278 Section A: Burden of disease 12 Burden of disease Pam Groenewald, Debbie Bradshaw, Candy Day, Ria Laubscher This chapter constitutes the third attempt to assess and compare the cause of death profiles for each of the 52 health districts in South Africa. Currently, Statistics South Africa (Stats SA) compiles cause of death statistics based on death notifications but reports only limited information at district level. Furthermore, data quality issues, including a high proportion of ill-defined causes, misclassification of HIV/AIDS deaths, and poor specification of external causes of injury deaths, have been identified. a District level mortality information is extremely important for health managers and programme planners to monitor health status, assess effectiveness of priority programmes, and identify emerging health issues and vulnerable groups. Such data can also be used to gauge inequities in health among districts. In spite of the data quality concerns, it is essential to start making use of the available data at the same time as initiating improvement strategies. By assuming that the metro areas have near-complete registration of deaths, it is possible to obtain death rates for these areas. While it is not yet possible to provide reliable mortality rates for each district, the epidemiological mortality profiles can be used as part of a measure of need for equitable resource allocation and priority-setting. Methodology Data source Unit records for the 2008 to 2011 mortality data were provided by Stats SA. b,c,d,e These included age, sex, district of death and underlying cause of death coded to ICD-10. f The ICD classification contains a detailed list of causes of mortality which is too extensive for public health use. For this reason, the ICD codes were aggregated according to the National Burden of Disease (NBD) list, g which is a condensed list of conditions containing the most prevalent diseases across South Africa, including those of public health importance. The NBD list has recently been updated, h and differs slightly from that used for the district mortality profiles prepared for the previous District Health Barometer. For this reason and also because a few district boundaries have been changed, the data for 2008 and 2009 were re-analysed with the 2010 and 2011 data. Stillbirths were excluded from the data prior to analysis. Aggregation of causes of death The NBD list of causes was aggregated into three broad cause groups, namely communicable diseases together with perinatal, maternal and nutritional conditions, and non-communicable diseases and injuries, as indicated in the 2000 NBD study g (see Table 1). Given the large burden caused by HIV-related deaths, which form part of the communicable disease group, these deaths were separated into a fourth group. Since many HIV deaths are misclassified to tuberculosis (TB), the TB deaths were reported with the HIV deaths. a Bradshaw D, Pillay-van Wyk V, Laubscher R, Nojilana B, Groenewald, Nannan N. Cause of death statistics for South Africa: Challenges and possibilities for improvement. Cape Town: Medical Research Council; 2011. www.mrc.ac.za/bod/cause_death_statsSA.pdf [accessed 30 October 2012]. b Statistics South Africa. Mortality and causes of death in South Africa, 2008: findings from death notification. Statistical Release P0309.3. Pretoria: Statistics South Africa; 2010. http://www.statssa.gov.za/publications/P03093/P030932008.pdf [accessed 23 September 2014] c Statistics South Africa. Mortality and causes of death in South Africa, 2009: findings from death notification. Statistical Release P0309.3. Pretoria: Statistics South Africa; 2011. http://www.statssa.gov.za/publications/P03093/P030932009.pdf [accessed 23 September 2014]. d Statistics South Africa. Mortality and causes of death in South Africa, 2010: findings from death notification. Statistical Release P0309.3. Pretoria: Statistics South Africa; 2013. http://www.statssa.gov.za/publications/P03093/P030932009.pdf [accessed 23 September 2014]. e Statistics South Africa. Mortality and causes of death in South Africa, 2011: findings from death notification. Statistical Release P0309.3. Pretoria: Statistics South Africa; 2014. http://www.statssa.gov.za/publications/P03093/P030932007.pdf [accessed 23 September 2014]. f World Health Organization. International Statistical Classification of Diseases and Health – Related Problems. 10th revision. Volume 2. 2nd edition. Geneva: World Health Organization; 2004. http://www.who.int/classifications/icd/ICD-10_2nd_ed_volume2.pdf [accessed 30 October 2012]. g Bradshaw D, Groenewald P, Laubscher R, et al. Initial burden of disease estimates for South Africa, 2000. Cape Town: South African Medical Research Council; 2003. www.mrc.ac.za/bod/initialbodestimates.pdf [accessed 30 October 2012]. h Personal communication: SA NBD team, SA Medical Research Council.

Welcome message from author
This document is posted to help you gain knowledge. Please leave a comment to let me know what you think about it! Share it to your friends and learn new things together.
Transcript

278
Section A: Burden of disease
12 Burden of disease Pam Groenewald, Debbie Bradshaw, Candy Day, Ria Laubscher
This chapter constitutes the third attempt to assess and compare the cause of death profiles for each of the 52 health districts in South Africa. Currently, Statistics South Africa (Stats SA) compiles cause of death statistics based on death notifications but reports only limited information at district level. Furthermore, data quality issues, including a high proportion of ill-defined causes, misclassification of HIV/AIDS deaths, and poor specification of external causes of injury deaths, have been identified.a
District level mortality information is extremely important for health managers and programme planners to monitor health status, assess effectiveness of priority programmes, and identify emerging health issues and vulnerable groups. Such data can also be used to gauge inequities in health among districts. In spite of the data quality concerns, it is essential to start making use of the available data at the same time as initiating improvement strategies. By assuming that the metro areas have near-complete registration of deaths, it is possible to obtain death rates for these areas. While it is not yet possible to provide reliable mortality rates for each district, the epidemiological mortality profiles can be used as part of a measure of need for equitable resource allocation and priority-setting.
Methodology
Data source
Unit records for the 2008 to 2011 mortality data were provided by Stats SA.b,c,d,e These included age, sex, district of death and underlying cause of death coded to ICD-10.f The ICD classification contains a detailed list of causes of mortality which is too extensive for public health use. For this reason, the ICD codes were aggregated according to the National Burden of Disease (NBD) list,g which is a condensed list of conditions containing the most prevalent diseases across South Africa, including those of public health importance. The NBD list has recently been updated,h and differs slightly from that used for the district mortality profiles prepared for the previous District Health Barometer. For this reason and also because a few district boundaries have been changed, the data for 2008 and 2009 were re-analysed with the 2010 and 2011 data. Stillbirths were excluded from the data prior to analysis.
Aggregation of causes of death
The NBD list of causes was aggregated into three broad cause groups, namely communicable diseases together with perinatal, maternal and nutritional conditions, and non-communicable diseases and injuries, as indicated in the 2000 NBD studyg (see Table 1). Given the large burden caused by HIV-related deaths, which form part of the communicable disease group, these deaths were separated into a fourth group. Since many HIV deaths are misclassified to tuberculosis (TB), the TB deaths were reported with the HIV deaths.
a Bradshaw D, Pillay-van Wyk V, Laubscher R, Nojilana B, Groenewald, Nannan N. Cause of death statistics for South Africa: Challenges and possibilities for improvement. Cape Town: Medical Research Council; 2011. www.mrc.ac.za/bod/cause_death_statsSA.pdf [accessed 30 October 2012].
b Statistics South Africa. Mortality and causes of death in South Africa, 2008: findings from death notification. Statistical Release P0309.3. Pretoria: Statistics South Africa; 2010. http://www.statssa.gov.za/publications/P03093/P030932008.pdf [accessed 23 September 2014]
c Statistics South Africa. Mortality and causes of death in South Africa, 2009: findings from death notification. Statistical Release P0309.3. Pretoria: Statistics South Africa; 2011. http://www.statssa.gov.za/publications/P03093/P030932009.pdf [accessed 23 September 2014].
d Statistics South Africa. Mortality and causes of death in South Africa, 2010: findings from death notification. Statistical Release P0309.3. Pretoria: Statistics South Africa; 2013. http://www.statssa.gov.za/publications/P03093/P030932009.pdf [accessed 23 September 2014].
e Statistics South Africa. Mortality and causes of death in South Africa, 2011: findings from death notification. Statistical Release P0309.3. Pretoria: Statistics South Africa; 2014. http://www.statssa.gov.za/publications/P03093/P030932007.pdf [accessed 23 September 2014].
f World Health Organization. International Statistical Classification of Diseases and Health – Related Problems. 10th revision. Volume 2. 2nd edition. Geneva: World Health Organization; 2004. http://www.who.int/classifications/icd/ICD-10_2nd_ed_volume2.pdf [accessed 30 October 2012].
g Bradshaw D, Groenewald P, Laubscher R, et al. Initial burden of disease estimates for South Africa, 2000. Cape Town: South African Medical Research Council; 2003. www.mrc.ac.za/bod/initialbodestimates.pdf [accessed 30 October 2012].
h Personal communication: SA NBD team, SA Medical Research Council.

279
Section A: Burden of disease
Table 1: Examples of causes of death in each broad cause group
Broad cause group ExamplesCommunicable diseases (excluding HIV and TB) maternal, perinatal and nutritional disorders(Comm/Mat/Peri/Nut)
Diarrhoeal diseases Meningitis & encephalitis Maternal conditions Perinatal conditions Nutritional disorders
HIV related and TB (HIV and TB) HIV related Tuberculosis
Non-communicable diseases (NCDs) Cerebrovascular disease Diabetes MellitusIschaemic heart diseaseCancer
Injuries Transport injuries Interpersonal violence
Adjustments to data
STATA 13 was used to adjust the data, firstly by redistributing deaths of unknown age and sex proportionally by known age and sex across each of the known causes of death and districts. Causes of death used as pseudonyms for AIDS, e.g. ‘retroviral disease’ or ‘immune suppression’ were combined with the HIV deaths. Deaths misclassified to ill-defined signs and symptoms (ICD chapter XVII) and other ‘garbage codes’ (intermediate causes of death, e.g. septicaemia; mechanisms of death, e.g. cardiac arrest; partially specified causes, e.g. cancer with unknown site of the disease; or risk factors, e.g. hypertension)i were proportionally redistributed to specified causes within each age and sex category.
Cause of death information for injuries was particularly problematic, with a very high proportion of ‘undetermined cause’ due to the manner of death (accident, homicide, suicide) not being specified on the death notification form. To accommodate a coding change implemented by StatsSA in 2007,j whereby undetermined injuries are coded to accidental injuries according to ICD-10 guidelines, injuries were redistributed using a different redistribution algorithm. This involved identifying the proportion of accidental injuries that would have been coded previously as undetermined based on 2006 data, and re-allocating these proportionally to homicide, suicide and accidental intent. In the absence of district-level information, the estimated national proportions were applied to each district, based on the assumption that the change in coding was consistent across the country.
Analysis
The proportions of deaths and Years of Life Lost (YLLs) due to the four broad cause groups were calculated for each of the 52 districts. YLLs are a measure of premature mortality based on the age at death, and as such, highlight the causes of death that should be targeted for prevention. In line with the initial South African NBD study, the highest observed national life expectancy was selected as the standard against which YLLs were calculated.k
Completeness of death registration for 2008 was reported to be 81% nationally,b but Dorrington and Bradshaw estimate that it is higher at 90%.l For 2009, the completeness was reported to be 93.5% at a national level,c and for 2010 and 2011, 94%.e However, estimates of completeness of registration are not available at district level and since variation in completeness of death registration at district level could distort death rates, these were not calculated except for the eight metros where completeness was likely to be good. Metro death rates were age-standardised to eliminate differences in observed mortality rates caused by differences in the age structure of the population in different areas.m The population estimates from the District Health Information Software (DHIS), based on 2002–2018 district cohort estimates developed by Statistics South Africa (2013), were used to calculate rates.
i Naghavi M, Makela S, Foreman K, O’Brien J, Pourmalek F, Lozano R. Algorithms for enhancing public health utility of national causes of death data. Population Health Metrics, 2010;8:9.
j Statistics South Africa. Mortality and causes of death in South Africa, 2007: findings from death notification. Statistical Release P0309.3. Pretoria: Statistics South Africa; 2009. http://www.statssa.gov.za/publications/P03093/P030932007.pdf [accessed 30 October 2012].
k This standard is represented by a model life table, Coale and Demeny West level 26, with a life expectancy at birth of 82.5 years for Japanese females and 80 for males. YLLs are estimated for each age, sex and cause category by multiplying the observed number of deaths in each category by the expected life expectancy in each age category, implying that YLLs are greater when age at death is younger. Since people value years of life gained in the future less than years gained in the present, a 3% discount rate is applied. In contrast to the first NBD study, an age weighting function that assigns greater value to a year of life lived in the economically active age groups higher than years lived in childhood or old age was not applied, in line with the latest Global Burden of Disease protocol (http://www.dcp2.org/pubs/GBD).
l Dorrington R, Bradshaw D. Maternal mortality in South Africa: lessons from a case study in the use of deaths reported by households in censuses and surveys. J Pop Research. 2011;28:49–73.
m Ahmad OB, Boschi-Pinto C, Lopez AD, Murray CJL, Lozano R, Inoue M. Age standardisation of rates – A new WHO standard, GPE Discussion Paper Series No 31. Geneva: World Health Organization; 2001

280
Section A: Burden of disease
Results
A total of 2 286 962 deaths were reported for 2008 until 2011, of which 57 776 stillbirths were excluded from further analysis (Table 2). There was a decline in the total number of deaths between 2008 and 2011, in keeping with the noted decline in mortality rates.n Between 2008 and 2009, large fluctuations in the total number of deaths reported by Chris Hani (EC), Nkangala (MP) and ZF Mgcawu (previously Siyanda) (NC) districts were noted that were completely inconsistent with the trends determined over the previous 12 years.o We were unable to explain these inconsistencies. In 2011, there was a large number of deaths (23 165) across all provinces where the district was ‘unknown’ because the place of death was documented as the hospital name rather than the place name, and Stats SA does not currently code hospital names according to districts. Since these seem to be related to patients dying in hospital rather than random cases, there was concern that this would introduce bias into the relative distribution of deaths and YLLs by causes. The ‘unknown district’ factor does result in reduced mortality rates in 2011 (including age-standardised mortality rates) since a substantial number of deaths cannot be attributed to districts. Among the metros, this was clearly apparent for Nelson Mandela Bay (EC), although it was more difficult to assess the impact in the other metros. For this reason, mortality rates for the metros were only reported until 2010.
Table 2: Number of registered deaths and stillbirths, 2008 until 2011
Year Deaths Stillbirths TotalUnknown district
N %2008 595 681 14 910 610 591 3 990 0.7
2009 579 978 14 151 594 129 4 339 0.8
2010 547 724 14 863 562 587 6 511 1.2
2011 505 803 13 852 519 655 23 165 4.6
Total 2 229 186 57 776 2 286 962 38 005
Data quality
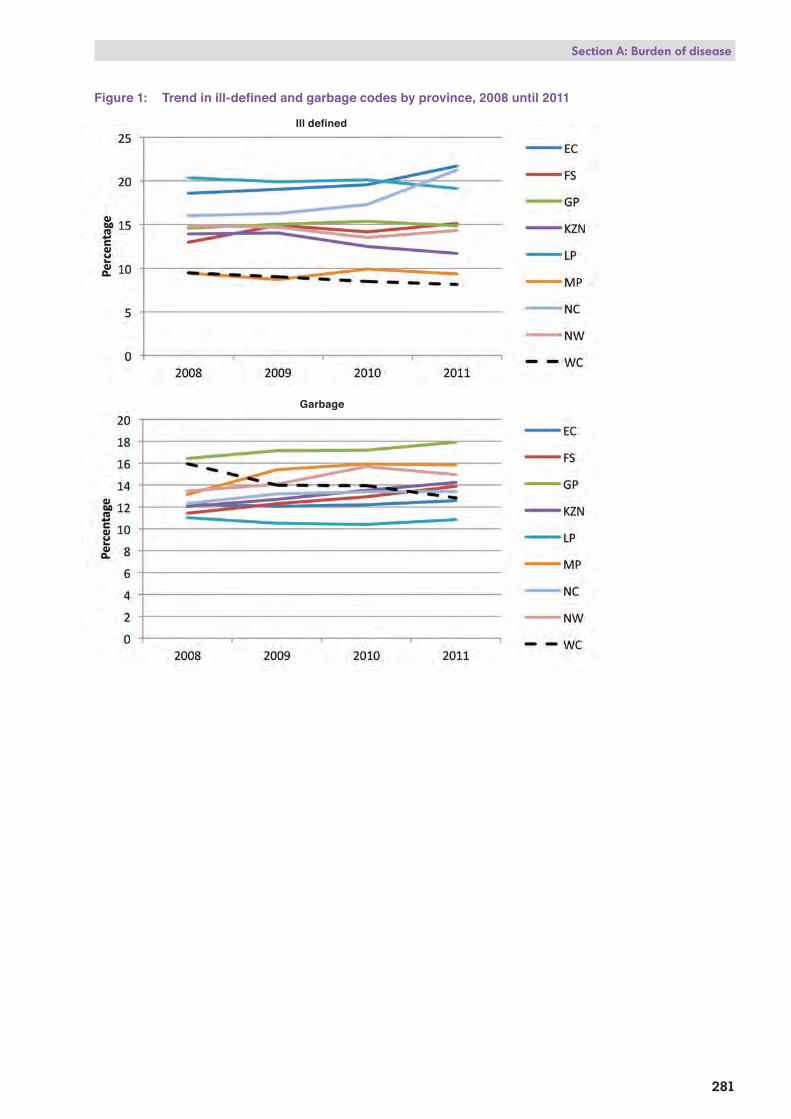
The two main indicators of data quality include the completeness of registration (which is unknown at district level) and the percentage of deaths classified to ill-defined causes and ‘garbage codes’ as described earlier. Internationally, the recommended standard is less than 10% ill-defined and garbage codes.p In South Africa, the total ill-defined and ‘garbage codes’ has declined from 39% in 1998q to 29.0% in 2008, and remained at this level (29.2%) in 2011. However, there have been marked improvements in both ill-defined and garbage codes in the Western Cape Province (WC) in contrast with other provinces (Figure 1). This may reflect the increased efforts to improve death certification in the WC, resulting from the implementation of a local mortality surveillance system there. In order to reduce the proportion of ill-defined deaths, it will be imperative to train doctors in death certification on the one hand, and to consider implementing alternative methods of establishing the underlying cause of death in rural areas (such as the use of verbal autopsy), on the other.
For the purposes of this study, the proportion of deaths coded to ill-defined causes is used as an indicator of the quality of mortality data. Ill-defined causes were reported for 14.8% of deaths in South Africa and ranged from 5.5% (Eden, WC) to 50.8% (Alfred Nzo, EC) across districts (see Figure 2 and Map 1), with 21 districts having a higher proportion of ill-defined deaths than the average for South Africa. The percentage of ill-defined deaths in the metros was 13.5% in 2011. As might be expected, the percentage ill-defined was lowest in the districts within the highest socio-economic quintile (SEQ 5) and highest in districts in the lowest SEQ.
Garbage codes were reported for 14.4% of deaths in South Africa and ranged from 7.1% (Alfred Nzo, EC) to 21.2% (Nkangala, MP) (Figure 3). In Namakwa (NC), Alfred Nzo (EC) and John Taolo Gaetsewe (NC), more than 50% of deaths were coded to ill-defined or garbage codes. In the Western Cape, all districts showed a decline in the percentage of garbage codes between 2008 and 2011, in contrast to the majority of districts in other provinces, where this percentage increased. Interestingly, the percentage of garbage codes was highest in districts within the highest socio-economic quintile (SEQ 5) and lowest in districts in the lowest SEQ. This may reflect better access to health services and medical information, but poor certification practices on behalf of the doctors.
n Bradshaw D, Dorrington RE, Laubscher R. Rapid Mortality Surveillance Report 2011. Cape Town: Medical Research Council; 2012. www.mrc.ac.za/bod/RapidMortality2011.pdf [accessed 30 October 2012].
o Personal communication: Maletela Ntoane-Nkhazi, Statistics SA.
p Mathers CD, Inoue M, Ma Fat D, Rao C, et al. Counting the dead and what they died from: an assessment of the global status of cause of death data. Bulletin of the World Health Organization. 2004;83:171–177.
q Pillay-van Wyk V, Bradshaw D, Groenewald P, Laubscher R. Improving the quality of medical certification of cause of death: the time is now! S Afr Med J. 2011 Sep 5;101(9):626.
Garbage
Ill defined
281
Section A: Burden of disease
Figure 1: Trend in ill-defined and garbage codes by province, 2008 until 2011

Percentage of deaths ill−defined by district, 2011
Percentage [Source: Stats SA Causes of Death]
A Nzo: DC44Namakwa: DC6
JT Gaetsewe: DC45OR Tambo: DC15
Vhembe: DC34Joe Gqabi: DC14Mangaung: MAN
Xhariep: DC16Mopani: DC33
Waterberg: DC36Johannesburg: JHB
Cacadu: DC10Bojanala: DC37
Ekurhuleni: EKUAmathole: DC12
Frances Baard: DC9Lejweleputswa: DC18
West Rand: DC48uMkhanyakude: DC27
Harry Gwala: DC43Capricorn: DC35
RS Mompati: DC39C Hani: DC13
uMzinyathi: DC24Zululand: DC26eThekwini: ETH
NM Molema: DC38G Sibande: DC30
Pixley ka Seme: DC7uMgungundlovu: DC22
uThungulu: DC28iLembe: DC29
ZF Mgcawu: DC8Ugu: DC21
Dr K Kaunda: DC40Nkangala: DC31
Cape Winelands: DC2Cape Town: CPTWest Coast: DC1
Central Karoo: DC5T Mofutsanyana: DC19
Ehlanzeni: DC32Overberg: DC3
Sedibeng: DC42Sekhukhune: DC47
Fezile Dabi: DC20N Mandela Bay: NMA
Amajuba: DC25Tshwane: TSH
uThukela: DC23Buffalo City: BUF
Eden: DC4
10 20 30 40 50
NHI
NHI
NHI
NHI
NHI
NHI
NHI
NHI
NHI
NHI
NHI
6.6
8.6 8.2
8.7
7.4
5.5
8.2
49.1
11.8
10.8
17.0
18.8
17.6
14.4
27.9
35.0
22.6
16.9
7.7
6.8
10.5
11.5
6.6
14.1
6.8
13.9
15.7
11.211.0
11.8
9.2
7.7
20.9
32.9
14.9
20.5
18.2
12.1
14.8
10.2
7.3
15.6
50.8
43.7
7.3
16.1
17.7
12.1
20.2
24.1
6.8
6.7
SA average: 14.8
ProvincesECFSGPKZNLPMPNCNWWC
282
Section A: Burden of disease
Figure 2: Percentage of deaths ill-defined by district, 2011

DC6
DC7
DC8
DC10
DC5
DC36
DC39
DC1
DC16
DC13
DC19DC18
DC30
DC4
DC38
DC2
DC32
DC45
DC14
DC34
DC12
DC35
DC20
DC33
DC37
DC31
DC3
DC9
DC26
DC40
DC27
DC47
DC15
DC23
DC43
DC22
DC24
DC28
TSH
MAN
DC25
DC44
DC21
DC42
DC48
DC29
BUF
CPT
ETH
NMA
EKUJHB
TSH
DC42
DC48
EKUJHB
Gauteng
LegendProvince
District
Deaths_Ill_def_20115.5 - 9.2
9.3 - 14.9
15.0 - 24.1
24.2 - 35.0
35.1 - 50.8
283
Section A: Burden of disease
Map 1: Percentage of deaths ill-defined by district, 2011

Percentage of deaths garbage codes by district, 2011
Percentage [Source: Stats SA Causes of Death]
Nkangala: DC31Tshwane: TSH
Sedibeng: DC42West Rand: DC48
uThukela: DC23eThekwini: ETH
Fezile Dabi: DC20Amajuba: DC25
Johannesburg: JHBEkurhuleni: EKU
NM Molema: DC38Bojanala: DC37
Pixley ka Seme: DC7N Mandela Bay: NMAFrances Baard: DC9
Buffalo City: BUFiLembe: DC29
West Coast: DC1uMgungundlovu: DC22T Mofutsanyana: DC19
RS Mompati: DC39Mangaung: MAN
Xhariep: DC16Amathole: DC12Ehlanzeni: DC32
G Sibande: DC30Central Karoo: DC5
Cape Winelands: DC2Dr K Kaunda: DC40
Cacadu: DC10Cape Town: CPT
uThungulu: DC28C Hani: DC13
Joe Gqabi: DC14uMzinyathi: DC24
Overberg: DC3Waterberg: DC36
uMkhanyakude: DC27Eden: DC4
Lejweleputswa: DC18Ugu: DC21
JT Gaetsewe: DC45Namakwa: DC6
Sekhukhune: DC47OR Tambo: DC15
Vhembe: DC34Capricorn: DC35ZF Mgcawu: DC8
Harry Gwala: DC43Mopani: DC33
Zululand: DC26A Nzo: DC44
5 10 15 20
NHI
NHI
NHI
NHINHI
NHI
NHI
NHI
NHI
NHI
NHI
12.6
14.9
12.0
17.1
12.5
16.8
9.8
13.7
12.512.5
10.9
13.8
12.0
14.2
16.9
11.5
14.7
14.9
12.7
14.8
13.0
12.4
12.0
13.1
11.1
15.6
10.7
15.0
12.8
13.7
21.2
13.6
9.8
10.910.7
12.4
15.816.0
13.9
12.9
20.1
10.7
7.1
11.5
11.1
17.3
16.5
17.0
16.6
13.8
15.2
20.8
SA average: 14.4
ProvincesECFSGPKZNLPMPNCNWWC
284
Section A: Burden of disease
Figure 3: Percentage of deaths with garbage codes by district, 2011

Death Year Rank_YLL Nbdcodename
0% 2% 4% 6% 8% 10% 12% 14% 16%% of Total YLL
2011 1 Tuberculosis
2 HIV/AIDS
3 Lower respiratory infections
4 Diarrhoeal diseases
5 Cerebrovascular disease
6 Ischaemic heart disease
7 Diabetes mellitus
8 Road injuries
9 Interpersonal violence
10 Hypertensive heart disease
15.1%
13.8%
10.5%
6.4%
5.1%
3.6%
2.4%
2.2%
2.1%
2.1%
Leading YLLs (single causes), South Africa
285
Section A: Burden of disease
Leading causes of premature mortality
The results presented here differ from the results presented in the Stats SA 2008 to 2011 cause of death reports,b,c,d,e in that ill-defined causes have been redistributed across other specified causes and specific causes of injury are presented. It is important to note that a large proportion of HIV deaths have been misattributed to immediate causes of death such as tuberculosis, diarrhoeal diseases and lower respiratory infections,r,s and that since many injury deaths are misclassified to ill-defined intent,t the ranking of injury causes may be unreliable. The four leading single causes of YLLs in South Africa were TB, HIV-related conditions, pneumonia and diarrhoea, suggesting that HIV-related mortality is by far the leading cause of YLLs in the majority of districts in South Africa (Figure 4). Also falling into the top 10 leading causes of YLLs across South Africa were cerebrovascular diseases, ischaemic heart disease, diabetes, road injuries, interpersonal violence and hypertensive heart disease. With some minor differences (pre-term birth complications in NW and NC, chronic obstructive pulmonary disease (COPD) in WC and NC, lung cancer in WC, and meningitis and encephalitis in KZN, GP, LP and MP), these are among the top 10 causes of premature mortality across most districts in South Africa (Figures 5 and 6).
The extent of the problem with regard to ill-defined injuries is illustrated by comparing the leading causes from the Western Cape mortality surveillance system,u where injury data are collected directly from the mortuaries, with the Stats SA injury data that reflect what is reported on the death certificate and often do not report the manner of death or the intent. This shows that the ranking and proportion of specific causes of injury deaths based on the Stats SA data is different from the Western Cape mortality surveillance data. The WC surveillance data should be more accurate with regard to the causes of injury deaths (Figure 7). In WC premature mortality due to interpersonal violence is ranked 3rd according to the Western Cape mortality surveillance accounting for 8.3% of YLLs. Using Stats SA data it ranks 5th accounting for only 4.9% of YLLs. Road injuries rank 7th (4.5% of YLLs) in Western Cape surveillance data whilst it does not appear in the top ten in the Stats SA data. Accidental gunshots (2.6%) rank 9th in the Stats SA data.
Figure 4: Leading causes of Years of Life Lost (YLLs) for South Africa, 2011
r Groenewald P, Nannan N, Bourne D, Laubscher R, Bradshaw D. Identifying deaths from AIDS in South Africa. AIDS. 2005;19:193-201.
s Yudkin PL, Burger EH, Bradshaw D, Groenewald P, Ward AM, Volmink J. Deaths caused by HIV disease under-reported in South Africa. AIDS. 2009 Jul 31;23(12):1600-2.
t Norman R, Matzopoulos R, Groenewald P, Bradshaw D. The high burden of injuries in South Africa. Bulletin of the World Health Organization. 2007;85:695–702.
u Groenewald P, Msemburi W, Morden E, Zinyakatira N, Neethling I, Daniels J, Evans J, Cornelius K, Berteler M, Martin LJ, Dempers J, Thompson V, Vismer M, Coetzee D, Bradshaw D. Western Cape mortality profile 2011. Cape Town: South African Medical Research Council; 2014.

286
Section A: Burden of disease
Figure 5: Ranking of 20 leading causes of YLLs by district, 2011

Prov Death Year Rank_YLL Nbdcodename
0% 2% 4% 6% 8% 10% 12% 14% 16% 18% 20%% of Total YLL
EC 2011 1 Tuberculosis
2 HIV/AIDS
3 Lower respiratory infections
4 Diarrhoeal diseases
5 Cerebrovascular disease
6 Interpersonal violence
7 Diabetes mellitus
8 Road injuries
9 Ischaemic heart disease
10 Hypertensive heart disease
FS 2011 1 Lower respiratory infections
2 Tuberculosis
3 HIV/AIDS
4 Diarrhoeal diseases
5 Cerebrovascular disease
6 Ischaemic heart disease
7 Hypertensive heart disease
8 Road injuries
9 Interpersonal violence
10 Diabetes mellitus
GP 2011 1 Tuberculosis
2 HIV/AIDS
3 Lower respiratory infections
4 Cerebrovascular disease
5 Diarrhoeal diseases
6 Ischaemic heart disease
7 Accidental gunshot
8 Nephritis/nephrosis
9 Accidental strangulation
10 Meningitis/encephalitis
KZN 2011 1 Tuberculosis
2 HIV/AIDS
3 Lower respiratory infections
4 Diarrhoeal diseases
5 Cerebrovascular disease
6 Ischaemic heart disease
7 Diabetes mellitus
8 Meningitis/encephalitis
9 Nephritis/nephrosis
10 Accidental gunshot
LP 2011 1 Lower respiratory infections
2 Tuberculosis
3 HIV/AIDS
4 Diarrhoeal diseases
5 Cerebrovascular disease
6 Road injuries
7 Diabetes mellitus
8 Hypertensive heart disease
9 Meningitis/encephalitis
10 Ischaemic heart disease
17.3%
15.9%
7.5%
5.3%
5.2%
3.2%
2.5%
2.5%
2.5%
2.2%
16.3%
13.7%
11.8%
7.8%
4.8%
3.5%
2.5%
2.4%
2.2%
1.9%
12.2%
11.8%
11.2%
4.8%
4.7%
4.4%
3.1%
2.5%
2.4%
2.4%
19.1%
16.2%
8.5%
6.8%
5.2%
3.7%
2.6%
2.1%
2.1%
2.1%
15.1%
12.9%
11.8%
11.4%
4.8%
4.3%
3.2%
2.3%
2.2%
2.0%
Leading YLLs (single causes) by province
287
Section A: Burden of disease
Figure 6: Leading 10 causes of YLLs by province, 2011

Prov Death Year Rank_YLL Nbdcodename
0% 2% 4% 6% 8% 10% 12% 14% 16% 18%% of Total YLL
MP 2011 1 Tuberculosis
2 HIV/AIDS
3 Lower respiratory infections
4 Diarrhoeal diseases
5 Cerebrovascular disease
6 Road injuries
7 Ischaemic heart disease
8 Meningitis/encephalitis
9 Diabetes mellitus
10 Hypertensive heart disease
NC 2011 1 HIV/AIDS
2 Tuberculosis
3 Lower respiratory infections
4 Diarrhoeal diseases
5 Cerebrovascular disease
6 Ischaemic heart disease
7 COPD
8 Interpersonal violence
9 Accidental strangulation
10 Preterm birth complications
NW 2011 1 Tuberculosis
2 HIV/AIDS
3 Lower respiratory infections
4 Diarrhoeal diseases
5 Cerebrovascular disease
6 Hypertensive heart disease
7 Ischaemic heart disease
8 Accidental strangulation
9 Diabetes mellitus
10 Preterm birth complications
WC 2011 1 HIV/AIDS
2 Tuberculosis
3 Ischaemic heart disease
4 Cerebrovascular disease
5 Interpersonal violence
6 Trachea/bronchi/lung
7 Lower respiratory infections
8 COPD
9 Accidental gunshot
10 Diabetes mellitus
16.7%
14.6%
12.5%
8.5%
5.2%
3.9%
2.9%
2.6%
2.5%
2.4%
14.2%
13.3%
10.5%
5.8%
5.3%
4.1%
3.2%
3.1%
2.0%
2.0%
15.2%
14.3%
13.5%
6.7%
4.7%
3.4%
2.8%
2.2%
2.2%
2.0%
12.2%
10.6%
7.2%
6.0%
4.9%
3.8%
3.5%
3.4%
2.6%
2.6%
Leading YLLs (single causes) by province
288
Section A: Burden of disease

289
Section A: Burden of disease
Figure 7: Comparison of ranking of injury causes of premature death between Stats SA and Western Cape mortality surveillance data for 2011
Lead
ing
caus
es o
f Yea
rs o
f Life
Los
t (%
)
Rank Western Cape Surv Western Cape Stats SA
1 HIV/AIDS 12.4% HIV/AIDS 12.2%
2 TB 8.6% TB 10.6%
3 Interpersonal violence 8.3% Ischaemic heart disease 7.2%
4 Ischaemic heart disease 6.6% Cerebrovascular disease 6.0%
5 Cerebrovascular disease 5.1% Interpersonal violence 4.9%
6 Lower Respiratory infections 4.8% Trachea/bronchi/lung 3.8%
7 Road injuries 4.5% Lower respiratory infections 3.5%
8 Diabetes Mellitus 4.5% COPD 3.4%
9 Trachea/ bronchi/lung 3.8% Accidental gunshot 2.6%
10 COPD 3.5% Diabetes mellitus 2.6%
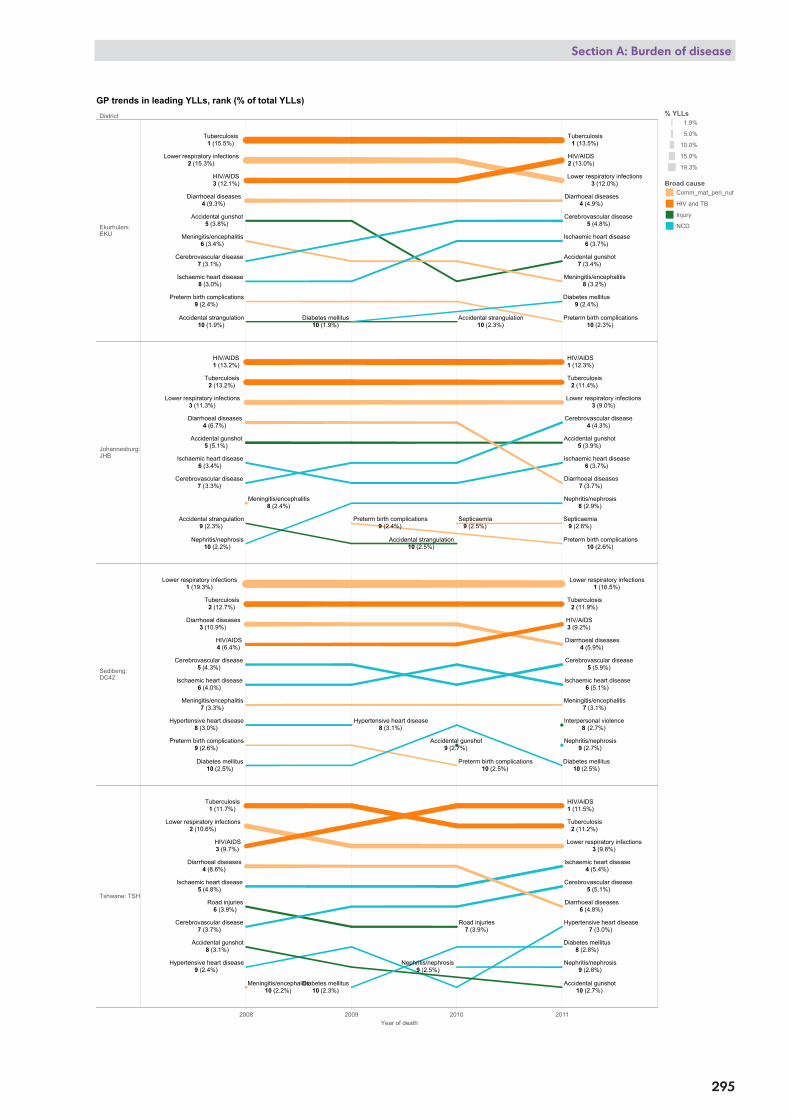
Trends in leading causes of premature mortality
Tuberculosis has remained the leading cause of premature mortality over the period 2008 until 2011 (Figure 8). HIV/AIDS ranked third in 2008 after lower respiratory infections, but moved to second in 2009 where it has remained. Meningitis/encephalitis dropped from seventh to ninth in the ranking, replaced by diabetes mellitus which moved from ninth to seventh place. Road injuries and interpersonal violence both moved up one position in the ranking to eighth and ninth respectively. Hypertensive heart disease moved up into tenth position in 2011.
Over the period 2008 until 2011, both HIV/AIDS and diabetes mellitus moved up in the YLLs rank in four EC districts (Joe Gqabi, OR Tambo, Amathole and Chris Hani), whilst cerebrovascular disease moved up in all EC districts.
In KZN, HIV/AIDS moved up in the YLL rank in uThukela, uThungulu, Zululand and uMgungundlovu. Cerebrovascular disease moved up in the ranking in Zululand, uMgungundlovu and uMkhanyakude districts, and diabetes in uThukela, uThungulu, Ugu, uMgungundlovu, uMkhanyakude (tenth to sixth) and uMzinyathi. In uMzinyathi, pre-term birth complications dropped from sixth to below tenth in the ranking.
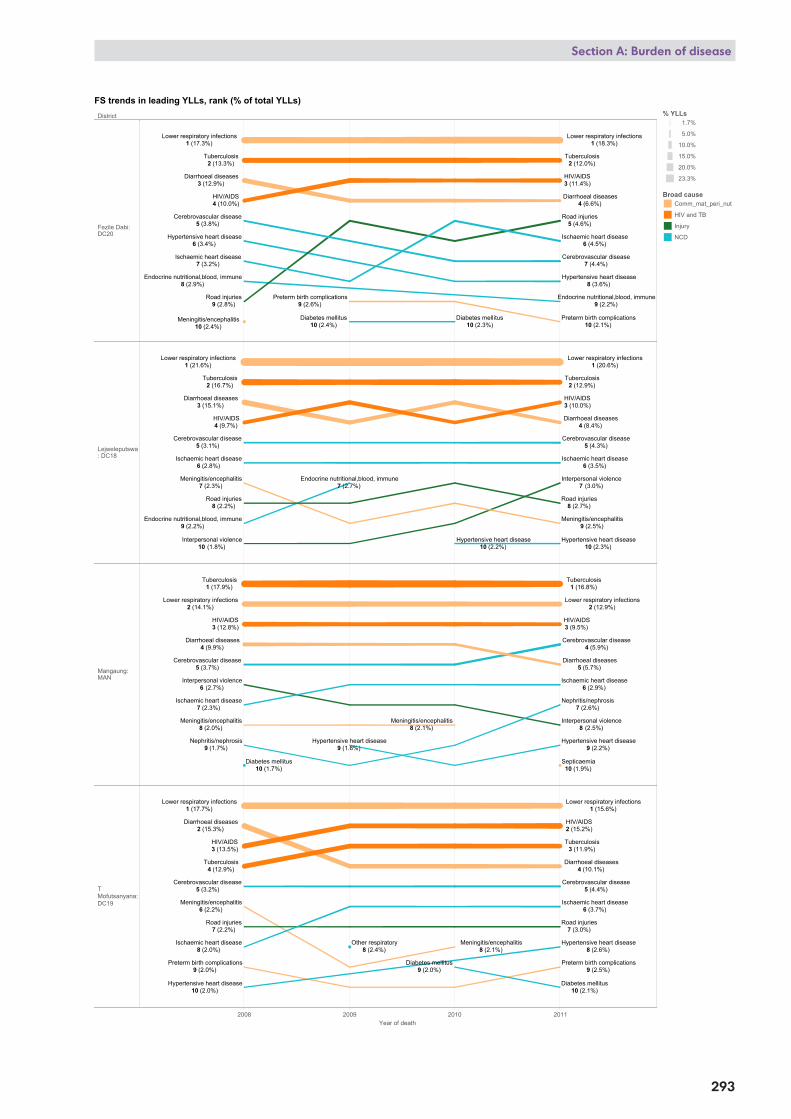
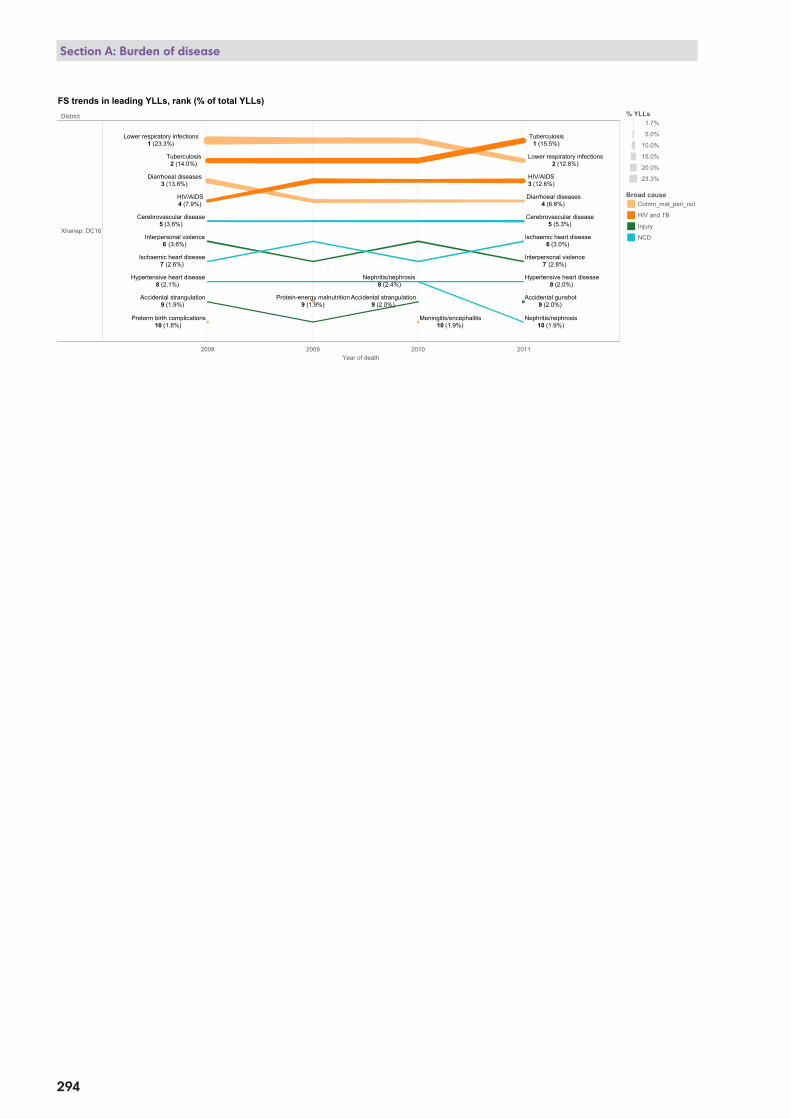
In FS, HIV/AIDS rose in the ranking in Fezile Dabi, Lejweleputswa, Thabo Mofutsanyana and Xhariep, tuberculosis in Xhariep and Thabo Mofutsanyana, and ischaemic heart disease in Fezile Dabi, Mangaung, Thabo Mofutsanyana, and Xhariep. Cerebrovascular disease dropped in the ranking in Fezile Dabi and increased in Mangaung.
In GP, HIV/AIDS went up in the ranking in Ekhurhuleni, Sedibeng, Tshwane and West Rand, ischaemic heart disease in West Rand,Tshwane and Ekhurhuleni. Cerebrovascular disease moved up in the ranking in Ekurhuleni, Johannesburg and Tshwane, and moved down the ranking in West Rand.
In LP, diarrhoeal disease went down in the ranking in Waterberg, Capricorn, Mopani and Sekhukhune, whilst HIV/AIDS and tuberculosis moved up in Waterberg and Capricorn, and tuberculosis moved up in Mopani. HIV/AIDS moved up in the ranking in Sekhukhune. Diabetes mellitus moved up in the ranking in Mopani, Sekhukhune and Vhembe.
In MP, HIV/AIDS moved up in the ranking in Ehlanzeni, Gert Sibande and Nkangala, while diarrhoea went down.
In NW, HIV/AIDS moved up in the ranking in Bojanala, NM Molema and RS Mompati, while diarrhoea and lower respiratory disease moved down. Cerebrovascular disease moved up in the ranking in Bojanala and Dr Kenneth Kaunda.
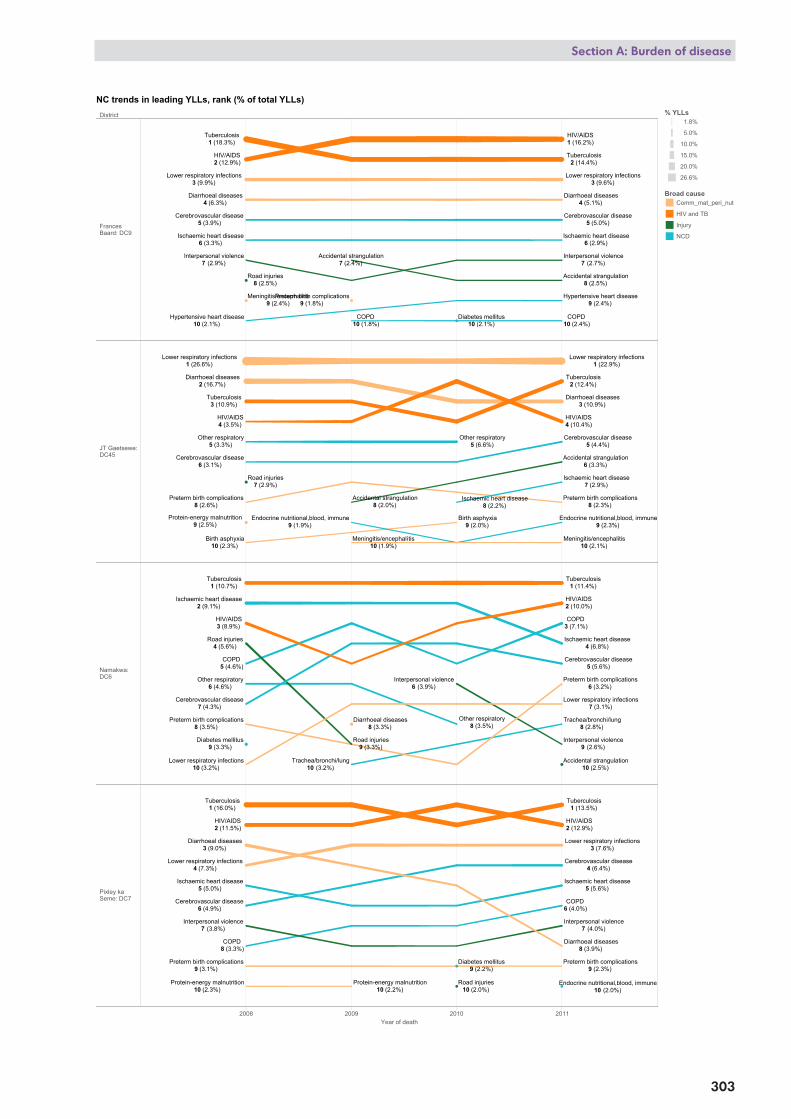
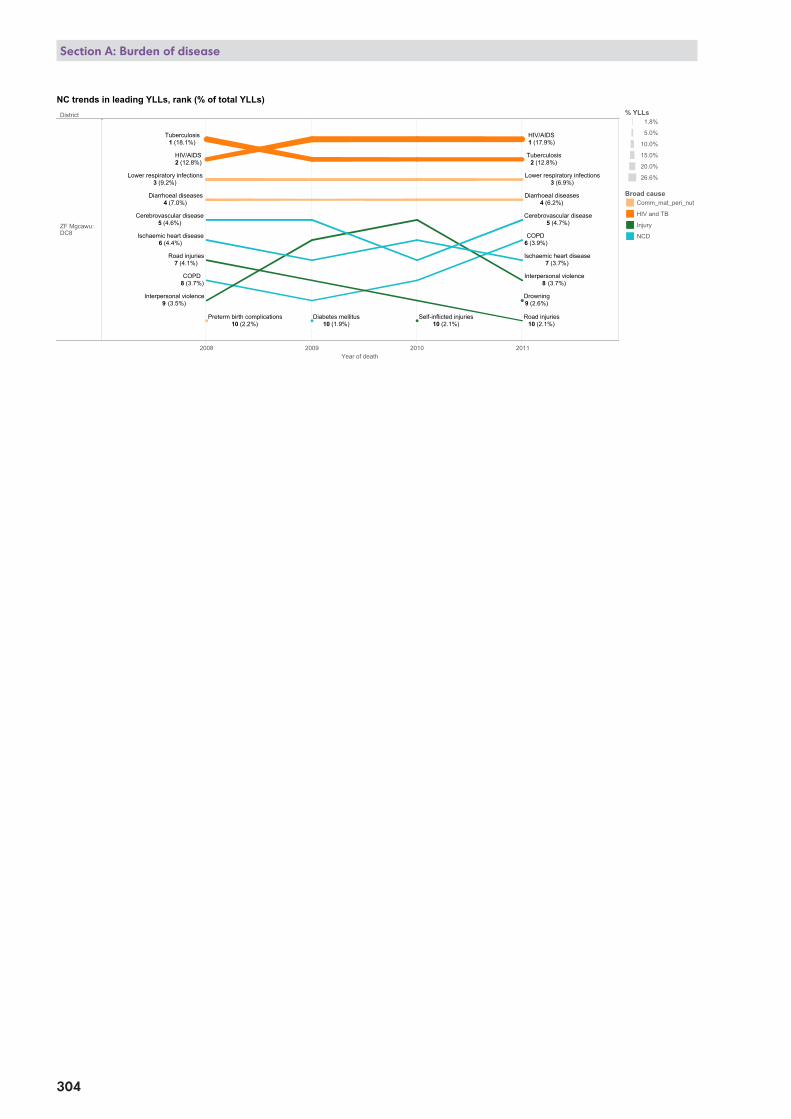
In NC, HIV/AIDS moved up in the ranking in Frances Baard, Namakwa, Pixley ka Seme and ZF Mgcawu. Diarrhoeal disease dropped from third to eighth in Pixley ka Seme, and COPD increased from fifth to third in Namakwa. Cerebrovascular disease went up in the ranking in John Taolo Gaetsewe, Namakwa and Pixley ka Seme. HIV/AIDS remained in fourth position in John Taolo Gaetsewe.
HIV/AIDS increased in the ranking in all WC districts except Central Karoo, and cerebrovascular disease increased in Cape Town, Cape Winelands and Overberg. COPD increased in the ranking in Cape Town Metro, Eden, Overberg and West Coast. Lung cancer increased in the ranking in all WC districts except West Coast. Diarrhoeal disease dropped in the ranking in all districts, while lower respiratory infections increased in Cape Winelands, Eden and Overberg.

2008 2009 2010 2011Year of death
Interpersonal violence10 (2.0%)
Interpersonal violence9 (2.1%)
Hypertensive heart disease10 (2.1%)
Accidental gunshot and other mechanical forces8 (2.2%)
Accidental gunshot and other mechanical forces10 (2.0%)
Meningitis/encephalitis7 (2.3%)
Meningitis/encephalitis9 (2.3%)
Road injuries9 (2.1%)
Road injuries8 (2.2%)
Ischaemic heart disease6 (3.0%)
Ischaemic heart disease6 (3.6%)
Diabetes mellitus9 (2.1%)
Diabetes mellitus7 (2.4%)
Cerebrovascular disease5 (4.0%)
Cerebrovascular disease5 (5.1%)
Diarrhoeal diseases4 (10.6%)
Diarrhoeal diseases4 (6.4%)
Lower respiratory infections2 (12.1%)
Lower respiratory infections3 (10.5%)
HIV/AIDS3 (11.7%)
HIV/AIDS2 (13.8%)
Tuberculosis1 (17.2%)
Tuberculosis1 (15.1%)
Trends in leading YLLs, rank (% of total YLLs)
Broad causeComm_mat_peri_nut
HIV and TB
Injury
NCD
% YLLs2.0%
5.0%
10.0%
17.2%
290
Section A: Burden of disease
Figure 8: Trends in 10 leading causes of YLLs, South Africa, 2008-2011

District
2008 2009 2010 2011Year of death
A Nzo: DC44
Amathole:DC12
Buffalo City:BUF
C Hani: DC13
Cacadu: DC10
Accidental strangulation10 (1.7%)
Other respiratory5 (9.7%)
Other respiratory7 (2.2%)
Interpersonal violence8 (2.6%)
Interpersonal violence9 (1.9%)
Hypertensive heart disease9 (2.2%)
Hypertensive heart disease10 (1.9%)
Meningitis/encephalitis6 (3.1%)
Meningitis/encephalitis6 (3.3%)
Road injuries9 (2.1%)
Road injuries8 (2.0%)
Ischaemic heart disease10 (1.7%)
Ischaemic heart disease9 (2.0%)
Diabetes mellitus10 (1.7%)
Cerebrovascular disease7 (2.8%)
Cerebrovascular disease5 (4.3%)
Diarrhoeal diseases3 (12.1%)
Diarrhoeal diseases4 (8.4%)
Lower respiratory infections4 (9.9%)
Lower respiratory infections3 (9.8%)
HIV/AIDS2 (13.5%)
HIV/AIDS2 (16.8%)
Tuberculosis1 (18.6%)
Tuberculosis1 (20.9%)
Asthma6 (3.6%)
Asthma8 (3.0%)
COPD10 (2.2%)
Interpersonal violence7 (3.1%)
Interpersonal violence6 (3.5%)
Hypertensive heart disease8 (2.7%)
Hypertensive heart disease7 (3.0%)
Meningitis/encephalitis9 (2.5%)
Meningitis/encephalitis10 (2.4%)
Road injuries10 (2.4%)
Road injuries10 (2.6%)
Diabetes mellitus9 (2.6%)
Cerebrovascular disease5 (4.5%)
Cerebrovascular disease4 (5.5%)
Diarrhoeal diseases3 (9.0%)
Diarrhoeal diseases5 (5.4%)
Lower respiratory infections4 (7.4%)
Lower respiratory infections3 (8.2%)
HIV/AIDS2 (15.6%)
HIV/AIDS1 (16.3%)
Tuberculosis1 (18.1%)
Tuberculosis2 (15.2%)
Cardiomyopathy10 (2.4%)
Cardiomyopathy9 (2.5%)
COPD9 (2.4%)
COPD9 (2.5%)
Interpersonal violence5 (4.6%)
Interpersonal violence5 (4.2%)
Nephritis/nephrosis9 (2.6%)
Accidental strangulation7 (2.7%)
Accidental strangulation8 (2.6%)
Road injuries7 (3.1%)
Road injuries7 (2.9%)
Ischaemic heart disease8 (2.5%)
Ischaemic heart disease8 (2.9%)
Diabetes mellitus10 (2.4%)
Diabetes mellitus10 (2.6%)
Cerebrovascular disease6 (4.5%)
Cerebrovascular disease3 (5.2%)
Diarrhoeal diseases4 (6.0%)
Diarrhoeal diseases6 (3.2%)
Lower respiratory infections3 (6.7%)
Lower respiratory infections4 (5.1%)
HIV/AIDS2 (8.1%)
HIV/AIDS2 (10.4%)
Tuberculosis1 (21.7%)
Tuberculosis1 (19.0%)
Cardiomyopathy9 (2.6%)
Asthma9 (2.4%)
Asthma7 (2.8%)
Interpersonal violence7 (2.8%)
Interpersonal violence6 (3.6%)
Hypertensive heart disease8 (2.6%)
Hypertensive heart disease9 (2.6%)
Meningitis/encephalitis10 (2.3%)
Meningitis/encephalitis10 (2.3%)
Road injuries6 (2.8%)
Ischaemic heart disease8 (2.7%)
Diabetes mellitus9 (2.1%)
Diabetes mellitus10 (2.6%)
Cerebrovascular disease5 (3.5%)
Cerebrovascular disease5 (4.8%)
Diarrhoeal diseases4 (9.9%)
Diarrhoeal diseases4 (6.6%)
Lower respiratory infections2 (12.2%)
Lower respiratory infections3 (9.9%)
HIV/AIDS3 (11.2%)
HIV/AIDS2 (12.8%)
Tuberculosis1 (18.3%)
Tuberculosis1 (17.6%)
EC trends in leading YLLs, rank (% of total YLLs)% YLLs
1.7%
5.0%
10.0%
15.0%
20.0%
22.7%
Broad causeComm_mat_peri_nut
HIV and TB
Injury
NCD
291
Section A: Burden of disease
Figure 9: Trends in 10 leading causes of YLLs by district, 2008-2011

District
2008 2009 2010 2011Year of death
C Hani: DC13
Cacadu: DC10
Joe Gqabi:DC14
N MandelaBay: NMA
OR Tambo:DC15
Trachea/bronchi/lung10 (2.0%)
COPD9 (2.7%)
COPD10 (2.3%)
Interpersonal violence5 (5.5%)
Interpersonal violence7 (3.1%)
Hypertensive heart disease8 (3.0%)
Hypertensive heart disease10 (2.5%)
Accidental strangulation9 (2.8%)
Accidental strangulation8 (2.8%)
Road injuries8 (2.8%)
Road injuries9 (2.5%)
Ischaemic heart disease7 (4.8%)
Ischaemic heart disease5 (5.1%)
Diabetes mellitus9 (2.0%)
Cerebrovascular disease4 (5.6%)
Cerebrovascular disease3 (6.6%)
Diarrhoeal diseases6 (5.1%)
Diarrhoeal diseases6 (3.1%)
Lower respiratory infections3 (9.6%)
Lower respiratory infections4 (5.7%)
HIV/AIDS2 (15.0%)
HIV/AIDS2 (15.6%)
Tuberculosis1 (17.8%)
Tuberculosis1 (19.2%)
Other respiratory5 (5.8%)
Other respiratory10 (2.1%)
Cardiomyopathy10 (1.7%)
Interpersonal violence7 (2.4%)
Interpersonal violence8 (2.5%)
Hypertensive heart disease10 (1.7%)
Hypertensive heart disease6 (3.1%)
Accidental strangulation9 (1.7%)
Accidental strangulation10 (2.3%)
Meningitis/encephalitis8 (1.9%)
Meningitis/encephalitis9 (2.6%)
Ischaemic heart disease7 (2.6%)
Ischaemic heart disease7 (2.7%)
Diabetes mellitus9 (2.2%)
Cerebrovascular disease6 (3.6%)
Cerebrovascular disease5 (5.1%)
Diarrhoeal diseases4 (11.6%)
Diarrhoeal diseases4 (6.2%)
Lower respiratory infections3 (11.8%)
Lower respiratory infections3 (11.9%)
HIV/AIDS2 (14.8%)
HIV/AIDS1 (18.4%)
Tuberculosis1 (18.7%)
Tuberculosis2 (13.2%)
Asthma9 (2.7%)
Asthma9 (2.3%)
Interpersonal violence7 (3.2%)
Interpersonal violence8 (2.6%)
Nephritis/nephrosis9 (2.3%)
Nephritis/nephrosis7 (2.8%)
Road injuries10 (2.6%)
Road injuries10 (2.3%)
Ischaemic heart disease4 (5.0%)
Ischaemic heart disease4 (4.2%)
Diabetes mellitus8 (2.7%)
Diabetes mellitus5 (3.7%)
Cerebrovascular disease5 (4.9%)
Cerebrovascular disease3 (6.9%)
Diarrhoeal diseases6 (4.4%)
Diarrhoeal diseases7 (3.4%)
Lower respiratory infections3 (7.6%)
Lower respiratory infections6 (3.4%)
HIV/AIDS2 (9.8%)
HIV/AIDS2 (14.3%)
Tuberculosis1 (22.4%)
Tuberculosis1 (17.5%)
Asthma8 (2.7%)
Interpersonal violence9 (2.4%)
Interpersonal violence6 (3.1%)
Nephritis/nephrosis10 (2.1%)
Accidental strangulation10 (1.7%)
Accidental gunshot10 (1.8%)
Accidental gunshot9 (1.7%)
Meningitis/encephalitis5 (3.6%)
Meningitis/encephalitis7 (2.7%)
Road injuries6 (3.5%)
Road injuries8 (2.6%)
Diabetes mellitus10 (1.7%)
Diabetes mellitus9 (2.3%)
Cerebrovascular disease7 (3.5%)
Cerebrovascular disease5 (4.4%)
Diarrhoeal diseases3 (10.3%)
Diarrhoeal diseases4 (6.1%)
Lower respiratory infections4 (7.5%)
Lower respiratory infections3 (7.0%)
HIV/AIDS2 (14.8%)
HIV/AIDS1 (21.0%)
Tuberculosis1 (18.6%)
Tuberculosis2 (17.0%)
EC trends in leading YLLs, rank (% of total YLLs)% YLLs
1.7%
5.0%
10.0%
15.0%
20.0%
22.7%
Broad causeComm_mat_peri_nut
HIV and TB
Injury
NCD
292
Section A: Burden of disease
District
2008 2009 2010 2011Year of death
Fezile Dabi:DC20
Lejweleputswa: DC18
Mangaung:MAN
TMofutsanyana:DC19
Xhariep: DC16
Meningitis/encephalitis10 (2.4%)
Endocrine nutritional,blood, immune8 (2.9%)
Endocrine nutritional,blood, immune9 (2.2%)
Preterm birth complications9 (2.6%)
Preterm birth complications10 (2.1%)
Hypertensive heart disease6 (3.4%)
Hypertensive heart disease8 (3.6%)
Road injuries9 (2.8%)
Road injuries5 (4.6%)
Ischaemic heart disease7 (3.2%)
Ischaemic heart disease6 (4.5%)
Diabetes mellitus10 (2.4%)
Diabetes mellitus10 (2.3%)
Cerebrovascular disease5 (3.8%)
Cerebrovascular disease7 (4.4%)
Diarrhoeal diseases3 (12.9%)
Diarrhoeal diseases4 (6.6%)
Lower respiratory infections1 (17.3%)
Lower respiratory infections1 (18.3%)
HIV/AIDS4 (10.0%)
HIV/AIDS3 (11.4%)
Tuberculosis2 (13.3%)
Tuberculosis2 (12.0%)
Endocrine nutritional,blood, immune9 (2.2%)
Endocrine nutritional,blood, immune7 (2.7%)
Interpersonal violence10 (1.8%)
Interpersonal violence7 (3.0%)
Hypertensive heart disease10 (2.2%)
Hypertensive heart disease10 (2.3%)
Meningitis/encephalitis7 (2.3%)
Meningitis/encephalitis9 (2.5%)
Road injuries8 (2.2%)
Road injuries8 (2.7%)
Ischaemic heart disease6 (2.8%)
Ischaemic heart disease6 (3.5%)
Cerebrovascular disease5 (3.1%)
Cerebrovascular disease5 (4.3%)
Diarrhoeal diseases3 (15.1%)
Diarrhoeal diseases4 (8.4%)
Lower respiratory infections1 (21.6%)
Lower respiratory infections1 (20.6%)
HIV/AIDS4 (9.7%)
HIV/AIDS3 (10.0%)
Tuberculosis2 (16.7%)
Tuberculosis2 (12.9%)
Septicaemia10 (1.9%)
Interpersonal violence6 (2.7%)
Interpersonal violence8 (2.5%)
Nephritis/nephrosis9 (1.7%)
Nephritis/nephrosis7 (2.6%)
Hypertensive heart disease9 (1.8%)
Hypertensive heart disease9 (2.2%)
Meningitis/encephalitis8 (2.0%)
Meningitis/encephalitis8 (2.1%)
Ischaemic heart disease7 (2.3%)
Ischaemic heart disease6 (2.9%)
Diabetes mellitus10 (1.7%)
Cerebrovascular disease5 (3.7%)
Cerebrovascular disease4 (5.9%)
Diarrhoeal diseases4 (9.9%)
Diarrhoeal diseases5 (5.7%)
Lower respiratory infections2 (14.1%)
Lower respiratory infections2 (12.9%)
HIV/AIDS3 (12.8%)
HIV/AIDS3 (9.5%)
Tuberculosis1 (17.9%)
Tuberculosis1 (16.8%)
Meningitis/encephalitis8 (2.1%)
Other respiratory8 (2.4%)
Preterm birth complications9 (2.0%)
Preterm birth complications9 (2.5%)
Hypertensive heart disease10 (2.0%)
Hypertensive heart disease8 (2.6%)
Meningitis/encephalitis6 (2.2%)
Road injuries7 (2.2%)
Road injuries7 (3.0%)
Ischaemic heart disease8 (2.0%)
Ischaemic heart disease6 (3.7%)
Diabetes mellitus9 (2.0%)
Diabetes mellitus10 (2.1%)
Cerebrovascular disease5 (3.2%)
Cerebrovascular disease5 (4.4%)
Diarrhoeal diseases2 (15.3%)
Diarrhoeal diseases4 (10.1%)
Lower respiratory infections1 (17.7%)
Lower respiratory infections1 (15.6%)
HIV/AIDS3 (13.5%)
HIV/AIDS2 (15.2%)
Tuberculosis4 (12.9%)
Tuberculosis3 (11.9%)
FS trends in leading YLLs, rank (% of total YLLs)% YLLs
1.7%
5.0%
10.0%
15.0%
20.0%
23.3%
Broad causeComm_mat_peri_nut
HIV and TB
Injury
NCD
293
Section A: Burden of disease
District
2008 2009 2010 2011Year of death
TMofutsanyana:DC19
Xhariep: DC16
Protein-energy malnutrition9 (1.9%)
Interpersonal violence6 (3.6%)
Interpersonal violence7 (2.8%)
Preterm birth complications10 (1.8%)
Nephritis/nephrosis8 (2.4%)
Nephritis/nephrosis10 (1.9%)
Hypertensive heart disease8 (2.1%)
Hypertensive heart disease8 (2.0%)
Accidental strangulation9 (1.9%)
Accidental strangulation9 (2.0%)
Accidental gunshot9 (2.0%)
Meningitis/encephalitis10 (1.9%)
Ischaemic heart disease7 (2.6%)
Ischaemic heart disease6 (3.0%)
Cerebrovascular disease5 (3.6%)
Cerebrovascular disease5 (5.3%)
Diarrhoeal diseases3 (13.8%)
Diarrhoeal diseases4 (6.8%)
Lower respiratory infections1 (23.3%)
Lower respiratory infections2 (12.8%)
HIV/AIDS4 (7.9%)
HIV/AIDS3 (12.6%)
Tuberculosis2 (14.0%)
Tuberculosis1 (15.5%)
FS trends in leading YLLs, rank (% of total YLLs)% YLLs
1.7%
5.0%
10.0%
15.0%
20.0%
23.3%
Broad causeComm_mat_peri_nut
HIV and TB
Injury
NCD
294
Section A: Burden of disease
District
2008 2009 2010 2011Year of death
Ekurhuleni:EKU
Johannesburg:JHB
Sedibeng:DC42
Tshwane: TSH
West Rand:DC48
Preterm birth complications9 (2.4%)
Preterm birth complications10 (2.3%)
Accidental strangulation10 (1.9%)
Accidental strangulation10 (2.3%)
Accidental gunshot5 (3.8%)
Accidental gunshot7 (3.4%)
Meningitis/encephalitis6 (3.4%)
Meningitis/encephalitis8 (3.2%)
Ischaemic heart disease8 (3.0%)
Ischaemic heart disease6 (3.7%)
Diabetes mellitus10 (1.9%)
Diabetes mellitus9 (2.4%)
Cerebrovascular disease7 (3.1%)
Cerebrovascular disease5 (4.8%)
Diarrhoeal diseases4 (9.3%)
Diarrhoeal diseases4 (4.9%)
Lower respiratory infections2 (15.3%)
Lower respiratory infections3 (12.0%)
HIV/AIDS3 (12.1%)
HIV/AIDS2 (13.0%)
Tuberculosis1 (15.5%)
Tuberculosis1 (13.5%)
Septicaemia9 (2.5%)
Septicaemia9 (2.6%)
Preterm birth complications9 (2.4%)
Preterm birth complications10 (2.6%)
Nephritis/nephrosis10 (2.2%)
Nephritis/nephrosis8 (2.9%)
Accidental strangulation9 (2.3%)
Accidental strangulation10 (2.5%)
Accidental gunshot5 (5.1%)
Accidental gunshot5 (3.9%)
Meningitis/encephalitis8 (2.4%)
Ischaemic heart disease6 (3.4%)
Ischaemic heart disease6 (3.7%)
Cerebrovascular disease7 (3.3%)
Cerebrovascular disease4 (4.3%)
Diarrhoeal diseases4 (6.7%)
Diarrhoeal diseases7 (3.7%)
Lower respiratory infections3 (11.3%)
Lower respiratory infections3 (9.0%)
HIV/AIDS1 (13.2%)
HIV/AIDS1 (12.3%)
Tuberculosis2 (13.2%)
Tuberculosis2 (11.4%)
Interpersonal violence8 (2.7%)
Preterm birth complications9 (2.6%)
Preterm birth complications10 (2.5%)
Nephritis/nephrosis9 (2.7%)
Hypertensive heart disease8 (3.0%)
Hypertensive heart disease8 (3.1%)
Accidental gunshot9 (2.7%)
Meningitis/encephalitis7 (3.3%)
Meningitis/encephalitis7 (3.1%)
Ischaemic heart disease6 (4.0%)
Ischaemic heart disease6 (5.1%)
Diabetes mellitus10 (2.5%)
Diabetes mellitus10 (2.5%)
Cerebrovascular disease5 (4.3%)
Cerebrovascular disease5 (5.9%)
Diarrhoeal diseases3 (10.9%)
Diarrhoeal diseases4 (5.9%)
Lower respiratory infections1 (19.3%)
Lower respiratory infections1 (16.5%)
HIV/AIDS4 (6.4%)
HIV/AIDS3 (9.2%)
Tuberculosis2 (12.7%)
Tuberculosis2 (11.9%)
Nephritis/nephrosis9 (2.5%)
Nephritis/nephrosis9 (2.8%)
Hypertensive heart disease9 (2.4%)
Hypertensive heart disease7 (3.0%)
Accidental gunshot8 (3.1%)
Accidental gunshot10 (2.7%)
Meningitis/encephalitis10 (2.2%)
Road injuries6 (3.9%)
Road injuries7 (3.9%)
Ischaemic heart disease5 (4.8%)
Ischaemic heart disease4 (5.4%)
Diabetes mellitus10 (2.3%)
Diabetes mellitus8 (2.8%)
Cerebrovascular disease7 (3.7%)
Cerebrovascular disease5 (5.1%)
Diarrhoeal diseases4 (8.6%)
Diarrhoeal diseases6 (4.8%)
Lower respiratory infections2 (10.6%)
Lower respiratory infections3 (9.8%)
HIV/AIDS3 (9.7%)
HIV/AIDS1 (11.5%)
Tuberculosis1 (11.7%)
Tuberculosis2 (11.2%)
GP trends in leading YLLs, rank (% of total YLLs)
Broad causeComm_mat_peri_nut
HIV and TB
Injury
NCD
% YLLs1.9%
5.0%
10.0%
15.0%
19.3%
295
Section A: Burden of disease

District
2008 2009 2010 2011Year of death
Tshwane: TSH
West Rand:DC48
Endocrine nutritional,blood, immune10 (2.3%)
Interpersonal violence9 (2.8%)
Interpersonal violence7 (3.2%)
Accidental strangulation10 (2.0%)
Accidental strangulation8 (3.1%)
Accidental gunshot7 (2.9%)
Accidental gunshot7 (2.8%)
Meningitis/encephalitis8 (2.9%)
Meningitis/encephalitis6 (3.6%)
Road injuries10 (2.2%)
Road injuries9 (2.3%)
Ischaemic heart disease6 (3.0%)
Ischaemic heart disease5 (5.3%)
Cerebrovascular disease5 (3.6%)
Cerebrovascular disease6 (4.2%)
Diarrhoeal diseases3 (11.1%)
Diarrhoeal diseases4 (5.3%)
Lower respiratory infections1 (16.7%)
Lower respiratory infections2 (11.8%)
HIV/AIDS4 (11.0%)
HIV/AIDS3 (10.6%)
Tuberculosis2 (16.2%)
Tuberculosis1 (13.3%)
GP trends in leading YLLs, rank (% of total YLLs)
Broad causeComm_mat_peri_nut
HIV and TB
Injury
NCD
% YLLs1.9%
5.0%
10.0%
15.0%
19.3%
296
Section A: Burden of disease

District
2008 2009 2010 2011Year of death
Amajuba:DC25
eThekwini:ETH
Harry Gwala:DC43
iLembe: DC29
Ugu: DC21
Road injuries8 (2.6%)
Other respiratory6 (3.0%)
Other respiratory6 (3.3%)
Preterm birth complications8 (2.3%)
Preterm birth complications8 (2.3%)
Nephritis/nephrosis8 (2.7%)
Hypertensive heart disease10 (2.1%)
Meningitis/encephalitis7 (2.5%)
Meningitis/encephalitis7 (2.7%)
Road injuries9 (2.2%)
Ischaemic heart disease10 (1.7%)
Ischaemic heart disease6 (3.0%)
Diabetes mellitus9 (1.7%)
Diabetes mellitus9 (2.6%)
Cerebrovascular disease5 (4.7%)
Cerebrovascular disease5 (4.6%)
Diarrhoeal diseases3 (11.2%)
Diarrhoeal diseases4 (6.7%)
Lower respiratory infections1 (21.2%)
Lower respiratory infections2 (18.2%)
HIV/AIDS4 (8.1%)
HIV/AIDS3 (10.0%)
Tuberculosis2 (20.9%)
Tuberculosis1 (18.5%)
Nephritis/nephrosis9 (2.5%)
Nephritis/nephrosis8 (3.0%)
Accidental strangulation9 (2.7%)
Accidental strangulation10 (2.5%)
Accidental gunshot5 (5.1%)
Accidental gunshot7 (3.7%)
Meningitis/encephalitis8 (2.8%)
Meningitis/encephalitis8 (2.7%)
Ischaemic heart disease6 (4.3%)
Ischaemic heart disease4 (6.4%)
Diabetes mellitus10 (2.0%)
Diabetes mellitus9 (2.9%)
Cerebrovascular disease7 (4.2%)
Cerebrovascular disease5 (5.1%)
Diarrhoeal diseases3 (9.3%)
Diarrhoeal diseases6 (4.9%)
Lower respiratory infections4 (8.0%)
Lower respiratory infections3 (6.8%)
HIV/AIDS2 (11.3%)
HIV/AIDS2 (13.1%)
Tuberculosis1 (21.5%)
Tuberculosis1 (17.5%)
Interpersonal violence10 (1.4%)
Asthma6 (4.0%)
Asthma7 (2.7%)
Preterm birth complications10 (1.7%)
Hypertensive heart disease10 (1.7%)
Hypertensive heart disease9 (2.0%)
Meningitis/encephalitis8 (1.8%)
Meningitis/encephalitis8 (2.5%)
Road injuries9 (1.5%)
Road injuries10 (1.8%)
Diabetes mellitus7 (1.8%)
Diabetes mellitus6 (2.9%)
Cerebrovascular disease5 (4.8%)
Cerebrovascular disease5 (5.6%)
Diarrhoeal diseases2 (13.0%)
Diarrhoeal diseases4 (8.0%)
Lower respiratory infections4 (8.8%)
Lower respiratory infections3 (9.0%)
HIV/AIDS3 (12.9%)
HIV/AIDS2 (15.7%)
Tuberculosis1 (25.6%)
Tuberculosis1 (20.8%)
Nephritis/nephrosis9 (2.1%)
Hypertensive heart disease10 (1.6%)
Accidental strangulation9 (1.7%)
Accidental gunshot6 (3.9%)
Accidental gunshot7 (2.6%)
Meningitis/encephalitis8 (1.9%)
Meningitis/encephalitis6 (2.9%)
Road injuries6 (2.9%)
Road injuries10 (2.0%)
Ischaemic heart disease7 (2.5%)
Ischaemic heart disease7 (2.8%)
Diabetes mellitus9 (2.0%)
Diabetes mellitus8 (2.1%)
Cerebrovascular disease5 (4.9%)
Cerebrovascular disease4 (5.6%)
Diarrhoeal diseases3 (12.1%)
Diarrhoeal diseases3 (9.3%)
Lower respiratory infections4 (7.1%)
Lower respiratory infections5 (5.4%)
HIV/AIDS2 (18.8%)
HIV/AIDS2 (17.7%)
Tuberculosis1 (22.8%)
Tuberculosis1 (21.1%)
KZN trends in leading YLLs, rank (% of total YLLs)% YLLs
1.3%
10.0%
20.0%
31.1%
Broad causeComm_mat_peri_nut
HIV and TB
Injury
NCD
297
Section A: Burden of disease

District
2008 2009 2010 2011Year of death
iLembe: DC29
Ugu: DC21
uMgungundlovu: DC22
uMkhanyakude: DC27
uMzinyathi:DC24
uThukela:DC23
Asthma10 (2.2%)
Asthma9 (2.1%)
Interpersonal violence9 (2.0%)
Interpersonal violence8 (2.1%)
Hypertensive heart disease9 (2.1%)
Hypertensive heart disease8 (2.1%)
Accidental strangulation6 (2.5%)
Accidental strangulation10 (2.1%)
Accidental gunshot10 (2.0%)
Meningitis/encephalitis7 (2.3%)
Meningitis/encephalitis7 (2.1%)
Ischaemic heart disease6 (2.5%)
Ischaemic heart disease7 (2.3%)
Diabetes mellitus8 (2.1%)
Diabetes mellitus6 (2.6%)
Cerebrovascular disease5 (5.0%)
Cerebrovascular disease5 (6.1%)
Diarrhoeal diseases3 (11.1%)
Diarrhoeal diseases4 (7.2%)
Lower respiratory infections4 (9.4%)
Lower respiratory infections3 (8.9%)
HIV/AIDS2 (15.6%)
HIV/AIDS2 (18.9%)
Tuberculosis1 (22.2%)
Tuberculosis1 (20.9%)
Interpersonal violence9 (2.3%)
Interpersonal violence8 (2.9%)
Nephritis/nephrosis9 (2.1%)
Nephritis/nephrosis9 (2.4%)
Accidental gunshot10 (2.2%)
Accidental gunshot10 (2.2%)
Meningitis/encephalitis7 (2.5%)
Meningitis/encephalitis9 (2.4%)
Ischaemic heart disease6 (3.9%)
Ischaemic heart disease6 (4.3%)
Diabetes mellitus8 (2.3%)
Diabetes mellitus7 (3.2%)
Cerebrovascular disease5 (5.1%)
Cerebrovascular disease4 (5.6%)
Diarrhoeal diseases4 (9.6%)
Diarrhoeal diseases5 (5.6%)
Lower respiratory infections3 (10.1%)
Lower respiratory infections3 (7.7%)
HIV/AIDS2 (11.2%)
HIV/AIDS1 (17.5%)
Tuberculosis1 (23.0%)
Tuberculosis2 (15.7%)
Protein-energy malnutrition10 (1.3%)
Interpersonal violence10 (1.7%)
Hypertensive heart disease7 (2.0%)
Accidental strangulation9 (1.6%)
Accidental strangulation8 (2.0%)
Accidental gunshot7 (2.0%)
Accidental gunshot9 (1.9%)
Meningitis/encephalitis8 (2.0%)
Meningitis/encephalitis9 (1.5%)
Ischaemic heart disease6 (2.1%)
Ischaemic heart disease8 (1.8%)
Diabetes mellitus10 (1.4%)
Diabetes mellitus6 (2.1%)
Cerebrovascular disease5 (3.8%)
Cerebrovascular disease4 (5.0%)
Diarrhoeal diseases3 (8.7%)
Diarrhoeal diseases3 (6.4%)
Lower respiratory infections4 (5.0%)
Lower respiratory infections5 (4.2%)
HIV/AIDS1 (31.1%)
HIV/AIDS1 (30.1%)
Tuberculosis2 (20.8%)
Tuberculosis2 (18.4%)
Other infectious diseases10 (1.8%)
Preterm birth complications6 (2.7%)
Preterm birth complications9 (2.5%)
Accidental gunshot7 (2.6%)
Accidental gunshot10 (1.9%)
Meningitis/encephalitis8 (2.6%)
Meningitis/encephalitis9 (2.4%)
Road injuries7 (2.7%)
Ischaemic heart disease10 (1.7%)
Ischaemic heart disease6 (2.8%)
Diabetes mellitus9 (1.7%)
Diabetes mellitus8 (2.5%)
Cerebrovascular disease5 (4.6%)
Cerebrovascular disease5 (4.7%)
Diarrhoeal diseases3 (12.3%)
Diarrhoeal diseases4 (9.0%)
Lower respiratory infections4 (11.6%)
Lower respiratory infections3 (9.3%)
HIV/AIDS2 (12.9%)
HIV/AIDS2 (17.3%)
Tuberculosis1 (23.7%)
Tuberculosis1 (19.8%)
KZN trends in leading YLLs, rank (% of total YLLs)% YLLs
1.3%
10.0%
20.0%
31.1%
Broad causeComm_mat_peri_nut
HIV and TB
Injury
NCD
298
Section A: Burden of disease

District
2008 2009 2010 2011Year of death
uMzinyathi:DC24
uThukela:DC23
uThungulu:DC28
Zululand:DC26
Preterm birth complications10 (1.8%)
Preterm birth complications10 (1.9%)
Hypertensive heart disease8 (2.4%)
Hypertensive heart disease10 (2.3%)
Accidental strangulation7 (2.8%)
Accidental strangulation7 (3.2%)
Accidental gunshot9 (2.2%)
Meningitis/encephalitis6 (3.0%)
Meningitis/encephalitis8 (2.5%)
Ischaemic heart disease7 (2.8%)
Ischaemic heart disease6 (4.7%)
Diabetes mellitus9 (2.5%)
Diabetes mellitus9 (2.1%)
Cerebrovascular disease5 (5.0%)
Cerebrovascular disease5 (6.0%)
Diarrhoeal diseases2 (16.0%)
Diarrhoeal diseases4 (9.4%)
Lower respiratory infections3 (13.7%)
Lower respiratory infections3 (11.1%)
HIV/AIDS4 (11.7%)
HIV/AIDS2 (15.0%)
Tuberculosis1 (18.5%)
Tuberculosis1 (17.0%)
Preterm birth complications10 (2.2%)
Preterm birth complications10 (2.1%)
Hypertensive heart disease9 (2.1%)
Hypertensive heart disease7 (2.3%)
Accidental gunshot6 (2.8%)
Accidental gunshot10 (2.1%)
Meningitis/encephalitis7 (2.6%)
Meningitis/encephalitis9 (2.3%)
Road injuries8 (2.6%)
Road injuries6 (3.7%)
Diabetes mellitus10 (1.8%)
Diabetes mellitus8 (2.3%)
Cerebrovascular disease5 (3.8%)
Cerebrovascular disease5 (4.6%)
Diarrhoeal diseases3 (9.1%)
Diarrhoeal diseases4 (5.8%)
Lower respiratory infections4 (8.5%)
Lower respiratory infections3 (8.0%)
HIV/AIDS2 (18.8%)
HIV/AIDS1 (19.0%)
Tuberculosis1 (23.3%)
Tuberculosis2 (18.3%)
Endocrine nutritional,blood, immune10 (1.5%)
Endocrine nutritional,blood, immune9 (1.9%)
Preterm birth complications8 (1.9%)
Preterm birth complications10 (1.6%)
Accidental strangulation10 (1.5%)
Meningitis/encephalitis5 (3.8%)
Meningitis/encephalitis6 (3.2%)
Road injuries9 (1.6%)
Road injuries7 (3.0%)
Ischaemic heart disease7 (2.7%)
Ischaemic heart disease9 (1.6%)
Diabetes mellitus8 (1.6%)
Diabetes mellitus8 (1.9%)
Cerebrovascular disease6 (3.3%)
Cerebrovascular disease5 (4.1%)
Diarrhoeal diseases2 (15.1%)
Diarrhoeal diseases4 (8.6%)
Lower respiratory infections4 (10.2%)
Lower respiratory infections3 (9.9%)
HIV/AIDS3 (10.4%)
HIV/AIDS2 (14.5%)
Tuberculosis1 (26.8%)
Tuberculosis1 (26.3%)
KZN trends in leading YLLs, rank (% of total YLLs)% YLLs
1.3%
10.0%
20.0%
31.1%
Broad causeComm_mat_peri_nut
HIV and TB
Injury
NCD
299
Section A: Burden of disease

District
2008 2009 2010 2011Year of death
Capricorn:DC35
Mopani: DC33
Sekhukhune:DC47
Vhembe:DC34
Waterberg:DC36
Hypertensive heart disease7 (2.4%)
Hypertensive heart disease7 (3.9%)
Meningitis/encephalitis10 (1.8%)
Meningitis/encephalitis10 (1.8%)
Road injuries5 (4.4%)
Road injuries5 (5.0%)
Ischaemic heart disease9 (2.3%)
Ischaemic heart disease9 (1.9%)
Diabetes mellitus8 (2.4%)
Diabetes mellitus8 (3.6%)
Cerebrovascular disease6 (4.0%)
Cerebrovascular disease6 (4.5%)
Diarrhoeal diseases2 (16.0%)
Diarrhoeal diseases4 (9.7%)
Lower respiratory infections1 (16.0%)
Lower respiratory infections1 (14.7%)
HIV/AIDS4 (8.4%)
HIV/AIDS3 (10.8%)
Tuberculosis3 (13.4%)
Tuberculosis2 (12.7%)
Protein-energy malnutrition10 (1.7%)
Cardiomyopathy10 (1.5%)
Cardiomyopathy9 (2.2%)
Septicaemia9 (1.7%)
Preterm birth complications10 (1.8%)
Preterm birth complications9 (1.8%)
Nephritis/nephrosis9 (2.1%)
Nephritis/nephrosis10 (1.8%)
Meningitis/encephalitis6 (3.4%)
Meningitis/encephalitis5 (4.0%)
Road injuries7 (2.8%)
Road injuries8 (2.5%)
Diabetes mellitus8 (2.4%)
Diabetes mellitus7 (3.0%)
Cerebrovascular disease5 (4.4%)
Cerebrovascular disease6 (4.0%)
Diarrhoeal diseases1 (20.0%)
Diarrhoeal diseases2 (13.9%)
Lower respiratory infections2 (13.9%)
Lower respiratory infections3 (12.9%)
HIV/AIDS4 (9.2%)
HIV/AIDS4 (12.5%)
Tuberculosis3 (13.1%)
Tuberculosis1 (14.5%)
Cardiomyopathy7 (2.4%)
Cardiomyopathy8 (2.3%)
Hypertensive heart disease8 (2.2%)
Hypertensive heart disease7 (2.8%)
Accidental strangulation10 (1.5%)
Meningitis/encephalitis10 (1.8%)
Meningitis/encephalitis10 (1.7%)
Road injuries6 (4.1%)
Road injuries6 (5.0%)
Ischaemic heart disease9 (1.7%)
Ischaemic heart disease9 (1.9%)
Diabetes mellitus9 (2.0%)
Diabetes mellitus8 (2.5%)
Cerebrovascular disease5 (4.6%)
Cerebrovascular disease5 (6.1%)
Diarrhoeal diseases2 (17.6%)
Diarrhoeal diseases3 (12.7%)
Lower respiratory infections1 (23.1%)
Lower respiratory infections1 (23.0%)
HIV/AIDS4 (8.6%)
HIV/AIDS2 (13.3%)
Tuberculosis3 (10.3%)
Tuberculosis4 (9.9%)
Endocrine nutritional,blood, immune10 (2.1%)
Protein-energy malnutrition9 (2.4%)
Septicaemia9 (2.3%)
Preterm birth complications10 (2.3%)
Nephritis/nephrosis10 (2.0%)
Nephritis/nephrosis10 (2.3%)
Accidental strangulation8 (2.6%)
Accidental strangulation8 (3.1%)
Meningitis/encephalitis9 (2.5%)
Meningitis/encephalitis9 (2.1%)
Road injuries6 (3.0%)
Road injuries7 (3.5%)
Diabetes mellitus7 (3.0%)
Diabetes mellitus6 (4.5%)
Cerebrovascular disease5 (3.8%)
Cerebrovascular disease5 (5.2%)
Diarrhoeal diseases2 (16.8%)
Diarrhoeal diseases2 (12.0%)
Lower respiratory infections3 (12.3%)
Lower respiratory infections3 (11.2%)
HIV/AIDS4 (5.2%)
HIV/AIDS4 (9.3%)
Tuberculosis1 (17.5%)
Tuberculosis1 (13.6%)
LP trends in leading YLLs, rank (% of total YLLs)
Broad causeComm_mat_peri_nut
HIV and TB
Injury
NCD
% YLLs1.5%
5.0%
10.0%
15.0%
20.0%
26.7%
300
Section A: Burden of disease

District
2008 2009 2010 2011Year of death
Vhembe:DC34
Waterberg:DC36
Nephritis/nephrosis8 (2.3%)
Hypertensive heart disease8 (2.4%)
Hypertensive heart disease9 (2.0%)
Meningitis/encephalitis9 (2.0%)
Meningitis/encephalitis9 (2.1%)
Road injuries5 (6.0%)
Road injuries5 (6.5%)
Ischaemic heart disease6 (4.2%)
Ischaemic heart disease7 (3.9%)
Diabetes mellitus10 (1.9%)
Diabetes mellitus10 (1.8%)
Cerebrovascular disease7 (3.7%)
Cerebrovascular disease6 (3.9%)
Diarrhoeal diseases1 (15.8%)
Diarrhoeal diseases4 (7.2%)
Lower respiratory infections2 (15.8%)
Lower respiratory infections3 (13.3%)
HIV/AIDS4 (11.5%)
HIV/AIDS2 (14.2%)
Tuberculosis3 (12.2%)
Tuberculosis1 (14.5%)
LP trends in leading YLLs, rank (% of total YLLs)
Broad causeComm_mat_peri_nut
HIV and TB
Injury
NCD
% YLLs1.5%
5.0%
10.0%
15.0%
20.0%
26.7%
301
Section A: Burden of disease

District
2008 2009 2010 2011Year of death
Ehlanzeni:DC32
G Sibande:DC30
Nkangala:DC31
Endocrine nutritional,blood, immune10 (1.4%)
Septicaemia8 (1.9%)
Septicaemia10 (1.6%)
Hypertensive heart disease10 (1.4%)
Meningitis/encephalitis7 (2.8%)
Meningitis/encephalitis7 (3.2%)
Road injuries6 (3.3%)
Road injuries6 (3.8%)
Ischaemic heart disease10 (1.3%)
Ischaemic heart disease8 (2.2%)
Diabetes mellitus9 (1.7%)
Diabetes mellitus9 (2.1%)
Cerebrovascular disease5 (5.1%)
Cerebrovascular disease5 (6.4%)
Diarrhoeal diseases2 (15.4%)
Diarrhoeal diseases4 (8.8%)
Lower respiratory infections3 (13.1%)
Lower respiratory infections3 (10.4%)
HIV/AIDS4 (12.5%)
HIV/AIDS2 (15.6%)
Tuberculosis1 (19.0%)
Tuberculosis1 (19.6%)
Preterm birth complications10 (1.7%)
Preterm birth complications10 (1.9%)
Hypertensive heart disease9 (1.9%)
Hypertensive heart disease9 (2.5%)
Accidental strangulation10 (2.0%)
Meningitis/encephalitis6 (3.0%)
Meningitis/encephalitis7 (2.6%)
Road injuries7 (2.6%)
Road injuries6 (3.5%)
Ischaemic heart disease8 (1.9%)
Ischaemic heart disease10 (2.4%)
Diabetes mellitus9 (1.7%)
Diabetes mellitus8 (2.5%)
Cerebrovascular disease5 (3.0%)
Cerebrovascular disease5 (3.9%)
Diarrhoeal diseases3 (14.7%)
Diarrhoeal diseases4 (10.2%)
Lower respiratory infections1 (16.7%)
Lower respiratory infections3 (13.7%)
HIV/AIDS4 (12.2%)
HIV/AIDS2 (14.4%)
Tuberculosis2 (16.3%)
Tuberculosis1 (15.5%)
COPD9 (2.4%)
Hypertensive heart disease5 (4.8%)
Hypertensive heart disease8 (4.0%)
Accidental strangulation10 (2.2%)
Meningitis/encephalitis10 (2.4%)
Meningitis/encephalitis10 (2.1%)
Road injuries6 (4.4%)
Road injuries6 (4.5%)
Ischaemic heart disease8 (3.1%)
Ischaemic heart disease7 (4.5%)
Diabetes mellitus10 (2.0%)
Diabetes mellitus9 (3.1%)
Cerebrovascular disease7 (3.7%)
Cerebrovascular disease5 (4.7%)
Diarrhoeal diseases3 (12.5%)
Diarrhoeal diseases4 (6.1%)
Lower respiratory infections1 (16.8%)
Lower respiratory infections1 (14.1%)
HIV/AIDS4 (9.5%)
HIV/AIDS3 (13.4%)
Tuberculosis2 (14.7%)
Tuberculosis2 (13.8%)
MP trends in leading YLLs, rank (% of total YLLs)
Broad causeComm_mat_peri_nut
HIV and TB
Injury
NCD
% YLLs1.3%
5.0%
10.0%
15.0%
20.1%
302
Section A: Burden of disease
District
2008 2009 2010 2011Year of death
FrancesBaard: DC9
JT Gaetsewe:DC45
Namakwa:DC6
Pixley kaSeme: DC7
ZF Mgcawu:DC8
COPD10 (1.8%)
COPD10 (2.4%)
Interpersonal violence7 (2.9%)
Interpersonal violence7 (2.7%)
Preterm birth complications9 (1.8%)
Hypertensive heart disease10 (2.1%)
Hypertensive heart disease9 (2.4%)
Accidental strangulation7 (2.4%)
Accidental strangulation8 (2.5%)
Meningitis/encephalitis9 (2.4%)
Road injuries8 (2.5%)
Ischaemic heart disease6 (3.3%)
Ischaemic heart disease6 (2.9%)
Diabetes mellitus10 (2.1%)
Cerebrovascular disease5 (3.9%)
Cerebrovascular disease5 (5.0%)
Diarrhoeal diseases4 (6.3%)
Diarrhoeal diseases4 (5.1%)
Lower respiratory infections3 (9.9%)
Lower respiratory infections3 (9.6%)
HIV/AIDS2 (12.9%)
HIV/AIDS1 (16.2%)
Tuberculosis1 (18.3%)
Tuberculosis2 (14.4%)
Protein-energy malnutrition9 (2.5%)
Ischaemic heart disease8 (2.2%)
Birth asphyxia10 (2.3%)
Birth asphyxia9 (2.0%)
Other respiratory5 (3.3%)
Other respiratory5 (6.6%)
Endocrine nutritional,blood, immune9 (1.9%)
Endocrine nutritional,blood, immune9 (2.3%)
Preterm birth complications8 (2.6%)
Preterm birth complications8 (2.3%)
Accidental strangulation8 (2.0%)
Accidental strangulation6 (3.3%)
Meningitis/encephalitis10 (1.9%)
Meningitis/encephalitis10 (2.1%)
Road injuries7 (2.9%)
Ischaemic heart disease7 (2.9%)
Cerebrovascular disease6 (3.1%)
Cerebrovascular disease5 (4.4%)
Diarrhoeal diseases2 (16.7%)
Diarrhoeal diseases3 (10.9%)
Lower respiratory infections1 (26.6%)
Lower respiratory infections1 (22.9%)
HIV/AIDS4 (3.5%)
HIV/AIDS4 (10.4%)
Tuberculosis3 (10.9%)
Tuberculosis2 (12.4%)
Other respiratory8 (3.5%)
Trachea/bronchi/lung10 (3.2%)
Trachea/bronchi/lung8 (2.8%)
Other respiratory6 (4.6%)
COPD5 (4.6%)
COPD3 (7.1%)
Interpersonal violence6 (3.9%)
Interpersonal violence9 (2.6%)
Preterm birth complications8 (3.5%)
Preterm birth complications6 (3.2%)
Accidental strangulation10 (2.5%)
Road injuries4 (5.6%)
Road injuries9 (3.3%)
Ischaemic heart disease2 (9.1%)
Ischaemic heart disease4 (6.8%)
Diabetes mellitus9 (3.3%)
Cerebrovascular disease7 (4.3%)
Cerebrovascular disease5 (5.6%)
Diarrhoeal diseases8 (3.3%)
Lower respiratory infections10 (3.2%)
Lower respiratory infections7 (3.1%)
HIV/AIDS3 (8.9%)
HIV/AIDS2 (10.0%)
Tuberculosis1 (10.7%)
Tuberculosis1 (11.4%)
Endocrine nutritional,blood, immune10 (2.0%)
Protein-energy malnutrition10 (2.3%)
Protein-energy malnutrition10 (2.2%)
COPD8 (3.3%)
COPD6 (4.0%)
Interpersonal violence7 (3.8%)
Interpersonal violence7 (4.0%)
Preterm birth complications9 (3.1%)
Preterm birth complications9 (2.3%)
Road injuries10 (2.0%)
Ischaemic heart disease5 (5.0%)
Ischaemic heart disease5 (5.6%)
Diabetes mellitus9 (2.2%)
Cerebrovascular disease6 (4.9%)
Cerebrovascular disease4 (6.4%)
Diarrhoeal diseases3 (9.0%)
Diarrhoeal diseases8 (3.9%)
Lower respiratory infections4 (7.3%)
Lower respiratory infections3 (7.6%)
HIV/AIDS2 (11.5%)
HIV/AIDS2 (12.9%)
Tuberculosis1 (16.0%)
Tuberculosis1 (13.5%)
NC trends in leading YLLs, rank (% of total YLLs)
Broad causeComm_mat_peri_nut
HIV and TB
Injury
NCD
% YLLs1.8%
5.0%
10.0%
15.0%
20.0%
26.6%
303
Section A: Burden of disease
District
2008 2009 2010 2011Year of death
Pixley kaSeme: DC7
ZF Mgcawu:DC8
Self-inflicted injuries10 (2.1%)
Drowning9 (2.6%)
COPD8 (3.7%)
COPD6 (3.9%)
Interpersonal violence9 (3.5%)
Interpersonal violence8 (3.7%)
Preterm birth complications10 (2.2%)
Road injuries7 (4.1%)
Road injuries10 (2.1%)
Ischaemic heart disease6 (4.4%)
Ischaemic heart disease7 (3.7%)
Diabetes mellitus10 (1.9%)
Cerebrovascular disease5 (4.6%)
Cerebrovascular disease5 (4.7%)
Diarrhoeal diseases4 (7.0%)
Diarrhoeal diseases4 (6.2%)
Lower respiratory infections3 (9.2%)
Lower respiratory infections3 (6.9%)
HIV/AIDS2 (12.8%)
HIV/AIDS1 (17.9%)
Tuberculosis1 (18.1%)
Tuberculosis2 (12.8%)
NC trends in leading YLLs, rank (% of total YLLs)
Broad causeComm_mat_peri_nut
HIV and TB
Injury
NCD
% YLLs1.8%
5.0%
10.0%
15.0%
20.0%
26.6%
304
Section A: Burden of disease

District
2008 2009 2010 2011Year of death
Bojanala:DC37
Dr K Kaunda:DC40
NM Molema:DC38
RS Mompati:DC39
Preterm birth complications10 (2.0%)
Accidental gunshot9 (2.0%)
Interpersonal violence10 (2.1%)
Interpersonal violence10 (2.1%)
Hypertensive heart disease5 (3.9%)
Hypertensive heart disease6 (4.3%)
Accidental strangulation8 (2.2%)
Accidental strangulation8 (3.1%)
Road injuries10 (2.0%)
Ischaemic heart disease7 (2.7%)
Ischaemic heart disease7 (3.4%)
Diabetes mellitus9 (2.0%)
Diabetes mellitus9 (2.6%)
Cerebrovascular disease6 (3.7%)
Cerebrovascular disease5 (4.6%)
Diarrhoeal diseases2 (13.5%)
Diarrhoeal diseases4 (6.9%)
Lower respiratory infections1 (14.6%)
Lower respiratory infections3 (11.9%)
HIV/AIDS3 (12.7%)
HIV/AIDS1 (15.2%)
Tuberculosis4 (12.5%)
Tuberculosis2 (12.7%)
Fires, hot substances9 (2.0%)
Interpersonal violence6 (3.0%)
Interpersonal violence7 (2.5%)
Preterm birth complications10 (1.8%)
Preterm birth complications10 (1.9%)
Nephritis/nephrosis10 (1.8%)
Nephritis/nephrosis8 (2.4%)
Accidental strangulation8 (2.5%)
Accidental strangulation8 (2.2%)
Road injuries9 (2.0%)
Road injuries9 (2.0%)
Ischaemic heart disease7 (2.6%)
Ischaemic heart disease6 (2.6%)
Diabetes mellitus10 (1.8%)
Cerebrovascular disease5 (3.3%)
Cerebrovascular disease4 (4.6%)
Diarrhoeal diseases4 (8.9%)
Diarrhoeal diseases5 (4.6%)
Lower respiratory infections3 (10.9%)
Lower respiratory infections3 (8.7%)
HIV/AIDS2 (12.8%)
HIV/AIDS2 (15.1%)
Tuberculosis1 (20.4%)
Tuberculosis1 (18.6%)
Accidental strangulation10 (1.8%)
Asthma10 (2.1%)
Septicaemia7 (2.9%)
Septicaemia8 (2.4%)
Preterm birth complications7 (2.7%)
Preterm birth complications9 (2.4%)
Hypertensive heart disease6 (3.1%)
Hypertensive heart disease6 (3.9%)
Meningitis/encephalitis9 (2.3%)
Meningitis/encephalitis9 (2.1%)
Road injuries8 (2.6%)
Road injuries7 (3.0%)
Diabetes mellitus10 (2.0%)
Diabetes mellitus10 (2.3%)
Cerebrovascular disease5 (4.3%)
Cerebrovascular disease5 (4.9%)
Diarrhoeal diseases3 (11.1%)
Diarrhoeal diseases4 (6.6%)
Lower respiratory infections1 (18.5%)
Lower respiratory infections1 (17.9%)
HIV/AIDS4 (6.7%)
HIV/AIDS3 (9.7%)
Tuberculosis2 (16.9%)
Tuberculosis2 (17.1%)
Protein-energy malnutrition7 (2.1%)
Protein-energy malnutrition9 (2.0%)
Birth asphyxia9 (1.8%)
Other respiratory7 (2.4%)
Preterm birth complications9 (1.8%)
Preterm birth complications10 (2.0%)
Hypertensive heart disease6 (2.7%)
Hypertensive heart disease6 (3.1%)
Accidental strangulation10 (1.7%)
Accidental strangulation8 (2.1%)
Ischaemic heart disease8 (1.9%)
Ischaemic heart disease7 (2.8%)
Cerebrovascular disease5 (3.8%)
Cerebrovascular disease5 (4.6%)
Diarrhoeal diseases3 (14.2%)
Diarrhoeal diseases4 (9.1%)
Lower respiratory infections2 (15.6%)
Lower respiratory infections2 (15.7%)
HIV/AIDS4 (13.5%)
HIV/AIDS1 (19.4%)
Tuberculosis1 (15.7%)
Tuberculosis3 (13.1%)
NW trends in leading YLLs, rank (% of total YLLs)
Broad causeComm_mat_peri_nut
HIV and TB
Injury
NCD
% YLLs1.7%
5.0%
10.0%
15.0%
21.8%
305
Section A: Burden of disease
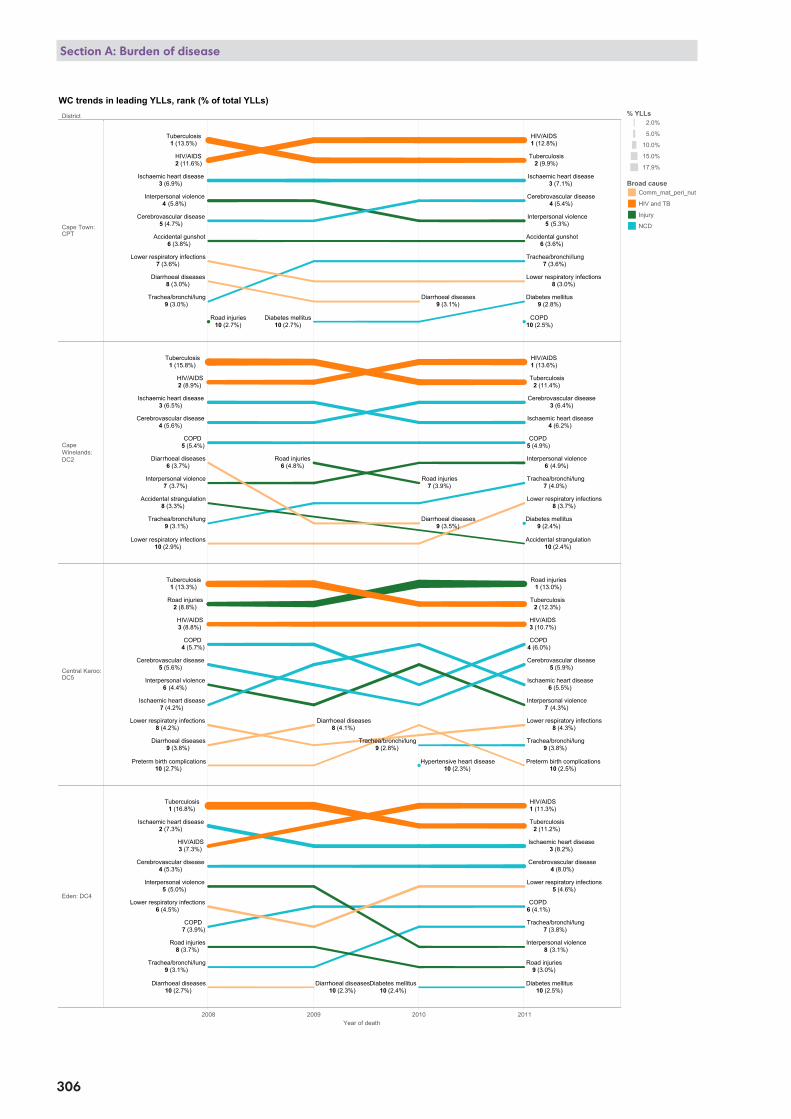
District
2008 2009 2010 2011Year of death
Cape Town:CPT
CapeWinelands:DC2
Central Karoo:DC5
Eden: DC4
Overberg: DC3
Trachea/bronchi/lung9 (3.0%)
Trachea/bronchi/lung7 (3.6%)
COPD10 (2.5%)
Interpersonal violence4 (5.8%)
Interpersonal violence5 (5.3%)
Accidental gunshot6 (3.8%)
Accidental gunshot6 (3.6%)
Road injuries10 (2.7%)
Ischaemic heart disease3 (6.9%)
Ischaemic heart disease3 (7.1%)
Diabetes mellitus10 (2.7%)
Diabetes mellitus9 (2.8%)
Cerebrovascular disease5 (4.7%)
Cerebrovascular disease4 (5.4%)
Diarrhoeal diseases8 (3.0%)
Diarrhoeal diseases9 (3.1%)
Lower respiratory infections7 (3.6%)
Lower respiratory infections8 (3.0%)
HIV/AIDS2 (11.6%)
HIV/AIDS1 (12.8%)
Tuberculosis1 (13.5%)
Tuberculosis2 (9.9%)
Trachea/bronchi/lung9 (3.1%)
Trachea/bronchi/lung7 (4.0%)
COPD5 (5.4%)
COPD5 (4.9%)
Interpersonal violence7 (3.7%)
Interpersonal violence6 (4.9%)
Accidental strangulation8 (3.3%)
Accidental strangulation10 (2.4%)
Road injuries6 (4.8%)
Road injuries7 (3.9%)
Ischaemic heart disease3 (6.5%)
Ischaemic heart disease4 (6.2%)
Diabetes mellitus9 (2.4%)
Cerebrovascular disease4 (5.6%)
Cerebrovascular disease3 (6.4%)
Diarrhoeal diseases6 (3.7%)
Diarrhoeal diseases9 (3.5%)
Lower respiratory infections10 (2.9%)
Lower respiratory infections8 (3.7%)
HIV/AIDS2 (8.9%)
HIV/AIDS1 (13.6%)
Tuberculosis1 (15.8%)
Tuberculosis2 (11.4%)
Trachea/bronchi/lung9 (2.8%)
Trachea/bronchi/lung9 (3.8%)
COPD4 (5.7%)
COPD4 (6.0%)
Interpersonal violence6 (4.4%)
Interpersonal violence7 (4.3%)
Preterm birth complications10 (2.7%)
Preterm birth complications10 (2.5%)
Hypertensive heart disease10 (2.3%)
Road injuries2 (8.8%)
Road injuries1 (13.0%)
Ischaemic heart disease7 (4.2%)
Ischaemic heart disease6 (5.5%)
Cerebrovascular disease5 (5.6%)
Cerebrovascular disease5 (5.9%)
Diarrhoeal diseases9 (3.8%)
Diarrhoeal diseases8 (4.1%)
Lower respiratory infections8 (4.2%)
Lower respiratory infections8 (4.3%)
HIV/AIDS3 (8.8%)
HIV/AIDS3 (10.7%)
Tuberculosis1 (13.3%)
Tuberculosis2 (12.3%)
Trachea/bronchi/lung9 (3.1%)
Trachea/bronchi/lung7 (3.8%)
COPD7 (3.9%)
COPD6 (4.1%)
Interpersonal violence5 (5.0%)
Interpersonal violence8 (3.1%)
Road injuries8 (3.7%)
Road injuries9 (3.0%)
Ischaemic heart disease2 (7.3%)
Ischaemic heart disease3 (8.2%)
Diabetes mellitus10 (2.4%)
Diabetes mellitus10 (2.5%)
Cerebrovascular disease4 (5.3%)
Cerebrovascular disease4 (8.0%)
Diarrhoeal diseases10 (2.7%)
Diarrhoeal diseases10 (2.3%)
Lower respiratory infections6 (4.5%)
Lower respiratory infections5 (4.6%)
HIV/AIDS3 (7.3%)
HIV/AIDS1 (11.3%)
Tuberculosis1 (16.8%)
Tuberculosis2 (11.2%)
WC trends in leading YLLs, rank (% of total YLLs)
Broad causeComm_mat_peri_nut
HIV and TB
Injury
NCD
% YLLs2.0%
5.0%
10.0%
15.0%
17.9%
306
Section A: Burden of disease

District
2008 2009 2010 2011Year of death
Eden: DC4
Overberg: DC3
West Coast:DC1
Drowning4 (5.2%)
Drowning10 (2.0%)
Trachea/bronchi/lung8 (3.9%)
Trachea/bronchi/lung5 (5.3%)
COPD10 (3.7%)
COPD8 (4.6%)
Interpersonal violence6 (4.4%)
Interpersonal violence6 (4.7%)
Accidental strangulation6 (4.6%)
Accidental strangulation8 (3.3%)
Road injuries5 (4.6%)
Road injuries7 (4.7%)
Ischaemic heart disease2 (8.5%)
Ischaemic heart disease3 (7.7%)
Cerebrovascular disease7 (4.6%)
Cerebrovascular disease4 (6.5%)
Diarrhoeal diseases9 (3.9%)
Diarrhoeal diseases10 (2.9%)
Lower respiratory infections10 (3.8%)
Lower respiratory infections9 (3.7%)
HIV/AIDS3 (6.3%)
HIV/AIDS1 (10.6%)
Tuberculosis1 (12.5%)
Tuberculosis2 (10.2%)
Drowning10 (2.8%)
Drowning9 (3.4%)
Trachea/bronchi/lung8 (3.5%)
Trachea/bronchi/lung8 (4.1%)
COPD9 (3.4%)
COPD6 (4.6%)
Interpersonal violence9 (2.9%)
Interpersonal violence7 (4.4%)
Accidental strangulation6 (4.5%)
Accidental strangulation10 (3.4%)
Ischaemic heart disease2 (8.2%)
Ischaemic heart disease2 (8.8%)
Cerebrovascular disease3 (6.8%)
Cerebrovascular disease4 (7.0%)
Diarrhoeal diseases7 (4.3%)
Diarrhoeal diseases10 (2.4%)
Lower respiratory infections5 (5.1%)
Lower respiratory infections5 (4.9%)
HIV/AIDS4 (6.1%)
HIV/AIDS3 (8.0%)
Tuberculosis1 (15.3%)
Tuberculosis1 (13.8%)
WC trends in leading YLLs, rank (% of total YLLs)
Broad causeComm_mat_peri_nut
HIV and TB
Injury
NCD
% YLLs2.0%
5.0%
10.0%
15.0%
17.9%
307
Section A: Burden of disease

0 5 10 15 20 25 30 35 40 45 50 55 60 65 70 75 80 85 90 95 100 105ZA_av
2008
2009
2010
2011
10.5
10.931.928.9
28.9
31.3
29.3
28.3
25.3
10.629.0
11.434.4
29.1
31.129.1
Percentage of YLLs by broad cause, South Africa
IndicatorShortInjury YLLsNCD YLLsHIV and TB YLLsComm_mat_peri_nut YLLs
0 5 10 15 20 25 30 35 40 45 50 55 60 65 70 75 80 85 90 95 100Percentage of YLLs
Western Cape
Northern Cape
Gauteng
Eastern Cape
Free State
North West
Limpopo
Mpumalanga
KwaZulu-Natal
39.523.5
16.8
28.9
11.9
30.8
29.8
35.8
10.3
29.7
31.3
24.7
35.3
10.7
10.6
23.6
25.6
29.6
36.6
22.6
12.0
10.0
19.0
49.4
26.4
32.4
26.4
28.4
33.2
30.2
11.2
32.2
25.1
38.1
9.8
8.7
Percentage of YLLs by broad causes, by province, 2011
IndicatorShortInjury YLLsNCD YLLsHIV and TB YLLsComm_mat_peri_nut YLLs
YLLs sorted in order of the combined proporation of Communicable and Maternal YLLs and YLLs due to HIV and TB.
308
Section A: Burden of disease
Cause of death profile
South Africa still faces a quadruple burden of communicable diseases together with maternal, perinatal and nutritional conditions (Comm/Mat/Peri/Nut), HIV and TB, non-communicable diseases (NCDs) and injuries. However, the percentage of the burden due to HIV and TB and Comm/Mat/Peri/Nutr declined between 2008 and 2011 from 60% to 54%, with a corresponding increase in the burden due to NCDs, and to a lesser extent, injuries (Figure 10).
Figure 10: Percentage of YLLs by broad cause, South Africa, 2008-2011
The quadruple burden varied across provinces, with Western Cape having the highest proportion due to injury (16.8%) and non-communicable diseases (49.4%) than any other province (Figure 12). KwaZulu-Natal, Mpumalanga, Limpopo and North West had the highest proportions due to HIV and TB and Comm/Mat/Peri/Nutri (approximately 60%). Districts within the provinces reflect the provincial profiles. uMkhanyakude (KZN) had the highest burden due to HIV and TB (48.5%), and Overberg (WC) had the lowest (20.8%). Districts falling into the highest SEQ quintile (SEQ5) and metros had higher proportions of YLLs due to injuries and NCDs, whilst those falling into the lowest SEQs had higher proportions of YLLs due to HIV and TB and Comm/Mat/Peri/Nut (Map 2).
Figure 11: Percentage of YLLs by broad cause by province, 2011
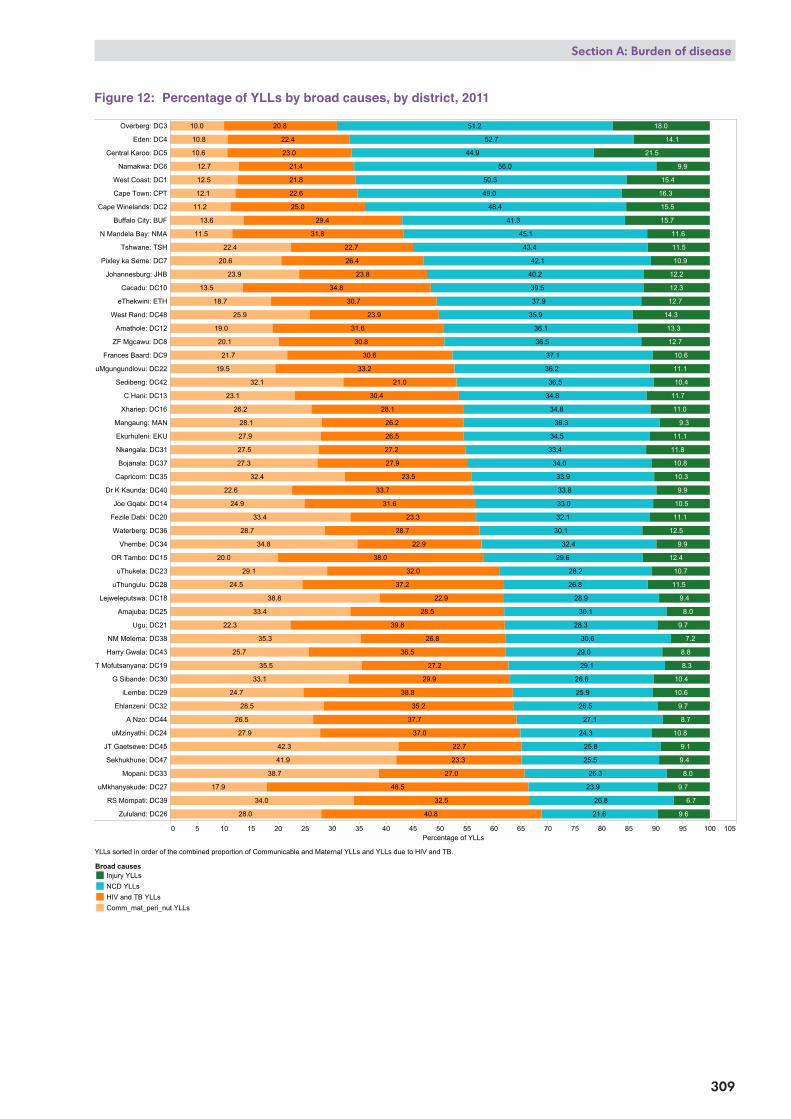
0 5 10 15 20 25 30 35 40 45 50 55 60 65 70 75 80 85 90 95 100 105Percentage of YLLs
Overberg: DC3
Eden: DC4
Central Karoo: DC5
Namakwa: DC6
West Coast: DC1
Cape Town: CPT
Cape Winelands: DC2
Buffalo City: BUF
N Mandela Bay: NMA
Tshwane: TSH
Pixley ka Seme: DC7
Johannesburg: JHB
Cacadu: DC10
eThekwini: ETH
West Rand: DC48
Amathole: DC12
ZF Mgcawu: DC8
Frances Baard: DC9
uMgungundlovu: DC22
Sedibeng: DC42
C Hani: DC13
Xhariep: DC16
Mangaung: MAN
Ekurhuleni: EKU
Nkangala: DC31
Bojanala: DC37
Capricorn: DC35
Dr K Kaunda: DC40
Joe Gqabi: DC14
Fezile Dabi: DC20
Waterberg: DC36
Vhembe: DC34
OR Tambo: DC15
uThukela: DC23
uThungulu: DC28
Lejweleputswa: DC18
Amajuba: DC25
Ugu: DC21
NM Molema: DC38
Harry Gwala: DC43
T Mofutsanyana: DC19
G Sibande: DC30
iLembe: DC29
Ehlanzeni: DC32
A Nzo: DC44
uMzinyathi: DC24
JT Gaetsewe: DC45
Sekhukhune: DC47
Mopani: DC33
uMkhanyakude: DC27
RS Mompati: DC39
Zululand: DC26
27.5
35.5
21.5
10.5
36.5
12.5
15.5
19.5
34.5
11.5
36.5
11.5
32.5
23.5
13.5
48.5
26.5
11.5
12.5
24.5
28.5
36.5
26.5
25.5
39.5
28.5
26.5
26.8
28.9
23.9
21.8
26.8
25.9
10.9
20.8
27.9
29.9
41.9
17.9
25.8
38.8
34.8
24.9
11.8
10.8
27.9
25.9
23.9
10.8
40.8
10.8
38.8
31.8
44.9
26.8
39.8
22.9
22.9
37.9
35.9
34.8
34.8
27.9
33.9
33.8
30.8
23.9
34.8
23.8
10.3
25.7
35.3
16.3
15.7
24.3
22.3
12.3
14.3
13.3
23.3
37.7
41.3
30.7
23.3
26.3
12.7
33.7
18.7
22.7
28.3
10.7
12.7
22.7
50.3
36.3
28.7
21.7
24.7
11.7
12.7
27.3
42.3
52.7
38.7
28.7
31.6
30.6
31.6
10.6
13.6
20.6
22.6
11.6
10.6
10.6
29.6
30.6
26.6
21.6
22.6
33.0
23.0
19.0
21.0
27.0
34.0
29.0
56.0
20.0
34.0
10.0
49.0
11.0
28.0
25.0
37.0
38.0
32.0
18.0
10.4
30.4
33.4
15.4
33.4
26.4
32.4
21.4
22.4
10.4
33.4
22.4 43.4
12.4
48.4
32.4
29.4
33.2
12.2
26.2
27.2
36.2
35.2
40.2
26.2
37.2
11.2
28.2
27.2
51.2
28.1
36.1
42.1
45.1
37.1
20.1
30.1
32.1
32.1
23.1
28.1
11.1
14.1
11.1
29.1
29.1
11.1
27.1
33.1
30.1
12.1
9.9
9.9
8.8
9.9
6.7
9.7
9.3
9.7
8.7
8.3
9.7
9.6
8.0
8.0
9.4
9.4
7.2
9.1
Percentage of YLLs by broad causes, by district, 2011
Broad causesInjury YLLsNCD YLLsHIV and TB YLLsComm_mat_peri_nut YLLs
YLLs sorted in order of the combined proportion of Communicable and Maternal YLLs and YLLs due to HIV and TB.
309
Section A: Burden of disease
Figure 12: Percentage of YLLs by broad causes, by district, 2011
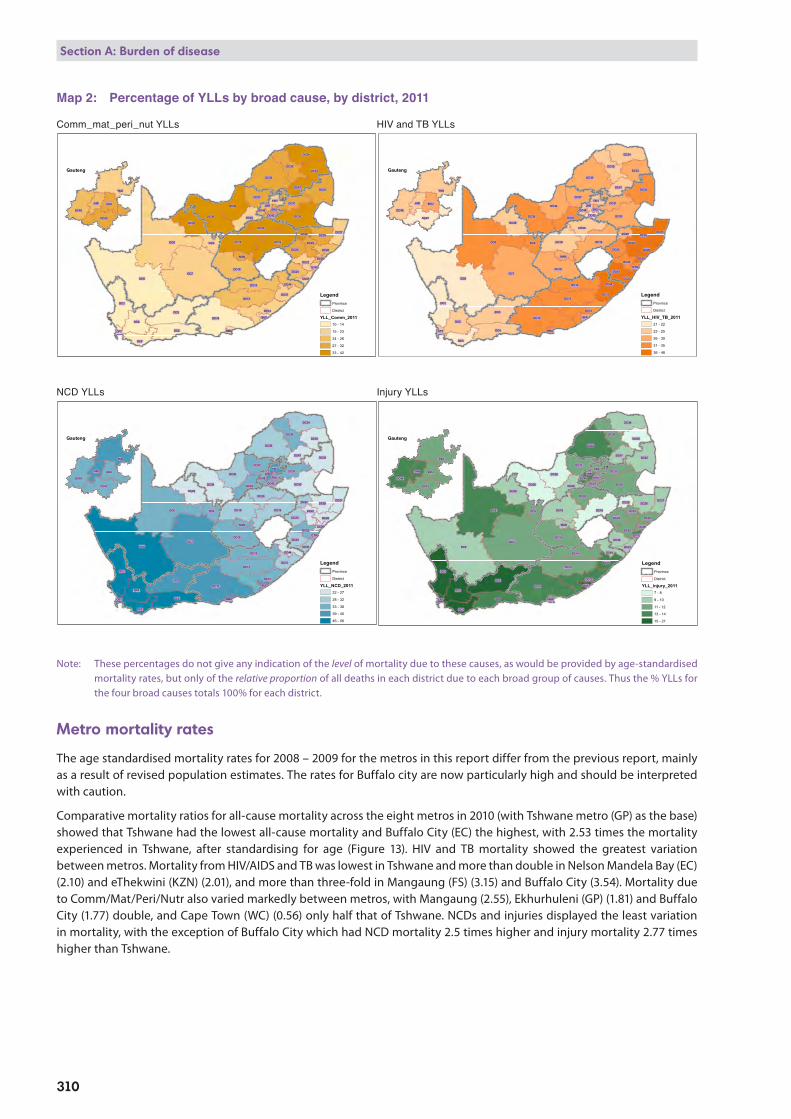
DC6
DC7
DC8
DC10
DC5
DC36
DC39
DC1
DC16
DC13
DC19DC18
DC30
DC4
DC38
DC2
DC32
DC45
DC14
DC34
DC12
DC35
DC20
DC33
DC37
DC31
DC3
DC9
DC26
DC40
DC27
DC47
DC15
DC23
DC43
DC22
DC24
DC28
TSH
MAN
DC25
DC44
DC21
DC42
DC48
DC29
BUF
CPT
ETH
NMA
EKUJHB
TSH
DC42
DC48
EKUJHB
Gauteng
LegendProvince
District
YLL_Comm_201110 - 14
15 - 23
24 - 26
27 - 32
33 - 42
DC6
DC7
DC8
DC10
DC5
DC36
DC39
DC1
DC16
DC13
DC19DC18
DC30
DC4
DC38
DC2
DC32
DC45
DC14
DC34
DC12
DC35
DC20
DC33
DC37
DC31
DC3
DC9
DC26
DC40
DC27
DC47
DC15
DC23
DC43
DC22
DC24
DC28
TSH
MAN
DC25
DC44
DC21
DC42
DC48
DC29
BUF
CPT
ETH
NMA
EKUJHB
TSH
DC42
DC48
EKUJHB
Gauteng
LegendProvince
District
YLL_HIV_TB_201121 - 22
23 - 25
26 - 30
31 - 35
36 - 48
DC6
DC7
DC8
DC10
DC5
DC36
DC39
DC1
DC16
DC13
DC19DC18
DC30
DC4
DC38
DC2
DC32
DC45
DC14
DC34
DC12
DC35
DC20
DC33
DC37
DC31
DC3
DC9
DC26
DC40
DC27
DC47
DC15
DC23
DC43
DC22
DC24
DC28
TSH
MAN
DC25
DC44
DC21
DC42
DC48
DC29
BUF
CPT
ETH
NMA
EKUJHB
TSH
DC42
DC48
EKUJHB
Gauteng
LegendProvince
District
YLL_NCD_201122 - 27
28 - 32
33 - 38
39 - 45
46 - 56
DC6
DC7
DC8
DC10
DC5
DC36
DC39
DC1
DC16
DC13
DC19DC18
DC30
DC4
DC38
DC2
DC32
DC45
DC14
DC34
DC12
DC35
DC20
DC33
DC37
DC31
DC3
DC9
DC26
DC40
DC27
DC47
DC15
DC23
DC43
DC22
DC24
DC28
TSH
MAN
DC25
DC44
DC21
DC42
DC48
DC29
BUF
CPT
ETH
NMA
EKUJHB
TSH
DC42
DC48
EKUJHB
Gauteng
LegendProvince
District
YLL_injury_20117 - 8
9 - 10
11 - 12
13 - 14
15 - 21
310
Section A: Burden of disease
Map 2: Percentage of YLLs by broad cause, by district, 2011
Comm_mat_peri_nut YLLs HIV and TB YLLs
NCD YLLs Injury YLLs
Note: These percentages do not give any indication of the level of mortality due to these causes, as would be provided by age-standardised mortality rates, but only of the relative proportion of all deaths in each district due to each broad group of causes. Thus the % YLLs for the four broad causes totals 100% for each district.
Metro mortality rates
The age standardised mortality rates for 2008 – 2009 for the metros in this report differ from the previous report, mainly as a result of revised population estimates. The rates for Buffalo city are now particularly high and should be interpreted with caution.
Comparative mortality ratios for all-cause mortality across the eight metros in 2010 (with Tshwane metro (GP) as the base) showed that Tshwane had the lowest all-cause mortality and Buffalo City (EC) the highest, with 2.53 times the mortality experienced in Tshwane, after standardising for age (Figure 13). HIV and TB mortality showed the greatest variation between metros. Mortality from HIV/AIDS and TB was lowest in Tshwane and more than double in Nelson Mandela Bay (EC) (2.10) and eThekwini (KZN) (2.01), and more than three-fold in Mangaung (FS) (3.15) and Buffalo City (3.54). Mortality due to Comm/Mat/Peri/Nutr also varied markedly between metros, with Mangaung (2.55), Ekhurhuleni (GP) (1.81) and Buffalo City (1.77) double, and Cape Town (WC) (0.56) only half that of Tshwane. NCDs and injuries displayed the least variation in mortality, with the exception of Buffalo City which had NCD mortality 2.5 times higher and injury mortality 2.77 times higher than Tshwane.
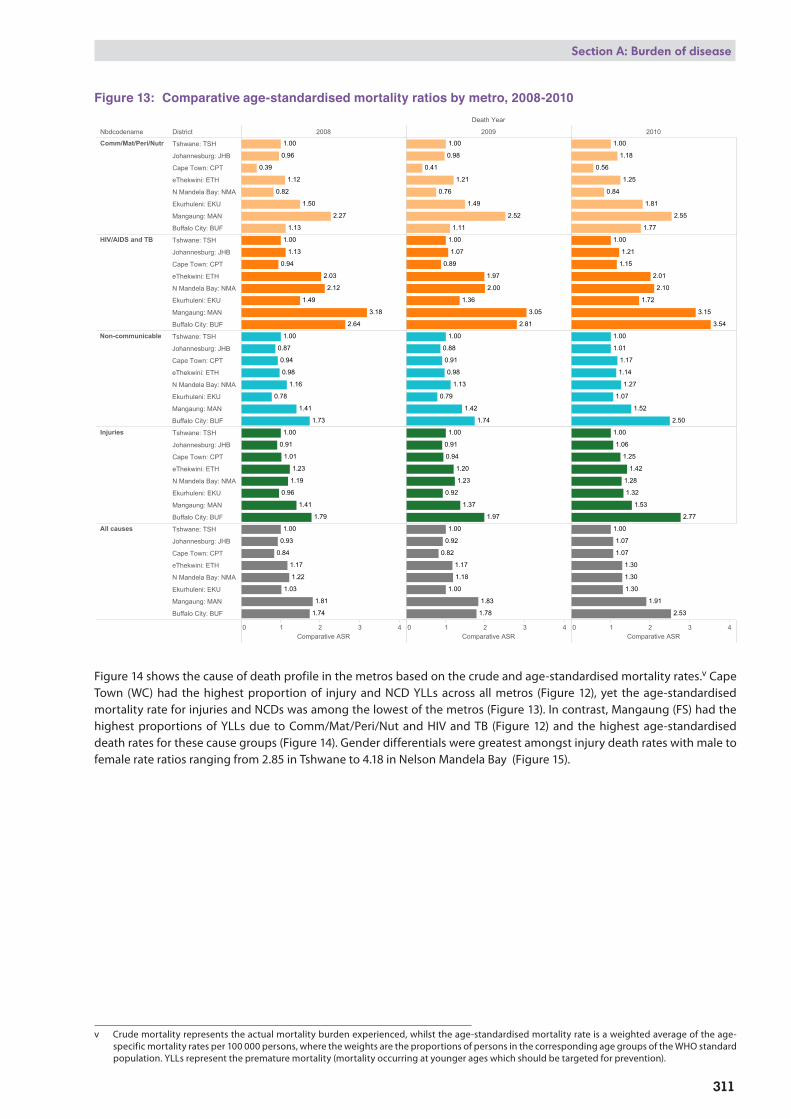
Nbdcodename District
Death Year
2008 2009 2010
0 1 2 3 4Comparative ASR
0 1 2 3 4Comparative ASR
0 1 2 3 4Comparative ASR
Comm/Mat/Peri/Nutr Tshwane: TSH
Johannesburg: JHB
Cape Town: CPT
eThekwini: ETH
N Mandela Bay: NMA
Ekurhuleni: EKU
Mangaung: MAN
Buffalo City: BUF
HIV/AIDS and TB Tshwane: TSH
Johannesburg: JHB
Cape Town: CPT
eThekwini: ETH
N Mandela Bay: NMA
Ekurhuleni: EKU
Mangaung: MAN
Buffalo City: BUF
Non-communicable Tshwane: TSH
Johannesburg: JHB
Cape Town: CPT
eThekwini: ETH
N Mandela Bay: NMA
Ekurhuleni: EKU
Mangaung: MAN
Buffalo City: BUF
Injuries Tshwane: TSH
Johannesburg: JHB
Cape Town: CPT
eThekwini: ETH
N Mandela Bay: NMA
Ekurhuleni: EKU
Mangaung: MAN
Buffalo City: BUF
All causes Tshwane: TSH
Johannesburg: JHB
Cape Town: CPT
eThekwini: ETH
N Mandela Bay: NMA
Ekurhuleni: EKU
Mangaung: MAN
Buffalo City: BUF
0.39
2.27
1.13
0.96
1.00
1.50
1.12
0.82
0.98
1.49
0.76
1.00
2.52
0.41
1.21
1.11
1.25
2.55
1.18
1.77
0.56
1.00
0.84
1.81
1.49
3.18
1.13
2.03
1.00
0.94
2.64
2.12
3.05
0.89
1.07
1.97
1.36
1.00
2.00
2.81
1.15
3.15
1.00
2.10
3.54
1.72
1.21
2.01
0.98
0.78
0.87
1.73
1.16
1.00
0.94
1.41
0.88
0.98
0.79
1.13
1.00
1.74
1.42
0.91 1.17
1.27
1.07
1.00
2.50
1.14
1.52
1.01
1.19
1.79
1.23
0.96
1.00
0.91
1.01
1.41
1.23
1.37
1.97
1.00
1.20
0.94
0.92
0.91
1.25
1.28
1.53
2.77
1.06
1.00
1.42
1.32
0.93
1.17
1.03
1.00
0.84
1.74
1.22
1.81
1.18
1.78
1.17
1.83
1.00
1.00
0.92
0.82
1.07
1.07
2.53
1.00
1.30
1.30
1.30
1.91
Comparative age-standardised mortality ratios by metro
311
Section A: Burden of disease
Figure 13: Comparative age-standardised mortality ratios by metro, 2008-2010
Figure 14 shows the cause of death profile in the metros based on the crude and age-standardised mortality rates.v Cape Town (WC) had the highest proportion of injury and NCD YLLs across all metros (Figure 12), yet the age-standardised mortality rate for injuries and NCDs was among the lowest of the metros (Figure 13). In contrast, Mangaung (FS) had the highest proportions of YLLs due to Comm/Mat/Peri/Nut and HIV and TB (Figure 12) and the highest age-standardised death rates for these cause groups (Figure 14). Gender differentials were greatest amongst injury death rates with male to female rate ratios ranging from 2.85 in Tshwane to 4.18 in Nelson Mandela Bay (Figure 15).
v Crude mortality represents the actual mortality burden experienced, whilst the age-standardised mortality rate is a weighted average of the age-specific mortality rates per 100 000 persons, where the weights are the proportions of persons in the corresponding age groups of the WHO standard population. YLLs represent the premature mortality (mortality occurring at younger ages which should be targeted for prevention).

312
Section A: Burden of disease
Figure 14: Age-standardised and crude mortality rates by metro, 2010
Figure 15: Age-standardised mortality rates by gender, by metro, 2010
The 10 causes with the highest age-standardised mortality rates are shown for each metro in Figure 16. High rates of mortality from TB, lower respiratory infection, HIV and diarrhoea featured in all metros, with extremely high TB mortality rates in Buffalo City (EC) (313.8 per 100 000), Mangaung (FS) (251.8 per 100 000), Nelson Mandela Bay (EC) (169.3 per 100 000) and eThekwini (KZN) (162.3 per 100 000). Cardiovascular diseases and diabetes featured in all metros, with mortality rates for ischaemic heart disease higher than cerebrovascular disease in Cape Town (WC), eThekwini, Johannesburg (GP) and Tshwane (GP), and cerebrovascular was higher in Buffalo City, Mangaung and Nelson Mandela Bay, suggesting that urban populations are at different stages of the health transition. COPD and oesophagus cancer mortality rates were very high in Buffalo City, and lung cancer mortality rates featured in Cape Town.
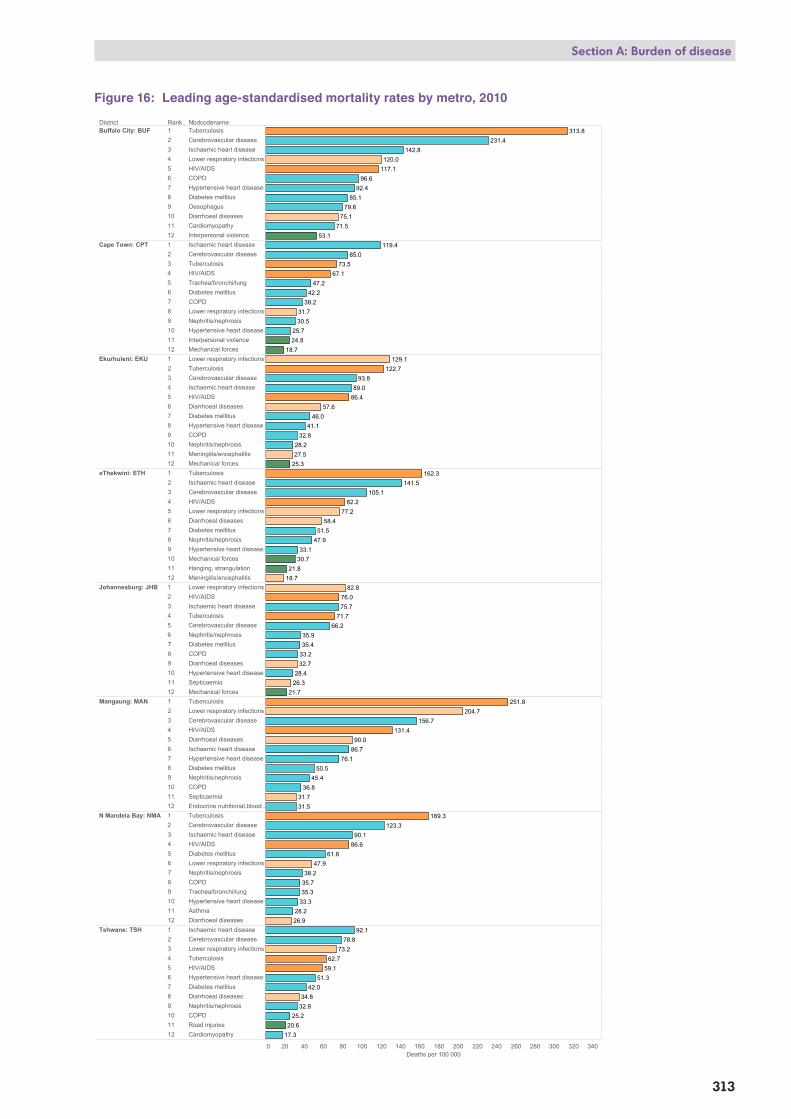
District Rank.. Nbdcodename
0 20 40 60 80 100 120 140 160 180 200 220 240 260 280 300 320 340Deaths per 100 000
Buffalo City: BUF 1 Tuberculosis2 Cerebrovascular disease3 Ischaemic heart disease4 Lower respiratory infections5 HIV/AIDS6 COPD7 Hypertensive heart disease8 Diabetes mellitus9 Oesophagus10 Diarrhoeal diseases11 Cardiomyopathy12 Interpersonal violence
Cape Town: CPT 1 Ischaemic heart disease2 Cerebrovascular disease3 Tuberculosis4 HIV/AIDS5 Trachea/bronchi/lung6 Diabetes mellitus7 COPD8 Lower respiratory infections9 Nephritis/nephrosis10 Hypertensive heart disease11 Interpersonal violence12 Mechanical forces
Ekurhuleni: EKU 1 Lower respiratory infections2 Tuberculosis3 Cerebrovascular disease4 Ischaemic heart disease5 HIV/AIDS6 Diarrhoeal diseases7 Diabetes mellitus8 Hypertensive heart disease9 COPD10 Nephritis/nephrosis11 Meningitis/encephalitis12 Mechanical forces
eThekwini: ETH 1 Tuberculosis2 Ischaemic heart disease3 Cerebrovascular disease4 HIV/AIDS5 Lower respiratory infections6 Diarrhoeal diseases7 Diabetes mellitus8 Nephritis/nephrosis9 Hypertensive heart disease10 Mechanical forces11 Hanging, strangulation12 Meningitis/encephalitis
Johannesburg: JHB 1 Lower respiratory infections2 HIV/AIDS3 Ischaemic heart disease4 Tuberculosis5 Cerebrovascular disease6 Nephritis/nephrosis7 Diabetes mellitus8 COPD9 Diarrhoeal diseases10 Hypertensive heart disease11 Septicaemia12 Mechanical forces
Mangaung: MAN 1 Tuberculosis2 Lower respiratory infections3 Cerebrovascular disease4 HIV/AIDS5 Diarrhoeal diseases6 Ischaemic heart disease7 Hypertensive heart disease8 Diabetes mellitus9 Nephritis/nephrosis10 COPD11 Septicaemia12 Endocrine nutritional,blood..
N Mandela Bay: NMA 1 Tuberculosis2 Cerebrovascular disease3 Ischaemic heart disease4 HIV/AIDS5 Diabetes mellitus6 Lower respiratory infections7 Nephritis/nephrosis8 COPD9 Trachea/bronchi/lung10 Hypertensive heart disease11 Asthma12 Diarrhoeal diseases
Tshwane: TSH 1 Ischaemic heart disease2 Cerebrovascular disease3 Lower respiratory infections4 Tuberculosis5 HIV/AIDS6 Hypertensive heart disease7 Diabetes mellitus8 Diarrhoeal diseases9 Nephritis/nephrosis10 COPD11 Road injuries12 Cardiomyopathy
313.8231.4
142.8120.0
117.196.6
92.485.1
79.675.1
71.553.1
119.485.0
73.567.1
47.242.2
38.231.730.5
25.724.8
18.7129.1
122.793.8
89.086.4
57.646.0
41.132.8
28.227.5
25.3162.3
141.5105.1
82.277.2
58.451.5
47.933.1
30.721.8
18.782.8
76.075.7
71.766.2
35.935.4
33.232.7
28.426.3
21.7251.8
204.7156.7
131.490.0
86.776.1
50.545.4
36.831.731.5
169.3123.3
90.186.6
61.847.9
38.235.735.3
33.328.226.9
92.178.8
73.262.7
59.151.3
42.034.8
32.825.2
20.617.3
Leading age-standardised mortality rates by metro, 2010
313
Section A: Burden of disease
Figure 16: Leading age-standardised mortality rates by metro, 2010
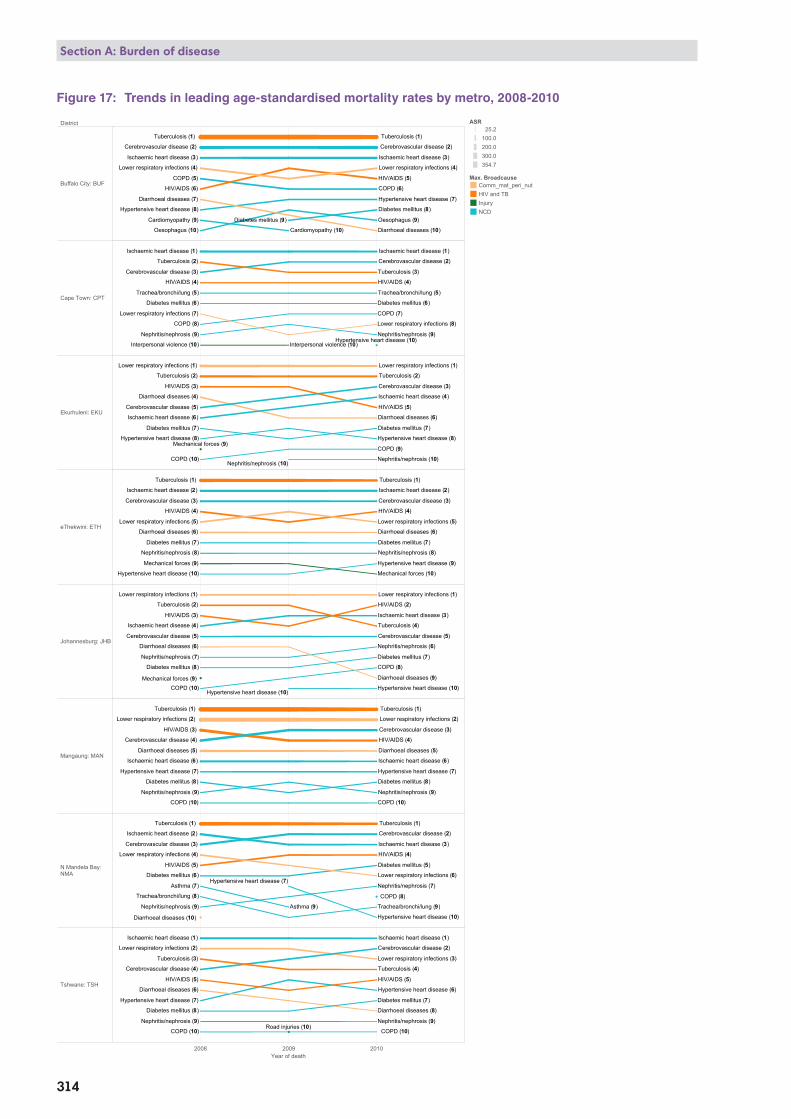
District
2008 2009 2010Year of death
Buffalo City: BUF
Cape Town: CPT
Ekurhuleni: EKU
eThekwini: ETH
Johannesburg: JHB
Mangaung: MAN
N Mandela Bay:NMA
Tshwane: TSH
Oesophagus (10)
Oesophagus (9)Cardiomyopathy (9)
Cardiomyopathy (10)
COPD (5)
COPD (6)
Hypertensive heart disease (8)
Hypertensive heart disease (7)Diarrhoeal diseases (7)
Diarrhoeal diseases (10)
Diabetes mellitus (9)
Diabetes mellitus (8)
HIV/AIDS (6)
HIV/AIDS (5)
Lower respiratory infections (4) Lower respiratory infections (4)
Ischaemic heart disease (3) Ischaemic heart disease (3)
Cerebrovascular disease (2) Cerebrovascular disease (2)
Tuberculosis (1) Tuberculosis (1)
Interpersonal violence (10) Interpersonal violence (10)
Trachea/bronchi/lung (5) Trachea/bronchi/lung (5)
Nephritis/nephrosis (9) Nephritis/nephrosis (9)
COPD (8)
COPD (7)
Hypertensive heart disease (10)
Diabetes mellitus (6) Diabetes mellitus (6)
HIV/AIDS (4) HIV/AIDS (4)
Lower respiratory infections (7)
Lower respiratory infections (8)
Ischaemic heart disease (1) Ischaemic heart disease (1)
Cerebrovascular disease (3)
Cerebrovascular disease (2)Tuberculosis (2)
Tuberculosis (3)
Mechanical forces (9)
Nephritis/nephrosis (10)Nephritis/nephrosis (10)COPD (10)
COPD (9)
Hypertensive heart disease (8) Hypertensive heart disease (8)
Diarrhoeal diseases (4)
Diarrhoeal diseases (6)
Diabetes mellitus (7) Diabetes mellitus (7)
HIV/AIDS (3)
HIV/AIDS (5)
Lower respiratory infections (1) Lower respiratory infections (1)
Ischaemic heart disease (6)
Ischaemic heart disease (4)
Cerebrovascular disease (5)
Cerebrovascular disease (3)
Tuberculosis (2) Tuberculosis (2)
Mechanical forces (9)
Mechanical forces (10)
Nephritis/nephrosis (8) Nephritis/nephrosis (8)
Hypertensive heart disease (10)
Hypertensive heart disease (9)
Diarrhoeal diseases (6) Diarrhoeal diseases (6)
Diabetes mellitus (7) Diabetes mellitus (7)
HIV/AIDS (4) HIV/AIDS (4)
Lower respiratory infections (5) Lower respiratory infections (5)
Ischaemic heart disease (2) Ischaemic heart disease (2)
Cerebrovascular disease (3) Cerebrovascular disease (3)
Tuberculosis (1) Tuberculosis (1)
Mechanical forces (9)
Nephritis/nephrosis (7)
Nephritis/nephrosis (6)
COPD (10)
COPD (8)
Hypertensive heart disease (10)Hypertensive heart disease (10)
Diarrhoeal diseases (6)
Diarrhoeal diseases (9)
Diabetes mellitus (8)
Diabetes mellitus (7)
HIV/AIDS (3)
HIV/AIDS (2)
Lower respiratory infections (1) Lower respiratory infections (1)
Ischaemic heart disease (4)
Ischaemic heart disease (3)
Cerebrovascular disease (5) Cerebrovascular disease (5)
Tuberculosis (2)
Tuberculosis (4)
Nephritis/nephrosis (9) Nephritis/nephrosis (9)
COPD (10) COPD (10)
Hypertensive heart disease (7) Hypertensive heart disease (7)
Diarrhoeal diseases (5) Diarrhoeal diseases (5)
Diabetes mellitus (8) Diabetes mellitus (8)
HIV/AIDS (3)
HIV/AIDS (4)
Lower respiratory infections (2) Lower respiratory infections (2)
Ischaemic heart disease (6) Ischaemic heart disease (6)
Cerebrovascular disease (4)
Cerebrovascular disease (3)
Tuberculosis (1) Tuberculosis (1)
COPD (8)
Diarrhoeal diseases (10)
Asthma (7)
Asthma (9)
Trachea/bronchi/lung (8)
Trachea/bronchi/lung (9)Nephritis/nephrosis (9)
Nephritis/nephrosis (7)Hypertensive heart disease (7)
Hypertensive heart disease (10)
Diabetes mellitus (6)
Diabetes mellitus (5)HIV/AIDS (5)
HIV/AIDS (4)Lower respiratory infections (4)
Lower respiratory infections (6)
Ischaemic heart disease (2)
Ischaemic heart disease (3)Cerebrovascular disease (3)
Cerebrovascular disease (2)
Tuberculosis (1) Tuberculosis (1)
COPD (10)Road injuries (10)
Nephritis/nephrosis (9) Nephritis/nephrosis (9)
COPD (10)
Hypertensive heart disease (7)
Hypertensive heart disease (6)Diarrhoeal diseases (6)
Diarrhoeal diseases (8)Diabetes mellitus (8)
Diabetes mellitus (7)
HIV/AIDS (5) HIV/AIDS (5)
Lower respiratory infections (2)
Lower respiratory infections (3)
Ischaemic heart disease (1) Ischaemic heart disease (1)
Cerebrovascular disease (4)
Cerebrovascular disease (2)
Tuberculosis (3)
Tuberculosis (4)
Trends in leading age-standardised mortality rates (rank) by metro
Max. BroadcauseComm_mat_peri_nutHIV and TBInjuryNCD
ASR25.2
100.0200.0300.0354.7
314
Section A: Burden of disease
Figure 17: Trends in leading age-standardised mortality rates by metro, 2008-2010

315
Section A: Burden of disease
Mortality rates for Buffalo City (EC) and Mangaung (FS) were very high, with mortality rates for TB, lower respiratory infection, diarrhoea and HIV/AIDS being much higher than in any of the other metros, suggesting that HIV/AIDS-related deaths were a major cause of the high mortality. However, death rates from cardiovascular causes were also higher than in other metros, suggesting that health services were sub-optimal in these metros, or that these metros were heavily burdened as a referral centre for severely ill patients from the surrounding areas.
Trends in age-standardised mortality rates by metro
All cause age-standardised mortality rates declined in all metros between 2008 and 2010, with the exception of Buffalo City (EC) where a slight increase in the all-cause age-standardised mortality rate was noted (data not shown). This was largely due to an increase in injury and NCD age-standardised mortality rates in Buffalo City over this period.
In Buffalo City, diarrhoeal disease dropped in the ranking from seventh to tenth, whilst diabetes and hypertensive heart disease both moved up in the ranking (Figure 17). In Cape Town (WC), cerebrovascular disease, hypertensive heart disease and COPD moved up in the ranking, whilst tuberculosis and lower respiratory disease moved down. In Ekurhuleni (GP), HIV/AIDS and diarrhoea moved down in the ranking and cerebrovascular disease and ischaemic heart disease moved up. The ranking remained essentially the same in eThekwini (KZN). In Johannesburg (GP), HIV/AIDS, ischaemic heart disease, diabetes mellitus and COPD moved up in the ranking, whilst tuberculosis and diarrhoea moved down. In Mangaung (FS), cerebrovascular disease and diabetes mellitus moved up in the ranking and HIV/AIDS moved down. In Nelson Mandela Bay (EC), cerebrovascular disease moved above ischaemic heart disease, and HIV/AIDS and diabetes moved up whilst lower respiratory infection moved down. COPD and hypertensive heart disease moved up into the top 10. In Tshwane (GP), cerebrovascular disease, hypertensive heart disease and diabetes mellitus moved up, whilst tuberculosis and lower respiratory infection moved down.
Conclusion
Mortality rates in South Africa have declined between 2008 and 2011 mainly due to a decline in HIV related mortality. Despite this, HIV/AIDS and associated conditions still stand out as being a leading cause of YLLS together with cerebrovascular diseases, ischaemic heart disease, diabetes mellitus, road injuries, interpersonal violence and hypertensive heart disease. The high mortality rates observed in Buffalo City may indicate problems with the population estimates. Careful review of district level population estimates is needed.
A reduction in the percentage of deaths coded to ill-defined or garbage codes was noted in the Western Cape. This suggests that the WC local mortality surveillance system, which included a provincial training initiative in medical certification of cause of death as well as increased utilisation of mortality information for health policy making, may have had a positive impact on the quality of medical certification. However, until the completeness of death registration is consistently high across all districts and the quality of medical certification has improved, the district level mortality profiles need to be interpreted cautiously. In particular, the lack of reliability of the injury profile and the misclassification of HIV and AIDS need to be taken into consideration. Efforts to utilise mortality profile information need to be accompanied by initiatives to improve medical certification of the cause of death.
Related Documents