BANK FOR INTERNATIONAL SETTLEMENTS ELEVENTH ANNUAL REPORT 1st APRIL 1940 — 31st MARCH 1941 BASLE . 9th June 1941

Welcome message from author
This document is posted to help you gain knowledge. Please leave a comment to let me know what you think about it! Share it to your friends and learn new things together.
Transcript
BANK FORINTERNATIONAL SETTLEMENTS
ELEVENTH ANNUAL REPORT
1st APRIL 1940 — 31st MARCH 1941
BASLE .
9th June 1941
TABLE OF CONTENTSPage
I. Introduction 5
II . Exchange Rates, Foreign Trade and Price Movements 26
III. Production and Movements of Gold . 89
IV. International Capital Movements . 98
V. Government Finance, Money and Capital Markets and the Stock Exchanges . . 111
VI. Central Banking Developments 176
VII. Current Activities of the Bank:
(1) Operations of the Banking Department 184
(2) Trustee and agency functions of the Bank . 189
(3) Net profits and distribution 189
(4) Changes in the Board of Directors 190
VIII. Conclusion 191
ANNEXES
I. Balance sheet as at March 31, 1941.
II. Profit and Loss Account and Appropriation Account for the financial year ended
March 31, 1941.
ELEVENTH ANNUAL REPORTTO THE ANNUAL GENERAL MEETING OF THE
BANK, FOR INTERNATIONAL SETTLEMENTS
Basle, 9th June 1941.
Gentlemen,
I have the honour to submit to you the Annual Report of the Bank forInternational Settlements for the eleventh financial year, beginning 1st April1940 and ending 31st March 1941. The results of the year's business oper-ations are set out in detail in chapter VII. Net profits, after provision forcontingencies, amount to 5,293,909.12 Swiss gold francs. After the allocation tothe Legal Reserve that is required by Article 53 of the Statutes, to an amountequal to 5 per cent, of the net profits, i. e. 264,695.46 Swiss gold francs,there remain available for the payment of a dividend 5,029,213.66 Swissgold francs, corresponding to about 4 per cent, of the paid-up capital. TheSpecial Reserve Fund has been drawn upon to the extent of 2,470,786.34 Swissgold francs in order to permit the distribution of an annual dividend of6 per cent. The balance-sheet total has risen from 469.9 million Swiss goldfrancs to 495.8 million Swiss gold francs on 31st March 1941, the rise beingdue to higher deposits from central banks.
The Bank for International Settlements has been granted all reasonableopportunities for the conduct of its business, which has thus continuednotwithstanding the difficulties of the international situation. The Bank hasadhered to the principles of scrupulous neutrality which it laid down foritself in the autumn of 1939, confining its activities strictly to transactionswhereby no question can possibly arise of conferring economic or financialadvantages on any belligerent nation to the detriment of any other.
In the period up to 31st March 1940, which was reviewed in the lastAnnual Report of the Bank, actual warfare in Europe had been limited tocertain relatively restricted areas and at the end of the period 50 per cent,of the population of Europe (excluding the U. S. S. R.) belonged to neutralor non-belligerent countries. Trade was still carried on in a substantial volumebetween most countries in Europe and overseas markets, and over a largearea the economic and financial life although increasingly coloured by thestate of war did not radically differ from the conditions which had obtainedbefore the autumn of 1939.
— 6 —
Developments in the spring and summer of 1940 and the hardening ofthe struggle in the winter extended the area of the conflict, so that at theend of March 1941 the proportion of European population which had not beendirectly involved in the war was less than 15 per cent, of the total. Actualdestruction of life and property had not been on an extensive scale inrelation to total population and wealth" but the disruption to which thepeacetime economic organisation was exposed, not least through theincisive changes in the customary channels of trade, created a seriesòf new and difficult problems and, in the areas most exposed, profoundlyaffected the conditions of daily life. With few exceptions the countries on theContinent of Europe have had their commercial relations with overseas marketsreduced to a minimum and as a result this continent has been compressed intoan economic group with a population of over 300 million people dependentin the main on its own resources.
For the United Kingdom, which for food alone is dependent to the extentof about three-quarters of its requirements on foreign sources, the cutting-offof supplies from Europe has increased the importance of her Atlantic trafficwith other continents and necessitated a concentration on the imports of themost vital foodstuffs and materials. The great reduction in the shipments toEuropean countries has been felt keenly in Latin America where surplusstocks have accumulated and the consequent reduction in the income fromabroad has led to exchange difficulties, which, however, have been easedto a considerable extent by loans obtained principally from governmentagencies in the United States and, in the case of the Argentine, Brazil andMexico, also by the inflow of refugee capital and funds for investment. Inthe United States rapid increases in spending for armaments have raisedthe level of domestic production to an all-time record and increased sales tothe British Empire and Latin America have, as far as industry is concerned,compensated for the loss of other foreign markets, while surplus agriculturalproducts have been laid up in stocks through government purchases and thegranting of loans on easy terms. As regards the Far East, Japanese exportsto countries of the yen bloc have expanded so rapidly that in 1940 theysurpassed the country's other exports and gave rise to the imposition ofgovernment control to ensure a more balanced distribution of the exporttrade in accordance with the need of foreign exchange. In almost everycorner of the world the various countries have more and more been thrownback upon their own resources, which they have been compelled to exploitin the fullest possible measure, leading to an extreme autarky beyond thedesires of any government. That in this, respect the present state of affairsis largely regarded as a temporary development to be reversed as soon aspeace returns and commercial relations can be resumed may be seen fromofficial declarations in practically all countries, however much opinions maydiffer as to the most suitable means of attaining a durable trade recovery.
If it is not possible for trie time being to speak of "world economy",it follows that a review of actual conditions in the year that has passed mustbe concerned mainly with the particular conditions within separate groups of
—- 7 —
countries. There are, however, many features in common in the various groupsand some of the most pressing economic and financial problems of the day,e. g., the meeting of heavy budget deficits, reveal a great degree of similaritythroughout the world, as also do the solutions adopted, there being manypractical arrangements which by force of circumstances impose themselvesirrespective of enmities or ideologies.
Besides the severance of commercial relations through the blockade andcounter-blockade the increase in armament expenditure, first and fore-most in the belligerent but also in other countries, is the outstandingfact which dominates commercial and financial developments. This increaserepresents the budgetary expression of a great diversion of national efforttowards armaments — through the mobilisation of men for active service,the manufacture of arms and ammunition, transport of troops and material,etc. The proportion of public expenditure (central and local) to national incomealready exceeds that of the last two years of the 1914-18 war. On accountof changes which have taken place in prices and earnings since the summerof 1939 it is more than ever difficult to calculate the magnitude of nationalincomes. But there seems to be little doubt that in Germany, Italy and theUnited Kingdom total public expenditure in 1941 will amount to 70 per cent,or more of the net national income*; and even in some of the neutralcountries, as, for instance, Sweden, public expenditure takes as much as40 per cent. The state has become the main customer of industry and tradeand the main — if not the exclusive — borrower on the money and capitalmarkets. This preponderance of the state must in many ways affect thecharacter of the economic and financial measures, for the state does not"react" in the same way to changes in interest rates, price alterations,etc. as the mass of private businesses and individuals may ordinarily beexpected to do. There remains, however, in all economies a certain "freesector", the reactions of which must be taken into account to a degreethat depends upon its importance in each case.
The concentration of so much of the national effort upon armamentsraises two closely related problems: how to put at the disposal of the state,with the least possible disturbance to the monetary system, the financialresources required to meet the increased expenditure, and how to ensurein the most efficient manner the adjustments of production and foreign tradenecessary to obtain a maximum of war effort, while still providing sufficientgoods for general consumption and other indispensable needs. Financiallythe problem is one of taxation and borrowing, and economically oneof allotting to their right purposes the men and materials available from
The high percentages given in the text represent the ratio between total public expenditure and net nationalincome. But other resources than those which form part of the net national income are drawn upon: inter-nally, amounts are released from embodiment in fixed and working capital and, externally, resources maybe made available from sales of gold, foreign loans, mobilisation of foreign investments, contributions fromother countries for occupation costs, etc. That public expenditure amounts to more than 70 per cent, of thenational income does not mean that less than 30 per cent, remains for private consumption. In the UnitedKingdom it has been calculated that in the last quarter of 1940 total expenditure of central and local govern-ments constituted 67 per cent, and consumption 63 per cent., together 130 per cent, of the net nationalincome. Not less than 30 per cent, was thus covered by "disinvestment", probably mainly the employmentof dollar resources. -
- 8 —
domestic and foreign sources. The main objective for a belligerent country isthat of gaining in strength to win the war, while remembering that main-tenance of economic and financial order is an important element in with-standing the emergency strain. It is noticeable that memories — whethersystematically analysed or not — of the last war and post-war period playa considerable rôle in framing present policy and in determining the attitudeof the public towards many current developments. Anxiety is felt lest thereshould again be a steep rise in prices either degenerating into a wild inflation,as was the experience of not a few countries in Europe after the last war,or followed by a devastating deflation with heavy business losses and wide-spread unemployment not less dangerous from a social point of view. Moreforesight should now be exercised to avoid a repetition of similar calamities.It is this attitude of mind which at least partly explains the imposition, inso many countries, of heavy taxation, control of prices and of costs, rationingof essential commodities and in general the more speedy establishment of anall-round war economy. While this is the predominant note it is, however,necessary to mention that among certain heavily indebted circles — especiallyfarming communities — there is found, if not a direct desire for, at leasta certain willingness to acquiesce in, an inflationary movement, which wouldraise the prices of their products and thus help to alleviate the burden ofexisting debts, in some cases a remainder of speculative excesses duringand immediately after the last war.
As to the f inancing of the increased state expenditure thereis — with the exception perhaps of certain inflation-minded groups — generalagreement on the desirability of meeting as much as possible of the expen-diture by taxation, the main reasons being that this method of financing involvesless danger of inflation and will make it easier to grapple with the difficultpost-war problems of heavy dead-weight debts. No country has, however,been able or willing to impose sufficient taxation to meet more than a partof the rapidly mounting outlay of the present emergency period. Withoutminimising the importance of political and psychological opposition to highnew taxes and the consequent temptation of those concerned to follow theline of least resistance, it should be pointed out that in a period of financialstrain the state must tap all sources of obtainable means and that genuinesavings as well as the amounts currently released from embodiment in fixedcapital (building, equipment, etc.) or in working capital (goods in processor in store) can best be absorbed by way of borrowing. As a matter of fact,of the two countries which have most effectively increased their taxation —Germany and the United Kingdom — the former was able to meet just over,and the latter somewhat under, 40 per cent, of its total military and otherexpenditure by current revenue, relying for the remainder upon the proceedsof long and short-term borrowing and the employment of foreign resources.According to the latest available figures (which can at best be onlyapproximately correct) the yield of central and local taxation in Germanycorresponds to 35 per cent, of the net national income; in the UnitedKingdom 30 per cent.; in the United States and Sweden. 22 per cent.;
g
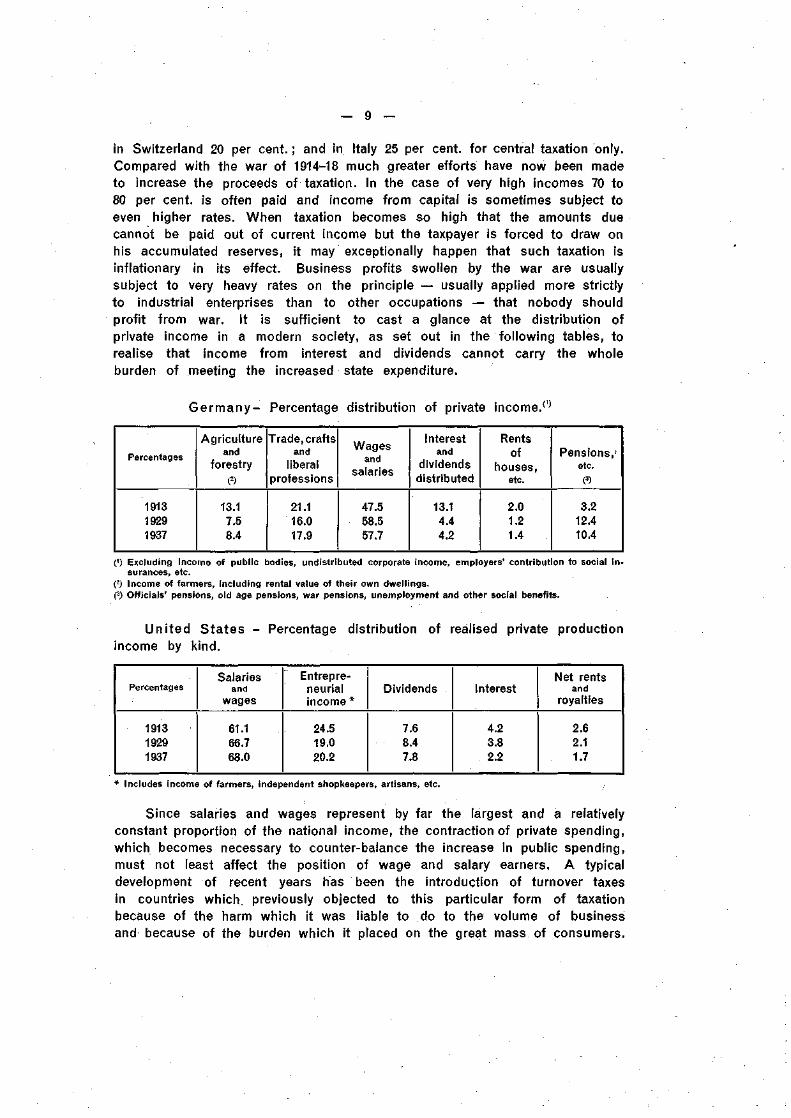
in Switzerland 20 per cent. ; and in Italy 25 per cent, for central taxation only.Compared with the war of 1914-18 much greater efforts have now been madeto increase the proceeds of taxation. In the case of very high incomes 70 to80 per cent, is often paid and income from capital is sometimes subject toeven higher rates. When taxation becomes so high that the amounts duecannot be paid out of current income but the taxpayer is forced to draw onhis accumulated reserves, it may exceptionally happen that such taxation isinflationary in its effect. Business profits swollen by the war are usuallysubject to very heavy rates on the principle — usually applied more strictlyto industrial enterprises than to other occupations — that nobody shouldprofit from war. It is sufficient to cast a glance at the distribution ofprivate income in a modern society, as set out in the following tables, torealise that income from interest and dividends cannot carry the wholeburden of meeting the increased state expenditure.
Germany- Percentage distribution of private income/1'
Percentages
191319291937
Agricultureand
forestry(2)
13.17.58.4
Trade, craftsand
liberalprofessions
21.116.017.9
Wagesand
salaries
47.558.557.7
Interestand
dividendsdistributed
13.14.44.2
Rentsof
houses,etc.
2.01.21.4
Pensions,1
etc.
(3)
3.212.410.4
0) Excluding income of public bodies, undistr ibuted corporate income, employers' contr ibut ion to social i n -surances, etc.
(2) Income of farmers, inc luding rental value of their own dwel l ings.(3) Off icials' pensions, old age pensions, war pensions, unemployment and other social benefits.
United States - Percentage distribution of realised private productionincome by kind.
Percentages
191319291937
Salariesand
wages
61.166.768.0
Entrepre-neurialincome *
24.519.020.2
Dividends
7.68.47.8
Interest
4.23.82.2
Net rentsand
royalties
2.62.11.7
* Includes income of farmers, independent shopkeepers, artisans, etc.
Since salaries and wages represent by far the largest and a relativelyconstant proportion of the national income, the contraction of private spending,which becomes necessary to counter-balance the increase in public spending,must not least affect the position of wage and salary earners. A typicaldevelopment of recent years has been the introduction of turnover taxesin countries which, previously objected to this particular form of taxationbecause of the harm which it was liable to do to the volume of businessand because of the burden which it placed on the great mass of consumers.
— 10 —
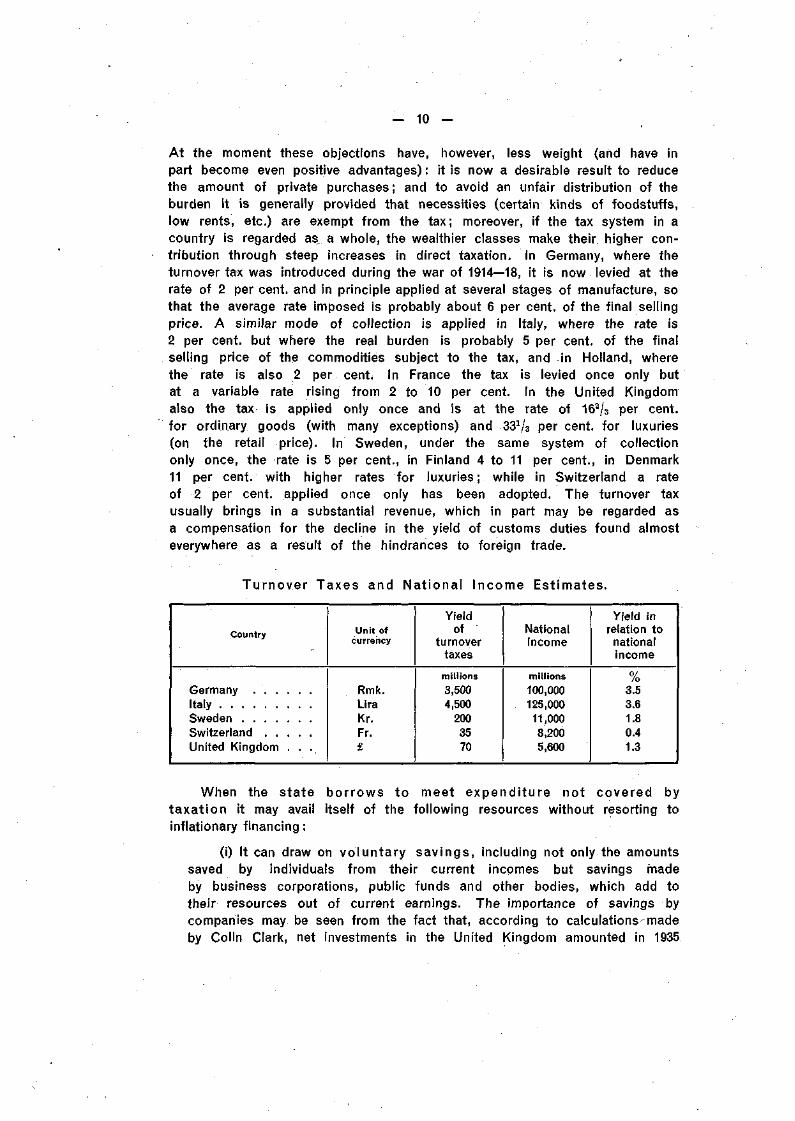
At the moment these objections have, however, less weight (and have inpart become even positive advantages) : it is now a desirable result to reducethe amount of private purchases ; and to avoid an unfair distribution of theburden it is generally provided that necessities (certain kinds of foodstuffs,low rents, etc.) are exempt from the tax; moreover, if the tax system in acountry is regarded as a whole, the wealthier classes make their higher con-tribution through steep increases in direct taxation. In Germany, where theturnover tax was introduced during the war of 1914—18, it is now levied at therate of 2 per cent, and in principle applied at several stages of manufacture, sothat the average rate imposed is probably about 6 per cent, of the final sellingprice. A similar mode of collection is applied in Italy, where the rate is2 per cent, but where the real burden is probably 5 per cent, of the finalselling price of the commodities subject to the tax, and in Holland, wherethe rate is also 2 per cent. In France the tax is levied once only butat a variable rate rising from 2 to 10 per cent. In the United Kingdomalso the tax is applied only once and is at the rate of 162/3 per cent,for ordinary goods (with many exceptions) and 33V3 per cent, for luxuries(on the retail price). In Sweden, under the same system of collectiononly once, the rate is 5 per cent., in Finland 4 to 11 per cent., in Denmark11 per cent, with higher rates for luxuries; while in Switzerland a rateof 2 per cent, applied once only has been adopted. The turnover taxusually brings in a substantial revenue, which in part may be regarded asa compensation for the decline in the yield of customs duties found almosteverywhere as a result of the hindrances to foreign trade.
Turnover Taxes and Nat ional Income Estimates.
Country
GermanyItalySwedenSwitzerlandUnited Kingdom . . .
Unit ofcurrency
Rmk.LiraKr.Fr.£
Yieldof
turnovertaxes
millions3,5004,500
2003570
Nationalincome
millions100,000125,00011,0008,2005,600
Yield inrelation to
nationalincome
0/
/o3.53.61.80.41.3
When the state borrows to meet expenditure not covered bytaxat ion it may avail itself of the following resources without resorting toinflationary financing :
(i) It can draw on voluntary savings, including not only the amountssaved by individuals from their current incomes but savings madeby business corporations, public funds and other bodies, which add totheir resources out of current earnings. The importance of savings bycompanies may be seen from the fact that, according to calculations-madeby Colin Clark, net investments in the United Kingdom amounted in 1935
— 11 —
to £305 million, of which nearly three-quarters was represented by undistri-buted profits of companies. The rate of savings varies considerably indifferent countries — from a high level of 15 to 18 per cent, of the nationalincome in Switzerland (in a normal year) to probably 7 per cent, in Hungaryand an even smaller percentage in some Latin American countries. It is,of course, in the general interest that voluntary savings should be increased
_jn times__of waL._emergencies, jind rationing of commodities, limitation ofdividends, as well as appeals to patriotism and other forms of propagandaare used to that end. The element of social and other compulsions whichthese measures involve has generally contributed to increase the volume ofsavings far above peacetime levels. In the English budget for the financialyear 1941-42 a system of "forced savings" was introduced: the so-calledpersonal and earned income "allowances" (deducted from income for thecalculation of income tax) were reduced but the extra tax payable as aresult of the reduction will be credited to the taxpayer, after the war, inthe Post Office Savings Bank.
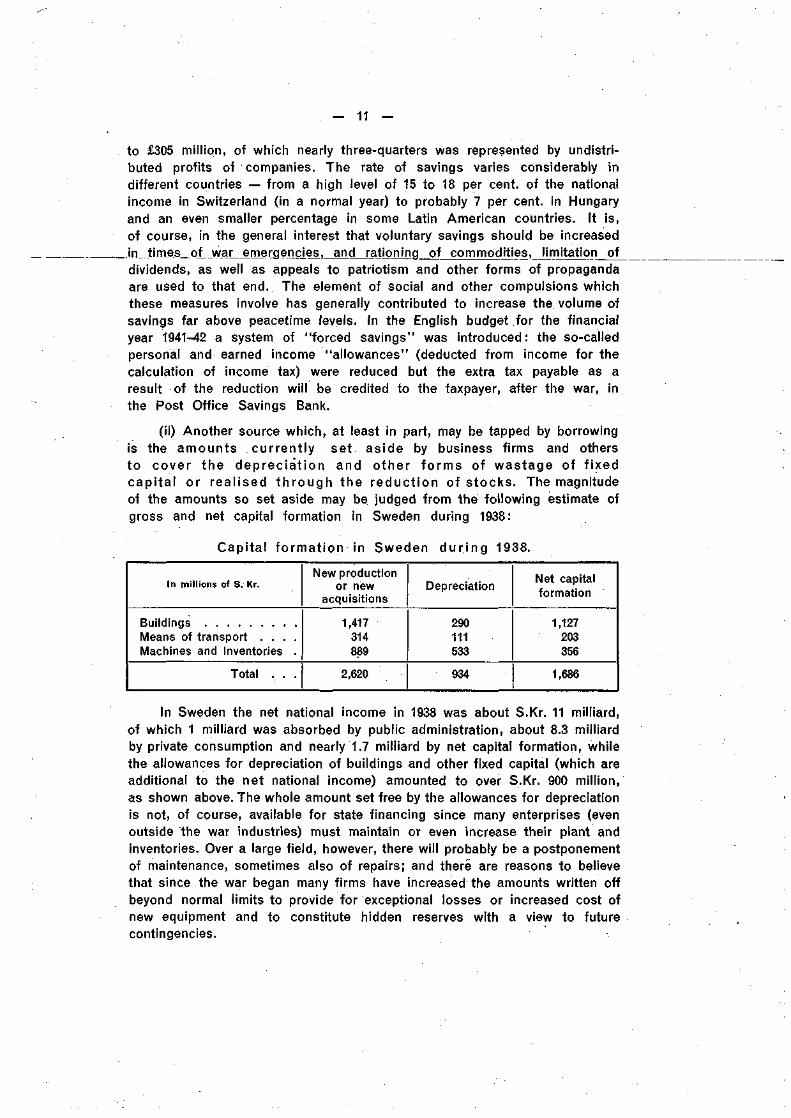
(ii) Another source which, at least in part, may be tapped by borrowingis the amounts currently set aside by business firms and othersto cover the depreciat ion and other forms of wastage of f ixedcapi ta l or real ised th rough the reduct ion of stocks. The magnitudeof the amounts so set aside may be judged from the following estimate ofgross and net capital formation in Sweden during 1938:
Capital format ion in Sweden d u r i n g 1938.
In millions of S. Kr.
BuildingsMeans of transport . . . .Machines and inventories .
Total . . .
New productionor new
acquisitions
1,417314889
2,620
Depreciation
290111533
934
Net capitalformation
1,127203356
1,686
In Sweden the net national income in 1938 was about S.Kr. 11 milliard,of which 1 milliard was absorbed by public administration, about 8.3 milliardby private consumption and nearly 1.7 milliard by net capital formation, whilethe allowances for depreciation of buildings and other fixed capital (which areadditional to the net national income) amounted to over S.Kr. 900 million,as shown above. The whole amount set free by the allowances for depreciationis not, of course, available for state financing since many enterprises (evenoutside the war industries) must maintain or even increase their plant andinventories. Over a large field, however, there will probably be a postponementof maintenance, sometimes also of repairs; and there are reasons to believethat since the war began many firms have increased the amounts written offbeyond normal limits to provide for exceptional losses or increased cost ofnew equipment and to constitute hidden reserves with a view to futurecontingencies.
— 12 —
With regard to working capital, it is usually difficult to indicatestatistically variations in commodity stocks; but it is common knowledgethat in a number of European countries such stocks have been reducedsince the war began largely because they could not be replenished; in thisway also financial resources are made available for investment in govern-ment securities. When the war is over the owners of funds previouslyreleased from fixed and working capital will as a rule seek to restoretheir business position. At the present time they may therefore wish toinvest the amounts set free in assets with a high degree of liquidity andthe governments naturally provide suitable forms of investment to meetthese wishes.
(iii) A third source for government financing is provided by foreignassets whether already available as monetary reserves or obtainedthrough the mobilisation of domestic holdings of foreign securities anddirect foreign investments or through the conclusion of foreign credits.In a number of countries the governments have borrowed directly fromthe central bank to obtain the gold or foreign exchange needed to payfor purchases abroad; such borrowing has.not been inflationary in itseffect since it has not increased the volume of purchasing power on thedomestic market.
Apart from foreign credits and other forms of external assistance thegovernments are limited in their employment of foreign resources by themagnitude of the gold and foreign exchange reserves and the domestic hold-ings of saleable foreign investments which may be acquired. As regardsborrowing on the home market no such strict limits apply. It is sometimessaid that in wartime no government is hampered by difficulties of finance;and this may be taken to mean that the governments can always turn to theirown banking systems for the necessary.advances to meet current expenditure.Indeed, the "creation of credit" by central and commercial banks is oftensaid to constitute a special source of finance additional to voluntary savingsand releases from fixed and working capital. Since government borrow-ing in most belligerent and other countries is made largely from commercialbanks it is of importance to examine at least briefly the nature of this sourceof financing.
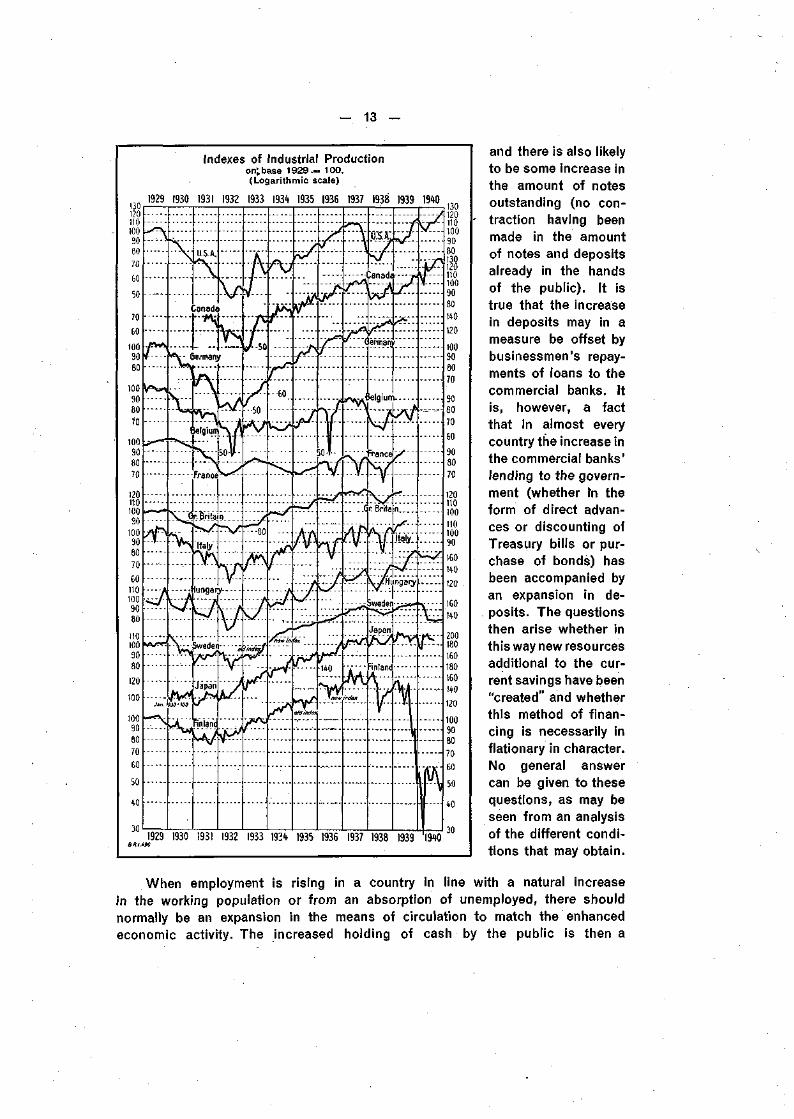
If the government borrows funds it needs by loans taken up by privateinvestors and institutions such as savings banks and insurance companies,those who subscribe to the loans put purchasing power in the form ofnotes or bank deposits at the disposal of the government. As the govern-ment spends the amounts borrowed the notes and deposits are againmade available to the public, but in the end there is no increase1 in thenote circulation or in the volume of deposits as a result of the govern-ment borrowing. On the other hand, if the government borrows from thecommercial banks there will be a tendency towards an expansion in the volumeof deposits held by the public (as and when the government spends the money)
— 13 —
13012011010030
70
60
50
70
60
10090
100908070
100908070
12011010090
100908070GO
1101009080
1101009080
120
100
10090807060
50
30
Indexes of Industrial Productionon^base 1929.= 100.(Logarithmic scale)
I929 I930 I93I 1932 1933 193* 1935 1936 1937 1938 1939 1940
N
US.A.
1
f[
•\f--Canada
Ï ^L,•;;;)- fa
1elgiuiT
...
N....L...
A
f\7
/
50
-V5 0 - V - - • • -
V^Gr. Britain
Vvs
Ft
3.30-WO
Italy
lungarL - - - - i
^ /
iwede
Japan
rinìand
XTV-I
u
/A
Àr
-
f- • 6 0
y i
/
ft
w
p\1/
i r
/
/
J
11 X
ÄA
" • " /
c/.>^
ok/indei
V
y
y.
1/•140
. . .V
. . . . . J
U.S.A.
Canade
. ys*
' flermanj
elgiun
w^ " " " " F r a n c e
1 /
""'"I.-_
._...A
GrBrita n
V"
A . ISIf™Italy
" / •
B^/Hungary
r
Japan
----- Finlan(
i r t J A •••r* V v
. . . 1 . . . .
—
:.\:.-J- M r - -
W™-—
• " 1
I l v
13012011010090801301201101009080
140
120
100908070
90
80
70
60
90
80
70
120110100
11010090
160
140
120
160
140
200180160180160140120
10090807060
50
40
30
and there is also likelyto be some increase inthe amount of notesoutstanding (no con-traction having beenmade in the amountof notes and depositsalready in the handsof the public). It istrue that the increasein deposits may in ameasure be offset bybusinessmen's repay-ments of loans to thecommercial banks. Itis, however, a factthat in almost everycountry the increase inthe commercial banks'lending to the govern-ment (whether m theform of direct advan-ces or discounting ofTreasury bills or pur-chase of bonds) hasbeen accompanied byan expansion in de-posits. The questionsthen arise whether inthis way new resourcesadditional to the cur-rent savings have been"created" and whetherthis method of finan-cing is necessarily inflationary in character.No general answercan be given to thesequestions, as may beseen from an analysisof the different condi-tions that may obtain.
When employment is rising in a country in line with a natural increasein the working population or from an absorption of unemployed, there shouldnormally be an expansion in the means of circulation to match the enhancedeconomic activity. The increased holding of cash by the public is then a
• — 14 —
form of genuine savings, non-inflationary in character. At the beginning ofa war when a nation's efforts are being enlisted to improve output theremay well be room for such an expansion ; Professor A. C. Pigou* statesthat between August 1939 and August 1940 the "warranted" expansion ofmoney in the United- Kingdom amounted to between 5 and 10 per cent.As the war goes on, however, and more men are mobilised and heaviershackles are laid on foreign trade, it is to be expected, on the basis ofexperience from previous wars, that the volume of production will tend todecline rather than increase, leaving no room for a non-inflationary expansionof circulating media to match increased activity.
The case just mentioned, however, in no way excludes other possibilitiesof a non-inflationary expansion through borrowing from the commercial banks.These banks act not only as part of the monetary mechanism in that theyprovide the basis for cheque currency, but also as savings banks throughwhich part of the thrift of the public may be transmitted to industry and tradeor to the government. The manner in which such transmission occurs mayperhaps best be shown by an example. Suppose that an individual whoreceives his salary in notes saves Sw.fcs 100 by placing a note of that amounton a savings account with a commercial bank. In this case the liabilities(deposits) and assets (cash in the form of notes) of the bank are immediatelyincreased ; if the bank in question now lends Sw.fcs 100 to the government(thus exchanging the notes against a government bond) there can be no doubtthat this lending is the counterpart of the genuine savings entrusted to thebanking system. If, on the other hand, the individual receives his salarythrough a transfer to his bank account and saves simply by not drawing onhis account, there is no immediate increase in the liabilities and assets ofthe banking system as a result of his savings. The only way in which thecommercial banks can take advantage of the savings which, by the inactionof their customers, have been entrusted to them is by the granting of creditin the form of advances or the purchase of securities; either operation inso far as it involves a net extension of the banks' business leads even-tually to an increase in deposits — if not at once, at least when the creditfacilities are made use of. Thus the increase in deposits occurs not whenthe savings are made but when they are given employment by the action ofthe commercial bank. This technical difference compared with what happenswhen notes are used does not in any way affect the essential nature ofthe source of the funds, the banks' lending and investment being in bothcases the counterpart of the savings entrusted to them. The banks' actionis in fact needed to maintain an even flow of purchasing power, and theexpansion in deposits is therefore in this case non-inflationary.
In normal times the amount of genuine savings held in e.g. the Englishbanking system is probably relatively stable, but in times of war the habitsof the public may change considerably; in some continental countries, as,e. g., Germany, the absorption of savings through the medium of commercial
* In an article in the "Economic Journal" for December 1940.
— 15 —
banks is undoubtedly of great practical importance. In a country with a highlycontrolled economy there is clearly an element of compulsion with regardto the way in which savings are left with the banks. When a governmentspends amounts obtained from the banking system the additional purchasingpower put into circulation would normally give rise to increased spending,which would in the first instance eat into the available reserves of commoditystocks and before long increase imports and the price level. Through anjudicious system of rationing and strict control of foreign trade and pricesthese effects can in a large measure be neutralised; sheer inability to buywill, up to a point, force individuals to abstain from spending, i. e. to save.If, moreover, opportunities for private investment are severely limited througha series of restrictions (prohibition against building of houses, etc.), thereremains no other outlet for those who receive the additional income thanto buy government bonds or to leave their money with some credit institution,which will usually be a bank. The successful working of such a system,under which rationing, so to say, becomes a means of monetary policy,presupposes a strict control of wages, prices and investments and the main-tenance of a sufficient balance in production to provide the goods neededfor the amount of consumption permitted.
To what extent these conditions are fulfilled in any particular countrymust always be difficult to determine. No doubt the progressive expansion inthe volume of deposits, always available as potential purchasing power, is aptto increase the tension between the demand for and the current supply of goodsand forces a greater degree of reliance on the efficiency of the control andthe discipline of the general public. In countries in which the "free sector"is still of considerable dimensions (and therefore the purchasing powerengendered by government borrowing in commercial banks will not be moreor less automatically sterilised through the system in force) continuous addi-tions to the volume of deposits, which may be only partially offset by increasedholdings of idle money in the banks, are more likely to provoke an inflationarytendency. In a special report to Congress dated 31st December 1940 the Boardof Governors of the Federal Reserve System, the Presidents of the FederalReserve Banks and the Federal Advisory Council recommended, inter alia,that "the financing of the ordinary requirements of the Government and theextraordinary needs of the defence programme should be accomplished bydrawing upon the existing large volume of deposits rather than by creatingadditional deposits through bank purchases of government securities".
What happens if the credi t expansion is of such a naturethat an in f la t ionary tendency clear ly sets in? It is not, of course,at all easy for the commercial banks to determine to what extent savings arebeing entrusted to them in the manner described above. If those who savetransfer their money from current to savings accounts, that is an indicationfor the banks, but it is notorious that many people leave savings for years oncurrent account. As a rule there may be a reduction in the rate of turnover
- 16 -
on deposits with commercial banks as new savings are made, but in abnormaltimes even these indications may be less helpful.
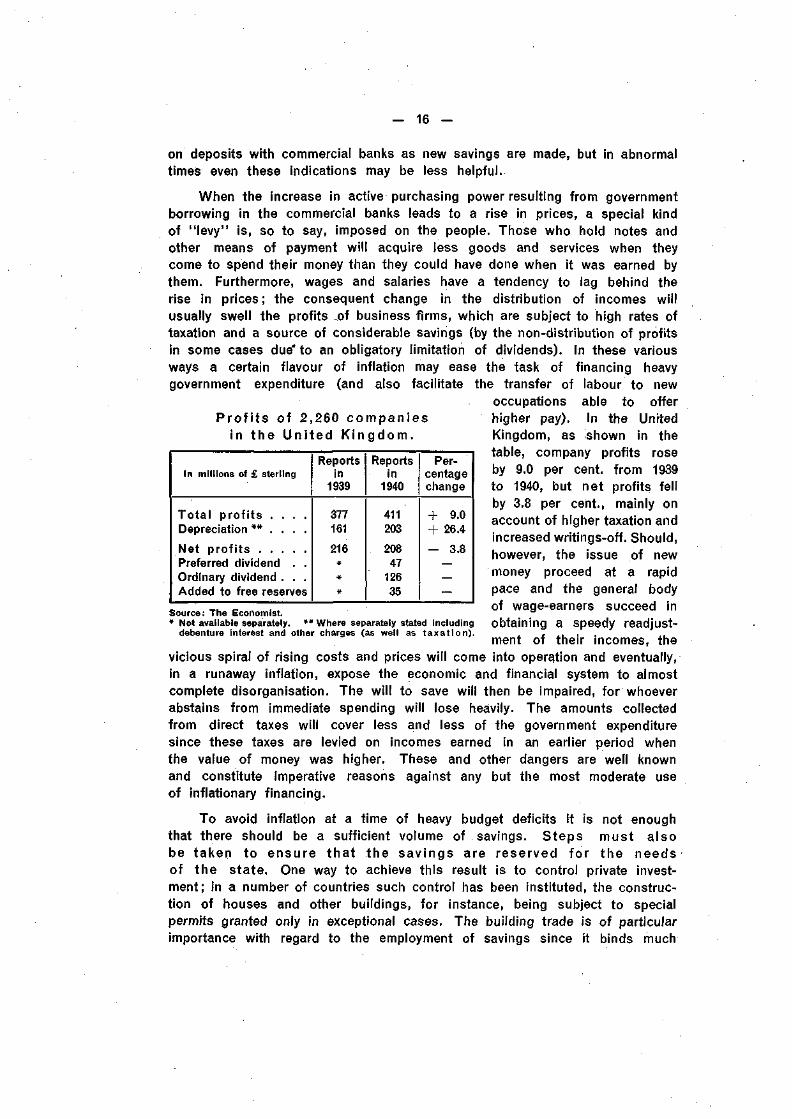
When the increase in active purchasing power resulting from governmentborrowing in the commercial banks leads to a rise in prices, a special kindof "levy" is, so to say, imposed on the people. Those who hold notes andother means of payment will acquire less goods and services when theycome to spend their money than they could have done when it was earned bythem. Furthermore, wages and salaries have a tendency to lag behind therise in prices; the consequent change in the distribution of incomes willusually swell the profits .of business firms, which are subject to high rates oftaxation and a source of considerable savings (by the non-distribution of profitsin some cases due" to an obligatory limitation of dividends). In these variousways a certain flavour of inflation may ease the task of financing heavygovernment expenditure (and also facilitate the transfer of labour to new
occupations able to offerP r o f i t s of 2,260 compan ies higher pay). In the United
in the Un i ted K i n g d o m . Kingdom, as shown in thetable, company profits roseby 9.0 per cent, from 1939to 1940, but net profits fellby 3.8 per cent., mainly onaccount of higher taxation andincreased writings-off. Should,however, the issue of newmoney proceed at a rapidpace and the general bodyof wage-earners succeed inobtaining a speedy readjust-ment of their incomes, the
vicious spiral of rising costs and prices will come into operation and eventually,in a runaway inflation, expose the economic and financial system to almostcomplete disorganisation. The will to save will then be impaired, for whoeverabstains from immediate spending will lose heavily. The amounts collectedfrom direct taxes will cover less and less of the government expendituresince these taxes are levied on incomes earned in an earlier period whenthe value of money was higher. These and other dangers are well knownand constitute imperative reasons against any but the most moderate useof inflationary financing.
To avoid inflation at a time of heavy budget deficits it is not enoughthat there should be a sufficient volume of savings. Steps must alsobe taken to ensure that the savings are reserved for the needsof the state. One way to achieve this result is to control private invest-ment; in a number of countries such control has been instituted, the construc-tion of houses and other buildings, for instance, being subject to specialpermits granted only in exceptional cases. The building trade is of particularimportance with regard to the employment of savings since it binds much
In millions of £ sterling
T o t a l p r o f i t s . . . .Depreciation * * . . . .
Net p r o f i t sPreferred dividend . .Ordinary dividend . . .Added to free reserves
Reportsin
1939
377161
216#*#
Reportsin
1940
411203
20847
12635
Per-centagechange
+ 9.0+ 26.4
- 3.8
Source: The Economist.* Not available separately. ** Where separately stated including
debenture interest and other charges (as well as taxation).
— 17 —
capital and in normal times may absorb one half or more of the annualsavings (compare the table for Sweden on page 11). Where no comprehensivecontrol has been imposed the contraction in private investment may in ameasure be achieved almost automatically. Since the war began the costof building has risen practically everywhere (in Switzerland, for instance, byabout 20 per cent, up to the end of 1940); difficulties are experienced inprocuring the necessary raw materials (in particular iron) and interest ratesfor new mortgage loans have often stiffened even when the interest forgovernment credit has moved but little. As a result the volume of newprivate building of dwelling-houses has fallen — in some countries precipi-tously. In Switzerland it was reduced by one-half between the autumn of1938 and the autumn of 1940 and in Sweden by over 80 per cent.
As regards the public's employment of their liquid balances, there arestrong reasons to guard against the danger that a continuous rise in commodityprices may produce a preference for investment in real assets (houses, shares,etc.) as distinct from money claims. Although it is impossible to prevent arise in prices by financial measures alone, governments are naturally anxiousto choose those methods of borrowing which provide the greatest guaranteesagainst an undue expansion in the volume of monetary purchasing power.Borrowing directly from the central bank is likely to be particularly risky sinceit adds not only to the volume of money held by the public but also to theliquidity of the whole credit system. Borrowing from the commercial banksincreases the volume of deposits held by the public but the effect may bemitigated, as seen above, to the extent that genuine savings are entrustedto the banks. On the other hand, when government bonds are successfullysold to private and institutional investors (and notably insurance companies,investment trusts, savings banks, etc.) there is not only no increase in theamount of money outstanding but funds held by the public are "tied up"and thus prevented from being used for other purposes. Most governmentshave endeavoured to tap the various sources of genuine savings by the issueof a selection of securities adapted to the needs of different categories ofinvestors, instead of relying mainly on the issue of "big loans", as in 1914-18.Special types of securities continuously available are usually issued for largeand small lenders; and variety is also provided with regard to dates ofmaturity, etc.
In the issue of long and middle-term loans, the question of the rate ofinterest to be offered takes a more acute form than in borrowing fromcommercial banks. The general policy has been to avoid an increase inthe interest level in order to enable the governments to borrow at the leastpossible cost and also to prevent an increase in the interest burden of olddebts as, for instance, mortgages. At a time when capital is being divertedfrom normal investments to armaments, when houses, plants, equipment andinventories can only partially be maintained or replaced, when commodityprices in most countries have been rising, making it more profitable tohold real assets than money claims (provided that the rise in prices becomespermanent), the "natural" tendency is probably for interest rates to stiffen,
- 18 -
as in fact has been the case in previous periods of war emergency. Thistendency may, at least temporarily, be counteracted by the central andcommercial banks, which are able to increase the supply of liquid funds.Whether or not it is desirable in a period of growing scarcity of goods toallow a high degree of liquidity is a question which must be considered inrelation to the monetary policy pursued and the extent of the control imposedon each economy.
The rôle of finance in war is primarily to assist in the transfer of resources— man-power, plant and raw materials — to the essential purposes determinedby the task of attaining a maximum effort of national strength; and it isbecause bad financial management — particularly if it leads to wild inflation —is apt to impair this effort that weight must be given to financial as distinctfrom economic and political considerations. Nevertheless, economic mobilisationmust also rely on other forces than those provided by à shift in monetarydemand; in the present emergency direct organisation of production, distributionand consumption has been applied on a much wider scale than in 1914-18,as is shown by the many measures of rationing, fixing of prices, export andimport regulations, compulsory transfer of labour, control of investments,allocation of raw materials and establishment of priorities. Never before in themodern world has state intervention been pushed so far as at present; and itis also true to say that never before has state direction been so successful.
In Germany the prohibitions originally introduced in 1936 against increasesin prices and wages were supplemented at the beginning of 1940 by limi-tations of profits, and although these provisions are applied with a certainelasticity the result is, as the President of the German Reichsbank (who isalso the Minister for National Economy) explained in his speech at the AnnualMeeting of the Bank on 12th March 1941, that "prices and wages are nolonger an instrument for the direction of production". Instead of waiting forthe slow processes of economic pressure, government agencies intervene,particularly in the belligerent countries, to determine the utilisation of pro-ductive resources and if need be to concentrate production on the mostefficient enterprises and so eliminate waste and ensure the greatest possibleresults. For instance, in a speech in the House of Commons on 4th March1941 the President of the Board of Trade announced that the policy ofthe British Government was " to concentrate production on a reducednumber of factories working full time. These factories should be able toproduce the output required for government orders, the greatest practicableexport trade and the minimum needs of our population, while at the sametime preserving the goodwill of the factories closed down" (which undercertain group arrangements will receive compensation from the firms able towork at full capacity).
Complete control of a national economy in all its ramifications is,however, difficult to establish; it is indeed probable that in most countriesrelative changes in prices and remuneration still provide inducement to work
- 19 -
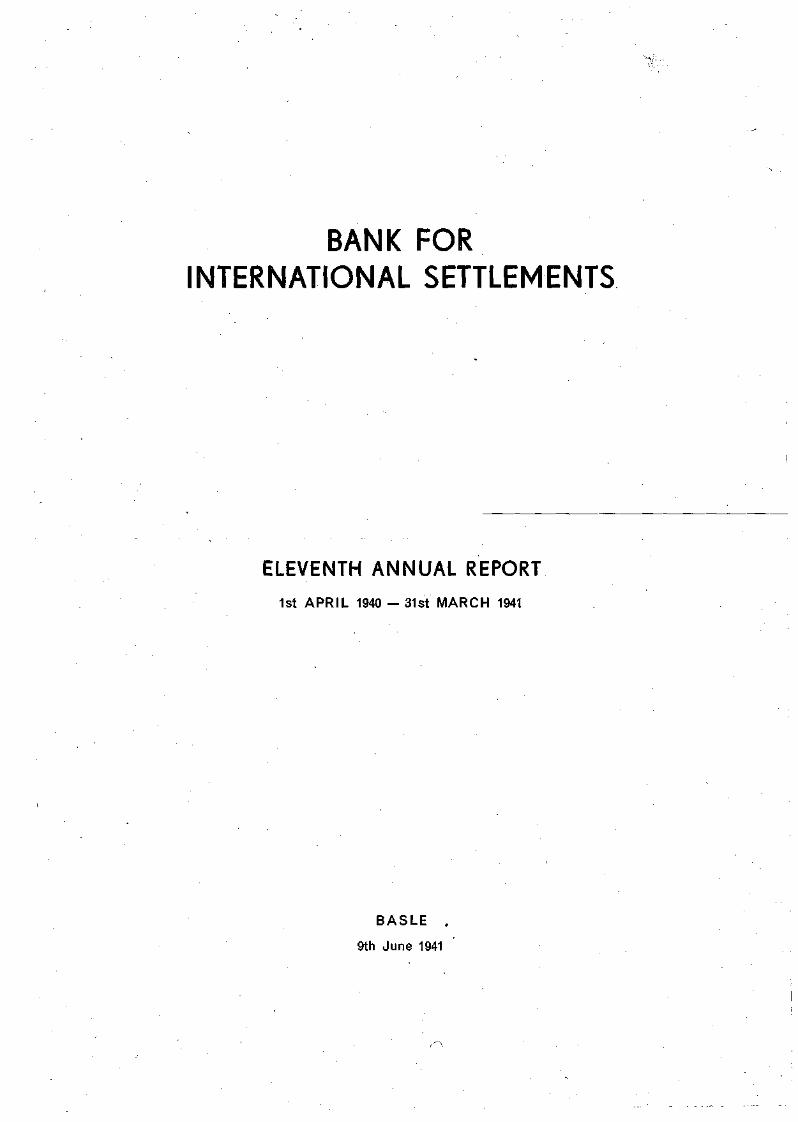
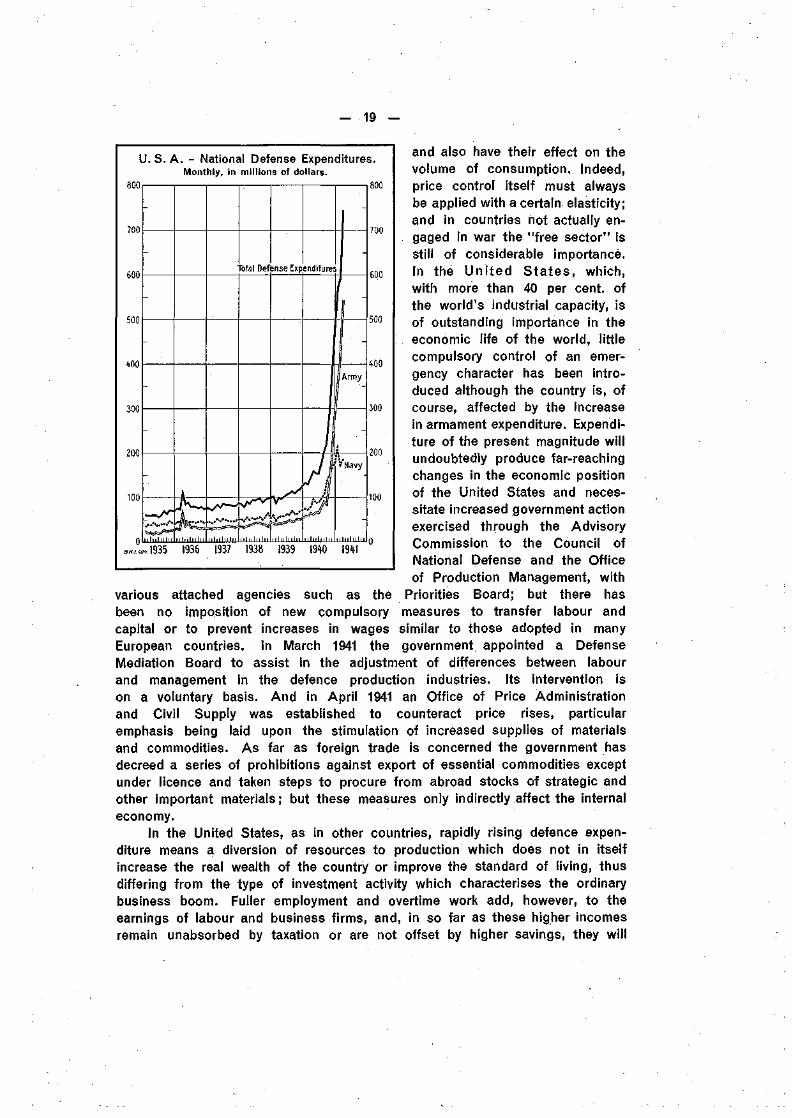
U. S. A. - National Defense Expenditures.Monthly, in millions of dollars.
800
700
600
500
400
300
200
100
-
-
-
-
-
. . . ' . . . - ' •
i i h i h i h i
i
Min i l i M ni
fötal Def änseExp
in
enditures
|
1-
1
AI1 lull iln
V'Navy
iilnln
800
700
600
500
400
300
200
100
and also have their effect on thevolume of consumption. Indeed,price control itself must alwaysbe applied with a certain elasticity;and in countries not actually en-gaged in war the "free sector" isstill of considerable importance.In the Uni ted Sta tes , which,with more than 40 per cent, ofthe world's industrial capacity, isof outstanding importance in theeconomic life of the world, littlecompulsory control of an emer-gency character has been intro-duced although the country is, ofcourse, affected by the increasein armament expenditure. Expendi-ture of the present magnitude willundoubtedly produce far-reachingchanges in the economic positionof the United States and neces-sitate increased government actionexercised through the AdvisoryCommission to the Council ofNational Defense and the Officeof Production Management, with
various attached agencies such as the Priorities Board; but there hasbeen no imposition of new compulsory measures to transfer labour andcapital or to prevent increases in wages similar to those adopted in manyEuropean countries. In March 1941 the government appointed a DefenseMediation Board to assist in the adjustment of differences between labourand management in the defence production industries. Its intervention ison a voluntary basis. And in April 1941 an Office of Price Administrationand Civil Supply was established to counteract price rises, particularemphasis being laid upon the stimulation of increased supplies of materialsand commodities. As far as foreign trade is concerned the government hasdecreed a series of prohibitions against export of essential commodities exceptunder licence and taken steps to procure from abroad stocks of strategic andother important materials; but these measures only indirectly affect the internaleconomy.
In the United States, as in other countries, rapidly rising defence expen-diture means a diversion of resources to production which does not in itselfincrease the real wealth of the country or improve the standard of living, thusdiffering from the type of investment activity which characterises the ordinarybusiness boom. Fuller employment and overtime work add, however, to theearnings of labour and business firms, and, in so far as these higher incomesremain unabsorbed by taxation or are not offset by higher savings, they will
.1935 1936 1937 1938 1939 1940 1941
- 20 -
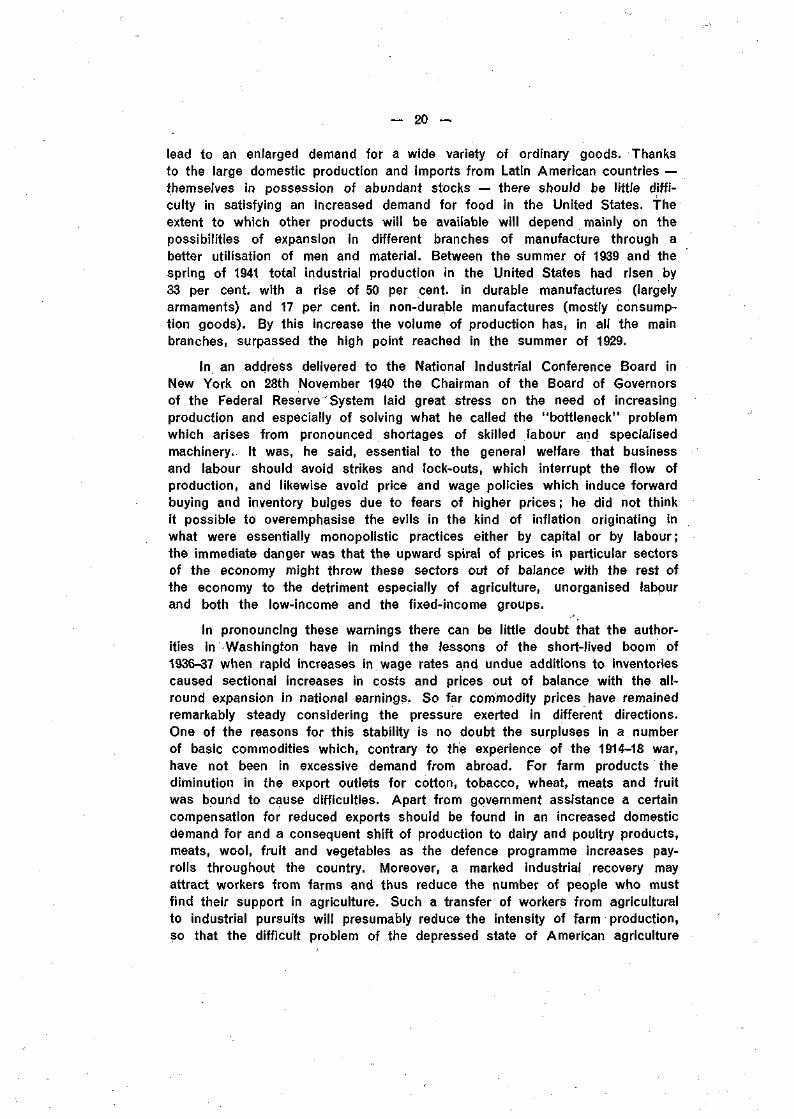
lead to an enlarged demand for a wide variety of ordinary goods. Thanksto the large domestic production and imports from Latin American countries —themselves in possession of abundant stocks — there should be little diffi-culty in satisfying an increased demand for food in the United States. Theextent to which other products will be available will depend mainly on thepossibilities of expansion in different branches of manufacture through abetter utilisation of men and material. Between the summer of 1939 and thespring of 1941 total industrial production in the United States had risen by33 per cent, with a rise of 50 per cent, in durable manufactures (largelyarmaments) and 17 per cent, in non-durable manufactures (mostly consump-tion goods). By this increase the volume of production has, in all the mainbranches, surpassed the high point reached in the summer of 1929.
In an address delivered to the National Industrial Conference Board inNew York on 28th November 1940 the Chairman of the Board of Governorsof the Federal Reserve System laid great stress on the need of increasingproduction and especially of solving what he called the "bottleneck" problemwhich arises from pronounced shortages of skilled labour and specialisedmachinery. It was, he said, essential to the general welfare that businessand labour should avoid strikes and lock-outs, which interrupt the flow ofproduction, and likewise avoid price and wage policies which induce forwardbuying and inventory bulges due to fears of higher prices ; he did not thinkit possible to overemphasise the evils in the kind of inflation originating inwhat were essentially monopolistic practices either by capital or by labour;the immediate danger was that the upward spiral of prices in particular sectorsof the economy might throw these sectors out of balance with the rest ofthe economy to the detriment especially of agriculture, unorganised labourand both the low-income and the fixed-income groups.
In pronouncing these warnings there can be little doubt that the author-ities in Washington have in mind the lessons of the short-lived boom of1936-37 when rapid increases in wage rates and undue additions to inventoriescaused sectional increases in costs and prices out of balance with the all-round expansion in national earnings. So far commodity prices have remainedremarkably steady considering the pressure exerted in different directions.One of the reasons for this stability is no doubt the surpluses in a numberof basic commodities which, contrary to the experience of the 1914-18 war,have not been in excessive demand from abroad. For farm products thediminution in the export outlets for cotton, tobacco, wheat, meats and fruitwas bound to cause difficulties. Apart from government assistance a certaincompensation for reduced exports should be found in an increased domesticdemand for and a consequent shift of production to dairy and poultry products,meats, wool, fruit and vegetables as the defence programme increases pay-rolls throughout the country. Moreover, a marked industrial recovery mayattract workers from farms and thus reduce the number of people who mustfind their support in agriculture. Such a transfer of workers from agriculturalto industrial pursuits will presumably reduce the intensity of farm production,so that the difficult problem of the depressed state of American agriculture
- 21 -
will be at least partially solved on much the same lines as in earlier periods ofthe history of the United States (as was pointed out by economists attachedto the Department of Agriculture in Washington in a statement publishedin January 1941).
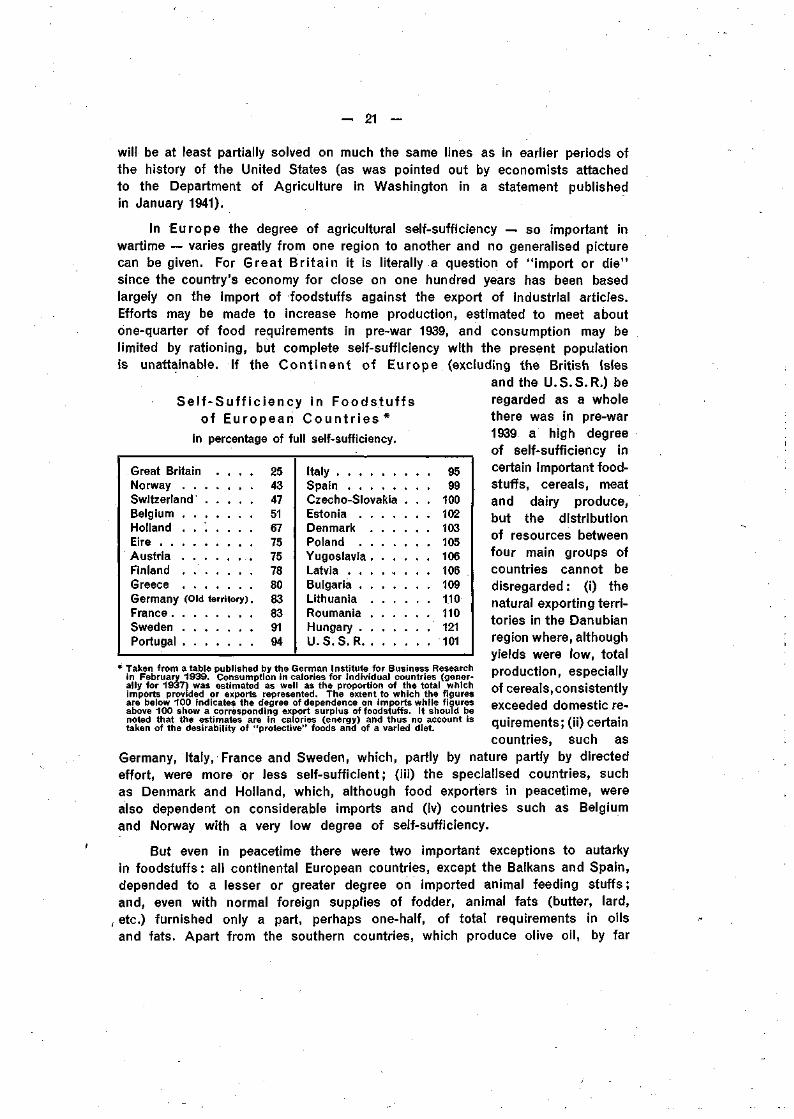
In Europe the degree of agricultural self-sufficiency — so important inwartime — varies greatly from one region to another and no generalised picturecan be given. For Great Br i ta in it is literally a question of "import or die"since the country's economy for close on one hundred years has been basedlargely on the import of foodstuffs against the export of industrial articles.Efforts may be made to increase home production, estimated to meet aboutone-quarter of food requirements in pre-war 1939, and consumption may belimited by rationing, but complete self-sufficiency with the present populationis unattainable. If the Con t inen t of Europe (excluding the British Isles
and the U.S.S.R.) beS e l f - S u f f i c i e n c y in F o o d s t u f f s
of European C o u n t r i e s *in percentage of full self-sufficiency.
Great Britain . . . . 25Norway 43Switzerland 47Belgium 51Holland . . . . . . . 67Eire 75Austria 75Finland . 78Greece 80Germany (Old territory). 83France 83Sweden 91Portugal 94
Italy 95S p a i n 99C z e c h o - S l o v a k i a . . . 100Es ton ia 102D e n m a r k 103P o l a n d 105Y u g o s l a v i a . . . . . . 106Latvia . . . . . . . . 106Bulgaria 109Lithuania 110Roumania 110Hungary 121U.S.S.R 101
regarded as a wholethere was in pre-war1939 a high degreeof self-sufficiency incertain important food-stuffs, cereals, meatand dairy produce,but the distributionof resources betweenfour main groups ofcountries cannot bedisregarded : (i) thenatural exporting terri-tories in the Danubianregion where, althoughyields were low, totalproduction, especiallyof cereals, consistentlyexceeded domestic re-quirements; (ii) certaincountries, such as
Germany, Italy, France and Sweden, which, partly by nature partly by directedeffort, were more or less self-sufficient; (iii) the specialised countries, suchas Denmark and Holland, which, although food exporters in peacetime, werealso dependent on considerable imports and (iv) countries such as Belgiumand Norway with a very low degree of self-sufficiency.
But even in peacetime there were two important exceptions to autarkyin foodstuffs: all continental European countries, except the Balkans and Spain,depended to a lesser or greater degree on imported animal feeding stuffs ;and, even with normal foreign supplies of fodder, animal fats (butter, lard,
, etc.) furnished only a part, perhaps one-half, of total requirements in oilsand fats. Apart from the southern countries, which produce olive oil, by far
* Taken from a table published by the German Institute for Business Researchin February 1939. Consumption in calories for individual countries (gener-ally for 1937) was estimated as well as the proportion of the total whichimports provided or exports represented. The extent to which the figuresare below 100 indicates the degree of dependence on imports while figuresabove 100 show a corresponding export surplus of foodstuffs. It should benoted that the estimates are in calories (energy) and thus no account istaken of the desirability of "protective" foods and of a varied diet.
— 22 —
the greatest proportion of vegetable oils was imported in the form of soyabeans and ground-nuts for crushing and refining.
In 1940 the continental European food situation changed in some importantrespects. About ten per cent, of the area of Continental Europe, mostlyagricultural land, was acquired by the U.S.S.R. (How far this loss may have beenoffset by increased exports from Russia is difficult to determine in the absenceof current statistics.) There was a failure of the wheat harvest in the Danubianarea and a drastic decline of cereal exports from this source. The wheatharvest for the total continental European area fel l ' to a level perhaps 20 percent, below normal requirements, with shortages unevenly distributed. Finally,the numbers of cattle, pigs and poultry were reduced owing to the lack ofimported fodder and failure of crops in some areas and to the necessity ofusing domestic barley and maize for direct human consumption to supplementwheat; as a consequence exports from the principal specialised dairy-producecountries declined in the latter part of the year.
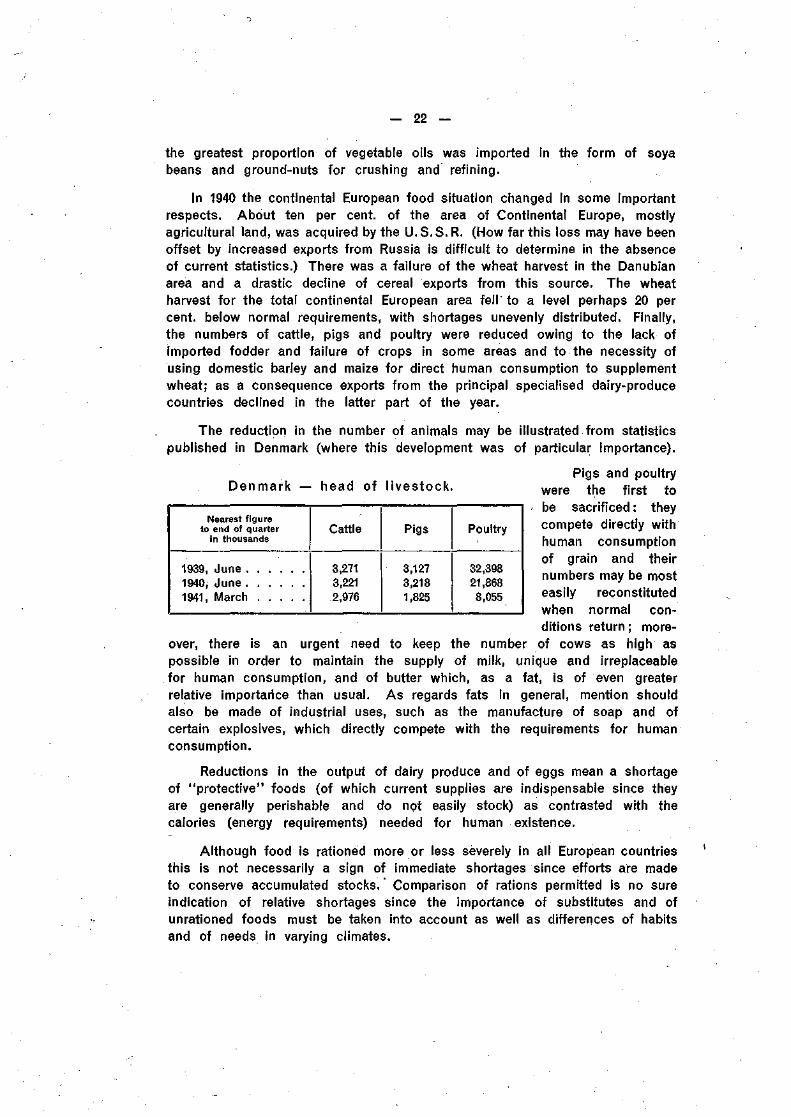
The reduction in the number of animals may be illustrated from statisticspublished in Denmark (where this development was of particular importance).
Denmark — head of l ivestock.
Nearest figureto end of quarter
in thousands
1939, June1940, June1941, March
Cattle
3,2713,2212,976
Pigs
3,1273,2181,825
Poultry
32,39821,8688,055
Pigs and poultrywere the first tobe sacrificed : theycompete directly withhuman consumptionof grain and theirnumbers may be mosteasily reconstitutedwhen normal con-ditions return ; more-
over, there is an urgent need to keep the number of cows as high aspossible in order to maintain the supply of milk, unique and irreplaceablefor human consumption, and of butter which, as a fat, is of even greaterrelative importarice than usual. As regards fats in general, mention shouldalso be made of industrial uses, such as the manufacture of soap and ofcertain explosives, which directly compete with the requirements for humanconsumption.
Reductions in the output of dairy produce and of eggs mean a shortageof "protective" foods (of which current supplies are indispensable since theyare generally perishable and do not easily stock) as contrasted with thecalories (energy requirements) needed for human existence.
Although food is rationed more or less severely in all European countriesthis is not necessarily a sign of immediate shortages since efforts are madeto conserve accumulated stocks." Comparison of rations permitted is no sureindication of relative shortages since the importance of substitutes and ofunrationed foods must be taken into account as well as differences of habitsand of needs in varying climates.
— 23 -r-
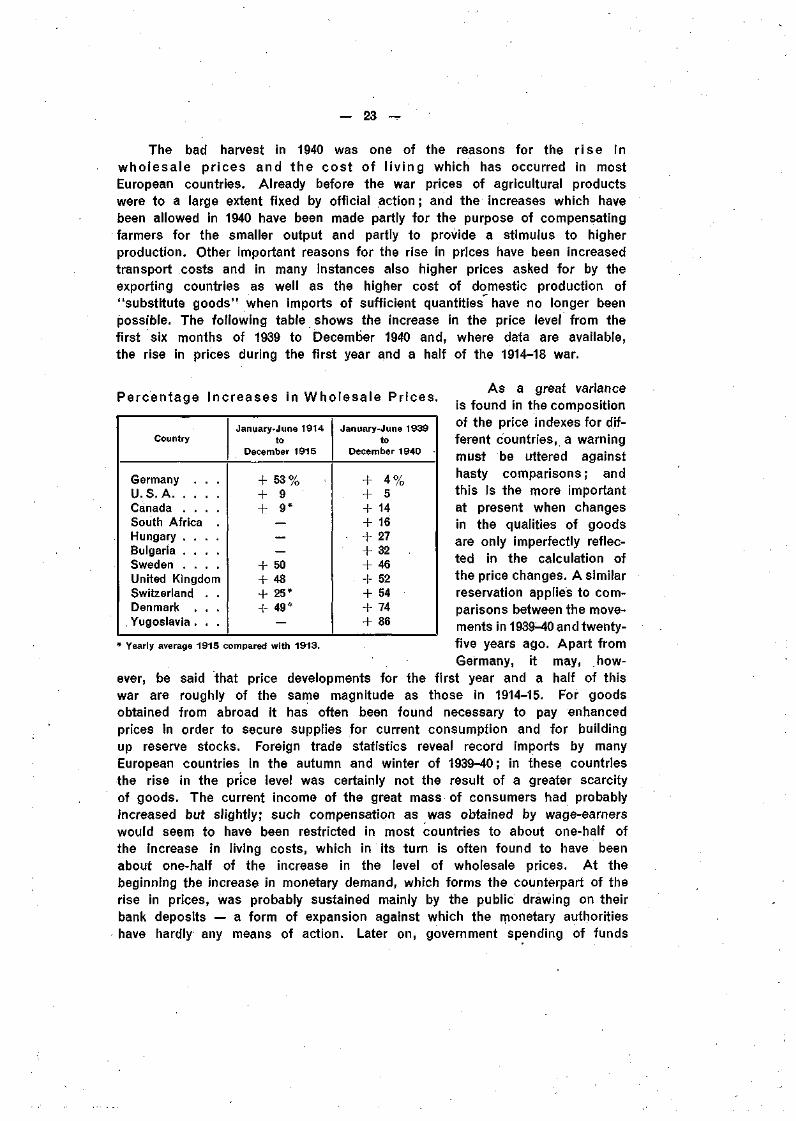
The bad harvest in 1940 was one of the reasons for the r ise inwholesale pr ices and the cost of l iv ing which has occurred in mostEuropean countries. Already before the war prices of agricultural productswere to a large extent fixed by official action; and the increases which havebeen allowed in 1940 have been made partly for the purpose of compensatingfarmers for the smaller output and partly to provide a stimulus to higherproduction. Other important reasons for the rise in prices have been increasedtransport costs and in many instances also higher prices asked for by theexporting countries as well as the higher cost of domestic production of"substitute goods" when imports of sufficient quantities have no longer beenpossible. The following table shows the increase in the price level from thefirst six months of 1939 to December 1940 and, where data are available,the rise in prices during the first year and a half of the 1914-18 war.
Percentage Increases in Who lesa le Pr ices.
Country
Germany . . .U.S.AC a n a d a . . . .South Africa .H u n g a r y . . . .B u l g a r i a . . . .S w e d e n . . . .United KingdomSwitzerland . .Denmark . . .Yugoslavia . . .
January-June 1914to
December 1915
+ 53% ;+ 9+ 9*
———
+ 50+ 48+ 25*-!- 49 *
—
January-June 1939to
December 1940
+ 4%+ 5+ 14+ 16+ 27+ 32+ 46+ 52+ 54+ 74+ 86
* Yearly average 1915 compared with 1913.
As a great varianceis found in the compositionof the price indexes for dif-ferent countries, a warningmust be uttered againsthasty comparisons; andthis is the more importantat present when changesin the qualities of goodsare only imperfectly reflec-ted in the calculation ofthe price changes. A similarreservation applies to com-parisons between the move-ments in 1939-40 and twenty-five years ago. Apart fromGermany, it may, how-
ever, be said that price developments for the first year and a half of thiswar are roughly of the same magnitude as those in 1914-15. For goodsobtained from abroad it has often been found necessary to pay enhancedprices in order to secure supplies for current consumption and for buildingup reserve stocks. Foreign trade statistics reveal record imports by manyEuropean countries in the autumn and winter of 1939-40 ; in these countriesthe rise in the price level was certainly not the result of a greater scarcityof goods. The current income of the great mass of consumers had probablyincreased but slightly; such compensation as was obtained by wage-earnerswould seem to have been restricted in most countries to about one-half ofthe increase in living costs, which in its turn is often found to have beenabout one-half of the increase in the level of wholesale prices. At thebeginning the increase in monetary demand, which forms the counterpart of therise in prices, was probably sustained mainly by the public drawing on theirbank deposits — a form of expansion against which the monetary authoritieshave hardly any means of action. Later on, government spending of funds
— 24 —
borrowed from the central or commercial banks and higher earnings by farmersand other income groups (some of them no doubt with a relatively low velocityof circulation) were in many countries important factors of additional monetaryexpansion. The dominant position of the governments on the money andcapital markets leaves little room for action by central banks to withstandinflationary tendencies. In the past it has often been regarded as a principleof credit policy that the central banks should intervene against the trend incommodity prices: when prices fall a policy of cheap and plentiful creditshould be applied and when prices rise an opposite policy should be enforced.In the present situation of rising prices attempts seem to be made not somuch to supplement as to replace central-bank action by a far-reaching priceand investment control. The question remains, however, whether in this waythe interest level and the degree of liquidity can be reduced to relativelyinsignificant factors in the development. There can in any case be little doubtthat the larger the "free sector" is in an economy the more important is theobservance of the more traditional credit principles in the struggle againstinflation.
In the first years of the war of 1914-18 there was a remarkable degreeof correspondence between the movements of commodity prices and exchangerates in conformity with the purchasing power parities of the various cur-rencies. As restrictions became more incisive and transport costs rose tohigh levels and foreign credits were arranged, this correspondence was dis-turbed by other more important influences. In the present emergency theinterruption of normal trade has been effected more quickly than in the lastwar. Moreover, systems of exchange control with the fixing of official rateshave been so widely put into force that little room has been found for inde-pendent market quotations. It is true that "free rates" have been quoted forcertain currencies in addition to the official rates, but these "free rates" usuallyreflect a limited number of transactions and can therefore in no waybe regarded as representative of major movements. Alterations in officialrates were made during 1940, especially of continental European rates inrelation to the Reichsmark. These changes were made in order to relate thecurrencies in occupied countries to the official rate of the Reichsmark orto establish a more uniform exchange structure in the Danubian and Balkanareas. The working of a multilateral clearing presupposes as an indispensablecondition that those countries which participate in the system apply a consistentstructure of rates and cross rates. In recent discussions emphasis has in-creasingly been laid on a number of other conditions which must be fulfilledin order to enable a multilateral clearing to work satisfactorily. One of theVice-Presidents of the German Reichsbank* underlined the fact that "asound domestic currency policy in all the countries participating in theclearing must be the foundation of the whole system; since the externalvalue of a currency is always dependent on its internal value, it is in thelong run impossible to maintain stable exchange rates when an unsound
* In an article published in "Die Staatsbank" of 10th November 1940.
— 25 —
currency policy at home leads to uncontrolled price increases. The basicrule applies that the monetary circulation must always stand in a weH-pro-portioned relation to the turnover of commodities".
This insistence on the need of fundamental equilibrium, with all thatit implies in the way of economic and budgetary policy, holds good fora multilateral clearing as well as for any other international monetary systemwhich is to function without disturbance. After 1918 it proved impossible tore-establish an international standard free from fundamental maladjustments ;and this failure, due to a variety of causes, was no doubt largely responsiblefor the unfortunate monetary and economic developments in the decade from1929 to 1939. Bitter experience has shown that the principles of monetaryequilibrium cannot be disregarded with impunity; and this lesson must beborne in mind when currency relations now deranged by war conditions areestablished anew on an international basis as a factor in the post-war recon-struction.
- 26 -
II. EXCHANGE RATES, FOREIGN TRADE AND PRICE MOVEMENTS.
1. EXCHANGE RATES.
The main characteristic of foreign exchange conditions in 1940 was afurther extension of official regulations, generally combined with detailedsupervision of foreign trade. Steps were taken to stop leakages in the existingexchange controls; the remaining markets for "free rates" became narroweras foreign payments — commercial and others — were forced into officialchannels. Alterations in exchange values were the result not so much ofmarket forces as of deliberate official action, often undertaken in connectionwith commercial negotiations. In the Danubian and Balkan regions the lackof uniformity in the quotations of different currencies, the result of a compli-cated system of premiums and varying provisions for surrender of foreignexchange, was largely eliminated. In areas occupied by Germany rates ofexchange were fixed more or less in conformity with the official quotationspreviously in force. In the United Kingdom and other countries of theBritish Empire the exchange regulations were reinforced and further agreementsconcluded with foreign exchange centres; as a result the quotation of freesterling, which in May 1940 had fallen 20 per cent, below the official rate,recovered in the autumn the ground which had been lost.
Among developments outside Europe interest attaches to the immobili-sation in the United States of the assets of a number of European countrieswhich were occupied in the course of the war or otherwise changed theirpolitical status. Fear of an extension of these measures provoked fairly extensivecapital movements: some Sw.fcs 850 million were, for instance, sold byprivate investors to the Swiss National Bank between the middle of June1940 and the end of March 1941. In Latin American countries export diffi-culties continue to limit the normal supply of foreign exchange and havenecessitated stricter control measures. In a few instances (Bolivia, Peru,Venezuela) they have led to further depreciation, the exchange position, ofthe Argentine, Brazil and Mexico has been strengthened by a considerableinflux of money from abroad, partly refugee funds and partly capital for newinvestments, while a number of Latin American countries were assisted bycredits obtained from the Export-Import Bank and the Exchange StabilizationFund in the United States. Finally, in the Far East the continuation ofhostilities has subjected the exchanges to further strain : in the autumnof 1940 a strict control was imposed on the exchange of goods and thetransfer of money between the different countries forming the yen area(Japan, Manchukuo and North China); in December 1940 a new centralbank was established in Nanking with its own currency, competing in Shanghaiand other areas with the Chungking yuan (the currency of the Chiang Kai-ChekGovernment); the latter, after a depreciation of 25 per cent, in the first fourmonths of 1940, remained relatively stable up to the end of the year. Betweenthe Yokohama Specie Bank and the Bank of Java an agreement, valid for one year
— 27 —
but terminable at three months notice, came into force on 1st January 1941, underwhich these banks make advances in their own currency to ensure prompt paymentsto exporters, any balance being settled from time to time by payments inU.S. dollars. In several European clearing agreements provisions have also beenincluded for advances by central banks to avoid delay in payments through theclearings — examples of the increased importance of official intervention underconditions which exclude resort to the ordinary sources of banking credit.
The present preponderance of the Reichsmark in the currency structureof the European continent is due to the increased relative importance of theGerman market for the trade of many countries after the cutting-off of theiroverseas commercial relations. In the area within the German barrier morethan one-half of the foreign trade is with Germany and practically all paymentsare made through clearings. Steps have been taken in Berlin to facilitatetransactions by a development towards a multilateral clearing system. In thisconnefction the arrangements entered into with countries in the Danubianand Balkan regions are of particular interest.
Especially after 1933 the intensification of trade relations with count r iesin central and south-eastern Europe became an objective of Germancommercial policy, partly because these countries could deliver agricultural andother primary products in exchange for industrial articles and partly becausetrade with these areas could presumably be maintained even in the event ofa war. Since the world-wide depression made it difficult for the Danubianand Balkan countries to sell their agricultural products in western Europe,these countries were naturally interested in the possibilities of exporting atcomparatively remunerative prices to the German market. In their clearingagreements with Germany the old par rates of exchange were at first applied.It was soon found that exports to Germany tended to exceed imports, leavingthe countries from time to time with a credit balance which in some instancesaffected the rates of the Reichsmark quoted in the free market. Since theDanubian and Balkan countries were in need of free "devisen" to pay fortheir imports of overseas raw materials (textiles, colonial products, etc.) andto meet the service of their foreign debts, they allowed premiums on thepurchase and sale of free exchange in order to stimulate exports payable insuch exchange. In that way the rates applied to such currencies as dollars,sterling and Swiss francs did not correspond to the rates applied to theReichsmark; and between the different countries in the Danubian and Balkanregions a variety of clearing rates were in force, with cross rates that didnot harmonise.
After the war had started in 1939 a series of developments set in whichaffected the exchange situation. Trade with most of the so-called free-exchange countries became gradually more difficult; commodity prices wererising in the Danubian and Balkan regions; the harvest in 1940 was generallya poor one and, for other reasons also, exports to Germany tended todecline. On the other hand, imports from Germany were badly needed;within a short time the clearing balances began to move in favour of
— 28 —
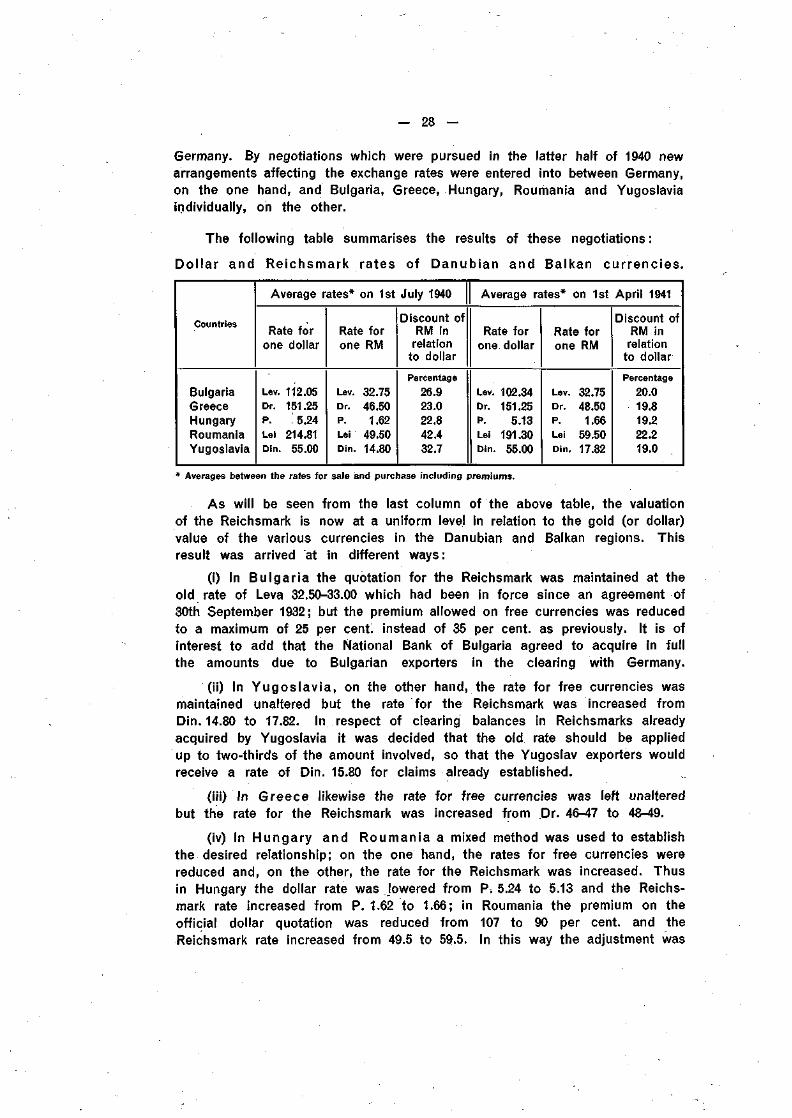
Germany. By negotiations which were pursued in the latter half of 1940 newarrangements affecting the exchange rates were entered into between Germany,on the one hand, and Bulgaria, Greece, Hungary, Roumania and Yugoslaviaindividually, on the other.
The following table summarises the results of these negotiations:
Dol lar and Reichsmark rates of Danubian and Balkan currencies.
BulgariaGreeceHungaryRoumaniaYugoslavia
Average
Rate forone dollar
Lev. 112.05Dr. 151.25P. 5.24Lei 214.81Din. 55.00
rates* on 1st
Rate forone
Lev.Dr.P.
LeiDin.
' RM
32.7546.501.62
49.5014.80
July 1940
Discount ofRM in
relationto dollar
Percentage26.923.022.842.432.7
Average rates*
Rate forone dollar
Lev. 102.34Dr. 151.25P. 5.13Lei 191.30Din. 55.00
on 1st
Rate forone
Lev.Dr.P.
LeiDin.
RM
32.7548.50
1.6659.5017.82
April 1941
Discount ofRM inrelation
to dollar
Percentage20.019.819.222.219.0
* Averages between the rates for sale and purchase including premiums.
As will be seen from the last column of the above table, the valuationof the Reichsmark is now at a uniform level in relation to the gold (or dollar)value of the various currencies in the Danubian and Balkan regions. Thisresult was arrived at in different ways :
(i) In Bulgar ia the quotation for the Reichsmark was maintained at theold rate of Leva 32.50-33.00 which had been in force since an agreement of30th September 1932; but the premium allowed on free currencies was reducedto a maximum of 25 per cent, instead of 35 per cent, as previously. It is ofinterest to add that the National Bank of Bulgaria agreed to acquire in fullthe amounts due to Bulgarian exporters in the clearing with Germany.
(ii) In Yugos lav ia , on the other hand, the rate for free currencies wasmaintained unaltered but the rate for the Reichsmark was increased fromDin. 14.80 to 17.82. In respect of clearing balances in Reichsmarks alreadyacquired by Yugoslavia it was decided that the old rate should be appliedup to two-thirds of the amount involved, so that the Yugoslav exporters wouldreceive a rate of Din. 15.80 for claims already established.
(iii) In Greece likewise the rate for free currencies was left unalteredbut the rate for the Reichsmark was increased from Dr. 46-47 to 48-49.
(iv) In Hungary and Roumania a mixed method was used to establishthe desired relationship; on the one hand, the rates for free currencies werereduced and, on the other, the rate for the Reichsmark was increased. Thusin Hungary the dollar rate was Jowered from P. 5.24 to 5.13 and the Reichs-mark rate increased from P. 1.62 to 1.66; in Roumania the premium on theofficial dollar quotation was reduced from 107 to 90 per cent, and theReichsmark rate increased from 49.5 to 59.5. In this way the adjustment was
- 29 -
made with relatively slight changes in the quotations. A moderate appreciationof the national currencies in terms of dollars and sterling was no longer amatter of importance since trade with the United States, the United Kingdomand other overseas countries had practically ceased; and in relation toSwitzerland the possibilities of delivering the goods in demand were foundto be more decisive for the maintenance of trade than slight changes inprices or rates. It should be added that for deliveries of petrol by Roumaniathe rate of Lei 49 was to continue to apply even after 1st April 1941.
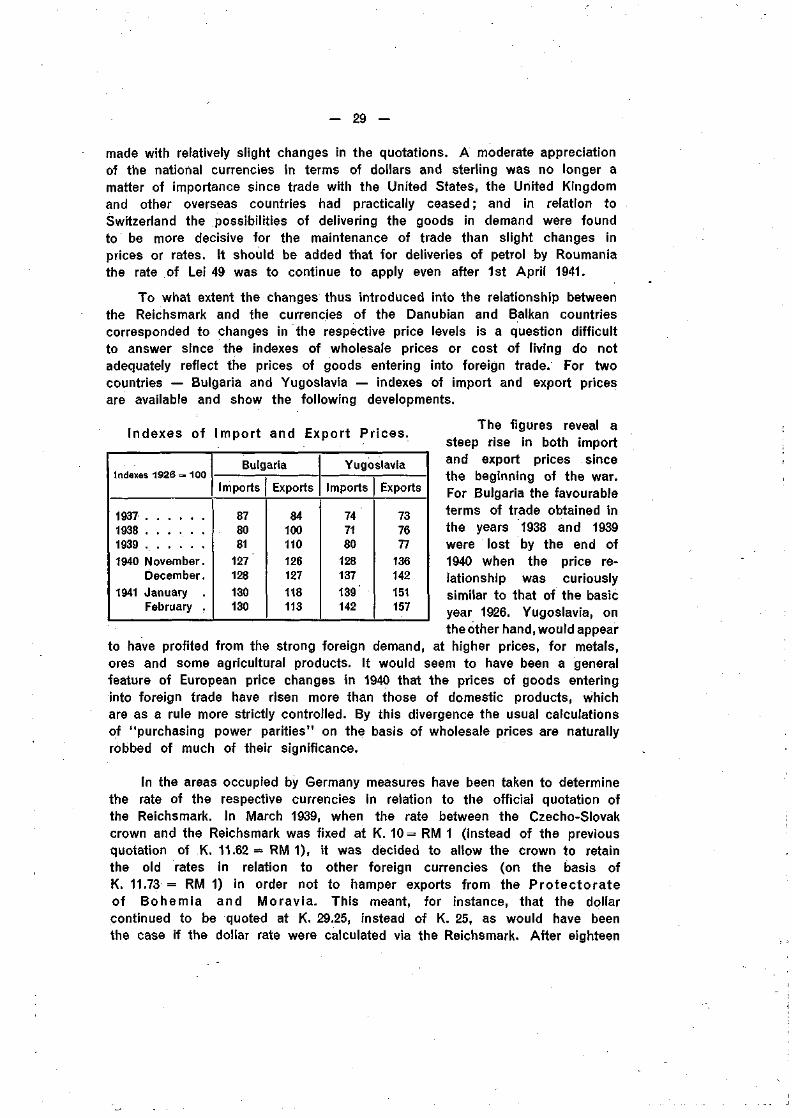
To what extent the changes thus introduced into the relationship betweenthe Reichsmark and the currencies of the Danubian and Balkan countriescorresponded to changes in the respective price levels is a question difficultto answer since the indexes of wholesale prices or cost of living do notadequately reflect the prices of goods entering into foreign trade. For twocountries — Bulgaria and Yugoslavia — indexes of import and export pricesare available and show the following developments.
Indexes of Import and Export Prices.
Indexes 1926 = 100
1937193819391940 November.
December.1941 January .
February .
Bulgaria
Imports
878081
127128130130
Exports
84100110126127118113
Yugoslavia
Imports
747180
128137139'142
Exports
737677
136142151157
The figures reveal asteep rise in both importand export prices sincethe beginning of the war.For Bulgaria the favourableterms of trade obtained inthe years 1938 and 1939were lost by the end of1940 when the price re-lationship was curiouslysimilar to that of the basicyear 1926. Yugoslavia, onthe other hand, would appear
to have profited from the strong foreign demand, at higher prices, for metals,ores and some agricultural products. It would seem to have been a generalfeature of European price changes in 1940 that the prices of goods enteringinto foreign trade have risen more than those of domestic products, whichare as a rule more strictly controlled. By this divergence the usual calculationsof "purchasing power parities" on the basis of wholesale prices are naturallyrobbed of much of their significance.
In the areas occupied by Germany measures have been taken to determinethe rate of the respective currencies in relation to the official quotation ofthe Reichsmark. In March 1939, when the rate between the Czecho-Slovakcrown and the Reichsmark was fixed at K. 10= RM 1 (instead of the previousquotation of K. 11.62= RM 1), it was decided to allow the crown to retainthe old rates in relation to other foreign currencies (on the basis ofK. 11.73 = RM 1) in order not to hamper exports from the Protec tora teof Bohemia and Moravia. This meant, for instance, that the dollarcontinued to be quoted at K. 29.25, instead of K. 25, as would have beenthe case if the dollar rate were calculated via the Reichsmark. After eighteen
— 30 —
months, however, this disparity was ended upon the abolition of thecustoms frontier between Germany and the Protectorate as from 1st October1940: in relation to other currencies than the Reichsmark the exchange valueof the Protectorate currency was raised by 17 per cent. Since the springof 1939 commodity prices had risen in Bohemia and Moravia (prices ofindustrial articles by not less than 41.7 per cent, between March 1939and July 1940). Such an increase would ordinarily have made an appre-ciation in the value of the currency difficult to sustain; prices of export goodsin the Danubian and Balkan regions had, however, risen substantially sincethe war began (compare the indexes quoted above for Bulgaria and Yugoslavia).
Of some interest is the special relationship of Bohemia and Moravia toSlovakia. Up to the end of September 1940 one Protectorate crown wasexchanged for one Slovak crown (K. 1 = Ks. 1). From 1st October 1940 theexchange was altered to K. 10 = Ks. 11.62. In order to keep trade on the oldbasis the Slovak Government imposed a levy of 16 per cent, (later reducedto 6 per cent.) on exports to the Protectorate and, from the funds thusobtained, granted subsidies to Slovak importers of goods from the Protectorate.
In the territories of Poland which were incorporated into Germany, asalso in the Governor-Generalship, the rate of conversion between the Reichs-mark and the zloty was fixed at RM 1 = ZI. 2. On 8th April 1940 the "Reichs-kreditkassen", opened at the time of the occupation to provide means ofpayment for the German troops and emergency currency and credit facilities,were closed and a new Bank of Issue for the Governor-Generalship with its headoffice in Cracow began operations, the old notes of the Bank Polski being ex-changed for the notes of the new bank at par. The offices of the Reichskredit-kassen were taken over as branches of 1he new bank; the Reichskreditkassen-scheine (the amount of which did not exceed RM 45 million) were withdrawnand replaced by zloty (or by Reichsbank notes in the incorporated territories).German currency is no longer legal tender in the Governor-Generalship, whichis connected with the German monetary system through a clearing arrangement.
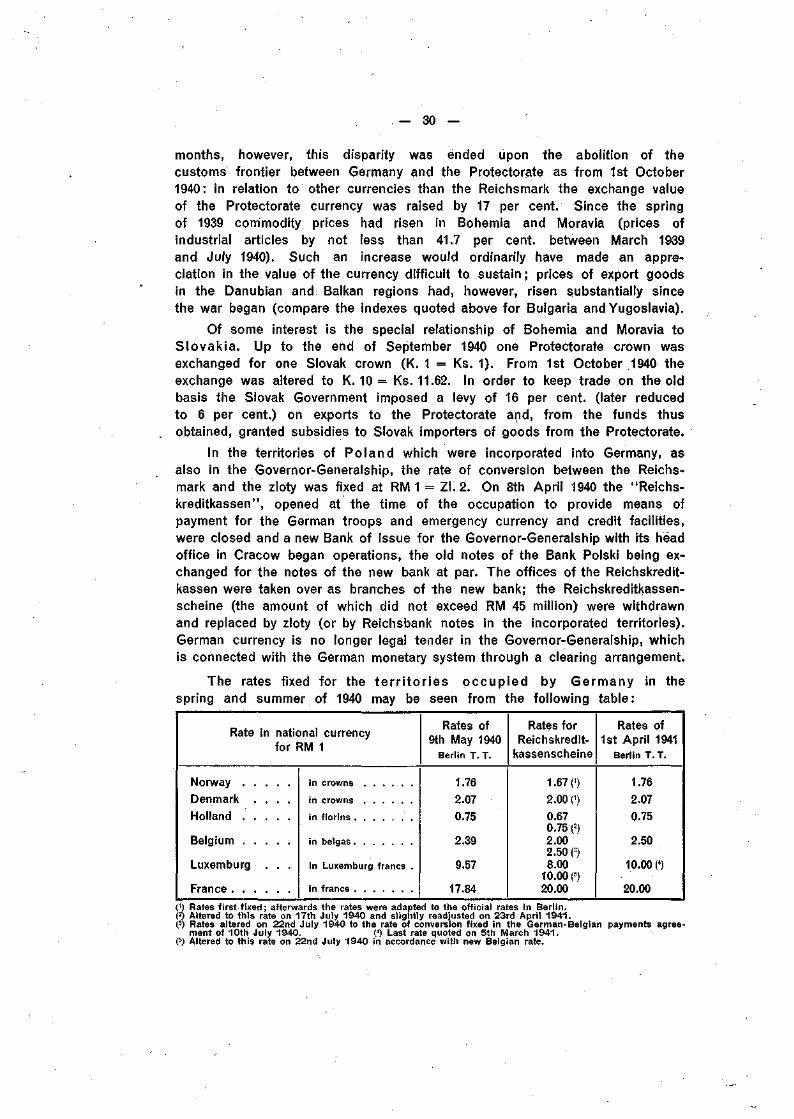
The rates fixed for the te r r i to r ies occup ied by Germany in thespring and summer of 1940 may be seen from the following table:
Rate in nat ional cur rencyfo r RM 1
Norway
Denmark . . . .
Ho l land . . . . .
Be lg ium
Luxemburg . . .
France
in crowns
in crowns
in florins
in belgas
in Luxemburg francs .
in francs
Rates of9th May 1940
Berlin T. T.
1.762.070.75
2.39
9.57
17.84
Rates forReichskredit-
kassenscheine
1.67 0)2.00 0)0.670.75 (2)2.002.50 (3)8.00
10.00 (5)20.00
Rates of1st April 1941
Berlin T. T.
1.76
2.07
0.75
2.50
10.00 (4)
20.00
0) Rates first fixed; afterwards the rates were adapted to the official rates in Berlin.O Altered to this rate on 17th July 1940 and slightly readjusted on 23rd April 1941.(3) Rates altered on 22nd July 1940 to the rate of conversion fixed in the German-Belgian payments agree-
ment of 10th July 1940. (4) Last rate quoted on 5th March 1941.(5) Altered to this rate on 22nd July 1940 in accordance with new Belgian rate.
- 31 -
To provide the German troops with means of payment the method ofissuing Reichsmark notes called Reichskredi tkassenscheine was againemployed in Norway, Denmark, Holland, Belgium, Luxemburg and France.Thus the experience gained in Poland was used in the North and theWest. Reichskreditkassenscheine became the cash of the German troopsabroad, and their import or use in Germany itself was forbidden. In fact,exchange restrictions were imposed between Germany and the German armyin foreign countries in order to ensure that the issue of Reichskreditkassen-scheine involved no danger to the stability of the Reichsmark. In fact, theemployment of Reichskreditkassenscheine as an ad hoc currency made itpossible to avoid the issue of Reichsmark notes, which would at least tempo-rarily have swollen the note circulation of the Reichsbank. Under a decreeof 3rd May, modified by a decree of 15th May 1940, the central managementof the Reichskreditkassen was authorised to issue Reichskreditkassenscheinein denominations of 50, 20, 5, 2 and 1 Reichsmark as well as 50 Reichspfennigeand coins of 10 and 5 Reichspfennige against cover chiefly in the form of loansto the Reich, for which a maximum of RM 3 milliard was fixed. Total issues donot seem to have exceeded RM 1.7 milliard and it was semi-officially stated inJanuary 1941 that the circulation of Reichskreditkassenscheine had declinedby one-half since the autumn of 1940. The issue of coins has not beenof any practical importance. While Reichskreditkassenscheine were issuedto the German troops in Norway and Denmark and these notes weregiven the quality of legal tender, no Reichskreditkassen were actuallyopened in these two countries since in them the credit systems continuedto function with only slight interruption, and early arrangements were madewith the central banks for Reichskreditkassenscheine already issued to beexchanged and for the occupying authorities to be supplied with the necessarymeans of payment against crediting of Reichsmarks to the accounts of thesecountries with the Reichsbank. For practical reasons the exchange rates ofthe Reichskreditkassenscheine were at first fixed at 50 Reichspfennige for1 Danish crown and 60 Reichspfennige for 1 Norwegian crown, but later onthe ordinary quotations of the exchange markets were applied, as shownin the above table.
In Hol land, Belgium and France Reichskreditkassen were openedin May 1940 by the German authorities, but in each of these countriesarrangements were soon made to provide the German troops with the nationalcurrency. In Holland the Reichskreditkassen were closed by the middleof July, with the exception of the office in Amsterdam, which was retainedfor the task of liquidation and liaison. In Belgium the conditions were morecomplicated since in May 1940 the direction of National Bank of Belgiumhad moved abroad; a new Bank of Issue was established, which came intobeing on 15th July 1940. Since, however, the direction of the National Bankat that time returned to Brussels, it was decided that the new Bank ofIssue should employ the administration and the notes of the National Bank,the two institutions being under the same management and staffed by thesame personnel. The Reichskreditkassen were maintained as credit institutions
- 32 -
for the German military administration but the issue of new Reichskredit-kassenscheine was on a very limited scale. In France the activity of the Reichs-kreditkassen was likewise restricted upon the conclusion of an agreementwith the Bank of France after the armistice of 22nd June 1940.
In Hol land exchange restrictions had been introduced on 10th May1940, and on 24th June 1940 a comprehensive system of exchange controlwas imposed according to the German model. Private holdings of goldand foreign exchange were to be offered to the Nederlandsche Bank, whichby the end of November 1940 had acquired FI. 38 million in gold from privatehoards. In relation to Germany the exchange restrictions were graduallymade less rigid. From 1st November 1940 permission was given to transferfreely an amount of RM 5,000 per month per person ; in the early months of1941 increased capital transfers were permitted but a special tax of 70 percent, on immediate repatriations of capital was imposed to check a toovoluminous inward movement of funds. Then, from 1st April 1941, full freedom ofpayments was established between Holland and Germany, including the right tobring notes and other means of payment from one country to the other. TheDutch-German clearing ceased to operate as far as payments between thetwo countries were concerned but remained in force with regard to paymentsbetween Holland and third countries. The rate of FI. 100 = RM 132.70 wasmade applicable also to notes and coins, which are exchangeable at the officesof the central banks and a number of other institutions. The freedom fromrestrictions extends to the transfer of capital, but the "blocked mark tax"which had been imposed by the Dutch Government on repatriations of capitalinvestments in Germany was maintained, though with certain alleviations. Thistax, which is intended to compensate for the gain accruing to individualowners from the return of capital invested in Germany and to prevent a suddenand wholesale liquidation of such investments, was fixed as follows:
for transfers up to the end of 1941 : at 60 per cent.do. 1942: at 40 do.do. 1943: at 20 do.
with no tax for transfers from 1st January 1944.
In Belgium a clearing arrangement of 10th July 1940 replaced the pre-vious payments agreement between Belgium and Germany. The new Bank ofIssue, which acts as payments institution, has obtained from the BelgianMinistry of Finance a guarantee to the amount of B.fcs 1,000 million in orderto be in a position to pay promptly clearing claims of Belgian exporters toGermany.
In France the following rates govern the exchange value of the French franc:
(i) In relation to Germany the rate of RM 5 = Fr.fcs 100 (RM 1 = Fr.fcs 20)was originally fixed by the occupying authorities as the rate for the Reichs-kreditkassenscheine; it was afterwards maintained in the clearing arrangementconcluded in the middle of November 1940 between the Reich (includingBohemia and Moravia), on the one hand, and the occupied and unoccupied
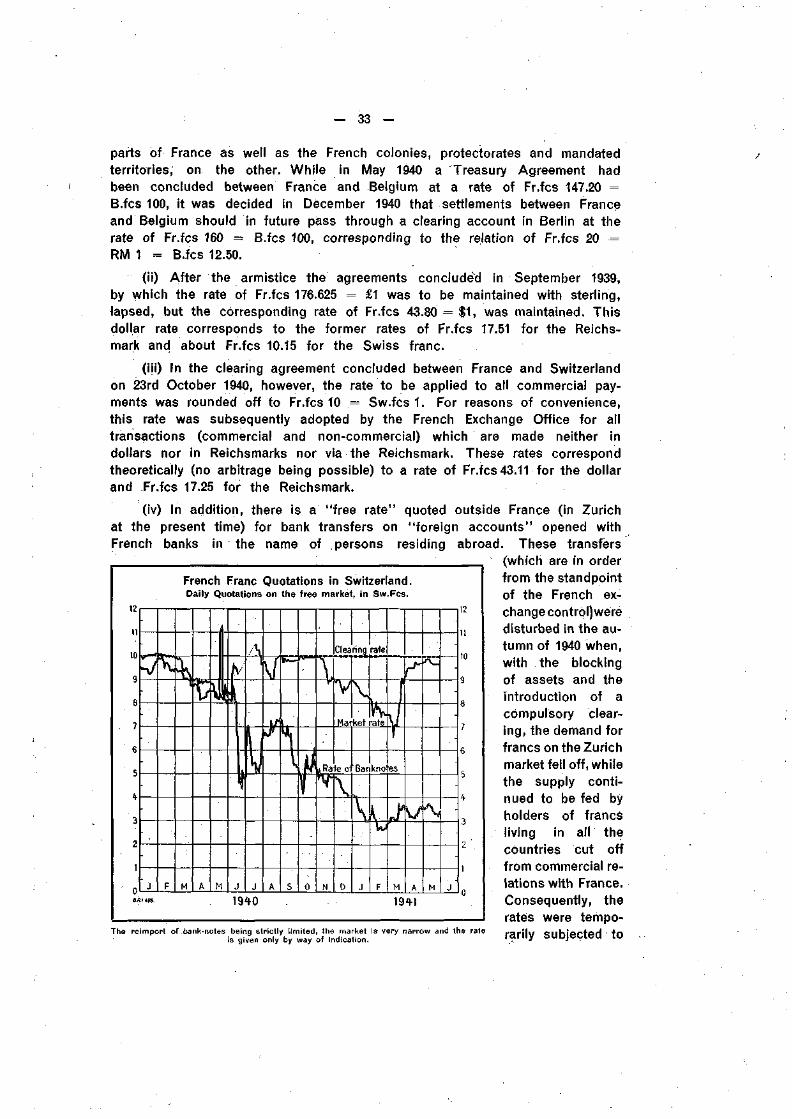
— 33 —
parts of France as well as the French colonies, protectorates and mandatedterritories, on the other. While in May 1940 a Treasury Agreement hadbeen concluded between France and Belgium at a rate of Fr.fcs 147.20 =B.fcs 100, it was decided in December 1940 that settlements between Franceand Belgium should in future pass through a clearing account in Berlin at therate of Fr.fcs 160 = B.fcs 100, corresponding to the relation of Fr.fcs 20 =RM 1 = B.fcs 12.50.
(ii) After the armistice the agreements concluded in September 1939,by which the rate of Fr.fcs 176.625 = £1 was to be maintained with sterling,lapsed, but the corresponding rate of Fr.fcs 43.80 = $1, was maintained. Thisdollar rate corresponds to the former rates of Fr.fcs 17.51 for the Reichs-mark and about Fr.fcs 10.15 for the Swiss franc.
(iii) In the clearing agreement concluded between France and Switzerlandon 23rd October 1940, however, the rate to be applied to all commercial pay-ments was rounded off to Fr.fcs 10 = Sw.fcsi . For reasons of convenience,this rate was subsequently adopted by the French Exchange Office for alltransactions (commercial and non-commercial) which are made neither indollars nor in Reichsmarks nor via the Reichsmark. These rates correspondtheoretically (no arbitrage being possible) to a rate of Fr.fcs 43.11 for the dollarand Fr.fcs 17.25 for the Reichsmark.
(iv) In addition, there is a "free rate" quoted outside France (in Zurichat the present time) for bank transfers on "foreign accounts" opened withFrench banks in the name of persons residing abroad. These transfers
(which are in orderfrom the standpointof the French ex-change control) weredisturbed in the au-tumn of 1940 when,with the blockingof assets and theintroduction of acompulsory clear-ing, the demand forfrancs on the Zurichmarket fell off, whilethe supply conti-nued to be fed byholders of francsliving in all thecountries cut offfrom commercial re-lations with France.Consequently, therates were tempo-
French Franc Quotations in Switzerland.Daily Quotations on the free market, in Sw.Fcs.
J F
r
M A
i
M
- I
hi
r
j A
\\
S
è-
0
Y
,,Ra
N
Clea
VMar
e o
\
D
ring
V
rate
• i ,
ket rate
8a t
\
j
kno
kXJ
/vres
Ï
M A
* \
M
-
-
-
-
J
1940
The reimport of bank-notes being strictly limited, the market is very narrow and the rate foi-ilw cnkiûr>fûH -fr*is qiven only by way of Indication. Tdniy bUDJCUlCU IU
— 34 —
a downward pressure. To remedy this, the French Government, adoptingmeasures similar to those applied in other countries, made an agreementwith the Swiss authorities to limit the transactions in "free" French francs onthe Swiss exchange market to persons residing in Switzerland. These measuresled to an immediate improvement of the free franc rates in Zurich, quotationsapproaching the official rate of Fr.fcs 10 = Sw.fcs 1.
(v) Another rate, subject to considerable fluctuation, is quoted for Frenchbank-notes, as in the case of other countries which have prohibited or limitedthe reimportation of their notes. It is not permissible to take more thanFr.fcs 1000 into France on each journey.
In actual practice the situation is, however, jess complicated than mightappear from the different rates indicated above. Commercial transactions takeplace either against or via the Reichsmark at the rate of Fr.fcs 20 == RM 1or against the Swiss franc at the rate of Fr.fcs 10,= Sw.fcs 1 (correspondingto Fr.fcs 17.25 = RM 1).
By force of circumstances, foreign exchange control was introduced inFrance in September 1939 when (in contrast to what happened in most countriesof Continental Europe) the franc had already undergone a substantial deprediation, namely in the spring of 1938 when the rate for sterling was establishedin the neighbourhood of Fr.fcs 175. When war broke out, French prices werestill below the level of world prices in free currencies and appreciably belowthose in European countries with exchange control. Subsequently prices rosein France, especially after the armistice* but the rise has been very unequaland, in particular, French agricultural prices have remained (in some cases50 per cent.) below the prices prevailing in neighbouring countries (calculatedaccording to the official exchange rates). These disparities naturally, give riseto problems which are of fundamental importance for the structure of theFrench economy and which, in present circumstances, are extremely difficultto solve, especially when account is taken of the desirability of avoiding anythingliable to prejudice the resumption of more extensive commercial relationswhen circumstances permit. . , ; ; .
The districts Eupen, Malmedy, and Moresne t were included! in theGerman currency system by a decree of 6th June 1940, the relevant rate ofexchange being fixed at B.fcsiO = RM1, i.e. the rate originally applied to theReichskreditkassenscheine in Belgium. In Luxemburg the Reichsmark wasmade legal tender by the side of the old currencies (the Belgian franc and theLuxemburg franc) by a decree of 26th August 1940, which fixed the rate ofLux.fcs 10 = RM1. From 29th January 1941 the Reichsmark alone was madelegal tender, Luxemburg being included in the German currency system.Lorraine and Alsace were at first subject to the monetary arrangementsmade with France, but on 9th August 1940 the Reichsmark was made legaltender in these provinces together with the French franc at the rate ofFr.fcs 20 = RM 1. In March 1941 the Reichsmark alone was declared legaltender and the two provinces were incorporated into the German currency system.To adjust the level of purchasing power to that of Germany, wages and
- 35 -
salaries were in general increased and commodity prices were allowed torise in sympathy with the increase in costs; rents for houses and landwere raised by about 50 per cent.
The clearing arrangements entered into by the Governor-Generalship ofPoland, Norway, Holland and Belgium provide for payments through accountskept at the German Clearing Institute (Verrechnungskasse) in Berlin ; andthese provisions apply both to the clearings between these four countriesin their relations with each other and to the clearings between any one ofthem and other countries in Europe. In fact the German Clearing Instituteenters as creditor and debtor in relation to the clearing institutes of thecountries concerned. The centralisation of the accounts for these four countriesmakes it possible to arrange more easily for a set t lement of balanceson a mul t i la tera l basis. In practice permission must be obtained for asurplus balance on one account to be utilised for payments on some otheraccount and, generally, the total of the amount which any one of thesecountries can utilise, is fixed in advance for a certain period, usually inconnection with commercial agreements.
Between other countries in Europe than the four just mentioned directclearings are in force without, as a rule, any provisions for settlement ofbalances in relation to third countries. Since, however, Germany holds apredominant position in the; trade of the continent of Europe, the accountswith Germany may afford the possibility of arranging for settlements betweena surplus on one account and a deficit on another; or Germany may, withinlimits, , allow a surplus in Reichsmarks to be utilised for payments to thirdcountries (as in the German-Bulgarian clearing). In the bilateral arrangementswhich are being, negotiated increased attention is given to the possibilities ofsettlement in relation to third parties.
The official rate of the L i ra, which had been reduced in September1939 by about 4 per cent, from $5.26Vt to $5.05= Lit. 100, has been maintainedat the latter rate except for a temporary deviation to $5.032 in the middle of1940, but at the end of May 1941 it was raised again to $5.26%. This raising ofthe lira rate on the dollar was followed by corresponding adjustments in the ratesof a number of other currencies (including the Reichsmark, the Swiss franc andthe Swedish crown), the result being a greater uniformity in the system ofrates and cross rates in relation to the lira and thus also in the Conti-nental exchange relations generally. Since May 1940 the ordinary "touristl ira" has been allowed only against the U.S. dollar (at the fate of $4.22 =Lit. 100), the Argentine peso and the Uruguayan peso. Under the Italian-Swiss Financial Agreements of 22nd June 1940 a "mixed l i ra" wasinstituted to ease the transfer of Swiss financial claims; the quotation ofthis type of lira, which under certain conditions may freely be used for alarge number of purposes, e.g. tourist expenses, stood at about Sw.fcs 17 =Lit. 100, i. e; some 20 per cent, below the official rate. Special accountsfor the requirements of tourists and other personal expenses are also
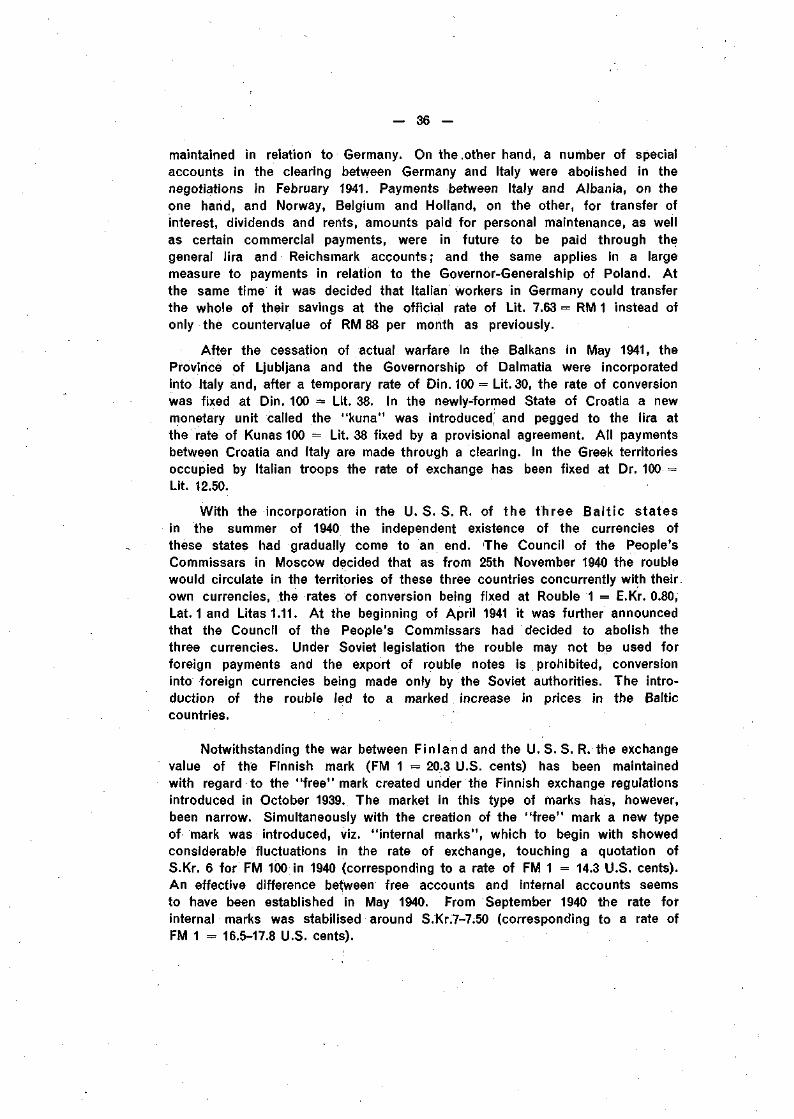
— 36 —
maintained in relation to Germany. On the .other hand, a number of specialaccounts in the clearing between Germany and Italy were abolished in thenegotiations in February 1941. Payments between Italy and Albania, on theone hand, and Norway, Belgium and Holland, on the other, for transfer ofinterest, dividends and rents, amounts paid for personal maintenance, as wellas certain commercial payments, were in future to be paid through thegeneral lira and Reichsmark accounts; and the same applies in a largemeasure to payments in relation to the Governor-Generalship of Poland. Atthe same time it was decided that Italian workers in Germany could transferthe whole of their savings at the official rate of Lit. 7.63 = RM 1 instead ofonly the countervalue of RM 88 per month as previously.
After the cessation of actual warfare in the Balkans in May 1941, theProvince of Ljubljana and the Governorship of Dalmatia were incorporatedinto Italy and, after a temporary rate of Din. 100 = Lit. 30, the rate of conversionwas fixed at Din. 100 = Lit. 38. In the newly-formed State of Croatia a newmonetary unit called the "kuna" was introduced! and pegged to the lira atthe rate of Kunas100 = Lit. 38 fixed by a provisional agreement. All paymentsbetween Croatia and Italy are made through a clearing. In the Greek territoriesoccupied by Italian troops the rate of exchange has been fixed at Dr. 100 =Lit. 12.50.
With the incorporation in the U. S. S. R. of the three Balt ic statesin the summer of 1940 the independent existence of the currencies ofthese states had gradually come to an end. The Council of the People'sCommissars in Moscow decided that as from 25th November 1940 the roublewould circulate in the territories of these three countries concurrently with theirown currencies, the rates of conversion being fixed at Rouble 1 = E.Kr. 0.80,Lat. 1 and Litas 1-11. At the beginning of April 1941 it was further announcedthat the Council of the People's Commissars had decided to abolish thethree currencies. Under Soviet legislation the rouble may not be used forforeign payments and the export of rouble notes is prohibited, conversioninto foreign currencies being made only by the Soviet authorities. The intro-duction of the rouble led to a marked increase in prices in the Balticcountries.
Notwithstanding the war between Finland and the U. S. S. R. the exchangevalue of the Finnish mark (FM 1 = 20.3 U.S. cents) has been maintainedwith regard to the "free" mark created under'the Finnish exchange regulationsintroduced in October 1939. The market in this type of marks has, however,been narrow. Simultaneously with the creation of the "free" mark a new typeof mark was introduced, viz. "internal marks", which to begin with showedconsiderable fluctuations in the rate of exchange, touching a quotation ofS.Kr. 6 for FM 100 in 1940 (corresponding to a rate of FM 1 = 14.3 U.S. cents).An effective difference between free accounts and internal accounts seemsto have been established in May 1940. From September 1940 the rate forinternal marks was stabilised around S.Kr.7-7.50 (corresponding to a rate ofFM 1 = 16.5-17.8 U.S. cents).
— 37 —
Finnish Mark Exchange in New York.Weekly Range of High and Low Quotations, in dollars.
0.024
0.022
0.020
0.018
0.016
0.01*
- •
v-
1 1 1 1 , 1 1 1 1 1 1
•
-
-
-
-
i :
1939 1940 1941
0.02*
0.022
0:020
0.018
0.016
0.01*
The internal marks areavailable only for certainpurposes and may not beemployed for payment ofFinnish exports (most com-mercial payments are madethrough clearings at officialrates). In November 1940the export of bank-noteswas forbidden. All hold-ings of foreign exchangemust now be remittedto the Bank of Finland,whereas previously theowner of such exchangewas allowed to retain thecountervalue of FM 5,000.
The import into Finland of Finnish bank-notes is not prohibited.
The exchange restrictions which had been introduced in Sweden duringFebruary 1940 were at first designed mainly to control capital movements but,as conditions turned more difficult in the spring, they were also used as ameans of import control. Later in the year, when the exchange market becameeasier, it was possible somewhat to soften the restrictions. While in thefirst four months of 1940 the combined holdings of gold and foreign exchangeof the Riksbank and the commercial banks fell by about S.Kr. 320 million(mainly because of payments for excess imports), the movement for theremainder of the year was in the opposite direction, the combined holdingsrising by about S.Kr. 120 million. In this latter period from May to December1940 the Riksbank acquired S.Kr. 255 million of foreign exchange, whilethe commercial banks reduced their holdings by S.Kr. 133 million. Thisreduction, which was most marked in the late autumn, would seem to havebeen due to fears that sales of Swedish assets in the United States would bemade subject to licence and possibly also that the Swedish crown would beraised in value in relation to the dollar. During the year there was, however,very little change in the quotations for any of the leading currencies. Afterthe conclusion of the Commerce and Payments Treaty between Swedenand the U. S. S. R. in September 1940 a clearing rate of S.Kr. 79.18 =Roubles 100 was fixed.
The year 1940 in Swi tzer land was characterised by unusually strongmovements on the foreign exchange market. During the first five and a halfmonths the National Bank, together with the Exchange Equalisation Fund,furnished the market with dollars to an equivalent of nearly Sw.fcs 500 million.In the main these dollars were required to pay for a heavy excess of importsand to supply the means of payment for future imports, but in part theyserved to meet withdrawals of funds owned by foreigners and, as the political
— 38 —
Situation became more unfavourable, to provide for the acquisition of dollarholdings on private account.
In the middle of June, when France opened negotiations with Germanyfor an armistice, funds suddenly began to return to the Swiss market andthe inward movement continued almost without interruption up to the endof the year, by which time the National Bank had added nearly Sw.fcs 650 mil-lion to its foreign exchange holdings. At first this movement was due princi-pally to the sale of dollars by commercial and industrial firms which no longerneeded that currency for payments abroad since imports from overseascountries had been largely cut off. Towards the end of the year there wasanother and more important reason for the massive repatriation of funds,viz. the fear that Swiss assets in the United States would be placed underthe régime of licences by the American Government. In the first quarter of1941 dollar funds still continued to be liquidated, the National Bank acquiringthe countervalue of about Sw.fcs 200 million.
When the National Bank had to provide dollars for the market in thespring of 1940, the question arose whether or not exchange restrictions shouldbe imposed. The authorities decided against such a measure, seeking asolution on other lines. . In order to prevent an undesirable outflow of fundsthe National Bank, in agreement with the Federal Department for Finance andCustoms, asked the banks on 10th May 1940 to limit their supplies of foreignexchange for industry and trade to the amounts needed for payments ofimports and foreign services, and in particular to abstain from the sale ofexchange for foreign investments. Thus, an informal arrangement between theNational Bank and the other banks took the place of official restrictions. Whenlater on in the year the National Bank had to acquire large amounts of dollars,it adopted the policy of demanding information as to the origin of the foreignexchange offered to it. The Bank was not interested in receiving unstableforeign funds and it was anxious to prevent blocked dollars from being liqui-dated through the Swiss market but it accepted all the exchange resultingfrom Swiss exports ór representing repatriation of funds in Swiss ownership.Notwithstanding the large increase in the National Bank's exchange holdingsthe arrangement limiting the outflow of funds was maintained in orderto keep the country's capital at the service of the Swiss economy.. Theinformal way in which contact — mostly by telephonic communication —is maintained between the National Bank and the other banks makes it easyto apply the principle agreed upon with all the desirable flexibility. Paymentsin connection with commercial transactions and remittances of dividends,interest and amortisation are free from all other restrictions than those inherentin the working of clearing arrangements or laid down in the Federal decreeof 6th July 1940, under which payments to creditors domiciled in Belgium,France, Luxemburg, Holland, Denmark and Norway must be made to theNational Bank. The same decree also places certain limitations upon the rightto dispose of assets held or managed in Switzerland for persons or firmsdomiciled in these six countries.
— 39 —
In the first five and a half months of the year the dollar rate remainedunchanged at Sw.fcs 4.457s = $1. In response to the subsequent inflow offunds the rate gradually went to Sw.fcs 4.30Vs, where it was held from October1940 to April 1941 except for some minor fluctuations in the last two monthsof 1940. The improvement in the dollar value of the Swiss franc affectedthe quotations of other currencies also ; the rate fixed in the Swiss-Germanclearing was reduced in October 1940 from Sw.fcs 175.44 to 173.01 = RM 100.On the other hand, the National Bank has kept its purchase price of goldunaltered at Sw.fcs 4,869.8 per kg. and has bought gold at that price fromforeign central banks and whenever the francs paid for the gold were to beused for settlement of commercial and other operations useful to the country.
The rate of exchange of the dollar in Spa in , which had been raisedfrom Pesetas 9.00 to Pesetas 9.90 = $1 in September 1939, moved slowlyupwards from. December 1939 to April 1940, when the dollar selling ratewas pegged at Pesetas 11.22. Arrangements having been made with theUnited Kingdom for the opening of special accounts for Spain, the free marketquotation for the peseta was discontinued in London as from 9th December1940 and replaced by the Bank of England clearing rates: an official rate ofPesetas at 40.50 = £1 and a so-called "voluntary rate" of 46.55. The formerrate is applied to commercial transactions and the latter to charitable andfamily remittances.
The foreign exchange regulations in Por tuga l , which may be tracedback to measures taken in 1914, were abolished in October 1937, since whenthe exchange market has been free from official restrictions. From 1932 to13th November 1939 the escudo was pegged to the pound sterling at the rateof Esc. 110 = £ 1 . On 14th November 1939 the escudo was related to the dollarat the maximum rate of Esc. 27.50 = $1, while the rate for the pound wasfixed at Esc. 108.25 = £1, but with certain supplementary provisions designedto attenuate the depreciation of the escudo in the event of a fall in thequotation of free sterling on the New York market. In the following monthsthe exchange value of the escudo moved between the value of free sterlingand the dollar. When the free sterling rate recovered in the summer theescudo was pegged to the pound as from 1st August at a rate ofEsc. 99.50-100.50 = £1, which corresponds to a dollar quotation of aboutEsc, 25 = $1. The exchange market is free from official restrictions but theBank of Portugal maintains contact with the commercial banks to ensurecollaboration with the general aims of the Bank's monetary policy.
In the United Kingdom the system of exchange control, introduced byan order of 25th August 1939, has been made more watertight and homo-geneous through a series of measures taken in the course of 1940, and at thésame time has moved towards a strict sectionalisation of the exchange market.Under the original provisions foreign owners of bank balances in sterling werein a large measure able to dispose of them in "free markets" and the"free sterling" which the purchasers acquired could be used to pay for suchBritish-area exports as did not fall under particular clearings and payments
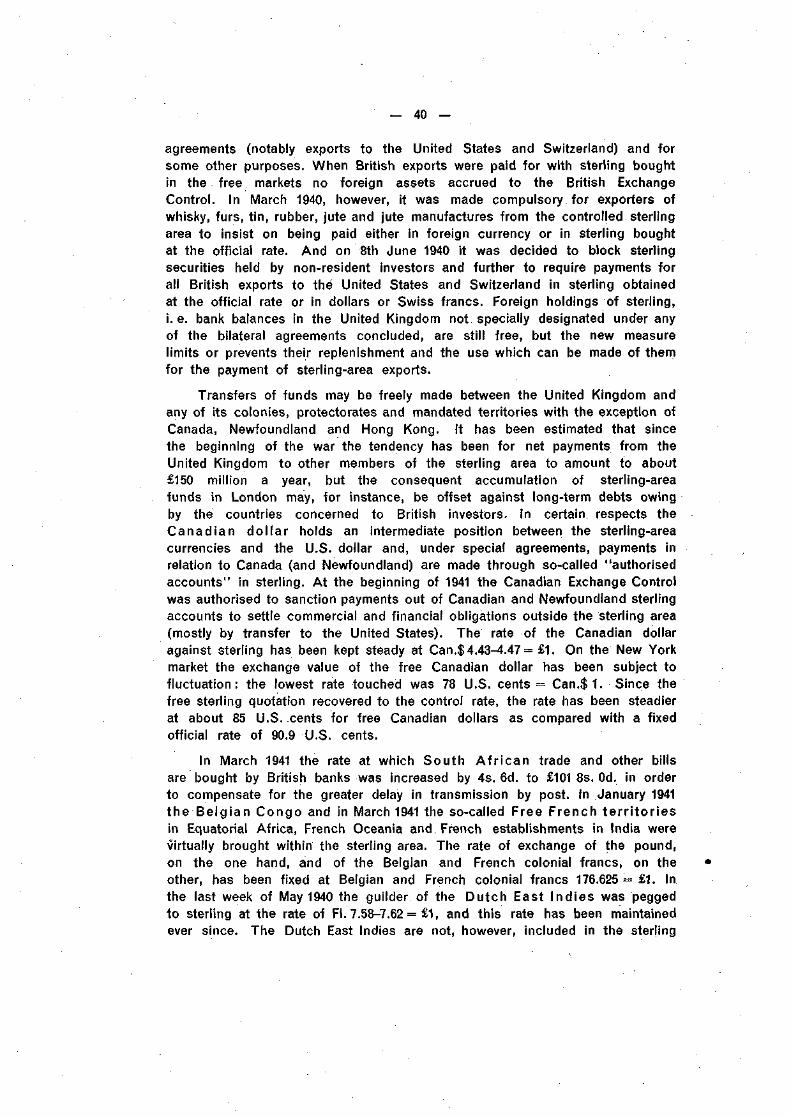
— 40 —
agreements (notably exports to the United States and Switzerland) and forsome other purposes. When British exports were paid for with sterling boughtin the free markets no foreign assets accrued to the British ExchangeControl. In March 1940, however, it was made compulsory for exporters ofwhisky, furs, tin, rubber, jute and jute manufactures from the controlled sterlingarea to insist on being paid either in foreign currency or in sterling boughtat the official rate. And on 8th June 1940 it was decided to block sterlingsecurities held by non-resident investors and further to require payments forall British exports to thé United States and Switzerland in sterling obtainedat the official rate or in dollars or Swiss francs. Foreign holdings of sterling,i.e. bank balances in the United Kingdom not specially designated under anyof the bilateral agreements concluded, are still free, but the new measurelimits or prevents their replenishment and the use which can be made of themfor the payment of sterling-area exports.
Transfers of funds may be freely made between the United Kingdom andany of its colonies, protectorates and mandated territories with the exception ofCanada, Newfoundland and Hong Kong. It has been estimated that sincethe beginning of the war the tendency has been for net payments from theUnited Kingdom to other members of the sterling area to amount to about£150 million a year, but the consequent accumulation of sterling-areafunds in London may, for instance, be offset against long-term debts owingby the countries concerned to British investors. In certain respects theCanadian dol lar holds an intermediate position between the sterling-areacurrencies and the U.S. dollar and, under special agreements, payments inrelation to Canada (and Newfoundland) are made through so-called "authorisedaccounts" in sterling. At the beginning of 1941 the Canadian Exchange Controlwas authorised to sanction payments out of Canadian and Newfoundland sterlingaccounts to settle commercial and financial obligations outside the sterling area(mostly by transfer to the United States). The rate of the Canadian dollaragainst sterling has been kept steady at Can.$4.43-4.47 = £1. On the New Yorkmarket the exchange value of the free Canadian dollar has been subject tofluctuation: the lowest rate touched was 78 U.S. cents = Can.$1. Since thefree sterling quotation recovered to the control rate, the rate has been steadierat about 85 U.S. cents for free Canadian dollars as compared with a fixedofficial rate of 90.9 U.S. cents.
In March 1941 the rate at which South A f r i can trade and other billsare bought by British banks was increased by 4s. 6d. to £101 8s. Od. in orderto compensate for the greater delay in transmission by post. In January 1941the Belgian Congo and in March 1941 the so-called Free French te r r i to r iesin Equatorial Africa, French Oceania and French establishments in India werevirtually brought within the sterling area. The rate of exchange of the pound,on the one hand, and of the Belgian and French colonial francs, on theother, has been fixed at Belgian and French colonial francs 176.625 = £1. Inthe last week of May 1940 the guilder of the Dutch East Indies was peggedto sterling at the rate of FI. 7.58-7.62 = £1, and this rate has been maintainedever since. The Dutch East Indies are not, however, included in the sterling
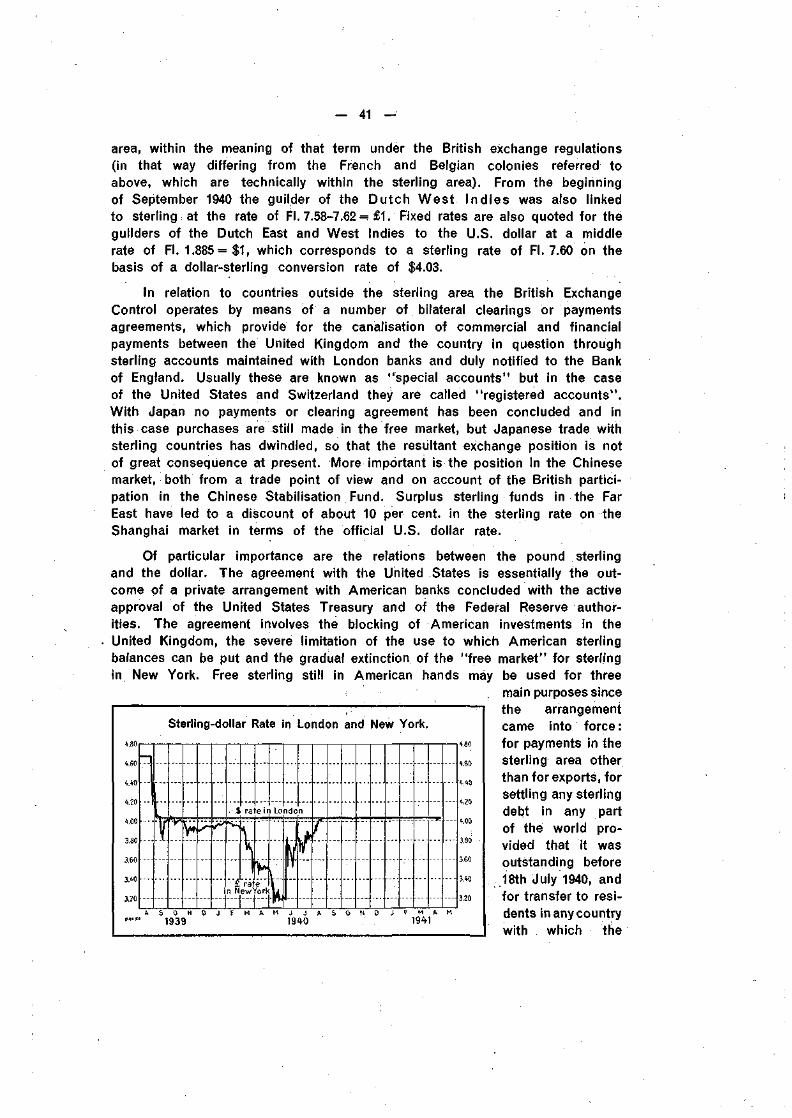
— 41 —
area, within the meaning of that term under the British exchange regulations(in that way differing from the French and Belgian colonies referred toabove, which are technically within the sterling area). From the beginningof September 1940 the guilder of the Dutch West Indies was also linkedto sterling at the rate of FI. 7.58-7.62 = £ 1 . Fixed rates are also quoted for théguilders of the Dutch East and West Indies to the U.S. dollar at a middlerate of FI. 1.885= $1, which corresponds to a sterling rate of FI. 7.6Û on thebasis of a dollar-sterling conversion rate of $4.03.
In relation to countries outside the sterling area the British ExchangeControl operates by means of a number of bilateral clearings or paymentsagreements, which provide for the canalisation of commercial and financialpayments between the United Kingdom and the country in question throughsterling accounts maintained with London banks and duly notified to the Bankof England. Usually these are known as "special accounts" but in the caseof the United States and Switzerland they are called "registered accounts".With Japan no payments or clearing agreement has been concluded and inthis case purchases are still made in the free market, but Japanese trade withsterling countries has dwindled, so that the resultant exchange position is notof great consequence at present. More important is the position in the Chinesemarket, both from a trade point of view and on account of the British partici-pation in the Chinese Stabilisation Fund. Surplus sterling funds in the FarEast have led to a discount of about 10 per cent, in the sterling rate on theShanghai market in terms of the official U.S. dollar rate.
Of particular importance are the relations between the pound sterlingand the dollar. The agreement with the United States is essentially the out-come of a private arrangement with American banks concluded with the activeapproval of the United States Treasury and of the Federal Reserve author-ities. The agreement involves the blocking of American investments in theUnited Kingdom, the severe limitation of the use to which American sterlingbalances can be put and the gradual extinction of the "free market" for sterlingin New York. Free sterling still in American hands may be used for three
main purposes sincethe arrangementcame into force :for payments in thesterling area otherthan for exports, forsettling any sterlingdebt in any partof thé world pro-vided that it wasoutstanding before18th July 1940, andfor transfer to resi-dents in any countrywith which the
Sterling-dollar Rate in London and New York.4.80
4.20
4.00
3.60
3.40
3.20
—1
1 —
:
• - . $ rate ir
\
y£ rate
n NewYork
1
London
\
Wfy
... ... ......
SON1939
3.80
3.40
M J J A S O N1940 1941
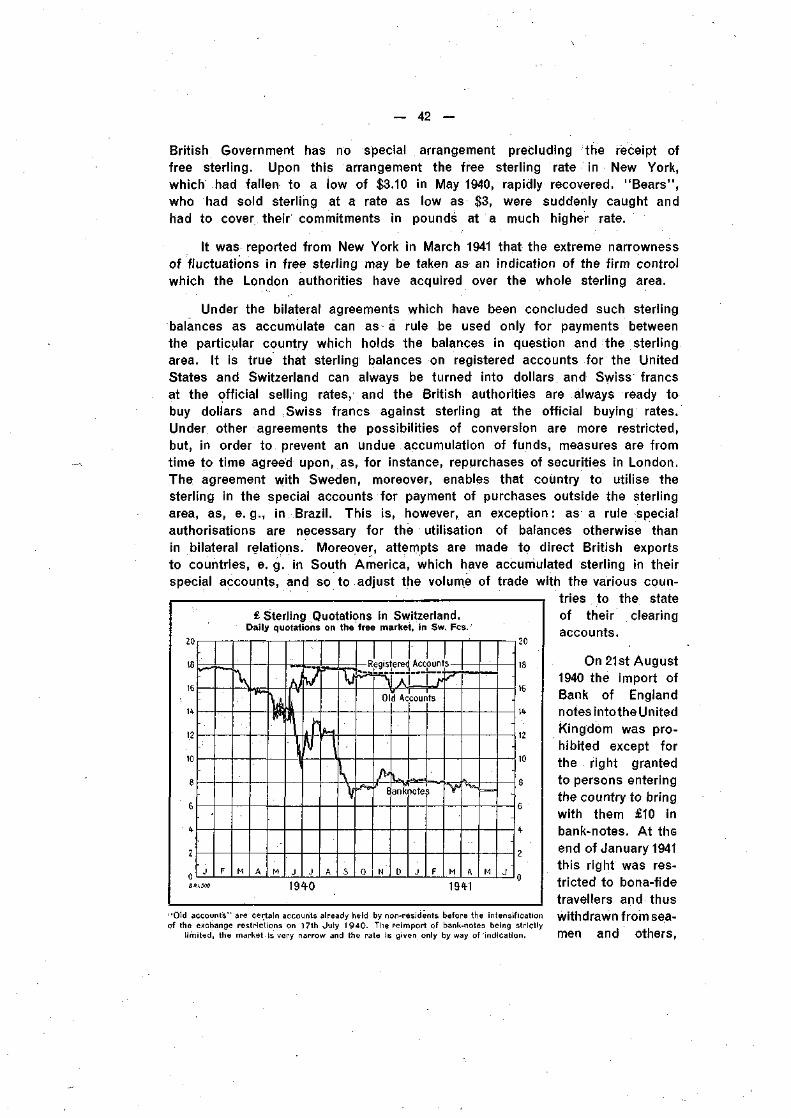
42 —
British Government has no special arrangement precluding the receipt offree sterling. Upon this arrangement the free sterling rate in New York,which had fallen to a low of $3.10 in May 1940, rapidly recovered. "Bears",who had sold sterling at a rate as low as $3, were suddenly caught andhad to cover their commitments in pounds at a much higher rate.
It was reported from New York in March 1941 that the extreme narrownessof fluctuations in free sterling may be taken as an indication of the firm controlwhich the London authorities have acquired over the whole sterling area.
Under the bilateral agreements which have been concluded such sterlingbalances as accumulate can as a rule be used only for payments betweenthe particular country which holds the balances in question and the sterlingarea. It is true that sterling balances on registered accounts for the UnitedStates and Switzerland can always be turned into dollars and Swiss francsat the official selling rates, and the British authorities are always ready tobuy dollars and Swiss francs against sterling at the official buying rates.Under other agreements the possibilities of conversion are more restricted,but, in order to prevent an undue accumulation of funds, measures are fromtime to time agreed upon, as, for instance, repurchases of securities in London.The agreement with Sweden, moreover, enables that country to utilise thesterling in the special accounts for payment of purchases outside the sterlingarea, as, e.g., in Brazil. This is, however, an exception: as a rule specialauthorisations are necessary for the utilisation of balances otherwise thanin bilateral relations. Moreover, attempts are made to direct British exportsto countries, e. g. in South America, which have accumulated sterling in theirspecial accounts, and so to adjust the volume of trade with the various coun-
tries to the stateof their clearingaccounts.
£ Sterling Quotations in Switzerland.Daily quotations on the free market, in Sw. Fes.
-
-
- .
•
-
j F
\
M A
h
M
- I '
r!
H
A
\
V
s
— R
0
pgis
0
A1 B
N
prer1
d Ac
Vank
D
Accniint
1 r:our
a-siote
j
ts
5
F
s —
S*
M
\ =
A
—
M
-
-
-
-
-
-
J
1940 1941
20
18
16
14
12
10
8
6
4-
2
0
"Old accounts" are certain accounts already held by non-residents before the intensificationof the exchange restrictions on 17th July 1940. The reimport of bank-notes being strictly
limited, the market is very narrow and the rate is given only byway of indication.
On 21st August1940 the import ofBank of Englandnotes intothe UnitedKingdom was pro-hibited except forthe right grantedto persons enteringthe country to bringwith them £10 inbank-notes. At theend of January 1941this right was res-tricted to bona-fidetravellers and thuswithdrawn from sea-men and others,
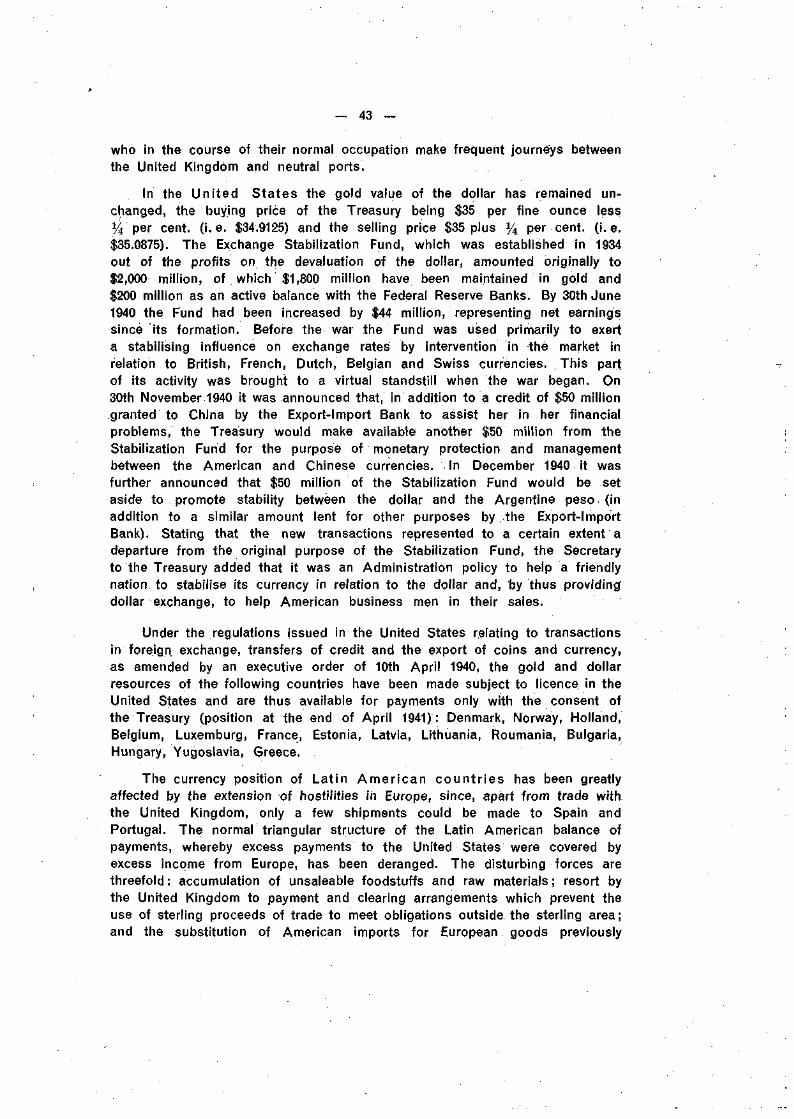
— 43 —
who in the course of their normal occupation make frequent journeys betweenthe United Kingdom and neutral ports. .
In the United States the gold value of the dollar has remained un-changed, the buying price of the Treasury being $35 per fine ounce less% per cent. (i.e. $34.9125) and the selling price $35 plus % per cent. ( i .e.$35.0875). The Exchange Stabilization Fund, which was established in 1934out of the profits on the devaluation of the dollar, amounted originally to$2,000 million, of which $1,800 million have been maintained in gold and$200 million as an active balance with the Federal Reserve Banks. By 30th June1940 the Fund had been increased by $44 million, representing net earningssince its formation. Before the war the Fund was used primarily to exerta stabilising influence on exchange rates by intervention in the market inrelation to British, French, Dutch, Belgian and Swiss currencies. This partof its activity was brought to a virtual standstill when the war began. On30th November 1940 it was announced that, in addition to a credit of $50 milliongranted to China by the Export-Import Bank to assist her in her financialproblems, the Treasury would make available another $50 million from theStabilization Fund for the purpose of monetary protection and managementbetween the American and Chinese currencies. In December 1940 it wasfurther announced that $50 million of the Stabilization Fund would be setaside to promote stability between the dollar and the Argentine peso (inaddition to a similar amount lent for other purposes by the Export-ImportBank). Stating that the new transactions represented to a certain extent adeparture from the original purpose of the Stabilization Fund, the Secretaryto the Treasury added that it was an Administration policy to help a friendlynation to stabilise its currency in relation to the dollar and, by thus providingdollar exchange, to help American business men in their sales.
Under the regulations issued in the United States relating to transactionsin foreign exchange, transfers of credit and the export of coins and currency,as amended by an executive order of 10th April 1940, the gold and dollarresources of the following countries have been made subject to licence in theUnited States and are thus available for payments only with the consent ofthe Treasury (position at the end of April 1941): Denmark, Norway, Holland,Belgium, Luxemburg, France, Estonia, Latvia, Lithuania, Roumania, Bulgaria,Hungary, Yugoslavia, Greece.
The currency position of Latin Amer ican count r ies has been greatlyaffected by the extension of hostilities in Europe, since, apart from trade withthe United Kingdom, only a few shipments could be made to Spain andPortugal. The normal triangular structure of the Latin American balance ofpayments, whereby excess payments to the United States were covered byexcess income from Europe, has been deranged. The disturbing forces arethreefold: accumulation of unsaleable foodstuffs and raw materials; resort bythe United Kingdom to payment and clearing arrangements which prevent theuse of sterling proceeds of trade to meet obligations outside the sterling area;and the substitution of American imports for European goods previously
— 44 —
imported. There are, however, some counterbalancing factors: the increaseddemand by the United States for "strategic", "critical" and other materialsof Latin American origin; credits granted by the U. S. Export-Import Bankand Stabilization Fund, through which about $250 million have been madeavailable to Latin America; foreign investments in Latin American countries,and for some of these countries an important inflow of refugee funds, amount-ing to at least $60 million for the Argentine and Brazil (together) and at least$20 million for Mexico. As a result of these various movements the Argentine,Brazil and Mexico, as well as some of the other countries, have even beenable to strengthen their monetary reserves, while others have been subjectto great strain. In Ecuador, Paraguay and Venezuela new exchange restrictionswere imposed during 1940; in Venezuela, Peru and Bolivia the currenciesdepreciated on balance in terms of the U.S. dollar; but by the end of theyear the exchange position was as a rule well in hand.
For the Argen t ine three official exchange rates have been maintained:an official buying rate of Pesos 3.36 for the U.S. dollar and two official selling,rates of Pesos 3.73 and 4.23 for goods considered essential, divided into twocategories. Exchange for most other products is sold by auction, under regul-ations issued in February 1941, importers submitting bids to the central bankand the exchange going to the highest bidder, the rate varying therefore witheach transaction. It was stated that this plan would permit the eliminationof all exchange quotas applying to specific commodities other than thoseprovided for in trade conventions with foreign countries. In April 1940 ithad been decided to base the free market quotation of sterling on the fixedrelationship of $4.02= £1. At the end of 1940 a triangular payments agreementwas concluded between Paraguay, the United Kingdom and the Argentine bywhich it was made possible for Paraguay to obtain Argentine pesos (virtuallythe only currency used in the country for international transactions) in returnfor sterling balances. In February 1941 a more drastic form of exchange controlwas introduced to counteract the results of adverse trade developments andexchange speculation.
Official and market rates quoted for the U.S. dollar in Brazil haveremained stable since the spring of 1939 despite the disappearance of importantmarkets for coffee on the continent of Europe. An agreement between coffee-producing Latin American countries and the Uhited States (see page 61),credits from the Export-Import Bank partly for industrial investments, and aninflow of refugee funds estimated to have reached an amount of at least$25 million, have helped to sustain the exchange position. In July 1940 anagreement was concluded with regard to the transfer of dividends, under which$13.9 million and £1.6 million will be transferred within four years. In themiddle of May 1940 the Bank of Brazil blocked the deposits of all Europeancountries, with the exception of Great Britain, France and Portugal, but onthe 30th of the same month the Bank of Brazil instructed the banks to freedeposits and to resume exchange operations with nationals of Europeancountries, exclusive of Norway, Denmark, Holland, Belgium, Poland,Çzecho-Slovakia and Luxemburg.
— 45 —
In Chi le , Colombia and Uruguay official dollar quotations remainedunchanged all through 1940. From time to time difficulties in providing foreignexchange were experienced ; exchange controls were reinforced, especially inColombia, but further depreciations of the currencies were avoided. InNovember an Anglo-Chilean payments agreement was concluded covering allcommercial and financial settlements between Chile and the sterling area.Sterling rates are to be determined through the cross quotation of the Londongold price and the dollar rate in Chile. In Bo l iv ia , after a decline in théexchange value in the spring of 1940, the currency was attached to the dollarat a rate of Bs.40 = $1 for necessary imports, and for other imports at a com-pensation rate of Bs. 55. In Peru, also, after a weakness of the exchange inthe spring, the dollar has been maintained since May 1940 at a rate of Sols 6.50= ' $ 1 . Peru has no exchange restrictions but has strengthened her tradeposition by imposing duties on luxuries and some other commodities. InVenezuela, where the currency had been held at very nearly its 1929gold value up to the end of 1939, a 20 per cent, depreciation occurred inthe latter half of 1940; the free exchange market was abolished and a strictcontrol imposed on imports and foreign exchanges. A credit was obtainedfrom the National City Bank of New York, whereupon the exchangequotas allowed for imports were increased by about 50 per cent. After asudden weakness of the exchange position in Ecuador exchange control wasre-established in June 1940 and control over imports in October; by the endof the year the decline had been recovered and in December the dollar ratewas fixed at Sucres 14.8 for purchases and Sucres 15 for sales.
The Mexican peso, after a pronounced weakness in the first half of1940, became strong in the autumn when, as a result of fears that the UnitedStates woujd participate in the war, dollars were sold on the free market, theBank of Mexico buying these dollars at a rate of Pesos 4.85 = $1. The heavyinflux of capital has strengthened the reserves of the Bank of Mexico andenabled the country to abstain from the imposition of exchange control. InCuba the peso was selling at a discount of about 9 per cent, against thedollar at the beginning of 1941, i.e. much the same rate as a year earlier.No exchange restrictions are in force and the same applies to the D o m i n i c a nR e p u b l i c , El S a l v a d o r , G u a t e m a l a , Ha i t i and Panama.
Far Eastern Currencies. The Japanese yen has continued to bepegged to the U.S. dollar at a rate of Yen 100 = $23.44. This was the rateadopted in October 1939 after the yen had abandoned its link with sterlingin the previous month and depreciated by 14 per cent., i. e. to the same extentas the official sterling rate. No payments or clearing agreement having beenconcluded between Japan and the United Kingdom, the market quotations forsterling against the yen have fluctuated in sympathy with the free sterlingrate in New York, attaining to an average of 1s. 5d. in May 1940 and return-ing to 1s. 2d. in the following August, since when the sterling rate hasremained unchanged. In addition to the circulation of the Bank of Japan,yen notes are issued by the Bank of Chosen and the Bank of Taiwan. The
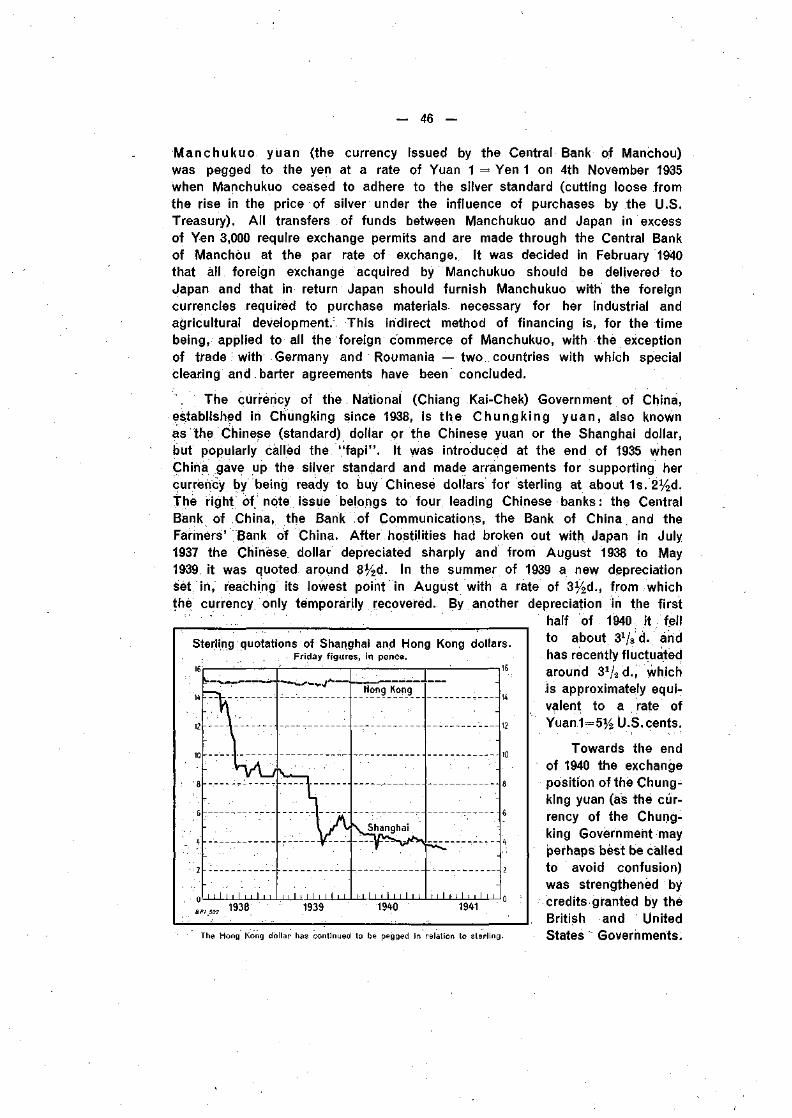
— 46 —
Manchukuo yuan (the currency issued by the Central Bank of Manchou)was pegged to the yen at a rate of Yuan 1 = Yen 1 on 4th November 1935when Manchukuo ceased to adhere to the silver standard (cutting loose fromthe rise in the price of silver under the influence of purchases by the U.S.Treasury). All transfers of funds between Manchukuo and Japan in excessof Yen 3,000 require exchange permits and are made through the Central Bankof Manchou at the par rate of exchange. It was decided in February 1940that all foreign exchange acquired by Manchukuo should be delivered toJapan and that in return Japan should furnish Manchukuo with the foreigncurrencies required to purchase materials necessary for her industrial andagricultural development. This indirect method of financing is, for the timebeing, applied to all the foreign commerce of Manchukuo, with the exceptionof trade : with Germany and Roumania — two countries with which specialclearing and barter agreements have been concluded.
The currency of the National (Chiang Kai-Chek) Government of China,established in Chungking since 1938, is the Chungking yuan, also knownäs the Chinese (standard) dollar or the Chinese yuan or the Shanghai dollar,but popularly called the "fapi" . It was introduced at the end of 1935 whenChina'.gave' up the silver standard and made arrangements for supporting hercurrency by being ready to buy Chinese dollars for sterling at about 1s. 2%d.The right of note issue belongs to four leading Chinese banks: the CentralBank of China, the Bank of Communications, the Bank of China and theFarmers' Bank of China. After hostilities had broken out with Japan in July1937 the Chinese dollar depreciated sharply and from August 1938 to May1939 it was quoted around 8%d. In the summer of 1939 a new depreciationset in, reaching its lowest point in August with a rate of 3%d., from whichthe currency only temporarily recovered. By another depreciation in the first
half of 1940 i t : fellto about 31/8 d. andhas recently fluctuatedaround 372 d., whichis approximately equi-valent to a rate ofYuan 1=5y2 U.S.cents.
Sterling quotations of Shanghai and Hong Kong dollars.Friday figures, in pence.
16r ^ — — r — 1 : : 1 — —116
—v
-.
- -
1 1 1 1 1 1 1 ! 1 I 1 1 1 1 1 1 1 1 1 f 11
Hong Kong
\_Shanghai
i i 1 i i 1 i i 1 it
•
; •
• -
1 1 1 M 1 M 1 1
1 9 3 8 1939 1940 1941
The Hong Kong dollar has continued to be pegged In relation to sterling.
Towards the endof 1940 the exchangeposition of the Chung-king yuan (as the cur-rency of the Chung-king Government mayperhaps best be calledto avoid confusion)was strengthened bycredits granted by théBritish and UnitedStates Governments.
- 47 -
Thus the British arranged for a loan of £10 million of which one halfwas for purchases of war materials and the other half for exchange sup-port (the new £5 million credit being additional to the £5 million guaranteegiven by the British Government in 1939); the American loan was to theamount of $100 million ($50 million from the Export-Import Bank and$50 million from the Stabilization Fund for exchange support). Exchangeagreements were signed on 25th April 1941 between China, on the one hand,and the United States and the United Kingdom, on the other. The agree-ments provide for the establishment by China of a Stabilisation Fund, whichwill be managed by a Stabilisation Board to be set up by the ChineseGovernment. The Board will consist of five members, comprising threeChinese nationals, an American appointed by China upon the recommendationof the Secretary of the U.S. Treasury, and a British national appointed uponthe recommendation of the British Treasury. j >
Between the Japanese yen, on the one hand, and the Chungking yuan,on the other, a kind of monetary warfare has arisen. No fewer than fournew banks of issue have been established with the aid of Japan since 1937,namely: (i) the Central Bank of Inner Mongolia, established at Changchiakou(Kalgan) in 1937; (ii) the North China Federal Reserve Bank, established atPeiping in 1938; (Hi) the Hua-Hsing Commercial Bank, established at Shanghaiin 1939; and (iv) the Central Reserve Bank, established at Nanking in 1940.
The Central Bank of Inner Mongol ia was established in 1937 bythe; three autonomous governments of Inner Mongolia, which each subscribedYuan 4 million to its capital (one-quarter being paid up). The currency issuedis known as theMengku yuan ; it is theoretically linked, at par, to the Manchukudyuan but in practice follows the rate of the Chungking yuan. Other foreigncurrencies than the yen and its satellites are acquired when necessary throughthe Chungking yuan in the Tientsin market. In general the capital neededin Inner Mongolia has for a long time been obtained from thè Tientsin-Peiping area and the financing of the country's foreign trade has mainlybeen in the, hands of foreign banks in that area. One of the reasons forthe introduction of exchange restrictions and control of foreign trade in thesummer of 1940 was the desire to make Inner Mongolia more independentof foreign financial influences. ;
The North China Federal Reserve Bank was established inMarch 1938 as a bank of issue for the three provinces Shantung, Stiansiand Hopeh At that time these provinces were governed by the so-callëd"Provisional Government", but from the autumn of 1940 (when the NationalGovernment of Wang Ching-Wei was established in Nanking) they cameunderi the control of the "Political Committee of North China'1. The Bankhas : a capital of Yuan 50 million, of which Yuan 25 million has beenpaid up, one half by the government and the other half by eight Chinesebanks. The amount subscribed by the government was advanced by théYokohama Specie Bank, the Bank of Chosen and the Industrial Bank of Japan;In order to maintain the exchange value of the yuan of North China (usuallycalled the Tientsin yuan) an Exchange Equalisation Fund was established and
— 48 —
provided with a credit of Yen 100 million from a syndicate of fourteen Japanesebanks. The Tientsin yuan is theoretically linked to the Japanese yen, but inpractice its exchange value has been affected by the movements of theChungking yuan. In the spring of 1940 it was even more depreciated thanthe latter, but a recovery set in, so that on 5th June Tientsin Yuan 90 wereequal to Chungking Yuan 100. This improvement is reported to have beenpartly due to the prohibition to import goods without utilising exchange notes(a measure by which the activity of European banks in financing foreign tradewith the aid of the Chungking yuan has been largely arrested) and partly tothe agreement concluded with the administrative authority of the InternationalConcessions in Tientsin as to the disposal of Yuan 52,993,000 in silver. Theimprovement has continued: on.6th February 1941 Tientsin Yuan 78.25 were equalto Chungking Yuan 100 on the Shanghai exchange market. The Tientsin yuanis the only currency accepted for customs payments in the three Northern Provinces.
The Hua-Hsing Commercial Bank in Shanghai was established inMay 1939, by the predecessor of the Wang Ching-Wei Government in Nanking,with a capital of Yuan 50 million — one half subscribed by the governmentand the other half by six Japanese banks. The original intention was to create abank of issue which would eventually develop into a central bank for the wholeof China. The Hua-Hsing yuan was at first aligned at par with the Chungkingyuan but, when the latter depreciated'in the summer of 1939, it was stabilisedat a rate of Hua-Hsing Yuan 1 = 6d. It thus appreciated in terms of the Chung-king yuan, and on 6th February 1941 it was quoted at a rate of Hua-Hsing Yuan 1 =Chungking Yuan 1.79. The Hua-Hsing yuan was, however, of little use inexport trade. Its total circulation is reported to have been only about Yuan6 million, compared with a total note circulation of Yuan 600 million in theShanghai area. When the new central bank was opened in Nanking at thebeginning of 1941, the Hua-Hsing Commercial Bank was deprived of its noteissue privilege and is to operate in future exclusively as a commercial bank.
The Central Reserve Bank in Nanking was constituted by theNational (Wang Ching-Wei) Government after its formation in 1940, the bankopening on 6th January 1941. Its capital of Yuan 100 million has been sub-scribed entirely by the government, and the Minister of Finance is the Governorof the bank.
The currency unit in which the new bank issues its notes is called theNanking Central Reserve Bank yuan, which has been given the same valueas the Chungking yuan. It was announced on the date of the opening of thenew bank that the head office had issued Yuan 7 million in exchange for" fapi" , i. e. the currency of the Chungking Government, which the NankingGovernment opposes. In the beginning the new bank was prepared to exchangethe " fap i " notes of the Chungking Government, unconditionally and withoutdiscrimination, against its own; but as a first exception the notes of theFarmers' Bank were excluded. Then on 8th February 1941 the following modifi-cations were made: all notes issued before 1939 by the Central Bank ofChina, the Bank of China and the Bank of Communications were to be con-vertible into Nanking Central Reserve Bank notes, except the denominations
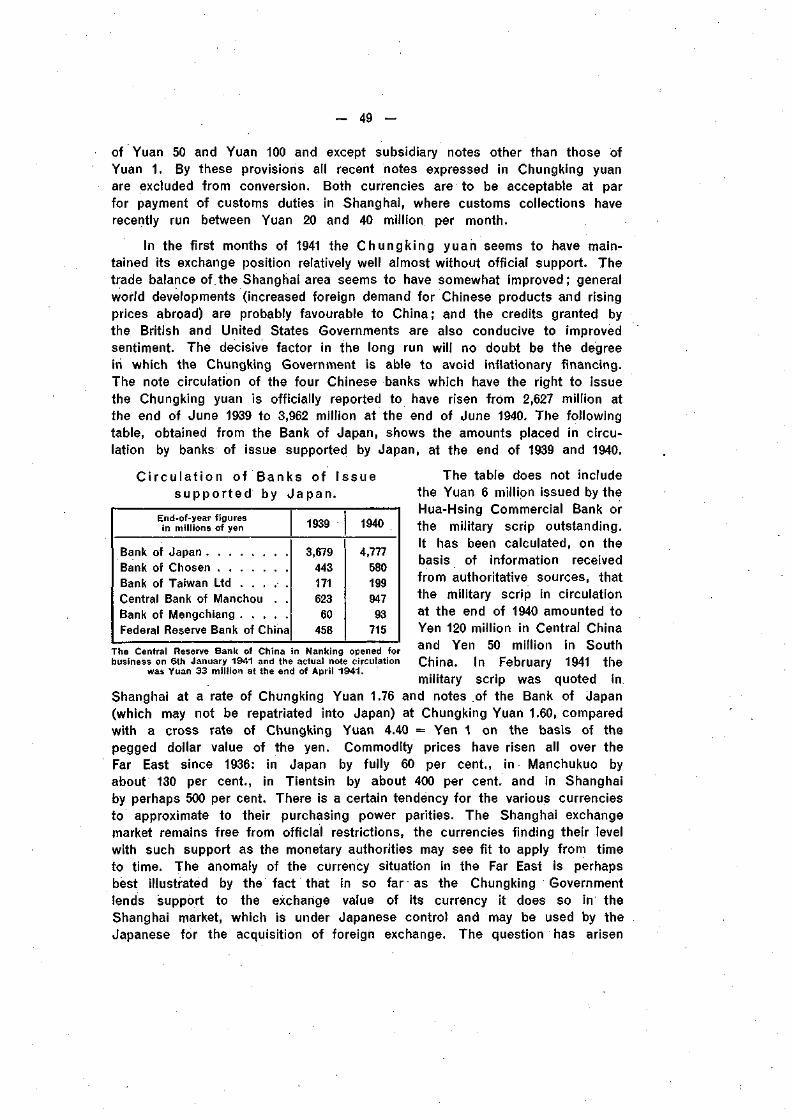
- 49 -
of Yuan 50 and Yuan 100 and except subsidiary notes other than those ofYuan 1. By these provisions all recent notes expressed in Chungking yuanare excluded from conversion. Both currencies are to be acceptable at parfor payment of customs duties in Shanghai, where customs collections haverecently run between Yuan 20 and 40 million per month.
In the first months of 1941 the Chungk ing yuan seems to have main-tained its exchange position relatively well almost without official support. Thetrade balance of the Shanghai area seems to have somewhat improved; generalworld developments (increased foreign demand for Chinese products and risingprices abroad) are probably favourable to China; and the credits granted bythe British and United States Governments are also conducive to improvedsentiment. The decisive factor in the long run will no doubt be the degreein which the Chungking Government is able to avoid inflationary financing.The note circulation of the four Chinese banks which have the right to issuethe Chungking yuan is officially reported to have risen from 2,627 million atthe end of June 1939 to 3,962 million at the end of June 1940. The followingtable, obtained from the Bank of Japan, shows the amounts placed in circu-lation by banks of issue supported by Japan, at the end of 1939 and 1940.
C i r c u l a t i o n of Banks of Issues u p p o r t e d by Japan .
End-of-year figuresin millions of yen
Bank of Japan
Bank of Chosen
Bank of Taiwan Ltd . . . . .
Central Bank of Manchou . .
Bank of Mengchiang
Federal Reserve Bank of China
1939
3,679
443
171
623
60
458
1940
4,777
580
199
947
93
715
The Central Reserve Bank of China in Nanking opened forbusiness on 6th January 1941 and the actual note circulation
was Yuan 33 million at the end of April 1941.
The table does not includethe Yuan 6 million issued by theHua-Hsing Commercial Bank orthe military scrip outstanding.It has been calculated, on thebasis of information receivedfrom authoritative sources, thatthe military scrip in circulationat the end of 1940 amounted toYen 120 million in Central Chinaand Yen 50 million in SouthChina. In February 1941 themilitary scrip was quoted in
Shanghai at a rate of Chungking Yuan 1.76 and notes of the Bank of Japan(which may not be repatriated into Japan) at Chungking Yuan 1.60, comparedwith a cross rate of Chungking Yuan 4.40 = Yen 1 on the basis of thepegged dollar value of the yen. Commodity prices have risen all over theFar East since 1936: in Japan by fully 60 per cent., in Manchukuo byabout 130 per cent., in Tientsin by about 400 per cent, and in Shanghaiby perhaps 500 per cent. There is a certain tendency for the various currenciesto approximate to their purchasing power parities. The Shanghai exchangemarket remains free from official restrictions, the currencies finding their levelwith such support as the monetary authorities may see fit to apply from timeto time. The anomaly of the currency situation in the Far East is perhapsbest illustrated by the fact that in so far as the Chungking Governmentlends support to the exchange value of its currency it does so in theShanghai market, which is under Japanese control and may be used by theJapanese for the acquisition of foreign exchange. The question has arisen
- 50 -
whether or not the Chungking Government could and should limit its supportto areas effectively under its control or whether it should continue to sustainconfidence in its currency by support on the Shanghai market also. At the timeof writing it is not known whether the new Stabilisation Board, set up bythe Chungking Government in connection with the credits granted by theBritish and United States Governments, has as yet come to a decision onthis point.
On the Shanghai exchange market foreign currencies may be boughtwithout any questions being asked as to the purpose of the transaction,whether it is for commercial or financial settlements or to effect a flight ofcapital. The same freedom from restrictions appertains to the U.S. dollar,the Mexican peso and certain other Latin American currencies. In Europefree exchange markets are found in Portugal and Switzerland, but in boththese countries the central banks have come to informal arrangements withthe private banks to prevent, in particular, a flight of capital. Systems of exchangecontrol and the application of fixed rates in clearing and payments agreementsmore and more exclude arbitrage operations and quotations of forward rates. Theforeign exchange markets no longer provide sensitive indexes of variations ineconomic tendencies and in capital movements, as was the case in the past.Under the strain of the present war emergency, however, important changesoccur in the cost and price structure, in the volume of money and the foreigntrade position of almost every country; and it is inevitable that, beneath theapparent stability, seeds of maladjustment are sown which sooner or later willaffect the relationship between the different currencies. For the moment it iscertainly not easy to determine what should be regarded as true equilibrium rates.When trade is virtually cut off between countries (as, for instance, between mostEuropean countries and the United States) the relative levels of costs and pricesare not of any immediate importance. Even when commercial relations aremaintained widely divergent tendencies often occur in the prices of importedand exported goods unequally affected by high transportation costs and anumber of other factors; these divergences may have an important thoughperhaps only transitory influence on the terms of trade. Many of the exceptionalfactors which at present affect the balances of payments will no doubt dis-appear when foreign trade resumes its peaceful course. Apart from structuralchanges, about which it is difficult to generalise, it will probably be foundthat such cost elements as wages and salaries, because of their resistanceto a downward adjustment, will have a decisive effect on the future intrinsicvalue of the various currencies.
2. FOREIGN TRADE.
Since in modern warfare measures of blockade and counter-blockade (large-scale applications of the ancient methods of siege) are designed to interruptthe foreign trade of the opponents, it is natural to find the publication ofcommercial statistics reduced to a minimum. For some countries, e.g. Belgium,
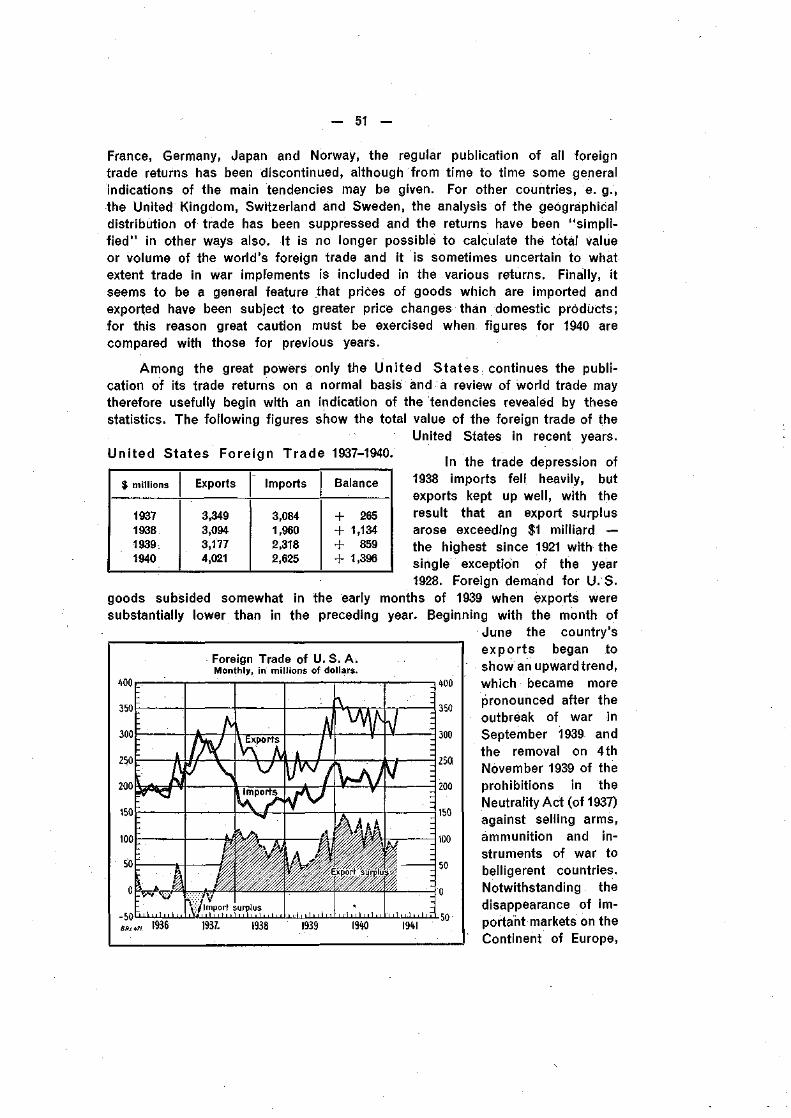
— 51 —
France, Germany, Japan and Norway, the regular publication of all foreigntrade returns has been discontinued, although from time to time some generalindications of the main tendencies may be given. For other countries, e. g.,the United Kingdom, Switzerland and Sweden, the analysis of the geographicaldistribution of trade has been suppressed and the returns have been "simpli-f ied" in other ways also. It is no longer possible to calculate the total valueor volume of the world's foreign trade and it is sometimes uncertain to whatextent trade in war implements is included in the various returns. Finally, itseems to be a general feature that prices of goods which are imported andexported have been subject to greater price changes than domestic products;for this reason great caution must be exercised when figures for 1940 arecompared with those for previous years.
Among the great powers only the United States continues the publi-cation of its trade returns on a normal basis and a review of world trade maytherefore usefully begin with an indication of the tendencies revealed by thesestatistics. The following figures show the total value of the foreign trade of the
United States in recent years.Uni ted States Foreign Trade 1937-1940. . .. . , , . ,
a In the trade depression of1938 imports fell heavily, butexports kept up well, with theresult that an export surplusarose exceeding $1 milliard —the highest since 1921 with thesirigle exception of the year1928. Foreign demand for U. S.
goods subsided somewhat in the early months of 1939 when exports weresubstantially lower than in the preceding year. Beginning with the month of
June the country'sexports began toshow an upwardtrend,
$ millions
193719381939;1940
Exports
3,3493,0943,1774,021
Imports
3,0841,9602,3182,625
Balance
+ 265+ 1,134+ 859+ 1,396
Foreign Trade of U. S. A.Monthly, in millions of dollars.
50
-50 i , f f , 'm l .??!?'.•!?
400
350
300
250
200
150
100
50
1936 1937. 1938 1939 1940 19*150
which became morepronounced after theoutbreak of war inSeptember 1939 andthe removal on 4thNovember 1939 of theprohibitions in theNeutrality Act (of 1937)against selling arms,ammunition and in-struments of war tobelligerent countries.Notwithstanding thedisappearance of im-portant markets on theContinent of Europe,
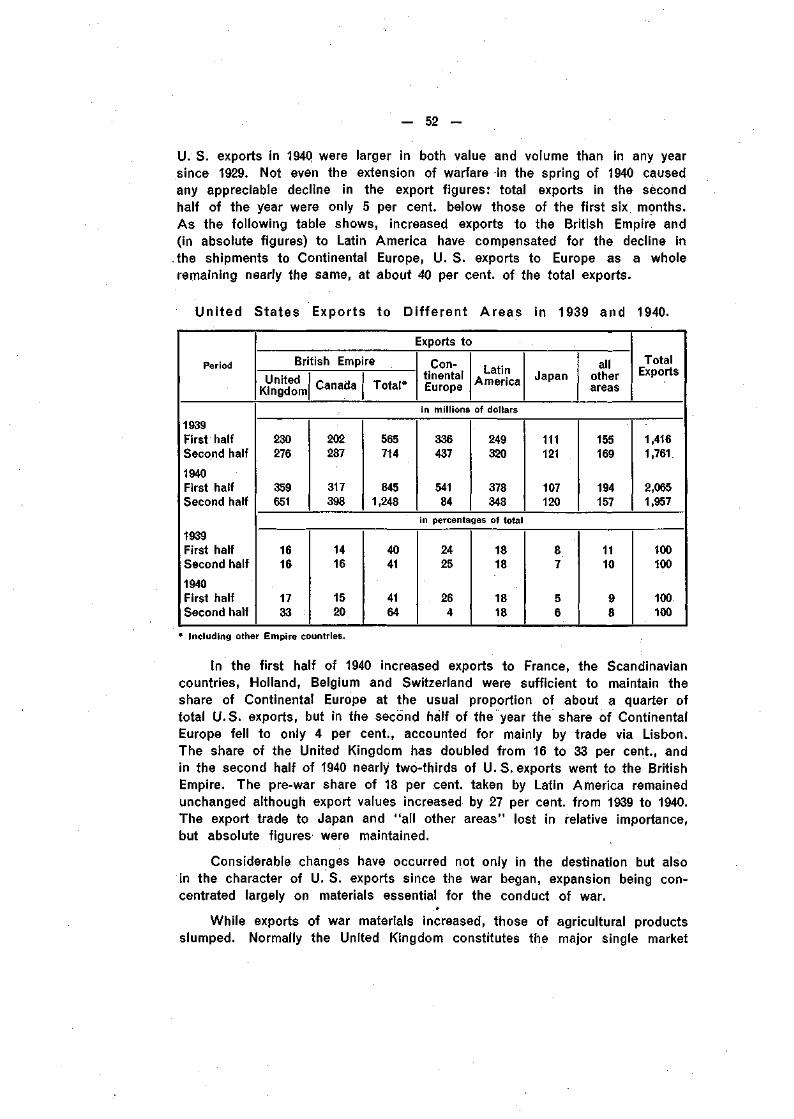
— 52 —
U. S. exports in 194Q were larger in both value and volume than in any yearsince 1929. Not even the extension of warfare in the spring of 1940 causedany appreciable decline in the export figures: total exports in the secondhalf of the year were only 5 per cent, below those of the first six months.As the following table shows, increased exports to the British Empire and(in absolute figures) to Latin America have compensated for the decline inthe shipments to Continental Europe, U. S. exports to Europe as a wholeremaining nearly the same, at about 40 per cent, of the total exports.
United States Exports to Di f ferent Areas in 1939 and 1940.
Period
•
British Empire
UnitedKingdom Canada Total*
Exports to
Con-tinentalEurope
•
LatinAmerica Japan
allotherareas
TotalExports
in millions of dollars1939First halfSecond half
1940First halfSecond half
1939First halfSecond half
1940First halfSecond half
230276
359651
202287
317398
565714
8451,248
336437
54184
249320
378348
111121
107120
155169
194157
1,4161,761
2,0651,957
in percentages of total
1616
1733
1416
1520
4041
4164
2425
264
1818
1818
87
56
1110
98
100100
100100
* Including other Empire countries.
In the first half of 1940 increased exports to France, the Scandinaviancountries, Holland, Belgium and Switzerland were sufficient to maintain theshare of Continental Europe at the usual proportion of about a quarter oftotal U.S. exports, but in the second half of the year the share of ContinentalEurope fell to only 4 per cent., accounted for mainly by trade via Lisbon.The share of the United Kingdom has doubled from 16 to 33 per cent., andin the second half of 1940 nearly two-thirds of U.S. exports went to the BritishEmpire. The pre-war share of 18 per cent, taken by Latin America remainedunchanged although export values increased by 27 per cent, from 1939 to 1940.The export trade to Japan and "all other areas" lost in relative importance,but absolute figures were maintained.
Considerable changes have occurred not only in the destination but alsoin the character of U. S. exports since the war began, expansion being con-centrated largely on materials essential for the conduct of war.
While exports of war materials increased, those of agricultural productsslumped. Normally the United Kingdom constitutes the major single market
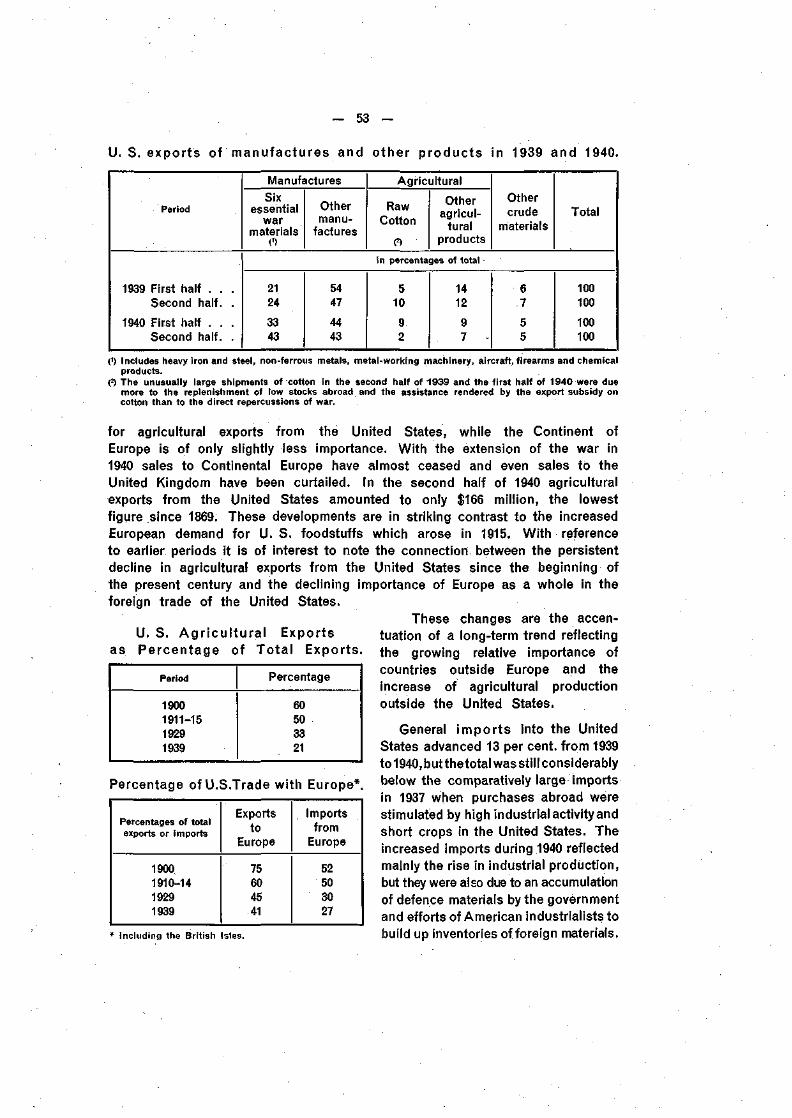
— 53 —
U. S. exports of manufactures and other products in 1939 and 1940.
Period
1939 First half . . .Second half. .
1940 First half . . .Second half. .
Manufactures
Sixessential
warmaterials
(')
Othermanu-
factures
Agricultural
RawCotton
O
Otheragricul-
turalproducts
Othercrude
materialsTotal
in percentages of total
2124
3343
5447
4443
510
92
1412
97
67
55
100100
100100
0) Includes heavy iron and steel, non-ferrous metals, metal-working machinery, aircraft, firearms and chemicalproducts.
0 The unusually large shipments of cotton in the second half of 1939 and the first half of 1940 were duemore to the replenishment of low stocks abroad and the assistance rendered by the export subsidy oncotton than to the direct repercussions of war.
for agricultural exports from the United States, while the Continent ofEurope is of only slightly less importance. With the extension of the war in1940 sales to Continental Europe have almost ceased and even sales to theUnited Kingdom have been curtailed. In the second half of 1940 agriculturalexports from the United States amounted to only $166 million, the lowestfigure since 1869. These developments are in striking contrast to the increasedEuropean demand for U. S. foodstuffs which arose in 1915. With referenceto earlier periods it is of interest to note the connection, between the persistentdecline in agricultural exports from the United States since the beginning ofthe present century and the declining importance of Europe as a whole in theforeign trade of the United States.
U. S. Ag r i cu l t u ra l Exportsas Percentage of Tota l Exports.
Period
19001911-1519291939
Percentage
60503321
Percentage of U.S.Trade with Europe*
Percentages of totalexports or imports
19001910-1419291939
Exportsto
Europe
75604541
Importsfrom
Europe
52503027
Including the British Isles.
These changes are the accen-tuation of a long-term trend reflectingthe growing relative importance ofcountries outside Europe and theincrease of agricultural productionoutside the United States.
General impor ts into the UnitedStates advanced 13 per cent, from 1939to 1940, but thetotal was still considerablybelow the comparatively large importsin 1937 when purchases abroad werestimulated by high industrial activity andshort crops in the United States. Theincreased imports during 1940 reflectedmainly the rise in industrial production,but they were also due to an accumulationof defence materials by the governmentand efforts of American industrialists tobuild up inventories of foreign materials.
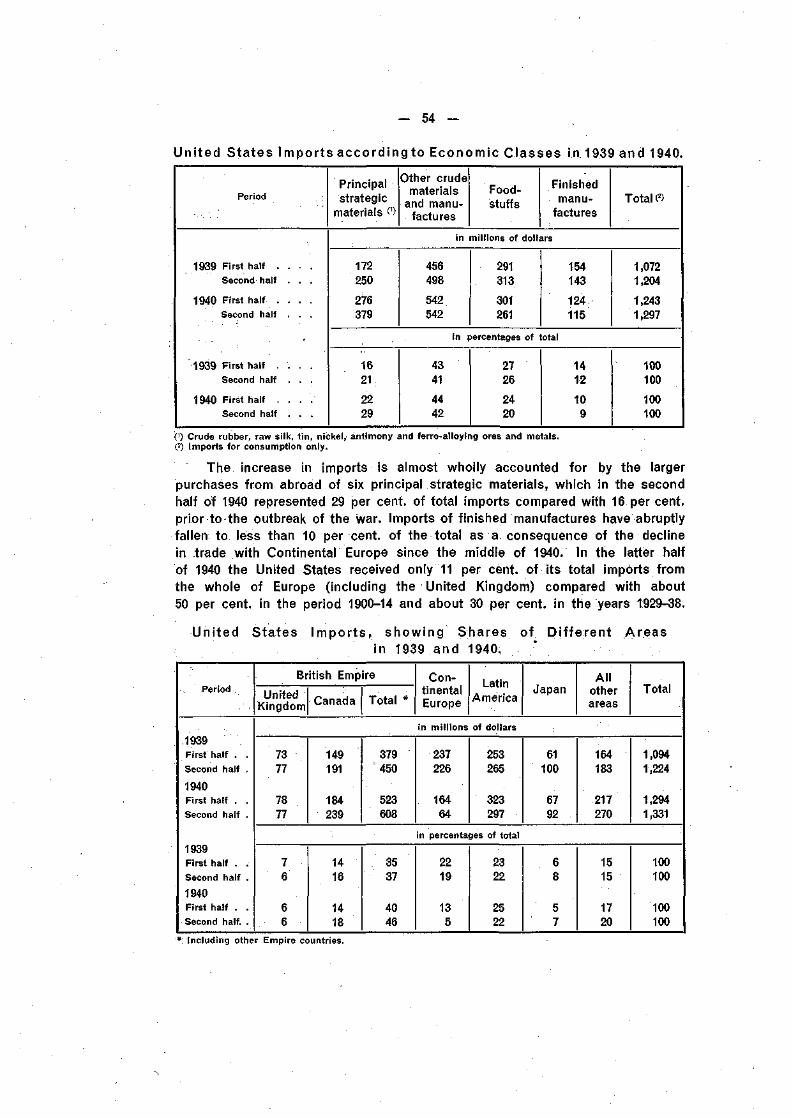
— 54 —
United States Imports according to Economic Classes in 1939 and 1940.
Per iod
1 9 3 9 F i r s t ha l f . . . .
Second hai f . . .
1 9 4 0 F i r s t ha l f . . . .
Second hal f . . .
1 9 3 9 F i r s t ha l f . . . .
Second hal f . . .
1 9 4 0 F i rs t ha l f . . . .
Second hal f . . .
Principalstrategic
materials 0)
Other crudematerials
and manu-factures
Food-stuffs
Finishedmanu-
facturesTotal (2)
in millions of dollars
172250
276379
456498
542542
291313
301261
154143
124115
1,0721,204
1,2431,297
in percentages of total
1621
2229
4341
4442
2726
2420
1412
109
|| ||
0) Crude rubber, raw silk, tin, nickel, antimony and ferro-alloying ores and metals.(2) Imports for consumption only.
The increase in imports is almost wholly accounted for by the largerpurchases from abroad of six principal strategic materials, which in the secondhalf oï 1940 represented 29 per cent, of total imports compared with 16 per cent,prior to the outbreak of the war. Imports of finished manufactures have abruptlyfallen to less than 10 per cent, of the total as a consequence of the declinein trade with Continental Europe since the middle of 1940. In the latter halfof 1940 the United States received only 11 per cent, of its total imports fromthe whole of Europe (including the United Kingdom) compared with about50 per cent, in the period 1900-14 and about 30 per cent, in the years 1929-38.
United States Impor ts , showing Shares of Di f ferent Areasin 1939 and 1940.
PeriodBritish Empire
UnitedKingdom Canada Total
Con-tinentalEurope
LatinAmerica
JapanAll
otherareas
Total
1939First half .Second half
1940First half .Second half
1939First half .Second half
1940First half .Second half.
7377
7877
149191
184239
379450
523608
in millions
237226
16464
of dollars
253265
323297
61100
6792
164183
217270
1,0941,224
1,2941,331
in percentages of total
1416
1418
3537
4046
2219
135
2322
2522
68
57
1515
1720
100100
100100
*: Including other Empire countries.
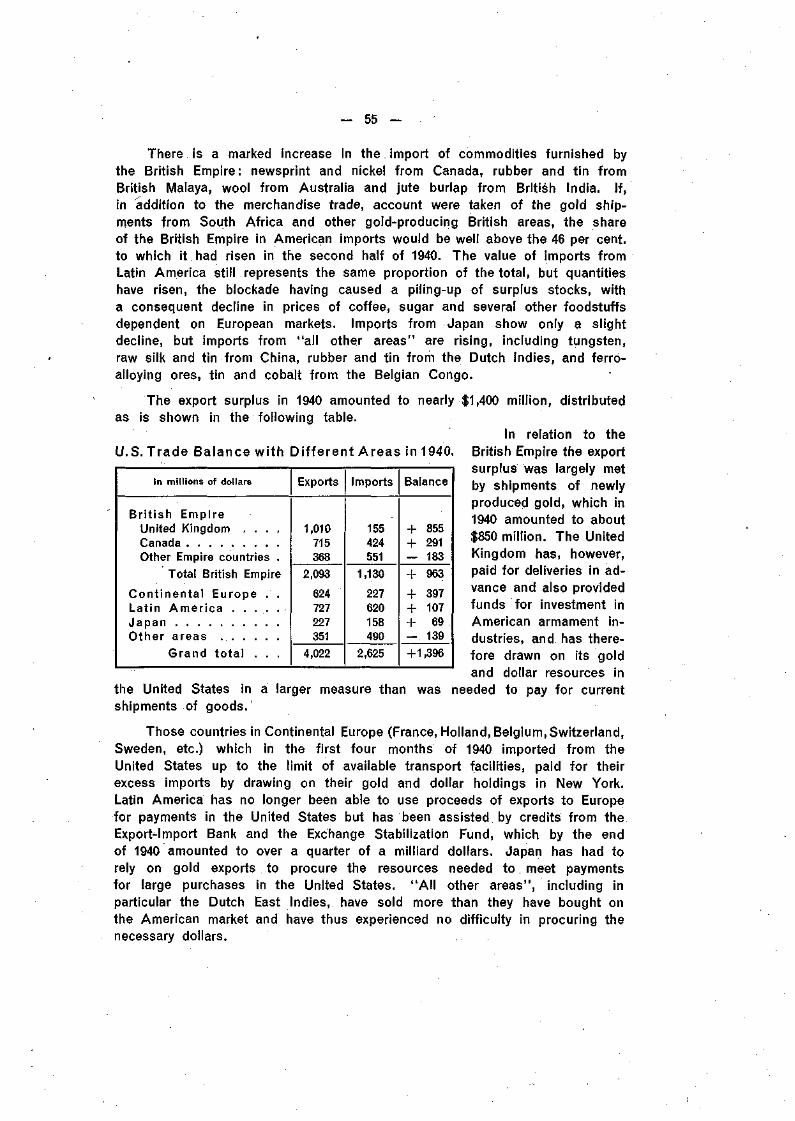
— 55 —
There is a marked increase in the import of commodities furnished bythe British Empire: newsprint and nickel from Canada, rubber and tin fromBritish Malaya, wool from Australia and jute burlap from British India. If,in addition to the merchandise trade, account were taken of the gold ship-ments from South Africa and other gold-producing British areas, the shareof the British Empire in American imports would be well above the 46 per cent,to which it had risen in the second half of 1940. The value of imports fromLatin America still represents the same proportion of the total, but quantitieshave risen, the blockade having caused a piling-up of surplus stocks, witha consequent decline in prices of coffee, sugar and several other foodstuffsdependent on European markets. Imports from Japan show only a slightdecline, but imports from "all other areas" are rising, including tungsten,raw silk and tin from China, rubber and tin from the Dutch Indies, and ferro-alloying ores, tin and cobalt from the Belgian Congo.
The export surplus in 1940 amounted to nearly $1,400 million, distributedas is shown in the following table.
In relation to theU.S.Trade Balance wi th Di f ferent Areas in 1940. British Empire the export
surplus was largely metby shipments of newlyproduced gold, which in1940 amounted to about$850 million. The UnitedKingdom has, however,paid for deliveries in ad-vance and also providedfunds for investment inAmerican armament in-dustries, and has there-fore drawn on its goldand dollar resources in
the United States in a larger measure than was needed to pay for currentshipments of goods.
Those countries in Continental Europe (France, Holland, Belgium, Switzerland,Sweden, etc.) which in the first four months of 1940 imported from theUnited States up to the limit of available transport facilities, paid for theirexcess imports by drawing on their gold and dollar holdings in New York.Latin America has no longer been able to use proceeds of exports to Europefor payments in the United States but has been assisted by credits from theExporHmport Bank and the Exchange Stabilization Fund, which by the endof 1940 amounted to over a quarter of a milliard dollars. Japan has had torely on gold exports to procure the resources needed to meet paymentsfor large purchases in the United States. "Al l other areas", including inparticular the Dutch East Indies, have sold more than they have bought onthe American market and have thus experienced no difficulty in procuring thenecessary dollars.
In millions of dollars
Br i t ish EmpireUnited Kingdom . . . .CanadaOther Empire countries .
Total British Empire
Cont inenta l Europe . .Lat in Amer ica . . . . .JapanOther areas
Grand tota l . . .
Exports
1,010715368
2,093
624727227351
4,022
Imports
155424551
1,130
227620158490
2,625
Balance
+ 855+ 291— 183+ 963
+ 397+ 107+ 69- 139+1,396
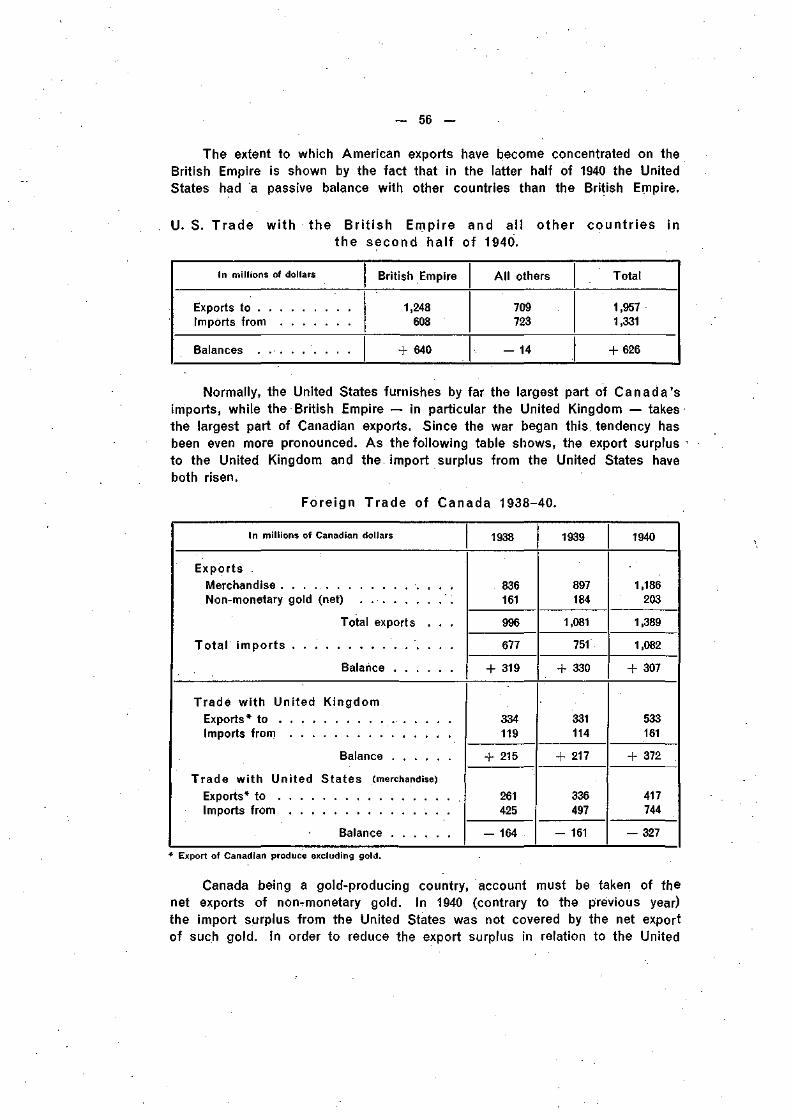
— 56 —
The extent to which American exports have become concentrated on theBritish Empire is shown by the fact that in the latter half of 1940 the UnitedStates had a passive balance with other countries than the British Empire.
U. S. Trade wi th the Br i t ish Empire and all other count r ies inthe second half of 1940.
In millions of dollars
Exports toImports from
Balances . . . . . . . . .
British Empire
1,248608
+ 640
All others
709723
- 14
Total
1,9571,331
+ 626
Normally, the United States furnishes by far the largest part of Canada'simports, while the British Empire — in particular the United Kingdom — takesthe largest part of Canadian exports. Since the war began this tendency hasbeen even more pronounced. As the following table shows, the export surplusto the United Kingdom and the import surplus from the United States haveboth risen.
Foreign Trade of Canada 1938-40.
In millions of Canadian dollars
ExportsMerchandiseNon-monetary gold (net) . .
Total exports . . .
Tota l impor ts
Balance
Trade wi th United KingdomExports* toImports from . . .
Balance
Trade wi th United States (merchandise)Exports* toImports from
Balance
1938
836161
996
677
+ 319
334119
+ 215
261425
- 164
1939
897184
1,081
751
+ 330
331114
+ 217
336497
- 161
1940
1,186203
1,389
1,082
+ 307
533161
+ 372
417744
— 327
* Export of Canadian produce excluding gold.
Canada being a gold-producing country, account must be taken of thenet exports of non-monetary gold. In 1940 (contrary to the previous year)the import surplus from the United States was not covered by the net exportof such gold. In order to reduce the export surplus in relation to the United
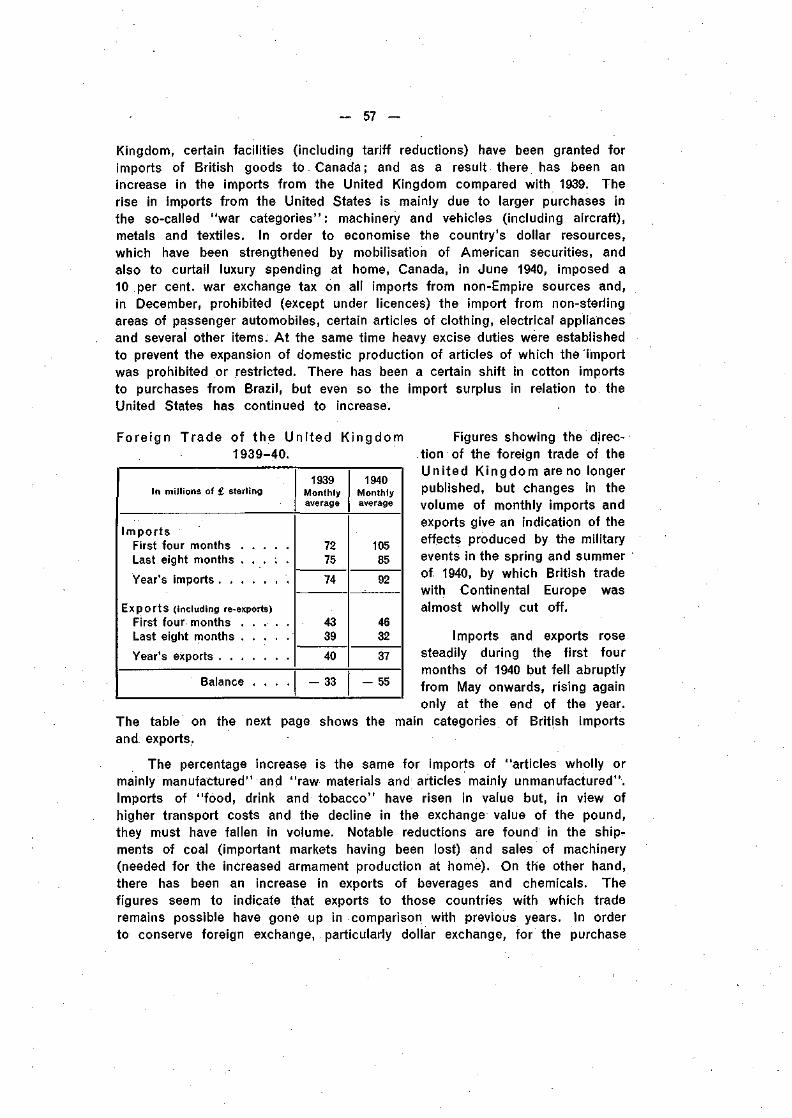
57 —
Kingdom, certain facilities (including tariff reductions) have been granted forimports of British goods to Canada; and as a result there has been anincrease in the imports from the United Kingdom compared with 1939. Therise in imports from the United States is mainly due to larger purchases inthe so-called "war categories": machinery and vehicles (including aircraft),metals and textiles. In order to economise the country's dollar resources,which have been strengthened by mobilisation of American securities, andalso to curtail luxury spending at home, Canada, in June 1940, imposed a10 per cent, war exchange tax on all imports from non-Empire sources and,in December, prohibited (except under licences) the import from non-sterlingareas of passenger automobiles, certain articles of clothing, electrical appliancesand several other items. At the same time heavy excise duties were establishedto prevent the expansion of domestic production of articles of which the importwas prohibited or restricted. There has been a certain shift in cotton importsto purchases from Brazil, but even so the import surplus in relation to theUnited States has continued to increase.
Foreign Trade of the United Kingdom1939-40.
Figures showing the direc-tion of the foreign trade of theUnited Kingdom areno longerpublished, but changes in thevolume of monthly imports andexports give an indication of theeffects produced by the militaryevents in the spring and summerof 1940, by which British tradewith Continental Europe wasalmost wholly cut off.
Imports and exports rosesteadily during the first fourmonths of 1940 but fell abruptlyfrom May onwards, rising againonly at the end of the year.
The table on the next page shows the main categories of British importsand exports.
The percentage increase is the same for imports of "articles wholly ormainly manufactured" and "raw materials and articles mainly unmanufactured".Imports of "food, drink and tobacco" have risen in value but, in view ofhigher transport costs and the decline in the exchange value of the pound,they must have fallen in volume. Notable reductions are found in the ship-ments of coal (important markets having been lost) and sales of machinery(needed for the increased armament production at home). On the other hand,there has been an increase in exports of beverages and chemicals. Thefigures seem to indicate that exports to those countries with which traderemains possible have gone up in comparison with previous years. In orderto conserve foreign exchange, particularly dollar exchange, for the purchase
In millions of £ sterling
ImportsFirst four monthsLast eight months . . . : .
Year's imports
E x p o r t s (including re-exports)F i r s t f o u r m o n t h s . . . . .Las t e i g h t m o n t h s
Y e a r ' s e x p o r t s
B a l a n c e . . . .
1939Monthlyaverage
7275
74
4339
40
- 33
1940Monthlyaverage
10585
92
4632
37
- 55
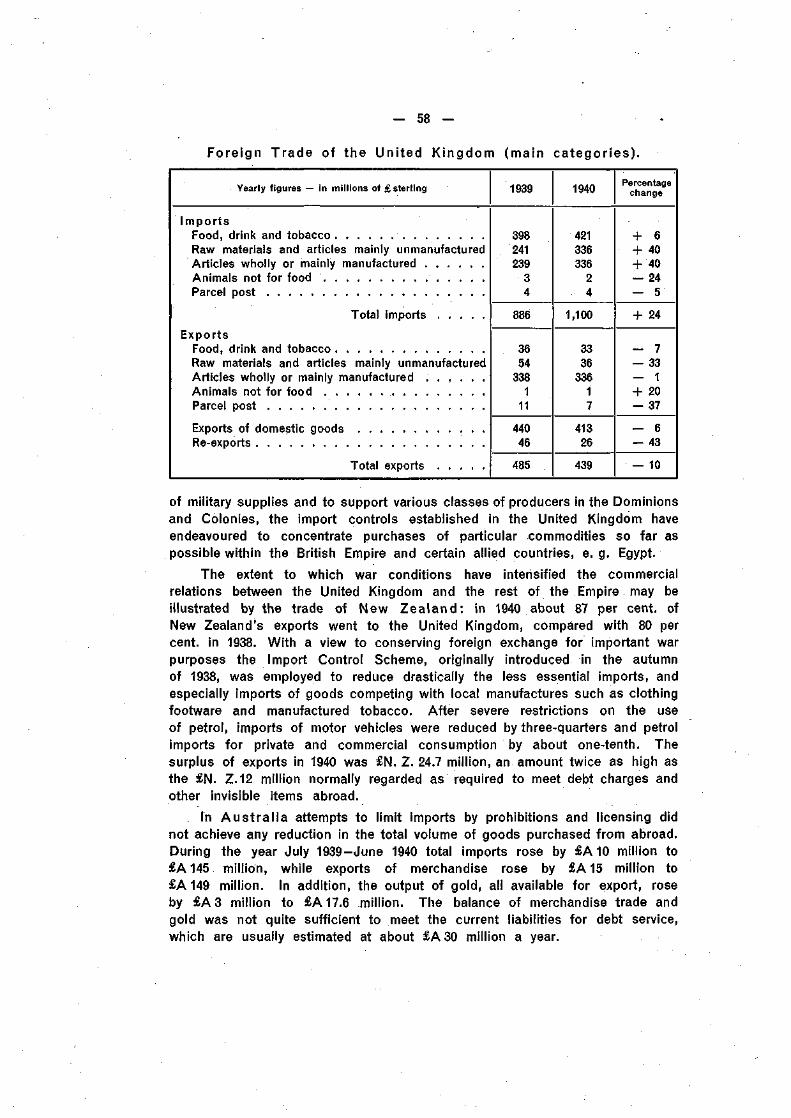
- 58 -
Foreign Trade of the United Kingdom (main categor ies) .
Yearly figures — in millions of £ sterling 1939 1940Percentage
change
ImportsFood, drink and tobaccoRaw materials and articles mainly unmanufacturedArticles wholly or mainly manufacturedAnimals not for foodParcel post
Total imports
ExportsFood, drink and tobaccoRaw materials and articles mainly unmanufacturedArticles wholly or mainly manufactured . . . . . .Animals not for foodParcel post
Exports of domestic goodsRe-exports
Total exports
398241239
34
421336336
24
+ 6+ 40+ 40- 24— 5
886 1,100 + 24
3654
3381
11
3336
33617
— 33— 1+ 20— 37
44046
41326
— 6— 43
485 439 - 10
of military supplies and to support various classes of producers in the Dominionsand Colonies, the import controls established in the United Kingdom haveendeavoured to concentrate purchases of particular commodities so far aspossible within the British Empire and certain allied countries, e.g. Egypt.
The extent to which war conditions have intensified the commercialrelations between the United Kingdom and the rest of the Empire may beillustrated by the trade of New Zea land: in 1940 about 87 per cent, ofNew Zealand's exports went to the United Kingdom, compared with 80 percent, in 1938. With a view to conserving foreign exchange for important warpurposes the Import Control Scheme, originally introduced in the autumnof 1938, was employed to reduce drastically the less essential imports, andespecially imports of goods competing with local manufactures such as clothingfootware and manufactured tobacco. After severe restrictions on the useof petrol, imports of motor vehicles were reduced by three-quarters and petrolimports for private and commercial consumption by about one-tenth. Thesurplus of exports in 1940 was £N. Z. 24.7 million, an amount twice as high asthe £N. Z.12 million normally regarded as required to meet debt charges andother invisible items abroad.
In Aus t ra l i a attempts to limit imports by prohibitions and licensing didnot achieve any reduction in the total volume of goods purchased from abroad.During the year July 1939-June 1940 total imports rose by £A10 million to£A 145 million, while exports of merchandise rose by £A 15 million to£A 149 million. In addition, the output of gold, all available for export, roseby £A3 million to £A17.6 million. The balance of merchandise trade andgold was not quite sufficient to meet the current liabilities for debt service,which are usually estimated at about £A 30 million a year.
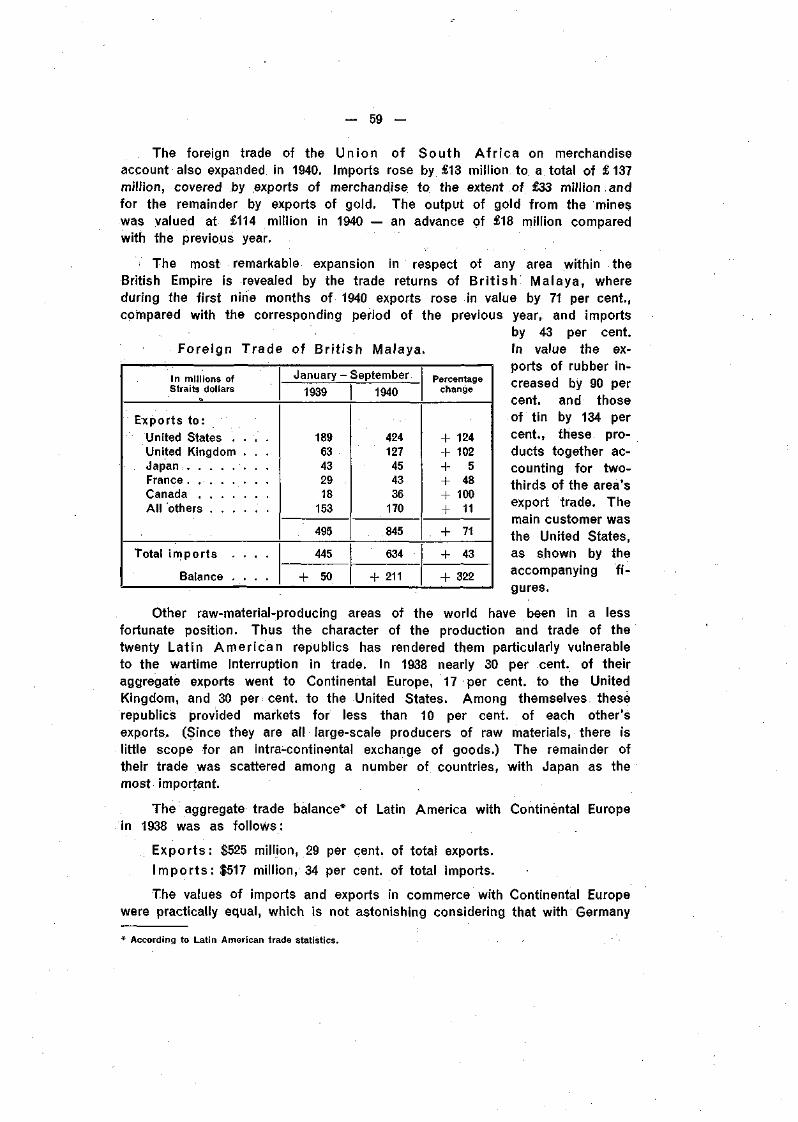
— 59 —
The foreign trade of the Union of South A f r i ca on merchandiseaccount also expanded in 1940. Imports rose by £13 million to a total of £137million, covered by exports of merchandise to the extent of £33 million andfor the remainder by exports of gold. The output of gold from the mineswas valued at £114 million in 1940 — an advance of £18 million comparedwith the previous year.
; The most remarkable expansion in respect of any area within theBritish Empire is revealed by the trade returns of Br i t ish Malaya, whereduring the first nine months of 1940 exports rose in value by 71 per cent.,compared with the corresponding period of the previous year, and imports
by 43 per cent.Foreign Trade of Br i t ish Malaya. In value the ex-
ports of rubber in-creased by 90 percent, and thoseof tin by 134 percent., these pro-ducts together ac-counting for two-thirds of the area'sexport trade. Themain customer wasthe United States,as shown by theaccompanying f i -gures.
Other raw-material-producing areas of the world have been in a lessfortunate position. Thus the character of the production and trade of thetwenty Latin Amer ican republics has rendered them particularly vulnerableto the wartime interruption in trade. In 1938 nearly 30 per cent, of theiraggregate exports went to Continental Europe, 17 per cent, to the UnitedKingdom, and 30 per cent, to the United States. Among themselves theserepublics provided markets for less than 10 per cent, of each other'sexports. (Since they are all large-scale producers of raw materials, there islittle scope for an intra-continental exchange of goods.) The remainder oftheir trade was scattered among a number of countries, with Japan as themost important.
The aggregate trade balance* of Latin America with Continental Europein 1938 was as follows:
Expor ts : $525 million, 29 per cent, of total exports.
Impor ts : $517 million, 34 per cent, of total imports.
The values of imports and exports in commerce with Continental Europewere practically equal, which is not astonishing considering that with Germany
In millions ofStraits dollars
: Exports to :United States . . . .United Kingdom . . .JapanFrance. . . . .CanadaA l l o t h e r s . . . . . .
Total i m p o r t s . . . .
Balance . . . .
January -
1939
18963432918
153
495
445
+ 50
September
1940
424127454336
170
845
634
+ 211
Percentagechange
+ 124+ 102+ 5+ 48+ 100+ 11
+ 71
+ 43
+ 322
* According to Latin American trade statistics.
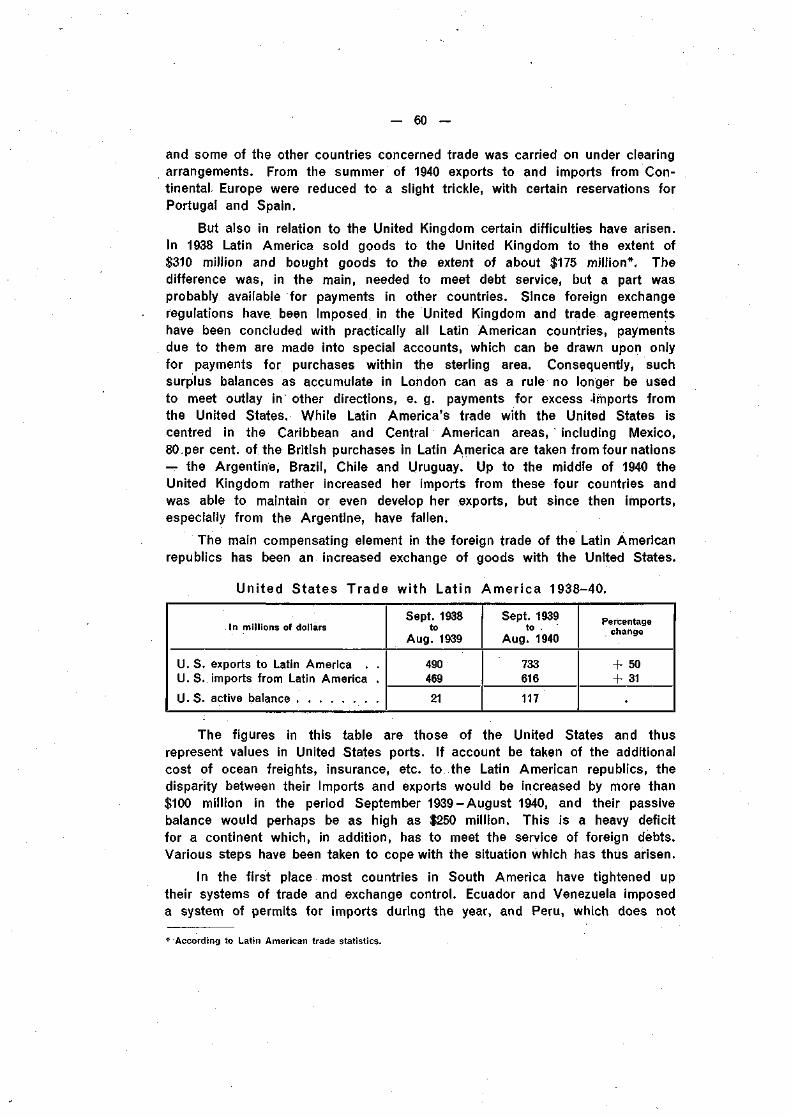
— 60 —
and some of the other countries concerned trade was carried on under clearingarrangements. From the summer of 1940 exports to and imports from Con-tinental. Europe were reduced to a slight trickle, with certain reservations forPortugal and Spain.
But also in relation to the United Kingdom certain difficulties have arisen.In 1938 Latin America sold goods to the United Kingdom to the extent of$310 million and bought goods to the extent of about $175 million*. Thedifference was, in the main, needed to meet debt service, but a part wasprobably available for payments in other countries. Since foreign exchangeregulations have been imposed in the United Kingdom and trade agreementshave been concluded with practically all Latin American countries, paymentsdue to them are made into special accounts, which can be drawn upon onlyfor payments for purchases within the sterling area. Consequently, suchsurplus balances as accumulate in London can as a rule no longer be usedto meet outlay in other directions, e. g. payments for excess imports fromthe United States. While Latin America's trade with the United States iscentred in the Caribbean and Central American areas, including Mexico,80 per cent, of the British purchases in Latin America are taken from four nations— the Argentine, Brazil, Chile and Uruguay. Up to the middle of 1940 theUnited Kingdom rather increased her imports from these four countries andwas able to maintain or even develop her exports, but since then imports,especially from the Argentine, have fallen.
The main compensating element in the foreign trade of the Latin Americanrepublics has been an increased exchange of goods with the United States.
u.u.u.
co c
o
S.
United States Trade
In millions of dollars
exports to Latin America . .imports from Latin America .
active balance
with Latin
Sept. 1938to
Aug. 1939
490469
21
America 1938-40.
Sept. 1939to .
Aug. 1940
733616
117
Percentagechange
+ 50+ 31
•
The figures in this table are those of the United States and thusrepresent values in United States ports. If account be taken of the additionalcost of ocean freights, insurance, etc. to the Latin American republics, thedisparity between their imports and exports would be increased by more than$100 million in the period September 1939-August 1940, and their passivebalance would perhaps be as high as $250 million. This is a heavy deficitfor a continent which, in addition, has to meet the service of foreign debts.Various steps have been taken to cope with the situation which has thus arisen.
In the first place most countries in South America have tightened uptheir systems of trade and exchange control. Ecuador and Venezuela imposeda system of permits for imports during the year, and Peru, which does not
* According to Latin American trade statistics.
— 61 —
apply any formal exchange control, increased duties on a range of productsconsidered luxuries or domestically replaceable and restricted the import ofcertain cereals. In Central America similar measures have been less common :no fewer than six out of the ten republics of that area are able to dispense withformal exchange control, namely Mexico, Guatemala, El Salvador, Panama, Haitiand the Dominican Republic.
Efforts have further been made to dispose of surpluses of commodities,and in this connection active aid is being granted by the United States. Arrange-ments have been made to erect a large tin-smelting plant in the United States,to operate with Bolivian ore. An agreement regarding coffee, drafted by theInter-American Financial and Economic Advisory Committee, was signed inNovember by representatives of fourteen coffee-producing countries in LatinAmerica and by the United States. It provided for the establishment of quotasgoverning the exports of the fourteen countries to the United States, whichis the world's largest consumer of coffee, and made an allotment for marketsother than the United States as they again become available. An interestingfeature of the agreement is that, besides the producing areas, the main con-suming country has played a decisive rôle in the fixing of the quotas andparticipates in the management of the scheme, which is entrusted to theInter-American Coffee Board in Washington. The agreement covers exportsto the United States market of 15.55 million sacks of coffee (about 933,000 tons),in which Brazil's share amounts to 9.3 million sacks and that of Colombiato 3.15 million.
The diversion of United States trade to Latin America is hampered bythe fact that about 40 per cent, of total Latin American exports are competitivewith those of the United States and therefore cannot be readily absorbed bythe market in that country. It was estimated in 1940 that theoretically theUnited States could increase imports from Latin America as a whole by over$300 million if it relied entirely on western hemisphere sources for its casings,hides, skins, wool, cashew nuts, copra, cocoa, coconut oil, industrial diamonds,manganese, palm oil, rubber, tapioca and vanilla beans. These purchaseswould, however, be largely confined to the tropical and mineral-exportingregions and would therefore not alleviate the difficulties of the temperateagricultural countries such as the Argentine, Paraguay and Uruguay.
Measures to promote trade take time to become effective; the immediateaid extended by the United States Government is represented by loans andcredits, granted mostly through the Export-Import Bank. Apart from thesupport given to local currencies, the purposes of the credits were to financeessential imports from the United States, particularly of machinery andtransportation and construction equipment, and also to afford a means forcarrying through certain internal development projects. In this connectionit is of interest to mention the movement towards a wider industrialisationof the Latin American countries. Many of these countries have reducedor waived their import duties on industrial equipment and materials during1940, either for particular types of production or for new manufacturing
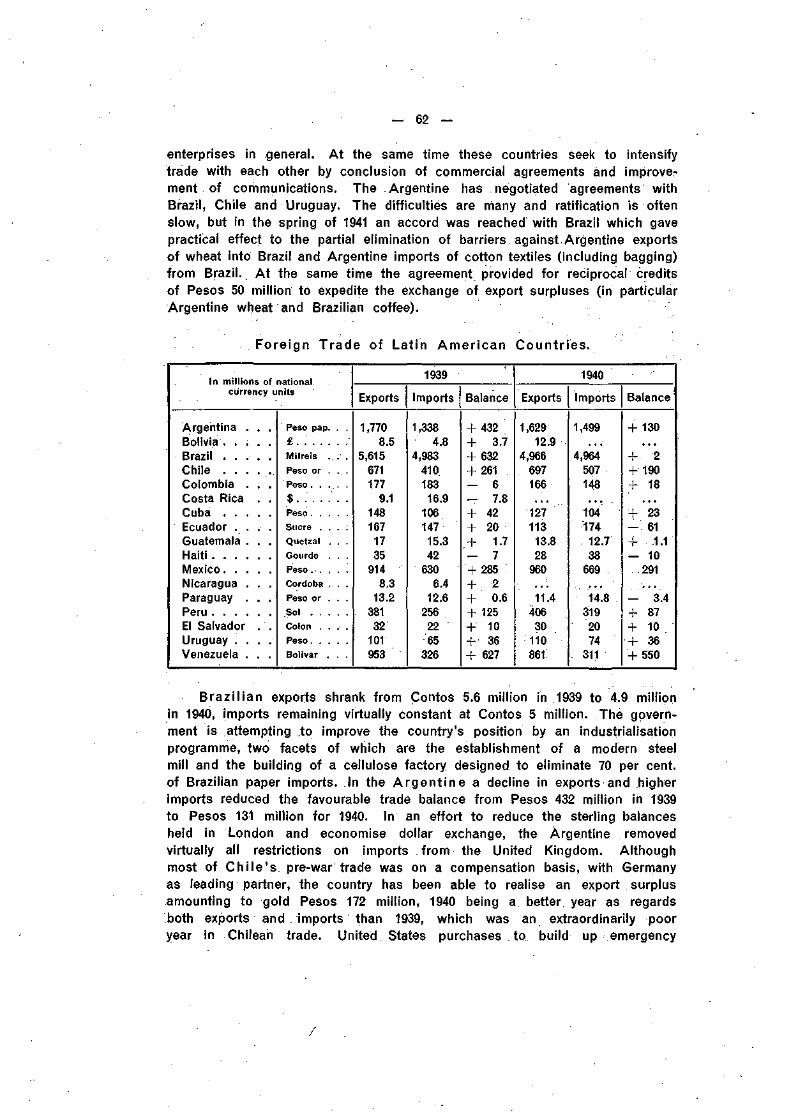
— 62 —
enterprises in general. At the same time these countries seek to intensifytrade with each other by conclusion of commercial agreements and improve-ment of communications. The Argentine has negotiated agreements withBrazil, Chile and Uruguay. The difficulties are many and ratification is oftenslow, but in the spring of 1941 an accord was reached with Brazil which gavepractical effect to the partial elimination of barriers against Argentine exportsof wheat into Brazil and Argentine imports of cotton textiles (including bagging)from Brazil. At the same time the agreement provided for reciprocal creditsof Pesos 50 million to expedite the exchange of export surpluses (in particularArgentine wheat and Brazilian coffee).
Foreign Trade of Latin Amer ican
In millions of nationalcurrency units
Argentina . . .Bolivia . . . . .Brazil . . . . .ChileColombia . . .Costa Rica . .CubaEcuador . . . .Guatemala . . .HaitiMexicoNicaragua . . .Paraguay . . .PeruEl Salvador . .Uruguay . . . .Venezuela . . .
Peso pap. . .
£ .Mi l re is
Peso or .
Peso
$ . : . . : . .
Peso . . . . .
Sucre . . . :
Quetzal . . .
Gourde . . .
Peso . . . . .
Cordoba . . .
Peso or . . .
Sol
Colon . . . .
Peso
Bolivar . . .
1939
Exports
1,7708.5
5,615671177
9.11481671735
9148.3
13.238132
101953
Imports
1,3384.8
4,98341018316.9
10614715.342
6306.4
12.62562265
326
Balance
+ 432+ 3.7+ 632+ 261— 6— 7.8+ 42+ 20+ 1.7— 7+ 285+ 2+ 0.6+ 125+ 10+ 36+ 627
Countr ies.
1940
Exports
1,62912.9
4,966697166
127113
13.828
960
11.440630
110861
Imports
1,499
4,964507148
10417412.738
669
14.83192074
311
Balance
+ 130
+ 2+ 190+ 18
+ 23— 61.+ i.r— 10
291
- 3.4+ 87+ 10+ 36+ 550
Brazi l ian exports shrank from Çontos 5.6 million in 1939 to 4.9 millionin 1940, imports remaining virtually constant at Contos 5 million. The govern-ment is attempting to improve the country's position by an industrialisationprogramme, two facets of which are the establishment of a modern steelmill and the building of a cellulose factory designed to eliminate 70 per cent,of Brazilian paper imports. In the A rgen t i ne a decline in exports and higherimports reduced the favourable trade balance from Pesos 432 million in 1939to Pesos 131 million for 1940. In an effort to reduce the sterling balancesheld in London and economise dollar exchange, the Argentine removedvirtually all restrictions on imports from the United Kingdom. Althoughmost of Ch i le 's pre-war trade was on a compensation basis, with Germanyas leading partner, the country has been able to realise an export surplusamounting to gold Pesos 172 million, 1940 being a better year as regardsboth exports and imports than 1939, which was an extraordinarily pooryear in Chilean trade. United States purchases to build up emergency
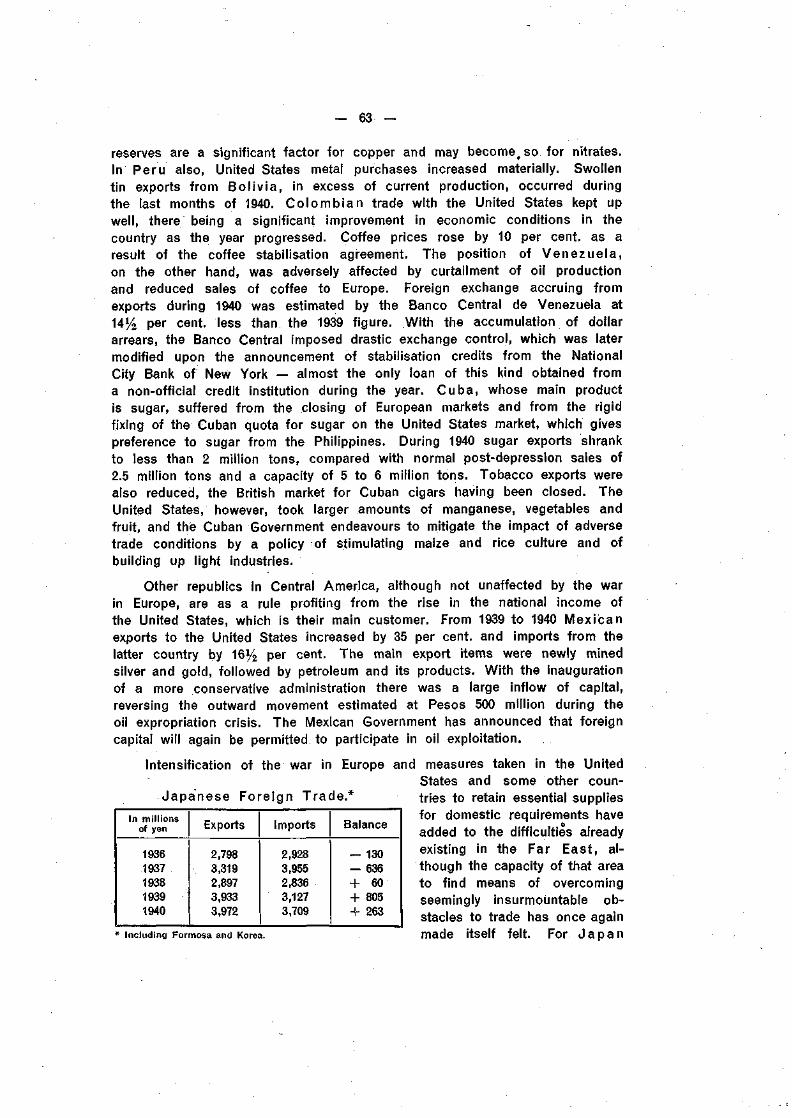
- 63 -
reserves are a significant factor for copper and may become, so for nitrates.In Peru also, United States metal purchases increased materially. Swollentin exports from Bol iv ia , in excess of current production, occurred duringthe last months of 1940. Colombian trade with the United States kept upwell, there being a significant improvement in economic conditions in thecountry as the year progressed. Coffee prices rose by 10 per cent, as aresult of the coffee stabilisation agreement. The position of Venezuela,on the other hand, was adversely affected by curtailment of oil productionand reduced sales of coffee to Europe. Foreign exchange accruing fromexports during 1940 was estimated by the Banco Central de Venezuela at14% per cent, less than the 1939 figure. With the accumulation of dollararrears, the Banco Central imposed drastic exchange control, which was latermodified upon the announcement of stabilisation credits from the NationalCity Bank of New York — almost the only loan of this kind obtained froma non-official credit institution during the year. Cuba, whose main productis sugar, suffered from the closing of European markets and from the rigidfixing of the Cuban quota for sugar on the United States market, which givespreference to sugar from the Philippines. During 1940 sugar exports shrankto less than 2 million tons, compared with normal post-depression sales of2.5 million tons and a capacity of 5 to 6 million tons. Tobacco exports werealso reduced, the British market for Cuban cigars having been closed. TheUnited States, however, took larger amounts of manganese, vegetables andfruit, and the Cuban Government endeavours to mitigate the impact of adversetrade conditions by a policy of stimulating maize and rice culture and ofbuilding up light industries.
Other republics in Central America, although not unaffected by the warin Europe, are as a rule profiting from the rise in the national income ofthe United States, which is their main customer. From 1939 to 1940 Mexicanexports to the United States increased by 35 per cent, and imports from thelatter country by 16% per cent. The main export items were newly minedsilver and gold, followed by petroleum and its products. With the inaugurationof a more conservative administration there was a large inflow of capital,reversing the outward movement estimated at Pesos 500 million during theoil expropriation crisis. The Mexican Government has announced that foreigncapital will again be permitted to participate in oil exploitation.
Intensification of the war in Europe and measures taken in the UnitedStates and some other coun-
Japanese Foreign Trade.*
In millionsof yen
19361937193819391940
Exports
2,7983,3192,8973,9333,972
Imports
2,9283,9552,8363,1273,709
Balance
— 130— 636+ 60+ 805+ 263
* Including Formosa and Korea.
tries to retain essential suppliesfor domestic requirements haveadded to the difficulties alreadyexisting in the Far East, al-though the capacity of that areato find means of overcomingseemingly insurmountable ob-stacles to trade has once againmade itself felt. For Japan
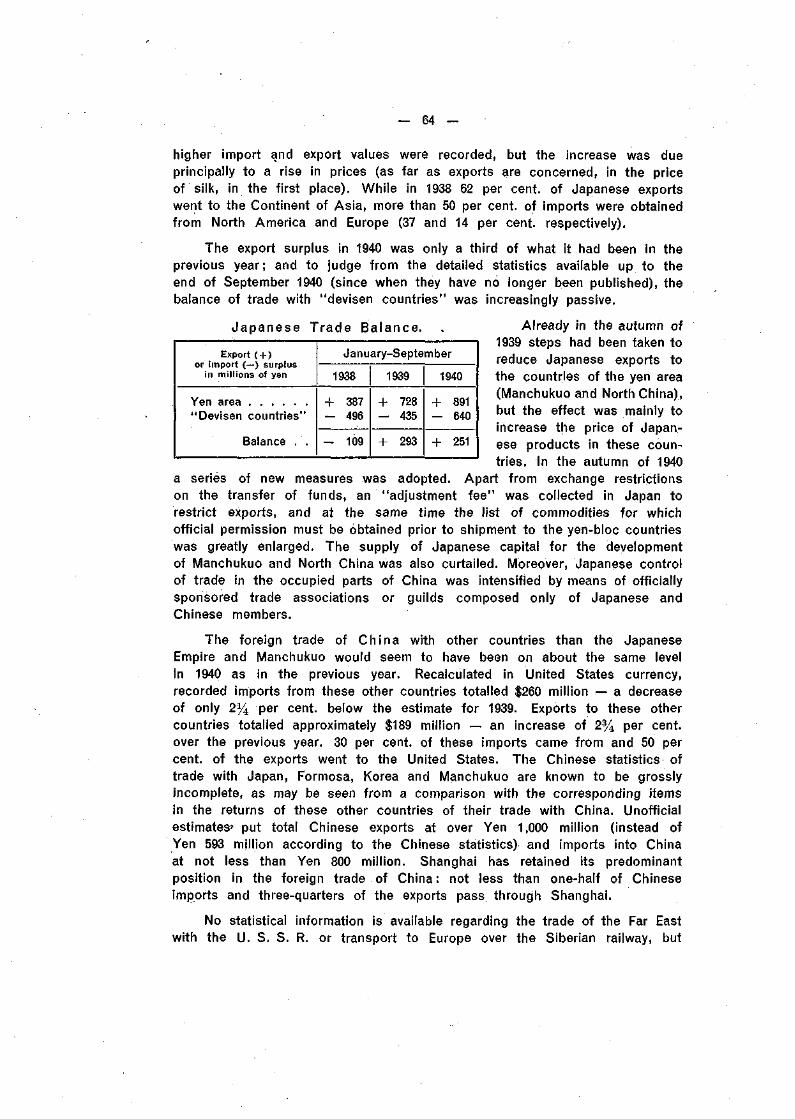
- 64
higher import and export values were recorded, but the increase was dueprincipally to a rise in prices (as far as exports are concerned, in the priceof silk, in the first place). While in 1938 62 per cent, of Japanese exportswent to the Continent of Asia, more than 50 per cent, of imports were obtainedfrom North America and Europe (37 and 14 per cent, respectively).
The export surplus in 1940 was only a third of what it had been in theprevious year; and to judge from the detailed statistics available up to theend of September 1940 (since when they have no longer been published), thebalance of trade with "devisen countries" was increasingly passive.
Japanese Trade Balance.
Export ( + )or import (—) surplus
in millions of yen
Yen area"Devisen countries"
Balance . .
January-September
1938
+ 387- 496
— 109
1939
+ 728- 435
+ 293
1940
+ 891— 640
+ 251
Already in the autumn of1939 steps had been taken toreduce Japanese exports tothe countries of the yen area(Manchukuo and North China),but the effect was mainly toincrease the price of Japan-ese products in these coun-tries. In the autumn of 1940
a series of new measures was adopted. Apart from exchange restrictionson the transfer of funds, an "adjustment fee" was collected in Japan torestrict exports, and at the same time the list of commodities for whichofficial permission must be obtained prior to shipment to the yen-bloc countrieswas greatly enlarged. The supply of Japanese capital for the developmentof Manchukuo and North China was also curtailed. Moreover, Japanese controlof trade in the occupied parts of China was intensified by means of officiallysponsored trade associations or guilds composed only of Japanese andChinese members.
The foreign trade of China with other countries than the JapaneseEmpire and Manchukuo would seem to have been on about the same levelin 1940 as in the previous year. Recalculated in United States currency,recorded imports from these other countries totalled $260 million — a decreaseof only 2^4 per cent, below the estimate for 1939. Exports to these othercountries totalled approximately $189 million — an increase of 2% per cent,over the previous year. 30 per cent, of these imports came from and 50 percent, of the exports went to the United States. The Chinese statistics oftrade with Japan, Formosa, Korea and Manchukuo are known to be grosslyincomplete, as may be seen from a comparison with the corresponding itemsin the returns of these other countries of their trade with China. Unofficialestimates» put total Chinese exports at over Yen 1,000 million (instead ofYen 593 million according to the Chinese statistics) and imports into Chinaat not less than Yen 800 million. Shanghai has retained its predominantposition in the foreign trade of China: not less than one-half of Chineseimports and three-quarters of the exports pass through Shanghai.
No statistical information is available regarding the trade of the Far Eastwith the U. S. S. R. or transport to Europe over the Siberian railway, but
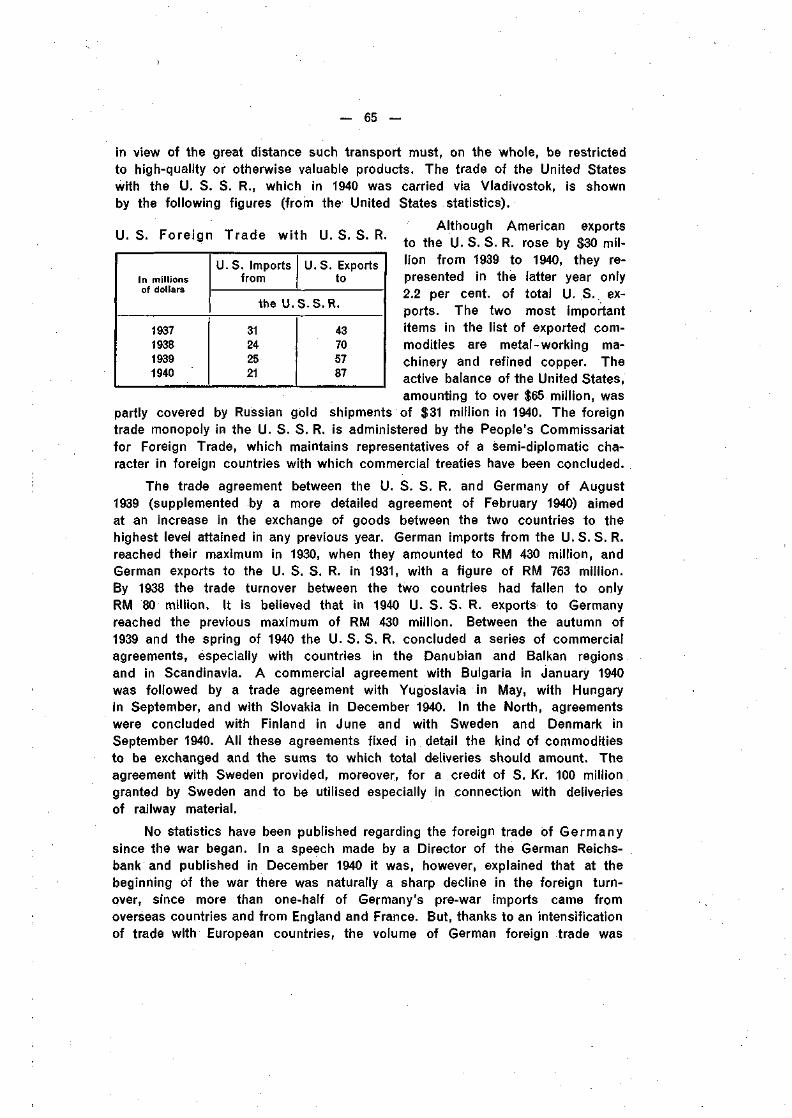
— 65 —
U. S. Foreign Trade with U. S. S. R.
In millionsof dollars
1937193819391940
U. S. Importsfrom
U. S. Exportsto
the U.S.S.R.
31242521
43705787
in view of the great distance such transport must, on the whole, be restrictedto high-quality or otherwise valuable products. The trade of the United Stateswith the U. S. S. R., which in 1940 was carried via Vladivostok, is shownby the following figures (from the United States statistics).
Although American exportsto the U. S. S. R. rose by $30 mil-lion from 1939 to 1940, they re-presented in the latter year only2.2 per cent, of total U .S. .ex-ports. The two most importantitems in the list of exported com-modities are metal-working ma-chinery and refined copper. Theactive balance of the United States,amounting to over $65 million, was
partly covered by Russian gold shipments of $31 million in 1940. The foreigntrade monopoly in the U. S. S. R. is administered by the People's Commissariatfor Foreign Trade, which maintains representatives of a semi-diplomatic cha-racter in foreign countries with which commercial treaties have been concluded.
The trade agreement between the U. S. S. R. and Germany of August1939 (supplemented by a more detailed agreement of February 1940) aimedat an increase in the exchange of goods between the two countries to thehighest level attained in any previous year. German imports from the U.S.S.R.reached their maximum in 1930, when they amounted to RM 430 million, andGerman exports to the U. S. S. R. in 1931, with a figure of RM 763 million.By 1938 the trade turnover between the two countries had fallen to onlyRM 80 million. It is believed that in 1940 U. S. S. R. exports to Germanyreached the previous maximum of RM 430 million. Between the autumn of1939 and the spring of 1940 the U. S. S. R. concluded a series of commercialagreements, especially with countries in the Danubian and Balkan regionsand in Scandinavia. A commercial agreement with Bulgaria in January 1940was followed by a trade agreement with Yugoslavia in May, with Hungaryin September, and with Slovakia in December 1940. In the North, agreementswere concluded with Finland in June and with Sweden and Denmark inSeptember 1940. All these agreements fixed in detail the kind of commoditiesto be exchanged and the sums to which total deliveries should amount. Theagreement with Sweden provided, moreover, for a credit of S. Kr. 100 milliongranted by Sweden and to be utilised especially in connection with deliveriesof railway material.
No statistics have been published regarding the foreign trade of Germanysince the war began. In a speech made by a Director of the German Reichs-bank and published in December 1940 it was, however, explained that at thebeginning óf the war there was naturally a sharp decline in the foreign turn-over, since more than one-half of Germany's pre-war imports came fromoverseas countries and from England and France. But, thanks to an intensificationof trade with European countries, the volume of German foreign trade was
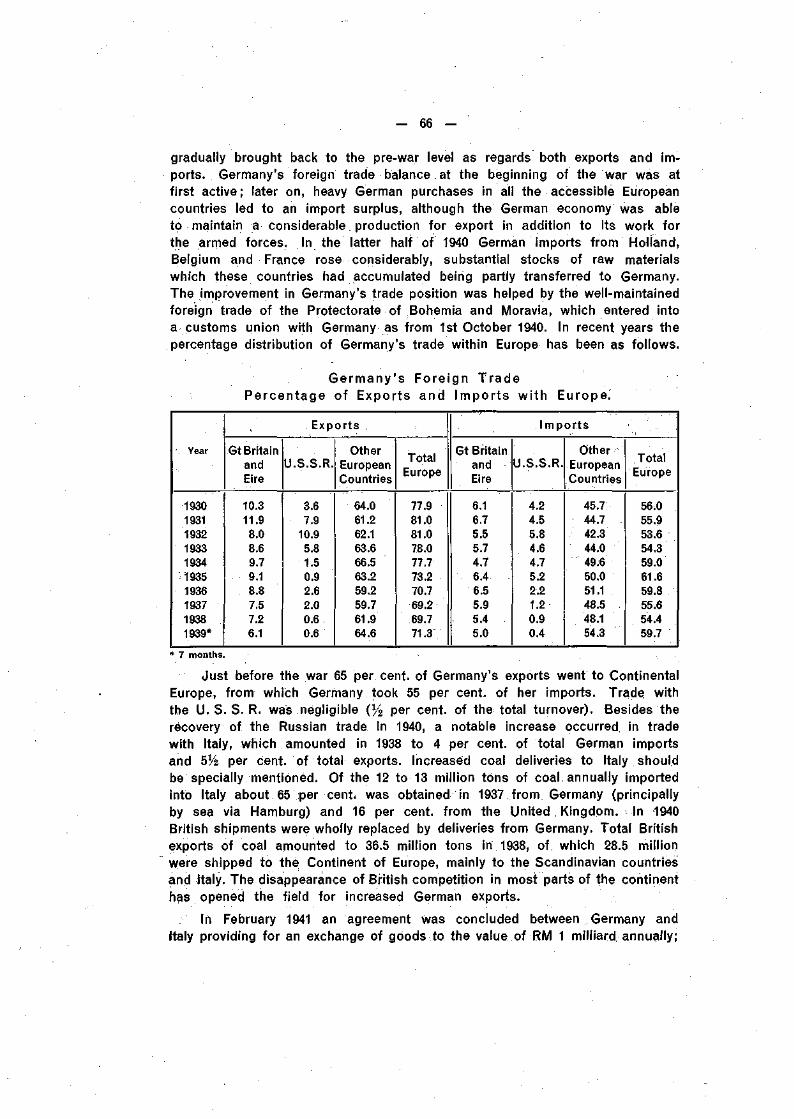
— 66 —
gradually brought back to the pre-war level as regards both exports and im-ports. Germany's foreign trade balance . at the beginning of the war was atfirst active; later on, heavy German purchases in all the accessible Europeancountries led to an import surplus, although the German economy was ableto maintain a considerable production for export in addition to its work forthe armed forces. In the latter half of 1940 German imports from Holland,Belgium and France rose considerably, substantial stocks of raw materialswhich these countries had accumulated being partly transferred to Germany.The improvement in Germany's trade position was helped by the well-maintainedforeign trade of the Protectorate of Bohemia and Moravia, which entered intoa customs union with Germany as from 1st October 1940. In recent years thepercentage distribution of Germany's trade within Europe has been as follows.
Germany's Foreign TradePercentage of Exports and Imports wi th Europe.
Year
1930193119321933193419351936193719381939*
Exports
Gt BritainandEire
10.311.98.08.69.79.18.87.57.26.1
U.S.S.R.
3.67.9
10.95.81.50.92.62.00.60.6
OtherEuropeanCountries
64.061.262.163.666.563.259.259.761.964.6
TotalEurope
77.981.081.078.077.773.270.769.269.771.3
Imports
Gt BritainandEire
6.16.75.55.74.76.46.55.95.45.0
U.S.S.R.
4.24.55.84.64.75.22.21.20.90.4
OtherEuropeanCountries
45.744.742.344.049.650.051.148.548.154.3
TotalEurope
56.055.953.654.359.061.659.855.654.459.7
* 7 months.
Just before the war 65 per cent, of Germany's exports went to ContinentalEurope, from which Germany took 55 per cent, of her imports. Trade withthe U. S. S. R. was negligible (% per cent, of the total turnover). Besides therecovery of the Russian trade in 1940, a notable increase occurred in tradewith Italy, which amounted in 1938 to 4 per cent, of total German importsand ö ^ per cent, of total exports. Increased coal deliveries to Italy shouldbe specially mentioned. Of the 12 to 13 million tons of coal annually importedinto Italy about 65 per cent, was obtained in 1937 from Germany (principallyby sea via Hamburg) and 16 per cent, from the United Kingdom. In 1940British shipments were wholly replaced by deliveries from Germany. Total Britishexports of coal amounted to 36.5 million tons in 1938, of which 28.5 millionwere shipped to the Continent of Europe, mainly to the Scandinavian countriesand Italy. The disappearance of British competition in most parts of the continenthas opened the field for increased German exports.
In February 1941 an agreement was concluded between Germany andItaly providing for an exchange of goods to the value of RM 1 milliard annually;
— 67 —
at the same time it was agreed that for the duration of the war all deliveriesof military importance should be continued without regard to equilibrium inthe balance of payments or the position of the clearing accounts.
In Italy also, regular publication of foreign trade returns has been dis-continued since the beginning of the war, but the global figures for 1940have been disclosed. According to these figures imports increased by someLit. 2.9 milliard to Lit. 12.9 milliard, about 30 per cent., this being the highestlevel reached since 1931 (except for the year 1937, when the necessity ofreplenishing stocks after the Abyssinian campaign swelled imports to a recordfigure of Lit. 13.6 milliard). Exports in 1940 amounted to Lit. 9.2 milliard,compared with Lit. 8.5 milliard in the previous year, thus increasing by 9 percent. In the whole period 1931—40 the highest exports were attained in 1931with a figure of Lit. 10 milliard, i. e. before the great depression had madeits full effects felt in Italy. The passive trade balance rose from Lit. 1.5 mil-liard in 1939 to Lit. 3.7 milliard in 1940, which is below the previous recordof Lit. 5.7 milliard in 1937. It is officially stated that the deficit in the tradebalance was largely due to the payment of higher prices for imported goodsand to the necessity of accumulating stocks. It is added that in the balanceof payments the deficit on merchandise account was largely offset by certainactive items, such as shipping freights (during the first five months of theyear), and by a reduction in certain passive items, such as the service ofItalian foreign loans, the transfer of which has been suspended since June1940.
According to statistics compiled by the Confederation of Commerce84 per cent, of the total volume of foreign goods entering Italy in 1938 arrivedby sea, by the following routes :
Through Gibraltar 79.1 per cent.
,, Suez 5.5 ,, ,,
,, the Dardanelles 4.8 ,, ,,
,, the Mediterranean Basin 10.6 ,, ,,
Total 100.0 per cent.
Although the overseas trade of Italy came practically to a standstill uponher entry into the war, the loss thus sustained was partly counterbalancedby an increase in the traffic with Continental Europe, particularly with Germany,Switzerland, Sweden and Spain. During the last seven months of 1940 Germanytook 41 per cent, of Italy's exports, providing some 47 per cent, of her imports.The exchange of goods between Italy and countries in the Danubian andBalkan regions seems also to have made further progress during 1940.
The following table summarises the trade returns of the Danubian andBalkan count r ies for 1939 and 1940. Not only value figures but also quanti-ties (in weight) have been given; great increases having occurred in commodityprices, a comparison on the basis of value figures alone is no longer con-clusive.
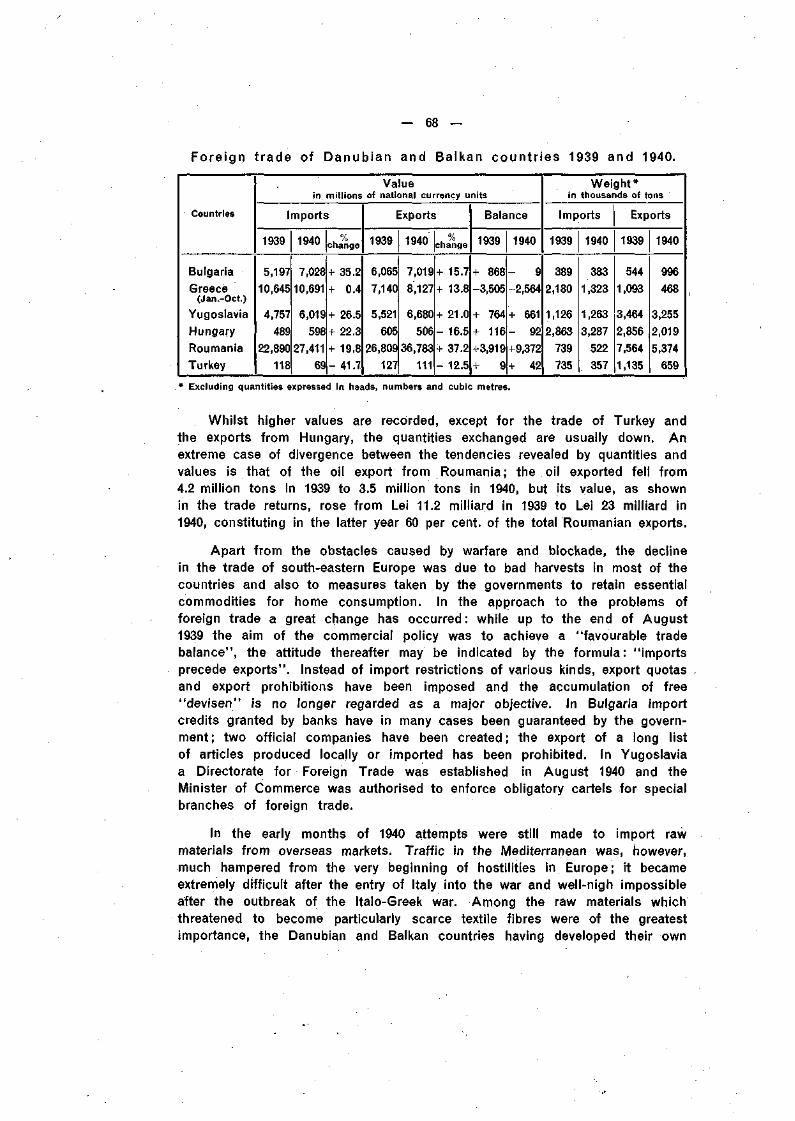
— 68 —
Foreign
Countries
BulgariaGreece
(Jan.-Oct.)YugoslaviaHungaryRoumaniaTurkey
trade of IDanubian
in millions
Imports
1939
5,197
10,645
4,757
48922,890
118
1940
7,028
10,691
6,019
59827,411
69
change
+ 35.2
+ 0.4
+ 26.5
+ 22.3
+ 19.8
- 41.7
and Balkan countries 1939 and 1940.
Valueof national currency units
Exports
1939
6,065
7,140
5,521
60526,809
127
1940
7,019
8,127
6,680
50636,783
111
u %
change
+ 15.7+ 13.8
+ 21.0
- 16.5
+ 37.2
- 12.5
Balance
1939
+ 868
-3,505
+ 764
+ 116
+3,919
+ 9
1940
- 9
-2,564
+ 661
- 92
+9,372
+ 42
inW e i g h t *
thousands of tons
Imports
1939
3892,180
1,126
2,863
739735
1940
3831,323
1,263
3,287
522357
Exports
1939
5441,093
3,464
2,856
7,564
1,135
1940
996468
3,255
2,019
5,374
659
* Excluding quantities expressed In heads, numbers and cubic metres.
Whilst higher values are recorded, except for the trade of Turkey andthe exports from Hungary, the quantities exchanged are usually down. Anextreme case of divergence between the tendencies revealed by quantities andvalues is that of the oil export from Roumania; the oil exported fell from4.2 million tons in 1939 to 3.5 million tons in 1940, but its value, as shownin the trade returns, rose from Lei 11.2 milliard in 1939 to Lei 23 milliard in1940, constituting in the latter year 60 per cent, of the total Roumanian exports.
Apart from the obstacles caused by warfare and blockade, the declinein the trade of south-eastern Europe was due to bad harvests in most of thecountries and also to measures taken by the governments to retain essentialcommodities for home consumption. In the approach to the problems offoreign trade a great change has occurred: while up to the end of August1939 the aim of the commercial policy was to achieve a "favourable tradebalance", the attitude thereafter may be indicated by the formula: "importsprecede exports". Instead of import restrictions of various kinds, export quotasand export prohibitions have been imposed and the accumulation of free"devisen" is no longer regarded as a major objective. In Bulgaria importcredits granted by banks have in many cases been guaranteed by the govern-ment; two official companies have been created; the export of a long listof articles produced locally or imported has been prohibited. In Yugoslaviaa Directorate for Foreign Trade was established in August 1940 and theMinister of Commerce was authorised to enforce obligatory cartels for specialbranches of foreign trade.
In the early months of 1940 attempts were still made to import rawmaterials from overseas markets. Traffic in the Mediterranean was, however,much hampered from the very beginning of hostilities in Europe; it becameextremely difficult after the entry of Italy into the war and well-nigh impossibleafter the outbreak of the Italo-Greek war. Among the raw materials whichthreatened to become particularly scarce textile fibres were of the greatestimportance, the Danubian and Balkan countries having developed their own
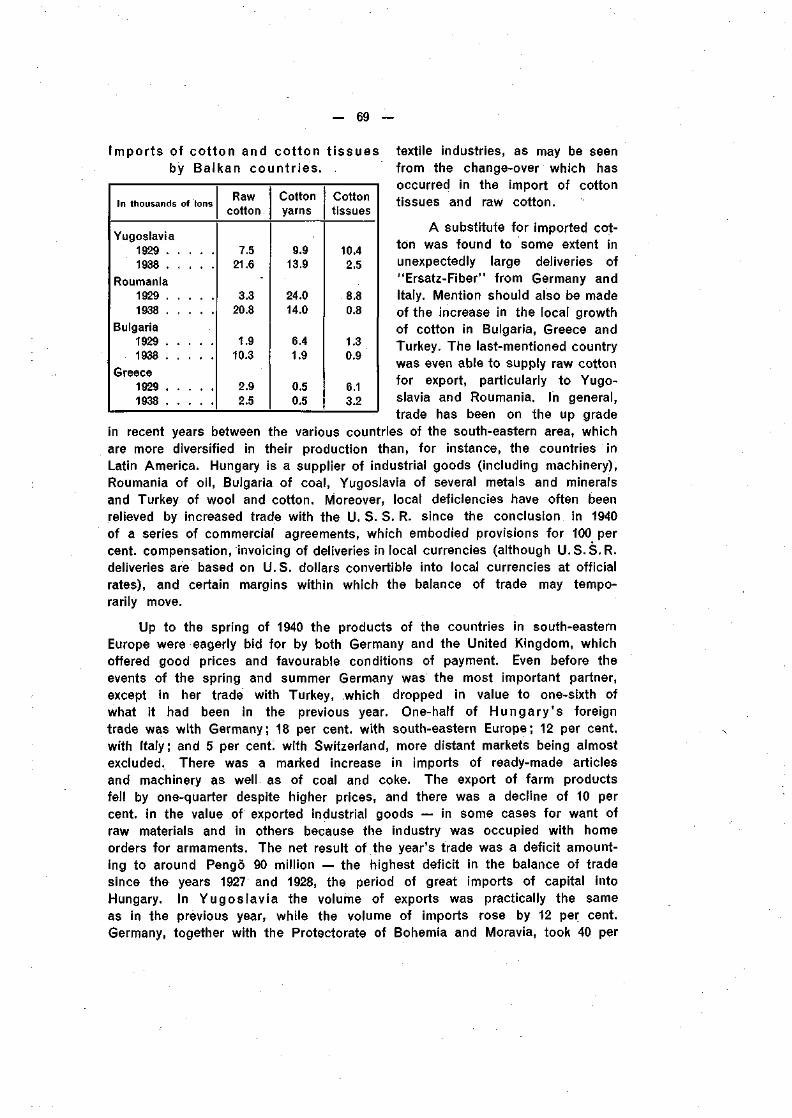
— 69
Imports of cotton and cotton tissuesby Balkan countries.
In thousands of tons
Yugoslavia19291938
Roumania19291938
Bulgaria19291938
Greece19291938
Rawcotton
7.521.6
3.320.8
1.910.3
2.92.5
Cottonyarns
9.913.9
24.014.0
6.41.9
0.50.5
Cottontissues
10.42.5
8.80.8
1.30.9
6.13.2
textile industries, as may be seenfrom the change-over which hasoccurred in the import of cottontissues and raw cotton.
A substitute for imported cot-ton was found to some extent inunexpectedly large deliveries of"Ersatz-Fiber" from Germany andItaly. Mention should also be madeof the increase in the local growthof cotton in Bulgaria, Greece andTurkey. The last-mentioned countrywas even able to supply raw cottonfor export, particularly to Yugo-slavia and Roumania. In general,trade has been on the up grade
in recent years between the various countries of the south-eastern area, whichare more diversified in their production than, for instance, the countries inLatin America. Hungary is a supplier of industrial goods (including machinery),Roumania of oil, Bulgaria of coal, Yugoslavia of several metals and mineralsand Turkey of wool and cotton. Moreover, local deficiencies have often beenrelieved by increased trade with the U. S. S. R. since the conclusion in 1940of a series of commercial agreements, which embodied provisions for 100 percent, compensation, invoicing of deliveries in local currencies (although U.S.S.R.deliveries are based on U.S. dollars convertible into local currencies at officialrates), and certain margins within which the balance of trade may tempo-rarily move.
Up to the spring of 1940 the products of the countries in south-easternEurope were eagerly bid for by both Germany and the United Kingdom, whichoffered good prices and favourable conditions of payment. Even before theevents of the spring and summer Germany was the most important partner,except in her trade with Turkey, which dropped in value to one-sixth ofwhat it had been in the previous year. One-half of Hungary 's foreigntrade was with Germany; 18 per cent, with south-eastern Europe; 12 per cent,with Italy; and 5 per cent, with Switzerland, more distant markets being almostexcluded. There was a marked increase in imports of ready-made articlesand machinery as well as of coal and coke. The export of farm productsfell by one-quarter despite higher prices, and there was a decline of 10 percent, in the value of exported industrial goods — in some cases for want ofraw materials and in others because the industry was occupied with homeorders for armaments. The net result of the year's trade was a deficit amount-ing to around Pengö 90 million — the highest deficit in the balance of tradesince the years 1927 and 1928, the period of great imports of capital intoHungary. In Yugoslavia the volume of exports was practically the sameas in the previous year, while the volume of imports rose by 12 per cent.Germany, together with the Protectorate of Bohemia and Moravia, took 40 per
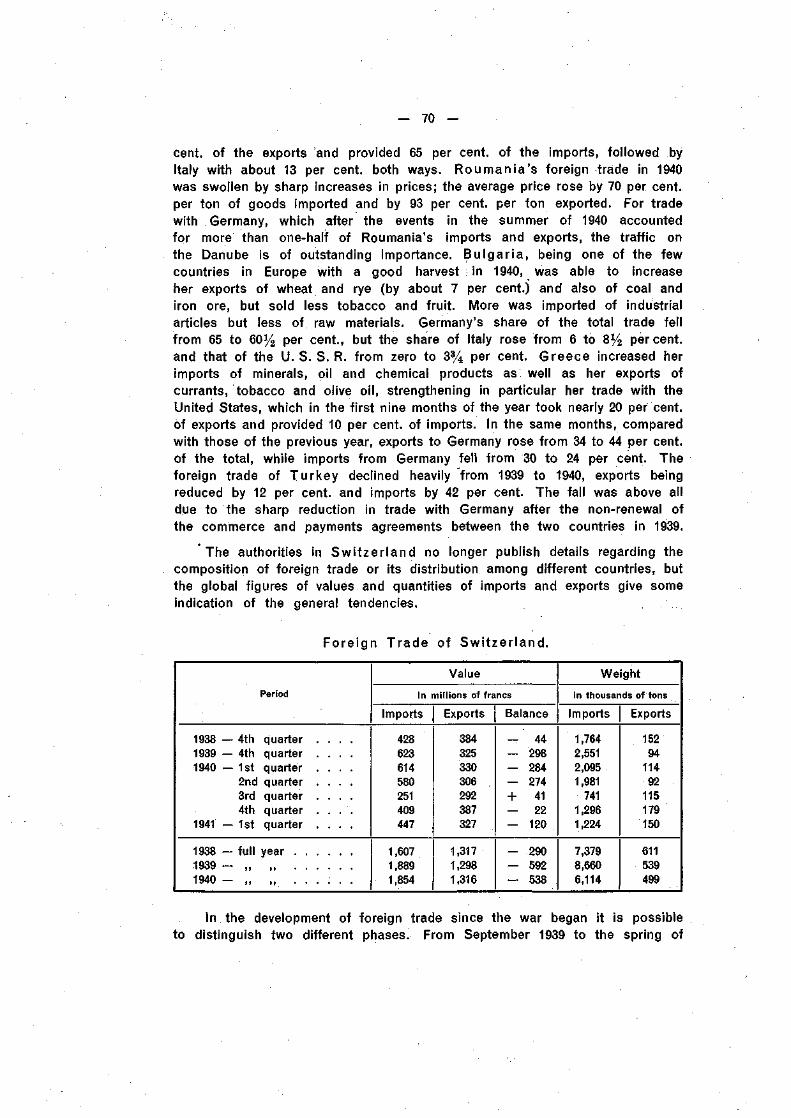
— 70 —
cent, of the exports and provided 65 per cent, of the imports, followed byItaly with about 13 per cent, both ways. Roumania's foreign trade in 1940was swollen by sharp increases in prices; the average price rose by 70 per cent,per ton of goods imported and by 93 per cent, per ton exported. For tradewith Germany, which after the events in the summer of 1940 accountedfor more than one-half of Roumania's imports and exports, the traffic onthe Danube is of outstanding importance. Bulgar ia , being one of the fewcountries in Europe with a good harvest in 1940, was able to increaseher exports of wheat and rye (by about 7 per cent.) and also of coal andiron ore, but sold less tobacco and fruit. More was imported of industrialarticles but less of raw materials. Germany's share of the total trade fellfrom 65 to 60% per cent., but the share of Italy rose from 6 to 8% percent,and that of the U. S. S. R. from zero to 3% per cent. Greece increased herimports of minerals, oil and chemical products as well as her exports ofcurrants, tobacco and olive oil, strengthening in particular her trade with theUnited States, which in the first nine months of the year took nearly 20 per cent,of exports and provided 10 per cent, of imports. In the same months, comparedwith those of the previous year, exports to Germany rose from 34 to 44 per cent,of the total, while imports from Germany fell from 30 to 24 per cent. Theforeign trade of Turkey declined heavily from 1939 to 1940, exports beingreduced by 12 per cent, and imports by 42 per cent. The fall was above alldue to the sharp reduction in trade with Germany after the non-renewal ofthe commerce and payments agreements between the two countries in 1939.
The authorities in Swi tzer land no longer publish details regarding thecomposition of foreign trade or its distribution among different countries, butthe global figures of values and quantities of imports and exports give someindication of the general tendencies.
Foreign Trade of Swi tzer land.
Period
1 9 3 8 — 4 t h q u a r t e r . . . .1 9 3 9 — 4 t h q u a r t e r . . . .1 9 4 0 — 1 s t q u a r t e r . . . .
2 n d q u a r t e r . . . .3 r d q u a r t e r . . . .4 t h q u a r t e r . . . .
1 9 4 1 — 1 s t q u a r t e r . . . .
1 9 3 8 - f u l l y e a r1 9 3 9 - „ „1 9 4 0 -
V a l u e
in millions of francs
Imports
428623614580251409447
1,6071,8891,854
Exports
384325330306292387327
1,3171,2981,316
Balance
- 44— 298— 284- 274+ 41— 22- 120
- 290- 592— 538
Weight
in thousands of tons
Imports
1,7642,5512,0951,981
7411,2961,224
7,3798,6606,114
Exports
15294
11492
115179150
611539499
In the development of foreign trade since the war began it is possibleto distinguish two different phases. From September 1939 to the spring of
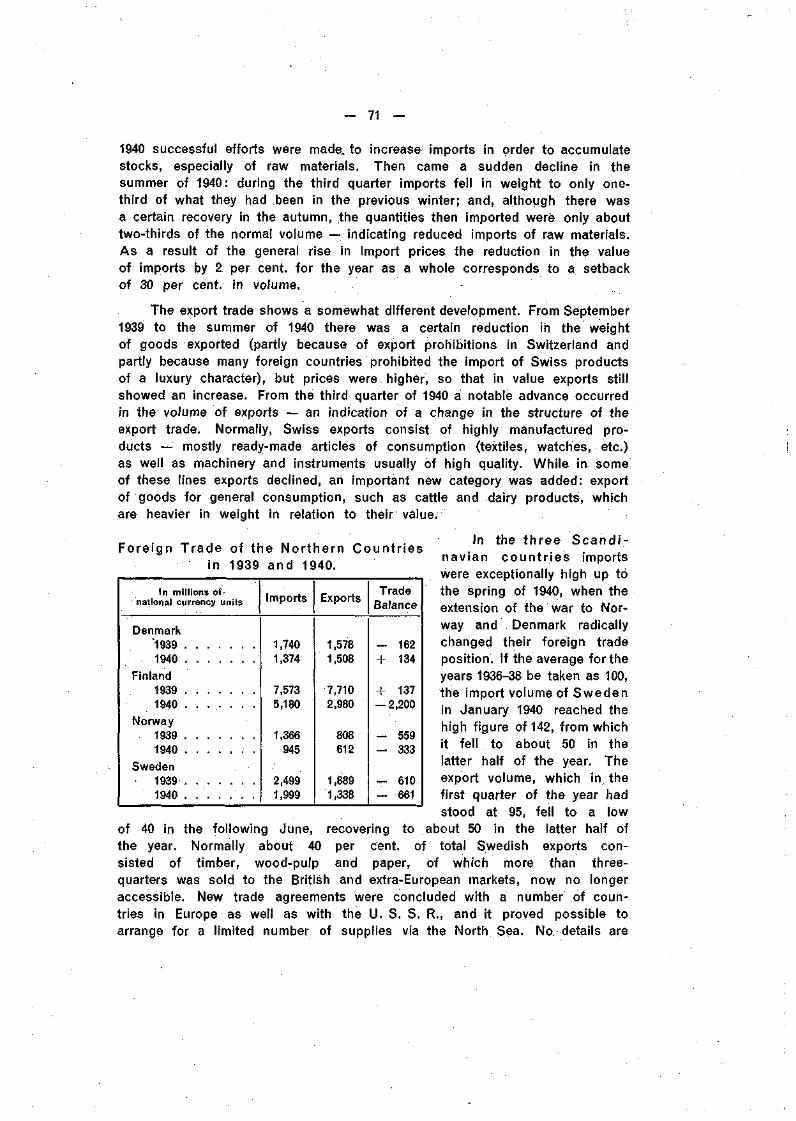
— 71 —
1940 successful efforts were made, to increase imports in order to accumulatestocks, especially of raw materials. Then came a sudden decline in thesummer of 1940: during the third quarter imports fell in weight to only one-third of what they had been in the previous winter; and, although there wasa certain recovery in the autumn, the quantities then imported were only abouttwo-thirds of the normal volume — indicating reduced imports of raw materials.As a result of the general rise in import prices the reduction in the valueof imports by 2 per cent, for the year as a whole corresponds to a setbackof 30 per cent, in volume.
The export trade shows a somewhat different development. From September1939 to the summer of 1940 there was a certain reduction in the weightof goods exported (partly because of export prohibitions in Switzerland andpartly because many foreign countries prohibited thé import of Swiss productsof a luxury character), but prices were, higher, so that in value exports stillshowed an increase. From the third quarter of 1940 a notable advance occurredin the volume of exports — an indication of a change in the structure of theexport trade. Normally, Swiss exports consist of highly manufactured pro-ducts — mostly ready-made articles of consumption (textiles, watches, etc.)as well as machinery and instruments usually of high quality. While in someof these lines exports declined, an important new category was added: exportof goods for general consumption, such as cattle and dairy products, whichare heavier in weight in relation to their value.
Foreign Trade of the Northern Countr iesin 1939 and 1940.
In the three Scand i -navian count r ies importswere exceptionally high up tòthe spring of 1940, when theextension of the war to Nor-way and Denmark radicallychanged their foreign tradeposition. If the average for theyears 1936-38 be taken as 100,the import volume of Swedenin January 1940 reached thehigh figure of 142, from whichit fell to about 50 in thelatter half of the year. Theexport volume, which in thefirst quarter of the year hadstood at 95, fell to a low
of 40 in the following June, recovering to about 50 in the latter half ofthe year. Normally about 40 per cent, of total Swedish exports con-sisted of timber, wood-pulp and paper, of which more than three-quarters was sold to the British and extra-European markets, now no longeraccessible. New trade agreements were concluded with a number of coun-tries in Europe as well as with the U. S. S. R., and it proved possible toarrange for a limited number of supplies via the North Sea- No details are
In millions ofnational currency units
Denmark'19391940 . . . . . . .
F in land1939 . . . . . . .1940
N o r w a y19391940
Sweden19391940 . . . . . . .
Impor t s
1,7401,374
7,5735,180
1,366945
2,4991,999
Exports
1,5781,508
7,7102,980
808612
1,8891,338
TradeBalance
— 162+ 134
+ 137-2,200
- 559— • 333
— 610— 661
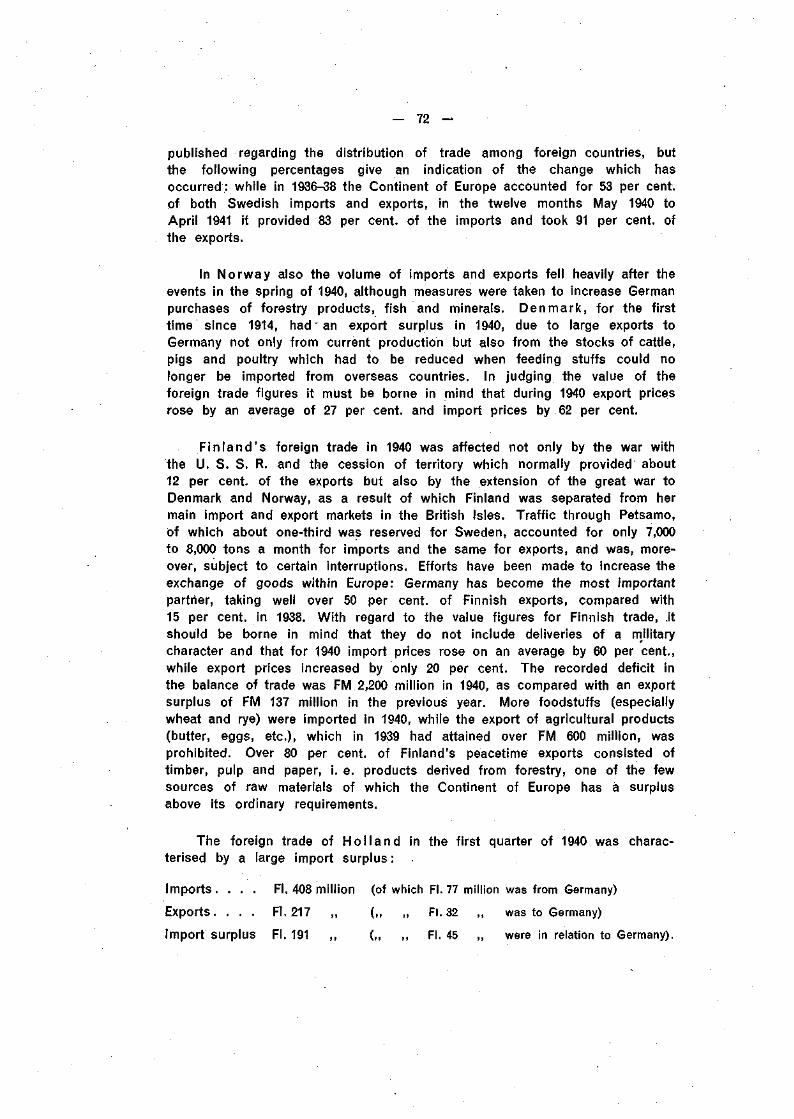
— 72 —
published regarding the distribution of trade among foreign countries, butthe following percentages give an indication of the change which hasoccurred : while in 1936-38 the Continent of Europe accounted for 53 per cent,of both Swedish imports and exports, in the twelve months May 1940 toApril 1941 it provided 83 per cent, of the imports and took 91 per cent, ofthe exports.
In Norway also the volume of imports and exports fell heavily after theevents in the spring of 1940, although measures were taken to increase Germanpurchases of forestry products, fish and minerals. Denmark, for the firsttime since 1914, had an export surplus in 1940, due to large exports toGermany not only from current production but also from the stocks of cattle,pigs and poultry which had to be reduced when feeding stuffs could nolonger be imported from overseas countries. In judging the value of theforeign trade figures it must be borne in mind that during 1940 export pricesrose by an average of 27 per cent, and import prices by 62 per cent.
F in land 's foreign trade in 1940 was affected not only by the war withthe U. S. S. R. and the cession of territory which normally provided about12 per cent, of the exports but also by the extension of the great war toDenmark and Norway, as a result of which Finland was separated from hermain import and export markets in the British Isles. Traffic through Petsamo,of which about one-third was reserved for Sweden, accounted for only 7,000to 8,000 tons a month for imports and the same for exports, and was, more-over, subject to certain interruptions. Efforts have been made to increase theexchange of goods within Europe: Germany has become the most importantpartner, taking well over 50 per cent, of Finnish exports, compared with15 per cent, in 1938. With regard to the value figures for Finnish trade, .itshould be borne in mind that they do not include deliveries of a militarycharacter and that for 1940 import prices rose on an average by 60 per cent.,while export prices increased by only 20 per cent. The recorded deficit inthe balance of trade was FM 2,200 million in 1940, as compared with an exportsurplus of FM 137 million in the previous year. More foodstuffs (especiallywheat and rye) were imported in 1940, while the export of agricultural products(butter, eggs, etc.), which in 1939 had attained over FM 600 million, wasprohibited. Over 80 per cent, of Finland's peacetime exports consisted oftimber, pulp and paper, i. e. products derived from forestry, one of the fewsources of raw materials of which the Continent of Europe has a surplusabove its ordinary requirements.
The foreign trade of Ho l l and in the first quarter of 1940 was charac-terised by a large import surplus :
Imports. . . . FI. 408 million (of which FI. 77 million was from Germany)
Exports. . . . FI. 217 ,, (,, ,, FI. 32 ,, was to Germany)
Import surplus FI. 191 ,, („ „ FI. 45 ,, were in relation to Germany).
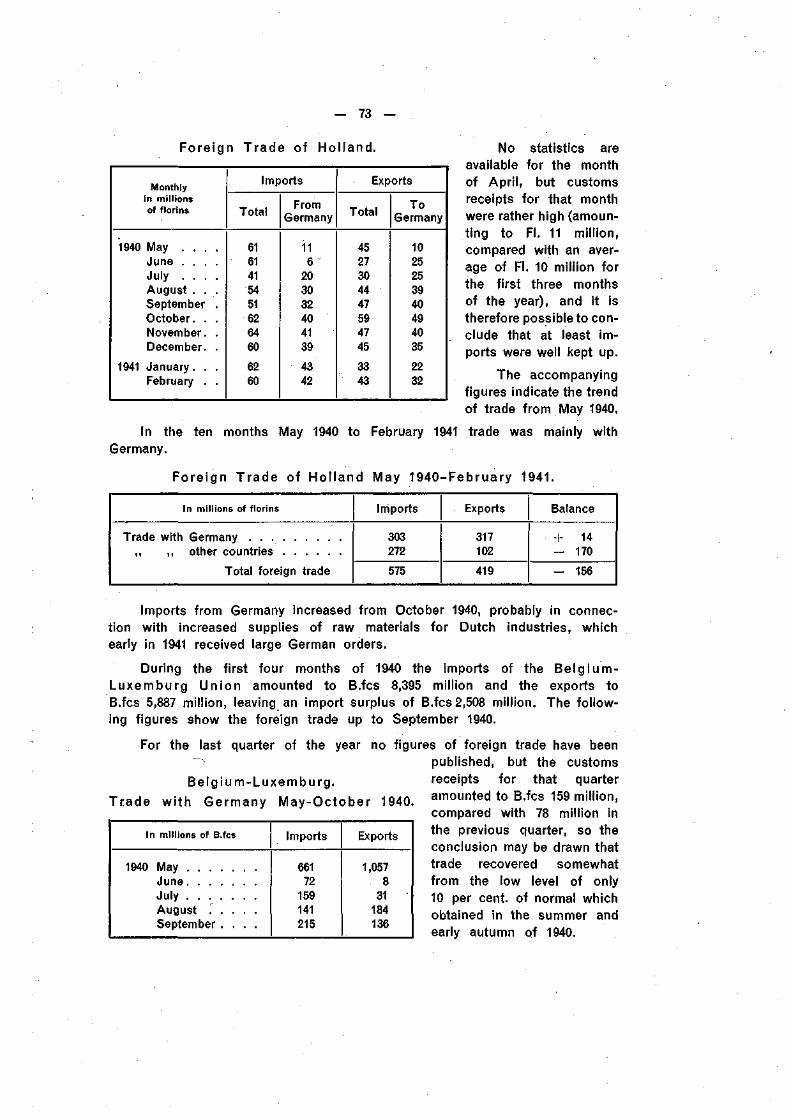
— 73 —
Foreign Trade of Hol land. No statistics areavailable for the monthof April, but customsreceipts for that monthwere rather high (amoun-ting to FI. 11 million,compared with an aver-age of FI. 10 million forthe first three monthsof the year), and it istherefore possible to con-clude that at least im-ports were well kept up.
The accompanyingfigures indicate the trendof trade from May 1940.
In the ten months May 1940 to February 1941 trade was mainly withGermany.
Foreign Trade of Hol land May 1940-February 1941.
Monthlyin millionsof florins
1940 May . . . .June . . . .July . . . .August . . .September .October. . .November. .December. .
1941 January. . .February . .
Imports
Total
6161415451626460
6260
FromGermany
116
203032404139
4342
Exports
Total
4527304447594745
3343
ToGermany
1025253940494035
2232
In millions of florins
Trade with Germany,, ,, other countries
Total foreign trade
Imports
303272
575
Exports
317102
419
Balance
+ 14- 170
- 156
Imports from Germany increased from October 1940, probably in connec-tion with increased supplies of raw materials for Dutch industries, whichearly in 1941 received large German orders.
During the first four months of 1940 the imports of the Be lg ium-Luxemburg Union amounted to B.fcs 8,395 million and the exports toB.fcs 5,887 million, leaving an import surplus of B.fcs 2,508 million. The follow-ing figures show the foreign trade up to September 1940.
For the last quarter of the year no figures of foreign trade have beenpublished, but the customs
Belgium-Luxemburg.
Trade wi th Germany May-October 1940.
In millions of B.fcs
1940 MayJuneJulyAugust . . . . .September . . . .
Imports
66172
159141215
Exports
1,0578
31 •
184136
receipts for that quarteramounted to B.fcs 159 million,compared with 78 million inthe previous quarter, so theconclusion may be drawn thattrade recovered somewhatfrom the low level of only10 per cent, of normal whichobtained in the summer andearly autumn of 1940.
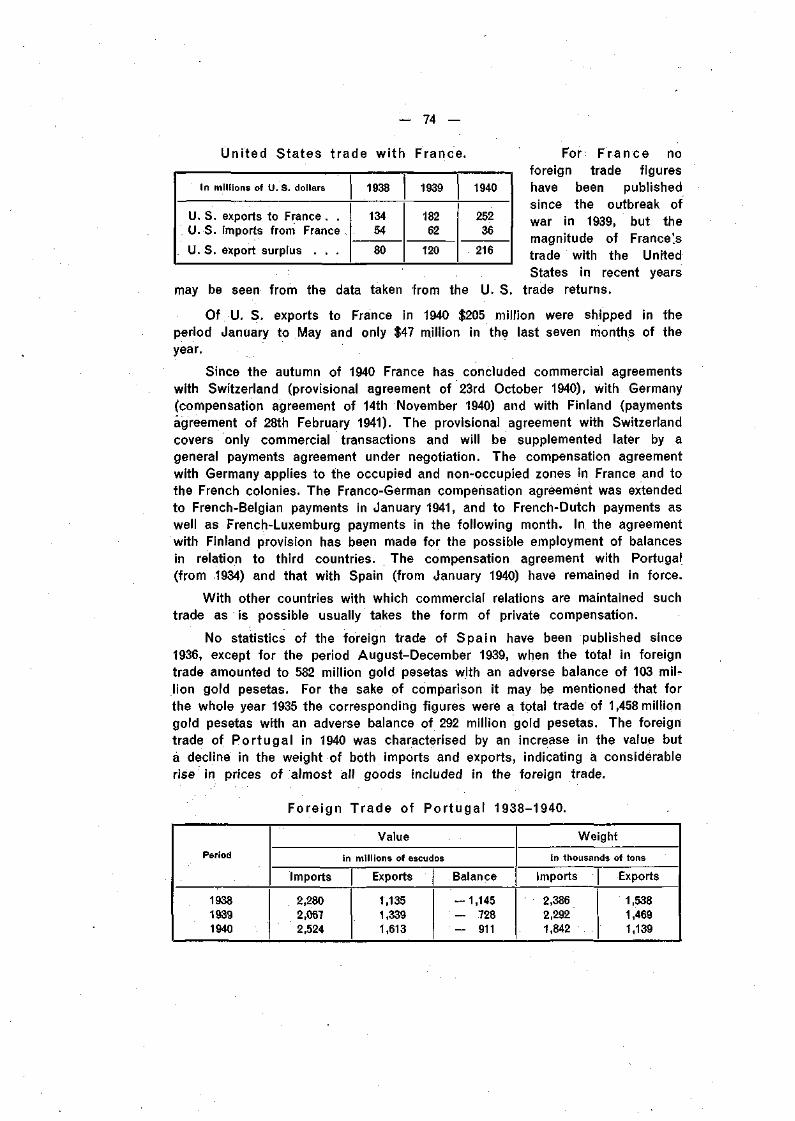
- 74 -
In millions of U.S. dollars
U. S. exports to France . .U. S. imports from France .
U.S. export surplus . . .
1938
13454
80
1939
18262
120
1940
25236
216
United States trade wi th France. For France noforeign trade figureshave been publishedsince the outbreak ofwar in 1939, but themagnitude of France'.strade with the UnitedStates in recent years
may be seen from the data taken from the U. S. trade returns.
Of U. S. exports to France in 1940 $205 million were shipped in theperiod January to May and only $47 million in the last seven months of theyear.
Since the autumn of 1940 France has concluded commercial agreementswith Switzerland (provisional agreement of 23rd October 1940), with Germany(compensation agreement of 14th November 1940) and with Finland (paymentsagreement of 28th February 1941). The provisional agreement with Switzerlandcovers only commercial transactions and will be supplemented later by ageneral payments agreement under negotiation. The compensation agreementwith Germany applies to the occupied and non-occupied zones in France and tothe French colonies. The Franco-German compensation agreement was extendedto French-Belgian payments in January 1941, and to French-Dutch payments aswell as French-Luxemburg payments in the following month. In the agreementwith Finland provision has been made for the possible employment of balancesin relation to third countries. The compensation agreement with Portugal(from 1934) and that with Spain (from January 1940) have remained in force.
With other countries with which commercial relations are maintained suchtrade as is possible usually takes the form of private compensation.
No statistics of the foreign trade of Spain have been published since1936, except for the period August-December 1939, when the total in foreigntrade amounted to 582 million gold pesetas with an adverse balance of 103 mil:-lion gold pesetas. For the sake of comparison it may be mentioned that forthe whole year 1935 the corresponding figures were a total trade of 1,458 milliongold pesetas with an adverse balance of 292 million gold pesetas. The foreigntrade of Por tugal in 1940 was characterised by an increase in the value buta decline in the weight of both imports and exports, indicating a considerablerise in prices of almost all goods included in the foreign trade.
Foreign Trade of Por tugal 1938-1940.
Period
193819391940
Imports
2,2802,0672,524
Value
in millions of escudos
Exports |
1,1351,3391,613
Balance
-1 ,145- 728— 911
Weight
in thousands of tons
Imports
2,3862,2921,842
Exports
1,5381,4691,139
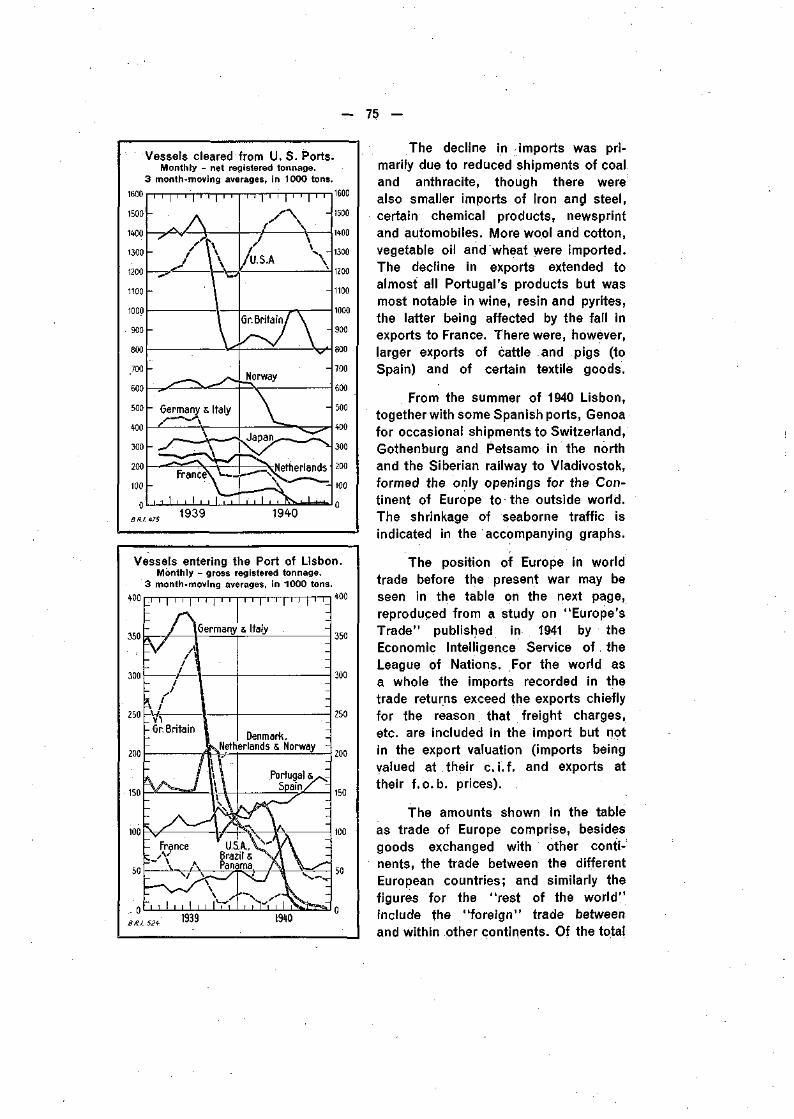
— 75 —
Vessels cleared from U. S. Ports.Monthly - net registered tonnage.
3 month-moving averages, in 1000 tons.1600
1 9 4 0
Vessels entering the Port of Lisbon.Monthly - gross registered tonnage.
3 month-moving averages, in 1000 tons.
Denmark,Netherlands s Norway
- rrance U.S.A.,Ï A( Brazils
A Panama
MO
The decline in imports was pri-marily due to reduced shipments of coaland anthracite, though there werealso smaller imports of iron and steel,certain chemical products, newsprintand automobiles. More wool and cotton,vegetable oil and wheat were imported.The decline in exports extended toalmost all Portugal's products but wasmost notable in wine, resin and pyrites,the latter being affected by the fall inexports to France. There were, however,larger exports of cattle and pigs (toSpain) and of certain textile goods.
From the summer of 1940 Lisbon,together with some Spanish ports, Genoafor occasional shipments to Switzerland,Gothenburg and Petsamo in the northand the Siberian railway to Vladivostok,formed the only openings for the Con-tinent of Europe to the outside world.The shrinkage of seaborne traffic isindicated in the accompanying graphs.
The position of Europe in worldtrade before the present war may beseen in the table on the next page,reproduced from a study on "Europe'sTrade" published in 1941 by theEconomic Intelligence Service of theLeague of Nations. For the world asa whole the imports recorded in thetrade returns exceed the exports chieflyfor the reason that freight charges,etc. are included in the import but notin the export valuation (imports beingvalued at their c i . f . and exports attheir f .o. b. prices).
The amounts shown in the tableas trade of Europe comprise, besidesgoods exchanged with other conti-nents, the trade between the differentEuropean countries; and similarly thefigures for the "rest of the world"include the "foreign" trade betweenand within other continents. Of the total
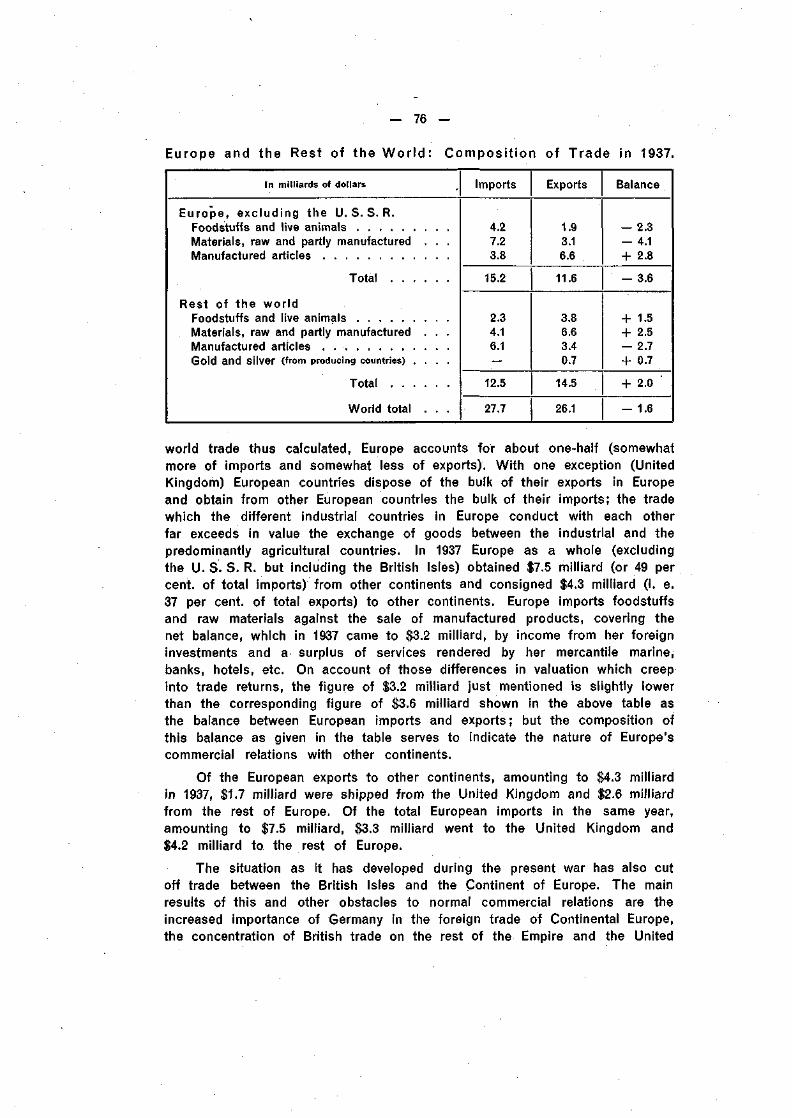
— 76 —
Europe and the Rest of the World: Composition of Trade in 1937.
In milliards of dollars
Europe, excluding the U. S. S. R.Foodstuffs and live animalsMaterials, raw and partly manufactured . . .Manufactured articles
Total
Rest of the wor ldFoodstuffs and live animalsMaterials, raw and partly manufactured . . .Manufactured articles .G o l d a n d S i l v e r ( f r o m p r o d u c i n g c o u n t r i e s ) . . . .
Total
World total . . .
Imports
4.27.23.8
15.2
2.34.16.1
12.5
27.7
Exports
1.93.16.6
11.6
3.86.63.40.7
14.5
26.1
Balance
- 2.3— 4.1+ 2.8
- 3.6
+ 1.5+ 2.5— 2.7+ 0.7
+ 2.0
- 1.6
world trade thus calculated, Europe accounts for about one-half (somewhatmore of imports and somewhat less of exports). With one exception (UnitedKingdom) European countries dispose of the bulk of their exports in Europeand obtain from other European countries the bulk of their imports; the tradewhich the different industrial countries in Europe conduct with each otherfar exceeds in value the exchange of goods between the industrial and thepredominantly agricultural countries. In 1937 Europe as a whole (excludingthe U. S. S. R. but including the British Isles) obtained $7.5 milliard (or 49 percent, of total imports) from other continents and consigned $4.3 milliard (i. e.37 per cent, of total exports) to other continents. Europe imports foodstuffsand raw materials against the sale of manufactured products, covering thenet balance, which in 1937 came to $3.2 milliard, by income from her foreigninvestments and a surplus of services rendered by her mercantile marine,banks, hotels, etc. On account of those differences in valuation which creepinto trade returns, the figure of $3.2 milliard just mentioned is slightly lowerthan the corresponding figure of $3.6 milliard shown in the above table asthe balance between European imports and exports; but the composition ofthis balance as given in the table serves to indicate the nature of Europe'scommercial relations with other continents.
Of the European exports to other continents, amounting to $4.3 milliardin 1937, $1.7 milliard were shipped from the United Kingdom and $2.6 milliardfrom the rest of Europe. Of the total European imports in the same year,amounting to $7.5 milliard, $3.3 milliard went to the United Kingdom and$4.2 milliard to the rest of Europe.
The situation as it has developed during the present war has also cutoff trade between the British Isles and the Continent of Europe. The mainresults of this and other obstacles to normal commercial relations are theincreased importance of Germany in the foreign trade of Continental Europe,the concentration of British trade on the rest of the Empire and the United
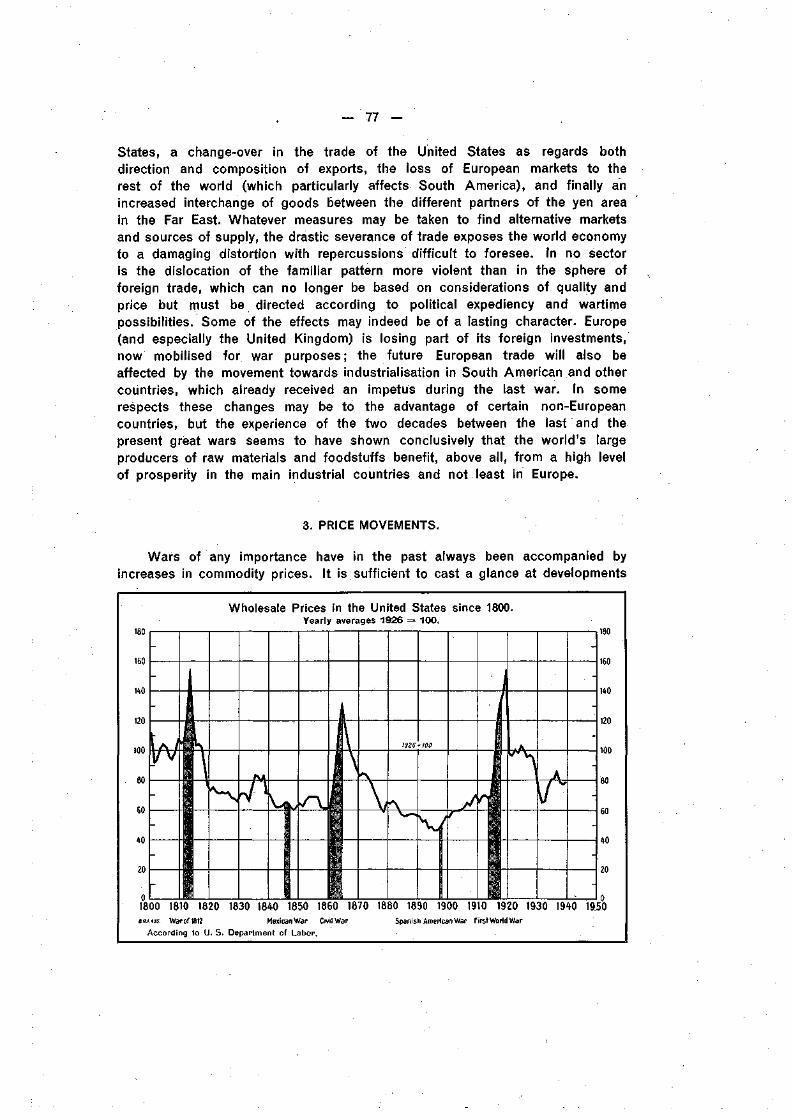
— 77 —
States, a change-over in the trade of the United States as regards bothdirection and composition of exports, the loss of European markets to therest of the world (which particularly affects South America), and finally anincreased interchange of goods between the different partners of the yen areain the Far East. Whatever measures may be taken to find alternative marketsand sources of supply, the drastic severance of trade exposes the world economyto a damaging distortion with repercussions difficult to foresee. In no sectoris the dislocation of the familiar pattern more violent than in the sphere offoreign trade, which can no longer be based on considerations of quality andprice but must be directed according to political expediency and wartimepossibilities. Some of the effects may indeed be of a lasting character. Europe(and especially the United Kingdom) is losing part of its foreign investments,now mobilised for war purposes; the future European trade will also beaffected by the movement towards industrialisation in South American and othercountries, which already received an impetus during the last war. In somerespects these changes may be to the advantage of certain non-Europeancountries, but the experience of the two decades between the last and thepresent great wars seems to have shown conclusively that the world's largeproducers of raw materials and foodstuffs benefit, above all, from a high levelof prosperity in the main industrial countries and not least in Europe.
3. PRICE MOVEMENTS.
Wars of any importance have in the past always been accompanied byincreases in commodity prices. It is sufficient to cast a glance at developments
Wholesale Prices in the United States since 1800.Yearly averages 1926 = 100.
180
V
180
160
140
120
100
80
60
40
20
1800 1810 1820 1830 1840 1850 1860 1870 1880 1890 1900 1910 1920 1930 1940 1930ss.«.«. Warof1812 MexicanWar CivilWar
According to U. S. Department of Labor.
Spanish American War FirstWoridWar
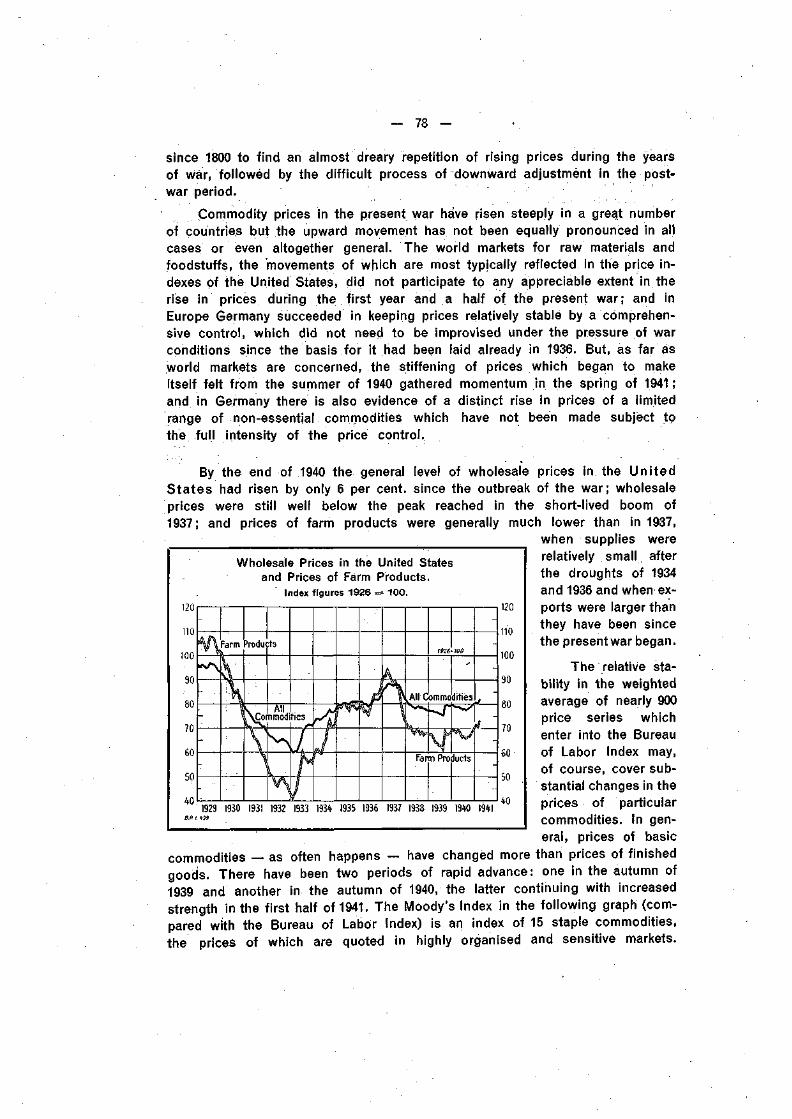
— 78 —
since 1800 to find an almost dreary repetition of rising prices during the yearsof war, followed by the difficult process of downward adjustment in the post-war period.
Commodity prices in the present war have risen steeply in a great numberof countries but the upward movement has not been equally pronounced in allcases or even altogether general. The world markets for raw materials andfoodstuffs, the movements of which are most typically reflected in the price in-dexes of the United States, did not participate to any appreciable extent in therise in prices during the first year and a half of the present war; and inEurope Germany succeeded in keeping prices relatively stable by a comprehen-sive control, which did not need to be improvised under the pressure of warconditions since the basis for it had been laid already in 1936. But, as far asworld markets are concerned, the stiffening of prices which began to makeitself felt from the summer of 1940 gathered momentum in the spring of 1941 ;and in Germany there is also evidence of a distinct rise in prices of a limitedrange of non-essential commodities which have not been made subject tothe full intensity of the price control.
By the end of 1940 the general level of wholesale prices in the UnitedStates had risen by only 6 per cent, since the outbreak of the war; wholesaleprices were still well below the peak reached in the short-lived boom of1937; and prices of farm products were generally much lower than in 1937,
when supplies wererelatively small afterthe droughts of 1934and 1936 and when ex-ports were larger thanthey have been sincethe present war began.
Wholesale Prices in the United Statesand Prices of Farm Products.
Index figures 1926 = 100.
Farm Products
120
110
100
90
70
60
50
The relative sta-bility in the weightedaverage of nearly 900price series whichenter into the Bureauof Labor Index may,of course, cover sub-stantial changes in theprices of particularcommodities. In gen-eral, prices of basic
commodities — as often happens — have changed more than prices of finishedgoods. There have been two periods of rapid advance: one in the autumn of1939 and another in the autumn of 1940, the latter continuing with increasedstrength in the first half of 1941. The Moody's Index in the following graph (com-pared with the Bureau of Labor Index) is an index of 15 staple commodities,the prices of which are quoted in highly organised and sensitive markets.
1929 1930 1931 1932 1933 193 1935 1936 1937 1933 1939 MO 1941B.R.I. 199- • •
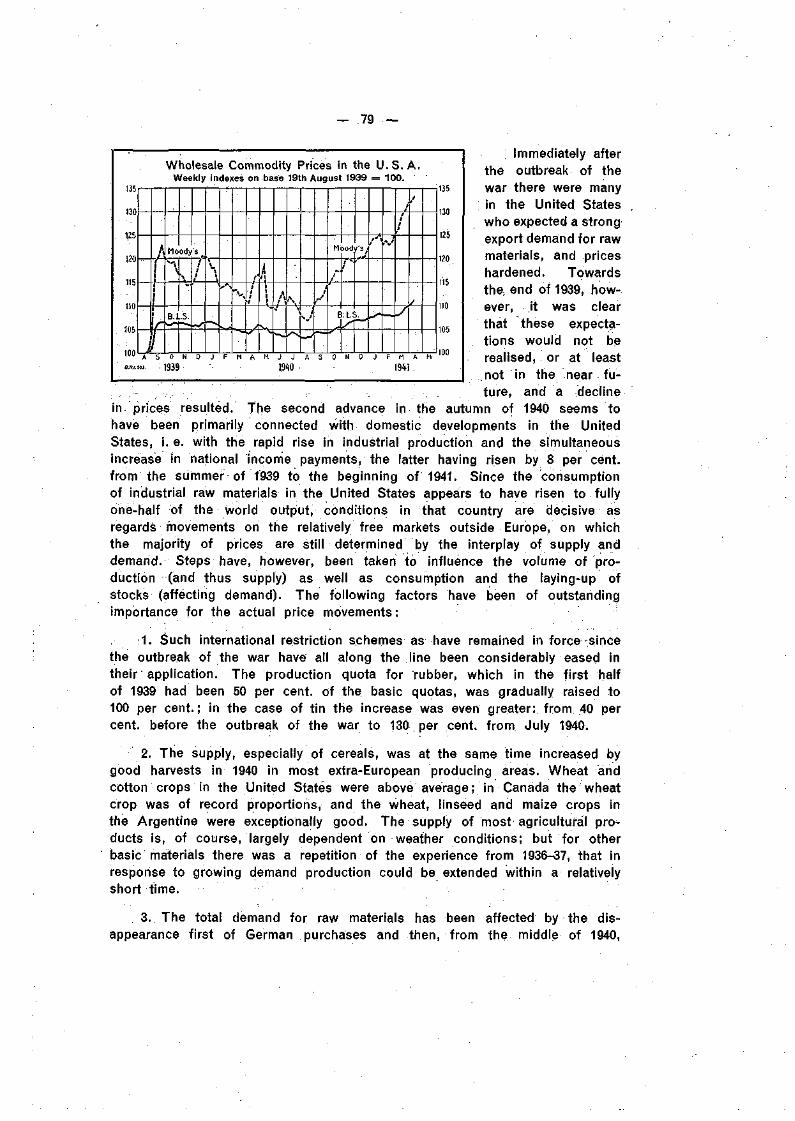
- 79 -
Wholesale Commodity Prices in the U.S.A.Weekly indexes on base 19th August 1939 = 100.
A S O N O J F M A M J J A S O N D J F M A M
1939 19«) - 19*1.
135
130
125
120
115
110
105
100
; Immediately afterthe outbreak of thewar there were manyin the United Stateswho expected a strongexport demand for rawmaterials, and priceshardened. Towardsthe end of 1939, how-ever, it was clearthat these expecta-tions would not berealised, or at leastnot in the near fu-ture, and a decline
in. prices resulted. The second advance in the autumn of 1940 seems tohave been primarily connected with domestic developments in the UnitedStates, i. e. with the rapid rise in industrial production and the simultaneousincrease in national income payments, the latter having risen by 8 per cent,from the summer of 1939 to the beginning of 1941. Since the consumptionof industrial raw materials in the United States appears to have risen to fullyone-half of the world output, conditions in that country are decisive asregards movements on the relatively free markets outside Europe, on whichthe majority of prices are still determined by the interplay of supply anddemand. Steps have, however, been taken to influence the volume of pro-duction (and thus supply) as well as consumption and the laying-up ofstocks (affecting demand). The following factors have been of outstandingimportance for the actual price movements:
1. Such international restriction schemes as have remained in force sincethe outbreak of the war have all along the line been considerably eased intheir application. The production quota for rubber, which in the first halfof 1939 had been 50 per cent, of the basic quotas, was gradually raised to100 per cent.; in the case of tin the increase was even greater: from 40 percent, before the outbreak of the war to 130 per cent, from July 1940.
2. The supply, especially of cereals, was at the same time increased bygood harvests in 1940 in most extra-European producing areas. Wheat andcotton crops in the United States were above average; in Canada the wheatcrop was of record proportions, and the wheat, linseed and maize crops inthe Argentine were exceptionally good. The supply of most agricultural pro-ducts is, of course, largely dependent on weather conditions; but for otherbasic materials there was a repetition of the experience from 1936-37, that inresponse to growing demand production could be extended within a relativelyshort time.
3. The total demand for raw materials has been affected by the dis-appearance first of German purchases and then, from the middle of 1940,
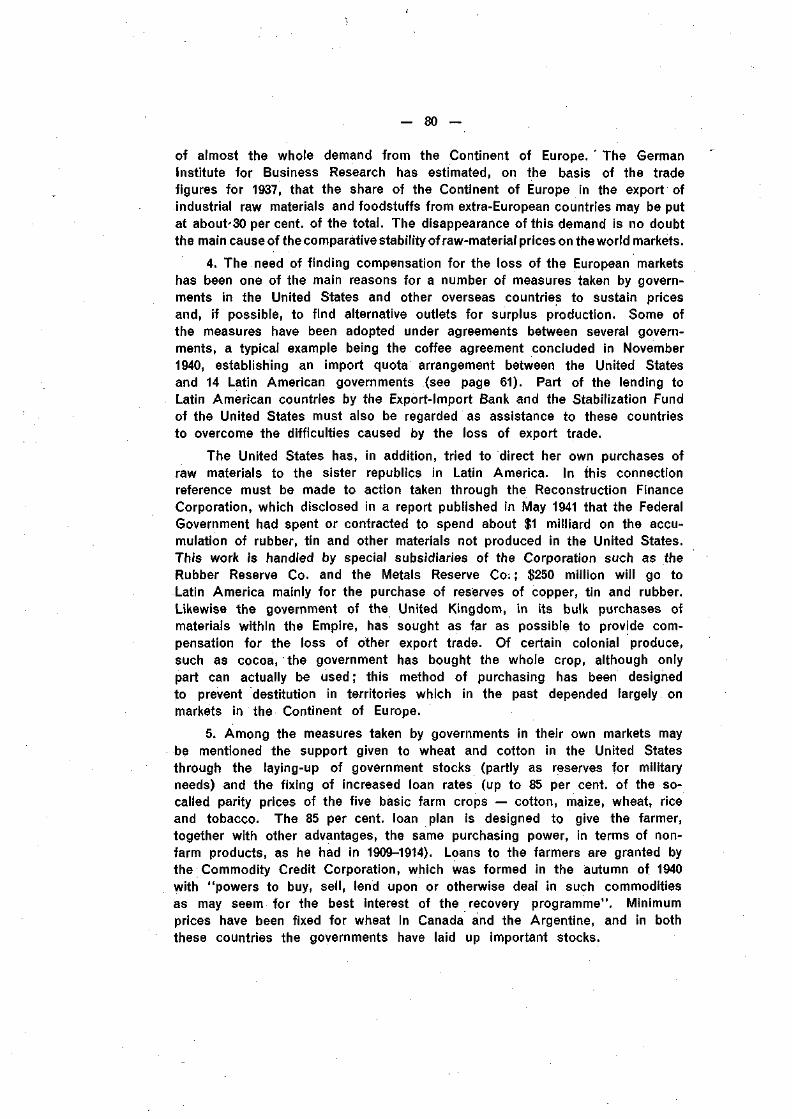
— 80 —
of almost the whole demand from the Continent of Europe. ' The GermanInstitute for Business Research has estimated, on the basis of the tradefigures for 1937, that the share of the Continent of Europe in the export ofindustrial raw materials and foodstuffs from extra-European countries may be putat about'30 percent, of the total. The disappearance of this demand is no doubtthe main cause of the comparative stability of raw-material prices on the world markets.
4. The need of finding compensation for the loss of the European marketshas been one of the main reasons for a number of measures taken by govern-ments in the United States and other overseas countries to sustain pricesand, if possible, to find alternative outlets for surplus production. Some ofthe measures have been adopted under agreements between several govern-ments, a typical example being the coffee agreement concluded in November1940, establishing an import quota arrangement between the United Statesand 14 Latin American governments (see page 61). Part of the lending toLatin American countries by the Export-Import Bank and the Stabilization Fundof the United States must also be regarded as assistance to these countriesto overcome the difficulties caused by the loss of export trade.
The United States has, in addition, tried to direct her own purchases ofraw materials to the sister republics in Latin America. In this connectionreference must be made to action taken through the Reconstruction FinanceCorporation, which disclosed in a report published in May 1941 that the FederalGovernment had spent or contracted to spend about $1 milliard on the accu-mulation of rubber, tin and other materials not produced in the United States.This work is handled by special subsidiaries of the Corporation such as theRubber Reserve Co. and the Metals Reserve Co; ; $250 million will go toLatin America mainly for the purchase of reserves of copper, tin and rubber.Likewise the government of the United Kingdom, in its bulk purchases ofmaterials within the Empire, has sought as far as possible to provide com-pensation for the loss of other export trade. Of certain colonial produce,such as cocoa, the government has bought the whole crop, although onlypart can actually be used; this method of purchasing has been designedto prevent destitution in territories which in the past depended largely onmarkets in the Continent of Europe.
5. Among the measures taken by governments in their own markets maybe mentioned the support given to wheat and cotton in the United Statesthrough the laying-up of government stocks (partly as reserves for militaryneeds) and the fixing of increased loan rates (up to 85 per cent, of the so-called parity prices of the five basic farm crops — cotton, maize, wheat, riceand tobacco. The 85 per cent, loan plan is designed to give the farmer,together with other advantages, the same purchasing power, in terms of non-farm products, as he had in 1909-1914). Loans to the farmers are granted bythe Commodity Credit Corporation, which was formed in the autumn of 1940with "powers to buy, sell, lend upon or otherwise deal in such commoditiesas may seem for the best interest of the recovery programme". Minimumprices have been fixed for wheat in Canada and the Argentine, and in boththese countries the governments have laid up important stocks.
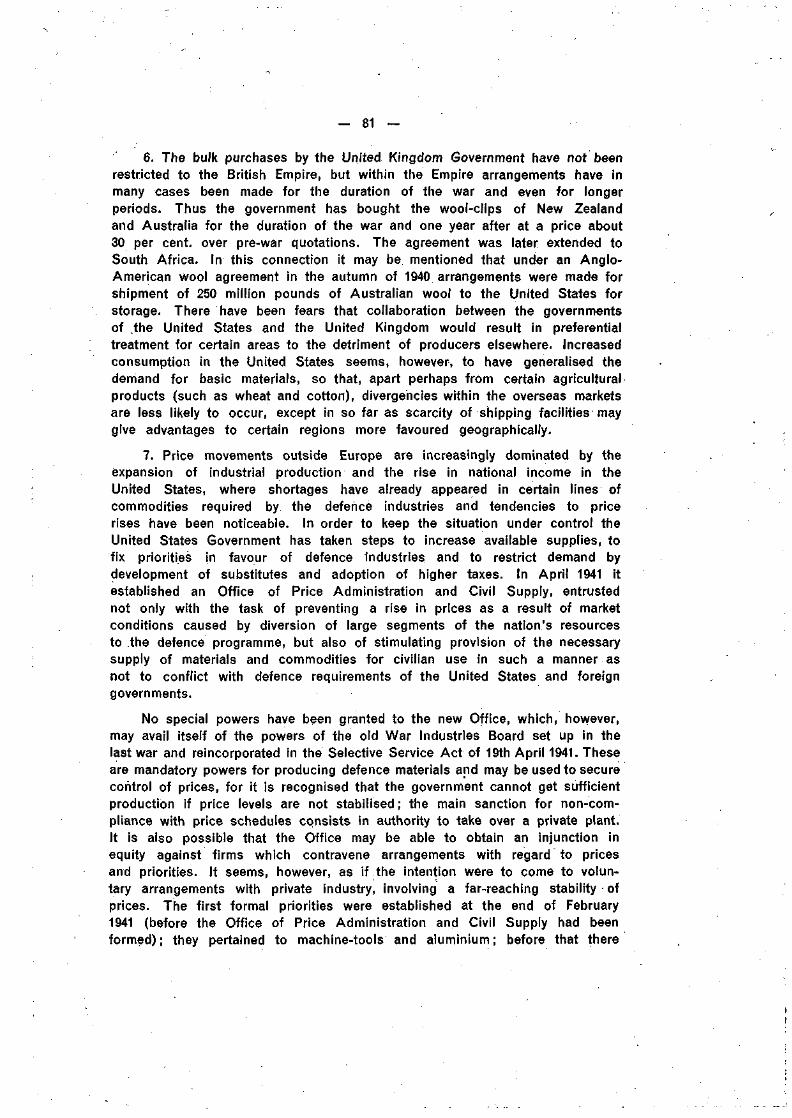
- 81 -
6. The bulk purchases by the United Kingdom Government have not beenrestricted to the British Empire, but within the Empire arrangements have inmany cases been made for the duration of the war and even for longerperiods. Thus the government has bought the wool-clips of New Zealandand Australia for the duration of the war and one year after at a price about30 per cent, over pre-war quotations. The agreement was later extended toSouth Africa. In this connection it may be mentioned that under an Anglo-American wool agreement in the autumn of 1940 arrangements were made forshipment of 250 million pounds of Australian wool to the United States forstorage. There have been fears that collaboration between the governmentsof the United States and the United Kingdom would result in preferentialtreatment for certain areas to the detriment of producers elsewhere. Increasedconsumption in the United States seems, however, to have generalised thedemand for basic materials, so that, apart perhaps from certain agriculturalproducts (such as wheat and cotton), divergencies within the overseas marketsare less likely to occur, except in so far as scarcity of shipping facilities maygive advantages to certain regions more favoured geographically.
7. Price movements outside Europe are increasingly dominated by theexpansion of industrial production and the rise in national income in theUnited States, where shortages have already appeared in certain lines ofcommodities required by. the defence industries and tendencies to pricerises have been noticeable. In order to keep the situation under control theUnited States Government has taken steps to increase available supplies, tofix priorities in favour of defence industries and to restrict demand bydevelopment of substitutes and adoption of higher taxes. In April 1941 itestablished an Office of Price Administration and Civil Supply, entrustednot only with the task of preventing a rise in prices as a result of marketconditions caused by diversion of large segments of the nation's resourcesto the defence programme, but also of stimulating provision of the necessarysupply of materials and commodities for civilian use in such a manner asnot to conflict with defence requirements of the United States and foreigngovernments.
No special powers have been granted to the new Office, which, however,may avail itself of the powers of the old War Industries Board set up in thelast war and reincorporated in the Selective Service Act of 19th April 1941. Theseare mandatory powers for producing defence materials and may be used to securecontrol of prices, for it is recognised that the government cannot get sufficientproduction if price levels are not stabilised; the main sanction for non-com-pliance with price schedules consists in authority to take over a private plant.It is also possible that the Office may be able to obtain an injunction inequity against firms which contravene arrangements with regard to pricesand priorities. It seems, however, as if the intention were to come to volun-tary arrangements with private industry, involving a far-reaching stability ofprices. The first formal priorities were established at the end of February1941 (before the Office of Price Administration and Civil Supply had beenformed); they pertained to machine-tools and aluminium; before that there
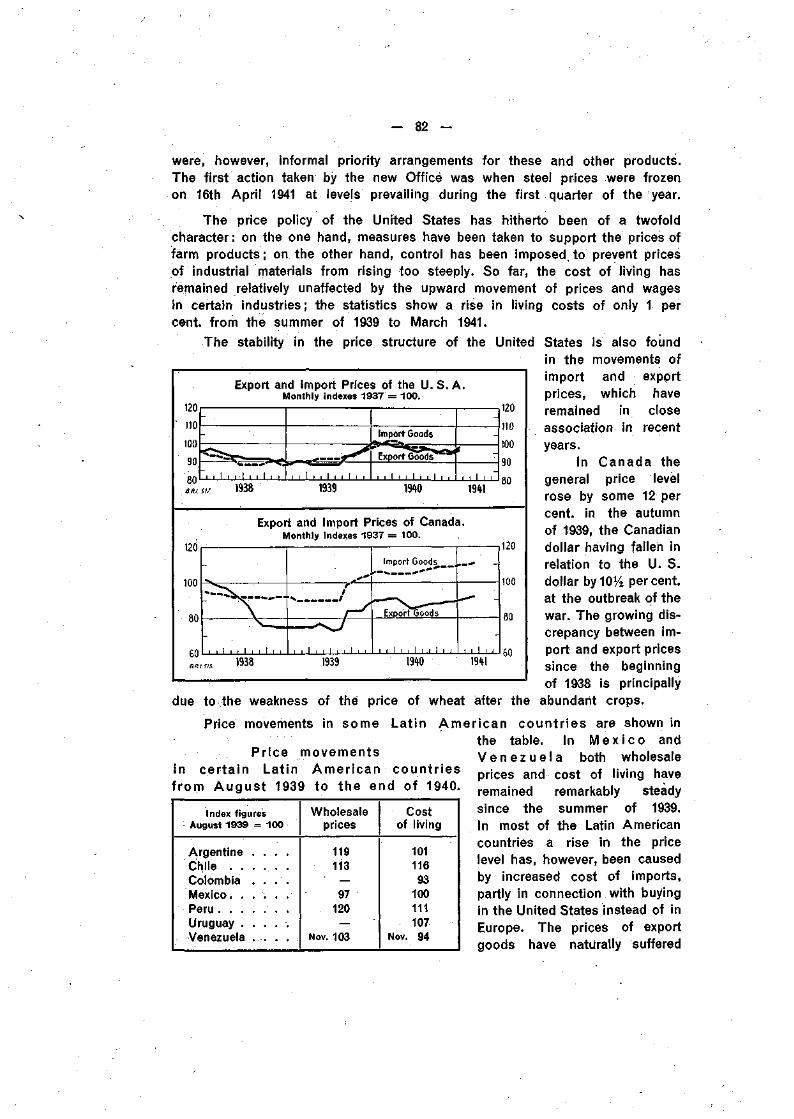
- 82 -
were, however, informal priority arrangements for these and other products.The first action taken by the new Office was when steel prices were frozenon 16th April 1941 at levels prevailing during the first quarter of the year.
The price policy of the United States has hitherto been of a twofoldcharacter: on the one hand, measures have been taken to support the prices offarm products; on the other hand, control has been imposed to prevent pricesof industrial materials from rising too steeply. So far, the cost of living hasremained relatively unaffected by the upward movement of prices and wagesin certain industries; the statistics show a rise in living costs of only 1 percent, from the summer of 1939 to March 1941.
The stability in the price structure of the United States is also foundin the movements ofimport and expprtprices, which haveremained in closeassociation in recentyears.
In Canada thegeneral price levelrose by some 12 percent, in the autumnof 1939, the Canadiandollar having fallen inrelation to the U. S.dollar by 10% percent,at the outbreak of thewar. The growing dis-crepancy between im-port and export pricessince the beginningof 1938 is principally
due to the weakness of thé price of wheat after the abundant crops.
Price movements in some Latin Amer ican count r ies are shown inthe table. In M e x i c o and
both
120
110
100
90
80
Export
- .
-<*v—
~. i 1 i i - l i i ! i
and Import Prices of the U.S.A.Monthly indexes 1937 = 100.
| I I M I i l l !
Import Goods
Export Goods"**'
i i 1 i i 1 i i 1 i ,
-
-
t
i i 1 i i~
1938 1939 1910 1941
120
110
100
90
80
120
100
80
60
Export and Import Prices of Canada.Monthly indexes 1937 = 100.
_
i i ! i ! 1 i i ! i i
e
Ji i 1 i i ! i i 1 i i
Import Goods __,
S-^Export Goods
1 1 1 ! ! 1 1 1 1 1 1
. ' _
.
1 1 ! 1 1
1938 1939 1940 1941
120
100
80
60
Price movementsin certain Latin American countriesfrom August 1939 to the end of 1940.
Index figuresAugust 1939 =100
Argentine . . . .Chile . . . . . .Colombia . .Mexico. . . . . .Peru .Uruguay . . . . .Venezuela .... . .
Wholesaleprices
119113
97120
Nov. 103
Costof living
10111693
100111107
Nov. 94
V e n e z u e l a both wholesaleprices and cost of living haveremained remarkably steadysince the summer of 1939.In most of the Latin Americancountries a rise in the pricelevel has, however, been causedby increased cost of imports,partly in connection with buyingin the United States instead of inEurope. The prices of exportgoods have naturally suffered
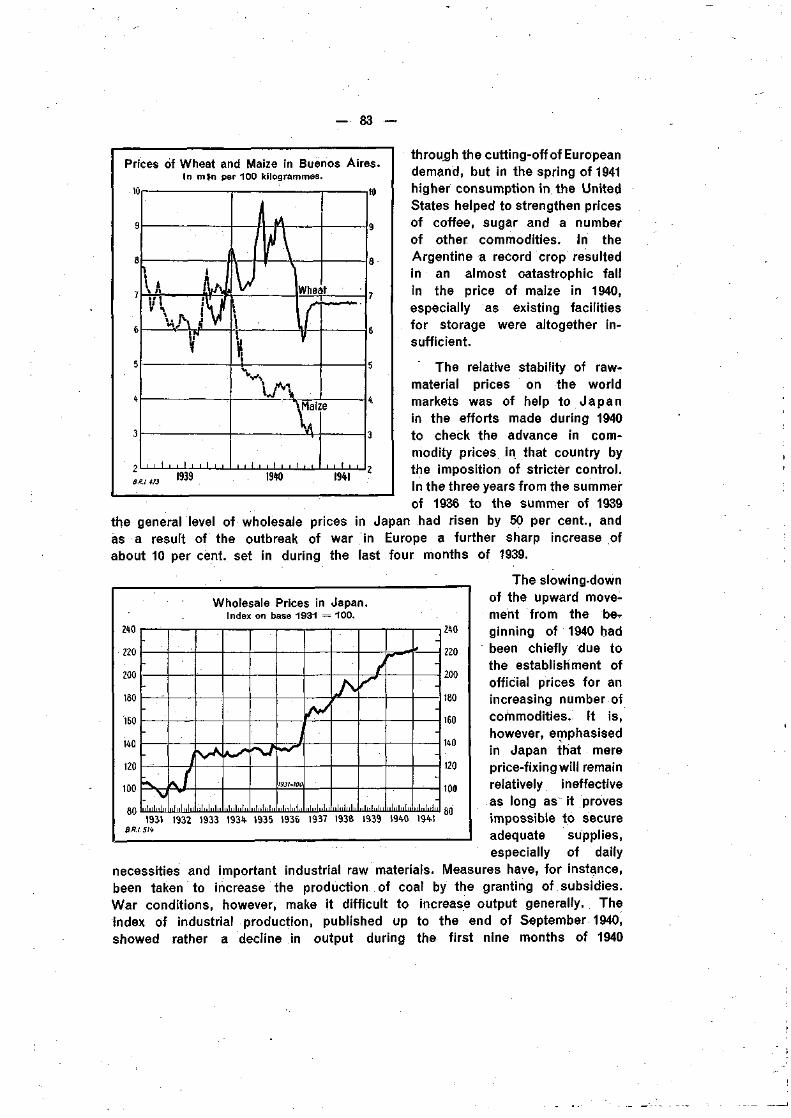
— 83
Prices of Wheat and Maize in Buenos Aires.In mSn per 100 kilogrammes.
.10
through the cutting-off of Europeandemand, but in the spring of 1941higher consumption in the UnitedStates helped to strengthen pricesof coffee, sugar and a numberof other commodities. In theArgentine a record crop resultedin an almost catastrophic fallin the price of maize in 1940,especially as existing facilitiesfor storage were altogether in-sufficient.
The relative stability of raw-material prices on the worldmarkets was of help to Japanin the efforts made during 1940to check the advance in com-modity prices in that country bythe imposition of stricter control.In the three years from the summerof 1936 to the summer of 1939
the general level of wholesale prices in Japan had risen by 50 per cent., andas a result of the outbreak of war in Europe a further sharp increase ofabout 10 per cent, set in during the last four months of 1939.
1939 1940 1941
Wholesale Prices in Japan.Index on base 1931 = 100.
The slowing-downof the upward move-ment from the be-ginning of 1940 hadbeen chiefly due tothe establishment ofofficial prices for anincreasing number ofcommodities. It is,however, emphasisedin Japan that mereprice-fixing will remainrelatively ineffectiveas long as it provesimpossible to secureadequate supplies,especially of daily
necessities and important industrial raw materials. Measures have, for instance,been taken to increase the production of coal by the granting of subsidies.War conditions, however, make it difficult to increase output generally. Theindex of industrial production, published up to the end of September 1940,showed rather a decline in output during the first nine months of 1940
240
220
200
180
160
120
100
-
-
-
-
-
-
-
I l l l l l l l l l l niiilnhi Illllllllll Illlllllll, Illllllllll
mi-wo
ululili,I iilnlnln
A\
nlnlnln
1 -
iiliilnln
r
I,hin
*
-
-
-
-
-
-
MIMIIIIM801931 1932 1933 1931- 1935 1936 1937 1938 1939 1940 194-1
BRI 5V*
240
220
200
180
160
140
120
109
80
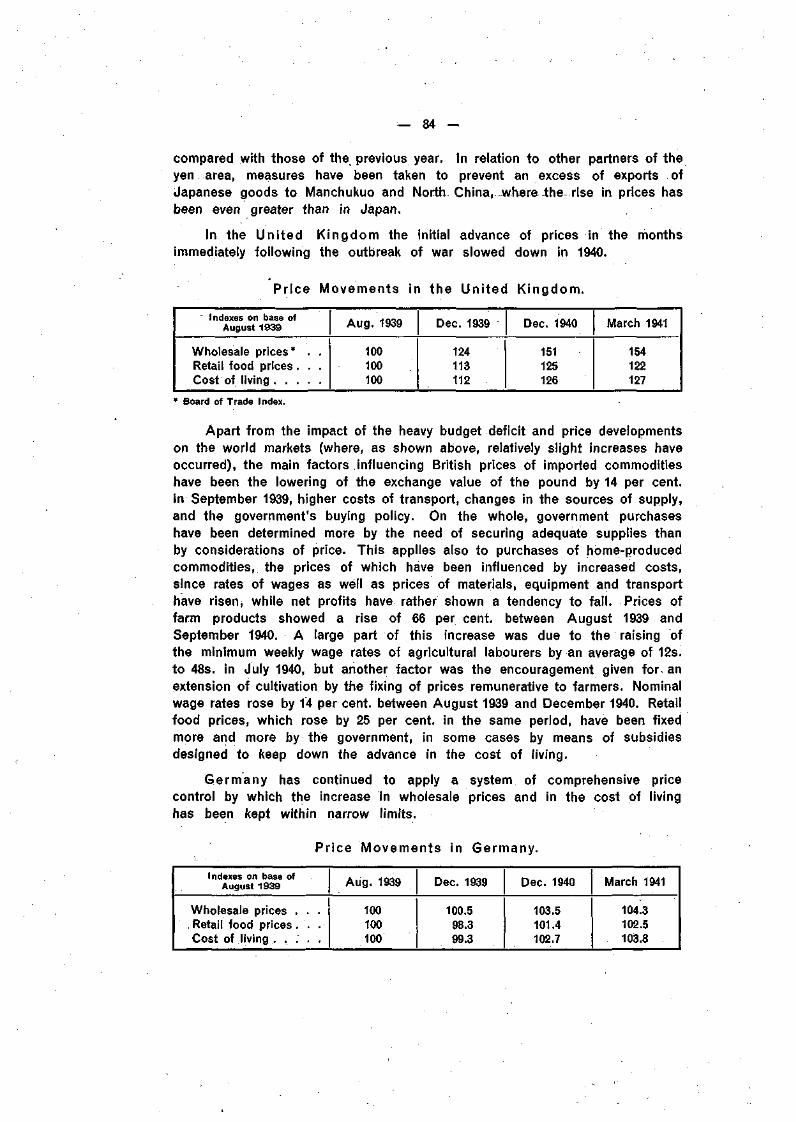
••— 8 4 -
compared with those of the previous year. In relation to other partners of theyen area, measures have been taken to prevent an excess of exports ofJapanese goods to Manchukuo and North. China, where the rise in prices hasbeen even greater than in Japan.
In the United Kingdom the initial advance of prices in the monthsimmediately following the outbreak of war slowed down in 1940.
Price Movements in the Uni ted Kingdom.
Indexes oh base ofAugust 1939
Wholesale prices* . .Retail food prices. . .Cost of living
Aug. 1939
88
8
Dec. 1939
124113112
Dec. 1940
151125126
March 1941
154122127
* Board of Trade Index.
Apart from the impact of the heavy budget deficit and price developmentson the world markets (where, as shown above, relatively slight increases haveoccurred), the main factors influencing British prices of imported commoditieshave been the lowering of the exchange value of the pound by 14 per cent,in September 1939, higher costs of transport, changes in the sources of supply,and the government's buying policy. On the whole, government purchaseshave been determined more by the need of securing adequate supplies thanby considerations of price. This applies also to purchases of home-producedcommodities, the prices of which have been influenced by increased costs,since rates of wages as well as prices of materials, equipment and transporthave risen* while net profits have rather shown a tendency to fall. Prices offarm products showed a rise of 66 per cent, between August 1939 andSeptember 1940. A large part of this increase was due to the raising ofthe minimum weekly wage rates of agricultural labourers by an average of 12s.to 48s. in July 1940, but another factor was the encouragement given for, anextension of cultivation by the fixing of prices remunerative to farmers. Nominalwage rates rose by 14 per cent, between August 1939 and December 1940. Retailfood prices, which rose by 25 per cent, in the same period, have been fixedmore and more by the government, in some cases by means of subsidiesdesigned to keep down the advance in the cost of living.
Germany has continued to apply a system of comprehensive pricecontrol by which the increase in wholesale prices and in the cost of livinghas been kept within narrow limits.
Price Movements in Germany.
Indexes on base ofAugust 1939
Wholesale prices . . .Retail food prices . . .Cost of living . . . . .
A u g . 1939
100100100
Dec. 1939
100.598.399.3
Dec. 1940
103.5101.4102.7
March 1941
104.3102.5103.8
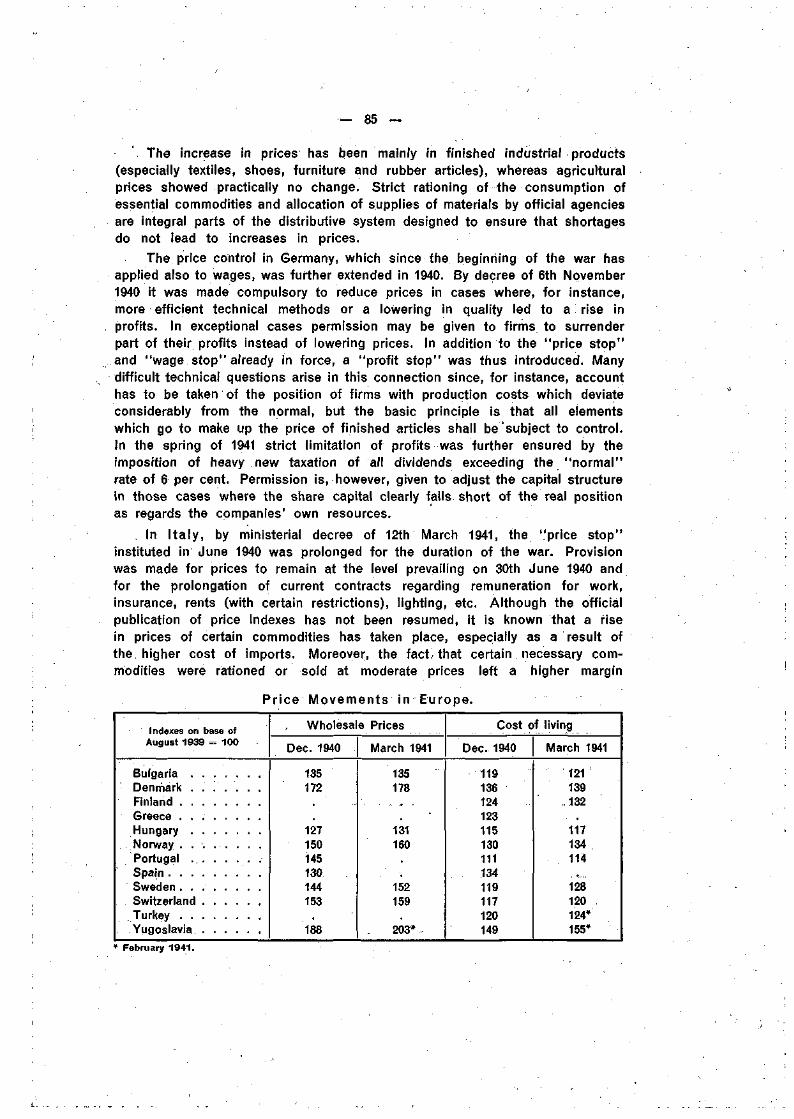
— 85 —
The increase in prices has been mainly in finished industrial products(especially textiles, shoes, furniture and rubber articles), whereas agriculturalprices showed practically no change. Strict rationing of the consumption ofessential commodities and allocation of supplies of materials by official agenciesare integral parts of the distributive system designed to ensure that shortagesdo not lead to increases in prices.
The price control in Germany, which since the beginning of the war hasapplied also to wages, was further extended in 1940. By decree of 6th November1940 it was made compulsory to reduce prices in cases where, for instance,more efficient technical methods or a lowering in quality led to a rise inprofits. In exceptional cases permission may be given to firms to surrenderpart of their profits instead of lowering prices. In addition to the "price stop"and "wage stop" already in force, a "profit stop" was thus introduced. Manydifficult technical questions arise in this connection since, for instance, accounthas to be taken of the position of firms with production costs which deviateconsiderably from the normal, but the basic principle is that all elementswhich go to make up the price of finished articles shall be subject to control.In the spring of 1941 strict limitation of profits was further ensured by theimposition of heavy new taxation of all dividends exceeding the "normal"rate of 6 per cent. Permission is, however, given to adjust the capital structurein those cases where the share capital clearly falls short of the real positionas regards the companies' own resources.
. In I taly, by ministerial decree of 12th March 1941, the ''price stop"instituted in June 1940 was prolonged for the duration of the war. Provisionwas made for prices to remain at the level prevailing on 30th June 1940 andfor the prolongation of current contracts regarding remuneration for work,insurance, rents (with certain restrictions), lighting, etc. Although the officialpublication of price indexes has not been resumed, it is known that a risein prices of certain commodities has taken place, especially as a result ofthe higher cost of imports. Moreover, the fact'that certain necessary com-modities were rationed or sold at moderate prices left a higher margin
Price Movements in Europe.
Indexes on base ofAugust 1939 = 100
Bulgaria . . . . . . .Denmark . . . . . . .FinlandGreeceHungaryNorway . . . . . . . .PortugalSpainSweden . . . . . . . .SwitzerlandTurkeyYugoslavia
Wholesale Prices
Dec. 1940
135172
127150145130144153
188
March 1941
135178
131160
152159
203*
Cost of living
Dec. 1940
119136124123115130111134119117120149
March 1941
121139132
117134 .114
128120124*155*
• February 1941.
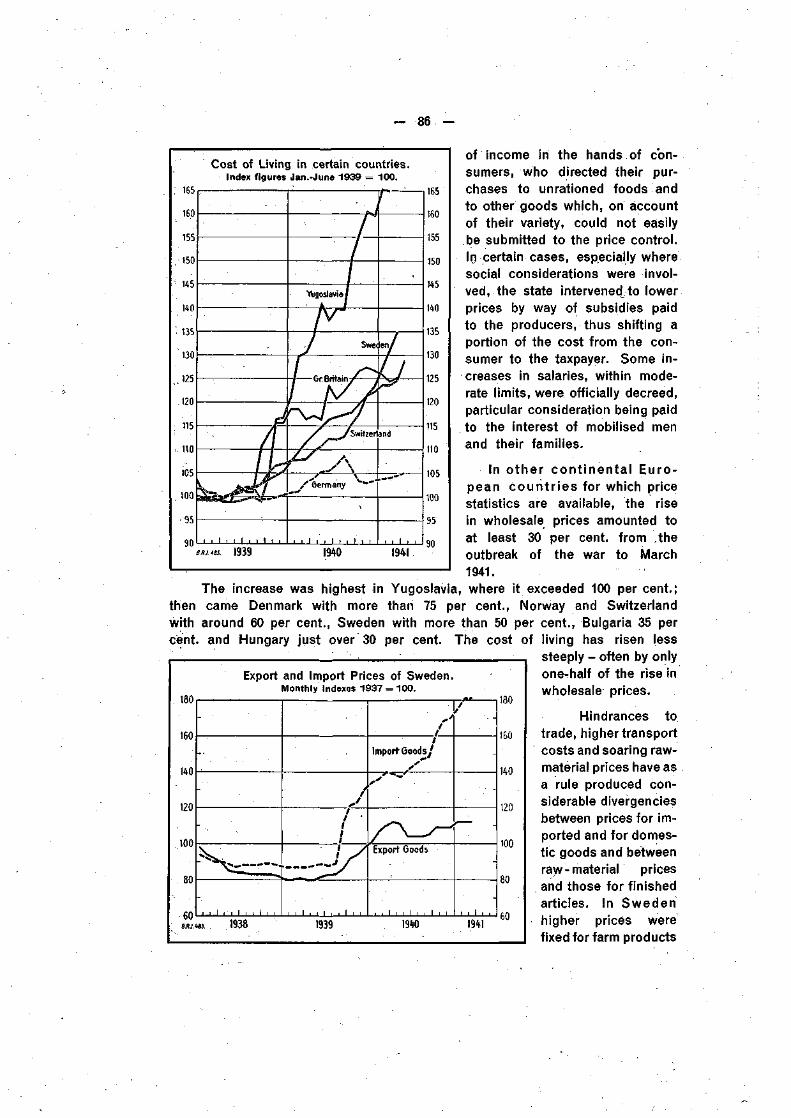
86 -
95
90
Cost of Living in certain countries.Index figures Jan.-June 1939 = 100.
• — t r -
ot income in the hands of con-sumers, who directed their pur-chases to unrationed foods andto other goods which, on accountof their variety, could not easilybe submitted to the price control.In certain cases, especially wheresocial considerations were invol-ved, the state intervened to lowerprices by way of subsidies paidto the producers, thus shifting aportion of the cost from the con-sumer to the taxpayer. Some in-creases in salaries, within mode-rate limits, were officially decreed,particular consideration being paidto the interest of mobilised menand their families.
In other cont inenta l Euro-pean count r ies for which pricestatistics are available, the risein wholesale prices amounted toat least 30 per cent, from theoutbreak of the war to March1941.
The increase was highest in Yugoslavia, where it exceeded 100 per cent.;then came Denmark with more than 75 per cent., Norway and Switzerlandwith around 60 per cent., Sweden with more than 50 per cent., Bulgaria 35 percent, and Hungary just over 30 per cent. The cost of living has risen (ess
steeply - often by onlyone-half of the rise inwholesale prices.
I I I i i i
1939• i i » • i i i ? i i i i i i
1940 1941
105
100
95
90
180
160
140
120
100
80
GO
Export and Import Prices of Sweden.Monthly indexes 1937 = 100.
- -
- •
- J1
1
1
1 1 1 , , 1 I , 1 1 1
Import Goods/
Export Goods
i , i i i i i i i i i
-
• ; -
— _
-
i i i .
1938 1939 1940 1941
180
160
140
120
100
60
Hindrances totrade, higher transportcosts and soaring raw-material prices have asa rule produced con-siderable divergenciesbetween prices for im-ported and for domes-tic goods and betweenraw-material pricesand those for finishedarticles. In Swedenhigher prices werefixed for farm products
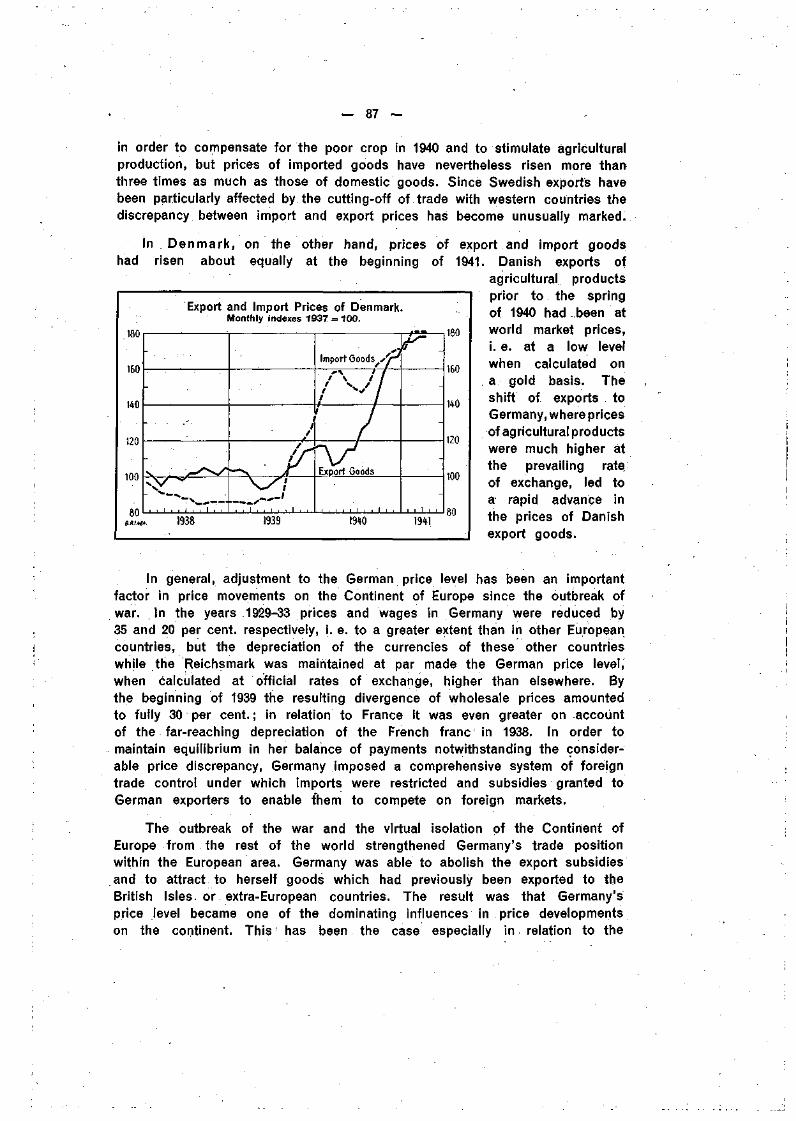
— 87 —
Export and Import Prices of Denmark.Monthly indexes 1937 = 100.
in order to compensate for the poor crop in 1940 and to stimulate agriculturalproduction, but prices of imported goods have nevertheless risen more thanthree times as much as those of domestic goods. Since Swedish exports havebeen particularly affected by the cutting-off of trade with western countries thediscrepancy between import and export prices has become unusually marked.
In Denmark, on the other hand, prices of export and import goodshad risen about equally at the beginning of 1941. Danish exports of
agricultural productsprior to the springof 1940 had been atworld market prices,i. e. at a low levelwhen calculated ona gold basis. Theshift of exports toGermany, where pricesof agricultural productswere much higher atthe prevailing rate,of exchange, led toa rapid advance inthe prices of Danishexport goods.
180
160
no
120
100
-,
- . . .-.
-N*—-x .i i 1 i i 1 i i 1 r i
i
i , i , , i , , 1 1 ,
Import Goods / V ^
MA/Export Goods
1 ; 1
-
-
• -
1 1 1 1 180BUM. 1938
180
160
140
120
100
1939 1940 194!
In general, adjustment to the German price level has been an importantfactor in price movements on the Continent of Europe since the outbreak ofwar. In the years 1929-33 prices and wages in Germany were reduced by35 and 20 per cent, respectively, i. e. to a greater extent than in other Europeancountries, but the depreciation of the currencies of these other countrieswhile the Reichsmark was maintained at par made the German price level,when calculated at official rates of exchange, higher than elsewhere. Bythe beginning of 1939 the resulting divergence of wholesale prices amountedto fully 30 per cent. ; in relation to France it was even greater on accountof the far-reaching depreciation of the French franc in 1938. In order tomaintain equilibrium in her balance of payments notwithstanding the consider-able price discrepancy, Germany imposed a comprehensive system of foreigntrade control under which imports were restricted and subsidies granted toGerman exporters to enable them to compete on foreign markets.
The outbreak of the war and the virtual isolation of the Continent ofEurope from the rest of the world strengthened Germany's trade positionwithin the European area. Germany was able to abolish the export subsidiesand to attract to herself goods which had previously been exported to theBritish Isles or extra-European countries. The result was that Germany'sprice level became one of the dominating influences in price developmentson the continent. This has been the case especially in relation to the
- 88 -
Protectorate of Bohemia and Moravia and to Holland, consequent upon theabolition of exchange restrictions between them and Germany (and for theProtectorate customs duties as well) ; and the same forces have been at workalso vis-à-vis other countries on the Continent of Europe. By the increasesin prices and wages which have occurred since the outbreak of the wara considerable adjustment to the German level has no doubt already beeneffected, but in some cases discrepancies still remain, which, at the pre-vailing rates of exchange, are in no way negligible.
Apart from influences emanating from the foreign trade position, pricemovements in the various countries have been subject to a number ofdomestic influences, among which the increased cost of production of sub-stitutes, poor crops in 1940 and higher prices paid to encourage an extensionof farming, as well as the mounting budget deficits, have been the mostimportant. Systems of price control are everywhere in force, and increasedpowers have been given to price controllers in 1940. Wage control is stillan exception to the rule, but in no country can the government remainindifferent to important changes in wage rates. It is generally admitted thatà rise in the cost of living should not be fully compensated by a rise inwages; when the higher living costs reflect an increased scarcity of con-sumption goods it is physically impossible to compensate everybody; andwhen indirect taxation is increased part of the purpose is often to restrictthe volume of consumers' purchases, while full compensation would meanfreedom from the particular tax increase. The compensation which has infact been granted to wage-earners in different countries has been limitedin general to about one-half of the rise in the cost of living, with specialallowances in favour of larger families. Rationing makes it possible, as a rule,to ensure a more equitable distribution of available supplies than would bethe result of competitive bidding in a free market and also to prevent shortagesfrom resulting in exaggerated price rises. It has been the tendency everywhereto rely more upon direct intervention in the price system through rationingand control than upon credit restriction. In contrast to the war of 1914-18a policy of cheap and plentiful credit is now being pursued, combined, how-ever, with higher taxation and a series of measures (such as rationing ofiron and steel) designed to prevent available funds from being used forunauthorised private investments. The extent to which the policy thus adoptedwill prove successful'in withstanding excessive price increases will no doubtdepend largely upon the determination with which it is carried out and, inparticular, upon the strength shown by the authorities in resisting sectionalinterests. It is, however, no easy matter to make a system of price controlfully effective ; if the volume of credit and purchasing power in the handsof the public were allowed to increase without restraint, it is not certain thatdirect measures of price control could wholly neutralise the impulse toincreased spending. The greater the "free sector" in a country the moreimperative it becomes to consider all possible safeguards, including thoseof a monetary character, if inflationary tendencies are to be avoided.
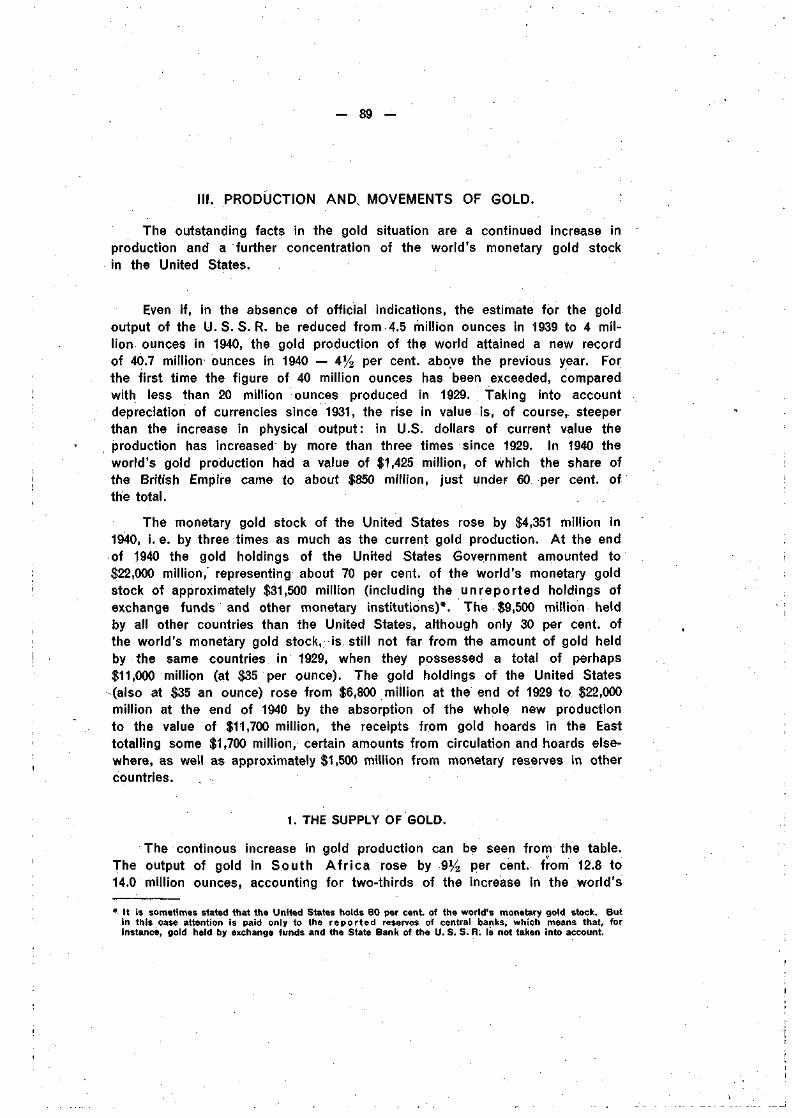
- 89 -
III. PRODUCTION AND. MOVEMENTS OF GOLD.
The outstanding facts in the gold situation are a continued increase inproduction and a further concentration of the world's monetary gold stockin the United States.
Even if, in the absence of official indications, the estimate for the goldoutput of the U. S. S. R. be reduced from 4.5 million ounces in 1939 to 4 mil-lion ounces in 1940, the gold production of the world attained a new recordof 40.7 million ounces in 1940 — 4% per cent, above the previous year. Forthe first time the figure of 40 million ounces has been exceeded, comparedwith less than 20 million ounces produced in 1929. Taking into accountdepreciation of currencies since 1931, the rise in value is, of course, steeperthan the increase in physical output: in U.S. dollars of current value theproduction has increased by more than three times since 1929. In 1940 theworld's gold production had a value of $1,425 million, of which the share ofthe British Empire came to about $850 million, just under 60 per cent, ofthe total.
The monetary gold stock of the United States rose by $4,351 million in1940, i.e. by three times as much as the current gold production. At the endof 1940 the gold holdings of the United States Government amounted to$22,000 million,' representing about 70 per cent, of the world's monetary goldstock of approximately $31,500 million (including the un reported holdings ofexchange funds and other monetary institutions)*. The $9,500 million heldby all other countries than the United States, although only 30 per cent, ofthe world's monetary gold stock, is still not far from the amount of gold heldby the same countries in 1929, when they possessed a total of perhaps$11,000 million (at $35 per ounce). The gold holdings of the United States(also at $35 an ounce) rose from $6,800 million at the end of 1929 to $22,000million at the end of 1940 by the absorption of the whole new productionto the value of $11,700 million, the receipts from gold hoards in the Easttotalling some $1,700 million, certain amounts from circulation and hoards else-where, as well as approximately $1,500 million from monetary reserves in othercountries.
1. THE SUPPLY OF GOLD.
The continous increase in gold production can be seen from the table.The output of gold in South A f r i ca rose by 9% per cent, from 12.8 to14.0 million ounces, accounting for two-thirds of the increase in the world's
* It is sometimes stated that the United States holds 80 per cent, of the world's monetary gold stock. Butin this case attention is paid only to the reported reserves of central banks, which means that, forinstance, gold held by exchange funds and the State Bank of the U. S. S. R. is not taken into account.
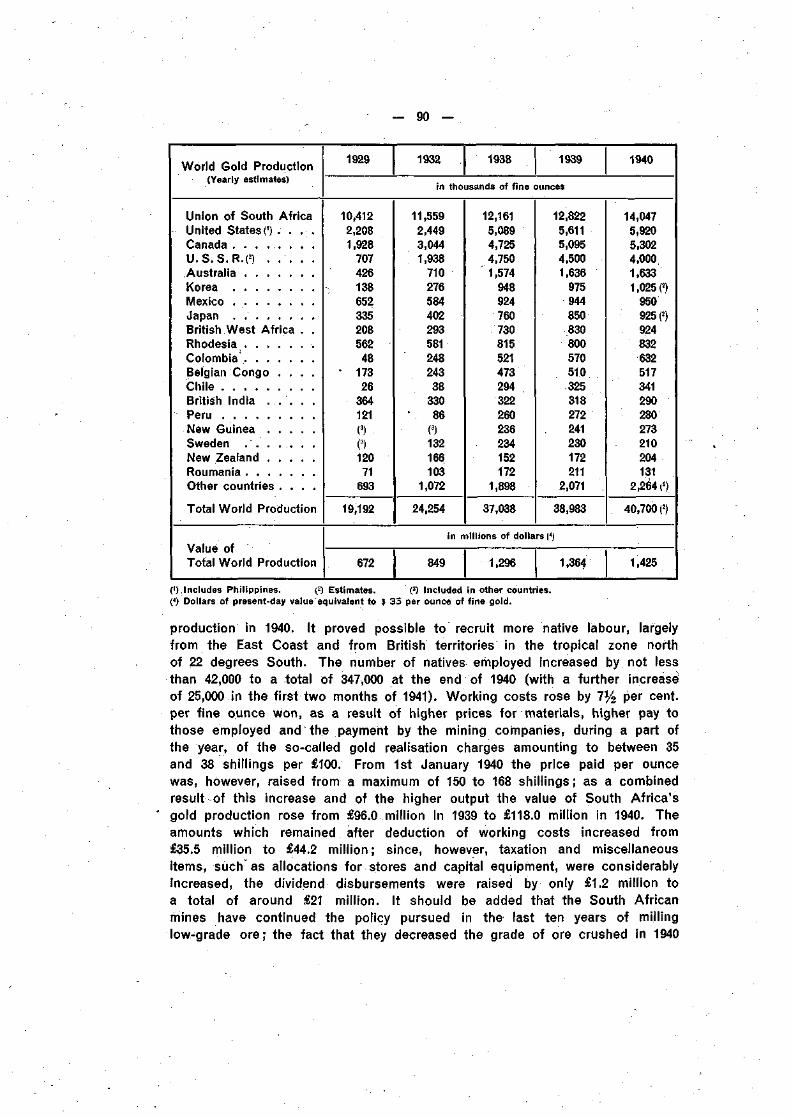
— 90 —
World Gold Production(Yearly estimates)
Union of South Afr icaUnited States (') . . . .CanadaU . S . S . R.(2) . . . . .Austral iaKoreaMexicoJapan .British West Afr ica . .RhodesiaColombiaBelgian Congo . . . .ChileBritish India . . . . .Peru . . . . . . . . .New GuineaSwedenNew Zealand . . . . .RoumaniaOther countries . . . .
Total Wor ld Production
Value ofTotal Wor ld Production
1929 1932 1938 1939 1940
in thousands of fine ounces
10,4122,2081,928
70742613865233520856248
• 17326
364121(3)(3)12071
693
19,192
11,5592,4493,0441,938
71027658440229358124824338
33086
(3)132166103
1,072
24,254
12,1615,0894,7254,750
" 1,574948924760730815521473294322260236234152172
1,898
37,038
12,8225,6115,0954,5001,636
975944850830800570510.325318272241230172211
2,071
38,983
14,0475,9205,3024,0001,6331,025 (2)
950925 H924832632517341290280273210204131
2,264 i2)
40,700 (2)
in millions of dollars {")
672 849 1,296 1,364 1,425
(') Includes Philippines. (2) Estimates. (3) Included in other countries.C) Dollars of present-day value equivalent to $ 35 per ounce of fine gold.
production in 1940. It proved possible to recruit more native labour, largelyfrom the East Coast and from British territories in the tropical zone northof 22 degrees South. The number of natives employed increased by not lessthan 42,000 to a total of 347,000 at the end of 1940 (with a further increaseof 25,000 in the first two months of 1941). Working costs rose by 7% per cent,per fine ounce won, as a result of higher prices for materials, higher pay tothose employed and the payment by the mining companies, during a part ofthe year, of the so-called gold realisation charges amounting to between 35and 38 shillings per £100. From 1st January 1940 the price paid per ouncewas, however, raised from a maximum of 150 to 168 shillings ; as a combinedresult of this increase and of the higher output the value of South Africa'sgold production rose from £96.0 million in 1939 to £118.0 million in 1940. Theamounts which remained after deduction of working costs increased from£35.5 million to £44.2 million ; since, however, taxation and miscellaneousitems, such* as allocations for stores and capital equipment, were considerablyincreased, the dividend disbursements were raised by only £1.2 million toa total of around £21 million. It should be added that the South Africanmines have continued the policy pursued in the last ten years of millinglow-grade ore; the fact that they decreased the grade of ore crushed in 1940
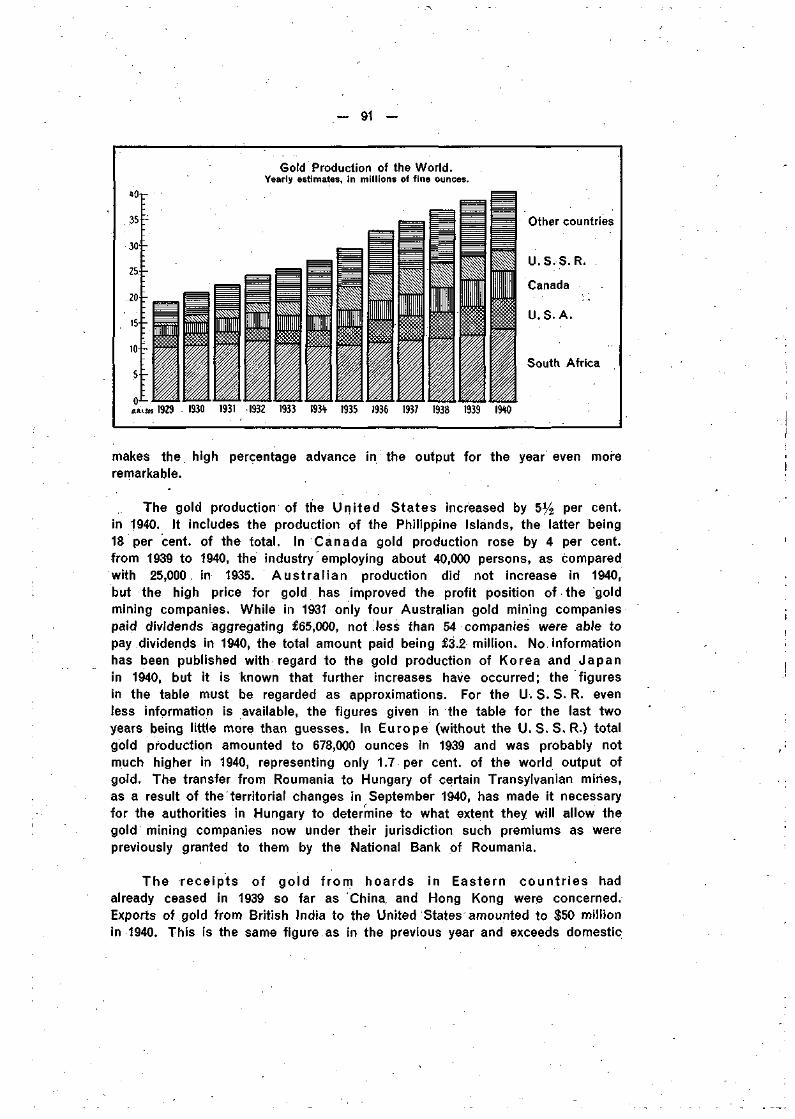
- 91 -
Gold Production of the World.Yearly estimates, in millions of fine ounces.
o-1-B.R.I.5C
Other countries
U.S.S.R.
South Africa
1929 1930 1931 1932 1933 193* 1935 1936 1937 1938 1939 M 0
makes the high percentage advance in the output for the year even moreremarkable.
The gold production of the United States increased by 5% per cent,in 1940. It includes the production of the Philippine Islands, the latter being18 per cent, of the total. In Canada gold production rose by 4 per cent,from 1939 to 1940, the industry employing about 40,000 persons, as comparedwith 25,000 in 1935. Aus t ra l ian production did not increase in 1940,but the high price for gold has improved the profit position of the goldmining companies. While in 1931 only four Australian gold mining companiespaid dividends aggregating £65,000, not less than 54 companies were able topay dividends in 1940, the total amount paid being £3.2 million. No informationhas been published with regard to the gold production of Korea and Japanin 1940, but it is known that further increases have occurred; the figuresin the table must be regarded as approximations. For the U. S. S. R. evenless information is available, the figures given in the table for the last twoyears being little more than guesses. In Europe (without the U.S.S.R.) totalgold production amounted to 678,000 ounces in 1939 and was probably notmuch higher in 1940, representing only 1.7 per cent, of the world output ofgold. The transfer from Roumania to Hungary of certain Transylvanian mines,as a result of the territorial changes in September 1940, has made it necessaryfor the authorities in Hungary to determine to what extent they will allow thegold mining companies now under their jurisdiction such premiums as werepreviously granted to them by the National Bank of Roumania.
The receipts of gold f rom hoards in Eastern count r ies hadalready ceased in 1939 so far as China and Hong Kong were concerned.Exports of gold from British India to the United States amounted to $50 millionin 1940. This is the same figure.as in the previous year and exceeds domestic
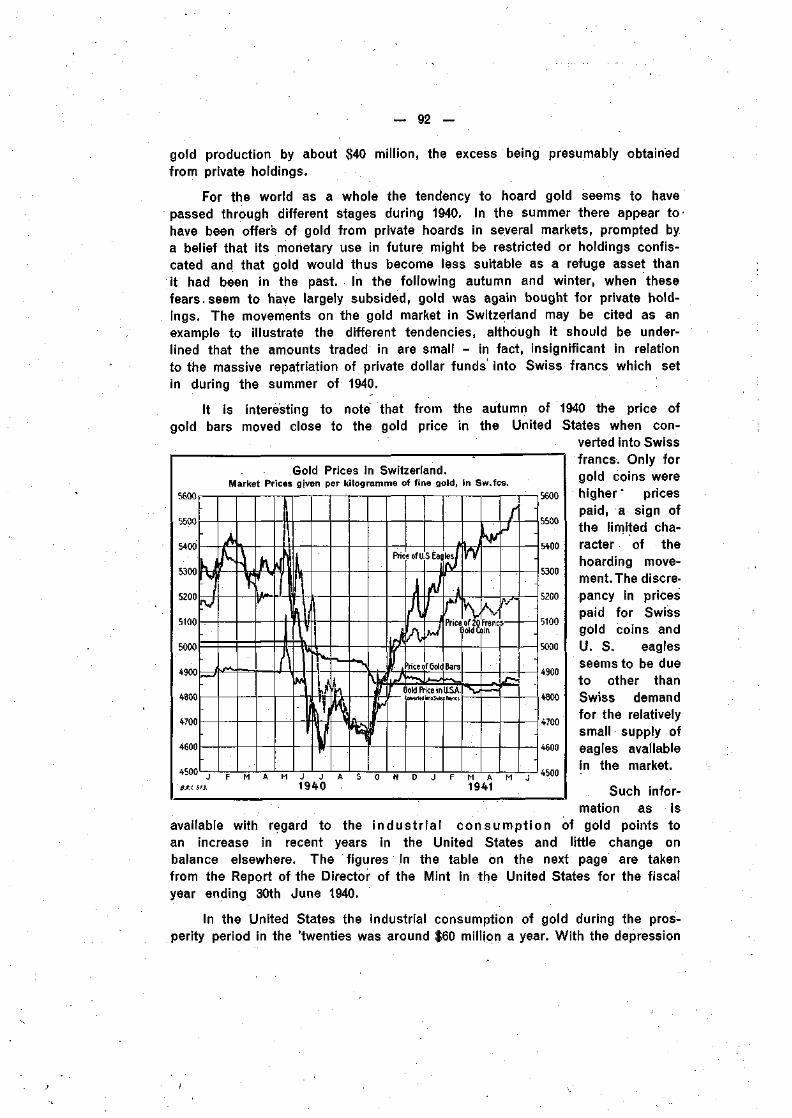
92 -
gold production by aboutfrom private holdings.
million, the excess being presumably obtained
For the world as a whole the tendency to hoard gold seems to havepassed through different stages during 1940. In the summer there appear to 'have been offer's of gold from private hoards in several markets, prompted bya belief that its monetary use in future might be restricted or holdings confis-cated and that gold would thus become less suitable as a refuge asset thanit had been in the past. In the following autumn and winter, when thesefears, seem to have largely subsided, gold was again bought for private hold-ings. The movements on the gold market in Switzerland may be cited as anexample to illustrate the different tendencies, although it should be under-lined that the amounts traded in are small - in fact, insignificant in relationto the massive repatriation of private dollar funds into Swiss francs which setin during the summer of 1940.
It is interesting to note that from the autumn of 1940 the price ofgold bars moved close to the gold price in the United States when con-
verted into Swissfrancs. Only forgold coins wereGold Prices in Switzerland.
Market Prices given per kilogramme of fine gold, in Sw.fcs.5600 r
5500 [
5400 [
5300 M
5200
5100
5000
4900
4800
4700
4600
4500
higher" pricespaid, a sign ofthe limited cha-racter of thehoarding move-ment. The discre-pancy in pricespaid for Swissgold coins andU. S. eaglesseems to be dueto other thanSwiss demandfor the relativelysmall supply ofeagles availablein the market.
Such infor-mation as is
available with regard to the indust r ia l consumpt ion of gold points toan increase in recent years in the United States and little change onbalance elsewhere. The figures in the table on the next page are takenfrom the Report of the Director of the Mint in the United States for the fiscalyear ending 30th June 1940.
In the United States the industrial consumption of gold during the pros-perity period in the 'twenties was around $60 million a year. With the depression
j j
1940M A
1941
5600
5500
5400
5300
5200
5100
5000
4900
4800
4700
4600
4500
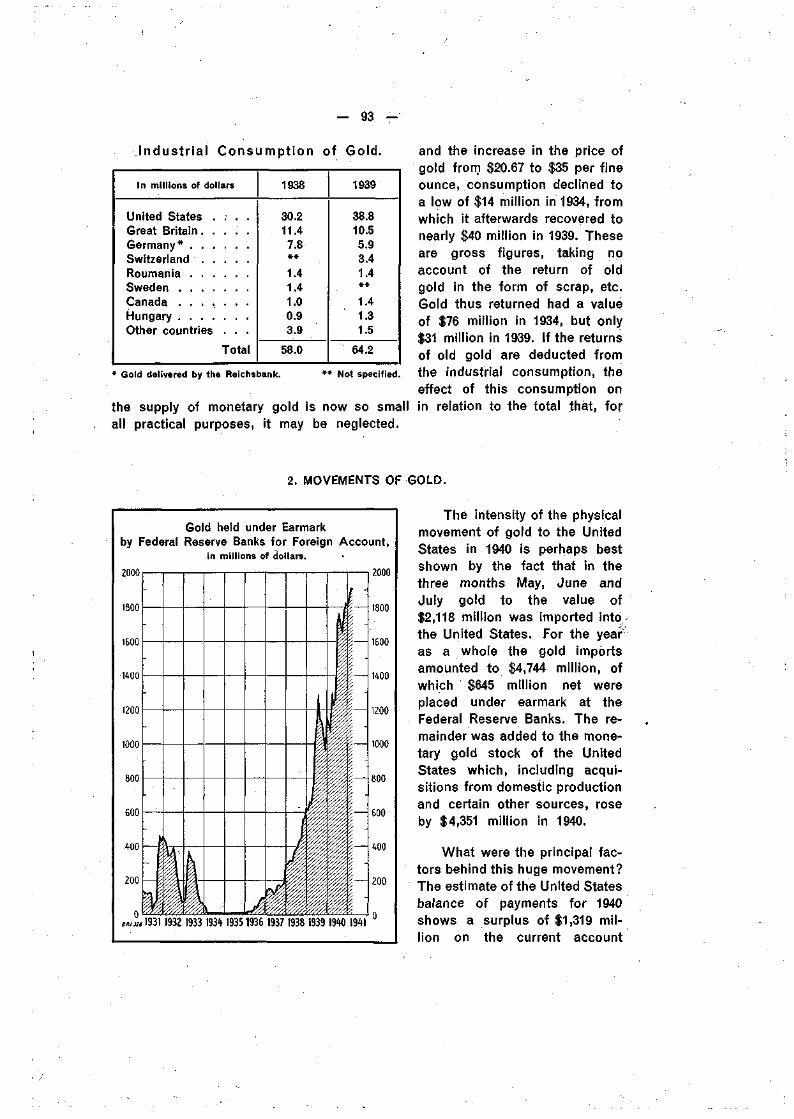
- 93 -
Industrial Consumption of Gold.
In millions of dollars
United States . . . .Great Br i ta in. . . . .Germany*SwitzerlandRoumaniaSwedenCanadaHungaryOther countries . . .
Total
1938
30.211.47.8
1.41.41.00.93.9
58.0
1939
38.810.55.93.41.4##
1.41.31.5
64.2
* Gold delivered by the Reichsbank. ** Not specified.
the supply of monetary gold is now so smallall practical purposes, it may be neglected.
and the increase in the price ofgold from $20.67 to $35 per fineounce, consumption declined toa low of $14 million in 1934, fromwhich it afterwards recovered tonearly $40 million in 1939. Theseare gross figures, taking noaccount of the return of oldgold in the form of scrap, etc.Gold thus returned had a valueof $76 million in 1934, but only$31 million in 1939. If the returnsof old gold are deducted fromthe industrial consumption, theeffect of this consumption onin relation to the total that, for
2. MOVEMENTS OF GOLD.
Gold held under Earmarkby Federal Reserve Banks for Foreign Account,
in millions of dollars.
2000
1800
1600
1400
1200
1000
800
G00
400
2000
«/a» 1931 1932 1933 193* 19351936 1937 1938 1939 1940 1941
The intensity of the physicalmovement of gold to the UnitedStates in 1940 is perhaps bestshown by the fact that in thethree months May, June andJuly gold to the value of$2,118 million was imported intothe United States. For the yearas a whole the gold importsamounted to $4,744 million, ofwhich $645 million net wereplaced under earmark at theFederal Reserve Banks. The re-mainder was added to the mone-tary gold stock of the UnitedStates which, including acqui-sitions from domestic productionand certain other sources, roseby $4,351 million in 1940.
What were the principal fac-tors behind this huge movement?The estimate of the United Statesbalance of payments for 1940shows a surplus of $1,319 mil-lion on the current account
— 94 —
(which includes, besides the export surplus, such items as dividend pay-ments, tourist traffic, .freights, etc.). The settlement of this surplus balanceaccounts for 30 per cent, of the gold acquisitions. As to the remaining70 per cent., representing just over $3,000 million, the underlying movementwas no longer a flow of funds on private account to the United States butmainly transfer of fun'ds to build up official balances in New York for theaccount of foreign central banks and governments.
Of the net gold imports to the United States in 1940 $3,255 million outof a total of $4,744 million came from Canada and the United Kingdom. Netimports from France were $242 million — practically all during June 1940.South Africa shipped $185 million direct to the United States. The value ofSouth Africa's gold output in 1940 was $492 million, of which $118 millionwent to increase the holdings of the South African Reserve Bank. Outsidethe United States this was the largest addition to the monetary reserves ofany country. During 1940 the gold reserves of Holland, Sweden and Switzerlandfell by $270 million, almost wholly, in the first half of the year and principallyon account of payments for excess imports of goods from the United States.
(After the military and political events in the spring of 1940 certain central
banks ceased to publish the magnitude of their gold reserves. A number ofbanks have reported exactly the same gold holdings at the end of 1940 asat the end of 1939 (as may be seen from the table on the next page). Inseveral cases gold continued to be held outside the reported reserves, andchanges in these undisclosed holdings have no doubt occurred in the courseof the year.
While the total of the reported gold holdings had a value of $29 milliardat the end of 1940, the total monetary gold stock at that date may be estimated(as already indicated above) at probably $31.5 milliard. The weight of thisstock is about 28,000 metric tons. Considering that this represents theaccumulated product of hundreds of years, gold must still be considered avery scarce metal ; but it should be added that more than half of the totalstock has been produced since 1920.
In the ardent discussions to which the problems connected with goldhave given rise since the war began, two questions have in particular beenraised : Firstly, what are the effects of the concentration of so much gold onthe price structure and the credit system in the United States? Secondly, howis the status of gold affected by the development of clearings in Europe?
As to the first question, the principal tendencies may briefly be statedas follows: gold sent to the United States before the outbreak of the warlargely reflected movements of capital funds, which had hardly any effect onthe immediate demand for goods and services, the funds produced by thesale of gold remaining, for the most part, as idle deposits in the bankingsystem or otherwise adding to the already redundant supplies of unusedcredit in the country. Recent gold shipments, on the other hand, have been
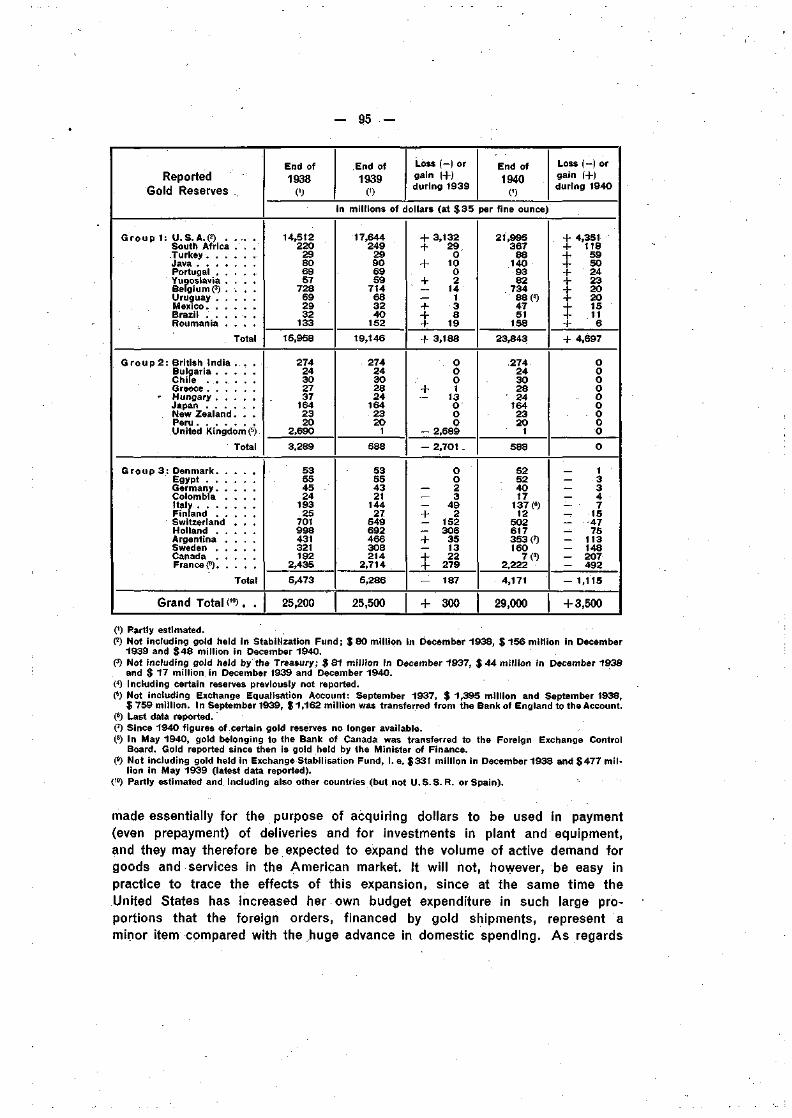
— 95 —
ReportedGold Reserves
Group 1: U.S.A.« .South AfricaTurkey. . .Java . . . .Portugal . .Yugoslavia .Belgium« .Uruguay . .Mexico. . .Brazil . . .Roumania .
Group 2: British IndiaBulgaria . .Chile . . .Greece . . .
* Hungary . .Japan . . .New ZealandP e r u . . . .United Kingdc
Group 3: Denmark. .Egypt . . .Germany. .Colombia .Italy . . . .Finland . .SwitzerlandHolland . .Argentina .Sweden . .Canada . .France O. .
rotai
>m (5)
rotai
Total
Grand Total 0°). .
End of1938
0)
End of1939
(')
Loss (—) orgain (+)during 1939
End of1940
0)
Loss (—) orgain (+)during 1940
in millions of dollars (at $35 per fine ounce)
14,51222029806957
728692932
133
15,958
27424302737
1642320
2,690
3,289
53554524
19325
701998431321192
2,435
5,473
25,200
17,644249
29906959
714683240
152
19,146
27424302824
1642320
1
588
53554321
14427
549692466308214
2,714
5,286
25,500
+ 3,132+ 29+ 10+ 2— 14— 1+ 3+ 8+ 19+ 3,188
000
± 13000
- 2,689
— 2,701 _
00
— 23
- 49+ 2- 152- 306+ 35— 13+ 22+ 279
- 187
+ 300
21,99536788
1409382
73488(<)4751
158
23,843
27424302824
1642320
1
588
52524017
137«12
502617353 (')160
7(»)2,222
4,171
29,000
+ 4,351+ 118+ 59+ 50+ 24+ 23+ 20+ 20+ 15+ J1+ 6+ 4,697
000000000
0
— 1— 3— 3— 4: y— 15- 47-^ 75- 113— 148— 207- 492— 1,115
+ 3,500
(') Partly estimated.(2) Not including gold held in Stabilization Fund; $ 8 0 million in December 1938, $ 156 million in December
1939 and $ 4 8 million in December 1940.(3) Not including gold held by the Treasury; $ 8 1 million in December 1937, $ 44 million in December 1938
and $ 17 million in December 1939 and December 1940.(4) Including certain reserves previously not reported.(5) Not including Exchange Equalisation Account: September 1937, $ 1,395 million and September 1938,
$ 759 million. In September 1939, $ 1 , 1 6 2 million was transferred from the Bank of England to the Account.C) Last data reported.(7) Since 1940 figures of certain gold reserves no longer available.(8) In May 1940 , gold belonging to the Bank of Canada was transferred to the Foreign Exchange Control
Board. Gold reported since then is gold held by the Minister of Finance.(s) Not including gold held in Exchange Stabilisation Fund, i. e. $ 3 3 1 million in December 1938 and $ 4 7 7 mil-
lion in May 1939 (latest data reported).0°) Partly estimated and including also other countries (but not U .S .S . R. or Spain).
made essentially for the purpose of acquiring dollars to be used in payment(even prepayment) of deliveries and for investments in plant and equipment,and they may therefore be expected to expand the volume of active demand forgoods and services in the American market. It will not, however, be easy inpractice to trace the effects of this expansion, since at the same time theUnited States has increased her own budget expenditure in such large pro-portions that the foreign orders, financed by gold shipments, represent aminor item compared with the huge advance in domestic spending. As regards
- 96 -
the credit system, incoming gold leads, of course, to an increase in excessreserves, since the new demand deposits created need be covered by reservesonly to the extent of 12-22% per cent. But deposits with member banks havebeen rising steeply of late for reasons other than gold imports (as a result ofincreased commercial lending and continued purchases of government securi-ties by the banks) and the amount of money in circulation has also gone up;both movements tend to reduce total member-bank excess reserves. Indeed,with the slowing-up of the gold inflow since the autumn of 1940, these reserveshave fallen from a maximum of $7,000 million at the end of October to $5,400million in June 1941. The importance of taking action against the effects offurther gold acquisitions seems somewhat less pressing when excess reservesare on the decline.
Already in a speech on 3rd May 1940 the Secretary to the United StatesTreasury Department dealt with a number of suggestions put forward in thegold discussions. He declared himself opposed to a cessation of goldpurchases, a cut in the price of gold and a discrimination against certaincountries in the purchase of gold. His conclusion was that continued ac-ceptance of gold by the United States was "the only sound course of actionopen to us".
The development of clearings in Europe has given rise to certain fearswith regard to the future position of gold as an element in the monetarystructure. It has been noted that Germany has been able to finance rearma-ment and war with very slight gold reserves and that the foreign trade ofGermany and Italy has been carried on largely on a clearing basis. Hencethe question is being asked whether a new monetary system is being developedwhich will altogether dispense with the services of gold.
In authoritative statements made on this subject in Germany and Italya distinction is drawn between different functions of gold. The President ofthe German Reichsbank said in a speech on 26th July 1940 that "in any casegold will in the future play no rôle as a basis of European currencies, fora currency is not dependent upon its cover but on the value which is givento it by the state, i.e. by the economic order as regulated by the state"."It is" , he added, "another matter whether gold should be regarded as asuitable medium for the settlement of debit balances between countries ; butwe shall never pursue a monetary policy which makes us in any way dependentupon gold, for it is impossible to tie oneself to a medium the value of whichone cannot determine oneself."
The Governor of the Banca d'Italia, in a speech on 29th March 1941,also pointed out that, although the possibility of a development of this kindcould not be excluded in connection with European trade with overseas countries,it was difficult to believe that this would occur immediately after the cessation ofhostilities, when payment in gold to correct disequilibria would in all probabilitybe necessary; the need of maintaining metallic reserves would, however, be con-centrated more and more on the clearing centres. "For years now the importanceof gold as backing for the currency and as basis of the credit structure hasbeen non-existent, the automatic working of the system having failed to stand
- 97 -
the test just when exceptional circumstances called for its efficient functioning:under state control credit has been commensurate with production and labour,and the stability of the currency has been maintained independently of theamount of the gold reserves."
The tendency in these and similar statements is to circumscribe strictlythe rôle which gold may play in the monetary system : instead of exerting adominating influence on credit policy, its usefulness is found more particularlyin its services as an international medium for settling balances arising fromtime to time between different countries, and thus preventing them fromdisturbing the exchange markets. In that way a greater flexibility is attainedthan would be possible if complete balancing, even over brief periods,were exacted. Besides gold, the U. S. dollar and some other currencieshave often been used as a settling medium ; but the licensing system towhich dollar assets in the United States have been subjected has made itdifficult, if not impossible, for many countries to make use of the dollar forsuch a purpose. The result has been a certain tendency, of late, to fall backmore upon gold for payment of outstanding balances ; central banks have beenbuying gold from each other at more or less fixed prices applicable speci-fically to the transactions between them. Sometimes clearing agreements havecontained provisions as to the magnitude of balances which may be settledotherwise than by export of commodities.
As long as war conditions last, the likelihood is that in domestic creditpolicies little attention will be paid to changes in the reserves of gold andother foreign assets, on account of the dominating importance of otherconsiderations. On the other hand, a shift in gold movements (and thesame applies with certain reservations to movements in foreign exchangeholdings or clearing balances) can probably not be altogether neglected. Whengold is bought or sold by a central bank, the credit structure is subjectedto certain direct effects which, as a rule, can be neutralised only by specificmeasures. Moreover, in normal times gold movements may well be a sign ofa maladjustment which requires correction. If, instead of physical transfersof gold, changes occur in the movements of other foreign assets, includingclearing balances in thé hands of central banks, the problem is not alteredfundamentally, except that these assets may not be so easily transferred tothird parties. If it is taken for granted that a monetary system does notfunction satisfactorily unless equilibrium is maintained in the economic andfinancial relationships between the different countries belonging to that system,then it is not unlikely that net changes in the balance of payments betweencountries (and consequently in their monetary reserves) will serve as oneamong several indications of disequilibrium and will give rise to correctivemeasures in the field of credit policy or direct intervention in foreign trade,or both. This does not mean a simple application of automatic rules butimplies that, for a fundamental equilibrium to be maintained, regard mustnormally be paid to the repercussions of the balances of payments onmonetary reserves.
— 98 —
IV. INTERNATIONAL CAPITAL MOVEMENTS.
European investments in the United States at the outbreak of warin 1914 have been estimated at over $6,000 million, of which British interestsin American railroads formed the most important part. During the war of1914-18 these foreign dollar holdings were heavily drawn upon and by the endof 1919 the total foreign stake in the United States was probably not morethan $2,800 million. The considerable capital outflow from the United States inthese years (indicated by the decline of foreign investments in the countryas well as by the mounting "war debts") was continued in the form of privatecapital issues after the war, and in the 'twenties the United States was theworld's principal exporter of capital. By 1929-30 total American investmentsabroad probably reached $15,000 million, offset to some extent by foreigninvestments in the United States. In addition, "war debts" to a nominalamount of over $ 10,000 million were outstanding and the service wasbeing paid.
This movement was sharply reversed upon the collapse of the New Yorkstock exchange, the international monetary crisis and the Hoover moratorium,and during the 'thirties the United States became the world's principal importerof capital, not only through the withdrawal of dollar credits previously grantedto foreign markets, but, especially since 1934, by the influx of foreign funds.By the end of 1939 American investments in foreign countries had beenreduced to $11,400 million, while foreign investments in the United Stateshad grown to $9,500 million, so that — apart from war debts — the net creditorposition of that country had fallen below $2,000 million. The reduction ofthe net creditor position had for some time averaged more than $1,000 milliona year and it was expected that by 1940 or 1941 the United States mightagain become a debtor country on foreign account (although the principalowner of the world's gold stock). As a result of the war in Europe, thisexpectation was not realised — the movement of funds to the United Stateschanged in character when dollar resources were used for the purchase ofwar materials. The growing surplus in the merchandise balance and thegranting of credits by the Export-Import Bank has, in fact, strengthened theUnited States' creditor position during the past year.
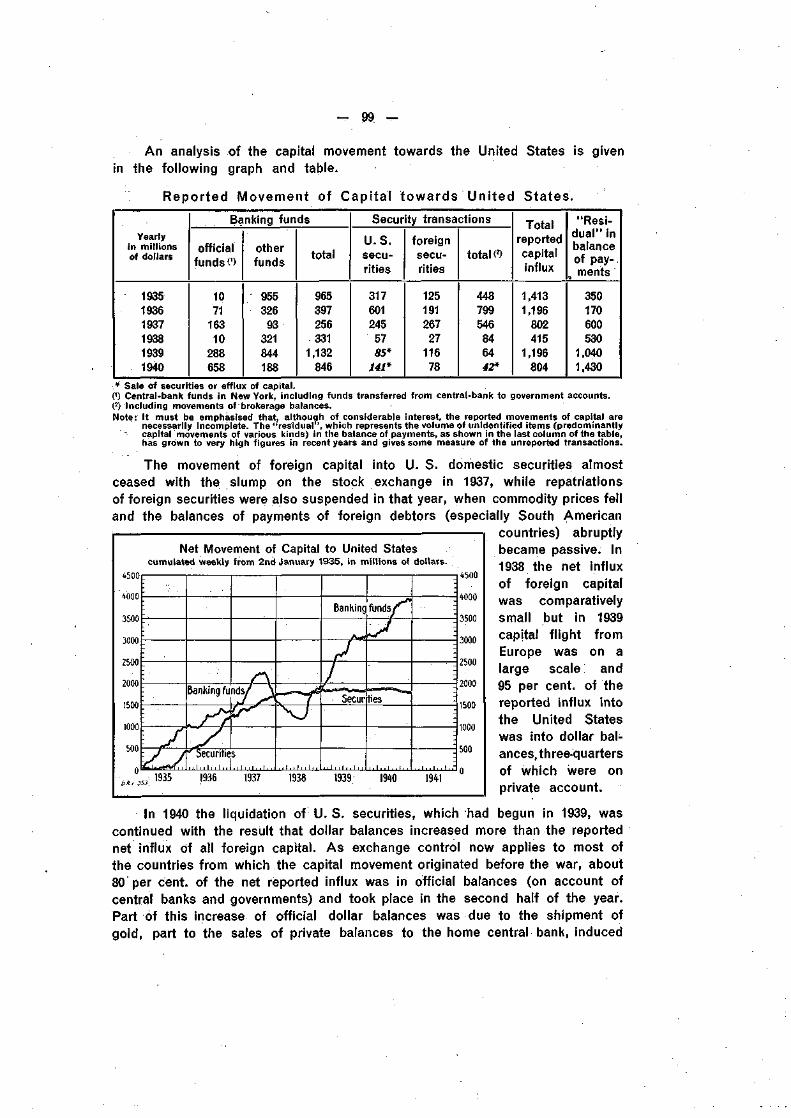
99 —
An analysis of the capital movement towards the United States is givenin the following graph and table.
Reported Movement of Capital towards United States.
Yearlyin millionsof dollars
193519361937193819391940
Banking funds
officialfunds 0)
1071
16310
288658
otherfunds
955326
93321844188
total
965397256331
1,132846
Security transactions
U.S.secu-rities
3176012455785*
141*
foreignsecu-rities
12519126727
11678
total«
448799546
846442*
Totalreportedcapitalinflux
1,4131,196
802415
1,196804
"Resi-dual" inbalanceof pay-ments
350170600530
1,0401,430
Net Movement of Capital to United Statescumulated weekly from 2nd January 1935, in millions of dollars.
* Sale of securities or efflux of capital.0) Central-bank funds in New York, including funds transferred from central-bank to government accounts.(2) Including movements of brokerage balances.Note: It must be emphasised that, although of considerable interest, the reported movements of capital are
necessarily incomplete. The "residual", which represents the volume of unidentified items (predominantly- capital movements of various kinds) in the balance of payments, as shown in the last column of the table,
has grown to very high figures in recent years and gives some measure of the unreported transactions.
The movement of foreign capital into U. S. domestic securities almostceased with the slump on the stock exchange in 1937, while repatriationsof foreign securities were also suspended in that year, when commodity prices felland the balances of payments of foreign debtors (especially South American
countries) abruptlybecame passive. In1938 the net influxof foreign capitalwas comparativelysmall but in 1939capital flight fromEurope was on alarge scale and95 per cent, of thereported influx intothe United Stateswas into dollar bal-ances, three-quartersof which were onprivate account.
4500
4000
3500
3000
2500
2000
1500
1000
500
Banking fu
y^Securitie
A7 A
sh i
Bankinç
A "
r•JSecur
uh
funds/^"^
L7
ties
i , ,
;
:
i..-
4500
4000
3500
3000
2500
2000
1500
1000
500
1935 1936 1937 1938 1939 1940
In 1940 the liquidation of U. S. securities, which had begun in 1939, wascontinued with the result that dollar balances increased more than the reportednet influx of all foreign capital. As exchange control now applies to most ofthe countries from which the capital movement originated before the war, about80 per cent, of the net reported influx was in official balances (on account ofcentral banks and governments) and took place in the second half of the year.Part of this increase of official dollar balances was due to the shipment ofgold, part to the sales of private balances to the home central bank, induced
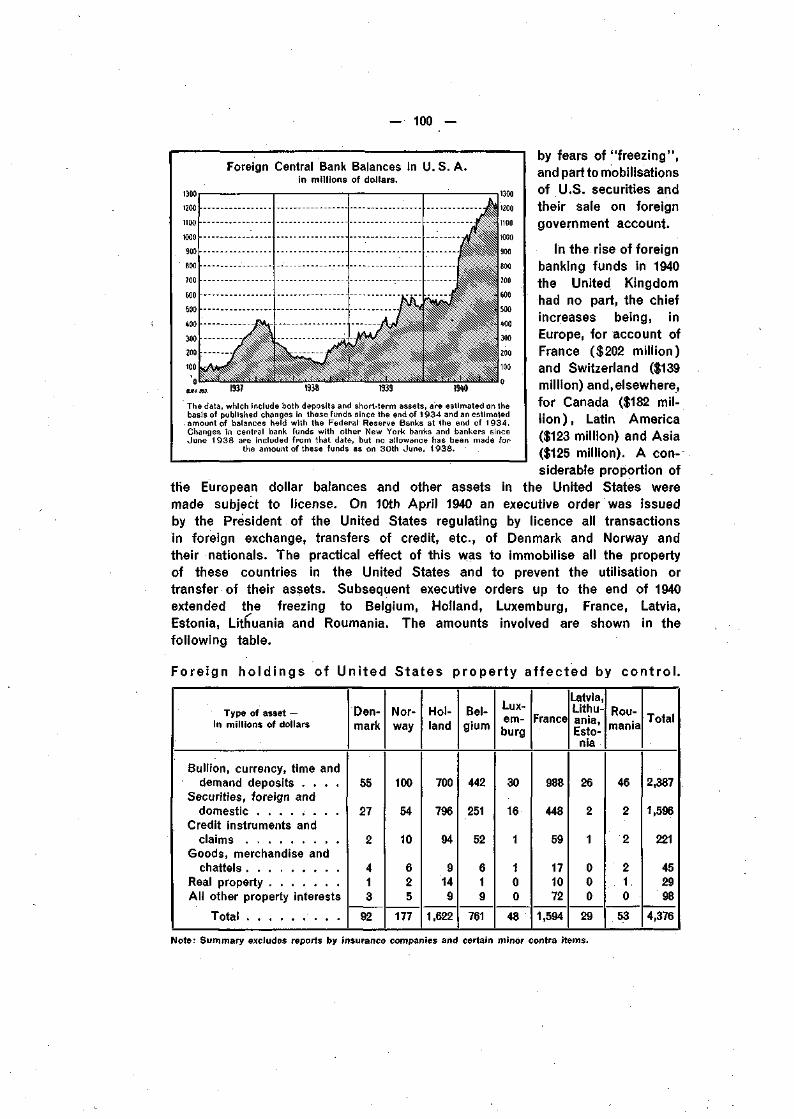
— 100 -
Foreign Central Bank Balances in U.S.A.in millions of dollars.
1300
1200
by fears of "freezing",and part to mobilisationsof U.S. securities andtheir sale on foreigngovernment account.
In the rise of foreignbanking funds in 1940the United Kingdomhad no part, the chiefincreases being, inEurope, for account ofFrance ($202 million)and Switzerland ($139million) and, elsewhere,for Canada ($182 mil-l ion), Latin America($123 million) and Asia($125 million). A con-siderable proportion of
the European dollar balances and other assets in the United States weremade subject to license. On 10th April 1940 an executive order was issuedby the President of the United States regulating by licence all transactionsin foreign exchange, transfers of credit, etc., of Denmark and Norway andtheir nationals. The practical effect of this was to immobilise all the propertyof these countries in the United States and to prevent the utilisation ortransfer of their assets. Subsequent executive orders up to the end of 1940extended the freezing to Belgium, Holland, Luxemburg, France, Latvia,Estonia, Lithuania and Roumania. The amounts involved are shown in thefollowing table.
1937
The data, which Include both deposits and short-term assets, are estimated on thebasis of published changes in these funds since the end of 1 934 and an estimatedamount of balances held with the Federal Reserve Banks at the end of 1934.Changes in central bank funds with other New York banks and bankers sinceJune 1938 are included from that date, but no allowance has been made for
the amount of these funds as on 30th June, 1938.
Fore ign h o l d i n g s of U
Type of asset —in millions of dollars
Bullion, currency, time anddemand deposits . . . .
Securities, foreign anddomestic . . . . . . . .
Credit instruments andclaims
Goods, merchandise andchattels
Real propertyAll other property interests
Total
ni ted
Den-mark
55
27
2
413
92
States p rope r t y a f f ec ted by c o n t r o l .
Nor-way
100
54
10
625
177
Hol-land
700
796
94
9149
1,622
Bel-gium
442
251
52
619
761
Lux-em-burg
30
16
1
100
48
France
988
448
59
171072
1,594
Latvia,Lithu-ania,Esto-nia
26
2
1
000
29
Rou-mania
(O
CM
C
M
CM
10
53
Total
2,387
1,596
221
452998
4,376
Note: Summary excludes reports by insurance companies and certain minor contra items.
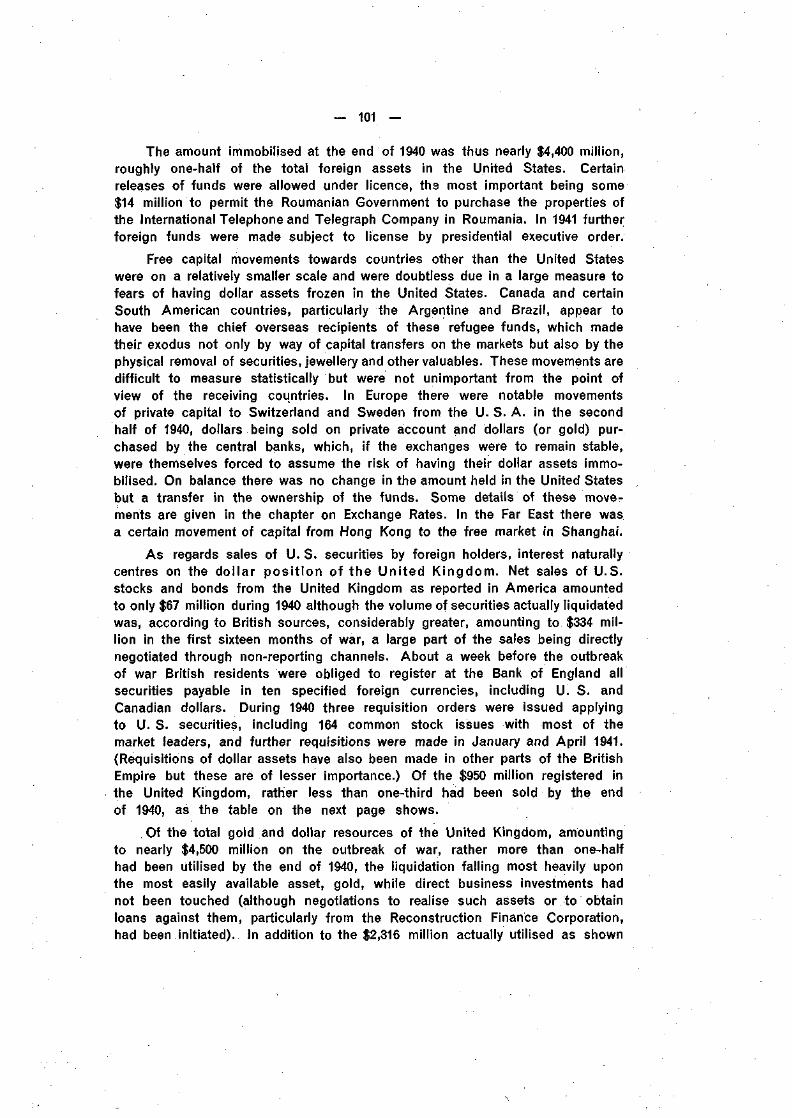
- 101 -
The amount immobilised at the end of 1940 was thus nearly $4,400 million,roughly one-half of the total foreign assets in the United States. Certainreleases of funds were allowed under licence, the most important being some$14 million to permit the Roumanian Government to purchase the properties ofthe International Telephone and Telegraph Company in Roumania. In 1941 furtherforeign funds were made subject to license by presidential executive order.
Free capital movements towards countries other than the United Stateswere on a relatively smaller scale and were doubtless due in a large measure tofears of having dollar assets frozen in the United States. Canada and certainSouth American countries, particularly the Argentine and Brazil, appear tohave been the chief overseas recipients of these refugee funds, which madetheir exodus not only by way of capital transfers on the markets but also by thephysical removal of securities, jewellery and other valuables. These movements aredifficult to measure statistically but were not unimportant from the point ofview of the receiving countries. In Europe there were notable movementsof private capital to Switzerland and Sweden from the U. S-A. in the secondhalf of 1940, dollars being sold on private account and dollars (or gold) pur-chased by the central banks, which, if the exchanges were to remain stable,were themselves forced to assume the risk of having their dollar assets immo-bilised. On balance there was no change in the amount held in the United Statesbut a transfer in the ownership of the funds. Some details of these move-ments are given in the chapter on Exchange Rates. In the Far East there wasa certain movement of capital from Hong Kong to the free market in Shanghai.
As regards sales of U. S. securities by foreign holders, interest naturallycentres on the dollar pos i t ion of the United Kingdom. Net sales of U.S.stocks and bonds from the United Kingdom as reported in America amountedto only $67 million during 1940 although the volume of securities actually liquidatedwas, according to British sources, considerably greater, amounting to $334 mil-lion in the first sixteen months of war, a large part of the sales being directlynegotiated through non-reporting channels. About a week before the outbreakof war British residents were obliged to register at the Bank of England allsecurities payable in ten specified foreign currencies, including U. S. andCanadian dollars. During 1940 three requisition orders were issued applyingto U. S. securities, including 164 common stock issues with most of themarket leaders, and further requisitions were made in January and April 1941.(Requisitions of dollar assets have also been made in other parts of the BritishEmpire but these are of lesser importance.) Of the $950 million registered inthe United Kingdom, rather less than one-third had been sold by the endof 1940, as the table on the next page shows.
Of the total gold and dollar resources of the United Kingdom, amountingto nearly $4,500 million on the outbreak of war, rather more than one-halfhad been utilised by the end of 1940, the liquidation falling most heavily uponthe most easily available asset, gold, while direct business investments hadnot been touched (although negotiations to realise such assets or to obtainloans against them, particularly from the Reconstruction Finance Corporation,had been initiated). In addition to the $2,316 million actually utilised as shown
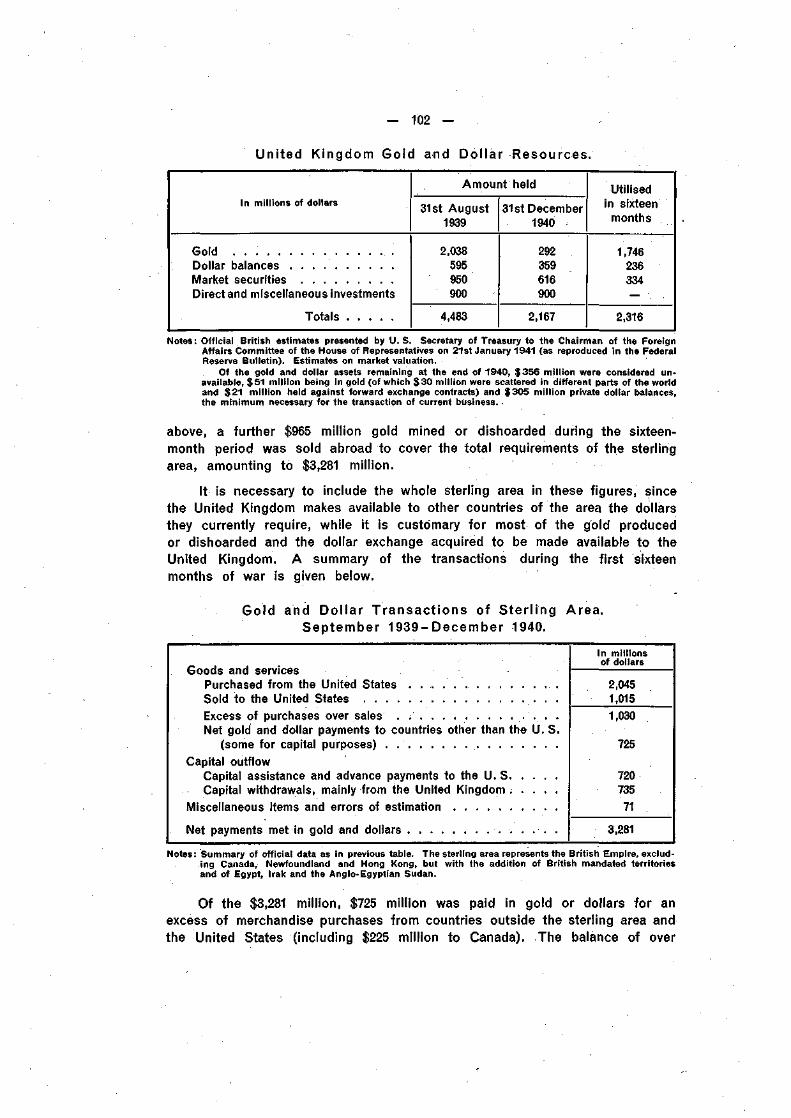
— 102 —
United Kingdom Gold and Dol lar Resources.
In millions of dollars
Gold .Dollar balancesMarket securitiesDirect and miscellaneous investments
Totals
Amount held
31st August1939
2,038595950900
4,483
31st December1940
292359616900
2,167
Utilisedin sixteen
months
1,746236334
2,316
Notes: Official British estimates presented by U.S. Secretary of Treasury to the Chairman of the ForeignAffairs Committee of the House of Representatives on 21st January 1941 (as reproduced in the FederalReserve Bulletin). Estimates on market valuation.
Of the gold and dollar assets remaining at the end of 1940, $356 million were considered un-available, $51 million being in gold (of which $30 million were scattered in different parts of the worldand $21 million held against forward exchange contracts) and $305 million private dollar balances,the minimum necessary for the transaction of current business..
above, a further $965 million gold mined or dishoarded during the sixteen-month period was sold abroad to cover the total requirements of the sterlingarea, amounting to $3,281 million.
It is necessary to include the whole sterling area in these figures, sincethe United Kingdom makes available to other countries of the area the dollarsthey currently require, while it is customary for most of the gold producedor dishoarded and the dollar exchange acquired to be made available to theUnited Kingdom. A summary of the transactions during the first sixteenmonths of war is given below.
Gold and Dol lar Transact ions of Ster l ing Area.September 1939-December 1940.
Goods and servicesPurchased from the United StatesSold to the United States . .
Excess of purchases over sales . . . . . • • • •Net gold and dollar payments to countries other than the U. S.
(some for capital purposes) .
Capital outflowCapital assistance and advance payments to the U. S
Capital withdrawals, mainly from the United Kingdom . . . . .
Miscellaneous items and errors of estimation .
Net payments met in gold and dollars
In millionsof dollars
2,0451,015
1,030
725
720735
71
3,281
Notes: Summary of official data as in previous table. The sterling area represents the British Empire, exclud-ing Canada, Newfoundland and Hong Kong, but with the addition of British mandated territoriesand of Egypt, Irak and the Anglo-Egyptian Sudan.
Of the $3,281 million, $725 million was paid in gold or dollars for anexcess of merchandise purchases from countries outside the sterling area andthe United States (including $225 million to Canada). The balance of over
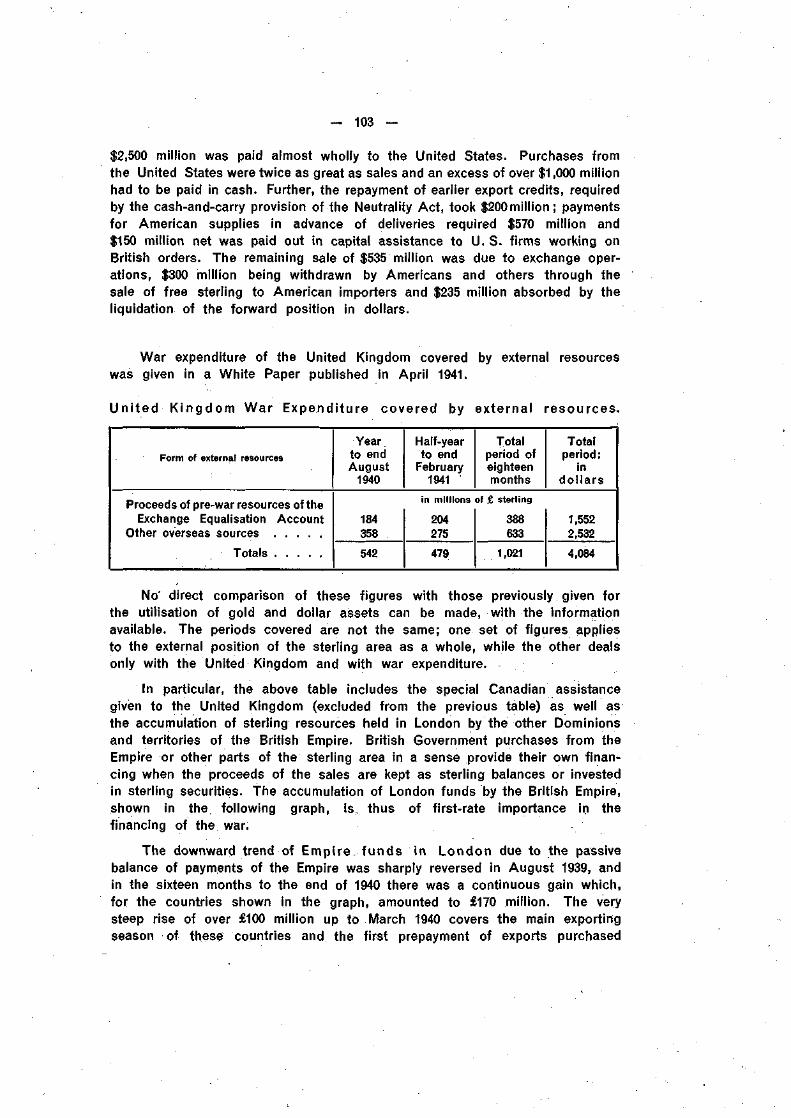
— 103 —
$2,500 million was paid almost wholly to the United States. Purchases fromthe United States were twice as great as sales and an excess of over $1,000 millionhad to be paid in cash. Further, the repayment of earlier export credits, requiredby the cash-and-carry provision of the Neutrality Act, took $200million; paymentsfor American supplies in advance of deliveries required $570 million and$150 million net was paid out in capital assistance to U.S. firms working onBritish orders. The remaining sale of $535 million was due to exchange oper-ations, $300 million being withdrawn by Americans and others through thesale of free sterling to American importers and $235 million absorbed by theliquidation of the forward position in dollars.
War expenditure of the United Kingdom covered by external resourceswas given in a White Paper published in April 1941.
Un i ted K ingdom War Expenditure covered by external resources.
Form of external resources
Proceeds of pre-war resources of theExchange Equalisation Account
Other overseas sources
Totals
Yearto endAugust
1940
184358
542
Half-yearto end
February1941
in millions
204275
479
Totalperiod ofeighteenmonths
of £ sterling
388633
1,021
Totalperiod:
indo l la rs
1,5522,532
4,084
No' direct comparison of these figures with those previously given forthe utilisation of gold and dollar assets can be made, with the informationavailable. The periods covered are not the same; one set of figures appliesto the external position of the sterling area as a whole, while the other dealsonly with the United Kingdom and with war expenditure.
In particular, the above table includes the special Canadian assistancegiven to the United Kingdom (excluded from the previous table) as well asthe accumulation of sterling resources held in London by the other Dominionsand territories of the British Empire. British Government purchases from theEmpire or other parts of the sterling area in a sense provide their own finan-cing when the proceeds of the sales are kept as sterling balances or investedin sterling securities. The accumulation of London funds by the British Empire,shown in the following graph, is. thus of first-rate importance in thefinancing of the war.
The downward trend of Empire funds in London due to the passivebalance of payments of the Empire was sharply reversed in August 1939, andin the sixteen months to the end of 1940 there was a continuous gain which,for the countries shown in the graph, amounted to £170 million. The verysteep rise of over £100 million up to March 1940 covers the main exportingseason of these countries and the first prepayment of exports purchased
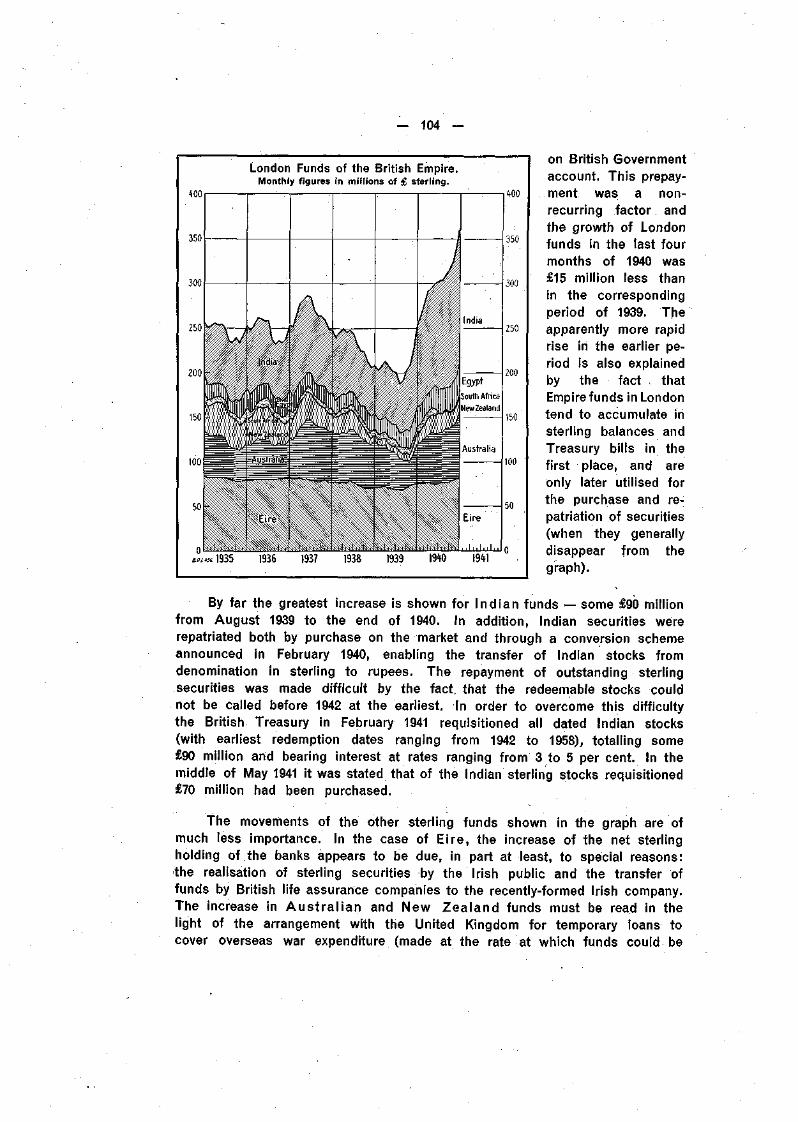
— 104 —
London Funds of the British Empire.Monthly figures in millions of £ sterling.
400
350
300
250
350
100
50
«,.«1935 1936 1937 1938 1939 19W 1941
on British Governmentaccount. This prepay-ment was a non-recurring factor andthe growth of Londonfunds in the last fourmonths of 1940 was£15 million less thanin the correspondingperiod of 1939. Theapparently more rapidrise in the earlier pe-riod is also explainedby the fact < thatEmpire funds in Londontend to accumulate insterling balances andTreasury bills in thefirst place, and areonly later utilised forthe purchase and re-patriation of securities(when they generallydisappear from thegraph).
By far the greatest increase is shown for Indian funds — some £90 millionfrom August 1939 to the end of 1940. In addition, Indian securities wererepatriated both by purchase on the market and through a conversion schemeannounced in February 1940, enabling the transfer of Indian stocks fromdenomination in sterling to rupees. The repayment of outstanding sterlingsecurities was made difficult by the fact, that the redeemable stocks couldnot be called before 1942 at the earliest. In order to overcome this difficultythe British Treasury in February 1941 requisitioned all dated Indian stocks(with earliest redemption dates ranging from 1942 to 1958), totalling some£90 million and bearing interest at rates ranging from 3 to 5 per cent. In themiddle of May 1941 it was stated that of the Indian sterling stocks requisitioned£70 million had been purchased.
the movements of the other sterling funds shown in the graph are ofmuch less importance. In the case of Eire, the increase of the net sterlingholding of the banks appears to be due, in part at least, to special reasons:the realisation of sterling securities by the Irish public and the transfer offunds by British life assurance companies to the recently-formed Irish company.The increase in Aus t ra l ian and New Zealand funds must be read in thelight of the arrangement with the United Kingdom for temporary loans tocover overseas war expenditure (made at the rate at which funds could be
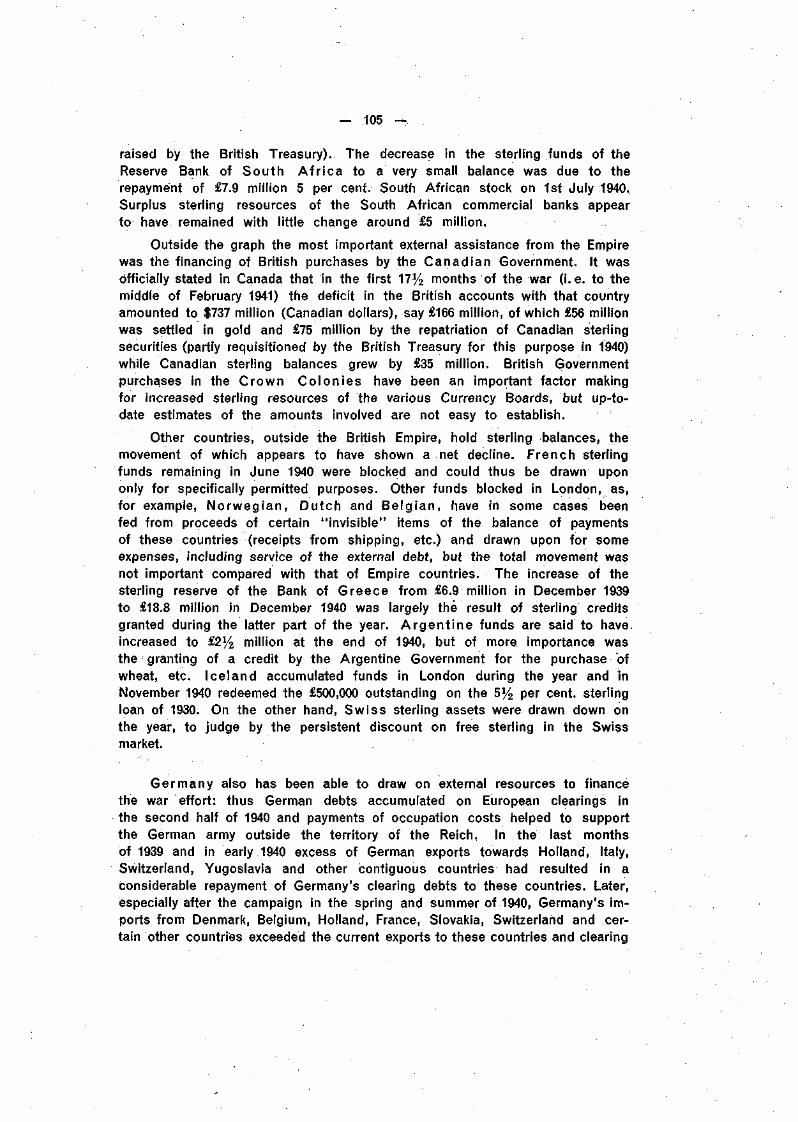
— 105 —
raised by the British Treasury). The decrease in the sterling funds of theReserve Bank of South A f r i ca to a very small balance was due to therepayment of £7.9 million 5 per cent. South African stock on 1st July 1940.Surplus sterling resources of the South African commercial banks appearto have remained with little change around £5 million.
Outside the graph the most important external assistance from the Empirewas the financing of British purchases by the Canadian Government. It wasofficially stated in Canada that in the first 17% months of the war (i.e. to themiddle of February 1941) the deficit in the British accounts with that countryamounted to $737 million (Canadian dollars), say £166 million, of which £56 millionwas settled in gold and £75 million by the repatriation of Canadian sterlingsecurities (partly requisitioned by the British Treasury for this purpose in 1940)while Canadian sterling balances grew by £35 million. British Governmentpurchases in the Crown Colonies have been an important factor makingfor increased sterling resources of the various Currency Boards, but up-to-date estimates of the amounts involved are not easy to establish.
Other countries, outside the British Empire, hold sterling balances, themovement of which appears to have shown a net decline. French sterlingfunds remaining in June 1940 were blocked and could thus be drawn upononly for specifically permitted purposes. Other funds blocked in London, as,for example, Norwegian, Dutch and Belg ian, have in some cases beenfed from proceeds of certain "invisible" items of the balance of paymentsof these countries (receipts from shipping, etc.) and drawn upon for someexpenses, including service of the external debt, but the total movement wasnot important compared with that of Empire countries. The increase of thesterling reserve of the Bank of Greece from £6.9 million in December 1939to £18.8 million in December 1940 was largely thé result of sterling creditsgranted during the latter part of the year. A rgen t ine funds are said to have,increased to £2% million at the end of 1940, but of more importance wasthe granting of a credit by the Argentine Government for the purchase ofwheat, etc. Iceland accumulated funds in London during the year and inNovember 1940 redeemed the £500,000 outstanding on the 5% per cent, sterlingloan of 1930. On the other hand, Swiss sterling assets were drawn down onthe year, to judge by the persistent discount on free sterling in the Swissmarket.
Germany also has been able to draw on external resources to financethe war effort: thus German debts accumulated on European clearings inthe second half of 1940 and payments of occupation costs helped to supportthe German army outside the territory of the Reich, In the last monthsof 1939 and in early 1940 excess of German exports towards Holland, Italy,Switzerland, Yugoslavia and other contiguous countries had resulted in aconsiderable repayment of Germany's clearing debts to these countries. Later,especially after the campaign in the spring and summer of 1940, Germany's im-ports from Denmark, Belgium, Holland, France, Slovakia, Switzerland and cer-tain other countries exceeded the current exports to these countries and clearing
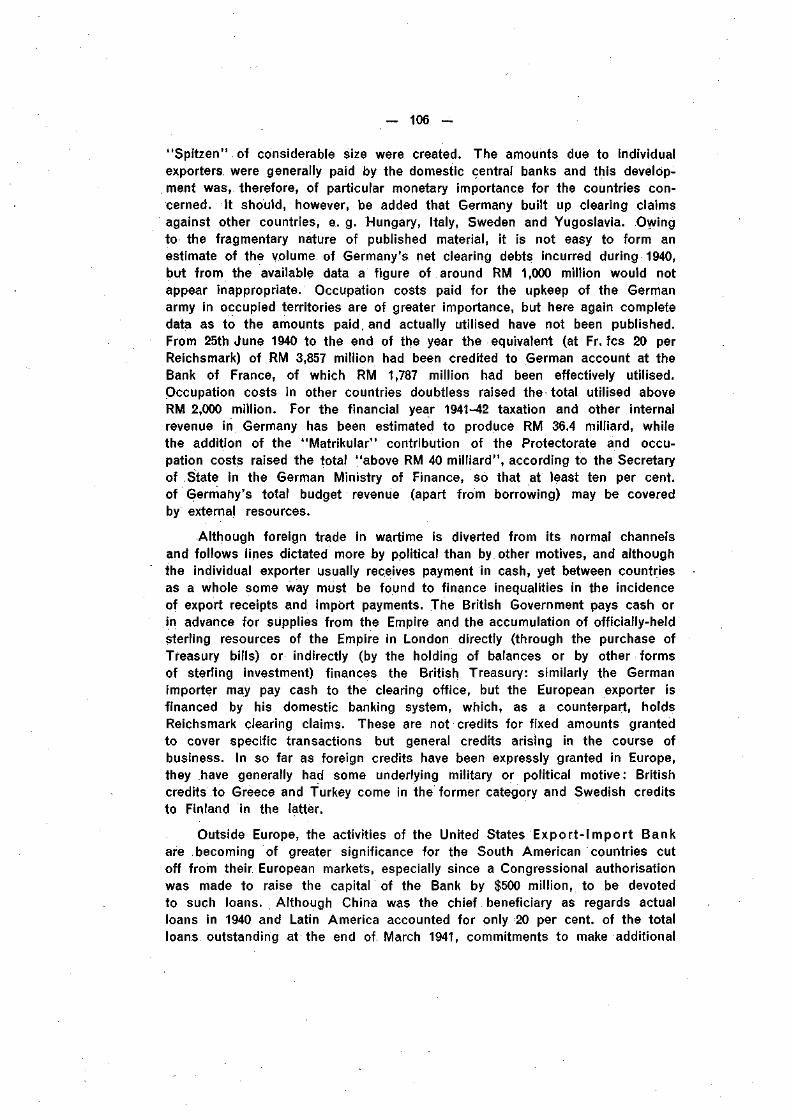
— 106 —
"Spitzen" of considerable size were created. The amounts due to individualexporters were generally paid by the domestic central banks and this develop-ment was, therefore, of particular monetary importance for the countries con-cerned. It should, however, be added that Germany built up clearing claimsagainst other countries, e. g. Hungary, Italy, Sweden and Yugoslavia. Owingto the fragmentary nature of published material, it is not easy to form anestimate of the volume of Germany's net clearing debts incurred during 1940,but from the available data a figure of around RM 1,000 million would notappear inappropriate. Occupation costs paid for the upkeep of the Germanarmy in occupied territories are of greater importance, but here again completedata as to the amounts paid, and actually utilised have not been published.From 25th June 1940 to the end of the year the equivalent (at Fr. fcs 20 perReichsmark) of RM 3,857 million had been credited to German account at theBank of France, of which RM 1,787 million had been effectively utilised.Occupation costs in other countries doubtless raised the total utilised aboveRM 2,000 million. For the financial year 1941-42 taxation and other internalrevenue in Germany has been estimated to produce RM 36.4 milliard, whilethe addition of the "Matrikular" contribution of the Protectorate and occu-pation costs raised the total "above RM 40 milliard", according to the Secretaryof State in the German Ministry of Finance, so that at least ten per cent,of Germany's total budget revenue (apart from borrowing) may be coveredby external resources.
Although foreign trade in wartime is diverted from its normal channelsand follows lines dictated more by political than by other motives, and althoughthe individual exporter usually receives payment in cash, yet between countriesas a whole some way must be found to finance inequalities in the incidenceof export receipts and import payments. The British Government pays cash orin advance for supplies from the Empire and the accumulation of officially-heldSterling resources of the Empire in London directly (through the purchase ofTreasury bills) or indirectly (by the holding of balances or by other formsof sterling investment) finances the British Treasury: similarly the Germanimporter may pay cash to the clearing office, but the European exporter isfinanced by his domestic banking system, which, as a counterpart, holdsReichsmark clearing claims. These are not credits for fixed amounts grantedto cover specific transactions but general credits arising in the course ofbusiness. In so far as foreign credits have been expressly granted in Europe,they have generally had some underlying military or political motive: Britishcredits to Greece and Turkey come in the former category and Swedish creditsto Finland in the latter.
Outside Europe, the activities of the United States Export - Import Bankare becoming of greater significance for the South American countries cutoff from their European markets, especially since a Congressional authorisationwas made to raise the capital of the Bank by $500 million, to be devotedto such loans. Although China was the chief beneficiary as regards actualloans in 1940 and Latin America accounted for only 20 per cent, of the totalloans outstanding at the end of March 1941, commitments to make additional
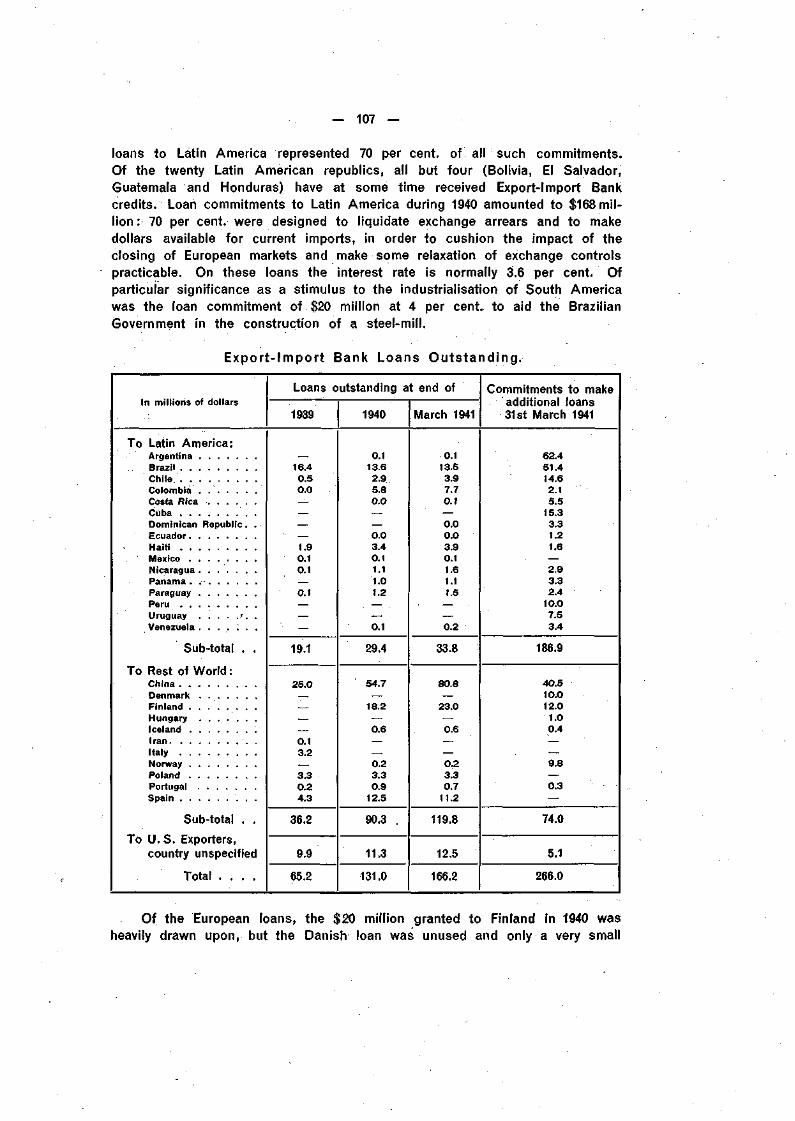
— 107 —
loans to Latin America represented 70 per cent, of all such commitments.Of the twenty Latin American republics, all but four (Bolivia, El Salvador,Guatemala and Honduras) have at some time received Export-Import Bankcredits. Loan commitments to Latin America during 1940 amounted to $168 mil-lion : 70 per cent, were designed to liquidate exchange arrears and to makedollars available for current imports, in order to cushion the impact of theclosing of European markets and make some relaxation of exchange controlspracticable. On these loans the interest rate is normally 3.6 per cent. Ofparticular significance as a stimulus to the industrialisation of South Americawas the loan commitment of $20 million at 4 per cent, to aid the BrazilianGovernment in the construction of a steel-mill.
Expor t - Import Bank Loans Outs tand ing.
In millions of dollars
To Latin America:ArgentinaBrazilChileColombia .Costa RicaCubaDominican Republic. .EcuadorHaitiMexicoNicaraguaPanama .ParaguayPeruUruguay '. .V e n e z u e l a . . . . . . .
Sub-total . .
To Rest of World :ChinaDenmarkFinlandHungary . . . . . . .Iceland1 ran .ItalyNorwayPolandPortugalSpain
Sub-total . .
To U.S. Exporters,country unspecified
Total . . . .
Loans outstanding at end of
1939
16.40.50.0
1.90.10.1
0.1
19.1
25.0
0.13.2
3.30.24.3
36.2
9.9
65.2
1940
0.113.62.95.80.0
0.03.40.11.11.01.2
0.1
29.4
54.7
18.2
0.6
0.23.30.9
12.5
90.3 ,
11.3
131.0
March 1941
0.113.53.97.70.1
0.00.03.90.11.61.11.5
0.2
33.8
80.8
23.0
0.6
0.23.30.7
11.2
119.8
12.5
166.2
Commitments to makeadditional loans31st March 1941
62.451.414.62.15.5
15.33.31.21.6
2.93.32.4
10.07.53.4
186.9
40.510.012.01.00.4
9.8
0.3
74.0
5.1
266.0
Of the European loans, the $20 million granted to Finland in 1940 washeavily drawn upon, but the Danish loan was unused and only a very small
— 108 —
part of the Norwegian loan was spent. $15 million was advanced to Swedenbut the $4 million employed was repaid and the balance not utilised. Theimmobilisation of European assets in the United States has now made certaincredit commitments purely nominal or they have been cancelled in the meantime.
During 1940 the Bank made three loans totalling $95 million to the ChineseGovernment and the Bank of China, of which $50 million was for currencystabilisation to be repaid over a period of years by Chinese exports of strategicand other materials needed for United States defence. Further credits forcurrency stabilisation were granted by the U. S. Exchange Stabi l izat ionFund in 1940, which made $50 million of dollar exchange available to China,$50 million to the Argentine and up to $60 million to Brazil. The Br i t ishGovernment also granted a loan of £10 million to Chjna, £5 million beingfor currency stabilisation and £5 million available for commodity purchaseswithin the sterling area.
Of particular interest was the loan made in December 1940 by the NationalCity Bank of New York to the Banco Central de Venezuela, to clear up blockedexchange and facilitate foreign trade — an exceptional example of a resumptionin the flow of new private capital from the United States towards SouthAmerica, which had completely dried up in recent years. There was also asuccessful public offering of $4 million 26-year 3% per cent, refunding bondsof the Republic of Panama in New York at the end of March 1941. Thiswas the first public offering of foreign bonds in the United States, except forCanadian government issues, since the Argentine floatation in November 1938.
Apart from the cases mentioned above, foreign credit operations havebeen practically confined to the renewal and repayment of old credits. TheSwiss banks' credit of Sw.fcs 40 million to the Argentine Government wasprolonged for a further six months in December 1940. German standstillagreements continue to run with Switzerland and the United States, interestbeing still transferred; with Holland the introduction of free capital transfersfrom 1st April 1941 has made an agreement superfluous, and with Belgianbanks separate arrangements on the basis of long-term credits have beenmade: the aggregate of RM 6,300 million standstill debts in 1931 has nowbeen reduced by repayments in registered marks or by currency depreciationsto less than one-tenth (even including debts to England and France). Repay-ments and consolidations of the credit granted to the National Bank ofHungary by central banks and the Bank for International Settlements in 1931are mentioned in the business section of this Report.
The thorny question of the current service of outstanding long-termforeign loans has become more complicated than ever. Changing politicaldivisions in Europe and constantly modified bilateral agreements make itimpracticable to give a detailed account in this Report. Broadly stated, therewere, early in June 1941, very little debt service payments in cash on privateor public foreign bonds of continental European countries to countries outsidethe continent, with some exceptions, e. g. Sweden and Switzerland and, inspite of difficulties, Denmark and Finland. Portugal, in an exceptionnally
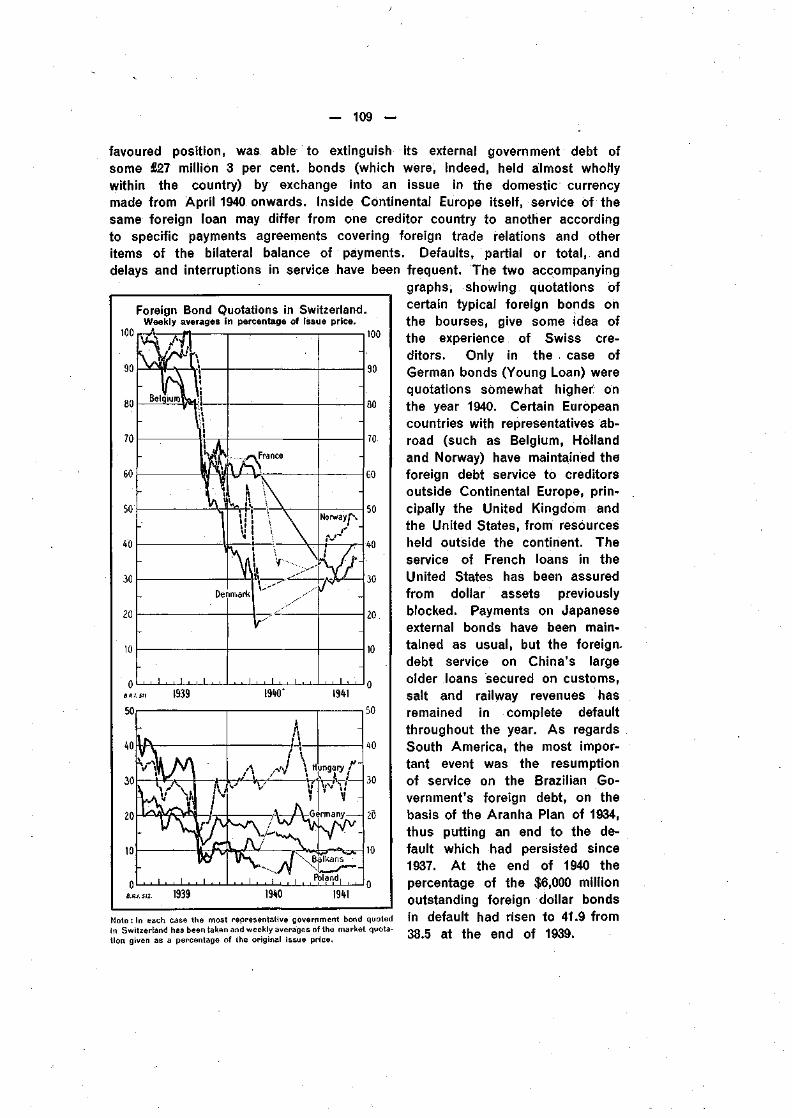
— 109 —
Foreign Bond Quotations in SwitzerlandWeekly averages in percentage of issue price.
1 0 0 100
90
80
70
60
50
favoured position, was able to extinguish its external government debt ofsome £27 million 3 per cent, bonds (which were, indeed, held almost whollywithin the country) by exchange into an issue in the domestic currencymade from April 1940 onwards. Inside Continental Europe itself, service of thesame foreign loan may differ from one creditor country to another accordingto specific payments agreements covering foreign trade relations and otheritems of the bilateral balance of payments. Defaults, partial or total, anddelays and interruptions in service have been frequent. The two accompanying
graphs, showing quotations ofcertain typical foreign bonds onthe bourses, give some idea ofthe experience of Swiss cre-ditors. Only in the case ofGerman bonds (Young Loan) werequotations somewhat higher onthe year 1940. Certain Europeancountries with representatives ab-road (such as Belgium, Hollandand Norway) have maintained theforeign debt service tó creditorsoutside Continental Europe, prin-cipally the United Kingdom andthe United States, from resourcesheld outside the continent. Theservice of French loans in theUnited States has been assuredfrom dollar assets previouslyblocked. Payments on Japaneseexternal bonds have been main-tained as usual, but the foreign,debt service on China's largeolder loans secured on customs,salt and railway revenues hasremained in complete defaultthroughout the year. As regardsSouth America, the most impor-tant event was the resumptionof service on the Brazilian Go-vernment's foreign debt, on thebasis of the Aranha Plan of 1934,thus putting an end to the de-fault which had persisted since1937. At the end of 1940 thepercentage of the $6,000 millionoutstanding foreign dollar bonds
20
1939 1940'
I9W 19*1__ _| W ^r .
Note: In each case the most representative government bond quoted in default had HSen tO 41.9 fromin Switzerland has been taken and weekly averages of the market quota- OQ K g t t h f e n d Oftlon given as a percentage of the original issue price. OO.a I l e
— 110 —
. War conditions, with exchange restrictions made more watertight, foreignassets immobilised in the United States and elsewhere and foreign trade undercontrol, put almost insuperable obstacles in the way of private financingoutside the limits of each individual country. Such international credits asare granted are therefore practically all derived from government funds orfrom official agencies and, as must be the case in such circumstances, aregiven mainly for political purposes, whether to assist in the war effort directlyor to develop trade in desirable directions. The volume of foreign indebtedness,which in 1930 had risen to considerable proportions, was greatly reduced inthe years prior to the outbreak of war, through repayments, currency depreci-ations, repatriations etc. The present increase in international indebted-ness (largely inter-governmental in character) coincides with other greatchanges in the world's capital structure (mobilisation and realisation of foreigninvestments, etc.). What the net result of these changes will be cannot yetbe foreseen, but difficult problems are undoubtedly being created which willreveal themselves in all their stringency when the war is over. In the imme-diate post-war period, when the need of foreign raw materials and foodstuffswill be intense in many areas, a rapid resumption of private internationalfinancing, now at a standstill, may well prove impossible and the task ofproviding the necessary resources may still fall upon public agencies. Somegovernments are clearly making great efforts to maintain their credit standingby payments of service on their foreign debts. Movements of goods withoutthe aid of credit will necessarily be limited and unsatisfactory and, for thatreason alone, the. problem of arranging adequate international financing willhave to be tackled with promptitude in order to prevent avoidable calamitiesonce the war is over.
— 111 —
V. GOVERNMENT FINANCE, MONEY AND CAPITAL MARKETS AND THESTOCK EXCHANGES.
1. GOVERNMENT FINANCE, MONEY AND CAPITAL MARKETS.
Government financing dominated the money and capital markets through-out the world in 1940, not only in the belligerent countries but in neutralstates and occupied territories also. Only in rare instances were other factorsimportant, as for example the financing of clearing claims in Denmark andSlovakia and the repatriation of dollar balances to Switzerland. Budget deficitscaused by the war were financed in the first months by both Germany andEngland almost wholly at short term, but more recently large long andmiddle-term loans have been placed, so that in both cases government borrow-ing in the six months to March 1941 was about half at long and half atshort term. In Italy considerable conversion and consolidation issues havebeen made to reduce the floating debt, swollen through the budget deficitsof recent years. In most other European countries budget deficits due toarmament expenditure, occupation costs or efforts at reconstruction have beenfinanced largely at short term, in some cases through a considerable expansionof bank (including central bank) credit. Overseas, a vast programme of arma-ment expenditure has been approved in the United States and actual expendi-ture grows monthly at an accelerating pace: in Japan the financing of thewar with China has provoked increasing budget deficits and continuousgovernment bond issues for nearly four years.
The war has not put a stop to the era of cheap money except in temporaryand isolated cases. Long-term rates of interest have fallen over the year inthe United States and in Germany, England and some other European countries,including territories occupied by Germany after the campaign in the spring andsummer of 1940. In Sweden the official discount rate was raised by % percent, in May 1940, this being the only increase of bank rate in the worldduring the year (if the readjustment of bank rate in the Protectorate of Bohemiaand Moravia to the German level be omitted); eight out of twenty-one Europeanbank rates were lowered during 1940, the most important consideration ineach case being to enable the governments to borrow at lower cost.
In Germany the technique of war financing was perfected in peacetimeand, whereas other countries were forced to improvise new methods, at leastin the first months of the war, the change in Germany was rather one ofdegree and the transition a smooth one. The total, revenue of the Reichfrom taxation and borrowing rose considerably on the outbreak of war andat the end of 1940 was more than double that of the last quarter of 1938.The financial year runs from April to March and the following table givesquarterly figures for the past three years.
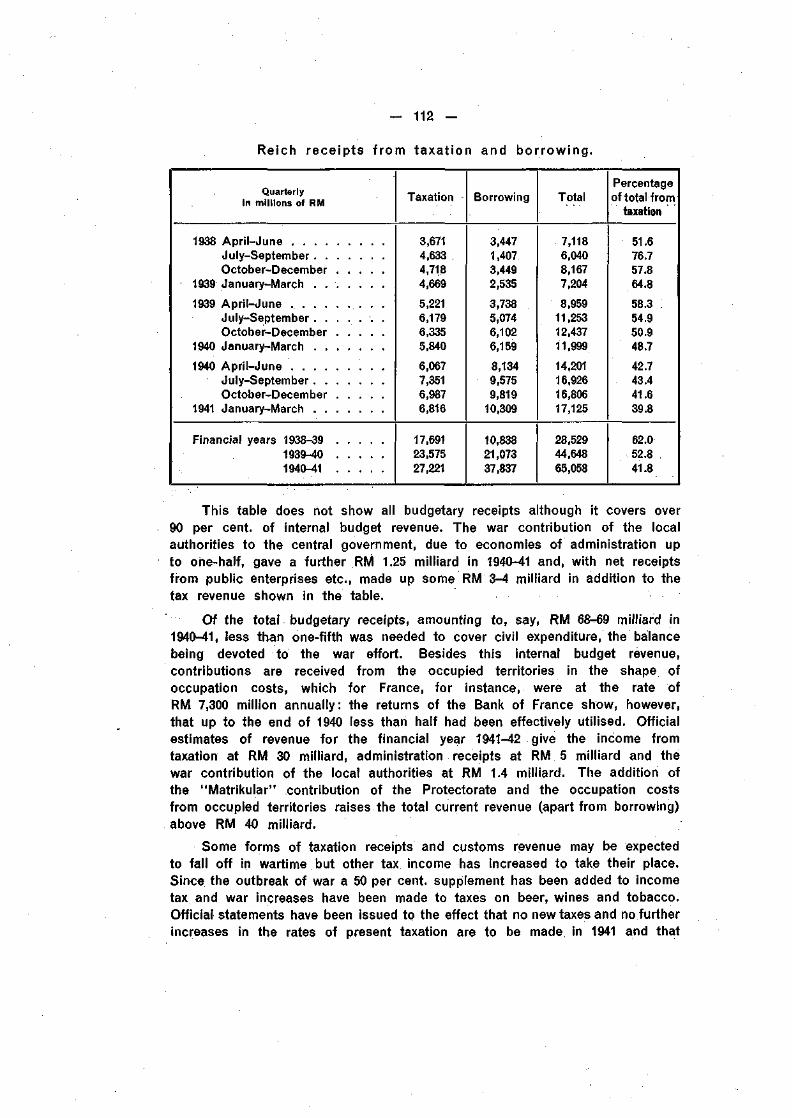
- 112 -
Reich receipts from taxation and borrowing.
Quarterlyin millions of RM
1938 Apr i l -JuneJuly-September .October-December
1939 January-March .
1939 Apr i l -JuneJuly-September .October-December
1940 January-March
1940 Apr i l - JuneJuly-September . . . . . . .October-December . . . . .
1941 January-March
Financial years 1938-391939-401940-41
Taxation
3,6714,6334,7184,669
5,2216,1796,3355,840
6,0677,3516,9876,816
17,69123,57527,221
Borrowing
3,4471,4073,4492,535
3,7385,0746,1026,159
8,1349,5759,819
10,309
10,83821,07337,837
Total
7,1186,0408,1677,204
8,95911,25312,43711,999
14,20116,92616,80617,125
28,52944,64865,058
Percentageof total from
taxation
51.676.757.864.8
58.354.950.948.7
42.743.441.639.8
62.052.841.8
This table does not show all budgetary receipts although it covers over90 per cent, of internal budget revenue. The war contribution of the localauthorities to the central government, due to economies of administration upto one-half, gave a further RM 1.25 milliard in 1940-41 and, with net receiptsfrom public enterprises etc., made up some RM 3-4 milliard in addition to thetax revenue shown in the table.
Of the total budgetary receipts, amounting to, say, RM 68-69 milliard in1940-41, less than one-fifth was needed to cover civil expenditure, the balancebeing devoted to the war effort. Besides this internal budget revenue,contributions are received from the occupied territories in the shape ofoccupation costs, which for France, for instance, were at the rate ofRM 7,300 million annually: the returns of the Bank of France show, however,that up to the end of 1940 less than half had been effectively utilised. Officialestimates of revenue for the financial year 1941-42 give the income fromtaxation at RM 30 milliard, administration receipts at RM 5 milliard and thewar contribution of the local authorities at RM 1.4 milliard. The addition ofthe "Matrikular" contribution of the Protectorate and the occupation costsfrom occupied territories raises the total current revenue (apart from borrowing)above RM 40 milliard.
Some forms of taxation receipts and customs revenue may be expectedto fall off in wartime but other tax income has increased to take their place.Since the outbreak of war a 50 per cent, supplement has been added to incometax and war increases have been made to taxes on beer, wines and tobacco.Official statements have been issued to the effect that no new taxes and no furtherincreases in the rates of present taxation are to be made in 1941 and that
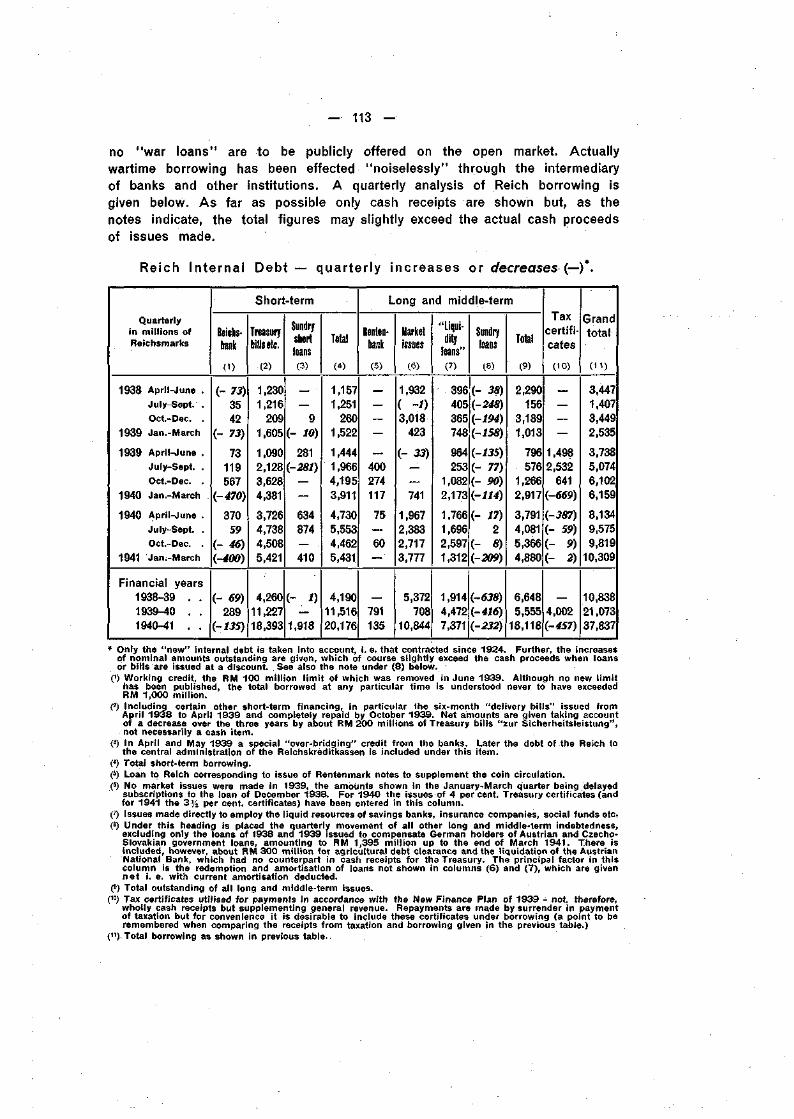
— 113 —•
no "war loans" are to be publicly offered on the open market. Actuallywartime borrowing has been effected "noiselessly" through the intermediaryof banks and other institutions. A quarterly analysis of Reich borrowing isgiven below. As far as possible only cash receipts are shown but, as thenotes indicate, the total figures may slightly exceed the actual cash proceedsof issues made.
Reich Internal Debt — quarter ly increases or decreases-(—)*.
Quarterlyin mil l ions ofReichsmarks
1938 April-June .
July-Sept. .
Oct.-Dec. .
1939 Jan.-March
1939 April-June .
July-Sept. .
Oct.-Dec. .
1940 Jan.-March
1940 April-June .
July-Sept. .
Oct.-Dec. .
1941 Jan.-March
Financial years
1938-39 . .
1939-40 . .
1940-41 . .
Short-term
Reichs-bank
0)
(-73)35
42
(- 73)
73
119
567
(-470)
370
59
(- 46)(-400)
(- 69)289
(-135)
Treasurybills etc.
(2)
1,230
1,216
209
1,605
1,090
2,128
3,628
4,381
3,726
4,738
4,508
5,421
4,260
11,227
18,393
SundryftliAnfshortloans(3)
—
9
(- 10)
281
(-281)—
—
634
874—
410
/ i\
_
1,918
TAIAIlotai
W
1,157
1,251
260
1,522
1,444
1,966
4,195
3,911
4,730
5,553
4,462
5,431
4,190
11,516
20,176
Long and middle-term
Renten-bank
(5)
—
—
—
—
400
274
117
75—
60
—
—
791
135
Marketissues
(6)
1,932
( -1)3,018
423
(- 33)——
741
1,967
2,383
2,717
3,777
5,372
708
10,844
"Liflui-nitiioiiy
loans"0)
396
405
365
748
964
253
1,082
2,173
1,766
1,696
2,597
1,312
1,914
4,472
7,371
Sundryloans
(8)
(- 38)(-248)
(-194)
(-158)
(-135)
(- 77)(- 90)
(-114)
(- 17)2
(- 8)
(-209)
(-638)
(-416)
(-232)
TA4AITotal
(9)
2,290
156
3,189
1,013
796
576
1,266
2,917
3,791
4,081
5,366
4,880
6,648
5,555
18,118
Taxcertifi-cates
(10)
—
—
—
1,498
2,532
641
(-669)
(-387)
(- 59)
(- 9)
(- 2)
—
4,002
(-457)
Grandtotal
(t i )
3,447
1,407
3,449
2,535
3,738
5,074
6,102
6,159
8,134
9,575
9,819
10,309
10,838
21,073
37,837
* Only the " n e w " internal debt is taken into account, i. e. that contracted since 1924. Further, the increasesof nominal amounts outstanding are given, which of course sl ightly exceed the cash proceeds when loansor bil ls are issued at a discount. See also the note under (8) below.
(') Working credit, the RM 1OO mil l ion l imi t of which was removed in June 1933. Although no new l imi thas been published, the total borrowed at any particular t ime is understood never to have exceededRM 1,000 mi l l ion.
(?) Incjuding certain other short-term f inancing, in particular the six-month "delivery b i l l s " issued fromApri l 1938 to Apri l 1939 and completely repaid by October 1939. Net amounts are given taking accountof a decrease over the three years by about RM 200 mil l ions of Treasury bil ls "zur Sicherheitsleistung",not necessarily a cash i tem.
(3) In Apri l and May 1939 a special "over-br idging" credit f rom the banks. Later the debt of the Reich tothe central administration of the Reichskreditkassen is included under this i tem.
(4) Total short-term borrowing.(5) Loan to Reich corresponding to issue of Rentenmark notes to supplement the coin circulat ion.(6) No market issues were made in 1939, the amounts shown in the January-March quarter being delayed
subscriptions to the loan of December 1938. For 1940 the issues of 4 percent. Treasury certificates (andfor 1941 the 3 % per cent, certificates) have been entered in this column.
(?) Issues made directly to employ the l iquid resources of savings banks, insurance companies, social funds etc.(«) Under this heading is placed the quarterly movement of all other long and middle-term indebtedness,
excluding only the loans of 1938 and 1939 issued to compensate German holders of Austrian and Czecho-Slovakian government loans, amounting to RM 1,395 mi l l ion up to the end of March 1941. There isincluded, however, about RM 300 mi l l ion for agricultural debt clearance and the l iquidation of the AustrianNational Bank, which had no counterpart in cash receipts for the Treasury. The principal factor in thiscolumn is the redemption and amortisation of loans not shown in columns (6) and (7), which are givenn e t i. e. with current amortisation deducted.
(9) Total outstanding of all long and middle-term issues.(") Tax certificates util ised for payments in accordance with the New Finance Plan of 1939 - not. therefore,
wholly cash receipts but supplementing general revenue. Repayments are made by surrender in paymentof taxation but for convenience it is desirable to include these certificates under borrowing (a point to beremembered when comparing the receipts f rom taxation and borrowing given in the previous table.)
(") Total borrowing as shown in previous table.
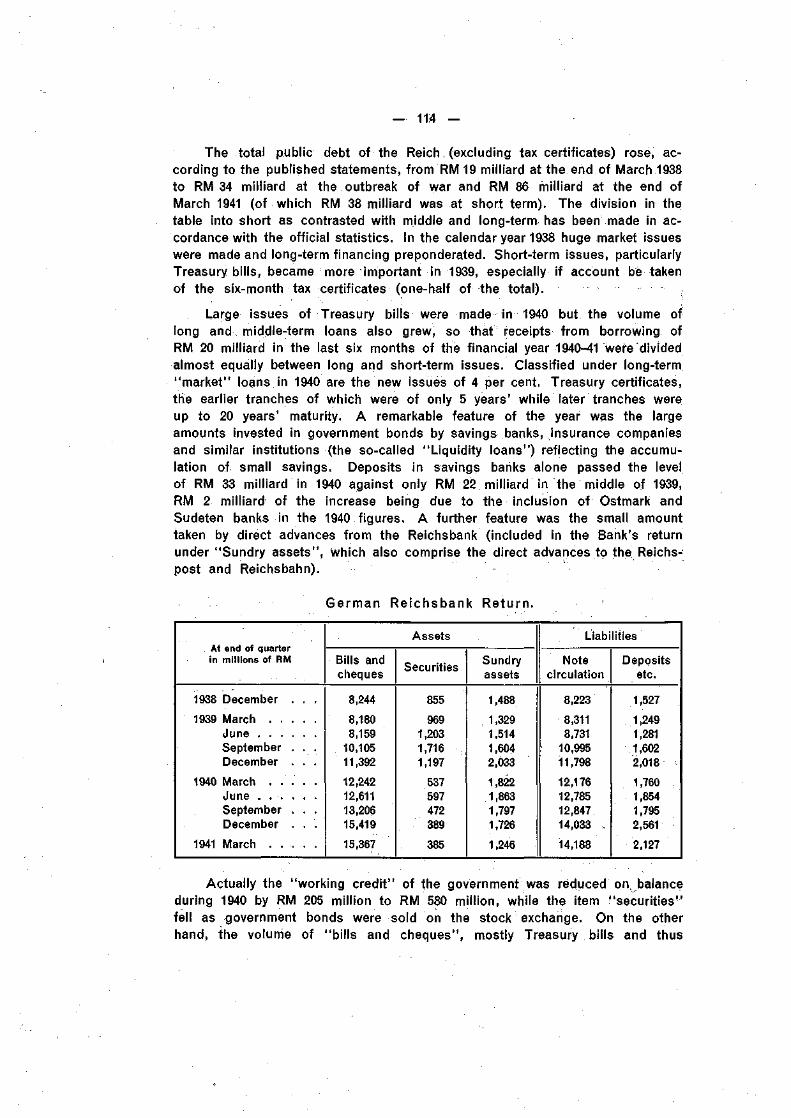
— 1.14 —
The total public debt of the Reich (excluding tax certificates) rose, ac-cording to the published statements, from RM 19 milliard at the end of March 1938to RM 34 milliard at the outbreak of war and RM 86 milliard at the end ofMarch 1941 (of which RM 38 milliard was at short term). The division in thetable into short as contrasted with middle and long-term has been made in ac-cordance with the official statistics. In the calendar year 1938 huge market issueswere made and long-term financing preponderated. Short-term issues, particularlyTreasury bills, became more important in 1939, especially if account be takenof the six-month tax certificates (one-half of the total).
Large issues of Treasury bills were made in 1940 but the volume oflong and middle-term loans also grew, so that receipts from borrowing ofRM 20 milliard in the last six months of the financial year 1940-41 were dividedalmost equally between long and short-term issues. Classified under long-term"market" loans in 1940 are the new issues of 4 per cent. Treasury certificates,the earlier tranches of which were of only 5 years' while later tranches wereup to 20 years' maturity. A remarkable feature of the year was the largeamounts invested in government bonds by savings banks, insurance companiesand similar institutions (the so-called "Liquidity loans") reflecting the accumu-lation of small savings. Deposits in savings banks alone passed the levelof RM 33 milliard in 1940 against only RM 22 milliard in the middle of 1939,RM 2 milliard of the increase being due to the inclusion of Ostmark andSudeten banks in the 1940 figures. A further feature was the small amounttaken by direct advances from the Reichsbank (included in the Bank's returnunder "Sundry assets", which also comprise the direct advances to the Reichs-post and Reichsbahn).
German Reichsbank Return.
At end of quarterin millions of RM
1938 December . . .
1939 March . . . . .JuneSeptember . . .December . . .
1940 March . . . . .June . . . . . .September . . .December . . .
1941 March
Assets
Bills andcheques
8,244
8,1808,159
10,10511,392
12,24212,61113,20615,419
15,367
Securities
855
9691,2031,7161,197
537597472389
385
Sundryassets
1,488
1,3291,5141,6042,033
1,8221,8631,7971,726
1,246
Liabilities
Notecirculation
8,223
8,3118,731
10,99511,798
12,17612,78512,84714,033
14,188
Depositsetc.
1,527
1,2491,2811,6022,018
1,760 ;
1,8541,7952,561
2,127
Actually the "working credit" of the government was reduced on balanceduring 1940 by RM 205 million to RM 580 million, while the item "securities"fell as government bonds were sold on the stock exchange. On the otherhand, the volume of "bills and cheques", mostly Treasury bills and thus
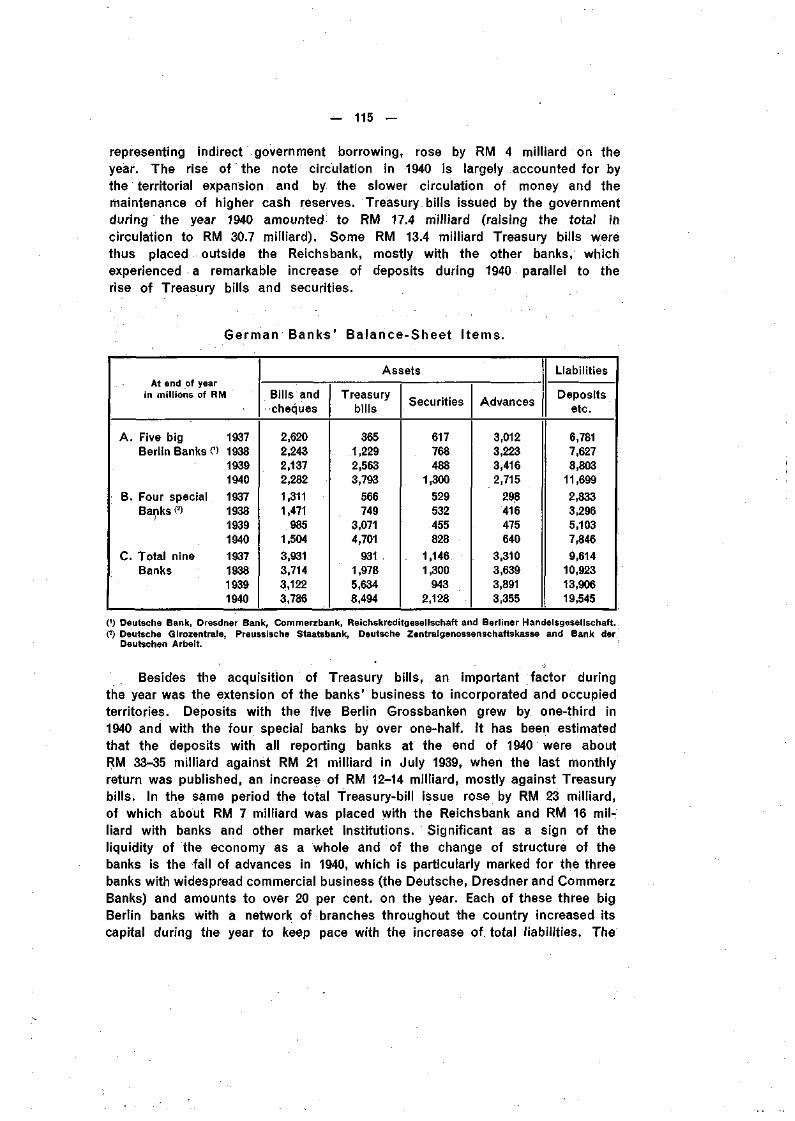
— 115 —
representing indirect government borrowing, rose by RM 4 milliard on theyear. The rise of the note circulation in 1940 is largely accounted for bythe territorial expansion and by the slower circulation of money and thèmaintenance of higher cash reserves. Treasury bills issued by the governmentduring the year 1940 amounted to RM 17.4 milliard (raising the total incirculation to RM 30.7 milliard). Some RM 13.4 milliard Treasury bills werethus placed outside the Reichsbank, mostly with the other banks, whichexperienced a remarkable increase of deposits during 1940 parallel to therise of Treasury bills and securities.
German Banks' Balance-Sheet I tems.
At end of yearin millions of RM
A. Five big 1937Berlin Banks 0) 1938
19391940
B. Four special 1937Banks« 1938
19391940
C. Total nine 1937Banks 1938
19391940
Assets
Bills andcheques
2,6202,2432,1372,2821,3111,471
9851,5043,9313,7143,1223,786
Treasurybills
3651,2292,5633,793
566749
3,0714,701
9311,9785,6348,494
Securities
617768488
1,300529532455828
1,1461,300
9432,128
Advances
3,0123,2233,4162,715
298416475640
3,3103,6393,8913,355
Liabilities
Depositsetc.
6,7817,6278,803
11,6992,8333,2965,1037,8469,614
10,92313,90619,545
(') Deutsche Bank, Dresdner Bank, Commerzbank, Reichskreditgesellschaft and Berliner Handelsgesellschaft.(2) Deutsche Girozentrale, Preussische Staatsbank, Deutsche Zentralgenossenschaftskasse and Bank der
Deutschen Arbeit. '
Besides the acquisition of Treasury bills, an important factor duringthe year was the extension of the banks' business to incorporated and occupiedterritories. Deposits with the five Berlin Grossbanken grew by one-third in1940 and with the four special banks by over one-half. It has been estimatedthat the deposits with all reporting banks at the end of 1940 were aboutRM 33-35 milliard against RM 21 milliard in July 1939, when the last monthlyreturn was published, an increase of RM 12-14 milliard, mostly against Treasurybills. In the same period the total Treasury-bill issue rose by RM 23 milliard,of which about RM 7 milliard was placed with the Reichsbank and RM 16 mil-liard with banks and other market institutions. Significant as a sign of theliquidity of the economy as a whole and of the change of structure of thebanks is the fall of advances in 1940, which is particularly marked for the threebanks with widespread commercial business (the Deutsche, Dresdner and CommerzBanks) and amounts to over 20 per cent, on the year. Each of these three bigBerlin banks with à network of branches throughout the country increased itscapital during the year to keep pace with the increase of. total liabilities. The
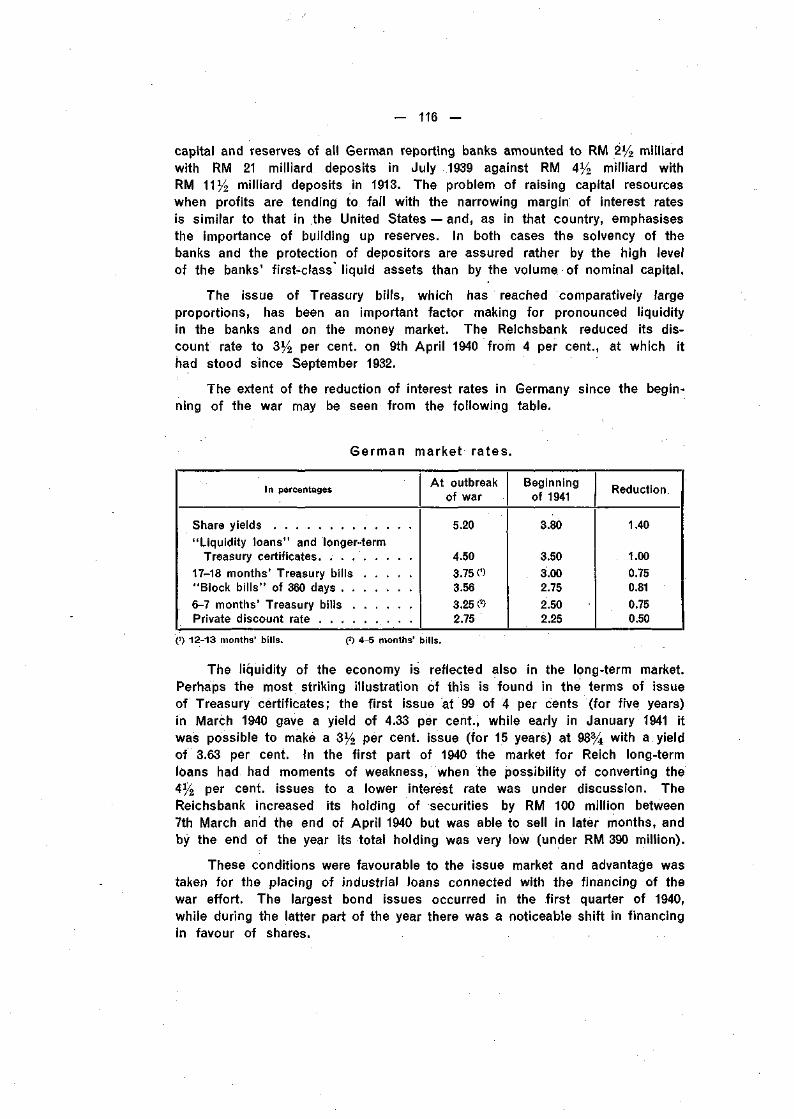
— 116 —
capital and reserves of all German reporting banks amounted to RM 2% milliardwith RM 21 milliard deposits in July 1939 against RM 4% milliard withRM 11% milliard deposits in 1913. The problem of raising capital resourceswhen profits are tending to fall with the narrowing margin of interest ratesis similar to that in thè United States — and, as in that country, emphasisesthe importance of building up reserves. In both cases the solvency of thebanks and the protection of depositors are assured rather by the high levelof the banks' first-class liquid assets than by the volume of nominal capital.
The issue of Treasury bills, which has reached comparatively largeproportions, has been an important factor making for pronounced liquidityin the banks and on the money market. The Reichsbank reduced its dis-count rate to 3% per cent, on 9th April 1940 from 4 per cent., at which ithad stood since September 1932.
The extent of the reduction of interest rates in Germany since the begin-ning of the war may be seen from the following table.
German market rates.
In percentages
Share yields"Liquidity loans" and longer-term
Treasury certificates. . . . . . . . .17-18 months' Treasury bills"Block bil ls" of 360 days6-7 months' Treasury billsPrivate discount rate
At outbreakof war
5.20
4.503.75 O3.563.25 (2)2.75
Beginningof 1941
3.80
3.503.002.752.502.25
Reduction
1.40
1.000.750.810.750.50
0) 12-13 months' bills. (2) 4-5 months' bills.
The liquidity of the economy is reflected also in the long-term market.Perhaps the most striking illustration of this is found in the terms of issueof Treasury certificates; the first issue at 99 of 4 per cents (for five years)in March 1940 gave a yield of 4.33 per cent., while early in January 1941 itwas possible to make a 3% per cent, issue (for 15 years) at 98% with a yieldof 3.63 per cent. In the first part of 1940 the market for Reich long-termloans had. had moments of weakness, when the possibility of converting the4% per cent, issues to a lower interest rate was under discussion. TheReichsbank increased its holding of securities by RM 100 million between7th March and the end of April 1940 but was able to sell in later months, andby the end of the year its total holding was very low (under RM 390 million).
These conditions were favourable to the issue market and advantage wastaken for the placing of industrial loans connected with the financing of thewar effort. The largest bond issues occurred in the first quarter of 1940,while during the latter part of the year there was a noticeable shift in financingin favour of shares.
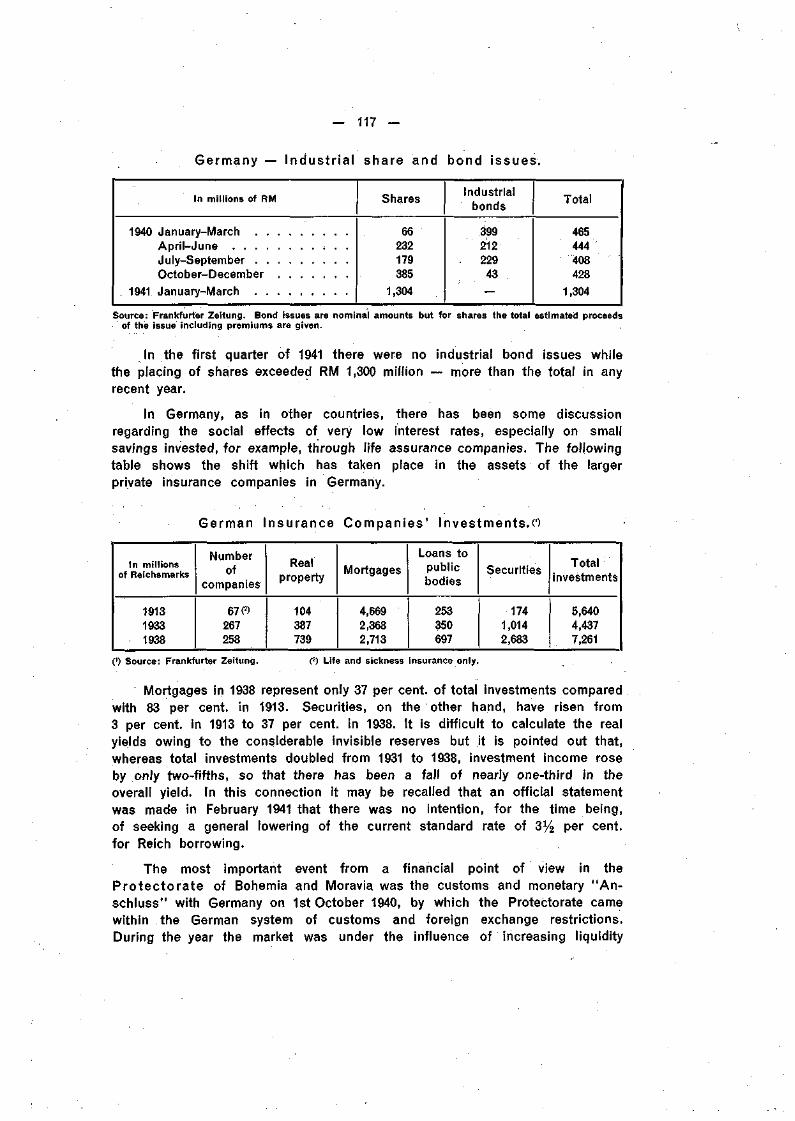
- 117 -
Germany — Industrial share and bond issues.
In millions of RM
1940 January-March . . . . . . . . .Apr i l -JuneJuly-SeptemberOctober-December
1941 January-March
Shares
66232179385
1,304
Industrialbonds
399212
- 22943
Total
465444408428
1,304
Source: Frankfurter Zeitung. Bond issues are nominal amounts but for shares the total estimated proceedsof the issue including premiums ara given.
In the first quarter of 1941 there were no industrial bond issues whilethe placing of shares exceeded RM 1,300 million — more than the total in anyrecent year.
In Germany, as in other countries, there has been some discussionregarding the social effects of very low interest rates, especially on smallsavings invested, for example, through life assurance companies. The followingtable shows the shift which has taken place in the assets of the largerprivate insurance companies in Germany.
German Insurance Companies ' Investments .«
In millionsof Reichsmarks
191319331938
Numberof
companies
67 &267258
Realproperty
104387739
Mortgages
4,6692,3682,713
Loans topublicbodies
253350697
Securities
1741,0142,683
Totalinvestments
5,6404,4377,261
(') Source: Frankfurter Zeitung. (2) Life and sickness insurance only.
Mortgages in 1938 represent only 37 per cent, of total investments comparedwith 83 per cent, in 1913. Securities, on the other hand, have risen from3 per cent, in 1913 to 37 per cent, in 1938. It is difficult to calculate the realyields owing to the considerable invisible reserves but it is pointed out that,whereas total investments doubled from 1931 to 1938, investment income roseby only two-fifths, so that there has been a fall of nearly one-third in theoverall yield. In this connection it may be recalled that an official statementwas made in February 1941 that there was no intention, for the time being,of seeking a general lowering of the current standard rate of 3% per cent,for Reich borrowing.
The most important event from a financial point of view in theProtectorate of Bohemia and Moravia was the customs and monetary "An-schluss" with Germany on 1st October 1940, by which the Protectorate camewithin the German system of customs and foreign exchange restrictions.During the year the market was under the influence of increasing liquidity
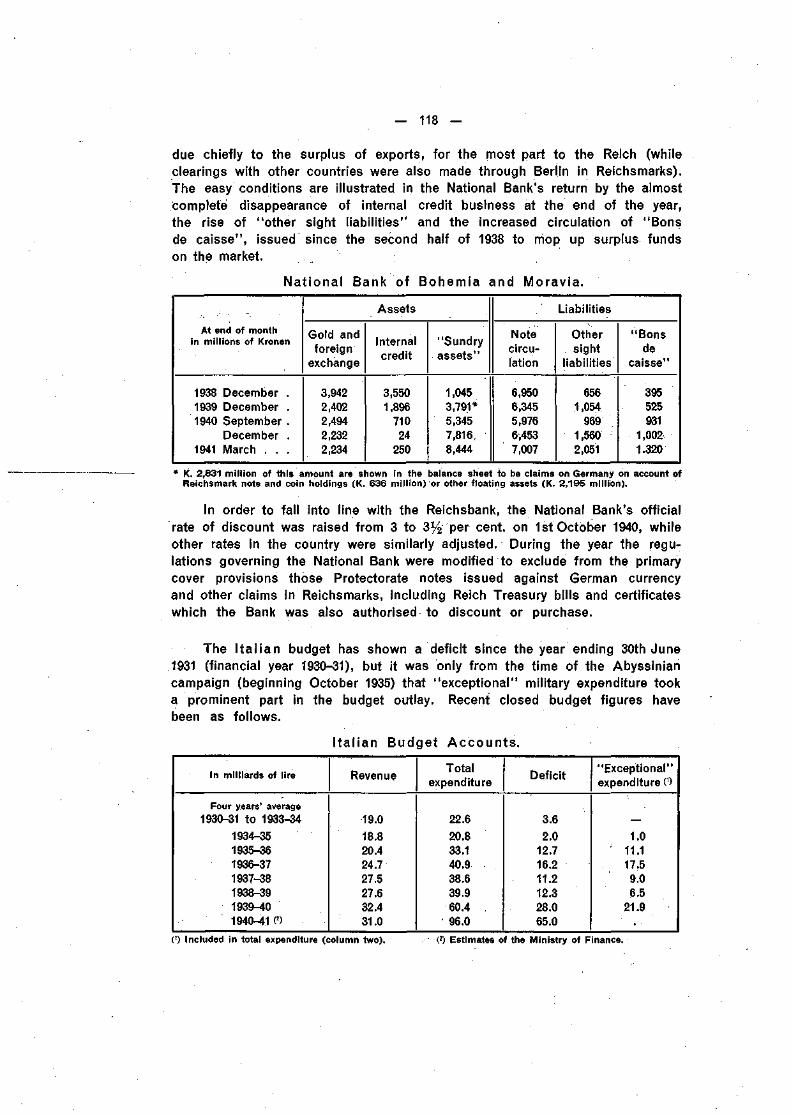
- 118 -
due chiefly to the surplus of exports, for the most part to the Reich (whileclearings with other countries were also made through Berlin in Reichsmarks).The easy conditions are illustrated in the National Bank's return by the almostcomplete disappearance of internal credit business at the end of the year,the rise of "other sight liabilities" and the increased circulation of "Bonsde caisse", issued since the second half of 1938 to mop up surplus fundson the market.
Nat ional Bank of Bohemia and Moravia.
At end of monthin millions of Kronen
1938 December .1939 December .1940 September .
December .1941 March . . .
Assets
Gold andforeign
exchange
3,9422,4022,4942,2322,234
Internalcredit
3,5501,896
71024
250
"Sundryassets"
1,0453,791*5,3457,816,8,444
Liabilities
Notecircu-lation
6,9506,3455,9766,4537,007
Othersight
liabilities
6561,054
9691,5602,051
"Bonsde
caisse"
395525931
1,0021.320
* K. 2,831 million of this amount are shown in the balance sheet to be claims on Germany on account ofReichsmark note and coin holdings (K. 636 million) or other floating assets (K. 2,195 million).
In order to fall into line with the Reichsbank, the National Bank's officialrate of discount was raised from 3 to 3% per cent, on 1st October 1940, whileother rates in the country were similarly adjusted. During the year the regu-lations governing the National Bank were modified to exclude from the primarycover provisions those Protectorate notes issued against German currencyand other claims in Reichsmarks, including Reich Treasury bills and certificateswhich the Bank was also authorised to discount or purchase.
The I ta l ian budget has shown a deficit since the year ending 30th June1931 (financial year 1930-31), but it was only from the time of the Abyssiniancampaign (beginning October 1935) that "exceptional" military expenditure tooka prominent part in the budget outlay. Recent closed budget figures havebeen as follows.
I tal ian Budget Accoun ts .
In milliards of lire
Four years' average1930-31 to 1933-34
1934-351935-361936-371937-381938-391939-401940-41 O
Revenue
19.018.820.424.727.527.632.431.0
Totalexpenditure
22.620.833.140.938.639.960.496.0
Deficit
3.62.0
12.716.211.212.328.065.0
"Exceptional"expenditure 0)
—1.0
' 11.117.59.06.5
21.9
(') Included in total expenditure (column two). O Estimates of the Ministry of Finance.
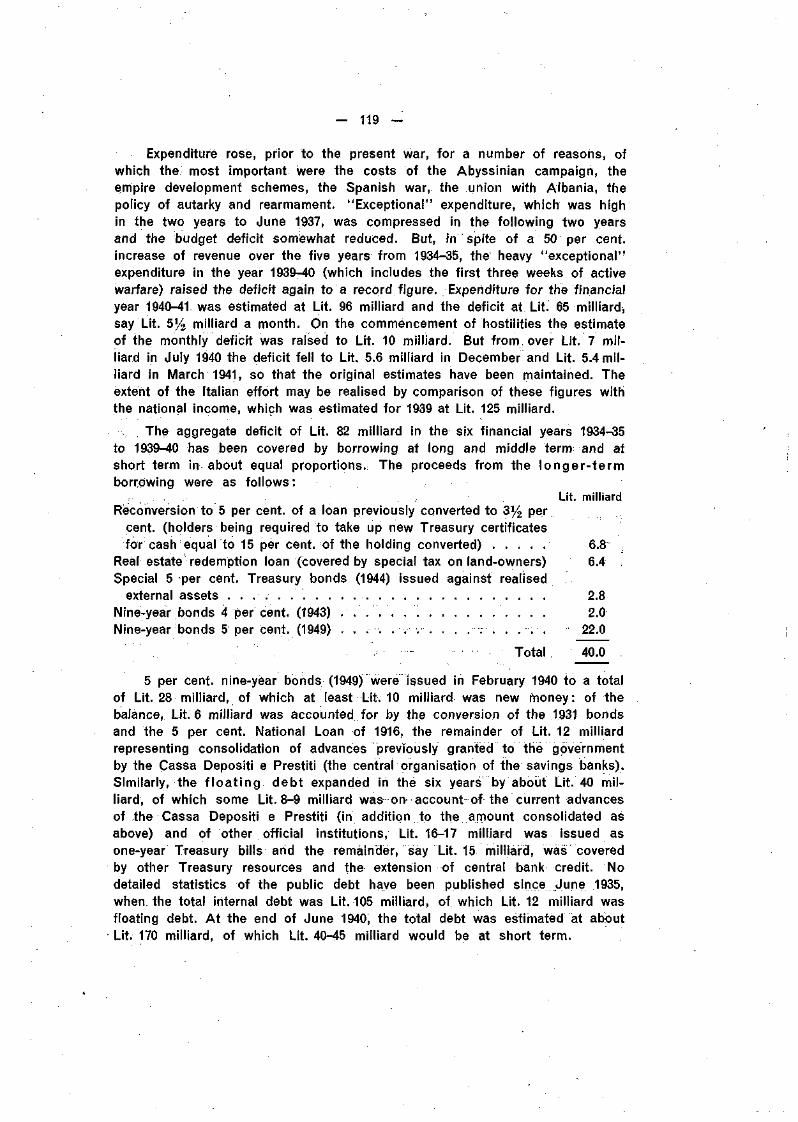
— 119 —
Expenditure rose, prior to the present war, for a number of reasons, ofwhich the most important were the costs of the Abyssinian campaign, theempire development schemes, the Spanish war, the union with Albania, thepolicy of autarky and rearmament. "Exceptional" expenditure, which was highin the two years to June 1937, was compressed in the following two yearsand the budget deficit somewhat reduced. But, in spite of a 50 per cent,increase of revenue over the five years from 1934-35, the heavy "exceptional"expenditure in the year 1939-40 (which includes the first three weeks of activewarfare) raised the deficit again to a record figure. Expenditure for the financialyear 1940-41 was estimated at Lit. 96 milliard and the deficit at Lit. 65 milliard,say Lit. 5% milliard a month. On the commencement of hostilities the estimateof the monthly deficit was raised to Lit. 10 milliard. But from over Lit. 7 mil-liard in July 1940 the deficit fell to Lit. 5.6 milliard in December and Lit. 5.4 mil-liard in March 1941, so that the original estimates have been maintained. Theextent of the Italian effort may be realised by comparison of these figures withthe national income, which was estimated for 1939 at Lit. 125 milliard.
The aggregate deficit of Lit. 82 milliard in the six financial years 1934-35to 1939-40 has been covered by borrowing at long and middle term and atshort term in about equal proportions. The proceeds from the longer- termborrowing were as follows :
r .\ • -, • Lit. milliard
Reconversion to 5 per cent, of a loan previously converted to 3% percent, (holders being required to take up new Treasury certificatesfor cash equal to 15 per cent, of the holding converted) 6.8
Real estate redemption loan (covered by special tax on land-owners) 6.4 ]Special 5 per cent. Treasury bonds (1944) issued against realised
external assets 2.8Nine-year bonds 4 per cent. (1943) 2.0Nine-year bonds 5 per cent. (1949) . . . . .-.-•-.-. . . . . . . . . . 22.0
Total 40.0
5 per cent, nine-year bonds (1949) were issued in February 1940 to a totalof Lit. 28 milliard, of which at least Lit. 10 milliard was new money: of thebalance, Lit. 6 milliard was accounted for by the conversion of the 1931 bondsand the 5 per cent. National Loan of 1916, the remainder of Lit. 12 milliardrepresenting consolidation of advances previously granted to the governmentby the Cassa Depositi e Prestiti (the centrai organisation of the savings banks).Similarly, the f loa t ing debt expanded in the six years by about Lit. 40 mil-liard, of which some Lit. 8-9 milliard was orv account of the current advancesof the Cassa Depositi e Prestiti (in addition to the amount consolidated asabove) and of other official institutions, Lit. 16-17 milliard was issued asone-year Treasury bills and the remainder, say Lit. 15 milliard, was coveredby other Treasury resources and the extension of central bank credit. Nodetailed statistics of the public debt have been published since June 1935,when the total internal debt was Lit. 105 milliard, of which Lit. 12 milliard wasfloating debt. At the end of June 1940, the total debt was estimated at aboutLit. 170 milliard, of which Lit. 40-45 milliard would be at short term.
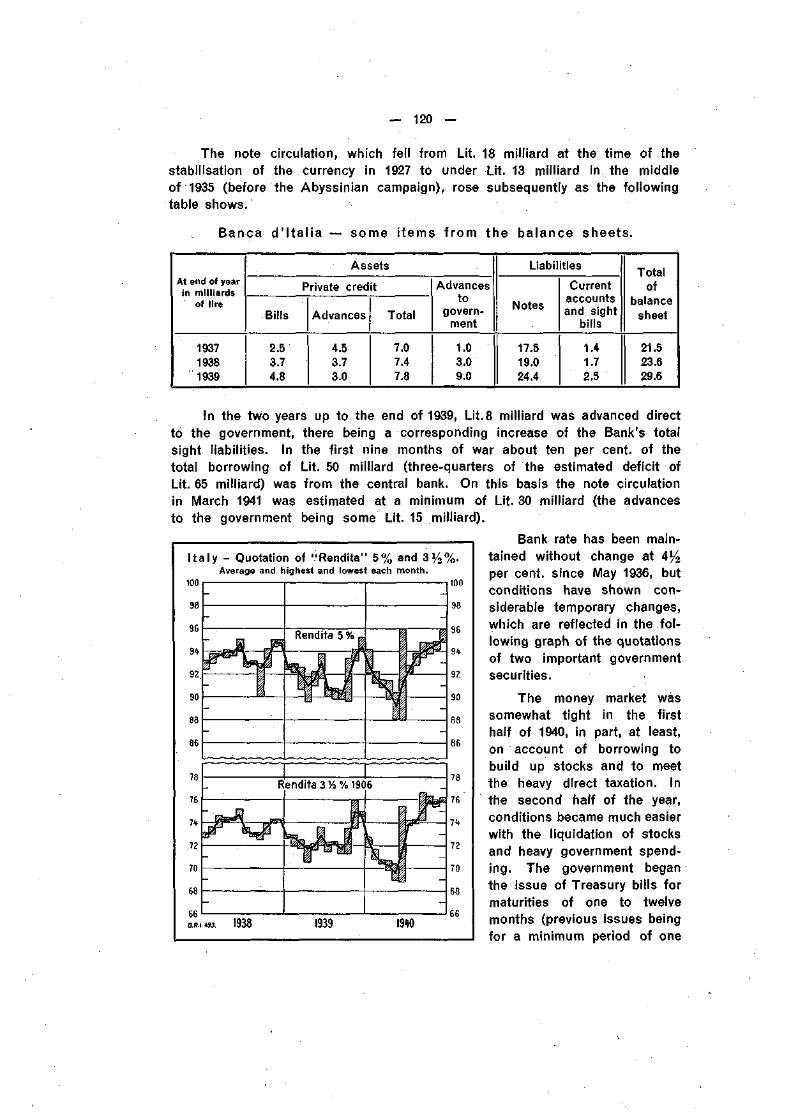
— 120 —•
The note circulation, which fell from Lit. 18 milliard at the time of thestabilisation of the currency in 1927 to under Lit. 13 milliard in the middleof 1935 (before the Abyssinian campaign), rose subsequently as the followingtable shows.
Banca d ' I ta l ia — some items f rom the balance sheets.
At end of yearin milliards
of lire
193719381939
Assets
Private credit
Bills
2.53.74.8
Advances
4.53.73.0
Total
7.07.47.8
Advancesto
govern-ment
1.03.09.0
Liabilities
Notes
17.519.024.4
Currentaccountsand sight
bills
1.41.72.5
Totalof
balancesheet
21.523.629.6
In the two years up to the end of 1939, Lit.8 milliard was advanced directto the government, there being a corresponding increase of the Bank's totalsight liabilities. In the first nine months of war about ten per cent, of thetotal borrowing of Lit. 50 milliard (three-quarters of the estimated deficit ofLit. 65 milliard) was from the central bank. On this basis the note circulationin March 1941 was estimated at a minimum of Lit. 30 milliard (the advancesto the government being some Lit. 15 milliard).
Bank rate has been main-tained without change at 4%per cent, since May 1936, butconditions have shown con-siderable temporary changes,which are reflected in the fol-lowing graph of the quotationsof two important governmentsecurities.
Italy - Quotation of "Rendita" 5% and 3%%.Average and highest and lowest each month.
100 | 1 1 1100
8G 86
1939 1940
The money market wassomewhat tight in the firsthalf of 1940, in part, at least,on account of borrowing tobuild up stocks and to meetthe heavy direct taxation. Inthe second half of the year,conditions became much easierwith the liquidation of stocksand heavy government spend-ing. The government beganthe issue of Treasury bills formaturities of one to twelvemonths (previous issues beingfor a minimum period of one
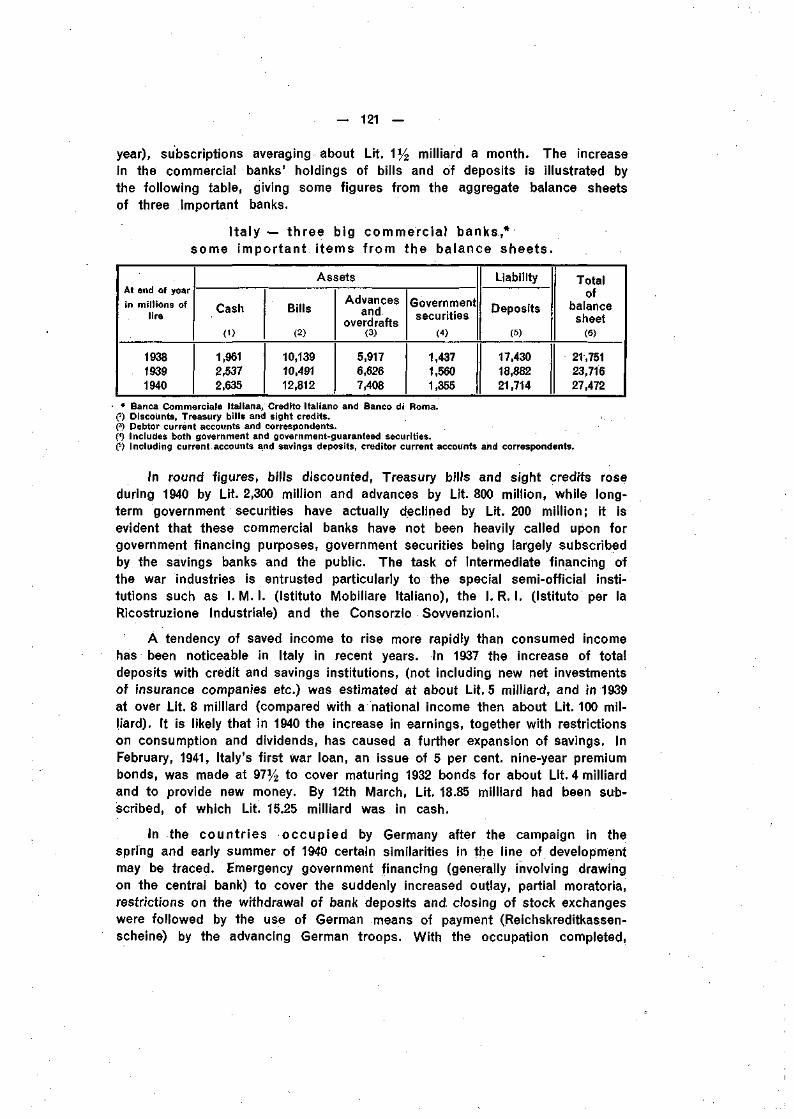
— 121 —
year), subscriptions averaging about Lit. 1% milliard a month. The increasein the commercial banks' holdings of bills and of deposits is illustrated bythe following table, giving some figures from the aggregate balance sheetsof three important banks.
I t a l y — three big commerc ia l banks,*some important i tems f rom the balance sheets .
At end of year
in millions oflire
193819391940
Assets
Cash
(1)
1,9612,5372,635
Bills
(2)
10,13910,49112,812
Advancesand
overdrafts(3)
5,9176,6267,408
Governmentsecurities
(4)
1,4371,5601,355
Liability
Deposits
(5)
17,43018,88221,714
Totalof
balancesheet
(6)
21,751
23,716
27,472
- * Banca Commerciale Italiana, Credito Italiano and Banco di Roma.(:) Discounts, Treasury bills and sight credits.P) Debtor current accounts and correspondents.C) Includes both government and government-guaranteed securities.(5) Including current accounts and savings deposits, creditor current accounts and correspondents.
In round figures, bills discounted, Treasury bills and sight credits roseduring 1940 by Lit. 2,300 million and advances by Lit. 800 million, while long-term government securities have actually declined by Lit. 200 million; it isevident that these commercial banks have not been heavily called upon forgovernment financing purposes, government securities being largely subscribedby the savings banks and the public. The task of intermediate financing ofthe war industries is entrusted particularly to the special semi-official insti-tutions such as I .M.I . (Istituto Mobiliare Italiano), the I .R. I . (Istituto per laRicostruzione Industriale) and the Consorzio Sovvenzioni.
À tendency of saved income to rise more rapidly than consumed incomehas been noticeable in Italy in recent years. In 1937 the increase of totaldeposits with credit and savings institutions, (not including new net investmentsof insurance companies etc.) was estimated at about Lit. 5 milliard, and in 1939at over Lit. 8 milliard (compared with a national income then about Lit. 100 mil-liard). It is likely that in 1940 the increase in earnings, together with restrictionson consumption and dividends, has caused a further expansion of savings. InFebruary, 1941, Italy's first war loan, an issue of 5 per cent, nine-year premiumbonds, was made at 97% to cover maturing 1932 bonds for about Lit. 4 milliardand to provide new money. By 12th March, Lit. 18.85 milliard had been sub-scribed, of which Lit. 15.25 milliard was in cash.
In the countr ies occup ied by Germany after the campaign in thespring and early summer of 1940 certain similarities in the line of developmentmay be traced. Emergency government financing (generally involving drawingon the central bank) to cover the suddenly increased outlay, partial moratoria,restrictions on the withdrawal of bank deposits and. closing of stock exchangeswere followed by the use of German means of payment (Reichskreditkassen-scheine) by the advancing German troops. With the occupation completed,
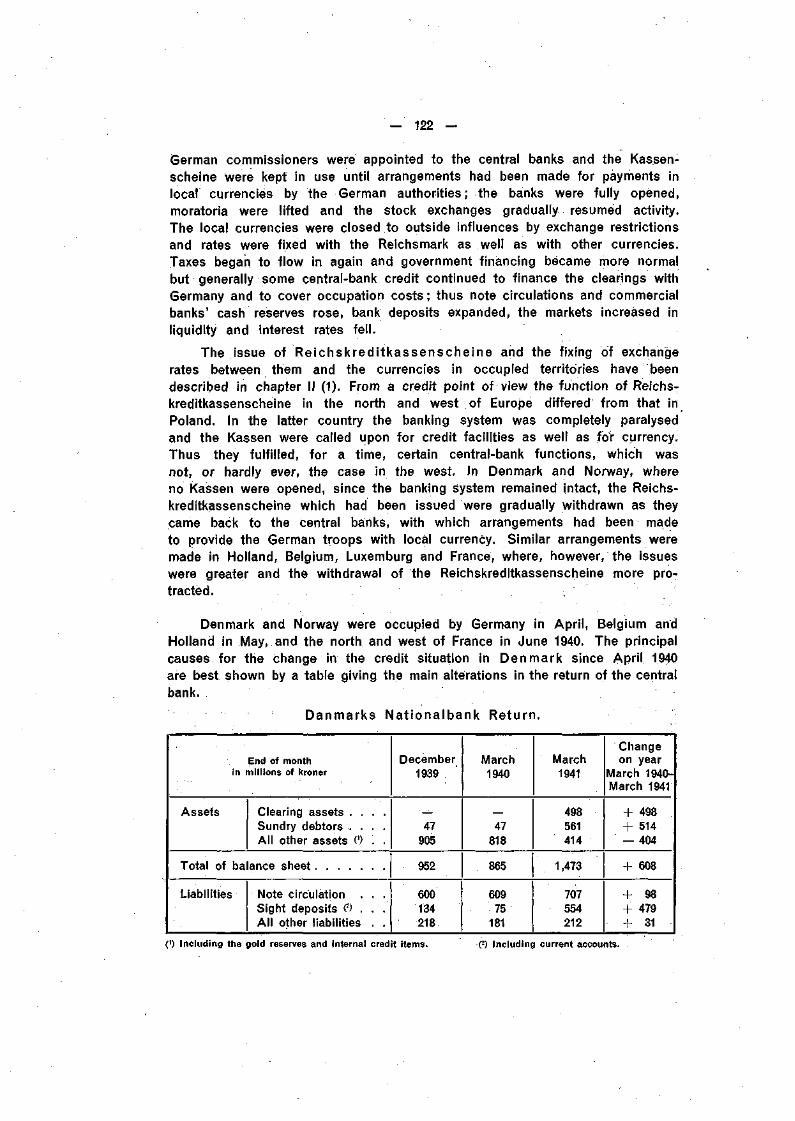
— 122 —
German commissioners were appointed to the central banks and the Kassen-scheine were kept in use until arrangements had been made for payments inlocal currencies by the German authorities; the banks were fully opened,moratoria were lifted and the stock exchanges gradually resumed activity.The local currencies were closed to outside influences by exchange restrictionsand rates were fixed with the Reichsmark as well as with other currencies.Taxes began to flow in again and government financing became more normalbut generally some central-bank credit continued to finance the clearings withGermany and to cover occupation costs ; thus note circulations and commercialbanks' cash reserves rose, bank deposits expanded, the markets increased inliquidity and interest rates fell.
The issue of Reichskredi tkassenscheine and the fixing of exchangerates between them and the currencies in occupied territories have beendescribed in chapter II (1). From a credit point of view the function of Reichs-kreditkassenscheine in the north and west of Europe differed from that inPoland. In the latter country the banking system was completely paralysedand the Kassen were called upon for credit facilities as well as for currency.Thus they fulfilled, for a time, certain central-bank functions, which wasnot, or hardly ever, the case in the west. In Denmark and Norway, whereno Kassen were opened, since the banking system remained intact, the Reichs-kreditkassenscheine which had been issued were gradually withdrawn as theycame back to the central banks, with which arrangements had been madeto provide the German troops with local currency. Similar arrangements weremade in Holland, Belgium, Luxemburg and France, where, however, the issueswere greater and the withdrawal of the Reichskreditkassenscheine more pro-tracted.
Denmark and Norway were occupied by Germany in April, Belgium andHolland in May, and the north and west of France in June 1940. The principalcauses for the change in the credit situation in Denmark since April 1940are best shown by a table giving the main alterations in the return of the centralbank.
Danmarks Nat ionalbank Return.
End of monthin millions of kroner
Assets Clearing assets . . . .Sundry debtorsAll other assets (') . .
Total of balance sheet
Liabilities Note circulation . . .Sight deposits O . . .Al l other liabilities . .
December1939
47905
952
600134218
March1940
47818
865
60975
181
March1941
498561414
1,473
707554212
Changeon year
March 1940-March 1941
+ 498+ 514- 404
+ 608
+ 98+ 479+ 31
(') Including the gold reserves and internal credit items. (2) Including current accounts.
— 123 —
Danish exporters through the clearing are paid directly and the foreignclaims taken over by the National Bank. A large surplus of exports of agri-cultural products to Germany has led to a piling-up of clearing claimsagainst which imports have not been made. In March 1941 there were netforeign exchange and clearing assets of Kr. 513 million against all countries,compared with a net debt of Kr. 36 million a year before. The item "Sundrydebtors", which includes the claims on the Reichskreditkassen for Kassen-scheine redeemed by the National Bank and also the financing of the occu-pation costs, has grown in a similar measure. Together the two items haverisen by over Kr. 1,000 million during the year to March 1941. Of theKr. 1,000 million new central-bank credit thus created, Kr. 400 million has beenutilised to repay credit previously granted, Kr. 100 million has gone into cir-culation and nearly Kr. 500 million has piled up on sight account at the NationalBank. The liquidity indicated by higher cash holdings and the repayment ofdebts is also reflected in the returns of the private banks.
Danish Commercia l Bank Returns.
In millions of kroner
Assets
Liabilities
Cash holding . . . . .Credit granted * . . . .Bonds and shares . .
Current accounts . . .Time deposits * . . .
December1939
2112,275
454
8431,612
March1940
1292,250
430
7021,647
March. 1941
6141,929
670
9391.747
Changeon year
March 1940-March 1941
+ 485— 321+ 240
+ 237+ 100
* Advances, overdrafts and bills discounted.
In May 1940 the government created a Kr. 100 million fund to guarantee,up to 50 per cent., advances made by the banks for the financing of industrialenterprises, but total advances nevertheless continue to fall. With depositsand cash rising and credit being repaid, the banks have employed part oftheir increased resources in the bond market (taking up securities sold bythe National Bank to curb the expansion of its assets). Over the year bondprices have risen by 10 per cent, and the National Bank has twice reducedits discount rate, from 5% to 4% per cent, in May and to 4 per cent, inOctober 1940 (while parallel reductions have been made by the commercialbanks on deposits and credit items). It is noteworthy that savings-bank depositshave not recovered. For the whole year 1940 they remained below the levelof 1939.
Some small loans have been issued by the government but insufficientto put a check to the expansion of central-bank credit: à Zx/2 per cent,one-year loan of Kr. 40 million was placed with the banks in July; in October,Kr. 50 million was raised by 4 per cent. 10-year bonds issued to the publicat 97%; in February 1941, a 4 per cent. 25-year loan for Kr. 30 million wasissued at 93%: Kr. 30 million of the second issue and all of the third wasfor redemption of maturing loans.
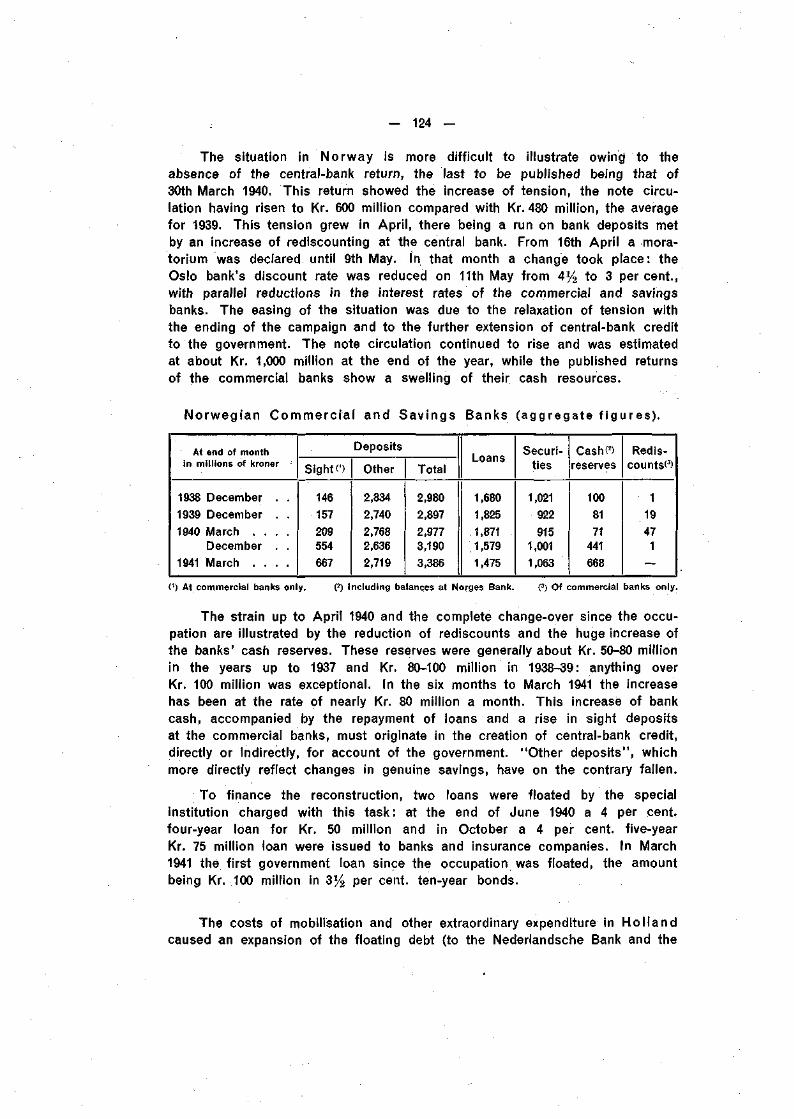
— 124 —
The Situation in Norway is more difficult to illustrate owing to theabsence of the central-bank return, the last to be published being that of30th March 1940. This return showed the increase of tension, the note circu-lation having risen to Kr. 600 million compared with Kr. 480 million, the averagefor 1939. This tension grew in April, there being a run on bank deposits metby an increase of rediscounting at the central bank. From 16th April a mora-torium was declared until 9th May. In that month a change took place: theOslo bank's discount rate was reduced on 11th May from 4% to 3 per cent.,with parallel reductions in the interest rates of the commercial and savingsbanks. The easing of the situation was due to the relaxation of tension withthe ending of the campaign and to the further extension of central-bank creditto the government. The note circulation continued to rise and was estimatedat about Kr. 1,000 million at the end of the year, while the published returnsof the commercial banks show a swelling of their cash resources.
Norwegian Commercia l and Savings Banks (aggregate f igures) .
At end of monthin millions of kroner
1938 December . .
1939 December . .
1940 March . . . .December . .
1941 March . . . .
Deposits
S i g h t «
146157209554667
Other
2,834
2,740
2,7682,636
2,719
Total
2,980
2,897
2,9773,190
3,386
Loans
1,680
1,825
1,8711,579
1,475
Securi-ties
1,021
922915
1,001
1,063
Cash«reserves
1008171
441668
Redis-counts«
119471
—
(') At commercial banks only. (?) Including balances at Norges Bank. (3) Of commercial banks only.
The strain up to April 1940 and the complete change-over since the occu-pation are illustrated by the reduction of rediscounts and the huge increase ofthe banks' cash reserves. These reserves were generally about Kr. 50-80 millionin the years up to 1937 and Kr. 80-100 million in 1938-39: anything overKr. 100 million was exceptional. In the six months to March 1941 the increasehas been at the rate of nearly Kr. 80 million a month. This increase of bankcash, accompanied by the repayment of loans and a rise in sight depositsat the commercial banks, must originate in the creation of central-bank credit,directly or indirectly, for account of the government. "Other deposits", whichmore directly reflect changes in genuine savings, have on the contrary fallen.
To finance the reconstruction, two loans were floated by the specialinstitution charged with this task: at the end of June 1940 a 4 per cent,four-year loan for Kr. 50 million and in October a 4 per cent, five-yearKr. 75 million loan were issued to banks and insurance companies. In March1941 the first government loan since the occupation was floated, the amountbeing Kr. 100 million in 3% per cent, ten-year bonds.
The costs of mobilisation and other extraordinary expenditure in Hol landcaused an expansion of the floating debt (to the Nederlandsche Bank and the
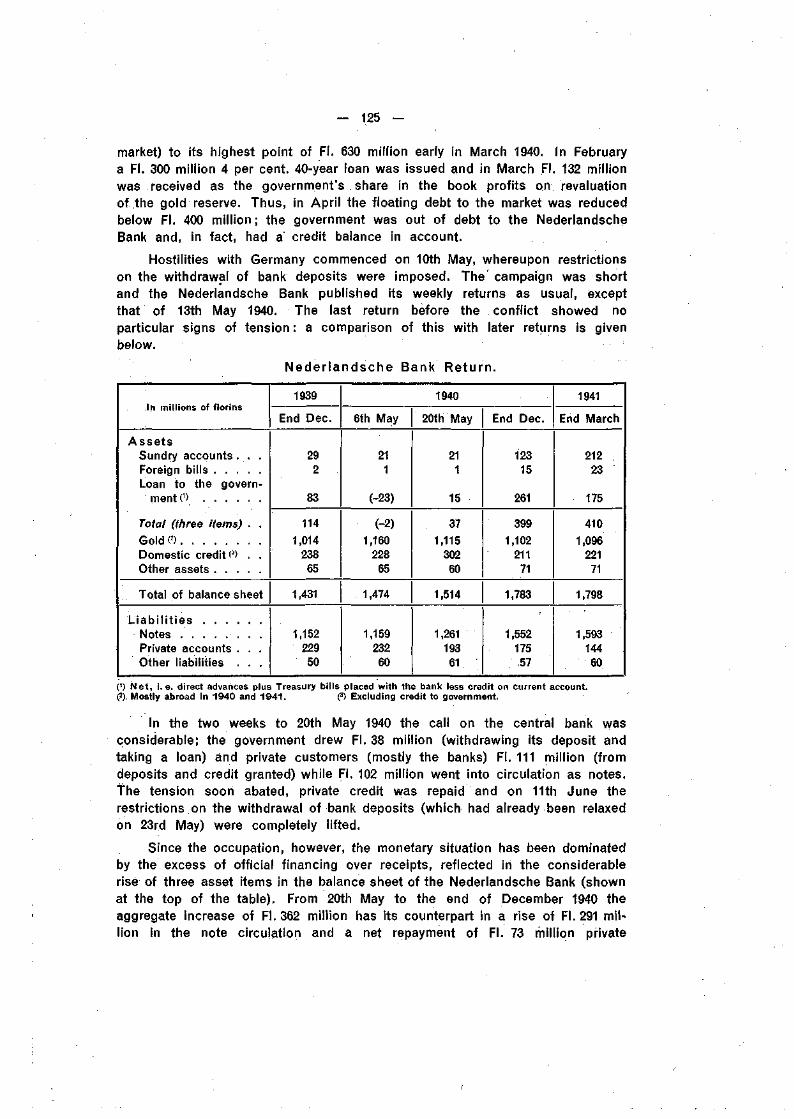
— 125 —
market) to its highest point of FI. 630 million early in March 1940. In Februarya FI. 300 million 4 per cent. 40-year loan was issued and in March FI. 132 millionwas received as the government's . share in the book profits on revaluationof the gold reserve. Thus, in April the floating debt to the market was reducedbelow FI. 400 million; the government was out of debt to the NederlandscheBank and, in fact, had a credit balance in account.
Hostilities with Germany commenced on 10th May, whereupon restrictionson the withdrawal of bank deposits were imposed. The campaign was shortand the Nederlandsche Bank published its weekly returns as usual, exceptthat of 13th May 1940. The last return before the conflict showed noparticular signs of tension : a comparison of this with later returns is givenbelow.
Neder landsche Bank Return.
In millions of florins
A s s e t sSundry accounts. . .Foreign billsLoan to the govern-
ment 0) . . . . . .
Total (three items) . .Gold«Domestic credit (s) . .Other assets
Total of balance sheet
L i ab i l i t i e sNotes . . . . . . . .Private accounts . . .Other liabilities . . .
1939
End Dec.
292
83
1141,014
23865
1,431
1,15222950
1940
6th May
211
(-23)
(-2)1,160
22865
1,474
1,15923260
20th May
211
15
371,115
30260
1,514
1,26119361
End Dec.
12315
261
3991,102
21171
1,783
1,55217557
1941
End March
21223
175
4101,096
22171
1,798
1,59314460
0) Net, i. e. direct advances plus Treasury bills placed with the bank less credit on current account.(2) Mostly abroad in 1940 and 1941. (3) Excluding credit to government.
In the two weeks to 20th May 1940 the call on the central bank wasconsiderable; the government drew FI. 38 million (withdrawing its deposit andtaking a loan) and private customers (mostly the banks) FI. 111 million (fromdeposits and credit granted) while FI. 102 million went into circulation as notes.The tension soon abated, private credit was repaid and on 11th June therestrictions on the withdrawal of bank deposits (which had already been relaxedon 23rd May) were completely lifted.
Since the occupation, however, the monetary situation has been dominatedby the excess of official financing over receipts, reflected in the considerablerise of three asset items in the balance sheet of the Nederlandsche Bank (shownat the top of the table). From 20th May to the end of December 1940 theaggregate increase of FI. 362 million has its counterpart in a rise of FI. 291 mil-lion in the note circulation and a net repayment of FI. 73 million private
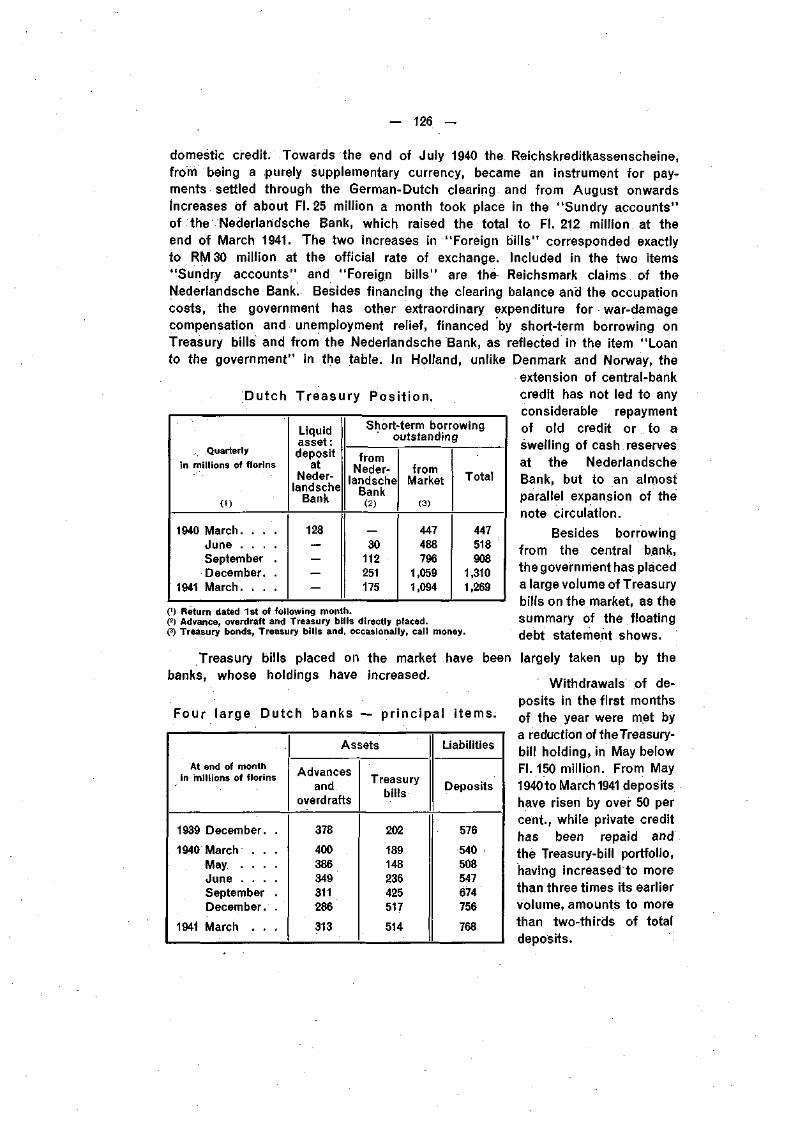
— 126 —
domestic credit. Towards the end of July 1940 the Reichskreditkassenscheine,from being a purely supplementary currency, became an instrument for pay-ments settled through the German-Dutch clearing and from August onwardsincreases of about FI. 25 million a month took place in the "Sundry accounts"òf the Nederlandsche Bank, which raised the total to FI. 212 million at theend of March 1941. The two increases in "Foreign bills" corresponded exactlyto RM 30 million at the official rate of exchange. Included in the two items"Sundry accounts" and "Foreign bills" are the Reichsmark claims of theNederlandsche Bank. Besides financing the clearing balance and the occupationcosts, the government has other extraordinary expenditure for war-damagecompensation and unemployment relief, financed by short-term borrowing onTreasury bills and from the Nederlandsche Bank, as reflected in the item "Loanto the government" in the table. In Holland, unlike Denmark and Norway, the
extension of central-bankDutch Treasury Pos i t ion. credit has not led to any
considerable repaymentof old credit or to aswelling of cash reservesat the NederlandscheBank, but to an almostparallel expansion of thenote circulation.
Besides borrowingfrom the central bank,the govern ment has placeda large volume of Treasurybills on the market, as thesummary of the floatingdebt statement shows.
Quarterlyin millions of florins
( t )
1940 March. . . .June . . . .September .December. .
1941 March. . . .
Liquidasset :deposit
atNeder-
landscheBank
128
Short-term borrowingoutstanding
fromNeder-
landscheBank
(2)
30112251175
fromMarket
(3)
447488796
1,0591,094
Total
447518908
1,3101,269
(') Return dated 1st of following month.(2) Advance, overdraft and Treasury bills directly placed.(3) Treasury bonds, Treasury bills and, occasionally, call money.
Treasury bills placed on the market have been largely taken up by thebanks, whose holdings have increased. , . , * L J • t _i
• • . Withdrawals of de-posits in the first months
Four large Dutch banks - pr inc ipa l i tems. o f t h e y e a r w e r e m e t b y
a reduction of the Treasury-bill holding, in May belowFI. 150 million. From May1940to March 1941 depositshave risen by over 50 percent., while private credithas been repaid andthe Treasury-bill portfolio,having increased to morethan three times its earliervolume, amounts to morethan two-thirds of totaldeposits.
At end of monthin millions of florins
1939 December. .
1940 March . . .May . . . .June . . . .September .December. .
1941 March . . .
Assets
Advancesand
overdrafts
378
400386349311286
313
Treasurybills
202
189148236425517
514
Liabilities
Deposits
576
540508547674756
768
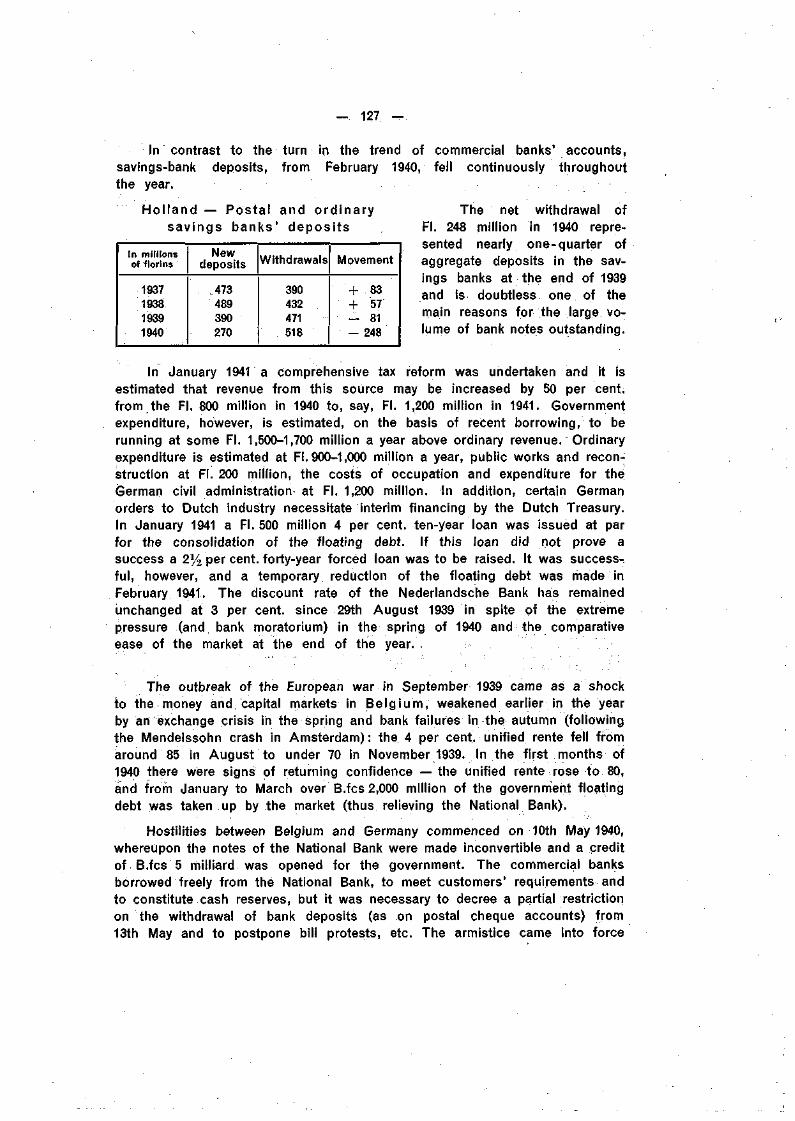
— 127 —
In contrast to the turn in the trend of commercial banks' accounts,savings-bank deposits, from February 1940, fell continuously throughoutthe year.
Hol land — Postal and ordinarysavings banks ' deposi ts
In millionsof florins
1937193819391940
Newdeposits
473489390270
Withdrawals
390432471518
Movement
+ 83+ 57— 81- 248
The net withdrawal ofFI. 248 million in 1940 repre-sented nearly one-quarter ofaggregate deposits in the sav-ings banks at the end of 1939and is doubtless one of themain reasons for the large vo-lume of bank notes outstanding.
In January 1941 a comprehensive tax reform was undertaken and it isestimated that revenue from this source may be increased by 50 per cent,from the FI. 800 million in 1940 to, say, FI. 1,200 million in 1941. Governmentexpenditure, however, is estimated, on the basis of recent borrowing, to berunning at some FI. 1,500-1,700 million a year above ordinary revenue. Ordinaryexpenditure is estimated at FI. 900-1,000 million a year, public works and recon-struction at FI. 200 million, the costs of occupation and expenditure for theGerman civil administration at FI. 1,200 million. In addition, certain Germanorders to Dutch industry necessitate interim financing by the Dutch Treasury.In January 1941 a FI. 500 million 4 per cent, ten-year loan was issued at parfor the consolidation of the floating debt. If this loan did not prove asuccess a 2% per cent, forty-year forced loan was to be raised. It was success-ful, however, and a temporary reduction of the floating debt was made inFebruary 1941. The discount rate of the Nederlandsche Bank has remainedunchanged at 3 per cent, since 29th August 1939 in spite of the extremepressure (and bank moratorium) in the spring of 1940 and the comparativeease of the market at the end of the year.
The outbreak of the European war in September 1939 came as a shockto the money and capital markets in Be lg ium, weakened earlier in the yearby an exchange crisis in the spring and bank failures in the autumn (followingthe Mendelssohn crash in Amsterdam): the 4 per cent, unified rente fell fromaround 85 in August to under 70 in November 1939. In the first months of1940 there were signs of returning confidence —the unified rente rose to 80,and from January to March over B.fcs 2,000 million of the government floatingdebt was taken up by the market (thus relieving the National Bank).
Hostilities between Belgium and Germany commenced on 10th May 1940,whereupon the notes of the National Bank were made inconvertible and a creditof B.fcs 5 milliard was opened for the government. The commercial banksborrowed freely from the National Bank, to meet customers' requirements andto constitute cash reserves, but it was necessary to decree a partial restrictionon the withdrawal of bank deposits (as on postal cheque accounts) from13th May and to postpone bill protests, etc. The armistice came into force
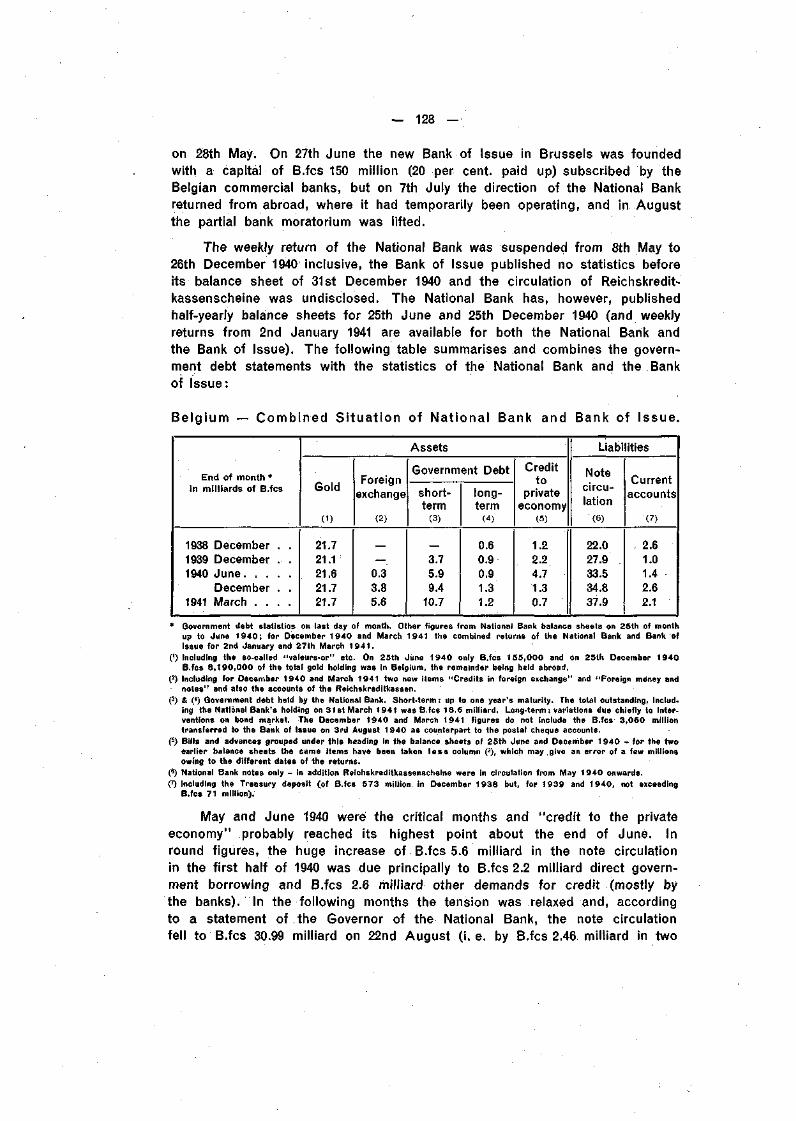
— 128 —
on 28th May. On 27th June the new Bank of Issue in Brussels was foundedwith a capital of B.fcs 150 million (20 per cent, paid up) subscribed by theBelgian commercial banks, but on 7th July the direction of the National Bankreturned from abroad, where it had temporarily been operating, and in Augustthe partial bank moratorium was lifted.
The weekly return of the National Bank was suspended from 8th May to26th December 1940 inclusive, the Bank of Issue published no statistics beforeits balance sheet of 31st December 1940 and the circulation of Reichskredit-kassenscheine was undisclosed. The National Bank has, however, publishedhalf-yearly balance sheets for 25th June and 25th December 1940 (and weeklyreturns from 2nd January 1941 are available for both the National Bank andthe Bank of Issue). The following table summarises and combines the govern-ment debt statements with the statistics of the National Bank and the Bankof Issue:
Belgium — Combined Si tuat ion of National Bank and Bank of Issue.
End of month *in milliards of B.fcs
1938 December . .1939 December . .1940 June
December . .1941 March . . . .
Assets
Gold
0)
21.721.121.621.721.7
Foreignexchange
(2)
0.33.85.6
Government Debt
short-term
(3)
3.75.99.4
10.7
long-term
(4)
0.60.90.91.31.2
Creditto
privateeconomy
(5)
1.22.24.71.30.7
Liabilities
Notecircu-lation
(6)
22.027.933.534.837.9
Currentaccounts
(7)
2.61.01.42.62.1
* Government debt statistics on last day of month. Other figures from National Bank balance sheets on 25th of monthup to June 1 9 4 0 ; for December 1940 and March 1941 the combined returns of the National Bank and Bank ofIssue for 2nd January and 27th March 1 9 4 1 .
0) Including the so-called "valeurs-or" etc. On 25th June 1940 only B.fcs 155 ,000 and on 25th December 1940B.fcs 8 ,190 ,000 of the total gold holding was in Belgium, the remainder being held abroad.
(2) Including for December 1940 and March 1941 two new items "Credits in foreign exchange" and "Foreign money andnotes" and also the accounts of the Reichskreditkassen.
(3) & (4) Government debt held by the National Bank. Short-term: up to one year's maturity. The total outstanding, includ-ing the National Bank's holding on 31 st March 1 941 was B.fcs 18.6 milliard. Long-term : variations due chiefly to inter-ventions on bond market. The December 1940 and March 1941 figures do not Include the B.fcs 3,060 milliontransferred to the Bank of Issue on 3rd August 1940 as counterpart to the postal cheque accounts.
(5) Bills and advances grouped under this heading in the balance sheets of 25th June and December 1940 - for the twoearlier balance sheets the same Items have been taken less column (3), which may .give an error of a few millionsowing to the different dates of the returns.
(6) National Bank notes only - in addition Reichskreditkassenscheine were in circulation from May 1940 onwards.(7) Including the Treasury deposit (of B.fcs 573 million, in December 1938 but, for 1939 and 1940 , not exceeding
B.fcs 71 million).
May and June 1940 were the critical months and "credit to the privateeconomy" probably reached its highest point about the end of June. Inround figures, the huge increase of B.fcs 5.6 milliard in the note circulationin the first half of 1940 was due principally to B.fcs 2.2 milliard direct govern-ment borrowing and B.fcs 2.6 milliard other demands for credit (mostly bythe banks). In the following months the tension was relaxed and, accordingto a statement of the Governor of the National Bank, the note circulationfell to B.fcs 30.99 milliard on 22nd August, ( i .e. by B.fcs 2.46 milliard in two
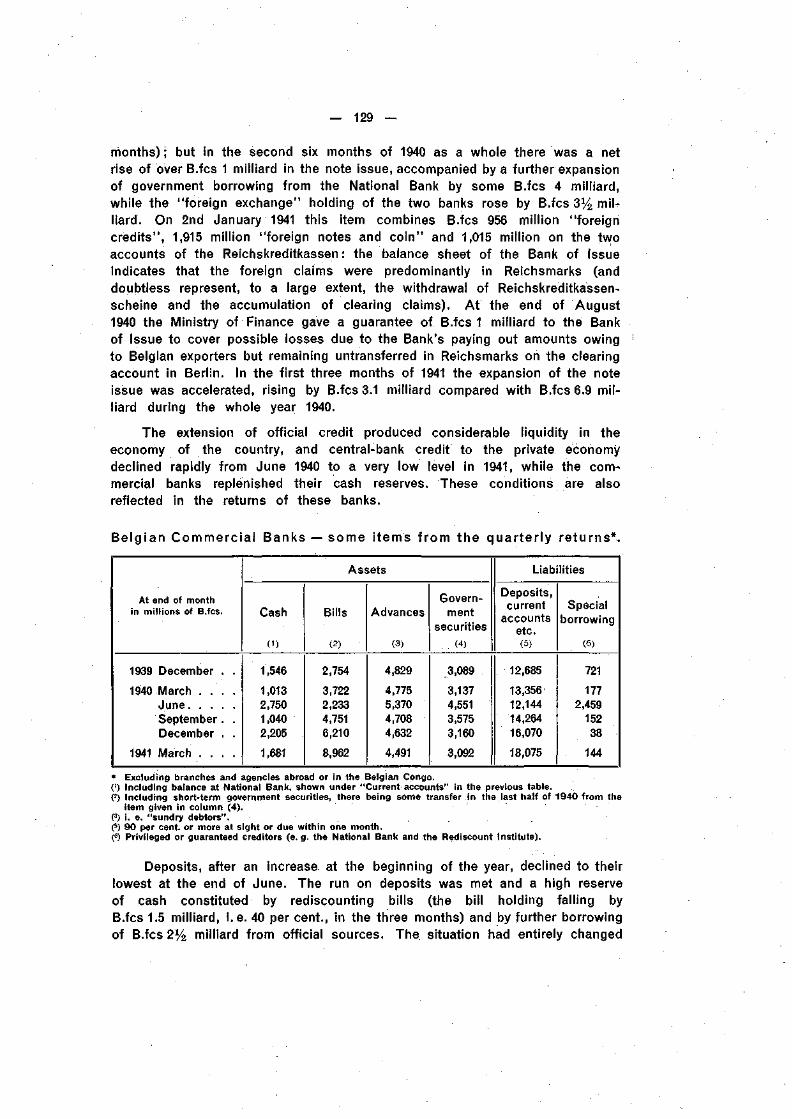
— 129 —
months); but in the second six months of 1940 as a whole there was a netrise of over B.fcs 1 milliard in the note issue, accompanied by a further expansionof government borrowing from the National Bank by some B.fcs 4 milliard,while the "foreign exchange" holding of the two banks rose by B.fcs 3% mil-liard. On 2nd January 1941 this item combines B.fcs 956 million "foreigncredits", 1,915 million "foreign notes and coin" and 1,015 million on the twoaccounts of the Reichskreditkassen: the balance sheet of the Bank of Issueindicates that the foreign claims were predominantly in Reichsmarks (anddoubtless represent, to a large extent, the withdrawal of Reichskreditkassen-scheine and the accumulation of clearing claims). At the end of August1940 the Ministry of Finance gave a guarantee of B.fcs 1 milliard to the Bankof Issue to cover possible losses due to the Bank's paying out amounts owingto Belgian exporters but remaining untransferred in Reichsmarks on the clearingaccount in Berlin. In the first three months of 1941 the expansion of the noteissue was accelerated, rising by B.fcs 3.1 milliard compared with B.fcs 6.9 mil-liard during the whole year 1940.
The extension of official credit produced considerable liquidity in theeconomy of the country, and central-bank credit to the private economydeclined rapidly from June 1940 to a very low level in 1941, while the com-mercial banks replenished their cash reserves. These conditions are alsoreflected in the returns of these banks.
Belgian Commercial Banks — some items f rom the quarter ly returns*.
At end of monthin millions of B.fcs.
1939 December . .
1940 March . . . .
June
September. .
December . .
1941 March . . . .
Assets
Cash
0)
1,546
1,013
2,750
1,040
2,205
1,681
Bills
(2)
2,754
3,722
2,233
4,751
6,210
8,962
Advances
(3)
4,829
4,775
5,370
4,708
4,632
4,491
Govern-
ment
securities
• . . < 4 )
3,089
3,137
4,551
3,575
3,160
3,092
Liabilities
Deposits,current
accountsetc.
(5)
12,685
13,356
12,144
14,264
16,070
18,075
Special
borrowing
(6)
721
177
2,459
152
38
144
* Excluding branches and agencies abroad or in the Belgian Congo.(') Including balance at National Bank, shown under "Current accounts" in the previous table.CO Including short-term government securities, there being some transfer in the last half of 1940 from the
item given in column (4).(3) i. e. "sundry debtors".(5) 90 per cent, or more at sight or due within one month.(6) Privileged or guaranteed creditors (e. g. the National Bank and the Rediscount Institute).
Deposits, after an increase at the beginning of the year, declined to theirlowest at the end of June. The run on deposits was met and a high reserveof cash constituted by rediscounting bills (the bill holding falling byB.fcs 1.5 milliard, i.e. 40 per cent., in the three months) and by further borrowingof B.fcs 2% milliard from official sources. The situation had entirely changed
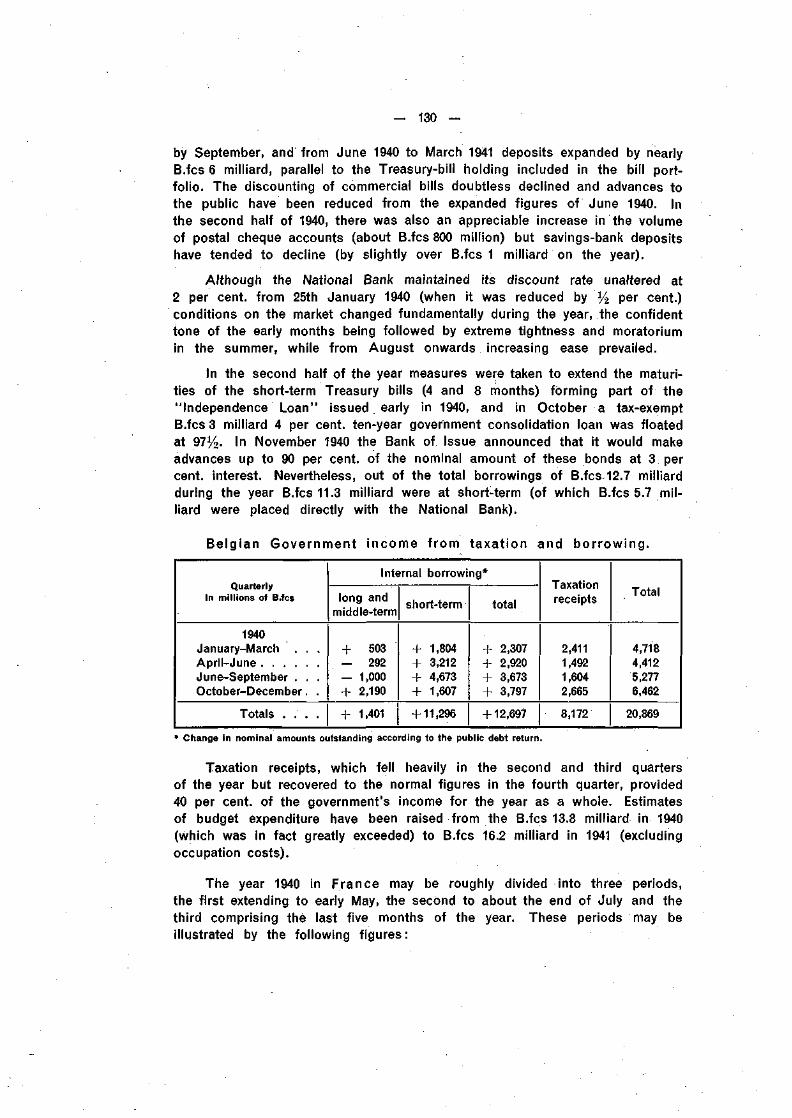
— 130 —
by September, and from June 1940 to March 1941 deposits expanded by nearlyB.fcs 6 milliard, parallel to the Treasury-bill holding included in the bill port-folio. The discounting of commercial bills doubtless declined and advances tothe public have been reduced from the expanded figures of June 1940. Inthe second half of 1940, there was also an appreciable increase in the volumeof postal cheque accounts (about B.fcs 800 million) but savings-bank depositshave tended to decline (by slightly over B.fcs 1 milliard on the year).
Although the National Bank maintained its discount rate unaltered at2 per cent, from 25th January 1940 (when it was reduced by '% per cent.)conditions on the market changed fundamentally during the year, the confidenttone of the early months being followed by extreme tightness and moratoriumin the summer, while from August onwards increasing ease prevailed.
In the second half of the year measures were taken to extend the maturi-ties of the short-term Treasury bills (4 and 8 months) forming part of the"Independence Loan" issued early in 1940, and in October a tax-exemptB.fcs 3 milliard 4 per cent, ten-year government consolidation loan was floatedat 97%. In November 1940 the Bank of Issue announced that it would makeadvances up to 90 per cent, of the nominal amount of these bonds at 3 percent, interest. Nevertheless, out of the total borrowings of B.fcs 12.7 milliardduring the year B.fcs 11.3 milliard were at short-term (of which B.fcs 5.7 mil-liard were placed directly with the National Bank).
Belgian Government income from taxat ion and borrowing.
QuarterlyIn millions of B.fcs
1940January-March . . .April-JuneJune-September . . .October-December. .
Totals . . . .
Internal borrowing*
long andmiddle-term
+ 503— 292— 1,000+ 2,190
+ 1,401
short-term
+ 1,804+ 3,212+ 4,673+ 1,607
+ 11,296
total
+ 2,307+ 2,920+ 3,673+ 3,797
+ 12,697
Taxationreceipts
2,4111,4921,6042,665
8,172
Total
4,7184,4125,2776,462
20,869
* Change in nominal amounts outstanding according to the public debt return.
Taxation receipts, which fell heavily in the second and third quartersof the year but recovered to the normal figures in the fourth quarter, provided40 per cent, of the government's income for the year as a whole. Estimatesof budget expenditure have been raised from the B.fcs 13.8 milliard in 1940(which was in fact greatly exceeded) to B.fcs 16.2 milliard in 1941 (excludingoccupation costs).
The year 1940 in France may be roughly divided into three periods,the first extending to early May, the second to about the end of July and thethird comprising thé last five months of the year. These periods may beillustrated by the following figures:
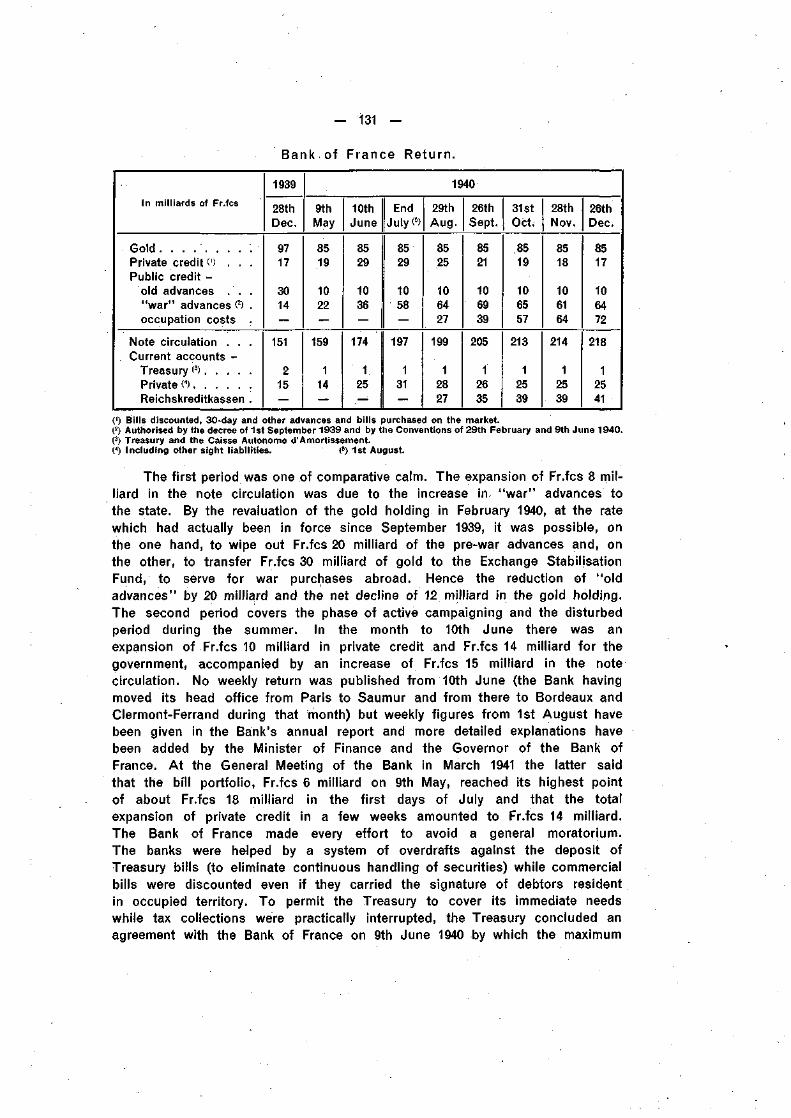
- 131 -
Bank of France Return.
In milliards of Fr.fcs
Gold . . . . . . . . .Private credit () . . .Public credit -
old advances . . ." w a r " advances O .occupation costs .
Note circulation . . .Current accounts -
Treasury P). . .Private C)Reichskreditkassen .
1939
28thDec.
9717
3014—
151
215
1940
9thMay
8519
1022—
159
114
10thJune
8529
1036—
174
125
EndJuly«
8529
1058—
197
131
29thAug.
8525
106427
199
12827
26thSept.
8521
106939
205
12635
31stOct.
8519
106557
213
12539
28thNov.
8518
106164
214
12539
26thDec.
8517
106472
218
12541
(') Bi l ls discounted, 30-day and other advances and bi l ls purchased on the market.(2) Authorised by the decree of 1st September 1939 and by the Conventions of 29th February and 9th June 1940.(3) Treasury and the Caisse Autonome d'Amort issement.C) Inc luding other s ight l iabi l i t ies. (5) 1st August.
The first period was one of comparative calm. The expansion of Fr.fcs 8 mil-liard in the note circulation was due to the increase in. "war" advances tothe state. By the revaluation of the gold holding in February 1940, at the ratewhich had actually been in force since September 1939, it was possible, onthe one hand, to wipe out Fr.fcs 20 milliard of the pre-war advances and, onthe other, to transfer Fr.fcs 30 milliard of gold to the Exchange StabilisationFund, to serve for war purchases abroad. Hence the reduction of "oldadvances" by 20 milliard and the net decline of 12 milliard in the gold holding.The second period covers the phase of active campaigning and the disturbedperiod during the summer. In the month to 10th June there was anexpansion of Fr.fcs 10 milliard in private credit and Fr.fcs 14 milliard for thegovernment, accompanied by an increase of Fr.fcs 15 milliard in the notecirculation. No weekly return was published from 10th June (the Bank havingmoved its head office from Paris to Saumur and from there to Bordeaux andClermont-Ferrand during that month) but weekly figures from 1st August havebeen given in the Bank's annual report and more detailed explanations havebeen added by the Minister of Finance and the Governor of the Bank ofFrance. At the General Meeting of the Bank in March 1941 the latter saidthat the bill portfolio, Fr.fcs 6 milliard on 9th May, reached its highest pointof about Fr.fcs 18 milliard in the first days of July and that the totalexpansion of private credit in a few weeks amounted to Fr.fcs 14 milliard.The Bank of France made every effort to avoid a general moratorium.The banks were helped by a system of overdrafts against the deposit ofTreasury bills (to eliminate continuous handling of securities) while commercialbills were discounted even if they carried the signature of debtors residentin occupied territory. To permit the Treasury to cover its immediate needswhile tax collections were practically interrupted, the Treasury concluded anagreement with the Bank of France on 9th June 1940 by which the maximum
- 132 -
of "war" advances was raised to Fr.fcs 70 milliard. This maximum was neverexceeded despite heavy drawings in June and July. The effect of the demandon the Bank's credit was a rise in the note circulation to Fr.fcs 198 milliardearly in August (an increase of nearly Fr.fcs 40 milliard, some 25 per cent,in three months).
The third period was characterised by efforts to put the internal financialposition and the banking system in order and also by the appearance of anew factor: the payment of the costs of occupation fixed at Fr.fcs 400 milliona day from 25th June.
Once the local financial administration could take up its work, collectionof taxes began again. Deposits returned to the postal cheque accounts andthe savings banks, and the net issues of Treasury bills rose to an average ofFr.fcs 6 milliard per month. Despite large exceptional expenditure the resortof the Treasury to the Bank of France to meet internal needs slowed downand later on ceased. At the same time the exceptional advances by the Bankto the market began to be reimbursed from the month of August, but at thattime the first payments of occupation costs had to be met and the series ofagreements between the Bank of France and the Treasury gave the latterspecial advances for that purpose. The first of these agreements was signedon 25th August and the amount of Fr.fcs 27.2 milliard, representing theamount of occupation costs for the period since 25th June, was debitedto the account of new advances "for occupation costs" and a similar sumcredited to the current account of the Reichskreditkassen. Altogether thisaccount had been credited with Fr.fcs 77,144 million by the end of the year,Fr.fcs 72,317 million being debited to the special advances account and thebalance temporarily to the government's "war" advances account. Of the totalFr.fcs 77 milliard odd, Fr.fcs 41,400 million (54 per cent.) remained unspent onthe account of the Reichskreditkassen at the end of the year; Fr.fcs 24 mil-liard had been drawn to cover various payments while Fr.fcs 12 milliardwas utilised to redeem Reichskreditkassenscheine previously issued by theoccupying authorities (the amount remaining in circulation in France beingunknown).
The "war" advances to the government at Fr.fcs 64 milliard on 26th December1940, compared with Fr.fcs 36 milliard in June, had, in fact, fallen fromtheir highest point of nearly Fr.fcs 70 milliard on 3rd October, and continuedto fall to around Fr.fcs 60 milliard by the end of the year. The monthlyrevenue from taxation became more normal and the placing of Treasury billseasier. "The equilibrium of the Treasury would thus have been assured", saidthe Governor at the General Meeting, "if the charges which the Treasuryhad already assumed and which tended to diminish had not been increasedin the last days of August by the payment of occupation costs." Centralbank credit granted to the private economy of the country also decreased inthe second half of the year to a figure slightly less than at the end of 1939,owing partly to the liquidity of the market and partly to the low level ofbusiness activity. As a consequence, the rise in the note circulation slowed
— 133 —
down. After having reached nearly Fr.fcs 40 milliard in May, June and July,the increase rather exceeded Fr.fcs 20 milliard during the last five months ofthe year (taking the circulation to Fr.fcs 221 milliard on 2nd January 1941)and, according to a statement by the Minister of Finance, it was onlyFr.fcs 11 milliard during the first four months of 1941, bringing the note cir-culation to Fr.fcs 232 milliard at the end of April.
With the armistice the great part of the military expenditure ceased :nevertheless, besides ordinary administrative expenses and debt service, therewas considerable emergency expenditure on immediate reconstruction (bridges,etc.), on behalf of refugees and other relief in the face of the drying-up of ordinaryincome (although no tax returns were published, taxation revenue doubtlessfell off in the spring and summer as in Belgium and Holland). The budgetdeficit, which towards the end of 1940 was estimated at about Fr.fcs 5 milliarda month, was largely met by the issue of Treasury bills, which explains thecessation of the Treasury's resort to the Bank of France except for paymentof the occupation costs.
For 1941 a budget has been established which does not comprise theoccupation costs (Fr.fcs 146 milliard covered solely by the Treasury) nor theexpenditure of the Caisse Autonome d'Amortissement (Fr.fcs 9 milliard coveredby the resources allocated to the "Caisse"). The budget estimates are asfollows :
Ordinary expenditure Fr.fcs milliards
Public debt . . . . . . . . . . . . . . . 18.0Annuities, pensions, etc. 14.5
Administrative expenditure 64.5
Tota l 97.0
Extraordinary expenditureLiquidation of expenditure resulting from the hostilities . . 29.0Public works, etc. 8.6
Tota l 37.6
Ordinary receipts are estimated at Fr.fcs 68.2 milliard. They cover abouttwo-thirds of ordinary expenditure (Fr.fcs 97.0 milliard) and nearly one-half ofthe total budget expenditure (Fr.fcs 134.6 milliard).
In his review of the budget estimates for 1941 the Minister of Financesaid that even if the Treasury could obtain funds regularly at a moderate rateof interest, thanks to exchange control, rationing and other measures whichlimit the employment of available funds, it would be an exaggeration to think"that the increase in the public debt could be pursued indefinitely withoutdanger".
The considerable issue of Treasury bills is reflected in the balance sheetsof the three large banks (Crédit Lyonnais, Société Générale and ComptoirNational d'Escompte).
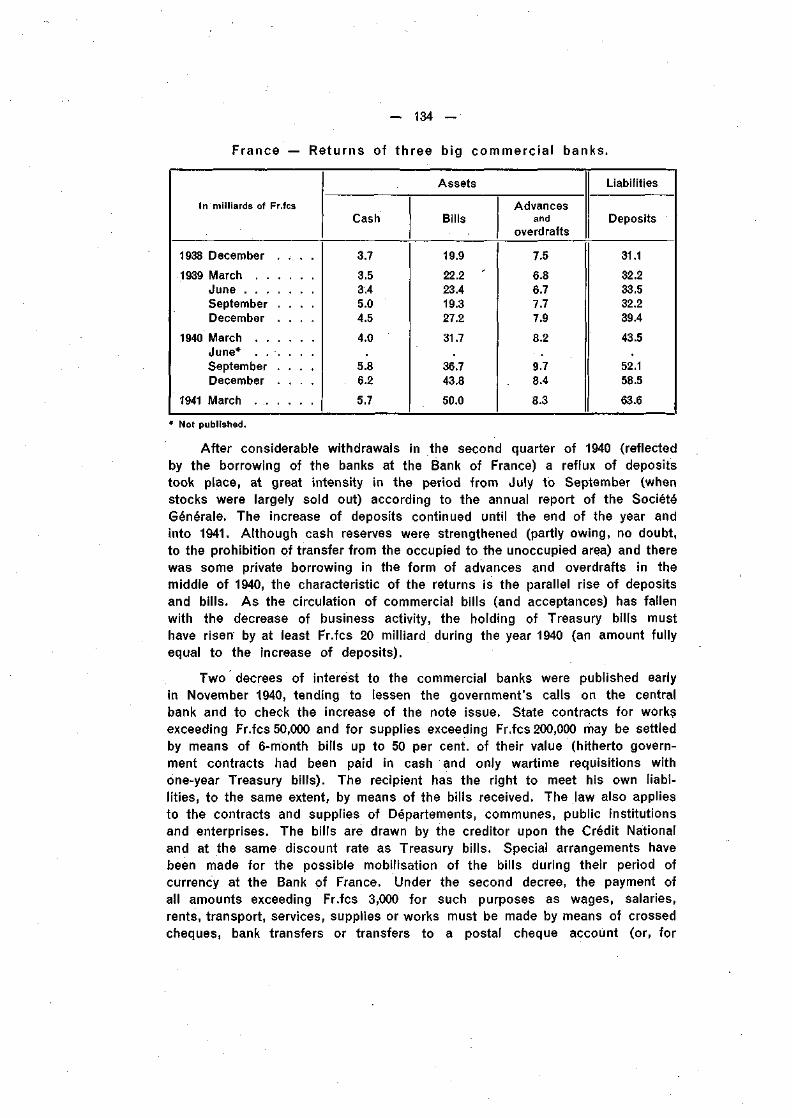
- 134
France — Returns of three big commercial banks.
In milliards of Fr.fcs
1 9 3 8 D e c e m b e r . . . .
1 9 3 9 M a r c hJ u n eS e p t e m b e r . . . .D e c e m b e r . . . .
1 9 4 0 M a r c hJ u n e * . . . . . .S e p t e m b e r . . . .D e c e m b e r . . . .
1941 M a r c h
A s s e t s
Cash
3.7
3.53.45.04.5
4.0
5.86.2
5.7
Bills
19.9
22.2 '23.419.327.2
31.7
36.743.8
50.0
Advancesand
overdrafts
7.5
6.86.77.77.9
8.2
9.78.4
8.3
Liabilities
Deposits
31.1
32.233.532.239.4
43.5
52.158.5
63.6
* Not published.
After considerable withdrawals in the second quarter of 1940 (reflectedby the borrowing of the banks at the Bank of France) a reflux of depositstook place, at great intensity in the period from July to September (whenstocks were largely sold out) according to the annual report of the SociétéGénérale. The increase of deposits continued until the end of the year andinto 1941. Although cash reserves were strengthened (partly owing, no doubt,to the prohibition of transfer from the occupied to the unoccupied area) and therewas some private borrowing in the form of advances and overdrafts in themiddle of 1940, the characteristic of the returns is the parallel rise of depositsand bills. As the circulation of commercial bills (and acceptances) has fallenwith the decrease of business activity, the holding of Treasury bills musthave risen' by at least Fr.fcs 20 milliard during the year 1940 (an amount fullyequal to the increase of deposits).
Two decrees of interest to the commercial banks were published earlyin November 1940, tending to lessen the government's calls on the centralbank and to check the increase of the note issue. State contracts for worksexceeding Fr.fcs 50,000 and for supplies exceeding Fr.fcs 200,000 may be settledby means of 6-month bills up to 50 per cent, of their value (hitherto govern-ment contracts had been paid in cash and only wartime requisitions withone-year Treasury bills). The recipient has the right to meet his own liabi-lities, to the same extent, by means of the bills received. The law also appliesto the contracts and supplies of Départements, communes, public institutionsand enterprises. The bills are drawn by the creditor upon the Crédit Nationaland at the same discount rate as Treasury bills. Special arrangements havebeen made for the possible mobilisation of the bills during their period ofcurrency at the Bank of France. Under the second decree, the payment ofall amounts exceeding Fr.fcs 3,000 for such purposes as wages, salaries,rents, transport, services, supplies or works must be made by means of crossedcheques, bank transfers or transfers to a postal cheque account (or, for
— 135 —
payments of the government, to an account opened at the Treasury office). Allmerchants on the commercial register are required to maintain a bank accountor an account with the postal cheque office.
Although no recent statistics have been published, it is known that thefall of deposits at the savings banks was more persistent than at the com-mercial banks but that during the last months of the year new deposits againexceeded withdrawals. In January 1941 the Fries 20,000 deposit limit, whichhad been suspended in August 1940, was reimposed and the interest rateon deposits at the Caisse Nationale reduced from 2% per cent., at whichit had stood for many years, to 2l/2 per cent. The rate for three-year NationalDefence bills was reduced from 4 to 3% per cent, on 1st January 1941 andat the end of the month to 3% per cent.: in January also the rate on two-year Treasury bills was reduced from 3% to 3% per cent., on one-year billsfrom 3 to 2% per cent, and on 6-month bills from 2% to 2% per cent. Therate for Treasury bills of 75-105 days was maintained at 2 per cent., equalto bank rate.
In the middle of March 1941, the Bank of France reduced its bank rateand the rate for 30-day advances against government paper of not more thantwo years' maturity, from 2 to 1% per cent. This decrease of % per cent, wasfollowed by a similar reduction in the rates for National Defence Bills and forthe various classes of Treasury bills. An improvement of 4% per cent, govern-ment bonds to par in April 1941 opened up the possibility of a large conversionoperation, covering some Fr.fcs 11% milliard of public debt issued throughthe Crédit National.
The new Bank of Issue in the Governor-Generalship of Poland began itsactivities on 8th April 1940. New zloty notes were put out against the Reichs-kreditkassenscheine in circulation while notes of the Bank of Poland were alsocalled in for exchange up to 31st May 1940. By a decree of the Governor-General the Bank of Issue was also authorised to mint coins and put theminto circulation. As no statistics of any kind have been published, the presentissue of notes and coin and the volume of bank deposits is unknown.
For the immediate re-establishment of the credit system after the Germancampaign in 1939, measures were taken locally by the heads of the civil adminis-tration. The records of the banks were put in order and as far as possiblecompleted (a special difficulty arising from the fact that some of the assetshad been removed abroad). The .banks were reorganised, administrativechanges made, expenses cut down and the granting of new credits madesubject to official authorisation. In addition to the appointment of Polishtrustees, German trustees were attached to the big state banks (the PostalSavings Bank, the National Economy Bank and the Agrarian Bank and laterto the Polish Commercial Bank) to centralise responsibility and to reassuredepositors. Two important banking measures were taken — the restrictionon withdrawals of deposits and the separation of old and new business. InWarsaw, as a relief measure, a weekly maximum withdrawal of ZI. 100 from
— 136 —
commercial banks and ZI. 50 from savings banks was allowed, beyond whichlimits permits were required for drawing on old balances. The weekly releasesof deposits began with low percentages of balances as at 5th October 1939,and in some cases mounted up to 20 or 30 per cent, of the original balance(more where balances were very small). Outside Warsaw, payments out ofold balances were generally determined by the amounts of receipts from oldbusiness.
In 1940 more uniformity was introduced throughout the country. By decreeof 8th April, a Bank Control Office was set up under the German "Bank-dirigent" attached to the Bank of Issue. On 8th July 1940, the provisionsregarding disposal of old balances in Warsaw were extended to the wholeterritory under the Governor-General and a sharper distinction made betweenold and new business. In particular, it was prescribed that new depositsmight not be used for the discharge of obligations arising out of old business.No interest was allowed on old deposits but, as new business deposits andthe bank investments grew, it became necessary to fix interest conditions.On 17th December 1940, by an order of the head of the Bank Control Office,the various kinds of new deposits' were defined and interest rates fixed : sightfunds received 1 per cent., deposits at notice 1% to 3 per cent, and fixeddeposits 1% to 2% per cent, (according to the period of notice required orthe term of the deposit); savings deposits received 2-3 per cent. The ratesfor bank credit operations were not fixed. Branches or subsidiaries of threeGerman banks have been opened in Cracow.
The ordinary budget for the first year of the Governor-Generalshipshowed revenue of ZI. 974 million and expenditure of ZI. 1,004 million, thusclosing with the small deficit of ZI. 30 million. The extraordinary budgetshowed expenditure at ZI, 278 million.
In spite of great differences of economic structure, of monetary con-ditions and of political experiences in 1940, certain broad similarities in thedevelopments may be perceived in the countries of south-eastern Europe.Generally these countries lack organised money and capital markets accordingto western standards, the rate of savings is low and the use of bank notesis more widespread than cheques and bank deposits. Unbalanced budgets,due largely to increased military and other extraordinary expenditure (such asthe financing of clearing claims) has been covered from market borrowingonly with difficulty, if at all. Recourse by the governments to central-bankcredit has thus been frequent and, in some cases, on a considerable scale,with corresponding increases in the note circulation (and in bank reserveswith the central bank). Owing to differences of accounting, it is not alwayseasy to say exactly to what extent the recent expansions in note issues aredue directly or indirectly to government borrowing from the central banks, butthis is doubtless the predominant influence in most cases. In some instanceswithdrawals of deposits from the commercial and savings banks have ledto considerable calls on the central banks for rediscounts and loans, but these
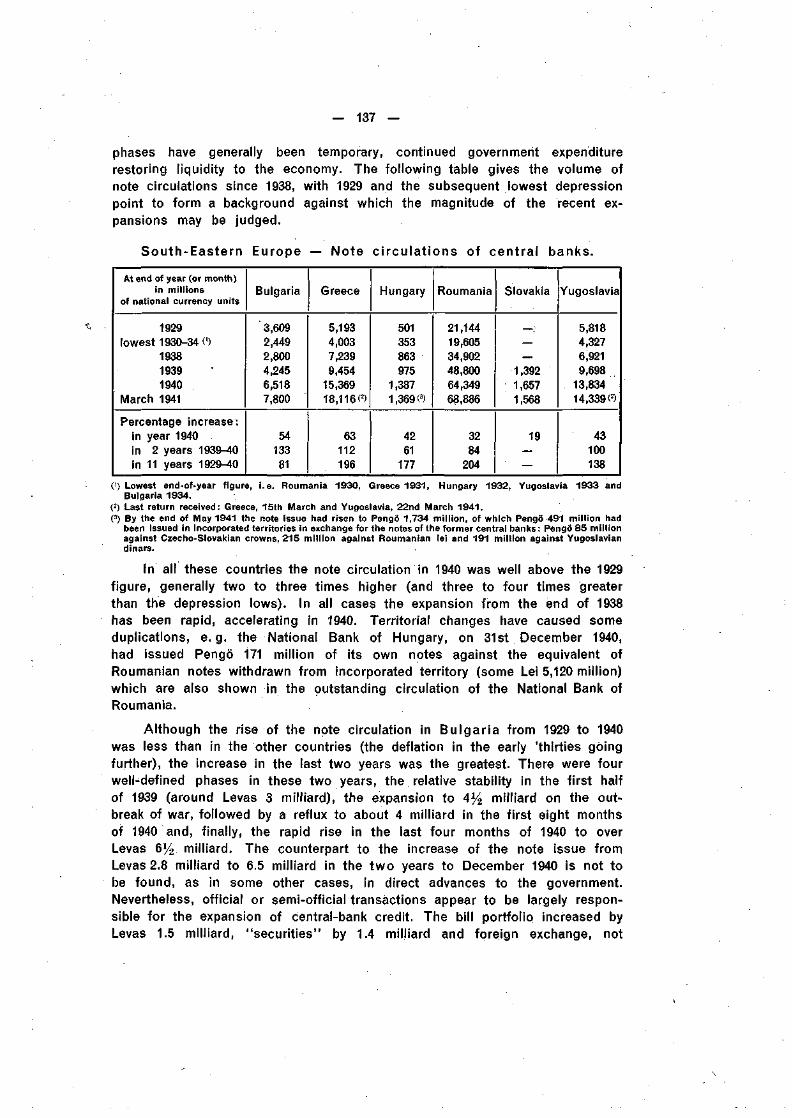
— 137 —
phases have generally been temporary, continued government expenditurerestoring liquidity to the economy. The following table gives the volume ofnote circulations since 1938, with 1929 and the subsequent lowest depressionpoint to form a background against which the magnitude of the recent ex-pansions may be judged.
South-Eastern
At end of year (or month)in millions
of national currency units
1929lowest 1930-34 O
193819391940
March 1941
Percentage increase:in year 1940in 2 years 1939-40in 11 years 1929-40
Europe
Bulgaria
3,6092,4492,8004,2456,5187,800
5413381
— Note
Greece
5,1934,0037,2399,454
15,36918,116(2)
63112196
circulations of central banks.
Hungary
501353863975
1,3871,369 (3)
4261
177
Roumania
21,14419,60534,90248,80064,34968,886
3284
204
Slovakia
——
1,3921,6571,568
19——
Yugoslavia
5,8184,3276,9219,698
13,83414,339«
43100138
(') Lowest end-of-year figure, i.e. Roumania 1930, Greece 1931, Hungary 1932, Yugoslavia 1933 andBulgaria 1934.
(2) Last return received : Greece, 15th March and Yugoslavia, 22nd March 1941.(3) By the end of May 1941 the note Issue had risen to Pengö 1,734 mil l ion, of which Pengö 491 mill ion had
been issued in incorporated territories in exchange for the notes of the former central banks : Pengö 85 mil l ionagainst Czecho-Slovakian crowns, 215 mill ion against Roumanian lei and 191 mill ion against Yugoslaviandinars.
In all these countries the note circulation in 1940 was well above the 1929figure, generally two to three times higher (and three to four times greaterthan the depression lows). In all cases the expansion from the end of 1938has been rapid, accelerating in 1940. Territorial changes have caused someduplications, e.g. the National Bank of Hungary, on 31st December 1940,had issued Pengö 171 million of its own notes against the equivalent ofRoumanian notes withdrawn from incorporated territory (some Lei 5,120 million)which are also shown in the outstanding circulation of the National Bank ofRoumania.
Although the rise of the note circulation in Bulgaria from 1929 to 1940was less than in the other countries (the deflation in the early 'thirties goingfurther), the increase in the last two years was the greatest. There were fourwell-defined phases in these two years, the relative stability in the first halfof 1939 (around Levas 3 milliard), the expansion to 4% milliard on the out-break of war, followed by a reflux to about 4 milliard in the first eight monthsof 1940 and, finally, the rapid rise in the last four months of 1940 to overLevas 6% milliard. The counterpart to the increase of the note issue fromLevas 2.8 milliard to 6.5 milliard in the two years to December 1940 is not tobe found, as in some other cases, in direct advances to the government.Nevertheless, official or semi-official transactions appear to be largely respon-sible for the expansion of central-bank credit. The bill portfolio increased byLevas 1.5 milliard, "securities" by 1.4 milliard and foreign exchange, not
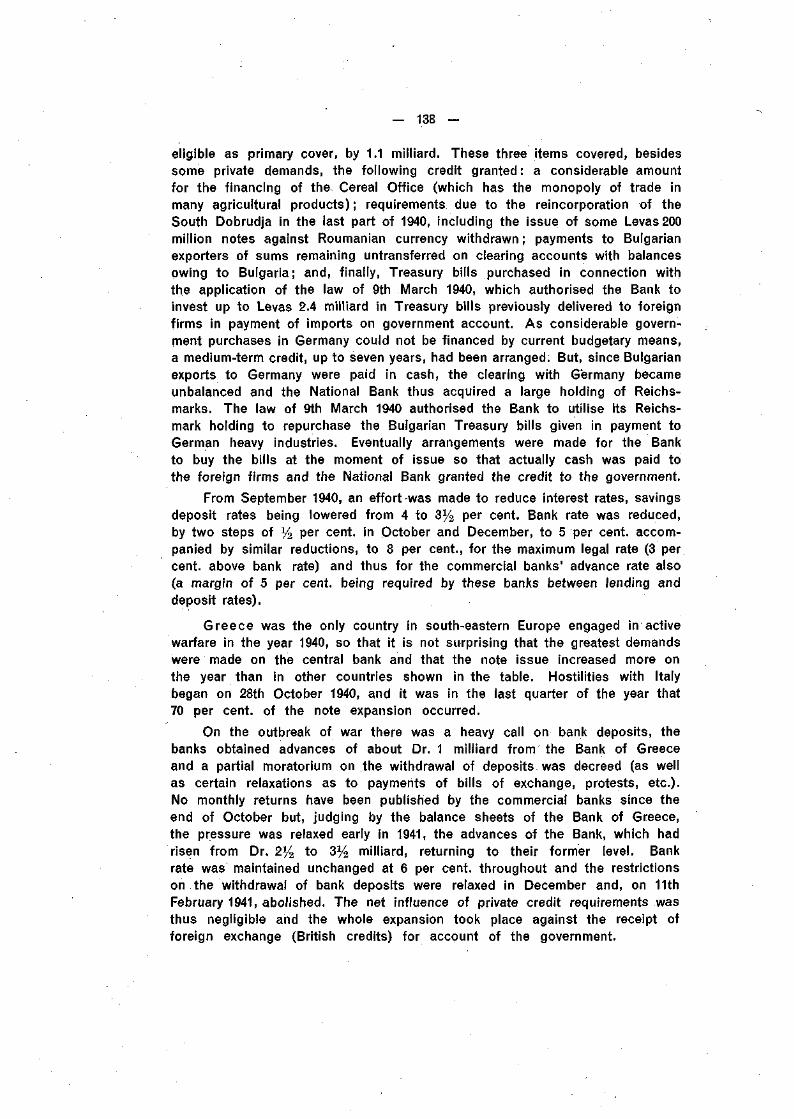
— 138 —
eligible as primary cover, by 1.1 milliard. These three items covered, besidessome private demands, the following credit granted : a considerable amountfor the financing of the Cereal Office (which has the monopoly of trade inmany agricultural products) ; requirements due to the reincorporation of theSouth Dobrudja in the last part of 1940, including the issue of some Levas 200million notes against Roumanian currency withdrawn; payments to Bulgarianexporters of sums remaining untransferred on clearing accounts with balancesowing to Bulgaria; and, finally, Treasury bills purchased in connection withthe application of the law of 9th March 1940, which authorised the Bank toinvest up to Levas 2.4 milliard in Treasury bills previously delivered to foreignfirms in payment of imports on government account. As considerable govern-ment purchases in Germany could not be financed by current budgetary means,a medium-term credit, up to seven years, had been arranged. But, since Bulgarianexports to Germany were paid in cash, the clearing with Germany becameunbalanced and the National Bank thus acquired a large holding of Reichs-marks. The law of 9th March 1940 authorised the Bank to utilise its Reichs-mark holding to repurchase the Bulgarian Treasury bills given in payment toGerman heavy industries. Eventually arrangements were made for the Bankto buy the bills at the moment of issue so that actually cash was paid tothe foreign firms and the National Bank granted the credit to the government.
From September 1940, an effort-was made to reduce interest rates, savingsdeposit rates being lowered from 4 to 3% per cent. Bank rate was reduced,by two steps of y2 per cent, in October and December, to 5 per cent, accom-panied by similar reductions, to 8 per cent., for the maximum legal rate (3 percent, above bank rate) and thus for the commercial banks' advance rate also(a margin of 5 per cent, being required by these banks between lending anddeposit rates).
Greece was the only country in south-eastern Europe engaged in activewarfare in the year 1940, so that it is not surprising that the greatest demandswere made on the central bank and that the note issue increased more onthe year than in other countries shown in the table. Hostilities with Italybegan on 28th October 1940, and it was in the last quarter of the year that70 per cent, of the note expansion occurred.
On the outbreak of war there was a heavy call on bank deposits, thebanks obtained advances of about Dr. 1 milliard from the Bank of Greeceand a partial moratorium on the withdrawal of deposits was decreed (as wellas certain relaxations as to payments of bills of exchange, protests, etc.).No monthly returns have been published by the commercial banks since theend of October but, judging by the balance sheets of the Bank of Greece,the pressure was relaxed early in 1941, the advances of the Bank, which hadrisen from Dr. 2% to 3% milliard, returning to their former level. Bankrate was maintained unchanged at 6 per cent, throughout and the restrictionson the withdrawal of bank deposits were relaxed in December and, on 11thFebruary 1941, abolished. The net influence of private credit requirements wasthus negligible and the whole expansion took place against the receipt offoreign exchange (British credits) for account of the government.
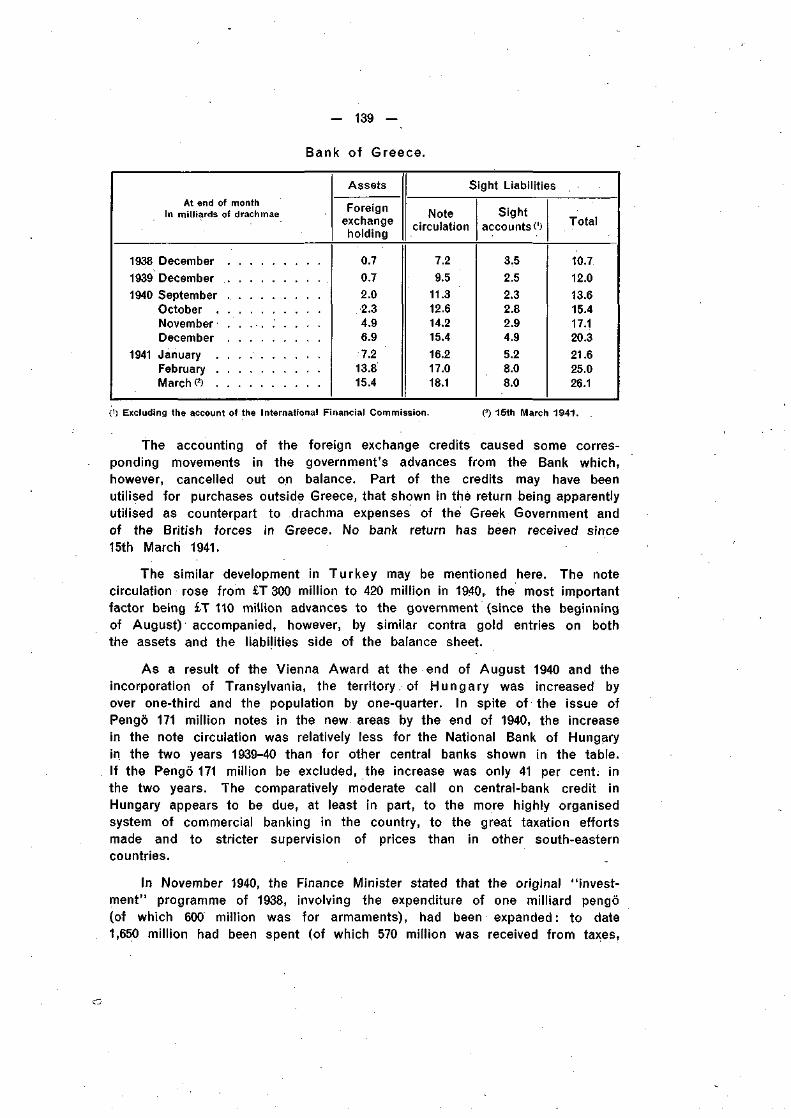
— 139 —
Bank of Greece.
At end of monthin milliards of drachmae
Assets
Foreignexchangeholding
Sight Liabilities
Notecirculation
Sightaccounts 0 Total
1938 December
1939 December
1940 SeptemberOctober .NovemberDecember
1941 January .February .March O .
0.7
0.7
2.02.34.96.97.2
13.815.4
7.29.5
11.312.614.215.416.217.018.1
3.52.52.32.82.94.95.28.08.0
10.712.013.615.417.120.321.625.026.1
(') Excluding the account of the International Financial Commission. (2) 15th March 1941.
The accounting of the foreign exchange credits caused some corres-ponding movements in the government's advances from the Bank which,however, cancelled out on balance. Part of the credits may have beenutilised for purchases outside Greece, that shown in the return being apparentlyutilised as counterpart to drachma expenses of the Greek Government andof the British forces in Greece. No bank return has been received since15th March 1941.
The similar development in Turkey may be mentioned here. The notecirculation rose from £T 300 million to 420 million in 1940, the most importantfactor being £T 110 million advances to the government (since the beginningof August) accompanied, however, by similar contra gold entries on boththe assets and the liabilities side of the balance sheet.
As a result of the Vienna Award at the end of August 1940 and theincorporation of Transylvania, the territory, of Hungary was increased byover one-third and the population by one-quarter. In spite of the issue ofPengö 171 million notes in the new areas by the end of 1940, the increasein the note circulation was relatively less for the National Bank of Hungaryin the two years 1939-40 than for other central banks shown in the table.If the Pengö 171 million be excluded, the increase was only 41 per cent, inthe two years. The comparatively moderate call on central-bank credit inHungary appears to be due, at least in part, to the more highly organisedsystem of commercial banking in the country, to the great taxation effortsmade and to stricter supervision of prices than in other south-easterncountries.
In November 1940, the Finance Minister stated that the original "invest-ment" programme of 1938, involving the expenditure of one milliard pengö(of which 600 million was for armaments), had been expanded: to date1,650 million had been spent (of which 570 million was received from taxes,
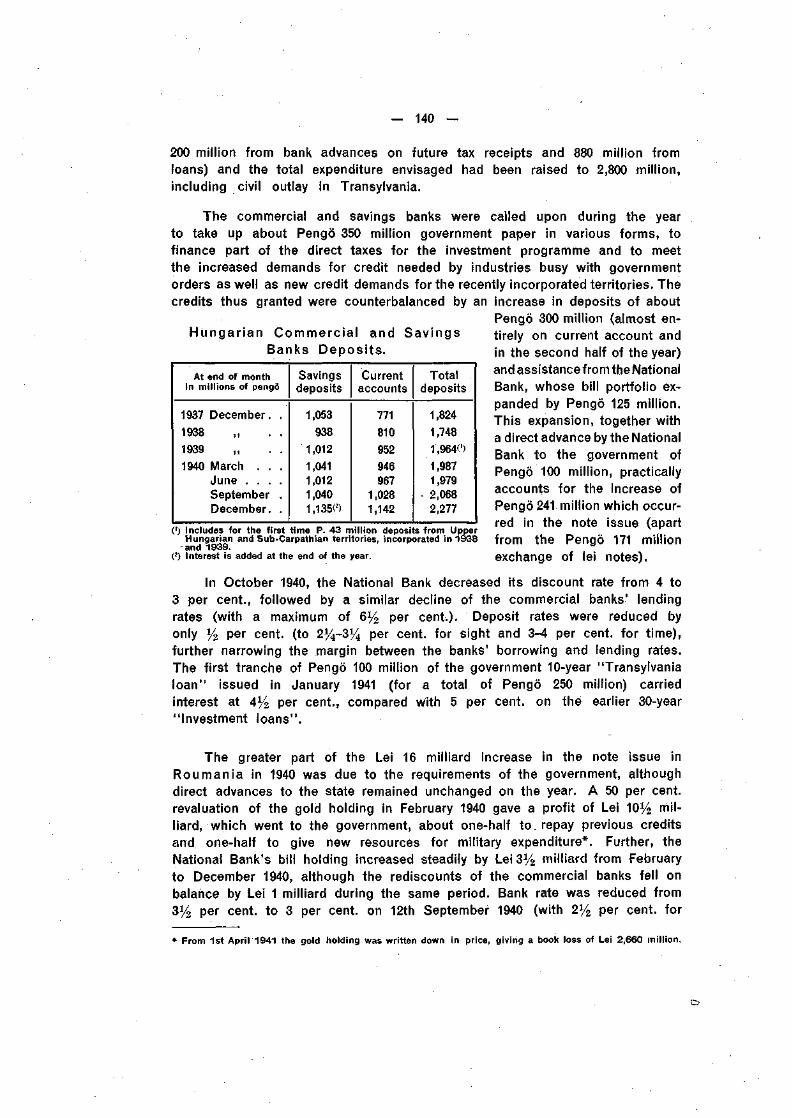
— 140 —
200 million from bank advances on future tax receipts and 880 million fromloans) and the total expenditure envisaged had been raised to 2,800 million,including civil outlay in Transylvania.
The commercial and savings banks were called upon during the yearto take up about Pengö 350 million government paper in various forms, tofinance part of the direct taxes for the investment programme and to meetthe increased demands for credit needed by industries busy with governmentorders as well as new credit demands for the recently incorporated territories. Thecredits thus granted were counterbalanced by an increase in deposits of about
Pengö 300 million (almost en-Hungarian Commercial and Savings tirely on current account and
Banks Deposi ts. in the second half of the year)and assistance from the NationalBank, whose bill portfolio ex-panded by Pengö 125 million.This expansion, together witha direct advance by the NationalBank to the government ofPengö 100 million, practicallyaccounts for the increase ofPengö 241 million which occur-red in the note issue (apartfrom the Pengö 171 millionexchange of lei notes).
At end of monthin millions of pengö
1937 December. .
1938
1939 „
1940 March . . .June . . . .September .December. .
Savingsdeposits
1,053
938
1,012
1,0411,0121,0401,135«
Currentaccounts
771
810
952
946967
1,0281,142
Totaldeposits
1,824
1,748
1,9640
1,9871,979
• 2,068
2,277
(') Includes for the first time P. 43 million deposits from UpperHungarian and Sub-Carpathian territories, incorporated in 1938and 1939.
(') Interest is added at the end of the year.
In October 1940, the National Bank decreased its discount rate from 4 to3 per cent., followed by a similar decline of the commercial banks' lendingrates (with a maximum of 6% per cent.). Deposit rates were reduced byonly y% per cent, (to 2%-3% per cent, for sight and 3-4 per cent, for time),further narrowing the margin between the banks' borrowing and lending rates.The first tranche of Pengö 100 million of the government 10-year "Transylvanialoan" issued in January 1941 (for a total of Pengö 250 million) carriedinterest at 4% per cent., compared with 5 per cent, on the earlier 30-year"Investment loans".
The greater part of the Lei 16 milliard increase in the note issue inRoumania in 1940 was due to the requirements of the government, althoughdirect advances to the state remained unchanged on the year. A 50 per cent,revaluation of the gold holding in February 1940 gave a profit of Lei 10% mil-liard, which went to the government, about one-half to. repay previous creditsand one-half to give new resources for military expenditure*. Further, theNational Bank's bill holding increased steadily by Lei 3% milliard from Februaryto December 1940, although the rediscounts of the commercial banks fell onbalance by Lei 1 milliard during the same period. Bank rate was reduced from3% per cent, to 3 per cent, on 12th September 1940 (with 2% per cent, for
* From 1st April 1941 the gold holding was written down in price, giving a book loss of Lei 2,660 million.
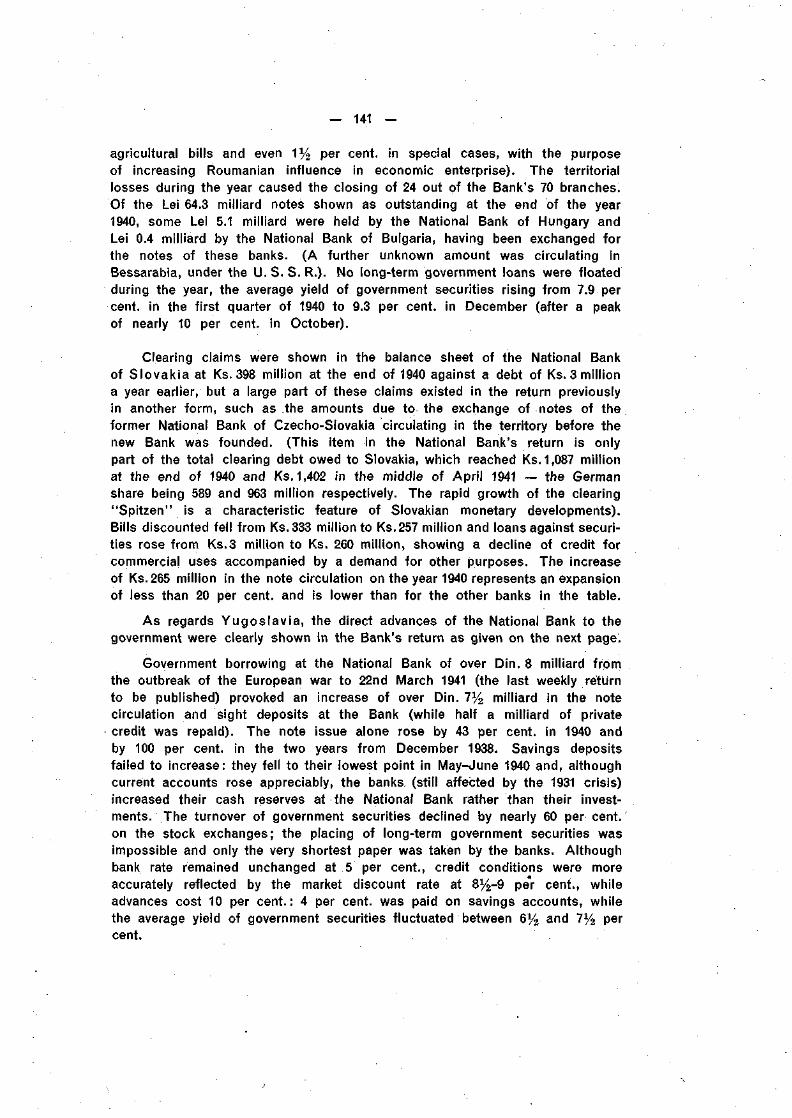
- 141 -
agricultural bills and even 1% per cent, in special cases, with the purposeof increasing Roumanian influence in economic enterprise). The territoriallosses during the year caused the closing of 24 out of the Bank's 70 branches.Of the Lei 64.3 milliard notes shown as outstanding at the end of the year1940, some Lei 5.1 milliard were held by the National Bank of Hungary andLei 0.4 milliard by the National Bank of Bulgaria, having been exchanged forthe notes of these banks. (A further unknown amount was circulating inBessarabia, under the U.S.S. R.). No long-term government loans were floatedduring the year, the average yield of government securities rising from 7.9 percent, in the first quarter of 1940 to 9.3 per cent, in December (after a peakof nearly 10 per cent, in October).
Clearing claims were shown in the balance sheet of the National Bankof Slovakia at Ks. 398 million at the end of 1940 against a debt of Ks. 3 milliona year earlier, but a large part of these claims existed in the return previouslyin another form, such as the amounts due to the exchange of notes of theformer National Bank of Czecho-Slovakia circulating in the territory before thenew Bank was founded. (This item in the National Bank's return is onlypart of the total clearing debt owed to Slovakia, which reached Ks. 1,087 millionat the end of 1940 and Ks. 1,402 in the middle of April 1941 — the Germanshare being 589 and 963 million respectively. The rapid growth of the clearing"Spitzen" is a characteristic feature of Slovakian monetary developments).Bills discounted fell from Ks.333 million to Ks.257 million and loans against securi-ties rose from Ks.3 million to Ks. 260 million, showing a decline of credit forcommercial uses accompanied by a demand for other purposes. The increaseof Ks.265 million in the note circulation on the year 1940 represents an expansionof less than 20 per cent, and is lower than for the other banks in the table.
As regards Yugoslavia, the direct advances of the National Bank to thegovernment were clearly shown in the Bank's return as given on the next page.
Government borrowing at the National Bank of over Din. 8 milliard fromthe outbreak of the European war to 22nd March 1941 (the last weekly returnto be published) provoked an increase of over Din. 7% milliard in the notecirculation and sight deposits at the Bank (while half a milliard of privatecredit was repaid). The note issue alone rose by 43 per cent, in 1940 andby 100 per cent, in the two years from December 1938. Savings depositsfailed to increase: they fell to their lowest point in May-June 1940 and, althoughcurrent accounts rose appreciably, the banks (still affected by the 1931 crisis)increased their cash reserves at the National Bank rather than their invest-ments. The turnover of government securities declined by nearly 60 per cent,on the stock exchanges; the placing of long-term government securities wasimpossible and only the very shortest paper was taken by the banks. Althoughbank rate remained unchanged at 5 per cent., credit conditions were moreaccurately reflected by the market discount rate at 8 y r 9 per cent., whileadvances cost 10 per cent.: 4 per cent, was paid on savings accounts, whilethe average yield of government securities fluctuated between 6% and 7% percent.
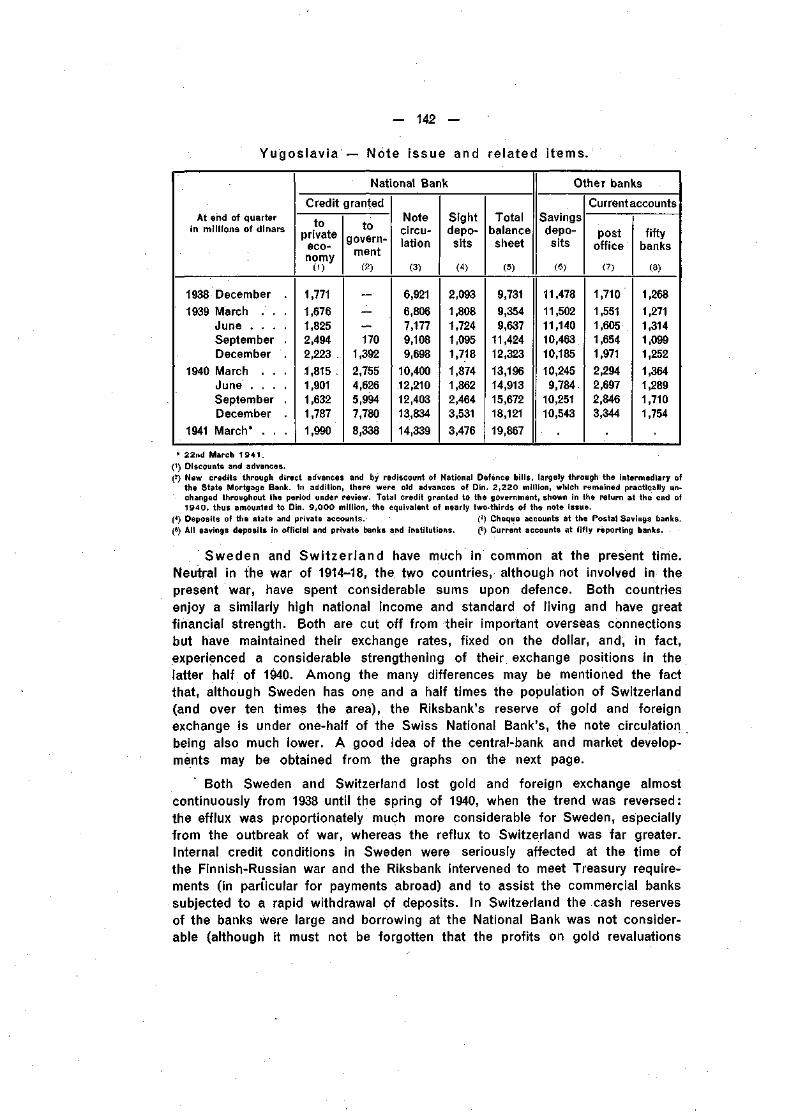
— 142 —
Yugoslavia — Note issue and related i tems.
At end of quarterin millions of dinars
1938 December .
1939 March .'• . .
June . . . .
September .
December .
1940 March . . .
June . . . .
September .
December .
1941 March* . . .
National Bank
Credit granted
toprivate
eco-nomy
(')
1,771
1,676
1,825
2,494
2,223
1,815 .
1,901
1,632
1,787
1,990
togovern-
ment
(2)
170
1,392
2,755
4,626
5,994
7,780
8,338
Notecircu-lation
(3)
6,921
6,806
7,177
9,108
9,698
10,400
12,210
12,403
13,834
14,339
Sightdepo-
sits
(4)
2,093
1,808
1,724
1,095
1,718
1,874
1,862
2,464
3,531
3,476
Totalbalancesheet
(5)
9,731
9,354
9,637
11,424
12,323
13,196
14,913
15,672
18,121
19,867
Other banks
Savingsdepo-
sits
(6)
11,478
11,502
11,140
10,463
10,185
10,245
9,784
10,251
10,543
Current accounts
postoffice
(?)
1,710
1,551
1,605
1,654
1,971
2,294
2,697
2,846
3,344
fiftybanks
(8)
1,268
1,271
1,314
1,099
1,252
1,364
1,289
1,710
1,754
* 22nd March 1941.(!) Discounts and advances.(2) New credits through direct advances and by rediscount of National Defence bills, largely through the intermediary of
the State Mortgage Bank. In addition, there were old advances of Din. 2,220 miflion, which remained practically un-changed throughout the period under review. Total credit granted to the government, shown in the return at the end of1940, thus amounted to Din. 9,000 million, the equivalent of nearly two-thirds of the note issue.
(4) Deposits of the state and private accounts. (7) Cheque accounts at the Postal Savings banks.(6) All savings deposits in official and private banks and institutions. (8) Current accounts at fifty reporting banks.
Sweden and Switzer land have much in common at the present time.Neutral in the war of 1914-18, the two countries, although not involved in thepresent war, have spent considerable sums upon defence. Both countriesenjoy a similarly high national income and standard of living and have greatfinancial strength. Both are cut off from their important overseas connectionsbut have maintained their exchange rates, fixed on the dollar, and, in fact,experienced a considerable strengthening of their exchange positions in thelatter half of 1940. Among the many differences may be mentioned the factthat, although Sweden has one and a half times the population of Switzerland(and over ten times the area), the Riksbank's reserve of gold and foreignexchange is under one-half of the Swiss National Bank's, the note circulationbeing also much lower. A good idea of the central-bank and market develop-ments may be obtained from the graphs on the next page.
Both Sweden arid Switzerland lost gold and foreign exchange almostcontinuously from 1938 until the spring of 1940, when the trend was reversed:the efflux was proportionately much more considerable for Sweden, especiallyfrom the outbreak of war, whereas the reflux to Switzerland was far greater.Internal credit conditions in Sweden were seriously affected at the time ofthe Finnish-Russian war and the Riksbank intervened to meet Treasury require-ments (in particular for payments abroad) and to assist the commercial bankssubjected to a rapid withdrawal of deposits. In Switzerland the cash reservesof the banks were large and borrowing at the National Bank was not consider-able (although it must not be forgotten that the profits on gold revaluations
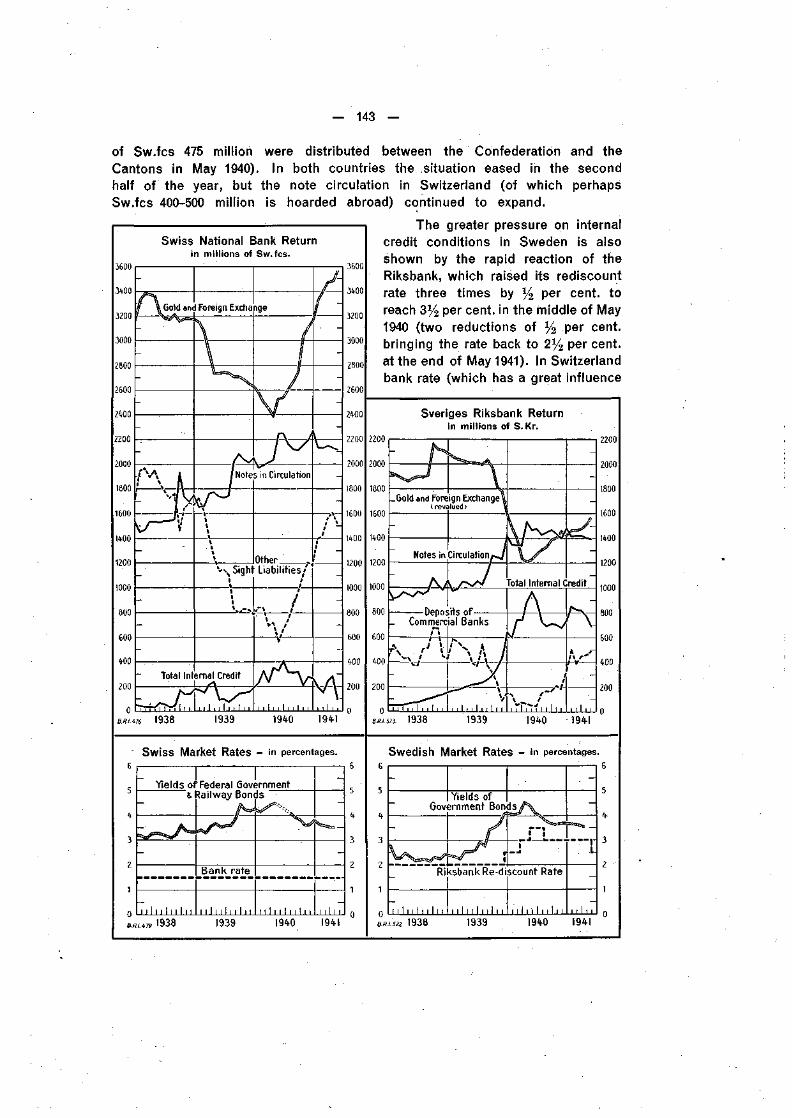
— 143 —
Swiss National Bank Returnin millions of Sw.fcs.
of Sw.fcs 475 million were distributed between the Confederation and theCantons in May 1940). In both countries the situation eased in the secondhalf of the year, but the note circulation in Switzerland (of which perhapsSw.fcs 400-500 million is hoarded abroad) continued to expand.
The greater pressure on internalcredit conditions in Sweden is alsoshown by the rapid reaction of theRiksbank, which raised its rediscountrate three times by % Per cent, toreach 3% per cent, in the middle of May1940 (two reductions of l/2 per cent,bringing the rate back to 2% per cent,at the end of May 1941). In Switzerlandbank rate (which has a great influence
3600
3400
3200
3000
2800
3600
3400
Sveriges Riksbank Returnin millions of S.Kr.
2200
_6oldand Foreign Exchange«(revalued) 1
1938 1939 1940 1941
Swiss Market Rates - in percentages. Swedish Market Rates - in percentages.
Yields of Federal Government«.Railway Bonds
11 I 11 I I 11 11 I I I 1 I 111 11 11 111 I I 11 I I I I I«.,.•». 1938 1939 1940 1941
-
~ Gov
-
Ri
! 1 1 1 1 1 I 1 1 1 1
Yields ofernment Bon
/
csbankRe-di
11111111 ! 11
Js/\
1
scount Rate
i i 1 ri 1 i i 1 i i
. -
-
-
I t i l i
s». 1938 1939 1940 1941
— 144 —
on mortgage rates in the country) remained unchanged throughout the periodat the very low level of 1% per cent. The margin between short-term andlong-term rates was much narrower in Sweden than in Switzerland: the yieldon government securities, which in Sweden was barely over 2 per cent, untilthe spring of 1939, had risen to 4% per cent, in April 1940; in Switzerlandthe rise in the yield was more moderate, from something over 3 per cent,to 4% per cent, on 10th May 1940, when the stock exchanges were temporarilyclosed. In both cases the yields of long-term government securities fell below4 per cent, before the end of the year.
Changing conditions on the money and capital markets naturally influencedthe governments' borrowing policy to cover defence expenditure. In Sweden,where defence expenditure runs at about S.Kr. 1,800 million per annum, ofwhich over one-half is to be covered by borrowing, issues of governmentbonds brought in S.Kr. 1,000 million during the year 1940, the most importantbeing the 4 per cent. 5-year Defence bonds, of which S.Kr. 800 million wereissued, while S.Kr. 340 million new Treasury bills were placed, largely withthe banks. In Switzerland, where preparations for defence were started in theyears before the war, current expenditure on defence works and mobilisationis at the yearly rate of nearly Sw.fcs 1,000 million, mostly met by loans: duringthe year Sw.fcs 350 million was obtained from 10-year bond issues (225 millionat 3%-4 per cent, in March and 125 million at 3% Per c e n t - m November 1940),Sw.fcs 290 million from two issues of 3 to 4-year Treasury bills at Pls-WA percent., Sw.fçs 112 million from 3.6 per cent, tax certificates (to anticipate receiptsfrom the national defence "sacrifice" levy), while Sw.fcs 250 million from theprofits on the revaluation of the National Bank's gold holding in May 1940were applied towards the amortisation of military expenditure.
As a contrast to these two countries (Switzerland and Sweden) may bementioned Finland and Spain, both in the process of reconstruction in 1940 aftera period of hostilities. A state of war existed between Finland and the U.S.S.R.from 30th November 1939 to 13th March 1940. Although it lasted only 3y2 months,material losses, due to hostilities and to the terms of the Moscow peacetreaty, were estimated at some 20 per cent, of Finland's national wealth. Thelosses could be divided into three main classes:
a) costs of mobilisation and carrying on the war,
b) material damage due to actual hostilities and
c) loss of property in the territory ceded under the terms of the peacetreaty.
The meeting of the charges occasioned by damage and loss under b)and c) was to be effected by insurance and the issue of bonds in com-pensation. But as payments under the insurance scheme were to begin onlyin January 1941 and under the Indemnity Act in the following spring, thedevelopment of the financial situation in 1940 can be traced almost solely tothe direct expenses of carrying on the war and of caring for refugees fromthe ceded territories.
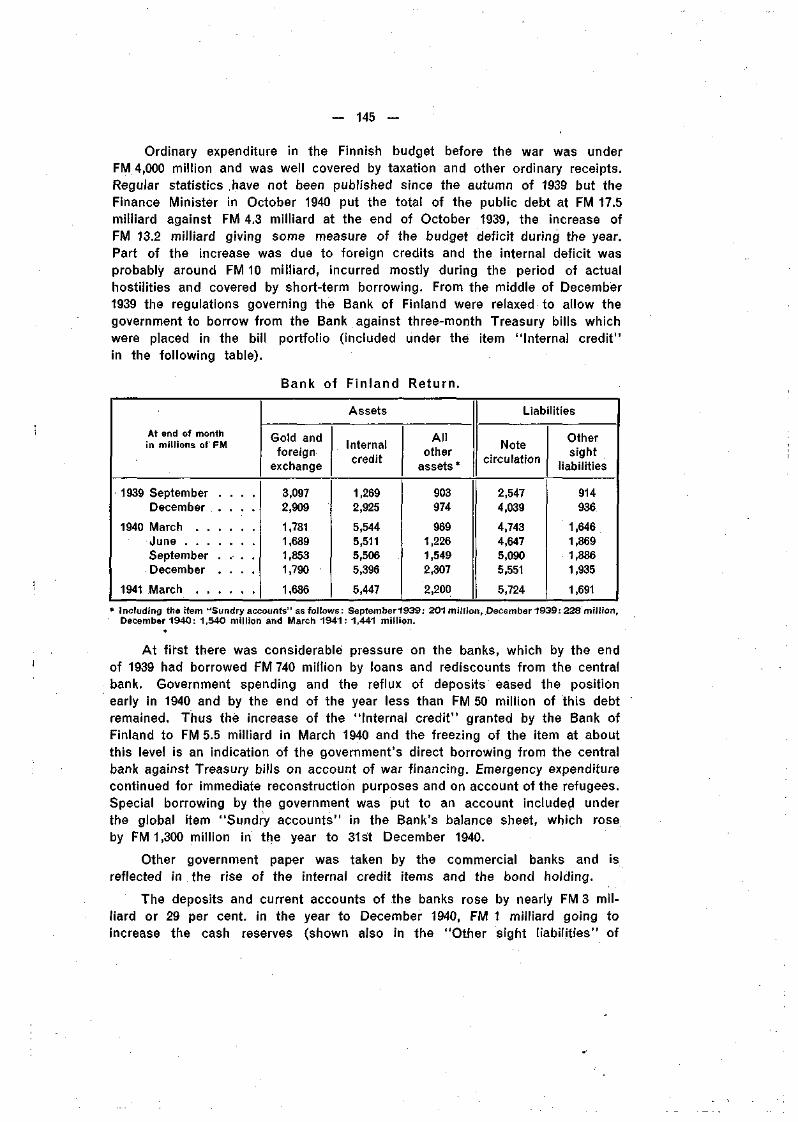
— 145 —
Ordinary expenditure in the Finnish budget before the war was underFM 4,000 million and was well covered by taxation and other ordinary receipts.Regular statistics have not been published since the autumn of 1939 but theFinance Minister in October 1940 put the total of the public debt at FM 17.5milliard against FM 4.3 milliard at the end of October 1939, the increase ofFM 13.2 milliard giving some measure of the budget deficit during the year.Part of the increase was due to foreign credits and the internal deficit wasprobably around FM 10 milliard, incurred mostly during the period of actualhostilities and covered by short-term borrowing. From the middle of December1939 the regulations governing the Bank of Finland were relaxed to allow thegovernment to borrow from the Bank against three-month Treasury bills whichwere placed in the bill portfolio (included under the item "Internal credit"in the following table).
Bank of Finland Return.
At end of monthin millions of FM
1939 September . . . .December . . . .
1940 MarchJuneSeptember . . . .December . . . .
1941 March
Assets
Gold andforeign
exchange
3,0972,909
1,7811,6891,8531,790
1,686
Internalcredit
1,2692,925
5,5445,5115,5065,396
5,447
Al lother
assets *
903974
9691,2261,5492,307
2,200
Liabilities
Notecirculation
2,5474,039
4,7434,6475,0905,551
5,724
Othersight
liabilities
914936
1,6461,8691,8861,935
1,691
• Including the item "Sundry accounts" as follows: September1939: 201 million, December 1939: 228 million,December 1940: 1,540 million and March 1941: 1,441 million.
At first there was considerable pressure on the banks, which by the endof 1939 had borrowed FM 740 million by loans and rediscounts from the centralbank. Government spending and the reflux of deposits eased the positionearly in 1940 and by the end of the year less than FM 50 million of this debtremained. Thus the increase of the "Internal credit" granted by the Bank ofFinland to FM 5.5 milliard in March 1940 and the freezing of the item at aboutthis level is an indication of the government's direct borrowing from the centralbank against Treasury bills on account of war financing. Emergency expenditurecontinued for immediate reconstruction purposes and on account of the refugees.Special borrowing by the government was put to an account included underthe global item "Sundry accounts" in the Bank's balance sheet, which roseby FM 1,300 million in the year to 31st December 1940.
Other government paper was taken by the commercial banks and isreflected in the rise of the internal credit items and the bond holding.
The deposits and current accounts of the banks rose by nearly FM 3 mil-liard or 29 per cent, in the year to December 1940, FM 1 milliard going toincrease the cash reserves (shown also in the "Other sight liabilities" of
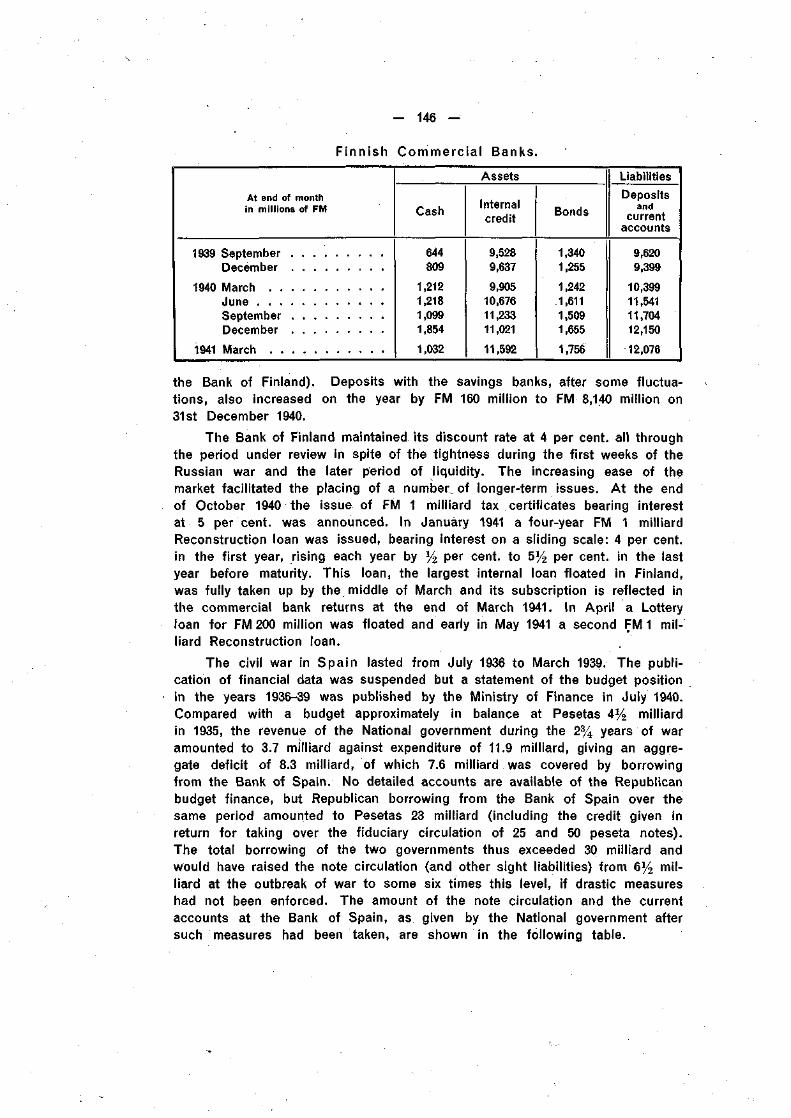
- 146 -
Finnish Commercial Banks.
At end of monthin millions of FM
Assets
Cash Internalcredit Bonds
Liabilities
Depositsand
currentaccounts
1939 SeptemberDecember
1940 March . .June . . .SeptemberDecember
1941 March . .
644809
1,2121,2181,0991,854
1,032
9,5289,637
9,90510,67611,23311,021
11,592
1,3401,255
1,2421,6111,5091,655
1,756
9,6209,399
10,39911,54111,70412,150
12,076
the Bank of Finland). Deposits with the savings banks, after some fluctua-tions, also increased on the year by FM 160 million to FM 8,140 million on31st December 1940.
The Bank of Finland maintained its discount rate at 4 per cent, all throughthe period under review in spite of the tightness during the first weeks of theRussian war and the later period of liquidity. The increasing ease of themarket facilitated the placing of a number, of longer-term issues. At the endof October 1940 the issue of FM 1 milliard tax certificates bearing interestat 5 per cent, was announced. In January 1941 a four-year FM 1 milliardReconstruction loan was issued, bearing interest on a sliding scale: 4 per cent,in the first year, rising each year by % per cent, to 5% per cent, in the lastyear before maturity. This loan, the largest internal loan floated in Finland,was fully taken up by the middle of March and its subscription is reflected inthe commercial bank returns at the end of March 1941. In April a Lotteryloan for FM 200 million was floated and early in May 1941 a second FM 1 mil-liard Reconstruction loan.
The civil war in Spain lasted from July 1936 to March 1939. The publi-cation of financial data was suspended but a statement of the budget positionin the years 1936-39 was published by the Ministry of Finance in July 1940.Compared with a budget approximately in balance at Pesetas 4% milliardin 1935, the revenue of the National government during the 2% years of waramounted to 3.7 milliard against expenditure of 11.9 milliard, giving an aggre-gate deficit of 8.3 milliard, of which 7.6 milliard was covered by borrowingfrom the Bank of Spain. No detailed accounts are available of the Republicanbudget finance, but Republican borrowing from the Bank of Spain over thesame period amounted to Pesetas 23 milliard (including the credit given inreturn for taking over the fiduciary circulation of 25 and 50 peseta notes).The total borrowing of the two governments thus exceeded 30 milliard andwould have raised the note circulation (and other sight liabilities) from 6% mil-liard at the outbreak of war to some six times this level, if drastic measureshad not been enforced. The amount of the note circulation and the currentaccounts at the Bank of Spain, as given by the National government aftersuch measures had been taken, are shown in the following table.
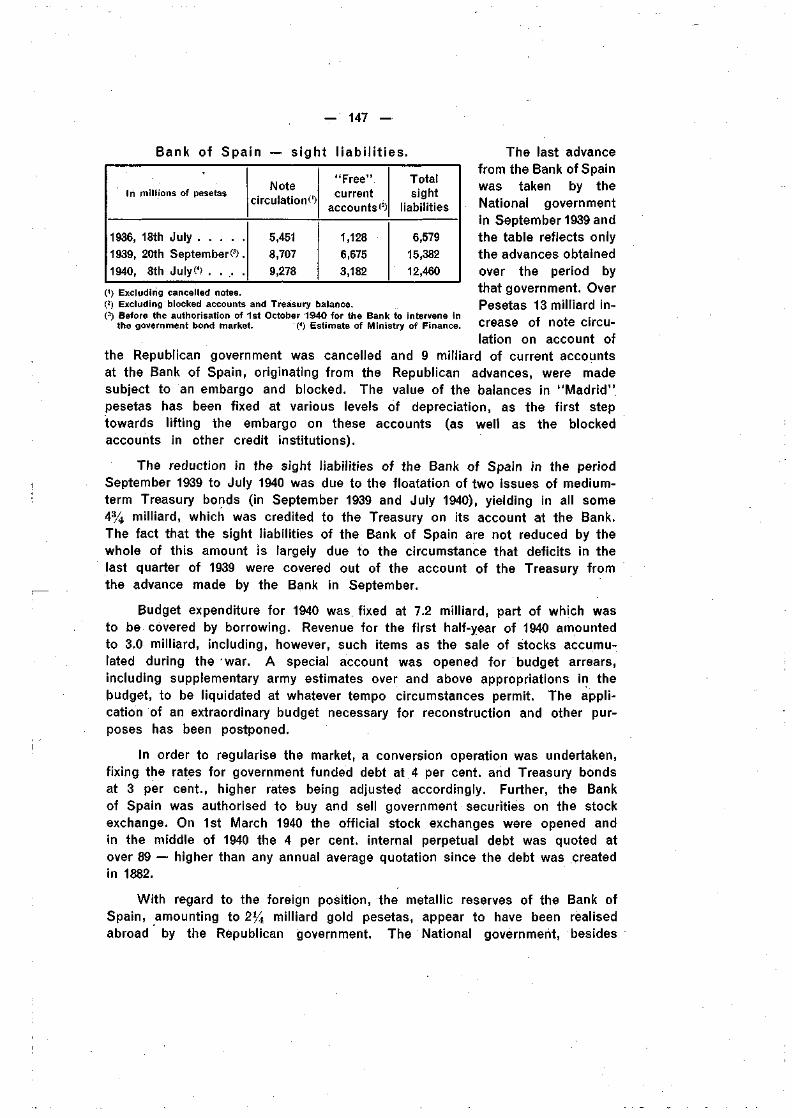
— 147 —
Ih millions of pesetas
1936, 18th July1939, 20th September« .1940, 8th July« . . .. .
Notecirculation«
5,4518,7079,278
"Free"current
accounts«
1,1286,6753,182
Totalsight
liabilities
6,57915,38212,460
(') Excluding cancelled notes.(!) Excluding blocked accounts and Treasury balance.(3) Before the authorisation of 1st October 1940 for the Bank to intervene in
the government bond market. (4) Estimate of Ministry of Finance.
Bank of Spain — sight l iab i l i t ies . The last advancefrom the Bank of Spainwas taken by theNational governmentin September 1939 andthe table reflects onlythe advances obtainedover the period bythat government. OverPesetas 13 milliard in-crease of note circu-lation on account of
the Republican government was cancelled and 9 milliard of current accountsat the Bank of Spain, originating from the Republican advances, were madesubject to an embargo and blocked. The value of the balances in "Madrid"pesetas has been fixed at various levels of depreciation, as the first steptowards lifting the embargo on these accounts (as well as the blockedaccounts in other credit institutions).
The reduction in the sight liabilities of the Bank of Spain in the periodSeptember 1939 to July 1940 was due to the floatation of two issues of medium-term Treasury bonds (in September 1939 and July 1940), yielding in all some4% milliard, which was credited to the Treasury on its account at the Bank.The fact that the sight liabilities of the Bank of Spain are not reduced by thewhole of this amount is largely due to the circumstance that deficits in thelast quarter of 1939 were covered out of the account of the Treasury fromthe advance made by the Bank in September.
Budget expenditure for 1940 was fixed at 7.2 milliard, part of which wasto be covered by borrowing. Revenue for the first half-year of 1940 amountedto 3.0 milliard, including, however, such items as the sale of stocks accumu-lated during the fwar. A special account was opened for budget arrears,including supplementary army estimates over and above appropriations in thebudget, to be liquidated at whatever tempo circumstances permit. The appli-cation of an extraordinary budget necessary for reconstruction and other pur-poses has been postponed.
In order to regularise the market, a conversion operation was undertaken,fixing the rates for government funded debt at 4 per cent, and Treasury bondsat 3 per cent., higher rates being adjusted accordingly. Further, the Bankof Spain was authorised to buy and sell government securities on the stockexchange. On 1st March 1940 the official stock exchanges were opened andin the middle of 1940 the 4 per cent, internal perpetual debt was quoted atover 89 — higher than any annual average quotation since the debt was createdin 1882.
With regard to the foreign position, the metallic reserves of the Bank ofSpain, amounting to 2% milliard gold pesetas, appear to have been realisedabroad by the Republican government. The National government, besides
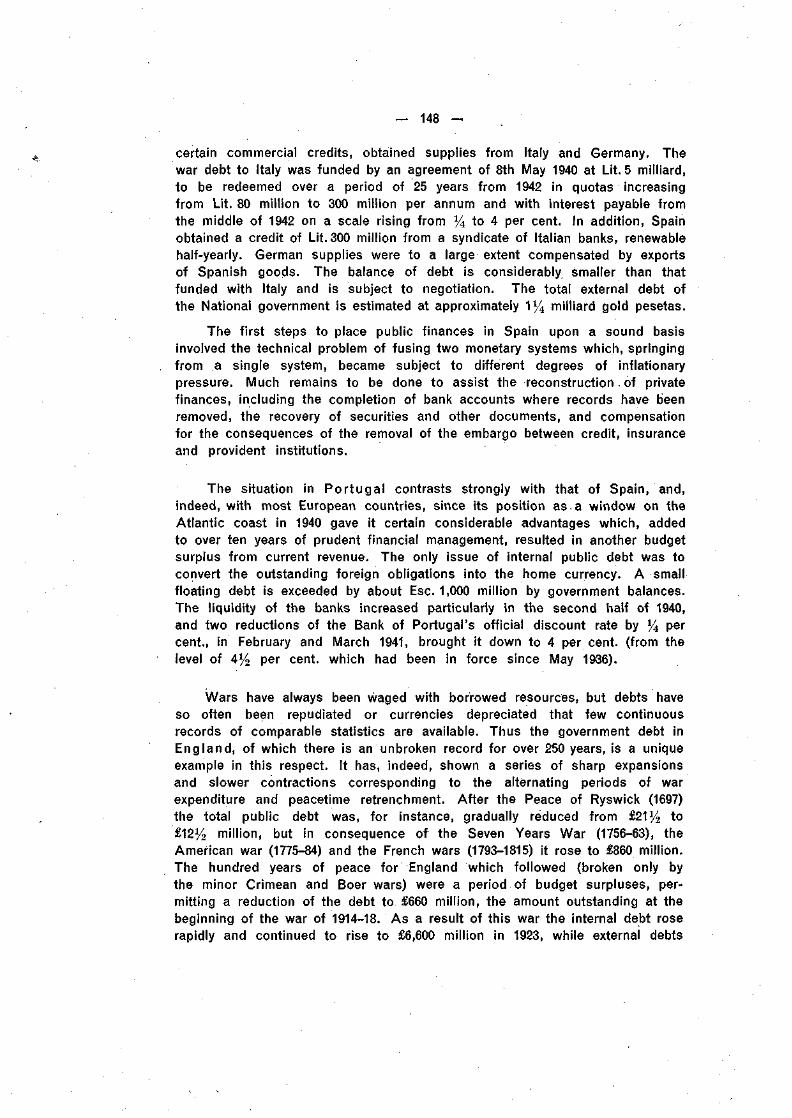
— 148 —
certain commercial credits, obtained supplies from Italy and Germany. Thewar debt to Italy was funded by an agreement of 8th May 1940 at Lit. 5 milliard,to be redeemed over a period of 25 years from 1942 in quotas increasingfrom Lit. 80 million to 300 million per annum and with interest payable fromthe middle of 1942 on a scale rising from % to 4 per cent. In addition, Spainobtained a credit of Lit. 300 million from a syndicate of Italian banks, renewablehalf-yearly. German supplies were to a large extent compensated by exportsof Spanish goods. The balance of debt is considerably, smaller than thatfunded with Italy and is subject to negotiation. The total external debt ofthe National government is estimated at approximately 1 % milliard gold pesetas.
The first steps to place public finances in Spain upon a sound basisinvolved the technical problem of fusing two monetary systems which, springingfrom a single system, became subject to different degrees of inflationarypressure. Much remains to be done to assist the reconstruction . of privatefinances, including the completion of bank accounts where records have beenremoved, the recovery of securities and other documents, and compensationfor the consequences of the removal of the embargo between credit, insuranceand provident institutions.
The situation in Portugal contrasts strongly with that of Spain, and,indeed, with most European countries, since its position as a window on theAtlantic coast in 1940 gave it certain considerable advantages which, addedto over ten years of prudent financial management, resulted in another budgetsurplus from current revenue. The only issue of internal public debt was toconvert the outstanding foreign obligations into the home currency. A smallfloating debt is exceeded by about Esc. 1,000 million by government balances.The liquidity of the banks increased particularly in the second half of 1940,and two reductions of the Bank of Portugal's official discount rate by % Per
cent., in February and March 1941, brought it down to 4 per cent, (from thelevel of 4% per cent, which had been in force since May 1936).
Wars have always been waged with borrowed resources, but debts haveso often been repudiated or currencies depreciated that few continuousrecords of comparable statistics are available. Thus the government debt inEngland, of which there is an unbroken record for over 250 years, is a uniqueexample in this respect. It has, indeed, shown a series of sharp expansionsand slower contractions corresponding to the alternating periods of warexpenditure and peacetime retrenchment. After the Peace of Ryswick (1697)the total public debt was, for instance, gradually reduced from £21% to£12% million, but in consequence of the Seven Years War (1756-63), theAmerican war (1775-84) and the French wars (1793-1815) it rose to £860 million.The hundred years of peace for England which followed (broken only bythe minor Crimean and Boer wars) were a period of budget surpluses, per-mitting a reduction of the debt to £660 million, the amount outstanding at thebeginning of the war of 1914-18. As a result of this war the internal debt roserapidly and continued to rise to £6,600 million in 1923, while external debts
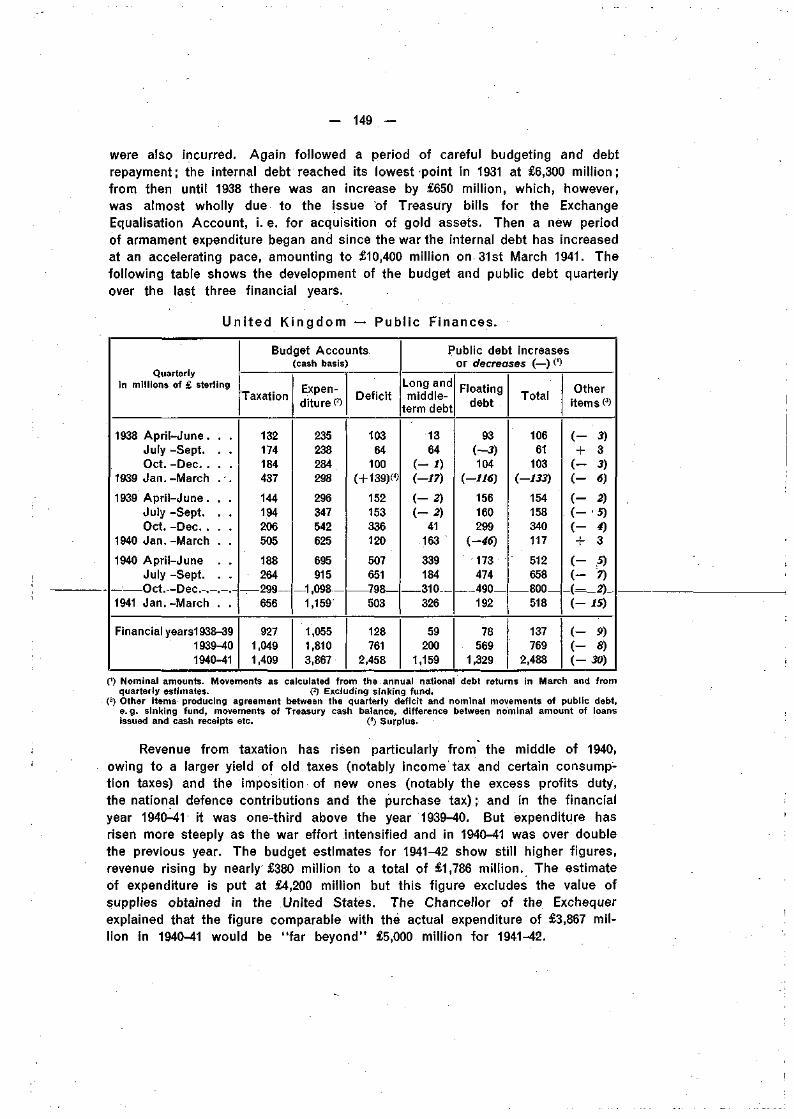
— 149
were also incurred. Again followed a period of careful budgeting and debtrepayment; the internal debt reached its lowest-point in 1931 at £6,300 million;from then until 1938 there was an increase by £650 million, which, however,was almost wholly due to the issue of Treasury bills for the ExchangeEqualisation Account, i. e. for acquisition of gold assets. Then a new periodof armament expenditure began and since the war the internal debt has increasedat an accelerating pace, amounting to £10,400 million on 31st March 1941. Thefollowing table shows the development of the budget and public debt quarterlyover the last three financial years.
Un
in millions of £ sterling
1938 April-June. . ,July -Sept. . .Oct. -Dec. . . .
1939 Jan. -March . .
1939 April-June . . .July -Sept. . .Oct. -Dec. . . .
1940 Jan. -March . .
1940 April-June . .July -Sept. . .Oct Dec. .
1941 Jan.-March . .
Financial years1938-391939-401940-41
i ted K n gdom — Publ ic Finances.
Budget Accounts
Taxation
132174184437
144194206505
188264299656
9271,0491,409
(cash basis
Expen-diture«
235238284298
296347542625
695915
1,0981,159
1,0551,8103,867
Deficit
10364
100(+139)(4)
152153336120
507651798503
128761
2,458
Public debt increases
Long andmiddle-
term debt
1364
(-•0(-17)
(-2)(-2)
41163
339184310326
59200
1,159
or decreases (—) 0)
Floatingdebt
93(-3)104
(-116)
156160299
(-46)
173474490192
78569
1,329
Total
10661
103(-133)
154158340117
512658R00518
137769
2,488
Otheritems (3)
( - 3)
+ 3( - 3)( - 6)
( - 2 )( - •5)( - 4)+ 3
( - 5)( - 7)(— 2)(-/5)
(- 9)( - s)(-30)
(') Nominal amounts. Movements as calculated from tha annual national debt returns in March and fromquarterly estimates. (2) Excluding sinking fund.
(5) Other items producing agreement between the quarterly deficit and nominal movements of public debt,e. g. sinking fund, movements of Treasury cash balance, difference between nominal amount of loansissued and cash receipts etc. (4) Surplus.
Revenue from taxation has risen particularly from the middle of 1940,owing to a larger yield of old taxes (notably income tax and certain consump-tion taxes) and the imposition of new ones (notably the excess profits duty,the national defence contributions and the purchase tax) ; and in the financialyear 1940^41 it was one-third above the year 1939-40. But expenditure hasrisen more steeply as the war effort intensified and in 1940-41 was over doublethe previous year. The budget estimates for 1941-42 show still higher figures,revenue rising by nearly £380 million to a total of £1,786 million. The estimateof expenditure is put at £4,200 million but this figure excludes the value ofsupplies obtained in the United States. The Chancellor of the Exchequerexplained that the figure comparable with the actual expenditure of £3,867 mil-lion in 1940-41 would be "far beyond" £5,000 million for 1941-42.
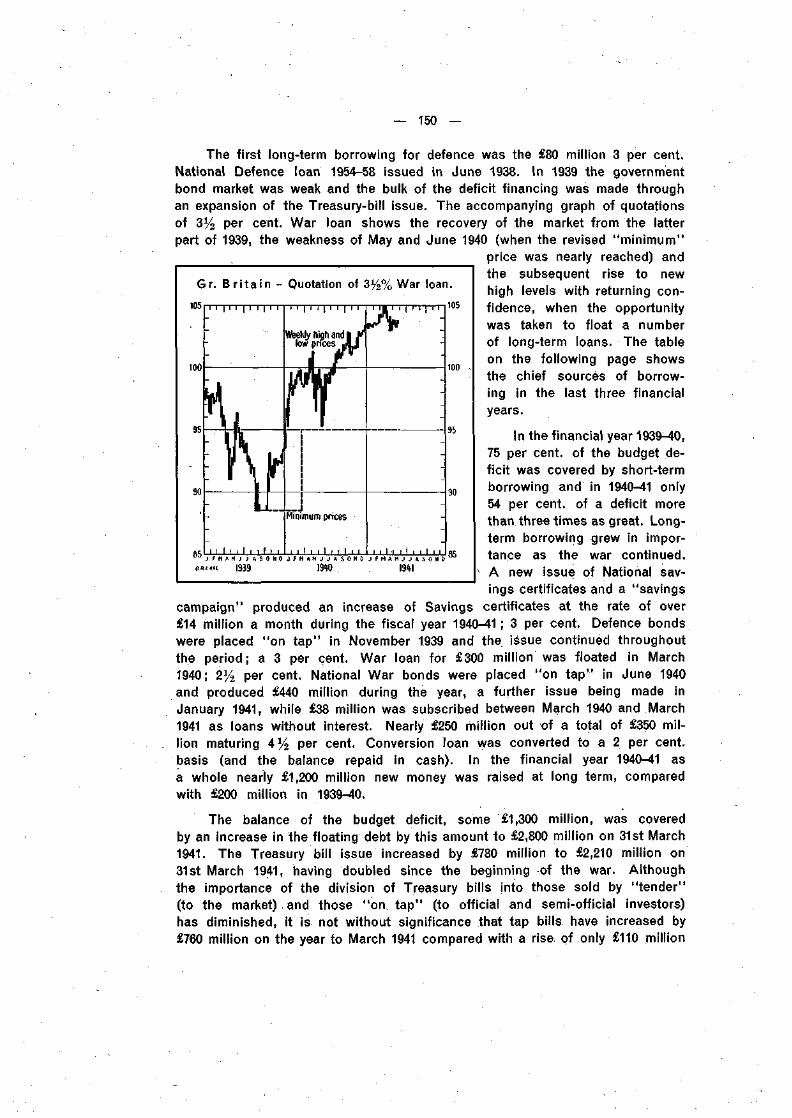
150 —
The first long-term borrowing for defence was the £80 million 3 per cent.National Defence loan 1954-58 issued in June 1938. In 1939 the governmentbond market was weak and the bulk of the deficit financing was made throughan expansion of the Treasury-bill issue. The accompanying graph of quotationsof 3% per cent. War loan shows the recovery of the market from the latterpart of 1939, the weakness of May and June 1940 (when the revised "minimum"
price was nearly reached) andthe subsequent rise to newhigh levels with returning con-fidence, when the opportunitywas taken to float a numberof long-term loans. The tableon the following page showsthe chief sources of borrow-ing in the last three financialyears.
Gr. Br i ta in - Quotation of 3%% War loan.
95
90
limmum prices
' I ' ' I ' '
»el I i I I i I i i I i i I i i I i i 1 i i I i i I i i I -i i I i i I iU J J F M A M J J A S O N 0 J F H A M J J A S O N 0 J F M A M J J A S O«»'«i 1939 M0 1941
105
100
90
campaign'
In the financial year 1939-40,75 per cent, of the budget de-ficit was covered by short-termborrowing and in 1940-41 only54 per cent, of a deficit morethan three times as great. Long-term borrowing grew in impor-tance as the war continued.A new issue of National sav-ings certificates and a "savings
produced an increase of Savings certificates at the rate of over£14 million a month during the fiscal year 1940-41; 3 per cent. Defence bondswere placed "on tap" in November 1939 and the issue continued throughoutthe period; a 3 per cent. War loan for £300 million was floated in March1940; 2% per cent. National War bonds were placed "on tap" in June 1940and produced £440 million during the year, a further issue being made inJanuary 1941, while £38 million was subscribed between March 1940 and March1941 as loans without interest. Nearly £250 million out of a total of £350 mil-lion maturing 4% per cent. Conversion loan was converted to a 2 per cent,basis (and the balance repaid in cash). In the financial year 1940-41 asa whole nearly £1,200 million new money was raised at long term, comparedwith £200 million in 1939-40.
The balance of the budget deficit, some £1,300 million, was coveredby an increase in the floating debt by this amount to £2,800 million on 31st March1941. The Treasury bill issue increased by £780 million to £2,210 million on31st March 1941, having doubled since the beginning of the war. Althoughthe importance of the division of Treasury bills into those sold by "tender"(to the market) and those "on tap" (to official and semi-official investors)has diminished, it is not without significance that tap bills have increased by£760 million on the year to March 1941 compared with a rise of only £110 million
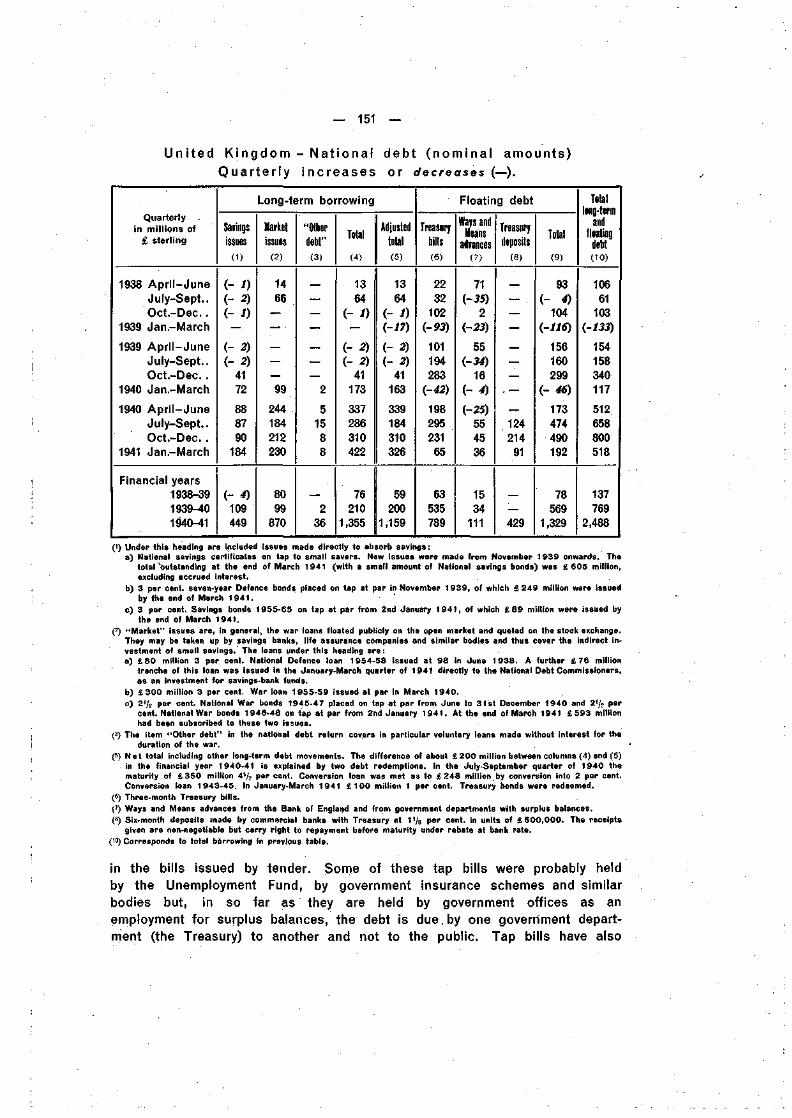
— 151 —
U n i t e d K i n g d o m - N a t i o n a l d e b t ( n o m i n a l a m o u n t s )
Q u a r t e r l y i n c r e a s e s o r ofecreases (—).
Quarterlyin millions of
£ sterling
1938 April-JuneJuly-Sept..Oct.-Dec..
1939 Jan.-March
1939 April-JuneJuly-Sept..Oct.-Dec..
1940 Jan.-March
1940 April-JuneJuly-Sept..Oct.-Dec. .
1941 Jan.-March
Financial years1938-391939-401940-41
Long-term borrowing
Savings
issues
(1)
(- D(- 2)(- 1)
—
( - 2)
(- 2)4172
888790
184
(- 4)109449
Marketissues
(2)
1466
—— •
—
—
—
99
244184212230
8099
870
"Other
debt"
(3)
—
—
—
—
—
—
2
51588
—
236
TnfalI Dial
(4)
1364
(- D
(- 2)
(- 2)41
173
337286310422
76210
1,355
Adjusted
total
(5)
1364
(- 1)(-17)
(- 2)(- 2)
41163
339184310326
59200
1,159
Floating debt
Treasury
bills
(6)
2232
102(-93)
101194283
(-42)
198295231
65
63535789
Ways andM pan1!m callo
advances(7)
71(-35)
2(-23)
55(-34)
16(- 4)
(-25)554536
1534
111
Treasury
deposits
(8)
__
—
—
—
—
—
—
- —
—
124214
91
—'.—
429
Totali Dial
(9)
93( - 4)
104(-116)
156160299
(-46)
173474490192
78569
1,329
Totallong-termIVI1U IUI III
andflnatinn• lummy
debt(10)
10661
103(-133)
154158340117
512658800518
137769
2,488
(1) Under this heading are included issues made directly to absorb savings :a) National savings certificates on tap to small savers. New issues were made from November 1939 onwards. The
total outstanding at the end of March 1941 (with a small amount of National savings bonds) was £ 6 0 5 million,excluding accrued interest.
b) 3 per cent, seven-year Defence bonds placed on tap at par in November 1939 , of which £ 2 4 9 million were issuedby the end of March 1 9 4 1 . '
c) 3 per cent. Savings bonds 1955-65 on tap at par from 2nd January 1 9 4 1 , of which £ 8 9 million were issued bythe end of March 1941 .
(2) "Market" issues are, in general, the war loans floated publicly on the open market and quoted on the stock exchange.They may be taken up by savings banks, life assurance companies and similar bodies and thus cover the indirect in-vestment of small savings. The loans under this heading are:a) £ 8 0 million 3 per cent. National Defence loan 1954-58 issued at 98 in June 1938 . A further £ 7 6 million
tranche of this loan was issued in the January-March quarter of 1941 directly to the National Debt Commissioners,as an investment for savings-bank funds.
b) £ 3 0 0 million 3 per cent. War loan 1955-59 issued at par In March 1940 .c) 2'/2 per cent. National War bonds 1945-47 placed on tap at par from June to 31st December 1940 and 21/2 per
cent. National War bonds 1946-48 on tap at par from 2nd January 1 9 4 1 . At the end of March 1941 £ 5 9 3 millionhad been subscribed to these two issues.
(3) The item "Other debt" in the national debt return covers in particular voluntary loans made without interest for theduration of the war.
(5) Ne t total Including other long-term debt movements. The difference of about £ 200 million between columns (4) and (5)in the financial year 1940-41 is explained by two debt redemptions. In the July-September quarter of 1940 thematurity of £ 3 5 0 million 4'/v per cent. Conversion loan was met as to £ 2 4 8 million by conversion into 2 per cent.Conversion loan 1943-45. In January-March 1941 £ 1 0 0 million 1 per cent. Treasury bonds were redeemed.
(6) Three-month Treasury bills.(7) Ways and Means advances from the Bank oF England and from government departments with surplus balances.(6) Six-month deposits made by commercial banks with Treasury at 1 ' /B per cent, in units of £ 5 0 0 , 0 0 0 . The receipts
given are non-negotiable but carry right to repayment before maturity under rebate at bank rate.(io) Corresponds to total borrowing in previous table.
in the bills issued by tender. Some of these tap bills were probably heldby the Unemployment Fund, by government insurance schemes and similarbodies but, in so far as they are held by government offices as anemployment for surplus balances, the debt is due, by one government depart-ment (the Treasury) to another and not to the public. Tap bills have also
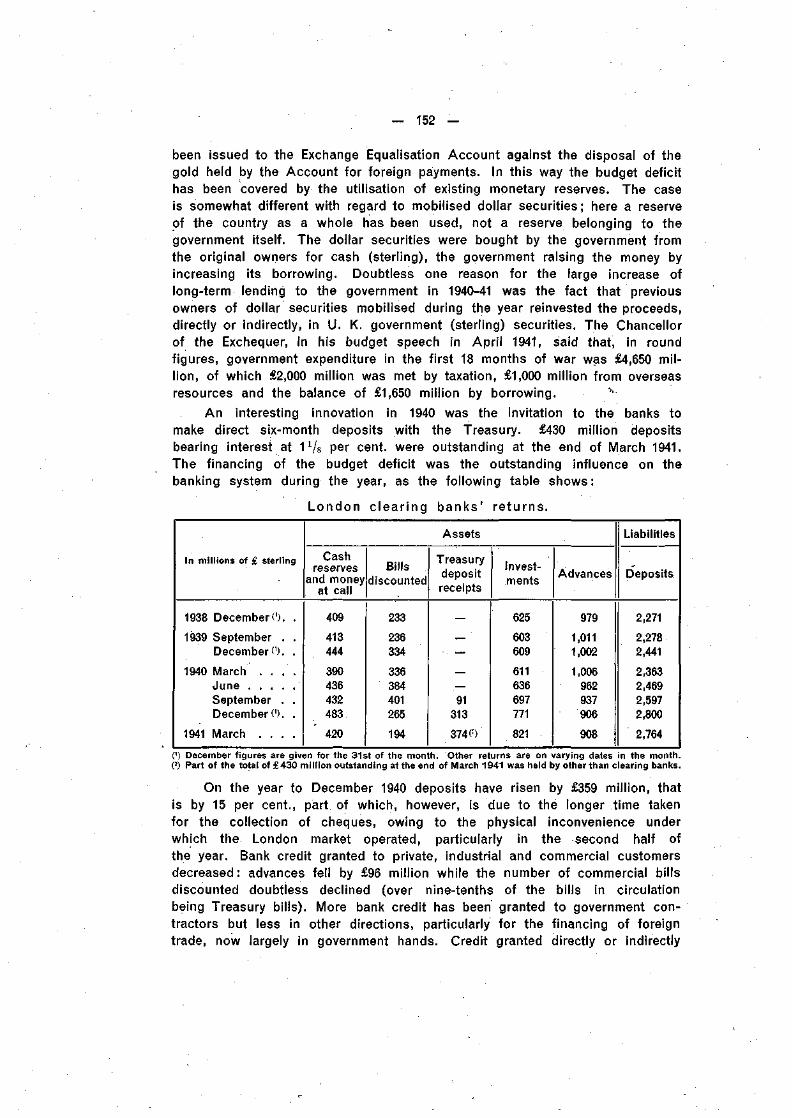
152 —
been issued to the Exchange Equalisation Account against the disposal of thegold held by the Account for foreign payments. In this way the budget deficithas been covered by the utilisation of existing monetary reserves. The caseis somewhat different with regard to mobilised dollar securities; here a reserveof the country as a whole has been used, not a reserve belonging to thegovernment itself. The dollar securities were bought by the government fromthe original owners for cash (sterling), the government raising the money byincreasing its borrowing. Doubtless one reason for the large increase oflong-term lending to the government in 1940-41 was the fact that previousowners of dollar securities mobilised during the year reinvested the proceeds,directly or indirectly, in U. K. government (sterling) securities. The Chancellorof the Exchequer, in his budget speech in April 1941, said that, in roundfigures, government expenditure in the first 18 months of war was £4,650 mil-lion, of which £2,000 million was met by taxation, £1,000 million from overseasresources and the balance of £1,650 million by borrowing. v
An interesting innovation in 1940 was the invitation to the banks tomake direct six-month deposits with the Treasury. £430 million depositsbearing interest at 1x/s per cent, were outstanding at the end of March 1941.The financing of the budget deficit was the outstanding influence on thebanking system during the year, as the following table shows:
London clear ing banks' returns.
In millions of £ sterling
1938 December ('). .
1939 September . .December 0). .
1940 March . . . .JuneSeptember . .December 0). .
1941 March . . . .
Assets
Cashreserves
and moneyat call
409
413444
390436432483
420
Billsdiscounted
233
236334
336384401265
194
Treasurydepositreceipts
91313
374 0
Invest-ments
625
603609
611636697771
821
Advances
979
1,0111,002
1,006962937906
908
Liabilities
Deposits
2,271
2,2782,441
2,3632,4692,5972,800
2,764
(') December figures are given for the 31st of the month. Other returns are on varying dates in the month.('<) Part of the total of £430 million outstanding at the end of March 1941 was held by other than clearing banks.
On the year to December 1940 deposits have risen by £359 million, thatis by 15 per cent., part of which, however, is due to the longer time takenfor the collection of cheques, owing to the physical inconvenience underwhich the London market operated, particularly in the second half ofthe year. Bank credit granted to private, industrial and commercial customersdecreased: advances fell by £96 million while the number of commercial billsdiscounted doubtless declined (over nine-tenths of the bills in circulationbeing Treasury bills). More bank credit has been granted to government con-tractors but less in other directions, particularly for the financing of foreigntrade, now largely in government hands. Credit granted directly or indirectly
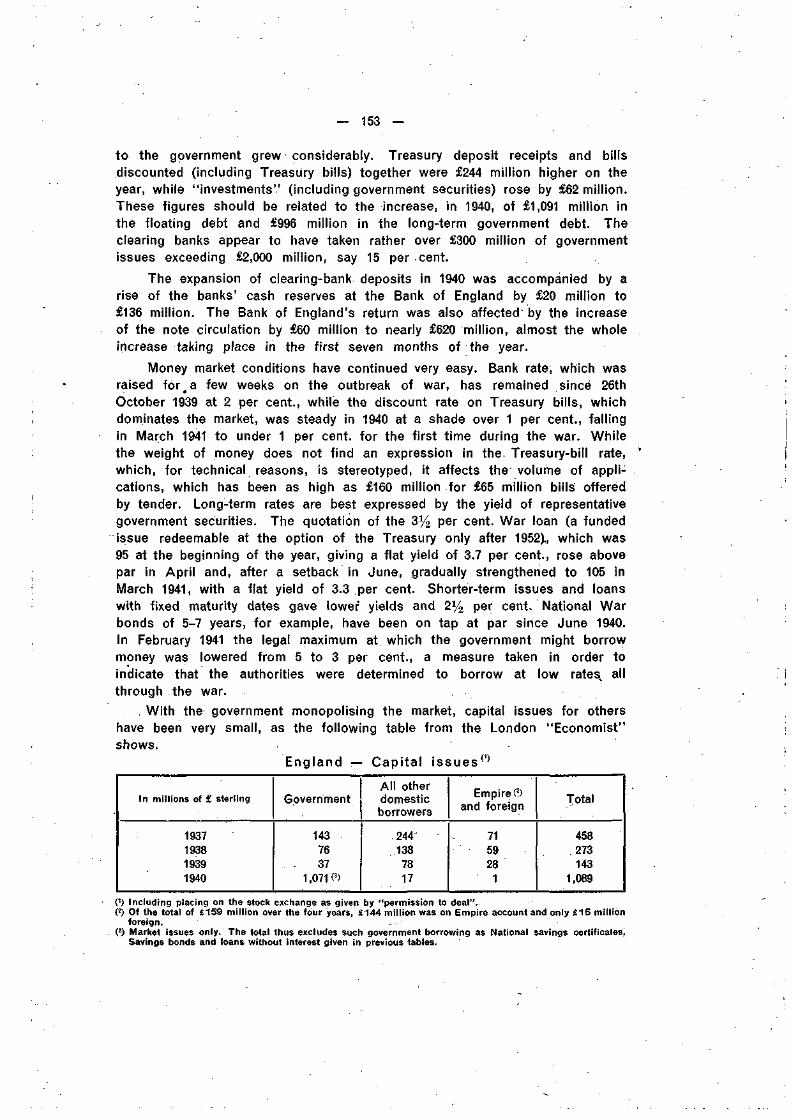
— 153 —
to the government grew considerably. Treasury deposit receipts and billsdiscounted (including Treasury bills) together were £244 million higher on theyear, while "investments" (including government securities) rose by £62 million.These figures should be related to the increase, in 1940, of £1,091 million inthe floating debt and £996 million in the long-term government debt. Theclearing banks appear to have taken rather over £300 million of governmentissues exceeding £2,000 million, say 15 per cent.
The expansion of clearing-bank deposits in 1940 was accompanied by arise of the banks' cash reserves at the Bank of England by £20 million to£136 million. The Bank of England's return was also affected by the increaseof the note circulation by £60 million to nearly £620 million, almost the wholeincrease taking place in the first seven months of the year.
Money market conditions have continued very easy. Bank rate, which wasraised for .a few weeks on the outbreak of war, has remained since 26thOctober 1939 at 2 per cent., while the discount rate on Treasury bills, whichdominates the market, was steady in 1940 at a shade over 1 per cent., fallingin March 1941 to under 1 per cent, for the first time during the war. Whilethe weight of money does not find an expression in the. Treasury-bill rate,which, for technical reasons, is stereotyped, it affects the volume of appli-cations, which has been as high as £160 million for £65 million bills offeredby tender. Long-term rates are best expressed by the yield of representativegovernment securities. The quotation of the 3% per cent. War loan (a fundedissue redeemable at the option of the Treasury only after 1952)., which was95 at the beginning of the year, giving a flat yield of 3.7 per cent., rose abovepar in April and, after a setback in June, gradually strengthened to 105 inMarch 1941, with a flat yield of 3.3 per cent. Shorter-term issues and loanswith fixed maturity dates gave lower yields and 2y2 per cent. National Warbonds of 5-7 years, for example, have been on tap at par since June 1940.In February 1941 the legal maximum at which the government might borrowmoney was lowered from 5 to 3 per cent., a measure taken in order toindicate that the authorities were determined to borrow at low rates, allthrough the war.
With the government monopolising the market, capital issues for othershave been very small, as the following table from the London "Economist"shows.
England — Capital issues (1 )
In millions of £ sterling
1937193819391940
Government
1437637
1,071 (3)
Al l otherdomesticborrowers
2441387817
EmpireOand foreign
7159281
Total
458273143
1,089
0) Including placing on the stock exchange as given by "permission to deal".(2) Of the total of £159 million over the four years, £144 million was on Empire account and only £15 million
foreign.(3) Market issues only. The total thus excludes such government borrowing as National savings certificates,
Savings bonds and loans without interest given in previous tables.
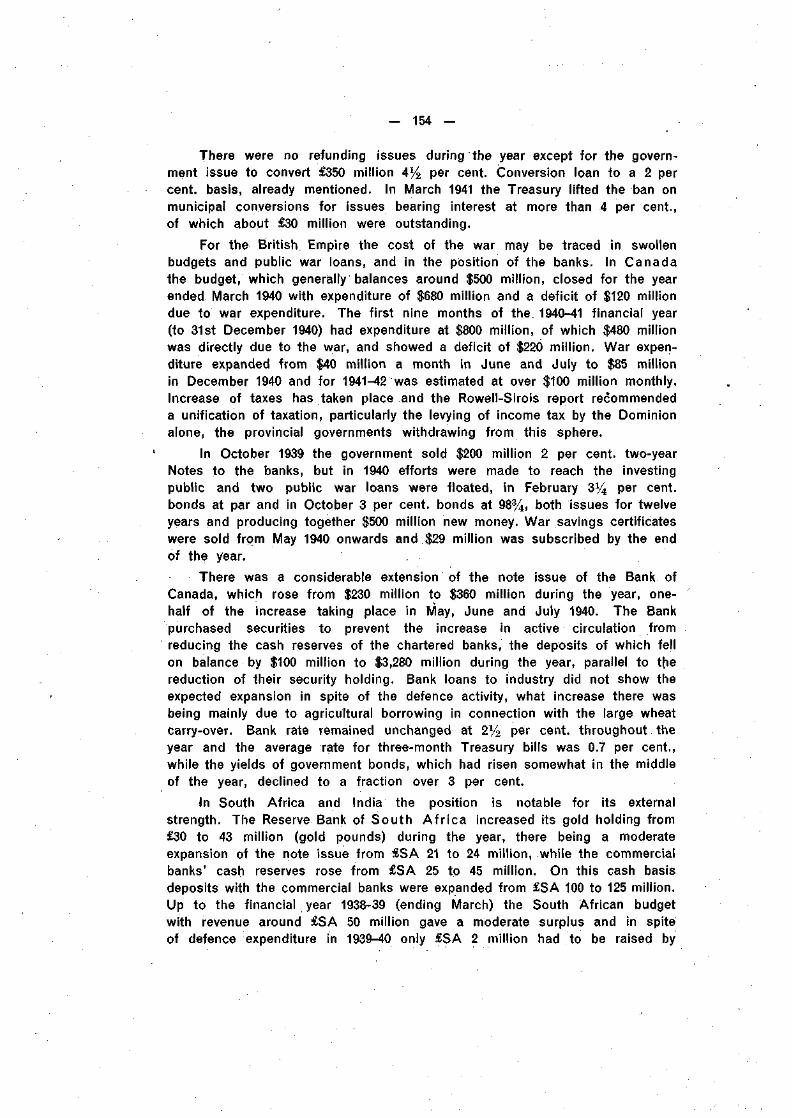
— 154 —
There were no refunding issues during the year except for the govern-ment issue to convert £350 million 4% per cent. Conversion loan to a 2 percent, basis, already mentioned. In March 1941 the Treasury lifted the ban onmunicipal conversions for issues bearing interest at more than 4 per cent.,of which about £30 million were outstanding.
For the British Empire the cost of the war may be traced in swollenbudgets and public war loans, and in the position of the banks. In Canadathe budget, which generally balances around $500 million, closed for the yearended March 1940 with expenditure of $680 million and a deficit of $120 milliondue to war expenditure. The first nine months of the, 1940-41 financial year(to 31st December 1940) had expenditure at $800 million, of which $480 millionwas directly due to the war, and showed a deficit of $220 million. War expen-diture expanded from $40 million a month in June and July to $85 millionin December 1940 and for 1941-42 was estimated at over $100 million monthly.Increase of taxes has taken place and the Rowell-Sirois report recommendeda unification of taxation, particularly the levying of income tax by the Dominionalone, the provincial governments withdrawing from this sphere.
In October 1939 the government sold $200 million 2 per cent, two-yearNotes to the banks, but in 1940 efforts were made to reach the investingpublic and two public war loans were floated, in February 3% per cent,bonds at par and in October 3 per cent, bonds at 98%, both issues for twelveyears and producing together $500 million new money. War savings certificateswere sold from May 1940 onwards and $29 million was subscribed by the endof the year.
There was a considerable extension of the note issue of the Bank ofCanada, which rose from $230 million to $360 million during the year, one-half of the increase taking place in May, June and July 1940. The Bankpurchased securities to prevent the increase in active circulation fromreducing the cash reserves of the chartered banks, the deposits of which fellon balance by $100 million to $3,280 million during the year, parallel to thereduction of their security holding. Bank loans to industry did not show theexpected expansion in spite of the defence activity, what increase there wasbeing mainly due to agricultural borrowing in connection with the large wheatcarry-over. Bank rate remained unchanged at 2% per cent, throughout theyear and the average rate for three-month Treasury bills was 0.7 per cent.,while the yields of government bonds, which had risen somewhat in the middleof the year, declined to a fraction over 3 per cent.
In South Africa and India the position is notable for its externalstrength. The Reserve Bank of South A f r i ca increased its gold holding from£30 to 43 million (gold pounds) during the year, there being a moderateexpansion of the note issue from £SA 21 to 24 million, while the commercialbanks' cash reserves rose from £SA 25 to 45 million. On this cash basisdeposits with the commercial banks were expanded from £SA 100 to 125 million.Up to the financial year 1938-39 (ending March) the South African budgetwith revenue around £SA 50 million gave a moderate surplus and in spiteof defence expenditure in 1939-40 only £SA 2 million had to be raised by
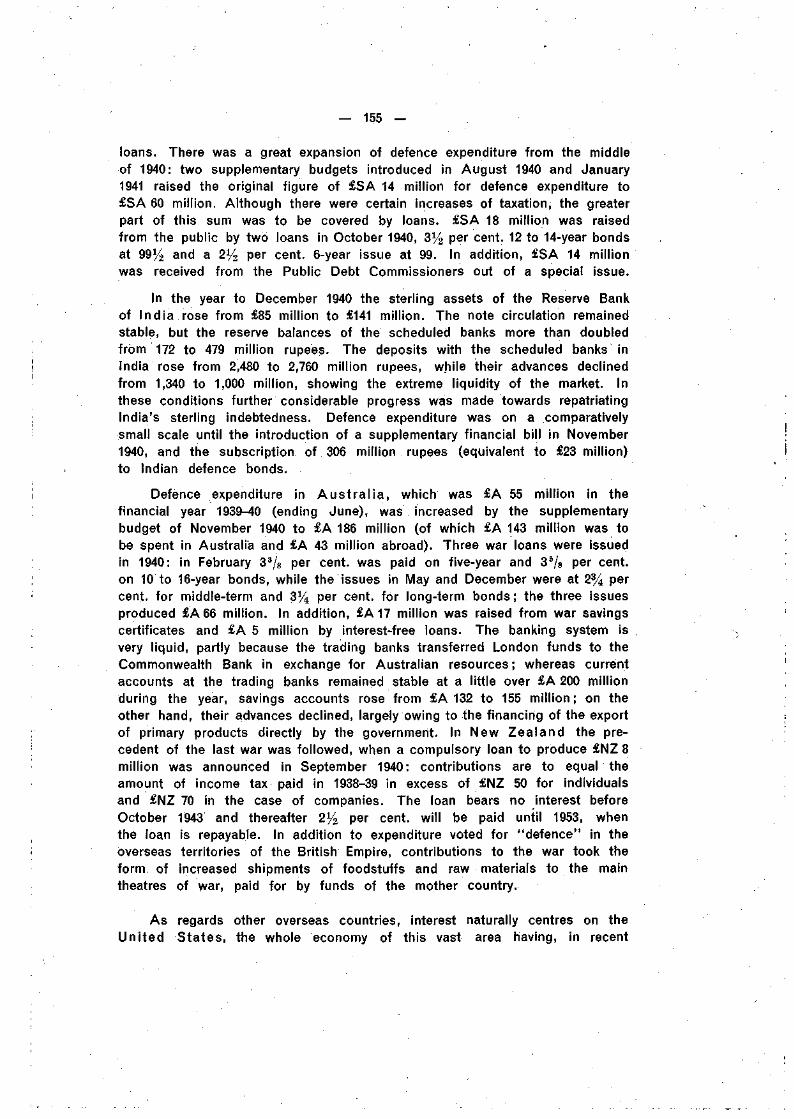
— 155 —
loans. There was a great expansion of defence expenditure from the middleof 1940: two supplementary budgets introduced in August 1940 and January1941 raised the original figure of £SA 14 million for defence expenditure to£SA 60 million. Although there were certain increases of taxation, the greaterpart of this sum was to be covered by loans. £SA 18 million was raisedfrom the public by two loans in October 1940, 3% per cent. 12 to 14-year bondsat 99% and a 2% per cent. 6-year issue at 99. In addition, £SA 14 millionwas received from the Public Debt Commissioners out of a special issue.
In the year to December 1940 the sterling assets of the Reserve Bankof India rose from £85 million to £141 million. The note circulation remainedstable, but the reserve balances of the scheduled banks more than doubledfrom 172 to 479 million rupees. The deposits with the scheduled banks inIndia rose from 2,480 to 2,760 million rupees, while their advances declinedfrom 1,340 to 1,000 million, showing the extreme liquidity of the market. Inthese conditions further considerable progress was made towards repatriatingIndia's sterling indebtedness. Defence expenditure was on a comparativelysmall scale until the introduction of a supplementary financial bill in November1940, and the subscription of 306 million rupees (equivalent to £23 million)to Indian defence bonds.
Defence expenditure in Aus t ra l i a , which was £A 55 million in thefinancial year 1939-40 (ending June), was increased by the supplementarybudget of November 1940 to £A 186 million (of which £A 143 million was tobe spent in Australia and £A 43 million abroad). Three war loans were issuedin 1940: in February 33/8 per cent, was paid on five-year and 35/s per cent,on 10 to 16-year bonds, while the issues in May and December were at 2% percent, for middle-term and 3% per cent, for long-term bonds; the three issuesproduced £A66 million. In addition, £A17 million was raised from war savingscertificates and £A 5 million by interest-free loans. The banking system isvery liquid, partly because the trading banks transferred London funds to theCommonwealth Bank in exchange for Australian resources; whereas currentaccounts at the trading banks remained stable at a little over £A 200 millionduring the year, savings accounts rose from £A 132 to 155 million; on theother hand, their advances declined, largely owing to the financing of the exportof primary products directly by the government. In New Zealand the pre-cedent of the last war was followed, when a compulsory loan to produce £NZ 8million was announced in September 1940: contributions are to equal theamount of income tax paid in 1938-39 in excess of £NZ 50 for individualsand £NZ 70 in the case of companies. The loan bears no interest beforeOctober 1943 and thereafter 2% per cent, will be paid until 1953, whenthe loan is repayable. In addition to expenditure voted for "defence" in theoverseas territories of the British Empire, contributions to the war took theform of increased shipments of foodstuffs and raw materials to the maintheatres of war, paid for by funds of the mother country.
As regards other overseas countries, interest naturally centres on theUnited States, the whole economy of this vast area having, in recent
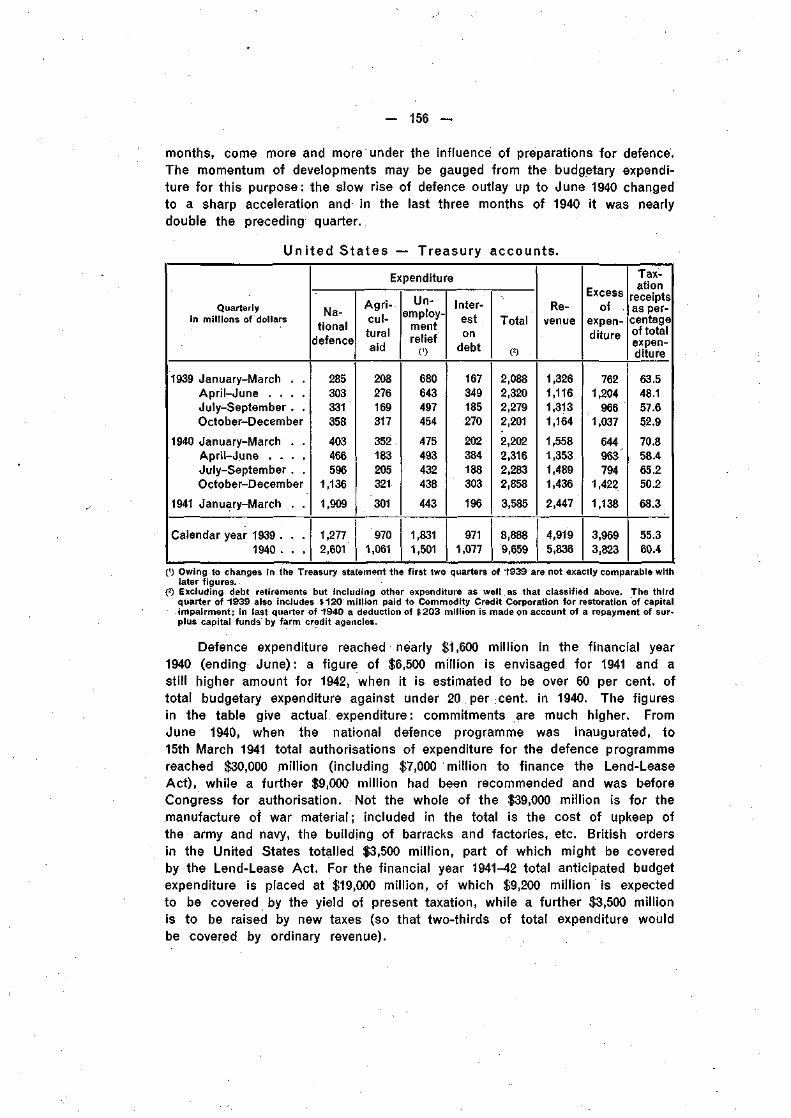
— 156 —
months, come more and more under the influence of preparations for defence.The momentum of developments may be gauged from the budgetary expendi-ture for this purpose: the slow rise of defence outlay up to June 1940 changedto a sharp acceleration and in the last three months of 1940 it was nearlydouble the preceding quarter.
Un i ted S ta tes — Treasury accounts.
Quarterlyin millions of dollars
1939 January-March . .Apri l-June . . . .July-September . .October-December
1940 January-March . .Apri l-June . . . .July-September . .October-December
1941 January-March . .
Calendar year 1939 . . .1940 . . .
Expenditure
Na-tional
defence
285303331358
403466596
1,136
1,909
1,2772,601
Agr i -cul-turalaid
208276169317
352183205321
301
9701,061
Un-employ-
mentrelief
(')
680643497454
475493432438
443
1,8311,501
Inter-eston
debt
167349185270
202384188303
196
9711,077
Total
(2) .
2,0882,3202,2792,201
2,2022,3162,2832,858
3,585
8,8889,659
Re-venue
1,3261,1161,3131,164
1,5581,3531,4891,436
2,447
4,9195,836
Excessof
expen-diture
7621,204
9661,037
644963 "794
1,422
1,138
3,9693,823
Tax-ation
receiptsas per-centageof totalexpen-diture
63.548.157.652.9
70.858.465.250.2
68.3
55.360.4
(') Owing to changes in the Treasury statement the first two quarters of 1939 are not exactly comparable withlater figures.
(') Excluding debt retirements but including other expenditure as well.as that classified above. The thirdquarter of 1939 also includes $120 million paid to Commodity Credit Corporation for restoration of capitalimpairment; in last quarter of 1940 a deduction of $203 million is made on account of a repayment of sur-plus capital funds by farm credit agencies.
Defence expenditure reached nearly $1,600 million in the financial year1940 (ending June) : a figure of $6,500 million is envisaged for 1941 and astill higher amount for 1942, when it is estimated to be over 60 per cent, oftotal budgetary expenditure against under 20 per cent, in 1940. The figuresin the table give actual, expenditure: commitments are much higher. FromJune 1940, when the national defence programme was inaugurated, to15th March 1941 total authorisations of expenditure for the defence programmereached $30,000 million (including $7,000 million to finance the Lend-LeaseAct), while a further $9,000 million had been recommended and was beforeCongress for authorisation. Not the whole of the $39,000 million is for themanufacture of war material; included in the total is the cost of upkeep ofthe army and navy, the building of barracks and factories, etc. British ordersin the United States totalled $3,500 million, part of which might be coveredby the Lend-Lease Act. For the financial year 1941-42 total anticipated budgetexpenditure is placed at $19,000 million, of which $9,200 million is expectedto be covered by the yield of present taxation, while a further $3,500 millionis to be raised by new taxes (so that two-thirds of total expenditure wouldbe covered by ordinary revenue).
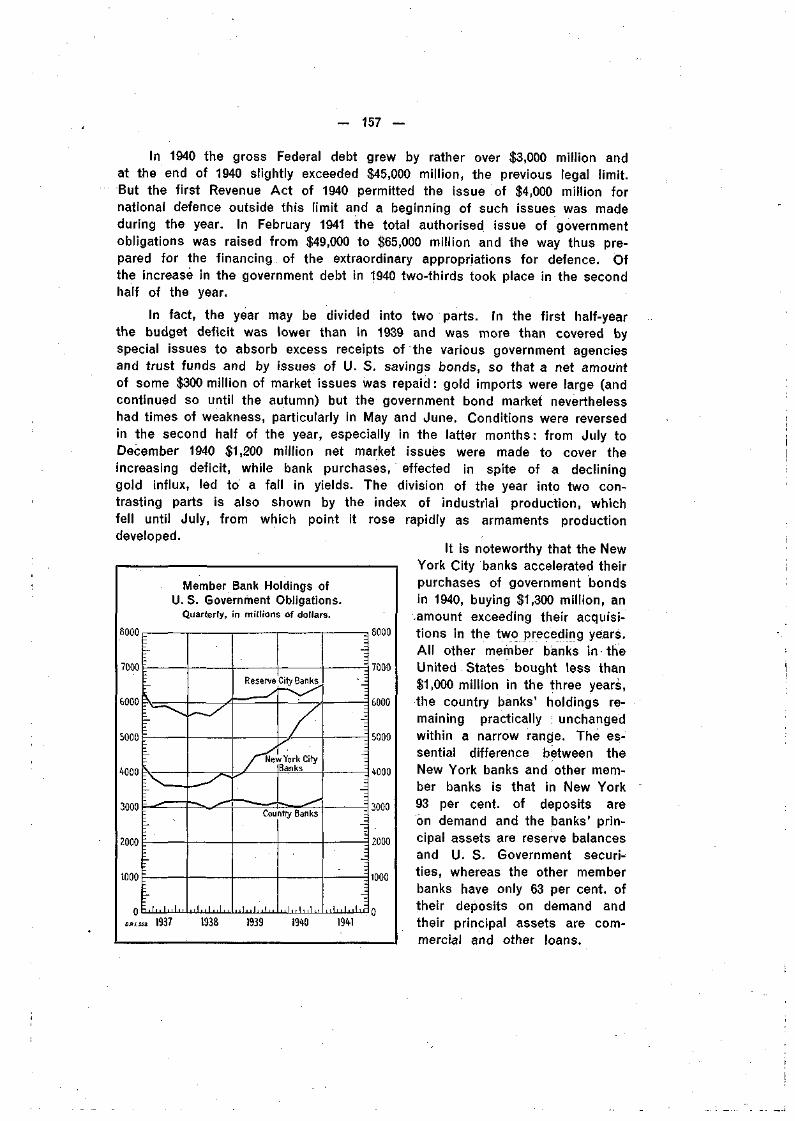
157
In 1940 the gross Federal debt grew by rather over $3,000 million andat the end of 1940 slightly exceeded $45,000 million, the previous legal limit.But the first Revenue Act of 1940 permitted the issue of $4,000 million fornational defence outside this limit and a beginning of such issues was madeduring the year. In February 1941 the total authorised issue of governmentobligations was raised from $49,000 to $65,000 million and the way thus pre-pared for the financing of the extraordinary appropriations for defence. Ofthe increase in the government debt in 1940 two-thirds took place in the secondhalf of the year.
In fact, the year may be divided into two parts. In the first half-yearthe budget deficit was lower than in 1939 and was more than covered byspecial issues to absorb excess receipts of the various government agenciesand trust funds and by issues of U. S. savings bonds, so that a net amountof some $300 million of market issues was repaid : gold imports were large (andcontinued so until the autumn) but the government bond market neverthelesshad times of weakness, particularly in May and June. Conditions were reversedin the second half of the year, especially in the latter months: from July toDecember 1940 $1,200 million net market issues were made to cover theincreasing deficit, while bank purchases, effected in spite of a declininggold influx, led to a fall in yields. The division of the year into two con-trasting parts is also shown by the index of industrial production, whichfell until July, from which point it rose rapidly as armaments productiondeveloped.
It is noteworthy that the NewYork City banks accelerated theirpurchases of government bondsin 1940, buying $1,300 million, anamount exceeding their acquisi-tions in the two preceding years.All other member banks in theUnited States bought less than$1,000 million in the three years,the country banks' holdings re-maining practically : unchangedwithin a narrow range. The es-sential difference between theNew York banks and other mem-ber banks is that in New York93 per cent, of deposits areon demand and the banks' prin-cipal assets are reserve balancesand U. S. Government securi-ties, whereas the other memberbanks have only 63 per cent, oftheir deposits on demand andtheir principal assets are com-mercial and other loans.
Member Bank Holdings ofU. S. Government Obligations.
Quarterly, in millions of dollars.
8000
7000
6000
5000
WOO
3000
2000
1000
Reserve City Banks
New York CityBanks
Country Banks
7000
6000
5000
WOO
3000
2000
1000
.w.50». 1937 1938 1939 1940 1941
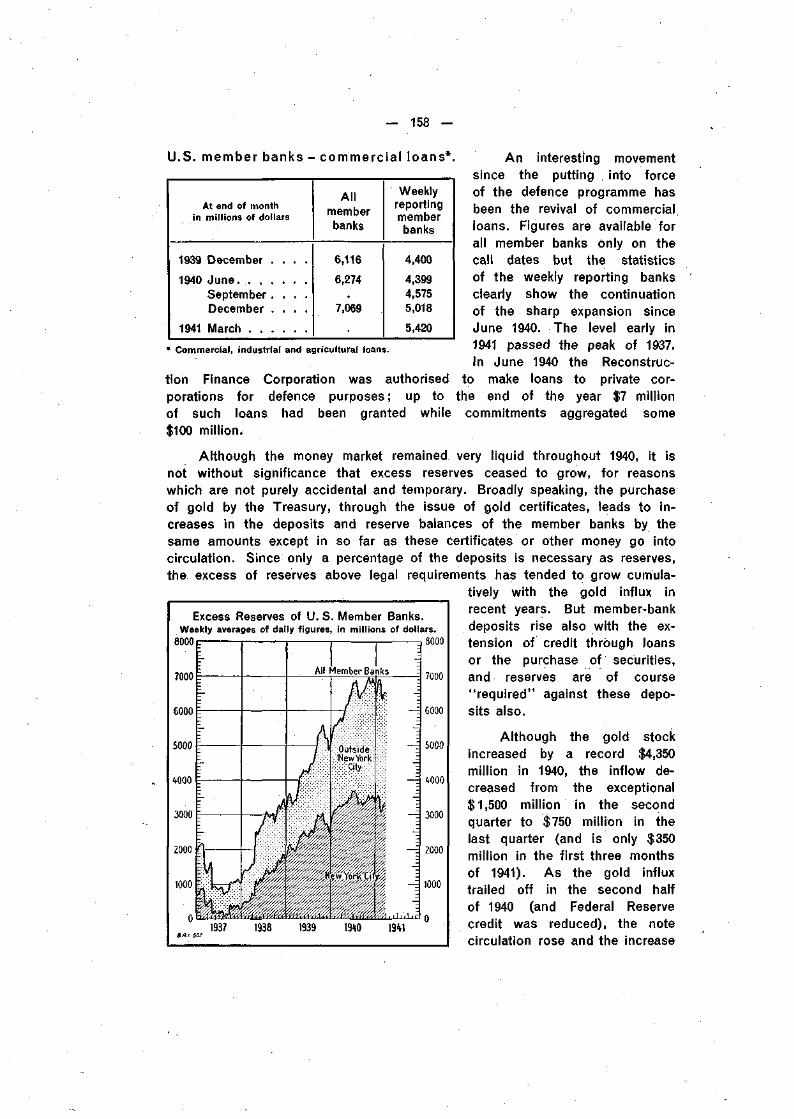
— 158 —
U.S. member banks - commercial loans*,
At end of monthin millions of dollars
1939 December . . . .
1940 JuneSeptember . . . .December . . . .
1941 March
Al lmemberbanks
6,116
6,274
7,069
Weeklyreportingmemberbanks
4,400
4,3994,5755,018
5,420
* Commercial, industrial and agricultural loans.
tion Finance Corporation was authorisedporations for defence purposes; up toof such loans had been granted while$100 million.
An interesting movementsince the putting into forceof the defence programme hasbeen the revival of commercialloans. Figures are available forall member banks only on thecall dates but the statisticsof the weekly reporting banksclearly show the continuationof the sharp expansion sinceJune 1940. The level early in1941 passed the peak of 1937.In June 1940 the Reconstruc-
to make loans to private cor-the end of the year $7 million
commitments aggregated some
Excess Reserves of U. S. Member Banks.Weekly averages of daily figures, in millions of dollars.
All Member Banks
Although the money market remained very liquid throughout 1940, it isnot without significance that excess reserves ceased to grow, for reasonswhich are not purely accidental and temporary. Broadly speaking, the purchaseof gold by the Treasury, through the issue of gold certificates, leads to in-creases in the deposits and reserve balances of the member banks by thesame amounts except in so far as these certificates or other money go intocirculation. Since only a percentage of the deposits is necessary as reserves,the excess of reserves above legal requirements has tended to grow cumula-
tively with the gold influx inrecent years. But member-bankdeposits rise also with the ex-tension of credit through loansor the purchase of securities,and reserves are of course"required" against these depo-sits also.
Although the gold stockincreased by a record $4,350million in 1940, the inflow de-creased from the exceptional$1,500 million in the secondquarter to $750 million in thelast quarter (and is only $350million in the first three monthsof 1941). As the gold influxtrailed off in the second halfof 1940 (and Federal Reservecredit was reduced), the notecirculation rose and the increase
8000
7000
6000
5000
4000
3000
2000
1000
8000
7000
6000
5000
4000
3000
2000
1000
1937 1938 1939 1940 M l
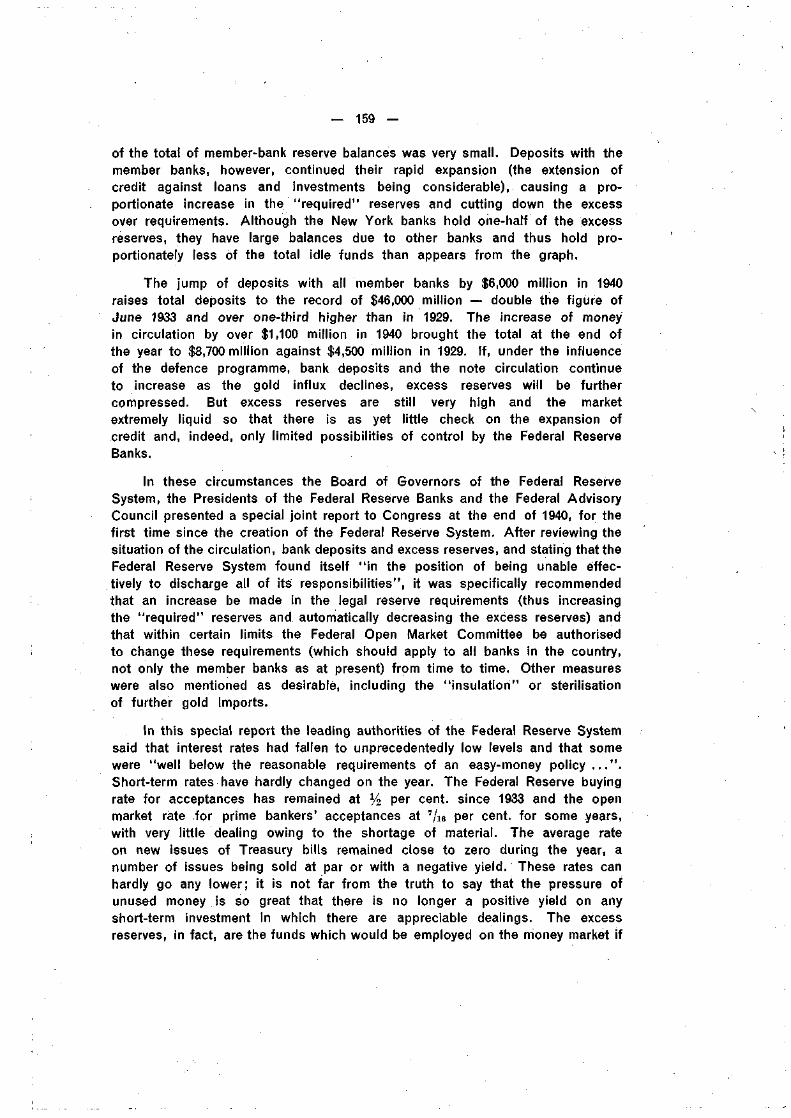
— 159 —
of the total of member-bank reserve balances was very small. Deposits with themember banks, however, continued their rapid expansion (the extension ofcredit against loans and investments being considerable), causing a pro-portionate increase in the "required" reserves and cutting down the excessover requirements. Although the New York banks hold one-half of the excessreserves, they have large balances due to other banks and thus hold pro-portionately less of the total idle funds than appears from the graph.
The jump of deposits with all member banks by $6,000 million in 1940raises total deposits to the record of $46,000 million — double the figure ofJune 1933 and over one-third higher than in 1929. The increase of moneyin circulation by over $1,100 million in 1940 brought the total at the end ofthe year to $8,700 million against $4,500 million in 1929. If, under the influenceof the defence programme, bank deposits and the note circulation continueto increase as the gold influx declines, excess reserves will be furthercompressed. But excess reserves are still very high and the marketextremely liquid so that there is as yet little check on the expansion ofcredit and, indeed, only limited possibilities of control by the Federal ReserveBanks.
In these circumstances the Board of Governors of the Federal ReserveSystem, the Presidents of the Federal Reserve Banks and the Federal AdvisoryCouncil presented a special joint report to Congress at the end of 1940, for thefirst time since the creation of the Federal Reserve System. After reviewing thesituation of the circulation, bank deposits and excess reserves, and stating that theFederal Reserve System found itself "in the position of being unable effec-tively to discharge all of its responsibilities", it was specifically recommendedthat an increase be made in the legal reserve requirements (thus increasingthe "required" reserves and automatically decreasing the excess reserves) andthat within certain limits the Federal Open Market Committee be authorisedto change these requirements (which should apply to ail banks in the country,not only the member banks as at present) from time to time. Other measureswere also mentioned as desirable, including the "insulation" or sterilisationof further gold imports.
In this special report the leading authorities of the Federal Reserve Systemsaid that interest rates had fallen to unprecedentedly low levels and that somewere "well below the reasonable requirements of an easy-money policy . . . " .Short-term rates have hardly changed on the year. The Federal Reserve buyingrate for acceptances has remained at % per cent, since 1933 and the openmarket rate for prime bankers' acceptances at 1jw per cent, for some years,with very little dealing owing to the shortage of material. The average rateon new issues of Treasury bills remained close to zero during the year, anumber of issues being sold at par or with a negative yield. These rates canhardly go any lower; it is not far from the truth to say that the pressure ofunused money is so great that there is no longer a positive yield on anyshort-term investment in which there are appreciable dealings. The excessreserves, in fact, are the funds which would be employed on the money market if
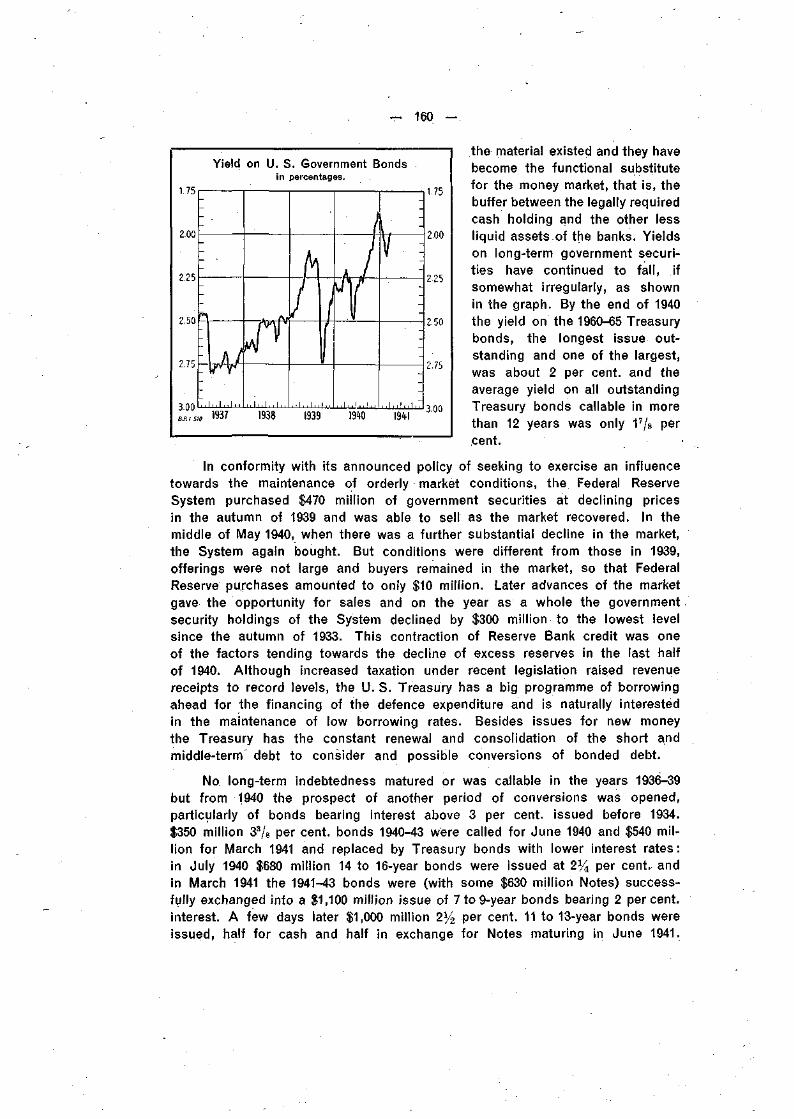
160 —
Yield on U. S. Government Bondsin percentages.
1.75 r - : 1- 1 —i 1 1175
2.00
2.25
2.50
2.75
3 - 0 0 * >• 11 • 11 • I • • 1111BM5I0 1937 1938 1939 19W 1941
2.00
2.25
2.50
2.75
3.00
the material existed and they havebecome the functional substitutefor the money market, that is, thebuffer between the legally requiredcash holding and the other lessliquid assets of the banks. Yieldson long-term government securi-ties have continued to fall, ifsomewhat irregularly, as shownin the graph. By the end of 1940the yield on the 1960-65 Treasurybonds, the longest issue out-standing and one of the largest,was about 2 per cent, and theaverage yield on all outstandingTreasury bonds callable in morethan 12 years was only 17/s percent.
In conformity with its announced policy of seeking to exercise an influencetowards the maintenance of orderly market conditions, the Federal ReserveSystem purchased $470 million of government securities at declining pricesin the autumn of 1939 and was able to sell as the market recovered. In themiddle of May 1940, when there was a further substantial decline in the market,the System again bought. But conditions were different from those in 1939,offerings were not large and buyers remained in the market, so that FederalReserve purchases amounted to only $10 million. Later advances of the marketgave the opportunity for sales and on the year as a whole the governmentsecurity holdings of the System declined by $300 million to the lowest levelsince the autumn of 1933. This contraction of Reserve Bank credit was oneof the factors tending towards the decline of excess reserves in the last halfof 1940. Although increased taxation under recent legislation raised revenuereceipts to record levels, the U. S. Treasury has a big programme of borrowingahead for the financing of the defence expenditure and is naturally interestedin the maintenance of low borrowing rates. Besides issues for new moneythe Treasury has the constant renewal and consolidation of the short andmiddle-term debt to consider and possible conversions of bonded debt.
No. long-term indebtedness matured or was callable in the years 1936-39but from 1940 the prospect of another period of conversions was opened,particularly of bonds bearing interest above 3 per cent, issued before 1934.$350 million 33/8 per cent, bonds 1940-43 were called for June 1940 and $540 mil-lion for March 1941 and replaced by Treasury bonds with lower interest rates:in July 1940 $680 million 14 to 16-year bonds were issued at 2% per cent, andin March 1941 the 1941-43 bonds were (with some $630 million Notes) success-fully exchanged into a $1,100 million issue of 7 to 9-year bonds bearing 2 percent,interest. A few days later $1,000 million 2% per cent. 11 to 13-year bonds wereissued, half for cash and half in exchange for Notes maturing in June 1941.
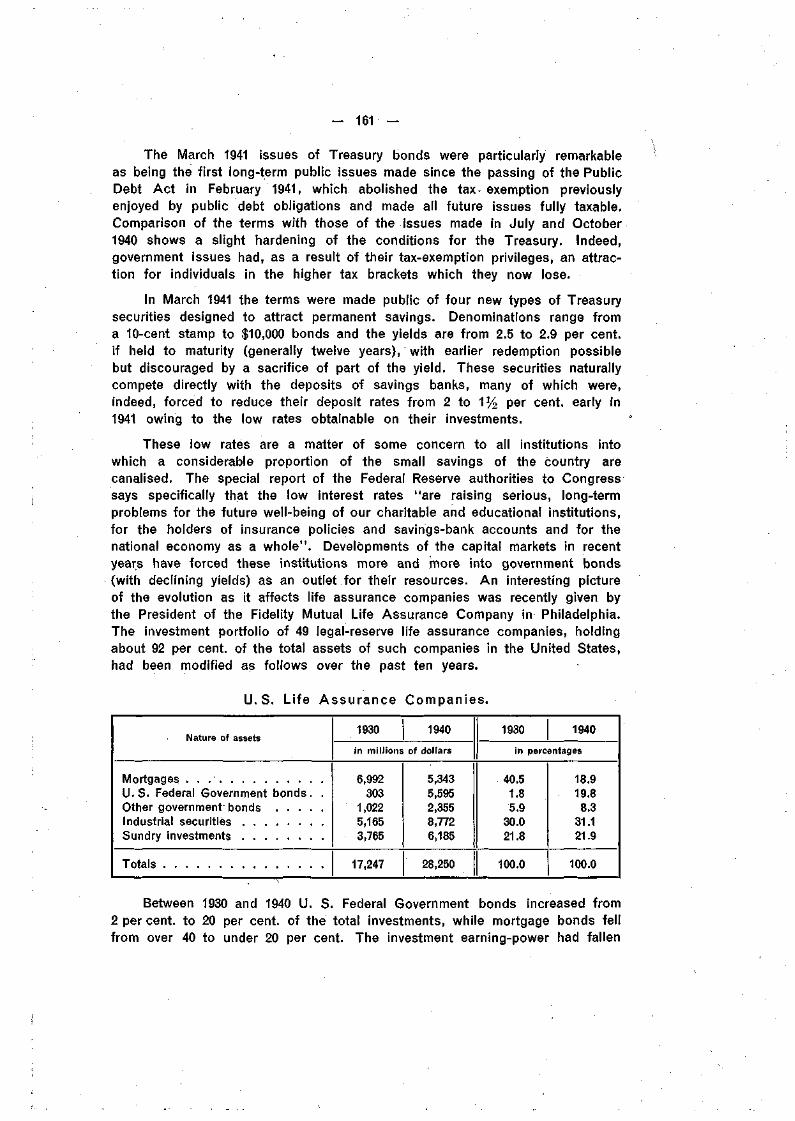
- 161 -
Thé March 1941 issues of Treasury bonds were particularly remarkableas being the first long-term public issues made since the passing of the PublicDebt Ac t in February 1941, which abolished the tax exemption previouslyenjoyed by public debt obligations and made all future issues fully taxable.Comparison of the terms with those of the issues made in July and October
1940 shows a slight hardening of the conditions for the Treasury. Indeed,government issues had, as a result of their tax-exemption privileges, an attrac-tion for individuals in the higher tax brackets which they now lose.
In March 1941 the terms were made public of four new types of Treasurysecurities designed to attract permanent savings. Denominations range froma 10-cent stamp to $10,000 bonds and the yields are from 2.5 to 2.9 per cent,if held to maturity (generally twelve years), with earlier redemption possiblebut discouraged by a sacrifice of part of the yield. These securities naturallycompete directly with the deposits of savings banks, many of which were,indeed, forced to reduce their deposit rates from 2 to 1 % per cent, early in1941 owing to the low rates obtainable on their investments.
These low rates are a matter of some concern to all institutions intowhich a considerable proportion of the small savings of the country arecanalised. The special report of the Federal Reserve authorities to Congresssays specifically that the low interest rates "are raising serious, long-termproblems for the future well-being of our charitable and educational insti tut ions,for the holders of insurance policies and savings-bank accounts and for thenational economy as a who le " . Developments of the capital markets in recentyears have forced these institutions more and more into government bonds(with declining yields) as an outlet for their resources. A n interesting pictureof the evolution as it affects life assurance companies was recently given bythe President of the Fidelity Mutual Life Assurance Company in Philadelphia.The investment portfolio of 49 legal-reserve life assurance companies, holdingabout 92 per cent, of the total assets of such companies in the United States,had been modified as fol lows over the past ten years.
U.S. Life Assurance Companies.
Nature of assets
MortgagesU.S. Federal Government bonds. .Other government bondsIndustrial securitiesSundry investments
Totals
1930 1940
in millions of dollars
6,992303
1,0225,1653,765
17,247
5,3435,5952,3558,7726,185
28,250
1930 1940
in percentages
40.51.85.9
30.021.8
100.0
18.919.88.3
31.121.9
100.0
Between 1930 and 1940 U. S. Federal Government bonds increased from2 per cent, to 20 per cent, of the total investments, while mortgage bonds fellfrom over 40 to under 20 per cent. The investment earning-power had fallen
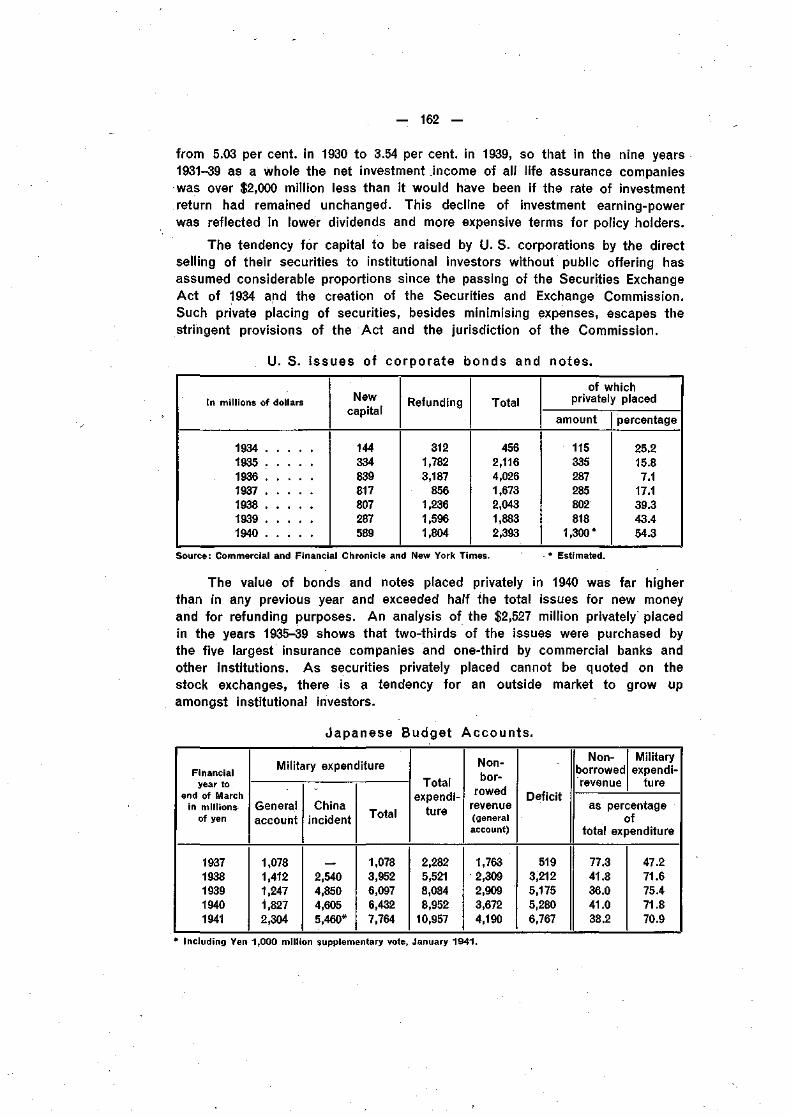
— 162 —
from 5.03 per cent, in 1930 to 3.54 per cent, in 1939, so that in the nine years1931-39 as a whole the net investment income of all life assurance companieswas over $2,000 million less than it would have been if the rate of investmentreturn had remained unchanged. This decline of investment earning-powerwas reflected in lower dividends and more expensive terms for policy holders.
The tendency for capital to be raised by U.S. corporations by the directselling of their securities to institutional investors without public offering hasassumed considerable proportions since the passing of the Securities ExchangeAct of 1934 and the creation of the Securities and Exchange Commission.Such private placing of securities, besides minimising expenses, escapes thestringent provisions of the Act and the jurisdiction of the Commission.
U. S. issues of corporate bonds and notes.
In millions of dollars
1934193519361937193819391940
Newcapital
144334839817807287589
Refunding
3121,7823,187
8561,2361,5961,804
Total
4562,1164,0261,6732,0431,8832,393
of whichprivately placed
amount
115335287285802818
1,300*
percentage
25.215.87.1
17.139.343.454.3
Source: Commercial and Financial Chronicle and New York Times. * Estimated.
The value of bonds and notes placed privately in 1940 was far higherthan in any previous year and exceeded half the total issues for new moneyand for refunding purposes. An analysis of the $2,527 million privately placedin the years 1935-39 shows that two-thirds of the issues were purchased bythe five largest insurance companies and one-third by commercial banks andother institutions. As securities privately placed cannot be quoted on thestock exchanges, there is a tendency for an outside market to grow upamongst institutional investors.
Japanese Budget Accounts .
Financialyear to
end of Marchin millions
of yen
19371938193919401941
Military expenditure
Generalaccount
1,0781,4121,2471,8272,304
Chinaincident
2,5404,8504,6055,460*
Total
1,0783,9526,0976,4327,764
Totalexpendi-
ture
2,2825,5218,0848,952
10,957
Non-bor-
rowedrevenue(generalaccount)
1,7632,3092,9093,6724,190
Deficit
5193,2125,1755,2806,767
Non-borrowedrevenue
Militaryexpendi-
ture
as percentageof
total expenditure
77.341.836.041.038.2
47.271.675.471.870.9
* Including Yen 1,000 million supplementary vote, January 1941.
— 163 —
Since the outbreak of war with China in the middle of 1937 the budgetin Japan has been dominated by military outlay, which has absorbed morethan two-thirds of total expenditure in the last few years.
Figures given for the "China incident" in the table on the preceding pageare authorised issues. These issues have not always been utilised in full in theyear for which they were authorised ; owing to this fact the total expenditure anddeficit for any particular year may be somewhat overstated. But the aggregateover the years is not far from the actual expenditure, since at the end ofDecember 1940 only Yen 875 million of the War Expenditure Special Accountbonds remained unissued. The deficit has been covered by continuous issuesof government bonds, all at 3% per cent, and of 11 to 17 years (with a yieldof about 3.65 per cent.).
The actual placings of government bonds on the market have been madechiefly through the Bank of Japan and, in spite of their increasing volume,have been accompanied by considerable private issues, particularly of industrialbonds and shares.
Japan — tota l capi tal issues.
Calendar yearin millions
of yen
1937193819391940
Governmentbonds
1,3713,7785,2936,705
Localgovernment
bonds
74131233207
Bankbonds
508758432
1,296
Industrialbonds
333663
. 1,2781,315
Shares
1,8961,8952,2902,979
Totalissues
4,1827,2259,526
12,503
Note: For 1937 and 1938 the figures include subscriptions to all categories of issues in Japan proper, Korea,Formosa, Sakhalien, Japanese South Sea mandates and Kuantoung leased territory: for 1939 and 1940local government bonds for Japan proper only. The figures exclude the Deposit Bureau of the Ministryof Finance and issues for conversion or against other values than cash.
In 1939 the assimilation of government bonds proved to be slow andtowards the end of 1940, as the placing became more difficult, measureswere taken to limit the issues for industrial financing. In 1940 the expansionof the Bank of Japan's government bond holding, which is a measure ofthe non-assimilation of bonds by the other banks and institutions, was byYen 1,500 million, nearly half of the total increase of Yen 3,100 million sinceDecember 1936. In the same four years the note issue has risen parallel tothe bond holding from Yen 1,870 million to Yen 4,780 million (i. e. by 155per cent.). Although bank rate has remained unchanged at 3% per cent.,the market has been rather tight throughout the year and for some timethe Bank of Japan has imposed higher penal rates on certain types ofborrowing. With the object of ensuring the better placing of its bonds, theJapanese Government has intensified its control over the banks and inAugust 1940 ordered the leading banks to submit reports regarding investments,issued an ordinance regulating the employment of funds by banks and otherinstitutions and made the temporary Capital Adjustment Law more rigorous.
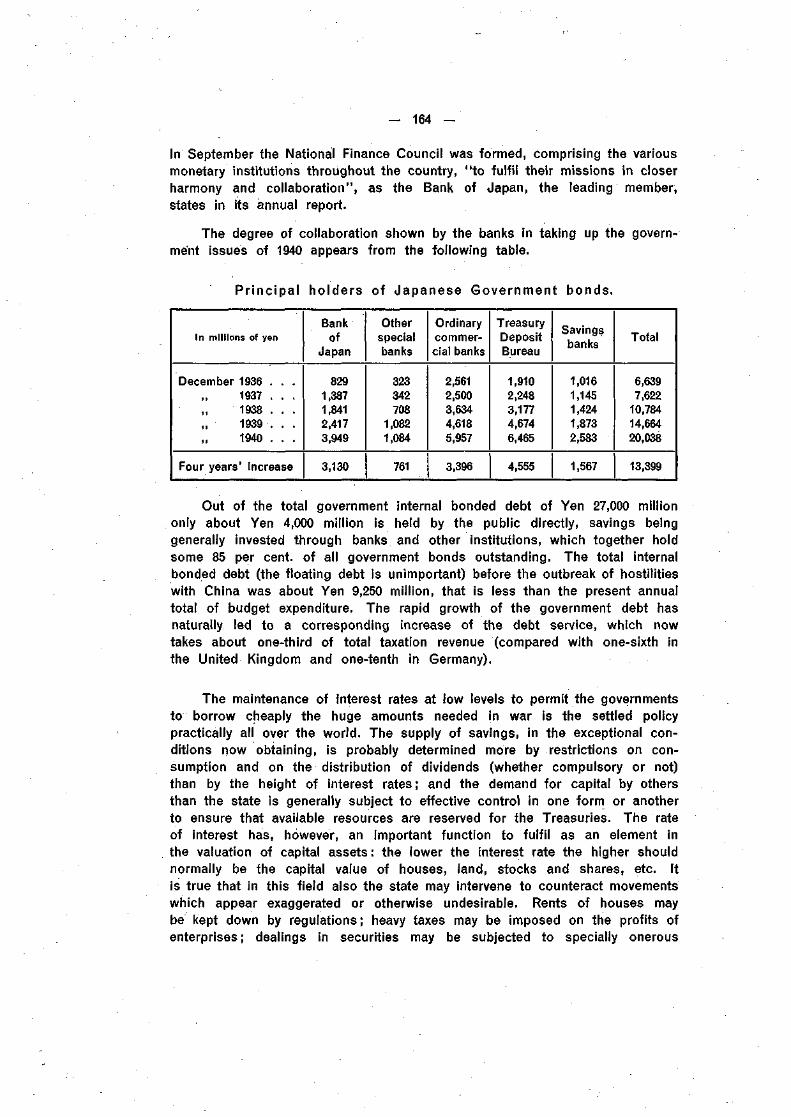
— 164 —
In September the National Finance Council was formed, comprising the variousmonetary institutions throughout the country, "to fulfil their missions in closerharmony and collaboration", as the Bank of Japan, the leading member,states in its annual report.
The degree of collaboration shown by the banks in taking up the govern-ment issues of 1940 appears from the following table.
Pr inc ipal holders of Japanese Government bonds.
In millions of yen
December 1936 . . .1937 . . .1938 . . .1939 . . .1940 . . .
Four years' increase
Bankof
Japan
8291,3871,8412,4173,949
3,130
Otherspecialbanks
323342708
1,0821,084
761
Ordinarycommer-cial banks
2,5612,5003,6344,6185,957
3,396
TreasuryDepositBureau
1,9102,2483,1774,6746,465
4,555
Savingsbanks
1,0161,1451,4241,8732,583
1,567
Total
6,6397,622
10,78414,66420,038
13,399
Out of the total government internal bonded debt of Yen 27,000 milliononly about Yen 4,000 million is held by the public directly, savings beinggenerally invested through banks and other institutions, which together holdsome 85 per cent, of all government bonds outstanding. The total internalbonded debt (the floating debt is unimportant) before the outbreak of hostilitieswith China was about Yen 9,250 million, that is less than the present annualtotal of budget expenditure. The rapid growth of the government debt hasnaturally led to a corresponding increase of the debt service, which nowtakes about one-third of total taxation revenue (compared with one-sixth inthe United Kingdom and one-tenth in Germany).
The maintenance of interest rates at low levels to permit the governmentsto borrow cheaply the huge amounts needed in war is the settled policypractically all over the world. The supply of savings, in the exceptional con-ditions now obtaining, is probably determined more by restrictions on con-sumption and on the distribution of dividends (whether compulsory or not)than by the height of interest rates ; and the demand for capital by othersthan the state is generally subject to effective control in one form or anotherto ensure that available resources are reserved for the Treasuries. The rateof interest has, however, an important function to fulfil as an element inthe valuation of capital assets: the lower the interest rate the higher shouldnormally be the capital value of houses, land, stocks and shares, etc. Itis true that in this field also the state may intervene to counteract movementswhich appear exaggerated or otherwise undesirable. Rents of houses maybe kept down by regulations; heavy taxes may be imposed on the profits ofenterprises; dealings in securities may be subjected to specially onerous
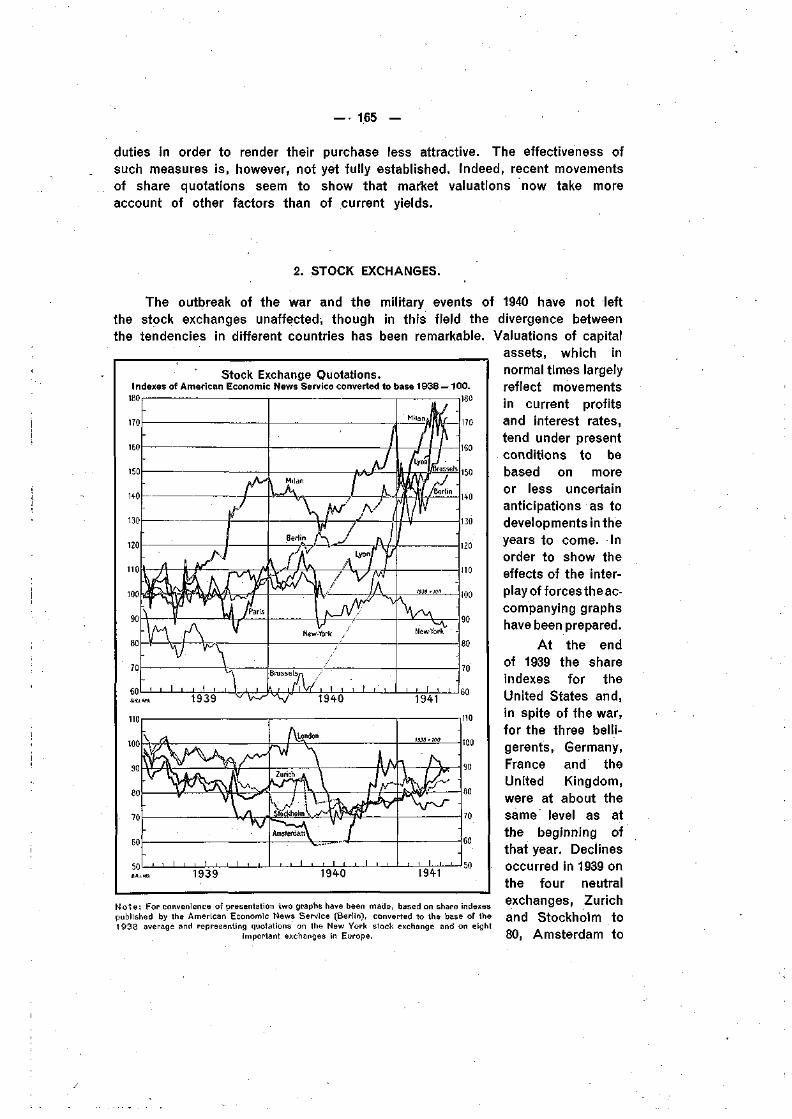
— • 165 —
duties in order to render their purchase less attractive. The effectiveness ofsuch measures is, however, not yet fully established. Indeed, recent movementsof share quotations seem to show that market valuations now take moreaccount of other factors than of current yields.
Stock Exchange Quotations.Indexes of American Economic News Service converted to base 1938 = 100.
180
170
160
150
HO
130
120
2. STOCK EXCHANGES.
The outbreak of the war and the military events of 1940 have not leftthe stock exchanges unaffected, though in this field the divergence betweenthe tendencies in different countries has been remarkable. Valuations of capital
assets, which innormal times largelyreflect movementsin current profitsand interest rates,tend under presentconditions to bebased on moreor less uncertainanticipations as todevelopments in theyears to come. Inorder to show theeffects of the inter-play of forces the ac-companying graphshave been prepared.
At the endof 1939 the shareindexes for theUnited States and,in spite of the war,for the three belli-gerents, Germany,France and theUnited Kingdom,were at about thesame level as atthe beginning ofthat year. Declinesoccurred in 1939 onthe four neutral
Note : For convenience of presentation two graphs have been made, based on share indexes . aliyea, -"1 l»'lpublished by the American Economic News Service (Berlin), converted to the base of the and Stockholm tO1938 average and representing quotations on the New York stock exchange and on eight
important exchanges in Europe. 80, Amsterdam tO
50 !—L
ERJ. «a. I ' I i I I I
1939 1940I 1 I I 1
60
50
— 166 —
70 and Brussels to 60 per cent, of the 1938 average, while in Milan the stockmarket spurted from the beginning of the war, to show a rise of 50 per cent,on the year 1939.
Almost all the stock exchanges displayed a weak tendency in the firstfive months of 1940; on 10th May the bourses were closed in Brussels,Amsterdam and Zurich, and on 10th June in Paris. Zurich was the first toreopen, on 8th July; Amsterdam came later in July and Brussels in August,while Paris opened for- bond dealing in October but remained closed forshares until March 1941. The other exchanges shown in the graph remainedopen without interruption. There was a mild setback in Berlin in June (re-ported to be due to the prospect of a short war), while in London the slumpwhich had begun in March continued into July, taking the index below 70.All the exchanges show rises of varying degree in the second half of the year.In the spring of 1941 the share indexes for New York and four of the Europeanexchanges (London, Zurich, Amsterdam and Stockholm) were grouped around75 to 90, i. e. somewhat below the average for the year 1938. The indexesfor Berlin, Milan, Lyons and Brussels were grouped around 150 to 180 — abouttwice as high as the former group.
The most spectacular rise took place in Brusse ls , where the shareindex more than doubled during the year 1940. The bourse was shut on10th May and remained closed until 21st August, when the bond market wasopened, and from 3rd September shares were gradually introduced. By 11thSeptember all except foreign securities were listed for dealings. On 16thSeptember the Antwerp bourse was also opened under the same conditionsas in Brussels. Various precautions were taken, particularly the prohibitionof forward markets, the placing of all dealing upon a cash basis and thefixing of "just quotations" some 15 per cent, above those ruling before theclosing in May. But further rises had to be allowed and the "Amens" Indexestablished for mid-October was 50 per cent, above the last figure in May:by February 1941 it was 100 per cent, higher and the rise continued at therate of about 10 per cent, a month. The Stock Exchange Commission firstissued a warning against exaggerated prices and stopped the publication of"b id " prices far above the market, while the pledging of securities as col-lateral was forbidden. As with relatively slight interruptions the "hausse"continued, the President of the Commission issued a new order in the middleof March 1941 prohibiting increases of quotations by more than one per cent,a day. About two weeks later a rise of two per cent, daily was permitted.The Luxemburg bourse was also reopened in August 1940, with the absenceof foreign securities, which formerly accounted for nine-tenths of the paperdealt in.
The Paris bourse was shut on 10th June 1940 (four days before theentry of German troops) and, except for an unsuccessful trial during a fewdays at the end of July, not opened again until 14th October. On the reopen-ing, quotations were confined to rentes and other government paper and to
— 167 —
industrial bonds: there were no dealings in shares. As the Bordeaux bourse(where shares had been quoted) was shut when Paris opened, there remainedno official market for shares in the occupied zone until the reintroduction ófshares in Paris on 19th March 1941. In the meantime an unofficial office-to-office market had grown up, with quotations based upon those in the un-occupied zone.
With Paris closed or restricted in scope, the importance of the provincialmarkets in the unoccupied zone increased, especially in Marseilles and Lyons.The Lyons bourse had been opened on 27th August for both bonds andshares and, after some initial weakness, a bull movement set in, with particularattention paid to shares of electrical and chemical works in the unoccupiedzone (less subject to raw-material difficulties than some others), as also ofindustries directly or indirectly having colonial or foreign interests. A number ofshares doubled in price during the bull movement. In many cases the demandwas so great in relation to the securities offered that there were difficultiesin establishing quotations-and, although rises were impressive, the shortageof material kept the turnover low. By March 1941 the yield of many shareswas down to about 1 or 2 per cent.
Rentes were also strong but, owing to the impossibility of arbitrage,considerable differences of quotations developed between Paris and the pro-vincial markets. The rise in rentes was checked at the end of the year butwas resumed in the new year, when yields were reduced to about 4% per cent.Further rises took place also in such government securities as the 4 per cent,rente 1925 (with a sterling clause) and the 4% per cent, rente 1937 (with adollar clause) which, on account of the foreign exchange guarantee, laterbecame subject to the tax on the increment resulting from the sale ofsecurities mentioned below, from which other government rentes are excepted.
Besides the regulation of technical questions as to cash payments andprior delivery of securities, special measures were taken, to enter into forceon the opening of the Paris share market in March 1941, for the purpose ofchecking an exaggerated rise in share values and suppressing illegitimate markets:shares were to be delivered only in registered form (or deposited with abank or stockbroker); single daily quotations were fixed and fluctuationsbeyond 5 per cent, in one day were not permitted (3 per cent, on provincialmarkets) ; dividends were limited and the coupon tax increased, while a taxon the increment resulting from the sale of securities was introduced on allshares bought from 19th March 1941 onwards. Foreign securities and thesecurities of French companies operating abroad might not be quoted inParis (though dealt in at Lyons). The immediate result of these measureswas a sharp contraction in the turnover.
The Amsterdam bourse, after a weak trend in the first months of theyear, was shut on 10th May 1940 and reopened gradually from 15th July onwards,at first for government bonds and, after the establishment of rates in unofficialdealing, for shares with official quotations. The opening was firm and inthe following months all securities previously quoted were listed for dealings,
— 168 —
including American shares (generally Dutch certificates) and German bondsand shares. Some Dutch shares, especially those of companies with foreigninterests, showed extraordinary rises from the low levels to which theyhad previously fallen. On 30th September and 24th October a number ofGerman shares not before quoted in Amsterdam were introduced and enjoyedan active market. In November the Dutch-German payments restrictions wererelaxed so that RM 5,000 per person and per month could be transferredfrom Germany to Holland without special permit, thus allowing the repaymentof Dutch claims on Germany or the acquisition by Germans of securitiesquoted in Holland. The abolition of exchange regulations between Hollandand Germany on 1st April 1941 opened the Amsterdam market to Germanpurchasers without restriction and a considerable rise in quotations ensued.
At the end of 1940 the share index was some 50 per cent, above theclosing figure in May but still somewhat below the 1938 average. Americanshares were quoted well above the New York parities, partly, but by nomeans wholly, for the reason that dividends were included in the price, owingto the impossibility of transfer. From 1st May 1941 the official quotation ofAmerican share certificates was suspended.
The Swiss bourses started the year weak and after a rather sharp declinewere closed from 10th May 1940, at the wish of the National Bank, whileoutside dealings between banks were restricted. On 1st July unofficial dealingson the exchanges were permitted experimentally and on 8th July the officialopening was made. Share trading was resumed, free of restrictions, whileminimum prices, 5 per cent, under those of 9th May, were introduced forgovernment bonds. But the bond market was firm and the share market quiet;the share index finished the year 1940 about 10 per cent, below the end of1939 but showed a sustained rise in the first months of 1941. Other stockexchanges temporarily closed during the year included those of Copenhagen(shut on 9th April and reopened for bonds on 28th May and shares on 6th June)and Oslo (shut on 9th April and reopened for bonds and shares on 21st May):the Hels ingfors exchange, which had been closed on the outbreak of warwith Russia near the end of 1939, was reopened in April 1940. In these threecases the share index was strong at the end of 1940 and into 1941 but apparentlywithout any very spectacular movements. The Athens share market wasweak in 1940, quotations in September being about 70 per cent, of the 1938average. Operations were suspended on 28th October, on the commencementof hostilities with Italy, but were resumed on 19th December, and from 30th January1941 maximum and minimum prices were fixed respectively 10 per cent, above'and 5 per cent, below the official rates on that day.
Of the stock exchanges that remained open throughout 1940, those ofMilan and London showed the most considerable fluctuations, Milan, however,ending nearly 20 per cent, higher and London over 20 per cent, lower on theyear. Milan quotations rose sharply on the outbreak of war in September1939 and, after some hesitation in November, upon the introduction of thecapital tax, finished the year strongly. In the first months of 1940 a setback
— 169 —
was experienced, due in part to a new tax on stock exchange profits, andaccentuated in May through the imminence of Italy's entry into the war andfears of a moratorium and of the closing of the exchanges. With the beginningof hostilities, the upward movement once more gained ground, carrying the indexin the autumn above the level at the end of 1939 and spurting in December1940 to a new high, but temporary, peak. A sharp reaction was caused on30th December 1940 and the following days, as a result of the doubling (from10 to 20 per cent.) of the dividend tax on shares, the lowering of the maximumlegal dividend rate from 8 to 7 per cent, and the imposition of a specialtax on the transformation of reserves into share capital. The share indexreached its lowest point of reaction near the end of January, after whichit rose again sharply, passing the December peak in March 1941. In thismonth the December restrictions were amended: dividends correspondingto the average distribution for the past three years were no longer subjectto curtailment, while exemptions were granted from the tax on the issue ofbonus shares (especially for companies which had reduced their capital duringthe period between 1928 and 1939). The market continued to be lively witha rising turnover in the following months. In March 1941 the yield on mostshares was reckoned at about 3 per cent, compared with over 5 per cent,on government bonds.
The London stock market was buoyant from the outbreak of war up toMarch 1940, when a landslide started which, by the end of June, had carriedthe index down by more than 30 per cent. From this point a slow but steadyrecovery raised quotations, so that at the end of January 1941 one-third of theloss had been regained. London share prices remained depressed, however,by the weight of direct taxation (in addition to income tax at 42% per cent.,a 100 per cent, excess profits duty was imposed in 1940), while, in somecases, difficulties of valuation have made cautious quotations desirable.
The Stockholm exchange was somewhat dull with a small turnoverexcept for a rather sharp rise in March 1940 (at the end of the Finnish-Russianwar) affecting especially factory shares.
Between the outbreak of the war and the end of 1940 the index of sharequotations on the Berl in bourse rose by 40 per cent. Taking advantage ofthe strong markets, the Prussian State Bank (Seehandlung), which had thetrusteeship of the shares accepted by the Reich in payment of the tax onJews in November 1938, continued its sales, and at the end of 1940 thereremained only a very small unsold balance. In view of market conditions itwas decided to reintroduce the so-called "speculation tax" (really an incometax on profits realised on the sale of shares within one year of purchase),which had been in abeyance for two years.
Two reasons for the rise in share quotations in Germany may be men-tioned: the fall of long-term interest rates and the narrowness of the sharemarket in the face of an increased demand. The rate of interest on newissues of Reich loans was reduced from 4% per cent, at the. end of 1939to 3% per cent, early in 1941, the yields falling accordingly. The average
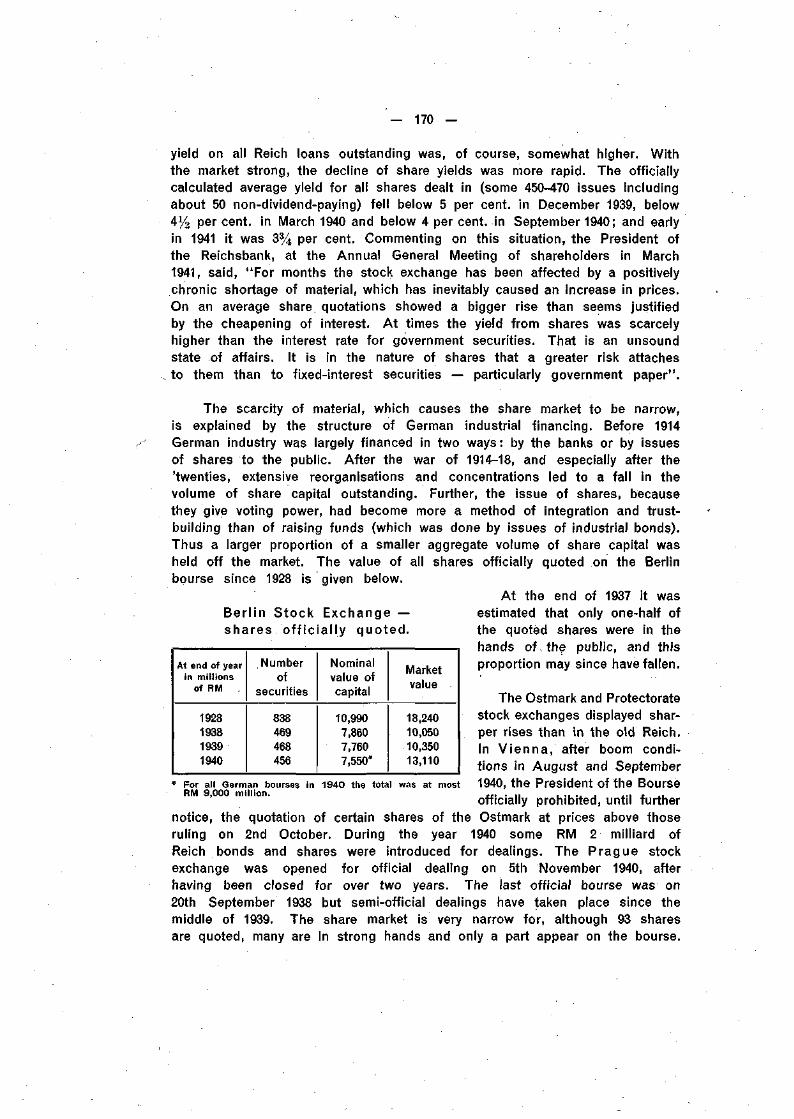
— 170 —
yield on all Reich loans outstanding was, of course, somewhat higher. Withthe market strong, the decline of share yields was more rapid. The officiallycalculated average yield for all shares dealt in (some 450-470 issues includingabout 50 non-dividend-paying) fell below 5 per cent, in December 1939, below4% per cent, in March 1940 and below 4 per cent, in September 1940; and earlyin 1941 it was 3% per cent. Commenting on this situation, the President ofthe Reichsbank, at the Annual General Meeting of shareholders in March1941, said, "For months the stock exchange has been affected by a positivelychronic shortage of material, which has inevitably caused an increase in prices.On an average share quotations showed a bigger rise than seems justifiedby the cheapening of interest. At times the yield from shares was scarcelyhigher than the interest rate for government securities. That is an unsoundstate of affairs. It is in the nature of shares that a greater risk attachesto them than to fixed-interest securities — particularly government paper".
The scarcity of material, which causes the share market to be narrow,is explained by the structure of German industrial financing. Before 1914German industry was largely financed in two ways: by the banks or by issuesof shares to the public. After the war of 1914-18, and especially after the'twenties, extensive reorganisations and concentrations led to a fall in thevolume of share capital outstanding. Further, the issue of shares, becausethey give voting power, had become more a method of integration and trust-building than of raising funds (which was done by issues of industrial bonds).Thus a larger proportion of a smaller aggregate volume of share capital washeld off the market. The value of all shares officially quoted on the Berlinbourse since 1928 is given below.
At the end of 1937 it wasBerl in Stock Exchange — estimated that only one-half ofshares of f ic ia l ly quoted. the quoted shares were in the
hands of, the public, and thisproportion may since have fallen.
The Ostmark and Protectoratestock exchanges displayed shar-per rises than in the old Reich.In V ienna, after boom condi-tions in August and September1940, the President of the Bourseofficially prohibited, until further
notice, the quotation of certain shares of the Ostmark at prices above thoseruling on 2nd October. During the year 1940 some RM 2 milliard ofReich bonds and shares were introduced for dealings. The Prague stockexchange was opened for official dealing on 5th November 1940, afterhaving been closed for over two years. The last official bourse was on20th September 1938 but semi-official dealings have taken place since themiddle of 1939. The share market is very narrow for, although 93 sharesare quoted, many are in strong hands and only a part appear on the bourse.
At end of yearin millions
of RM .
1928193819391940
Numberof
securities
838469468456
Nominalvalue ofcapital
10,9907,8607,7607,550*
Marketvalue
18,24010,05010,35013,110
* For all German bourses in 1940 the total was at mostRM 9,000 million.
— 171 —
With a sustained domestic demand as well as orders from the Reich, themarket opened very strong and rose steeply. The sensitive share index of.the National Bank (based on the quotations of ten important active shares),which was 125 at the time of the closing in 1938, was 253 on 5th November1940 and rose to 267 at the end of the year. For many securities only a "b id "quotation was available, at which no deal could be made. The National Bankcalculated the average yield of all shares quoted at 1.5 per cent, for December1940 (varying between 2.2 per cent, for the machine industry and 0.8 per cent,for the sugar factories). Various control measures were taken early in 1941.In particular, the quotation of "b id " prices above those at which dealingslast took place was forbidden, as well as dealings in shares outside thestock exchange at prices above those officially quoted.
Bucarest has been notable for extremely wide fluctuations in shareprices: before the outbreak of war in 1939 the official general index (basedon January 1926 = 100) was below 300; with a turnover up to twenty timesthe usual rate, oil shares doubled in price in October, while the general indexrose to 600 and, with a continuing high turnover, exceeded 900 in March 1940;from this point the index slid back to under 500 in* October 1940 and remainedwithin the 500-600 range in the following months. In Budapest share quota-tions rose by 50 per cent, from August 1939 to January 1940, but fell awayto October, losing about half the ground previously gained. From November1940 to February 1941, a further rise of over 50 per cent, took quotations toa level about double that preceding the war. The stock exchange inBrat is lava (Pressburg), capital of Slovakia, was opened on 15th October 1940and maintained a very strong tone until the end of the year, when quotationswere generally about one-third higher than at the opening.
In all cases where stock exchanges have been reopened after an abruptclose, special measures have been taken regarding uncompleted forwardcontracts, outstanding loans on securities (such as "prolongatie" in Amsterdam)and similar technical matters, in order to facilitate dealings'. In addition to thefactors which tend indirectly to . weigh on share quotations (war damage,heavy direct taxation, limitation of dividends, etc.) governments or stock-exchange authorities have found it necessary to take measures to checkunwarranted price rises and the development of black markets, especially inthose bourses which have been recently reopened. Generally, stock exchangeshave been reopened first for bonds and later for share dealing, introduced bydegrees — in Paris only after five months. Other measures may be summarisedas follows:
a) dealings only for cash and no forward markets (general) ;b) verbal warnings, official or semi-official, against exaggerated rises of
quotations (in several instances) ;c) the fixing of minimum prices (Oslo);d) fixing of maximum price rises for any single day (Brussels and Prague);e) fixing of maximum quotations (the "price-stop" in Vienna);f) fixing of one quotation a day (Paris) ;
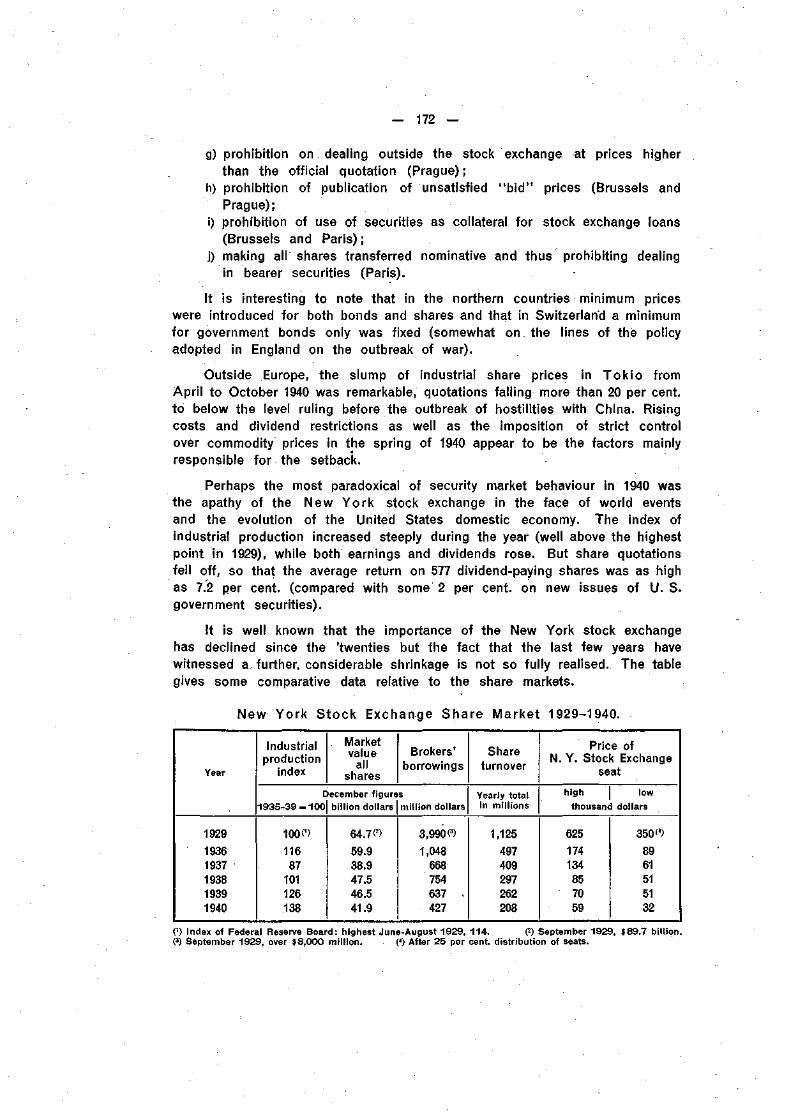
— 172 —
g) prohibition on dealing outside the stock exchange at prices higherthan the official quotation (Prague) ;
h) prohibition of publication of unsatisfied "b id " prices (Brussels andPrague);
i) prohibition of use of securities as collateral for stock exchange loans(Brussels and Paris) ;
j) making all shares transferred nominative and thus prohibiting dealingin bearer securities (Paris). ;
It is interesting to note that in the northern countries minimum priceswere introduced for both bonds and shares and that in Switzerland a minimumfor government bonds only was fixed (somewhat on the lines of thè policyadopted in England on the outbreak of war).
Outside Europe, the slump of industrial share prices in Tokio fromApril to October 1940 was remarkable, quotations falling more than 20 per cent,to below the level ruling before the outbreak of hostilities with China. Risingcosts and dividend restrictions as well as the imposition of strict controlover commodity prices in the spring of 1940 appear to be the factors mainlyresponsible for the setback.
Perhaps the most paradoxical of security market behaviour in 1940 wasthe apathy of the New York stock exchange in the face of world eventsand the evolution of the United States domestic economy. The index ofindustrial production increased steeply during the year (well above the highestpoint in 1929), while both earnings and dividends rose. But share quotationsfell off, so that the average return on 577 dividend-paying shares was as highas 7.2 per cent, (compared with some 2 per cent, on new issues of U.S.government securities).
It is well known that the importance of the New York stock exchangehas declined since the 'twenties but the fact that the last few years havewitnessed a- further, considerable shrinkage is not so fully realised. The tablegives some comparative data relative to the share markets.
New York Stock Exchange Share Market 1929-1940.
Year
1929
19361937193819391940
Industrialproduction
index
Marketvalue
allshares
Brokers'borrowings
December figures1935-39 = 100
100«11687
101126138
billion dollars
64.7«59.938.947.546.541.9
million dollars
3,990 P)1,048
668754637 ,427
Shareturnover
Yearly totalin millions
1,125497409297262208
Price ofN. Y. Stock Exchange
seat
high low
thousand dollars
625174134857059
350«8961515132
0) Index of Federal Reserve Board: highest June-August 1929, 114. (2) September 1929, S89.7 billion.(3) September 1929, over $8,000 million. (4) After 25 per cent, distribution of seats.
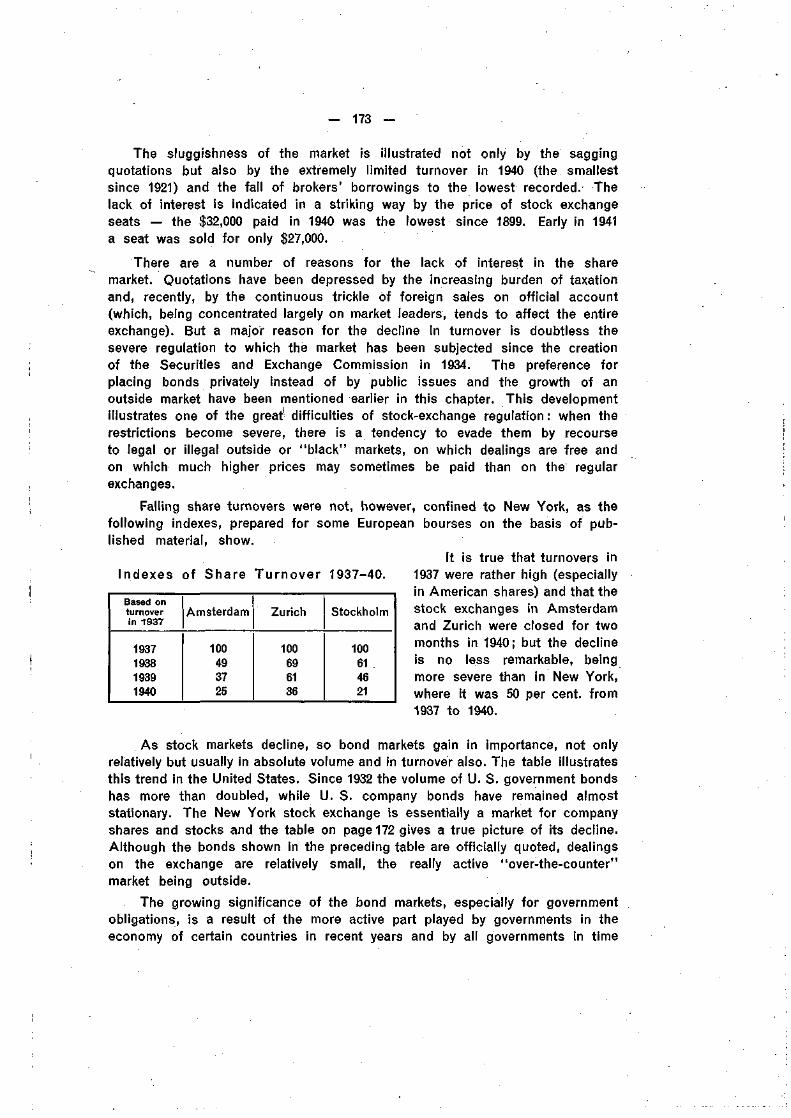
— 173 —
The sluggishness of the market is illustrated not only by the saggingquotations but also by the extremely limited turnover in 1940 (the smallestsince 1921) and the fall of brokers' borrowings to the lowest recorded. Thelack of interest is indicated in a striking way by the price of stock exchangeseats — the $32,000 paid in 1940 was the lowest since 1899. Early in 1941a seat was sold for only $27,000.
There are a number of reasons for the lack of interest in the sharemarket. Quotations have been depressed by the increasing burden of taxationand, recently, by the continuous trickle òf foreign sales on official account(which, being concentrated largely on market leaders, tends to affect the entireexchange). But a major reason for the decline in turnover is doubtless thesevere regulation to which the market has been subjected since the creationof the Securities and Exchange Commission in 1934. The preference forplacing bonds privately instead of by public issues and the growth of anoutside market have been mentioned earlier in this chapter. This developmentillustrates one of the great1 difficulties of stock-exchange regulation : when therestrictions become severe, there is a tendency to evade them by recourseto legal or illegal outside or "black" markets, on which dealings are free andon which much higher prices may sometimes be paid than on the regularexchanges.
Falling share turnovers were not, however, confined to New York, as thefollowing indexes, prepared for some European bourses on the basis of pub-lished material, show.
It is true that turnovers in1937 were rather high (especiallyin American shares) and that thestock exchanges in Amsterdamand Zurich were closed for twomonths in 1940; but the declineis no less remarkable, beingmore severe than in New York,where it was 50 per cent, from1937 to 1940.
As stock markets decline, so bond markets gain in importance, not onlyrelatively but usually in absolute volume and in turnover also. The table illustratesthis trend in the United States. Since 1932 the volume of U. S. government bondshas more than doubled, while U. S. company bonds have remained almoststationary. The New York stock exchange is essentially a market for companyshares and stocks and the table on page 172 gives a true picture of its decline.Although the bonds shown in the preceding table are officially quoted, dealingson the exchange are relatively small, the really active "over-the-counter"market being outside.
The growing significance of the bond markets, especially for governmentobligations, is a result of the more active part played by governments in theeconomy of certain countries in recent years and by all governments in time
Indexes of Share Turnover 1937-40.
Based onturnoverin 1937
1937193819391940
Amsterdam
100493725
Zurich
100696136
Stockholm
100614621
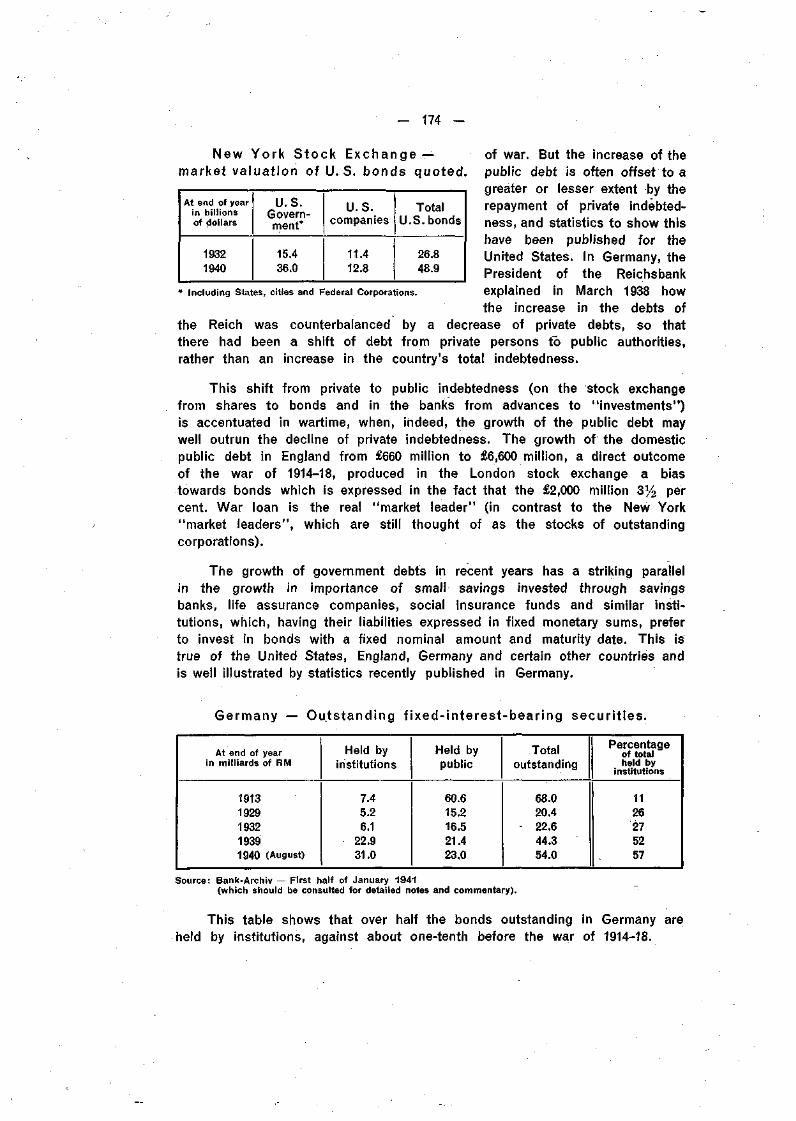
- 174 -
At end of yearin billionsof dollars
19321940
U.S.Govern-ment*
15.436.0
U.S.companies
11.412.8
TotalU.S.bonds
26.848.9
* Including States, cities and Federal Corporations.
New York Stock Exchange— of war. But the increase of themarket valuat ion of U.S. bonds quoted, public debt is often offset to a
greater or lesser extent by therepayment of private indebted-ness, and statistics to show thishave been published for theUnited States. In Germany, thePresident of the Reichsbankexplained in March 1938 howthe increase in the debts of
the Reich was counterbalanced by a decrease of private debts, so thatthere had been a shift of debt from private persons to public authorities,rather than an increase in the country's total indebtedness.
This shift from private to public indebtedness (on the stock exchangefrom shares to bonds and in the banks from advances to "investments")is accentuated in wartime, when, indeed, the growth of the public debt maywell outrun the decline of private indebtedness. The growth of the domesticpublic debt in England from £660 million to £6,600 million, a direct outcomeof the war of 1914-18, produced in the London stock exchange a biastowards bonds which is expressed in the fact that the £2,000 million 3% percent. War loan is the real "market leader" (in contrast to the New York"market leaders", which are still thought of as the stocks of outstandingcorporations).
The growth of government debts in recent years has a striking parallelin the growth in importance of small savings invested through savingsbanks, life assurance companies, social insurance funds and similar insti-tutions, which, having their liabilities expressed in fixed monetary sums, preferto invest in bonds with a fixed nominal amount and maturity date. This istrue of the United States, England, Germany and certain other countries andis well illustrated by statistics recently published in Germany.
Germany — Outstanding f ixed- in teres t -bear ing secur i t ies.
At end of yearin milliards of RM
19131929193219391940 (August)
Held byinstitutions
7.45.26.1
22.931.0
Held bypublic
60.615.216.521.423.0
Totaloutstanding
68.020.4
- 22.644.354.0
Percentageof totalheld by
institutions
1126275257
Source: Bank-Archiv — First half of January 1941(which should be consulted for detailed notes and commentary).
This table shows that over half the bonds outstanding in Germany areheld by institutions, against about one-tenth before the war of 1914-18.
— 175 —
Government securities, long and short, are becoming the preponderatinginvestment of commercial and savings banks, of life assurance companiesand social funds almost throughout the world^The^l i f f icïï l t ies caused by~the low yields have been mentioned as regards the United States, but arein no way confined to that country and are, indeed, widespread. Anotheraspect of the relative decline of business and other private borrowing is theprofound change in the structural form of the total indebtedness, particularlyin relation to the underlying assets. In other words, there is a change fromthe more or less illiquid private loan, bank advance or direct mortgage tothe comparatively liquid Treasury bill or "shiftable" obligation (i. e. saleable ona regular market). This, indeed, is not a new phenomenon but one observableover the past half-century and related to the development of the joint-stockprinciple, of the urban population and of the comparative importance of smallsavings and to the increase of government debts. A study made of the growthin volume of bank notes and bank deposits, of negotiable instruments,bonds, shares and other liquid or "shiftable" paper in the United States*showed that the ratio of these "liquid claims" to total national wealth rosefrom 15 per cent, in 1890 to 25 per cent, before the war of 1914-18 andto 40 per cent, in 1930. And there has doubtless been an increase sincethat time, for the Federal debt has more than doubled while the volume ofnotes and bank deposits is also higher. In other countries too there hasbeen a similar growth of "liquid claims" especially in the form of governmentsecurities in recent years, claims which, for current financing purposes, thegovernments cannot for long allow to become illiquid through the closingof stock exchanges or in other ways. The events of 1940 showed how everyeffort was made to avoid moratoria and how bond markets were kept openor rapidly reopened, even in the midst of catastrophe. Because sound warfinancing implies the voluntary subscription of savings, government bondmarkets remain an important part of the relatively "free sector" in everycountry.
It is an ironical fact of the present times that the destruction of nationalwealth through warfare is facilitated by the creation of more "liquid claims",in the form of government bonds, to the aggregate wealth that remains. InEngland, the compulsory insurance against war damage has been introducednot only to ensure an equitable distribution of sacrifice but also to preserve thecomplex structure of debts and claims which has been erected. The volumeof government indebtedness is everywhere growing both absolutely and inrelation to the national wealth, and important problems will call for solution inthe post-war period when working capital and other funds invested temporarilyin government securities are wanted for their normal purposes.
* See "Liquid Claims and Nation Wealth" by Berle & Pedérson 1934.
- 176 -
VI. CENTRAL BANKING DEVELOPMENTS.
Many important factors relating to central banking activity during the yearhave already been mentioned earlier in this Report, especially in chapters II(1) and V. At the beginning of the war, or shortly afterwards, nearly all Europeancentral-bank statutes were modified to give greater elasticity for direct lendingto the governments and to allow the release of gold and foreign exchangefor foreign payments without a contraction of the note circulation or of bankers'cash, and further steps in this direction were taken in 1940. The advent ofwar, indeed, brought an expansion of central-bank credit in most Europeancountries for the needs óf the government and, at times of emergency, tocover withdrawals of deposits by the public from the other banks. Thegrowing liquidity of the markets as a result of government spending occasionedconsiderable repayments of private credit previously granted by both the centraland the commercial banks, but note circulations continued to rise, in somecases with increased rapidity.
Modifications were made in the laws and statutes governing the activityof central banks to allow further direct lending to the government inFrance and Algeria, in Bulgaria, Turkey, Greece and Roumania during 1940.By two conventions of 29th February and 9th June 1940, the amount of pro-visional advances granted by the Bank of France to the government wasraised to Fr.fcs 70 milliard, a limit which was nearly attained early in Octoberbut which has not been exceeded. On 25th August .1940 a special advancewas granted by the Bank of France to the government to cover occupationcosts, the total of permissible advances on this account being successivelyraised to Fr.fcs 108 milliard in May 1941. The Bank of Algeria was authorisedby a law of 31st December 1940 to place at the disposal of the FrenchGovernment a further advance of Fr.fcs 1 milliard and an advance ofFr.fcs 50 million to the government of Algeria, the legal maximum of the notecirculation being raised at the same time from Fr.fcs 5 to 7 milliard.
Further resources for government credit were given in Bulgaria by alaw of 9th March 1940: the National Bank had previously been authorised toplace an amount not exceeding 20 per cent, of its paid-up capital and reservesin government or government-guaranteed securities. The new law authorisedthe Bank in addition to invest a sum not exceeding 140 per cent, of its paid-upcapital and reserves in Treasury bonds maturing in, at most, seven years,issued to foreign firms in payment of government supplies. A law of 30th May1940 authorised the Turk ish Treasury to contract extraordinary advances fromthe central bank to the extent of £T 250 million. The legal limit for the tempo-rary advances of the Bank of Greece to the Greek Government was raised
— 177 —
from Dr. 400 million to Dr. 1,000 million by a law of 18th October 1940. InRoumania, by a decision of the Council of Ministers dated 29th March 1940,the National-Bank-s powers-were-widened-as-regards thegranting-of-eredrMoagriculturists as well as to the government. The limit on the discount of agriculturalbills up to nine months' maturity, previously fixed at 40 per cent, of the billportfolio, was removed. Further, the discounting of Treasury bills by privatepersons had been limited to 20 per cent, of the Bank's capital, and advancesor overdrafts on government or publicly-guaranteed securities to 30 per cent,of the bill portfolio, while the purchase of government or government-guaranteed securities was limited to the total of the capital and reserves.The new law authorised the General Council of the Bank to draw up temporaryrules regarding these operations so long as the "exceptional circumstances"obtained.
As regards gold reserves new laws were passed in 1940 and revaluationswere made in France (February),' Holland (March), Roumania (April) andSwitzerland (May), in each case the book profit going largely, if not wholly, tothe government to cover defence and other expenditure. In the Protectorate ofBohemia and Moravia the gold price was lowered when the exchange wasadjusted upwards to the Reichsmark at the end of September: the gold reserveof the National Bank was written down in value, special measures being takento deal with the book loss of K. 207 million. A change was made in the lawgoverning the Sveriges Riksbank, which had previously limited the gold holdingof the Bank eligible as primary reserve to the gold held in Sweden, plus goldheld abroad or in transport up to 15 per cent, of the total reserve. By a royalordinance of 31st January 1940 the gold reserve of the Bank now constitutesall gold and bullion held by Sveriges Riksbank, wherever its location. Further,while the gold reserve remains in the books at par value, market value hasbeen taken for the calculation of cover requirements since that time.
Modifications of laws and statutes have also been made during the yearwith regard to the internal admin is t ra t ion of the central banks in Roumania(29th March), Yugoslavia (14th September), France (24th November) and théFrench colonial banks in Indo-China, Madagascar and French West Africa,as well as the Bank of Algeria.
The most interesting of these changes were those affecting the Bankof France. The reform of 1936 maintained the principle of the Bank's funda-mental statutes of 1808 that the direction of the affairs of the Bank shouldbe exercised by a governor appointed by the state and assisted by two deputygovernors. But that reform replaced the fifteen regents of the Bank (electedby the two hundred largest shareholders) by a General Council of twentymembers, of which only two were elected by the shareholders, nine representingeconomic and social interests (six chosen by the government) and nine thecollective interests of the nation, chosen from amongst the highest officials. Thenew law of 24th November 1940 allows this organisation to continue but reducesthe number of councillors from twenty to eleven : three chosen by the share-holders, four by the government from among representatives of commerce,
— 178 —
industry and agriculture, three persons with official positions (the Director ofthe Caisse des Dépôts et Consignations, the Governor of the Crédit Foncierand the Director-General of the Crédit National), while one councillor ischosen from the personnel of the Bank. Thus, although the number of coun-cillors is reduced, the shareholders are better represented and there are no longerany officials representing the various services of the government. Similar ad-ministrative reforms were made at the same time to the Crédit Foncier andthe Crédit National, in both cases only the highest executive being' the repre-sentative of the state.
Three European central banks suspended operations in 1940 when theBalt ic States were attached to the U. S. S. R. and the rouble currencyintroduced. A new Bank of Issue in Brussels was constituted on27th June 1940 by a decree of the German Military Commander for Belgiumand Northern France. The Bank, which is a joint-stock company under Belgianlaw, has a capital of B.fcs 150 million (subscribed by the Belgian commercialbanks). The Bank's statutes follow the general line of central-bank law modifiedby the conditions of its creation. The Bank is authorised to issue notesexpressed in Belgian francs which, if issued, would be legal tender; but,as already mentioned earlier in this Report, no bank-notes have been issued— the Issue Bank having become in practice the banking department of theNational Bank, entrusted particularly with relations with the occupying authorities,the management of the clearings and the accounts of the Reichskreditkassen,while the postal cheque accounts have also been transferred to it. Thecreation of a new central reserve bank in China has been mentioned inchapter II (1). By a decree of 10th August 1940 the Egyptian Governmentgave force of law to modifications made in the statutes of the National Bankof Egypt in 1939, lengthening the term for which the Bank had the note-issue privilege and making certain administrative changes.
Though actual changes in the laws and statutes governing central bankshave not been numerous during the past year, measures taken affecting centralbanks directly or indirectly in an administrative or other capacity have farexceeded the experience of recent years. It is only necessary to mentionsome of the tasks carried out by central banks to indicate the wide fieldcovered. '
a) Temporary legal and other arrangements were made regarding theremoval of offices and administration in times of emergency, and in someinstances actual removals took place.
b) Numerous exchanges of bank-notes and other means of paymenthave been made in attached and occupied territories, generally involvingchanges of book-keeping into the new currency. In the occupied territoriesarrangements have been concluded, making the national currency availableto the occupying authorities and providing for the withdrawal of previouslyissued Reichskreditkassenscheine. These central banks work with thesupervision of a German Commissioner appointed by the occupyingauthorities.
- 179 -
c) Foreign exchange regulations have generally been made watertightand in many cases adapted to the German model. In Roumania the premiumsgiven for gold produced in the country and sold to the National Bank havebeen changed. As European gold reserves are now mostly held outsideEurope and foreign exchange reserves in sterling and dollars are largelyunavailable, the importance of the Reichsmark holding has considerablyincreased for certain central banks, not only in volume but in turnover.
d) Numerous new bilateral clearing and payments agreements, eitherthrough the central bank or through an associated institution, have beenmade during the year. Of particular practical importance has been themobilisation of clearing "Spitzen" through central-bank credit.
e) Mobilisations of foreign securities have taken place, as also theregistration and management of enemy property and, in occupied territories,the property of the enemies of the occupying authorities (as well as therestitution of the property of the occupying authorities or their nationalspreviously placed under supervision).
f) Small notes have been issued in some cases to supplement thecoinage, while nickel and bronze coins have been withdrawn (involvingthe disappearance of the well-known French "sou").
The Reichsbank in particular has been cailed upon for numerousadministrative and other tasks. The Reichskreditkassen, which closely followedthe German army in the field, were manned by Reichsbank personnel (althoughthe institutions were, of course, completely separate) and the managementof the circulation of Reichskreditkassenscheine and their withdrawal were thussupervised by Reichsbank staff. Reichsbank notes, which had previously beenissued in the Saar (February 1935), Austria (March 1938), the Sudeten territory(October 1938), Memel (March 1939), Danzig (September 1939) and theincorporated territories of Poland (November 1939), were issued during 1940in Eupen, Malmedy and Moresnet (June), and in Alsace, Lorraine andLuxemburg (August). Not only were Reichsbank notes introduced in thesecases but book-keeping and other accounts were changed over intoReichsmarks.
One feature of central bank balance sheets has been common to allcountries — the increase of the note circulation, particularly during the pasttwo years. The accompanying graph gives end-of-year figures for elevenEuropean and three overseas countries. Certain European countries have beenomitted from the statistics for lack of recent data, e.g. Italy, Spain and Norway,and others owing to the incomparability of the data, e. g. Czecho-Slovakia.In other instances, such as Austria, Danzig and the three Baltic States, thebanks of issue have been incorporated as branches of other central banks.
The note circulations at the end of 1929 have been taken as the basis for thecalculation of indexes which give the proportionate increase of note circulation inthe countries covered by the graph on the next page. Although differences and
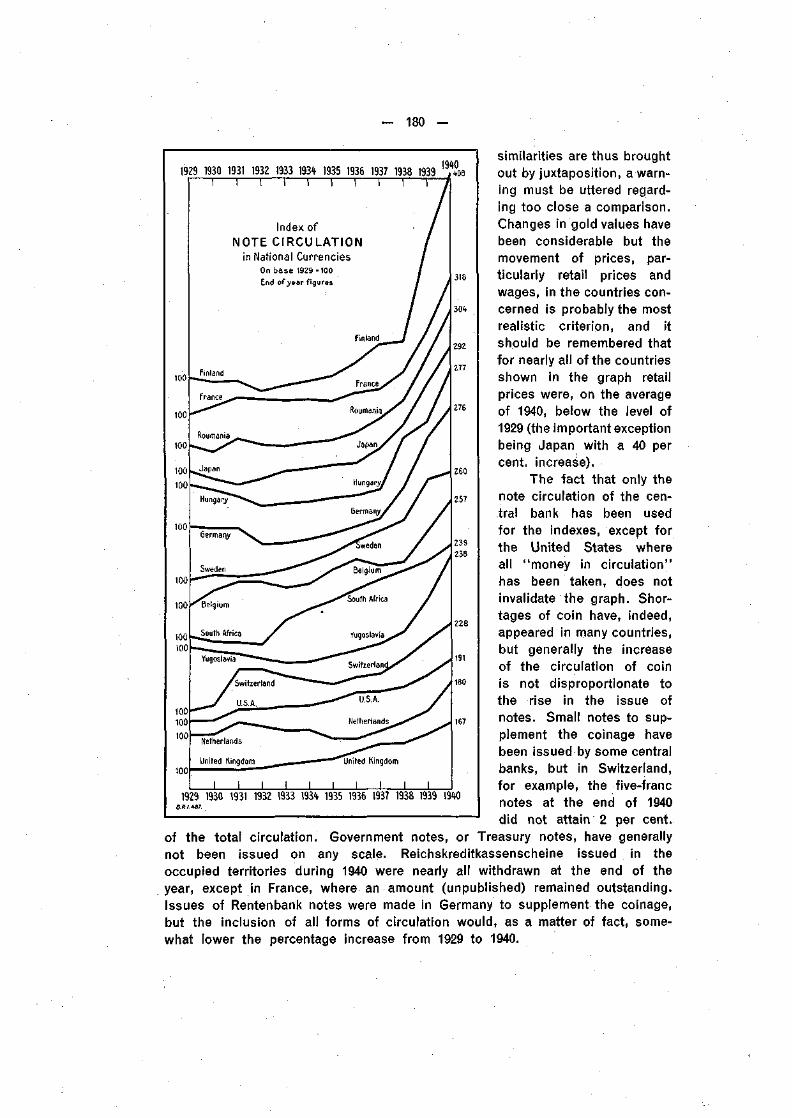
180 —
similarities are thus broughtout by juxtaposition, a warn-ing must be uttered regard-ing too close a comparison.Changes in gold values havebeen considerable but themovement of prices, par-ticularly retail prices andwages, in the countries con-cerned is probably the mostrealistic criterion, and itshould be remembered thatfor nearly all of the countriesshown in the graph retailprices were, on the averageof 1940, below the level of1929 (the important exceptionbeing Japan with a 40 percent, increase).
The fact that only thenote circulation of the cen-tral bank has been usedfor the indexes, except forthe United States whereall "money in circulation"has been taken, does notinvalidate the graph. Shor-tages of coin have, indeed,appeared in many countries,but generally the increaseof the circulation of coinis not disproportionate tothe rise in the issue ofnotes. Small notes to sup-plement the coinage havebeen issued by some centralbanks; but in Switzerland,for example, the five-francnotes at the end of 1940did not attain 2 per cent,
of the total circulation. Government notes, or Treasury notes, have generallynot been issued on any scale. Reichskreditkassenscheine issued in theoccupied territories during 1940 were nearly all withdrawn at the end of theyear, except in France, where an amount (unpublished) remained outstanding.Issues of Rentenbank notes were made in Germany to supplement the coinage,but the inclusion of all forms of circulation would, as a matter of fact, some-what lower the percentage increase from 1929 to 1940.
1929 1930 1931 1932 1933 193* 1935
100
100
100
100
100
100
100
100
100100
100100
100
100
1 1 I I 1 1
Index of
1936 1937 1938 19391 I 1 1
NOTE CIRCULATION /in National Currencies /
On base 1929-100End of year figures
Finland ^S
" \ — " "
•Roumania _ _ _ * »
^ ^ — -
^Japan ^^
• • ^ • ^ ^
Germany ^ ^ ^ >^^
Sweden " ^ ^ .^^^
^Belgium ^j**1^
South Africa /
—Yiinn'l i n J*<*^
/Switzerland ' *»
Netherlands . ™ ~
United Kingdom
1 I I 1 1 11929 1930 1931 1932 1933 1934 1935
B.R.I.487.
/
/
/ /
Finland 7 / /
y J//France/ / /
" J/ 1Roumania/ / /
*S / J â
^ / / /Japan/ / /
6erman^^ / .
--<^^ /^ ^ • ^ /»•'Sweden /
Belgium ^f*^
South Africa /
/
^ * ^ /Switzerland/''^ ^
•*" us.A. y
yNetherlands - ^ ' ^ ' ^
United Kingdom
1 1 1 11936 1937 1938 1939
,940 8
/
/(
/f
/fJ/
/
/
à
/
y/y
318
304-
292
277
276
260
257
239238
228
191
180
167
1910
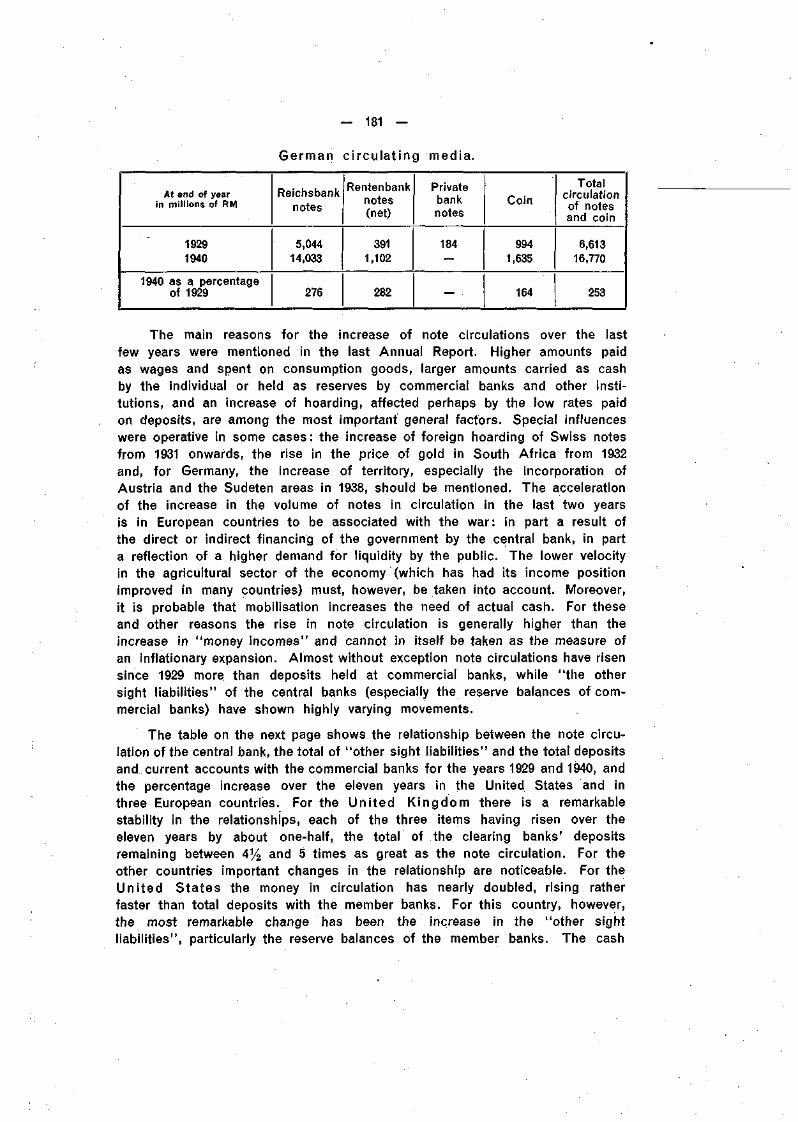
- 181 -
German c i rcu lat ing media.
At end of yearin millions of RM
19291940
1940 as a percentageot 1929
Reichsbanknotes
5,04414,033
276
Rentenbanknotes(net)
3911,102
282
Privatebanknotes
184
—
Coin
9941,635
164
Totalcirculationof notesand coin
6,61316,770
253
The main reasons for the increase of note circulations over the lastfew years were mentioned in the last Annual Report. Higher amounts paidas wages and spent on consumption goods, larger amounts carried as cashby the individual or held as reserves by commercial banks and other insti-tutions, and an increase of hoarding, affected perhaps by the low rates paidon deposits, are among the most important general factors. Special influenceswere operative in some cases: the increase of foreign hoarding of Swiss notesfrom 1931 onwards, the rise in the price of gold in South Africa from 1932and, for Germany, the increase of territory, especially the incorporation ofAustria and the Sudeten areas in 1938, should be mentioned. The accelerationof the increase in the volume of notes in circulation in the last two yearsis in European countries to be associated with the war: in part a result ofthe direct or indirect financing of the government by the central bank, in parta reflection of a higher demand for liquidity by the public. The lower velocityin the agricultural sector of the economy (which has had its income positionimproved in many countries) must, however, be taken into account. Moreover,it is probable that mobilisation increases the need of actual cash. For theseand other reasons the rise in note circulation is generally higher than theincrease in "money incomes" and cannot in itself be taken as the measure ofan inflationary expansion. Almost without exception note circulations have risensince 1929 more than deposits held at commercial banks, while "the othersight liabilities" of the central banks (especially the reserve balances of com-mercial banks) have shown highly varying movements.
The table on the next page shows the relationship between the note circu-lation of the central bank, the total of "other sight liabilities" and the total depositsand current accounts with the commercial banks for the years 1929 and 1940, andthe percentage increase over the eleven years in the United States and inthree European countries. For the United Kingdom there is a remarkablestability in the relationships, each of the three items having risen over theeleven years by about one-half, the total of the clearing banks' depositsremaining between 4% and 5 times as great as the note circulation. For theother countries important changes in the relationship are noticeable. For theUnited States the money in circulation has nearly doubled, rising ratherfaster than total deposits with the member banks. For this country, however,the most remarkable change has been the increase in the "other sightliabilities", particularly the reserve balances of the member banks. The cash
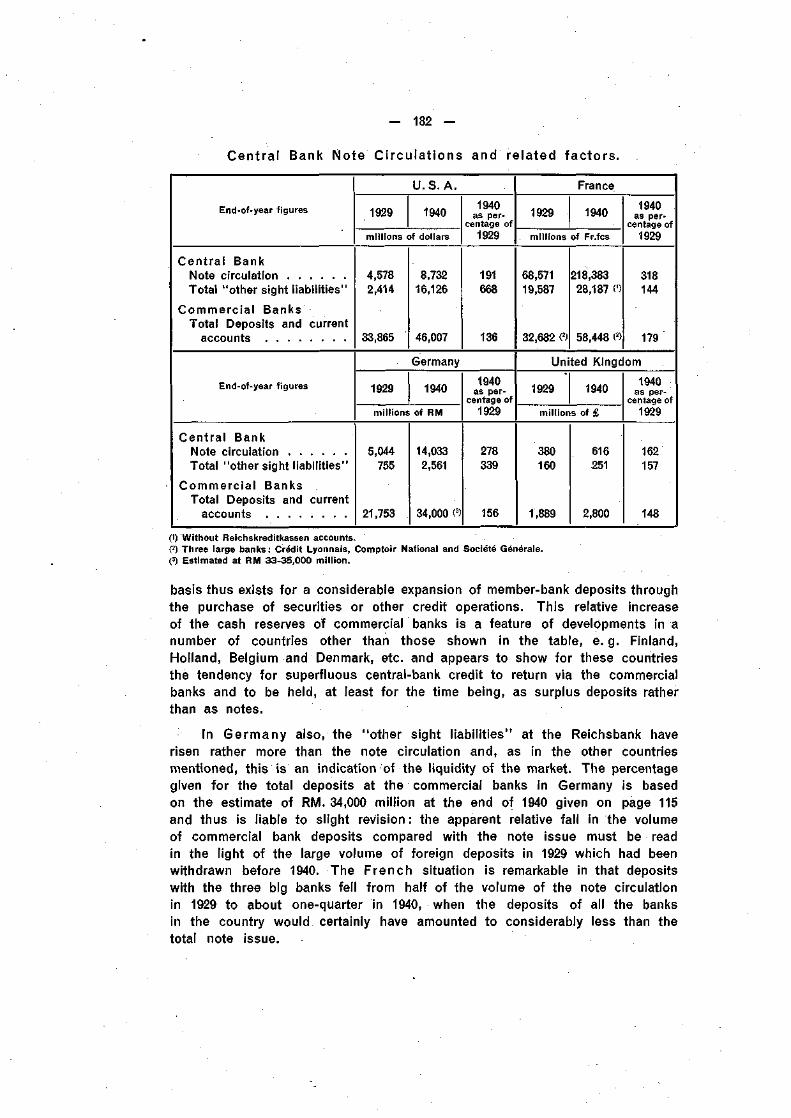
— 182 —
Central Bank Note Ci rcu la t ions and related factors .
End-of-year figures
Central BankNote circulationTotal "other sight liabilities"
Commercial BanksTotal Deposits and current
accounts
End-of-year figures
Central BankNote circulationTotal "other sight liabilities"
Commercial BanksTotal Deposits and current
accounts
U.S.A.
1929 1940
millions of dollars
4,5782,414
33,865
8,73216,126
46,007
1940as per-
centage of1929
191668
136
Germany
1929 1940
millions of RM
5,044755
21,753
14,0332,561
34,000 «
1940as per-
centage of1929
278339
156
France
1929 1940
millions of Fr.fcs
68,57119,587
32,682 O
218,38328,187 (')
58,448 O
1940as per-
centage of1929
318144
179
United Kingdom
1929 1940
millions of £
380160
1,889
616251
2,800
1940as per-
centage of1929
162157
148
(1) Wi thout Reichskreditkassen accounts.(2) Three large banks : Crédit Lyonnais, Comptoir National and Société Générale.(3) Estimated at RM 33-35,000 mi l l ion .
basis thus exists for a considerable expansion of member-bank deposits throughthe purchase of securities or other credit operations. This relative increaseof the cash reserves of commercial banks is a feature of developments in anumber of countries other than those shown in the table, e. g. Finland,Holland, Belgium and Denmark, etc. and appears to show for these countriesthe tendency for superfluous central-bank credit to return via the commercialbanks and to be held, at least for the time being, as surplus deposits ratherthan as notes.
In Germany also, the "other sight liabilities" at the Reichsbank haverisen rather more than the note circulation and, as in the other countriesmentioned, this is an indication of the liquidity of the market. The percentagegiven for the total deposits at the commercial banks in Germany is basedon the estimate of RM. 34,000 million at the end of 1940 given on page 115and thus is liable to slight revision : the apparent relative fall in the volumeof commercial bank deposits compared with the note issue must be readin the light of the large volume of foreign deposits in 1929 which had beenwithdrawn before 1940. The French situation is remarkable in that depositswith the three big banks fell from half of the volume of the note circulationin 1929 to about one-quarter in 1940, when the deposits of all the banksin the country would certainly have amounted to considerably less than thetotal note issue.
— 183 —
To obtain a complete picture it would naturally be desirable to trace thechanges in the relationships shown in the tables through the years and toconsider other factors such as the volume of savings deposits. But the tablebrings out the fact, which is confirmed by calculations for other countries,that generally the rise of note circulations has been more rapid than the increasein the volume of bank deposits in recent years, even in countries such asthe United States, where the cheque habit is well developed.
In time of war the central banks, as the ultimate source of liquidity, arenaturally exposed to heavy strain. In this connection it is pertinent to pointout that both in the United Kingdom and in Germany direct borrowing fromthe central bank has been on a very small scale and utilised only to evenout temporary irregularities of receipts and expenditures. In the calendaryear 1940 the published statistics show the direct advance of the Bank ofEngland to the Treasury at its highest point of £50 million in December,compared with an average note circulation of £580 million and total budgetexpenditure of £3,300 million: similarly, the working credit granted, by theReichsbank to the German Government touched RM 685 million in Junecompared with an average note circulation of RM 12,200 million and totalreceipts from taxation and borrowing of RM 60,000 million. In both casesdirect advances from the central bank did not exceed 2 per cent, of annualbudget expenditure.
Indirect government borrowing and other influences are, however, alsoof importance and, in the end, the currency system will only escape com-paratively unscathed where internal war financing is effected from currenttaxation, and through the borrowing of genuine savings. No doubt, dangerousdevelopments are scarcely concealed in many countries and, if they are notarrested, the task of setting right currency troubles when the war is overwill be far from easy. In wartime it is inevitable that central banks, asindeed all other institutions, must come largely under government controland participate to their utmost in the effort of their countries. But theirprincipal contribution even then should be to uphold fundamental principles,the non-observance of which would not only render post-war reconstructionand adaptation more difficult but might also impair the war effort itself.
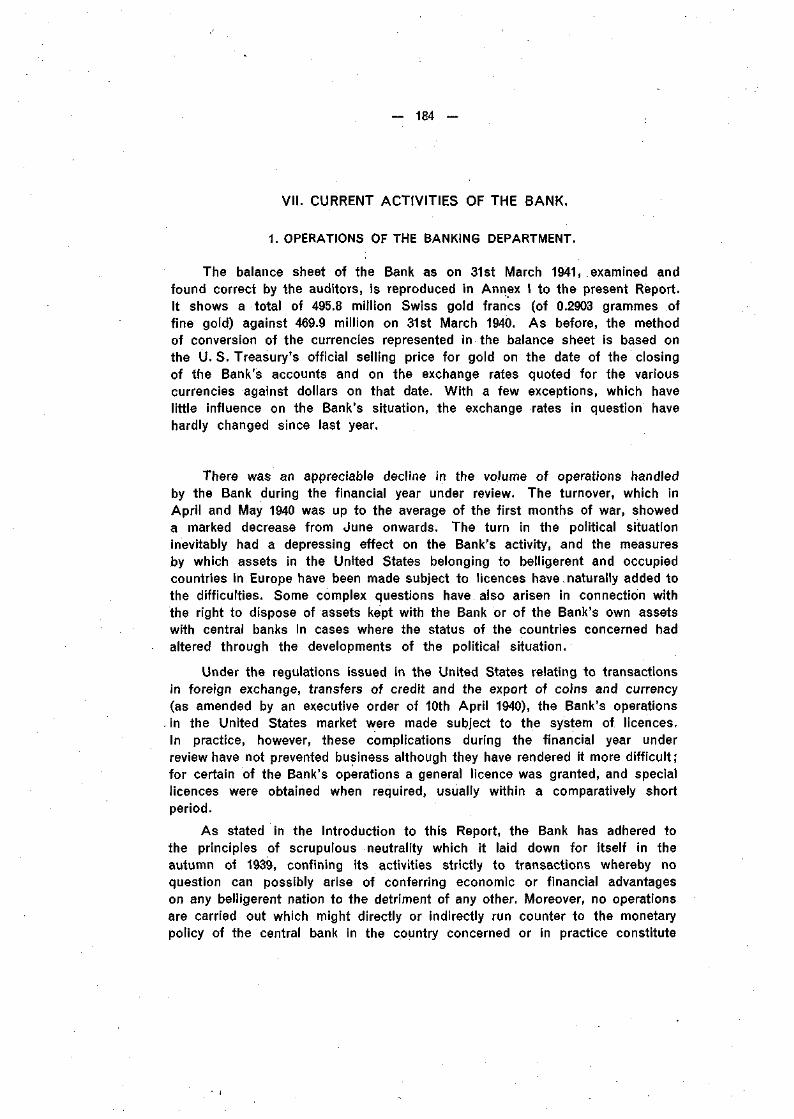
— 184
VII. CURRENT ACTIVITIES OF THE BANK.
1. OPERATIONS OF THE BANKING DEPARTMENT.
The balance sheet of the Bank as on 31st March 1941, examined andfound correct by the auditors, is reproduced in Annex I to the present Report.It shows a total of 495.8 million Swiss gold francs (of 0.2903 grammes offine gold) against 469.9 million on 31st March 1940. As before, the methodof conversion of the currencies represented in the balance sheet is based onthe U. S. Treasury's official selling price for gold on the date of the closingof the Bank's accounts and on the exchange rates quoted for the variouscurrencies against dollars on that date. With a few exceptions, which havelittle influence on the Bank's situation, the exchange rates in question havehardly changed since last year.
There was an appreciable decline in the volume of operations handledby the Bank during the financial year under review. The turnover, which inApril and May 1940 was up to the average of the first months of war, showeda marked decrease from June onwards. The turn in the political situationinevitably had a depressing effect on the Bank's activity, and the measuresby which assets in the United States belonging to belligerent and occupiedcountries in Europe have been made subject to licences have,naturally added tothe difficulties. Some complex questions have also arisen in connection withthe right to dispose of assets kept with the Bank or of the Bank's own assetswith central banks in cases where the status of the countries concerned hadaltered through the developments of the political situation.
Under the regulations issued in the United States relating to transactionsin foreign exchange, transfers of credit and the export of coins and currency(as amended by an executive order of 10th April 1940), the Bank's operations
. in the United States market were made subject to the system of licences.In practice, however, these complications during the financial year underreview have not prevented business although they have rendered it more difficult;for certain of the Bank's operations a general licence was granted, and speciallicences were obtained when required, usually within a comparatively shortperiod.
As stated in the Introduction to this Report, the Bank has adhered tothe principles of scrupulous neutrality which it laid down for itself in theautumn of 1939, confining its activities strictly to transactions whereby noquestion can possibly arise of conferring economic or financial advantageson any belligerent nation to the detriment of any other. Moreover, no operationsare carried out which might directly or indirectly run counter to the monetarypolicy of the central bank in the country concerned or in practice constitute
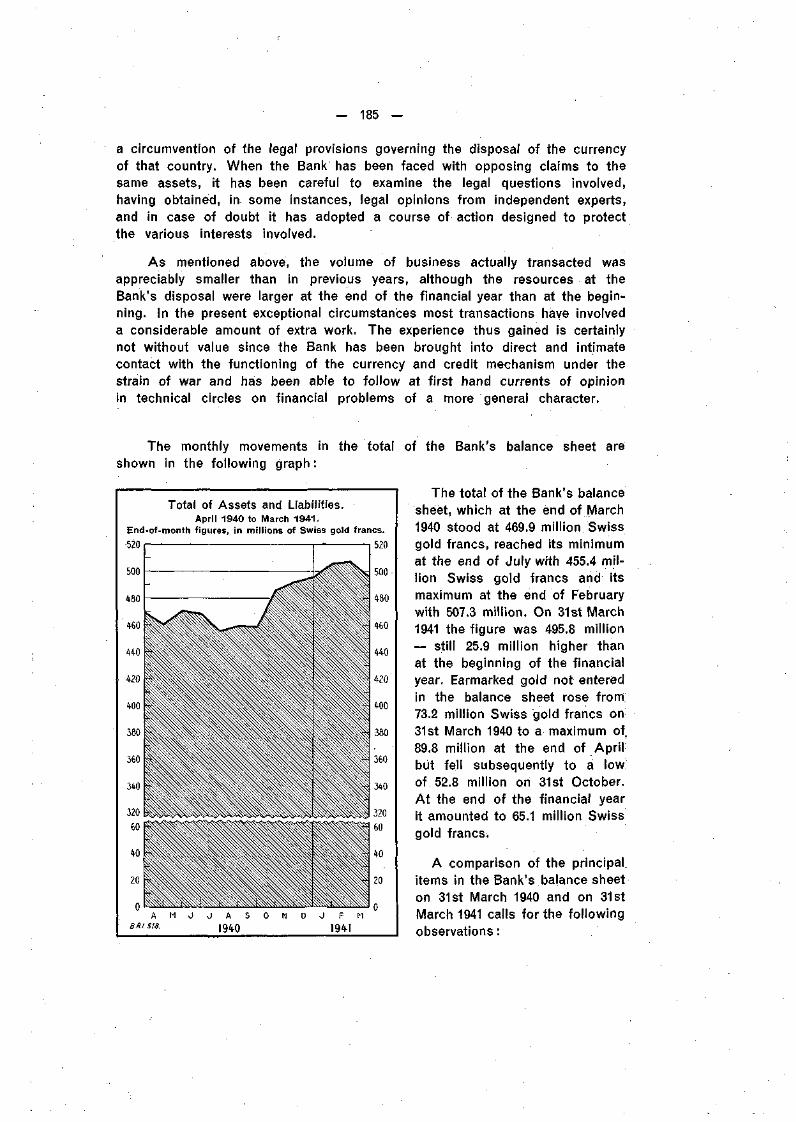
— 185 —
a circumvention of the legal provisions governing the disposal of the currencyof that country. When the Bank has been faced with opposing claims to thesame assets, it has been careful to examine the legal questions involved,having obtained, in some instances, legal opinions from independent experts,and in case of doubt it has adopted a course of action designed to protectthe various interests involved.
As mentioned above, the volume of business actually transacted wasappreciably smaller than in previous years, although the resources at theBank's disposal were larger at the end of the financial year than at the begin-ning. In the present exceptional circumstances most transactions have involveda considerable amount of extra work. The experience thus gained is certainlynot without value since the Bank has been brought into direct and intimatecontact with the functioning of the currency and credit mechanism under thestrain of war and has been able to follow at first hand currents of opinionin technical circles on financial problems of a more general character.
The monthly movements in the total of the Bank's balance sheet areshown in the following graph :
Total of Assets and Liabilities.April 1940 to March 1941.
End-of-month figures, in millions of Swiss gold francs.520 i 1— 1 520
A M J J A S O N DB/u sta. 19A-0
J F M
194-1
The total of the Bank's balancesheet, which at the end of March1940 stood at 469.9 million Swissgold francs, reached its minimumat the end of July with 455.4 mil-lion Swiss gold francs and itsmaximum at the end of Februarywith 507.3 million. On 31st March1941 the figure was 495.8 million— still 25.9 million higher thanat the beginning of the financialyear. Earmarked gold not enteredin the balance sheet rose from-73.2 million Swiss gold francs on31st March 1940 to a maximum of,89.8 million at the end of Aprilbut fell subsequently to a lowof 52.8 million on 31st October.At the end of the financial yearit amounted to 65.1 million Swissgold francs.
A comparison of the principal;items in the Bank's balance sheeton 31st March 1940 and on 31stMarch 1941 calls for the followingobservations :
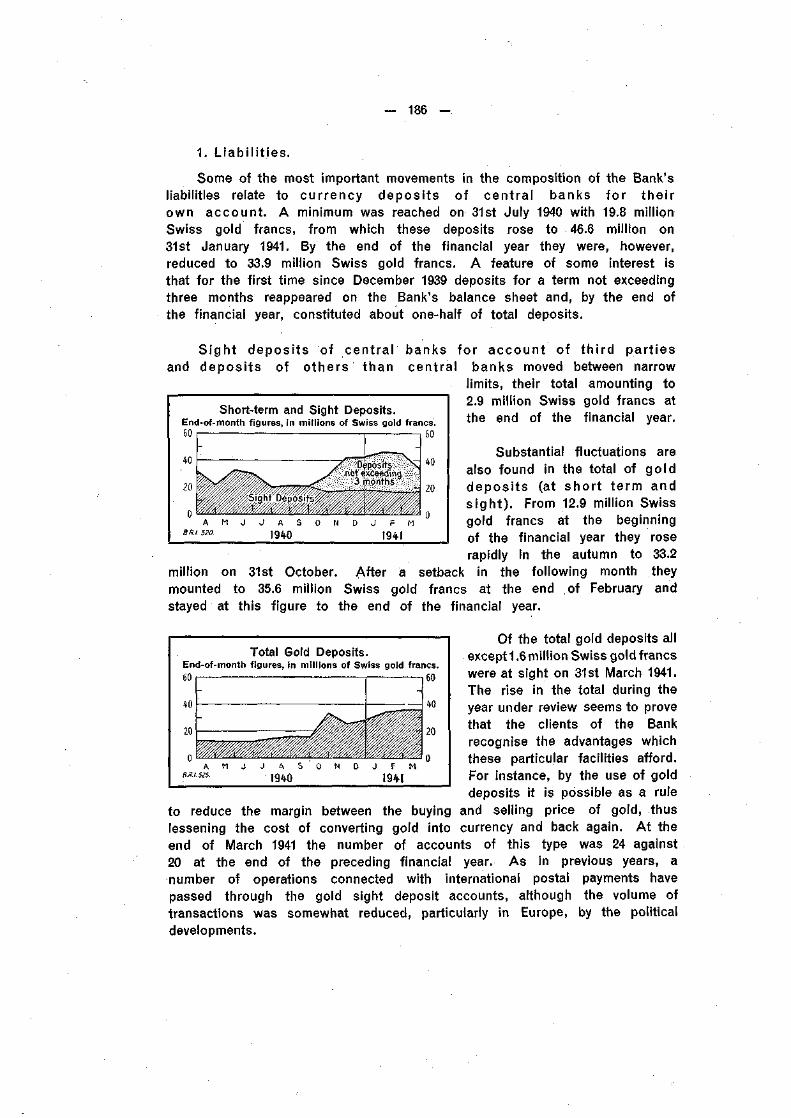
— 186 —
1. L iab i l i t ies .
Some of the most important movements in the composition of the Bank'sliabilities relate to currency deposi ts of central banks for theirown account. A minimum was reached on 31st July 1940 with 19.8 millionSwiss gold francs, from which these deposits rose to 46.6 million on31st January 1941. By the end of the financial year they were, however,reduced to 33.9 million Swiss gold francs. A feature of some interest isthat for the first time since December 1939 deposits for a term not exceedingthree months reappeared on the Bank's balance sheet and, by the end ofthe financial year, constituted about one-half of total deposits.
Sight deposi ts of central banks for account of th i rd part iesand deposi ts of others than central banks moved between narrow
limits, their total amounting to2.9 million Swiss gold francs atthe end of the financial year.
Short-term and Sight Deposits.End-of-month figures, in millions of Swiss gold francs.60 i - , , 60
Depositsnot exceeding
3 months
Substantial fluctuations arealso found in the total of golddeposi ts (at short term ands igh t ) . From 12.9 million Swissgold francs at the beginningof the financial year they roserapidly in the autumn to 33.2
million on 31st October. After a setback in the following month theymounted to 35.6 million Swiss gold francs at the end of February andstayed at this figure to the end of the financial year.
A M J J A S O N D J F MB.R.1.520. 1940 | 9 4 . |
Total Gold Deposits.End-of-month figures, in millions of Swiss gold francs.60 i —T 1 60
A M J J A S O N D J F M
Of the total gold deposits allexcept 1.6 million Swiss gold francswere at sight on 31st March 1941.The rise in the total during theyear under review seems to provethat the clients of the Bankrecognise the advantages whichthese particular facilities afford.For instance, by the use of golddeposits it is possible as a rule
to reduce the margin between the buying and selling price of gold, thuslessening the cost of converting gold into currency and back again. At theend of March 1941 the number of accounts of this type was 24 against20 at the end of the preceding financial year. As in previous years, anumber of operations connected with international postal payments havepassed through the gold sight deposit accounts, although the volume oftransactions was somewhat reduced, particularly in Europe, by the politicaldevelopments.
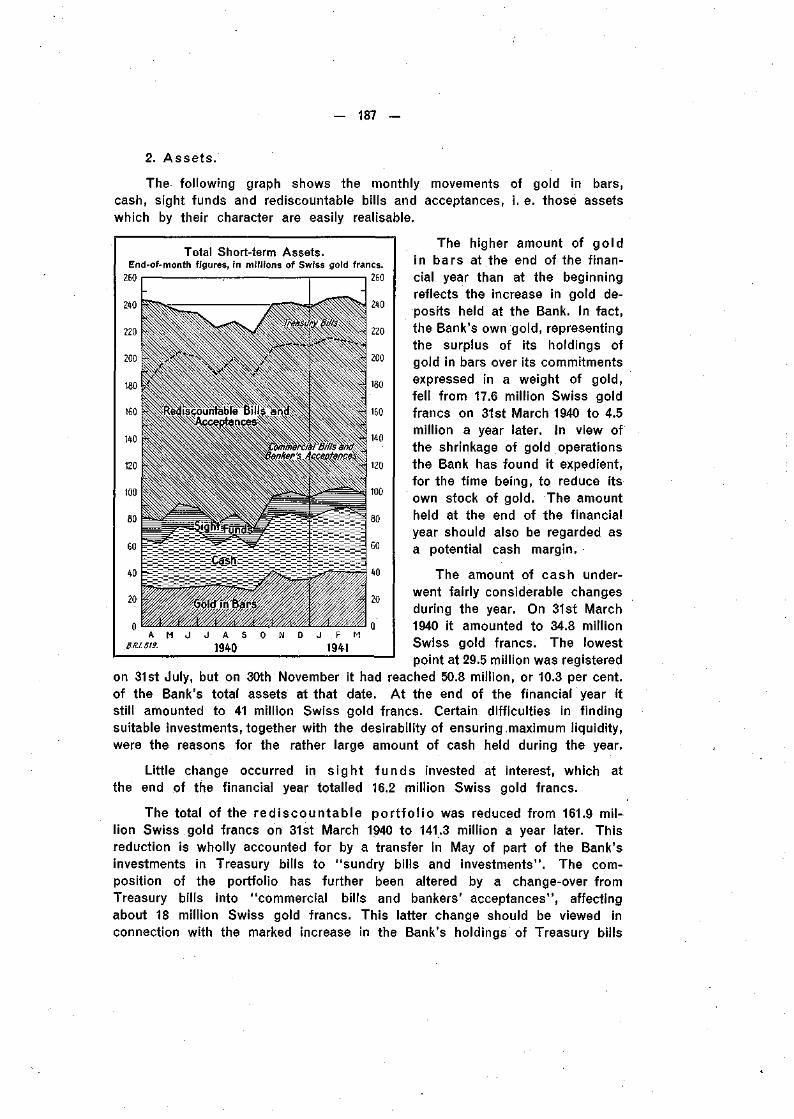
- 187 -
2. Assets .
The following graph shows the monthly movements of gold in bars,cash, sight funds and rediscountable bills and acceptances, i. e. those assetswhich by their character are easily realisable.
Total Short-term Assets.End-of-month figures, in millions of Swiss gold francs.
260 i : 1 1 260
The higher amount of goldin bars at the end of the finan-cial year than at the beginningreflects the increase in gold de-posits held at the Bank. In fact,the Bank's own gold, representingthe surplus of its holdings ofgold in bars over its commitmentsexpressed in a weight of gold,fell from 17.6 million Swiss goldfrancs on 31st March 1940 to 4.5million a year later. In view ofthe shrinkage of gold operationsthe Bank has found it expedient,for the time being, to reduce itsown stock of gold. The amountheld at the end of the financialyear should also be regarded asa potential cash margin.
The amount of cash under-went fairly considerable changesduring the year. On 31st March1940 it amounted to 34.8 millionSwiss gold francs. The lowestpoint at 29.5 million was registered
on 31st July, but on 30th November it had reached 50.8 million, or 10.3 per cent,of the Bank's total assets at that date. At the end of the financial year itstill amounted to 41 million Swiss gold francs. Certain difficulties in findingsuitable investments, together with the desirability of ensuring maximum liquidity,were the reasons for the rather large amount of cash held during the year.
Little change occurred in s ight funds invested at interest, which atthe end of the financial year totalled 16.2 million Swiss gold francs.
The total of the red iscountab le por t fo l io was reduced from 161.9 mil-lion Swiss gold francs on 31st March 1940 to 141.3 million a year later. Thisreduction is wholly accounted for by a transfer in May of part of the Bank'sinvestments in Treasury bills to "sundry bills and investments". The com-position of the portfolio has further been altered by a change-over fromTreasury bills into "commercial bills and bankers' acceptances", affectingabout 18 million Swiss gold francs. This latter change should be viewed inconnection with the marked increase in the Bank's holdings of Treasury bills
A M J J A Sß.R.1.519. jg^o
J , F M194-1
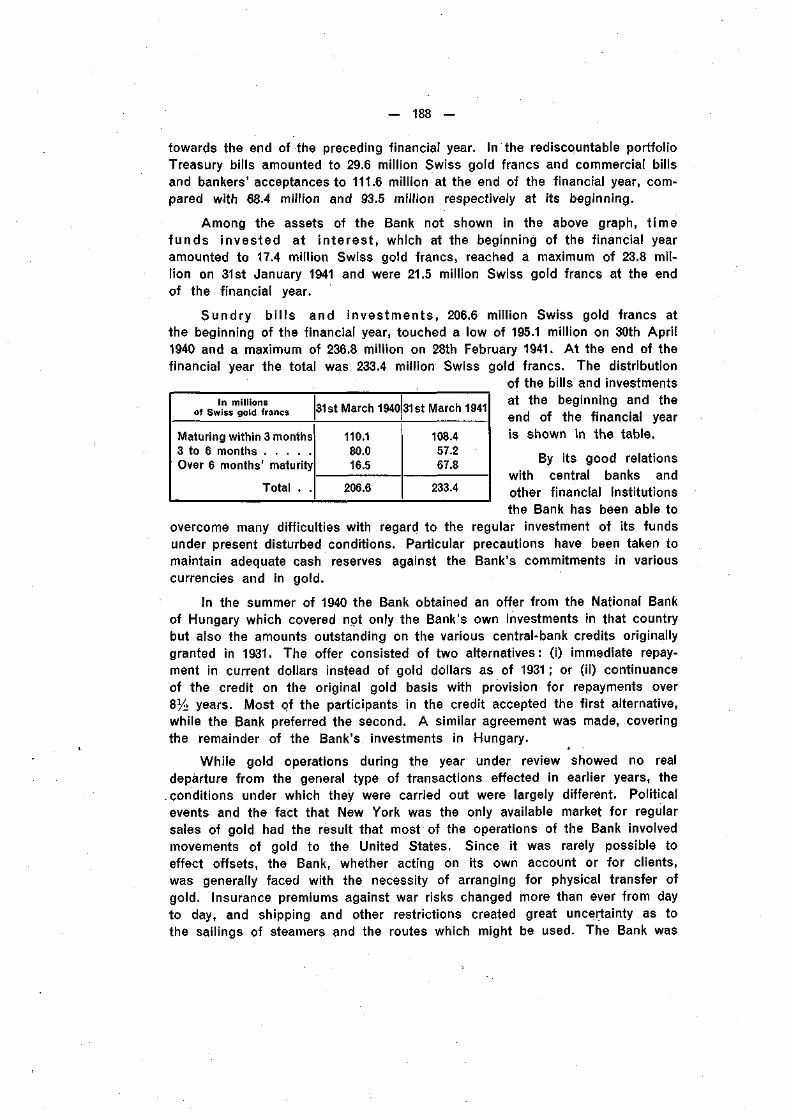
— 188 —
towards the end of the preceding financial year. In the rediscquntable portfolioTreasury bills amounted to 29.6 million Swiss gold francs and commercial billsand bankers' acceptances to 111.6 million at the end of the financial year, com-pared with 68.4 million and 93.5 million respectively at its beginning.
Among the assets of the Bank not shown in the above graph, t imefunds invested at in terest , which at the beginning of the financial yearamounted to 17.4 million Swiss gold francs, reached a maximum of 23.8 mil-lion on 31st January 1941 and were 21.5 million Swiss gold francs at the endof the financial year.
Sundry bi l ls and investments, 206.6 million Swiss gold francs atthe beginning of the financial year, touched a low of 195.1 million on 30th April1940 and a maximum of 236.8 million on 28th February 1941. At the end of thefinancial year the total was 233.4 million Swiss gold francs. The distribution
of the bills and investmentsat the beginning and theIn millions
of Swiss gold francs 31st March 1940 31st March 1941
Maturing within 3 months3 to 6 monthsOver 6 months' maturity
Total
110.180.016.5
206.6
108.457.267.8
233.4
end of the financial yearis shown in the table.
By its good relationswith central banks andother financial institutionsthe Bank has been able to
overcome many difficulties with regard to the regular investment of its fundsunder present disturbed conditions. Particular precautions have been taken tomaintain adequate cash reserves against the Bank's commitments in variouscurrencies and in gold.
In the summer of 1940 the Bank obtained an offer from the National Bankof Hungary which covered not only the Bank's own investments in that countrybut also the amounts outstanding on the various central-bank credits originallygranted in 1931. The offer consisted of two alternatives: (i) immediate repay-ment in current dollars instead of gold dollars as of 1931 ; or (ii) continuanceof the credit on the original gold basis with provision for repayments over8^2 years. Most of the participants in the credit accepted the first alternative,while the Bank preferred the second. A similar agreement was made, coveringthe remainder of the Bank's investments in Hungary.
While gold operations during the year under review showed no realdeparture from the general type of transactions effected in earlier years, theconditions under which they were carried out were largely different. Politicalevents and the fact that New York was the only available market for regularsales of gold had the result that most of the operations of the Bank involvedmovements of gold to the United States. Since it was rarely possible toeffect offsets, the Bank, whether acting on its own account or for clients,was generally faced with the necessity of arranging for physical transfer ofgold. Insurance premiums against war risks changed more than ever from dayto day, and shipping and other restrictions created great uncertainty as tothe sailings of steamers and the routes which might be used. The Bank was
— 189 —
not able to give effect to all the requests made by its clients; but in thecourse of the year it has arranged for a certain number of transports —naturally only after having obtained all the necessary permits and licences.In cases where offsetting proved possible, the expense, risks and, above all,the great delay entailed by physical shipments were avoided. It should beadded that as a rule the Bank has been able to furnish its clients with answersto enquiries concerning the constantly changing conditions under which goldtransfers might be effected.
Credits granted via central banks to facilitate the financing of internationaltrade have still continued but the amounts involved have been relativelysmall. The business, useful in itself, is interesting because it keeps alivea line of operations which may possibly be extended at some future date.
During the year under review the Bank on various occasions placed itsservices at the disposal of international bodies. In particular, operations havebeen carriedout at the request of Red Cross organisations and, as a result,accounts have been opened with central banks in all continents. It must beregarded as a natural development of the Bank's activity to perform bankingservices for international organisations and especially those which carry ontheir work under international conventions.
2. TRUSTEE AND AGENCY FUNCTIONS OF THE BANK.
During the year under review, there has been no change or developmentin the Trustee and Agency functions of the Bank, which were described onpp. 155 and 156 of the Bank's tenth Annual Report.
3. NET PROFITS AND DISTRIBUTION.
It is for the present General Meeting to consider the declaration of adividend. The net profit for the year, after making allowance for contingenciesis 5,293,909.12 Swiss gold francs, the Swiss gold franc being as defined byArt. 5 of the Bank's Statutes, i .e. the equivalent of 0.29032258 grammesfine gold. This compares with a figure of 7,962,180.65 Swiss gold francs forthe tenth fiscal year. For the purpose of the Balance Sheet as at 31st March1941, the foreign currency amounts of the assets and liabilities have beenconverted into Swiss gold francs on the basis of the quoted or official ratesof exchange for the respective currencies on that date, and all assets arevalued at or below market quotations, if any, or at or below cost.
After providing for the Legal Reserve that is required by Article 53 ofthe Statutes, to an amount equal to 5 per cent, of the net profits, i. e.264,695.46 Swiss gold francs (1940: 398,109.03 Swiss gold francs), there remain5,029,213.66 Swiss gold francs available for the payment of a dividend. It isrecommended that the General Meeting declare a dividend at the rate of
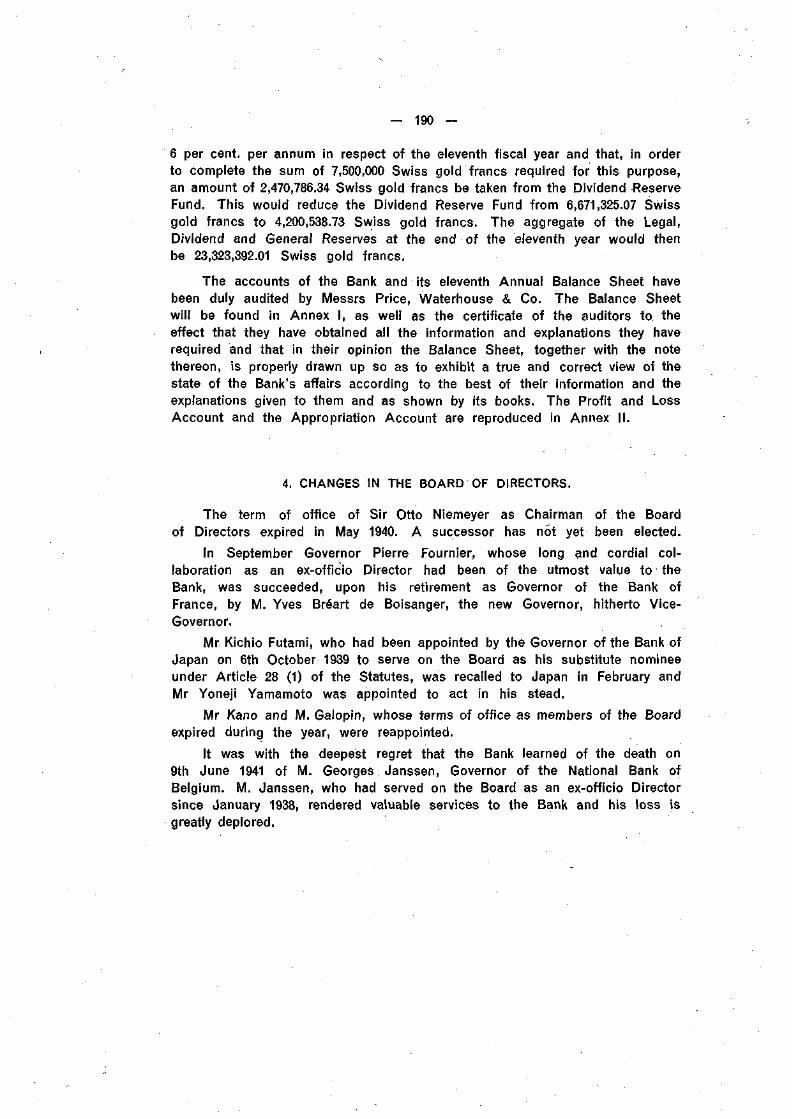
— 190 —
6 per cent, per annum in respect of the eleventh fiscal year and that, in orderto complete the sum of 7,500,000 Swiss gold francs required for this purpose,an amount of 2,470,786.34 Swiss gold francs be taken from the Dividend ReserveFund. This would reduce the Dividend Reserve Fund from 6,671,325.07 Swissgold francs to 4,200,538.73 Swiss gold francs. The aggregate of the Legal,Dividend and General Reserves at the end of the eleventh year would thenbe 23,323,392.01 Swiss gold francs.
The accounts of the Bank and its eleventh Annual Balance Sheet havebeen duly audited by Messrs Price, Waterhouse & Co. The Balance Sheetwill be found in Annex I, as well as the certificate of the auditors to. theeffect that they have obtained all the information and explanations they haverequired and that in their opinion the Balance Sheet, together with the notethereon, is properly drawn up so as to exhibit a true and correct view of thestate of the Bank's affairs according to the best of their information and theexplanations given to them and as shown by its books. The Profit and LossAccount and the Appropriation Account are reproduced in Annex II.
4. CHANGES IN THE BOARD OF DIRECTORS.
The term of office of Sir Otto Niemeyer as Chairman of the Boardof Directors expired in May 1940. A successor has not yet been elected.
In September Governor Pierre Fournier, whose long and cordial col-laboration as an ex-officio Director had been of the utmost value to theBank, was succeeded, upon his retirement as Governor of the Bank ofFrance, by M. Yves Bréart de Boisanger, the new Governor, hitherto Vice-Governor.
Mr Kichio Futami, who had been appointed by the Governor of the Bank ofJapan on 6th October 1939 to serve on the Board as his substitute nomineeunder Article 28 (1) of the Statutes, was recalled to Japan in February andMr Yoneji Yamamoto was appointed to act in his stead.
Mr Kano and M. Galopin, whose terms of office as members of the Boardexpired during the year, were reappointed.
It was with the deepest regret that the Bank learned of the death on9th June 1941 of M. Georges Janssen, Governor of the National Bank ofBelgium. M. Janssen, who had served on the Board as an ex-officio Directorsince January 1938, rendered valuable services to the Bank and his loss isgreatly deplored.
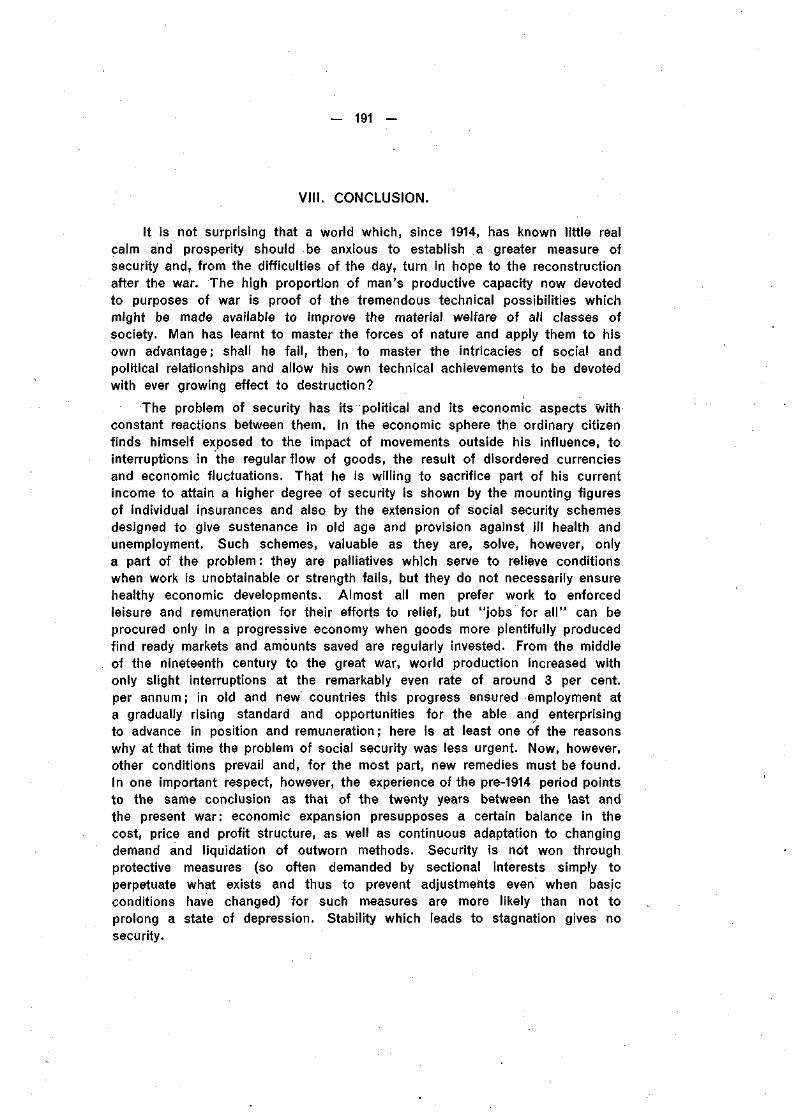
— 191 —
Vil i . CONCLUSION.
It is not surprising that a world which, since 1914, has known little realcalm and prosperity should be anxious to establish a greater measure ofsecurity and, from the difficulties of the day, turn in hope to the reconstructionafter the war. The high proportion of man's productive capacity now devotedto purposes of war is proof of the tremendous technical possibilities whichmight be made available to improve the material welfare of all classes ofsociety. Man has learnt to master the forces of nature and apply them to hisown advantage; shall he fail, then, to master the intricacies of social andpolitical relationships and allow his own technical achievements to be devotedwith ever growing effect to destruction?
The problem of security has its political and its economic aspects withconstant reactions between them. In the economic sphere the ordinary citizenfinds himself exposed to the impact of movements outside his influence, tointerruptions in the regular flow of goods, the result of disordered currenciesand economic fluctuations. That he is willing to sacrifice part of his currentincome to attain a higher degree of security is shown by the mounting figuresof individual insurances and also by the extension of social security schemesdesigned to give sustenance in old age and provision against ill health andunemployment. Such schemes, valuable as they are, solve, however, onlya part of the problem : they are palliatives which serve to relieve conditionswhen work is unobtainable or strength fails, but they do not necessarily ensurehealthy economic developments. Almost all men prefer work to enforcedleisure and remuneration for their efforts to relief, but "jobs for al l " can beprocured only in a progressive economy when goods more plentifully producedfind ready markets and amounts saved are regularly invested. From the middleof the nineteenth century to the great war, world production increased withonly slight interruptions at the remarkably even rate of around 3 per cent,per annum; in old and new countries this progress ensured employment ata gradually rising standard and opportunities for the able and enterprisingto advance in position and remuneration ; here is at least one of the reasonswhy at that time the problem of social security was less urgent. Now, however,other conditions prevail and, for the most part, new remedies must be found.In one important respect, however, the experience of the pre-1914 period pointsto the same conclusion as that of the twenty years between the last andthe present war: economic expansion presupposes a certain balance in thecost, price and profit structure, as well as continuous adaptation to changingdemand and liquidation of outworn methods. Security is not won throughprotective measures (so often demanded by sectional interests simply toperpetuate what exists and thus to prevent adjustments even when basicconditions have changed) for such measures are more likely than not toprolong a state of depression. Stability which leads to stagnation gives nosecurity.
— 192 —
In many ways the problem of full employment is comparatively easy tosolve in times of rapid rearmament and war, for the state provides an unlimitedmarket for all the instruments of war which industry can produce, while satis-faction of consumers' needs is restricted to a minimum. Peacetime economy,on the other hand, means growing production of a great variety of articlesto improve the standard of living of the mass of consumers, and this involvesdifficult problems of maintaining a proper balance between output and pur-chasing power without impairing equilibrium in the credit system and in thedifferent branches of economic life. Social duty and common sense will obligegovernments to assist in the process of post-war readjustment by whichproduction will be redirected into its peacetime channels — the only courseby which the standard of living can again be raised after the decline dueto the war. Resumption of foreign trade, supply of raw materials, transferof labour and the provision of credit — these are some of the questionswhich will arise. As far as finance is concerned it will, in the light of theexperience gained after 1918, be equally important to avoid, within each country,a runaway inflation and a violent contraction of credit — both harmful andinimical to reconstruction. Internationally, the same experience points themoral that an excessive volume of foreign credits, especially when granted atshort notice, exposes the balances of payments to intolerable strains andmust therefore be avoided, but that foreign trade without the lubrication offinance cannot render the services so badly needed to restore economicefficiency after a devastating war. How to profit by past experience and trans-late the principles of desirable financial policy into constructive action is theobject of careful examination to-day in countries all over the world. Sincesocial advance with secure employment can be attained only in a progressiveeconomy, the future well-being of humanity will depend upon the measureof success with which these problems are solved.
Respectfully submitted,
THOMAS H. McKITTRICK,
President.
ANNEXES
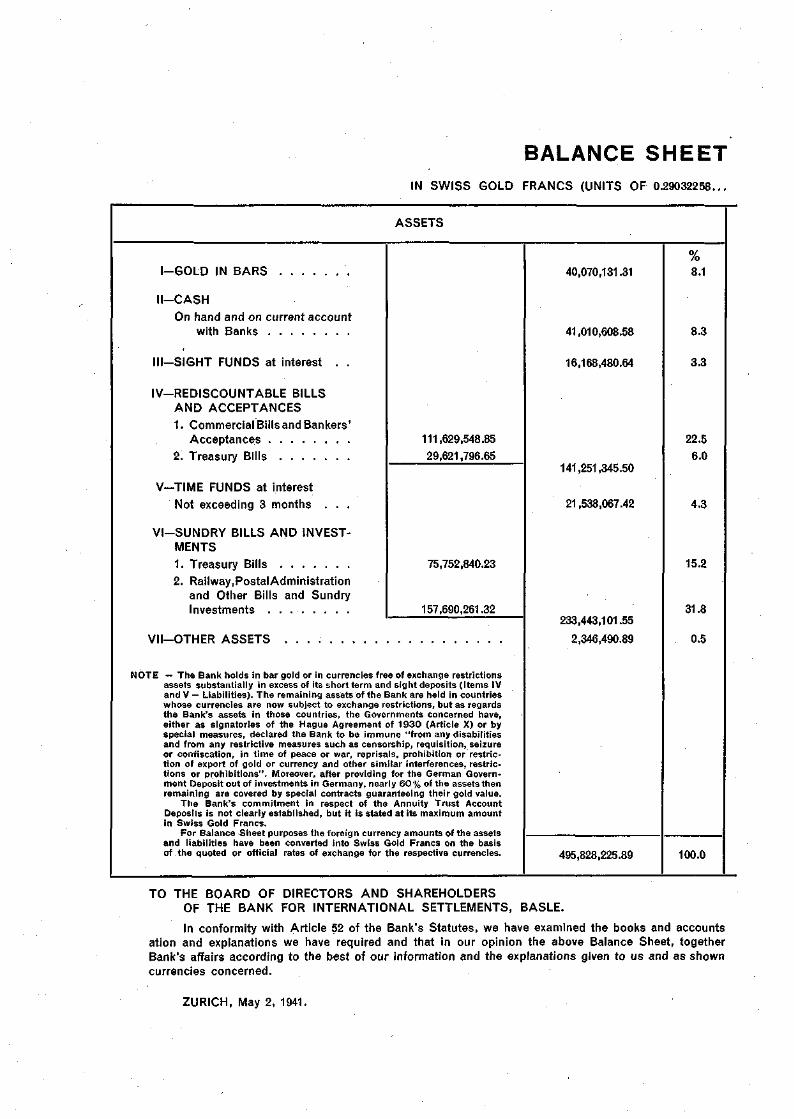
BALANCE SHEETIN SWISS GOLD FRANCS (UNITS OF 0.29032258...
ASSETS
I—GOLD IN BARS
II-CASH
On hand and on current accountwith Banks
MI-SIGHT FUNDS at interest . .
IV-REDISCOUNTABLE BILLSAND ACCEPTANCES
1. Commercial Bills and Bankers'Acceptances
2. Treasury Bills . . . . .
V-TIME FUNDS at interest
Not exceeding 3 months . . .
VI-SUNDRY BILLS AND INVEST-MENTS
1. Treasury Bills
2. Railway.PostalAdmlnistrationand Other Bills and SundryInvestments
111,629,548.85
29,621,796.65
75,752,840.23
157,690,261.32
Vll-OTHER ASSETS
NOTE — The Bank holds in bar gold or in currencies free of exchange restrictionsassets substantially in excess of its short term and sight deposits (Items IVand V— Liabilities). The remaining assets of the Bank are held in countrieswhose currencies are now subject to exchange restrictions, butas regardsthe Bank's assets in those countries, the Governments concerned have,either as signatories of the Hague Agreement of 1930 (Article X) or byspecial measures, declared the Bank to be immune "from any disabilitiesand from any restrictive measures such as censorship, requisition, seizureor confiscation, in time of peace or war, reprisals, prohibition or restric-tion of export of gold or currency and other similar interferences, restric-tions or prohibitions". Moreover, after providing for the German Govern-ment Deposit out of investments in Germany, nearly 60% of the assets thenremaining are covered by special contracts guaranteeing their gold value.
The Bank's commitment in respect of the Annuity Trust AccountDeposits is not clearly established, but it is stated at its maximum amountin Swiss Gold Francs.
For Balance Sheet purposes the foreign currency amounts of the assetsand liabilities have been converted into Swiss Gold Francs on the basisof the quoted or official rates of exchange for the respective currencies.
40,070,131.31
41,010,608.58
16,168,480.64
141,251,345.50
21,538,067.42
233,443,101.55
2,346,490.89
495,828,225.89
708.1
8.3
3.3
22.5
6.0
4.3
15.2
31.8
0.5
100.0
TO THE BOARD OF DIRECTORS AND SHAREHOLDERSOF THE BANK FOR INTERNATIONAL SETTLEMENTS, BASLE.
In conformity with Article 52 of the Bank's Statutes, we have examined the books and accountsation and explanations we have required and that in our opinion the above Balance Sheet, togetherBank's affairs according to the best of our information and the explanations given to us and as showncurrencies concerned.
ZURICH, May 2, 1941.
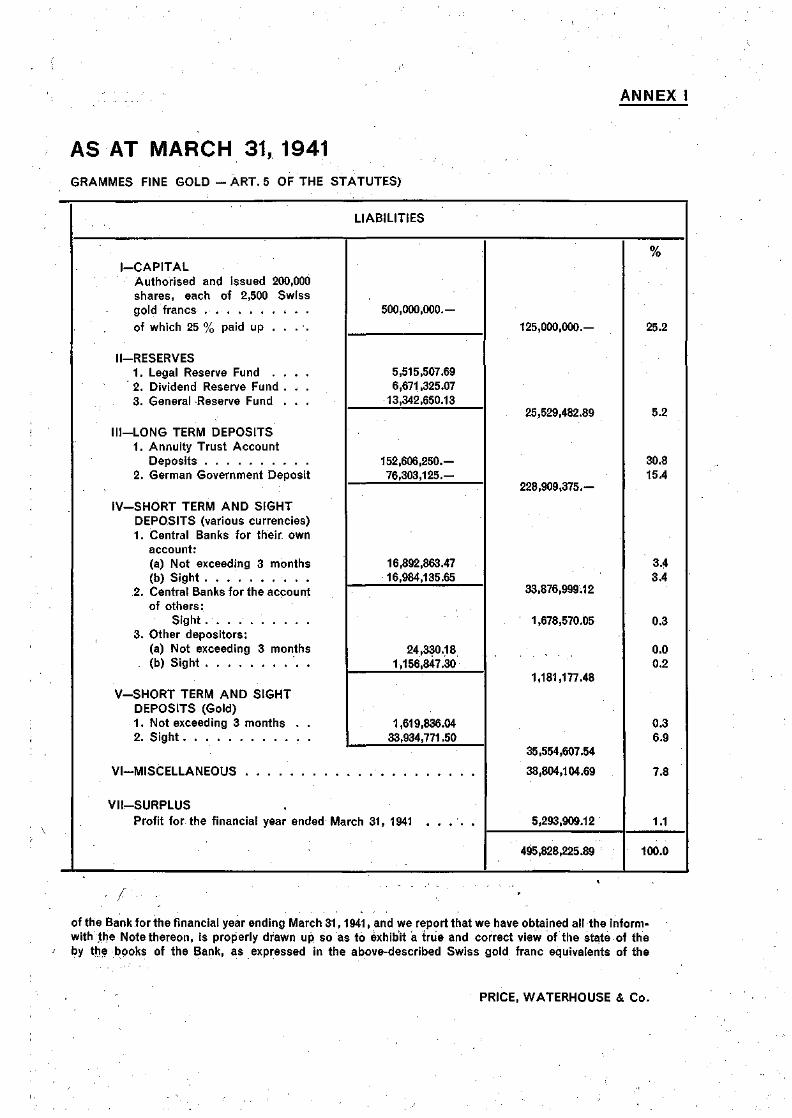
ANNEX I
AS AT MARCH 31, 1941GRAMMES FINE GOLD - ART. 5 OF THE STATUTES)
LIABILITIES
I-CAPITALAuthorised and issued 200,000shares, each of 2,500 Swissgold francs . ; . .of which 25 % paid up . .
II-RESERVES1. Legal Reserve Fund . .2. Dividend Reserve Fund . . .3. General Reserve Fund . . .
Ill—LONG TERM DEPOSITS1. Annuity Trust Account
Deposits2. German Government Deposit
IV-SHORT TERM AND SIGHTDEPOSITS (various currencies)1. Central Banks for their own
account:(a) Not exceeding 3 months(b) Sight . . . . . . . . . .
2. Central Banks for the accountof others:
Sight . . . .3. Other depositors:
(a) Not exceeding 3 months(b) Sight
V-SHORT TERM AND SIGHTDEPOSITS (Gold)1. Not exceeding 3 months . .2. Sight .
VI-MISCELLANEOUS
500,000,000.—
5,515,507.696,671,325.07
13,342,650.13
152,606,250.—76,303,125.—
16,892,863.4716,984,135.65
24,330.181,156,847.30
1,619,836.0433,934,771.50
VII-SURPLUS .Profit for the financial year ended March 31, 1941
125,000,000.-
25,529,482.89
228,909,375.-
33,876,999.12
1,678,570.05
1,181,177.48
35,554,607.54
38,804,104.69
5,293,909.12
495,828,225.89
25.2
5.2
30.815.4
3.43.4
0.3
0.00.2
0.36.9
7.8
1.1
100.0
< / • • • • • • . . •
of the Bank for the financial year ending March 31,1941, and we report that we have obtained all the inform-with the Note thereon, is properly drawn up so as to exhibit a true and correct view of the state of theby the books of the Bank, as expressed in the above-described Swiss gold franc equivalents of the
PRICE, WATERHOUSE & Co.
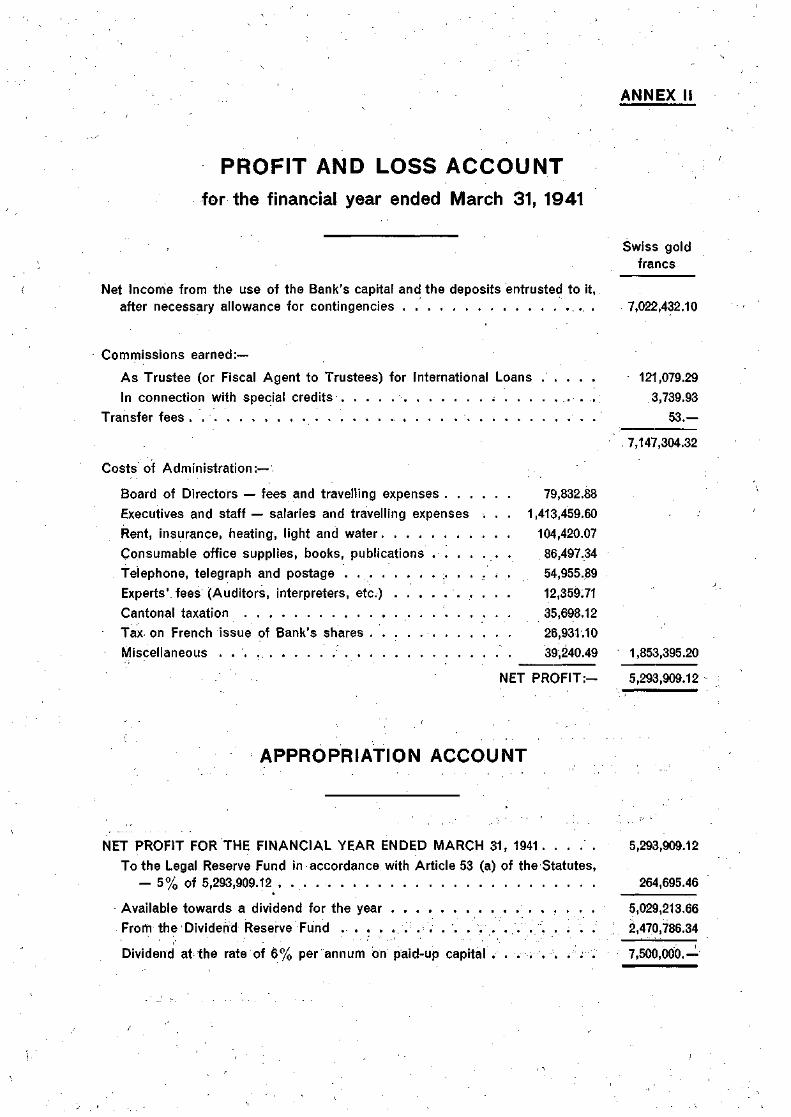
ANNEX II
PROFIT AND LOSS ACCOUNTfor the financial year ended March 31, 1941
Swiss goldfrancs
Net Income from the use of the Bank's capital and the deposits entrusted to it,after necessary allowance for contingencies 7,022,432.10
Commissions earned:—
As Trustee (or Fiscal Agent to Trustees) for International Loans . . . . . 121,079.29
In connection with special credits 3,739.93
Transfer fees . . 53.—
7,147,304.32
Costs of Administration:—
Board of Directors — fees and travelling expenses 79,832.88
Executives and staff — salaries and travelling expenses . . . 1,413,459.60
Rent, insurance, heating, light and water 104,420.07
Consumable office supplies, books, publications . • . . . . . . 86,497.34
Telephone, telegraph and postage . 54,955.89
Experts', fees (Auditors, interpreters, etc.) 12,359.71
Cantonal taxation • • • 35,698.12
Tax on French issue of Bank's shares 26,931.10
Miscellaneous . . . . 39,240.49 1,853,395.20
NET PROFIT:— 5,293,909.12
APPROPRIATION ACCOUNT
N E T P R O F I T F O R T H E F I N A N C I A L Y E A R E N D E D M A R C H 3 1 , 1 9 4 1 . . . . . 5 ,293,909.12
T o t h e L e g a l R e s e r v e F u n d in a c c o r d a n c e w i t h A r t i c l e 53 (a ) o f t h e S t a t u t e s ,— 5 % o f 5 ,293,909.12 264,695.46
A v a i l a b l e t o w a r d s a d i v i d e n d f o r t h e y e a r . . . . 5 ,029,213.66
F r o r n t h e D i v i d e n d R e s e r v e F u n d . . . . . . . . . . . . . . . . . . . . . 2 ,470,786.34
D i v i d e n d a t t h e r a t e o f 6 % p e r a n n u m o n p a i d - u p c a p i t a l . . . . . . . . . 7 , 5 0 0 , 0 0 0 . —
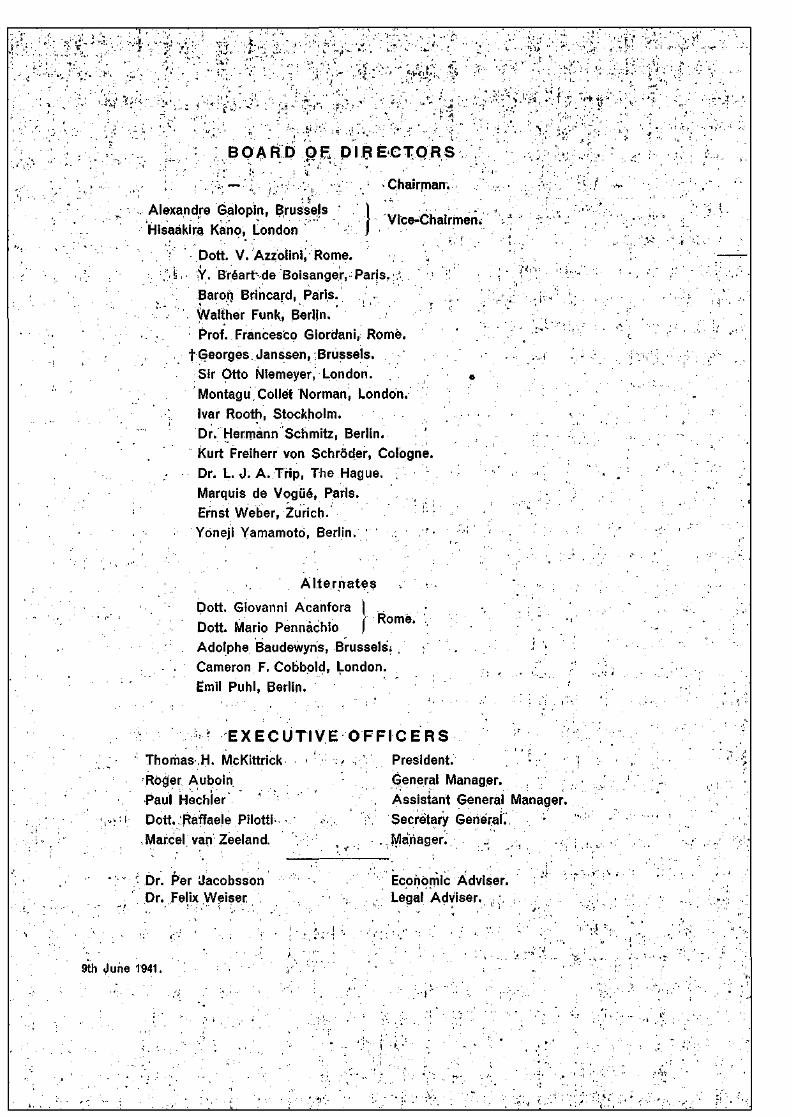
.1 > . . . . . >
> . » • • . • * • „
B O A R D O F D I R E C T O R S .
— , Chairman.
Alexandre Galopin, Brussels 1Vice-Chairmen.
Hisaakira Kano, London j
Dott. V. Azzolini, Rome.1 Y. Bréart de Boisanger, Paris.
Baron Brincard, Paris.
Walther Funk, Berlin.
. Prof. Francesco Giordani, Rome.
fGeorges Janssen, Brussels.
Sir Otto Niemeyer, London. «
Montagu,Collet Norman, London.
• •'„ Ivar Rooth, Stockholm.
Dr. Hermann Schmitz, Berlin.
Kurt Freiherr von Schröder, Cologne.
Dr. L. J .A.Tr ip, The Hague. ;
Marquis de Vogué, Paris.
Ernst Weber, Zurich. '
Yòneji Yamamotò, Berlin. ; . ' ' M
. Al ternates ,
Dott. Giovanni Acanfora_ . , . _ . , . . Rome. , •Dott. Mario Pennachio J
Adolphe Baudewyns, Brussels'; .
Cameron F. Cobbold, London.
Emil Puhl, Berlin.
: ; ^ EXECUTIVE OFFICERS f
Thomas.H. McKittrick <':':'••:> ' President. •
Roger Auboin General Manager.
Paul Hechler' ' , Assistant General Manager.
.<;•••[ Dott..'Raffaele Pilotti , ; . Ï , Secretary Genera l .
,Marcel van Zeeland. . .Manager . ., ,
, • - . : < ; . - ' . . ' , . . • : , ' ; • • • • • • • , ' i • • • ' . ; , • / ' - - i t .
'D r . Per Jacobssön Economic Adviser. ' !
Dr. Felix Weiser, ••„ Legal Adviser. (l ;. ;
9th June 1941.
Related Documents