THE BURDEN OF ACUTE GASTROINTESTINAL ILLNESS IN GALVEZ, ARGENTINA AND THE METROPOLITAN REGION, CHILE A Thesis Presented to The Faculty of Graduate Studies of The University of Guelph by M. KATHLEEN THOMAS In partial fulfillment of requirements for the degree of Doctor of Philosophy May, 2010 © M. Kathleen Thomas, 2010

Welcome message from author
This document is posted to help you gain knowledge. Please leave a comment to let me know what you think about it! Share it to your friends and learn new things together.
Transcript
THE BURDEN OF ACUTE GASTROINTESTINAL ILLNESS IN GALVEZ, ARGENTINA
AND THE METROPOLITAN REGION, CHILE
A Thesis
Presented to
The Faculty of Graduate Studies
of
The University of Guelph
by
M. KATHLEEN THOMAS
In partial fulfillment of requirements
for the degree of
Doctor of Philosophy
May, 2010
© M. Kathleen Thomas, 2010
1*1 Library and Archives Canada
Published Heritage Branch
395 Wellington Street Ottawa ON K1A 0N4 Canada
Bibliotheque et Archives Canada
Direction du Patrimoine de I'edition
395, rue Wellington Ottawa ON K1A 0N4 Canada
Your file Votre reference ISBN: 978-0-494-67821-3 Our We Notre r6f6nence ISBN: 978-0-494-67821-3
NOTICE: AVIS:
The author has granted a nonexclusive license allowing Library and Archives Canada to reproduce, publish, archive, preserve, conserve, communicate to the public by telecommunication or on the Internet, loan, distribute and sell theses worldwide, for commercial or noncommercial purposes, in microform, paper, electronic and/or any other formats.
L'auteur a accorde une licence non exclusive permettant a la Bibliotheque et Archives Canada de reproduce, publier, archiver, sauvegarder, conserver, transmettre au public par telecommunication ou par Nnternet, prefer, distribuer et vendre des theses partout dans le monde, a des fins commerciales ou autres, sur support microforme, papier, electronique et/ou autres formats.
The author retains copyright ownership and moral rights in this thesis. Neither the thesis nor substantial extracts from it may be printed or otherwise reproduced without the author's permission.
L'auteur conserve la propriete du droit d'auteur et des droits moraux qui protege cette these. Ni la these ni des extraits substantiels de celle-ci ne doivent etre imprimes ou autrement reproduits sans son autorisation.
In compliance with the Canadian Privacy Act some supporting forms may have been removed from this thesis.
Conformement a la loi canadienne sur la protection de la vie privee, quelques formulaires secondaires ont ete enleves de cette these.
While these forms may be included in the document page count, their removal does not represent any loss of content from the thesis.
Bien que ces formulaires aient inclus dans la pagination, il n'y aura aucun contenu manquant.
1*1
Canada
ABSTRACT
THE BURDEN OF ACUTE GASTROINTESTINAL ILLNESS IN GALVEZ, ARGENTINA AND THE METROPOLITAN REGION, CHILE
M. Kathleen Thomas Advisor:
University of Guelph, 2010 Dr. Scott A. McEwen
This thesis is an investigation of the burden of acute gastrointestinal
illness (Gl) in Galvez, Argentina and the Metropolitan region, Chile. A cross-
sectional survey was administered door-to-door to 2915 and 6047 randomly
selected residents of Galvez and the Metropolitan region, respectively. Two time
periods, coinciding with high and low Gl seasons, were selected for survey
administration. Shorter (i.e., 7 and 15 day) and longer (i.e., 30 day) recall
periods were incorporated in the surveys. The surveys were designed to
determine the distribution and population-level burden of Gl, identify risk factors
including food and water consumption and food safety behaviours, estimate
pathogen-specific community-level incidence rates, and evaluate the effect of
different recall periods on Gl incidence rates in population-level burden of Gl
studies. High response rates of 61% and 76% were obtained in Galvez and the
Metropolitan region, respectively. The annual incidence rate of Gl in the
Metropolitan region ranged from 0.98 to 2.3 episodes per person-year, for a 30-
day and a 7-day recall period, respectively, and the annual incidence rate of
diarrhea in Galvez, ranged from 0.46 to 1.68 episodes per person-year for a 30-
day and a 7-day recall period, respectively. In general, little difference in the rate
of Gl was seen between men and women, while children 0-4 and youths 10-19
had higher rates of Gl in both Galvez and the Metropolitan region. In the
Metropolitan region, Gl was associated with consumption of undercooked
poultry, undercooked beef, cheese made from unpasteurized milk and higher
water consumption, though causality cannot be inferred due to the different recall
periods used for risk factors versus Gl symptoms and the cross-sectional study
methodology. The estimated community-level, pathogen-specific incidence rates
for Salmonella, Campylobacter and Shigella infections were greater than the
laboratory confirmed incidence rates, likely due to ill residents not seeking
medical care, not submitting a stool sample and some laboratories not routinely
testing for certain enteric pathogens. This research has demonstrated the
significant burden of Gl in these South American communities that is not
captured by traditional surveillance and outbreak registries, and has highlighted
risk factors that can inform public health policy and prevention activities.
ACKNOWLEDGEMENTS
"It takes a village to raise a child"
- African proverb
This thesis would not have been possible without the help, guidance and
support from the many people that make up my 'village'. My thanks and
gratitude to the entire faculty and staff of the Department of Population Medicine
for their assistance, support and mentorship throughout these past 3 V2 years; in
particular to William Sears for his statistical expertise and colourful
conversations. Thanks to the Public Health Agency of Canada, the International
Development Research Centre, and the Pan American Health Organization for
supporting this research. Thanks to my study partners and participants in
Argentina and Chile. Thanks to my fellow graduate students for their friendship,
their time for sharing ideas and commiserating about the common struggles of
graduate school. Thanks to my friends, for their thoughtful patience and kind
encouragement. Thanks to my advisory committee, without them none of this
would have been possible. Specifically, thanks to Dr. Richard Reid-Smith for his
calm guidance, intelligence and resourcefulness throughout this process; to Dr.
Enrique Perez for his dedication, constant demonstration that there is always a
way to get things done and his pursuit of equity in public health; to Dr. Shannon
Majowicz for her continued mentorship, positive attitude and incredible content
knowledge; and to Dr. Scott McEwen for his wisdom and advice, epidemiology
expertise and kindness. I was truly blessed to have four complementary
individuals that provided me with the necessary support, expertise and
mentorship, I could not have asked for a better team. Thanks to my family, for
their love and support, in particular my parents for their faith in me and for
exposing me to other parts of the world early on. And finally, thanks to my fiance
Fernando, for his love and support, for his patience and willingness to travel and
for his encouragement to pursue my goals. It truly 'takes a village to make a
Doctoral student'.
a
TABLE OF CONTENTS
CHAPTER ONE: Introduction and Literature Review 1
INTRODUCTION 1
LITERATURE REVIEW 4
RATIONALE 36
OBJECTIVES 39
REFERENCES 41
TABLES 46
CHAPTER TWO: Burden of acute gastrointestinal illness in Galvez,
Argentina, 2007 53
ABSTRACT 53
INTRODUCTION 54
MATERIALS AND METHODS 55
RESULTS 60
DISCUSSION 62
REFERENCES 68
TABLES 71
FIGURES 79
CHAPTER THREE: Burden of acute gastrointestinal illness in the
Metropolitan region, Chile, 2008 80
SUMMARY 80
INTRODUCTION 80
in
METHODS 82
RESULTS 86
DISCUSSION 89
REFERENCES 95
TABLES 98
FIGURES 105
CHAPTER FOUR: Risk factors for acute gastrointestinal illness related to food consumption trends, food purchasing and hygiene habits among residents of the Metropolitan Region, Chile, 2008 106
ABSTRACT 106
INTRODUCTION 107
METHODS 108
RESULTS 113
DISCUSSION 117
CONCLUSIONS 123
REFERENCES 125
TABLES 129
FIGURES 138
CHAPTER FIVE: Water consumption trends and associations with acute gastrointestinal illness in the Metropolitan Region, Chile, 2008 139
ABSTRACT 139
BACKGROUND 140
MATERIALS AND METHODS 141
IV
RESULTS 145
DISCUSSION 149
CONCLUSIONS 156
REFERENCES 157
TABLES 161
FIGURES 166
CHAPTER SIX: Estimated numbers of human infections due to Salmonella, Campylobacter and Shigella, Metropolitan region, Chile, 2008 171
ABSTRACT 171
BACKGROUND 172
MATERIALS AND METHODS 173
RESULTS 176
DISCUSSION 177
CONCLUSIONS 182
REFERENCES 184
TABLES 189
CHAPTER SEVEN: Conclusions 193
SUMMARY, DISCUSSION AND CONCLUSIONS 193
APPENDICES 205
APPENDIX I: Survey tool - Argentina (7 day recall period) 206
APPENDIX II: Survey tool - Argentina (30 day recall period) 210
APPENDIX III: Formulas for calculating prevalence, incidence rate and
V
incidence proportion 214
APPENDIX IV: Survey tool - Chile (7, 15 and 30 day recall periods) 215
APPENDIX V: Expected probability formulas - Chile 222
APPENDIX VI: Survey tool - Chile (Laboratory survey) 223
APPENDIX VII: Survey tool - Chile (Sentinel clinic case-control study).231
VI
LIST OF TABLES
Table Title Page 1.1 Summary of published population-based burden of acute 46
gastrointestinal illness (Gl) studies 1991 - 2006, by region, in chronological order.
1.2 Summary of food and water consumption data from 50 population-based studies, in various countries 1992 - 2006, in chronological order.
2.1 Respondent representativeness, demographic distribution and 71 the prevalence of acute gastrointestinal illness per study phase and recall period in Galvez Argentina, 2007.
2.2 Symptoms and their duration for both study phases and recall 73 periods combined, Galvez, Argentina, 2007.
2.3 Days of missed work and school by cases and care-givers for 74 both study phases and recall periods combined, Galvez, Argentina, 2007.
2.4 Final multivariate model of risk factors associated with acute 75 gastrointestinal illness in Galvez, Argentina, 2007.
2.5 Medications and access to medical care, for both study 76 phases and recall periods combined, Galvez, Argentina, 2007.
2.6 Number and mean, minimum, and maximum percentage of 77 cases that sought medical attention and the estimated underreporting, for both study phases and recall periods, Galvez, Argentina, 2007.
2.7 Minimum set of results proposed for studies of acute 78 gastrointestinal illness (25) for both study phases and recall periods, Galvez, Argentina, 2007.
3.1 Socio-demographic distribution of Metropolitan region 98 residents, survey respondents and monthly prevalence of acute gastrointestinal illness by category, Chile 2008.
3.2 Number of cases by gastrointestinal illness symptom, 99 prevalence, annual incidence rate and annual incidence proportion, by recall period and phase, Metropolitan region, Chile 2008.
vn
3.3 Number and percent of cases (n=467) by secondary 100 symptoms, duration of gastrointestinal symptoms and duration of missed activities due to gastrointestinal illness, Metropolitan region, Chile, 2008.
3.4 Number and percent of cases (n=467) by treatments, use of 101 medical care and reasons for not seeking medical care by Gl cases, Metropolitan region, Chile, 2008.
3.5 Univarable analysis results of association with acute 102 gastrointestinal illness, Metropolitan region, Chile. 2008.
3.6 Final multivariable model of risk factors associated with acute 103 gastrointestinal illness, Metropolitan region, Chile, 2008.
3.7 Descriptive statistics of acute gastrointestinal illness based on 104 30-day recall period following the proposed standard case definition of gastrointestinal illness, Metropolitan region, Chile, 2008.
4.1 Age, gender and education distribution of Metropolitan region 129 residents and survey respondents, Chile 2008.
4.2 Distribution of food purchasing habits in the seven days prior 130 to interview, monthly prevalence of acute gastrointestinal illness, and unconditional associations between location of food item purchase Gl in the 30 days prior to interview, Metropolitan region, Chile, 2008.
4.3 Frequency of hand washing and hygiene behaviours, monthly 132 acute gastrointestinal illness prevalence and unconditional associations between hand washing and hygiene behaviours and Gl in the 30 days prior to interview, Metropolitan region, Chile, 2008.
4.4 Proportion of respondents that consumed high risk food at 134 least once in the seven days prior to interview, monthly prevalence of acute gastrointestinal illness and unconditional associations between consumption of individual high risk food and Gl, Metropolitan region, Chile, 2008 (n=6047).
4.5 Associations between reported consumption of high risk food 135 items and gender in the seven days prior to interview, Metropolitan region Chile, 2008.
4.6 Associations of reported consumption of high risk food items 136
vm
and age group in the seven days prior to interview compared with referent group of individuals 20-59 years of age, Metropolitan region, Chile, 2008.
4.7 Final multivariable model of socio-demographic, food 137 consumption and hygiene behaviour factors associated with Gl, Metropolitan region, Chile, 2008.
5.1 Age, gender and education distribution of Metropolitan region 161 residents and survey respondents, Chile 2008.
5.2 Mean number of drinking water servings consumed, by 162 occupation, adjusted for other variables in the multivariable model, Metropolitan region, Chile, 2008 (n=5765).
5.3 Final multivariable logistic regression model of risk factors for 163 Gl and proportion of respondents with Gl by risk factor, Metropolitan region, Chile, 2008 (n=5709).
6.1 Data sources and input distributions used to estimate under- 189 reporting of gastro-intestinal infections (Salmonella, Campylobacter, and Shigella) in the Metropolitan region, Chile, 2008.
6.2 The annual reported number of infections and incidence by 190 Instituto de Salud Publica (ISP) and estimated annual number of cases, incidence and under-reporting multipliers for Salmonella, Campylobacter, and Shigella infections, Metropolitan region, Chile, 2008.
6.3 Sensitivity analysis of correlation of input distributions and 191 overall under-reporting multiplier by pathogen for the Metropolitan region, Chile, 2008.
6.4 Summary of international pathogen-specific incidence rates 192 for comparison with results from the Metropolitan region, Chile, 2008.
IX
LIST OF FIGURES
Figure Title Page 2.1 Theoretical burden of illness pyramid for Galvez, Argentina, 79
2007.
3.1 Monthly prevalence of Gl by symptoms and age group, 105 Metropolitan region, Chile, 2008.
4.1 Unconditional odds of acute gastrointestinal illness (Gl) and 138 proportion of meals consumed in different locations, Metropolitan region, Chile, 2008.
5.1 Estimated mean number of servings of water consumed in the 166 24 hours prior to interview by gender and study phase from multivariable model with 95% confidence interval error bars, Metropolitan region, Chile, 2008 (n=5765).
5.2 Estimated mean number of servings of water consumed in the 167 24 hours prior to interview by study phase and education level with from multivariable model with 95% confidence interval error bars, Metropolitan region, Chile, 2008 (n=5765).
5.3 Estimated mean number of servings of water consumed in the 168 24 hours prior to interview by gender and age category from multivariable model with 95% confidence interval error bars, Metropolitan region, Chile, 2008 (n=5765).
5.4 Estimated mean number of servings of water consumed in the 169 24 hours prior to interview by 3-way interaction of socioeconomic level and study phase and being a bottled water user from multivariable model with 95% confidence interval error bars, Metropolitan region, Chile, 2008 (n=5765).
5.5 Probability of being a case of Gl by socio-economic level and 170 gender from multivariable model with 95% confidence interval error bars, Metropolitan region, Chile, 2008 (5709).
x
CHAPTER ONE
Introduction and Literature Review
Introduction
Acute gastrointestinal illness (Gl) causes significant morbidity, mortality
and socio-economic burden around the world (1-4). Developed countries tend to
experience lower rates of mortality, but high rates of morbidity and socio
economic loss. Developing countries typically have a higher mortality burden,
though deaths caused by diarrhea appear to be declining (5,6). Clean water,
sanitation and safe food are key components to preventing and controlling Gl at
the population-level (7). These public health areas are at the forefront of
international public health organizations' objectives and priorities as well as local
public health workers concerns (8-11).
Understanding the magnitude, distribution and specific risk factors
associated with Gl is a good first step in mitigation (12). With this baseline
information, interventions, targeted surveillance and research activities can be
developed and their success assessed. Likewise, this fundamental knowledge
provides insight into the impacts of broader worldwide trends, such as
globalization, climate change and international travel and trade, on the rates,
distributions and risk factors of disease. It also informs international estimates
such as the World Health Organization Global Burden of Disease Assessments
specific to foodbome diseases (3).
1
Existing surveillance based on disease notification and outbreak
investigation reporting activities around the world substantially underestimates
the true burden of Gl in the population (13). Many cases of Gl are not captured
by local and national surveillance systems, and outbreak reports can also be
biased due to a lack of source identification, incomplete case capture and
unidentified outbreaks not being included (14,15). In order to have a clearer
understanding of disease status within the population, targeted research
activities, including burden of illness studies, need to be undertaken (16,17).
These studies focus on capturing the magnitude and impact of a particular
illness. Studies can be designed to capture a variety of qualitative and
quantitative burden indicators, for example case counts, direct costs associated
with treatment, and indirect costs associated with lost productivity (18).
To date, the majority of research pertaining to population-level burden of
Gl has occurred in developed countries (12,16,17,19-27), with few studies
occurring within developing countries (28-30). Common results from studies in
developed populations include higher rates of Gl in females (16,17,24), young
children (16,17,20,22,24,26), and those with higher levels of education
(20,22,26).
In developed countries, methods used for burden of illness studies
commonly include surveys of the population, laboratories, physicians, and
analysis of reportable disease surveillance system data. With the information
gained from these surveys it is possible to generate multipliers and to determine
estimates of disease in the population and the under-reporting rate (31-33).
2
Among the scientists currently using the existing methodologies for
estimation of burden of Gl, there is debate regarding the advantages and
disadvantages of prospective cohort designs versus retrospective approaches
using cross-sectional surveys that seek information about symptoms in the
recent past (27). The prospective approach is more costly and time consuming
but provides more accurate estimates of disease incidence (22,27). The
retrospective approach, though less expensive and time consuming, is thought to
suffer from a type of recall bias known as 'telescoping' (i.e., the tendency to recall
illness events from the more distant past into the recent past) which results in
potential overestimation of the burden of Gl (27).
Methods utilized in developed countries may not be suitable for use in
developing countries. Studies spanning many months are expensive; they
require substantial personnel and financial investments that are prohibitive in
countries with limited public health resources and extensive competing public
health priorities. Trained telephone survey companies are used in some
developed countries for burden of illness studies but these companies are less
common or non-existent in developing countries. Residents with fixed telephone
lines may not be representative of the population in some developing countries,
especially with the popularity of cellular phones1. In addition, literacy rates tend
to be lower in developing countries, limiting the utility of mail-in surveys.
To develop intervention and policy, understanding the source of the illness
is of great importance (34,35). Disease attribution involves crediting cases of
' International Telecommunications Union, http://www.itu.int/ITU-D/ICTEYE/lndicators/lndicators.aspx#. accessed February 23, 2010.
3
illness to their source or cause; in terms of foodborne disease, it is the attribution
of cases of illness to the responsible food vehicle (34). This is currently a
developing area of research which can play a key role in informing food safety
initiatives (36). With an increased understanding of what foods are contaminated
and what levels of exposure to these foods exist, a more complete food safety
risk profile can be created. This can be used to generate interventions or
monitoring strategies. An initial step of this work is determining what foods
people are consuming on a regular basis and to identify what food-based risks
are prevalent in the population. This enables targeted food safety initiatives to be
developed and tested for effectiveness and economic viability.
Literature Review
This literature review focuses on three main types of studies:
1. Burden of acute gastrointestinal illness population surveys. The studies are
presented by region and in chronological order, including key results and
estimates of the burden of acute gastrointestinal illness by age, gender and
socio-economic level. Study designs and response rates are presented in brief
for general comparison; however, detailed descriptions of the methodologies and
study discussions are not included.
2. Food and water consumption surveys. Patterns in food and water
consumption by socio-demographic factors, and proportions of bottled water and
water filtration use results are described in a population-level burden of Gl study
4
context. Nutrition-focused, water intervention trials or other non-population,
burden of illness based studies are not included in this review.
3. Community estimates for pathogens. Brief descriptions of analytic
approaches, data sources and under-reporting estimates for specific pathogens
are presented. Literature outside of the population-based, burden of Gl context
is not reviewed.
1. Burden of acute gastrointestinal illness population surveys
1.1 Europe
The Netherlands-1991:
Hoogenboom-Verdegaal et al. (21) conducted a community-based study
in four regions of the Netherlands that provided information on the incidence and
severity of gastroenteritis in single households or families. A cohort study was
conducted from March to July 1991 in ten geographically representative
municipalities located within four regional health services. Each of the four
health services contacted approximately 1,500 people by letter from the
municipal registers and one person from each household was asked to complete
the survey. Participants were asked about the presence and persistence of
gastrointestinal symptoms, if they sought medical care and what type. Weekly
questionnaires were to be returned over the 17 consecutive weeks of the study.
Those who developed symptoms during the study period were asked to submit a
stool sample immediately. Participants were asked to report symptoms of
diarrhea (two or more stools in a day), fever, vomiting, nausea, abdominal pain
5
and or cramps, and the presence of blood and/or mucus in stools. Grade 1
gastroenteritis was defined as diarrhea or vomiting and at least two additional
symptoms of nausea, abdominal pain, cramps, blood or mucus in stools within a
1 week period. Grade 2 gastroenteritis was defined as diarrhea or vomiting and
at least two additional symptoms as in grade 1 but both on the same day and
lasting at least 2 days within a 1 week period. In total, there were 2,257
participants (36% response rate) of which 425 and 115 had symptoms consistent
with grade 1 and 2 gastroenteritis, respectively. A doctor was consulted by 18%
and 22% of the cases for grade 1 and 2 gastroenteritis, respectively, with half of
these consultations being in person and the remainder by telephone. Women
and children 0-18 years of age had higher risks of grade 1 gastroenteritis
compared to males and adults 19-35 years of age.
Infectious Intestinal Disease (IIP) Study- England 1993 - 1996:
Wheeler et al. (27) studied the incidence and etiology of cases of
infectious intestinal disease (IID) (a) in the community and (b) presenting to
general practitioners, and their relationship with national surveillance (laboratory)
reports. Prospective cohort and cross-sectional study designs were used.
General practices were selected from the Medical Research Council's general
practice research framework and 70, serving approximately 460 000 people,
volunteered to participate in the study. The sample was representative of
national general practices in terms of location, urban and rural characteristics,
and social deprivation index. From each practice, 200 people of all ages were
6
selected at random and invited to participate by letter and telephone. A case of
I ID was defined as anyone experiencing loose stools or significant vomiting
(more than once in 24 hours, incapacitating, or accompanied by cramps or fever)
lasting less than 2 weeks, in the absence of a known non-infectious cause and
preceded by a symptom-free period of three weeks. Participants returned
weekly postcards for six months indicating absence of symptoms. Those with
symptoms sent a stool specimen to the Leeds Public Health Laboratory. A
second cohort was selected for an additional six months. Data were collected
from 1993 to 1996. In total, 9,776 people were recruited (40% response rate) for
a total of 4,026 person-years and there were 781 cases of IID; an incidence rate
of 19.4/100 person years. The retrospective estimate of reported diarrhea in the
month prior to recruitment from the cross-sectional survey was 564/8,674, which
extrapolates to an incidence rate of 55/100 person years. The ratio of community
incidence to general practice presentation rates was 5.8. For every isolate
reported to the national surveillance there were 1.4 positive laboratory results,
6.2 stools submitted, 23 cases presented to the practitioner and 136 cases in the
community.
Sensor (A population based cohort study on Gastroenteritis) - Netherlands 1998
-1999:
De Wit et al. (22) studied the incidence of gastroenteritis in the general
population and associated causative pathogens in different age groups.
Prospective population-based cohort and nested case-control study designs
7
were used. Two 6-month cohorts were recruited and data were collected from
December 1998 - December 1999. An age-stratified random sample was
selected from all people registered at the 44 participating sentinel general
practices from the Netherlands Institute of Primary Health Care, 27 practices
participated in the first cohort and 31 in the second. Selected individuals were
invited by mail with a follow-up letter 3 weeks later to non-respondents. A
baseline questionnaire was completed at the beginning of the study and
participants returned a card weekly, reporting presence or absence of symptoms.
Participants were instructed to contact the study coordinator by telephone if they
developed symptoms of vomiting or diarrhea, and a stool sample was to be
collected immediately. The case definition was at least three loose stools within
24 hours or vomiting at least three times within 24 hours or diarrhea with two or
more additional symptoms in 24 hours; additional symptoms were diarrhea,
vomiting, abdominal cramps, abdominal pain, fever, nausea, blood in stool, or
mucus in stool. If there was an obvious non-infectious cause the case was
excluded. For each case, a control was selected matched on age, degree of
urbanization and region, and requested to submit stool samples. In total, 4,860
people participated (42% response rate) with a total of 1,050 case episodes. The
overall incidence rate standardized by age, sex and cohort was 283 per 1,000
person-years. Incidence was slightly higher in the first cohort, much higher in
children 0-11 years of age and increased with educational level. Seasonal peaks
were seen in January and June. Antibiotic use in the week prior to illness was
reported by 2% of cases. Norwalk-like virus (NLV) was the most commonly
8
identified pathogen for all age groups except those 18-64 where Staphylococcus
aureus toxins were most common.
Norway 1999-2000:
Kuusi et al. (24) conducted a national survey to estimate the incidence
and burden of gastroenteritis in Norway. A cross-sectional survey design was
used. Data were collected from June 1999 - June 2000. A total of 3,000 people
were selected at random from the Norwegian population registry and were
mailed the survey. A reminder letter was mailed one week after initial mail-out
and a second reminder and an additional copy of the survey were mailed out to
non-respondents within 3 weeks. Surveys of children under 15 years of age
were completed by their parents. A case was defined as a person who had
diarrhea (three or more loose stools in 24 hours) or at least three of the following
symptoms: vomiting, nausea, abdominal cramps or fever > 38 °C in the 4 weeks
prior to completion of survey. Those with chronic diarrheal illness were excluded.
In total, 1,843 respondents (61% response rate) completed the survey,
symptoms were reported by 265 (14%) of respondents of which 171 met the
case definition. Women and those between ages 25 and 39 years were most
likely to be cases. Approximately 17% of cases visited their physician, 8% of
cases submitted a stool sample and 4% of cases were hospitalized for their
illness. For those 0-14 years of age, consumption of water from a private supply
(well or surface source) was identified as a significant risk factor while consuming
water from a chlorinated water source was found to be a protective factor in this
9
age group. For those 21-40 years of age, travel outside of Norway was identified
as a risk factor. For all other age groups, no significant differences were found
for any of the risk factors.
Ireland 2000-2001:
Scallan et al. (16) studied the extent of acute gastroenteritis in the
population in Northern Ireland and the Republic of Ireland as well as the
associated health-seeking behaviour and impact on missed work and school. A
cross-sectional survey was administered by telephone. Data were collected from
December 2000 to November 2001. Random digit dialling was used to survey
private households with a fixed telephone line. The individual with the next
birthday was selected to respond to the survey, with proxy respondents for
children < 12 years of age and at the discretion of the parent for children 12-16
years of age. A case was defined as anyone experiencing diarrhea with three or
more loose stools in 24 hours or bloody diarrhea or vomiting together with at
least one other symptom (diarrhea, abdominal pain/cramps, or fever) in the 4
weeks prior to interview and in the absence of a known non-infectious cause. In
total, 9,903 interviews were completed (64.8% response rate) with 4.5% of
respondents reporting at least one episode of acute gastroenteritis in the 4
weeks prior to interview, an incidence rate of 0.60 episodes per person-year.
Women, children < 14 years of age, adults 25-44 years of age and those
reporting a professional or non-manual occupation were more likely to report
being a case. A higher frequency of reporting of acute gastroenteritis was found
10
in Northern Ireland compared to the Republic of Ireland. From multivariable
analysis sex (being female), age (<5 years old), occupation of main earner
(professional/non-manual) and jurisdiction (Northern Ireland) were significantly
associated with reporting acute gastroenteritis. Seasonal peaks were found in
Northern Ireland in December and April, and in April and September in the
Republic of Ireland. A physician was consulted by 29.2% of cases and 9.1% of
cases were asked to submit a stool sample. For 17.4% of cases, they
themselves or a family member were required to take time off work, while for
19.0% of cases someone in their household had to take time off from school.
1.2 North America
FoodNet - USA 1996 - 1997:
Herikstad et al. (20) conducted a survey of the Foodborne Diseases Active
Surveillance Network (FoodNet) to better understand and more precisely quantify
the amount and burden of illness caused by acute diarrhea in the United States.
A cross-sectional survey was administered by telephone. Data were collected
between July 1996 and June 1997. Random digit dialling was used to identify
households within the FoodNet sites. Respondents were asked about symptoms
of diarrhea, defined as three or more loose stools or bowel movements in any 24
hour period within the four weeks prior to interview. Those respondents with a
chronic illness in which diarrhea is a major symptom (e.g., colitis, irritable bowel
syndrome) or who had had surgery to remove part of their stomach or intestine
were excluded from the analysis. Diarrheal illness was defined as diarrhea
11
lasting longer than one day or which resulted in significant impairment of daily
activities. Overall, 9,003 surveys were completed (71% response rate); 8624
surveys were completed by eligible respondents of which 977 had experienced
symptoms of diarrhea in the 4 weeks prior to interview, resulting in a rate of 1.4
episodes of diarrhea per person-year, and 492 had experienced diarrheal illness.
Prevalence of diarrheal illness was highest among children <5 years of age and
lowest among adults > 65 years of age. Prevalence of diarrheal illness increased
with increasing education and was more common in respondents living in urban
areas. Of those with diarrheal illness, 7% reported taking antibiotics to treat their
illness and 12% reported visiting a healthcare provider. Of those who visited a
healthcare provider, 21% reported being requested to provide a stool sample of
which 89% complied and 8% of those who visited a healthcare provider were
hospitalized.
FoodNet - USA 1998 - 1999:
Imhoff et al. (23) conducted the second survey of the FoodNet sites to
continue tracking the burden of self-reported diarrheal illness. A cross-sectional
survey was administered by telephone between July 1998 and June 1999.
Random digit dialling was used to identify households within the FoodNet sites.
One individual per household was randomly selected from a roster of household
members. Parents or guardians responded for children <12 years of age.
Respondents were asked if they had experienced diarrhea, defined as three or
more loose stools in any 24 hour period in the 4 weeks prior to interview. People
12
with a chronic illness (e.g., Crohn's disease or irritable bowel syndrome) and
people with part of their stomach or intestine removed were excluded from the
analysis. Diarrheal illness was defined as diarrhea that lasted more than 1 day.
Overall 12,755 surveys were completed (41% response rate); 12,075 were
eligible respondents of which 1,192 (10%) reported having symptoms of diarrhea
in the 4 weeks prior to interview resulting in a rate of 1.3 episodes of acute
diarrhea per person-year, of which 645 had diarrheal illness. Children < 5 years
of age and adults 25 - 44 years of age had the highest prevalences of acute
diarrheal illness, while adults > 65 years of age had the lowest. There were no
differences in prevalence between males and females, or between urban and
rural dwellers. Of those with diarrheal illness, 12% reported taking antibiotics to
treat their illness and 21% sought medical care of which 16% were asked to
submit a stool sample - 97% complied. Overall, 2% of those with diarrheal illness
were hospitalized.
FoodNet - USA 1996 - 2003:
Jones et al. (12) summarized four population-based surveys that
assessed acute diarrheal illness within FoodNet sites. In addition to the two
studies already mentioned by Herikstad et al. (20) and Imhoff et al. (23), two
additional similar cross-sectional surveys were conducted by telephone in March
2000 - February 2001 and March 2002 - February 2003. Diarrhea was defined
as three or more loose stools in 24 hours and acute diarrheal illness was defined
as diarrhea with duration greater than one day or impairment of daily activities.
13
Those with chronic illness with diarrhea as a major symptom were excluded from
analysis. The 2000/2001 survey had a total of 14,139 eligible respondents of
which 7.3% experienced symptoms of diarrhea and 5.0% experienced diarrheal
illness. The 2002/2003 survey had a total of 15,578 eligible respondents of which
7.2% and 5.2% experienced symptoms of diarrhea and diarrheal illness,
respectively. In both surveys, children < 5 years of age and adults 18-35 years of
age had the highest prevalences of diarrheal illness. Females in the 2002/2003
survey had a significantly greater prevalence of diarrheal illness compared to
males, 6.0% compared to 4.5%. When all four studies were combined, the
overall rate of diarrheal illness among blacks and those with less than a high
school education were lower than the comparison groups of whites and high
school graduates. The rate of diarrheal illness was higher among rural residents
and medically uninsured compared to urban residents and medically insured
respondents, respectively. Sex, race, age and insurance status were
significantly associated with acute diarrheal illness in multivariable modeling.
Overall 19.5% of those suffering diarrheal illness sought medical care, 3.9% were
asked to submit a stool sample and 3.7% of respondents complied with this
request, additionally 1.9% of all respondents with diarrheal illness were
hospitalized.
National Studies on Acute Gastrointestinal Illness (NSAGI) - Canada 2001-2002:
Majowicz et al. (17) estimated the magnitude and distribution of acute
gastrointestinal illness in a Canadian community. A cross-sectional survey was
14
administered by telephone from February 2001 to February 2002. Population
sampling was conducted using a randomized list of residential telephone
numbers, and one individual from each household was identified randomly by
selecting the individual with the next birthday. Respondents were asked whether
they experienced any symptoms of diarrhea or vomiting in the previous 28 days.
In total 3,496 surveys were completed (36.6% response rate); 351 respondents
were identified to be cases of acute gastrointestinal illness; an additional 77
identified their symptoms as due to a pre-existing condition and were included in
the non-case group for analysis. Prevalence was significantly higher in children
0-9 years of age and young adults 20-24 years of age and there were
significantly more female than male cases. Overall, 1% of cases reported being
hospitalized for their illness.
NSAGI - Canada 2002-2003:
Thomas et al. (26) described the frequency, magnitude, distribution and
clinical burden of acute, self-reported gastrointestinal illness in British Columbia.
A cross-sectional telephone survey was administered from June 2002 to June
2003. A randomized list of residential telephone numbers was used and one
individual from each household was identified randomly by selecting the
individual with the next birthday. Respondents were asked about experiencing
any symptoms of diarrhea or vomiting in the previous 28 days. In total 4,612
surveys were completed (44.3% response rate); 451 respondents were identified
as acute cases of gastrointestinal illness; an additional 131 cases were identified
15
as chronic cases and were included in the non-case group for analysis.
Prevalence was highest in those 0-9 and 10-14 years of age, higher in females
than in males and higher in those with a university, graduate or professional
degree. Overall, 11.6% of cases visited a healthcare provider, of which 23.1 %
were asked to submit a stool sample; 83.3% complied. Of cases 18 years of age
or older, 32.5% took time away from work because of their illness of which 43.5%
lost income as a result of their absence.
NSAGI - Canada (2005 - 2006):
Sargeant et al. (25) estimated the burden, severity and demographic
distribution of acute gastrointestinal illness in Ontario. A cross-sectional
telephone survey was administered from May 2005 to April 2006. Ontario
residential telephone numbers were randomly selected and one individual from
each household was identified at random by selecting the person with the next
birthday. The survey elicited information on symptoms of vomiting or diarrhea in
the previous 28 days as well as medical history and medical system or
medication use to treat illness. In total, 2,090 surveys were completed (36.6%
response rate); 178 respondents were identified as acute cases of Gl; an
additional 34 were identified as chronic cases and were included in the non-case
group for analysis. Prevalence was higher among rural residents (compared to
urban residents), females (compared to males) and in the months of February
and April (compared to December). Overall, 22% of cases sought medical care,
16
of which 33% were asked to submit a stool sample and 100% complied with this
request.
1.3 Australia
OzFoodNet - Australia 2001 - 2002:
Hall et al. (19) conducted a national community survey to estimate the
number of cases of gastroenteritis and to identify any regional, seasonal,
demographic and socioeconomic risk factors for gastroenteritis in Australia. A
cross-sectional survey was administered via telephone from September 2001 to
August 2002. Random digit dialling was used to select households and
interviewers asked to speak to the person with the next birthday. Parents or
guardians responded on behalf of children <15 years of age. Respondents were
asked about symptoms of vomiting and diarrhea within the 4 weeks prior to
interview. Infectious gastroenteritis was defined as at least three loose stools or
two vomits in 24 hours, or at least four loose stools or three vomits in 24 hours if
respiratory symptoms were present. In total, 6,987 surveys were completed
(67% response rate); 11.2% of respondents reported having any diarrhea or
vomiting and 7.4% met the case definition for symptoms in the 4 weeks prior to
interview. Prevalence was higher among females than males and among young
children (0-4 years of age). From multivariable analysis, region, season, age and
sex were found to be associated with having gastroenteritis. There were greater
odds of gastroenteritis in Northern Territory compared to Queensland, in summer
compared to spring, for children 0-4 years of age and for females compared to
17
males. For those with less than year 10 of education, higher levels of
gastroenteritis were associated with lower and higher income levels, and lower
levels of gastroenteritis were associated with middle levels of income. For those
with higher levels of education, income had little effect. Those without medical
insurance were more likely to report gastroenteritis.
1.4 Jordan
Jordan 2003 - 2004:
Gargouri et al. (29,30) estimated the burden of disease due to Salmonella,
Shigella and Brucella infections in Jordan. As part of this work, national cross-
sectional population surveys were conducted in September 2003 and May 2004
to estimate the numbers of people experiencing symptoms consistent with
Salmonella, Shigella and Brucella infections (i.e., diarrhea for salmonellosis and
shigellosis, and persistent fever for brucellosis and salmonellosis caused by
Salmonella Typhi infection). Respondents were selected at random and surveys
were administered face-to-face. Those less than one year of age were excluded
from the survey. Questions pertained to diarrhea and persistent fever in the 30
days prior to interview as well as whether the ill person sought medical care, and
if so whether they went to a Ministry of Health (MOH) facility and submitted a
sample. Diarrhea was defined as three or more loose stools that took the shape
of a container in a 24 hour period, and persistent fever was defined as a fever
lasting more than 48 hours. In September 2003, 759 surveys were completed
(91% response rate); 7.8% of respondents experienced diarrhea and 2.3%
18
experienced persistent fever. Of the diarrhea cases, 19.5% sought medical
attention and 8.9% went to a Ministry of Health (MOH) facility. In May 2004, 819
surveys were completed (98% response rate); 6.1% of respondents experienced
diarrhea and 1.1 % experienced persistent fever. Of the diarrhea cases, 40.8%
sought medical care and 71.1 % went to a MOH facility. Overall the rate of
diarrhea in the community was 0.8 episodes per person-year.
1.5 Latin America
Cuba 2005 - 2006:
Prieto et al. (28) determined the temporal and demographic distribution
and burden of self-reported acute gastrointestinal illness in Cuba. A cross-
sectional survey was administered door-to-door within three sentinel sites during
two time periods, June - July 2005 (rainy season) and November 2005 -
January 2006 (dry season). Households were randomly selected from a list
maintained by the medical office at the site. One individual per household was
selected to complete the interview. Though attempts were made to select this
person at random by asking for the person with the next birthday, in most
interviews the person who answered the door was the respondent. Acute
gastrointestinal illness was defined as three or more bouts of loose stools in a 24
hour period in the 30 days prior to interview. In total, 6,399 interviews were
completed (97.3% response rate); 680 respondents had experienced symptoms
of acute gastrointestinal illness. Prevalence varied by site and season. From
multivariable analysis, gastrointestinal illness was higher in the rainy season, in
19
children 0-12 years of age and teens 13-17 years of age compared to adults 25-
54 years of age, and in males. Proportions of cases that visited a physician
ranged from 17.1 % to 38.1%, of which 33.3% to 53.9% were asked to submit a
stool sample and 72.7% -100.0% complied. Of those who sought treatment,
0.0% - 31.6% received an antibiotic for treatment. Hospitalization was low with
1.2% of cases being hospitalized for their illness.
Table 1.1 provides a summary of the above described burden of acute
gastrointestinal illness surveys. These studies were the most recent and relevant
to this thesis, however additional studies do exist (37). Three studies used
prospective cohort methodology while the remaining studies were conducted as
cross-sectional studies. Only two studies were conducted in developing
countries (Cuba and Jordan) and both were administered face-to-face, which
likely contributed to the high response rates achieved. Additionally, these
surveys were conducted during two time periods rather than over an entire year,
as was the case with the studies conducted in developed countries (excepting
the first study in the Netherlands (21)). In many of the studies, a greater
occurrence of Gl was found in women and children. Additionally, some studies
found GI to be associated with higher education and certain months or seasons.
Incidence of Gl ranged from 0.18 to 1.4 episodes per person-year, with the three
studies conducted as prospective cohorts having the lowest incidence estimates.
It is likely that variation in incidence estimates reflects not only potential true
differences in disease burden in these locations, but also differences in
20
methodology and case definition employed in the study, thus making direct
comparisons more difficult.
2. Food and water consumption community surveys
2.1 Food consumption surveys
The Food and Drug Administration (FDA) National Survey - USA 1992 - 1993:
Klontz et al. (38) assessed the prevalence of selected food consumption
and preparation behaviours associated with increased risks of food-borne illness
and demographic characteristics related to such behaviours. The FDA
completed a telephone survey of 1,620 individuals (65% response rate) with
questions pertaining to consuming raw animal protein foods and handling of
cutting boards. More than 50% of respondents reported eating foods with raw
eggs, 23% usually ate hamburgers undercooked and 17% reported eating raw
shellfish. After cutting raw meat or chicken, 26% of respondents did not wash
their cutting board with soap or bleach or replace with a different cutting board to
continue preparing food. Males, adults 18-39 years of age and those with more
than a high school education were more likely to consume raw animal protein
foods, compared to females, adults >39 years of age and those with less than
high school education, respectively. Similarly, males and individuals 18-39 years
of age were more likely to use a dirty cutting board.
21
The Behavioral Risk Factor Surveillance System (BRFSS) - USA 1995 - 1996:
Yang et al. (39) reported the results of standard food safety questions that
were added to the BRFSS survey in 8 states in 1995 and 1996. The BRFSS
survey is an on-going, telephone health survey system that tracks health
conditions and risk behaviours in the United States.2 Surveys were administered
to non-institutionalized adults (>17 years of age) by telephone in 1995 and 1996.
The standard food safety questions pertained to handling of raw meat or chicken,
consumption of high risk food items, knowledge of safe food handling practices
and occurrence of diarrhea. In total, 19,356 interviews were completed and
responses pertained to the 12 months prior to interview. Approximately 50% of
respondents had eaten undercooked eggs in the previous 12 months.
Consumption of undercooked hamburgers was more common among males than
females, decreased with increasing age and increased with increasing salary and
education. Nearly 20% of respondents did not wash their hands or the cutting
board with soap after handling raw meat or chicken.
FoodNet - USA 1998 - 1999:
Samuel et al. (40) reported results from food consumption questions of the
FoodNet survey administered to 12,755 Americans > 17 years of age. In total,
10,209 responses were included in the analysis. Approximately 18% of
respondents consumed runny eggs in the 7 days prior to interview, followed by
alfalfa sprouts (8%) and pink hamburgers (7%). Overall, 62% of respondents
2 Center for Disease Control, Behavioral Risk Factor Surveillance System, http://www.cdc.qov/brfss/.
22
reported not eating any of the risky foods in the 7 days prior to interview. Males
were more likely than females to consume more than 1 risky food. Adults >64
years of age were less likely to consume risky foods while immuno-compromised
respondents were more likely to consume risky foods compared to their healthy
counterparts.
C-EnterNet - Canada 2005 - 2006:
Nesbitt et al. (36) evaluated the food consumption patterns of the general
population in the Waterloo Region of Ontario and described, from a food safety
perspective, demographic factors that related to the consumption of specific food
items. A cross-sectional survey was administered by telephone from November
2005 to March 2006 to randomly selected residents. Households were randomly
sampled from a list of residential telephone numbers and the individual with the
next birthday was selected for interview. Questions pertained to location of meal
consumption, types of food consumed, water consumption, hygiene and food
safety practices, acute gastrointestinal illness in the previous week and previous
four weeks, demographics, grocery purchasing habits and food preparation
habits. Questions about food consumption pertained to the seven days prior to
interview. Where appropriate, questions pertaining to grocery purchasing were
asked of the person identified as most familiar with these practices for the
household. In total, 2,332 surveys were completed (32.7% response rate). In
general, males were more likely than females to consume foods considered high
risk for the transmission of enteric pathogens. Respondents >65 years old were
23
more likely to consume eggs, including undercooked eggs, than other age
groups. Consumption of chicken nuggets, hamburgers (not made at home) and
deli meats was highest among children, teens and young adults suggesting
elevated interest in convenience foods for these age groups. Home was the
most commonly reported place for meal preparation with an average of 25.8
meals per week prepared at home. The percentage of respondents whose food
consumption patterns in the week prior to survey were typical of a normal week
ranged from 80.3% to 95.5% depending on general food category.
2.2 Water consumption surveys
FoodNet - USA 1998 - 1999:
Lee et al. (41) reported results of water consumption-related questions
that were incorporated into FoodNet surveys administered to 7 sites from 1998-
1999. In total 12,755 people participated and 63.8% identified municipal water
as their primary water source, followed by bottled water (17.8%), and private well
water (15.0%). Of tap water drinkers, 30% treated their water, with filtration
being the most common method (76.0%). Reasons for drinking bottled water
included improved taste and odour (49.1%), avoiding chemicals (28.0%) and
avoiding germs (16.5%). Experiencing diarrheal illness was not associated with
any of the water exposure variables.
NSAGI - Canada 2001 - 2002:
24
Jones et al. (42) described the drinking water consumption patterns and
associations with various demographic characteristics of the residents of
Hamilton, Ontario. A cross-sectional telephone survey was administered
September 2001 - March 2002. A residential telephone listing was used to
identify households and the individual with the next birthday was selected to
respond to the survey. Proxy respondents were used for subjects > 12 years of
age, and at the discretion of the parent or guardian for those 1 2 - 1 8 years of
age. Questions pertained to the amount of water consumed in the previous 24
hour period including all plain water or water consumed from beverages made
from water combined with frozen juices or flavoured crystals as well as the
amount of water consumed from bottled water. Other questions pertained to use
of water treatment devices as well as demographic variables. A total of 1,757
surveys were completed (37.4% response rate). Total daily water intake ranged
from zero to thirty-two 250 ml servings, with a median of four servings. From
multivariable analysis, water consumption decreased with increasing age and
was higher for respondents with higher levels of education than 'less than high-
school', and residents using in-home water treatment devices consumed more
water than those who did not use water treatment devices. In total, 27.3% of
respondents were classified as bottled water users (i.e., those who consumed
75% or more of their total water as bottled water) while 59.7% of respondents did
not consume any bottled water. From multivariable analysis, the probability of
being a bottled water user increased with increasing age until the age of 31 and
then decreased as age increased; in-home water treatment users were less likely
25
to be bottled water users, and the odds of bottled water use was less for
weekdays compared to weekends. Use of water treatment devices was reported
by 49% of respondents, with jug filters being used by 66.2% of these
respondents.
NSAGI - Canada 2002 - 2003:
Jones et al. (43) described the drinking water consumption patterns and
associations with demographic characteristics and acute gastrointestinal illness
in three communities in British Columbia. A cross-sectional telephone survey
was administered June 2002 - June 2003. Questions pertained to the amount of
water consumed as tap water and as bottled water in the 24 hours prior to
interview, as well as use of water treatment devices in the home, source of water
(municipal, private source, both, or other source), demographic factors and
recent symptoms of vomiting and diarrhea. In total, 4,612 surveys were
completed (44% response rate). Total daily water consumption ranged from zero
to thirty-six 250ml servings with a median of four servings in the 24 hours prior to
interview. From multivariable analysis, bottled water users consumed more
water, water consumption was higher on weekdays than on weekends,
respondents with higher levels of education consumed more water, and females
over the age of 25 years consumed more water than males. In total, 23% of
respondents were identified as bottled water users (i.e., those who consumed
75% or more of their total water as bottled water) while 67.4% of respondents
consumed no bottled water in the 24 hours prior to interview. From multivariable
26
analysis, bottled water use increased with increasing age until approximately 26
years of age and then began to decline with increasing age. An increased
probability of being a bottled water user was associated with municipal water
source compared to private water source, a higher level of income and with not
using an in-home water treatment device. In-home water treatment devices were
used by 47% of the respondents, with jug filters being the most common choice
(53%). Odds of reporting symptoms of acute gastrointestinal illness increased
with increasing amount of water consumed, controlling for age and sex.
Sweden 1999-2003:
Westrell et al. (44) estimated the drinking water consumption and
evaluated potential demographic differences that could impact water intake in
Sweden using three data sources: 1. a national environmental health survey
conducted in 1999; 2. a waterborne disease outbreak investigation in 2002; and,
3. a small water consumption study from 2003. The national survey was
administered to 15,496 residents of which 11,233 responded (73% response
rate) and 10,957 provided answers regarding water intake within the home. The
waterborne disease outbreak investigation reported results of a cohort study
questionnaire administered to all 605 permanent residents in the area of the
outbreak, of which 387 responded (64% response rate) and 157 people provided
information on water consumption. Heated tap water and bottled water
consumption was the focus of the small water consumption study with 75
respondents (63% response rate). Daily consumption of cold tap water ranged
27
from 0.2 to 2.4 litres with an average of 0.86 litres. Women drank more tap water
than men, people >70 years of age consumed the most water while those aged
40-49 years consumed the least. Average daily bottled water intake was low with
0.06 litres/day being consumed; however, increasing bottled water consumption
was associated with increasing income.
C-EnterNet - Canada 2005 - 2006:
Pintar et al. (45) examined the daily amount of water consumed and
different factors related to water consumption. A cross-sectional survey was
administered by telephone from November 2005 to March 2006 to randomly
selected residents of the Waterloo Region of Ontario. Questions pertained to
amount of water consumed in the 24 hours prior to interview, use of water
treatment devices and amount of bottled water consumed along with
demographic variables. Interviews were completed by 2,332 respondents
(32.7% response rate). Answers regarding amount of water consumed were
obtained from 2,189 respondents, among which total water consumption ranged
from 0 to 6.25L per day, mean of 1.39L. From multivariate modeling, men
consumed less water than women and this volume decreased with age of
respondent. Frequent bottled water drinkers (i.e., those that consumed 75% or
more of their total water as bottled water) consumed less water. A higher level of
education was associated with higher water consumption, except for those with
an advanced post-graduate degree who consumed less than the referent group
with some trade, college or university training. Respondents who had an
28
advanced water treatment system consumed more water if they also consumed
bottled water, compared to those who consumed bottled water and had either no
water treatment system or a carbon filter system. In total, 34% of respondents
were identified as bottled water users and 48% consumed no bottled water in the
24 hours prior to interview. From multivariable analysis of the non-bottled water
users, older respondents consumed less water and this effect was more
pronounced in males than in females. Overall, males consumed less water than
females, a higher level of education was associated with higher water
consumption (except for those with an advanced degree where it was associated
with lower water consumption), and respondents that used an advanced
treatment device consumed less water than those that used a carbon filter.
Table 1.2 summarizes the food and water consumption studies reviewed
above. All of these studies were conducted in developed countries and all but the
Swedish water consumption study solely used cross-sectional methodology. The
English IID study attempted to identify foods associated with I ID; however, due to
their methodology (prospective cohort with a nested case-control) they were
unable to achieve this goal (46). Foods considered to be higher risk for Gl were
regularly consumed in these study populations. Several studies report that more
water is consumed by women than men and those with higher levels of
education. A wealth of related literature on nutrition and nutrition related
diseases (e.g., diabetes, obesity, etc.), water intervention trials, outbreak
29
investigations and other non-population, burden of acute gastrointestinal illness
based studies exists but is outside the scope of this review.
3. Community estimates for pathogens
IIP Study-England:
Wheeler et al. (27) studied the incidence and etiology of infectious
intestinal disease (IID) in England in 1993 - 1996 as described earlier.
Pathogen-specific incidence rates in the community were calculated based on
the number of incident cases occurring in the population cohort divided by the
number of person-weeks of follow-up. Pathogen-specific general practice rates
were calculated based on the number of incident cases presenting at a general
practice divided by the practice population. Community and general practice
pathogen-specific incidence rates were combined with rates of positive laboratory
testing and reporting to national surveillance to construct reporting pyramids for
all IID, Campylobacter, Salmonella, Rotavirus, and Small round structured
viruses. Ratios of the number of community cases to those reported to the
national surveillance for Salmonella, Campylobacter, Rotavirus and Small round
structured viruses were 3.2:1, 7.6:1, 35.0:1 and 1562:1, respectively.
USA:
Mead et al. (35) used data from numerous sources including FoodNet
surveys to estimate the number of food-related illnesses and deaths in the United
States. Total cases reported, by pathogen, was obtained from passive and
30
active surveillance systems, outbreak reports, and individual studies. Under-
ascertainment by pathogen was taken into account using multipliers generated
from FoodNet surveys, literature and expert opinion. A factor of 38 was used for
pathogens that cause primarily non-bloody diarrhea. A factor of 20 was used for
pathogens that typically cause bloody diarrhea. A factor of 2 was used for
pathogens that typically cause very severe illness. Estimated total annual cases
were generated for a number of bacteria, parasites and viruses, including
approximately 1.4 million cases of salmonellosis, 2.5 million cases of
campylobacteriosis, 0.5 million cases of shigellosis and 73,000 infections due to
Escherichia coli 0157:H7 in the entire population.
FoodNet-USA:
Voetsch et al. (31) used data from FoodNet surveys and other sources to
estimate the number of non-Typhoidal Salmonella infections and resultant
physician visits, hospitalizations and deaths in the community that occurred
annually in the USA from 1993 - 1996. Multipliers were generated for those with
both bloody and non-bloody symptoms, with the relevant proportions determined
from a Salmonella case-control study. Data from FoodNet active surveillance
provided age-specific incidence rates of salmonellosis for the FoodNet sites,
which were extrapolated to the entire USA population to determine an estimated
annual total number of laboratory confirmed cases of salmonellosis. The
FoodNet active surveillance system provided information on the rate of
hospitalization and death. Data from a laboratory survey were used to estimate
31
the frequency of laboratory testing for Salmonella and the sensitivity of laboratory
tests was estimated from the literature. Data from population surveys were used
to estimate the proportion of cases that seek medical attention, have a stool
sample requested and submit a stool sample. For each culture-confirmed case
of Salmonella it was estimated that there were 38.6 cases in the community and
that Salmonella caused 14,860 hospitalizations and 415 deaths annually.
NSAGI-Canada:
Thomas et al. (47) used data from the NSAGI surveys and other literature
to estimate the number of community cases of illness due to Salmonella,
Campylobacter and verotoxigenic Escherichia coli (VTEC) in Canada circa 2000.
Multipliers were determined for both bloody and non-bloody diarrhea and the
proportion of pathogen-specific cases in each category was based on information
from the international literature. The Canadian National Notifiable Disease
registry (NND) provided data on the annual number of laboratory confirmed
cases. Data from the NSAGI public health reporting survey were used to
determine the frequency of case reporting from local to provincial health
authorities. Data from the NSAGI laboratory survey were used to estimate the
frequency of laboratory reporting to the local health authority and the frequency
of sample testing for each pathogen. Sensitivities of laboratory tests were taken
from international literature. The NSAGI population surveys provided estimates
for the frequency of cases seeking medical attention, being requested to submit a
sample and complying with the sample request. Conservative and liberal
32
estimates were calculated for each pathogen to account for uncertainty in the
estimates. It was estimated that for every case of VTEC, Salmonella and
Campylobacter infection reported to NND, there were 10-47, 13-37 and 23-49
infections annually in the Canadian population, respectively. This corresponds to
an annual rate of 0.7 - 3.3, 2.5 - 6.9 and 9.1 - 19.3 per 1,000 Canadians, of
VTEC, Salmonella and Campylobacter infections, respectively.
QzFoodNet - Australia:
Hall et al. (48) estimated multipliers to be applied to the annual number of
cases of salmonellosis, campylobacteriosis and Shiga toxin-producing
Escherichia coli (STEC) infections reported to the Australian Notifiable Diseases
Surveillance System, as well as the community incidence of these infections in
Australia. Severity of symptoms (bloody vs. non-bloody, and duration (1-2 days,
3-4 days and 5 or more days)) was used to categorize cases of gastroenteritis,
and multipliers were calculated according to these categories. Infections by the
three pathogens of interest were classified by these same severity categories.
To generate the case categories, data from the Australian National
Gastroenteritis (NGS) survey and unpublished reports on practices for treatment
and management of gastroenteritis by general practitioners were used. Data
from the Royal College of Pathologists Australasia Quality Assurance Programs
were used to determine the probability of correctly identifying Salmonella and
Campylobacter in stool samples by laboratories. Expert opinion was used to
determine the probability of a positive laboratory result being reported to health
33
authorities. Symptom profiles of salmonellosis and campylobacteriosis were
taken from unpublished case-control studies in Australia. Unpublished data from
OzFoodNet provided information on reported cases of STEC and laboratory
sensitivity of detecting STEC. The numbers of annual community Salmonella,
Campylobacter and STEC infections in Australia were estimated to be 49,843,
224,972 and 4,420, respectively, circa 2000-2004. This corresponds to an
annual rate of 262, 1184 and 23 Salmonella, Campylobacter and STEC
infections per 100,000 population.
Jordan:
Gargouri et al. (30) estimated the burden of disease due to Salmonella,
Shigella and Brucella infections in Jordan. National cross-sectional population
surveys were conducted in September 2003 and May 2004 to estimate the
number of people experiencing symptoms consistent with Salmonella, Shigella
and Brucella infections (i.e., diarrhea for non-typhoidal salmonellosis and
shigellosis and persistent fever for brucellosis and salmonellosis caused by
Salmonella Typhi infection). During September 2003 and May 2004 a survey of
all laboratories that received blood or stool samples to test for Salmonella,
Shigella or Brucella was conducted to determine the number of stool cultures,
blood cultures, Brucella tube agglutination tests, and the number of laboratory
confirmed cases of Salmonella, Shigella or Brucella. National surveillance data
from September 2003 to August 2004 were reviewed to compare the number of
reported Salmonella, Shigella or Brucella infections in Jordan to the number
34
reported in the Ministry of Health (MOH) laboratory survey. The annual average
number of cases was estimated by summing the two month estimates and
multiplying by six. Multipliers were calculated using the proportion of ill people >1
year of age who sought care only and those who sought care at MOH facilities
and submitted a clinical stool or blood specimen to an MOH laboratory. These
multipliers were applied to the numbers of laboratory confirmed non-typhi
Salmonella, Shigella or Brucella infection obtained from the MOH laboratory
survey to estimate the burden of disease. No laboratory samples were positive
for Salmonella Typhi or Salmonella Paratyphi A, B or C. The total numbers of
national non-typhi Salmonella and Shigella infections were estimated to be
16,266 and 6,606 per year, respectively, which corresponds to rates of 306 and
124 per 100,000 people. The total number of national cases of Brucella infection
was estimated to be 6912 per year, corresponding to a rate of 130 cases per
100,000 people.
The six above-reviewed studies provide community pathogen-specific
burden estimates; only one was conducted in a developing country. Some work
has been done to better capture the uncertainty of these estimates with
confidence intervals and credible intervals calculated for estimates by the English
and Australian studies, respectively. Several other key studies (49,50) have
incorporated and made refinements to these sorts of calculations; however, their
focus was specific to the burden attributable to foodborne disease, (i.e., number
of cases, hospitalizations and deaths due to foodborne disease, by pathogen)
35
and thus are not included in this review. Other studies describe pathogen-
specific burden but were conducted in specific demographic groups (i.e., children
<5 years old) typically using prospective cohort methodology rather than
population study-based multiplier estimations, and, thus, are not included in this
review.
Rationale
Although the reviewed studies have established some accepted
approaches to burden of illness research, several important methodologic
questions remain. For example: what is the impact of using different recall
periods in a population-level burden of acute gastrointestinal illness study?; how
can population-level burden of acute gastrointestinal illness study methods be
adapted for use in developing countries or countries with limited resources? In
addition, while the burden of Gl is relatively well understood in developed
countries, it remains largely undescribed in developing or under-resourced
countries, including those of South America. Burden of Gl questions specific to
South American include: what is the population-level burden of Gl in South
America?; what population-level food and water consumption-related risk factors
for Gl exist in South America?; and what are the community-level enteric
pathogen-specific burden estimates in South America? Answering these
questions is the basis for the rationale of this thesis.
The concern around recall bias is central to study design methodology for
data collection in a population study. Recall bias, a form of information bias, can
36
result in misclassification of study participants (51). This misclassification can
contribute to over- or under-estimation of the true burden of illness as well as
potentially distort relationships with factors and behaviours of interest (e.g.,
socio-demographic factors, medical care seeking behaviours etc.). These errors
can be exacerbated, for example, when these data are extrapolated to generate
estimates for entire populations or regions, used to inform risk assessments or to
generate pathogen-specific community estimates.
The prospective cohort approach is less likely to suffer from recall bias,
but is costly and more difficult to complete than the survey approach. In addition,
this approach can include the requirement that participants who experience Gl
symptoms to submit a stool sample, as was the case in England (27) and the
Netherlands (21,22). This may deter respondents from reporting symptoms in
order to avoid having to collect a stool sample, contributing to under-estimation.
The cross-sectional study design can be subject to recall bias in the form of
'telescoping' or forgetting, which can result in over- or under-estimates, but is
less costly and time consuming and does not typically require stool samples from
those with symptoms.
Route of survey administration can affect survey cost as well as response
rate and study participation. Face-to-face surveys are more labour-intensive,
time-consuming and costly compared to telephone or mail-in survey
administration; however, response and participation rates may be compromised.
Maintaining anonymity is a challenge for face-to-face interviews which may make
potential responders hesitant to participate. A lack of literacy may generate
37
selection bias in a mail-in survey where respondents would be required to read
and understand each question in order to participate. Similarly, the use of
cellular phones or lack of land-line telephones may generate selection bias in a
telephone survey if participants are selected from a land-line directory or are
unwilling to participate in a survey using their cellular phone. It is crucial to
ensure an appropriate study population to obtain representative results.
Capture of data over a full year or multiple years is ideal; however, this
can be prohibitive due to budget and resource limitations. Approximations can
be made by selecting Gl high- and low-season time periods for the study (e.g.,
using historical surveillance data to determine when the highest and lowest
incidence of Gl occur in the population and administering the study during these
two time periods). This method makes data collection more vulnerable to
disease outbreaks, timing of holidays or special events and other unexpected
changes during survey time periods. It is necessary to have reliable historical
surveillance data from which to select time periods.
The scarcity of information from less developed parts of the world,
including South America, has resulted in a gap of valuable information on acute
gastrointestinal illness. The World Health Organization has recognized the need
for studies and the development of suitable methodologies to address this
knowledge gap (3,52). Identification of region and country-specific risk factors
and behaviours associated with acute gastrointestinal illness, in particular food
and water consumption and food handling behaviours, is important for effective
control and prevention strategies. The relative importance of these factors may
38
vary by location, gender, age and socio-economic status, and, thus, must be
explored with these variables in mind.
Generating pathogen-specific community level estimates for specific
countries or regions is important for better understanding of the burden of acute
gastrointestinal illness in the population. This information can highlight target
areas for prevention and control measures, as well as methods that can enhance
pathogen surveillance and reporting mechanisms.
Proper case definitions for diarrhea and acute gastrointestinal illness are
important for study comparisons. This has been the topic of much discussion in
the literature and is still evolving (53-56). Although not specifically addressed as
part of this thesis, a proposed standard case definition (53) was used when
possible.
Objectives
The main goal of this thesis was to describe the distribution and
population-level burden of acute gastrointestinal illness in select South American
communities, identify risk factors for Gl and evaluate the effect of different recall
periods on Gl incidence rates in population-level burden of acute gastrointestinal
illness studies. To achieve this goal, community-level burden of acute
gastrointestinal illness studies were conducted in Galvez, Santa Fe, Argentina
and in the Metropolitan Region, Chile. The specific objectives were:
39
• to determine the burden, distribution and associated risk factors of acute
gastrointestinal illness in Galvez, Argentina and the Metropolitan Region,
Chile;
• to examine the impact of different recall periods on precision and accuracy
of burden estimates;
• to evaluate food consumption trends and food sources within a food safety
context and their relationship with acute gastrointestinal illness in the
study areas;
• to evaluate water consumption trends and their relationship with acute
gastrointestinal illness in the study areas;
• to estimate the number of cases at the study population-level for specific
pathogens related to acute gastrointestinal illness and of public health
importance.
40
References
1. Guerrant RL, Kosek M, Moore S, Lorntz B, Brantley R, Lima AA. Magnitude and impact of diarrheal diseases. Arch Med Res 2002;33(4):351-5.
2. Kosek M, Bern C, Guerrant RL. The global burden of diarrhoeal disease, as estimated from studies published between 1992 and 2000. Bull World Health Organ 2003;81 (3): 197-204.
3. Stein C, Kuchenmuller T, Hendrickx S, Pruss-Ustun A, Wolfson L, Engels D, et al. The Global Burden of Disease assessments--WHO is responsible? PLoS Negl TropDis 2007; 1(3):e161.
4. Bryce J, Boschi-Pinto C, Shibuya K, Black RE, WHO Child Health Epidemiology Reference Group. WHO estimates of the causes of death in children. Lancet 2005;365(9465):1147-52.
5. Podewils LJ, Mintz ED, Nataro JP, Parashar UD. Acute, infectious diarrhea among children in developing countries. Semin Pediatr Infect Dis 2004;15(3):155-68.
6. Farthing MJ. Diarrhoea: a significant worldwide problem. Int J Antimicrob 4gente2000;14(1):65-9.
7. Kaferstein F. Foodbome diseases in developing countries: aetiology, epidemiology and strategies for prevention. Int J Environ Health Res 2003; 13 SuppM:S161-8.
8. Schlundt J. New directions in foodbome disease prevention. Int J Food Microbiol 2002;78(1 -2):3-17.
9. Herikstad H, Motarjemi Y, Tauxe RV. Salmonella surveillance: a global survey of public health serotyping. Epidemiol /nfecf 2002;129(1):1-8.
10. Guerrant RL, Kosek M, Lima AA, Lorntz B, Guyatt HL. Updating the DALYs for diarrhoeal disease. Trends Parasitol 2002; 18(5): 191 -3.
11. Flint JA, Van Duynhoven YT, Angulo FJ, DeLong SM, Braun P, Kirk M, et al. Estimating the burden of acute gastroenteritis, foodbome disease, and pathogens commonly transmitted by food: an international review. Clin Infect Dis 2005;41(5):698-704.
12. Jones TF, McMillian MB, Scallan E, Frenzen PD, Cronquist AB, Thomas S, et al. A population-based estimate of the substantial burden of diarrhoeal disease in the United States; FoodNet, 1996-2003. Epidemiol Infect 2007; 135(2):293-301.
41
13. Scallan E, Majowicz SE, Hall G, Banerjee A, Bowman CL, Daly L, et al. Prevalence of diarrhoea in the community in Australia, Canada, Ireland, and the United States. Int J Epidemiol 2005;34(2)A54-60.
14. Prado V, Solari V, Alvarez IM, Arellano C, Vidal R, Carreno M, et al. Epidemiological situation of foodborne diseases in Santiago, Chile in 1999-2000. Rev Med CA7//2002;130(5):495-501.
15. O'Brien SJ, Gillespie IA, Sivanesan MA, Elson R, Hughes C, Adak GK. Publication bias in foodborne outbreaks of infectious intestinal disease and its implications for evidence-based food policy. England and Wales 1992-2003. Epidemiol Infect 2006; 134(4):667-74.
16. Scallan E, Fitzgerald M, Collins C, Crowley D, Daly L, Devine M, et al. Acute gastroenteritis in northern Ireland and the Republic of Ireland: a telephone survey. Commun Dis Public Health 2004;7(1):61-7.
17. Majowicz SE, Dore K, Flint JA, Edge VL, Read S, Buffett MC, et al. Magnitude and distribution of acute, self-reported gastrointestinal illness in a Canadian community. Epidemiol Infect 2004; 132(4):607-17.
18. McGuire T, Wells KB, Bruce ML, Miranda J, Scheffler R, Durham M, et al. Burden of illness. Ment Health Serv Res 2002;4(4): 179-85.
19. Hall GV, Kirk MD, Ashbolt R, Stafford R, Lalor K. Frequency of infectious gastrointestinal illness in Australia, 2002: regional, seasonal and demographic variation. Epidemiol Infect 2006;134(1 ):111 -8.
20. Herikstad H, Yang S, Van Gilder TJ, Vugia D, Hadler J, Blake P, et al. A population-based estimate of the burden of diarrhoeal illness in the United States: FoodNet, 1996-7. Epidemiol Infect 2002;129(1):9-17.
21. Hoogenboom-Verdegaal AM, de Jong JC, During M, Hoogenveen R, Hoekstra JA. Community-based study of the incidence of gastrointestinal diseases in The Netherlands. Epidemiol Infect 1994;112(3):481-7.
22. de Wit MA, Koopmans MP, Kortbeek LM, Wannet WJ, Vinje J, van Leusden F, et al. Sensor, a population-based cohort study on gastroenteritis in the Netherlands: incidence and etiology. Am J Epidemiol 2001 ;154(7):666-74.
23. Imhoff B, Morse D, Shiferaw B, Hawkins M, Vugia D, Lance-Parker S, et al. Burden of self-reported acute diarrheal illness in FoodNet surveillance areas, 1998-1999. Clin Infect Dis 2004;38 Suppl 3:S219-26.
42
24. Kuusi M, Aavitsland P, Gondrosen B, Kapperud G. Incidence of gastroenteritis in Norway-a population-based survey. Epidemiol Infect 2003;131(1):591-7.
25. Sargeant JM, Majowicz SE, Snelgrove J. The burden of acute gastrointestinal illness in Ontario, Canada, 2005-2006. Epidemiol Infect 2007:1-10.
26. Thomas MK, Majowicz SE, MacDougall L, Sockett PN, Kovacs SJ, Fyfe M, et al. Population distribution and burden of acute gastrointestinal illness in British Columbia, Canada. BMC Public Health 2006;6:307.
27. Wheeler JG, Sethi D, Cowden JM, Wall PG, Rodrigues LC, Tompkins DS, et al. Study of infectious intestinal disease in England: rates in the community, presenting to general practice, and reported to national surveillance. The Infectious Intestinal Disease Study Executive. BMJ 1999;318(7190):1046-50.
28. Aguiar Prieto P, Finley RL, Muchaal PK, Guerin MT, Isaacs S, Castro Dominguez A, et al. Burden of self-reported acute gastrointestinal illness in Cuba. J Health Popul Nutr 2009;27:345-57.
29. Gargouri Darwaza N. Jordan burden of foodborne disease sentinel study, 2003 Technical Report.
30. Gargouri N, Walke H, Belbeisi A, Hadadin A, Salah S, Ellis A, et al. Estimated burden of human Salmonella, Shigella, and Brucella infections in Jordan, 2003-2004. Foodborne Pathog Dis 2009;6(4):481-6.
31. Voetsch AC, Van Gilder TJ, Angulo FJ, Farley MM, Shallow S, Marcus R, et al. FoodNet estimate of the burden of illness caused by nontyphoidal Salmonella infections in the United States. Clin Infect Dis 2004;38 Suppl 3:S127-34.
32. Majowicz SE, Edge VL, Fazil A, McNab WB, Dore KA, Sockett PN, et al. Estimating the under-reporting rate for infectious gastrointestinal illness in Ontario. Can J Public Health 2005;96(3):178-81.
33. Thomas MK, Majowicz SE, Sockett PN, Fazil A, Pollari F, Dore KA, et al. Estimated numbers of community cases of illness due to Salmonella, Campylobacter and verotoxigenic Escherichia coli: Pathogen-specific community rates. Can J Infect Dis Med Microbiol 2006; 17(4):229-34.
34. Batz MB, Doyle MP, Morris G,Jr, Painter J, Singh R, Tauxe RV, et al. Attributing illness to food. Emerg Infect Dis 2005;11(7):993-9.
35. Mead PS, Slutsker L, Dietz V, McCaig LF, Bresee JS, Shapiro C, et al. Food-related illness and death in the United States. Emerg Infect Dis 1999;5(5):607-25.
43
36. Nesbitt A, Majowicz S, Finley R, Pollari F, Pintar K, Marshall B, et al. Food consumption patterns in the Waterloo Region, Ontario, Canada: a cross-sectional telephone survey. BMC Public Health 2008;8:370.
37. Roy SL, Scallan E, Beach MJ. The rate of acute gastrointestinal illness in developed countries. J Water Health 2006;4 Suppl 2:31-69.
38. Klontz KC, Timbo BB, Fein SB, Levy AS. Prevalence of selected food consumption and preparation behaviors associated with increased risks of food-borne disease. J Food ProM995;58(8):927-930.
39. Yang S, Leff MG, McTague D, Horvath KA, Jackson-Thompson J, Murayi T, et al. Multistate surveillance for food-handling, preparation, and consumption behaviors associated with foodborne diseases: 1995 and 1996 BRFSS food-safety questions. MMWR CDC Surveill Summ 1998;47(4):33-57.
40. Samuel MC, Vugia D, Koehler KM, Marcus R, Deneen V, Damaske B, et al. Consumption of risky foods among adults at high risk for severe foodborne diseases: Room for improved targeted prevention messages. J Food Safety 2007;27:219-232.
41. Lee S, Levy D, Hightower A, Imhoff B, and the EIP FoodNet Working Group. Drinking water exposures and perceptions among 1998-1999 FoodNet survey respondents. International Conference on Emerging Infectious Diseases. Atlanta, GA, March 2002. Available at: http://www.cdc.gov/iceid/asm-iceid proqram.pdf. Accessed February 20, 2010.
42. Jones AQ, Dewey CE, Dore K, Majowicz SE, McEwen SA, Waltner-Toews D. Drinking water consumption patterns of residents in a Canadian community. J Water Health 2006;4(1): 125-38.
43. Jones AQ, Majowicz SE, Edge VL, Thomas MK, MacDougall L, Fyfe M, et al. Drinking water consumption patterns in British Columbia: an investigation of associations with demographic factors and acute gastrointestinal illness. Sci Total Environ 2007;388(1-3):54-65.
44. Westrell T, Andersson Y, Stenstrom TA. Drinking water consumption patterns in Sweden. J Water Health 2006;4(4):511-22.
45. Pintar KD, Waltner-Toews D, Charron D, Pollari F, Fazil A, McEwen SA, et al. Water consumption habits of a south-western Ontario community. J Water Health 2009;7(2):276-92.
46. Cowden JM. Foodborne infectious risks: do we need a wide system of data collection and survey? The lessons learned from the study of infectious intestinal disease in England. Rev Epidemiol Sante Publique 2002;50(1):89-92.
44
47. Thomas MK, Majowicz SE, Sockett PN, Fazil A, Pollari F, Dore K, et al. Estimated Numbers of Community Cases of Illness Due to Salmonella, Campylobacter and Verotoxigenic Escherichia Coli: Pathogen-specific Community Rates. Can J Infect Dis Med Microbiol 2006; 17(4):229-34.
48. Hall G, Yohannes K, Raupach J, Becker N, Kirk M. Estimating community incidence of Salmonella, Campylobacter, and Shiga toxin-producing Escherichia coli infections, Australia. Emerg Infect Dis 2008; 14(10): 1601 -9.
49. Adak GK, Long SM, O'Brien SJ. Trends in indigenous foodbome disease and deaths, England and Wales: 1992 to 2000. Gut 2002;51(6):832-41.
50. Adak GK, Meakins SM, Yip H, Lopman BA, O'Brien SJ. Disease risks from foods, England and Wales, 1996-2000. Emerg Infect Dis 2005;11(3):365-72.
51. Dohoo I, Martin W, Stryhn H. Veterinary Epidemiologic Research. Charlottetown, PEI, Canada: AVC Inc.; 2003.
52. World Health Organization. WHO consultation to develop a strategy to estimate the global burden of foodbome diseases: Taking stock and charting the way forward. 2007.
53. Majowicz SE, Hall G, Scallan E, Adak GK, Gauci C, Jones TF, et al. A common, symptom-based case definition for gastroenteritis. Epidemiol Infect 2008;136(7):889-94.
54. Baqui AH, Black RE, Yunus M, Hoque AR, Chowdhury HR, Sack RB. Methodological issues in diarrhoeal diseases epidemiology: definition of diarrhoeal episodes. Int J Epidemiol 1991 ;20(4): 1057-63.
55. Wright JA, Gundry SW, Conroy R, Wood D, Du Preez M, Ferro-Luzzi A, et al. Defining episodes of diarrhoea: results from a three-country study in Sub-Saharan Africa. J Health Popul Nutr 2006;24(1 ):8-16.
56. Wright J, Gundry SW, Conroy RM. A review of changing episode definitions and their effects on estimates of diarrhoeal morbidity. J Health Popul Nutr 2007;25(4):448-55.
45
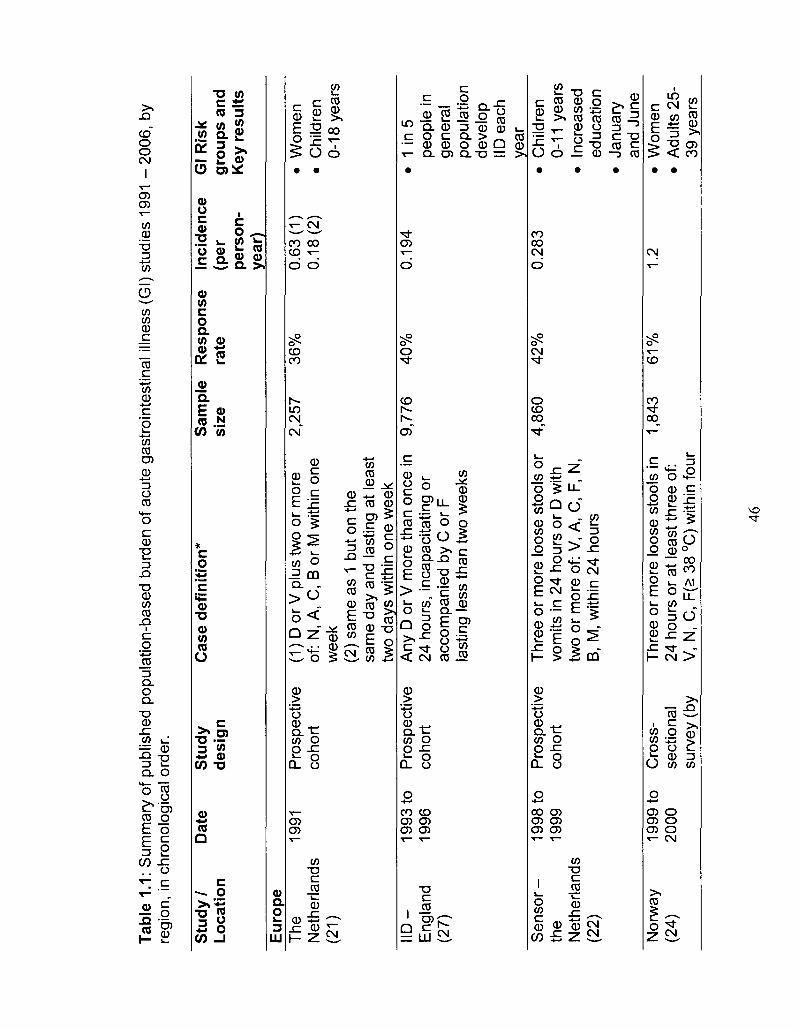
Tabl
e 1.
1: S
umm
ary
of p
ublis
hed
popu
latio
n-ba
sed
burd
en o
f ac
ute
gast
roin
test
inal
illn
ess
(Gl)
stud
ies
1991
-2
00
6,
by
regi
on,
in c
hron
olog
ical
ord
er.
Stu
dy /
Loca
tion
D
ate
Stu
dy
des
ign
C
ase
def
init
ion
* S
amp
le
size
R
espo
nse
rate
In
cid
ence
(p
er
pers
on-
year
)
Gl R
isk
grou
ps a
nd
Key
res
ults
Eur
ope
The
19
91
Pro
spec
tive
(1)
D o
r V
plu
s tw
o or
mor
e N
ethe
rland
s co
hort
of
: N
, A,
C,
B o
r M
with
in o
ne
(21)
w
eek
(2)
sam
e as
1 b
ut o
n th
e sa
me
day
and
last
ing
at le
ast
two
days
with
in o
ne w
eek
2,25
7 36
%
0.63
(1)
0.18
(2)
• W
omen
•
Chi
ldre
n 0-
18 y
ears
I ID
- 19
93 to
P
rosp
ectiv
e A
ny D
or
V m
ore
than
onc
e in
E
ngla
nd
1996
co
hort
24
hou
rs,
inca
paci
tatin
g or
(2
7)
acco
mpa
nied
by
C o
r F
la
stin
g le
ss th
an tw
o w
eeks
9,77
6 40
%
0.19
4 •
1 in
5
peop
le in
ge
nera
l po
pula
tion
deve
lop
IID e
ach
year
S
en
sor-
19
98 to
th
e 19
99
Net
herla
nds
(22)
Pro
spec
tive
coho
rt
Thr
ee o
r m
ore
loos
e st
ools
or
vom
its in
24
hour
s or
D w
ith
two
or m
ore
of:
V, A
, C
, F,
N,
B,
M, w
ithin
24
hour
s
4,86
0 4
2%
0.
283
• C
hild
ren
0-11
yea
rs
• In
crea
sed
educ
atio
n •
Janu
ary
and
June
N
orw
ay
1999
to
Cro
ss-
Thr
ee o
r m
ore
loos
e st
ools
in
(24)
20
00
sect
iona
l 24
hou
rs o
r at
leas
t thr
ee o
f: su
rvey
(by
V
, N
, C,
F(>
38
°C)
with
in f
our
1,84
3 6
1%
1.
2 •
Wom
en
• A
dults
25-
39 y
ears
46
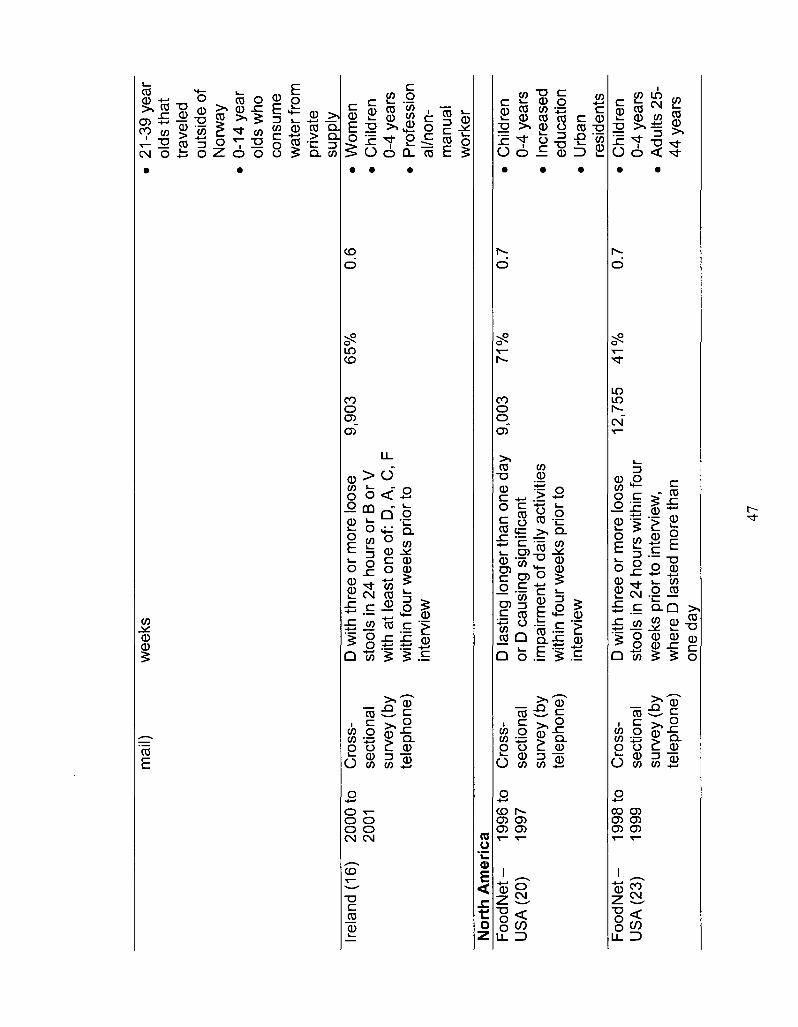
mai
l) w
eeks
Irela
nd (
16)
2000
to
2001
C
ross
-se
ctio
nal
surv
ey (
by
tele
phon
e)
D w
ith th
ree
or m
ore
loos
e st
ools
in 2
4 ho
urs
or B
or
V
with
at
leas
t one
of:
D, A
, C
, F
with
in fo
ur w
eeks
prio
r to
in
terv
iew
9,90
3 65
%
0.6
21-3
9 ye
ar
olds
tha
t tr
avel
ed
outs
ide
of
Nor
way
0-
14 y
ear
olds
who
co
nsum
e w
ater
fro
m
priv
ate
supp
ly
Wom
en
Chi
ldre
n 0-
4 ye
ars
Pro
fess
ion
al/n
on-
man
ual
wor
ker
Nor
th A
mer
ica
• C
hild
ren
0-4
year
s •
Incr
ease
d ed
ucat
ion
• U
rban
re
side
nts
• C
hild
ren
0-4
year
s •
Adu
lts 2
5-44
yea
rs
Foo
dNet
-
1996
to
Cro
ss-
D la
stin
g lo
nger
than
one
day
U
SA
(20
) 19
97
sect
iona
l or
D c
ausi
ng s
igni
fican
t su
rvey
(by
im
pairm
ent
of d
aily
act
iviti
es
tele
phon
e)
with
in fo
ur w
eeks
prio
r to
in
terv
iew
9,00
3 71
%
0.7
Fo
od
Ne
t-
1998
to
Cro
ss-
US
A (
23)
1999
se
ctio
nal
surv
ey (
by
tele
phon
e)
D w
ith th
ree
or m
ore
loos
e st
ools
in 2
4 ho
urs
with
in fo
ur
wee
ks p
rior
to i
nter
view
, w
here
D la
sted
mor
e th
an
one
day
12,7
55
41
%
0.7
47
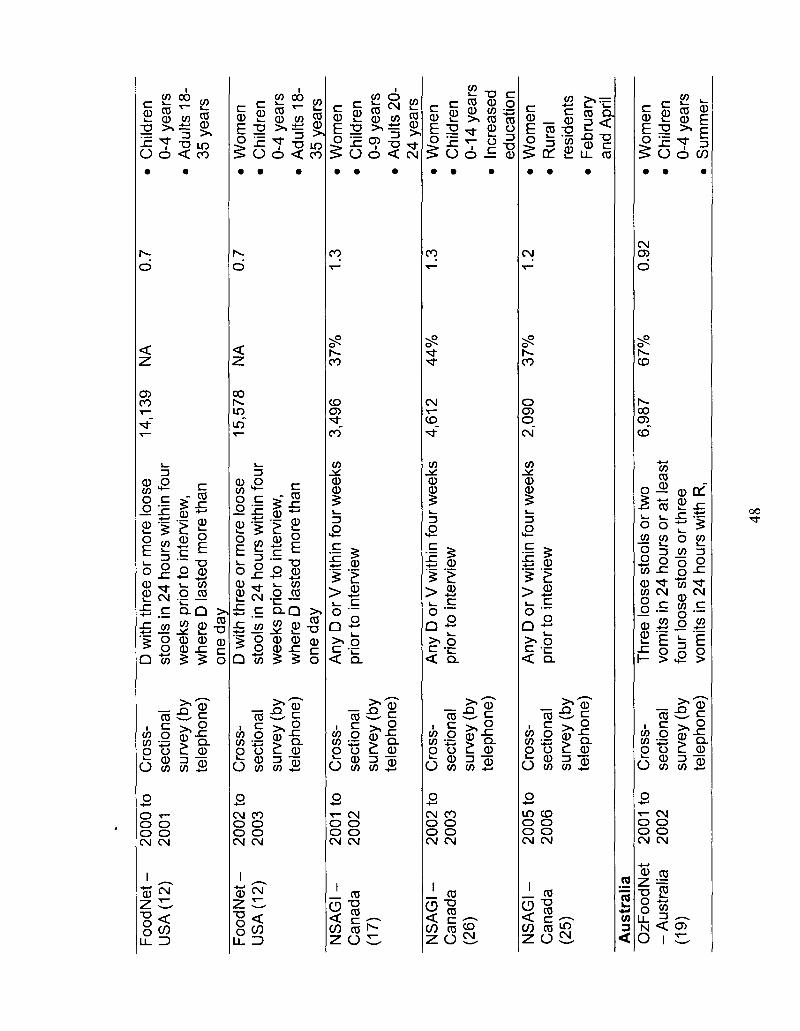
Foo
d N
et -
US
A(1
2)
Fo
od
Ne
t-U
SA
(12
)
NS
AG
I-C
anad
a (1
7)
NS
AG
I -
Can
ada
(26)
NS
AG
I -
Can
ada
(25)
2000
to
2001
2002
to
2003
2001
to
2002
2002
to
2003
2005
to
2006
Cro
ss-
sect
iona
l su
rvey
(by
te
leph
one)
Cro
ss-
sect
iona
l su
rvey
(by
te
leph
one)
Cro
ss-
sect
iona
l su
rvey
(by
te
leph
one)
Cro
ss-
sect
iona
l su
rvey
(by
te
leph
one)
Cro
ss-
sect
iona
l su
rvey
(by
te
leph
one)
D w
ith th
ree
or m
ore
loos
e st
ools
in 2
4 ho
urs
with
in f
our
wee
ks p
rior
to i
nter
view
, w
here
D la
sted
mor
e th
an
one
day
D w
ith th
ree
or m
ore
loos
e st
ools
in 2
4 ho
urs
with
in fo
ur
wee
ks p
rior
to i
nter
view
, w
here
D la
sted
mor
e th
an
one
day
Any
D o
r V
with
in fo
ur w
eeks
pr
ior
to i
nter
view
Any
D o
r V
with
in fo
ur w
eeks
pr
ior
to i
nter
view
Any
D o
r V
with
in f
our
wee
ks
prio
r to
int
ervi
ew
14,1
39
15,5
78
3,49
6
4,61
2
2,09
0
NA
NA
37%
44%
37%
0.7
0.7
1.3
1.3
1.2
Au
stra
lia
OzF
oodN
et
- A
ustr
alia
20
01 to
20
02
Cro
ss-
sect
iona
l T
hree
loos
e st
ools
or
two
vom
its in
24
hour
s or
at
leas
t 6,
987
67%
0.
92
• C
hild
ren
0-4
year
s •
Adu
lts 1
8-35
yea
rs
» W
omen
•
Chi
ldre
n 0-
4 ye
ars
• A
dults
18-
35 y
ears
»
Wom
en
• C
hild
ren
0-9
year
s »
Adu
lts 2
0-24
yea
rs
» W
omen
»
Chi
ldre
n 0-
14 y
ears
•
Incr
ease
d ed
ucat
ion
• W
omen
•
Rur
al
resi
dent
s »
Feb
ruar
y an
d A
pril
» W
omen
»
Chi
ldre
n (1
9)
surv
ey (
by
four
loos
e st
ools
or
thre
e te
leph
one)
vo
mits
in 2
4 ho
urs
with
R,
0-4
year
s S
umm
er
48
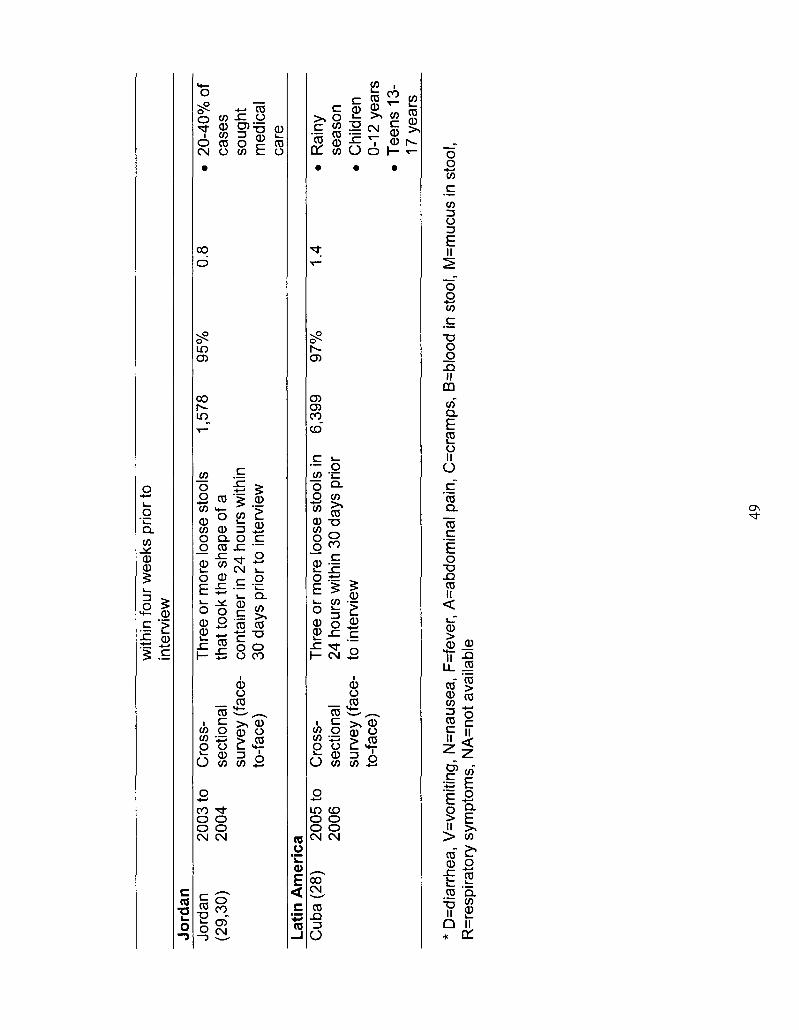
with
in fo
ur w
eeks
prio
r to
in
terv
iew
Jo
rdan
Jo
rdan
(2
9,30
) 20
03 to
20
04
Cro
ss-
sect
iona
l su
rvey
(fa
ce-
to-f
ace)
Thr
ee o
r m
ore
loos
e st
ools
th
at to
ok th
e sh
ape
of a
co
ntai
ner
in 2
4 ho
urs
with
in
30 d
ays
prio
r to
int
ervi
ew
1,57
8 95
%
0.8
• 20
-40%
of
case
s so
ught
m
edic
al
care
La
tin A
mer
ica
Cub
a (2
8)
2005
to
2006
C
ross
-se
ctio
nal
surv
ey (
face
-to
-fac
e)
Thr
ee o
r m
ore
loos
e st
ools
in
24 h
ours
with
in 3
0 da
ys p
rior
to i
nter
view
6,39
9 97
%
1.4
Rai
ny
seas
on
Chi
ldre
n 0-
12 y
ears
T
eens
13-
17 y
ears
* D
=dia
rrhe
a, V
=vo
miti
ng,
N=n
ause
a, F
=fev
er,
A=a
bdom
inal
pai
n, C
=cra
mps
, B
=blo
od in
sto
ol, M
=muc
us in
sto
ol,
R=r
espi
rato
ry s
ympt
oms,
NA
=not
ava
ilabl
e
49
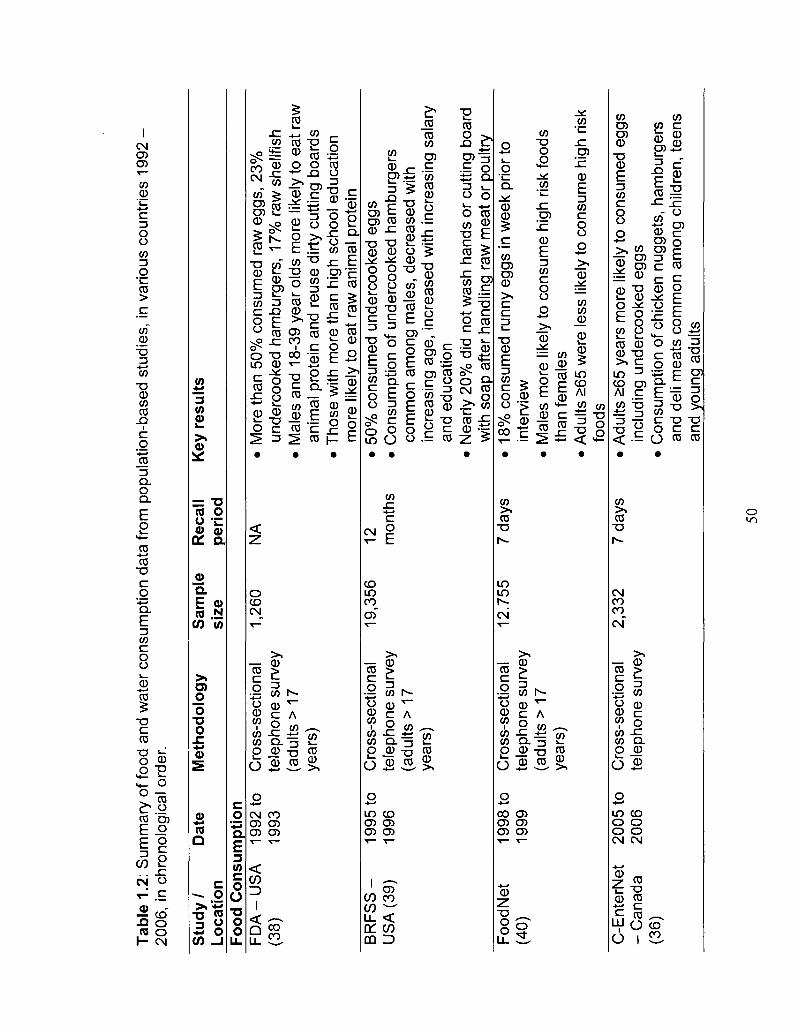
Tab
le 1
.2:
Sum
mar
y of
food
and
wat
er c
onsu
mpt
ion
data
from
pop
ulat
ion-
base
d st
udie
s, in
var
ious
cou
ntrie
s 19
92
2006
, in
chr
onol
ogic
al o
rder
.
Stu
dy
/ Lo
catio
n
Dat
e M
eth
od
olo
gy
Sam
ple
si
ze
Rec
all
peri
od
Key
res
ults
Food
Co
nsu
mp
tion
F
DA
-US
A
1992
to
Cro
ss-s
ectio
nal
(38)
19
93
tele
phon
e su
rvey
(a
dults
> 1
7 ye
ars)
1,26
0 N
A
Mor
e th
an 5
0% c
onsu
med
raw
egg
s, 2
3%
unde
rcoo
ked
ham
burg
ers,
17%
raw
she
llfis
h M
ales
and
18-
39 y
ear
olds
mor
e lik
ely
to e
at r
aw
anim
al p
rote
in a
nd r
euse
dirt
y cu
tting
boa
rds
Tho
se w
ith m
ore
than
hig
h sc
hool
edu
catio
n m
ore
likel
y to
eat
raw
ani
mal
pro
tein
B
RF
SS
- 19
95 to
C
ross
-sec
tiona
l U
SA
(39
) 19
96
tele
phon
e su
rvey
(a
dults
> 1
7 ye
ars)
19,3
56
12
mon
ths
50%
con
sum
ed u
nder
cook
ed e
ggs
Con
sum
ptio
n of
und
erco
oked
ham
burg
ers
com
mon
am
ong
mal
es, d
ecre
ased
with
in
crea
sing
age
, inc
reas
ed w
ith in
crea
sing
sal
ary
and
educ
atio
n N
early
20%
did
not
was
h ha
nds
or c
uttin
g bo
ard
with
soa
p af
ter
hand
ling
raw
mea
t or
poul
try
Foo
dNet
19
98 to
C
ross
-sec
tiona
l (4
0)
1999
te
leph
one
surv
ey
(adu
lts >
17
year
s)
12.7
55
7 da
ys
18%
con
sum
ed r
unny
egg
s in
wee
k pr
ior
to
inte
rvie
w
Mal
es m
ore
likel
y to
con
sum
e hi
gh r
isk
food
s th
an f
emal
es
Adu
lts >
65 w
ere
less
like
ly to
con
sum
e hi
gh r
isk
food
s C
-Ent
erN
et
- C
anad
a (3
6)
2005
to
Cro
ss-s
ectio
nal
2006
te
leph
one
surv
ey
2,33
2 7
days
•
Adu
lts >
65 y
ears
mor
e lik
ely
to c
onsu
med
egg
s in
clud
ing
unde
rcoo
ked
eggs
•
Con
sum
ptio
n of
chi
cken
nug
gets
, ha
mbu
rger
s an
d de
li m
eats
com
mon
am
ong
child
ren,
teen
s an
d yo
ung
adul
ts
50
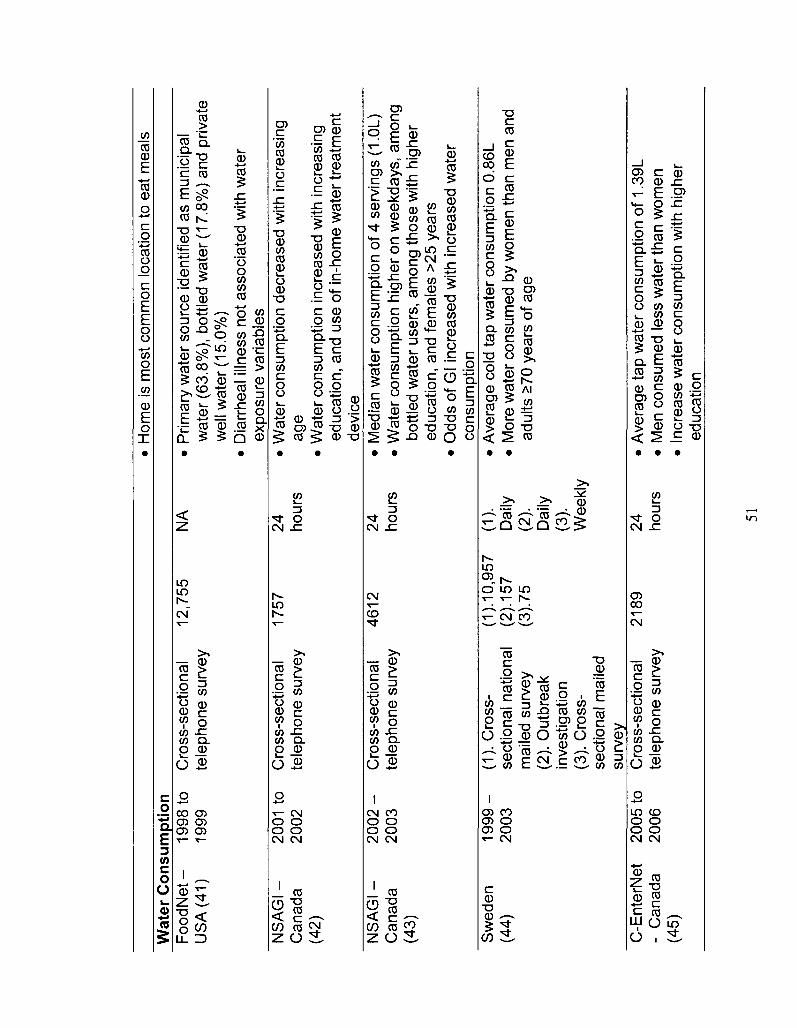
• H
ome
is m
ost
com
mon
loca
tion
to e
at m
eals
W
ater
Co
nsu
mp
tion
F
oo
dN
et-
19
98 to
C
ross
-sec
tiona
l 12
,755
U
SA
(41
) 19
99
tele
phon
e su
rvey
NS
AG
I-
2001
to
Cro
ss-s
ectio
nal
1757
C
anad
a 20
02
tele
phon
e su
rvey
(4
2)
NS
AG
I-
20
02
- C
ross
-sec
tiona
l 46
12
Can
ada
2003
te
leph
one
surv
ey
(43)
Sw
eden
1
99
9-
(1).
Cro
ss-
(1).
10,9
57
(44)
20
03
sect
iona
l na
tiona
l (2
). 1
57
mai
led
surv
ey
(3).
75
(2).
Out
brea
k in
vest
igat
ion
(3).
Cro
ss-
sect
iona
l m
aile
d su
rvey
C
-Ent
erN
et
2005
to
Cro
ss-s
ectio
nal
2189
-
Can
ada
2006
te
leph
one
surv
ey
(45)
NA
•
Prim
ary
wat
er s
ourc
e id
entif
ied
as m
unic
ipal
w
ater
(63
.8%
), b
ottle
d w
ater
(17
.8%
) an
d pr
ivat
e w
ell w
ater
(15
.0%
) •
Dia
rrhe
al il
lnes
s no
t as
soci
ated
with
wat
er
expo
sure
var
iabl
es
24
• W
ater
con
sum
ptio
n de
crea
sed
with
inc
reas
ing
hour
s ag
e •
Wat
er c
onsu
mpt
ion
incr
ease
d w
ith i
ncre
asin
g ed
ucat
ion,
and
use
of
in-h
ome
wat
er t
reat
men
t de
vice
24
•
Med
ian
wat
er c
onsu
mpt
ion
of 4
ser
ving
s (1
.0L)
ho
urs
• W
ater
con
sum
ptio
n hi
gher
on
wee
kday
s, a
mon
g bo
ttled
wat
er u
sers
, am
ong
thos
e w
ith h
ighe
r ed
ucat
ion,
and
fem
ales
>25
yea
rs
• O
dds
of G
l inc
reas
ed w
ith in
crea
sed
wat
er
cons
umpt
ion
(1).
•
Ave
rage
col
d ta
p w
ater
con
sum
ptio
n 0.
86L
Dai
ly
• M
ore
wat
er c
onsu
med
by
wom
en t
han
men
and
(2
).
adul
ts £
70 y
ears
of
age
Dai
ly
(3).
W
eekl
y
24
• A
vera
ge ta
p w
ater
con
sum
ptio
n of
1.3
9L
hour
s •
Men
con
sum
ed l
ess
wat
er th
an w
omen
•
Incr
ease
wat
er c
onsu
mpt
ion
with
hig
her
educ
atio
n
51
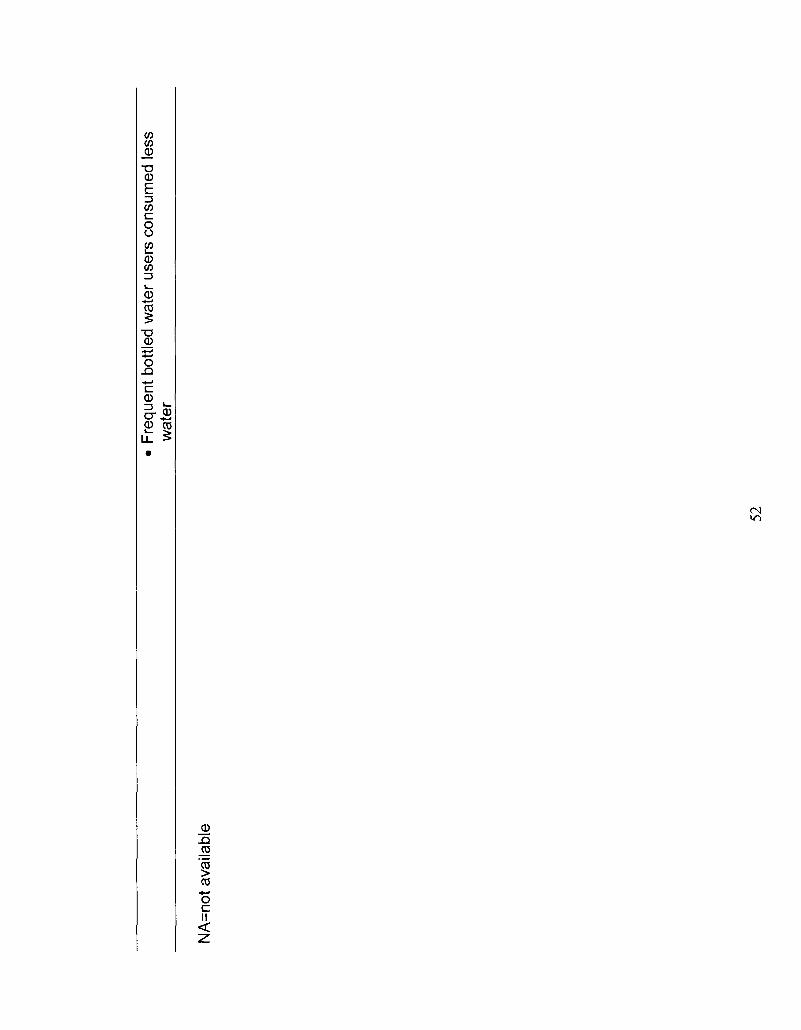
• F
requ
ent
bottl
ed w
ater
use
rs c
onsu
med
less
w
ater
NA
=not
ava
ilabl
e
52
CHAPTER TWO
Burden of acute gastrointestinal illness in Galvez, Argentina, 2007
As Published: Journal of Health, Population and Nutrition, 2010; 28(2): 149-58.
Abstract
This study evaluated the magnitude and distribution of acute gastrointestinal
illness (Gl) in Galvez, Argentina, and assessed the outcome of a 7-day versus
30-day recall period in survey methodology. A cross-sectional population survey,
with either a 7-day or a 30-day retrospective recall period, was administered
door-to-door to randomly selected residents during the 'high' and 'low' season of
Gl in the community. Comparisons were made between the annual incidence
rate obtained using the 7-day and the 30-day recall periods. Using the 30-day
recall period, the mean annual incidence rate was 0.43 (low Gl season) and 0.49
(high Gl season) episodes per person-year. Using the 7-day recall period the
mean annual incidence rate was 0.76 (low Gl season) and 2.66 (high Gl season)
episodes per person-year. This study highlights the significant burden of Gl in a
South American community, confirms the importance of seasonality when
investigating Gl in the population and presents evidence suggesting that a longer
recall period may underestimate the burden of Gl in retrospective population
surveys of Gl.
53
Introduction
Acute gastrointestinal illness (Gl) causes significant morbidity, mortality,
and socio-economic burden worldwide (1,2). Clean water, sanitation, and food
safety are key components to preventing and controlling Gl in the population (3).
These public health areas are at the forefront of international public health
organizations' objectives and priorities as well as local public health workers
concerns (4-7). Understanding the magnitude, distribution and demographic
factors associated with Gl is key for its mitigation (8). However, Gl cases tend to
be under-reported by traditional surveillance techniques which require cases to
seek medical attention in order to be captured. To address this, numerous
countries have conducted population based studies to better estimate the
disease burden (8-19). With population-level baseline information, interventions,
targeted surveillance and research activities can be accurately evaluated.
Likewise, the impacts of broader worldwide trends such as globalization, climate
change and international travel and trade, on the magnitude and distribution of
disease can be gauged. Additionally, within population based study
methodology, discussions on prospective and retrospective methods, recall
period selection and recall bias are ongoing (18,20,21). Further research to
evaluate these issues within the burden of Gl context is needed.
In September 2006, Argentina's Ministry of Health completed their first
pilot burden of Gl study in Diamante, (Entre Rios province), which estimated a
monthly Gl prevalence of 8.2% (Dr. Oswaldo Rico, Argentina Ministry of Health,
personal communication 2006). Building from the pilot, we conducted a study in
54
Galvez (Santa Fe province) in 2007. The objectives of the Galvez study were to
determine the magnitude and distribution of Gl in the population, describe the
burden and clinical presentation of Gl, evaluate under-reporting and identify risk
factors associated with Gl. An additional objective was to assess the differences
between a 7-day and a 30-day recall period.
Materials and Methods
Population baseline study
A cross-sectional, door-to-door survey of randomly selected residents of
Galvez, Santa Fe, Argentina was administered 30 April 2007 - 21 May 2007
(phase 1: high Gl season) and 1 -12 October 2007 (phase 2: low Gl season).
Galvez and the pilot location Diamante, were conveniently selected by the
Argentine Ministry of Health based on their suitability, willingness of local and
regional authorities, feasibility of completing the studies, and availability of data
based on local and regional surveillance activities. Galvez has a population of
approximately 18 500 people, is primarily an urban area surrounded by farmland
and rural areas, and is divided into 15 neighborhoods3,4. 'High' and 'low' Gl
season designation was based on the data contained in the municipal
surveillance system housed at the Centro de Desarrollo de Agroalimentario
(CeDA) Galvez, Argentina. This surveillance system collects the monthly
number of cases of Gl in the community presenting at the local hospital and
clinics.
3 2001 Census data, Institute) Nacional de Estadistica y Censos, www.indec.mecon.qov.ar 42000 Ciudad de Galvez, www.unimedio.com/galvez
55
Face-to-face interviews were conducted by trained interviewers from the
community. Households were randomly selected proportionally by neighborhood
population from a community census using Epidat 3.1 (Pan American Health
Organization, 2006). The individual in the household with the next birthday was
selected to participate in the survey as is commonly done in population surveys
to achieve a random sample (10,14-17). If the selected individual declined or no
one lived at the residence, the neighboring house, that being the next closest
house, was selected conveniently by the surveyor, as the replacement. If the
selected individual was under the age of 12, the parent or guardian answered the
survey on their behalf. If the selected individual was between the ages of 12 and
18, the parent, guardian or child answered the survey at the discretion of the
parent or guardian. All surveys were administered in Spanish.
Sample size
Sample sizes were calculated using Epilnfo 3.0 (Centers for Disease
Control and Prevention, Atlanta, Georgia, 2000) with a 2% allowable error and a
95% confidence level in a population of 18 500. In phase 1 (high Gl season), the
target sample sizes of 681 respondents (30-day recall period) and 725
respondents (7-day recall period) were based on expected monthly (8%) and
weekly (2%) prevalences estimated from a prior Diamante, Argentina pilot study.
The prevalences estimated from phase 1 were used as expected prevalences in
phase 2 (low Gl season), yielding target sample sizes of 753 respondents for
both the 30- and 7-day recall periods. The total target sample size for the study
was 2 912.
56
Data gathering
The survey instrument (Appendix I and II) was developed by modifying the
survey tools used previously in Diamante, Argentina. Modifications to the
Diamante pilot survey included revisions to some questions to improve their
clarity and utility, while additional questions pertaining to potential risk factors and
recent antibiotic use were incorporated. Respondents were asked if they had
experienced any symptoms of diarrhea in the previous 7 or 30 days, depending
on the survey recall period, where diarrhea was defined as three or more loose
stools in 24 hours. Individuals who suffered chronic diarrhea or diarrhea caused
by use of medications, laxatives, alcohol or medical conditions, were considered
non-cases. Additional questions asked about socio-demographic factors,
secondary symptoms, number of days of missed school or work and whether
hospitalization was required.
Under-reporting estimation
From the population survey, the percentage of cases that visited the local
clinics and hospital were used to estimate the magnitude of under-reporting from
the community level to the CeDA managed municipal surveillance system, using
the model shown in the burden of illness pyramid (Figure 2.1).
Ethics
The study was approved by the Human Subjects Committee of the
University of Guelph Research Ethics Board (Guelph, Ontario, Canada) in
partnership with Argentina's Ministry of Health. Signed, informed consent was
57
obtained from all participants or the parent/guardian in the event the participant
was a minor.
Statistics
Data were manually entered into Epilnfo 3.0 and managed using Microsoft
Access. Analysis was performed using SAS 9.0 (SAS Institute Inc., Cary North
Carolina, 2004). Individuals responding 'don't know' or 'unsure' were excluded
from the analysis of that question. Whether cases had used antibiotics in the 4
weeks prior to illness was compared with whether non-cases had used antibiotics
in the 4 weeks prior to interview to assess the effect of recent antibiotic use.
Univariable analysis was performed on the overall dataset (both recall
periods and study phases). The null hypothesis of no association between
presence of Gl and individual potential risk factors was tested using the Fisher's
Exact test or the Monte Carlo estimation of the Fisher's Exact test in SAS. A
weighted multivariate logistic regression model was built manually beginning
with those variables that had a Fisher's Exact test p-value <0.25 on univariable
analysis (22). Weighting was used to correct for differences in neighbourhood
sampling fractions. All remaining variables were offered to the model, however
only variables with a p-value <0.05 (Wald's test) were kept in the final model.
Differences between medians were tested using the Median test in SAS.
The primary outcome measures of monthly and weekly prevalence were
defined as the number of respondents reporting Gl in the previous 30 or 7 days,
respectively, divided by the total number of respondents for the 30 or 7 day
58
surveys. Prevalence, incidence rate and incidence proportion calculations were
also performed (Modern Epidemiology; (23)); the formulas are shown in
Appendix III.
Using the burden of illness model shown in Figure 2.1, the under-reporting
estimate was generated via stochastic modeling in @RISK student version
(Palisade Corporation, Newfield New York) as an add-on to Microsoft Excel. The
Beta form (a, b) where a= number of cases that seek medical care +1 and b=
number of cases - number of cases that seek medical care + 1, was used to
estimate underreporting between the bottom and middle step of the pyramid (per
cent of cases who seek care) (24). The per cent of cases reported to the
municipal surveillance system was assumed to be 100%, therefore the inverse of
the per cent of cases who seek care was considered to be the estimated under
reporting fraction.
To facilitate international comparisons Majowicz et al. (25) proposed a
minimum set of reported results and a standard symptom-based case definition
for Gl of three or more loose stools or any vomiting in 24 hours excluding those
(a) with cancer of the bowel, irritable bowel syndrome, Crohn's disease,
ulcerative colitis, cystic fibrosis, celiac disease, or any other chronic illness with
symptoms of diarrhea or vomiting, or (b) who report their symptoms were due to
drugs, alcohol or pregnancy. Although our study definition did not capture
'vomiting only' cases, we still report the suggested minimum set of results, using
the study definition to facilitate international study comparisons.
59
Results
Magnitude, distribution and burden
The demographic distribution of Galvez residents versus survey
respondents are shown in Table 2.1 along with the prevalence, annual incidence
rate, annual incidence proportion, and prevalence by demographic
characteristics. The overall annual incidence rate varied between 0.46 and 1.68
episodes per person year, for the 30-day and 7-day recall periods, respectively.
Statistically significant higher annual incidence proportions were seen in phase 1
(high Gl season) compared to phase 2 (low Gl season) for the 7-day recall
period.
The proportion of the study population that was female or over 19 years of
age was larger than the target population of Galvez. The median age of cases
(46.5 years) and non-cases (46.6 years) for the full dataset was not statistically
different (p-value=0.92). The response rate of 61.1% for phase 2 was calculated
by dividing the number of completed surveys by the number of households
visited. Denominator data were not available for phase 1 and thus the response
rate was not calculated.
The type and frequency of secondary symptoms are shown in Table 2.2.
Headache and muscle pain were most often reported, followed by vomiting and
fever. Bloody diarrhea was only reported by cases in phase 1 (high Gl season),
30-day recall period.
The overall number of days of missed work and school of cases and of
caretakers is shown in Table 2.3. In phase 1 (high Gl season) a greater
60
proportion of cases missed work or school, and with a higher maximum number
of days missed, compared to phase 2 (low Gl season). However, in phase 2, a
larger proportion of cases had family members miss work or school to take care
of them.
Univariable and multivariable analysis
In the overall dataset (n=2915) study phase (p<0.05), age (p<0.05),
neighbourhood of residence (p<0.05), level of education (p=0.08), occupation
(p=0.25), number of people in the household (p=0.19), ownership of a rabbit
(p=0.08), ownership of a dog (p=0.22), and ownership of a chicken (p=0.14) were
associated at the preliminary univariable level (p<0.25) with being a case of Gl.
Variables not associated were sex (p=0.46), number of bedrooms in the
household (p=0.82), use of antibiotics in the 4 weeks prior to illness (p=1.00), a
cat (p=0.26), a bird (p=0.87), a cow (p=1.00), a horse (p=1.00), a sheep (p=1.00),
a goat (p=1.00), a turtle (p=1.00), a fish (p=1.00) and ownership of any pet
(p=0.32). A final multivariable model included significant predictor variables (p-
value <0.05) of study phase, age and neighbourhood of residence (Table 2.4).
Medical system use
Medications used by cases to treat symptoms, medical facilities visited by
cases and reasons for not seeking medical care are reported in Table 2.5.
Antidiarrheals and analgesics were used most frequently, followed by antibiotics
with and without prescription. Among those cases that sought medical care,
61
private clinics and the public hospital were most frequently visited. In total, two
cases required hospitalization for their illness, for a duration of 2 days and 8 days
respectively, both during phase 1. 'Self-medication' and 'not thinking the illness
was important enough to seek medical care' were the most common reasons for
not seeking medical attention.
Under-reporting estimation
The mean, minimum and maximum percentage of cases that sought
medical care are reported in Table 2.6. Assuming that all cases that sought
medical care are reported to the surveillance system, the average number of
cases of Gl in the community for each case in the surveillance system ranged
from 2.6 (minimum=1.5, maximum=7.4) to 4.3 (minimum=1.7, maximum=90.1)
depending on the study phase and recall period.
Standard case definition comparison
Table 2.7 reports the proposed minimum set of results of this study, thus
allowing for international comparisons. Using a subset of the proposed standard
case definition, no statistically significant differences were observed between the
incidence of Gl in males and females within a given recall period nor in the
percentage of cases with symptoms on the day of interview between study
phases and recall periods.
Discussion
62
This study provides the first population-based estimates of the magnitude,
distribution, and burden of Gl in an Argentinean community. Additionally, this
study provided an opportunity to evaluate the effect of retrospective recall period
(7-day versus 30-day recall) on estimates generated from a Gl survey.
In both phases of the study, the 7-day recall period yielded higher annual
estimates of Gl than the 30-day recall period. Assuming recall bias is minimized
the shorter the retrospective observation period, this is contrary to the suggestion
that 'telescoping' past illnesses into the observation period causes overestimates
of disease in the population when using retrospective methods, as suggested by
Wheeler et al. (18). These results may be evidence of a recall bias effect in the
opposite direction, such that the true burden of disease is actually under
estimated when a longer recall period is used. This may be due to forgetting
episodes of 'familiar illnesses' such as Gl or more easily remembering illnesses
that are perceived as severe (26). Further research into the mechanisms of this
potential bias is warranted.
We found that age, study phase and neighbourhood of residence were all
significantly associated with Gl. The odds of Gl were 2.14 times higher in the
'high' season (phase 1) compared to the 'low' season (phase 2). The odds of Gl
were greatest among the young (those under the age of 20 years) and the elderly
(those over the age of 59 years) when compared to the referent group (20 - 59
years of age) which is similar to other reported studies (9,12,14,16,17,19). Three
neighbourhoods were found to have significantly lower odds of Gl compared to
the referent neighbourhood. These three neighbourhoods are located on the
63
North-west, East, and South-east borders of the referent neighbourhood. Socio-
demographic information is not available at the neighbourhood level.
Municipal surveillance data for Galvez support the seasonal trend
observed in this study; during the same timeframe, surveillance data showed a
peak of Gl prevalence in the high season (phase 1) that was approximately three
times the prevalence seen in the low season (phase 2). A seasonal effect was
also observed in a Cuban study conducted in 2005-2006, where the prevalence
of Gl was approximately 2-5 fold times greater in the rainy season compared to
the dry season (10). Likewise, in Galvez, high Gl season coincided with more
rainfall and low Gl season coincided with less rainfall5. Interestingly, the
significantly higher odds associated with the 'high' season in this study was more
pronounced for the 7-day versus the 30-day recall period. This phenomenon
warrants more investigation
Gender was not significantly associated at the univariable level with Gl in
any recall periods or study phases. However, it was striking that in phase 1 (but
not phase 2), all cases <15 years of age were male (n=8, data not shown).
Similarly, results from a Cuban study (10) indicate that when controlling for
season, sentinel site and age group, there was a higher risk for males than for
females, supporting this potential relationship. Additionally, research in England
and Wales on demographic determinants of Campylobacter infections found an
increased risk among males between birth and 17 years of age (27). The
5 2005-2008 Meteorological data, Oliveros weather station, Santa Fe, Argentina, Instituto Nacional de Tecnologia Agropecuaria, www.inta.qov.ar
64
potential higher risk of Gl of young males in the high season should be pursued
in further research into behavioural and other risk factors.
Our results indicate that there are more cases in the community than are
captured by local Gl surveillance systems, demonstrating that the true burden of
Gl is larger than typically detected by surveillance. Similar under-reporting has
been found by several other studies in developed countries (9,12,14,15,17-
19,28). We assumed that all cases that sought medical care were captured by
the municipal surveillance system but could not verify this. Any human error in
reporting of cases or misclassification of cases at the hospital or clinic level
would contribute to further under-estimation of the true burden.
The strict case definition used here was selected to be consistent with the
previous pilot study conducted in Argentina, and was specifically chosen to
reduce potential misclassifications of cases of non-infectious causes of Gl
symptoms (e.g., alcohol consumption). However, some infectious Gl cases with
vomiting as the sole symptom or less than 3 episodes of diarrhea in 24 hours
may have been excluded using this definition and if so, this would cause some
under-estimation of the true burden in the community.
Our findings are similar to those of others that have applied the proposed
symptom-based case definition (25), with the exception of the incidence
calculations for phase 1, 7-day recall period. However, our results are based on
two time periods selected to represent the 'high Gl season' and the 'low Gl
season' in the community and thus cannot be applied directly as full annual
estimates.
65
In phase 1 of the study, we observed more cases in the 7-day recall
period than in the 30-day recall period. This is surprising given that these two
survey recall periods occurred during the same calendar time period. Further
investigation of this is necessary, potentially examining multiple different recall
periods, study locations and times.
A potential limitation of this study was the retrospective methodology
used. Retrospective methods may be more subject to recall bias and thus under
ideal conditions, prospective methodology is preferred (18). This is somewhat
compensated by the advantage that we used similar methods to numerous other
retrospective studies, thereby enabling comparison with these studies.
Another limitation of this study may be selection bias, as the age and
gender distributions of study participants differed from those of the reference
community. Additionally, lack of denominator data for phase 1 prevented
calculation of the response rate. However, since the structure and management
of both study phases were identical, it is likely that there is not a large difference
between response rates of the two phases. Moreover, a response rate of 61 %
was achieved for phase 2 of the study, which is on the high-end of the range of
response rates from other published retrospective surveys (25). The door-to-
door methodology likely contributed to the relatively high response rate.
Provided that there are no differences between responders and non-responders
in terms of confounding characteristics and the risk of Gl, then non-response
should not impact our results. Additionally, to improve sample size in the
multivariable analysis, the outcome of being a case of Gl combined cases from
66
both the 7-day and the 30-day recall periods, thus interpretation of the model
odds ratios is not as straight forward.
Institutions and hospitals were not included as part of the study
population. Thus it is possible that cases of Gl that resided in these locations
were missed and may cause an under-estimation of the true burden.
This study builds on the pilot burden of Gl research conducted by the
Argentina Ministry of Health and is the first publication of this kind from
Argentina. It contributes to the growing understanding of Gl in the population
and highlights the significant burden of Gl in this Argentine community. It
presents evidence suggesting that a shorter recall period may be more valid for
retrospective population surveys of Gl. It demonstrates associations between Gl
and age, neighbourhood of residence and season. It provides the proposed
required results for international comparison using a subset of the proposed
standard case of Gl definition.
67
References
1. Guerrant RL, Kosek M, Moore S, Lorntz B, Brantley R, Lima AA. Magnitude and impact of diarrheal diseases. Arch Med Res 2002;33(4):351-5.
2. Kosek M, Bern C, Guerrant RL. The global burden of diarrhoeal disease, as estimated from studies published between 1992 and 2000. Bull World Health Organ 2003;81 (3): 197-204.
3. Kaferstein F. Foodborne diseases in developing countries: aetiology, epidemiology and strategies for prevention. Int J Environ Health Res 2003; 13 Suppl 1:S161-8.
4. Schlundt J. New directions in foodborne disease prevention. Int J Food Microbiol 2002;78(1 -2):3-17.
5. Herikstad H, Motarjemi Y, Tauxe RV. Salmonella surveillance: a global survey of public health serotyping. Epidemiol Infect 2002;129(1):1-8.
6. Guerrant RL, Kosek M, Lima AA, Lorntz B, Guyatt HL. Updating the DALYs for diarrhoeal disease. Trends Parasitol 2002; 18(5): 191 -3.
7. Flint JA, Van Duynhoven YT, Angulo FJ, DeLong SM, Braun P, Kirk M, et al. Estimating the burden of acute gastroenteritis, foodborne disease, and pathogens commonly transmitted by food: an international review. Clin Infect Dis 2005;41(5):698-704.
8. Jones TF, McMillian MB, Scallan E, Frenzen PD, Cronquist AB, Thomas S, et al. A population-based estimate of the substantial burden of diarrhoeal disease in the United States; FoodNet, 1996-2003. Epidemiol Infect 2007; 135(2):293-301.
9. de Wit MA, Koopmans MP, Kortbeek LM, Wannet WJ, Vinje J, van Leusden F, et al. Sensor, a population-based cohort study on gastroenteritis in the Netherlands: incidence and etiology. Am J Epidemiol 2001 ;154(7):666-74.
10. Aguiar Prieto P, Finley RL, Muchaal PK, Guerin MT, Isaacs S, Castro Dominguez A, et al. Burden of self-reported acute gastrointestinal illness in Cuba. J Health Popul Nutr 2009.
11. Hall GV, Kirk MD, Ashbolt R, Stafford R, Lalor K. Frequency of infectious gastrointestinal illness in Australia, 2002: regional, seasonal and demographic variation. Epidemiol Infect 2006;134(1 ):111 -8.
68
12. Imhoff B, Morse D, Shiferaw B, Hawkins M, Vugia D, Lance-Parker S, et al. Burden of self-reported acute diarrheal illness in FoodNet surveillance areas, 1998-1999. Clin Infect Dis 2004;38 Suppl 3:S219-26.
13. Kuusi M, Aavitsland P, Gondrosen B, Kapperud G. Incidence of gastroenteritis in Norway--a population-based survey. Epidemiol Infect 2003;131(1):591-7.
14. Majowicz SE, Dore K, Flint JA, Edge VL, Read S, Buffett MC, et al. Magnitude and distribution of acute, self-reported gastrointestinal illness in a Canadian community. Epidemiol Infect 2004; 132(4):607-17.
15. Scallan E, Fitzgerald M, Collins C, Crowley D, Daly L, Devine M, et al. Acute gastroenteritis in northern Ireland and the Republic of Ireland: a telephone survey. Commun Dis Public Health 2004;7(1):61-7.
16. Sargeant JM, Majowicz SE, Snelgrove J. The burden of acute gastrointestinal illness in Ontario, Canada, 2005-2006. Epidemiol Infect 2008, 136(4): 451-460.
17. Thomas MK, Majowicz SE, MacDougall L, Sockett PN, Kovacs SJ, Fyfe M, et al. Population distribution and burden of acute gastrointestinal illness in British Columbia, Canada. BMC Public Health 2006;6(307).
18. Wheeler JG, Sethi D, Cowden JM, Wall PG, Rodrigues LC, Tompkins DS, et al. Study of infectious intestinal disease in England: rates in the community, presenting to general practice, and reported to national surveillance. The Infectious Intestinal Disease Study Executive. BMJ 1999;318(7190):1046-50.
19. Herikstad H, Yang S, Van Gilder TJ, Vugia D, Hadler J, Blake P, et al. A population-based estimate of the burden of diarrhoeal illness in the United States: FoodNet, 1996-7. Epidemiol Infect 2002; 129(1 ):9-17.
20. Boland M, Sweeney MR, Scallan E, Harrington M, Staines A. Emerging advantages and drawbacks of telephone surveying in public health research in Ireland and the U.K. BMC Public Health 2006;6:208.
21. Rodrigues LC. Let us not forget telescoping as a major risk of telephone surveys. Comment on Boland et al. BMC Public Health 2006;6(208).
22. Mickey RM, Greenland S. The impact of confounder selection criteria on effect estimation. Am J Epidemiol 1989;129(1 ):125-37.
23. Rothman KJ, Greenland S. Modern Epidemiology 2nd Edition. 2nd ed. Philadelphia, Pennsylvania: Lippincott-Raven Publishers; 1998.
69
24. Vose D. Risk Analysis: A quantitative guide. 2nd ed. Chichester: John Wiley & Sons ltd.; 2000.
25. Majowicz SE, Hall G, Scallan E, Adak GK, Gauci C, Jones TF, et al. A common, symptom-based case definition for gastroenteritis. Epidemiol Infect 2008;136(7):889-94.
26. Roy SL, Scallan E, Beach MJ. The rate of acute gastrointestinal illness in developed countries. J Water Health 2006;4 Suppl 2:31-69.
27. Gillespie IA, O'Brien SJ, Penman C, Tompkins D, Cowden J, Humphrey TJ. Demographic determinants for Campylobacter infection in England and Wales: implications for future epidemiological studies. Epidemiol Infect 2008;136(12):1717-25.
28. Hall G, Kirk MD, Becker N, Gregory JE, Unicomb L, Millard G, et al. Estimating foodborne gastroenteritis, Australia. Emerg Infect Dis 2005;11(8):1257-64.
70
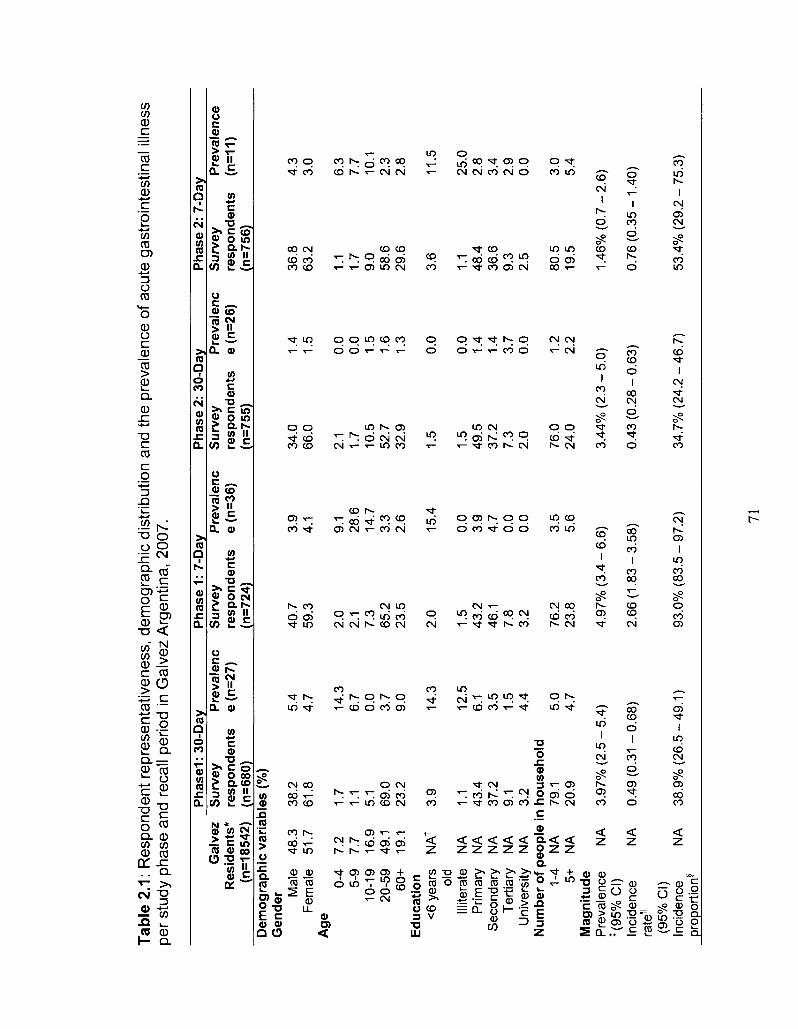
Tab
le 2
.1:
Res
pond
ent
repr
esen
tativ
enes
s, d
emog
raph
ic d
istr
ibut
ion
and
the
prev
alen
ce o
f ac
ute
gast
roin
test
inal
illn
ess
per
stud
y ph
ase
and
reca
ll pe
riod
in G
alve
z A
rgen
tina,
200
7.
Ph
asel
: 30
-Day
P
hase
1:
7-D
ay
Pha
se 2
: 30
-Day
P
hase
2:
7-D
ay
Gal
vez
Su
rvey
P
reva
len
c S
urv
ey
Pre
vale
nc
Su
rvey
P
reva
len
c S
urv
ey
Pre
vale
nce
R
esid
ents
* re
spon
dent
s e
(n=2
7)
resp
on
den
ts
e (n
=36)
re
spon
dent
s e
(n=2
6)
resp
on
den
ts
(n=1
1)
(n=1
8542
) (n
=680
) (n
=724
) (n
=755
) (n
=756
) D
emo
gra
ph
ic v
aria
ble
s (%
) G
ende
r Mal
e F
emal
e A
ge
0-4
5-9
10-1
9 20
-59
60+
E
duca
tion
<6
yea
rs
old
Illite
rate
P
rimar
y S
econ
dary
T
ertia
ry
Uni
vers
ity
48.3
51
.7
7.2
7.7
16.9
49
.1
19.1
NA
f
NA
N
A
NA
N
A
NA
38.2
61
.8
1.7
1.1
5.1
69.0
23
.2
3.9
1.1
43.4
37
.2
9.1
3.2
Num
ber
of p
eopl
e in
hou
seho
ld
1-4 5+
M
agn
itud
e P
reva
lenc
e *(
95
%C
I)
Inci
denc
e ra
te1
(95%
CI)
In
cide
nce
prop
ortio
n§
NA
N
A
NA
NA
NA
79.1
20
.9
3.97
% (
2.5
-
0.49
(0.
31 -
38.9
% (
26.5
5.4
4.7
14.3
6.
7 0.
0 3.
7 9.
0
14.3
12.5
6.
1 3.
5 1.
5 4.
4
5.0
4.7
-5.4
)
0.68
)
-49
.1)
40.7
59
.3
2.0
2.1
7.3
65.2
23
.5
2.0
1.5
43.2
46
.1
7.8
3.2
76.2
23
.8
4.97
% (
3.4
-
2.66
(1.
83 -
93.0
% (
83.5
3.9
4.1
9.1
28.6
14
.7
3.3
2.6
15.4
0.0
3.9
4.7
0.0
0.0
3.5
5.6
-6.6
)
3.58
)
-97
.2)
34.0
66
.0
2.1
1.7
10.5
52
.7
32.9
1.5
1.5
49.5
37
.2
7.3
2.0
76.0
24
.0
3.44
% (
2.3
-
0.43
(0.
28 -
34.7
% (
24.2
1.4
1.5
0.0
0.0
1.5
1.6
1.3
0.0
0.0
1.4
1.4
3.7
0.0
1.2
2.2
-5.0
)
0.63
)
-46
.7)
36.8
63
.2
1.1
1.7
9.0
58.6
29
.6
3.6
1.1
48.4
36
.6
9.3
2.5
80.5
19
.5
1.46
% (
0.7
-
0.76
(0.
35 -
53.4
% (
29.2
4.3
3.0
6.3
7.7
10.1
2.
3 2.
8
11.5
25.0
2.
8 3.
4 2.
9 0.
0
3.0
5.4
•2.6
)
1.40
)
- 75
.3)
71
(95%
CI)
* 20
01 C
ensu
s da
ta,
Inst
ituto
Nac
iona
l de
Est
adis
tica
y C
enso
s, w
ww
.inde
c.m
econ
.gov
.ar.
f N
A =
Not
ava
ilabl
e/ap
plic
able
. *
Wee
kly
or m
onth
ly p
reva
lenc
e ac
cord
ing
to 7
-day
or
30-d
ay r
ecal
l per
iod.
N
A =
Not
ava
ilabl
e/ap
plic
able
U
Ann
ual
inci
denc
e ra
te p
er p
erso
n ye
ar.
§ A
nnua
l in
cide
nce
prop
ortio
n.
72
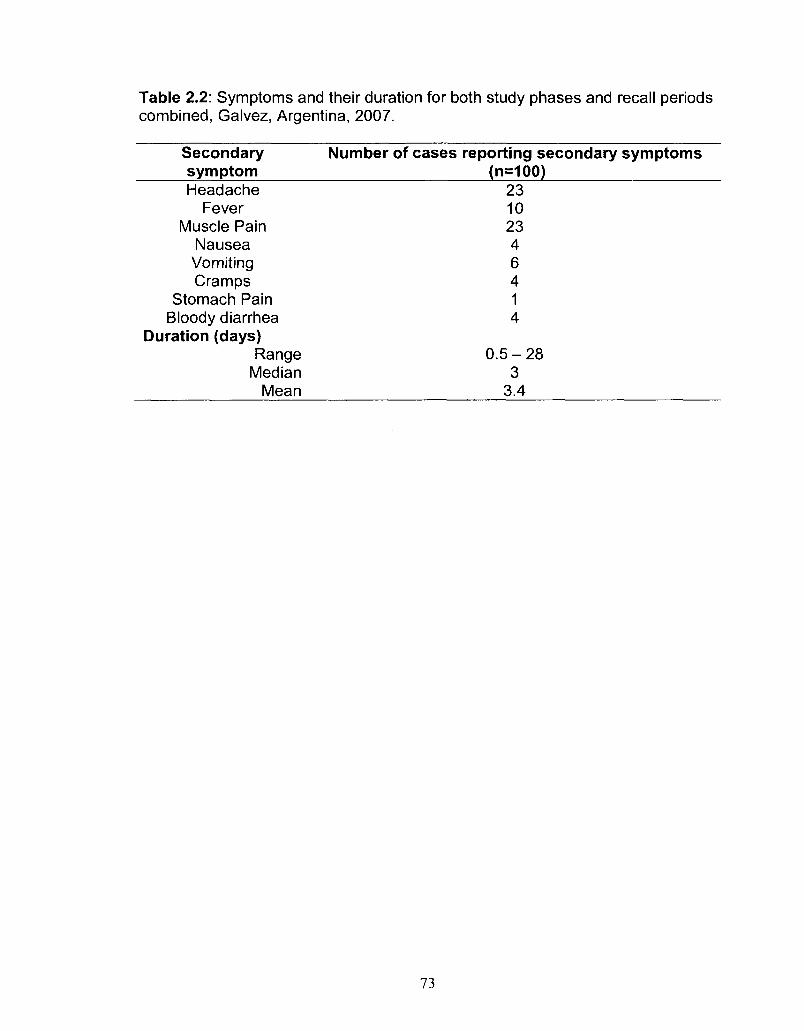
Table 2.2: Symptoms and their duration for both study phases and recall periods combined, Galvez, Argentina, 2007.
Secondary Number of cases reporting secondary symptoms symptom (n=100) Headache 23
Fever 10 Muscle Pain 23
Nausea 4 Vomiting 6 Cramps 4
Stomach Pain 1 Bloody diarrhea 4
Duration (days) Range 0.5 - 28
Median 3 Mean 3.4
73
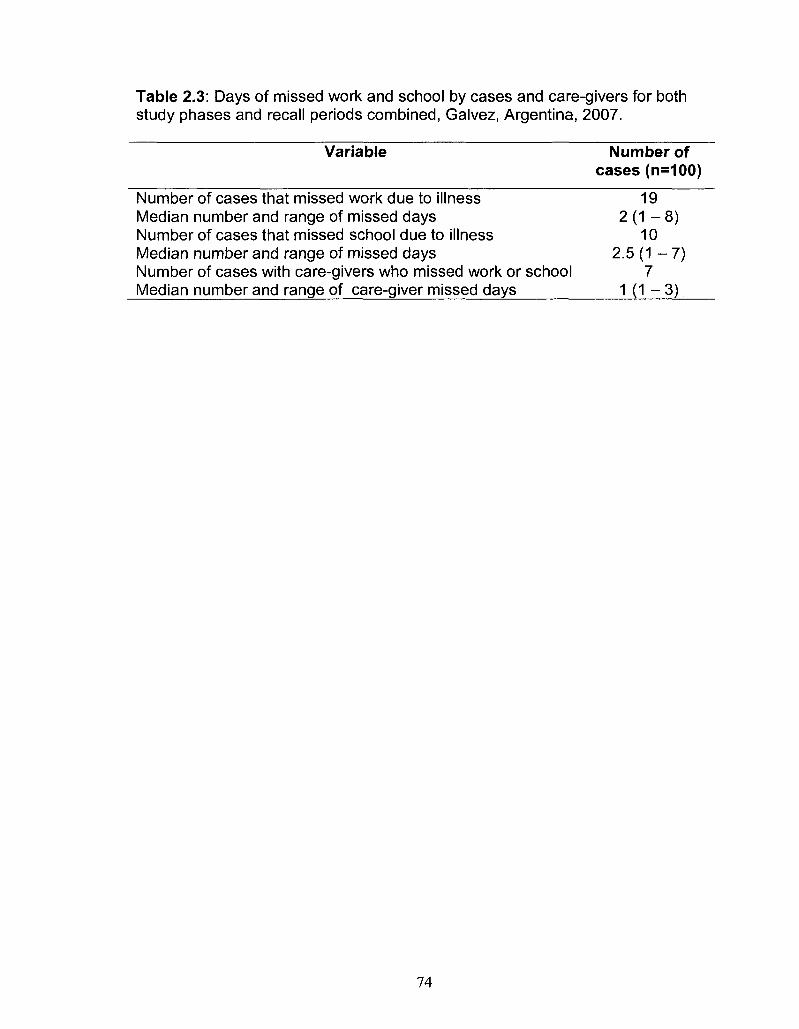
Table 2.3: Days of missed work and school by cases and care-givers for both study phases and recall periods combined, Galvez, Argentina, 2007.
Variable Number of cases (n=100)
Number of cases that missed work due to illness 19 Median number and range of missed days 2 ( 1 - 8 ) Number of cases that missed school due to illness 10 Median number and range of missed days 2.5 (1 - 7) Number of cases with care-givers who missed work or school 7 Median number and range of care-giver missed days 1(1—3)
74
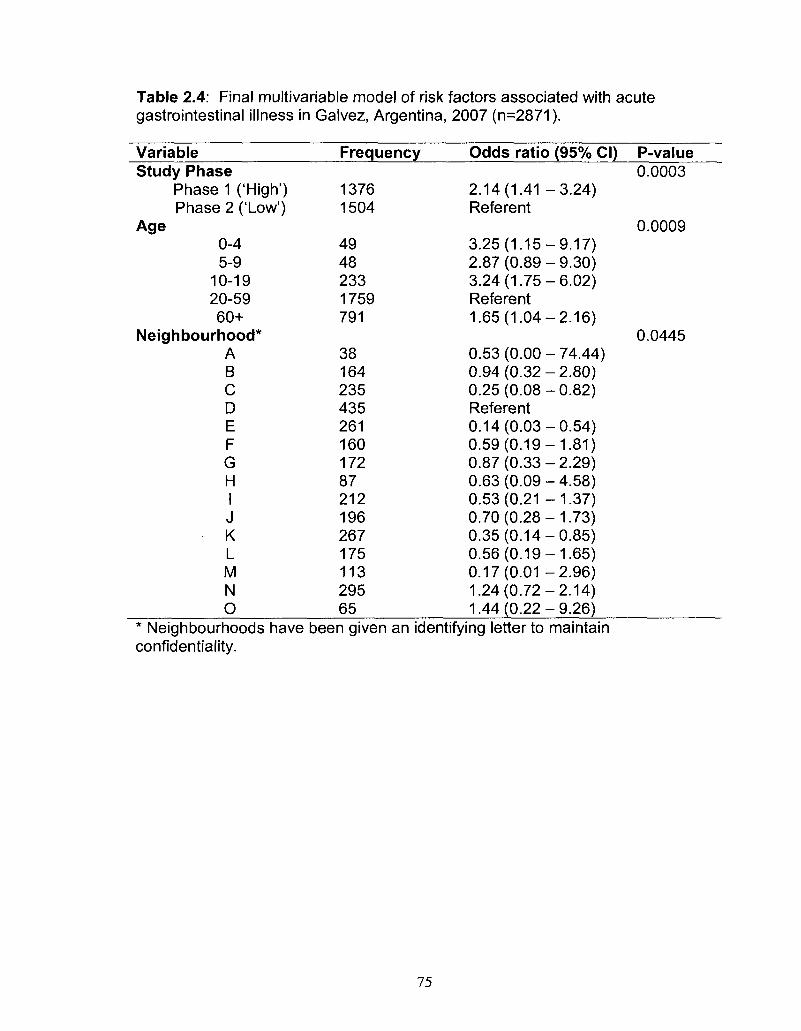
Table 2.4: Final multivariable model of risk factors associated with acute gastrointestinal illness in Galvez, Argentina, 2007 (n=2871).
Variable Study Phase
Phase 1 ('High') Phase 2 ('Low')
Age 0-4 5-9
10-19 20-59 60+
Neighbourhood* A B C D E F G H I J K L M N O
Frequency
1376 1504
49 48 233 1759 791
38 164 235 435 261 160 172 87 212 196 267 175 113 295 65
Odds ratio (95% CI)
2.14(1.41 -3.24) Referent
3.25(1.15-9.17) 2.87(0.89-9.30) 3.24(1.75-6.02) Referent 1.65(1.04-2.16)
0.53 (0.00 - 74.44) 0.94(0.32-2.80) 0.25(0.08-0.82) Referent 0.14(0.03-0.54) 0.59(0.19-1.81) 0.87(0.33-2.29) 0.63(0.09-4.58) 0.53(0.21 -1.37) 0.70(0.28-1.73) 0.35(0.14-0.85) 0.56(0.19-1.65) 0.17(0.01 -2.96) 1.24(0.72-2.14) 1.44(0.22-9.26)
P-value 0.0003
0.0009
0.0445
* Neighbourhoods have been given an identifying letter to maintain confidentiality.
75
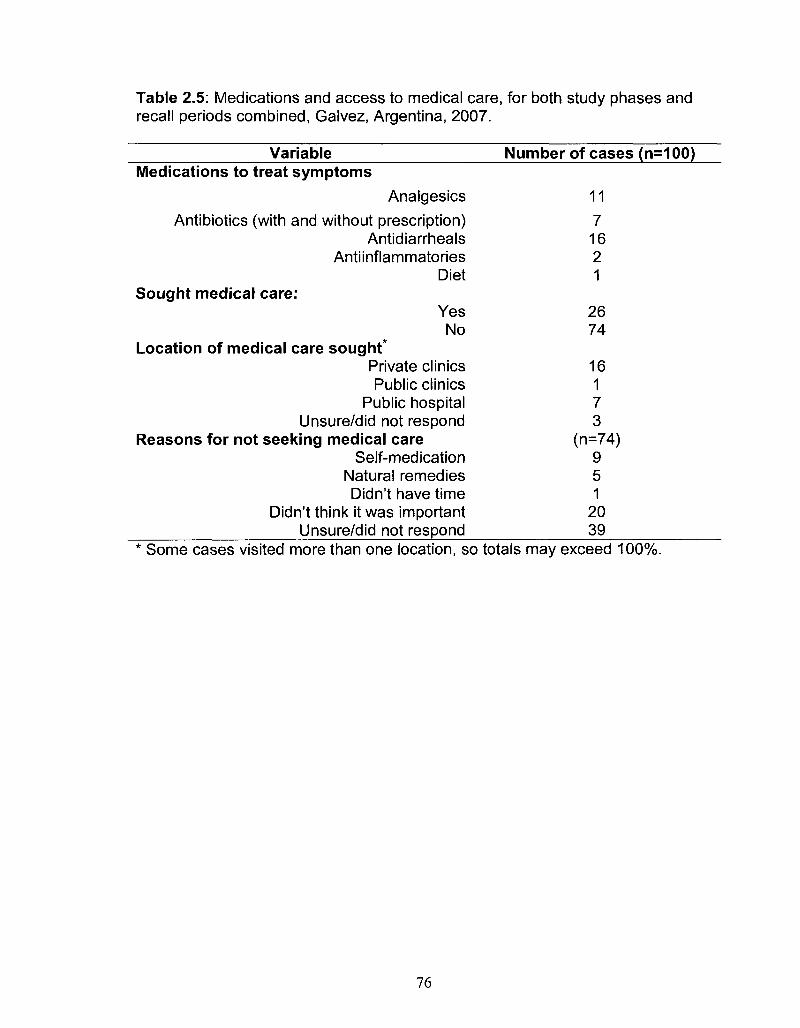
Table 2.5: Medications and access to medical care, for both study phases and recall periods combined, Galvez, Argentina, 2007.
Variable Medications to treat symptoms
Analgesics
Antibiotics (with and without prescription) Antidiarrheals
Antiinflammatories Diet
Sought medical care: Yes No
Location of medical care sought* Private clinics Public clinics
Public hospital Unsure/did not respond
Reasons for not seeking medical care Self-medication
Natural remedies Didn't have time
Didn't think it was important Unsure/did not respond
Number of cases (n=100)
11
7 16 2 1
26 74
16 1 7 3
(n=74) 9 5 1
20 39
Some cases visited more than one location, so totals may exceed 100%.
76
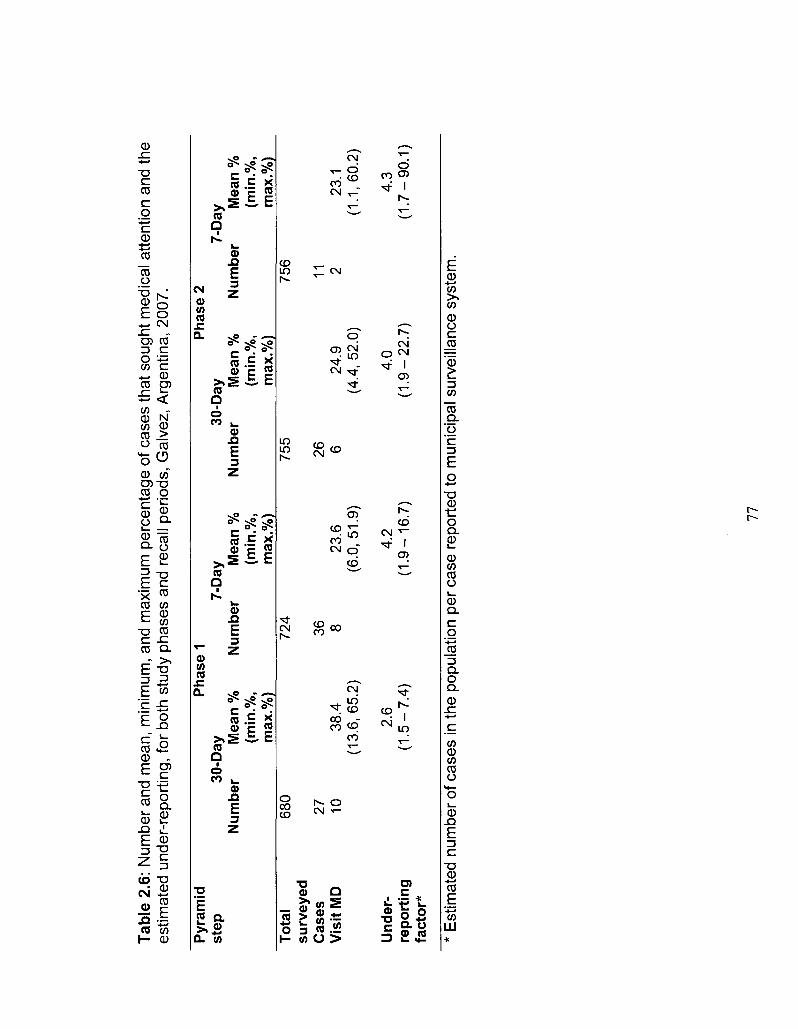
Tab
le 2
.6:
Nu
mb
er
an
d m
ea
n,
min
imu
m,
an
d m
axi
mu
m p
erc
en
tag
e of
ca
ses
tha
t so
ug
ht
me
dic
al
att
en
tion
an
d th
e e
stim
ate
d u
nd
er-
rep
ort
ing
, fo
r bo
th s
tud
y p
ha
ses
an
d re
call
pe
rio
ds,
Ga
lve
z, A
rge
nti
na
, 2
00
7.
Pyr
amid
P
hase
1
Pha
se 2
st
ep
30-D
ay
7-D
ay
30-D
ay
7-D
ay
Num
ber
Mea
n %
N
umbe
r M
ean
%
Num
ber
Mea
n %
N
umbe
r M
ean
%
(min
.%,
(min
.%,
(min
.%,
(min
.%,
max
.%)
max
.%)
max
.%)
max
.%)
To
tal
680
724
755
756
surv
eyed
C
ases
27
36
26
11
V
isit
MD
10
38
.4
8 23
.6
6 24
.9
2 23
.1
(13.
6,65
.2)
(6.0
,51.
9)
(4.4
,52.
0)
(1.1
,60.
2)
Und
er-
2.6
4.2
4.0
4.3
rep
ort
ing
(1
.5-7
.4)
(1.9
-16
.7)
(1.9
-22
.7)
(1.7
-90
.1)
fact
or*
* E
stim
ate
d n
um
be
r of
ca
ses
in t
he
po
pu
latio
n pe
r ca
se r
ep
ort
ed
to m
un
icip
al
surv
eill
an
ce s
yste
m.
77
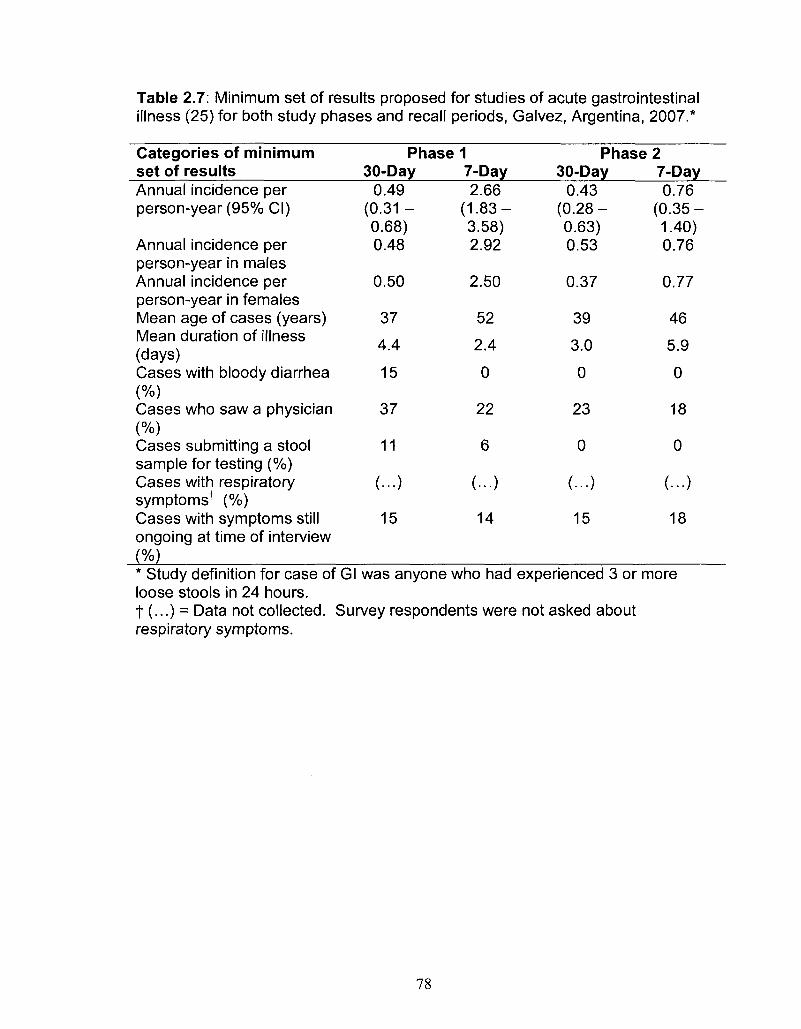
Table 2.7: Minimum set of results proposed for studies of acute gastrointestinal illness (25) for both study phases and recall periods, Galvez, Argentina, 2007.*
Categories of minimum set of results Annual incidence per person-year (95% CI)
Annual incidence per person-year in males Annual incidence per person-year in females Mean age of cases (years) Mean duration of illness (days) Cases with bloody diarrhea (%) Cases who saw a physician (%) Cases submitting a stool sample for testing (%) Cases with respiratory symptomsf (%) Cases with symptoms still ongoing at time of interview (%)
Phase 1 30-Day
0.49 (0.31 -0.68) 0.48
0.50
37
4.4
15
37
11
(...)
15
7-Day 2.66
(1.83-3.58) 2.92
2.50
52
2.4
0
22
6
(...)
14
Phase 2 30-Day
0.43 (0.28-0.63) 0.53
0.37
39
3.0
0
23
0
(...)
15
7-Day 0.76
(0.35-1.40) 0.76
0.77
46
5.9
0
18
0
(...)
18
* Study definition for case of Gl was anyone who had experienced 3 or more loose stools in 24 hours. t (...) = Data not collected. Survey respondents were not asked about respiratory symptoms.
78
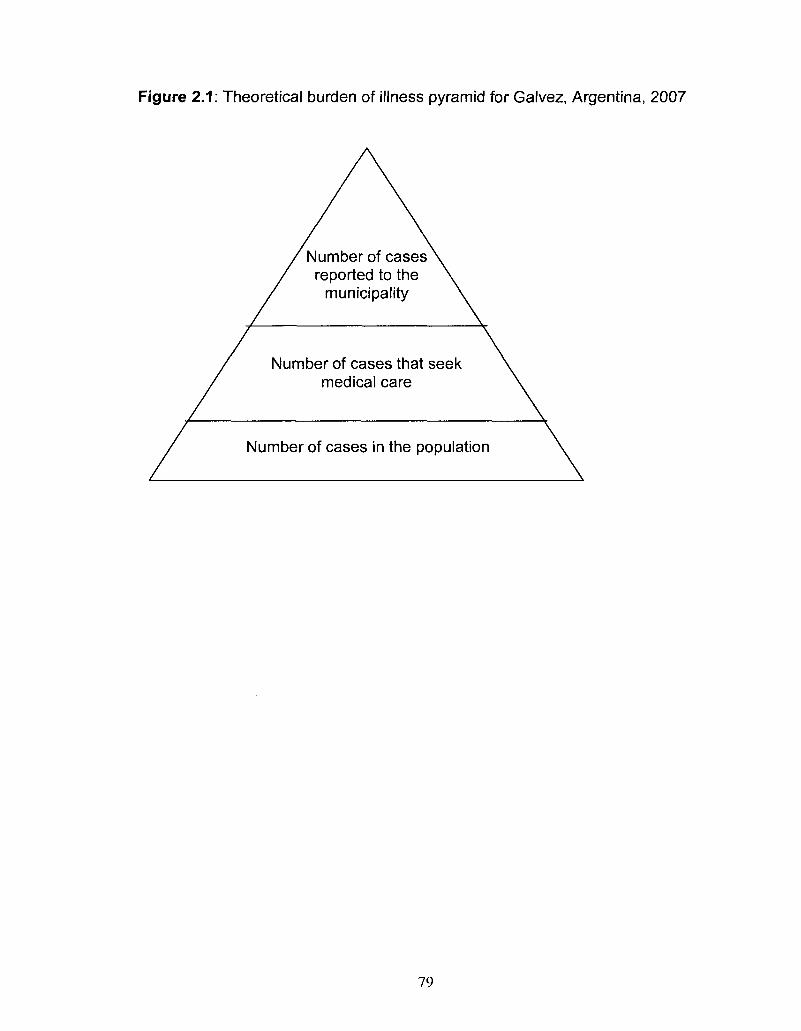
Figure 2.1: Theoretical burden of illness pyramid for Galvez, Argentina, 2007
Number of cases reported to the
municipality
Number of cases that seek medical care
Number of cases in the population
79
CHAPTER THREE
Burden of acute gastrointestinal illness in the Metropolitan region, Chile,
2008
Accepted: Epidemiology and Infection
Summary
The purpose of this study was to determine the magnitude and distribution
of acute gastrointestinal illness (Gl) in the population, describe its burden and
presentation, identify risk factors associated with Gl and assess the differences
between a 7-day, 15-day and a 30-day recall period in the population-based
burden of illness study design. Face-to-face surveys were conducted on 6047
randomly selected residents in the Metropolitan region, Chile, with an average
response rate of 75.8%. The age-adjusted monthly prevalence of Gl was 9.2%.
The 7-day recall period provided annual incidence rate estimates approximately
2.2 times those of the 30-day recall period. Age, occupation, health care system,
sewer system, antibiotic use and cat ownership were all found to be significant
predictors for being a case of Gl. This study expands on the discussion of recall
bias in retrospective population studies and reports the first Chilean population-
based estimates of the burden and distribution of Gl.
Introduction
80
The World Health Organization (WHO) ranks diarrhoeal diseases fifth
among the world's top causes of mortality, responsible for 2.2 million deaths
worldwide [1]. In low-income countries, diarrhoeal diseases rank third, illustrating
the large burden of acute gastrointestinal illnesses (Gl) on the global population,
particularly in developing countries. Clean water, sanitation and food safety are
key components to preventing and controlling Gl in the population [2]. These
public health areas remain priorities for international public health organizations
and public health workers [3-6]. Accurately determining the burden of Gl is
important for its mitigation [7]. However, Gl cases tend to be under-reported by
traditional surveillance techniques, which require cases to seek medical attention
in order to be captured. To address this, numerous countries have conducted
population-based studies to better estimate the disease burden [7-18]. With
population-level baseline information, interventions, targeted surveillance and
research activities can be implemented and evaluated. However, there are still
unresolved issues in population-based burden of illness study methodology,
including recall period selection and recall bias [17, 19, 20].
In 2008, a partnership of the Pan-American Health Organization, the
Public Health Agency of Canada, the University of Guelph and the Ministry of
Health in Chile completed the first population burden of Gl study in the
Metropolitan region of Chile. The objectives of this study were to determine the
magnitude and distribution of Gl in the population, describe the burden and
clinical presentation of Gl and identify risk factors associated with Gl. An
81

additional objective was to assess the differences between a 7-day, 15-day and a
30-day recall period in the population-based burden of illness study design.
Methods
Population baseline study
A cross-sectional, door-to-door survey of randomly selected residents of
the Metropolitan region of Chile was administered July 21 - August 25, 2008
(phase 1: low Gl season) and November 14 - December 21, 2008 (phase 2: high
Gl season). The Metropolitan region of Chile was selected as it is a diverse
region consisting of 6061185 residents which account for 40.1 % of the total
population of Chile. 'High' and 'low' Gl season designation was based on data
from the Ministry of Health surveillance system on reported cases of Gl and
outbreaks related to food and water.
The Metropolitan region is divided into 52 neighbourhoods which are
further divided into districts, zones and blocks. Neighbourhoods are classified by
the Instituto Nacional de Estadisticas6 into 5 categories according to socio
economic level. The number of surveys administered per socio-economic
category, was determined proportional to population size per category. Three
neighbourhoods were excluded from the sample due to concerns for surveyor
safety. Blocks were randomly selected proportional to the number of households
in each block. SAS 9.1 (SAS Institute Inc., Cary, North Carolina, 2004) was used
to conduct the proportional random selection. A convenience sample of
6 Instituto Nacional de Estadisticas, www.ine.cl 2009.
82
households was generated from within the randomly selected block at the
discretion of the surveyor in the field.
Face-to-face interviews were conducted by trained surveyors from the
region. The individual in the household with the next birthday was selected to
participate in the survey. If the selected individual declined or no one lived at the
residence, the neighboring house was selected as the replacement. If the
selected individual was under the age of 12, the parent or guardian answered the
survey on their behalf. If the selected individual was between the ages of 12 and
18, the parent, guardian or child answered the survey at the discretion of the
parent or guardian. All surveys were administered in Spanish.
Sample size
Sample sizes were calculated using Epilnfo 3.4.1 (Centers for Disease
Control and Prevention, Atlanta, Georgia, 2007). Using an expected monthly
prevalence of 8%, a 1% allowable error and a 95% confidence interval, a target
sample size of 2826 was calculated, which was rounded to 3000 surveys per
phase for an overall total sample size of 6000 surveys.
Data gathering
The survey tool (Appendix IV) was developed by modifying the survey
tools used previously in Argentina (Appendix I and II, Chapter 2, [21]) and using
other similar cross-sectional population burden of Gl studies as models [7, 9,11,
13-16]. Respondents were asked if they had experienced any symptoms of
diarrhoea or vomiting in the previous 7, 15 and 30 days, where diarrhoea was
defined as three or more loose stools in 24 hours. Individuals who suffered
83
chronic diarrhoea or diarrhoea caused by use of medications, laxatives, alcohol
or medical conditions, were considered non-cases. Additional questions asked
about socio-demographic factors, secondary symptoms, number of days of
missed school or work, whether hospitalization was required and potential risk
factors.
Ethics
The study was approved by the Human Subjects Committee of the
University of Guelph Research Ethics Board (Guelph, Ontario, Canada) and by
the Servicio de Salud Metropolitano Oriente scientific ethics committee of the
Government of Chile. Signed, informed consent was obtained from all
participants or the parent/guardian in the event the participant was a minor.
Statistics
Data were manually entered into Epilnfo 3.4.1 and managed using
Microsoft Access. Analysis was performed using SAS 9.1. Individuals
responding 'don't know' or 'unsure' were excluded from the analysis of that
question. Whether cases had used antibiotics in the four weeks prior to illness
was compared with whether non-cases had used antibiotics in the four weeks
prior to interview to assess impact of recent antibiotic use.
The primary outcome measures of weekly, 15-day and monthly
prevalence were defined as the number of respondents reporting Gl in the
previous 7, 15 or 30 days, respectively, divided by the total number of
respondents. Prevalence, incidence rate and incidence proportion calculations
84
(Modern Epidemiology; [22]) were performed for all three recall periods; the
formulas are shown in Appendix III.
Analysis was performed on the total dataset using monthly cases as the
outcome. The null hypothesis of no association between presence of Gl and
individual potential risk factors was tested using the Fisher's Exact test or the
Monte Carlo estimation of the Fisher's Exact test in SAS. A multivariate logistic
regression model was built manually using backwards elimination. Only
variables with a p-value <0.05 (Wald's test) were kept in the final model. All
variables that were initially screened out of the final model were re-introduced to
test for significance and visually assess confounding. Confounding was
determined by looking for a change of 30% or more in model coefficients. All
possible interactions between variables in the final model were assessed at a p-
value <0.05 (Wald's test). The Hosmer-Lemeshow test in SAS was used to
assess goodness of fit of the model, where a significant p-value (p-value <0.05)
indicates poor fit of the model. Differences between medians were tested using
the Median test in SAS.
Recently Majowicz et al. [23] proposed a standard symptom-based case
definition for Gl of three or more loose stools or any vomiting in 24 hours
excluding those (a) with cancer of the bowel, irritable bowel syndrome, Crohn's
disease, ulcerative colitis, cystic fibrosis, celiac disease, or any other chronic
illness with symptoms of diarrhoea or vomiting, or (b) who report their symptoms
were due to drugs, alcohol or pregnancy. We calculated the minimum set of
results, and report them here to facilitate future international comparisons.
85
Recall period comparison
There is no proper, accepted statistical test available to compare annual
estimates generated from different recall periods as we did here. Thus, we used
two approaches: A. compare 95% confidence intervals of the annual incidence
rate and proportion estimates generated from the three different recall periods, 7-
day, 15-day, and 30-day; and B., a simple binomial test as described below. To
compare thel 5-day and 30-day recall periods to the 7-day recall period, the
observed number of Gl cases of a recall period was tested by conducting a
simple binomial test using as the expected probability the prevalence of the 7-
day recall (fixed). P-values for the tests were computed by using the PROBBNML
function of SAS 9.1 (p-value < 0.05 indicates a significant result). The expected
probability of a case for the 15-day and 30-day recall periods was calculated
using the formula shown in Appendix V, assuming that the probability of being a
Gl case in the 15-day and 30-day recall was 2.14 and 4.29 times greater than the
probability in the 7-day recall respectively. By fixing the 7-day results as the
referent, we are ignoring the fact that the observed number of cases is a random
variable (even holding the number of surveys fixed) and that there is dependence
between the 7-day result and each of the 15-day and 30-day results.
Results
Burden and case description
In total, 6047 surveys were completed, 3033 in phase 1 and 3014 in
phase 2, with an overall average response rate of 75.8%. The demographic
86
distribution of residents of the Metropolitan region, along with survey respondents
and monthly cases is illustrated in Table 3.1. In general, survey respondents
were older, more educated and more likely to be female than residents. Overall,
cases were significantly younger than non-cases, with median ages of 33 and 39
respectively (p<0.001).
Of the 6047 respondents, in total 467 (7.7%; 7.1 - 8.4), 384 (6.4%; 5.8 -
7.0) and 262 (4.3%; 3.8 - 4.9) had symptoms of vomiting or diarrhoea in the 30,
15 and 7 days prior to interview, respectively (Table 3.2). The overall age-
adjusted monthly prevalence was 9.2%.
Symptoms and severity
The majority of monthly cases suffered symptoms of 'only vomiting'
followed by those with 'only diarrhoea' in phase 1 and overall; the reverse was
seen in phase 2, with the number of cases experiencing 'only diarrhoea' being
greater than the number of cases with 'only vomiting' (Table 3.2). Symptoms of
'both diarrhoea and vomiting' was highest in cases 0-4 years of age, while
symptoms of 'only diarrhoea' and 'only vomiting' peaked in cases 10-19 years of
age (Figure 3.1).
Of the 467 monthly cases, 110 (23.6%) had more than one episode of
diarrhoea and 78 (14.3%) had more than one episode of vomiting in the 30 days
prior to interview. Of the 292 cases that experienced diarrhoea, 11 (3.8%) had
blood in their diarrhoea. On the day of interview, 43 cases had diarrhoea and 20
cases had vomiting.
87
The most commonly experienced secondary symptoms were headache,
nausea and muscle pain (Table 3.3). As a result of their illness, 74 and 46 cases
missed work or school, respectively, and 25 cases required someone else to
miss work or school in order to provide care. Overall the median duration of
diarrhoea and vomiting were 2 days and 1 day, respectively. Cases reported the
maximum number of diarrhoeal events to be an average of 4.4 loose stools
(range 3 - 20) and a maximum number of vomiting events to be an average of
3.0 (range 1-20) in a 24 hour period.
Medical system use
Medications used by cases to treat symptoms, medical facilities visited by
cases and reasons for not seeking medical care are reported in Table 3.4.
Liquids, antidarrheals and analgesics were the top choices for medications used
by cases. Among those cases that sought medical care (n=99), public clinics,
private clinics and public hospitals were the most frequently visited. Only one
case required hospitalization for their illness, for a total of 24 hours. In total, 11
(11%) cases were asked to submit a sample of which 9 (82%) complied. Of the
nine samples submitted only two cases knew that their test results were negative
and the rest did not know the result. 'Self-medicating' and 'not thinking the
illness important' were the most common reasons for not seeking medical care.
Univariable and multivariable analysis
From univariable analysis of the full dataset (n=6047) age, socio-economic
level, occupation, education, ownership of a cat, ownership of a cow, ownership
of any pet, health system plan, sewer system and use of antibiotics in the four
88
weeks prior to illness/interview were all significantly associated with being a
monthly case of Gl p<0.05 (Table 3.5). A final multivariable model included
significant (p<0.05) predictor variables of age, health system, occupation, sewer
system, antibiotic use, and ownership of a cat (Table 3.6). Interaction between
'antibiotic use' and 'ownership of a cat', though significant in the final model, was
excluded due to low frequency of respondents included by this interaction. The
Hosmer-Lemeshow goodness of fit test p-value was 0.86 indicating the model fit
the data well.
Standard case definition comparison
A summary of this study's results using the suggested symptom-based
case definition are outlined in Table 3.7.
Recall period comparison
Significant differences in annual incidence rate and annual incidence
proportion estimates occurred between the 7-day, 15-day and 30-day recall
periods, within each study phase and within the combined overall estimates
(Appendix V). The annual incidence rate estimate from the 7-day recall was
approximately 2.2 times greater than the annual incidence rate estimate from the
30-day recall, for both study phases and overall (Table 3.2).
Discussion
This study provides population based estimates of Gl for the Metropolitan
region of Chile, illustrating that the incidence of Gl is comparable to international
estimates. An advantage of this study was using face-to-face methodology to
89
administer surveys, and a high average response rate of 75.8% was achieved
compared to other telephone administered surveys [12-16]. Another unique
contribution of this study, we evaluated the impact of a 7-day, 15-day and 30-day
recall period on estimates of the magnitude of Gl from a survey.
Overall the age-adjusted monthly prevalence of 9.2% is similar to
prevalences from studies in Canada and Cuba [7, 9, 13, 15, 16], and somewhat
higher than prevalences from studies in the United States, Australia and
Argentina (Chapter 2, [7, 10, 21]). The overall range of annual incidence rates
reported here of 0.98 - 2.3 episodes per person-year are higher than those
reported in Ireland, the United Kingdom and the Netherlands [14, 17, 24]. In part,
variations in case definition may explain differences in the magnitude of Gl
reported here compared with other studies.
A standard case definition has been proposed [23] to assist with
international comparisons and reports estimates from five countries: Australia,
Canada, Ireland, Malta and the United States. The incidence per person-year
overall, incidence per person-year in females and the percentage of cases that
sought medical care reported here are similar to those reported in Australia and
Canada. The mean age of cases, 36 years, is equivalent to that of Canada,
which is the highest of all the countries. Mean duration of illness, and
percentage of cases with respiratory symptoms reported here is lower than other
countries, additionally, percentage of cases submitting a stool sample reported
here is second lowest compared to the other countries. Percentage of cases
with symptoms at time of interview (12.85%) is similar to Canada and in the
90
middle of the range reported by other countries (8.22% -18.20%). Similarly, the
percentage of cases with bloody diarrhoea (2.36%) is in the middle of the range
reported by other countries (0.87% - 5.10%). The annual incidence per person-
year in males of 0.95 reported here was higher than all other rates reported
(range 0.31 -0.87).
The symptoms, severity and duration of illness were similar to other
studies, [7, 9, 11, 13-16, 18] though median duration and percentage of cases
with bloody diarrhoea were at the lower end of the spectrum of reported results.
Similarly, percentages of cases that sought medical care, had a stool sample
requested and that submitted a stool sample are at the low end of the range of
percentages reported from other studies [7, 11, 14-16, 18]. However, we had a
higher response rate, therefore it may not be a true difference or may be a bias in
other surveys where response rates are low. The lower percentage of individuals
seeking care means fewer cases would be captured in a surveillance system,
resulting in a larger under-estimation of the true burden of illness.
From multivariable modeling, age, health system, occupation, sewer
system, antibiotic use in the four weeks prior to illness/interview, and ownership
of a cat were significant risk factors to being a case of Gl. Children 0-4 years of
age and 10-19 years of age were 2.98 and 1.55 times more likely, respectively,
to be cases compared to the referent group of 20-59 year olds, which is similar to
other reported studies where children and youths had higher odds of being a
case of Gl [7-9, 13-16].
91
Residents who belonged to private-system health care had significantly
lower odds (OR=0.68) of being a case when compared to those belonging to the
public system, whereas those who did not belong to any health system had 1.54
times the odds of being a case compared to those belonging to the public health
system. This result is similar to studies in the United States, where those without
medical insurance reported higher rates of Gl than those with insurance and
where rural residents had an increased rate of Gl compared to urban residents
[7]. Likewise, those using a septic tank or outdoor latrine in place of the
municipal sewer system had 4.18 times the odds of being a case of Gl. Though
socio-economic level was not significant in the final model, these results may in
part reflect differences in socio-economic status; however, this needs to be
explored further.
Those who did not take antibiotics in the four weeks prior to illness or
interview had 1.64 times the odds of being a case as those that took antibiotics.
This result does not support the theory that antibiotic-associated diarrhoea is a
common side-effect of antibiotic use [25]. However, the occurrence of antibiotic-
associated diarrhoea is dependent on host factors as well as the type of antibiotic
and method in which it is taken which may in part explain the contrasting result
found here [26-28]. Information on type of antibiotic and method of
administration was not collected in this survey. Additionally, this information was
self-reported and not verified with medical records or prescriptions.
Of the other non-socio-demographic risk factors, only ownership of a cat
was significant, resulting in a 1.36 times higher odds of being a case of Gl. Cats
92
are known to carry a number of pathogens including Toxocara, Ancylostoma sp.,
Uncinaria, Dipylidium, Spirometra, Giardia, Toxoplasma, Cryptosporidium spp.
Campylobacter spp., Salmonella spp., and rabies [29, 30] which can be
transmitted to humans. In particular, contact with cats has been documented to
be associated with being a case of campylobacteriosis [31], and recent work has
looked at pet cats as a potential risk factor for enteric infection in the home [32,
33].
Though 'phase' was not significantly associated with being a case of Gl, it
is of interest that 'vomiting only' was more frequent among cases in phase 1, July
and August ('winter'), whereas 'diarrhoea only' was more frequent among cases
in phase 2, November and December ('summer'). This may indicate a seasonal
difference in Gl pathogens, where viral infections are associated with winter [34]
and bacterial and parasitic infections are associated with summer [35].
The shorter 7-day recall period yielded significantly greater annual
estimates compared to the 15-day and 30-day recall periods. This result is
similar to that reported for our population survey of an Argentine community
where the 7-day recall period yielded 1.7- 5.4 times the annual incidence rate
compared to the longer 30-day recall period (Chapter 2, [21]). However, this is
contrary to the suggestion that 'telescoping' past illnesses into the observation
period causes overestimation of disease in the population when using
retrospective methods, as suggested by Wheeler et al. [17]. These results
suggest an opposite effect of recall bias, such that the true burden of disease is
under-estimated when a longer recall period is used. Further investigation and
93
international comparisons are needed to explore the impact of different recall
periods.
The retrospective methodology of our study was a potential limitation.
Retrospective studies are more subject to recall bias and prospective
methodology is preferred [17]. The exploration of shorter recall periods was an
attempt to evaluate the impact of recall bias in our study and population-based
burden of illness studies in general. Methods similar to those used in previous
retrospective burden of illness studies were used, enabling comparison among
studies.
Selection bias due to differences in age and gender of respondents and
the referent community is another possible limitation of the study. Additionally,
institutions and hospitals were not included as part of the study population; it is
therefore possible that cases of Gl that resided in these locations were missed
and may cause an under-estimation of the true burden.
This study expands on the discussion of recall bias in retrospective
population burden of illness studies. It reports the first Chilean population-based
burden of Gl, the distribution of Gl estimates relative to various demographic
characteristics and is one of only a handful of these types of studies to have
been conducted in a developing country.
94
References
1. World Health Organization. The global burden of disease: 2004 update. 2008.
2. Kaferstein F. Foodborne diseases in developing countries: aetiology, epidemiology and strategies for prevention. Int J Environ Health Res 2003; 13 Suppl 1:S161-8.
3. Schlundt J. New directions in foodborne disease prevention. Int J Food Microbiol 2002; 78:3-17.
4. Herikstad H, Motarjemi Y, Tauxe RV. Salmonella surveillance: a global survey of public health serotyping. Epidemiol Infect 2002; 129: 1-8.
5. Guerrant RL, et al. Updating the DALYs for diarrhoeal disease. Trends Parasitol 2002; 18: 191-193.
6. Flint JA, et al. Estimating the burden of acute gastroenteritis, foodborne disease, and pathogens commonly transmitted by food: an international review. Clin Infect Dis 2005; 41: 698-704.
7. Jones TF, etal. A population-based estimate of the substantial burden of diarrhoeal disease in the United States; FoodNet, 1996-2003. Epidemiol Infect 2007; 135:293-301.
8. de Wit MA, et al. Sensor, a population-based cohort study on gastroenteritis in the Netherlands: incidence and etiology. Am J Epidemiol 2001; 154: 666-674.
9. Aguiar Prieto P, et al. Burden of self-reported acute gastrointestinal illness in Cuba. J Health Popul Nutr 2009.
10. Hall GV, et al. Frequency of infectious gastrointestinal illness in Australia, 2002: regional, seasonal and demographic variation. Epidemiol Infect 2006; 134: 111-118.
11. Imhoff B, et al. Burden of self-reported acute diarrheal illness in FoodNet surveillance areas, 1998-1999. Clin Infect Dis 2004; 38 Suppl 3: S219-26.
12. Kuusi M, etal. Incidence of gastroenteritis in Norway--a population-based survey. Epidemiol Infect 2003; 131: 591-597.
13. Majowicz SE, etal. Magnitude and distribution of acute, self-reported gastrointestinal illness in a Canadian community. Epidemiol Infect 2004; 132: 607-617.
95
14. Scallan E, etal. Acute gastroenteritis in northern Ireland and the Republic of Ireland: a telephone survey. Commun Dis Public Health 2004; 7: 61-67.
15. Sargeant JM, Majowicz SE, Snelgrove J. The burden of acute gastrointestinal illness in Ontario, Canada, 2005-2006. Epidemiol Infect 2008, 136(4): 451-460.
16. Thomas MK, etal. Population distribution and burden of acute gastrointestinal illness in British Columbia, Canada. BMC Public Health 2006; 6.
17. Wheeler JG, etal. Study of infectious intestinal disease in England: rates in the community, presenting to general practice, and reported to national surveillance. The Infectious Intestinal Disease Study Executive. BMJ 1999; 318: 1046-1050.
18. Herikstad H, etal. A population-based estimate of the burden of diarrhoeal illness in the United States: FoodNet, 1996-7. Epidemiol Infect 2002; 129: 9-17.
19. Boland M, etal. Emerging advantages and drawbacks of telephone surveying in public health research in Ireland and the U.K. BMC Public Health 2006; 6: 208.
20. Rodrigues LC. Let us not forget telescoping as a major risk of telephone surveys. Comment on Boland et al. BMC Public Health 2006; 6.
21. Thomas MK, etal. The burden and impact of acute gastrointestinal illness in Galvez, Argentina, 2007. J Health Popul Nutr{\n press, 2010).
22. Rothman KJ, Greenland S. Modern Epidemiology 2nd Edition, 2nd edn. Philadelphia, Pennsylvania: Lippincott-Raven Publishers, 1998.
23. Majowicz SE, etal. A common, symptom-based case definition for gastroenteritis. Epidemiol Infect 2008; 136: 889-94.
24. de Wit MA, et al. Gastroenteritis in sentinel general practices.The Netherlands. Emerg Infect Dis 2001; 7: 82-91.
25. Hogenauer C, etal. Mechanisms and management of antibiotic-associated diarrhea. Clin Infect Dis 1998; 27: 702-710.
26. Bartlett JG. Antibiotic-associated diarrhea. Clin Infect Dis 1992; 15: 573-581.
27. Bergogne-Berezin E. Treatment and prevention of antibiotic associated diarrhea. I'nt J Antimicrob Agents 2000; 16: 521-526.
28. Barbut F, Meynard JL. Managing antibiotic associated diarrhoea. BMJ 2002; 324: 1345-1346.
96
29. Robertson ID, Thompson RC. Enteric parasitic zoonoses of domesticated dogs and cats. Microbes Infect 2002; 4: 867-873.
30. Lappin MR. General concepts in zoonotic disease control. Vet Clin North Am Small Anim Pract 2005; 35: 1-20.
31. Deming MS, et al. Campylobacter enteritis at a university: transmission from eating chicken and from cats. Am J Epidemiol 1987; 126: 526-534.
32. Hill SL, et al. Prevalence of enteric zoonotic organisms in cats. J Am Vet Med Assoc 2000; 216: 687-692.
33. Spain CV, et al. Prevalence of enteric zoonotic agents in cats less than 1 year old in central New York State. J Vet Intern Med 2001; 15: 33-38.
34. Mounts AW, et al. Cold weather seasonality of gastroenteritis associated with Norwalk-like viruses. J Infect Dis 2000; 181 Suppl 2: S284-7.
35. Naumova EN, et al. Seasonality in six enterically transmitted diseases and ambient temperature. Epidemiol Infect 2007; 135: 281-292.
97
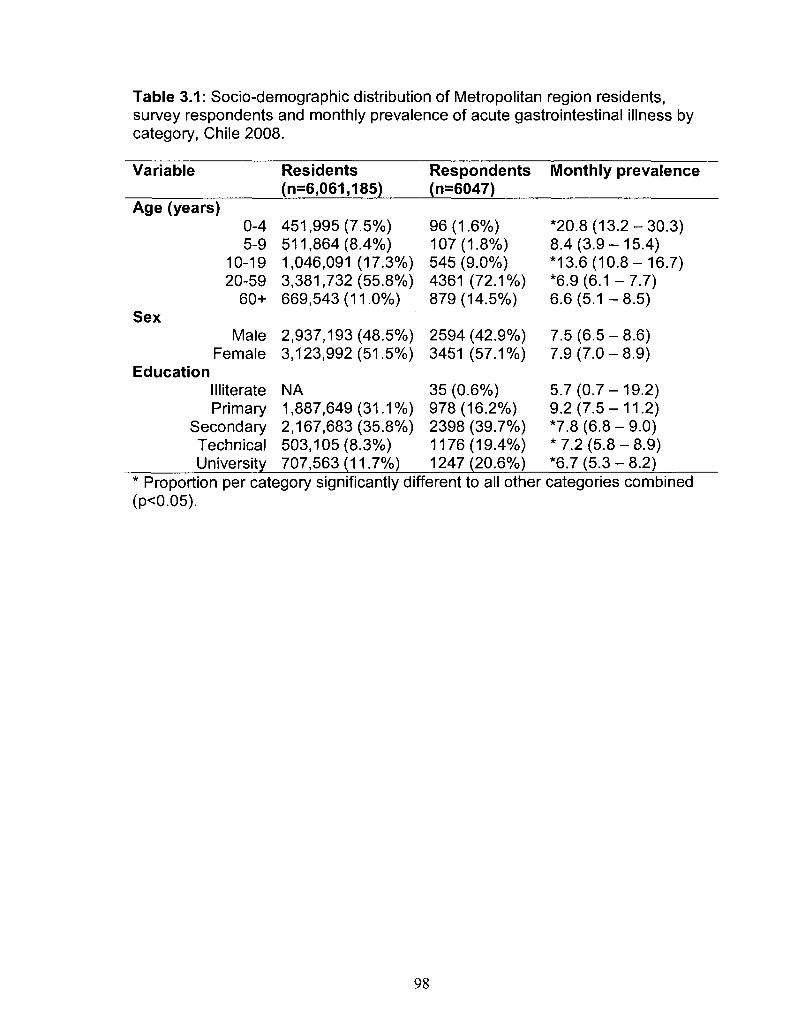
Table 3.1: Socio-demographic distribution of Metropolitan region residents, survey respondents and monthly prevalence of acute gastrointestinal illness by category, Chile 2008.
Variable
Age (years) 0-4 5-9
10-19 20-59
60+ C o y O C A
Male Female
Education Illiterate Primary
Secondary Technical University
Residents (n=6,061,185)
451,995(7.5%) 511,864(8.4%) 1,046,091 (17.3%) 3,381,732(55.8%) 669,543(11.0%)
2,937,193(48.5%) 3,123,992(51.5%)
NA 1,887,649(31.1%) 2,167,683(35.8%) 503,105(8.3%) 707,563(11.7%)
Respondents (n=6047)
96(1.6%) 107(1.8%) 545 (9.0%) 4361 (72.1%) 879(14.5%)
2594 (42.9%) 3451 (57.1%)
35 (0.6%) 978(16.2%) 2398 (39.7%) 1176(19.4%) 1247(20.6%)
Monthly prevalence
*20.8 (13.2-30.3) 8.4(3.9-15.4) *13.6(10.8-16.7) *6.9(6.1 -7.7) 6.6(5.1 -8.5)
7.5(6.5-8.6) 7.9(7.0-8.9)
5.7(0.7-19.2) 9.2(7.5-11.2) *7.8(6.8-9.0) * 7.2 (5.8-8.9) *6.7(5.3-8.2)
* Proportion per category significantly different to all other categories combined (p<0.05).
98
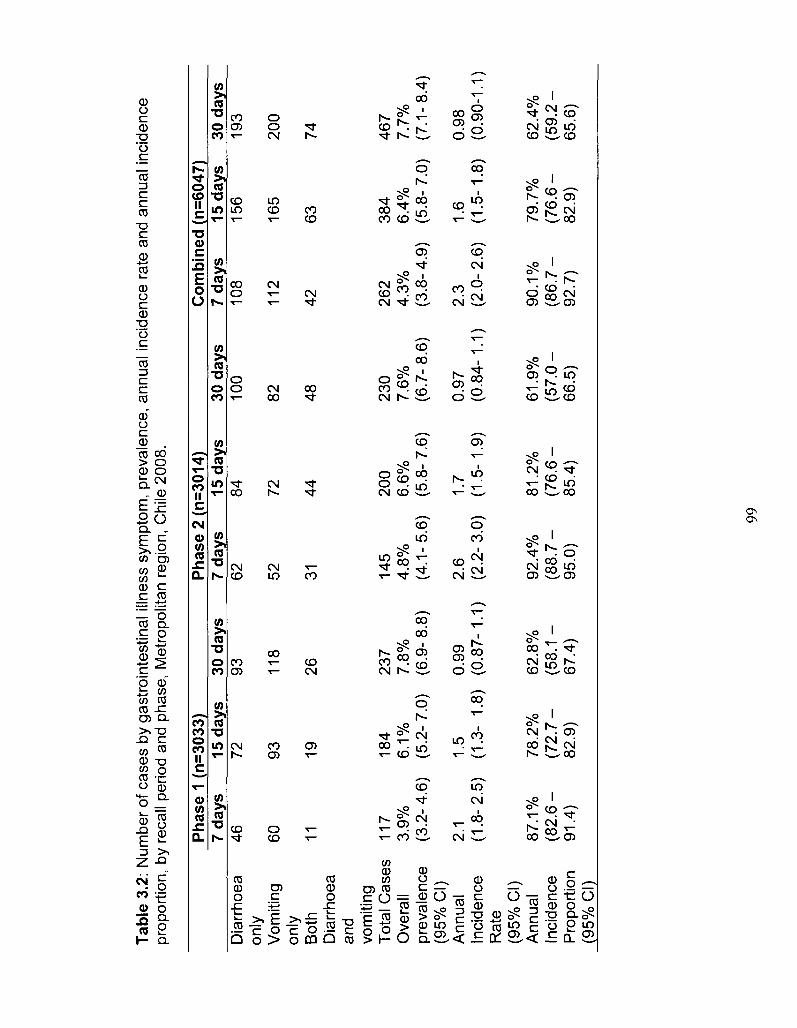
Tab
le 3
.2:
Num
ber
of c
ases
by
gast
roin
test
inal
illn
ess
sym
ptom
, pre
vale
nce,
ann
ual i
ncid
ence
rat
e an
d an
nual
inc
iden
ce
prop
ortio
n, b
y re
call
perio
d an
d ph
ase,
Met
ropo
litan
reg
ion,
Chi
le 2
008.
Pha
se 1
(n=3
033)
P
hase
2 (
n=3
014)
C
om
bin
ed (
n=6
047)
7
days
15
day
s 30
day
s 7
days
15
day
s 30
day
s 7
days
15
day
s 30
day
s D
iarr
hoea
on
ly
Vom
iting
on
ly
Bot
h D
iarr
hoea
an
d vo
miti
ng
Tot
al C
ases
O
vera
ll pr
eval
ence
(9
5% C
I)
Ann
ual
Inci
denc
e R
ate
(95%
CI)
A
nnua
l In
cide
nce
Pro
port
ion
(95%
CI)
46
60
11
117
3.9%
(3
.2-4
.6)
2.1
(1.8
-2.5
)
87.1
%
(82.
6 -
91.4
)
72
93
19
184
6.1%
(5
.2-
7.0)
1.5
(1.3
- 1.
8)
78.2
%
(72
.7-
82.9
)
93
118
26
237
7.8%
(6
.9-
8.8)
0.99
(0
.87-
1.1)
62.8
%
(58.
1 -
67.4
)
62
52
31
145
4.8%
(4
.1-5
.6)
2.6
(2.2
- 3.
0)
92.4
%
(88.
7 -
95.0
)
84
72
44
200
6.6%
(5
.8-
7.6)
1.7
(1.5
-1.9
)
81.2
%
(76
.6-
85.4
)
100
82
48
230
7.6%
(6
.7-
8.6)
0.97
(0
.84-
1.1)
61.9
%
(57
.0-
66.5
)
108
112
42
262
4.3%
(3
.8-
4.9)
2.3
(2.0
- 2.
6)
90.1
%
(86
.7-
92.7
)
156
165
63
384
6.4%
(5
.8-
7.0)
1.6
(1.5
-1.8
)
79.7
%
(76
.6-
82.9
)
193
200
74
467
7.7%
(7
.1-8
.4)
0.98
(0
.90-
1.1)
62.4
%
(59.
2 -
65.6
)
99
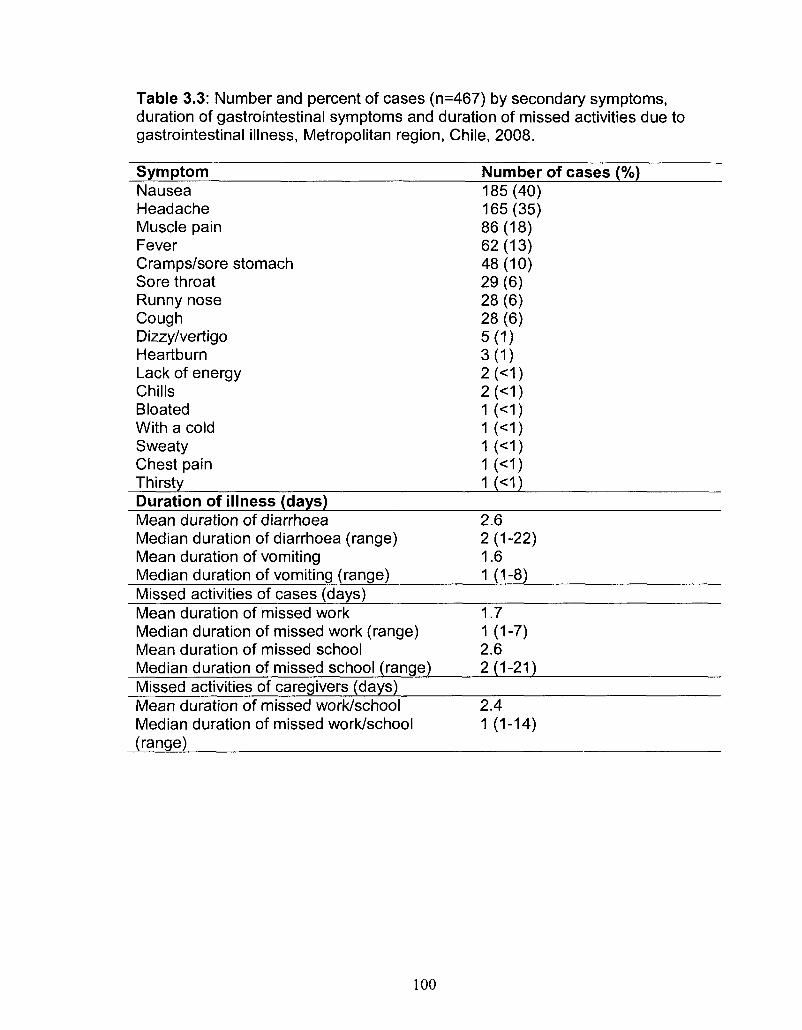
Table 3.3: Number and percent of cases (n=467) by secondary symptoms, duration of gastrointestinal symptoms and duration of missed activities due to gastrointestinal illness, Metropolitan region, Chile, 2008.
Symptom Number of cases (%) Nausea Headache Muscle pain Fever Cramps/sore stomach Sore throat Runny nose Cough Dizzy/vertigo Heartburn Lack of energy Chills Bloated With a cold Sweaty Chest pain Thirsty
185(40) 165(35) 86(18) 62(13) 48(10) 29(6) 28(6) 28(6) 5(1) 3(1) 2(<1) 2(<1) 1(<1) 1(<1) 1(<1) 1(<1)
K<D Duration of illness (days) Mean duration of diarrhoea Median duration of diarrhoea (range) Mean duration of vomiting Median duration of vomiting (range)
2.6 2(1-22) 1.6 1 (1-8)
Missed activities of cases (days) Mean duration of missed work Median duration of missed work (range) Mean duration of missed school Median duration of missed school (range)
1.7 1 (1-7) 2.6 2(1-21)
Missed activities of caregivers (days) Mean duration of missed work/school Median duration of missed work/school (range)
2.4 1 (1-14)
100
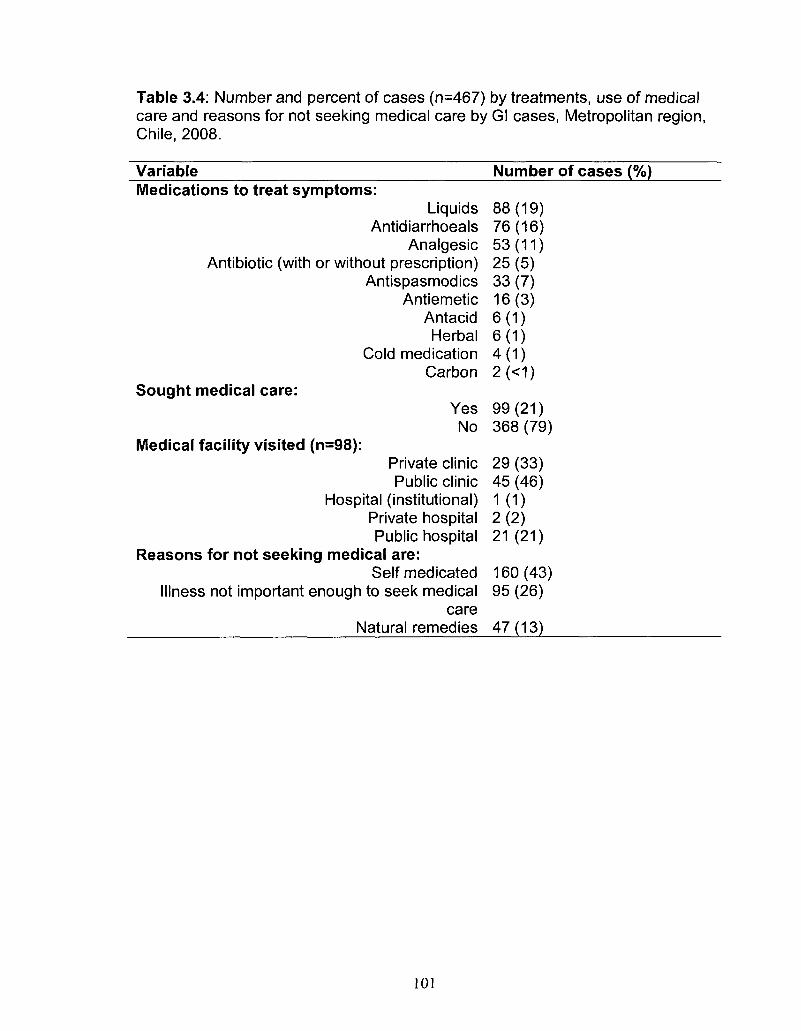
Table 3.4: Number and percent of cases (n=467) by treatments, use of medical care and reasons for not seeking medical care by Gl cases, Metropolitan region, Chile, 2008.
Variable Number of cases (%) Medications to treat symptoms:
Liquids 88(19) Antidiarrhoeals 76(16)
Analgesic 53(11) Antibiotic (with or without prescription) 25 (5)
Antispasmodics 33 (7) Antiemetic 16(3)
Antacid 6(1) Herbal 6(1)
Cold medication 4(1) Carbon 2(<1)
Sought medical care: Yes 99(21) No 368(79)
Medical facility visited (n=98): Private clinic 29(33) Public clinic 45 (46)
Hospital (institutional) 1(1) Private hospital 2 (2) Public hospital 21(21)
Reasons for not seeking medical are: Self medicated 160(43)
Illness not important enough to seek medical 95 (26) care
Natural remedies 47 (13)
101
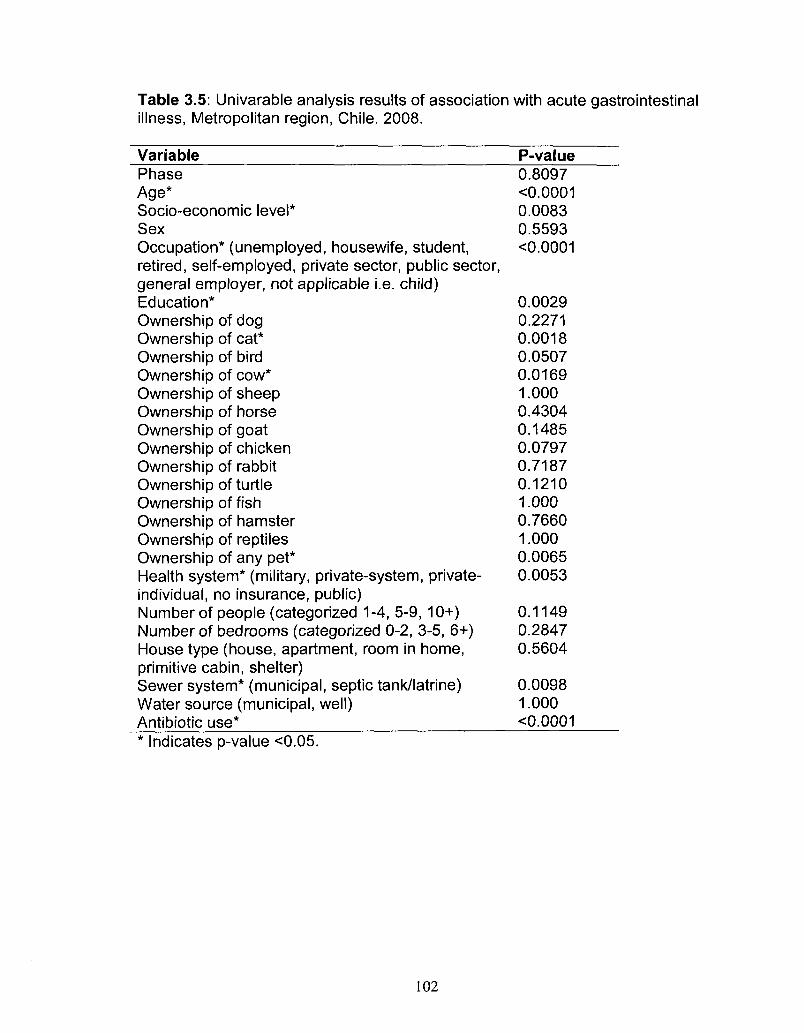
Table 3.5: Univarable analysis results of association with acute gastrointestinal illness, Metropolitan region, Chile. 2008.
Variable Phase Age* Socio-economic level* Sex Occupation* (unemployed, housewife, student, retired, self-employed, private sector, public sector, general employer, not applicable i.e. child) Education* Ownership of dog Ownership of cat* Ownership of bird Ownership of cow* Ownership of sheep Ownership of horse Ownership of goat Ownership of chicken Ownership of rabbit Ownership of turtle Ownership of fish Ownership of hamster Ownership of reptiles Ownership of any pet* Health system* (military, private-system individual, no insurance, public) Number of people (categorized 1-4, 5-9 Number of bedrooms (categorized 0-2, House type (house, apartment, room in primitive cabin, shelter)
i, private-
,10+) 3-5, 6+) home,
Sewer system* (municipal, septic tank/latrine) Water source (municipal, well) Antibiotic use*
P-value 0.8097 <0.0001 0.0083 0.5593 <0.0001
0.0029 0.2271 0.0018 0.0507 0.0169 1.000 0.4304 0.1485 0.0797 0.7187 0.1210 1.000 0.7660 1.000 0.0065 0.0053
0.1149 0.2847 0.5604
0.0098 1.000 <0.0001
Indicates p-value <0.05.
102
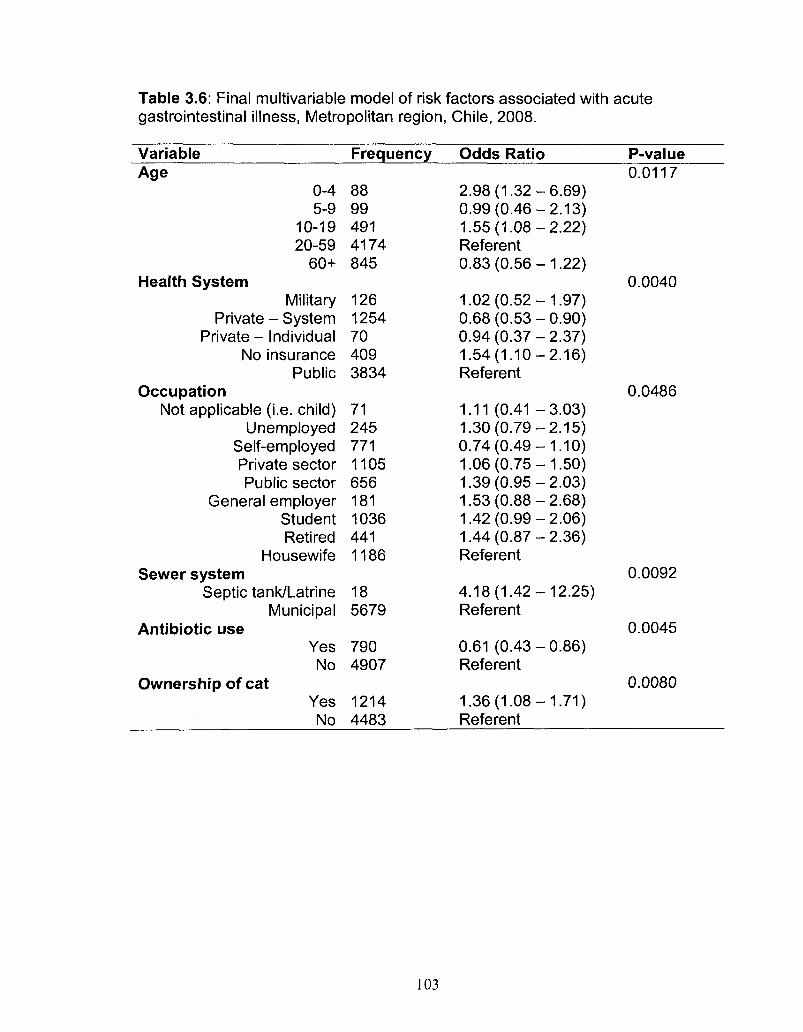
Table 3.6: Final multivariable model of risk factors associated with acute gastrointestinal illness, Metropolitan region, Chile, 2008.
Variable Frequency Odds Ratio P-value Age
0-4 5-9
10-19 20-59
60+ Health System
Military Private - System
Private - Individual No insurance
Public Occupation
Not applicable (i.e. child) Unemployed
Self-employed Private sector Public sector
General employer Student Retired
Housewife Sewer system
Septic tank/Latrine Municipal
Antibiotic use Yes No
Ownership of cat Yes No
88 99 491 4174 845
126 1254 70 409 3834
71 245 771 1105 656 181 1036 441 1186
18 5679
790 4907
1214 4483
2.98(1.32-0.99(0.46-1.55(1.08-Referent 0.83(0.56-
1.02(0.52-0.68(0.53-0.94(0.37-1.54(1.10-Referent
1.11 (0.41 -1.30(0.79-0.74 (0.49 -1.06(0.75-1.39(0.95-1.53(0.88-1.42(0.99-1.44(0.87-Referent
4.18(1.42-Referent
0.61 (0.43-Referent
1.36(1.08-Referent
-6.69) -2.13) -2.22)
-1.22)
-1.97) -0.90) -2.37) -2.16)
-3.03) -2.15) -1.10) -1.50) -2.03) -2.68) -2.06) -2.36)
-12.25)
-0.86)
-1.71)
0.0117
0.0040
0.0486
0.0092
0.0045
0.0080
103
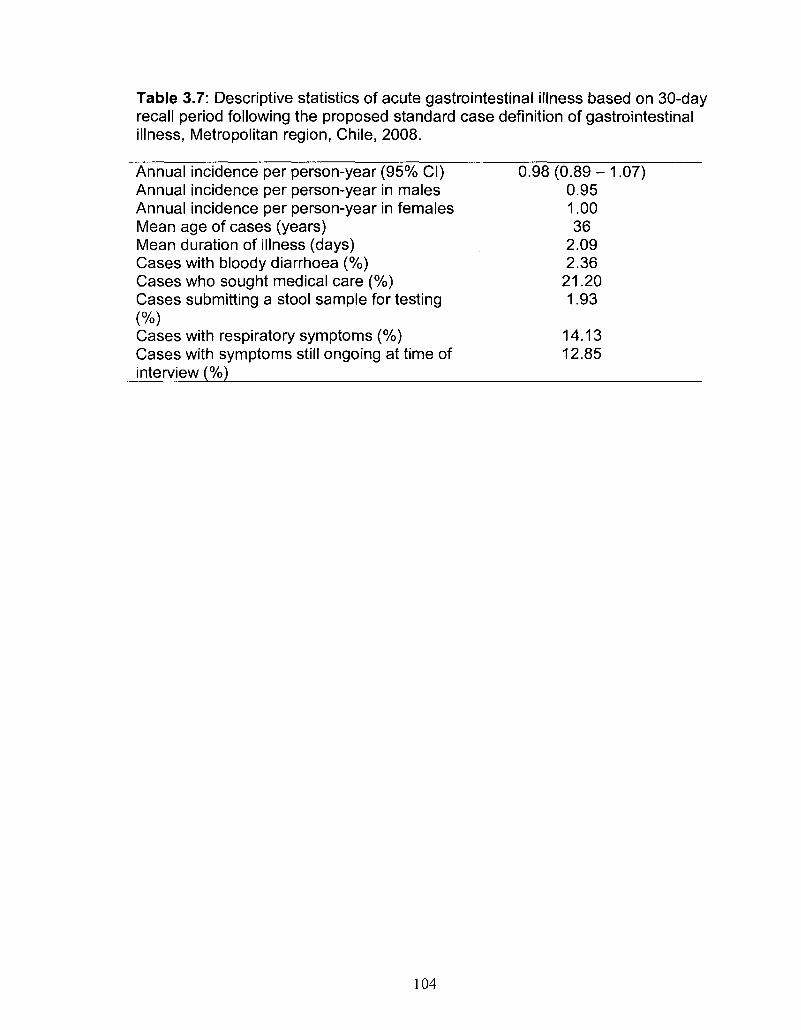
Table 3.7: Descriptive statistics of acute gastrointestinal illness based on 30-day recall period following the proposed standard case definition of gastrointestinal illness, Metropolitan region, Chile, 2008.
Annual incidence per person-year (95% CI) 0.98 (0.89 - 1.07) Annual incidence per person-year in males 0.95 Annual incidence per person-year in females 1.00 Mean age of cases (years) 36 Mean duration of illness (days) 2.09 Cases with bloody diarrhoea (%) 2.36 Cases who sought medical care (%) 21.20 Cases submitting a stool sample for testing 1.93 (%) Cases with respiratory symptoms (%) 14.13 Cases with symptoms still ongoing at time of 12.85 interview (%)
104
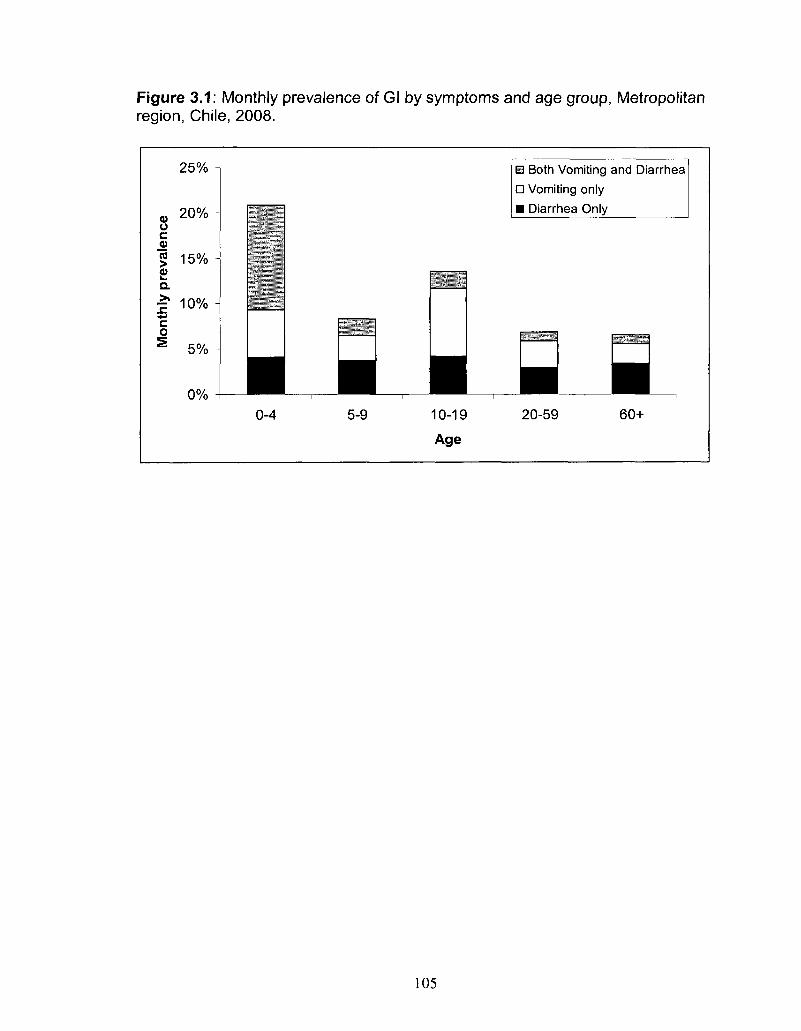
Figure 3.1: Monthly prevalence of Gl by symptoms and age group, Metropolitan region, Chile, 2008.
25% -
a, 2 0 % -u c 5 15% -2> a 1" 10% -•#-»
c o
S 5% -
0% -
• 0-4
• 5-9
• 10-19
Age
B Both Vomiting and Diarrhea
• Vomiting only
• Diarrhea Only
*
• 20-59
• 60+
105
CHAPTER FOUR
Risk factors for acute gastrointestinal illness related to food consumption
trends, food purchasing and hygiene habits among residents of the
Metropolitan Region, Chile, 2008
Prepared for submission: Foodborne Pathogens and Disease
Abstract
Background: This paper describes food consumption patterns, common food
purchasing habits, hygiene behaviours related to food safety and their
associations with acute gastrointestinal illness (Gl) in the Metropolitan region of
Chile.
Methods: A cross-sectional survey was administered door-to-door 21 July to 25
August and 14 November to 21 December 2008 in the Metropolitan region, Chile.
Respondents were randomly selected after socio-economic level stratification of
the region. Food consumption and food purchasing habits were assessed using
7-day recall, as well as general hand washing and food preparation habits.
Logistic regression was used to assess the association of Gl with food
consumption and hygiene behaviours.
Results: In total, 6047 residents participated with an average response rate of
75.8%. Supermarket and home were the most commonly identified locations of
food purchasing and meal eating, respectively. Respondents reported
consumption of an average of 15.2 meals per week. Most respondents
106
answered that they 'always' washed hands before eating and after using the
bathroom; used soap when washing hands; used a specific cutting board for
cutting meat and washed fruits and vegetables prior to eating. After controlling
for the effect of age, being a case of GI in the month prior to interview was
associated with consumption of undercooked poultry (OR=2.99), undercooked
beef (OR=2.18) and cheese made from unpasteurized milk (OR=2.09) in the 7
days prior to interview.
Conclusions: This study assessed food consumption and purchasing and
hygiene habits in the Metropolitan region, Chile from a food safety and Gl
perspective. These results can assist in developing Gl prevention and control
strategies.
Introduction
Access to 'safe food' is identified as a basic human right, which is not
always achieved by everyone, particularly in less developed countries, and this is
not fully appreciated by all public health authorities (Kaferstein, 2003, Kaferstein,
et al., 1999). Food consumption studies that assess nutritional intake with a
focus on malnutrition, obesity and chronic diseases have been conducted in
many countries. The safety of food, however, is a function of the presence or
absence of harmful concentrations of contaminants, including pathogens, which
may be especially important when food quantity is low (Kaferstein, 2003).
Recent research in Canada and the United States has focused on population
food consumption patterns in terms of food safety and risk of infectious diseases,
107
specifically acute gastrointestinal illnesses (Gl) (Nesbitt, etal., 2008, Altekruse,
etal., 1999, Yang, etal., 1998).
In Chile, surveys are done to monitor factors that affect quality of life,
including food intake (Ministerio de Salud Gobierno de Chile, 2006, Castillo, et
a/., 2002, Olivares, etal., 2004). However, associations between food
consumption and Gl are mainly derived from foodborne disease outbreak
reports, which represent only a fraction of all foodborne disease cases (Ministerio
de Salud (Chile), 2007, Prado, etal., 2002).
In 2008, the first population burden of Gl study in the Metropolitan region
of Chile was conducted (Chapter 3, (Thomas, etal., (Accepted 2010))). This
survey included specific questions related to food consumption and food
purchasing habits, as well as hygiene behaviours. The survey formed the basis
of this study, the objectives of which were to describe food consumption patterns,
common food purchasing habits and hygiene behaviours related to food safety,
and their associations with Gl.
Methods
Population baseline study
Detailed methodology of the survey with results of basic burden of Gl is
reported elsewhere (Chapter 3, (Thomas, et ai, (Accepted 2010))). In brief, a
cross-sectional, door-to-door survey of randomly selected residents of the
Metropolitan region of Chile was administered July 21 - August 25, 2008 (Phase
1, low Gl season) and November 14 - December 21, 2008 (Phase 2, high Gl
season).
108
The 52 neighbourhoods of the region were classified by Instituto Nacional
de Estadisticas (INE)7 according to socio-economic level into five categories.
The number of surveys administered per socio-economic category was
proportional to population size. Blocks within neighbourhoods were randomly
selected proportional to the number of households within each block.
Households were selected from within the randomly selected block at the
convenience and discretion of the surveyor in the field, as within each block the
area was considered to be homogeneous.
Face-to-face interviews were conducted by trained surveyors from the
region. The individual in the household with the next birthday was selected to
participate in the survey. If the selected individual declined or no one lived at the
residence, the neighboring house was selected as the replacement. If the
selected individual was under the age of 12, the parent or guardian answered the
survey on their behalf. If the selected individual was between the ages of 12 and
18, the parent, guardian or child answered the survey at the discretion of the
parent or guardian. All surveys were administered in Spanish.
Sample size
Sample sizes were calculated using Epilnfo 3.4.1 (Centers for Disease
Control and Prevention, Atlanta, Georgia, 2000). Using an expected monthly
prevalence of Gl (defined below) of 8%, a 1% allowable error, a 95% confidence
interval and a population of 6,000,000, a target sample size of 2826 was
calculated, which was rounded to 3000 surveys per phase for an overall total
sample size of 6000 surveys.
7 Instituto Nacional de Estadisticas, www.ine.cl 2009.
109
Data gathering
The survey tool (Appendix IV) was developed by modifying that used
previously in Argentina (Appendix I and II, Chapter 2, (Thomas, etai, 2010)) and
using other similar cross-sectional population burden of Gl surveys (Aguiar
Prieto, etai, 2009, Majowicz, etai, 2004, Sargeant, etai, 2007, Thomas, etai,
2008) and food consumption surveys (Nesbitt, etai, 2008, Yang, etai, 1998,
Samuel, etai, 2007) as models. In addition to questions about Gl symptoms
and general socio-demographic factors, respondents were asked, with regard to
the seven days prior to interview, (a) if they had consumed specific foods which
had been identified by the Ministry of Health as 'high Gl risk', (b) where they had
purchased food (by product category), (c) the number of meals they had eaten
and where, as well as (d) general hand washing and food preparation habits.
Ethics
The study was approved by the Human Subjects Committee of the
University of Guelph Research Ethics Board (Guelph, Ontario, Canada) and by
the Servicio de Salud Metropolitano Oriente scientific ethics committee of the
Government of Chile. Signed, informed consent was obtained from all
participants or their parent/guardian.
Statistics
Data were manually entered into Epilnfo 3.4.1 and managed using
Microsoft Access (Microsoft Corporation, 2003). Analysis was performed using
SAS 9.1 (SAS Institute Inc., Cary North Carolina, 2004). Individuals responding
'don't know' or 'unsure' were excluded from the analysis of that question.
110
The case definition of Gl in a respondent was defined as experiencing
symptoms of vomiting or diarrhea in the 30 days prior to interview, where
diarrhea was defined as three or more loose stools in 24 hours. Monthly
prevalence of Gl was defined as the number of cases of Gl in the 30 days prior to
interview, divided by the total number of survey respondents. The estimate using
the 30-day recall period (i.e., rather than using the 7-day or 15-day recall periods)
was selected to maximize sample size. Exact confidence intervals were
calculated at the 95% level.
Differences in distribution of socio-demographic factors between
respondents and residents of the Metropolitan region (as determined from 2002
Census, INE) were tested using PROBBNML test in SAS, where a p-value <0.05
was considered to be statistically significant.
Logistic regression was used to test the association of percentage of
meals consumed by location with Gl. Each location of meal consumption was
assessed individually; associations with a p-value <0.05 (Wald's test) were
considered to be significant.
Odds ratios (ORs) were used to estimate the strength of unconditional
association of Gl with food purchasing habits, and consumption of high risk food
items. Unconditional associations between Gl and hand washing and hygiene
behaviours were assessed using ORs where responses of 'sometimes' were
combined with responses of (a) 'always' and compared to responses of 'never'
and (b) 'never' and compared to responses of 'always'. Additionally, ORs were
calculated to assess the strengths of association of age and gender (adjusted by
111
each other), with consumption of each high risk food item. Age was categorized
for analysis and referent groups were females and respondents between the
ages of 20 and 59 years (this age category contained the largest number of
respondents, ensuring more stable estimates). The 95% confidence intervals
(CI) and p-values of the ORs were adjusted for multiple comparisons when
appropriate using an in-house fortran program.8 Evaluation of 95% CI of ORs
was used to identify statistically significant differences.
The Cochran-Armitage trend test in SAS was used to evaluate the linear
trend relationship between education level and (a) consumption of each food and
(b) hand washing and hygiene habits, and the relationship between age and
hand washing and hygiene habits. The Fisher's Exact test was used to evaluate
the relationship between gender and hand washing and hygiene habits.
Responses of 'always' and 'sometimes' were combined for questions on hand
washing and hygiene habits. A p-value <0.05 was considered to be significant
for the above comparisons.
Multivariate analysis was conducted using manual backwards elimination
logistic regression to assess the association of Gl with food consumption and
hygiene behaviours. All individual hygiene behaviours, food consumption and
socio-demographic (age, gender and education level) variables were evaluated
as potential predictor variables. Only variables with a p-value <0.05 (Wald's test)
or considered to be confounders a priori were kept in the final model. All
variables that were initially screened out of the final model (i.e., not considered to
8 DISTRIB, William C Sears, University of Guelph, 2009, based on the information in Hochberg, Y. and Tamhane, A. C, 1987: Multiple Comparison Procedures. Wiley, New York.
112
be confounders a priori or not significant) were re-introduced to test for
significance and visually assess confounding. Confounding was considered
present when a change of 30% or more, a change in sign or a change in
significance in model coefficients was observed. Multicollinearity was assessed
and considered present if two variables were individually significant, but became
non-significant when both were present in the model. Interaction among all
variables in the final model was assessed and considered present if the
interaction term had a p-value <0.05 (Wald's test). The Hosmer-Lemeshow test
in SAS was used to assess goodness of fit of the model, where a significant p-
value (p-value <0.05) indicated poor fit of the model.
Results
In total, 6047 surveys were completed, 3033 in phase 1 and 3014 in
phase 2, with an overall average response rate of 75.8%. The demographic
distribution of survey respondents and residents of the Metropolitan region is
illustrated in Table 4.1. In general, survey respondents were older, more
educated and more likely to be female than residents.
Univariable (unconditional) significant associations
Food purchasing
'Supermarket' was the most common source reported for meat, fish and
dairy and egg purchases, while 'farmers market' was the most common source
for fruits and vegetable purchases in the week prior to interview (Table 4.2).
Purchasing dairy and eggs from a 'stationary or mobile market/kiosk' was
associated with increased odds of Gl in the month prior to interview, whereas
113
purchasing dairy and eggs from a 'supermarket' was associated with decreased
odds of Gl. Ninety-nine percent of respondents said that their responses
reflected where they habitually purchased their groceries.
Eating habits
Respondents reported consuming an average of 15.2 meals in the week
prior to interview (range 1-66). The largest average proportion of weekly meals
was consumed in the home (84.8%, range 0-100%) followed by a
cafeteria/casino (6.0%, range 0-100%), from the street (cart/kiosk; 3.2%, range
0-100%), in a sit-down restaurant (2.4%, range 0-100%), in a fast food restaurant
(2.4%, range 0-100%), and delivered (1.3%, range 0-100%).
Eating at home (p<0.01, Wald's test), in a cafeteria/casino (p=0.01) or
from the street (p=0.01) in the 7 days prior to interview were significantly
associated with Gl in the month prior to interview (Figure 4.1). As the proportion
of meals consumed in a cafeteria or in the street increased, so did the odds of
Gl, while as the proportion of meals consumed at home increased, the odds of Gl
decreased. Ninety-seven percent of respondents reported that their responses
reflected eating habits of a typical week.
Hand washing and hygiene habits
The majority of respondents responded 'always' to questions of washing
hands before eating, after using the bathroom, using soap when washing hands,
using a specific cutting board for cutting meat, and washing fruits and vegetables
prior to eating (Table 4.3). Increasing level of education was significantly
associated with 'always' or 'sometimes' washing hands prior to eating (p=0.012,
114
Cochran-Armitage trend test), using soap when washing hands prior to eating
(p<0.001), washing hands after using the bathroom (p<0.001) and using soap
when washing hands after using the bathroom (p<0.001). Males were more
likely than females to 'never' wash their hands after using the bathroom
(p=0.027, Fisher's Exact test), 'never' use a specific cutting board for meat
(p=0.005), and 'never' wash their fruits and vegetables prior to eating them
(p=0.022). Increasing age was significantly associated with 'always' or
'sometimes' performing all of the six hand washing and hygiene behaviours that
were questioned in the survey.
Compared to those who responded 'sometimes' and 'never' combined for
each question, the odds of Gl in the month prior to interview were significantly
lower in respondents who reported they 'always' wash their hands prior to eating,
use soap when washing hands prior to eating, use a specific cutting board for
cutting meat and wash fruits and vegetables prior to eating. Those who reported
they 'never' use soap when washing their hands after using the bathroom and
those who reported they 'never' wash fruits and vegetables prior to eating, had a
significantly higher odds of Gl compared to those who responded 'always' and
'sometimes' combined for each question.
High risk food consumption
In total, 71.5% (n=4323) of respondents reported eating at least one 'high
Gl risk' food (as defined by Ministry of Health) in the week prior to interview
(Table 4.4). The most commonly consumed 'high Gl risk' foods were commercial
mayonnaise, undercooked eggs and homemade mayonnaise. Gl was most
115
strongly associated with consumption of undercooked poultry (OR=2.99),
undercooked beef (OR=2.18) and cheese made from unpasteurized milk
(OR=2.09). Males were at significantly higher odds of consuming several 'high
Gl risk' food items in the week prior to interview compared to females (Table 4.5).
Children less than 5 years of age and adults 60 years and older were at
significantly lower odds of consuming any 'high Gl risk' food compared to
respondents 20 - 59 years of age, whereas respondents between the ages of 10
and 19 years had significantly greater odds of consuming any 'high Gl risk' food
compared to the referent age group (Table 4.6). Increasing level of education
was significantly associated with consumption of commercial mayonnaise
(p<0.001, Cochran-Armitage trend test), undercooked beef (p<0.001), raw fish
(p<0.001), oysters, mussels or molluscs (p<0.001), undercooked eggs (p<0.001),
undercooked chicken (p<0.001) and any 'high Gl risk' food (p<0.001). Eighty-
four percent of respondents said that their responses reflected what they ate in a
normal week.
High risk food consumption was significantly greater in phase 1 than in
phase 2 (p<0.001, Fisher's Exact test). Specifically, it was significantly more
common for respondents to report that they consumed raw eggs (p<0.001), raw
seafood (p<0.001), undercooked beef (p<0.001), undercooked hamburgers
(p<0.001), cheese made from unpasteurized milk (p<0.001) and commercial
mayonnaise (p<0.001) in July-August compared to November-December.
Multivariable results
116
In the final multivariable model, age and consumption of undercooked
beef, undercooked chicken and cheese made from unpasteurized milk in the 7
days prior to interview were all significantly (p<0.05, Wald's test) associated with
being a case of Gl in the 30 days prior to interview (Table 4.7). Those 0-4 and
10-19 years of age were at increased odds of Gl. None of the excluded
variables were confounders, multicollinearty was not present and no interactions
were significant in the final model. The Hosmer-Lemeshow goodness of fit test
p-value was 0.78, indicating the model fit the data.
Discussion
Previously published food consumption and dietary intake studies in Chile
typically had a nutritional focus rather than one of food safety concerns
(Ministerio de Salud Gobiemo de Chile, 2006, Castillo, etal., 2002, Olivares, et
al., 2004). This study assessed food consumption and purchasing as well as
general hygiene habits in the population of the Metropolitan region of Chile, from
a food safety and Gl perspective. The results deepen our understanding of
behavioural and food risk factors for Gl in Chile which could assist in developing
prevention and control measures. As well, these results can be used in food
safety-related risk assessments by contributing estimates of the prevalence of
specific food consumption and hand-washing and hygiene behaviours.
In the final multivariable logistic model, age and consumption of
undercooked chicken, beef and cheese made from unpasteurized milk in the 7
days prior to interview were all found to be significantly associated with being a
case of Gl in the 30 days prior to interview. Consumption of these food products
117
has been associated with numerous foodborne disease outbreaks in Chile
(Ministerio de Salud (Chile), 2007, Prado, et al., 2002). Evidence from foodborne
disease outbreaks and surveillance provided the basis for classification of 'high
Gl risk' foods in this study (Ministerio de Salud (Chile), 2007, Prado, et al., 2002).
The highest statistically significant odds of being a case of Gl in the 30
days prior to interview in this study were associated with consuming
undercooked poultry, undercooked beef, and cheese made from unpasteurized
milk in the seven days prior to interview. Due to the cross-sectional design of
this study, it is not possible to infer causal associations, as we are unsure
whether consumption of these foods occurred prior to becoming a case of Gl.
We note, however, that these are certainly biologically plausible associations that
are consistent with other studies (Oliver, et al., 2009, Smith, et al., 2008, Currie,
etal., 2005, Centers for Disease Control and Prevention (CDC), 2009, Rivas, et
al., 2008), and that 84% of respondents said that their responses reflected what
they ate in a normal week, indicating a potentially large, habitual exposure to
'high Gl risk' foods. In an effort to educate the public, the Ministry of Health
currently provides information on how to prevent Gl with proper hand-washing,
food preparation and general hygiene.9 Expansion of prevention and education
campaigns on the risks associated with 'high Gl risk' foods could be beneficial in
reducing Gl in the population.
Significant differences in 'high Gl risk' food consumption were observed by
age group; young children and the elderly were less likely to consume a 'high Gl
risk' food item. Respondents 10 to 19 years of age had the greatest number (2
9 Chile Ministry of Health, http://epi.minsal.cl/epi/html/enfer/veranosalud.html Accessed March 2010.
118
of possible 16 food items were significant) of 'high Gl risk' food items with
significantly increased odds of consumption compared to the referent group.
Adolescents in this age group typically experience an increase in independence
(Christie, et al., 2005), which may be reflected in their food choices. A peak in
monthly Gl prevalence was observed in this age group in the burden of Gl study
in Chile (Chapter 3, (Thomas, et al., (Accepted 2010))), which might, in part, be
attributed to their food choices and perhaps also to unsafe food handling and
preparation associated with the phenomenon of 'second weaning', where
individuals in this age group are beginning to cook food for themselves and move
out of the family home.
The location of food purchases varied depending on the food item.
'Supermarkets' were identified most frequently for purchases of meat, fish, and
dairy and eggs, while 'farmers markets' were most frequently reported for
purchases of fruits and vegetables. For all food product categories, purchase at
'supermarkets' was associated with lower odds of Gl in the 30 days prior to
interview, though this was only statistically significant for dairy and egg
purchases. Food from supermarkets may be derived from different sources or
more consistently refrigerated than food from farmers markets, but further
research is needed to characterize the basis for these associations.
Furthermore, purchasing dairy and eggs from a 'stationary or mobile
market/kiosk' was associated with increased odds of Gl in the 30 days prior to
interview. This may also be due to cross-contamination, failure to refrigerate
perishable foods, acquisition from less safe sources, or alternatively, may be a
119
reflection of socio-economic level, however further investigation is needed. This
information could be of use for food safety risk assessments and for targeted
food safety education campaigns.
Respondents most commonly reported consuming meals in the home.
The higher percentage of meals consumed at home was unconditionally
associated with a decrease in the odds of Gl while the reverse relationship was
seen with increasing percentage of meals consumed in the street or from a
cafeteria/casino. This too could affect exposure to potential hazards in foods and
should be considered in food safety risk assessments and education campaigns.
Of interest, the most frequently cited location of outbreaks in Chile is the home
(Ministerio de Salud (Chile), 2007, Prado, etal., 2002), though this is probably a
reflection of the large proportion of meals consumed in the home.
Increasing education, age and being female were generally associated
with reported 'good' hand washing and hygiene behaviours. A similar
association of reported 'good' hand washing and hygiene habits with being
female and with increasing age was previously reported in the United States
(Altekruse, etai, 1999, Yang, etal., 1998); however, the opposite relationship
between education and hand washing and hygiene habits (i.e., increasing
education was associated with poor hand washing and hygiene habits) was
reported in these same studies. These results may be useful for more targeted
awareness and prevention campaigns aimed at Chilean residents.
Results from this study illustrate that those who report 'good' hand
washing and hygiene practices have reduced levels of Gl. This association has
120

been seen in other studies (Kaferstein, 2003, Gorter, etal., 1998, Huttly, etal.,
1997, Larsen, 2003). Promotion and education on proper hand hygiene as a
method to prevent infectious diseases should be continued.
One or more food items identified to be of 'high Gl risk' by the Ministry of
Health were consumed in the seven days prior to interview by over 70% of the
survey respondents, with commercial mayonnaise, undercooked eggs and
homemade mayonnaise representing the most frequently consumed. However,
these three food products were not found to be significantly associated with Gl in
the 30 days prior to interview in this study in univariable or multivariable model
tests. Nevertheless, eggs and homemade mayonnaise are often identified as a
source of Salmonella (Mitchell, etal., 1989, Alexandre, etal., 2000, Callaway, et
al, 2008). In Chile in 2006, mayonnaise and eggs ranked 4th and 7th respectively
as sources of foodbome disease outbreaks with an identified food source
(Ministerio de Salud (Chile), 2007). Other foods designated as 'high Gl risk'
(e.g., raw fish, undercooked hamburgers, unpasteurized milk, etc.) were not
found to be significantly associated with Gl in this study; however, this may be
due to small sample sizes of consumers and the adjustment for multiple
comparisons creating conservative 95% confidence intervals and p-values.
Additional studies and more detailed information on food consumption, sporadic
cases and outbreaks of Gl would be useful in refining hypotheses of attribution of
Gl to specific food products.
Significant differences by gender were observed for 4 of the 16 'high Gl
risk' foods, with males being more likely to consume these items. These results
121
are similar to those from studies in Canada and the United States where males
were more likely to consume foods considered 'high Gl risk' (Nesbitt, etal., 2008,
Altekruse, etal., 1999, Samuel, etal., 2007). This could be important for food
safety interventions, which may have more impact if targeted to males. Of
interest, from burden of Gl studies, the monthly prevalence of Gl is reported to be
higher among females than males in Canada and the United States (Majowicz, et
al., 2004, Thomas, etal., 2006, Jones, etal., 2007); however, in this Chilean
study there was no difference in prevalence of Gl between males and females
(Chapter 3, (Thomas, et al., (Accepted 2010))). This may be a reflection of the
high response rate in this study or may indicate that the source of illness may be
different for genders in different regions; requires further investigation.
The prevalence of consumption of several specific 'high Gl risk' foods as
well as consumption of any identified 'high Gl risk' food increased with increasing
education. This trend has also been seen in the United States (Altekruse, et al.,
1999, Yang, etal., 1998). Yang et al (Yang, etal., 1998) hypothesized that
highly educated individuals are either unaware of or choose to ignore risks
associated with the consumption of 'high Gl risk' foods, while Levy et al (Levy, et
al., 2008) proposed that self-confidence and complacency associated with higher
education leads to a lower risk perception. Another possible explanation is that
certain 'high risk foods' (e.g., seafood, rare steak etc.) could be related to a more
affluent lifestyle and that higher education is a surrogate for wealth in this
population.
122
'High Gl risk' food consumption was greater in phase 1 of this study than
in phase 2, which is opposite to the pattern of seasonality associated with Gl in
Chile (Ministerio de Salud (Chile), 2007, Thomas, etal., (Accepted 2010)). This
is somewhat surprising; however, the pattern of seasonality associated with Gl
may be due to the temporal or behavioural factors influencing the presence or
growth of microbial pathogens in food, or consumption of foods in settings less
conducive to good hygiene and food preparation practices (i.e., lack of
refrigeration, barbecue season, inadequate cooking, etc.).
Recall bias is a potential limitation of this study as we asked about food
consumption in the seven days prior to interview, and symptoms of Gl in the 30
days prior to interview. Use of a 1-day recall of food consumption may have
reduced recall bias, but this can be subject to day-to-day fluctuations that can be
limited by multiple-day recall (Block, 1982). Choice of recall period length for
burden of Gl studies is an on-going topic of discussion and no clear consensus
has yet been reached (Wheeler, etal., 1999, Boland, etal., 2006, Rodrigues,
2006). Additionally, proxy respondents who answer on behalf of children may
not know exactly what the child ate and children may not be able to accurately
recall what they ate, which may also result in recall bias.
Selection bias due to differences in the distribution of age, gender and
education level among respondents and the referent community may be another
limitation of this study. As well, misclassification bias could have occurred, given
that responses were self-reported and they are only as accurate as respondents
123
are honest. Certain responses may have been over or under-reported due to
perceived pressure to give the 'right' answer (Nederhof, 1985).
Conclusions
This study assessed food consumption, purchasing and hygiene habits
from a food safety perspective in Chile. A key advantage of this study was the
face-to-face methodology which contributed to its high response rate, which
minimized the risk of non-response bias. The results generated here will be
useful for public health practitioners, risk assessors and food safety professionals
in Chile and around the world.
124
References
Aguiar Prieto P, Finley RL, Muchaal PK, Guerin MT, Isaacs S, Castro Domfnguez A, Gisele Coutin M, Perez E. Burden of self-reported acute gastrointestinal illness in Cuba. J Health Popul Nutr 2009; 27:345-57.
Alexandre M, Pozo C, Gonzalez V, Martinez MC, Prat S, Fernandez A, Fica A, Fernandez J, Heitmann I. Detection of Salmonella enteritidis in samples of poultry products for human consumption in the Chilean metropolitan area. Rev.Med.Chil. 2000; 128:1075-1083.
Altekruse SF, Yang S, Timbo BB, Angulo FJ. A multi-state survey of consumer food-handling and food-consumption practices. Am.J.Prev.Med. 1999; 16:216-221.
Block G. A review of validations of dietary assessment methods. Am.J.Epidemiol. 1982; 115:492-505.
Boland M, Sweeney MR, Scallan E, Harrington M, Staines A. Emerging advantages and drawbacks of telephone surveying in public health research in Ireland and the U.K. BMC Public Health 2006; 6:208.
Callaway TR, Edrington TS, Anderson RC, Byrd JA, Nisbet DJ. Gastrointestinal microbial ecology and the safety of our food supply as related to Salmonella. J.Anim.Sci. 2008; 86:E163-72.
Castillo O, Rozowski J, Cuevas A, Maiz A, Soto M, Mardones F, Leighton F. Nutrients intake in elderly people living in Providence, Santiago de Chile. Rev.Med.Chil. 2002; 130:1335-1342.
Centers for Disease Control and Prevention (CDC). Campylobacter jejuni infection associated with unpasteurized milk and cheese-Kansas, 2007. MMWR Morb.Mortal.Wkly.Rep. 2009; 57:1377-1379.
Christie D and Viner R. Adolescent development. BMJ 2005; 330:301-304.
Currie A, MacDougall L, Aramini J, Gaulin C, Ahmed R, Isaacs S. Frozen chicken nuggets and strips and eggs are leading risk factors for Salmonella Heidelberg infections in Canada. Epidemiol.Infect. 2005; 133:809-816.
Gorter AC, Sandiford P, Pauw J, Morales P, Perez RM, Alberts H. Hygiene behaviour in rural Nicaragua in relation to diarrhoea. Int.J.Epidemiol. 1998; 27:1090-1100.
125
Huttly SR, Morris SS, Pisani V. Prevention of diarrhoea in young children in developing countries. Bull.World Health Organ. 1997; 75:163-174.
Jones TF, McMillian MB, Scallan E, Frenzen PD, Cronquist AB, Thomas S, Angulo FJ. A population-based estimate of the substantial burden of diarrhoeal disease in the United States; FoodNet, 1996-2003. Epidemiol.Infect. 2007; 135:293-301.
Kaferstein F. Foodborne diseases in developing countries: aetiology, epidemiology and strategies for prevention. Int.J.Environ.Health Res. 2003; 13 SuppM:S161-8.
Kaferstein F and Abdussalam M. Food safety in the 21st century. Bull.World Health Organ. 1999; 77:347-351.
Larsen B. Hygiene and health in developing countries: defining priorities through cost- benefit assessments. Int.J.Environ.Health Res. 2003; 13 Suppl 1:S37-46.
Levy AS, Choiniere CJ, Fein SB. Practice-specific risk perceptions and self-reported food safety practices. Risk Anal. 2008; 28:749-761.
Majowicz SE, Dore K, Flint JA, Edge VL, Read S, Buffett MC, McEwen S, McNab WB, Stacey D, Sockett P, Wilson JB. Magnitude and distribution of acute, self-reported gastrointestinal illness in a Canadian community. Epidemiol.Infect. 2004; 132:607-617.
Ministerio de Salud (Chile). Boletin de vigilancia de salud publica en Chile. 2007; 10(25):.
Ministerio de Salud Gobiemo de Chile. II Encuesta de Calidad de Vida y Salud Chile 2006 Informe de Resultados Total Nacional. 2006; .
Mitchell E, O'Mahony M, Lynch D, Ward LR, Rowe B, Uttley A, Rogers T, Cunningham DG, Watson R. Large outbreak of food poisoning caused by Salmonella typhimurium definitive type 49 in mayonnaise. BMJ 1989; 298:99-101.
Nederhof AJ. Methods of coping with social desirability bias: a review. Eur J Soc Psychol 1985; 15:263-283.
Nesbitt A, Majowicz S, Finley R, Pollari F, Pintar K, Marshall B, Cook A, Sargeant J, Wilson J, Ribble C, Knowles L. Food consumption patterns in the Waterloo Region, Ontario, Canada: a cross-sectional telephone survey. BMC Public Health 2008; 8:370.
126
Olivares S, Kain J, Lera L, Pizarro F, Vio F, Moron C. Nutritional status, food consumption and physical activity among Chilean school children: a descriptive study. Eur.J.CIin.Nutr. 2004; 58:1278-1285.
Oliver SP, Boor KJ, Murphy SC, Murinda SE. Food safety hazards associated with consumption of raw milk. Foodborne Pathog.Dis. 2009; 6:793-806.
Prado V, Solari V, Alvarez IM, Arellano C, Vidal R, Carreno M, Mamani N, Fuentes D, O'Ryan M, Munoz V. Epidemiological situation of foodborne diseases in Santiago, Chile in 1999-2000. Rev.Med.Chil. 2002; 130:495-501.
Rivas M, Sosa-Estani S, Rangel J, Caletti MG, Valles P, Roldan CD, Balbi L, Marsano de Mollar MC, Amoedo D, Miliwebsky E, Chinen I, Hoekstra RM, Mead P, Griffin PM. Risk factors for sporadic Shiga toxin-producing Escherichia coli infections in children, Argentina. Emerg.lnfect.Dis. 2008; 14:763-771.
Rodrigues LC. Let us not forget telescoping as a major risk of telephone surveys. Comment on Boland et al. BMC Public Health 2006; 6:.
Samuel MC, Vugia D, Koehler KM, Marcus R, Deneen V, Damaske B, Shiferaw B, Hadler J, Henao O, Angulo F. Consumption of risky foods among adults at high risk for severe foodborne diseases: Room for improved targeted prevention messages. J Food Safety 2007; 27:219-232.
Sargeant JM, Majowicz SE, Snelgrove J. The burden of acute gastrointestinal illness in Ontario, Canada, 2005-2006. Epidemiol.Infect. 2008;136: 451-460.
Smith KE, Medus C, Meyer SD, Boxrud DJ, Leano F, Hedberg CW, Elfering K, Braymen C, Bender JB, Danila RN. Outbreaks of salmonellosis in Minnesota (1998 through 2006) associated with frozen, microwaveable, breaded, stuffed chicken products. J.Food Prot. 2008; 71:2153-2160.
Thomas MK, Perez E, Majowicz SE, Reid-Smith R, Olea A, Diaz J, Solari V, McEwen SA. Burden of acute gastrointestinal illness in the Metropolitan region, Chile, 2008. Epidemiol.Infect. (Accepted 2010); .
Thomas MK, Majowicz SE, MacDougall L, Sockett PN, Kovacs SJ, Fyfe M, Edge VL, Flint JA, Henson S, Jones AQ. Population distribution and burden of acute gastrointestinal illness in British Columbia, Canada. BMC Public Health 2006; 6:307.
Thomas MK, Perez E, Majowicz SE, Reid-Smith R, Albil S, Monteverde M, McEwen SA. Burden of acute gastrointestinal illness in Galvez, Argentina, 2007. J Health Popul Nutr. 2010;28: 149-158. .
127
Thomas MK, Majowicz SE, Pollari F, Sockett PN. Burden of acute gastrointestinal illness in Canada, 1999-2007: interim summary of NSAGI activities. Can.Commun.Dis.Rep. 2008; 34:8-15.
Wheeler JG, Sethi D, Cowden JM, Wall PG, Rodrigues LC, Tompkins DS, Hudson MJ, Roderick PJ. Study of infectious intestinal disease in England: rates in the community, presenting to general practice, and reported to national surveillance. The Infectious Intestinal Disease Study Executive. BMJ 1999; 318:1046-1050.
Yang S, Leff MG, McTague D, Horvath KA, Jackson-Thompson J, Murayi T, Boeselager GK, Melnik TA, Gildemaster MC, Ridings DL, Altekruse SF, Angulo FJ. Multistate surveillance for food-handling, preparation, and consumption behaviors associated with foodborne diseases: 1995 and 1996 BRFSS food-safety questions. MMWR CDC Surveill.Summ. 1998; 47:33-57.
128
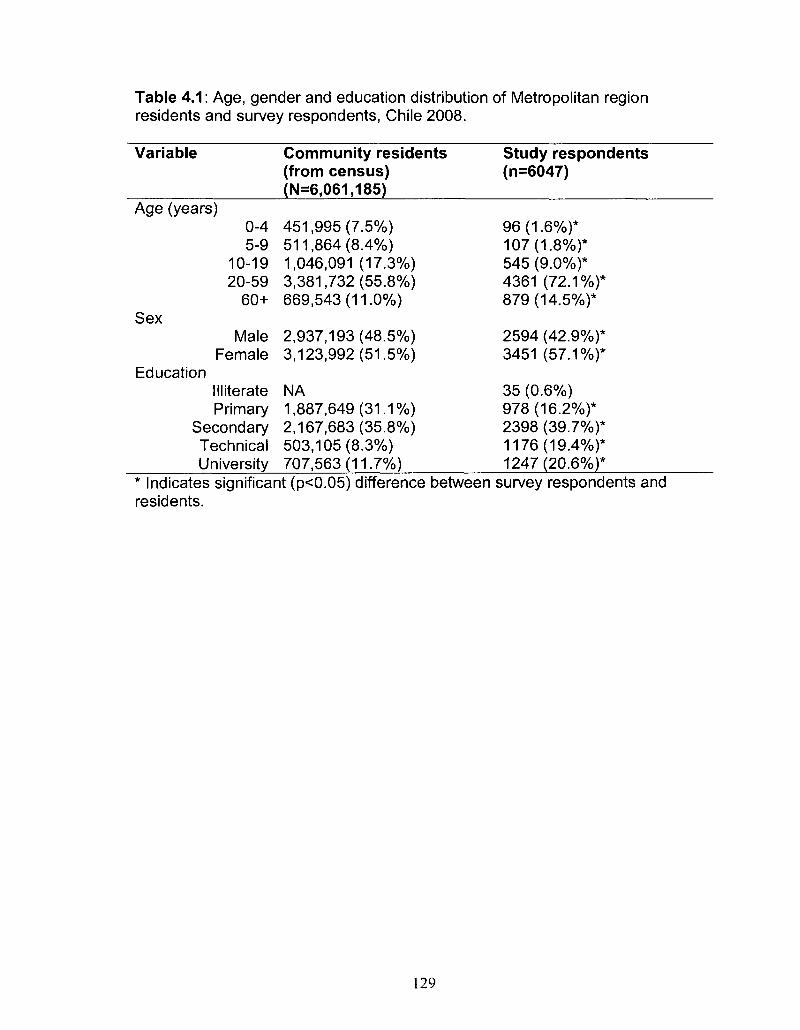
Table 4.1: Age, gender and education distribution of Metropolitan region residents and survey respondents, Chile 2008.
Variable
Age (years) 0-4 5-9
10-19 20-59
60+ Sex
Male Female
Education Illiterate Primary
Secondary Technical University
Community residents (from census) (N=6,061,185)
451,995 (7.5%) 511,864 (8.4%) 1,046,091 (17.3%) 3,381,732(55.8%) 669,543(11.0%)
2,937,193(48.5%) 3,123,992(51.5%)
NA 1,887,649(31.1%) 2,167,683(35.8%) 503,105(8.3%) 707,563(11.7%)
Study respondents (n=6047)
96(1.6%)* 107(1.8%)* 545 (9.0%)* 4361 (72.1%)* 879(14.5%)*
2594 (42.9%)* 3451 (57.1%)*
35 (0.6%) 978(16.2%)* 2398 (39.7%)* 1176(19.4%)* 1247(20.6%)*
Indicates significant (p<0.05) difference between survey respondents and residents.
129
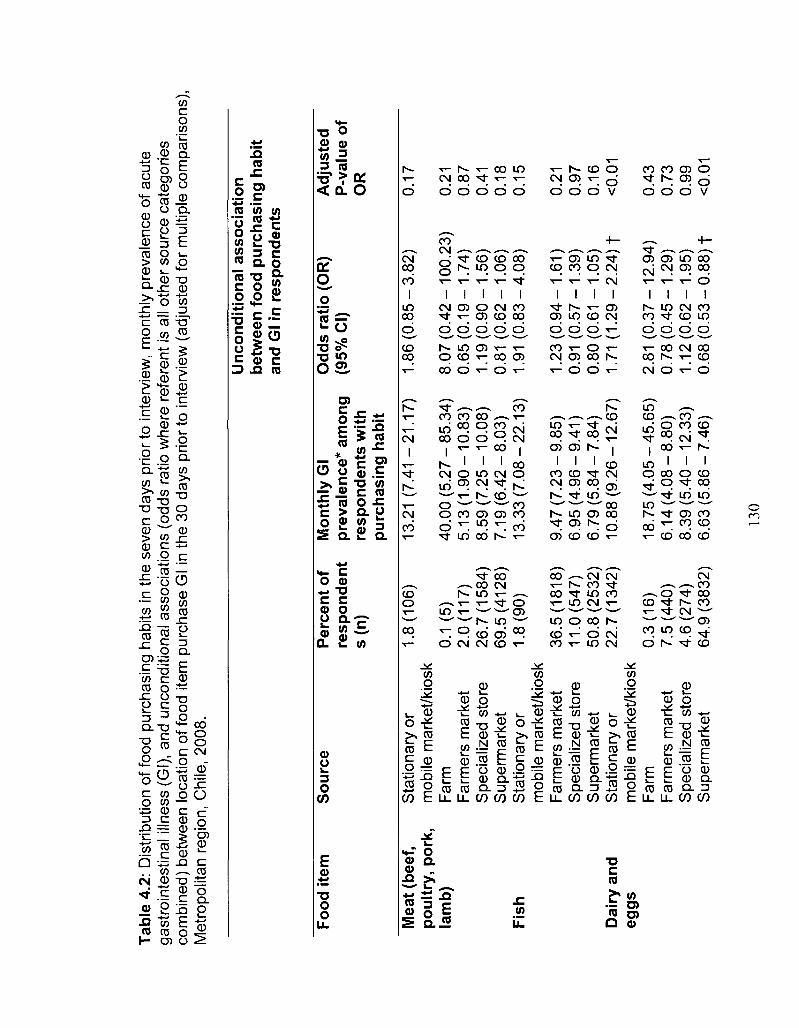
Tabl
e 4.
2: D
istr
ibut
ion
of fo
od p
urch
asin
g ha
bits
in th
e se
ven
days
prio
r to
inte
rvie
w,
mon
thly
pre
vale
nce
of a
cute
ga
stro
inte
stin
al i
llnes
s (G
l), a
nd u
ncon
ditio
nal a
ssoc
iatio
ns (
odds
rat
io w
here
ref
eren
t is
all
othe
r so
urce
cat
egor
ies
com
bine
d) b
etw
een
loca
tion
of fo
od it
em p
urch
ase
Gl i
n th
e 30
day
s pr
ior
to in
terv
iew
(ad
just
ed f
or m
ultip
le c
ompa
rison
s),
Met
ropo
litan
reg
ion,
Chi
le, 2
008.
Food
ite
m
Mea
t (b
eef,
poul
try,
por
k,
lam
b)
Fish
Dai
ry a
nd
eggs
So
urc
e
Sta
tiona
ry o
r m
obile
mar
ket/k
iosk
F
arm
F
arm
ers
mar
ket
Spe
cial
ized
sto
re
Sup
erm
arke
t S
tatio
nary
or
mob
ile m
arke
t/kio
sk
Far
mer
s m
arke
t S
peci
aliz
ed s
tore
S
uper
mar
ket
Sta
tiona
ry o
r m
obile
mar
ket/k
iosk
F
arm
F
arm
ers
mar
ket
Spe
cial
ized
sto
re
Sup
erm
arke
t
Per
cen
t of
re
spo
nd
ent
s(n
)
1.8
(10
6)
0.1
(5)
2.0(
117)
26
.7(1
584)
69
.5(4
128)
1
.8(9
0)
36.5
(181
8)
11.0
(547
) 50
.8 (
2532
) 22
.7(1
342)
0.3
(16
) 7.
5 (4
40)
4.6
(274
) 64
.9 (
3832
)
Mon
thly
Gl
pre
vale
nce
* am
ong
re
spo
nd
ents
wit
h
pu
rch
asin
g h
abit
13.2
1 (7
.41
-21
.17
)
40
.00
(5.2
7-8
5.3
4)
5.1
3(1
.90
-10
.83
) 8
.59
(7.2
5-1
0.0
8)
7.1
9(6
.42
-8.0
3)
13
.33
(7.0
8-2
2.1
3)
9.4
7(7
.23
-9.8
5)
6.9
5(4
.96
-9.4
1)
6.7
9(5
.84
-7.8
4)
10
.88
(9.2
6-1
2.6
7)
18
.75
(4.0
5-4
5.6
5)
6.1
4(4
.08
-8.8
0)
8.3
9(5
.40
-12
.33
) 6
.63
(5.8
6-7
.46
)
Un
con
diti
on
al a
sso
ciat
ion
be
twee
n f
oo
d p
urch
as
and
Gl i
n r
esp
on
den
ts
Od
ds
ratio
(O
R)
(95%
CI)
1.8
6(0
.85
-3.8
2)
8.0
7(0
.42
-10
0.2
3)
0.6
5(0
.19
-1.7
4)
1.1
9(0
.90
-1.5
6)
0.81
(0
.62
-1.0
6)
1.91
(0
.83
-4.0
8)
1.2
3(0
.94
-1.6
1)
0.91
(0
.57
-1.3
9)
0.80
(0.6
1 -1
.05
) 1.
71 (
1.2
9-2
.24
) f
2.81
(0
.37
-12
.94
) 0
.78
(0.4
5-1
.29
) 1
.12
(0.6
2-1
.95
) 0.
68 (
0.5
3-0
.88
) f
ing
hab
it
Ad
just
ed
P-v
alu
e of
O
R
0.17
0.21
0.
87
0.41
0.
18
0.15
0.21
0.
97
0.16
<0
.01
0.43
0.
73
0.99
<0
.01
130
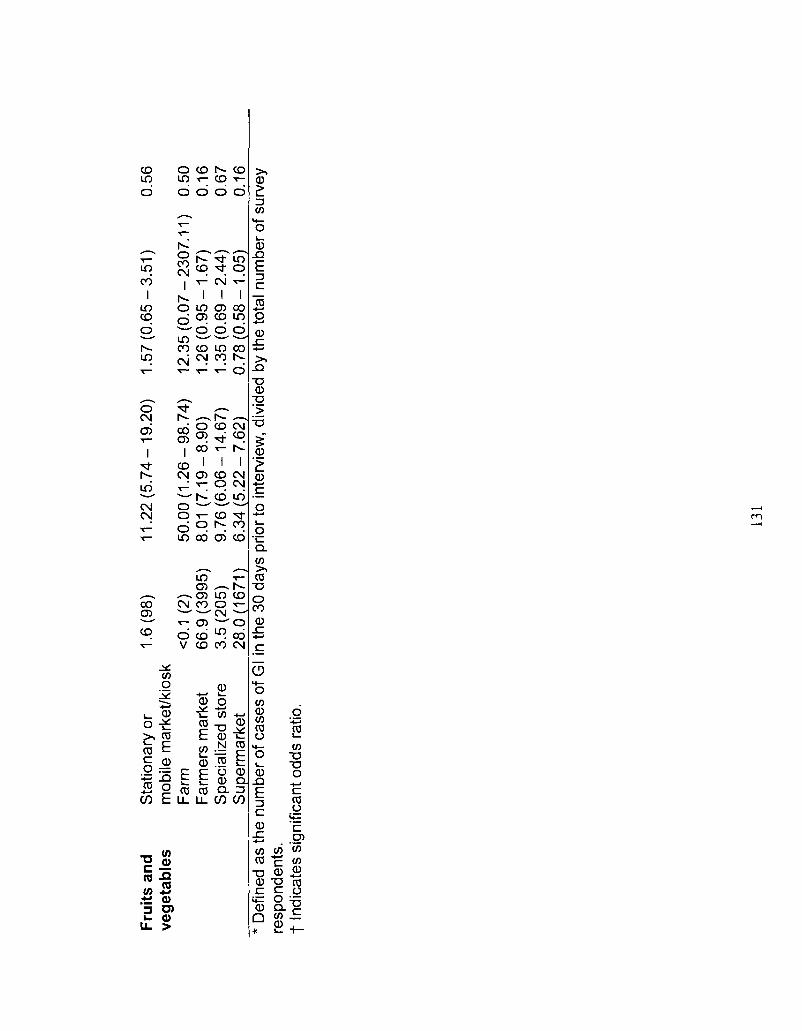
Frui
ts a
nd
veg
etab
les
Sta
tiona
ry o
r m
obile
mar
ket/k
iosk
F
arm
F
arm
ers
mar
ket
Spe
cial
ized
sto
re
Sup
erm
arke
t
1.6
(98
)
<0.1
(2)
66
.9 (
3995
) 3.
5 (2
05)
28.0
(167
1)
11
.22
(5.7
4-1
9.2
0)
50
.00
(1.2
6-9
8.7
4)
8.01
(7
.19
-8.9
0)
9.7
6(6
.06
-14
.67
) 6
.34
(5.2
2-7
.62
)
1.5
7(0
.65
-3.5
1)
12
.35
(0.0
7-2
30
7.1
1)
1.2
6(0
.95
-1.6
7)
1.3
5(0
.69
-2.4
4)
0.7
8(0
.58
-1.0
5)
0.56
0.50
0.
16
0.67
0.
16
* D
efin
ed a
s th
e nu
mbe
r of
cas
es o
f G
I in
the
30 d
ays
prio
r to
inte
rvie
w,
divi
ded
by th
e to
tal n
umbe
r of
sur
vey
resp
onde
nts.
t
Indi
cate
s si
gnifi
cant
odd
s ra
tio.
131
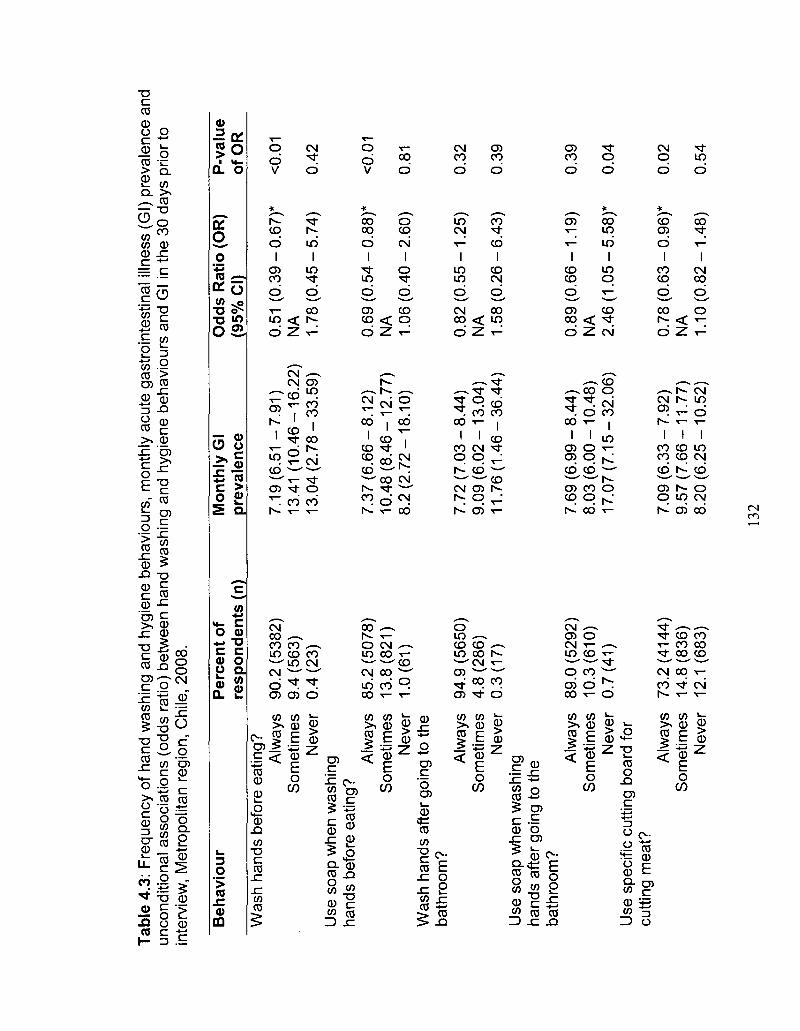
Tab
le 4
.3:
Fre
quen
cy o
f ha
nd w
ashi
ng a
nd h
ygie
ne b
ehav
iour
s, m
onth
ly a
cute
gas
troi
ntes
tinal
illn
ess
(Gl)
prev
alen
ce a
nd
unco
nditi
onal
ass
ocia
tions
(od
ds r
atio
) be
twee
n ha
nd w
ashi
ng a
nd h
ygie
ne b
ehav
iour
s an
d G
l in
the
30 d
ays
prio
r to
in
terv
iew
, M
etro
polit
an r
egio
n, C
hile
, 200
8.
Beh
avio
ur
Was
h ha
nds
befo
re e
atin
g?
Alw
ays
Som
etim
es
Nev
er
Use
soa
p w
hen
was
hing
ha
nds
befo
re e
atin
g?
Alw
ays
Som
etim
es
Nev
er
Was
h ha
nds
afte
r go
ing
to t
he
bath
room
? A
lway
s S
omet
imes
N
ever
U
se s
oap
whe
n w
ashi
ng
hand
s af
ter
goin
g to
the
bath
room
? A
lway
s S
omet
imes
N
ever
U
se s
peci
fic c
uttin
g bo
ard
for
cutti
ng m
eat?
A
lway
s S
omet
imes
N
ever
Per
cen
t of
re
spo
nd
ents
(n)
90.2
(53
82)
9.4
(563
) 0.
4 (2
3)
85.2
(50
78)
13.8
(821
) 1
.0(6
1)
94.9
(56
50)
4.8
(286
) 0
.3(1
7)
89.0
(52
92)
10.3
(610
) 0
.7(4
1)
73.2
(414
4)
14.8
(836
) 12
.1 (
683)
Mon
thly
Gl
pre
vale
nce
7.1
9(6
.51
-7.9
1)
13.4
1 (1
0.4
6-1
6.2
2)
13
.04
(2.7
8-3
3.5
9)
7.3
7(6
.66
-8.1
2)
10
.48
(8.4
6-1
2.7
7)
8.2
(2.7
2-1
8.1
0)
7.7
2(7
.03
-8.4
4)
9.0
9(6
.02
-13
.04
) 1
1.7
6(1
.46
-36
.44
)
7.69
(6.
99 -
8.
44)
8.0
3(6
.00
-10
.48
) 1
7.0
7(7
.15
-32
.06
)
7.0
9(6
.33
-7.9
2)
9.5
7(7
.66
-11
.77
) 8
.20
(6.2
5-1
0.5
2)
Odd
s R
atio
(O
R)
(95%
CI)
0.51
(0
.39
-N
A
1.7
8(0
.45
-
0.6
9(0
.54
-N
A
1.0
6(0
.40
-
0.8
2(0
.55
-N
A
1.5
8(0
.26
-
0.89
(0.
66 -
NA
2
.46
(1.0
5-
0.7
8(0
.63
-N
A
1.1
0(0
.82
-- 0.
67)*
- 5.
74)
- 0.
88)*
-2.6
0)
-1.2
5)
-6.4
3)
-1.1
9)
-5.5
8)*
-0.9
6)*
-1.4
8)
P-v
alu
e of
OR
<0.0
1
0.42
<0.0
1
0.81
0.32
0.39
0.39
0.04
0.02
0.54
132
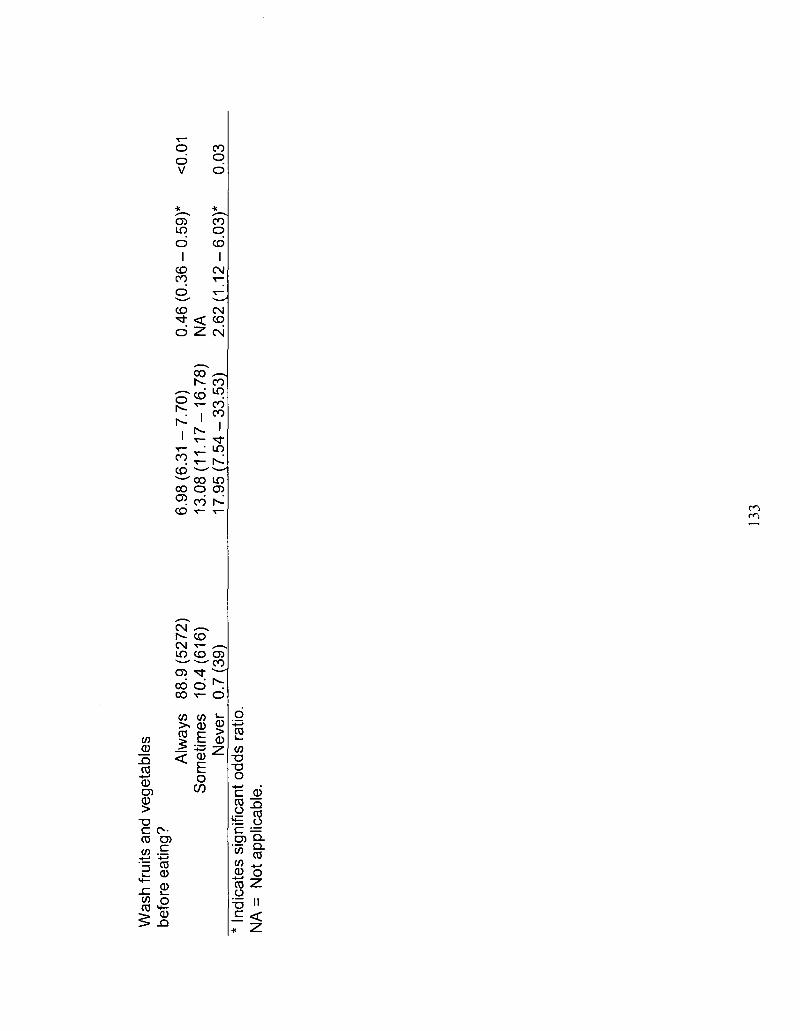
Was
h fr
uits
and
veg
etab
les
befo
re e
atin
g?
Alw
ays
88.9
(527
2)
Som
etim
es
10.4
(616
) N
ever
0
.7(3
9)
* In
dica
tes
sign
ifica
nt o
dds
ratio
. N
A =
Not
app
licab
le.
6.9
8(6
.31
-7.7
0)
0.4
6(0
.36
-0.5
9)*
<
0.01
1
3.0
8(1
1.1
7-1
6.7
8)
NA
1
7.9
5(7
.54
-33
.53
) 2
.62
(1.1
2-6
.03
)*
0-03
133
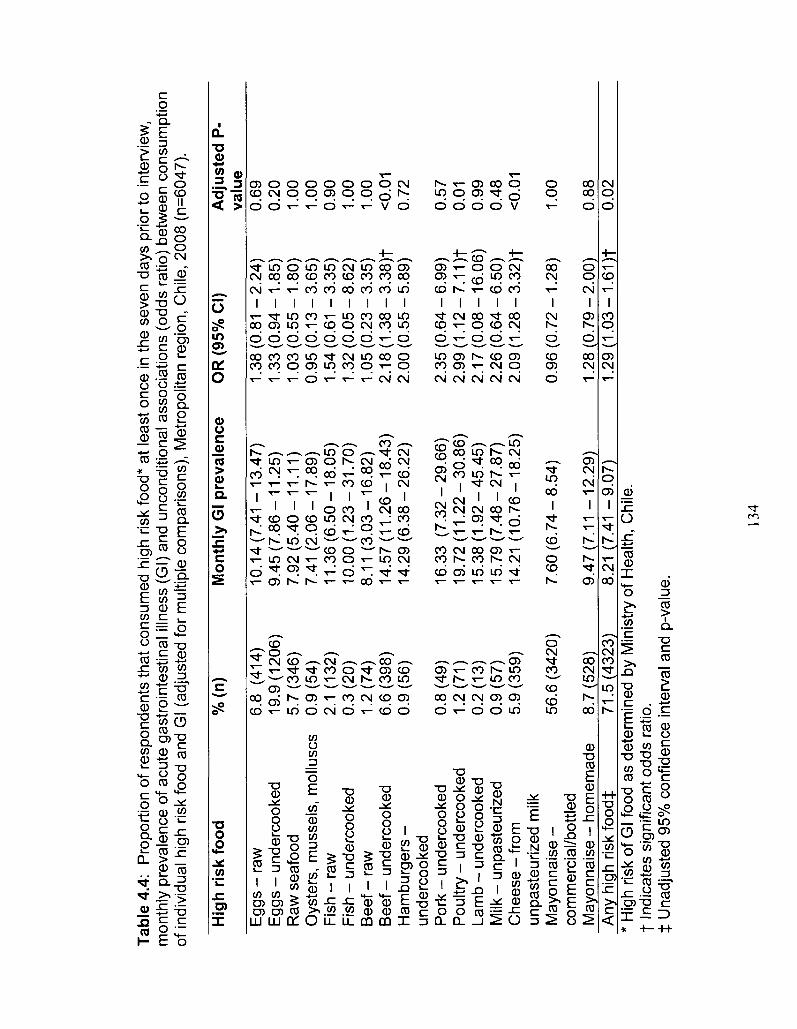
Tabl
e 4.
4:
Pro
port
ion
of r
espo
nden
ts t
hat
cons
umed
hig
h ris
k fo
od*
at le
ast
once
in th
e se
ven
days
prio
r to
int
ervi
ew,
mon
thly
pre
vale
nce
of a
cute
gas
troi
ntes
tinal
illn
ess
(Gl)
and
unco
nditi
onal
ass
ocia
tions
(od
ds r
atio
) be
twee
n co
nsum
ptio
n of
indi
vidu
al h
igh
risk
food
and
Gl (
adju
sted
for
mul
tiple
com
paris
ons)
, M
etro
polit
an r
egio
n, C
hile
, 200
8 (n
=604
7).
Hig
h r
isk
foo
d
% (n
) M
onth
ly G
l p
reva
len
ce
OR
(95
% C
I)
Ad
just
ed P
-va
lue
Egg
s -
raw
E
ggs
- un
derc
ooke
d R
aw s
eafo
od
Oys
ters
, m
usse
ls,
mol
lusc
s F
ish
- ra
w
Fis
h -
unde
rcoo
ked
Bee
f - r
aw
Bee
f -
unde
rcoo
ked
Ham
burg
ers
-un
derc
ooke
d P
ork
- un
derc
ooke
d P
oultr
y -
unde
rcoo
ked
Lam
b -
unde
rcoo
ked
Milk
-
unpa
steu
rized
C
hees
e -
from
un
past
euriz
ed m
ilk
May
onna
ise
-co
mm
erci
al/b
ottle
d M
ayon
nais
e -
hom
emad
e A
ny h
igh
risk
food
}:
6.8
(414
) 19
.9(1
206)
5.
7 (3
46)
0.9
(54)
2.
1 (1
32)
0.3
(20)
1.
2 (7
4)
6.6
(398
) 0.
9 (5
6)
0.8
(49)
1
.2(7
1)
0.2(
13)
0.9
(57)
5.
9 (3
59)
56.6
(34
20)
8.7
(528
) 71
.5(4
323)
10.1
4(7.
41 -
13
.47
) 9
.45
(7.8
6-1
1.2
5)
7.9
2(5
.40
-11
.11
) 7
.41
(2.0
6-1
7.8
9)
11
.36
(6.5
0-1
8.0
5)
10
.00
(1.2
3-3
1.7
0)
8.11
(3
.03
-16
.82
) 1
4.5
7(1
1.2
6-1
8.4
3)
14
.29
(6.3
8-2
6.2
2)
16.3
3 (7
.32
-29
.66
) 1
9.7
2(1
1.2
2-3
0.8
6)
15
.38
(1.9
2-4
5.4
5)
15
.79
(7.4
8-2
7.8
7)
14.2
1 (1
0.7
6-1
8.2
5)
7.6
0(6
.74
-8.5
4)
9.47
(7.1
1 -1
2.2
9)
8.21
(7.
41 -
9.0
7)
1.38
(0.8
1 -
1.3
3(0
.94
-1
.03
(0.5
5-
0.9
5(0
.13
-1.
54(0
.61
-1
.32
(0.0
5-
1.0
5(0
.23
-2
.18
(1.3
8-
2.0
0(0
.55
-
2.3
5(0
.64
-2
.99
(1.1
2-
2.1
7(0
.08
-2
.26
(0.6
4-
2.0
9(1
.28
-
0.96
(0.
72 -
1.2
8(0
.79
-1
.29
(1.0
3--2
.24
) -1
.85
) -1
.80
) -3
.65
) -3
.35
) -8
.62
) -
3.35
) -
3.3
8)f
-5
.89
)
-6.9
9)
-7.1
1)t
-1
6.0
6)
-6.5
0)
- 3
.32
)f
-1.2
8)
-2.0
0)
-1.6
1)t
0.69
0.
20
1.00
1.
00
0.90
1.
00
1.00
<0
.01
0.72
0.57
0.
01
0.99
0.
48
<0.0
1
1.00
0.88
0.
02
* H
igh
risk
of G
l foo
d as
det
erm
ined
by
Min
istr
y of
Hea
lth, C
hile
. f
Indi
cate
s si
gnifi
cant
odd
s ra
tio.
t U
nadj
uste
d 95
% c
onfid
ence
int
erva
l and
p-v
alue
.
134
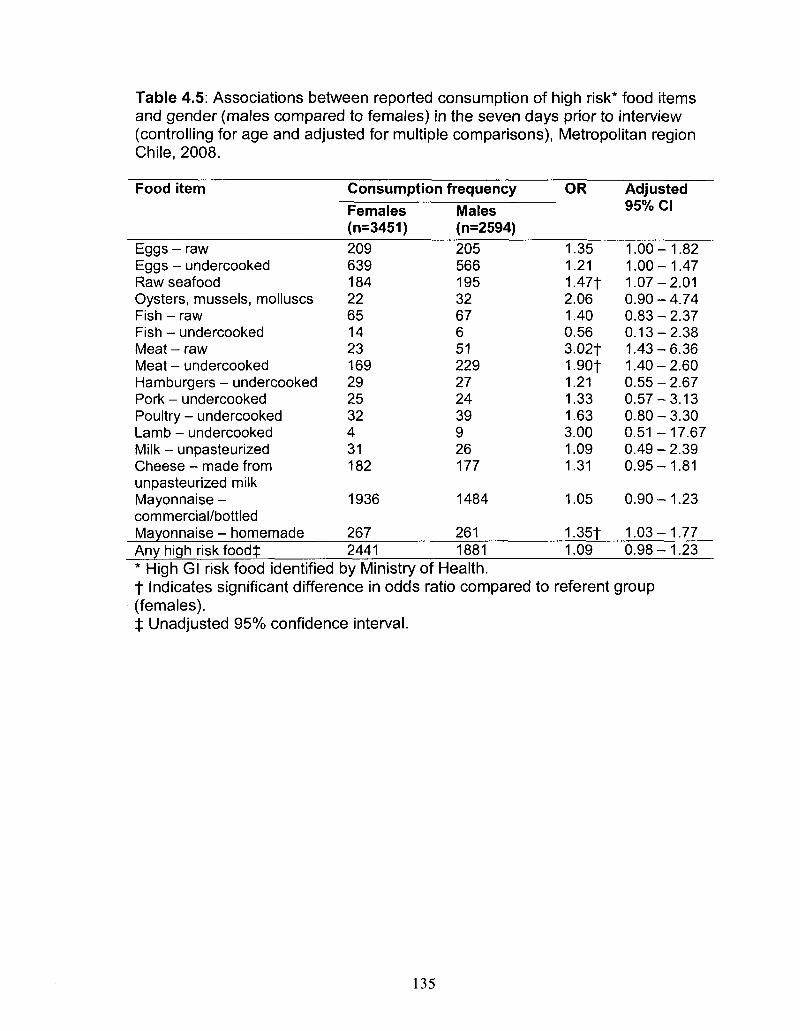
Table 4.5: Associations between reported consumption of high risk* food items and gender (males compared to females) in the seven days prior to interview (controlling for age and adjusted for multiple comparisons), Metropolitan region Chile, 2008.
Food item
Eggs - raw Eggs - undercooked Raw seafood Oysters, mussels, molluscs Fish - raw Fish - undercooked Meat - raw Meat - undercooked Hamburgers - undercooked Pork - undercooked Poultry - undercooked Lamb - undercooked Milk - unpasteurized Cheese - made from unpasteurized milk Mayonnaise -commercial/bottled Mayonnaise - homemade Any high risk foodt
Consumption Females (n=3451) 209 639 184 22 65 14 23 169 29 25 32 4 31 182
1936
267 2441
frequency
Males (n=2594) 205 566 195 32 67 6 51 229 27 24 39 9 26 177
1484
261 1881
OR
1.35 1.21 1.47t 2.06 1.40 0.56 3.02f 1.90f 1.21 1.33 1.63 3.00 1.09 1.31
1.05
1.35f 1.09
Adjusted 95% CI
1.00-1.82 1.00-1.47 1.07-2.01 0.90 - 4.74 0.83-2.37 0.13-2.38 1.43-6.36 1.40-2.60 0.55-2.67 0.57-3.13 0.80-3.30 0.51 -17.67 0.49-2.39 0.95-1.81
0.90-1.23
1.03-1.77 0.98-1.23
* High Gl risk food identified by Ministry of Health. f Indicates significant difference in odds ratio compared to referent group (females). j : Unadjusted 95% confidence interval.
135
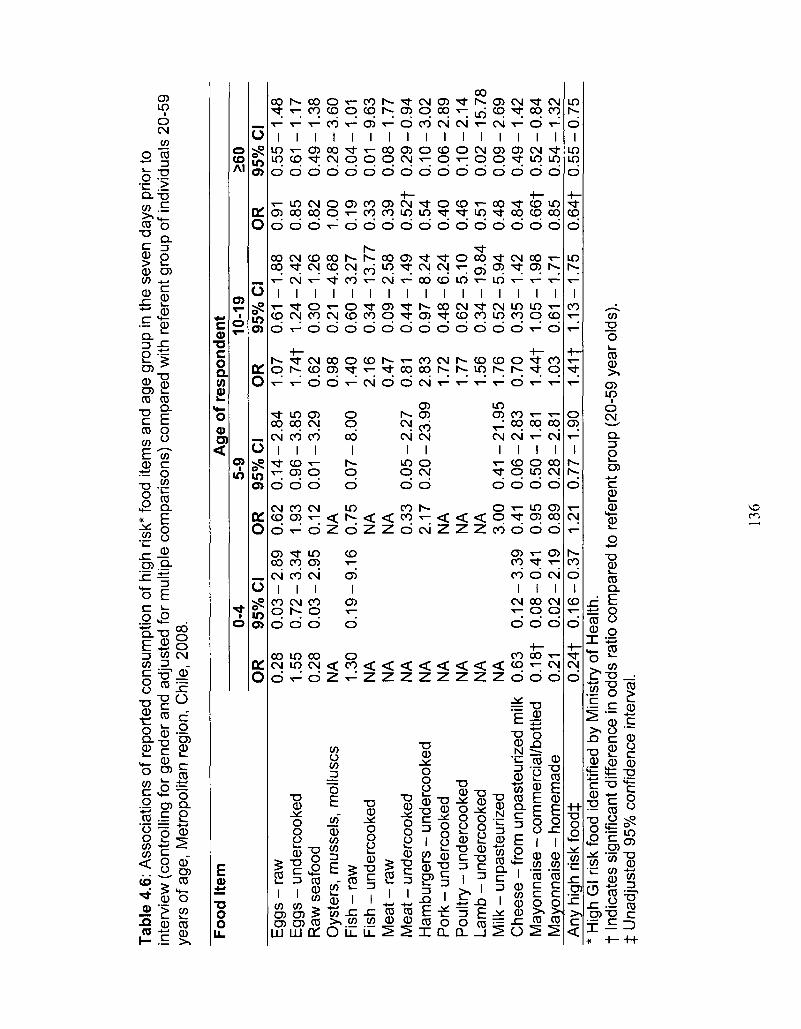
Tabl
e 4.
6: A
ssoc
iatio
ns o
f re
port
ed c
onsu
mpt
ion
of h
igh
risk*
food
item
s an
d ag
e gr
oup
in th
e se
ven
days
prio
r to
in
terv
iew
(co
ntro
lling
for
gen
der
and
adju
sted
for
mul
tiple
com
paris
ons)
com
pare
d w
ith r
efer
ent
grou
p of
indi
vidu
als
20-5
9 ye
ars
of a
ge,
Met
ropo
litan
reg
ion,
Chi
le, 2
008.
Food
Ite
m
Egg
s -
raw
E
ggs
- un
derc
ooke
d R
aw s
eafo
od
Oys
ters
, m
usse
ls,
mol
lusc
s F
ish
- ra
w
Fis
h -
unde
rcoo
ked
Mea
t - r
aw
Mea
t -
unde
rcoo
ked
Ham
burg
ers
- un
derc
ooke
d P
ork
- un
derc
ooke
d P
oultr
y -
unde
rcoo
ked
Lam
b -
unde
rcoo
ked
Milk
-
unpa
steu
rized
C
hees
e -
from
unp
aste
uriz
ed m
ilk
May
onna
ise
- co
mm
erci
al/b
ottle
d M
ayon
nais
e -
hom
emad
e A
ny h
igh
risk
foo
dt
OR
0.
28
1.55
0.
28
NA
1.
30
NA
N
A
NA
N
A
NA
N
A
NA
N
A
0.63
0.
18f
0.21
0
.24
t
0-4
95%
CI
0.0
3-
0.7
2-
0.0
3-
0.1
9-
0.1
2-
0.0
8-
0.0
2-
0.1
6--2
.89
-3.3
4 -2
.95
-9.1
6
-3.3
9 -0
.41
-2.1
9 -0
.37
OR
0.
62
1.93
0.
12
NA
0.
75
NA
N
A
0.33
2.
17
NA
N
A
NA
3.
00
0.41
0.
95
0.89
1.
21
Age
of
resp
on
den
t 5-
9 95
% C
I 0
.14
-0
.96
-0.
01-
0.0
7-
0.0
5-
0.2
0-
0.41
-0.
06-
0.50
-0.
28-
0.77
--2.8
4 -3
.85
-3.2
9
-8.0
0
-2.2
7 -
23.9
9
-21
.95
-2.8
3 -1
.81
-2.8
1 -1
.90
OR
1.
07
1.74
f 0.
62
0.98
1.
40
2.16
0.
47
0.81
2.
83
1.72
1.
77
1.56
1.
76
0.70
1.
44f
1.03
1
.41
|
10-1
9 95
% C
I 0.
61 -
1.24
-0
.30
-0.
21 -
0.6
0-
0.3
4-
0.0
9-
0.4
4-
0.9
7-
0.4
8-
0.6
2-
0.3
4-
0.5
2-
0.3
5-
1.05
-0.
61 -
1.13
--1.8
8 -2
.42
-1.2
6 -4
.68
-3.2
7 -1
3.7
7 -2
.58
-1.4
9 -8
.24
-6.2
4 -5
.10
-19
.84
-5.9
4 -1
.42
-1.9
8 -1
.71
-1.7
5
OR
0.
91
0.85
0.
82
1.00
0.
19
0.33
0.
39
0.5
2f
0.54
0.
40
0.46
0.
51
0.48
0.
84
0.6
6|
0.85
0
.64
f
>60
95%
CI
0.5
5-
0.6
1-
0.4
9-
0.2
8-
0.0
4-
0.0
1-
0.0
8-
0.2
9-
0.1
0-
0.0
6-
0.1
0-
0.0
2-
0.0
9-
0.4
9-
0.5
2-
0.5
4-
0.5
5--1
.48
-1.1
7 -1
.38
-3.6
0 -1
.01
-9.6
3 -1
.77
-0.9
4 -3
.02
-2.8
9 -2
.14
-15
.78
-2.6
9 -1
.42
-0.8
4 -1
.32
-0.7
5 *
Hig
h G
l ris
k fo
od id
entif
ied
by M
inis
try
of H
ealth
. t
Indi
cate
s si
gnifi
cant
diff
eren
ce i
n od
ds r
atio
com
pare
d to
ref
eren
t gro
up (
20-5
9 ye
ar o
lds)
. t
Una
djus
ted
95%
con
fiden
ce in
terv
al.
136
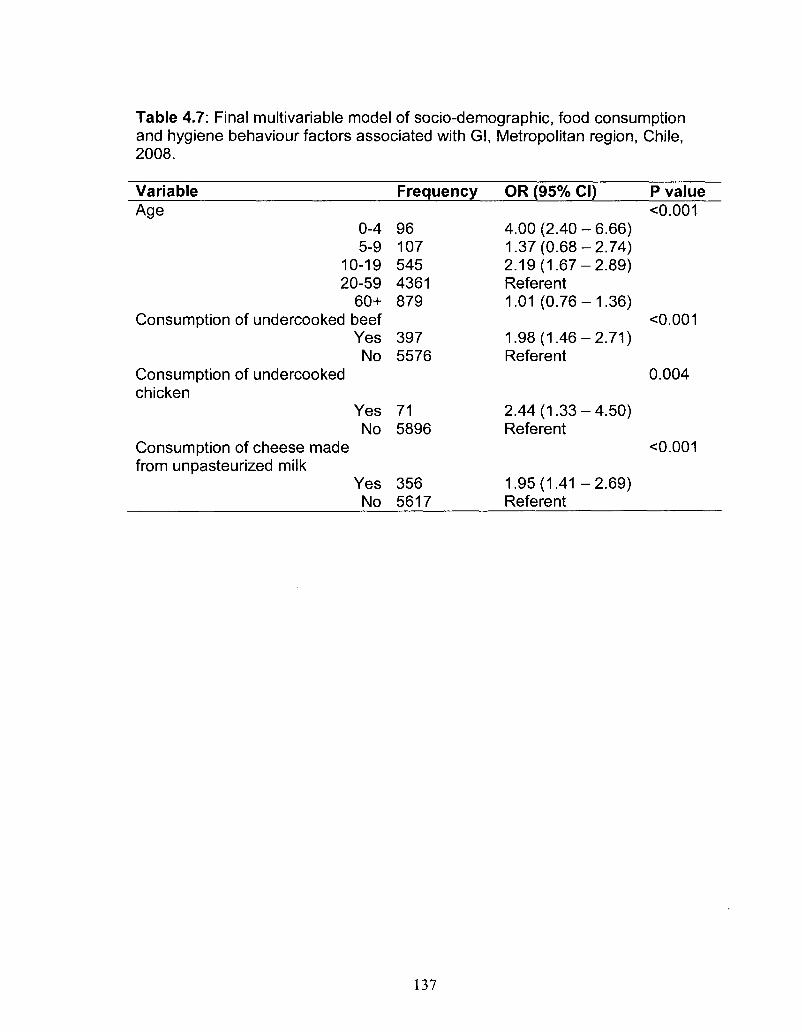
Table 4.7: Final multivariable model of socio-demographic, food consumption and hygiene behaviour factors associated with Gl, Metropolitan region, Chile, 2008.
Variable Age
0-4 5-9
10-19 20-59
60+ Consumption of undercooked beef
Yes No
Consumption of undercooked chicken
Yes No
Consumption of cheese made from unpasteurized milk
Yes No
Frequency
96 107 545 4361 879
397 5576
71 5896
356 5617
OR (95% CI)
4.00(2.40-6.66) 1.37(0.68-2.74) 2.19(1.67-2.89) Referent 1.01 (0.76-1.36)
1.98(1.46-2.71) Referent
2.44(1.33-4.50) Referent
1.95(1.41 -2.69) Referent
P value <0.001
<0.001
0.004
<0.001
137
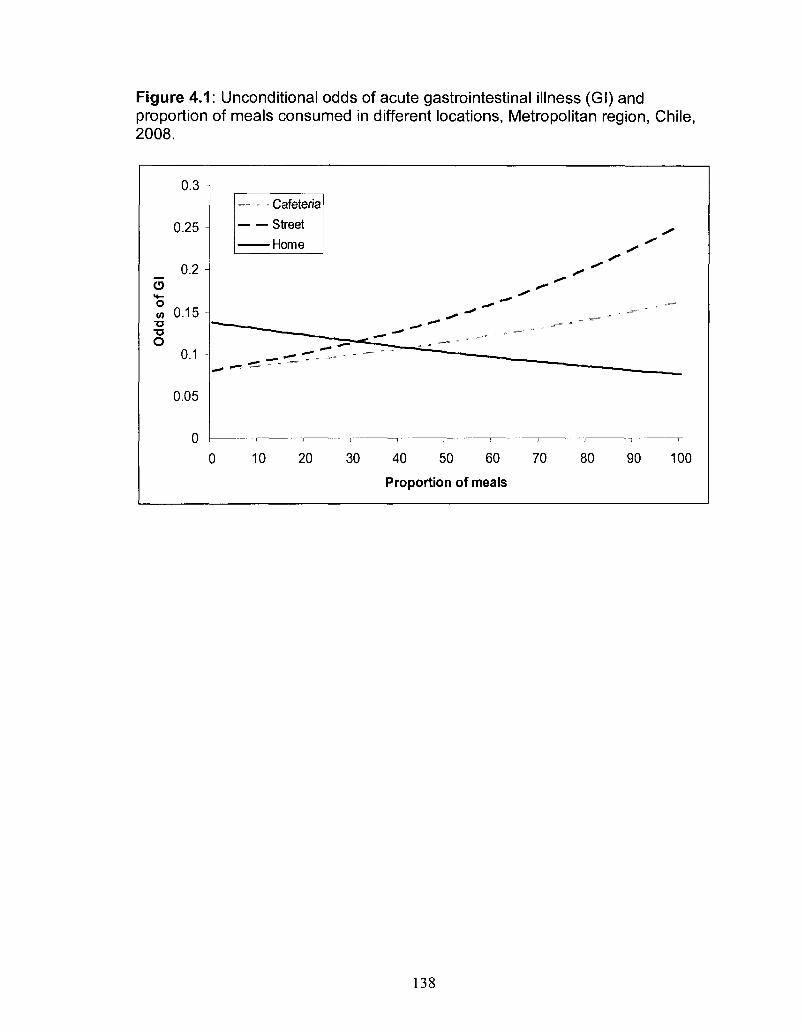
Figure 4.1: Unconditional odds of acute gastrointestinal illness (Gl) and proportion of meals consumed in different locations, Metropolitan region, Chile, 2008.
0.3 -
0.25 -
0.2 -
O > • -
° 0.15 -TJ T3 O
0.1 -
0.05
n U i
- '
— - - Cafeteria
Street
Home
^r.cr:
0 10 20 30 40 50 60 70 80 90 100
Proportion of meals
138
CHAPTER FIVE
Water consumption trends and associations with acute gastrointestinal
illness in the Metropolitan Region, Chile, 2008
Prepared for submission: BMC Public Health
Abstract
Background: An adequate, safe water supply is essential, and contaminated
water has been a global cause of morbidity and mortality. In 2008, the first
population survey on the burden of acute gastrointestinal illness (Gl) in the
Metropolitan region of Chile was conducted. The objectives of the study
presented here were to describe water consumption patterns, use of bottled
water and water treatment, and to identify associations of drinking water-related
risk factors with Gl.
Methods: A cross-sectional survey was administered door-to-door in the
Metropolitan region, Chile from 21 July to 25 August and 14 November to 21
December, 2008. Respondents were randomly selected proportional to socio
economic level stratification. Survey questions related to water consumption,
source of water, use of bottled water, water treatment and recent symptoms of
Gl.
Results: Overall, 6047 respondents participated (76% response rate). The
majority of respondents did nothing to treat their drinking water. Approximately
139
18% of respondents consumed 75% or more of their daily water as bottled water.
Males, respondents < 10 years of age, and non-bottled water users tended to
consume more water. Boiling water and increased water consumption were
associated with increased odds of Gl.
Conclusions: This study describes the water consumption patterns of the
Metropolitan region, Chile and their associations with Gl. This information
provides region-specific data that can inform quantitative microbial risk
assessments on drinking water for this population.
Background
An adequate, safe supply of water is a necessity [1, 2], and contaminated
water has been a cause of morbidity and mortality around the world, often due to
acute gastrointestinal illness (Gl)from bacteria (e.g., Campylobacter spp., Vibrio
spp.), parasites (e.g., Giardia spp., Cryptosporidium spp.) and viruses (e.g.,
hepatitis A virus) [3-13]. To minimize the adverse health impacts of
microbiological contaminants in drinking water, several control measures can be
implemented. These include boiling of potentially contaminated water in homes
prior to consumption, delivery of piped water to households and other buildings,
treating water by chlorination, sedimentation, flocculation, filtration or other
treatment procedures or devices, and commercial delivery of potable water in
containers (e.g., bottled water). At the international level the World Health
Organization (WHO) has established recommended guidelines for drinking water
quality to ensure drinking water safety and support the development and
140
implementation of waterborne risk management strategies [1]. A decision
support tool that is increasingly being promoted for use by waterborne disease
risk managers is quantitative microbial risk assessment (QMRA [1]). QMRA can
provide a structured approach for assembling scientific information that is
important for making sound drinking water risk management decisions [14].
However, to effectively conduct a QMRA on drinking water, key data are
required, including water consumption and water source information.
The WHO estimated that in 2006, 98% and 72% of the urban and rural
residents of Chile, respectively, had access to 'improved' drinking water sources
(i.e., water piped into residence or yard or public taps, wells or protected water
sources [15]). However, there is little published information related to the amount
of water consumed in Chile, how much of that water is from bottled sources, and
which water treatment methods are used at the household level.
In 2008, the first population survey on the burden of acute gastrointestinal
illness (Gl) in the Metropolitan region of Chile was conducted. This survey
included specific questions related to water consumption, source of water, and
the use of bottled water and water treatment. The objectives of the study
presented here were to describe the distribution of water consumption patterns,
use of bottled water and water treatment and to identify associations of drinking
water-related risk factors with Gl.
Materials and Methods
Population study
141
Detailed methodology of the survey is reported elsewhere (Chapter 3,
[16]). In summary, a cross-sectional, door-to-door survey of randomly selected
residents of the Metropolitan region of Chile was administered in two phases,
July 21 - August 25, 2008 (Phase 1, low Gl season) and November 14 -
December 21, 2008 (Phase 2, high Gl season). These phases were selected to
correspond with low and high Gl seasons (based on surveillance and outbreak
data for the Metropolitan region from the Ministry of Health).
The 52 neighbourhoods of the region were classified by Instituto Nacional
de Estadisticas10 according to socio-economic level into five categories. The
number of surveys administered per socio-economic category was selected
proportional to population size. Blocks within neighbourhoods were randomly
selected proportional to the number of households within each block. A
convenience sample of households was selected from within the randomly
selected block at the discretion of the surveyor in the field.
Face-to-face interviews were conducted by trained surveyors from the
region. The individual in the household with the next birthday was selected to
participate in the survey. If the selected individual declined or no one lived at the
residence, the neighboring house was selected as the replacement. If the
selected individual was under the age of 12, the parent or guardian answered the
survey on their behalf. If the selected individual was between the ages of 12 and
18, the parent, guardian or child answered the survey at the discretion of the
parent or guardian. All surveys were administered in Spanish.
Sample size
10 Instituto Nacional de Estadisticas, www.ine.cl 2009.
142
Sample sizes were calculated using Epilnfo 3.4.1 (Centers for Disease
Control and Prevention, Atlanta, Georgia, 2000). Using an expected monthly
prevalence of Gl of 8%, a 1% allowable error and a 95% confidence interval, a
target sample size of 2826 was calculated, which was rounded to 3000 surveys
per study phase for an overall total sample size of 6000 surveys.
Data collection
The survey (Appendix IV) was developed by modifying the survey tools
used previously in Argentina (Appendix I and II, Chapter 2, [17]) with reference to
other similar cross-sectional population burden of Gl studies [18-21] and water
consumption studies [22-24] as models. In addition to questions about Gl
symptoms and general socio-demographic factors, respondents were asked to
estimate the number of 250ml servings of cold water (i.e. not including water
used to make tea or coffee) they had consumed in the 24 hours prior to interview,
and to identify their source of drinking water (i.e., tap, bottled water, other), any
processes or devices used to treat their water at home (i.e., boiling, filtering,
other) and the origin of their drinking water (i.e., municipal water supply, well,
other).
Ethics
The study was approved by the Human Subjects Committee of the
University of Guelph Research Ethics Board (Guelph, Ontario, Canada) and by
the Servicio de Salud Metropolitano Oriente scientific ethics committee of the
Government of Chile. Signed, informed consent was obtained from all
participants or the parent/guardian in the event the participant was a minor.
143

Statistics
Data were manually entered into Epilnfo 3.4.1 and managed using
Microsoft Access (Microsoft Corporation, 2003). Analysis was performed using
SAS 9.1 (SAS Institute Inc., Cary North Carolina, 2004). Individuals responding
'don't know' or 'unsure' were excluded from the analysis of that question.
Respondents who consumed 75% or more of their total water intake as 'bottled
water' were classified as 'bottled water users' for analytic purposes.
Gl in a respondent was defined as experiencing symptoms of vomiting or
diarrhea in the 30 days prior to interview, where diarrhea was defined as three or
more loose stools in 24 hours. Monthly prevalence of Gl was defined as the
number of cases of Gl in the 30 days prior to interview, divided by the total
number of survey respondents.
Multivariable analyses
A manual backwards elimination procedure was used for all multivariable
models and interactions were considered. Negative binomial regression was
used for the multivariable analysis of explanatory variables associated with the
number of 250 ml servings of cold drinking water consumed, using Proc
GENMOD in SAS. All socio-demographic (age, gender, education, socio
economic level, occupation) and water-related (source of water, water treatment
use, being a bottled water user) variables and the study phase variable were
offered to the model. Two-way interactions were created using all main effect
variables which had a likelihood ratio p-value <0.05. Only variables and two-way
144
interaction terms with likelihood ratio p-values <0.01 were kept in the final model.
All variables that were initially screened out of the final model (i.e., not
considered to be confounders a priori or not statistically significant) were re
introduced to test for significance and visually assess confounding. Confounding
was considered present when a change of 30% or more, a change in sign or a
change in significance in model coefficients was observed.
Logistic regression was used for the multivariable analysis of risk factors
for Gl using Proc GENMOD in SAS. All socio-demographic (age, gender,
education, socio-economic level, occupation) and water-related (source of water,
water treatment use, being a bottled water user, number of servings of water
consumed) variables along with the study phase and health insurance system
variables were offered to the model. Two-way interactions were created among
all main effect variables, with the exception of health insurance system and water
source due to sparseness of data. Main effect variables and interactions were
kept in the model if significant (p-value <0.05, Wald's test). All variables that were
initially screened out of the final model (i.e., not considered to be confounders a
priori or not significant) were re-introduced to test for significance and visually
assess confounding, as described above. The Hosmer-Lemeshow test in SAS
was used to assess goodness of fit of the model, where a significant p-value (p-
value <0.05) indicated poor fit of the model.
Results
145
In total, 6047 surveys were completed, 3033 in phase 1 and 3014 in
phase 2 with an overall average response rate of 75.8%. The demographic
distribution of residents of the Metropolitan region, along with survey respondents
and Gl cases is presented in Table 5.1. In general, survey respondents were
older, more educated and more likely to be female than residents. The majority
of respondents received their water from the municipal water supply (99.8%).
Water treatment
In total, 6024 respondents answered questions about processes and
devices they used to treat their water. The majority indicated that they did
nothing to treat their water (82.6%), followed by boiling (12.1%), use of tap filters
(4.8%) or use of jug filters (0.4%). One respondent reported use of 'osmosis'.
Bottled water consumption
The total amount of bottled water consumed was reported by 5927
respondents. Bottled water was not consumed the day prior to interview by
53.7% (n=3184) of respondents. However 1.9% (n=110) of respondents
consumed a 'small' amount (<25% of total daily consumption) of bottled water. A
'moderate' amount (25% - 50% of total daily consumption) of bottled water was
consumed by 10.8% (n=643) of respondents. A 'large' amount (50% - 74% of
total daily consumption) of bottled water was consumed by 15.1% (n=895) of
respondents. 'Nearly all' (75% - 99% of total daily water consumption) water
consumed as bottled water was reported by 2.8% (n=166) of respondents and
146
15.7% (n=929) of respondents consumed 'all' (100% of total daily water
consumption) water as bottled water. Respondents that consumed 75% or
greater of their total water consumption as bottled water (n=1095) were classified
as 'bottled water users'. Of the 1095 'bottled water users', total water
consumption (including both bottled and other water) ranged from 1 to 24
servings (250 ml) with a median of 4 servings consumed in the day prior to
interview.
Factors associated with total water consumption
Responses regarding the amount of water consumed were received from
6025 respondents. Total daily water intake ranged from 0 to 32 servings (250
ml) per day with a median of 4 servings per day. A few respondents (n=77,
1.3%) reportedly consumed no water, 31.4% (n=1898) consumed a 'small'
amount of water (less than 4 servings), 48.8% (n=2952) consumed a 'moderate'
amount of water (between 4 and 8 servings) and 18.2% (n=1098) consumed a
'large' amount of water (8 or more servings) in the day prior to interview. In total,
93.1% of respondents said that the amount of water consumed in the 24 hours
prior to interview was the amount of water that they consume in a day on a
regular basis.
The final multivariable model of the amount of water consumed contained
the variables study phase, age, gender, socio-economic level, education,
occupation, being a bottled water user and three 2-way interaction terms (study
phase by education and by gender, and age by gender) and a 3-way interaction
147
term (study phase by socio-economic level by being a bottled water user). Table
5.2 shows the estimated mean number of servings by occupation, the only main
effect with no significant interactions, where 'general employers' consumed the
most (5.51 servings) and those who worked in the public sector consumed the
least (4.37 servings).
Figure 5.1 shows the estimated mean number of servings by gender and
study phase. Males tended to consume more servings than females; this
difference was greater in phase 2, where more servings were consumed than in
phase 1. Figure 5.2 shows the estimated mean number of servings by education
and phase. Those with higher education tended to consume more water in
phase 1 while the reverse was seen in phase 2, though the variation was smaller
across the different education levels in phase 2. Figure 5.3 shows the estimated
mean number of servings by gender and age. Respondents <10 years of age
drank more than older responders, and males consumed more than females in
all age groups except those 60 years and older. Figure 5.4 shows the estimated
mean number of servings by phase, socio-economic level and bottled water use.
Non-bottled water users typically consumed more water than bottled water users
in phase 2 and most of phase 1, though this varied by socio-economic level.
Differences in socio-economic level were greatest in phase 2. Those in the
lowest socio-economic level consumed the highest amount of water in phase 2,
while in phase 1 bottled water users in the mid-low and mid-high socio-economic
levels consumed the greatest amount of water.
148
Factors associated with acute gastrointestinal illness
In total 7.7% (n=467) of respondents experienced symptoms of Gl in the
30 days prior to interview. In the final logistic regression model with Gl as the
outcome, study phase, occupation, health system, age, water treatment, number
of portions of water consumed and the interaction of socio-economic level by
gender were significant (Table 5.3, Figure 5.5). The Hosmer-Lemeshow
goodness of fit test p-value was 0.11, indicating the model fit the data.
Those who treated their water by boiling had higher odds of Gl compared
to those did nothing to their water. For every 250 ml serving of water consumed
in the day prior to interview, the odds of Gl in the 30 days prior to interview
increased by 1.10 (95% CI 1.06, 1.13) times. Water source (p=0.37) and being a
bottled water user (p=0.76) were not significantly associated with Gl.
Of the non-water-related variables, participants surveyed in study phase 1
(low Gl season) had higher odds of Gl compared to those in study phase 2 (high
Gl season). Students had higher odds of Gl compared to housewives. Children
0-4 years and youths 10-19 years of age had the highest odds of Gl. Having no
health insurance was associated with higher odds of Gl, while those subscribing
to a private health insurance system had lower odds of Gl, compared to those
that subscribed to a public health insurance system. Females in the lowest
socio-economic level had higher odds of Gl compared to females in the highest
socio-economic level.
Discussion
149
This study reports the drinking water habits of residents of the
Metropolitan region, Chile during two time periods of 2008 and evaluates
associations among water-related factors (i.e., water source, amount of water
consumed, being a bottled water user and in-home water treatment) and Gl.
Nearly 8% of the respondents reported experiencing Gl in the 30-days
prior to interview. The amount of water consumed (number of 250 ml servings)
on the day before interview and water treatment in the home were both
significantly associated with being a case of Gl in the 30 days prior to interview.
For each serving of water consumed, the odds of Gl increased by 1.10 times, a
finding similar to a Canadian water consumption study [23]. This suggests the
possibility that there may be waterborne Gl in the community, especially in light
of an apparent dose-response relationship between the amount of water
consumed and odds of Gl. However, due to the cross-sectional study design,
and since data on water consumption pertained to the 24 hours prior to interview
while data on Gl pertained to the 30 days prior to interview, it is not possible to
be sure that increasing water consumption was causally associated with being a
case of Gl. We cannot rule out the possibility that cases of Gl consumed more
water to alleviate symptoms of their illness (e.g., dehydration).
Those who used boiling as a water treatment had increased odds of Gl.
We do not, however, believe that this means that water boiling caused Gl, rather,
we think water boiling may be an indicator of poor water quality in affected
homes, associated with a perceived potential for water contamination among
participants experiencing Gl or associated with the possible occurrence of boil
150
water advisories to control waterborne disease in regions of the community with
water treatment problems. In any case, as discussed above, due to the study
design we cannot conclude that boiling water was causally associated with being
a case of Gl. Interactions by water source could not be explored due to
sparseness of data, though water source was not significant as an individual
variable in this model and socio-economic level was controlled analytically in the
model. A Canadian study found an increase in Gl among those consuming
untreated tap water compared to filtered tap water [25], while a recent study in
the USA found no association of endemic cryptosporidiosis with drinking filtered,
bottled or plain water compared to boiled water [26], underscoring the need for
further investigation into the association of type of water treatment and water
consumption with Gl in the general population.
Respondents in phase 1 had modestly higher odds of Gl compared to
respondents in phase 2, controlling for other variables in the model. The time
period for study phase 1 took place within the 'low Gl season' in the Metropolitan
region, Chile, thus, this finding is somewhat surprising. The water consumption
patterns reported here may in part explain this result. We found that the amount
of water consumed was greater in phase 2 than phase 1 and that increasing
water consumption was associated with Gl. It is possible that the increased
water consumption in phase 2 may in part explain the typical seasonal pattern of
Gl seen in this population and that by including water consumption in the
multivariable model we have, in part, accounted for the Gl seasonality.
Additional explanations could be that the typical Gl seasonality is due to certain
151
pathogens (e.g., bacteria) that are more often reported than others (e.g., viruses)
and their inherent seasonality. Thus what is captured by surveillance and used to
determine 'high' and 'low' Gl season reflects seasonality of certain Gl-related
pathogens rather than seasonality of Gl caused by all pathogens. Moreover, it is
possible that severe cases of Gl that may be more likely to occur in the high Gl
season (phase 2) were hospitalized and thus not captured in the survey. Further
investigation of this association is needed.
More detailed discussion about the socio-demographic and health
insurance system associations with Gl is discussed elsewhere (Chapter 3, [16]).
In brief, children 0-4 years of age and youths 10-19 years of age had increased
odds of Gl, and this is similar to findings in other studies [18-21, 27-29].
Children's behaviour may increase their exposure to pathogens through
environment and person-to-person contact [30] and we found that youths 10-19
years of age were more likely to consume high Gl risk food than adults 20-59
years of age in our analysis of risk factors for Gl related to food consumption
trends, food purchasing and hygiene habits (Chapter 4).
Students had higher odds of Gl compared to housewives, adjusting for
age. This may in part be attributed to food choices as well as the phenomenon
of 'second weaning', where individuals in this age group are beginning to cook
food for themselves and move out of the family home. In Ireland, increased odds
of Gl was observed among professional/non-manual occupations compared to
skilled/unskilled manual occupations [29], and in Cuba [18] health service and
administrative occupations were at increased odds of Gl compared to being a
152
housewife, although there was no difference in odds of Gl between housewives
and students, as was found in this study. Direct comparison of these results is
difficult due to differences in occupation categorization; however, these results
may be evidence of country-specific differences in risk of Gl related to
occupation.
Respondents without health insurance had higher odds of Gl and those
subscribing to private health insurance had lower odds of Gl compared to those
subscribing to the public health insurance system. This is similar to studies in the
United States where a lack of medical insurance was associated with Gl [28].
This may in part reflect differences in socio-economic level. Furthermore,
significant interaction of gender and socio-economic level indicated that females
in the lowest socio-economic level had the highest odds of Gl. Increase odds of
Gl were found among low income females in Canada [31] and in low income
households in developing countries [32-34].
The median number of servings (250 ml) of water consumed was 4 with a
range of 0 to 32 servings. This result is similar to those from water consumption
studies from Canada where the median number of servings was twice reported
as 4 (250 ml servings) [22, 23] and the mean volume of water consumed was
1.39L [24]. The multiple significant interactions and variables in the final model
predicting the amount of water consumed underline the complexity in the factors
associated with water consumption. In general, the number of servings
consumed was higher among males, respondents less than 10 years old, non-
bottled water users, respondents in phase 2 of the study, those with a higher
153
level of education in phase 1, and those in the lower socio-economic levels in
phase 2. Water consumption studies from Canada, Sweden and Italy found that
increased water consumption was associated with being female [23, 24, 35] and
being a bottled water user [23, 24] all of which are opposite to the findings
reported here. These study differences may indicate country-specific or cultural
variations in water consumption patterns, including preference for bottled water
that may reflect necessity (i.e., lack of potable water) in some locations versus
convenience, and factors that affect amount of water consumed. This
underscores the need for population-specific estimates to ensure accuracy in risk
assessments.
Furthermore, decreasing age was associated with increased water
consumption as was seen in Canadian studies [22, 23] but adults 70 years and
older and 65 years and older consumed the largest amount of water in Sweden
[35] and Italy [36], respectively. Additionally, the use of water treatment devices
was significantly associated with increased consumption of water in Canada [22,
23] in contrast to the results of this study. Once again, these international
differences highlight the need for population and region-specific estimates.
Increased level of education was associated with increased water
consumption in phase 1, as was also observed in Canadian studies [22-24], and
in the United States where more educated, older adults were more likely than
younger and less educated adults to have a healthy diet pattern including high
water consumption [37].
154
Within-home water treatment was not practiced by over 80% of
respondents in this study. Furthermore, no bottled water was consumed in the
day prior to interview by more than half (54%) of the respondents, while 18% of
respondents were classified as bottled water users, consuming 75% or more of
their total daily water intake as bottled water. This may be a reflection of the high
proportion of respondents with a municipal water supply assumed to be of
adequate quality, or the potential lack of in-home water filtration devices available
and affordable for the general population in Chile. In Canadian water
consumption studies, roughly 50% of respondents did not employ in-home water
treatment, while the bottled water results are similar to those presented here [22-
24]. This information could be used in waterborne disease and drinking water-
related risk assessments to better describe the potential exposures of specific
populations.
Potential limitations of this study include the inability to evaluate the role of
unmeasured variables such as participant weight, physical activity, and health
condition as well as weather conditions which may have contributed to a more
complete model of the key determinants of water consumption. Water-related
survey questions pertained to 'cold' water consumption and did not include tea or
coffee or other hot beverages because we assumed that boiling would affect the
probabilities of exposure to waterborne microbiological hazards. Future studies
may wish to include consumption of these other types of water to assess
exposure to other types of hazards (e.g., chemicals, heavy metals etc.). Though
93% of respondents claimed that the reported amount of water consumed in the
155
day prior to interview reflected their normal daily consumption, it is likely that a 24
hour recall does not fully capture water consumption patterns, which is another
limitation of this study.
Conclusions
In conclusion, this study provides insight into the water consumption
patterns of the general population in the Metropolitan region, Chile, and its
associations with Gl. Average daily water consumption was 1.2 I. Age, gender,
socio-economic level, education, occupation, being a bottled water user and
study phase all were significantly associated with number of servings of water
consumed. Approximately 8% of the survey population experienced symptoms
of Gl in the 30 days prior to interview. In addition to socio-demographic, study
phase and health insurance system variables, the use of water treatment (i.e.,
boiling) and increasing amount of water consumed were associated with Gl. The
majority of respondents received water from a municipal water supply and did not
treat their water. Bottled water use was common in less than one quarter of the
respondents. This information can be used by waterbome disease risk
managers and public health officials to better describe and understand potential
drinking water health hazards.
156
References
1. World Health Organization: Guidelines for Drinking-water quality, incorporating first and second addenda. Volume 1 Recommendations. 2008:515.
2. World Health Organization, UNICEF: Meeting the MDG drinking water and sanitation target: the urban and rural challenge of the decade. 2006:42.
3. Yoder JS, Hlavsa MC, Craun GF, Hill V, Roberts V, Yu PA, Hicks LA, Alexander NT, Calderon RL, Roy SL, Beach MJ, Centers for Disease Control and Prevention (CDC): Surveillance for waterborne disease and outbreaks associated with recreational water use and other aquatic facility-associated health events-United States, 2005-2006. MMWR Surveill Summ 2008, 57(9):1-29.
4. Yoder J, Roberts V, Craun GF, Hill V, Hicks LA, Alexander NT, Radke V, Calderon RL, Hlavsa MC, Beach MJ, Roy SL, Centers for Disease Control and Prevention (CDC): Surveillance for waterborne disease and outbreaks associated with drinking water and water not intended for drinking-United States, 2005-2006. MMWR Surveill Summ 2008, 57(9):39-62.
5. Sailaja B, Murhekar MV, Hutin YJ, Kuruva S, Murthy SP, Reddy KS, Rao GM, Gupte MD: Outbreak of waterborne hepatitis E in Hyderabad, India, 2005. Epidemiol Infect 2009, 137(2):234-240.
6. Franklin LJ, Fielding JE, Gregory J, Gullan L, Lightfoot D, Poznanski SY, Vally H: An outbreak of Salmonella Typhimurium 9 at a school camp linked to contamination of rainwater tanks. Epidemiol Infect 2009, 137(3):434-440.
7. Bhunia R, Hutin Y, Ramakrishnan R, Pal N, Sen T, Murhekar M: A typhoid fever outbreak in a slum of South Dumdum municipality, West Bengal, India, 2007: evidence for foodborne and waterborne transmission. BMC Public Health 2009, 9:115.
8. Jones JL, Dubey JP: Waterborne toxoplasmosis - Recent developments. Exp Parasitol 2009, .
9. Centers for Disease Control and Prevention (CDC): Outbreak of cryptosporidiosis associated with a splash park - Idaho, 2007. MMWR Morb Mortal Wkly Rep 2009, 58(22):615-618.
10. Hrudey SE, Payment P, Huck PM, Gillham RW, Hrudey EJ: A fatal waterborne disease epidemic in Walkerton, Ontario: comparison with other
157
waterborne outbreaks in the developed world. Water Sci Technol 2003, 47(3):7-14.
11. Hewitt J, Bell D, Simmons GC, Rivera-Aban M, Wolf S, Greening GE: Gastroenteritis outbreak caused by waterborne norovirus at a New Zealand ski resort. Appl Environ Microbiol 2007, 73(24):7853-7857.
12. Kopilovic B, Ucakar V, Koren N, Krek M, Kraigher A: Waterborne outbreak of acute gastroenteritis in a costal area in Slovenia in June and July 2008. Euro Surveill 2008, 13(34):18957.
13. Jakopanec I, Borgen K, Void L, Lund H, Forseth T, Hannula R, Nygard K: A large waterborne outbreak of campylobacteriosis in Norway: the need to focus on distribution system safety. BMC Infect Dis 2008, 8:128.
14. Walls I, International Life Sciences Institute Research Foundation: Framework for identification and collection of data useful for risk assessments of microbial foodborne or waterborne hazards: a report from the International Life Sciences Institute Research Foundation Advisory Committee on data collection for microbial risk assessment. J Food Prot 2007, 70(7):1744-1751.
15. UNICEF, World Health Organization: Progress on drinking water and sanitation. Special focus on sanitation. 2008, :.
16. Thomas MK, Perez E, Majowicz SE, Reid-Smith R, Olea A, Diaz J, Solari V, McEwen SA: Burden of acute gastrointestinal illness in the Metropolitan region, Chile, 2008. Epidemiol Infect (Accepted 2010).
17. Thomas MK, Perez E, Majowicz SE, Reid-Smith R, Albil S, Monteverde M, McEwen SA: Burden of acute gastrointestinal illness in Galvez, Argentina, 2007. J Health Popul Nutr. 2010; 28:149-158.
18. Aguiar Prieto P, Finley RL, Muchaal PK, Guerin MT, Isaacs S, Castro Dominguez A, Gisele Coutin M, Perez E: Burden of self-reported acute gastrointestinal illness in Cuba. J Health Popul Nutr 2009, 27:345-57.
19. Majowicz SE, Dore K, Flint JA, Edge VL, Read S, Buffett MC, McEwen S, McNab WB, Stacey D, Sockett P, Wilson JB: Magnitude and distribution of acute, self-reported gastrointestinal illness in a Canadian community. Epidemiol Infect 2004,132(4):607-617.
20. Thomas MK, Majowicz SE, MacDougall L, Sockett PN, Kovacs SJ, Fyfe M, Edge VL, Flint JA, Henson S, Jones AQ: Population distribution and burden
158
of acute gastrointestinal illness in British Columbia, Canada. BMC Public Health 2006, 6:307.
21. Sargeant JM, Majowicz SE, Snelgrove J: The burden of acute gastrointestinal illness in Ontario, Canada, 2005-2006. Epidemiol Infect 2008;136(4):451-460.
22. Jones AQ, Dewey CE, Dore K, Majowicz SE, McEwen SA, Waltner-Toews D: Drinking water consumption patterns of residents in a Canadian community. J Water Health 2006, 4(1 ):125-138.
23. Jones AQ, Majowicz SE, Edge VL, Thomas MK, MacDougall L, Fyfe M, Atashband S, Kovacs SJ: Drinking water consumption patterns in British Columbia: an investigation of associations with demographic factors and acute gastrointestinal illness. Sci Total Environ 2007, 388(1 -3):54-65.
24. Pintar KD, Waltner-Toews D, Charron D, Pollari F, Fazil A, McEwen SA, Nesbitt A, Majowicz S: Water consumption habits of a south-western Ontario community. J Water Health 2009, 7(2):276-292.
25. Payment P, Richardson L, Siemiatycki J, Dewar R, Edwardes M, Franco E: A randomized trial to evaluate the risk of gastrointestinal disease due to consumption of drinking water meeting current microbiological standards. Am J Public Health 1991, 81(6):703-708.
26. Khalakdina A, Vugia DJ, Nadle J, Rothrock GA, Colford JM.Jr: Is drinking water a risk factor for endemic cryptosporidiosis? A case-control study in the immunocompetent general population of the San Francisco Bay Area. BMC Public Health 2003, 3:11.
27. de Wit MA, Koopmans MP, Kortbeek LM, Wannet WJ, Vinje J, van Leusden F, Bartelds Al, van Duynhoven YT: Sensor, a population-based cohort study on gastroenteritis in the Netherlands: incidence and etiology. Am J Epidemiol 2001, 154(7):666-674.
28. Jones TF, McMillian MB, Scallan E, Frenzen PD, Cronquist AB, Thomas S, Angulo FJ: A population-based estimate of the substantial burden of diarrhoeal disease in the United States; FoodNet, 1996-2003. Epidemiol Infect 2007, 135(2):293-301.
29. Scallan E, Fitzgerald M, Collins C, Crowley D, Daly L, Devine M, Igoe D, Quigley T, Robinson T, Smyth B: Acute gastroenteritis in northern Ireland and the Republic of Ireland: a telephone survey. Commun Dis Public Health 2004, 7(1 ):61-67.
159
30. Hall GV, Kirk MD, Ashbolt R, Stafford R, Lalor K: Frequency of infectious gastrointestinal illness in Australia, 2002: regional, seasonal and demographic variation. Epidemiol Infect 2006, 134(1 ):111-118.
31. Majowicz SE, Horrocks J, Booking K: Demographic determinants of acute gastrointestinal illness in Canada: a population study. BMC Public Health 2007,7:162.
32. Woldemicael G: Diarrhoeal morbidity among young children in Eritrea: environmental and socioeconomic determinants. J Health Popul Nutr 2001, 19(2):83-90.
33. Hatt LE, Waters HR: Determinants of child morbidity in Latin America: a pooled analysis of interactions between parental education and economic status. Soc Sci Med 2006, 62(2):375-386.
34. Genser B, Strina A, Teles CA, Prado MS, Barreto ML: Risk factors for childhood diarrhea incidence: dynamic analysis of a longitudinal study. Epidemiology 2006, 17(6):658-667.
35. Westrell T, Andersson Y, Stenstrom TA: Drinking water consumption patterns in Sweden. J Water Health 2006, 4(4):511-522.
36. Turrini A, Saba A, Perrone D, Cialfa E, D'Amicis A: Food consumption patterns in Italy: the INN-CA Study 1994-1996. Eur J Clin Nutr 2001, 55(7):571-588.
37. Popkin BM, Barclay DV, Nielsen SJ: Water and food consumption patterns of U.S. adults from 1999 to 2001. Obes Res 2005,13(12):2146-2152.
160
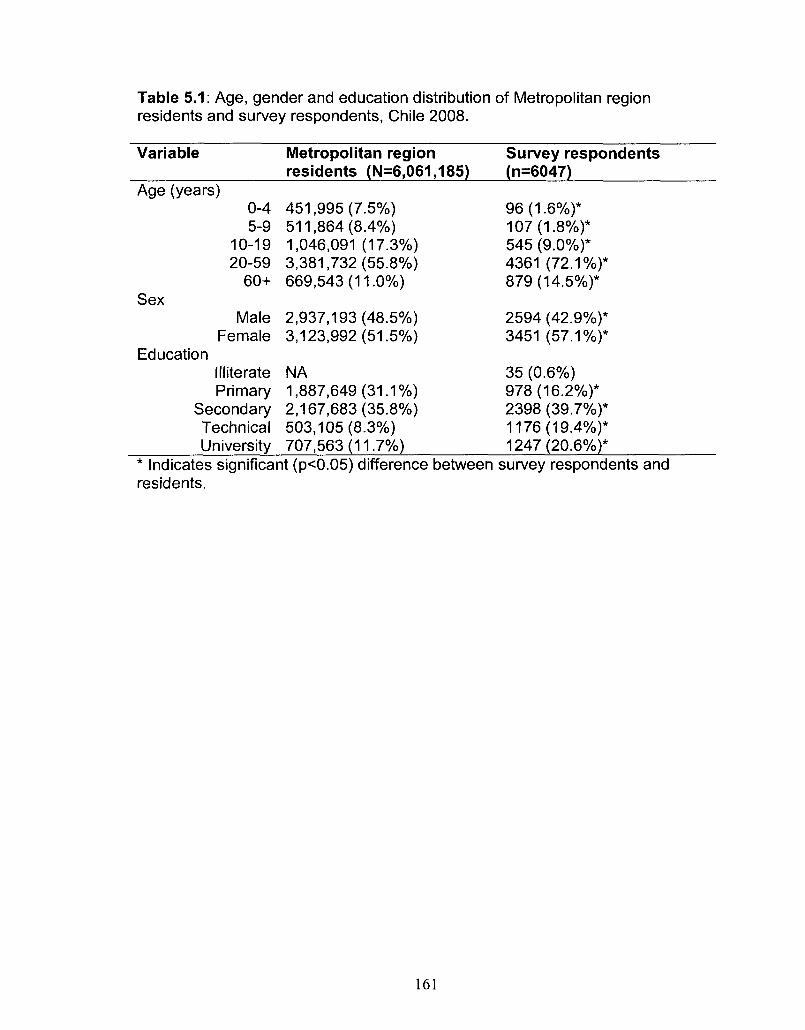
Table 5.1: Age, gender and education distribution of Metropolitan region residents and survey respondents, Chile 2008.
Variable
Age (years) 0-4 5-9
10-19 20-59
60+ Sex
Male Female
Education Illiterate Primary
Secondary Technical University
Metropolitan region residents (N=6,061,185)
451,995 (7.5%) 511,864 (8.4%) 1,046,091 (17.3%) 3,381,732(55.8%) 669,543(11.0%)
2,937,193(48.5%) 3,123,992(51.5%)
NA 1,887,649(31.1%) 2,167,683(35.8%) 503,105(8.3%) 707,563(11.7%)
Survey respondents (n=6047)
96(1.6%)* 107(1.8%)* 545 (9.0%)* 4361 (72.1%)* 879(14.5%)*
2594 (42.9%)* 3451 (57.1%)*
35 (0.6%) 978(16.2%)* 2398 (39.7%)* 1176(19.4%)* 1247(20.6%)*
* Indicates significant (p<0.05) difference between survey respondents and residents.
161
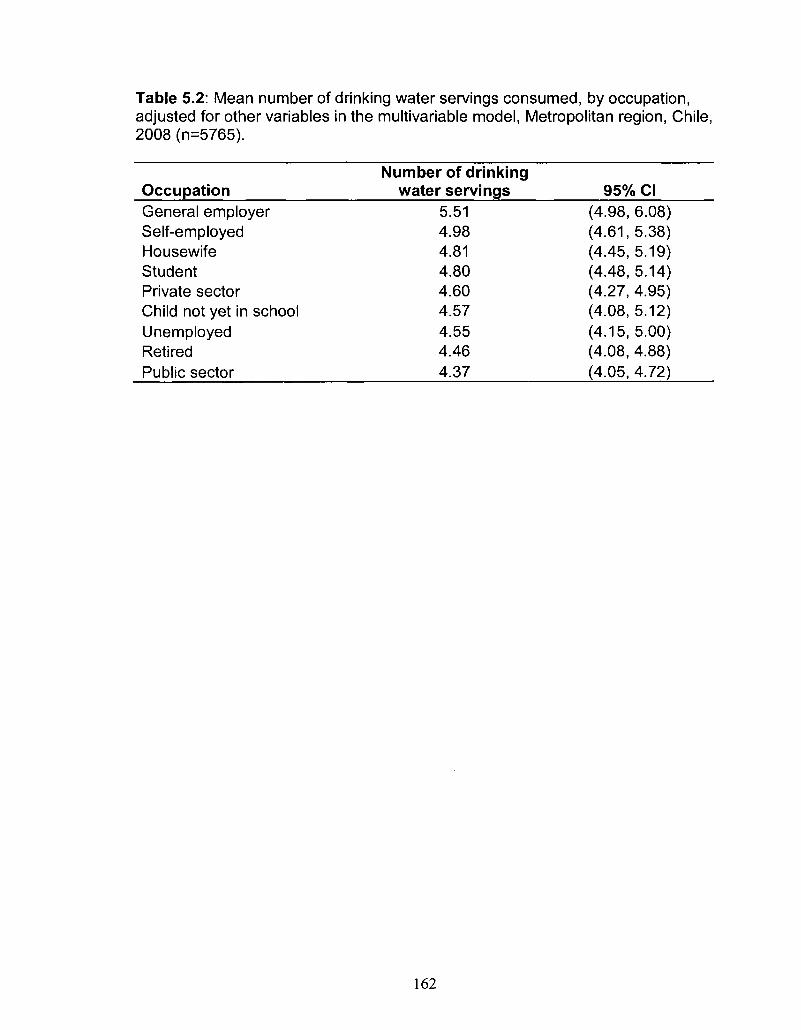
Table 5.2: Mean number of drinking water servings consumed, by occupation, adjusted for other variables in the multivariable model, Metropolitan region, Chile, 2008 (n=5765).
Occupation General employer Self-employed Housewife Student Private sector Child not yet in school Unemployed Retired Public sector
Number of drinking water servings
5.51 4.98 4.81 4.80 4.60 4.57 4.55 4.46 4.37
95% CI (4.98, 6.08) (4.61,5.38) (4.45, 5.19) (4.48, 5.14) (4.27, 4.95) (4.08, 5.12) (4.15,5.00) (4.08, 4.88) (4.05, 4.72)
162
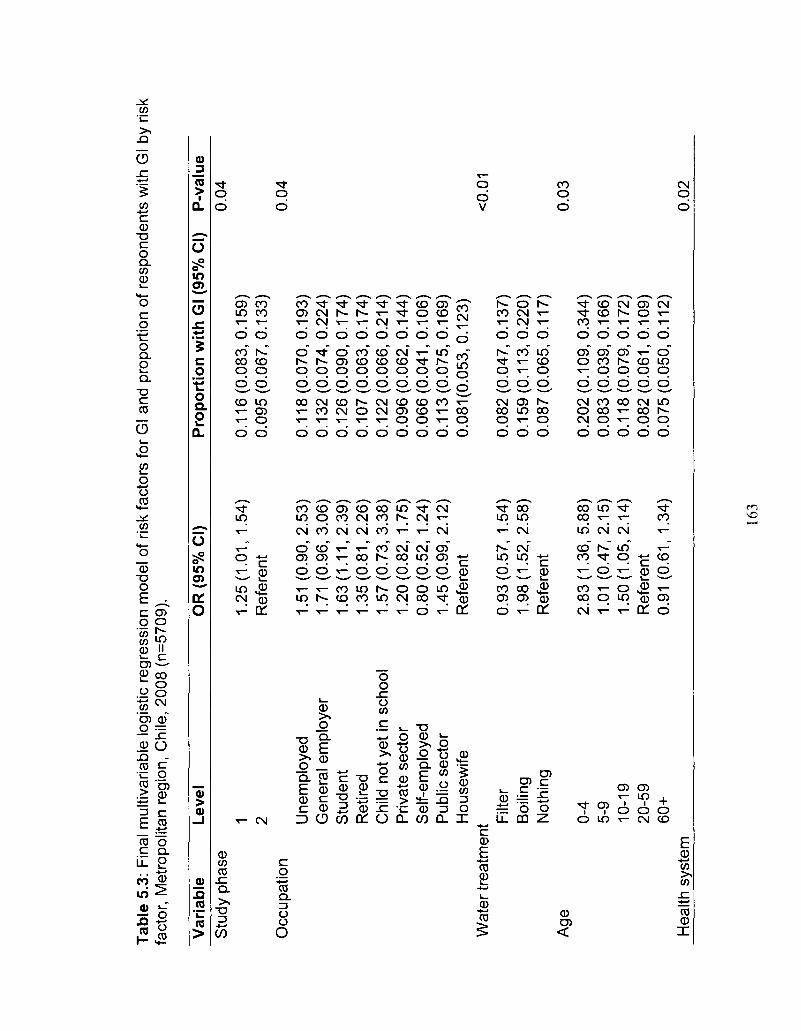
Tab
le 5
.3:
Fin
al m
ultiv
aria
ble
logi
stic
reg
ress
ion
mod
el o
f ris
k fa
ctor
s fo
r G
l and
pro
port
ion
of r
espo
nden
ts w
ith G
l by
risk
fact
or,
Met
ropo
litan
reg
ion,
Chi
le, 2
008
(n=5
709)
.
Var
iab
le
Leve
l O
R (
95%
CI)
P
rop
ort
ion
wit
h G
l (95
% C
I)
P-v
alu
e S
tudy
pha
se
Occ
upat
ion
1 2 Une
mpl
oyed
G
ener
al e
mpl
oyer
S
tude
nt
Ret
ired
Chi
ld n
ot ye
t in
sch
ool
Priv
ate
sect
or
Sel
f-em
ploy
ed
Pub
lic s
ecto
r H
ouse
wife
W
ater
tre
atm
ent
Age
Hea
lth s
yste
m
Filt
er
Boi
ling
Not
hing
0-4
5-9
10-1
9 20
-59
60+
1.25
(1.0
1, 1
.54)
R
efer
ent
1.51
(0.
90,2
.53)
1.
71 (
0.96
,3.0
6)
1.6
3(1
.11
,2.3
9)
1.3
5(0
.81
,2.2
6)
1.5
7(0
.73
,3.3
8)
1.20
(0.8
2, 1
.75)
0.
80(0
.52,
1.2
4)
1.4
5(0
.99
,2.1
2)
Ref
eren
t
0.93
(0.5
7, 1
.54)
1
.98
(1.5
2,2
.58
) R
efer
ent
2.8
3(1
.36
,5.8
8)
1.01
(0.
47,2
.15)
1
.50
(1.0
5,2
.14
) R
efer
ent
0.91
(0.
61, 1.
34)
0.1
16
(0.0
83
,0.1
59
) 0
.09
5(0
.06
7,0
.13
3)
0.1
18
(0.0
70
,0.1
93
) 0
.13
2(0
.07
4,0
.22
4)
0.1
26
(0.0
90
,0.1
74
) 0
.10
7(0
.06
3,0
.17
4)
0.1
22
(0.0
66
,0.2
14
) 0
.09
6(0
.06
2,0
.14
4)
0.0
66
(0.0
41
,0.1
06
) 0
.11
3(0
.07
5,0
.16
9)
0.0
81
(0.0
53
,0.1
23
)
0.0
82
(0.0
47
,0.1
37
) 0
.15
9(0
.11
3,0
.22
0)
0.0
87
(0.0
65
,0.1
17
)
0.2
02
(0.1
09
,0.3
44
) 0
.08
3(0
.03
9,0
.16
6)
0.1
18
(0.0
79
,0.1
72
) 0
.08
2(0
.06
1,0
.10
9)
0.0
75
(0.0
50
,0.1
12
)
0.04
0.04
<0.
01
0.03
0.02
163
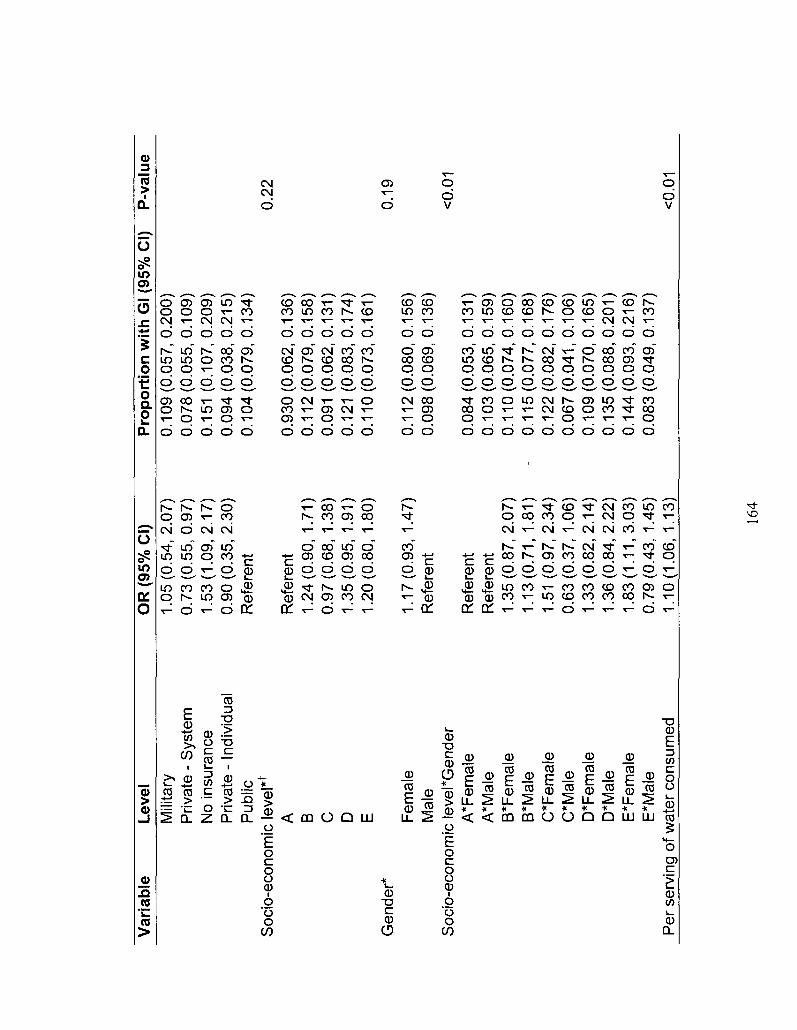
Var
iab
le
Lev
el
OR
(95
% C
I)
Pro
po
rtio
n w
ith
Gl (
95%
CI)
P-v
alu
e M
ilita
ry
Priv
ate
- S
yste
m
No
insu
ranc
e P
rivat
e -
Indi
vidu
al
Pub
lic
Soc
io-e
cono
mic
leve
l*f
A
B
C
D
E
Gen
der*
F
emal
e M
ale
Soc
io-e
cono
mic
leve
l*G
ende
r A
*Fem
ale
A*M
ale
B*F
emal
e B
*Mal
e C
*Fem
ale
C*M
ale
D*F
emal
e D
*Mal
e E
*Fem
ale
E*M
ale
Per
ser
ving
of w
ater
con
sum
ed
1.0
5(0
.54
,2.0
7)
0.7
3(0
.55
,0.9
7)
1.5
3(1
.09
,2.1
7)
0.90
(0.
35, 2
.30)
R
efer
ent
Ref
eren
t 1.
24(0
.90,
1.7
1)
0.9
7(0
.68
, 1.
38)
1.35
(0.9
5, 1
.91)
1.
20(0
.80,
1.8
0)
1.17
(0.9
3, 1
.47)
R
efer
ent
Ref
eren
t R
efer
ent
1.3
5(0
.87
,2.0
7)
1.1
3(0
.71
,1.8
1)
1.51
(0
.97
,2.3
4)
0.6
3(0
.37
, 1.
06)
1.3
3(0
.82
,2.1
4)
1.3
6(0
.84
,2.2
2)
1.8
3(1
.11
,3.0
3)
0.7
9(0
.43
, 1.
45)
1.10
(1.0
6, 1
.13)
0.1
09
(0.0
57
,0.2
00
) 0
.07
8(0
.05
5,0
.10
9)
0.15
1 (0
.107
,0.2
09)
0.0
94
(0.0
38
,0.2
15
) 0
.10
4(0
.07
9,0
.13
4)
0.9
30
(0.0
62
,0.1
36
) 0
.11
2(0
.07
9,0
.15
8)
0.09
1 (0
.062
,0.1
31)
0.12
1 (0
.083
,0.1
74)
0.1
10
(0.0
73
,0.1
61
)
0.1
12
(0.0
80
,0.1
56
) 0
.09
8(0
.06
9,0
.13
6)
0.0
84
(0.0
53
,0.1
31
) 0
.10
3(0
.06
5,0
.15
9)
0.1
10
(0.0
74
,0.1
60
) 0
.11
5(0
.07
7,0
.16
8)
0.1
22
(0.0
82
,0.1
76
) 0
.06
7(0
.04
1,0
.10
6)
0.1
09
(0.0
70
,0.1
65
) 0
.13
5(0
.08
8,0
.20
1)
0.1
44
(0.0
93
,0.2
16
) 0
.08
3(0
.04
9,0
.13
7)
0.22
0.19
<0.0
1
<0.0
1
164
* V
aria
bles
par
t of
inte
ract
ion
term
. t
Soc
io-e
cono
mic
lev
el, w
ith A
= H
igh
and
E=L
ow.
165
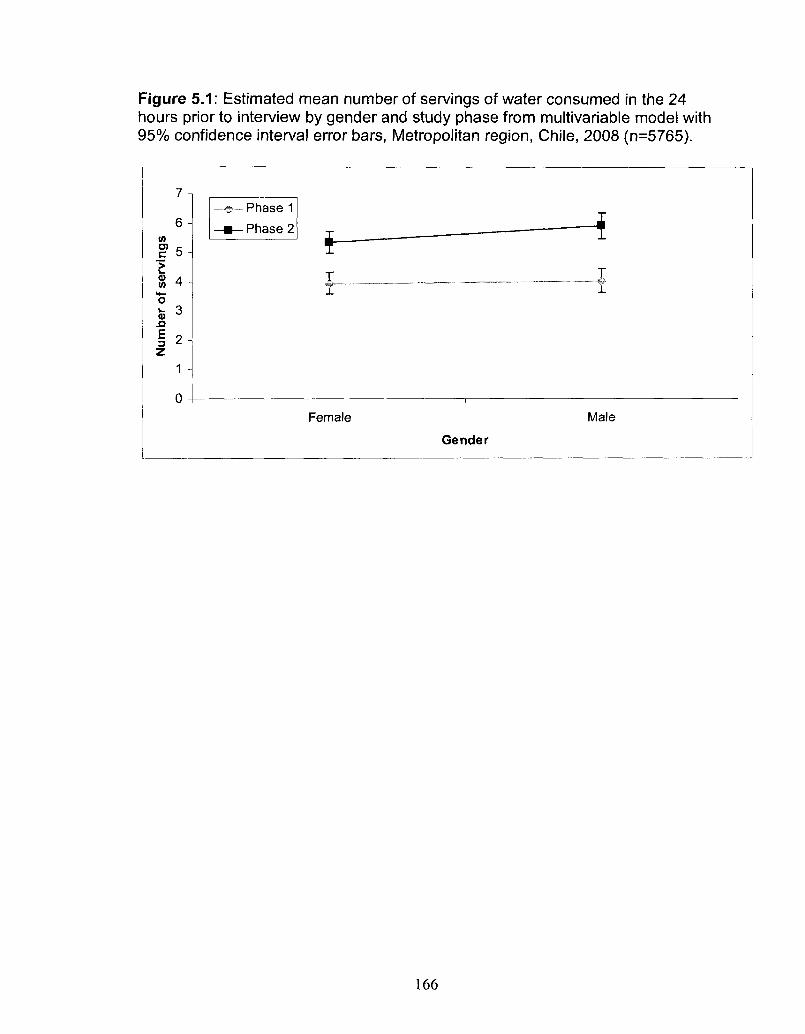
Figure 5.1: Estimated mean number of servings of water consumed in the 24 hours prior to interview by gender and study phase from multivariable model with 95% confidence interval error bars, Metropolitan region, Chile, 2008 (n=5765).
D) C
E w
n E 3 Z
6 -
5 -
4 -
3
2
1 -
0 -
«!!• Phase 1
-•—Phase 2 i i — -
• — i
— -i
Female Male
Gender
166
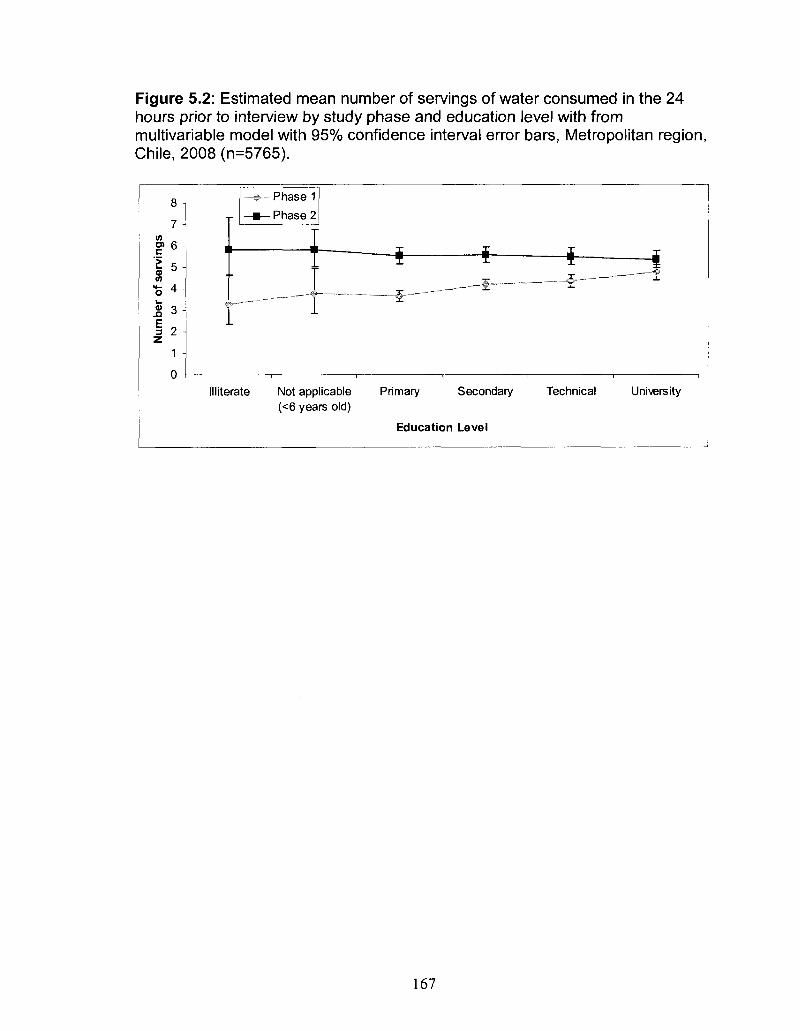
Figure 5.2: Estimated mean number of servings of water consumed in the 24 hours prior to interview by study phase and education level with from multivariable model with 95% confidence interval error bars, Metropolitan region, Chile, 2008 (n=5765).
8
7 in
D) 6
I 5 in
O ^ i .
f 2 z
1
0
Phase 1
• Phase 2
• * - + -&- ~ -̂
III iterate Not applicable (<6 years old)
Primary Secondary
Education Level
Technical University
167
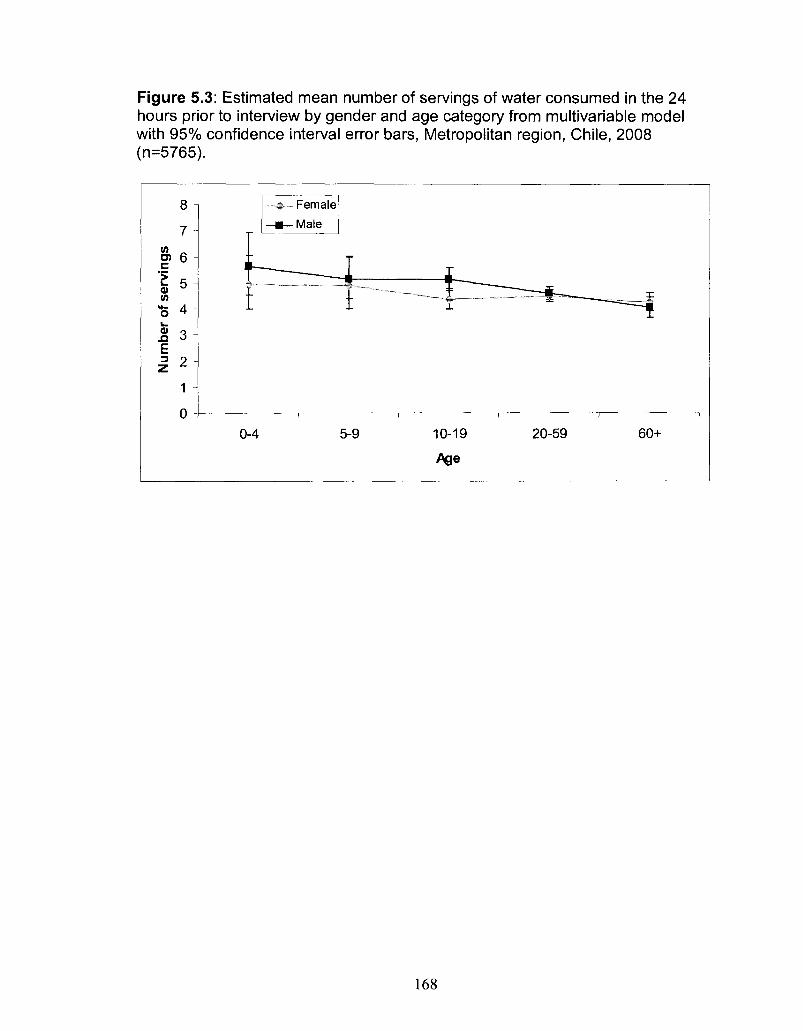
Figure 5.3: Estimated mean number of servings of water consumed in the 24 hours prior to interview by gender and age category from multivariable model with 95% confidence interval error bars, Metropolitan region, Chile, 2008 (n=5765).
8 -
7 -
TO 6 -
0) Q Si O -E 3 2
1 -
o -
_ ^ _ Female
—•—Male
•f • Y —
0-4 5-9
i r
10-19
Age
20-59
___£
I
60+
168
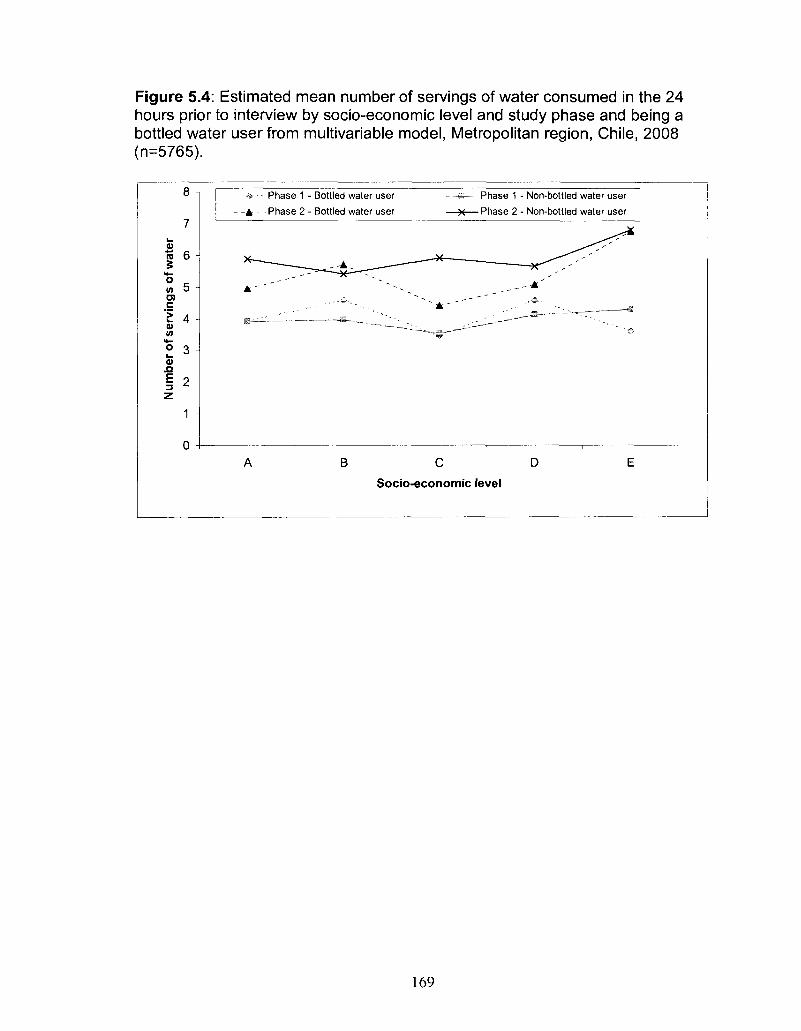
Figure 5.4: Estimated mean number of servings of water consumed in the 24 hours prior to interview by socio-economic level and study phase and being a bottled water user from multivariable model, Metropolitan region, Chile, 2008 (n=5765).
8 -
7 -
3 "K 6 -
**-( f l o ra c 'E 4 -V (A **-
V
n
I 2-z
1
- - A -
A'
A
Phase 1 - Bottled water user * —• Phase 1 - Non-bottled water user
—=~^£i— ~~~* ~ * " ^ ^ '
• • • • ' ' ' • * . • • • " ' • • - . B
. , . - ' • • ' ' • - - . . . . • • ' & . = • — — • —
• • ~ . . ~ „ ^ , . . . — " • #
B C D E
Socio-economic level
169
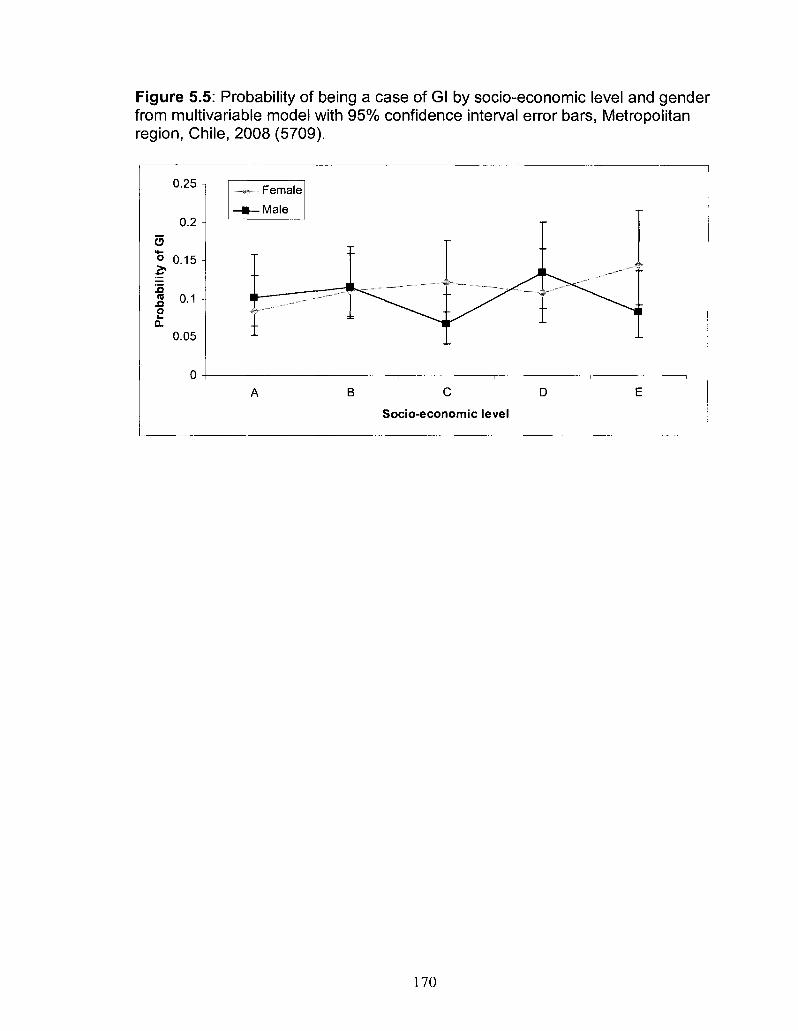
Figure 5.5: Probability of being a case of Gl by socio-economic level and gender from multivariable model with 95% confidence interval error bars, Metropolitan region, Chile, 2008 (5709).
0.25 -
0.2 -O
o 0.15 -2?
Pro
bab
il
p
0.05
0 -
•>- Female
—m— Male
I ^ ^
1
A B
„.„....._..—•-- ̂ *••- ^ ^
r-~~~ ..
C D
Socio-economic level
„.-'*• *
E
170
CHAPTER SIX
Estimated numbers of human infections due to Salmonella, Campylobacter
and Shigella, Metropolitan region, Chile, 2008
Prepared for submission: BMC Public Health
Abstract
Background: Acute gastrointestinal illness (Gl) causes global morbidity and
mortality; however, the true pathogen-specific burden at the community level is
not always known. As part of a larger burden of Gl study, we estimated the
number of human infections due to Salmonella, Campylobacter and Shigella in
the Metropolitan region of Chile, 2008, using under-reporting multipliers. The
Instituto de Salud Publica (ISP) reference laboratory collated the number of
pathogen-specific infections in Chile and provided the total number of reported
laboratory-confirmed infections due to Salmonella, Campylobacter and Shigella
in the Metropolitan region of Chile, 2008.
Methods: The proportions of cases expected to progress at each step of the
reporting system were used as input values in a stochastic model. For some
steps, Gl data were used when pathogen-specific data were not available. To
better approximate Gl symptoms by pathogen, data from international outbreaks
were used to estimate the proportion of bloody diarrhea by pathogen. The
171
inverse of the proportions at each step were multiplied together to derive the
overall estimated under-reporting multiplier. The number of pathogen-specific
laboratory confirmed cases from ISP was multiplied by the estimated under
reporting multiplier. The model outcome was expressed as the mean under
reporting multiplier with 5th and 95th percentiles to illustrate the uncertainty in the
estimate.
Results: The overall estimated mean multiplier (5th - 95th percentile) for
Salmonella infections was 66 (30 - 129), for Campylobacter 470 (179 - 1006),
and for Shigella 77 (35 - 148). The estimated incidence rates in 2008 per
100,000 person-years were 1140 (513 - 2227), 233 (89 - 498), and 278 (126 -
538) for Salmonella, Campylobacter and Shigella, respectively.
Conclusions: A significant number of infections occur in the Metropolitan
region, Chile due to Salmonella, Campylobacter and Shigella, and under
reporting of their true burden exists. Better understanding of the true burden can
help to mitigate the burden and inform prevention and control activities.
Background
Acute gastrointestinal illness (Gl) causes significant morbidity, mortality,
and socio-economic burden around the world [1-3]. Outbreak reports and
surveillance data provide estimates of this burden; however, these are typically
subject to under-reporting [4]. To address this, numerous countries have
conducted population-based studies to better estimate the burden of Gl [5-16].
Reportable disease data can be adjusted by under-reporting multipliers
172
generated, in part, from population-based survey information, to better estimate
the pathogen-associated burden in the population [17-20].
In Chile, the Instituto de Salud Publica national reference laboratory (ISP)
is legislated to record the number of samples tested and confirmed positive for
select pathogens, including Salmonella, Campylobacter and Shigella. In order to
be captured in this database, an ill individual must seek medical care, have a
stool sample requested and submit a stool sample for testing. Local laboratories
conduct preliminary testing and send samples as appropriate to ISP for further
testing or confirmation of results. Typically, compliance with each of these steps
is less than perfect, thus, the database is subject to under-estimation of the true
number of cases of illness caused by specific pathogens.
In 2008, a partnership of the Pan-American Health Organization, the
Public Health Agency of Canada, the University of Guelph and the Ministry of
Health in Chile completed the first population burden of Gl study in the
Metropolitan region of Chile (Chapter 3, [21]) and its main objective was to
determine the burden of Gl in the population. Data arising from that burden of
illness study were used to support the present study, whose purpose was to
estimate the number of human infections due to Salmonella, Campylobacter and
Shigella in the Metropolitan region of Chile, 2008.
Materials and Methods
Analytic approach
173
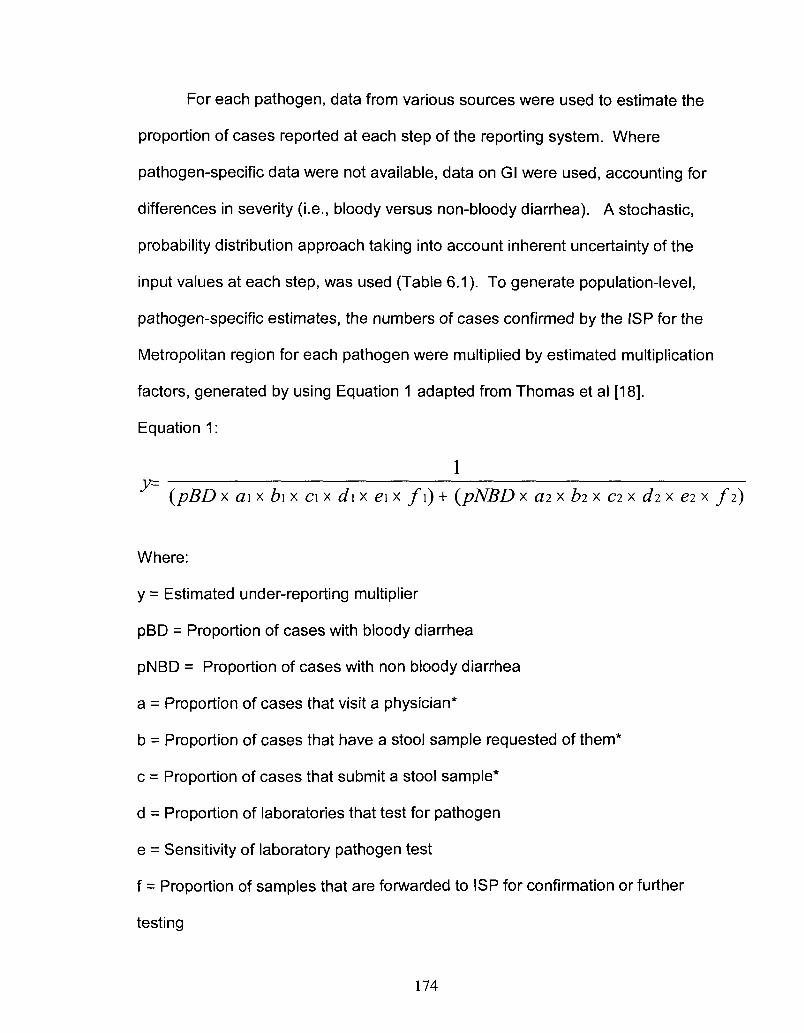
For each pathogen, data from various sources were used to estimate the
proportion of cases reported at each step of the reporting system. Where
pathogen-specific data were not available, data on Gl were used, accounting for
differences in severity (i.e., bloody versus non-bloody diarrhea). A stochastic,
probability distribution approach taking into account inherent uncertainty of the
input values at each step, was used (Table 6.1). To generate population-level,
pathogen-specific estimates, the numbers of cases confirmed by the ISP for the
Metropolitan region for each pathogen were multiplied by estimated multiplication
factors, generated by using Equation 1 adapted from Thomas et al [18].
Equation 1:
1 (pBD x ai x b\x ci x d\x e\x f\) + (pNBD x ai x bi x ci x di x ei x fi)
Where:
y = Estimated under-reporting multiplier
pBD = Proportion of cases with bloody diarrhea
pNBD = Proportion of cases with non bloody diarrhea
a = Proportion of cases that visit a physician*
b = Proportion of cases that have a stool sample requested of them*
c = Proportion of cases that submit a stool sample*
d = Proportion of laboratories that test for pathogen
e = Sensitivity of laboratory pathogen test
f = Proportion of samples that are forwarded to ISP for confirmation or further
testing
174
* Where 1 and 2 represent the proportions for bloody and non bloody diarrhea,
respectively
Stochastic simulations were performed using @RISK version 5.0
(Palisade Corporation, Ithaca, New York) as an add-on to Microsoft Excel
(Microsoft Corporation, 2003) with 20 000 iterations and Latin Hypercube
sampling. The mean, median, 5th and 95th percentile values for the estimated
multipliers, number of cases and incidence per 100,000 person-years were
reported. Calculation of input values was performed using SAS 9.1 (SAS
Institute Inc., Cary North Carolina, 2004). Input distributions (type and input
parameters) are described in Table 6.1.
A sensitivity analysis was done to determine which input distributions had
the greatest influence on the overall under-reporting multiplier, by pathogen. The
correlation between each input distribution with the under-reporting multiplier was
calculated. The five most influential input distributions by pathogen are
presented.
Data
Data from a recently conducted population survey (Chapter 3, [21]) were
used to determine the proportion of cases that sought medical care, had a stool
sample requested and submitted a stool sample in the Metropolitan region, Chile
(Table 6.1, steps A-C) [21]. Individuals responding 'don't know' or 'unsure' were
excluded from the analysis of that question. Proportions were segregated by
cases experiencing bloody versus non-bloody diarrhea. For this analysis, cases
of Gl were defined as people experiencing three or more loose stools within a 24
175
hour period, in the 30 days prior to interview. Individuals who reported that their
symptoms were due to a chronic or medical condition were excluded from the
case group. The expected range in proportion of cases that experience bloody
diarrhea for each pathogen were derived from published reports of outbreaks
(Table 6.1, step G) [22-39].
A laboratory survey was conducted as part of the burden of Gl study
conducted in the Metropolitan region, Chile (Appendix VI). In total, 106
laboratories from the Metropolitan region were contacted to participate in the
survey and responses were obtained from 49 (46%). Questions in the survey
pertained to the number of samples received, tested and found positive during
July 1-31 and November 15-December 15, 2008 (these time periods were
selected to coincide with the timing of the above population survey). Information
in the survey was used to determine the estimated proportion of laboratories that
routinely (80%-100% of the time) test for each pathogen, and the proportion of
positive samples that are referred to ISP for confirmation or further testing, by
pathogen (Table 6.1, steps D, F). The ranges in sensitivity of laboratory tests, by
pathogen were obtained from international literature (Table 6.1, step E) [40-42].
Results
Table 6.2 shows the reported and estimated annual number of human
cases of Salmonella, Campylobacter and Shigella infection in the Metropolitan
region, Chile in 2008. For every case of Salmonella infection reported by ISP
there was an estimated annual average of 66 (5th and 95th percentile: 30 - 129)
176
cases of Salmonella in 2008 in the Metropolitan region, Chile, corresponding to
an incidence rate of 1140 (5th and 95th percentile: 513 - 2227) cases per 100,000
person-years. Likewise, for every case of Campylobacter and Shigella infection
reported by ISP there were estimated annual averages of 470 (5th and 95th
percentile: 179 - 1006) and 76 (5th and 95th percentile: 35 - 148) cases in 2008
in the Metropolitan region, Chile, respectively. These values correspond to
incidence rates of 233 (5th and 95th percentile: 89 - 498) and 278 (5th and 95th
percentile: 126 - 538) cases per 100,000 person-years.
From the sensitivity analysis, the proportion of stool samples requested
(Table 6.1, step B) had the highest correlation with the estimated under-reporting
multiplier for all three of the pathogens (Table 6.3). Thus this input distribution
contributed the most to the uncertainty of the overall under-reporting estimate for
each of the pathogens.
Discussion
This study provides population estimates of three important enteric
pathogens using stochastic methods for the Metropolitan region, Chile in 2008.
To date, similar results have been published from the United States, England
Canada, Australia, Jordan, and Japan as well as an international estimate of the
global burden of Salmonella (Table 6.4) [15, 17-20, 43-45]. Assessing
differences in annual incidence estimates is useful for comparing relative
pathogen
177
The mean incidence rate of Shigella infection reported here is similar to
the rate reported from Jordan [20]; however, it is higher than the rates reported
from the United States [44] and England [15]. This may be due to a true
difference in the incidence of Shigella infection in these different populations. It
is also possible that differences in methodology may, in part, explain the variation
between study results. The study in England used prospective cohort
methodology, which can lead to lower estimates of burden compared to cross-
sectional study designs, possibly due to the requirement that ill study participants
to submit stool samples [15]. The study from the United States [44] combined
data from outbreak reports with those from active and passive surveillance
reports to estimate the average annual number of reported cases, to which a
multiplier of 20 was applied. This multiplier was used for any pathogen typically
associated with bloody diarrhea and was based on the under-reporting of
Escherichia coli 0157:H7 found in a previous internal report [46]. Consequently,
it may not have fully accounted for the under-reporting of Shigella in the
American study. Furthermore, we utilised a stochastic model with distributions to
account for uncertainty in the estimates, which generated a mean value higher
than the median value.
The mean incidence rate of Campylobacter infection reported here is
similar to that reported by Japan [43], but lower than those reported by the United
States [44], England [15], Canada [18] and Australia [19]. It is possible that the
incidence of Campylobacter infection is lower in Chile compared to these
locations; however, this low incidence is likely, to some extent, a reflection of the
178
low percentage (i.e., 16.3%) of laboratories that routinely test for Campylobacter
in the Metropolitan region, Chile. From the sensitivity analysis, the second most
influential input distribution was the percentage of laboratories that test for
Campylobacter, contributing to the uncertainty of the overall under-reporting
multiplier for Campylobacter.
The mean population-based incidence rate of Salmonella infection
estimated here (i.e., 1140 per 100,000 person-years) is equal to the estimate of
the global burden of Salmonella [45]. However, this international estimate was
based on regional estimates, including one of 80 cases per 100,000 person
years for the Latin American - South region. Note that our estimate for Chile is
considerably higher than this regional estimate. Due to a lack of studies such as
our recent work (Chapter 3, [21]), the global burden of Salmonella study relied on
data from a returning traveler survey, with adjustment for under-ascertainment
and differences in susceptibility of residents versus travelers, to generate this
value. These differences in methodology may in part explain the differences in
results and highlight the importance of region-specific data. Moreover, the mean
estimated rate for Chile is higher than all other reported studies [15, 17-20, 43-
45]. This may reflect a true difference in the burden of Salmonella by country or
region, or perhaps a difference in healthcare seeking or laboratory reporting
behaviours such that the under-reporting of Salmonella is much greater in Chile
than other regions. This may be due to differences in access to healthcare or
public health and laboratory surveillance system designs.
179
In the case of Salmonella, a large proportion (i.e., 83.7%) of laboratories in
the Metropolitan region routinely tested for Salmonella and the ISP confirmed
incidence rate of Salmonella infections was 17.2 per 100,000 person-years in
2008, in the Metropolitan region, Chile. The increased rate of testing likely
contributed to an increased rate of recovery of positive samples and the
confirmed number of Salmonella infections.
The Chilean laboratory confirmed rate of Salmonella (17.2 per 100,000
person-years) is similar to the laboratory reported incidence rate of Salmonella
from Canada (19 per 100,000 person-years [18] and the United States (13.6 per
100,000 person-years [47], thus the differences in estimated rates may be
attributed to differences in healthcare seeking behaviours in the different
populations or different estimate methodologies. Our estimates incorporated
uncertainty with distributions at each step, while the Canada study provided a low
and high estimated value, and the United States study generated a point
estimate. Furthermore, the estimates from the United States used a point
estimate of 50.3% of cases to have bloody diarrhea, while a range of values were
used here and in the Canadian study.
From the sensitivity analysis, healthcare seeking behaviours were most
influential on the uncertainty of the overall under-reporting multiplier for both
Salmonella and Shigella, with four of the top five measures of correlation related
to the under-reporting multiplier (Table 6.3). For Campylobacter, the second and
third most influential input distributions were related to laboratory testing and
180
reporting to ISP. Further research would be useful to provide better data on
these steps.
Pathogen-specific rates can be useful for public health policy makers. It is
possible that the prioritization or ranking of pathogens, for the purposes of
control, prevention or surveillance activities may differ depending upon which
estimates are used: estimated population rates versus reported laboratory
confirmed rates. Laboratory confirmed rates are only a subset of the true
pathogen-specific burden in the population. For example, pathogens previously
not given high priority may become more important to public health officials when
the population level estimates are known. This can result in increased laboratory
testing or specific studies to better understand their burden in the community. In
Chile, this may prove useful in the case of Campylobacter as it appears to be
considerably under-reported in this population and had the lowest rate of
laboratory testing of the three pathogens examined. Additionally, assessing
country-specific under-reporting multipliers by pathogen enables comparison of
reporting and surveillance systems which may help to explain where differences
exist between pathogen-specific international incidence estimates.
We attempted to estimate the population-level burden of Escherichia coli
0157:H7; however, due to scarcity of data at the laboratory level the range in
estimated values exceeded what was considered sensible and biologically
plausible (data not shown). It would be useful to explore this in future research
activities.
181
There are some limitations of this study. The low response rate (46%) on
the laboratory survey. This could have created non-response bias if the activities
of the responding laboratories differed from those of the non-responding
laboratories. The location of the responding laboratories was geographically
representative of the Metropolitan region (data not shown). The ranges of
laboratory test sensitivities and proportions of cases that suffer bloody diarrhea,
by pathogen were based on those observed in published studies in other
countries and are similar to those used in studies published from the United
States, Canada and Australia [17-19]. The use of outbreak data may not reflect
the true distribution of severity of sporadic cases in the population. Less severe
cases may be captured due to the recognized outbreak (i.e., whereas under non-
outbreak conditions they may not have been identified) or the opposite could
occur where an outbreak is identified because of the extreme nature of the
symptoms of individual cases, thus shifting the severity distribution. No
adjustment was made for test specificity and the possibility of false positives due
to insufficient information (i.e., we do not know the true prevalence nor the
number of test negatives). This is a common limitation to these types of studies
and can present an issue when the specificity of a test is poor, otherwise the
impact of false positives would be small. Based on previous publications, test
specificity for Salmonella and Shigella is 100% but test specificity for
Campylobacter ranges from 32.5%-99%, and could therefore have a large impact
on the Campylobacter incidence rate [40-42].
182
To account for differences in case behaviour given severity of illness, we
segregated our analysis by bloody and non-bloody diarrhea in an attempt to
better describe pathogen-specific illness behaviours as this information is not
currently available for Chile. However, this segregation created small numbers
for some of the calculations and thus contributed to the wider range in values
obtained.
Conclusions
This study provides the first population-based estimates of enteric
bacterial infections in Chile. The uncertainty of these estimates was captured
using the 5th and 95th percentile values as upper and lower bounds to the
estimates. These results will be of use not only to local public health workers
and policy makers and should enable international comparisons that better reflect
the true population burden by pathogen. This sort of information has been
sought after by the World Health Organization and will be useful in generating
burden of disease estimates [3, 48].
183
References
1. Guerrant RL, Kosek M, Moore S, Lorntz B, Brantley R, Lima AA: Magnitude and impact of diarrheal diseases. Arch Med Res 2002, 33(4):351-355.
2. Kosek M, Bern C, Guerrant RL: The global burden of diarrhoeal disease, as estimated from studies published between 1992 and 2000. Bull World Health Organ 2003, 81(3):197-204.
3. Stein C, KuchenmullerT, Hendrickx S, Pruss-Ustun A, Wolfson L, Engels D, Schlundt J: The Global Burden of Disease assessments-WHO is responsible? PLoS Negl Trap Dis 2007, 1(3):e161.
4. Scallan E, Majowicz SE, Hall G, Banerjee A, Bowman CL, Daly L, Jones T, Kirk MD, Fitzgerald M, Angulo FJ: Prevalence of diarrhoea in the community in Australia, Canada, Ireland, and the United States. Int J Epidemiol 2005, 34(2):454-460.
5. de Wit MA, Koopmans MP, Kortbeek LM, Wannet WJ, Vinje J, van Leusden F, Bartelds Al, van Duynhoven YT: Sensor, a population-based cohort study on gastroenteritis in the Netherlands: incidence and etiology. Am J Epidemiol 2001, 154(7):666-674.
6. Aguiar Prieto P, Finley RL, Muchaal PK, Guerin MT, Isaacs S, Castro Dominguez A, Gisele Coutin M, Perez E: Burden of self-reported acute gastrointestinal illness in Cuba. J Health Popul Nutr 2009, 27:345-57.
7. Hall GV, Kirk MD, Ashbolt R, Stafford R, Lalor K: Frequency of infectious gastrointestinal illness in Australia, 2002: regional, seasonal and demographic variation. Epidemiol Infect 2006, 134(1 ):111-118.
8. Imhoff B, Morse D, Shiferaw B, Hawkins M, Vugia D, Lance-Parker S, Hadler J, Medus C, Kennedy M, Moore MR, Van Gilder T, Emerging Infections Program Food Net Working Group: Burden of self-reported acute diarrheal illness in FoodNet surveillance areas, 1998-1999. Clin Infect Dis 2004, 38 Suppl 3:S219-26.
9. Jones TF, McMillian MB, Scallan E, Frenzen PD, Cronquist AB, Thomas S, Angulo FJ: A population-based estimate of the substantial burden of diarrhoeal disease in the United States; FoodNet, 1996-2003. Epidemiol Infect 2007, 135(2):293-301.
10. Kuusi M, Aavitsland P, Gondrosen B, Kapperud G: Incidence of gastroenteritis in Norway-a population-based survey. Epidemiol Infect 2003, 131(1):591-597.
184
11. Majowicz SE, Dore K, Flint JA, Edge VL, Read S, Buffett MC, McEwen S, McNab WB, Stacey D, Sockett P, Wilson JB: Magnitude and distribution of acute, self-reported gastrointestinal illness in a Canadian community. Epidemiol Infect 2004, 132(4):607-617.
12. Scallan E, Fitzgerald M, Collins C, Crowley D, Daly L, Devine M, Igoe D, Quigley T, Robinson T, Smyth B: Acute gastroenteritis in northern Ireland and the Republic of Ireland: a telephone survey. Commun Dis Public Health 2004, 7(1):61-67.
13. Sargeant JM, Majowicz SE, Snelgrove J: The burden of acute gastrointestinal illness in Ontario, Canada, 2005-2006. Epidemiol Infect 2008, 136(4): 451-460.
14. Thomas MK, Majowicz SE, MacDougall L, Sockett PN, Kovacs SJ, Fyfe M, Edge VL, Flint JA, Henson S, Jones AQ: Population distribution and burden of acute gastrointestinal illness in British Columbia, Canada. BMC Public Health 2006, 6(307).
15. Wheeler JG, Sethi D, Cowden JM, Wall PG, Rodrigues LC, Tompkins DS, Hudson MJ, Roderick PJ: Study of infectious intestinal disease in England: rates in the community, presenting to general practice, and reported to national surveillance. The Infectious Intestinal Disease Study Executive. BMJ 1999, 318(7190):1046-1050.
16. Herikstad H, Yang S, Van Gilder TJ, Vugia D, Hadler J, Blake P, Deneen V, Shiferaw B, Angulo FJ: A population-based estimate of the burden of diarrhoeal illness in the United States: FoodNet, 1996-7. Epidemiol Infect 2002, 129(1):9-17.
17. Voetsch AC, Van Gilder TJ, Angulo FJ, Farley MM, Shallow S, Marcus R, Cieslak PR, Deneen VC, Tauxe RV, Emerging Infections Program FoodNet Working Group: FoodNet estimate of the burden of illness caused by nontyphoidal Salmonella infections in the United States. Clin Infect Dis 2004, 38 Suppl3:S127-34.
18. Thomas MK, Majowicz SE, Sockett PN, Fazil A, Pollari F, Dore KA, Flint JA, Edge VL: Estimated numbers of community cases of illness due to Salmonella, Campylobacter and verotoxigenic Escherichia coli: Pathogen-specific community rates. Can J Infect Dis Med Microbiol 2006, 17(4):229-234.
19. Hall G, Yohannes K, Raupach J, Becker N, Kirk M: Estimating community incidence of Salmonella, Campylobacter, and Shiga toxin-producing Escherichia coli infections, Australia. Emerg Infect Dis 2008, 14(10):1601-1609.
185
20. Gargouri N, Walke H, Belbeisi A, Hadadin A, Salah S, Ellis A, Braam HP, Angulo FJ: Estimated burden of human Salmonella, Shigella, and Brucella infections in Jordan, 2003-2004. Foodborne Pathog Dis 2009, 6(4):481-486.
21. Thomas MK, Perez E, Majowicz SE, Reid-Smith R, Olea A, Diaz J, Solari V, McEwen SA: Burden of acute gastrointestinal illness in the Metropolitan region, Chile, 2008. Epidemiol Infect (Submitted 2010).
22. Gupta SK, Nalluswami K, Snider C, Perch M, Balasegaram M, Burmeister D, Lockett J, Sandt C, Hoekstra RM, Montgomery S: Outbreak of Salmonella Braenderup infections associated with Roma tomatoes, northeastern United States, 2004: a useful method for subtyping exposures in field investigations. Epidemiol Infect 2007, 135(7): 1165-1173.
23. Ellis A, Preston M, Borczyk A, Miller B, Stone P, Hatton B, Chagla A, Hockin J: A community outbreak of Salmonella berta associated with a soft cheese product. Epidemiol Infect 1998, 120(1 ):29-35.
24. Shane AL, Roels TH, Goldoft M, Herikstad H, Angulo FJ: Foodborne disease in our global village: a multinational investigation of an outbreak of Salmonella serotype Enteritidis phage type 4 infection in Puerto Vallarta, Mexico. Int J Infect Dis 2002, 6(2):98-102.
25. Anonymous Restaurant foodhandler-associated outbreak of Salmonella Heidelberg gastroenteritis identified by calls to a local telehealth service, Edmonton, Alberta, 2004. Can Commun Dis Rep 2005, 31(10):105-110.
26. Centers for Disease Control and Prevention (CDC): Outbreak of Salmonella serotype Muenchen infections associated with unpasteurized orange juice--United States and Canada, June 1999. MMWR Morb Mortal Wkly Rep 1999, 48(27):582-585.
27. Richardson G, Thomas DR, Smith RM, Nehaul L, Ribeiro CD, Brown AG, Salmon RL: A community outbreak of Campylobacter jejuni infection from a chlorinated public water supply. Epidemiol Infect 2007,135(7):1151-1158.
28. Olsen SJ, Hansen GR, Bartlett L, Fitzgerald C, Sonder A, Manjrekar R, Riggs T, Kim J, Flahart R, Pezzino G, Swerdlow DL: An outbreak of Campylobacter jejuni infections associated with food handler contamination: the use of pulsed-field gel electrophoresis. J Infect Dis 2001, 183(1):164-167.
29. Kuusi M, Klemets P, Miettinen I, Laaksonen I, Sarkkinen H, Hanninen ML, Rautelin H, Kela E, Nuorti JP: An outbreak of gastroenteritis from a non-chlorinated community water supply. J Epidemiol Community Health 2004, 58(4):273-277.
186
30. Gillespie IA, O'Brien SJ, Adak GK, Tarn CC, Frost JA, Bolton FJ, Tompkins DS, Campylobacter Sentinel Surveillance Scheme Collaborators: Point source outbreaks of Campylobacter jejuni infection-are they more common than we think and what might cause them? Epidemiol Infect 2003, 130(3):367-375.
31. Centers for Disease Control and Prevention (CDC): Outbreak of Campylobacter enteritis associated with cross-contamination of food-Oklahoma, 1996. MMWR Morb Mortal Wkly Rep 1998, 47(7):129-131.
32. Centers for Disease Control and Prevention (CDC): Outbreak of Campylobacter jejuni infections associated with drinking unpasteurized milk procured through a cow-leasing program-Wisconsin, 2001. MMWR Morb Mortal Wkly Rep 2002, 51(25):548-549.
33. Centers for Disease Control and Prevention (CDC): Shigellosis outbreak associated with an unchlorinated fill-and-drain wading pool-Iowa, 2001. MMWR Morb Mortal Wkly Rep 2001, 50(37):797-800.
34. Davis H, Taylor JP, Perdue JN, Stelma GN,Jr, Humphreys JM.Jr, Rowntree R,3rd, Greene KD: A shigellosis outbreak traced to commercially distributed shredded lettuce. Am J Epidemiol 1988, 128(6):1312-1321.
35. Frost JA, McEvoy MB, Bentley CA, Andersson Y: An outbreak of Shigella sonnei infection associated with consumption of iceberg lettuce. Emerg Infect Dis 1995, 1(1):26-29.
36. Huq I, Alam AK, Morris GK, Wathen G, Merson M: Foodborne outbreak of shigellosis caused by an unusual Shigella strain. J Clin Microbiol 1980, 11(4):337-339.
37. Makintubee S, Mallonee J, Istre GR: Shigellosis outbreak associated with swimming. Am J Public Health 1987, 77(2):166-168.
38. Reller ME, Nelson JM, Molbak K, Ackman DM, Schoonmaker-Bopp DJ, Root TP, Mintz ED: A large, multiple-restaurant outbreak of infection with Shigella flexneri serotype 2a traced to tomatoes. Clin Infect Dis 2006, 42(2):163-169.
39. Werber D, Dreesman J, Feil F, van Treeck U, Fell G, Ethelberg S, Hauri AM, Roggentin P, Prager R, Fisher IS, Behnke SC, Bartelt E, Weise E, Ellis A, Siitonen A, Andersson Y, Tschape H, Kramer MH, Ammon A: International outbreak of Salmonella Oranienburg due to German chocolate. BMC Infect Dis 2005, 5(1 ):7.
40. Odumeru JA, Steele M, Fruhner L, Larkin C, Jiang J, Mann E, McNab WB: Evaluation of accuracy and repeatability of identification of food-borne
187
pathogens by automated bacterial identification systems. J Clin Microbiol 1999, 37(4):944-949.
41. Hindiyeh M, Jense S, Hohmann S, Benett H, Edwards C, Aldeen W, Croft A, Daly J, Mottice S, Carroll KC: Rapid detection of Campylobacter jejuni in stool specimens by an enzyme immunoassay and surveillance for Campylobacter upsaliensis in the greater Salt Lake City area. J Clin Microbiol 2000, 38(8):3076-3079.
42. Dutta S, Chatterjee A, Dutta P, Rajendran K, Roy S, Pramanik KC, Bhattacharya SK: Sensitivity and performance characteristics of a direct PCR with stool samples in comparison to conventional techniques for diagnosis of Shigella and enteroinvasive Escherichia coli infection in children with acute diarrhoea in Calcutta, India. J Med Microbiol 2001, 50(8):667-674.
43. Kubota K, Iwasaki E, Inagaki S, Nokubo T, Sakurai Y, Komatsu M, Toyofuku H, Kasuga F, Angulo FJ, Morikawa K: The human health burden of foodborne infections caused by Campylobacter, Salmonella, and Vibrio parahaemolyticus in Miyagi Prefecture, Japan. Foodborne Pathog Dis 2008, 5(5):641-648.
44. Mead PS, Slutsker L, Dietz V, McCaig LF, Bresee JS, Shapiro C, Griffin PM, Tauxe RV: Food-related illness and death in the United States. Emerg Infect Dis 1999, 5(5):607-625.
45. Majowicz SE, Musto J, Scallan E, Angulo FJ, Kirk M, O'Brien SJ, Jones TF, Fazil A, Hoekstra RM, International Collaboration on Enteric Disease 'Burden of Illness' Studies: The global burden of nontyphoidal Salmonella gastroenteritis. Clin Infect Dis 2010, 50(6):882-889.
46. Hedberg C, Angulo F, Townes J, Vugia D, Farley M, FoodNet.: Differences in Escherichia co/# 0157:H7 annual incidence among FoodNet active surveillance sites. Baltimore, MD. 1997.
47. Centers for Disease Control and Prevention: Salmonella surveillance: annual summary, 2006. 2008.
48. World Health Organization: WHO consultation to develop a strategy to estimate the global burden of foodborne diseases: Taking stock and charting the way forward. 2007.
188
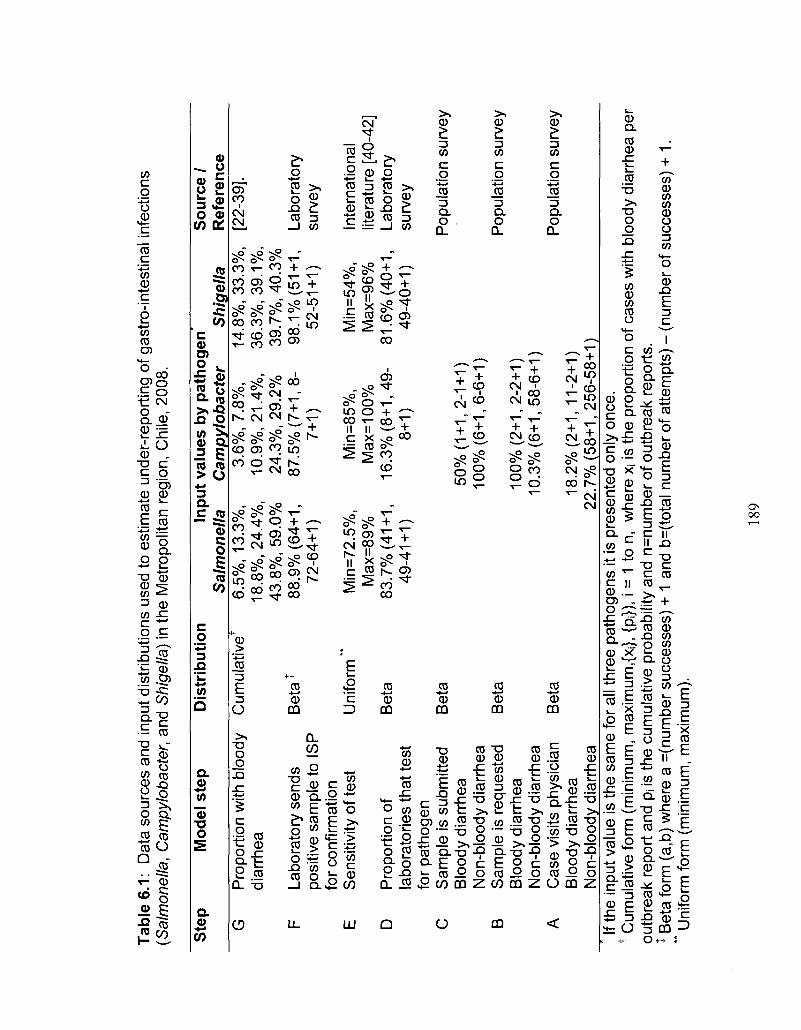
Tab
le 6
.1:
Dat
a so
urce
s an
d in
put d
istr
ibut
ions
use
d to
est
imat
e un
der-
repo
rtin
g of
gas
tro-
inte
stin
al i
nfec
tions
(S
alm
onel
la,
Cam
pylo
bact
er,
and
Shi
gella
) in
the
Met
ropo
litan
reg
ion,
Chi
le, 2
008.
Ste
p
G
F
E
D
C
B
A
Mod
el s
tep
Pro
port
ion
with
blo
ody
diar
rhea
Labo
rato
ry s
ends
po
sitiv
e sa
mpl
e to
IS
P
for
conf
irmat
ion
Sen
sitiv
ity o
f tes
t
Pro
port
ion
of
labo
rato
ries
that
test
fo
r pa
thog
en
Sam
ple
is s
ubm
itted
B
lood
y di
arrh
ea
Non
-blo
ody
diar
rhea
S
ampl
e is
req
uest
ed
Blo
ody
diar
rhea
N
on-b
lood
y di
arrh
ea
Cas
e vi
sits
phy
sici
an
Blo
ody
diar
rhea
N
on-b
lood
y di
arrh
ea
Dis
trib
utio
n
Cum
ulat
iveT
Be
ta1
Uni
form
**
Bet
a
Bet
a
Bet
a
Bet
a
Inpu
t va
lues
by
pat
ho
gen
S
alm
on
ella
6.
5%,
13.3
%,
18.8
%, 2
4.4%
, 43
.8%
, 59.
0%
88.9
% (
64+1
, 72
-64+
1)
Min
=72.
5%,
Max
=89
%
83.7
% (
41+1
, 49
-41+
1)
Cam
pyl
ob
acte
r 3.
6%,
7.8%
, 10
.9%
, 21.
4%,
24.3
%, 2
9.2%
87
.5%
(7+
1, 8
-7+
1)
Min
=85%
, M
ax=1
00%
16
.3%
(8+
1, 4
9-8+
1)
50%
(1+
1, 2
-1+
1)
100%
(6+
1, 6
-6+
1)
100%
(2+
1, 2
-2+
1)
10.3
% (
6+1,
58-
6+1)
18.2
% (
2+1,
11-
2+1)
22
.7%
(58
+1,
256-
58+
Sh
igel
la
14.8
%, 3
3.3%
, 36
.3%
, 39
.1%
, 39
.7%
, 40.
3%
98.1
% (
51+1
, 52
-51+
1)
Min
=54%
, M
ax=9
6%
81.6
% (
40+1
, 49
-40+
1)
D
So
urc
e /
Ref
eren
ce
[22-
39].
Labo
rato
ry
surv
ey
Inte
rnat
iona
l lit
erat
ure
[40-
42]
Labo
rato
ry
surv
ey
Pop
ulat
ion
surv
ey
Pop
ulat
ion
surv
ey
Pop
ulat
ion
surv
ey
If th
e in
put v
alue
is th
e sa
me
for
all t
hree
pat
hoge
ns it
is p
rese
nted
onl
y on
ce.
t Cum
ulat
ive
form
(m
inim
um, m
axim
um,{X
j}, {
pi})
, i =
1 to
n,
whe
re x
i is
the
prop
ortio
n of
cas
es w
ith b
lood
y di
arrh
ea p
er
outb
reak
rep
ort
and
pi is
the
cum
ulat
ive
prob
abili
ty a
nd n
=num
ber
of o
utbr
eak
repo
rts.
jB
eta
for
m (
a,b)
whe
re a
=(n
umbe
r su
cces
ses)
+ 1
and
b=(
tota
l num
ber
of a
ttem
pts)
- (
num
ber
of s
ucce
sses
) +
1.
** U
nifo
rm fo
rm (
min
imum
, m
axim
um).
189
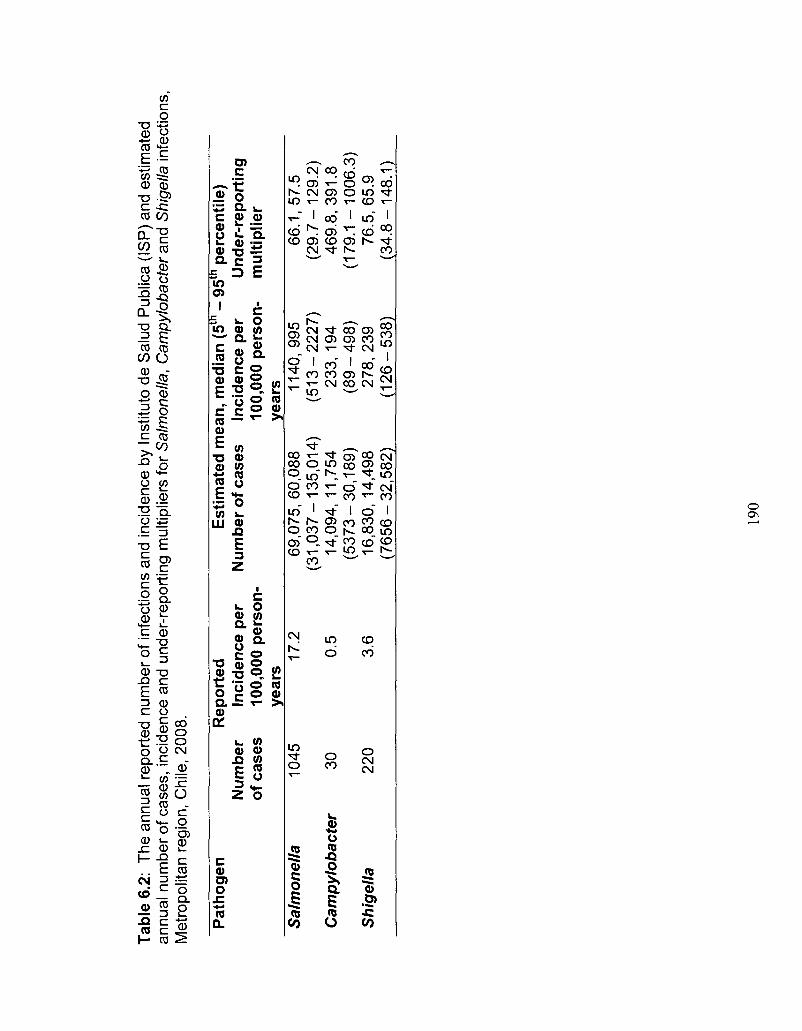
Tab
le 6
.2:
The
ann
ual r
epor
ted
num
ber
of in
fect
ions
and
inci
denc
e by
Ins
titut
o de
Sal
ud P
ublic
a (I
SP
) an
d es
timat
ed
annu
al n
umbe
r of
cas
es,
inci
denc
e an
d un
der-
repo
rtin
g m
ultip
liers
for
Sal
mon
ella
, C
ampy
loba
cter
and
Shi
gella
infe
ctio
ns,
Met
ropo
litan
reg
ion,
Chi
le, 2
008.
Pat
hoge
n
Rep
orte
d
Est
imat
ed m
ean
, med
ian
(5
- 95
p
erce
ntil
e)
Nu
mb
er
Inci
den
ce p
er
Num
ber
of
case
s In
cid
ence
per
U
nd
er-r
epo
rtin
g
of c
ases
10
0,00
0 p
erso
n-
100,
000
per
son
- m
ulti
plie
r ye
ars
year
s S
alm
on
ella
10
45
17.2
69
,075
,60,
088
1140
,995
66
.1,5
7.5
(31
,03
7-1
35
,01
4)
(51
3-2
22
7)
(29
.7-1
29
.2)
Cam
pyl
ob
acte
r 30
0.
5 14
,094
,11,
754
23
3,1
94
469.
8,39
1.8
(53
73
-30
,18
9)
(89
-49
8)
(17
9.1
-10
06
.3)
Sh
igel
la
220
3.6
16,8
30,1
4,49
8 2
78
,23
9 76
.5,6
5.9
(76
56
-32
,58
2)
(12
6-5
38
) (3
4.8
-14
8.1
)
190

Tabl
e 6.
3: S
ensi
tivity
ana
lysi
s of
cor
rela
tion
of in
put d
istr
ibut
ions
and
ove
rall
unde
r-re
port
ing
mul
tiplie
r by
pat
hoge
n fo
r th
e M
etro
polit
an r
egio
n, C
hile
, 200
8.
Ran
k In
put
step
and
co
rrel
atio
n w
ith
ove
rall
un
der
-rep
ort
ing
mu
ltip
lier
Sal
mo
nel
la
Cam
pyl
ob
acte
r S
hig
ella
1 2 3 4 5
Inpu
t S
tep
S
ampl
e re
ques
ted:
N
on-b
lood
y S
ampl
e su
bmitt
ed:
Non
-blo
ody
Sam
ple
subm
itted
: B
lood
y P
ropo
rtio
n of
cas
es
with
blo
ody
diar
rhea
C
ase
visi
ts
phys
icia
n: N
on-
bloo
dy
Co
rrel
atio
n
(-0.
53)
(-0.
24)
(-0.
21)
(-0.
20)
(-0.
17)
Inpu
t S
tep
S
ampl
e re
ques
ted:
Non
-bl
oody
La
bora
tory
tes
ts fo
r pa
thog
en
Pos
itive
s se
nt to
IS
P
Sam
ple
subm
itted
: Non
-bl
oody
C
ase
visi
ts p
hysi
cian
: N
on-b
lood
y
Co
rrel
atio
n
(-0.
39)
(-0.
34)
(-0.
21)
(-0.
17)
(-0.
13)
Inpu
t S
tep
S
ampl
e re
ques
ted:
N
on-b
lood
y S
ampl
e su
bmitt
ed:
Blo
ody
Sen
sitiv
ity o
f la
bora
tory
tes
ts
Sam
ple
subm
itted
: N
on-b
lood
y C
ase
visi
ts
phys
icia
n: B
lood
y
Co
rrel
atio
n
(-0.
42)
(-0.
22)
(-0.
19)
(-0.
18)
(-0.
17)
191
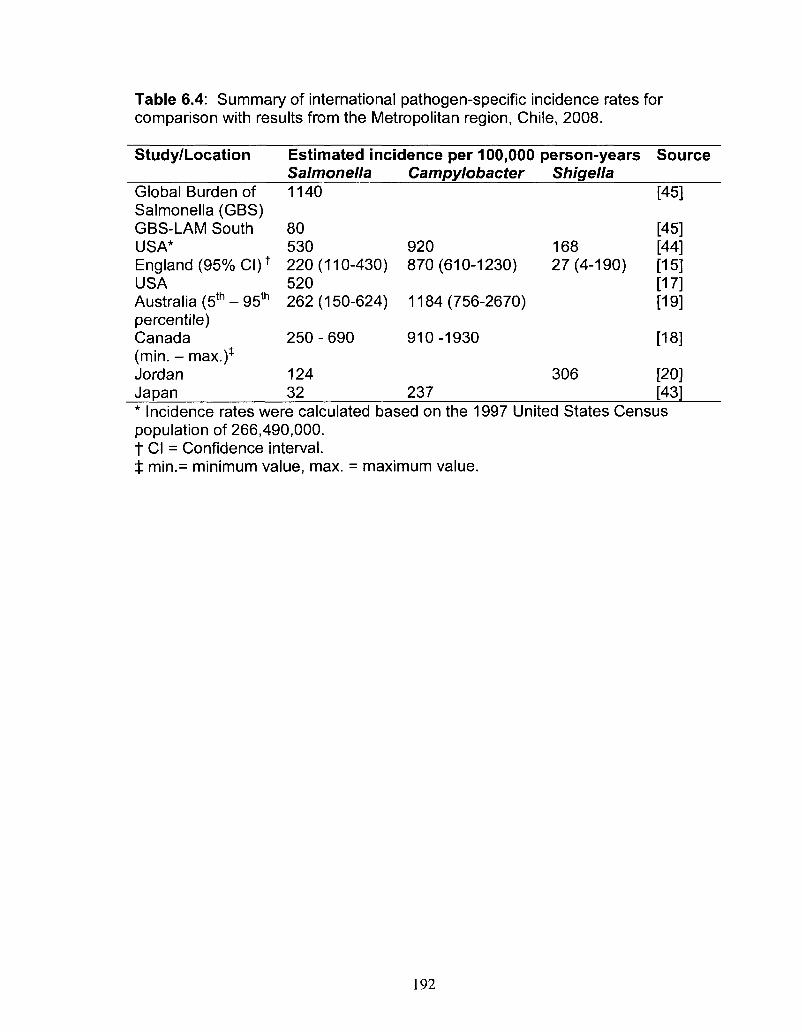
Table 6.4: Summary of international pathogen-specific incidence rates for comparison with results from the Metropolitan region, Chile, 2008.
Study/Location Estimated incidence per 100,000 person-years Source Salmonella Campylobacter Shigella
Global Burden of 1140 [45] Salmonella (GBS) GBS-LAM South 80 USA* 530 920 England (95% CI) * 220 (110-430) 870 (610-1230) USA 520 Australia (5th - 95th 262 (150-624) 1184 (756-2670) percentile) Canada 250-690 910-1930 (min. - max.)* Jordan 124 Japan 32 237 * Incidence rates were calculated based on the 1997 United States Census population of 266,490,000. t CI = Confidence interval. $ min.= minimum value, max. = maximum value.
168 27(4-190)
306
[45] [44] [15] [17] [19]
[18]
[20] [43]
192
CHAPTER SEVEN
Summary Discussion and Conclusions
Although acute gastrointestinal illness (Gl) remains an important public
health burden in both developed and developing countries, few population-level
studies of Gl and associated risk factors have been conducted in developing
regions; regions that, according to the World Health Organization (WHO), carry
the greater part of the global burden. The shortage of population-based
information from less developed parts of the world, including South America, has
resulted in important gaps in available information on Gl, including: (a) the
population-level burden of Gl in South America; (b) the population-level food and
water-related risk factors for Gl in South America; (c) the community-level enteric
pathogen-specific burden estimates in South America. In addition, there is a
general limit in our understanding of the impact of using different recall periods in
a population-level burden of Gl study. The objectives of the research described
in this dissertation were: (1) to describe the distribution and population-level
burden of Gl; (2) the risk factors associated with Gl in Galvez, Argentina and the
Metropolitan region, Chile; and (3) to evaluate the effect of different recall periods
in population-level burden of Gl studies.
We examined the burden of Gl in two locations: first, a small Argentinean
community, Galvez, Argentina, population of approximately 18,500 in 2007, and
second, the large Metropolitan region, Chile, population of approximately
193
6,000,000 in 2008. To do this, proportional random samples from the
communities were obtained using residential listings and census data. Surveys
were administered door-to-door within each of these populations and the door-to-
door methodology required geographical information of the region to be
surveyed. A certain amount of creativity and resourcefulness was needed to
develop a sampling frame and provide the interviewers with appropriate lists of
households to survey. Often the ideal data are not available, especially in a
developing country. In Galvez, there was a residential listing that was used to
randomly select households and generate a sample. In the Metropolitan region,
this did not exist; however, there were maps and a listing to the level of
neighbourhood block from a recent census. These were used to randomly select
blocks. Maps were photocopied and selected blocks were manually highlighted
and provided to interviewers along with the list of selected blocks in order to go
into the field and conduct the surveys.
As it was not feasible to conduct surveys year-round, two time periods
(high and low Gl season) were selected during which to conduct the surveys.
This can present some research challenges as it requires sufficient and reliable
historical data to select the time periods appropriately. Once selected, the
validity of the study results is vulnerable to any Gl outbreak that might take place
during the study periods, or a shift in the seasonality of Gl creating a lack of
synchronization between study periods and peaks of illness, as this may inflate
or decrease the resulting estimates. Furthermore, holidays and special
occasions need to be taken into account as they may result in overall over- or
194
under-estimates of the true burden and complicate data collection. In addition,
extreme weather (e.g., heat, rain, natural disasters) can also present tremendous
challenges, particularly when surveys are being done door-to-door. Interviewers
typically do not enjoy working in extreme weather conditions and extra time must
be included in the schedule in order to prepare for such unpredictable
circumstances. Other events such as political strikes and protests can
complicate data collection. Having a strong team on the ground prepared for any
sort of contingency is essential to achieving success.
For the work in Galvez, we partnered with a municipal organization
(Centra de Desarrollo Agroalimentario, CeDA) whose mandate included food
safety activities. Their knowledge and local contacts proved valuable in obtaining
interviewers, selecting appropriate time periods and managing the survey.
Extreme heat and heavy rainfall during the data collection period proved
challenging for some interviewers; however, the desired sample sizes were
achieved in a timely fashion. Likewise, in Chile the Ministry of Health, the
Metropolitan Region Health Agency (SEREMI), the local Pan American Health
Organization (PAHO) officials and contacts at a local university provided
expertise to the study coordination, management, interviewer and time period
selection. Issues related to holidays, political strikes, large distances to travel for
interviewers and weather conditions were overcome.
Keeping the survey short, with only the essential questions, and thinking
ahead about how the questions will be analysed will help in the structure of each
question and of the overall survey. Asking others to review, edit and pilot-test the
195
survey are good ways to ensure the survey is acceptable, makes sense and
addresses the main questions that need to be answered. Language should be
clear and in line with local terms and colloquialisms to ensure that the survey is
understandable. Additionally, it is necessary to be cognisant of issues that might
arise due to translation differences if working in an area that speaks a language
other than the first-language of the researchers. For the work in Galvez, the
survey was kept to one page (double-sided) and questions were organized in an
appropriate sequence to facilitate the interview process. In the Metropolitan
region, surveys were more complex, but questions were kept to a minimum and
thought out in advance in terms of analysis, with many closed and semi-
structured questions, rather than entirely open-ended questions. This allowed for
data entry templates to include drop down menus as well as open areas for
answers outside the available list. Furthermore, much discussion took place
around ensuring that the difference between acute and chronic diarrhea was well
understood by interviewers. In Argentina for example, "colitis" in Spanish was
not understood as a chronic illness, as is normally the case for the general
population in English.
High response rates were achieved in both study locations; 61% in Galvez
and 76% in the Metropolitan region. These are among the highest response
rates for cross-sectional population-based burden of Gl studies. Campaigns to
raise awareness within the community can help in ensuring high response rates
and facilitate the work of the interviewers. Television, radio and newspapers or
individual letters sent to the homes in the area could be useful. In Galvez, the
196
local television and radio station conducted interviews with CeDA representatives
and me to inform the community about the study.
It is essential that all interviewers for Gl surveys have clearly visible
identification (e.g., badge or nametag) identifying them so respondents are not
suspicious or afraid to participate. Furthermore, hiring interviewers from the
community will help ensure they know the area, how to get from one place to
another and are familiar with local customs and language. Students and
workers in the areas of public health, medicine, nursing and veterinary medicine
are suitable interviewers as they may have a better understanding of research
principles and the importance of Gl than the general population. Nevertheless,
proper training is essential. We conducted role-playing and trouble-shooting
exercises which were a very useful way to discuss potential scenarios that might
occur out in the field. Using examples from previous studies can also help
illustrate the importance of certain practices and methods for data collection.
In total, 2915 and 6047 surveys were completed in Galvez and the
Metropolitan region, respectively. The information that was collected pertained to
symptoms of diarrhea and vomiting, secondary symptoms, socio-demographic
factors as well as medical system use, and in the Metropolitan region, Chile,
survey information on food and water consumption and general hygiene risk
factors was collected.
Key results from the analysis of the survey data include the observations
that the monthly prevalence of diarrhea in Galvez was 3.4% and the monthly
prevalence of Gl in the Metropolitan region was 7.7%. The annual incidence rate
197
of Gl in the Metropolitan region, Chile ranged from 0.98 to 2.3 episodes per
person-year, for a 30-day and a 7-day recall period, respectively. This illustrates
the significant burden of GI as well as the effect of shorter and longer recall
periods in burden of Gl surveys, in these communities.
In Galvez, comparisons were made of a 7-day and a 30-day recall period,
while in the Metropolitan region, Chile, 7-day, 15-day and 30-day recall periods
were included. Discussion and debate in the literature on recall period selection
and study methodology is ongoing. Prospective cohort studies are subject to
less recall bias and thus likely to generate more accurate burden estimates;
however, they are more expensive and time consuming to conduct. Cross-
sectional studies on the other hand, offer the advantages of being relatively
inexpensive and less time and labour intensive, and require the selection of an
appropriate recall period that minimizes potential recall bias but is feasible to
administer. Stool sample requests that are often incorporated in prospective
cohort studies have the potential to cause under-estimation of the burden due to
participants' aversion to providing a sample, while longer recall periods in cross-
sectional studies can lead to 'telescoping' and resultant over-estimation of the
burden. This research illustrates the potential under-estimation of the burden of
Gl when using longer recall periods, assuming shorter recall periods are less
subject to recall bias. This observation contradicts the thinking that 'telescoping'
of respondents in cross-sectional surveys occurs and results in over-estimation
of the burden.
198
As indicated by the WHO, syndromic surveillance of Gl requires, at
minimum, that someone seek medical care to be captured and counted in the
surveillance system. This source of information can provide basic case counts
and potentially can be used for outbreak identification. Of greater use is
laboratory-based surveillance that requires stool sample collection, submission
and testing. However, as more detailed information is sought, fewer cases are
captured. For example, my research in Galvez, Argentina, 26% of cases sought
medical care, and in the Metropolitan region, Chile 21% sought medical care,
highlighting the under-estimation of the burden of Gl in passively collected
surveillance data which rely solely on records of patient presentation at a medical
facility. This underscores the need for burden of Gl studies that are conducted
within the general population.
Of note, in most other population-level burden of Gl studies, women
typically had higher rates of Gl than men; however, in both study locations of this
research, men had nearly the same rate of Gl as women. This could indicate a
potential cultural-gender difference in the epidemiology of Gl in these
populations, perhaps due to differences in eating habits, occupations, or general
hygiene. Furthermore, men were more likely than women to have poor hygiene
and food safety habits and to consume foods identified to be of 'high Gl risk' in
the Metropolitan region, Chile. This information could be useful for more
targeted, population-specific interventions and education activities in the future.
Information specific to behaviours associated with Gl could be useful for
prevention and control activities. My research identified that risk factors
199
associated with Gl in the Chilean study included consumption of undercooked
poultry, beef and cheese made from unpasteurized milk, as well as increasing
consumption of water and using boiling as a method to treat drinking water. It
was not possible to infer causal associations as we are not sure if any of these
behaviours occurred prior to or perhaps as a result of, developing Gl.
Nevertheless, it is useful to highlight potential areas for improvement in terms of
foodborne and waterborne disease prevention and several of these associations
are in line with other measures of causality including biological plausibility and
consistency with other research.
Application of some of the results from the population survey, combined
with information from the literature and a laboratory survey enabled us to
estimate the pathogen-specific burden in the Metropolitan region, Chile, 2008.
We estimated community-level incidence of infections due to Salmonella,
Campylobacter and Shigella to be 1140, 233 and 278 per 100,000 person-years,
respectively. These results highlight the considerable pathogen-specific under
reporting that exists and could be useful for public health interventions.
Key strengths of the research described in this dissertation are the large
sample sizes in the surveys with all ages and both genders represented and the
high response rates. These factors contribute to the representativeness of the
sample and the internal validity of the results. Door-to-door surveys, although
time consuming, are likely to have contributed to achieving such high response
rates (61% and 76%). Exploring the impact of different recall periods in cross-
sectional population burden of Gl studies provides an innovative element to this
200
dissertation. Much discussion has arisen around study methodology and how to
best determine accurate burden of Gl estimates at the population level. The
issue of recall bias has been at the center of these discussions. By exploring
different recall periods we have shed light on this topic and furthered population-
based burden of Gl study methodology by demonstrating the utility of a shorter
recall period in population-based burden of Gl studies.
Population-level information on the burden of Gl from South America was
lacking prior to this work. Providing information from an under-represented part
of the world is a major contribution to the international literature. Current efforts
from the WHO to determine the global burden of foodborne disease can utilise
research like mine to better inform estimates and continue to elevate the level of
research being done in less developed parts of the world. Additionally, English
language publication of research from Spanish-speaking countries broadens the
level of international awareness.
One drawback of this study is the cross-sectional study design that was
used for the surveys. This design is not ideal for drawing causal associations
and formal hypothesis testing, as timing of events is not always clear. However,
it provides considerable breadth of information in a convenient and efficient
manner that would be difficult and costly to obtain using other study designs
(e.g., prospective cohort).
Another potential limitation was the lack of survey questions aimed at
determining details on costs associated with lost productivity and medical
expenses; however, information on number of medical visits, hospitalizations and
201
number of days missed from school or work due to illness was collected. These
values can be compared to other studies to help establish the economic burden,
and in the future could be incorporated with local average medical costs and
salary information to estimate the economic burden associated with Gl in these
communities.
Additionally, despite making considerable efforts to obtain a truly
representative, random sample, the study populations in both locations were
more likely to be female and older than the general population in the respective
communities. This weakness was somewhat expected as it is seen in many
population-based burden of Gl studies. This may be due to women being more
willing to participate and that parents are protective of their children so do not
wish them to participate in such surveys. The practice of selecting the person
with the next birthday was easy to implement in the field and overall did allow for
both genders and all ages to participate and be represented in the data.
As is often the case, we are left with as many questions when we finish as
when we started. Going forward from this research there are several projects
and recommendations for further study that I would suggest. An international
comparison of different recall periods used in burden of Gl cross-sectional
studies is needed in order to strengthen the evidence on the effect of shorter and
longer recall periods and determine if the results of this dissertation are
comparable to studies from other countries. This could have broad-reaching
effects on study design methodology in the future.
202
Additional studies in Latin American countries and developing countries
are needed. Of particular interest would be investigation of the gender
differences in rates of Gl in other locations and determination if, at least in some
populations, rates of Gl are similar for males and females, or potentially higher
among males, a finding thus far not seen in developed countries. Furthermore,
additional cross-sectional population surveys in other developing countries would
be useful for estimating the population-level burden of Gl, and can be
recommended in the WHO Foodbome Disease Burden Epidemiology Reference
Group (FERG) country protocols.
The burden of Gl in the study communities might be reduced by
developing or enhancing existing food safety campaigns, perhaps specifically
focusing on the demographic groups found to have higher rates of poor food
safety and hygiene behaviours. Additionally, evaluating the costs associated
with Gl (i.e., medical costs and lost productivity) to assess the economic impact
could help justify and support such campaigns to minimize Gl in the population
and to promote cost-effective ways to improve food safety.
If funds and resources permitted, it would be useful to conduct a year-
round survey to assess any bias that might result from selecting two time periods
to administer the survey. Furthermore, obtaining more information at the
laboratory level and assessing the under-reporting and under-estimation of other
important enteric pathogens would be of benefit.
On a more personal note, the work described in this dissertation, as is
likely the case in most doctoral research, was at once a 'labour of love' and a set
203
of considerable challenges. Patience and persistence are essential to success in
these sorts of situations. For me, it reaffirmed the importance of personal
relationships and networks in order to get a job done. Without these networks
and connections this work would not have been possible. We brought together
local, regional, national and international organizations, partners from North and
South America to make this project a success. It taught me the value of clear
communication and to never assume that things are they way you expect them to
be. This especially applies when working in different cultures, languages and
countries. What may seem obvious is often not, and how you phrase a question
is key to obtaining the answer you need.
In closing, the research described in this dissertation has demonstrated
the significant burden of Gl that is not fully captured in surveillance and outbreak
registries. It has taken steps to fill the void of population-level burden of Gl
information from developing countries, in particular from South America and it
has contributed to burden of Gl research methodology, in particular for use in
developing countries.
204

APPENDICES
205
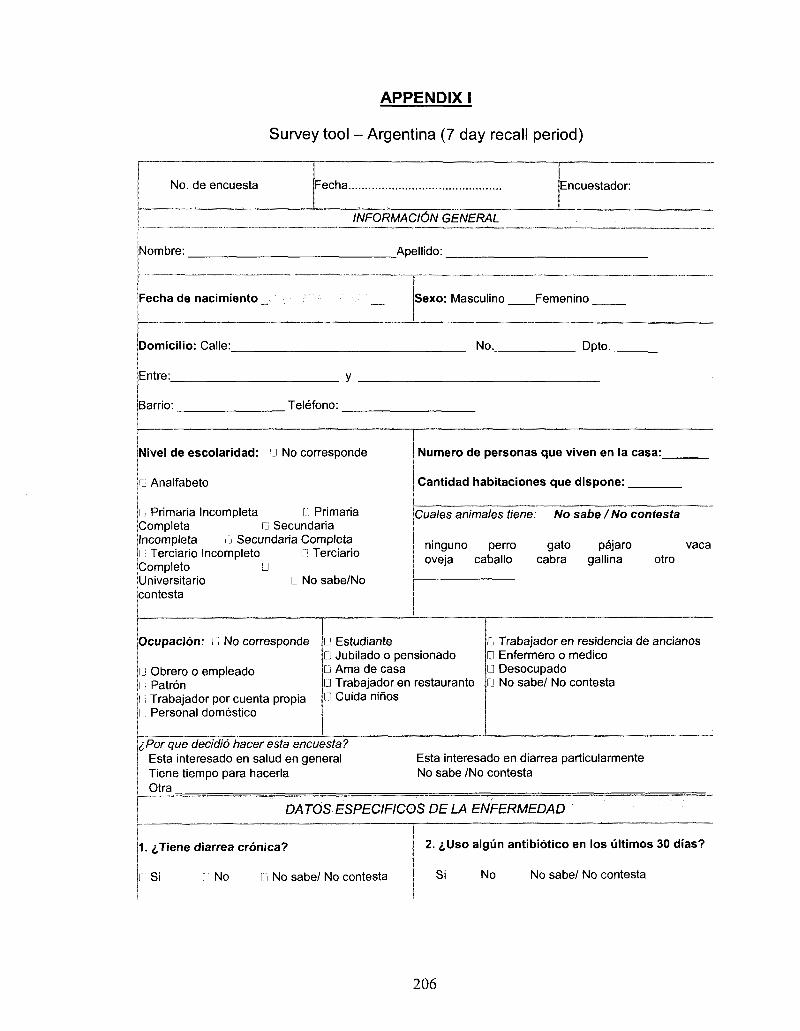
APPENDIX I
Survey tool - Argentina (7 day recall period)
No. de encuesta Fecha Encuestador:
INFORMACldN GENERAL
Nombre:
Fecha de nacimiento _
Aoellido:
• " • ' " • " ' • ' • ' ' —
Sexo: Masculino Femenino
Domicilio: Calle:_
Entre:
No. Dpto._
Barrio: Telefono:
Nivel de escolaridad: D No corresponde
1 Analfabeto
G Primaria Incompleta G Primaria Completa G Secundaria Incompleta G Secundaria Completa l i Terciario Incompleto G Terciario Completo G Universitario G No sabe/No contesta
Numero de personas que viven en la casa:
Cantidad habitaciones que dispone:
Cuales animates tiene: No sabe I No contesta
ninguno perro gato pajaro vaca oveja caballo cabra gallina otro
Ocupacion: G No corresponde
G Obrero o empleado G Patron l; Trabajador por cuenta propia i Personal domestico
G Estudiante G Jubilado o pensionado G Ama de casa G Trabajador en restaurante G Cuida ninos
G Trabajador en residencia de ancianos 0 Enfermero o medico G Desocupado • No sabe/ No contesta
iPor que decidio hacer esta encuesta? Esta interesado en salud en general Tiene tiempo para hacerla Otra
Esta interesado en diarrea particularmente No sabe /No contesta
DATOS ESPECIFICOS DE LA ENFERMEDAD
1. ^Tiene diarrea cronica?
Si l: No 11 No sabe/ No contesta
2. &Uso algun antibiotico en los ultimos 30 dias?
Si No No sabe/ No contesta
206
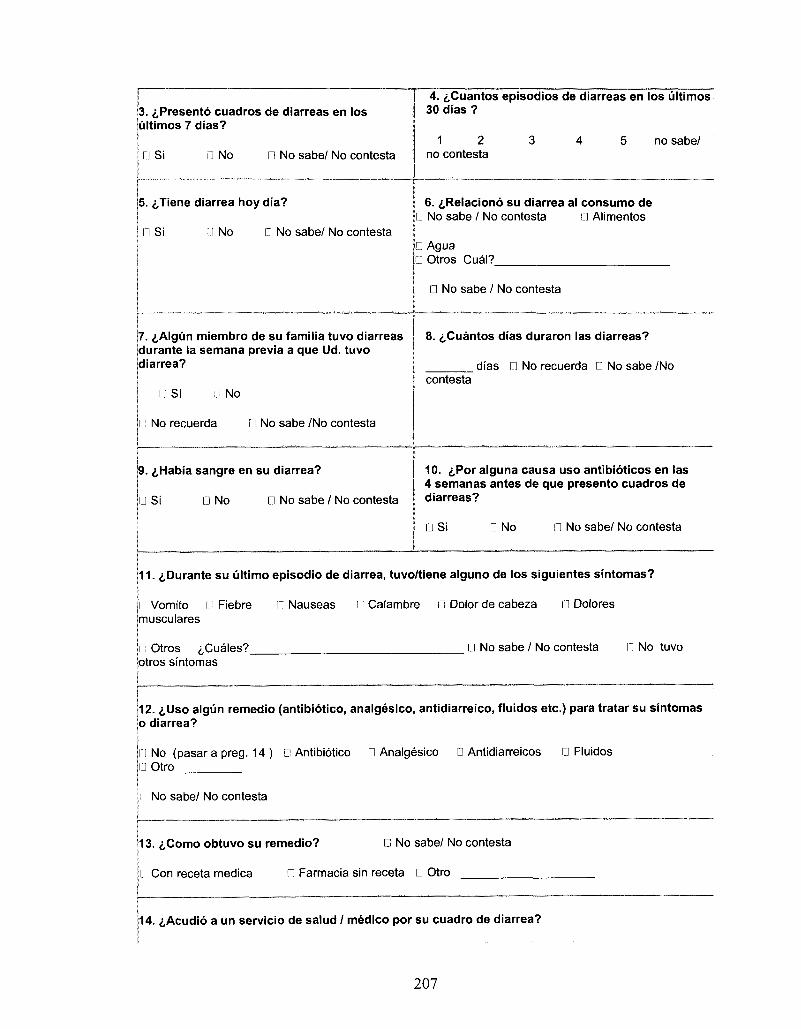
3. i,Presento cuadros de diarreas en los ultimos 7 dias?
Si j No Q No sabe/ No contests
4. &Cuantos episodios de diarreas en los ultimos 30 dias ?
1 2 no contesta
no sabe/
5. ^Tiene diarrea hoy dia?
n Si l l No n No sabe/ No contesta
6. ^Relaciono su diarrea al consumo de n No sabe / No contesta • Alimentos
• Agua 0 Otros Cual?
• No sabe / No contesta
7. i,Algun miembro de su familia tuvo diarreas durante la semana previa a que Ud. tuvo diarrea?
n Si n No
n No recuerda D No sabe /No contesta
8. ^Cuantos dias duraron las diarreas?
dias n No recuerda 0 No sabe /No contesta
9. i,Habia sangre en su diarrea?
n Si D No D No sabe / No contesta
10. £Por alguna causa uso antibioticos en las 4 semanas antes de que presento cuadros de diarreas?
D Si D No • No sabe/ No contesta
11. ^Durante s u ultimo episodio de diarrea, tuvo/tiene alguno de los siguientes sintomas?
I Vomito I Fiebre l i Nauseas n Calambre in Dolor de cabeza G Dolores imusculares
I"': Otros ,i,Cuales?_ otros sintomas
[J No sabe / No contesta n No tuvo
12. i,Uso algun remedio (antibiotico, analgesico, antidiarreico, fluidos etc.) para tratar su sintomas 0 diarrea?
IJ No (pasara preg. 14 ) D Antibiotico D Analgesico D Antidiarreicos 0 Fluidos III Otro
1 No sabe/ No contesta
13. <j,Como obtuvo su remedio? C No sabe/ No contesta
Li Con receta medica • Farmacia sin receta • Otro
14. i,Acudio a un servicio de salud / medico por su cuadro de diarrea?
207
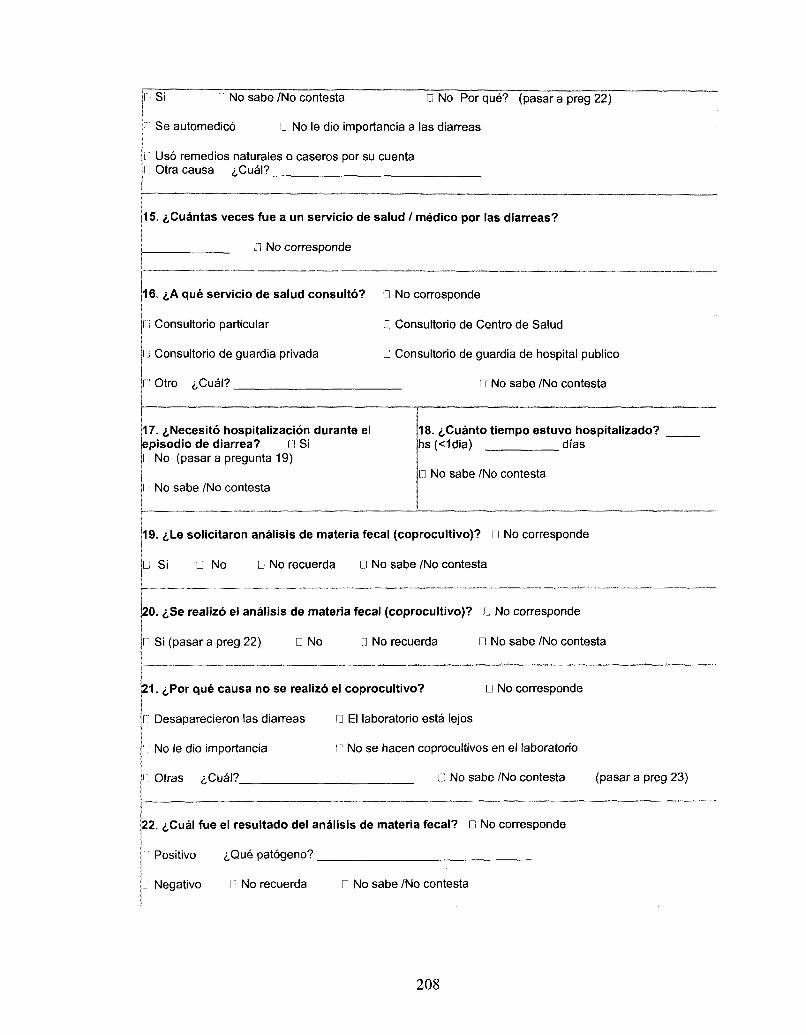
I Si n No sabe /No contesta D No Porque? (pasar a preg 22)
n Se automedico D No le dio importancia a las diarreas
1.1 Uso remedios naturales o caseros por su cuenta n Otra causa <j,Cual?
15. ^Cuantas veces fue a un servicio de salud / medico por las diarreas?
D No corresponde
16. £,A que servicio de salud consulto? 0 No corresponde
n Consultorio particular D Consultorio de Centra de Salud
li Consultorio de guardia privada D Consultorio de guardia de hospital publico
Otro <j,Cual? n No sabe /No contesta
17. £,Necesito hospitalizacion durante el episodio de diarrea? U Si
No (pasar a pregunta 19)
l ] No sabe /No contesta
18. d,Cuanto tiempo estuvo hospitalizado? hs(<1dia) dias
D No sabe /No contesta
19. ^Le solicitaron analisis de materia fecal (coprocultivo)? D No corresponde
IJ Si • No D No recuerda D No sabe /No contesta
20. i,Se realizo el analisis de materia fecal (coprocultivo)? • No corresponde
n Si (pasar a preg 22) D No D No recuerda D No sabe /No contesta
21. £Por que causa no se realizo el coprocultivo? • No corresponde
n Desaparecieron las diarreas • El laboratorio esta lejos
No le dio importancia l.l No se hacen coprocultivos en el laboratorio
Otras ^Cual? • No sabe /No contesta (pasar a preg 23)
22. i,Cual fue el resultado del analisis de materia fecal? D No corresponde
Positivo iQue patogeno?
n Negativo II No recuerda • No sabe /No contesta
208
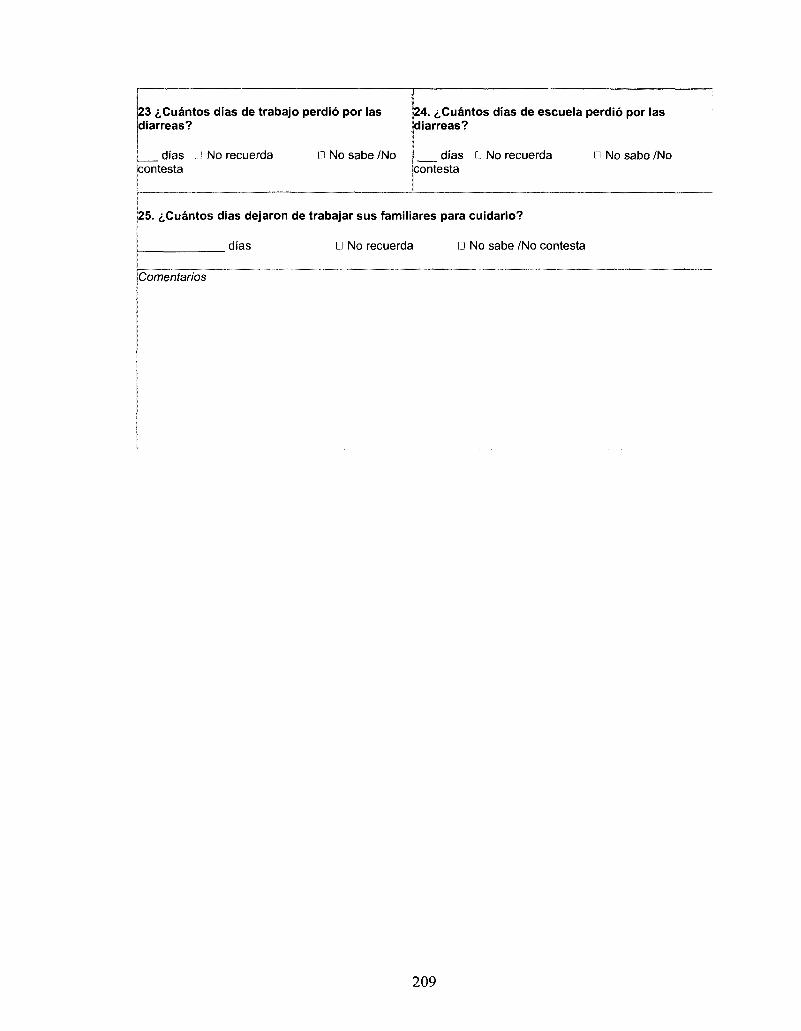
23 t&iantos dias de trabajo perdio por las diarreas?
dias U No recuerda n No sabe /No contesta
24. ^Cuantos dias de escuela perdio por las diarreas?
dias G No recuerda in No sabe /No contesta
25. t&iantos dias dejaron de trabajar sus familiares para cuidarlo?
dias • No recuerda D No sabe /No contesta
Comentarios
209
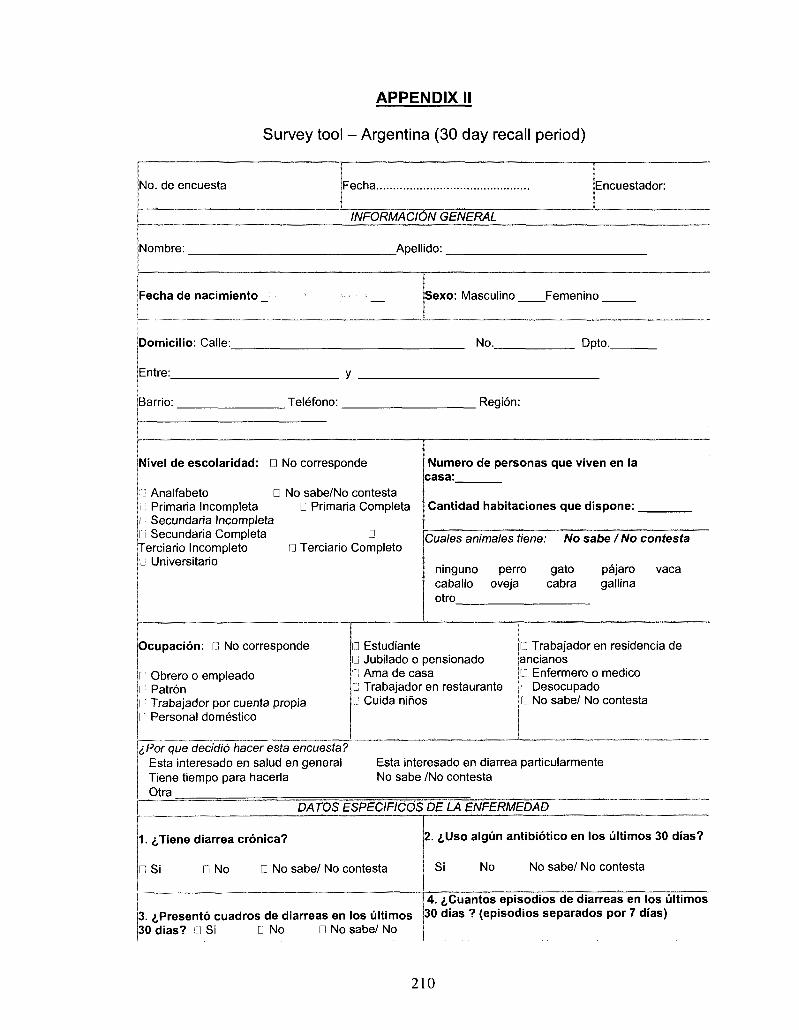
APPENDIX II
Survey tool - Argentina (30 day recall period)
No. de encuesta Fecha. Encuestador:
INFORhMOONGENERAL
Nombre: _Apellido:.
Fecha de nacimiento Sexo: Masculino Femenino
Domicilio: Calle:
Entre:
No. Dpto..
Barrio: Telefono: Region:
Nivel de escolaridad: D No corresponde
Analfabeto Primaria Incompleta Secundaria Incompleta Secundaria Completa
Terciario Incomplete) Universitario
D No sabe/No contesta D Primaria Completa
D 0 Terciario Completo
Numero de personas que viven en la casa:
Cantidad habitaciones que dispone: _
Cuales animates tiene: No sabe I No contesta
ninguno perro gato pajaro vaca caballo oveja cabra gallina otro
Ocupacion: n No corresponde
Obrero o empleado Patron Trabajador por cuenta propia Personal domestico
D Estudiante • Jubilado o pensionado n Ama de casa L'J Trabajador en restaurante D Cuida nifios
• Trabajador en residencia de ancianos D Enfermero o medico n Desocupado G No sabe/ No contesta
iPor que decidio hacer esta encuesta? Esta interesado en salud en general Tiene tiempo para hacerla Otra
Esta interesado en diarrea particularmente No sabe /No contesta
DATOS ESPECIFICOS DE LA ENFERMEDAD
1. ^Tiene diarrea cronica?
n Si D No D No sabe/ No contesta
2. i,Uso algiin antibiotico en los ultimos 30 dias?
Si No No sabe/ No contesta
3. ^Presento cuadros de diarreas en los ultimos 30 dias? 0 Si • No • No sabe/ No
4. £,Cuantos episodios de diarreas en los ultimos 30 dias ? (episodios separados por 7 dias)
210
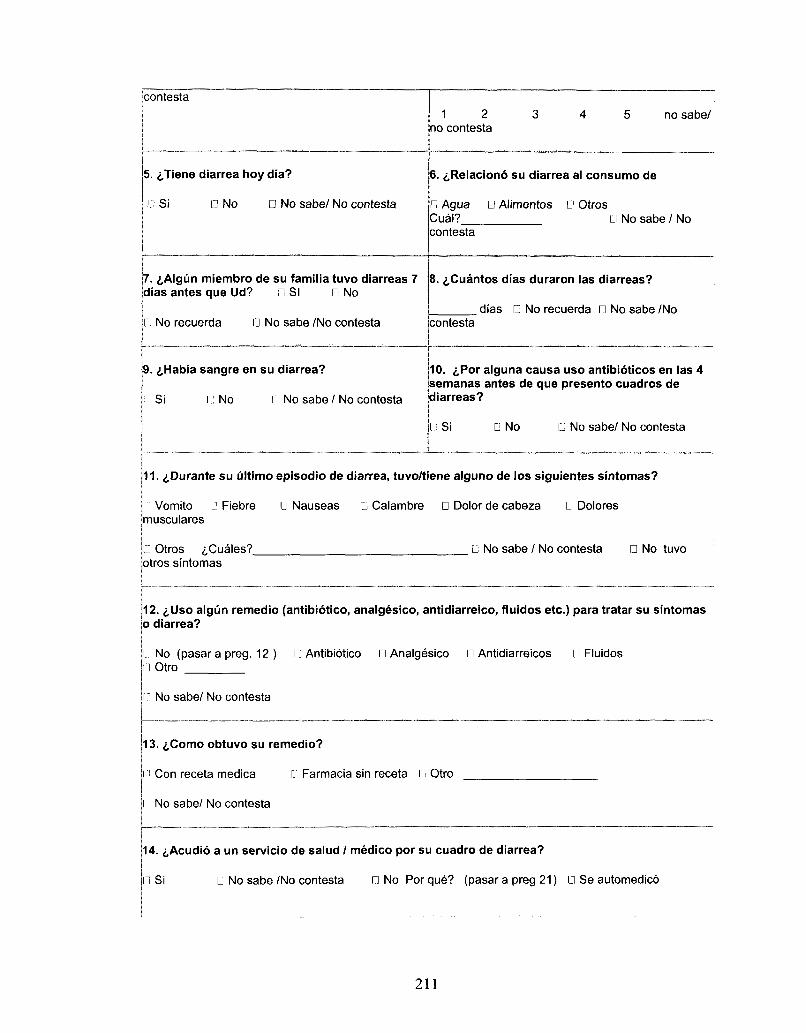
contests
5. ^Tiene diarrea hoy dia?
n Si • No • No sabe/ No contesta
7. iAIgiin miembro de su familia tuvo diarreas 7 dias antes que Ud? 0 SI D No
n No recuerda G No sabe /No contesta
9. i,Habia sangre en su diarrea?
I Si I: No l.'i No sabe / No contesta
1 2 3 4 5 no sabe/ no contesta
6. i,Relaciono su diarrea al consumo de
D Agua • Alimentos • Otros Cual? n No sabe / No contesta
8. ^Cuantos dias duraron las diarreas?
dias • No recuerda • No sabe /No contesta
10. <,Por alguna causa uso antibioticos en las 4 semanas antes de que presento cuadros de diarreas?
Li Si D No Li No sabe/ No contesta
11. ^Durante su ultimo episodio de diarrea, tuvo/tiene alguno de los siguientes sintomas?
l i: Vomito u Fiebre U Nauseas D Calambre D Dolor de cabeza • Dolores musculares
D Otros iCuales? • No sabe / No contesta D No tuvo otros sintomas
12. <,Uso algun remedio (antibiotico, analgesico, antidiarreico, fluidos etc.) para tratar su sintomas 0 diarrea?
• No (pasar a preg. 12 ) • Antibiotico • Analgesico D Antidiarreicos D Fluidos LI Otro
1 J No sabe/ No contesta
13. i,Como obtuvo su remedio?
I ! Con receta medica 0 Farmacia sin receta Li Otro
jl: No sabe/ No contesta
14. i,Acudio a un servicio de salud / medico por su cuadro de diarrea?
in Si Q No sabe/No contesta LI No Por que? (pasar a preg 21) LI Se automedico
211
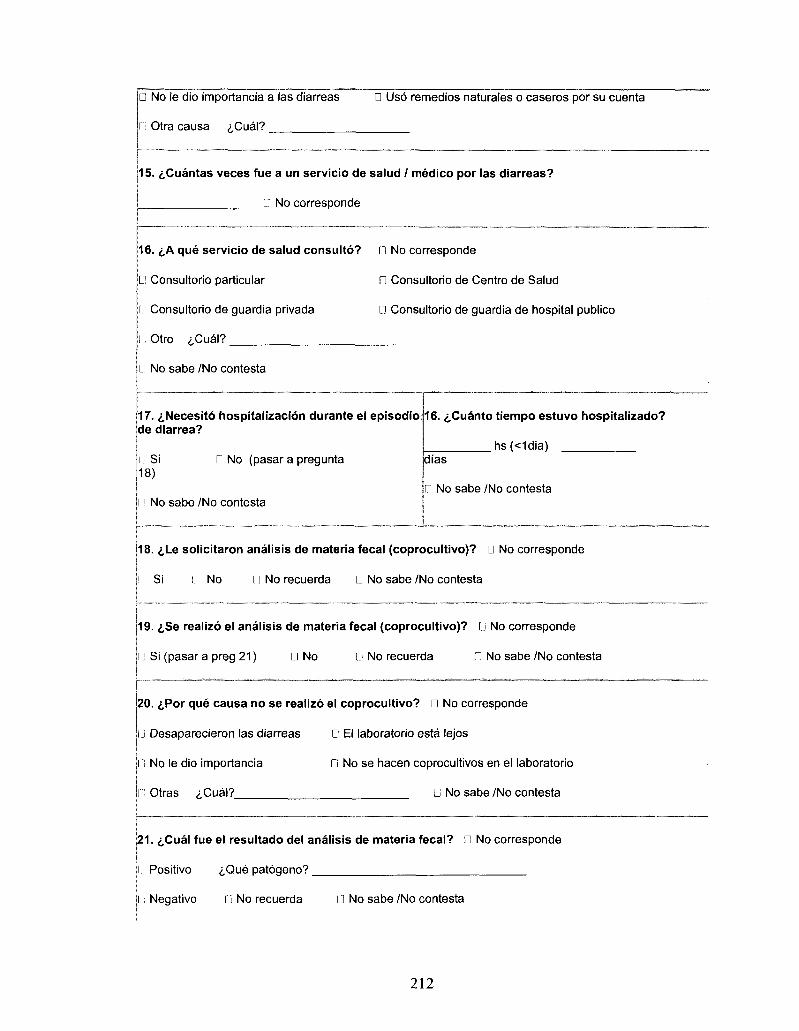
• No le dio importancia a las diarreas • Uso remedios naturales o caseros por su cuenta
n Otra causa iCua\?
15. i.Cuantas veces fue a un servicio de salud / medico por las diarreas?
LI No corresponde
16. <j,A que servicio de salud consulto?
LI Consultorio particular
L! Consultorio de guardia privada
l; Otro <j,Cual?
Ll No sabe /No contesta
17. tNecesito hospitalizacion durante el episodio 16. ^Cuanto tiempo estuvo hospitalizado? de diarrea?
hs(<1dia) n Si Li No (pasar a pregunta dias 18)
Ll No sabe /No contesta I! No sabe /No contesta
18. <,Le solicitaron analisis de materia fecal (coprocultivo)? Ll No corresponde
! Si 11 No M No recuerda IJ No sabe/No contesta
19. ^Se realizo el analisis de materia fecal (coprocultivo)? D No corresponde
n Si (pasar a preg 21) Li No D No recuerda • No sabe /No contesta
20. ^Por que causa no se realizo el coprocultivo? • No corresponde
Ll Desaparecieron las diarreas D El laboratorio esta lejos
Ll No le dio importancia Li No se hacen coprocultivos en el laboratorio
G Otras iCual? Q No sabe /No contesta
21. i,Cual fue el resultado del analisis de materia fecal? D No corresponde
l Positivo iQue patogeno?
l; Negativo Li No recuerda Ll No sabe /No contesta
D No corresponde
0 Consultorio de Centra de Salud
n Consultorio de guardia de hospital publico
212
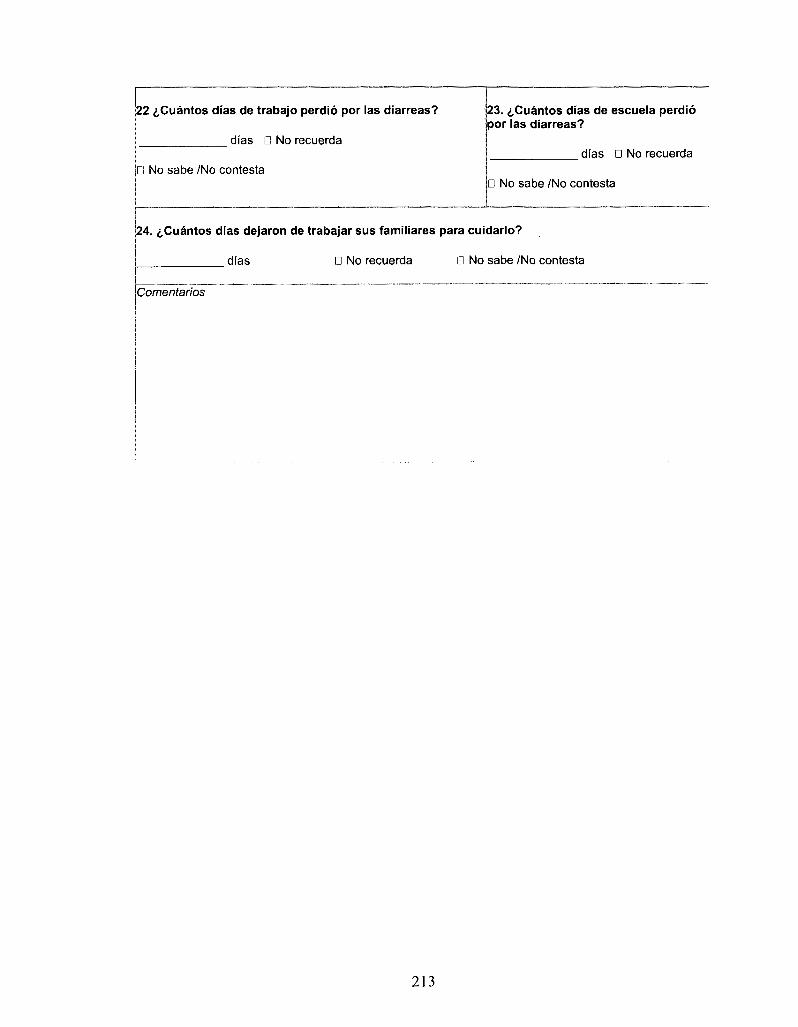
22 i,Cuantos dias de trabajo perdio por las diarreas? 23. iCuantos dias de escuela perdio por las diarreas?
dias • No recuerda dias D No recuerda
n No sabe /No contesta D No sabe /No contesta
24. ^Cuantos dias dejaron de trabajar sus familiares para cuidarlo?
dias • No recuerda 0 No sabe /No contesta
iComentarios
213
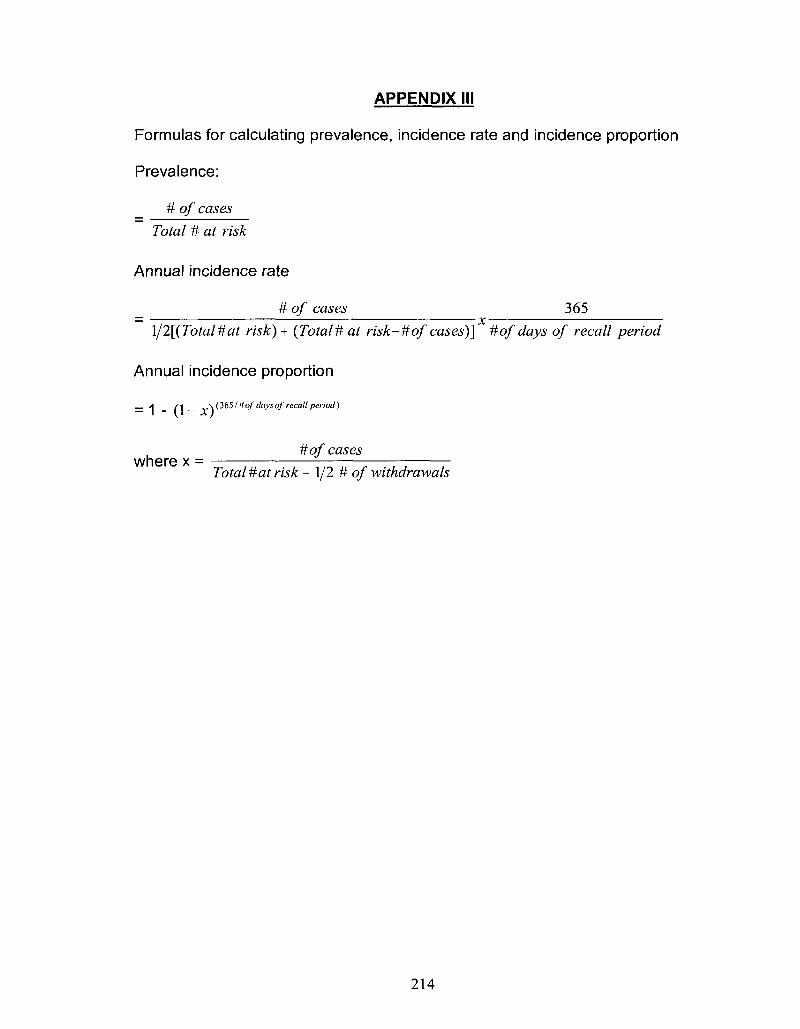
APPENDIX III
Formulas for calculating prevalence, incidence rate and incidence proportion
Prevalence:
# of cases
Total # at risk
Annual incidence rate
# of cases 365
\/2[(Total#at risk) + (Total# at risk-#of cases)] #of days of recall period
Annual incidence proportion
A (] __ y\ (3651'Hofdays ofrecall period)
# ofcases where x =
Total # at risk - 1/2 # of withdrawals
214
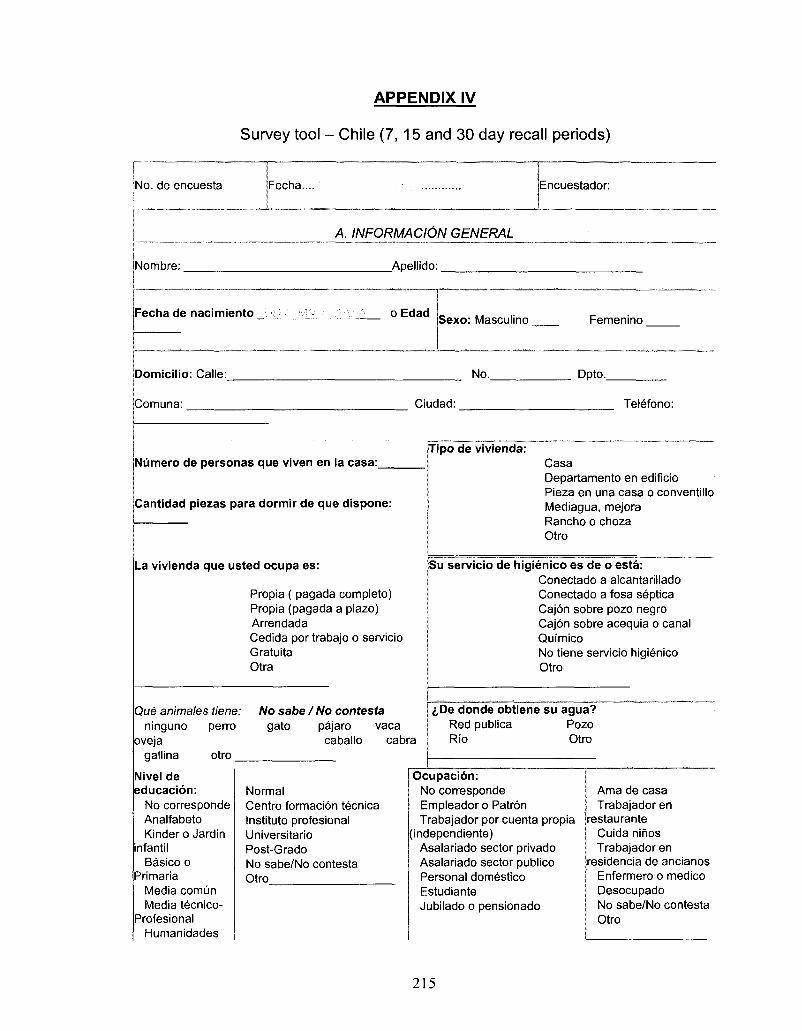
APPENDIX IV
Survey tool - Chile (7, 15 and 30 day recall periods)
No. de encuesta Fecha.... Encuestador:
A. INFORMAClON GENERAL
Nombre:
Fecha de nacimiento _
Domicilio: Calle:
Apellido:
o Edad Sexo: Masculino
No.
Femenino
Dpto.
iComuna: Ciudad: Telefono:
Niimero de personas que viven en la casa: Tipo de vivienda:
Cantidad piezas para dormir de que dispone:
La vivienda que usted ocupa es:
Propia ( pagada completo) Propia (pagada a plazo) Arrendada Cedida por trabajo o servicio Gratuita Otra
Que animales tiene: ninguno perro
oveja gallina otro
No sabe I No contesta gato pajaro vaca
caballo cabra
Casa Departamento en edificio Pieza en una casa o conventillo Mediagua, mejora Rancho o choza Otro
Su servicio de higienico es de o esta: Conectado a alcantarillado Conectado a fosa septica Cajon sobre pozo negro Cajon sobre acequia o canal Quimico No tiene servicio higienico Otro
<,De donde obtiene su agua? Red publica Pozo Rio Otro
Nivel de educacion:
No corresponde Analfabeto Kinder o Jardin
infantil Basico o
Primaria Media comun Media tecnico-
Profesional Humanidades
Normal Centra formacion tecnica Instituto profesional Universitario Post-Grado No sabe/No contesta Otro
Ocupacion: No corresponde Empleador o Patron Trabajador por cuenta propia
[independiente) Asalariado sector privado Asalariado sector publico Personal domestico Estudiante Jubilado o pensionado
Ama de casa Trabajador en
restaurante Cuida nihos Trabajador en
residencia de ancianos Enfermero o medico Desocupado No sabe/No contesta Otro
215
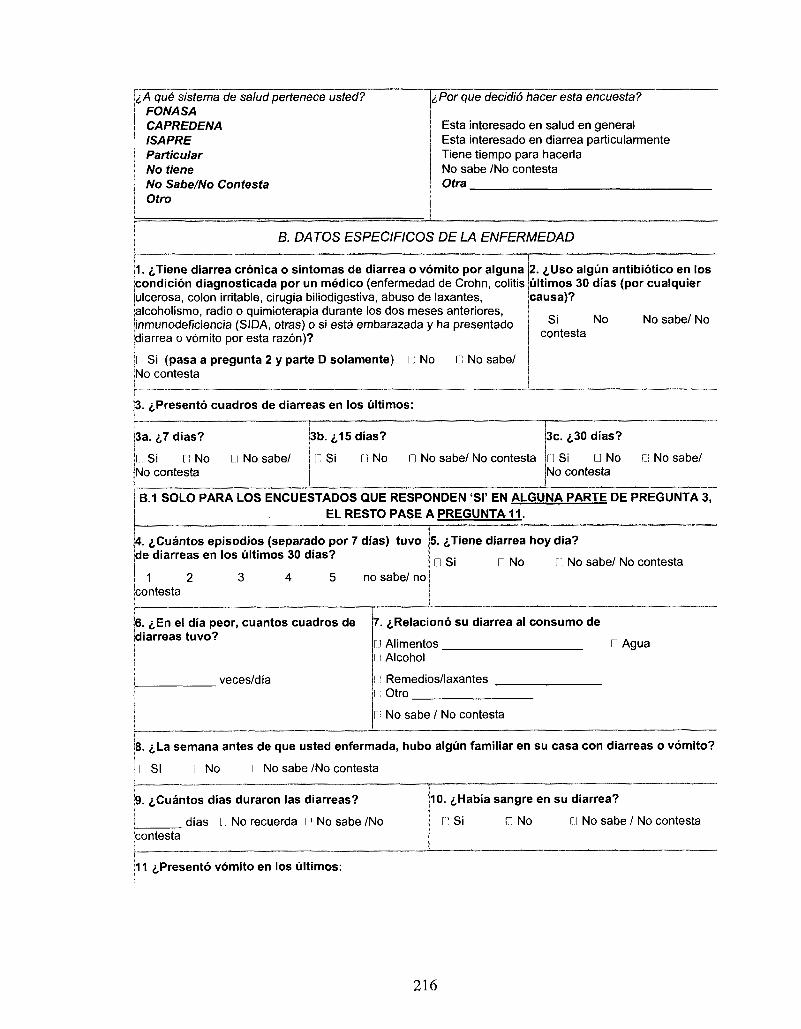
1A que sistema de salud pertenece usted? FONASA CAPREDENA ISAPRE Particular No tiene No Sabe/No Contesta Otro
,/Por que decidio hacer esta encuesta?
Esta interesado en salud en general Esta interesado en diarrea particularmente Tiene tiempo para hacerla No sabe /No contesta Otra
B. DATOS ESPECIFICOS DE LA ENFERMEDAD
1. ^Tiene diarrea cronica o sintomas de diarrea o vomito por alguna condicion diagnosticada por un medico (enfermedad de Crohn, colitis ulcerosa, colon irritable, cirugia biliodigestiva, abuso de laxantes, alcoholismo, radio o quirnioterapia durante los dos meses anteriores, inmunodeficiencia (SIDA, otras) o si esta embarazada y ha presentado diarrea o vomito por esta razon)?
I Si (pasa a pregunta 2 y parte D solamente) [ No I No sabe/ No contesta
2. i,Uso algun antibiotico en los ultimos 30 dias (por cualquier causa)?
Si No No sabe/ No contesta
3. {.Presento cuadros de diarreas en los ultimos:
3a. ij dias?
i; Si 11 No No contesta
Ll No sabe/
3b. ^15 dias?
C Si r.l No n No sabe/ No contesta
3c. ^30 dias?
Li Si (J No No contesta
G No sabe/
B.1 SOLO PARA LOS ENCUESTADOS QUE RESPONDEN 'SI' EN ALGUNA PARTE DE PREGUNTA 3, EL RESTO PASE A PREGUNTA 11.
{4. <,Cuantos episodios (separado por 7 dias) tuvo de diarreas en los ultimos 30 dias?
1 2 contesta
no sabe/ no
5. ^Tiene diarrea hoy dia?
D Si D No Li No sabe/ No contesta
6. ^En el dia peor, cuantos cuadros de diarreas tuvo?
veces/dia
7. ^Relaciono su diarrea al consumo de
[j Alimentos Li Alcohol
Remedios/laxantes Otro
Ll Agua
l: No sabe / No contesta
8. iLa semana antes de que usted enfermada, hubo algun familiar en su casa con diarreas o vomito?
11 SI I No i No sabe /No contesta
9. ^Cuantos dias duraron las diarreas? j j dias I".] No recuerda D No sabe /No ;contesta
10. £Habia sangre en su diarrea?
L' Si n No Li No sabe / No contesta
1̂1 ̂ Presento vomito en los ultimos:
216
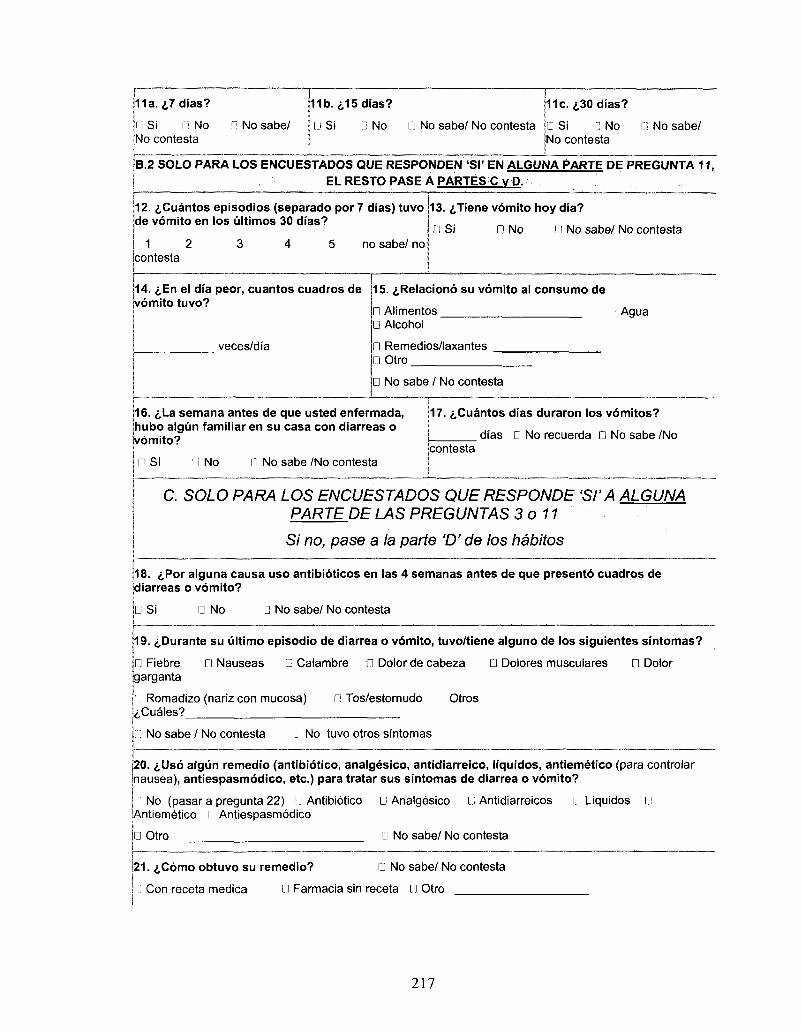
11a. <j,7 dias?
11 Si n No No contests
n No sabe/
11b. <s,15 dias?
D Si D No n No sabe/ No contests
11c. i.30 dias?
• Si n No No contests
D No sabe/
B.2 SOLO PARA LOS ENCUESTADOS QUE RESPONDEN 'SI' EN ALGUNA PARTE DE PREGUNTA 11, EL RESTQ PASE A PARTES C v P.
12. &Cuantos episodios (separado por 7 dias) tuvo de vomito en los ultimos 30 dias?
1 2 contesta
no sabe/ no
13. ^Tiene vomito hoy dia?
D Si 0 No D No sabe/ No contesta
14.«;,En el dia peor, cuantos cuadros de vomito tuvo?
veces/dia
15. i,Relaciono su vomito al consumo de
D Alimentos D Alcohol
0 Remedios/laxantes 0 Otro
• Agua
D No sabe / No contesta
16. 6La semana antes de que usted enfermada, hubo algun familiar en su casa con diarreas o jvomito?
n si f] No D No sabe /No contesta
17. ^.Cuantos dias duraron los vomitos?
dias D No recuerda D No sabe /No contesta
C. SOLO PARA LOS ENCUESTADOS QUE RESPONDE 'SI'A ALGUNA PARTE.DE LAS PREGUNTAS 3 o 11
Si no, pase a la parte V de los habitos
18. iPor alguna causa uso antibioticos en las 4 semanas antes de que presento cuadros de diarreas o vomito?
G Si • No D No sabe/ No contesta
19. ^Durante su ultimo episodio de diarrea o vomito, tuvo/tiene alguno de los siguientes sintomas?
n Fiebre • Nauseas • Calambre D Dolor de cabeza • Dolores musculares D Dolor garganta
Romadizo (nariz con mucosa) • Tos/estornudo Otros ^Cuales?
No sabe / No contesta • No tuvo otros sintomas
20. ^Uso algun remedio (antibiotico, analgesico, antidiarreico, liquidos, antiemetico (para controlar nausea), antiespasmodico, etc.) para tratar sus sintomas de diarrea o vomito?
I No (pasar a pregunta 22) IJ Antibiotico • Analgesico G Antidiarreicos r.'l Liquidos G Antiemetico r! Antiespasmodico
G Otro G No sabe/ No contesta
|21. ,f,C6mo obtuvo su remedio? G No sabe/ No contesta
l: Con receta medica L' l Farmacia sin receta G Otro
217
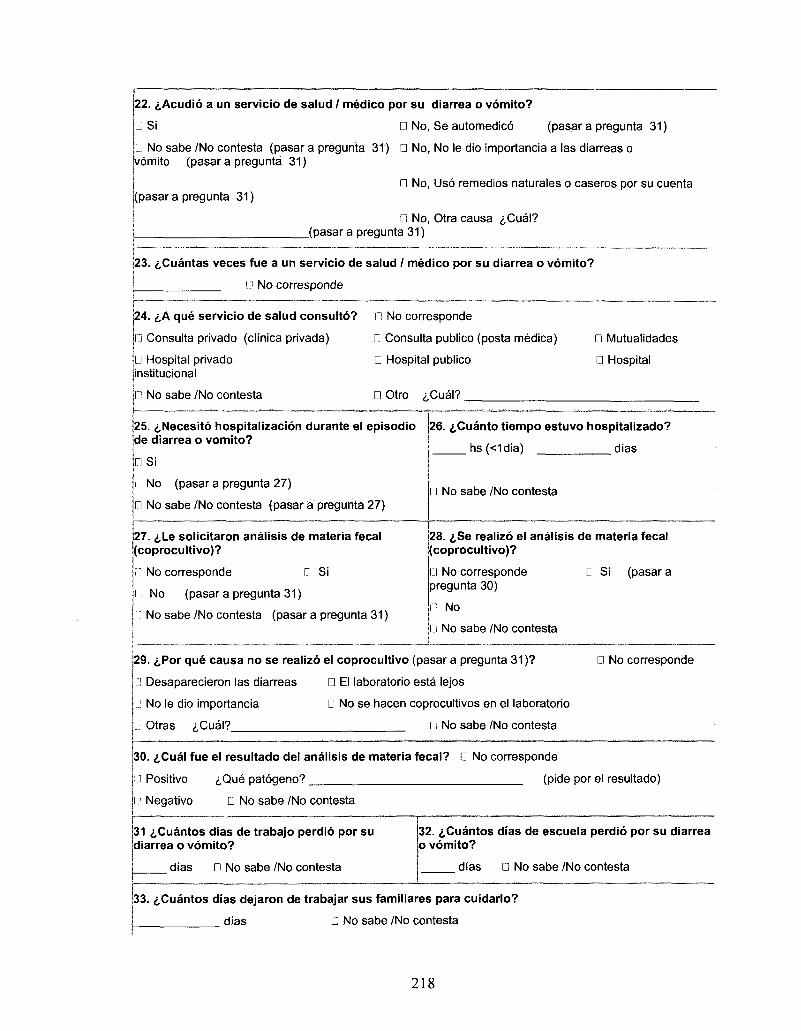
22. i,Acudio a un servicio de salud / medico por su
GSi • No,
D No sabe /No contesta (pasar a pregunta 31) • No vomito (pasar a pregunta 31)
(pasar a pregunta 31) • No
D No (pasar a orequnta 31)
diarrea o vomito?
Se automedico (pasar a pregunta
No le dio importancia a las diarreas o
31)
Uso remedios naturales o caseros por su cuenta
Otra causa <j,Cual?
23. £Cuantas veces fue a un servicio de salud / medico por su diarrea o vomito?
i l No corresponde
24. ^A que servicio de salud consulto? n No corresponde
lj Consulta privado (clinica privada) • Consulta publico (posta medica) D Mutualidades
D Hospital publico • Hospital D Hospital privado institutional
No sabe /No contesta • Otro <^Cual?.
25. ^Necesito hospitalizacion durante el episodio de diarrea o vomito?
nsi
D, No (pasar a pregunta 27)
D No sabe /No contesta (pasar a pregunta 27)
26. i,Cuanto tiempo estuvo hospitalizado?
hs(<1dia) dias
• No sabe /No contesta
27. i,Le solicitaron anaiisis de materia fecal (coprocultivo)?
n No corresponde n Si
I: No (pasar a pregunta 31)
n No sabe /No contesta (pasar a pregunta 31)
28. (,Se realizo el anaiisis de materia fecal (coprocultivo)?
LI No corresponde pregunta 30)
D No
r.1 No sabe /No contesta
D Si (pasara
|29. iPor que causa no se realizo el coprocultivo (pasar a pregunta 31)?
G Desaparecieron las diarreas • El laboratorio esta lejos
• No le dio importancia • No se hacen coprocultivos en el laboratorio
D Otras <j,Cual? D No sabe /No contesta
No corresponde
30. i,Cual fue el resultado del anaiisis de materia fecal? n No corresponde
Li Positivo i,Que patogeno? (pide por el resultado)
l :> Negativo D No sabe /No contesta
31 iCuantos dias de trabajo perdio por su diarrea o vomito?
dias D No sabe /No contesta
32. tCuantos dias de escuela perdio por su diarrea o vomito?
dias • No sabe /No contesta
33. i,Cuantos dias dejaron de trabajar sus familiares para cuidarlo?
dias • No sabe /No contesta
218
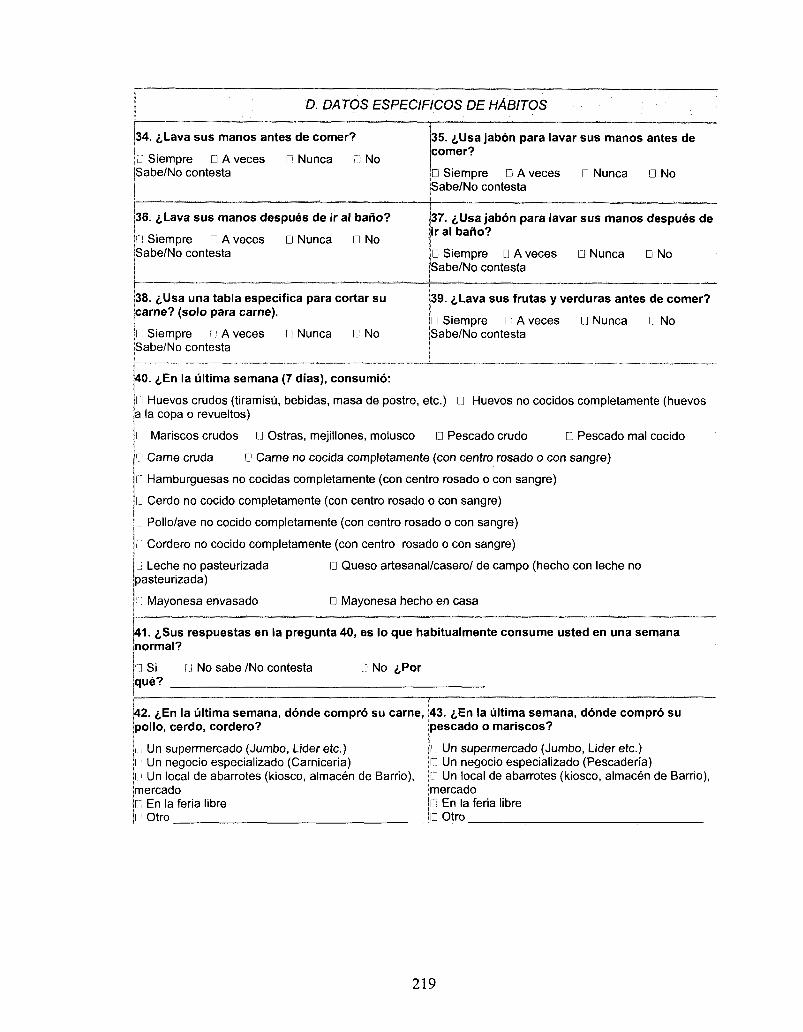
D. DATOS ESPECIFICOS DE HABITOS
34. i,Lava sus manos antes de comer?
Ll Siempre D A veces n Nunca D No Sabe/No contesta
36. 6Lava sus manos despues de ir al bano?
I! Siempre G A veces 0 Nunca D No Sabe/No contesta
38. <j,Usa una tabla especifica para cortar su carne? (solo para carne).
I: Siempre i A veces I'] Nunca I1 No Sabe/No contesta
[] Si n No sabe /No contesta G No ^Por que?
42. i,En la ultima semana, donde com pro su carne, polio, cerdo, cordero?
I.I Un supermercado (Jumbo, Lideretc.) I: Un negocio especializado (Carniceria) i.i Un local de abarrotes (kiosco, almacen de Barrio), mercado G En la feria libre I: Otro
35. <s,Usa jabon para lavar sus manos antes de comer?
D Siempre D A veces • Nunca 0 No Sabe/No contesta
37. iUsa jabon para lavar sus manos despues de ir al bano?
D Siempre D A veces • Nunca D No Sabe/No contesta
39. iLava sus frutas y verduras antes de comer?
• Siempre G A veces D Nunca G No Sabe/No contesta
43. i,En la ultima semana, donde com pro su pescado o mariscos?
[J Un supermercado (Jumbo, Lider etc.) G Un negocio especializado (Pescaderia) n Un local de abarrotes (kiosco, almacen de Barrio), mercado G En la feria libre G Otro
40. <,En la ultima semana (7 dias), consumio:
I ] Huevos crudos (tiramisu, bebidas, masa de postre, etc.) G Huevos no cocidos completamente (huevos a la copa o revueltos)
I Mariscos crudos G Ostras, mejillones, molusco G Pescado crudo G Pescado mal cocido
G Carne cruda G Carne no cocida completamente (con centra rosado o con sangre)
II Hamburguesas no cocidas completamente (con centra rosado o con sangre)
G Cerdo no cocido completamente (con centra rosado o con sangre)
l j Pollo/ave no cocido completamente (con centra rosado o con sangre)
l; Cordero no cocido completamente (con centra rosado o con sangre)
Li Leche no pasteurizada G Queso artesanal/casero/ de campo (hecho con leche no pasteurizada)
G Mayonesa envasado G Mayonesa hecho en casa
41. i,Sus respuestas en la pregunta 40, es lo que habitualmente consume usted en una semana normal?
219
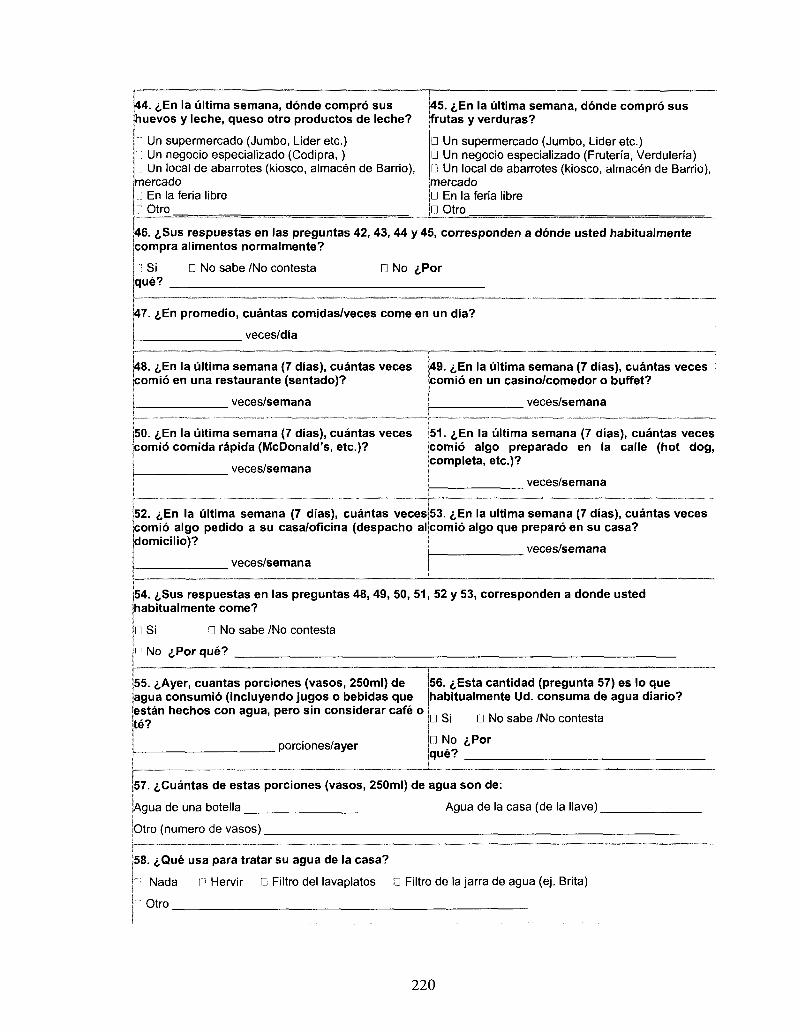
44. £,En la ultima semana, donde compro sus huevos y leche, queso otro productos de leche?
n Un supermercado (Jumbo, Lider etc.) I! Un negocio especializado (Codipra,) L: Un local de abarrotes (kiosco, almacen de Barrio), mercado l ] En la feria libre • Otro
45. £En la ultima semana, donde compro sus frutas y verduras?
D Un supermercado (Jumbo, Lider etc.) • Un negocio especializado (Fruteria, Verduleria) • Un local de abarrotes (kiosco, almacen de Barrio), mercado • En la feria libre • Otro
46. <j,Sus respuestas en las preguntas 42, 43, 44 y 45, corresponden a donde usted habitualmente compra alimentos normalmente?
Si D No sabe /No contesta que?
• No <s,Por
47. £En promedio, cuantas comidas/veces come en un dia?
veces/dia
48. <,En la ultima semana (7 dias), cuantas veces comio en una restaurante (sentado)?
veces/semana
49. £En la ultima semana (7 dias), cuantas veces comio en un casino/comedor o buffet?
veces/semana
50. <;,En la ultima semana (7 dias), cuantas veces comio comida rapida (McDonald's, etc.)?
veces/semana
51. £En la ultima semana (7 dias), cuantas veces comio algo preparado en la calle (hot dog, completa, etc.)?
veces/semana
52. i,En la ultima semana (7 dias), cuantas veces comio algo pedido a su casa/oficina (despacho al domicilio)?
veces/semana
53. <,En la ultima semana (7 dias), cuantas veces comio algo que prepare en su casa?
veces/semana
54. i,Sus respuestas en las preguntas 48, 49, 50, 51, 52 y 53, corresponden a donde usted habitualmente come?
LI Si D No sabe /No contesta
I ] No <,Por que?
55. <,Ayer, cuantas porciones (vasos, 250ml) de agua consumio (incluyendo jugos o bebidas que estan hechos con agua, pero sin considerar cafe o te?
porciones/ayer
56. i,Esta cantidad (pregunta 57) es lo que habitualmente Ud. consuma de agua diario?
• Si • No sabe /No contesta
n No <j,Por Ique?
57. ^Cuantas de estas porciones (vasos, 250ml) de agua son de:
jAgua de una botella Agua de la casa (de la Have)
ptro (numero de vasos)
58. iQue usa para tratar su agua de la casa?
Nada P Hervir n Filtro del lavaplatos D Filtro de la jarra de agua (ej. Brita)
I" Otro
220
Comentarios:
221
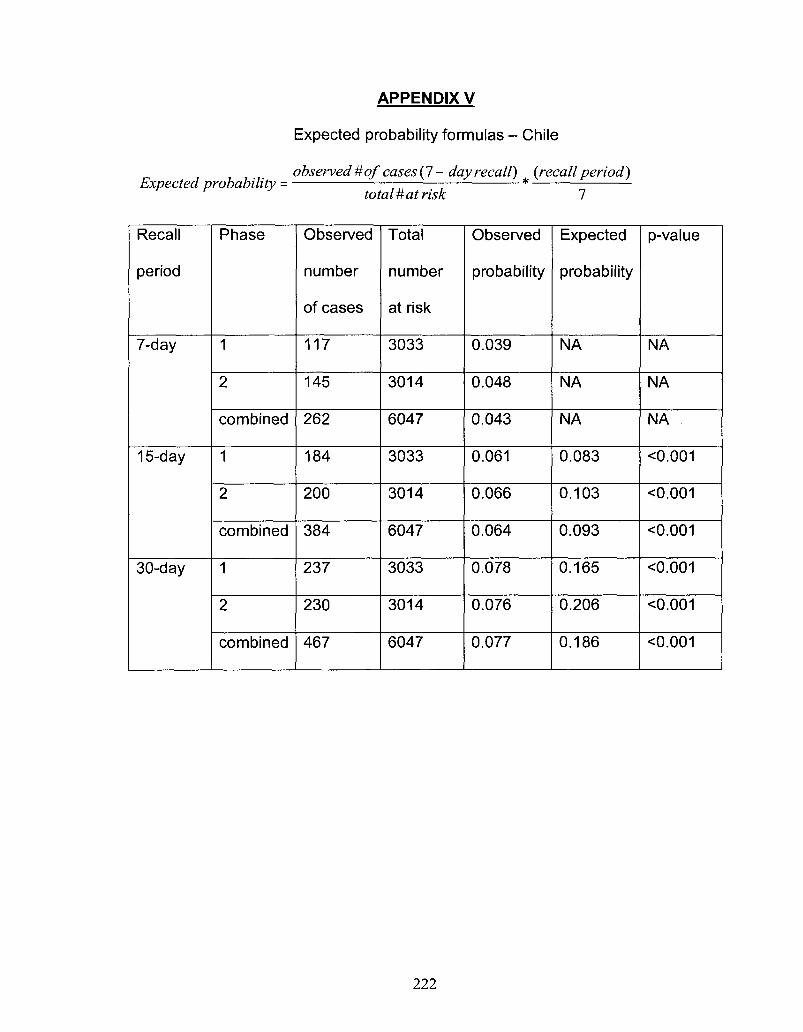
APPENDIX V
Expected probability formulas - Chile
observed # of cases (7 - day recall) {recall period) Expected probability = *
total # at risk 7
Recall
period
7-day
15-day
30-day
Phase
1
2
combined
1
2
combined
1
2
combined
Observed
number
of cases
117
145
262
184
200
384
237
230
467
Total
number
at risk
3033
3014
6047
3033
3014
6047
3033
3014
6047
Observed
probability
0.039
0.048
0.043
0.061
0.066
0.064
0.078
0.076
0.077
Expected
probability
NA
NA
NA
0.083
0.103
0.093
0.165
0.206
0.186
p-value
NA
NA
NA
<0.001
<0.001
O.001
O.001
<0.001
<0.001
222
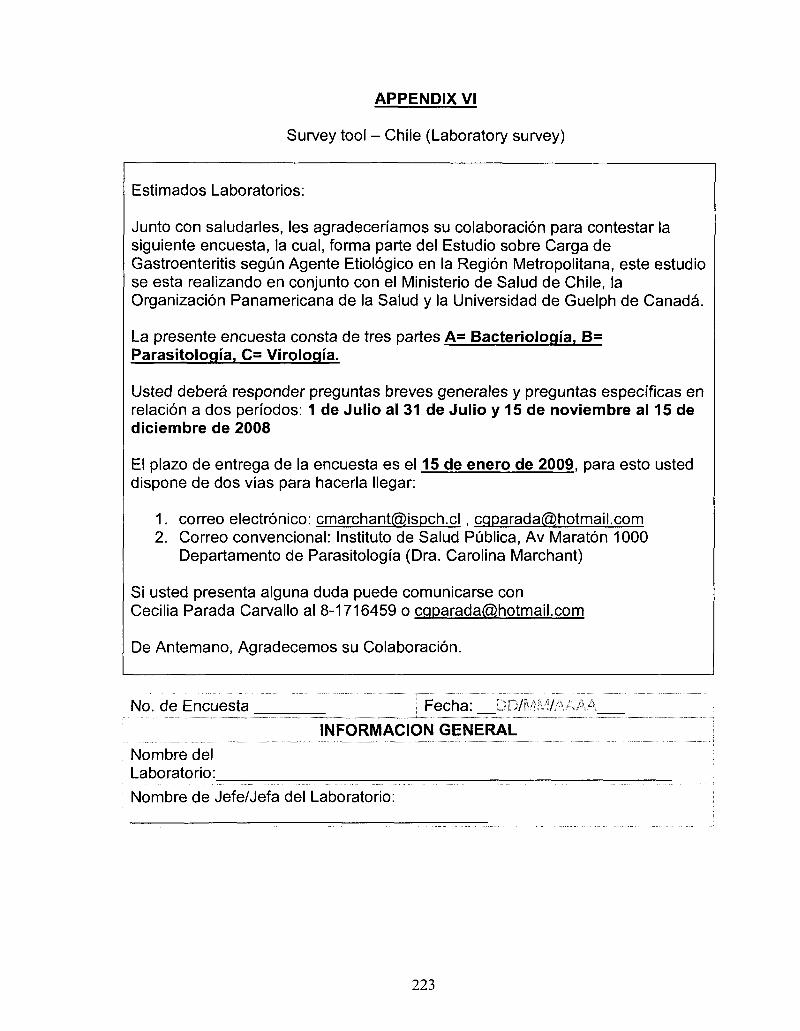
APPENDIX VI
Survey tool - Chile (Laboratory survey)
Estimados Laboratories:
Junto con saludarles, les agradecenamos su colaboracion para contestar la siguiente encuesta, la cual, forma parte del Estudio sobre Carga de Gastroenteritis segun Agente Etiologico en la Region Metropolitana, este estudio se esta realizando en conjunto con el Ministerio de Salud de Chile, la Organizacion Panamericana de la Salud y la Universidad de Guelph de Canada.
La presente encuesta consta de tres partes A= Bacteriologia, B= Parasitology, C= Virologia.
Usted debera responder preguntas breves generales y preguntas especificas en relacion a dos periodos: 1 de Julio al 31 de Julio y 15 de noviembre al 15 de diciembre de 2008
El plazo de entrega de la encuesta es el 15 de enero de 2009, para esto usted dispone de dos vias para hacerla llegar:
1. correo electronico: [email protected] , [email protected] 2. Correo convencional: Instituto de Salud Publica, Av Maraton 1000
Departamento de Parasitologia (Dra. Carolina Marchant)
Si usted presenta alguna duda puede comunicarse con Cecilia Parada Carvallo al 8-1716459 o [email protected]
De Antemano, Agradecemos su Colaboracion.
No. de Encuesta Fecha: '."?./"•: 7/
INFORMACION GENERAL
Nombre del Laboratorio:
Nombre de Jefe/Jefa del Laboratorio:
223
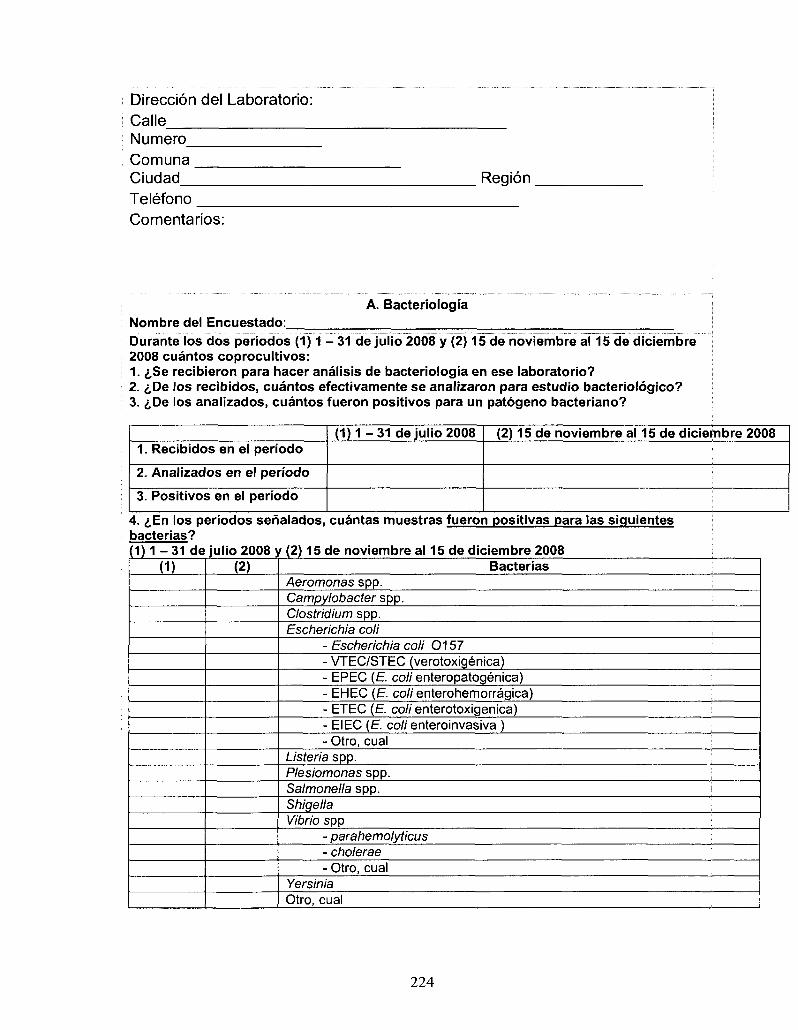
Direccion del Laboratorio: Calle Numero Comuna Ciudad Telefono
Region
Comentarios:
A. Bacteriologia Nombre del Encuestado:
Durante los dos periodos (1) 1 - 31 de julio 2008 y (2) 15 de noviembre al 15 de diciembre 2008 cuantos coprocultivos: 1. £Se recibieron para hacer analisis de bacteriologia en ese laboratorio? 2. i,De los recibidos, cuantos efectivamente se analizaron para estudio bacteriologico? 3. &De los analizados, cuantos fueron positivos para un patogeno bacteriano?
1. Recibidos en el periodo
2. Analizados en el periodo
3. Positivos en el periodo
( 1 ) 1 - 3 1 de julio 2008 (2) 15 de noviembre al 15 de diciembre 2008
4. i,En los periodos senalados, cuantas muestras fueron positivas para las siguientes bacterias? ( 1 ) 1 - 3 1 de
(D julio 2008 y (2) 15 de noviembre al 15 de diciembre 2008
(2) Bacterias Aeromonas spp. Campylobacter spp. Clostridium spp. Escherichia coli
- Escherichia coli 0157 - VTEC/STEC (verotoxigenica) - EPEC (E coli enteropatogenica) - EHEC (£. coli enterohemorragica) - ETEC (E. coli enterotoxigenica) - EIEC (E colienteroinvasiva ) - Otro, cual
Listeria spp. Plesiomonas spp. Salmonella spp. i Shigella Vibrio spp
- parahemolyticus - cholerae - Otro, cual
Yersinia Otro, cual
224
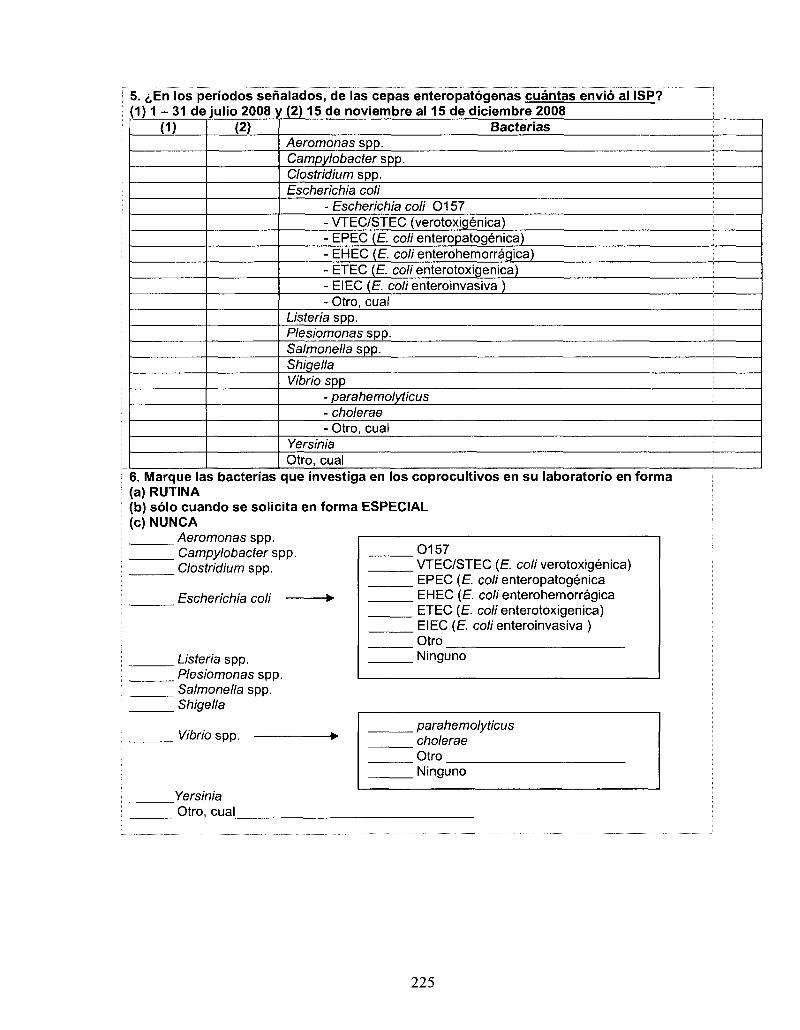
5 . ; En los periodos senalados, de las cepas enteropatoqenas cuantas envio al ISP? (1) 1 - 31 de julio 2008 y (2) 15 de noviembre al 15 de diciembre 2008
(D (2) Bacterias Aeromonas spp. Campylobacter spp. Clostridium spp. Escherichia coli
- Escherichia coli 0157 - VTEC/STEC (verotoxigenica) - EPEC (E. coli enteropatogenica) - EHEC (E. coli enterohemorragica) - ETEC (E. coli enterotoxigenica) - EIEC (E. coli enteroinvasiva ) - Otro, cual
Listeria spp. Plesiomonas spp. Salmonella spp. Shigella Vibrio spp
- parahemolyticus - cholerae - Otro, cual
Yersinia Otro, cual
6. Marque las bacterias que investiga en los coprocultivos en su laboratorio en forma (a) RUTINA (b) solo cuando se solicita en forma ESPECIAL (c) NUNCA
Aeromonas spp. Campylobacter spp. Clostridium spp.
Escherichia coli
Listeria spp. Plesiomonas spp. Salmonella spp. Shigella
.0157
. VTEC/STEC (E. coli verotoxigenica) EPEC (E. coli enteropatogenica EHEC (E. coli enterohemorragica ETEC (E. coli enterotoxigenica) EIEC (E. coli enteroinvasiva )
" Otro Ninguno
Vibrio spp.
Yersinia Otro, cual
parahemolyticus cholerae
\ Otro Ninguno
225
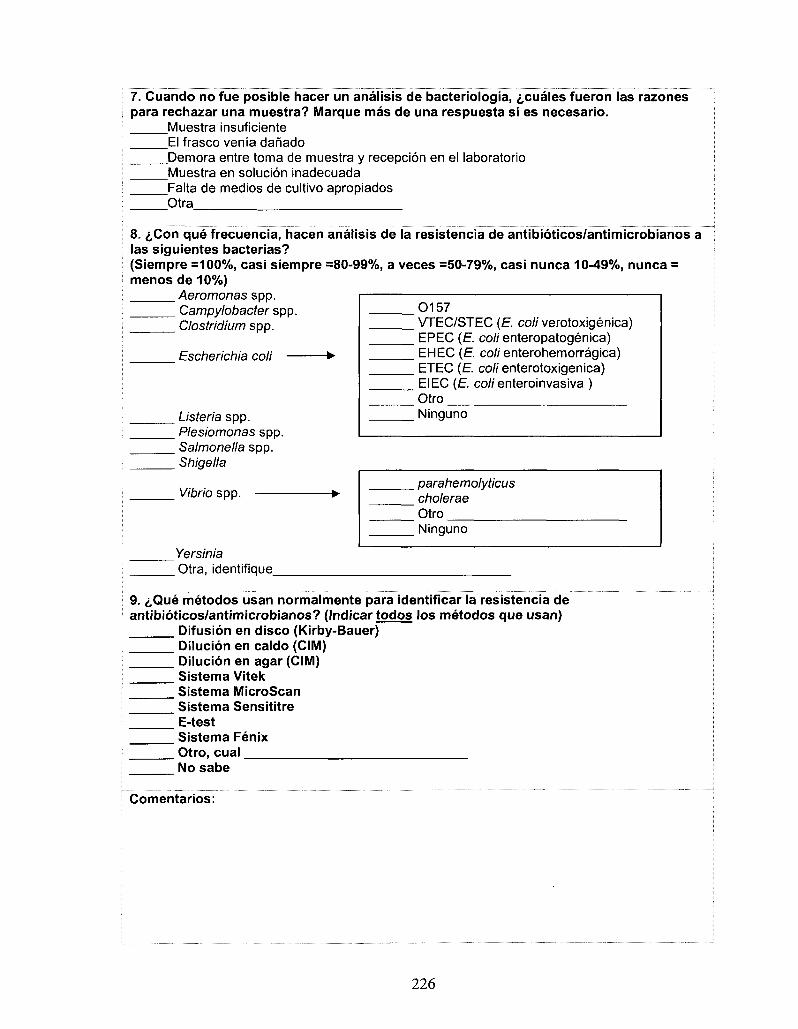
7. Cuando no fue posible hacer un analisis de bacteriologia, ^cuaies fueron las razones para rechazar una muestra? Marque mas de una respuesta si es necesario.
Muestra insuficiente El frasco venia danado Demora entre toma de muestra y recepcion en el laboratorio Muestra en solucion inadecuada Falta de medios de cultivo apropiados Otra
8. £Con que frecuencia, hacen analisis de la resistencia de antibioticos/antimicrobianos a las siguientes bacterias? (Siempre =100%, casi siempre =80-99%, a veces =50-79%, casi nunca 10-49%, nunca = menos de 10%)
Aeromonas spp. i Campylobacter spp. 0157 Clostridium spp. VTEC/STEC (E. coli verotoxigenica)
EPEC (E coli enteropatogenica) Escherichia coli • EH EC (E. coli enterohemorragica)
ETEC (E coli enterotoxigenica) EIEC (E colienteroinvasiva ) Otro Ninguno
parahemolyticus cholerae Otro Ninguno
Yersinia Otra, identifique
9. i,Que metodos usan normalmente para identificar Ja resistencia de antibioticos/antimicrobianos? (Indicar todos los metodos que usan)
Difusion en disco (Kirby-Bauer) Dilucion en caldo (CIM) Dilucion en agar (CIM) Sistema Vitek Sistema MicroScan Sistema Sensititre E-test Sistema Fenix Otro, cual No sabe
Comentarios:
Listeria spp. Plesiomonas spp. Salmonella spp. Shigella
Vibrio spp.
226
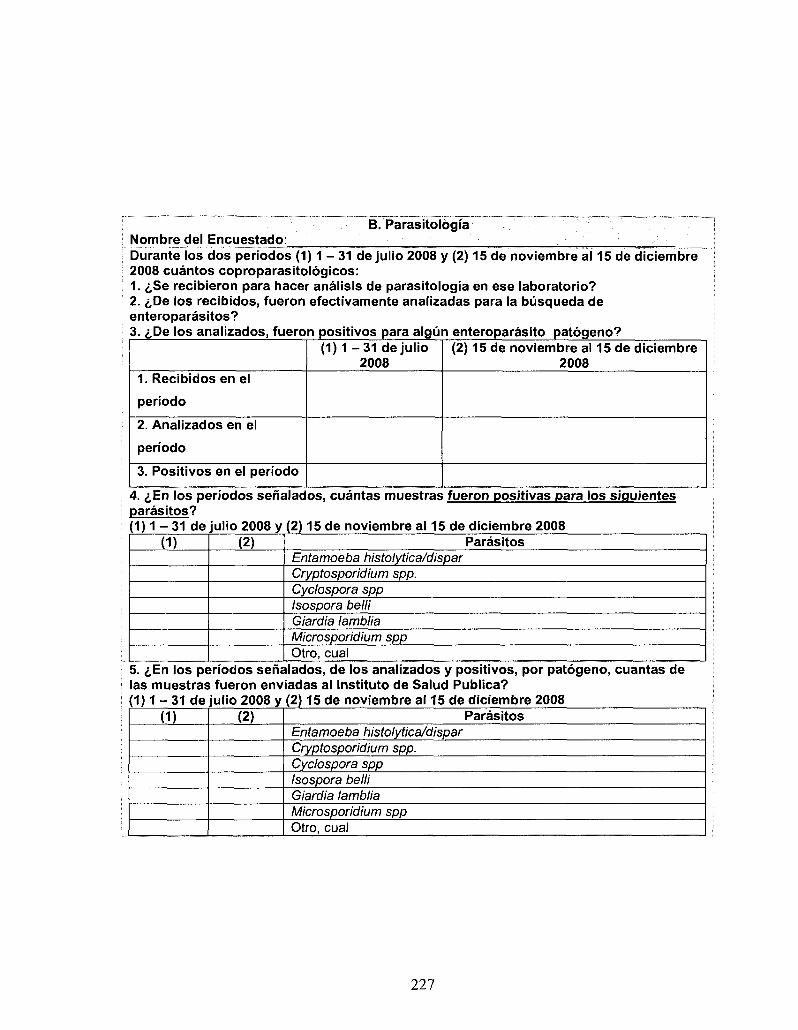
Nombre del Encuestado: B. Parasitologia
Durante los dos periodos (1) 1 - 3 1 de julio 2008 y (2) 15 de noviembre al 15 de diciembre 2008 cuantos coproparasitologicos: 1. £Se recibieron para hacer analisis de parasitologia en ese laboratorio? 2. i,De los recibidos, fueron efectivamente analizadas para la busqueda de enteroparasitos? 3. <j,De los analizados, fueron positivos para algun enteroparasito patogeno?
( 1 ) 1 - 3 1 de julio 2008
(2) 15 de noviembre al 15 de diciembre 2008
1. Recibidos en el
periodo
2. Analizados en el
periodo
3. Positivos en el periodo
4. ^En los periodos senalados, cuantas muestras fueron positivas para los siguientes parasitos? (1) 1 - 31 de julio 2008 y (2) 15 de noviembre al 15 de diciembre 2008
(1) (2) Parasitos Entamoeba histolytica/dispar Cryptosporidium spp. Cyclospora spp Isospora belli Giardia lamblia Microsporidium spp Otro, cual
5. ^En los periodos senalados, de los analizados y positivos, por patogeno, cuantas de las muestras fueron enviadas al Instituto de Salud Publica? (1) 1 - 31 de julio 2008 y (2) 15 de noviembre al 15 de diciembre 2008
(1) (2) Parasitos Entamoeba histolytica/dispar Cryptosporidium spp. Cyclospora spp Isospora belli Giardia lamblia Microsporidium spp Otro, cual
227
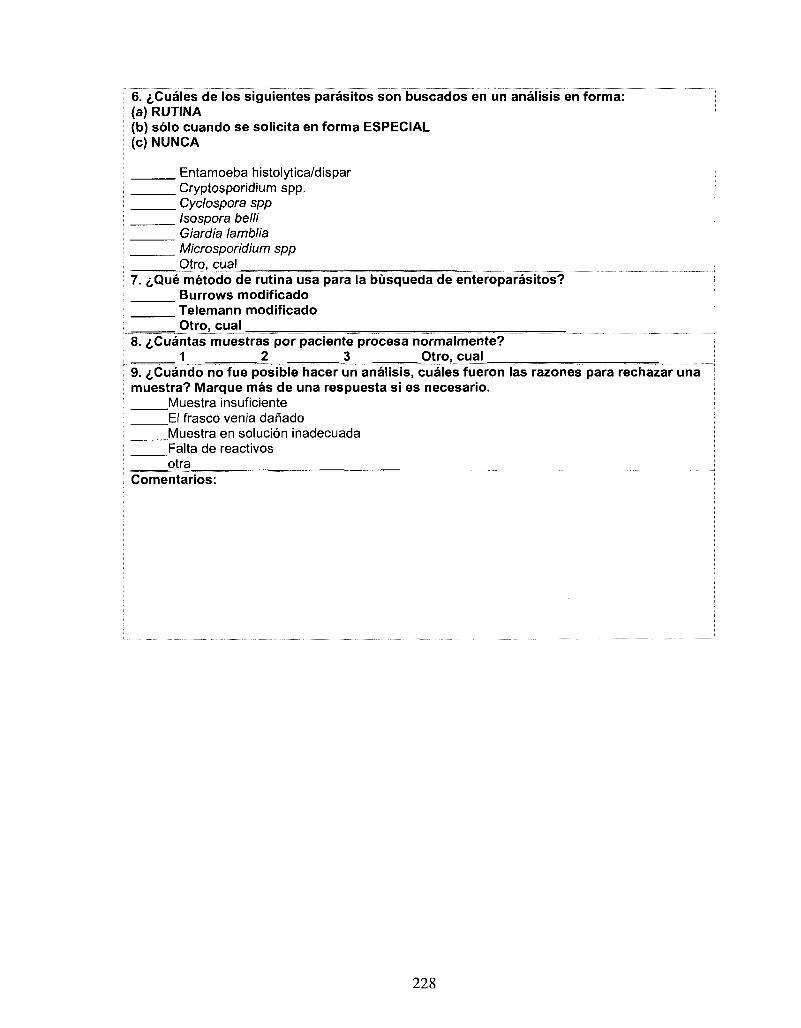
6. ^Cuales de los siguientes parasitos son buscados en un analisis en forma: (a) RUTINA (b) solo cuando se solicita en forma ESPECIAL (c) NUNCA
Entamoeba histolytica/dispar Cryptosporidium spp. Cyclospora spp Isospora belli Giardia lamblia Microsporidium spp Otro, cual
7. i,Que metodo de rutina usa para la busqueda de enteroparasitos? Burrows modificado Telemann modificado Otro, cual
8. ^Cuantas muestras por paciente procesa normalmente? 1 2 3 Otro, cual
9. ^Cuando no fue posible hacer un analisis, cuales fueron las razones para rechazar una muestra? Marque mas de una respuesta si es necesario.
Muestra insuficiente El frasco venia danado Muestra en solucion inadecuada Falta de reactivos qtra
Comentarios:
228
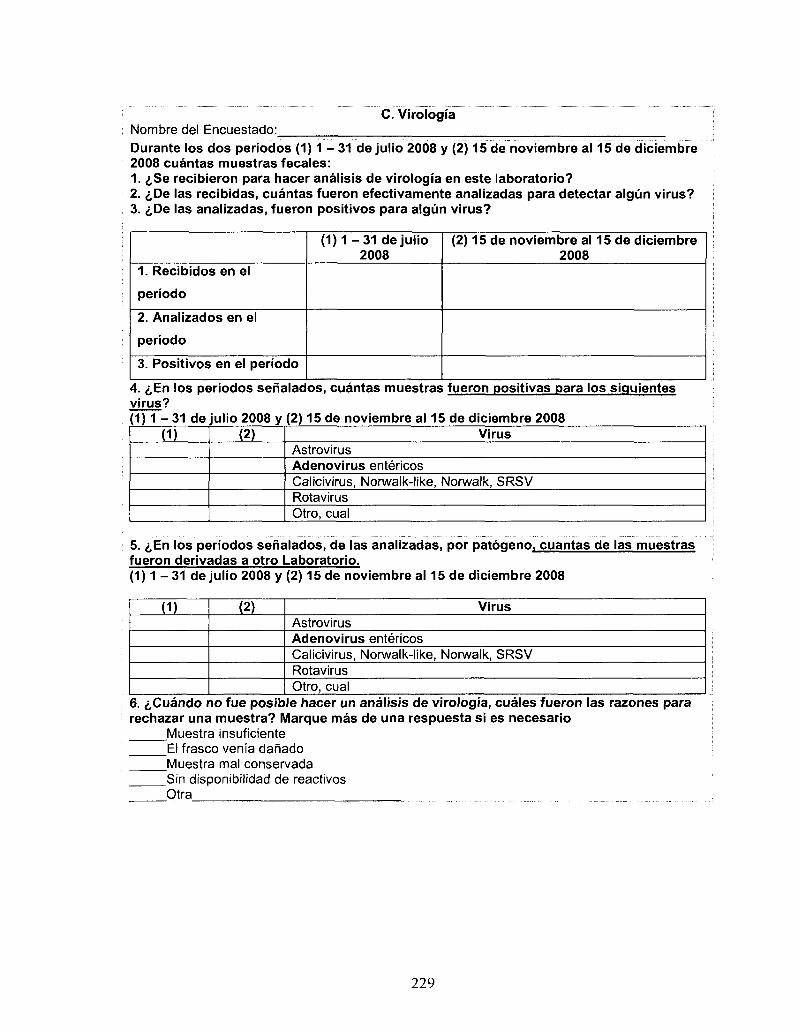
Nombre del Encuestado: C. Virologia
Durante los dos periodos ( 1 ) 1 - 31 de julio 2008 y (2) 15 de noviembre al 15 de diciembre 2008 cuantas muestras fecates: 1. £Se recibieron para hacer analisis de virologia en este laboratorio? 2. iDe las recibidas, cuantas fueron efectivamente analizadas para detectar algun virus? 3. &De las analizadas, fueron positivos para algun virus?
1. Recibidos en el
periodo
2. Analizados en el
periodo
3. Positivos en el periodo
( 1 ) 1 - 3 1 de julio 2008
(2) 15 de noviembre al 15 de diciembre 2008
4. i,En los periodos senalados, cuantas muestras fueron positivas para los siguientes virus? 1) 1 - 3 1 de julio 2008 y (2) 15 de noviembre al 15 de diciembre 2008
(1) (2) Virus Astrovirus Adenovirus entericos Calicivirus, Norwalk-like, Norwalk, SRSV Rotavirus Otro, cual
5. iEn los periodos senalados, de las analizadas, por patogeno, cuantas de las muestras fueron derivadas a otro Laboratorio. (1) 1 - 31 de julio 2008 y (2) 15 de noviembre al 15 de diciembre 2008
(1) (2) Virus Astrovirus Adenovirus entericos Calicivirus, Norwalk-like, Norwalk, SRSV Rotavirus Otro, cual
6. i,Cuando no fue posible hacer un analisis de virologia, cuales fueron las razones para rechazar una muestra? Marque mas de una respuesta si es necesario
Muestra insuficiente El frasco venia danado Muestra mal conservada Sin disponibilidad de reactivos Otra
229
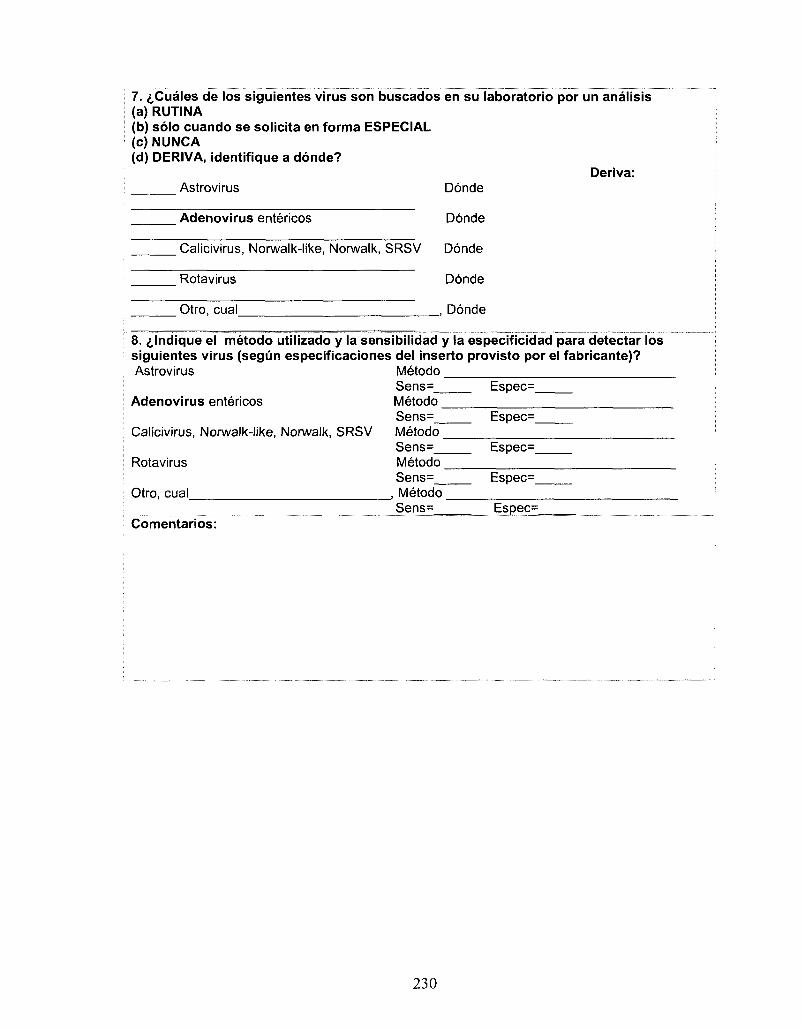
7. <,Cuales de los siguientes virus son buscados en su laboratorio por un analisis (a) RUTINA (b) solo cuando se solicita en forma ESPECIAL (c) NUNCA (d) DERIVA, identifique a donde?
Deriva: Astrovirus Donde
Adenovirus entericos Donde
Calicivirus, Norwalk-like, Norwalk, SRSV Donde
Rotavirus Donde
Otro, cual , Donde
8. £lndique el metodo utilizado y la sensibilidad y fa especificidad para detectar los siguientes virus (segun especificaciones del inserto provisto por el fabricante)? Astrovirus Metodo
Sens= Espec= Adenovirus entericos Metodo
Sens= Espec= Calicivirus, Norwalk-like, Norwalk, SRSV Metodo
Sens= Espec= Rotavirus Metodo
Sens= Espec= Otro, cual , Metodo
Sens=_ Especf Comentarios:
230
APPENDIX VII
Sentinel Clinic Study
In conjunction with the population survey, a sentinel clinic study of
diarrheal cases and non-cases was completed in the Metropolitan region, Chile.
However, in the end this was not part of the final research dissertation. In this
study, cases of diarrheal illness presenting at seven sentinel clinics located in the
Metropolitan region, Chile during July 15 - August 31 and November 3 -
December 16, were invited to participate in a survey and submit a stool sample
for testing. Concurrently, non-cases presenting at the sentinel clinics were asked
to complete a risk factor survey. In the first phase, 25 cases and 26 non-cases
that participated while in the second phase, 128 cases and 299 non-cases
participated. This portion of the research was inconvenienced by protests and
strikes that shut down clinics for extended periods of time as well as difficulties
with compliance for stool submission from adults. The data from these surveys
and the corresponding laboratory results has not yet been analysed, however the
surveys are presented here for study completeness.
231
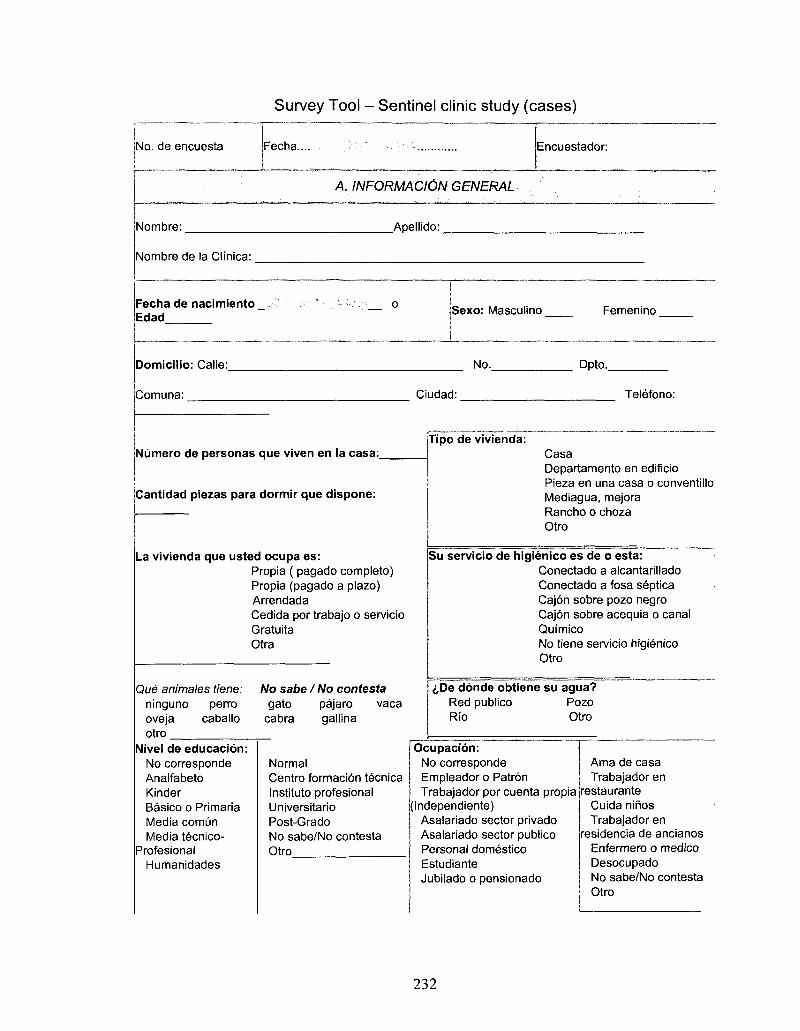
Survey Tool - Sentinel clinic study (cases)
No. de encuesta Encuestador:
A. INFORMAClON GENERAL
Nombre: _Apellido:
Nombre de la Clinica:
Domicilio: Calle:_
Comuna:
No. Dpto..
Ciudad: Telefono:
Numero de personas que viven en la casa:. JTipo de vivienda:
Cantidad piezas para dormir que dispone:
La vivienda que usted ocupa es: Propia (pagado completo) Propia (pagado a plazo) Arrendada Cedida por trabajo o servicio Gratuita Otra
\Que animates tiene: ninguno perro oveja caballo otro
No sabe I No contesta gato pajaro vaca
cabra gallina
Casa Departamento en edificio Pieza en una casa o conventillo Mediagua, mejora Rancho o choza Otro
Su servicio de higienico es de o esta: Conectado a alcantarillado Conectado a fosa septica Cajon sobre pozo negro Cajon sobre acequia o canal Quimico No tiene servicio higienico Otro
i,De donde obtiene su agua? Red publico Pozo Rio Otro
Nivel de educacion: No corresponde Analfabeto Kinder Basico o Primaria Media comiin Media tecnico-
Profesional Humanidades
Normal Centra formacion tecnica Institute profesional Universitario Post-Grado No sabe/No contesta Otro
Ocupacion: No corresponde Empleador o Patron Trabajador por cuenta propia
(independiente) Asalariado sector privado Asalariado sector publico Personal domestico Estudiante Jubilado o pensionado
Ama de casa Trabajador en
restaurante Cuida nihos Trabajador en
residencia de ancianos Enfermero o medico Desocupado No sabe/No contesta Otro
232
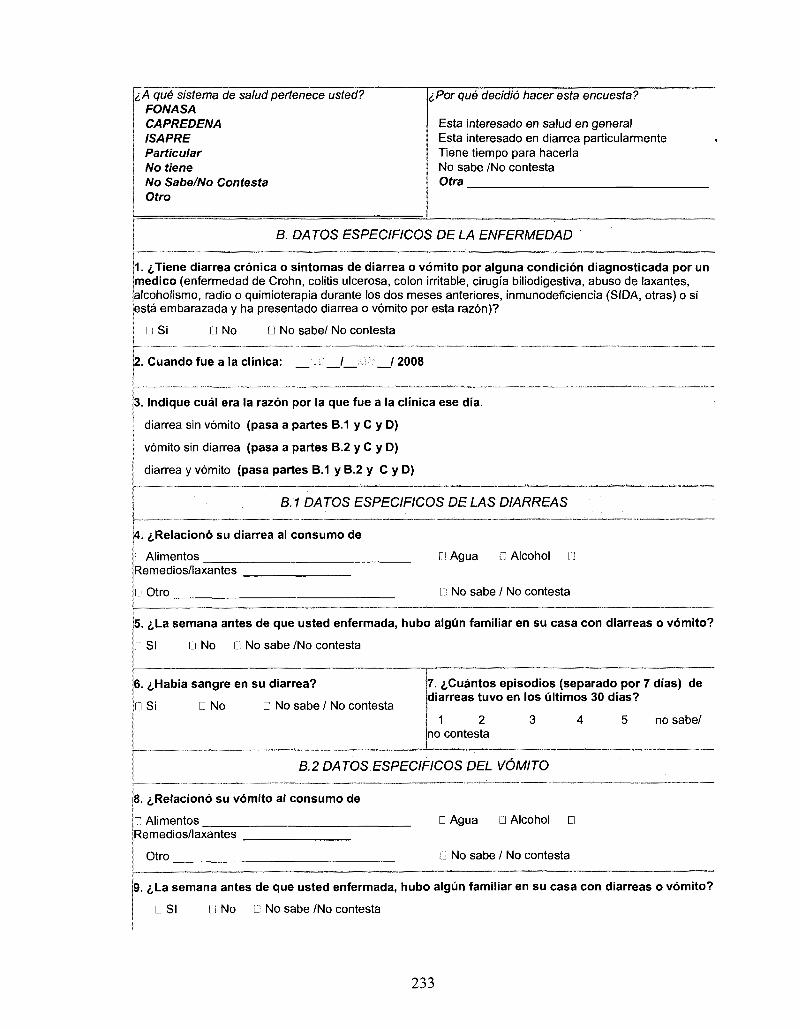
IA que sistema de salud pertenece usted? FONASA CAPREDENA ISAPRE Particular No tiene No Sabe/No Contesta Otro
iPor que decidio hacer esta encuesta?
Esta interesado en salud en general Esta interesado en diarrea particularmente Tiene tiempo para hacerla No sabe /No contesta Otra
B. DATOS ESPECIFICOS DE LA ENFERMEDAD
1. i,Tiene diarrea cronica o sintomas de diarrea o vomito por alguna condicion diagnosticada por un medico (enfermedad de Crohn, colitis ulcerosa, colon irritable, cirugia biliodigestiva, abuso de laxantes, alcoholismo, radio o quimioterapia durante los dos meses anteriores, inmunodeficiencia (SIDA, otras) o si esta embarazada y ha presentado diarrea o vomito por esta razon)?
n Si n No O No sabe/ No contesta
2. Cuando fue a la clinica: / /2008
3. Indique cual era la razon por la que fue a la clinica ese dia.
diarrea sin vomito (pasa a partes B.1 y C y D)
vomito sin diarrea (pasa a partes B.2 y C y D)
diarrea y vomito (pasa partes B.1 y B.2 y C y D)
B.1 DATOS ESPECIFICOS DE LAS DIARREAS
4. ^Relaciono su diarrea al consumo de
i Alimentos IT! Aqua • Alcohol IJ Remedios/laxantes
I j Otro n No sabe / No contesta
5. <,La semana antes de que usted enfermada, hubo algun familiar en su casa con diarreas o vomito?
I"] SI Li No D No sabe /No contesta
6. ^Habia sangre en su diarrea?
D Si • No D No sabe / No contesta
7. i,Cuantos episodios (separado por 7 dias) de diarreas tuvo en los ultimos 30 dias?
1 2 3 4 5 no sabe/ no contesta
B.2 DATOS ESPECIFICOS DEL VOMITO
8. i,Relaciono su vomito al consumo de
H Alimentos Remedios/laxantes
G Otro
9. <i,La semana antes de que usted enfermada, hubc
• SI IJ No G No sabe /No contesta
D Agua G Alcohol G
0 No sabe / No contesta
> algun familiar en su casa con diarreas o vomito?
233
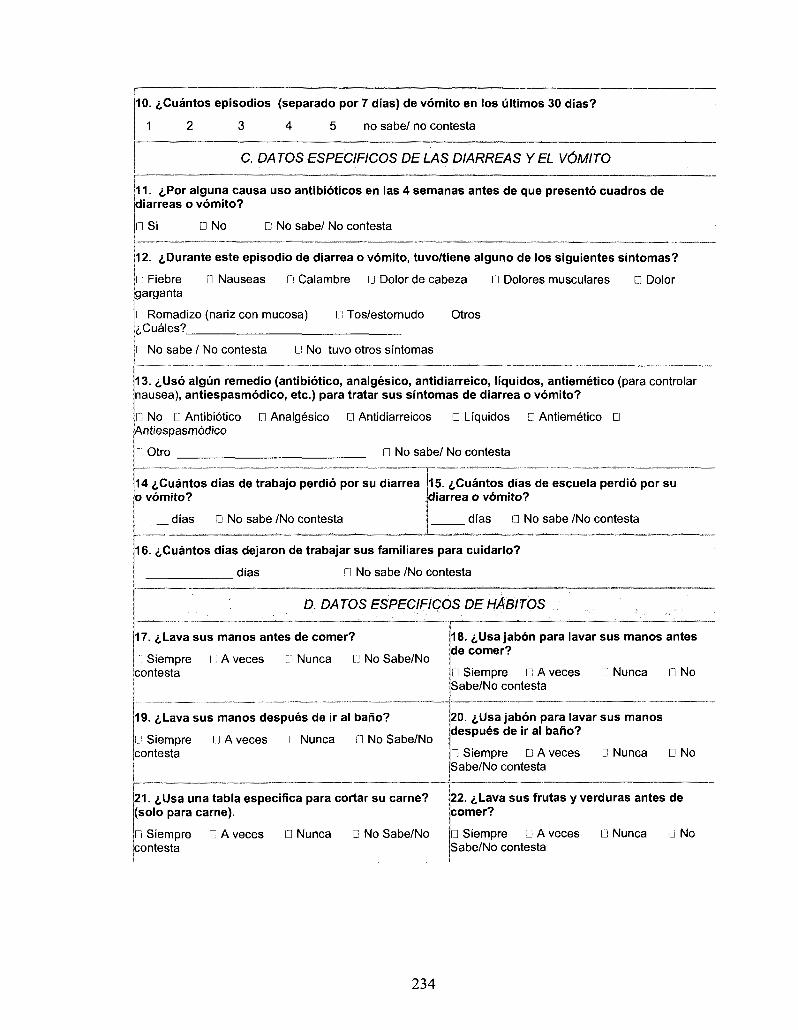
10. ^Cuantos episodios (separado por 7 dias) de vomito en los ultimos 30 dias?
1 2 3 4 5 no sabe/ no contests
C. DATOS ESPECIFICOS DELAS DIARREAS Y EL VOMITO
11. iPor alguna causa uso antibioticos en las 4 semanas antes de que presento cuadros de diarreas o vomito?
GlSi • No D No sabe/ No contests
12. ^Durante este episodio de diarrea o vomito, tuvo/tiene alguno de los siguientes sintomas?
Fiebre D Nauseas G Calambre 0 Dolor de cabeza G Dolores musculares D Dolor garganta
I Romadizo (nariz con mucosa) G Tos/estornudo Otros ^Cuales?
i No sabe / No contests G No tuvo otros sintomas
13. <,Us6 algun remedio (antibiotico, analgesico, antidiarreico, liquidos, antiemetico (para controlar nausea), antiespasmodico, etc.) para tratar sus sintomas de diarrea o vomito?
I ] No G Antibiotico CJ Analgesico 0 Antidiarreicos D Liquidos D Antiemetico • Antiespasmodico
Otro D No sabe/ No contests
14 tCuantos dias de trabajo perdio por su diarrea o vomito?
dias D No sabe /No contests
15. ^Cuantos dias de escuela perdio por su diarrea o vomito?
dias 0 No sabe /No contesta
16. i,Cuantos dias dejaron de trabajar sus familiares para cuidarlo?
dias Q No sabe /No contesta
D. DATOS ESPECIFICOS DE HABITOS
17. c,Lava sus manos antes de comer?
Siempre I ; A veces G Nunca G No Sabe/No contesta
18. <j,Usa jabon para lavar sus manos antes de comer?
0 Siempre G A veces Sabe/No contesta
G Nunca G No
19. 6Lava sus manos despues de ir al bano?
Siempre G A veces G Nunca D No Sabe/No contesta
20. ^Usa jabon para lavar sus manos despues de ir al bano?
G Siempre Q A veces Sabe/No contesta
0 Nuncs G No
21. i,Usa una tabla especifica para cortar su carne? (solo para carne).
22. i,Lava sus frutas y verduras antes de comer?
• Siempre G A veces icontesta
G Nunca D No Sabe/No G Siempre Q A veces Sabe/No contesta
Q Nunca D No
234
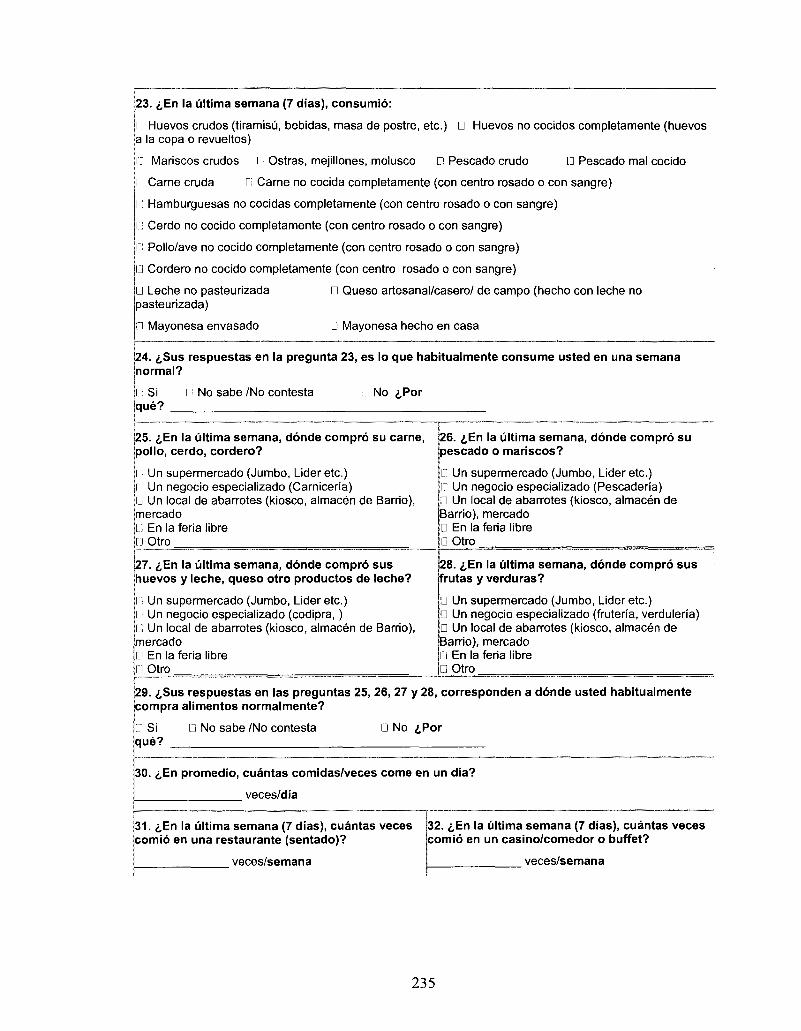
23. 6En la ultima semana (7 dias), consumio:
n Huevos crudos (tiramisu, bebidas, masa de postre, etc.) • Huevos no cocidos completamente (huevos a la copa o revueltos)
r: Mariscos crudos I i Ostras, mejillones, molusco 0 Pescado crudo n Pescado mal cocido
n Carne caida • Carne no cocida completamente (con centra rosado o con sangre)
I: Hamburguesas no cocidas completamente (con centra rosado o con sangre)
I ] Cerdo no cocido completamente (con centra rosado o con sangre)
n Pollo/ave no cocido completamente (con centra rosado o con sangre)
Ll Cordero no cocido completamente (con centra rosado o con sangre)
• Queso artesanal/casero/ de campo (hecho con leche no • Leche no pasteurizada pasteuhzada)
i Mayonesa envasado D Mayonesa hecho en casa
24. i,Sus respuestas en la pregunta 23, es lo que habitualmente consume usted en una semana normal?
I : Si r i No sabe /No contesta que?
No iPor
25. i,En la ultima semana, donde compro su carne, polio, cerdo, cordero?
I Un supermercado (Jumbo, Lider etc.) I Un negocio especializado (Carniceria) |J Un local de abarrotes (kiosco, almacen de Barrio), mercado [.; En la feria libre [j Otro
26. <j,En la ultima semana, donde compro su pescado o mariscos?
• Un supermercado (Jumbo, Lider etc.) G Un negocio especializado (Pescaderia) • Un local de abarrotes (kiosco, almacen de Barrio), mercado D En la feria libre • Otro
27. i,En la ultima semana, donde compro sus huevos y leche, queso otro productos de leche?
l l Un supermercado (Jumbo, Lider etc.) Un negocio especializado (codipra,) Un local de abarrotes (kiosco, almacen de Barrio),
mercado l.".1 En la feria libre • Otro
28. &En la ultima semana, donde compro sus frutas y verduras?
• Un supermercado (Jumbo, Lider etc.) D Un negocio especializado (fruteria, verduleria) D Un local de abarrotes (kiosco, almacen de Barrio), mercado • En la feria libre • Otro
29. i,Sus respuestas en las preguntas 25, 26, 27 y 28, corresponden a donde usted habitualmente compra alimentos normalmente?
l Si que?
• No sabe /No contesta D No ^Por
30. i,En promedio, cuantas comidas/veces come en un dia?
veces/dia
31. £,En la ultima semana (7 dias), cuantas veces comio en una restaurante (sentado)?
veces/semana
32. i,En la ultima semana (7 dias), cuantas veces comio en un casino/comedor o buffet?
veces/semana
235

33. i,En la ultima semana (7 dias), cuantas veces comio comida rapida (McDonald's, etc.)?
veces/semana
34. ^En la ultima semana (7 dias), cuantas veces comio algo preparado en la calle (hot dog, completa, etc.)?
veces/semana
35. £,En la ultima semana (7 dias), cuantas veces comio algo pedido a su casa/oficina (despacho al domicilio)?
veces/semana
36. i,En la ultima semana (7 dias), cuantas veces comio algo que preparo en su cocina?
veces/semana
37. <i,Sus respuestas en las preguntas 31, 32, 33, 34, 35 y 36, corresponden a donde usted habitualmente come?
n Si que?
n No sabe /No contesta D No iPor
38. iAyer, cuantas porciones (vasos, 250ml) de agua consumio (incluyendo jugos o bebidas que estan hechos con agua, pero sin considerar cafe o te?
porciones/ayer
39. iEsta cantidad (pregunta 38) es lo que habitualmente Ud. consuma de agua diario?
D Si • No sabe /No contesta
D No <,Por que?
40. ^Cuantas de estas porciones (vasos, 250ml) de agua son de:
Agua de una botella Agua de la casa (de la Nave).
Otro (numero de vasos)
141. i,Que usa para tratar su agua de la casa?
I : Nada G Hervir U Filtro del lavaplatos • Filtro de la jarra de agua (ej. Brita)
Otro
Comentarios:
236
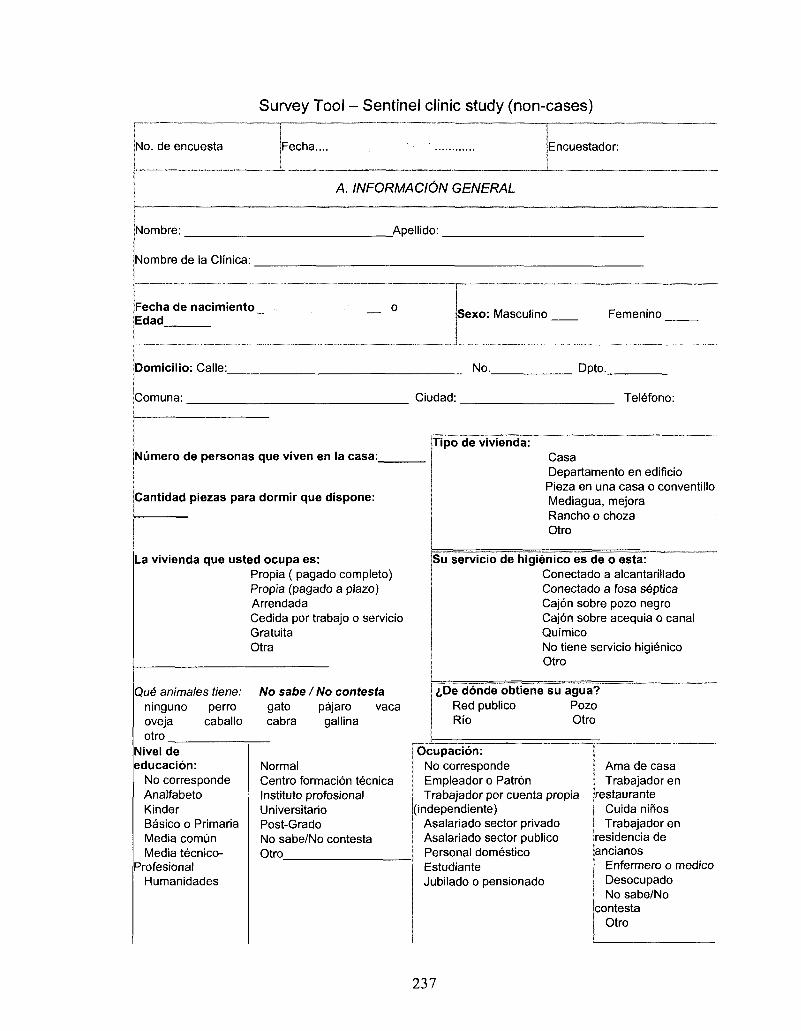
Survey Tool - Sentinel clinic study (non-cases)
No. de encuesta Fecha... Encuestador:
A. INFORMACI6N GENERAL
Nombre:
Nombre de la Clinica:
Apellido:
Fecha de nacimiento Edad
0 Sexo: Masculino Femenino
Domicilio: Calle:
iComuna:
No. Dpto..
La vivienda que usted ocupa es: Propia ( pagado completo) Propia (pagado a plazo) Arrendada Cedida por trabajo o servicio Gratuita Otra
Ciudad: Telefono:
Numero de personas que viven en la casa: Tipo de vivienda:
Cantidad piezas para dormir que dispone:
Que animates tiene: ninguno perro oveja caballo otro
No sabe I No contesta gato pajaro vaca cabra gallina
Nivel de educacion:
No corresponde Analfabeto Kinder Basico o Primaria Media comun Media tecnico-
Profesional Humanidades
Normal Centra formacion tecnica Instituto profesional Universitario Post-Grado No sabe/No contesta Otro
Casa Departamento en edificio Pieza en una casa o conventillo Mediagua, mejora Rancho o choza Otro
Su servicio de higienico es de o esta: Conectado a alcantarillado Conectado a fosa septica Cajon sobre pozo negro Cajon sobre acequia o canal Quimico No tiene servicio higienico Otro
i,De donde obtiene su agua? Red publico Pozo Rio Otro
Ocupacion: No corresponde Empleador o Patron Trabajador por cuenta propia
(independiente) Asalariado sector privado Asalariado sector publico Personal domestico Estudiante Jubilado o pensionado
Ama de casa Trabajador en
restaurante Cuida niflos Trabajador en
residencia de ancianos
Enfermero o medico Desocupado No sabe/No
contesta Otro
237
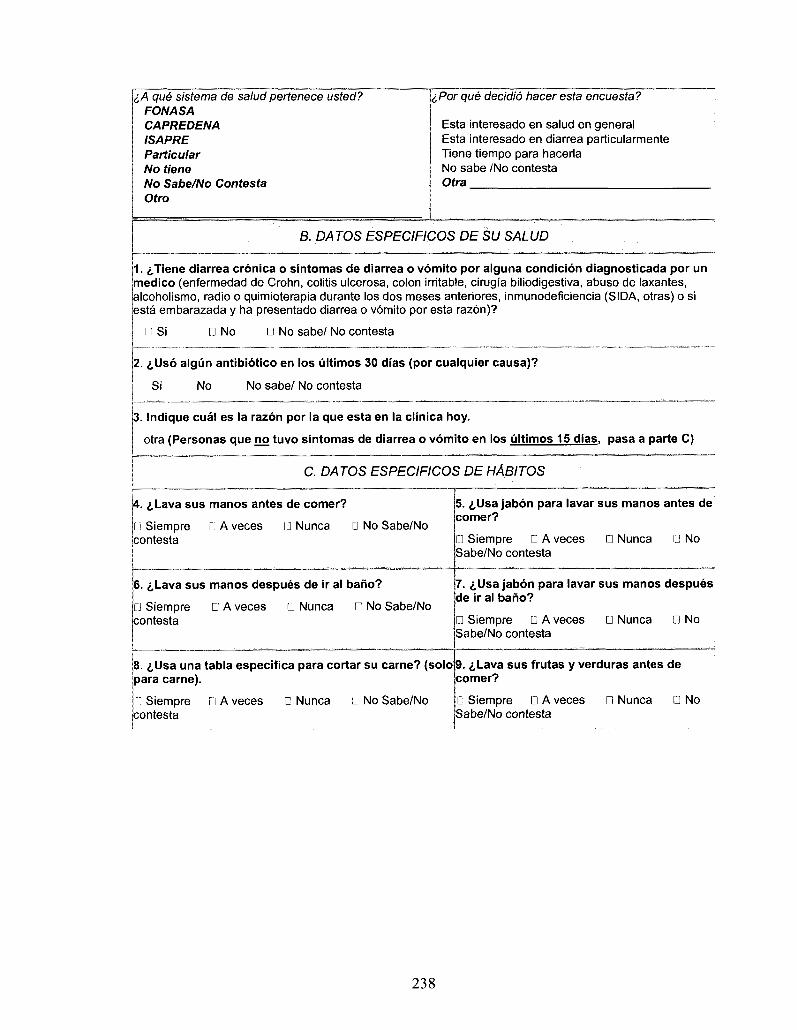
c A que sistema de salud pertenece usted? FONASA CAPREDENA ISAPRE Particular No tiene No Sabe/No Contesta Otro
iPor que decidio hacer esta encuesta?
Esta interesado en salud en general Esta interesado en diarrea particularmente Tiene tiempo para hacerla No sabe /No contesta Otra
6. DATOS ESPECIFICOS DE SU SALUD
1. i/Tiene diarrea cronica o sintomas de diarrea o vomito por alguna condicion diagnosticada por un medico (enfermedad de Crohn, colitis ulcerosa, colon irritable, cirugia biliodigestiva, abuso de laxantes, alcoholismo, radio o quimioterapia durante los dos meses anteriores, inmunodeficiencia (SIDA, otras) o si esta embarazada y ha presentado diarrea o vomito por esta razon)?
Ii Si n No D No sabe/ No contesta
2. <j,Us6 algiin antibiotico en los ultimos 30 dias (por cualquier causa)?
Si No No sabe/ No contesta
3. Indique cual es la razon por la que esta en la clinica hoy.
otra (Personas que no tuvo sintomas de diarrea o vomito en los ultimos 15 dias, pasa a parte C)
C. DATOS ESPECIFICOS DE HABITOS
A. i,Lava sus manos antes de comer?
11 Siempre iJ A veces I'J Nunca D No Sabe/No contesta
5. i,Usa jabon para lavar sus manos antes de comer?
D Siempre D A veces Sabe/No contesta
D Nunca 0 No
6. 6Lava sus manos despues de ir al bano?
[J Siempre D A veces • Nunca • No Sabe/No contesta
7. iUsa jabon para lavar sus manos despues de ir al bano?
• Siempre D A veces Sabe/No contesta
D Nunca D No
8. £Usa una tabla especifica para cortar su carne? (solo para carne).
9. i,Lava sus frutas y verduras antes de comer?
Li Siempre contesta
D A veces D Nunca • No Sabe/No D Siempre D A veces Sabe/No contesta
• Nunca • No
238
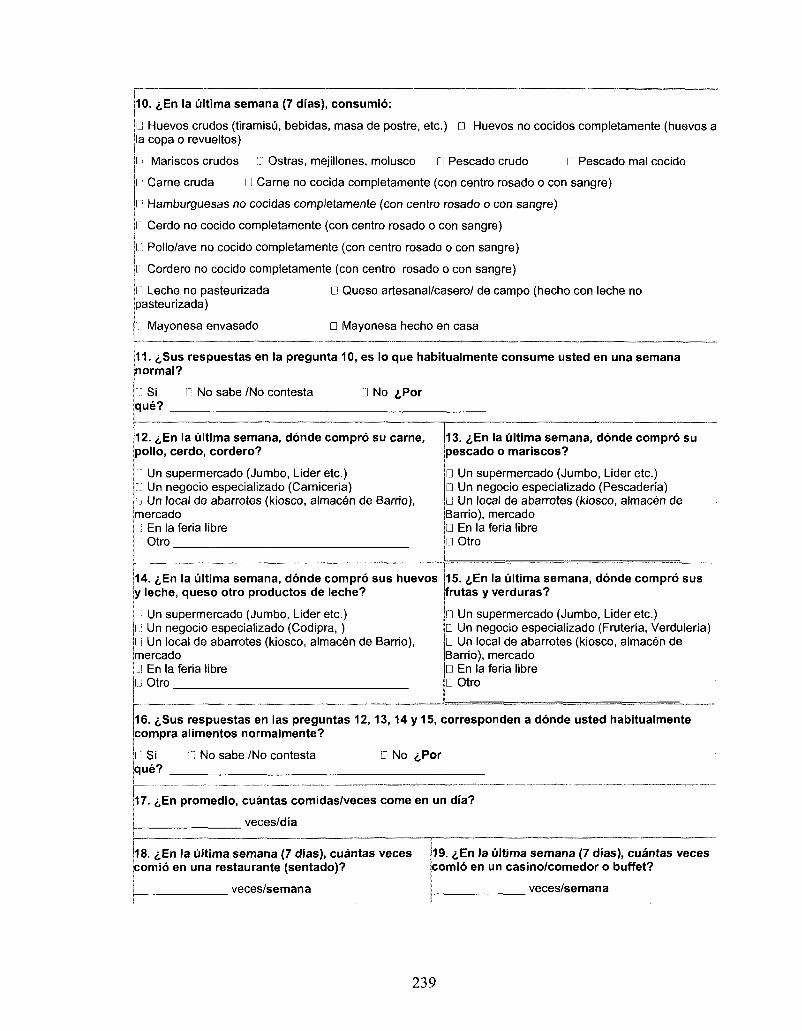
10. £,En la ultima semana (7 dias), consumio:
• Huevos crudos (tiramisu, bebidas, masa de postre, etc.) n Huevos no cocidos completamente (huevos a la copa o revueltos)
I Mariscos crudos G Ostras, mejillones, molusco G Pescado crudo il Pescado mal cocido
l Came cruda LI Carne no cocida completamente (con centra rosado o con sangre)
r: Hamburguesas no cocidas completamente (con centra rosado o con sangre)
n Cerdo no cocido completamente (con centra rosado o con sangre)
I..) Pollo/ave no cocido completamente (con centra rosado o con sangre)
n Cordero no cocido completamente (con centra rosado o con sangre)
• Queso artesanal/casero/ de campo (hecho con leche no I] Leche no pasteurizada pasteurizada)
n Mayonesa envasado • Mayonesa hecho en casa
11. ^Sus respuestas en la pregunta 10, es lo que habitualmente consume usted en una semana normal?
u Si D No sabe /No contesta D No ,̂Por que?
12. £En la ultima semana, donde compro su carne, polio, cerdo, cordero?
I i Un supermercado (Jumbo, Lideretc.) J Un negocio especializado (Camiceria) 1 Un local de abarrotes (kiosco, almacen de Barrio), mercado I i En la feria libra l": Otro
14. i,En la ultima semana, donde compro sus huevos y leche, queso otro productos de leche?
i; Un supermercado (Jumbo, Lider etc.) I.: Un negocio especializado (Codipra,) l"i Un local de abarrotes (kiosco, almacen de Barrio), mercado Ll En la feria libra LJ Otro
13. <,En la ultima semana, donde compro su pescado o mariscos?
D Un supermercado (Jumbo, Lider etc.) D Un negocio especializado (Pescaderia) • Un local de abarrotes (kiosco, almacen de Barrio), mercado • En la feria libra a Otro
15. i,En la ultima semana, donde compro sus frutas y verduras?
Un supermercado (Jumbo, Lideretc.) D Un negocio especializado (Fruteria, Verduleria) D Un local de abarrotes (kiosco, almacen de Barrio), mercado • En la feria libra • Otro
16. <,Sus respuestas en las preguntas 12,13,14 y 15, corresponden a donde usted habitualmente compra alimentos normalmente?
Si que?
C No sabe /No contesta • No ,£,Por
17. ^En promedio, cuantas comidas/veces come en un dia?
veces/dia
18. <i,En la ultima semana (7 dias), cuantas veces comio en una restaurante (sentado)?
veces/semana
19. i,En la ultima semana (7 dias), cuantas veces comio en un casino/comedor o buffet?
veces/semana
239
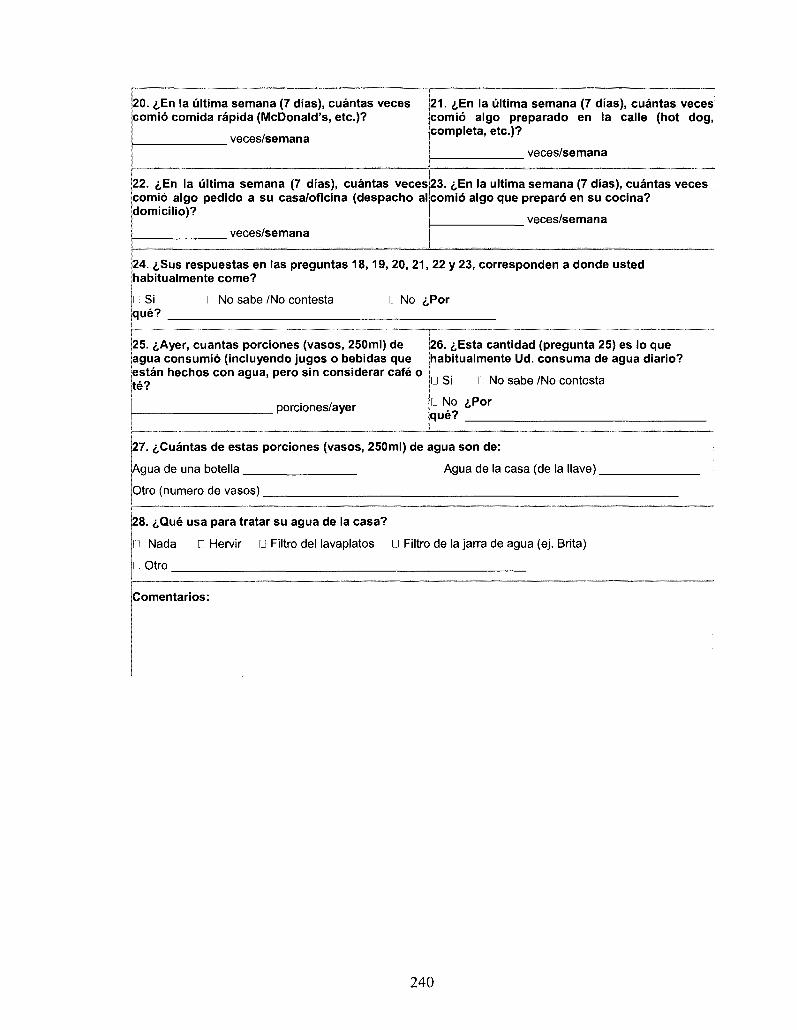
20. iEn la ultima semana (7 dias), cuantas veces comio comida rapida (McDonald's, etc.)?
veces/semana
21. «|,En la ultima semana (7 dias), cuantas veces comio algo preparado en la calle (hot dog, completa, etc.)?
veces/semana
22. ^En la ultima semana (7 dias), cuantas veces comio algo pedido a su casa/oficina (despacho al domicilio)?
veces/semana
23. ^En la ultima semana (7 dias), cuantas veces comio algo que preparo en su cocina?
veces/semana
24. i,Sus respuestas en las preguntas 18,19, 20, 21, 22 y 23, corresponden a donde usted habitualmente come?
i: Si que?
11 No sabe /No contests l l No <j,Por
25. i,Ayer, cuantas porciones (vasos, 250ml) de agua consumio (incluyendo jugos o bebidas que estan hechos con agua, pero sin considerar cafe o te?
porciones/ayer
26. <j,Esta cantidad (pregunta 25) es lo que habitualmente Ud. consuma de agua diario?
• Si 111 No sabe /No contesta
n No i,Por que?
27. ^Cuantas de estas porciones (vasos, 250ml) de agua son de:
Agua de una botella Agua de la casa (de la Have).
Otro (numero de vasos)
28. i,Que usa para tratar su agua de la casa?
Nada D Hervir • Filtro del lavaplatos • Filtro de la jarra de agua (ej. Brita)
Otro
iComentarios:
240
Related Documents