Addendum to Market Instruments BPM (Based on Ver.39)

Welcome message from author
This document is posted to help you gain knowledge. Please leave a comment to let me know what you think about it! Share it to your friends and learn new things together.
Transcript

Addendum to Market Instruments BPM(Based on Ver.39)
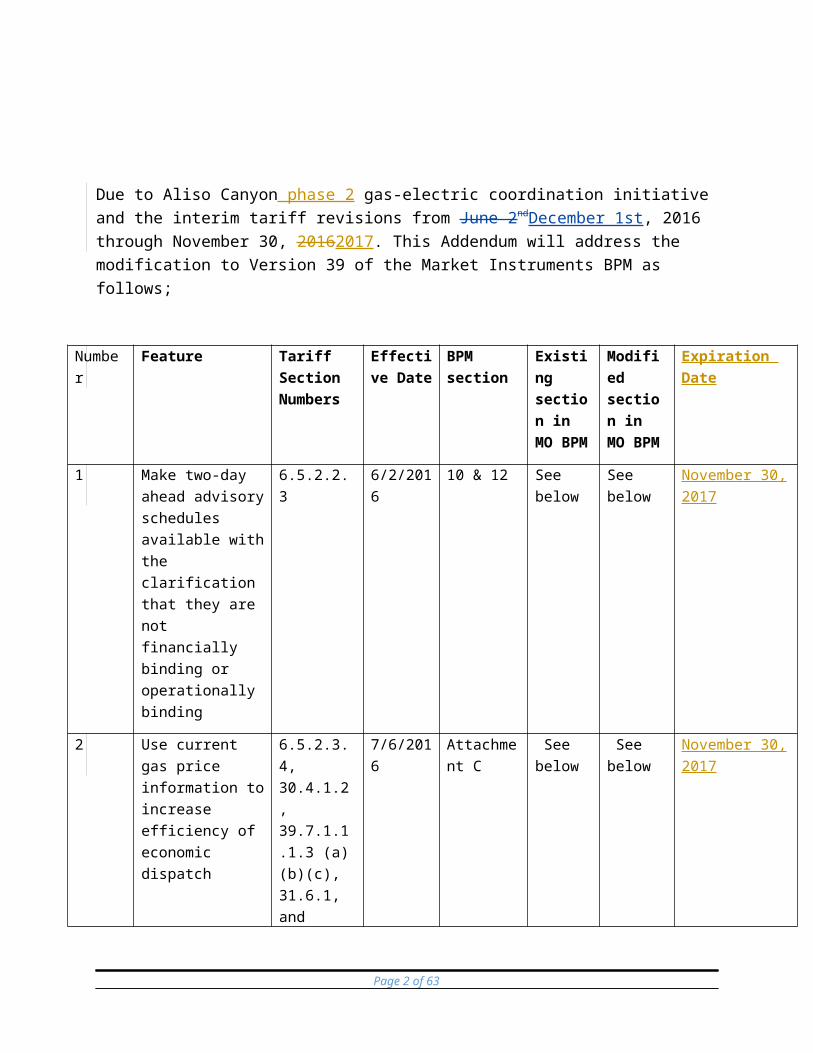
Due to Aliso Canyon phase 2 gas-electric coordination initiative and the interim tariff revisions from June 2ndDecember 1st, 2016 through November 30, 20162017. This Addendum will address the modification to Version 39 of the Market Instruments BPM as follows;
Number Feature Tariff Section Numbers
Effective Date
BPM section
Existing section in MO BPM
Modified section in MO BPM
Expiration Date
1 Make two-day ahead advisory schedules available with the clarification that they are not financially binding or operationally binding
6.5.2.2.3 6/2/2016 10 & 12 See below
See below
November 30, 2017
2 Use current gas price information to increase efficiency of economic dispatch
6.5.2.3.4, 30.4.1.2, 39.7.1.1.1.3 (a)(b)(c), 31.6.1, and deleting old (b)
7/6/2016 Attachment C
See below
See below
November 30, 2017
3 Adjust the gas price indexes used to calculation commitment and default energy bids & generated bids for affected resources on the SoCalGas/SDG&E system
39.7.1.1.1.3 (d)
7/6/2016 Attachment C
See below
See below
November 30, 2017
4 Permit market participants to rebid commitment costs in the real-time market
30.5.1(b) 6/2/2016 4.1, 5.1.1.1.1, 5.1.1.1.2, 8.2.1.3, B.2.1,
See below
See below
November 30, 2017
Page 2 of 45
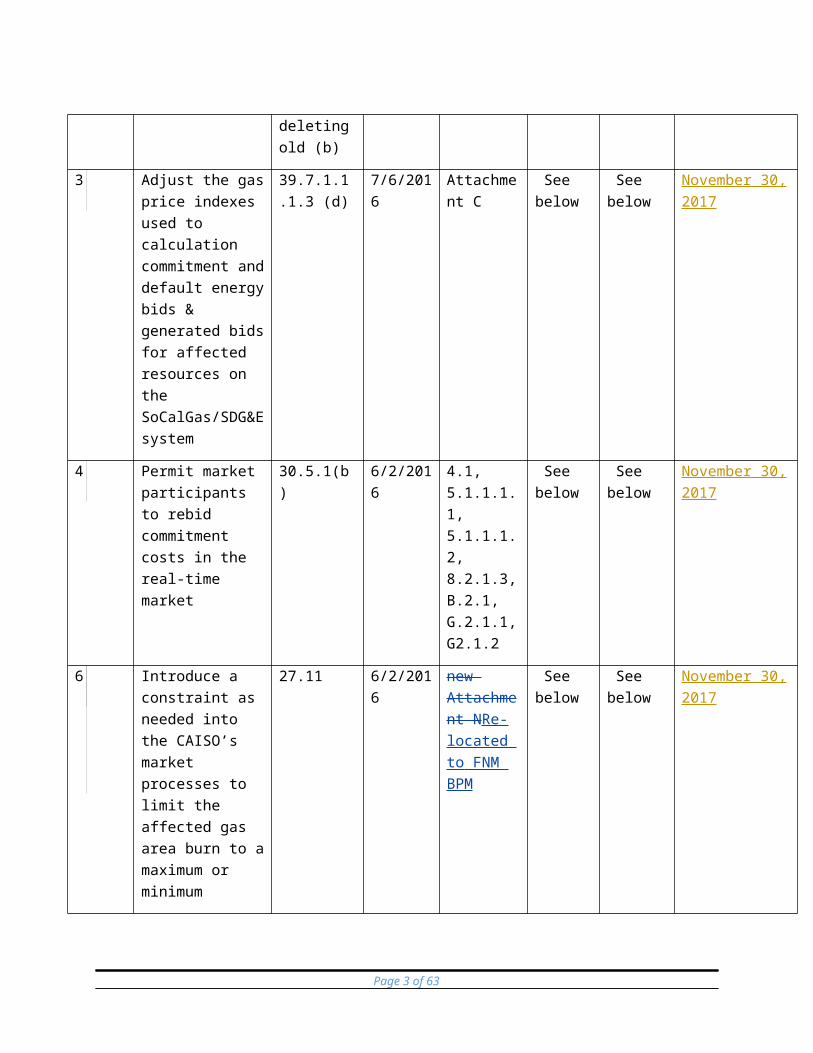
G.2.1.1, G2.1.2
6 Introduce a constraint as needed into the CAISO’s market processes to limit the affected gas area burn to a maximum or minimum
27.11 6/2/2016 new Attachment NRe-located to FNM BPM
See below
See below
November 30, 2017
Number 1
10.1 Scope of CMRI Reports available to SCsExhibit 10-1.1 summarizes the reports that are available to SCs through the Customer Market Results Interface (CMRI). Details of the report contents are provided in subsequent sections.
Page 3 of 45
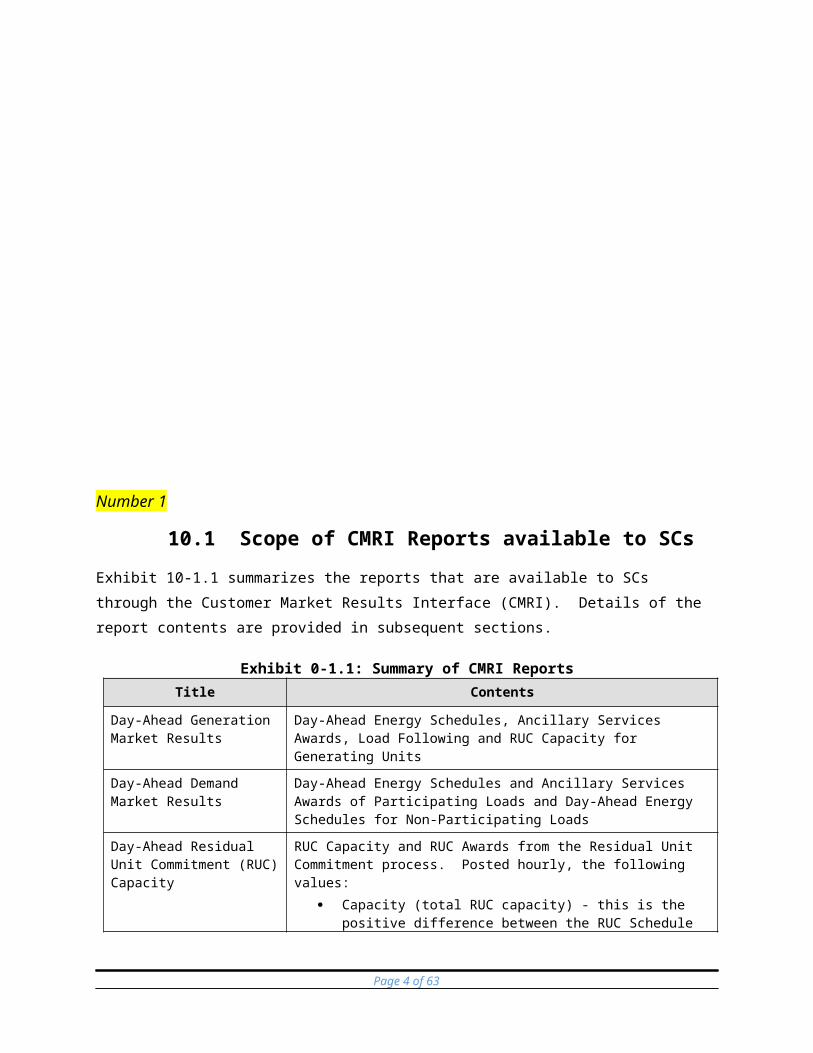
Exhibit 0-1.1: Summary of CMRI ReportsTitle Contents
Day-Ahead Generation Market Results
Day-Ahead Energy Schedules, Ancillary Services Awards, Load Following and RUC Capacity for Generating Units
Day-Ahead Demand Market Results
Day-Ahead Energy Schedules and Ancillary Services Awards of Participating Loads and Day-Ahead Energy Schedules for Non-Participating Loads
Day-Ahead Residual Unit Commitment (RUC) Capacity
RUC Capacity and RUC Awards from the Residual Unit Commitment process. Posted hourly, the following values:
Capacity (total RUC capacity) - this is the positive difference between the RUC Schedule and the greater of the Day-Ahead Schedule and the Minimum Load level of a resource.
Award (RUC Award portion) – this is the portion of the RUC capacity from resources eligible to receive RUC Availability Payments.
For Interties the total RUC Schedule is displayed as the RUC Award product.
Two Day-Ahead Residual Unit Commitment (RUC) Advisory Schedules
This report is based on the Two Day-Ahead process run. For the second trading day, the resource level advisory RUC Schedule is the Schedule in MW which gets cleared from the RUC process. While it is advisory, it serves as a forecast of the resource’s upcoming energy schedule on a two-day ahead base. RUC data presented in this report is for informational purposes only. This advisory data will be available for a rolling window of seven trading-date period on CMRI as soon as the Two Day-Ahead process run is completed (14:00 and 18:00 PST).
Day-Ahead Import/Export Schedules
Day-Ahead Energy Schedules and Ancillary Services Awards at Intertie Scheduling Points.Addition of a new column called “Effective Intertie”, an element that only applies to intertie resources. In cases of an open-tie situation per market run results, this element will indicate the Secondary Tie identifier; whereas if there is no open-tie situation, this element will indicate the Primary Tie identifier.
Day-Ahead Start-Up Instructions
Start-Up instructions resulting from the RUC process
Day-Ahead Ancillary Service Market Results
Resource-specific Ancillary Service Awards resulting from the Integrated Forward Market run
Day-Ahead Market Power Mitigation (MPM) Results
Segments of the “new” or mitigated Bid as a result of the Day-Ahead Market Power Mitigation Process (MPM)
HASP Market Power Mitigation (MPM) Results
Segments of the “new” or mitigated Bid as a result of the HASP Market Power Mitigation Process (MPM)
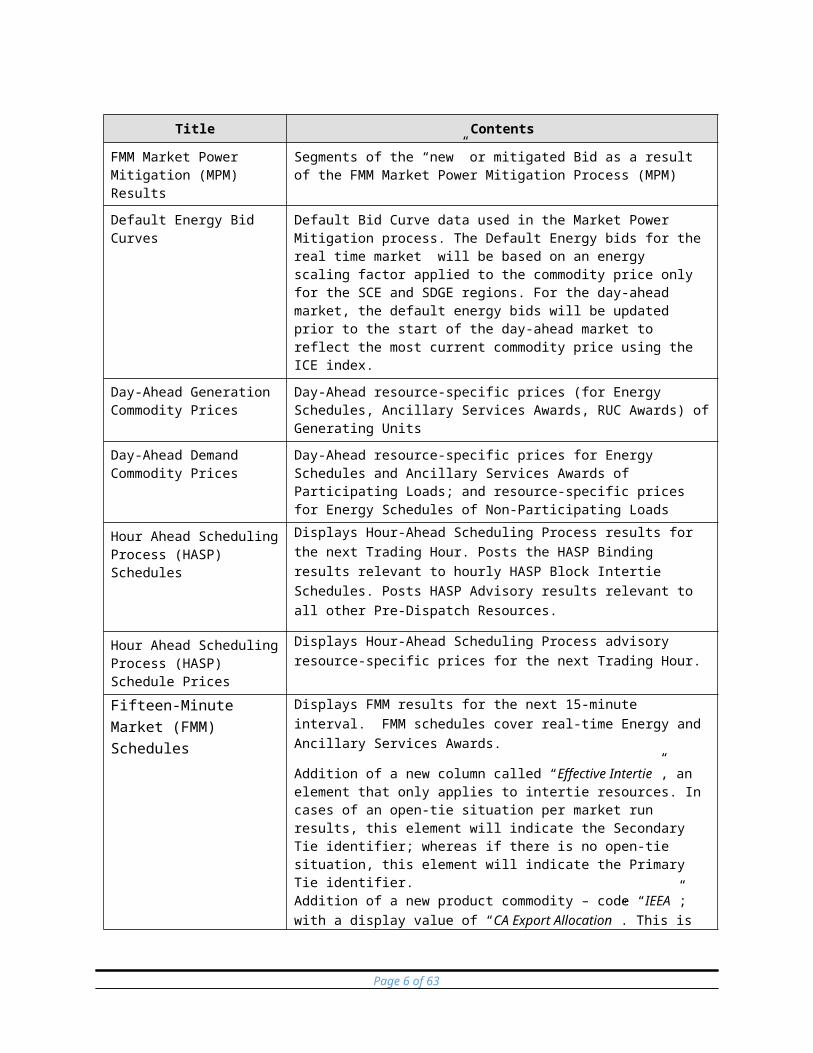
FMM Market Power Mitigation (MPM) Results
Segments of the “new” or mitigated Bid as a result of the FMM Market Power Mitigation Process (MPM)
Default Energy Bid Curves Default Bid Curve data used in the Market Power Mitigation process. The Default Energy bids for the real time market will be based on an
Page 4 of 45

Title Contents
energy scaling factor applied to the commodity price only for the SCE and SDGE regions. For the day-ahead market, the default energy bids will be updated prior to the start of the day-ahead market to reflect the most current commodity price using the ICE index.
Day-Ahead Generation Commodity Prices
Day-Ahead resource-specific prices (for Energy Schedules, Ancillary Services Awards, RUC Awards) of Generating Units
Day-Ahead Demand Commodity Prices
Day-Ahead resource-specific prices for Energy Schedules and Ancillary Services Awards of Participating Loads; and resource-specific prices for Energy Schedules of Non-Participating Loads
Hour Ahead Scheduling Process (HASP) Schedules
Displays Hour-Ahead Scheduling Process results for the next Trading Hour. Posts the HASP Binding results relevant to hourly HASP Block Intertie Schedules. Posts HASP Advisory results relevant to all other Pre-Dispatch Resources.
Hour Ahead Scheduling Process (HASP) Schedule Prices
Displays Hour-Ahead Scheduling Process advisory resource-specific prices for the next Trading Hour.
Fifteen-Minute Market (FMM) Schedules
Displays FMM results for the next 15-minute interval. FMM schedules cover real-time Energy and Ancillary Services Awards.
Addition of a new column called “Effective Intertie”, an element that only applies to intertie resources. In cases of an open-tie situation per market run results, this element will indicate the Secondary Tie identifier; whereas if there is no open-tie situation, this element will indicate the Primary Tie identifier. Addition of a new product commodity – code “IEEA”; with a display value of “CA Export Allocation”. This is the Imbalance Energy Export Allocation applicable for EIM resources.
Fifteen-Minute Market (FMM) Schedule Prices
Displays FMM resource-specific prices for the next 15-minute interval. Covers prices for Energy and Ancillary Services Awards.
Addition of a new Locational Marginal Price LMP component called “GHG” Greenhouse Gas only applicable for EIM resources. It is the additional LMP component due to the net energy export allocation constraint.
Day Ahead Finally Qualified Load Following Capacity
Day-Ahead Finally Qualified Load Following Up and Down Capacity for Metered Subsystems (MSS) resources
Day-Ahead Unit Commitments
Resources that are self-committed or CAISO committed by the IFM or RUC process in the Day-Ahead Market
Default RMR Minimum Load & Startup Cost Bid Curves
Displays the default minimum load and startup cost bid curves that will used for the Market Power Mitigation (MPM) Process. This information originates from an independent entity and applies to RMR units only.
Page 5 of 45
Title Contents
Day-Ahead Import-Export Commodity Prices
Day-Ahead resource-specific prices (for Energy Schedules, Ancillary Services Awards, RUC Awards) of System Resources
Extremely Long Start Resource Startup Instructions
Startup instructions resulting from the Extremely Long Start Commitment (ELC) process.This report is not currently active.
Day-Ahead Reliability Must Run (RMR) Dispatches
RMR units that either have an Energy Schedule (from the IFM run)that is flagged as an RMR Dispatch and/or a Manual RMR Dispatch
Expected Energy Allocation Details
Displays the post-market Expected Energy results from the energyAccounting process. Expected Energy is the sum total of all DA and RT(Including FMM and RTD) market awards, Exceptional Dispatches and any other Dispatch Instructions, taking into account physical limitations (outage management system), disaggregated into their Settlement components. For residual energy, report includes the price at which the residual energy will be settled.User may choose to display allocation either by Default Energy Bid, or the final input bid used by the market systems (SIBR clean bid as adjusted by market pre-processors).Addition of two new expected energy type codes applicable for EIM resources: • BASE - real-time expected energy based on the base schedules • MDE - manual dispatch energy signals
Conformed Dispatch Notice (CDN)
Summary of the Day-Ahead and Real-Time Energy Schedules, Ancillary Service Awards, RMR Dispatches, Competitive Constraint Run results of RMR resources
Expected Energy Post-market or after-the-fact energy accounting results forSettlement calculations. This report will contain the TotalExpected Energy for Day Ahead, Fifteen-Minute, and Real Time Dispatch, and include Instructed and Total energy.
ISO Commitment Cost Details
Includes Commitment and transition Flags, time periods and Costs to validate the BidCost Recovery charge in Settlements
Non-Dispatchable Time Ranges
Specifies the start and end time of non-dispatchable periods including resource commitments, transitions, operations within a forbidden region and DOP corrections. Used to validate the Bid Cost Recovery charge in Settlements.
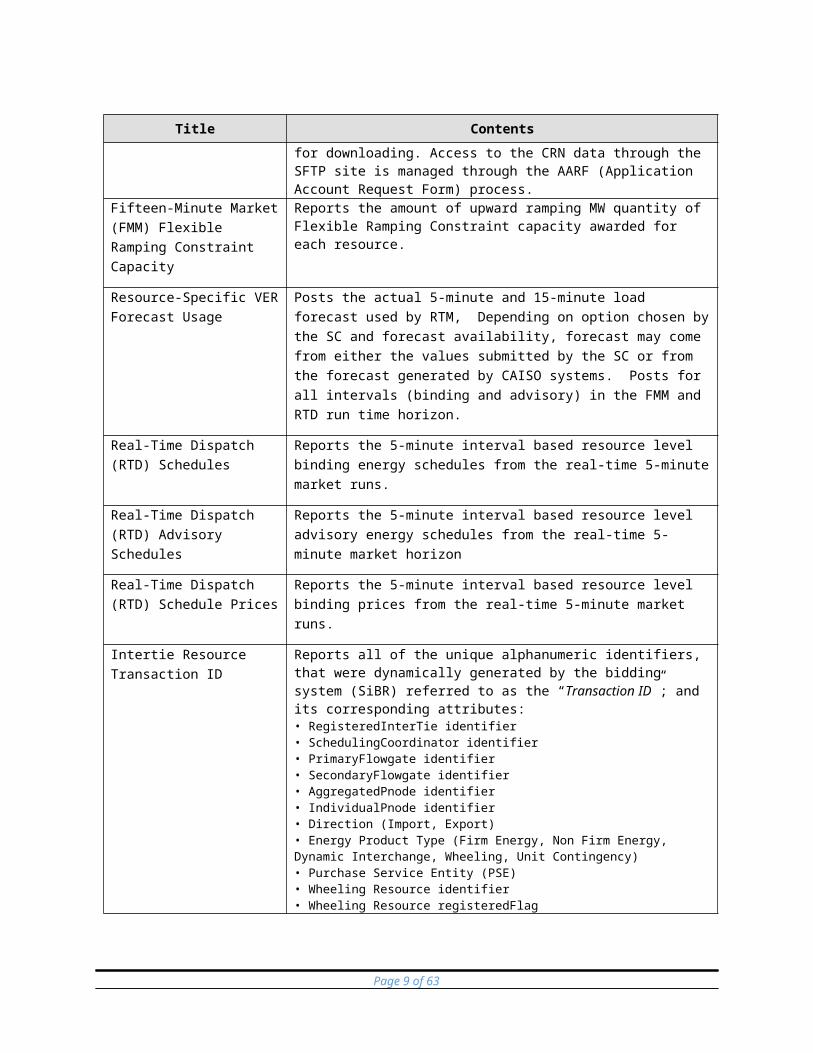
CRN Reports the MW breakdown and CRN number market results for ETC/TOR Self-Schedules in the DAM and the RTM. These MWs breakdown are inputs used in the ETC/TOR balancing rights, and are not the final ETC/TOR balancing rights. RTM CRN reporting includes ETC/TOR schedule changes after the close of the RTM.Note: This report has limited functionality, and is only available inthe GUI. The same results are posted to the CAISO SFTP sitefor downloading. Access to the CRN data through the SFTP site is managed through the AARF (Application Account Request Form) process.
Page 6 of 45

Title Contents
Fifteen-Minute Market (FMM) Flexible Ramping Constraint Capacity
Reports the amount of upward ramping MW quantity of Flexible Ramping Constraint capacity awarded for each resource.
Resource-Specific VER Forecast Usage
Posts the actual 5-minute and 15-minute load forecast used by RTM, Depending on option chosen by the SC and forecast availability, forecast may come from either the values submitted by the SC or from the forecast generated by CAISO systems. Posts for all intervals (binding and advisory) in the FMM and RTD run time horizon.
Real-Time Dispatch (RTD) Schedules
Reports the 5-minute interval based resource level binding energy schedules from the real-time 5-minute market runs.
Real-Time Dispatch (RTD) Advisory Schedules
Reports the 5-minute interval based resource level advisory energy schedules from the real-time 5-minute market horizon
Real-Time Dispatch (RTD) Schedule Prices
Reports the 5-minute interval based resource level binding prices from the real-time 5-minute market runs.
Intertie Resource Transaction ID
Reports all of the unique alphanumeric identifiers, that were dynamically generated by the bidding system (SiBR) referred to as the “Transaction ID”; and its corresponding attributes: • RegisteredInterTie identifier • SchedulingCoordinator identifier • PrimaryFlowgate identifier • SecondaryFlowgate identifier • AggregatedPnode identifier • IndividualPnode identifier • Direction (Import, Export) • Energy Product Type (Firm Energy, Non Firm Energy, Dynamic Interchange, Wheeling, Unit Contingency) • Purchase Service Entity (PSE) • Wheeling Resource identifier • Wheeling Resource registeredFlag
Day-Ahead Base Schedules Reports the generation and interchange base schedules submitted for the day-ahead and/or real-time markets to the CAISO. These represent the forward energy schedules, with hourly granularity, that is the baseline to measure deviations for settlement through the EIM.
Real-Time Base Schedules Reports the generation and interchange base schedules submitted for the day-ahead and/or real-time markets to the CAISO. These represent the forward energy schedules, with hourly granularity, that is the baseline to measure deviations for settlement through the EIM.
Base Schedules Reports the generation and interchange EIM Base Schedules submitted for the day-ahead and/or real-time markets to the CAISO. These represent the forward energy schedules, with hourly granularity, that is the baseline to measure deviations for settlement through the EIM.
Page 7 of 45

Title Contents
EIM Transfer Reports the Energy Imbalance Market transfer (mw) breakdown for each EIM Entity Balancing Authority Area and EIM Entity Balancing Authority Area group under the real-time market runs (RTPD and RTD).
Load Base Schedules Reports the base schedules for load resources under the real-time markets
Balancing Test Results Report that provide the results for the series of tests conducted to ensure that each EIM Entity Balancing Authority Area has sufficient resources to serve its load while still realizing the benefits of increased resource diversity. Please refer to the Energy Imbalance Market Business Practice Manual document for more information.
Transmission Violation Test Results
Report that provide the results for the series of tests conducted to ensure that each EIM Entity Balancing Authority Area has sufficient resources to serve its load while still realizing the benefits of increased resource diversity. Please refer to the Energy Imbalance Market Business Practice Manual document for more information.
Flexible Ramp Requirement Sufficiency Test Results
Report that provide the results for the series of tests conducted to ensure that each EIM Entity Balancing Authority Area has sufficient resources to serve its load while still realizing the benefits of increased resource diversity. Please refer to the Energy Imbalance Market Business Practice Manual document for more information.
Bid Range Capacity Test Results
Report that provide the results for the series of tests conducted to ensure that each EIM Entity Balancing Authority Area has sufficient resources to serve its load while still realizing the benefits of increased resource diversity. Please refer to the Energy Imbalance Market Business Practice Manual document for more information.
Convergence Bidding Reports
The following four Convergence Bidding reports are available through the Customer Market Results Interface (CMRI). Reports 4.2, 4.3 and 4.4 are associated with the CRR Adjustment Settlement Rule. For additional details on the CRR Adjustment Settlement Rule, please see the BPM for Market Operations, Appendix F.
Day Ahead Convergence Bidding Awards
Displays the market Virtual Bidding supply and demand awards that were cleared in the day-ahead market for energyAddition of a new column called “Intertie”, which defines the “Primary Tie” if the virtual bid Pnode or Apnode is external to CAISO
Hourly Prices due to Convergence Bidding for CRR Adjustment
Displays the hourly prices that CAISO uses to calculate Congestion Revenue Rights (CRR) adjustments due to Virtual Bidding.
Binding Transmission Displays supporting data for settlement charges imposed on
Page 8 of 45
Title Contents
Constraints due to Convergence Bidding for CRR Adjustment Report
scheduling coordinators, as a result of the application of the CRR settlement rule - specifically CRR flow impact on award locations for each scheduling coordinator.
Flow Impact due to Convergence Bidding for CRR Adjustment
Displays supporting data for settlement charges imposed on scheduling coordinators, as a result of the application of the CRR settlement rule – specifically CRR flow impact aggregated by Entity, where the Entity is a Convergence Bidding Entity name that coincides with a CRR Holder.
12.1 PricesCAISO provides information on prices to the public through the OASIS web page. The Price reports contain the following information:
Locational Marginal Prices (LMP) – Posts Hourly Locational Marginal Prices for all PNodes, APNodes and Scheduling Points in $/MWh, for the DAM and RUC market processes. Data fields are as follows:
LMP
LMP Marginal Cost of Energy (MCE)
LMP Marginal Cost of Congestion (MCC)
LMP Marginal Cost of Losses (MCL)
Note: For the RUC prices, only the RUC price is posted. The three-component LMP breakdown is not applicable for RUC pricing.
HASP Locational Marginal Prices (LMP) – Posts hourly, the 4 15-minute advisory Locational Marginal Prices in $/MWh, for the HASP hour. Posts the LMP, plus the Congestion, Loss and Energy Components that make up the LMP.
Note: In the event of HASP failure, HASP Pnode prices may not be available in OASIS. In this case, CAISO will not backfill these advisory prices.
Data fields are as follows:
LMP
Page 9 of 45

LMP Marginal Cost of Energy (MCE)
LMP Marginal Cost of Congestion (MCC)
LMP Marginal Cost of Losses (MCL)
FMM Locational Marginal Prices (LMP) – Posts on a 15-minute basis, the 15-minute financially binding Locational Marginal Prices in $/MWh, for the FMM market process. Posts the LMP, plus the Congestion, Loss and Energy Components that make up the LMP.
Interval Locational Marginal Prices (LMP) – Posts the five-minute Locational Marginal Prices for PNodes and APNodes in $/MWh, for each five-minute interval Real-Time Economic Dispatch (RTED). Data fields are as follows:
LMP
LMP Marginal Cost of Energy (MCE)
LMP Marginal Cost of Congestion (MCC)
LMP Marginal Cost of Losses (MCL)
Greenhouse Gas (GHG) 1
Contingency Dispatch Locational Marginal Prices (LMP) – Similar to the Interval Locational Marginal Prices (LMP) report, but for Real Time Contingency Dispatch (RTCD) runs.
Posts the ten-minute Locational Marginal Prices for PNodes and APNodes in $/MWh, for each ten-minute interval RTCD. Data fields are as follows:
LMP
LMP Marginal Cost of Energy (MCE)
LMP Marginal Cost of Congestion (MCC)
LMP Marginal Cost of Losses (MCL)
EIM Green House Gas Shadow Prices (GHG) - Provides the Greenhouse Gas Shadow Price of the net imbalance energy export from all EIM Entity BAAs imported into the ISO BAA resulting from the Real-Time Market runs (RTPD and RTD).
1 Greenhouse Gas component is only applicable to the Energy Imbalance Market (EIM)
Page 10 of 45

AS Clearing Prices – Posts the Ancillary Services Marginal Price (ASMP) for all Ancillary Service types for all binding AS Regions. Posted hourly in $/MW for the DAM.
DAM - Hourly ASMP ($/MW)
Interval AS Clearing Prices - Ancillary Services Marginal Price (ASMP) for all Ancillary Service types for all binding AS Regions. Posts 15-Minute price relevant to the next 15 minute binding interval for RTM on a fifteen minute basis.
RTM - 15Min Binding ASMP ($/MW)
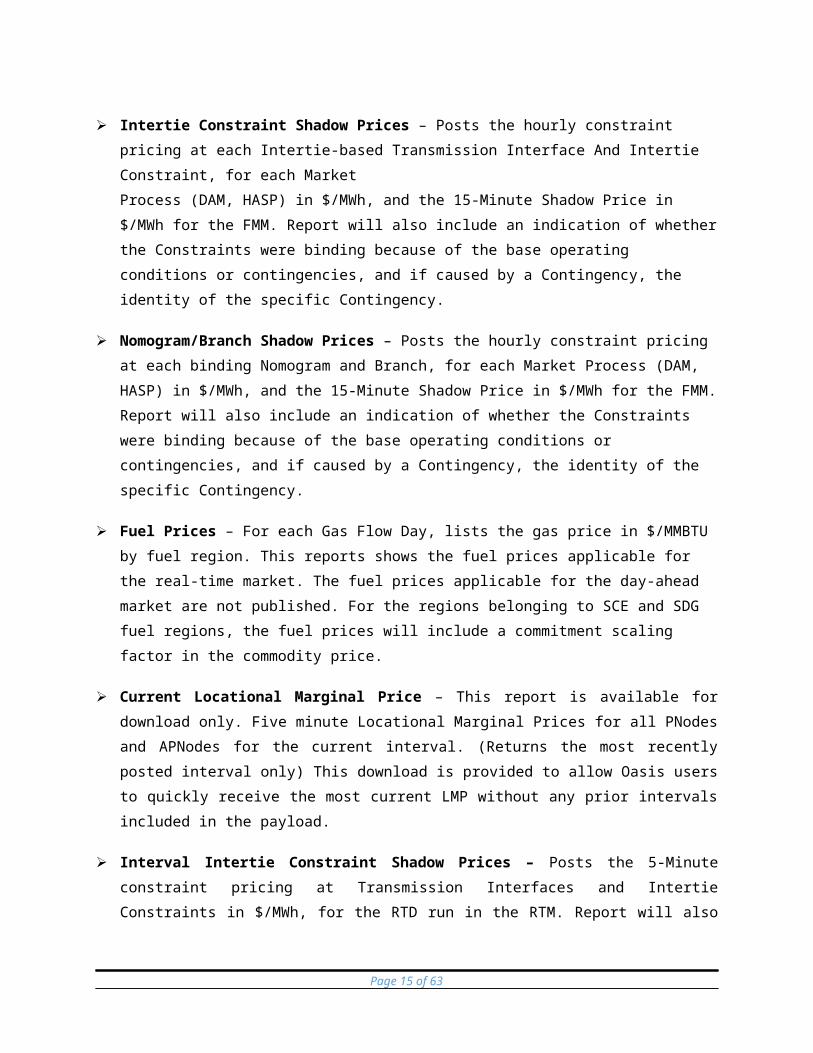
Intertie Constraint Shadow Prices – Posts the hourly constraint pricing at each Intertie-based Transmission Interface And Intertie Constraint, for each MarketProcess (DAM, HASP) in $/MWh, and the 15-Minute Shadow Price in $/MWh for the FMM. Report will also include an indication of whether the Constraints were binding because of the base operating conditions or contingencies, and if caused by a Contingency, the identity of the specific Contingency.
Nomogram/Branch Shadow Prices – Posts the hourly constraint pricing at each binding Nomogram and Branch, for each Market Process (DAM, HASP) in $/MWh, and the 15-Minute Shadow Price in $/MWh for the FMM. Report will also include an indication of whether the Constraints were binding because of the base operating conditions or contingencies, and if caused by a Contingency, the identity of the specific Contingency.
Fuel Prices – For each Gas Flow Day, lists the gas price in $/MMBTU by fuel region. This reports shows the fuel prices applicable for the real-time market. The fuel prices applicable for the day-ahead market are not published. For the regions belonging to SCE and SDG fuel regions, the fuel prices will include a commitment scaling factor in the commodity price.
Current Locational Marginal Price – This report is available for download only. Five minute Locational Marginal Prices for all PNodes and APNodes for the current interval. (Returns the most recently posted interval only) This download is provided to allow Oasis users to quickly receive the most current LMP without any prior intervals included in the payload.
Interval Intertie Constraint Shadow Prices – Posts the 5-Minute constraint pricing at Transmission Interfaces and Intertie Constraints in $/MWh, for the RTD run in the RTM. Report will also include an indication of whether the Constraints were binding because of the
Page 11 of 45

base operating conditions or contingencies, and if caused by a Contingency, the identity of the specific Contingency.
Contingency Dispatch Intertie Constraint Shadow Prices – Similar to the Interval Intertie Constraint Shadow Prices report, but for Real Time Contingency Dispatch (RTCD) runs. Posts the 10-Minute constraint pricing at Transmission Interfaces and Intertie Constraints in $/MWh, for the RTCD run in the RTM. Report will also include an indication of whether the Constraints were binding because of the base operating conditions or contingencies, and if caused by a Contingency, the identity of the specific Contingency.
Interval Nomogram/Branch Shadow Prices - Posts the 5-Minute constraint pricing at each Nomogram and Branch in $/MWh, for the RTD run in the RTM. Report will also include an indication of whether the Constraints were binding because of the base operating conditions or contingencies, and if caused by a Contingency, the identity of the specific Contingency.
Contingency Dispatch Nomogram/Branch Shadow Prices - Similar to the Interval Nomogram/Branch Shadow Prices report, but for Real Time Contingency Dispatch (RTCD) runs. Posts the 10-Minute constraint pricing at each Nomogram and Branch in $/MWh, for the RTCD run in the RTM. Report will also include an indication of whether the Constraints were binding because of the base operating conditions or contingencies, and if caused by a Contingency, the identity of the specific Contingency.
Reference Prices – Posts Quarterly Reference prices associated with each Virtual Bidding PNode and APNode for supply and demand.
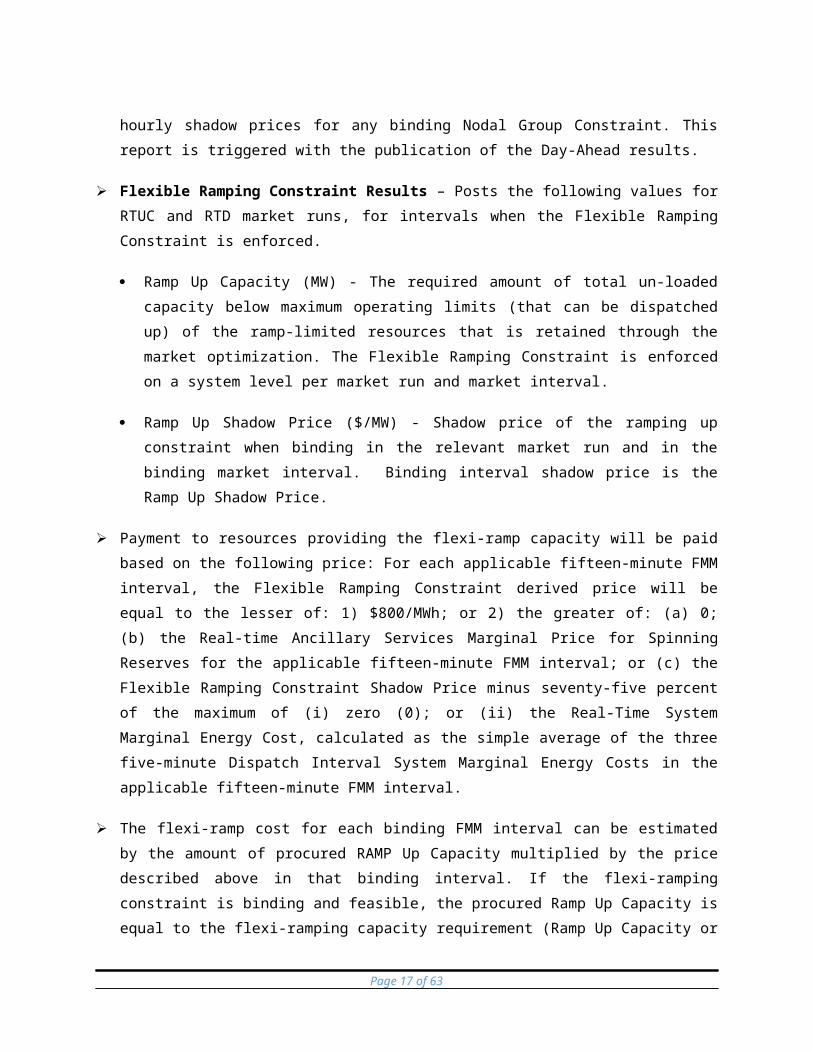
Nodal Group Constraints Shadow Prices - This report displays the upper and lower MW limits, cleared MW value and associated hourly shadow prices for any binding Nodal Group Constraint. This report is triggered with the publication of the Day-Ahead results.
Flexible Ramping Constraint Results – Posts the following values for RTUC and RTD market runs, for intervals when the Flexible Ramping Constraint is enforced.
Ramp Up Capacity (MW) - The required amount of total un-loaded capacity below maximum operating limits (that can be dispatched up) of the ramp-limited resources that is retained through the market optimization. The Flexible Ramping Constraint is enforced on a system level per market run and market interval.
Ramp Up Shadow Price ($/MW) - Shadow price of the ramping up constraint when binding in the relevant market run and in the binding market interval. Binding interval shadow price is the Ramp Up Shadow Price.
Page 12 of 45

Payment to resources providing the flexi-ramp capacity will be paid based on the following price: For each applicable fifteen-minute FMM interval, the Flexible Ramping Constraint derived price will be equal to the lesser of: 1) $800/MWh; or 2) the greater of: (a) 0; (b) the Real-time Ancillary Services Marginal Price for Spinning Reserves for the applicable fifteen-minute FMM interval; or (c) the Flexible Ramping Constraint Shadow Price minus seventy-five percent of the maximum of (i) zero (0); or (ii) the Real-Time System Marginal Energy Cost, calculated as the simple average of the three five-minute Dispatch Interval System Marginal Energy Costs in the applicable fifteen-minute FMM interval.
The flexi-ramp cost for each binding FMM interval can be estimated by the amount of procured RAMP Up Capacity multiplied by the price described above in that binding interval. If the flexi-ramping constraint is binding and feasible, the procured Ramp Up Capacity is equal to the flexi-ramping capacity requirement (Ramp Up Capacity or RAMP_UP_CAP_REQ). However, if the flexi-ramping constraint is infeasible, meaning that the FMM market run is unable to procure the full required flexi-ramping capacity, the procured Ramp Up Capacity would be less than the flexi-ramping capacity requirement. On OASIS, the flexi-ramping capacity requirement not the procured amount is posted.
MPM DA Locational Marginal Prices (LMP) – Hourly Locational Marginal Prices from the Day-Ahead MPM run for all PNodes and APNodes associated with market resources with physical bids in $/MWh. Posts the LMP, including the competitive congestion component, non-competitive congestion component, loss and energy components that make up the LMP.
MPM RTM Locational Marginal Prices (LMP) – 15-minute Locational Marginal Prices from the HASP and FMM MPM runs for all PNodes and APNodes associated with market resources with physical bids in $/MWh. Posts hourly for the 4 intervals of the HASP hour and every 15 minutes for FMM. Posts the LMP, plus the competitive congestion component, non-competitive congestion component, loss and energy components that make up the LMP.
MPM Nomogram/Branch Group Shadow Prices – Posts the constraint pricing at each binding nomogram and branch group, for each market process of the MPM run (DAM, HASP, FMM) in $/MWh. Posts hourly data for DAM and 15 minute data for HASP and FMM. Report will also include an indication of whether the Constraints were binding because of the base operating conditions or contingencies, and if caused by a Contingency, the identity of the specific Contingency.
MPM Nomogram/Branch Group Competitive Paths – Posts the results of the dynamic competitive path determination, for binding nomogram and branch constraints for each
Page 13 of 45

market process of the MPM run (DAM, HASP, FMM). Posts hourly data for DAM and 15 minute data for HASP and FMM. Posts a flag indicating whether each binding constraint was competitive or not.
MPM Intertie Constraint Shadow Prices – Posts the constraint pricing at Transmission Interfaces and Intertie Constraints, for each market process of the MPM run (DAM, HASP, FMM) in $/MWh. Posts hourly data for DAM and 15 minute data for HASP and FMM. Report will also include an indication of whether the Constraints were binding because of the base operating conditions or contingencies, and if caused by a Contingency, the identity of the specific Contingency.
MPM Intertie Constraint Competitive Paths – Posts the results of the dynamic competitiveness constraint, for binding interchange, market scheduling limit, and branch group constraints for each market process of the MPM run (DAM, HASP, FMM). Posts hourly data for DAM and 15 minute data for HASP and FMM. Posts a flag indicating whether each binding constraint was competitive or not.
MPM Reference Bus – Posts the reference bus used in the MPM run for each market process of the MPM run (DAM, HASP, FMM). Contains hourly data for the Day-Ahead market and 15-minute data for HASP and FMM. Note, the IFM, RUC, and regular HASP and FMM runs use a distributed reference bus.
Greenhouse Gas Allowance Prices – Posts the index price for the greenhouse gas allowance in $/allowance.
Historical ACE Data – Pursuant to FERC Order 784; 18 C.F.R § 385 37.6(k), the CAISO will post on OASIS historical one-minute and ten-minute area control error data for the most recent calendar year, and update this posting once per year. The CAISO will post this annual data by the end of January for the previous year.
Number 2 & 3
Attachment C
Page 14 of 45
GAS PRICE INDEX CALCULATION RULESC Gas Price Index Calculation RulesC.1 Background
The daily Gas Price Index (GPI) is the index that is used in the calculation of the Default Energy Bids, as well as the generated bids including Startup Costs, and Minimum Load Costs subject to the proxy cost option. The GPI has a number of key components, including principally the gas price indices themselves and the intra-state gas transport costs. Gas Price Indices consist of a single price ($/mmBTU) for each GPI Region, of which there is at least one for each of the main LSEs. Each Resource is associated with the GPI Region in which it resides, or to which it is geographically closest. The GPI calculated for resources assigned to a BAA regional fuel region (e.g., CISO) will be the minimum of all GPI index values for GPI Regions within the BAA. Monthly futures gas prices are used in the calculation of Demand Response net benefits test (DR NBT) threshold prices and projected proxy costs. The monthly price is calculated similar to the daily price, but using an average of several days’ futures prices instead of a single day-ahead price.
C.2 Gas Transport CostThe proxy gas transport costs are based on the cost of gas transport in the respective service territories of the main LSEs. It is calculated in the following manner:
Units served by SDG&E: The Southern California Gas Company intrastate transportation rate (currently GT-SD) plus the volumetric component of the SDG&E gas transportation rate for electric generation service, including the ITCS2 (currently GTUEG – SD), or any successor rate for electric generation service applicable to deliveries to the Facility, divided by one minus the applicable in-kind shrinkage allowance, if any.
Units served by Southern California Gas: The Southern California Gas Company intrastate transportation rate for firm electric generation service, including the ITCS (GT-F) plus the G-ITC Wheeler Ridge Interconnection Access fee, if applicable, or any successor rate for firm electric generation service applicable to deliveries to the Facility, divided by one minus the applicable in-kind shrinkage allowance, if any.
Units served by PG&E: The PG&E intrastate transportation charge stated in Rate Schedule G-EG, or any successor rate for electric generation service applicable to
2 ITCS means Interstate Transition Cost Surcharges.
Page 15 of 45

deliveries to the Facility, divided by one minus the applicable in-kind shrinkage allowance, if any.3
C.3 Daily Gas Prices
Pursuant to tariff section 30.4 and 39.7.1.1.1.3, the CAISO will use different gas prices for the Day-Ahead Market and the Real-Time Market. Gas price index will be calculated for both the day-ahead and real-time markets for the following fuel regions:
Gas Price Index hubs Gas Price Index plus applicable regional transportation adder
PG&E Citygate PGE2
SoCal Citygate SCE1
SCE2
SDGE1
SDGE2
The specific calculations for day-ahead and real-time are different and are described in sections C.3.1 for day-ahead and C.3.2 for real-time.
C.3.1 Standard Calculation Process for the Day-Ahead Market
For the Day-Ahead Market, the CAISO will use the gas price reported by the Intercontinental Exchange between 8:00 and 9:00 Pacific Time. The CAISO will use a volume-weighted average price calculated by the Intercontinental Exchange based on the trades transacted for next-day gas for the PG&E Citygate and Southern California (SoCal) Citygate hub prices.
The CAISO then adds the appropriate transportation adder to create five specific different regional gas cost values, plus one region for CAISO (outlined in section C.1 above), utilized in the CAISO market systems.
3 If the Facility does not qualify for service under Rate Schedule G-EG, the applicable rate shall be given by Rate Schedule G-NT.
Page 16 of 45
If for any reasons the ICE price is not available by 9am, the day ahead market will use the gas price indices estimated through the real-time market process described in section C.3.2.
C.3.2 Standard Calculation Process for the Real-Time Market
For the Real-time market, the CAISO will use at least two prices from two or more of the following publications: Natural Gas Intelligence, SNL Energy/BTU’s Daily Gas Wire, Platt’s Gas Daily, and the Intercontinental Exchange. The gas price indices reflect the commodity gas price.
If for any reason there are fewer than two available gas price indices, the real-market will use the last available gas price indices.
SourceEarliest Time Available (PST)
Latest Time Available (PST)
ICE 11:30 AM 12:00 PMSNL Energy/BTU Daily 16:00 PM 19:00 PMNGI 19:00 PM 2:00 AM (flow date)Platt's 17:00 PM 19:00 PM
The CAISO calculates the Real-Time Market gas price indices each day between 19:00 and 22:00 Pacific Time using natural gas prices published earlier on the same day.
C.3.2.1 Real-Time Market Gas Price Index for Southern California
Due to limited operations of the Aliso Canyon natural gas storage facility, the CAISO will increase the gas price for resources receiving gas service from Southern California Gas Company and San Diego Gas and Electric Company to improve the dispatch of these resources so that they are more likely to be dispatched to address local needs rather than system needs, account for the systematic differences between day-ahead and same-day natural gas prices and improves the ability to manage the generators’ gas usage within applicable gas balancing rules. Gas-fired resources that have registered SCE1, SCE2, SDG1 or SDG2 as the fuel region for the resource in the Master File are applicable resources.
For applicable resources, the CAISO will increase the gas commodity used in the calculation of Start-Up Costs, Minimum Load Costs and Transition Costs as described in Tariff Section 30.4.1.1 by 75%.
Gas Price Index for Southern California Commitment Costs = SoCal Citygate commodity price *1.75 + applicable Transportation Cost
For applicable resources, the CAISO will increase the gas commodity used in the calculation of Default Energy Bids as described in Tariff Section 39.7.1.1 by 25%.
Page 17 of 45
Gas Price Index for Southern California Default Energy Bids = SoCal Citygate commodity price *1.25 + applicable Transportation Cost
Tariff Section 39.7.1.1.1.3(d) allows for increases and decreases in the percentages. The CAISO will issue a Market Notice specifying the amount of the increase or decrease.
Page 18 of 45

Number 4
1.1 Daily & Hourly Bid Components This section is based on CAISO Tariff Section 30.4 Election for Start-Up and Minimum
Load Costs and Section 39.6.1.6. (Start-Up and Minimum Load Costs are not applicable to Virtual Bids).
Bid components are divided into two categories:
Daily Bid components – These Bid components are constant across all Trading Hours in a Trading Day and do not change for that Trading Day , except for Start-Up, Minimum Load and Transition Costs which can be re-bid in RTM.
Hourly Bid components – These Bid components can vary in each Trading Hour of the Trading Day.
With the exception of three Bid components (Start-Up, Minimum Load and Transition Costs), all Bid components can vary each day, and are submitted by SCs as part of their DAM and RTM Bids. For Start-Up and Minimum Load Bid components, the SC selects one of two alternatives: Registered Cost or Proxy Cost. The elections are independent; that is, a Scheduling Coordinator electing either the Proxy Cost option or Registered Cost option for Start-Up Costs may make a different election for Minimum Load Costs. The Start-Up and Minimum Load Bid components are constant for each Trading Day for the period submitted.
If Registered Cost is selected for Start-Up and/ or Minimum Load, the SC submits information for Start-Up and/ or Minimum Load respectively to CAISO for entry into the Master File. Subject to the applicable cap, these values can be updated every 30 days through the Master File Update process that is described in Attachment B. Start-Up and Minimum Load Costs under the Registered Cost Option may not exceed 150 percent of the unit’s Projected Proxy Cost for Start-Up and Minimum Load Costs. If the SC selects the Registered Cost Option, the values will be fixed for 30 days unless the resources costs, as calculated pursuant to the Proxy Cost option, exceed the Registered Cost option, in which case the SC may switch to the Proxy Cost option for the balance of the 30 day period. (see Attachment G for details).
If the Proxy Cost option is selected, the Start-Up and Minimum Load Bid components are calculated daily for each Generating Unit based on the daily gas price and includes, in addition, auxiliary power costs (for Start-Up), O&M costs (Minimum Load adder as listed in Exhibit 4-2, the adder is a value registered in the Master File), greenhouse gas allowance Start-Up and Minimum Load costs if applicable (see Attachment K), the Market Services Charge and System Operations Charge components of the Grid Management Charge (GMC) (for Start-Up), the
Page 19 of 45
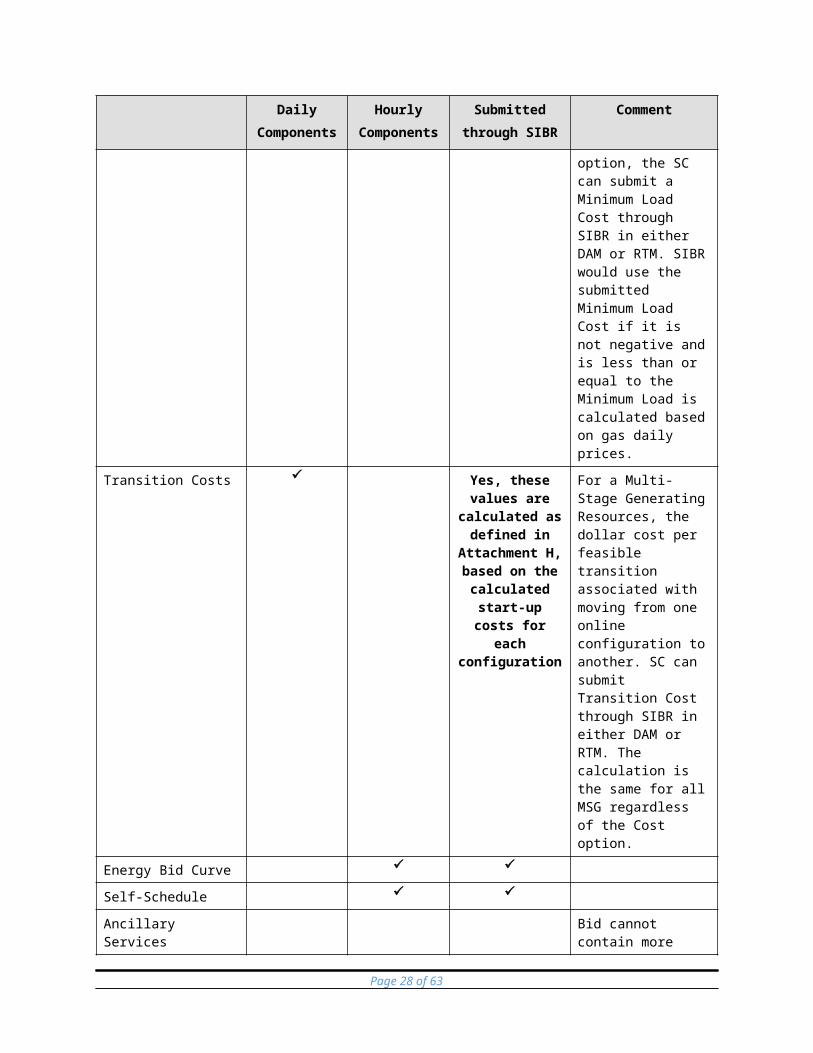
Market Services Charge and System Operations Charge components of the GMC and the Bid Segment Fee component (for Minimum Load), and a major maintenance cost adder if applicable (see Attachment L), which may be different for Start-Up and Minimum Load. The process that CAISO uses to calculate the daily gas price is shown in Attachment C, and there is an example in section 8.2.1.3 for a Generated Bid. The SC is also allowed to submit a Start-Up and/or Minimum Load Cost Bid as part of a generator’s Bid in the Day-Ahead Market (DAM) and or the Real-Time Market (RTM) as long as the SC elected the Proxy Cost option for them and the submitted Bid is not negative and is less than or equal to the proxy cost calculated using the daily Gas Price Index and the Relative Proxy (Start-up or Minimum Load) Cost Ceiling. RTM submissions will not be used if the resources was committed in the DAM, the DAM Daily Components will be copied to the RTM bid.
Transition Cost will be calculated as the product of the Transition Fuel and the Daily Gas Price Index associated with the resource. This will be the same for all Multi-Stage Generating Resources regardless of the resource’s elected Cost option.
The details of the Bid components are described in subsequent sections.
Exhibit 0-2: Daily & Hourly Bid ComponentsDaily
ComponentsHourly
ComponentsSubmitted
through SIBRComment
Start-Up Yes, only if proxy cost option is currently
effective for Start-Up Cost in
Master File.
If the resource has elected to use Registered Cost, the Start-Up cost used is that registered in the Master File. If the resource has elected the Proxy Cost option, the SC can submit a Start-Up Cost through SIBR in either DAM or RTM. SIBR would use the submitted Start-up cost if it is not negative and is less than or equal to the Start-Up Cost calculated based on daily gas prices.
Minimum Load Yes, only if Proxy Cost
option is currently
effective for Minimum Load Cost in Master
File.
If the resource has elected to use Registered Cost, the Minimum Load cost used is that registered in the Master File. If the resource has elected the Proxy
Page 20 of 45

Daily Components
Hourly Components
Submitted through SIBR
Comment
Cost option, the SC can submit a Minimum Load Cost through SIBR in either DAM or RTM. SIBR would use the submitted Minimum Load Cost if it is not negative and is less than or equal to the Minimum Load is calculated based on gas daily prices.
Transition Costs Yes, these values are
calculated as defined in
Attachment H, based on the
calculated start-up costs for
each configuration
For a Multi-Stage Generating Resources, the dollar cost per feasible transition associated with moving from one online configuration to another. SC can submit Transition Cost through SIBR in either DAM or RTM. The calculation is the same for all MSG regardless of the Cost option.
Energy Bid Curve
Self-Schedule
Ancillary Services Bid cannot contain more than certified quantities for each service.
Regulation Down
Regulation Up
Spinning Reserve
Non-Spinning Reserve
Ramp Rate Bid by SC, within limits of the minimum and maximum Ramp Rates in the Master File.
Operational Ramp Rate
Operating Reserve
Page 21 of 45

Daily Components
Hourly Components
Submitted through SIBR
Comment
Ramp Rate
Regulation Ramp Rate
Contingency Dispatch Indicator
Must be selected if any AS is part of the Bid/Schedule.
Intertie Minimum Hourly Block (DA)
For Non-Dynamic System Resources, specifies minimum number of hours that an intertie bid must be awarded in the DA market, if economic. If no Minimum Hourly Block is set, it defaults to 1.
Dispatch Option A Bid option that determines the participation of an Intertie resource in the Real-Time Market: Hourly:
submission of a HASP Block Intertie Schedules
Once: submission of an Economic Hourly Block Bid with Intra-Hour option.
15min: dispatched in each 15 minute Interval of a Trading Hour with a flat Dispatch for all 5 minute Dispatch Intervals of that 15 minute Interval.
Dynamic: dispatched in each 5 minute Dispatch Interval of a Trading Hour.
Page 22 of 45

Daily Components
Hourly Components
Submitted through SIBR
Comment
Pump Shut-Down Cost
Pumping Cost
Energy Limit (Maximum and Minimum Daily)
RUC
Capacity Limit (Unrelated to Capacity Limit Indicator). Specifies an upward limit on the total Energy and Ancillary Services awards for a given hour. Limit must be set no lower than the maximum of the highest energy bid or the RA obligation amount. Used mainly for partial RA or non-RA resources who want to limit the total award when bidding multiple services.
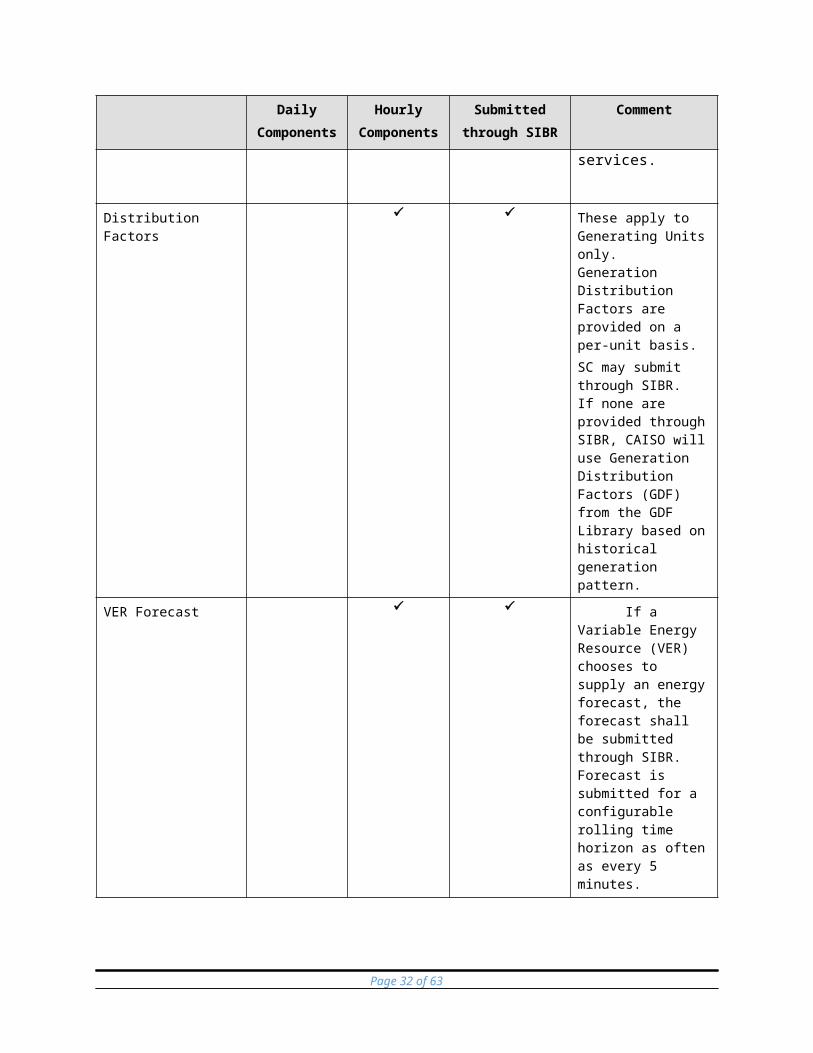
Distribution Factors These apply to Generating Units only. Generation Distribution Factors are provided on a per-unit basis.SC may submit through SIBR. If none are provided through SIBR, CAISO will use Generation Distribution Factors (GDF) from the GDF Library based on historical generation pattern.
VER Forecast If a Variable Energy Resource
Page 23 of 45

Daily Components
Hourly Components
Submitted through SIBR
Comment
(VER) chooses to supply an energy forecast, the forecast shall be submitted through SIBR. Forecast is submitted for a configurable rolling time horizon as often as every 5 minutes.
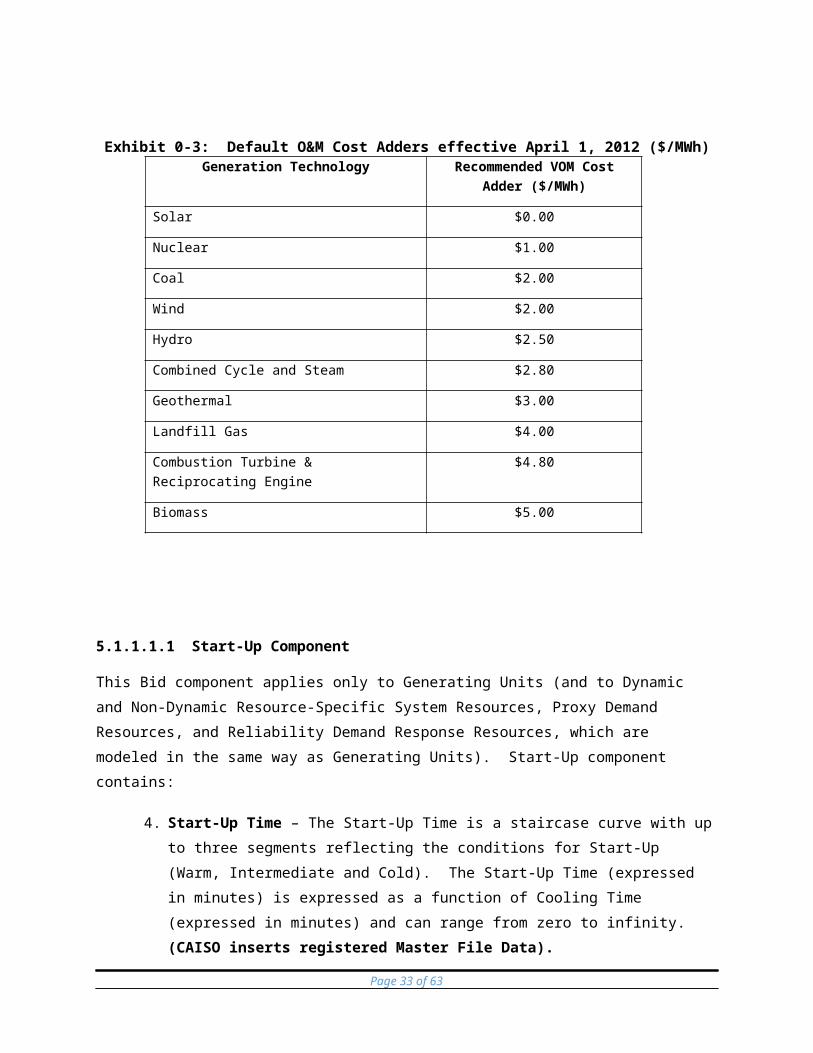
Exhibit 0-3: Default O&M Cost Adders effective April 1, 2012 ($/MWh)Generation Technology Recommended VOM Cost Adder
($/MWh)
Solar $0.00
Nuclear $1.00
Coal $2.00
Wind $2.00
Hydro $2.50
Combined Cycle and Steam $2.80
Geothermal $3.00
Landfill Gas $4.00
Combustion Turbine & Reciprocating Engine $4.80
Biomass $5.00
5.1.1.1.1 Start-Up Component
This Bid component applies only to Generating Units (and to Dynamic and Non-Dynamic Resource-Specific System Resources, Proxy Demand Resources, and Reliability Demand Response Resources, which are modeled in the same way as Generating Units). Start-Up component contains:
Page 24 of 45
Start-Up Time – The Start-Up Time is a staircase curve with up to three segments reflecting the conditions for Start-Up (Warm, Intermediate and Cold). The Start-Up Time (expressed in minutes) is expressed as a function of Cooling Time (expressed in minutes) and can range from zero to infinity. (CAISO inserts registered Master File Data).
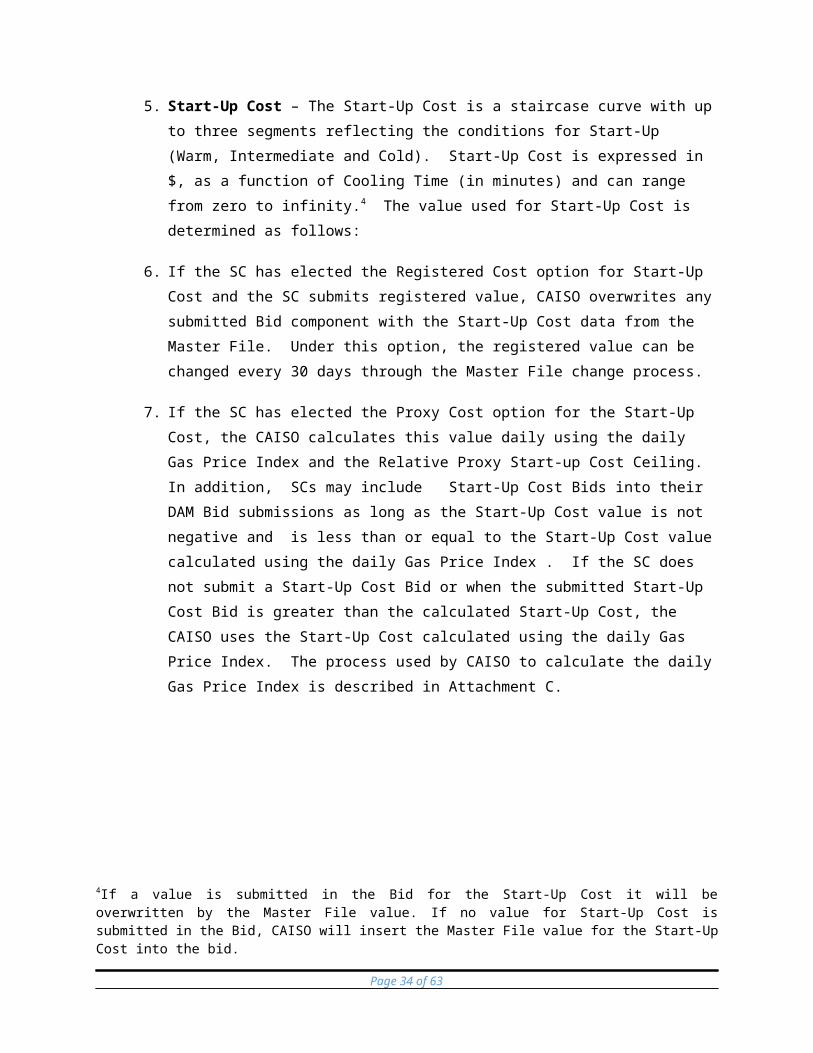
Start-Up Cost – The Start-Up Cost is a staircase curve with up to three segments reflecting the conditions for Start-Up (Warm, Intermediate and Cold). Start-Up Cost is expressed in $, as a function of Cooling Time (in minutes) and can range from zero to infinity.4 The value used for Start-Up Cost is determined as follows:
If the SC has elected the Registered Cost option for Start-Up Cost and the SC submits registered value, CAISO overwrites any submitted Bid component with the Start-Up Cost data from the Master File. Under this option, the registered value can be changed every 30 days through the Master File change process.
If the SC has elected the Proxy Cost option for the Start-Up Cost, the CAISO calculates this value daily using the daily Gas Price Index and the Relative Proxy Start-up Cost Ceiling. In addition, SCs may include Start-Up Cost Bids into their DAM Bid submissions as long as the Start-Up Cost value is not negative and is less than or equal to the Start-Up Cost value calculated using the daily Gas Price Index . If the SC does not submit a Start-Up Cost Bid or when the submitted Start-Up Cost Bid is greater than the calculated Start-Up Cost, the CAISO uses the Start-Up Cost calculated using the daily Gas Price Index. The process used by CAISO to calculate the daily Gas Price Index is described in Attachment C.
Example of Start-Up Bid Component
Cooling Time(Minutes)
Start-Up Time(Minutes)
Start-Up Cost($)
Warm 0 600 6,500
Intermediate 240 1390 9,800
Cold 480 1400 12,000
The Start-Up Cost component is a daily Bid component and can be bid into both the DAM and the RTM. RTM submissions will not be used if the resources was committed in the DAM, the DAM Daily Components will be copied to the RTM bid.
4If a value is submitted in the Bid for the Start-Up Cost it will be overwritten by the Master File value. If no value for Start-Up Cost is submitted in the Bid, CAISO will insert the Master File value for the Start-Up Cost into the bid.
Page 25 of 45
If the SC has selected Registered Cost option for the Start-Up Cost, this value can be changed every 30 days through the Master File change process. The process used by CAISO to calculate the daily Gas Price Index is described in Attachment C. Whenever the Start-Up Cost submitted by the SC is overwritten, the CAISO notifies the SC that the daily Bid Start-Up Cost has been overwritten by the default values when the Bid confirmation is provided to the SC.
5.1.1.1.2 Minimum Load Cost Component
This Bid cost component applies to Generating Units and Proxy Demand Resources. The Minimum Load Cost component contains:
The hourly cost of operating the Generating Unit at Minimum Load, expressed in $/hr.5
The Minimum Load Cost can be bid into both the DAM and the RTM. RTM submissions will not be used if the resources was committed in the DAM, the DAM Daily Components will be copied to the RTM bid.
If the SC has elected the Registered Cost option for Minimum Load Cost, and the SC submits data for this component, CAISO overwrites the Bid component with the data from the Master File. If the SC selected Registered Cost Minimum Load Cost, this value can be changed every 30 days through the Master File.
If the SC has elected the Proxy Cost option for Minimum Load Cost, CAISO calculates this value daily based on the daily Gas Price Index. In addition, SCs may include Minimum Load Cost Bids into their DAM Bid as long as the value is not negative and is less than or equal to the Minimum Load Cost value calculated using the daily Gas Price Index and the Relative Proxy Minimum Load Cost Ceiling. If the SC does not submit a Minimum Load Cost Bid or when the submitted Minimum Load Cost Bid is greater than the calculated Minimum Load Cost, the CAISO uses the Minimum Load Cost calculated using the daily Gas Price Index. The process used by CAISO to calculate the daily Gas Price Index is described in Attachment C.
The CAISO notifies the SC that the Minimum Load Cost component has been overwritten by the default values when the Bid confirmation is provided to the SC.
5 If a value is submitted in the Bid for the Minimum Load Cost it will be overwritten by the Master File value. If no value for Minimum Load Cost is submitted in the Bid, CAISO will insert the Master File value for the Minimum Load Cost into the bid.
Page 26 of 45

8.2.1.3 SIBR Generated Bid (Physical Bids only)
In the event that SIBR must generate a Bid or Bid component to comply with Tariff requirements SIBR will generate a Bid or Bid component for the resource. There is a series of processing rules that are executed to establish the Start-Up and Minimum Load Cost in SIBR to generate the Bid with the proper Start-Up and Minimum Load costs based on the resource’s election of either the Proxy Cost Option or the Registered Cost Option , and if it is a Natural Gas resource or Non-Natural Gas resource. Registered Cost resources use the values provided for the resource that are in the Master File.
Resources that are subject to CAISO Tariff Appendix II must select the Proxy Cost Option for Start-Up and Minimum Load costs. The SIBR Rules (Appendix A) sections 411xx (Generating Resource Start-Up Bid Component Processing and Generating Resource Minimum Load Cost Bid Component Processing detail the generation of these costs.
Start-Up Bid Component
If the Registered Cost Option is selected, a Registered Start-Up Cost will be generated. See Attachment G for details.
If the Proxy Cost Option is selected, the following two curves will be generated for a Start-Up Bid component if the Scheduling Coordinator has not submitted a Start-Up Bid component, or if the submitted Start-Up Bid component is higher than the proxy cost:
1. The Start-Up Time Bid Curve - this is the registered value retrieved from Master File for the resource and most current Trading Day.
2. The Start-Up Cost Curve - this is calculated using the following information:
a. Start-Up Energy Cost Curve (registered Start-Up Energy * Energy Price Index).
b. Start-Up Fuel Cost Curve (registered Start-Up Fuel * Gas Price Index).
c. Greenhouse Gas Start-Up Cost Allowance Curve (if applicable – see Attachment K for details).
d. Major Maintenance Start-Up Cost Adder (if applicable – see Attachment L for details).
e. Grid Management Charge (GMC) Start-Up Cost Adder (Minimum Load * GMC Adder * (shortest Start-Up Time/60) * .5). The GMC Adder is made up of the Market Services Charge and System Operations Charge components.
Page 27 of 45
f. Relative Proxy Start-Up Cost Ceiling (125%) – for validation of submitted Start-Up Bid Component.
Start-Up Cost Curve = Start-Up Energy Cost Curve + Start-Up Fuel Cost Curve + Greenhouse Gas Start-Up Cost Allowance Curve + Major Maintenance Start-Up Cost Adder + GMC Start-Up Cost Adder.
For examples of a Start-Up Bid component calculation, see Attachment G.
Minimum Load Cost Component
If the Registered Cost Option is selected, a Registered Minimum Load Cost will be generated. See Attachment G for details.
If the Proxy Cost Option is selected, the Minimum Load Cost is generated using the following information if the Scheduling Coordinator has not submitted a Minimum Load Cost bid, or if the submitted Minimum Load Cost bid is higher than the proxy cost:
1. Minimum Load Fuel Cost – the product of the Minimum Load Heat Rate, the Minimum Load, and the daily Gas Price Index.
2. Operation and Maintenance Minimum Load Cost - the product of the registered Operation and Maintenance Cost and the registered Minimum Load. Alternatively, a custom O&M adder may be negotiated with the CAISO or the Independent Entity.
3. Greenhouse Gas Allowance Minimum Load Cost - the product of the Greenhouse Gas Minimum Load Cost Allowance and the registered Minimum Load (if applicable – see Attachment K for details).
4. Major Maintenance Minimum Load Cost Adder (if applicable – see Attachment L for details).
5. Grid Management Charge (GMC) Minimum Load Cost Adder - product of the GMC Minimum Load Cost Adder and the registered Minimum Load. The GMC Minimum Load Cost Adder is made up of the Market Services Charge and System Operations Charge components and a third value representing the Bid Segment Fee component divided by the resource Pmin.
6. Relative Proxy Minimum Load Cost Ceiling (125%) – for validation of submitted Minimum Load Bid Component.
Minimum Load Cost = Minimum Load Fuel Cost + Operation and Maintenance Minimum Load Cost + Greenhouse Gas Allowance Minimum Load Cost + Major Maintenance Minimum Load Cost Adder + GMC Minimum Load Cost Adder.
Page 28 of 45

For examples of a Minimum Load Cost Component calculation, see Attachment G.
Energy Bid Component
An Energy Bid will be generated as provided in accordance with the CAISO’s SIBR rules using the following information if the Scheduling Coordinator has not submitted an Energy Bid:
1. Energy cost curve – product of the incremental heat rate curve multiplied by the Gas Price Index.
2. Operation and Maintenance (O&M) cost - specified in Exhibit 4-2. Alternatively, a custom O&M adder may be negotiated with the CAISO or the Independent Entity.
3. Grid Management Charge (GMC) adder - made up of the Market Services Charge and System Operations Charge components and a third value representing the Bid Segment Fee component divided by the bid segment MW size.
Energy Bid curve = energy cost curve + O&M cost + GMC adder.
Below is an example of how the Bid is generated for Generating Units and Resource Specific System Resources. Additional examples are contained in Attachment F. For non-Resource Specific System Resources, please see Appendix Attachment I.
Bid Curve Generation Example
The Generating Unit in the following example is registered as a natural gas resource. The following registered Master File data is used in the example. These values are for illustrative purposes only:
Operating Levels
Average Heat Rate
Gas price index
Operation & Maintenance Cost
Grid Management Charge adder
70 14440 $5.5 $2.80 $0.50150 11960300 10909
485.17 10366
1) Generated Energy Curve Calculation
The generated Energy Curve is calculated as the sum of the Incremental Fuel Cost curve (calculated in section 3 and 4 below), the registered Operation and Maintenance Cost ($/MWh), and the GMC adder.
Segment 1 – (53.85 + 2.80 + 0.50) = $57.15
Page 29 of 45

Segment 2 – (54.22 + 2.80 + 0.50) = $57.52
Segment 3 – (52.17 + 2.80 + 0.50) = $55.47
The resulting Energy Curve is:
70MW – 150MW @ $57.15
150MW – 300MW @ $57.52
300MW – 485.17MW @ $55.47
The Generated Energy curve must be adjusted to be monotonically increasing. If a Generated Energy Bid Curve is not monotonically increasing, CAISO adjusts the Energy Bid price of each Energy Bid segment after the first one, to the previous Energy Bid segment, if higher, and the two Energy Bid segments are merged in the Energy Bid Curve
2) Final Generated Energy Curve
70MW - 150MW @ 57.15
150MW – 485.17 MW @ 57.52
Note, if the resource is subject to a greenhouse gas compliance obligation as indicated in the Master File, the CAISO will add to this curve an incremental energy curve representing the cost of meeting that obligation. See Appendix Attachment K for details.
3) Incremental Fuel Cost Curve Calculation
The Incremental Fuel Cost Curve used to derive the Energy Bid Curve must be calculated as the product of the Incremental Heat Rate Curve and the registered Gas Price Index ($/MMBtu) for that Trading Hour and the Generating Resource specified in that Bid, if that Generating Resource is registered as a Natural Gas Resource for that Trading Hour.
Segment 1 - 9790/1000 * 5.5 = 53.85
Segment 2 – 9858/1000 * 5.5 = 54.22
Segment 3 – 9486/1000 * 5.5 = 52.17
4) Incremental Heat Rate Calculation
Page 30 of 45

The Incremental Heat Rate of the Incremental Heat Rate Curve segment between two Operating Levels is calculated as the ratio of the difference between the product of the registered Average Heat Rate at the higher Operating Level times that Operating Level, minus the product of the registered Average Heat Rate at the lower Operating Level times that Operating Level, over the difference between the higher Operating Level and the lower Operating Level
Segment 1 – ((11960 * 150) – (14440 * 70))/(150 – 70) = 9790
Segment 2 – ((10909*300) – (11960 * 150))/(300-150) = 9858
Segment 3 – ((10366*485.17) –(10909 * 300))/(485.17 – 300) = 9486
5) Minimum Load Cost Calculation
Minimum Load Cost = Minimum Load Fuel Cost + (O&M * Minimum Operating Level) + Greenhouse Gas Allowance Minimum Load Cost + Major Maintenance Minimum Load Cost Adder + GMC Minimum Load Cost Adder
6) Transition Cost Calculation - See Attachment H of this BPM for details.
B.2.1 Generator Resource – May request data change
This table contains operational data for the Generator resources where changes to the data can be initiated by the Market Participants via the RDT update process. The field names are listed in the order they appear in the GRDT.
Page 31 of 45
Master File Field Name
(RDT Column Name)
Definition Parameter and/or Enumerations
MAX_GEN(Maximum Generation Capacity)
The Net Dependable Capacity (NDC or PMAX) a Generator Resource can produce on a sustained basis as measured at or compensated to the Generating Unit's defined point of delivery.
Cannot be null
MIN_GEN(Minimum Generation Capacity)
The minimum output level at which a Generator Unit can operate.
Note: Depending on schedules and bids submitted in the market, the CAISO may dispatch units in the real-time market between the values of min gen and max gen. Therefore, the CAISO strongly recommends that the min gen level be set at the Minimum Output Level (PMIN) at which a Generator Unit can operate on a sustained basis.
Cannot be null.
MIN_DISP_LEVEL(Minimum Dispatchable Level)
The Minimum operating level at which a Generating Unit is able to readily respond to a dispatch instruction
MIN_ON(Minimum On Time)
The minimum amount of time that a Generating Unit must stay on-line after starting up and reaching PMin, prior to being shut down, due to physical operating constraints. In case of a Pump Storage resource, this field represents the minimum time that the resource must stay on-line in the generating mode prior to being shut down.
Cannot be null if Fuel Type is equal to GAS
MAX_ON(Maximum On Time)
The maximum amount of time that a Generating Unit can stay on-line per day, due to environmental or physical operating constraints.
If no constraint, then leave this field blank
MIN_OFF(Minimum Off Time)
The minimum amount of time that a Generating Unit must stay off-line after being shut down, due to physical operating constraints. In case of a Pump Storage resource, this field represents the minimum time that the resource must stay off-line after being shutdown from the generating mode prior to being started again in the generating mode.
MAX_STRT(Maximum Startups Per Day)
The maximum number of times a Generating Unit can be started up within one day, due to environmental or physical operating constraints.
Cannot be null
MIN_LOAD_COST(Minimum Load Cost)
The costs a Generating Unit or a Participating Load incurs operating at minimum load.
The value is needed for a resource with the Cost Basis of Registered Cost (fixed value) only.
Page 32 of 45
Master File Field Name
(RDT Column Name)
Definition Parameter and/or Enumerations
ML_COST_BASIS_TYPE(Minimum Load Cost Basis Type)
30 days Election of the type of Operational Cost used for maintaining operation at Minimum Load:If Proxy Cost: The Operating Cost of a generating resource is calculated using the Heat Rate data in the Master File and daily gas price. (PRXC). The SC is also allowed to submit a daily component in either DAM or RTM bid for Minimum Load Cost as long as the bid is not negative and less than or equal to the calculated Minimum Load Cost based on the Heat Rate, Daily Gas Price Index and the Operations and Maintenance (O&M) adder.If Registered Cost: Please refer to Attachment G.
If RES_TYPE = GEN or TG then ML_COST_BASIS_TYPE cannot be null, must be filled with one of the following:PRXC - Proxy Cost REGC - Registered Cost
SU_COST_BASIS_TYPE(Start-Up Cost Basis Type)
30 days Election of the type of Operational Cost used for Start-UpIf Proxy Cost: The Start-Up Cost of a generating resource is calculated using the Start-Up data in the Master File and daily gas price. (PRXC). The SC is also allowed to submit a daily component in either DAM or RTM bid for Start-Up Cost as long as the bid is not negative and is less than or equal to the calculated Start-Up Cost based on the Start-Up data and daily gas price.If Registered Cost: Please refer to Attachment G
If RES_TYPE = GEN or TG then SU_COST_BASIS_TYPE cannot be null, must be filled with one of the following:PRXC - Proxy Cost REGC - Registered Cost
MAX_PUMP(Maximum Pump Capacity)
The Maximum Operating Level of a Pump or a Pumped-Storage-Hydro Unit operating as a hydro pump
Cannot be null if GEN_TECH_TYPE equals either PTUR or PUMP
MIN_PUMP_CST(Pumping Minimum Cost)
The minimum cost to start the pump up. MIN_PUMP_CST cannot be null if GEN_TECH_TYPE = PTUR or PUMP
PUMPING_FACTOR(Pumping Factor)
The efficiency or recovering energy potential in pumping water from the lower to the upper reservoir.
Cannot be null if GEN_TECH_TYPE equals either PTUR or PUMP
PUMP_MAX_STRT(Pump Maximum Daily Startups)
The maximum number of times a Pumped Storage Hydro Resource can switch into pumping mode during a Trading Day.
Cannot be null if GEN_TECH_TYPE equals either PTUR or PUMP
PUMP_MIN_UP_TM(Pump Minimum Up Time)
The minimum time that a Pumped Storage Hydro Resource must stay in pumping mode after switching to that mode.
Cannot be null if GEN_TECH_TYPE equals either PTUR or PUMP
Page 33 of 45
Master File Field Name
(RDT Column Name)
Definition Parameter and/or Enumerations
PUMP_MIN_DWN_TM(Pump Minimum Down Time)
The minimum time that a Pumped Storage Hydro Resource must stay out of pumping mode after switching out of that mode.
MIN_DWN_TM_GP The Gen-to-Pump minimum down time applies to Pump Storage Resources and reflects the minimum time (in minutes) that the resource must be offline (or self-scheduled) after being de-committed from generation mode and before being dispatched in pumping mode.
MIN_DWN_TM_PG The Pump-to-Gen minimum down time. applies to Pump Storage Resources and reflects the: Minimum time (in minutes) that the resource must be offline (or self-scheduled) after being de-committed from pumping mode and before being dispatched in generation mode.
MAX_PUMP_SD_CST(Pump Maximum Shutdown Cost)
The maximum cost it would take to shutdown the pump.
MAX_PUMP_SD_CST cannot be null if GEN_TECH_TYPE = PTUR or PUMP
PUMP_SHTDWN_TM(Pump Shutdown Time)
The pump shutdown time
COST_RANK_LMPM(Variable Cost Option)
A method of calculating Default energy Bids based on fuel costs and variable operations and maintenance costs.
Rank 1, 2, or 3
NEGO_RANK_LMPM(Negotiated Rate Option)
A method of calculating Default energy Bids based on a negotiation with the CAISO or the Independent Entity.
Rank 1, 2, or 3
PRC_RANK_LMPM(LMP Option)
A method of calculating Default energy Bids based Locational Marginal Prices.
Rank 1, 2, or 3
RSRV_CAP_SPIN(Reserve Capacity: Spin)
The portion of unloaded synchronized generating capacity that is immediately responsive to system frequency and that is capable of being loaded in ten minutes, and that is capable of running for at least two hours.
RSRV_CAP_NSPIN(Reserve Capacity: Non-Spin)
The portion of off-line generating capacity that is capable of being synchronized and Ramping to a specified load in ten minutes (or load that is capable of being interrupted in ten minutes) and that is capable of running (or being interrupted) for at least two hours.
CERT_REG(Certified for AS: Regulation - CERT_REG)
An identifier of a resource that is certified to provide Regulation Reserve.
Page 34 of 45

Master File Field Name
(RDT Column Name)
Definition Parameter and/or Enumerations
CERT_SPIN(Certified for AS: Spin - CERT_SPIN)
An identifier of a resource that is certified to provide Spinning Reserve.
CERT_NSPIN_DAM(Certified for AS DAM: Non-Spin - CERT_DAM_NON_SPIN)
An identifier of a resource that is certified to provide Non-Spinning Reserve in the DAM.
CERT_NSPIN_RTM(Certified for AS RTM: Non-Spin - CERT_RTM_NON_SPIN)
An identifier of a resource that is certified to provide Non-Spinning Reserve in the RTM. To be procured in the RTM, a unit must also have a Startup Code Type of FAST.
REM(Regulation Energy Management)
Indicator of a non-generator resource that can only provide regulation energy
MIN_CONT_ENERGY_LIMIT(Minimum Continuous Energy Limit)
Minimum stored energy for an NGR. If no real physical energy limit, leave blank.
MAX_CONT_ENERGY_LIMIT(Maximum Continuous Energy Limit)
Maximum stored energy for an NGR. If no real physical energy limit, leave blank.
CURT_ENERGY_LIMIT(Curtailment Energy Limit)
The energy limit for curtailing the consumption of energy for NGR. If no limit, leave blank.This is a placeholder for future functionality.
ENERGY_EFFIC(Energy Efficiency)
The percentage of charging energy that the device can store and later discharge; 0<= n <=1
RMT_MAX_ON_PEAK For CHP resources, the portion of capacity that is eligible for Reliability Must-Take scheduling priority during on-peak hours. Must be reestablished annually. If there is no off-peak value established, this value will be used in all hours.
RMT_MAX_ON_PEAK_EXP_DT
Expiration date of the stated RMTG-eligible capacity
RMT_MAX_OFF_PEAK For CHP resources, the portion of capacity that is eligible for Reliability Must-Take scheduling priority during off-peak hours. This value is optional. Must be reestablished annually.
RMT_MAX_OFF_PEAK_EXP_DT
Expiration date of the stated RMTG-eligible capacity
Page 35 of 45

Master File Field Name
(RDT Column Name)
Definition Parameter and/or Enumerations
EMISSION_RATE For gas-fired resources, the emission rate (mtCO2/mmBTU) used to determine a resource's greenhouse gas compliance obligation
GHG_COMPLIANCE_OBLIG
Indicator of a resource that has a green house gas compliance obligation and is, therefore, eligible to recover greenhouse gas allowance costs
FORECAST_OWNER Indicator for whether a resource will provide its own forecast or will utilize the ISO’s forecast
G.2.1.1 Maximum Proxy Cost Start-up Costs
For purposes of determining maximum Start-up costs6 that may be approved for gas-fired units under the Proxy Cost Option, the calculated Start-up costs will be calculated by combining the unit’s Startup fuel and electrical energy consumption curves in the Master File, the daily Gas Price Index calculated as described in Attachment C and the electricity price index as described in attachment M, plus a Grid Management Charge (GMC) adder representing the Market Services Charge and System Operations Charge components. If the resource is subject to a greenhouse gas compliance obligation (as indicated by a ‘Y’ in the GHG_COMPLIANCE_OBLIG field in Master File), the CAISO will add to the calculated Start-up costs the greenhouse gas allowance start-up cost. The cost will be calculated per Attachment K, using the Greenhouse Gas Allowance Price described in Attachment K. In addition, if the resource has major maintenance expenses approved by the CAISO, the CAISO will add a major maintenance cost adder (MMA). See Attachment L for details.
For purposes of this calculation, the cost of any auxiliary power needed for start-up (as indicated in the STARTUP_ENERGY field in the Master File) will be calculated multiplying the MWh energy input with the Electricity Price Index. See Attachment M for details.
A Scheduling Coordinator may bid Start-up Costs daily in either DAM or RTM, RTM submissions will not be used if the resources was committed in the DAM, the DAM Daily Components will be copied to the RTM bid. The Start-up Cost bid for a unit cannot exceed the applicable limit of 125 percent of the unit’s
6 Multi-stage generating resources have both start-up and indicative start-up costs, as described in greater detail in Attachment H. This section refers to both generically as start-up costs.
Page 36 of 45
calculated Proxy Cost for Start-up Costs. For multi-stage generating resources, a Scheduling Coordinator may bid Transition Costs daily.7 The Transition Cost bid for a unit cannot exceed the applicable limit of 125 percent of the unit’s calculated Proxy Cost for Transition Costs. If the Scheduling Coordinator does not bid, the CAISO will generate daily bids based on the calculated Proxy Costs.
Example: Proxy Start-up Cost Calculation and Bid Cap for Gas-Fired Resource
An example of this calculation based on a natural gas price index of $8.50/MMBtu is provided in the following table.
For purposes of the GMC adder, assume a PMin of 20 MW, a Start-Up Time Period of 600 minutes, and a GMC adder of $0.50/MWh (made up of a $0.15/MWh Market Services Charge and a $0.35/MWh System Operations Charge). Note that the fastest Start-Up Time Period registered in the Master File is used in this calculation, regardless of segment. In other words, even for warm starts or cold starts, the fastest start-up time will be used. For MSG resources this applies to each configuration. That is, the fastest time period registered for the segment, not the entire resource, will be used.
Start-Up Cost = (Start-Up Fuel x Gas Price) + (Start-Up Energy x Electricity Price Index) + (PMin x Start-Up Time Period in min / 60 min/hour x GMC adder / 2)
Gas price index = 8.50/MMBtu
Example of start-up cost calculation (first Start-Up segment):Start-Up Cost = (1,083 MMBtu x $8.50/MMBtu) + (20MWh x $80/MWh) + (20 MW x (600 minutes/(60 minutes/hour)) x $0.50/MWh / 2) = (9,205.5) + (1,600) + (50) = 10,855.50 = 10,856 (rounded)
Start-Up Costs including a GHG Compliance Obligation:
Start-Up Cost = (Start-Up Fuel x Gas Price) + (Start-Up Energy x Electricity Price Index) + (PMin x Start-Up Time Period in min / 60 min/hour x GMC adder / 2) + (Start-Up Fuel x GHG Emission Rate x GHG Allowance Price)
GHG Allowance Price = $15.34/mtCO2eGHG Emission Rate = 0.053165 mtCO2e /MMBtu
7 See Attachment H for transition cost calculations.
Page 37 of 45
Example of start-up:Start-Up Cost = (1,083 MMBtu x $8.50/MMBtu) + (20MWh x $80/MWh) + (20 MW x (600 minutes / (60minutes/hour)) x $0.50/MWh / 2) + (1083 MMBtu x 0.053165 mtCO2e /MMBtu x $15.34) = (9,205.5) + (1,600) + (50) + (883.24) = 11,738.74 = 11,739 (rounded)
Start-Up Costs including a major maintenance cost adder:
The major maintenance cost adder is a single line item that is added to the Start-Up Cost. Continuing the example above:
Assume major maintenance cost adder approved by the CAISO is $800.98 (same value applied to all segments).Start-Up Cost = $11,738.74 + major maintenance cost adder
= $11,738.74 + 800.98= $12,539.72= $12,540 (rounded)
Table G3. Example of Calculated Start-up Cost and Maximum Proxy Cost Bid Calculation (Gas Price = $8.50/MMBtu, EPI = $80/MWh)
Cooling Time
(minutes)
Start-Up Time
(minutes)
Start-Up Fuel
(MMBtu)
Start-Up Energy
(MWh)
Start-Up Cost w/o
GHG/MMA($)
Start-Up Cost with GHG &
MMA($)
Max Start-Up Bid w/o GHG/MMA
($)
Max Start-Up Bid with GHG & MMA
($)
Hot 0 600 1,083 20 $10,856 $12,540 $13,569 $15,675
Warm 240 1390 1,633 40 $17,196 $19,329 $21,495 $24,161
Cold 480 1400 2,000 60 $21,917 $24,349 $27,396 $30,436
G.2.1.2 Maximum Proxy Cost Minimum Load Costs
For purposes of determining maximum Minimum Load Cost that may be calculated for gas-fired units under the Proxy Cost Option, the calculated Minimum Load Cost will be calculated using the unit’s Minimum Load Heat Rate and the daily Gas Price Index calculated as described in Attachment C, plus a
Page 38 of 45

GMC adder made up of the Market Services Charge and System Operations Charge components and a third value representing the Bid Segment Fee component divided by the resource Pmin. If the resource is subject to a greenhouse gas compliance obligation (as indicated by a ‘Y’ in the GHG_COMPLIANCE_OBLIG field in Master File), the CAISO will add to the calculated Minimum Load Cost the Greenhouse gas allowance minimum load cost. The cost will be calculated using the Greenhouse Gas Allowance Price described in Attachment K. In addition, if the resource has minimum load major maintenance adder approved by the CAISO, the CAISO will add a major maintenance cost adder (MMA). See Attachment L for details.
A Scheduling Coordinator may daily bids for Minimum Load Costs daily in either DAM or RTM, RTM submissions will not be used if the resources was committed in the DAM, the DAM Daily Components will be copied to the RTM bid. The Minimum Load Cost bid for the unit cannot exceed the cap of 125 percent of the unit’s calculated Proxy Cost for Minimum Load Costs. If the Scheduling Coordinator does not bid, the CAISO will generate daily bids based on the calculated Proxy Costs. The calculation and an example are provided below.
Example: Proxy Minimum Load Cost Calculation and Bid Cap for Gas-Fired Resource
Minimum Load Cost Cap = (Unit Conversion Factor x Minimum Load Heat Rate x Minimum Operating Level x Gas Price) + (O&M x Minimum Operating Level) + (GMC adder x Minimum Operating Level)
Example:Gas price index = 8.50/MMBtuO&M adder = $4/MWhGMC adder = $0.50/MWh
Minimum Load Cost = (0.001 x 14,000Btu/kWh x 20MW x $8.50/MMBtu) + ($4/MWh8 x 20MW) + ($0.50/MWh x 20MW)= ($2,380) + ($80) + ($10)= $2,470
Minimum Load Cost with a GHG component = (Unit Conversion Factor x Minimum Load Heat Rate x Minimum Operating Level x Gas Price) + (O&M x Minimum Operating Level) + (GMC adder x Minimum Operating Level) + (Minimum Operating Level x Unit Conversion Factor x Minimum Load Heat Rate x Emission Rate x GHG Allowance Price)
Example:Emission Rate = 0.053165 mtCO2e /MMBtuGHG Allowance Price = $15.34/mtCO2e
8 This example assumes a $4/MWh O&M adder.
Page 39 of 45

= (0.001 x 14,000Btu/kWh x 20MW x $8.50/MMBtu) + ($4/MWh * 20MW) + ($0.50/MWh x 20MW) + (20MW x 0.001 x 14,000Btu/kWh x 0.053165 mtCO2/MMBtu x 15.34)= ($2,380) + ($80) + ($10) + ($228)= $2,698
Minimum Load Costs including a major maintenance cost adder:
The major maintenance cost adder is a single line item that is added to the Minimum Load cost. Continuing the example above:
Assume major maintenance cost adder approved by the CAISO is $105.19.Minimum Load Cost = $2,695 + major maintenance cost adder= $2,698 + 105= $2,803
Table G4. Example of Calculated Minimum Load Cost and Maximum Bid CalculationGas Price Index = $8.50/MMBtu
Minimum Operating
Level
(MW)
Heat Rate
(MBtu/ MWh)
O&M Cost
($/MWh)
Minimum Load Cost
($)
GHG Allowance Cost & MMA
($/MWh)
Minimum Load Cost
with GHG & MMA
($)
Max MLC Bid w/o
GHG/MMA
($)
Max MLC Bid with GHG & MMA
($)
20 14,000 4 $2,470 $333 $2,803 $3,088 $3,504
Page 40 of 45

Number 6
Attachment N Gas Constraint using generation nomograms The ISO will implement a constraint in its day-ahead or real-time market, or both, that would
limit the affected area gas burn to a gas burn limitation reflecting gas system limitations for either capacity reduction limitations or system imbalance limitations. If ISO operations determined additional generation from the affected generators is needed beyond the limits of the constraint enforced, the additional generation could only be dispatched through exceptional dispatches once coordinated with the gas system operator.
N.1 Defining affected generators under gas constraint(s) This gas constraint will be implemented using generation nomograms where the generation
nomogram is defined by the set of generators each with a unity shift factor (dfax=1) to the transmission paths within the area so the nomogram limits the area’s generators to either a minimum or maximum gas burn level.
The affected area, or the set of generators included under the gas constraint(s), will be the gas fired generation within the SoCalGas and SDG&E gas operating zone(s) identified by SoCalGas or SDG&E as under the maximum gas burn limitation. If the entire system is affected, the constraint would encompass the entire SoCalGas and SDG&E system.
Depending on which gas operating zones are under restricted system limitations, the affected area could be one gas operating zones, a selection of gas operating zones, or the entire gas system. The ISO will define a generation nomogram for each of the 6 gas operating zones under its tariff. A 7th generation nomogram will be defined to include all generators within the ISO’s portion of the SoCalGas and SDG&E system. If gas system limitation is anticipated or identified that would impact more than one gas operating zone but not inclusive of the system-wide generation nomogram, the ISO will allocate the multi-zone limitation to the individual gas operating zones.
N.2 General constraint formulation This gas constraint appears in Equation 1 as a two sided constraint but in practice the ISO would
likely choose one side of the constraint to enforce depending on gas system limitations. The ISO believes there is a higher need to enforce the upper bound (i.e. right hand side) limit as it anticipates gas and electric needs will mostly call for ISO imposing limitations on the maximum gas burn level which the electric market is limited in reflecting higher costs to manage maximum burn levels. Situations calling for the need to enforce the lower bound (i.e. left hand side) limit to minimum gas burn levels could arise but would be more infrequent as generators can submit
Page 41 of 45
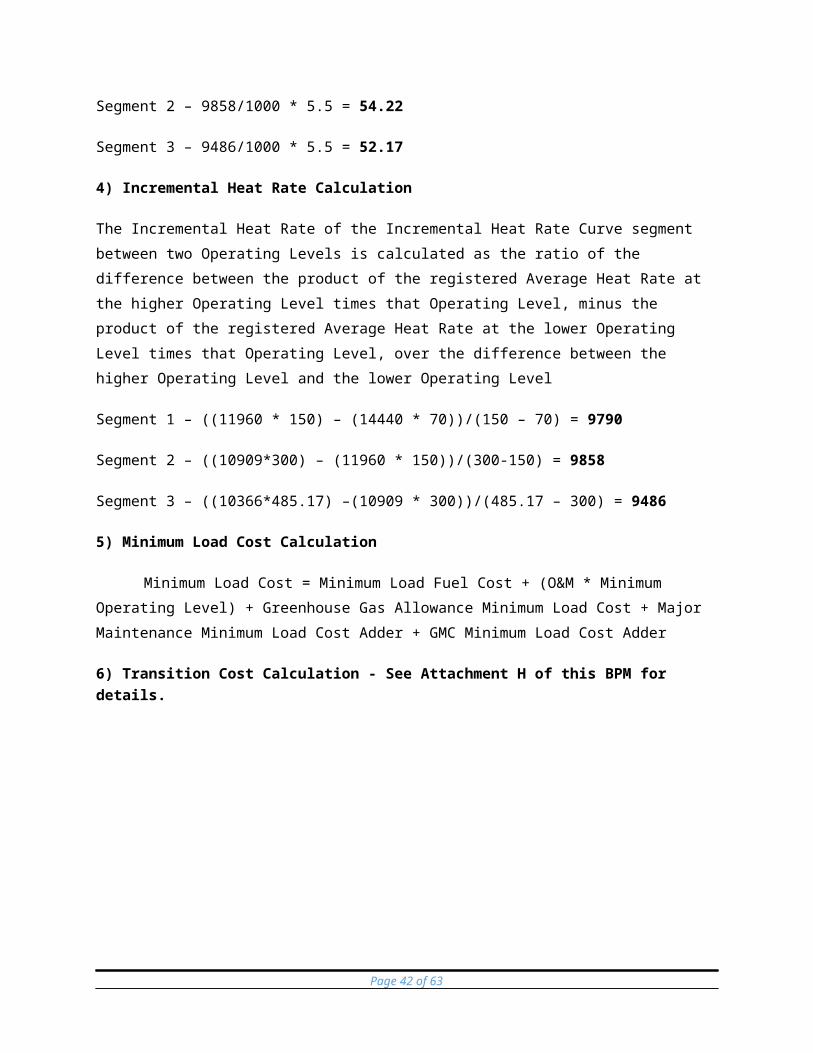
bid prices at low enough levels to manage their burn at higher output levels to support gas system reliability.
Equation 1: Gas Constraint(s)
𝐿𝐻𝑆𝑡≤Σ𝛼𝑖 (𝐺𝑖,)𝑖∈𝑆≤𝑅𝐻𝑆𝑡 𝑆 Set of generators in affected
area (1 or more gas operating zones)
𝐺 Power output (MW)
∝𝑖 Energy (MW) to million cubic
feet (MMcf) gas conversion factor (Masterfile heat rate value at given MW output * unit conversion factor)
𝐿𝐻𝑆𝑡 Left hand side limit enforcing
lower bound constraint.
𝑅𝐻𝑆𝑡 Right hand side limit enforcing upper bound constraint.
The criteria for enforcing the limits would differ depending on whether (1) it’s a total gas burn
limitation (absolute) versus incremental gas burn limitation (relative), (2) daily or hourly limitation, and (3) limit provided by the gas company or default value. The details for the left hand side and right hand side limits for the first condition, total or incremental, are discussed below and reflected in Equation 2 and Equation 3 respectively.
N.3 Total gas burn limitation due to reduction in capacity or deliverability The upper bound limit defines the maximum allowable total gas burn generally communicated
to the ISO from the gas company When this maximum limit is enforced and ISO operations determines additional generation from the affected generators is needed above this limit for electric reliability, the additional generation would only be dispatched through exceptional dispatches once coordinated with the gas system operator.
The upper bound constraint used to reflect gas system limitations due to outages or curtailments could either reflect a gas system limitation daily or hourly depending on the type of capacity reduction. A system capacity reduction from outages could tend to last for several days and appear as a daily limitation where a system capacity reduction from curtailments or emergency flow orders issued to respond to deteriorating system conditions generally occur for specific hours at hourly amounts.
The ISO would distribute the daily limitation across the hours based on a ratio of hourly load forecast to daily load forecast to support greater electric flexibility, if provided an hourly burn limit the value would be input individually for each hour. To further enhance the flexibility of this constraint, the ISO proposes to have the flexibility to recapture portions of the allocated range unused for earlier intervals if necessary. For example, if balancing range allocated to the first 4 hours of the day was unused, the gas burn associated with that allocation would be
Page 42 of 45

recaptured and used to increase the allowable range for later periods consistent with expected load shape.
Equation 2: Gas Capacity Reduction Limitation 𝑊ℎ𝑒𝑟𝑒 𝑙𝑖𝑚𝑖𝑡 𝑖𝑠 𝑠𝑒𝑡 𝑎𝑠 𝑓𝑜𝑙𝑙𝑜𝑤𝑠:
𝑅𝐻𝑆𝑡=𝛾𝑡 𝑅ℎ Σ𝛾𝑡𝑁1=1 𝑅ℎ Gas system limitation which
could be a MMcf/day limitation on pipeline capacity as result of planned outages provided by the gas company (if not provided ISO will default to gas system design capacity) or an hourly value in MMcf provided by gas company generally in instance of curtailments
𝛾𝑡 Allowance distribution
coefficients associated with upper bound limit that distributes a MMcf/day amount over the intervals of a trading day based on ratio of hourly load forecast to daily load forecast, if provided an hourly burn limit and not a daily limitation this value will be 1
The ISO proposes to request authority to enforce the gas constraint in its markets when
SoCalGas notifies the ISO of a concern with its fuel supply or access to fuel based on its system conditions. This constraint would not be enforced daily but instead enforced in the market when the gas company notifies the ISO of the limitation and its details: (1) affected area, (2) affected hours, and (3) maximum allowable gas burn for each hour. For example, if the gas company notifies the ISO it will have an outage on its pipelines reducing the availability of fuel in a defined zone to an expected maximum amount prior to the day-ahead market close, the constraint would be enforced in both day-ahead and real-time. If an unplanned outage occurs after day- ahead or curtailment is issued during real-time, the constraint could be enforced in real-time market run.
N.4 Incremental gas burn limitation A maximum allowable incremental gas burn due to concerns about deteriorating pipeline
pressure on the gas system. The upper bound limit defines the maximum allowable incremental
Page 43 of 45

gas burn the gas system can support and maintain reliable operations, generally communicated to the ISO from the gas company. When this maximum incremental limit is enforced and ISO operations determines additional generation from the affected generators is needed above this limit for electric reliability, the additional generation would only be dispatched through exceptional dispatches once coordinated with the gas system operator.
The lower or upper bound constraint used to reflect gas system limitations due to anticipated gas and electric system conditions that would lead to deterioration of pipeline operating pressures would define the limit on either side based on a daily MMcf amount. A significant change in the ISO’s dispatch from day-ahead to real-time if generators are not successful in adjusting nominations to compensate for change can lead to compromising the gas operating pressures. This constraint, since it is relative to the day-ahead schedule, would be enforced in real-time as a daily limitation representing the incremental amount (MMcf/day) the real-time dispatch can deviate from the day-ahead schedule.
The ISO would distribute the daily limitation across the hours based on a ratio of hourly load forecast to daily load forecast to support greater electric flexibility, if a value is not provided by SoCalGas a default value of 5% relative to the area’s day-ahead schedule burn. To further enhance the flexibility of this constraint, the ISO proposes to have the flexibility to recapture portions of the allocated range unused for earlier intervals if necessary. For example, if balancing range allocated to the first 4 hours of the day was unused, the gas burn associated with that allocation would be recaptured and used to increase the allowable range for later periods consistent with expected load shape.
Equation 3: Gas System Imbalance Limitation 𝑊ℎ𝑒𝑟𝑒 𝑙𝑖𝑚𝑖𝑡𝑠 𝑎𝑟𝑒 𝑠𝑒𝑡 𝑎𝑠 𝑓𝑜𝑙𝑙𝑜𝑤𝑠:
𝐿𝐻𝑆𝑡=𝛽𝑡 [𝑅𝑙+Σ𝛼𝑖 (𝐺 ̅𝑖,)𝑖∈𝑆] 𝑅𝐻𝑆𝑡=𝛾𝑡 [𝑅ℎ+Σ𝛼𝑖 (𝐺 ̅𝑖,)𝑖∈𝑆] Σ𝛽𝑡𝑁1=Σ𝛾𝑡𝑁1=1 𝑆 Set of generators in affected
area
𝐺̅ Day-ahead market schedule
∝𝑖 Energy (MW) to million cubic feet (MMcf) gas conversion factor (Masterfile heat rate value at given MW output * unit conversion factor)
𝑅𝑙 Daily lower bound deviation
allowance relative to day-ahead market schedule
𝑅ℎ Daily upper bound deviation
allowance relative to day-
Page 44 of 45
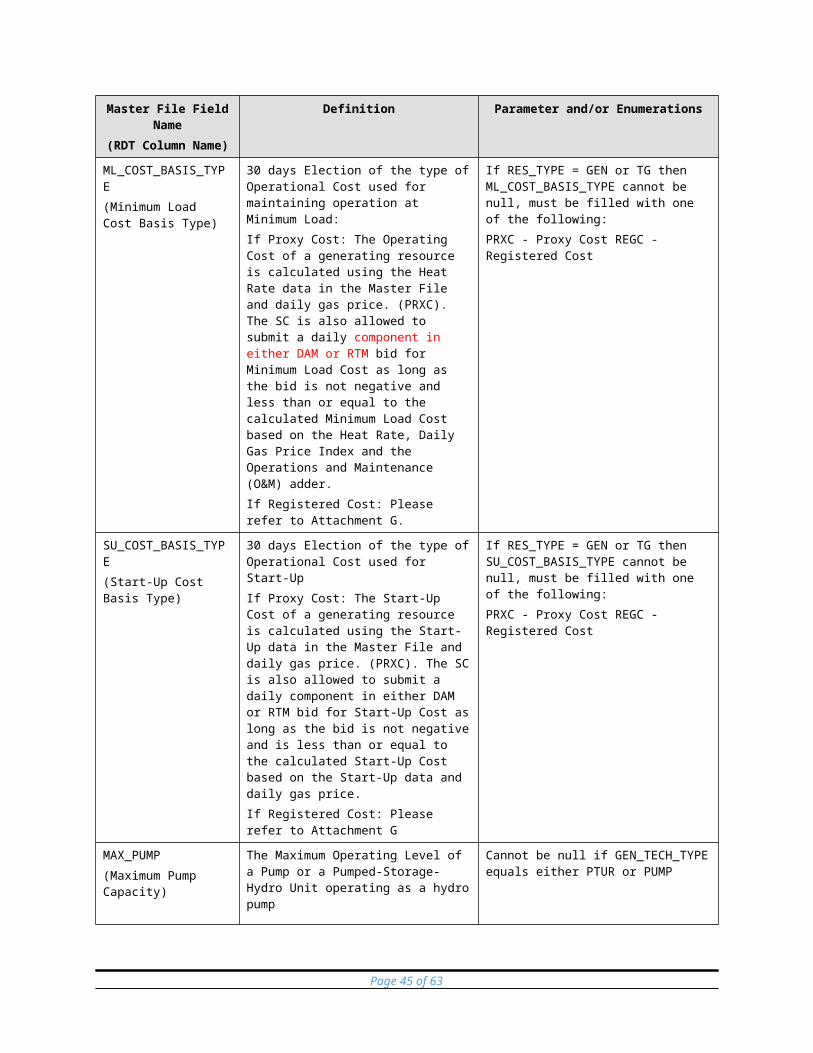
ahead market schedule
𝛽𝑡 Allowance distribution coefficients associated with upper bound limit that distributes a MMcf/day amount over the intervals of a trading day based on ratio of hourly load forecast to daily load forecast
𝛾𝑡 Allowance distribution
coefficients associated with upper bound limit that distributes a MMcf/day amount over the intervals of a trading day based on ratio of hourly load forecast to daily load forecast
The ISO would enforce this constraint for: Real-time hours once the gas company has issued or anticipates issuing an operational
flow order. The ISO would enforce the side of the constraint of the OFO. For a low operational flow order, the right hand side limit would be enforced so that the maximum gas burn would be maintained at a supportable level. For a high operational flow order, the left hand side limit would be enforced so that the minimum gas burn would be maintained at supportable level (e.g. day-ahead schedule burn +/- 5%). The ratio the gas system can support would be dynamic if provided by the gas company, if not would default to 5%.
For days where the ISO anticipates its load forecast may have a large error
resulting in significant re-dispatches in the real-time market. The magnitude of such re-dispatch especially if day-ahead gas demand forecast is high implying a smaller imbalance tolerance, the ISO needs the authority to limit the re-dispatch in real-time as a preventive measure. By limiting the re-dispatch the ISO would not be issuing real-time dispatch instructions that could compromise the gas system reliability. Used in such a manner, the electric operator would be enforcing the constraint to avoid gas system conditions that could result in curtailments. The ratio the gas system can support would be dynamic if provided by the gas company, if not would default to 5%.Please refer to Managing Full Network BPM https://bpmcm.caiso.com/Pages/BPMDetails.aspx?BPM=Managing Full Network Model Section 4.2.7.1.2 for Gas Constraint using Generation Nomograms.
Page 45 of 45
Related Documents