1 UN-Water / WHO TrackFin UN-Water/ WHO TrackFin Initiative WASH Accounts in Brazil: Overview and Next Steps 1 Introduction This note presents the main conclusions on the implementation of TrackFin methodology and the development of WASH Accounts in Brazil, where WASH stands for Water, Sanitation and Hygiene. TrackFin aims to track all expenditures made by stakeholders in the WASH sector, including governments and public institutions, public and private organizations, NGOs, foundations, national and international donors, investors, and households. This methodology enables countries to answer four key questions: 1) What is the total expenditure in the WASH sector? 2) How are funds distributed to the different WASH services and expenditure types? 3) Who pays for WASH services and how much do they pay? 4) Which entities are the main funding channels for the WASH sector? Although Brazil has broad databases and statistical information on the sector, such financial information is not regularly consolidated and evaluated in an integrated manner. It is therefore not possible to give specific responses on the amount of funds spent and how they are allocated, what the sources of these funds are, and who provides them. The TrackFin initiative is an important and strategic opportunity for Brazil to test an efficient methodology for collecting, consolidating, and evaluating the available information on financing, with a view to the monitoring and systematic assessment of the financial aspects of public policy for basic sanitation in the country, including WASH services. In Brazil, Law 11.445/2007, which establishes national guidelines for sanitation, defines basic sanitation (“saneamento básico”) as the following services: a) water supply; b) sewage disposal; c) urban cleaning and solid waste management; d) drainage and management of urban rainwater. In this note, we use the term “sanitation” in the sense understood at international level as in WASH. The national stakeholder group consisted of the main federal government actors in the water and sanitation sector, national service providers and entities, and the national statistics agency, coordinated by the Ministry of Cities/ National Secretariat of Environmental Sanitation (SNSA). 2 Overview of the WASH sector and its financing 2.1 How are WASH services provided? The Brazilian federation is composed of a national (federal) government as well as subnational governments of 26 states, 5,570 municipalities, and a Federal District. The three levels of government are politically and administratively independent of each other. The municipal governments are responsible for the organization, management, and (direct or indirect) provision of local public services, including basic sanitation services. The state governments and federal government, in cooperation with the municipalities, undertake. The federal government has the authority to implement housing and basic sanitation programmes to improve sanitation and housing conditions. It is also responsible for establishing general guidelines and regulations for the management of services by all levels of government, for example, the Law on Basic Sanitation, the National Basic Sanitation Plan (PLANSAB), and the Program for Accelerated Growth/PAC-Sanitation––coordinated by SNAS/Ministry of Cities, which coordinates national basic sanitation policy. The Ministry of Cities also coordinates the National Information System on Sanitation (SNIS), which has been rolled out at the Federal level.

10 page Summary of TrackFin's results in Brazil
Jul 30, 2015
Welcome message from author
This document is posted to help you gain knowledge. Please leave a comment to let me know what you think about it! Share it to your friends and learn new things together.
Transcript

1
UN-Water / WHO TrackFin UN-Water/ WHO TrackFin Initiative
WASH Accounts in Brazil: Overview and Next Steps
1 Introduction
This note presents the main conclusions on the implementation of TrackFin methodology and the development of
WASH Accounts in Brazil, where WASH stands for Water, Sanitation and Hygiene. TrackFin aims to track all
expenditures made by stakeholders in the WASH sector, including governments and public institutions, public and
private organizations, NGOs, foundations, national and international donors, investors, and households. This
methodology enables countries to answer four key questions:
1) What is the total expenditure in the WASH sector?
2) How are funds distributed to the different WASH services and expenditure types?
3) Who pays for WASH services and how much do they pay?
4) Which entities are the main funding channels for the WASH sector?
Although Brazil has broad databases and statistical information on the sector, such financial information is not
regularly consolidated and evaluated in an integrated manner. It is therefore not possible to give specific responses
on the amount of funds spent and how they are allocated, what the sources of these funds are, and who provides
them. The TrackFin initiative is an important and strategic opportunity for Brazil to test an efficient methodology
for collecting, consolidating, and evaluating the available information on financing, with a view to the monitoring
and systematic assessment of the financial aspects of public policy for basic sanitation in the country, including
WASH services. In Brazil, Law 11.445/2007, which establishes national guidelines for sanitation, defines basic
sanitation (“saneamento básico”) as the following services: a) water supply; b) sewage disposal; c) urban
cleaning and solid waste management; d) drainage and management of urban rainwater. In this note, we use the
term “sanitation” in the sense understood at international level as in WASH.
The national stakeholder group consisted of the main federal government actors in the water and sanitation sector,
national service providers and entities, and the national statistics agency, coordinated by the Ministry of Cities/
National Secretariat of Environmental Sanitation (SNSA).
2 Overview of the WASH sector and its financing
2.1 How are WASH services provided?
The Brazilian federation is composed of a national (federal) government as well as subnational governments of 26
states, 5,570 municipalities, and a Federal District. The three levels of government are politically and
administratively independent of each other. The municipal governments are responsible for the organization,
management, and (direct or indirect) provision of local public services, including basic sanitation services. The
state governments and federal government, in cooperation with the municipalities, undertake. The federal
government has the authority to implement housing and basic sanitation programmes to improve sanitation and
housing conditions. It is also responsible for establishing general guidelines and regulations for the management of
services by all levels of government, for example, the Law on Basic Sanitation, the National Basic Sanitation Plan
(PLANSAB), and the Program for Accelerated Growth/PAC-Sanitation––coordinated by SNAS/Ministry of
Cities, which coordinates national basic sanitation policy. The Ministry of Cities also coordinates the National
Information System on Sanitation (SNIS), which has been rolled out at the Federal level.

2
In practice, drinking water and sewage disposal services are provided by 1,560 local water service providers, 4,360
municipalities directly responsible for sewage disposal services, 26 regional service providers (state water and
sewage disposal companies), and 6 micro-regional providers (entities that serve a small group of municipalities).
These providers offer WASH services through different supply arrangements including: direct, indirect
(delegated), jointly managed, centralized, decentralized, by consortia, and through concession contracts. There is
no central national regulator for water and sewage disposal services. Water resources are centrally regulated.
2.2 What is the level of access to WASH services?
PLANSAB has made progress in categorizing access to water and sanitation as adequate access and inadequate
access. The latter category is sub-categorized between precarious access and no access. According to PLANSAB,
59.9% of the population has adequate access to water, 33.9% has precarious access, and 6.8% has no access. As
for sewage disposal, 39.7% of the population has adequate access, 50.7% has precarious access, and 9.6% has no
access. The focus of the current basic sanitation policies is to reverse the lack of access by developing
infrastructure and improving service quality.
Overall, by 2012, Brazil had achieved the MDG targets for water supply and sanitation. More than 85% of the total
population received water supply (network-based supply), while over 78% had access to sanitation (via a sewer
system or septic tank), compared to the MDG targets of 84% and 74.5%, respectively. However, data analysis
shows that, in fact, it was only in urban areas that the MDG targets were met for all income levels. For most
income levels in rural areas, these targets are far from being reached, particularly for sewage disposal. In rural
areas, both water supply and sewage disposal reach 33% of the population, while the MDG targets for these
services are 54.66% and 54.42%, respectively. There are also great regional disparities. The northern region has
not yet met the MDG targets for water supply, while the north, northeast and mid-west have not reached the targets
for sewage disposal. The highest levels of access to water supply and sewage disposal are concentrated in the
southern and southeastern regions.
The biggest problem faced by the sector, in terms of sustainability and quality of services, involves low
institutional capacity, associated with a shortage of skilled labor to efficiently manage the services. Insufficient
regulation of the sector is also another identified problem is.
3 Study scope and methodology
The study collected data on WASH sector expenditures for 2010, 2011, and 2012. The methodology proposed in
the Guidance Document was rigorously followed, as can be seen in the definitions and detailed classifications
adopted. There were no deviations from the proposed methodology.
The study aimed to obtain a comprehensive view of the financial flows for both urban and rural water supply and
sewage disposal. All classifications and proposed categories were considered to be adapted to the country context,
with marginal adjustments in terminology to reflect conditions in the country. Two new categories were proposed
and used: S5—Hygiene Activities related to Water Supply and Sewage Disposal Services and C6—Tax
Expenditures. Disaggregated information was gathered for the “urban and rural water supply” and “urban and
rural sewage disposal” subsectors.
A country-wide pilot exercise was conducted based on the national databases, which make reliable data available
at national level. Although the exercise was not carried out for each geographic macro-region or state, the
collected data can be used for detailed analyses at the regional level (for each macro-region and state).
3
The purpose of the exercise was to provide a comprehensive view of funding from all financing sources in the
sector. Although Brazil has quite comprehensive and reliable sources of data on WASH services from the national
databases, it was not possible to obtain disaggregated information in all the categories proposed in the TrackFin
methodology (for example, a breakdown of revenues from tariffs and taxes for each type of service used; and the
disaggregation of new capital expenditures and large capital maintenance costs, known in Brazil as replacement
investment costs). For other cost categories, it was possible to disaggregate expenditures for each service only by
using rations on the total number of users of each water supply and sewage disposal services.
No specific or systematic information on the rural subsector was obtained, due to insufficient data It was only
possible to obtain some specific information on this subject for domestic public transfers from the federal
government but covering only a small part of the financial flows to the rural subsector. No data was collected on
spending from categories FU7 (bilateral and multilateral donors) and FU9 (NGOs and community-based
organizations), since these are insignificant flows impossible to capture at the national level. The data for all cost
categories was obtained primarily from the SNIS national database (which covers 91% of municipalities for water
and 65.5% for sewage disposal). Complementary data not obtained through SNIS was based on Brazilian Institute
of Geography and Statistics (IBGE) data (census and National Household Sample Survey––PNAD), using
parameters. However, it was not possible to disaggregate data on large capital maintenance costs (C3) (renewal,
replacement, and rehabilitation), on capital costs (C1) or to disaggregate costs by type of use.
The table below summarizes the financing flows that have been included in and excluded from the study and the
reliability of the data (actual or estimated).
Table 1. Summary of financial flows included in the study
Sources of
financing
Availability of
data
Gaps in available data Methods used to cover the data gaps
Tariffs and taxes
for services
provided
SNIS lacks some important
information on the set of
services provided to rural
households; this information
is aggregated to the data on
urban households.
Parameters were extracted and adjusted
according to available SNIS data, based on
the average household income. These
parameters were applied on the basis of 2010
Census and PNAD/IBGE data (2011 and
2012) to estimate the tariffs charged by
municipalities not included in the SNIS for
the same years, including all households
served in urban and rural sectors.
Household
expenditure for
self-supply
There are no systematic or
accessible sources of public
information on these
expenditures
Approximate estimate based on IBGE data
(Census 2010 and PNAD 2011 and 2012) on
households that have self-supply solutions
and the average expenditure per household
with water supply and sewage disposal,
obtained from the Family Budget Survey
(POF) 2009 (IBGE).
Domestic
public
transfers
(national
government)
90% of data on domestic
(federal government)
transfers is available from
government databases
(Report on Public
Expenditure on Basic
Sanitation––SIAFI/
Transparency Portal)

4
Sources of
financing
Availability of
data
Gaps in available data Methods used to cover the data gaps
Domestic
public
transfers
(local
governments)
Data from financial
statements of companies and
SNIS cannot be
disaggregated by type of
services
Estimated based on the financial statements
of 15 public sanitation companies + 380
government agencies that report to SNIS.
International
public transfers
(public or
multilateral
donors)
a) Federal government
flows: available data
identified only
insignificant balances
from certain contracts
between certain states
and agencies (IDB,
IBRD, KFW, and JBIC)
b) Subnational government
flows cannot be captured
These flows have been classified as
“repayable financing.”
Voluntary
contributions
(NGOs)
There is no reliable registry
of information on these
flows in national databases
because in Brazil there is no
tradition of making
donations for WASH.
CNE (National Register of Entities/Ministry
of Justice) is the source of available data in
this category. However, WASH-related
searches are not possible at present.
Repayable
financing
(loans)
Data obtained from the main
sources of repayable
financing: CAIXA (FGTS
Management Report) and
BNDES (financial report).
Partially available by type of service and
comprehensively by provider, region, and
type of cost, but not by type of use.
Disaggregation by service: estimates based
on available SNIS data on the relative share
of investments made in each service.
Available data Partially available data + estimates Estimated data Data not collected
4 Key results
The WASH Accounts provided a comprehensive picture of financing in the WASH sector. The results obtained are
summarized in the table below.
With regard to WASH vs. health sector expenditures, it should be noted that GDP calculations are based on values
reported by the various sectors of the economy. However, the calculation of WASH expenditures was based on the
sector’s total financial flow, while the health expenditures reported in the study correspond to final expenditures on
goods and services by the public administration and by households. Therefore, these values cannot be compared
with each other: they simply indicate correlations with GDP. Actual total expenditures on health must be higher
than those indicated in the study.

5
Table 2. WASH Accounts: Summary of indicators of expenditures on WASH services in Brazil
Unit 2010 2011 2012
Total WASH sector expenditure (millions)
Local
currency R$ 44,893.49 R$ 46,202.53 R$51,824.24
USD USD 25,518.88 USD 27,619.40 USD26,534.77
Total per capita WASH expenditure
Local
currency R$ 235.35 R$ 237.77 R$ 264.40
USD USD 133.78 USD 142.13 USD 135.38
Total WASH expenditure as % of GDP
1.22% 1.12% 1.18%
Total health expenditure as % of GDP
9.01% 8.90% 9.31%
Total public expenditure on WASH as % of total
public expenditure 5.63% 5.39% 5.54%
Total WASH expenditure in the urban sector as
% of total WASH expenditure 96.85% 96.02% 95.31%
Total household expenditure as % of total WASH
expenditure 1.95% 2.29% 2.19%
Domestic public transfers as % of total WASH
expenditure 6.00% 6.16% 8.66%
International public transfers as % of total
WASH expenditure 0.00% 0.00% 0.00%
Total maintenance and operating costs as % of
total WASH expenditure 63.60% 65.79% 60.53%
Official exchange rate (R$ per US$, average for the
period )(source: World Data Bank) 1.759 1.673 1.953
4.1. What is the total expenditure in the WASH sector?
Total expenditure in the WASH sector has been growing gradually in nominal and real terms, although they appear
relatively stable as a share of Brazil’s GDP in the study period. With regard to total public spending, 2012 showed
more significant growth, reflecting federal government investment in the sector since 2009.
Specific expenditures on hygiene/health activities are apparently still small, but have been growing quickly.
Expenditures may be higher than those mapped, since they may not have been categorized in accordance with the
methodology.
As shown on Figure 1 below, domestic public transfers remained stable in real terms in the first two years of the
study, but then rose sharply in 2012, growing more than 50% in the period. However, service providers’
implementation capacity has not kept pace with the availability of funds guaranteed by the federal government: as
a rule, approximately 50% of federally allocated funds are not used.

6
Figure 1. Total WASH sector financing in Million Brazilian Real
As shown on Figure 2 below, the total capital cost of services showed significant growth in 2012 with respect to
total expenditure in the sector, following relative stability in the two previous years. This growth was due to
greater investment in sewage disposal––given the serious gaps in the provision of this service––at the expense of
water supply, to which more resources have historically been allocated. This demonstrates that public policy for
the sector is on the right course.
Figure 2. Total expenditures on WASH services in Million Brazilian Real
Total expenditure in the sector has been increasing in recent years. This trend is confirmed both by the “financing
sources” approach (from R$44.9 billion in 2010 to R$51.8 billion in 2012) and the “costs-based” approach
(ranging from R$43.6 billion to R$52.5 billion in the same period). We used the two approaches in the study, since
it was not possible to identify the sources and the causes of differences among them, which would require more
detailed research on the available sources and the concepts involved.
Overall, the current levels of financing have been sufficient to cover the operating and maintenance costs of the
services, to amortize repayable financing, and to finance expansion and replacement (new infrastructure), with
more funds allocated for investment in sewage disposal. This financing has succeeded in fostering the expansion
R$ 0.00
R$ 10,000.00
R$ 20,000.00
R$ 30,000.00
R$ 40,000.00
R$ 50,000.00
R$ 60,000.00
2010 2011 2012
Repayable financing
Voluntary contributions
International publictransfers
Domestic public transfers
Households’ expenditure for self-supply
Tariffs for services provided
R$ 0.00
R$ 10,000.00
R$ 20,000.00
R$ 30,000.00
R$ 40,000.00
R$ 50,000.00
R$ 60,000.00
2010 2011 2012
Taxes
Support costs
Cost of capital
Operating andmaintenanceexpenditureCapital Investments
7
of services at a pace that is reasonable (faster than population growth), but not yet sufficient to achieve the
universalization of services in the medium term.
With regard to the “cost-based approach” and the volumes of water use reported by providers in the SNIS, the
domestic use of services accounts for a predominant share of the sector’s expenditures and has remained stable in
proportion to total expenditure in the sector. However, due to the lack of disaggregated data on revenues from
tariffs and taxes in each category of use, it was not possible to evaluate the relative weight of household
expenditure in the financing of the services. Based on information from certain public companies and
municipalities, it can be estimated that the tariffs paid by households and direct household expenditures on self-
supply (domestic uses) account for nearly 60% of total financing.
The main sources of financing for WASH investment (C1: Capital costs) are repayable public funds, which come
from the FGTS (Workers Guarantee Fund), Worker Assistance Fund (FAT), and others, reinvestment of earnings
by corporate providers, and domestic public transfers.
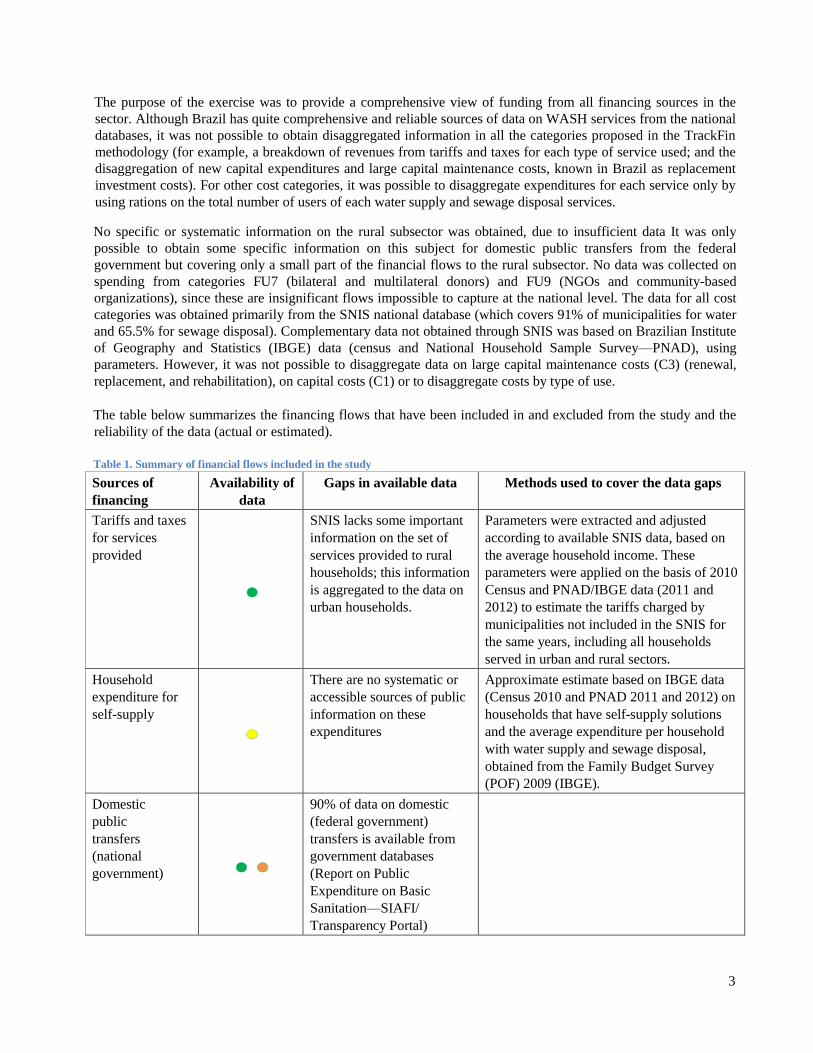
4.2. How are funds distributed for the different types of services and expenditures?
Figure 3. WASH expenditures by subsector in Million Brazilian Real
One of the challenges related to basic sanitation services in Brazil is the extreme concentration of population in
urban areas. It is estimated that 60% of the urban population is concentrated in just 224 of the country’s 5,570
municipalities.
However, based on the available information, WASH expenditures for urban areas are estimated to represent about
96% of total expenditures, compared with an average of only 4% in rural areas. As information or parameters
needed to estimate the actual cost of services in each region is not available, the values attributed to the rural
subsector may be underestimated. This distribution has been changing in recent years with a sharp increase in
expenditures in rural areas; however, rural expenditures remain below reasonable levels, considering that rural
households account for about 14% of all households in the country. This trend should continue and increase more
quickly with the implementation of PLANSAB, which plans priority investment in this sector.
Half of the expenditure in rural areas is made by households for self-supply of services. The other half is divided
between direct federal government expenditure (through the Special Secretariat for Indigenous Health (SESAI)
and the National Health Foundation (FUNASA), both dependent on the Ministry of Health and the Ministry of the
R$ 0.00
R$ 10,000.00
R$ 20,000.00
R$ 30,000.00
R$ 40,000.00
R$ 50,000.00
R$ 60,000.00
2010 2011 2012
Water resources Management
Support to WASH
Rural Sanitation services Rural
Urban Sanitation services Urban
Rural Water supply Rural
Urban Water supply Urban

8
Interior) aimed at serving indigenous communities, African-descendent quilombolas, mine workers, river dwellers
(traditional populations), and agricultural settlements, and for building cisterns; and expenditure by formal
providers aimed at serving small communities.
Expenditure supporting the WASH sector––known in Brazil as structural expenditure––is currently very low,
according to the little available information. However, over the long term––after 20 years of PLANSAB––it is
expected that there will be a reversal in the trend, with higher structural expenditure today giving way to and
higher structuring expenditure in the future.
The relative share of different WASH service providers in the allocation of resources in the sector remains stable,
with slight growth in the participation of governmental institutions and households (self-supply).
Network corporate providers tend to predominate over governmental providers in attending to the demand for
expanded sewage disposal service, particularly in municipalities with populations over 20,000. This is because
corporate providers already provide water supply services in most of the municipalities where there is a
proportionately greater lack of sewage disposal, while also having greater capacity to capture repayable funds to
finance investments. These conditions encourage municipalities to delegate sewage disposal services to these
providers.
In rural areas, it is households that are most able to meet most of the demand through self-supply solutions, with
financial support from low-interest, reimbursable public funds and with funds transferred from the central
government to the municipalities to be used for individual self-supply solutions. The rest of the demand,
corresponding to collective, networked solutions for small rural communities, may be better served by formal
community organizations. This is already happening and is being expanded in the northeastern region of the
country, particularly in the states of Ceará, Bahia, and Rio Grande do Norte, with the establishment of the
Integrated Rural Sanitation Systems (SISAR), supported by the state governments.
Figure 4. WASH expenditure by type of cost (2012) in Million Brazilian Real
R$ 0.00
R$ 5,000.00
R$ 10,000.00
R$ 15,000.00
R$ 20,000.00
R$ 25,000.00
R$ 30,000.00
R$ 35,000.00 Taxes
Support costs
Cost of capital
Operating andmaintenance expenditure
Capital Investments
9
The data in this table show that operation and maintenance costs are predominant, accounting for about 60% of
total costs. Capital costs represent the second largest expenditure, at 19.5% of total costs. Capital costs accounted
for 14.34% of expenditures in 2012. The relative weight of water supply and sewage disposal services also
remained stable in the period, remaining near 59% and 40% of total costs, respectively. Tax-related expenditures
represent about 4.9% of total costs, increasing the cost of services for users in the same proportion.
In principle, the expenditures allocated for operations and maintenance have been sufficient and reasonably
proportionate to expenditures on investment, and to the total cost of services, considering current conditions,
which continue to require large investments in service expansion. However, while sufficient to significantly
expand services, the trend in investments appears to be insufficient to achieve the access (expansion) goals and the
asset modernization and/or replacement goals (large capital maintenance costs) established in PLANSAB.
Insignificant funds have been allocated to investment in support activities, even taking into account the amounts
that providers classify and record together with operating and maintenance costs (C2)––in particular, actions to
improve service management, such as planning, operational performance, and regulation.
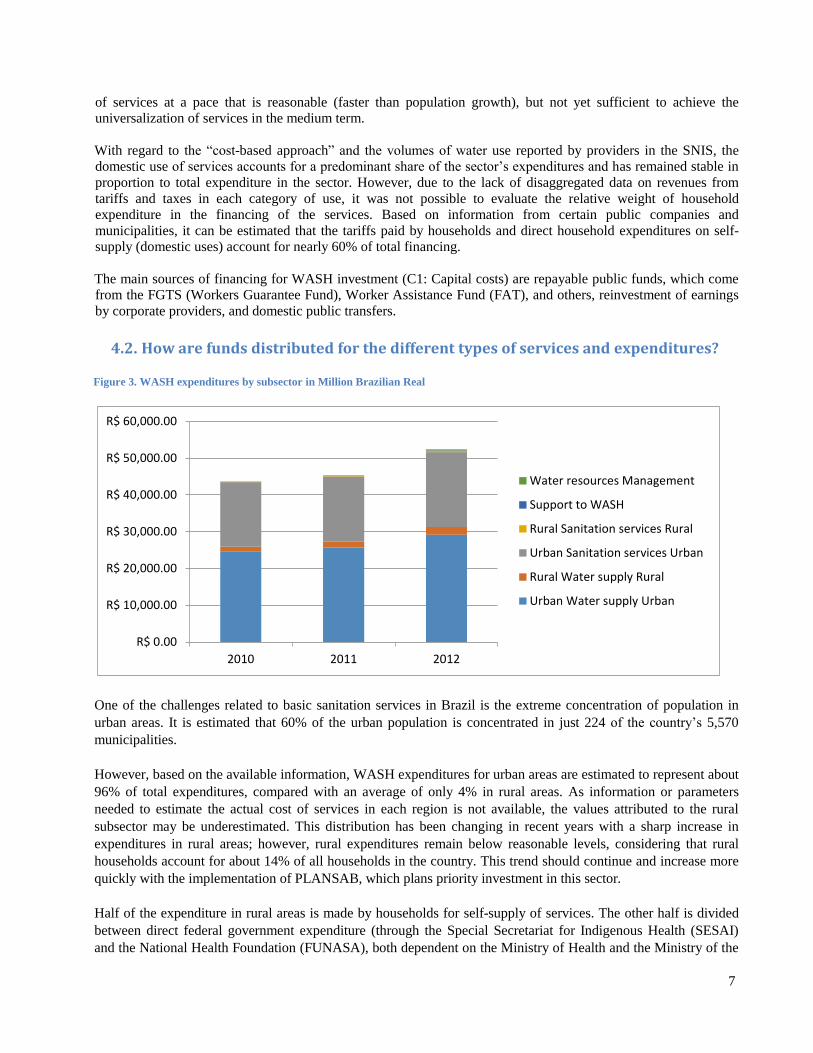
4.3. Who pays for WASH services and how much do they pay?
Figure 5. WASH expenditure by type of financing unit in Million Brazilian Real
The main financing units for services are network corporate providers, which account for almost 60% of total
expenditure, followed by local authorities/providers (about 17%). During the study period, banks and financial
institutions provided about 12.5% of the sector’s financing, with a downward trend. This type of financing should
stabilize in the short term due to the limited financing sources used by these financial institutions and also due to
the limited borrowing capacity of most providers, whether corporate providers or governmental institutions. Most
corporate providers are already at their maximum borrowing capacity, whether in terms of leverage of equity or
their ability to pay off new loans. The public sector is also restricted by the debt limits set in the country’s Law on
Fiscal Responsibility (Complementary Law 101/2002).
Contributions by national authorities rose from 5.5% in 2010 to 8.1% in 2012, a rising trend that should continue
in the coming years as the PLANSAB programs develop. Household self-supply was responsible for nearly 2% of
R$ 0.00
R$ 5,000.00
R$ 10,000.00
R$ 15,000.00
R$ 20,000.00
R$ 25,000.00
R$ 30,000.00
R$ 35,000.00
2010 2011 2012 2010 2011 2012 2010 2011 2012 2010 2011 2012
Water supplyservices
Sanitationservices
Support toWASH
Waterresources
Management
Households
NGOs and community-basedorganizationsBanks and FinancialInstitutionsBilateral and multilateraldonorsEconomic and qualityRegulatorsNon-network corporateprovidersNetwork corporate providers
Local authorities
Regional authorities

10
expenditure in the sector, similar to the participation of state governments that provide services through non-
corporate public entities.
It is important to note, however, that the main source (nearly 80%) of the funds allocated by local authorities and
by network corporate providers, including reinvested earnings, are the tariffs and taxes collected from users for
the provision of services. The funds allocated for basic sanitation by the national authorities (between 6% and
8.6% of total WASH expenditure) come from the General Budget of the Union––a general tax source. It is also
worth noting that most of these funds corresponded to contributions collected from WASH service providers
themselves (cost type C6), with a small reduction in 2012.
Taking into account funds raised through tariffs (FS1) and expenditure for self-supply (FS2), the financial burden
on households represents almost 80% of total expenditure in the sector. Transfers by domestic or foreign donors
were not identified in the available data consulted in the study period.
4.4. Which entities are the main funding channels for the WASH sector?
The main funding channels for the sector are providers associated with local authorities (P1) and network
corporate providers (P2), whose main source of funds consists of tariffs collected for services provided (FS1) to
households, which provides nearly 80% of all transferred resources. The equity allocated to the sector by service
providers consists almost entirely of reinvestment (through amortization and tariff revenue).
Domestic public transfers (FS3)––almost entirely by federal government entities––ranged from 5.5% to 8.1% of
expenditure in the sector during the study period. Only a small part of these resources is channeled directly by
federal government entities (FUNASA and SESAI/Ministry of Health) to the direct provision of services to
indigenous communities, quilombolas, river dwellers, and agricultural settlements. However, most of these funds
are transferred to the sector through regional and local governments, which are responsible for their direct or
indirect implementation through service providers. This policy of decentralizing resources is consistent with the
constitutional powers of the federal government, which also makes local governments responsible for the direct or
indirect provision of WASH services, in cooperation with the regional governments.
Another significant part of the sector’s funds (around 12.5% in the study period) is allocated by financial
institutions, through repayable financing transferred directly to corporate providers and, indirectly, to regional and
local governments. However, there are problems with the disbursement of funds allocated by national authorities
and by financial institutions, if those who take these resources do not succeed in using them in accordance with
the commitments made. There are different reasons for this situation, the main ones being: i) the lack of planning
and investment management capacity on the part of providers and the regional and local authorities that act as
their partners; and ii) the scarcity of companies in the market that can implement projects and public works, due to
strong competition from other infrastructure sectors.
5 Lessons learned from the process
Implementation of the TrackFin pilot project was positive for the country in the following areas:
Data: The exercise made it possible to map the different databases and analyze the quality of the available data.
The following were identified: a) data gaps; b) a need for improvement in existing information systems (type of
data collected, how data are organized and made available for consultations, whether for internal use by the federal
government or for the general public); and c) a need to improve statistical research, with a focus on financial data.
Results related to financing flows: It was confirmed that the available data and information on financing flows
and costs in the sector are insufficient for a more conclusive evaluation of the effectiveness of the public policies
outlined for the sector, demonstrating the need for improving and expanding the existing information systems. In
the current national context of implementing and monitoring PLANSAB, it will be essential to carry out
11
monitoring and economic/financial assessment in order to reach the projected service provision goals within the
next twenty years (2013-2033). In this regard, TrackFin is a tool that will be useful in monitoring financing trends,
whether to redefine financing guidelines or to develop new financing strategies.
WASH Account results: The study shows that:
The financing flows for the sector not yet are aligned sufficiently with the objectives and goals set in
PLANSAB. The funds allocated for new investments to expand services and replace existing assets show
a rising trend, but below projected estimates. However, the available data showed that growth in federal
public spending in the WASH sector is in keeping with the directives and federal policy objectives
established in Law 11.445/2007.
More funds were allocated to the sector by the federal government and by financial agencies in the sector
(CAIXA and BNDES) than the providers were able to use, demonstrating ineffective resource
implementation.
The amount of funds allocated to the sector for support activities and complementary WASH-related
hygiene and health activities continues to be very small and far from meeting the sector’s needs.
Expenditure on WASH services for the rural subsector remains very low and does not meet the demand in
this subsector, where the biggest gaps are found in the provision of adequate water supply and sewage
disposal services.
National stakeholder group: The group showed interest in and commitment to obtaining results. However,
because of the highly specialized and unusual content (even for actors in the sanitation sector) and because the
group had few face-to-face meetings and there was little time to discuss and align ideas, it was impossible for each
agency involved in this exercise to truly appropriate and internalize the results and potential of the methodology.
However, the positive results obtained will help ensure that this does occur in future exercises with the
methodology. The main challenge encountered in the course of the exercise was the very small team available.
6 Recommendations for future studies and next steps
The following measures are both recommended and necessary for a more in-depth, comprehensive study of the
sector, using the proposed methodology to include state and regional breakdowns, with regular monitoring and
evaluation of the sector:
a) Create mechanisms and procedures for the regular and systematic implementation of TrackFin
methodology in the Ministry of Cities (within the structure of SNSA), also adapted for PLANSAB
monitoring and evaluation;
b) Revise, expand, and qualify financial information found in SNIS in order to close the identified gaps and
allow better data disaggregation by service (S1 to S5), by financing source (FS1 to FS6), by use (U1 to
U5), and by urban/rural area;
c) Include the categories adopted in the TrackFin pilot project in the Report on Public Expenditure on Basic
Sanitation and in managerial reports by the financial agencies that deal with funds that finance the sector.
In the case of financial agencies, publicize the reports on the financing of the sector;
d) Develop information modules on other public policy areas associated with WASH services and integrate
them into the new National Information System on Sanitation (SINISA);
e) In the medium term, expand and/or revise the questionnaires used by PNAD and/or POF (IBGE) for
statistical research in order to enter information on household expenditure on basic sanitation;
f) Carry out exercises with regional and state breakdowns with a view to more broadly identifying the
effects of public policies and helping state providers to internalize the methodology;
12
g) WHO should study the classification of hygiene and health promotion expenditures more closely in order
to provide greater clarity in this area and to facilitate data collection at the national level (in the available
databases of the ministries of Health and Education);
h) Evaluate the viability of collaboration between the TrackFin exercise and the SEEW-A accounts now
being adopted by the Brazilian government.
i) Design research related to categories FU7—Governments and bilateral and multilateral donors, and
FU9—NGOs and community-based organizations, in order to step up consultations on available data
sources.
j) Achieve clearer understanding of including the “hygiene” category in water and sanitation services, and
evaluate whether to keep the category in future exercises. There are hygiene initiatives promoted as part of
health, education, and basic sanitation policies in Brazil; however, they cannot be identified in the national
databases.
k) Reduce the scope of the categories or allow the subdivision of categories, taking into account the
characteristics of each country. Within public policies for the WASH sector, Brazil does not consider the
self-provided water supply or sewage disposal in the industrial and commercial categories (U6); therefore,
it should not be included as a category of use. With regard to category P1—“Government agencies”: in
Brazil these institutions act as service providers of the federal, state, and municipal governments. For
future editions of TrackFin, it would be useful to split this category into three parts, similar to the proposal
for the classification of financing units. In Brazil, the institutions or authorities that regulate basic
sanitation services (category FU6) do not finance the services in their jurisdictions; it is therefore
proposed that this category be excluded in future editions of TrackFin in Brazil.
l) Extend the period for completing the exercise and ensure that a specialized team is exclusively devoted to
in in future editions. If the state of information sources at the federal level remains unchanged or is little
improved in future replications of the methodology in Brazil, at least eight full months will be necessary
to complete the entire process, with a team exclusively devoted to the task. The working team should be
made up of at least five people: a coordinator, a senior analyst specialized in economic/financial
management of the services and in public administration; two experienced researchers with an
understanding of the economic and financial considerations relevant to the methodology; and an assistant.
Related Documents