1 Where High-Sped Rail Works Best Petra Todorovich Director, America 2050 Megaregions + MetroProsperity Sustainable Economics for the Texas Triangle Megaregion September 24, 2009 Houston, Texas

1 Where High-Sped Rail Works Best Petra Todorovich Director, America 2050 Megaregions + MetroProsperity Sustainable Economics for the Texas Triangle Megaregion.
Dec 16, 2015
Welcome message from author
This document is posted to help you gain knowledge. Please leave a comment to let me know what you think about it! Share it to your friends and learn new things together.
Transcript

1
Where High-Sped Rail Works Best
Petra TodorovichDirector, America 2050
Megaregions + MetroProsperitySustainable Economics for the Texas Triangle
Megaregion
September 24, 2009 Houston, Texas
2
What does FRA consider HSR?
HSR – Express •Frequent, express service between major population centers 200 – 600 miles apart •Top speeds of at least 150 mph, grade-separated, dedicated ROW.
HSR – Regional •Relatively frequent service between population centers 100-500 miles apart.•Top speeds 110 – 150 mph, grade separated, some dedicated some shared track.
Emerging HSR •Developing corridors of 100-500 miles, with strong potential for future HSR. •Top speeds 90-110 mph on primarily shared track.
Conventional Rail
•Top speeds up to 79 (possibly 90) mph on shared track. •Intended to provide travel options and develop rail market.

3
FRA’s Evaluation CriteriaPublic Return on Investment
Transportation Benefits Ridership/passenger miles / OTP / delay data
Reduced trip time / additional service frequency
Impact on highway / air congestion / avoidance of alternative investment
Support of Network integration / capacity
Economic Recovery Benefits
Promote expansion of business opportunities & short and long term job creation
Other Public BenefitsEnvironmental quality / energy efficiency / promotion of livable communities
Project Success Factors
Project Management Approach Quality of project management plan
Applicants technical capacity and experience
Thoroughness of cost methodology / assumptions
Sustainability of Benefits Quality financial plan / revenue and operating forecasts
Comprehensiveness of agreements with operators and host
railroads
Other Attributes
Timeliness of Project Completion
Readiness of project to be commenced, timeliness of completion and realizations

4
Included all cities 50,000 or greater

5
27,000 city pairs – 100-500 Miles Apart

6
Criteria Used
•Population•Distance•Transit connections•Economic productivity•Congestion• In a megaregion
7
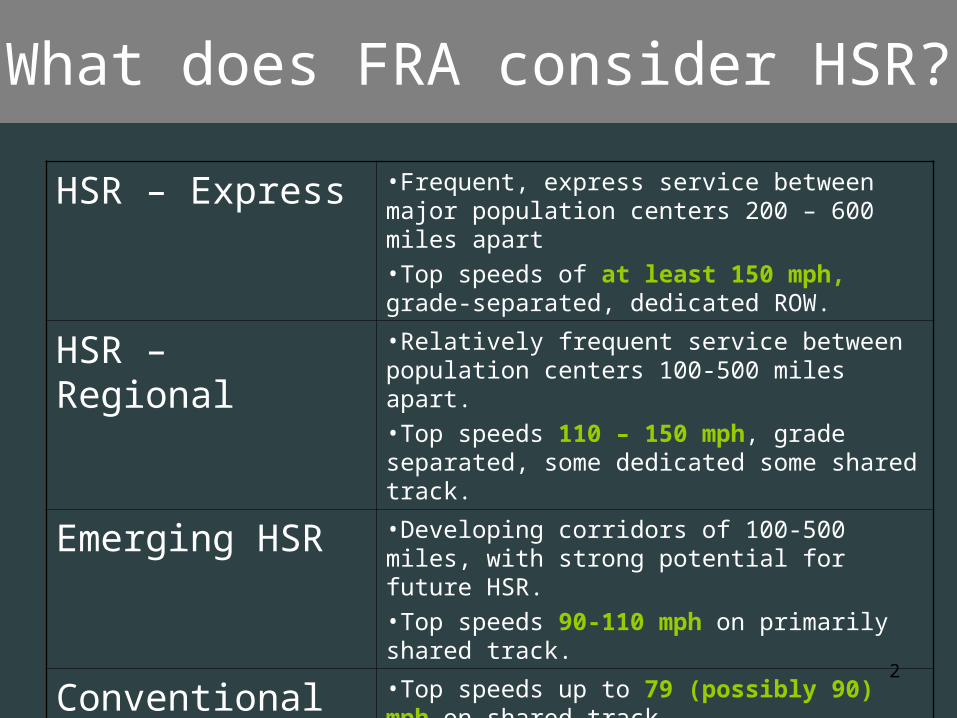
Criterion 1: Population

8
Criterion 2: Distance
9
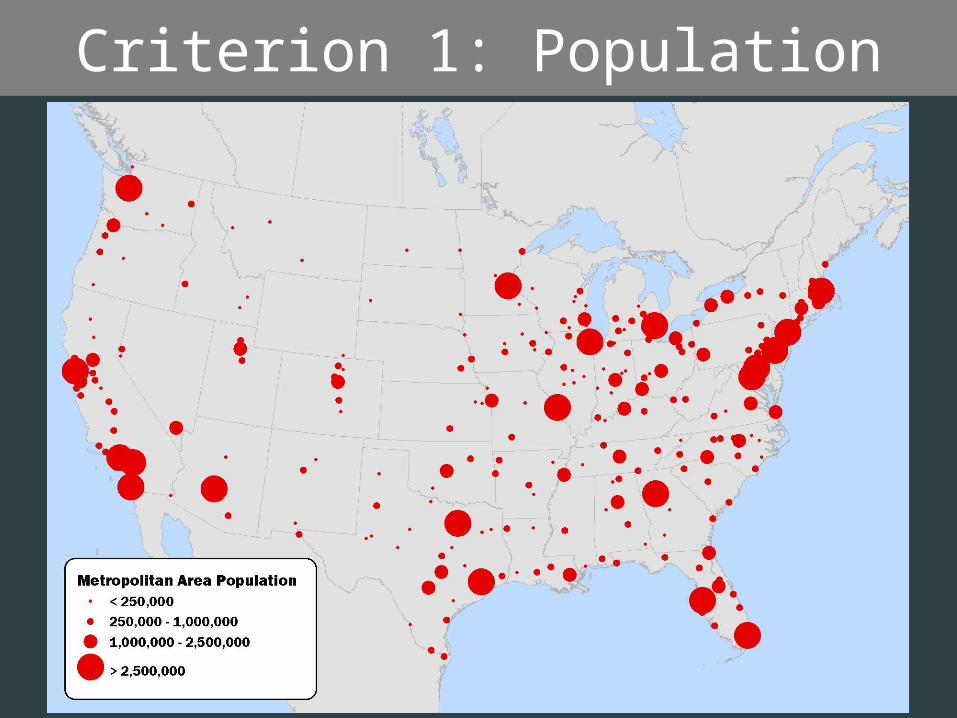
Criterion 3: Rail Transit Connections
New York
Chicago
Houston
Miami
San Diego
Salt Lake City
50 Miles

10
Study Favors Cities with high per capita GDP
Per Capita GDPSan Francisco: $69,000
Washington DC: $69,000
Boston: $61,000
Criterion 4: Economic Productivity
11
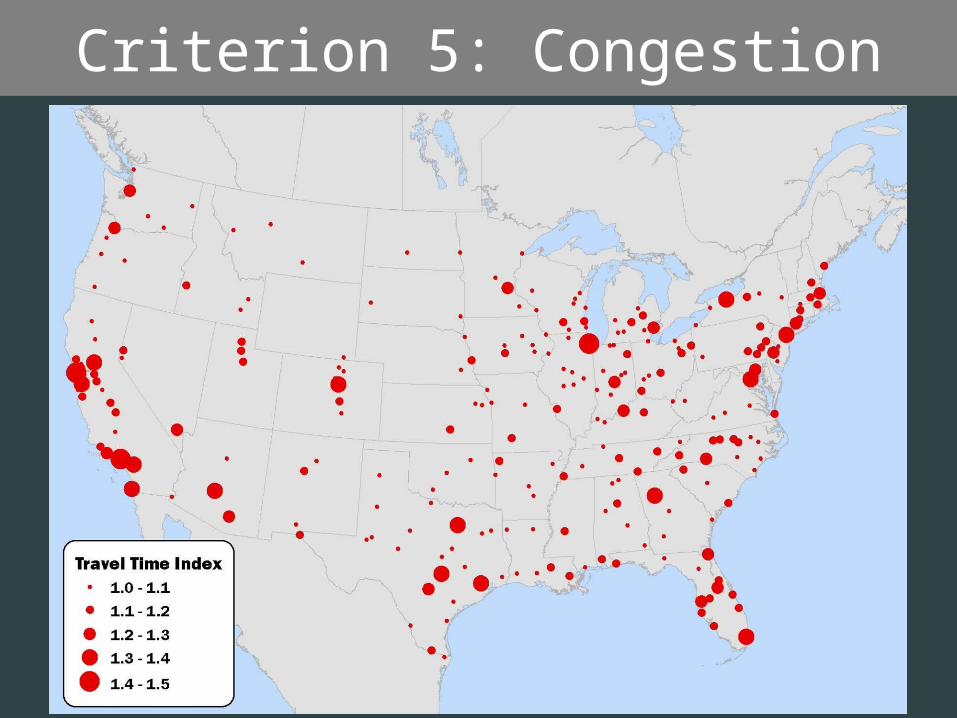
Criterion 5: Congestion

12
Criterion 6: Megaregion

13
Index Results and ScoresRank Corridor Score Rank Corridor Score
1 New York-Washington 100.00 26 Detroit-Washington 87.27
2 Philadelphia-Washington 98.24 27 Cleveland-New York 87.25
3 Boston-New York 97.22 28 Philadelphia-Pittsburgh 87.23
4 Baltimore-New York 96.83 29 Portland-Seattle 87.19
5 Los Angeles-San Francisco 96.43 30 Pittsburgh-Washington 86.69
6 Boston-Philadelphia 96.05 31 Los Angeles-Sacramento 86.58
7 Los Angeles-San Diego 94.92 32 New York-Providence 86.58
8 Los Angeles-San Jose 94.19 33 Raleigh-Washington 86.36
9 Boston-Washington 92.79 34 Detroit-Philadelphia 86.30
10 Dallas-Houston 91.37 35 Chicago-Louisville 86.25
11 Chicago-Detroit 91.09 36 Hartford-Philadelphia 86.20
12 Baltimore-Boston 90.39 37 San Diego-San Jose 86.14
13 Chicago-Columbus 89.42 38 Hartford-Washington 86.13
14 Chicago-Saint Louis 89.25 39 Chicago-Cincinnati 86.02
15 Los Angeles-Phoenix 89.03 40 Cleveland-Philadelphia 85.99
16 Chicago-Cleveland 88.71 41 Charlotte-Philadelphia 85.60
17 Charlotte-Washington 88.39 42 Philadelphia-Raleigh 85.58
18 San Diego-San Francisco 88.32 43 Buffalo-New York 85.58
19 Columbus-Washington 88.21 44 New York-Virginia Beach 85.52
20 Cleveland-Washington 88.13 45 Austin-Dallas 85.47
21 New York-Pittsburgh 88.03 46 Manchester-New York 85.41
22 Phoenix-San Diego 87.97 47 Philadelphia-Providence 85.36
23 Las Vegas-Los Angeles 87.79 48 Bridgeport-Philadelphia 85.31
24 Detroit-New York 87.47 49 Columbus-Philadelphia 85.24
25 Chicago-Minneapolis 87.33 50 New York-Rochester 85.11
14
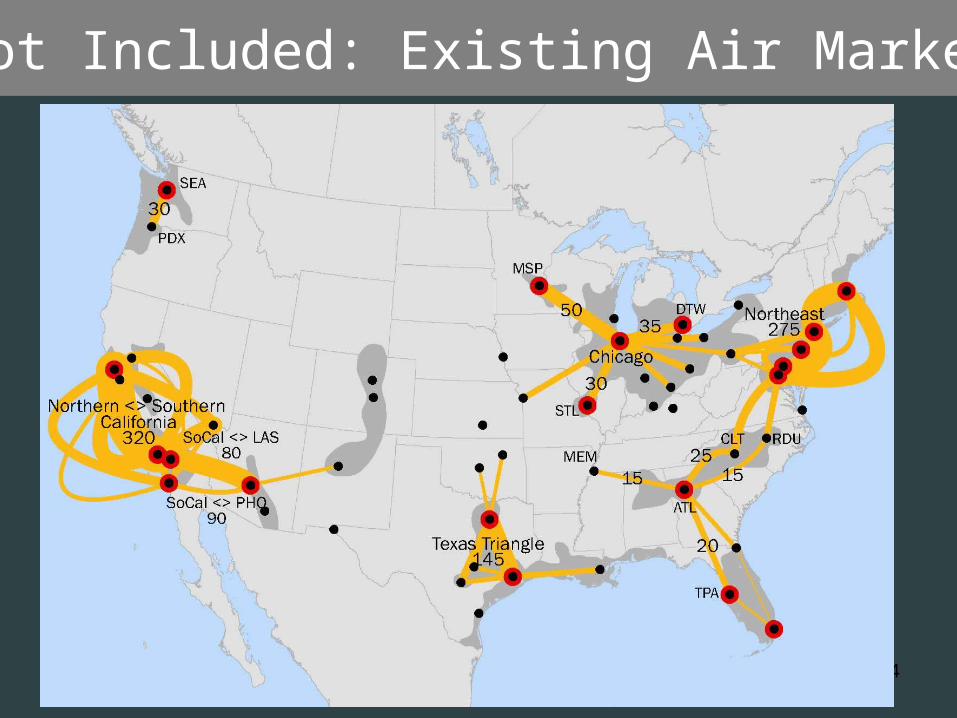
Not Included: Existing Air Market
15
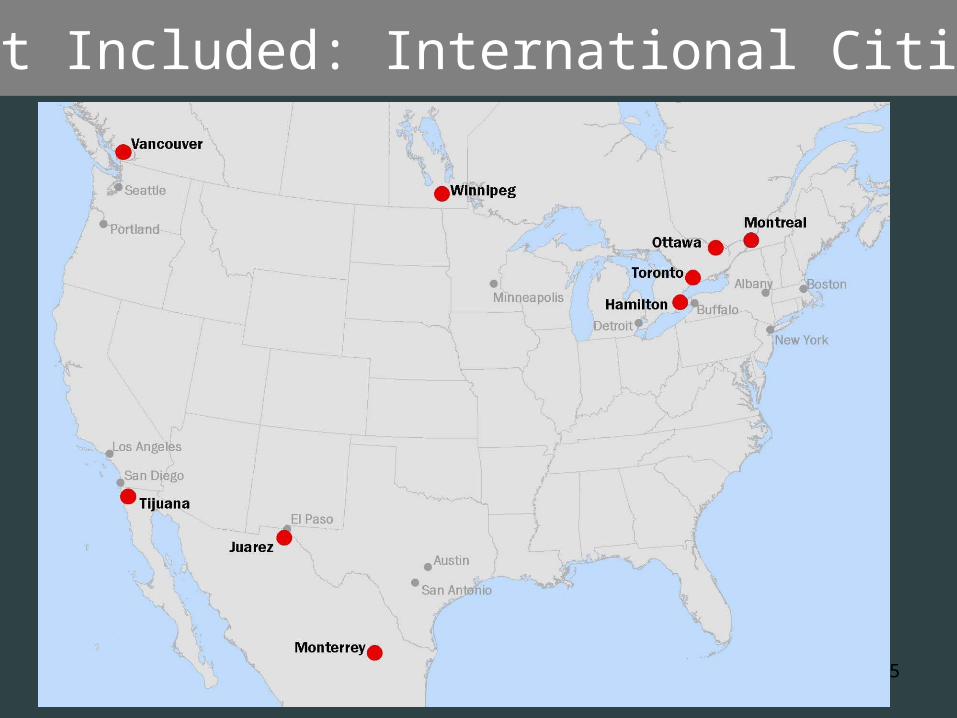
Not Included: International Cities
16
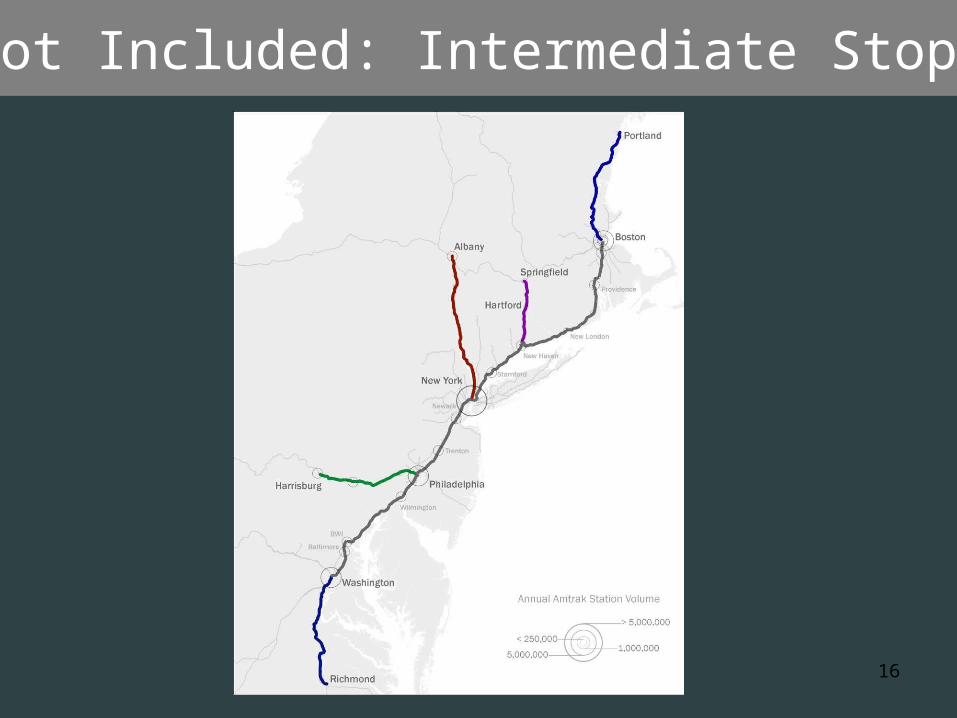
Not Included: Intermediate Stops

17
HSR Phasing Plan: Phase 1

18
HSR Phasing Plan: Phase 2

19
HSR Phasing Plan: Phase 3

20
Trans-American Passenger Network
21
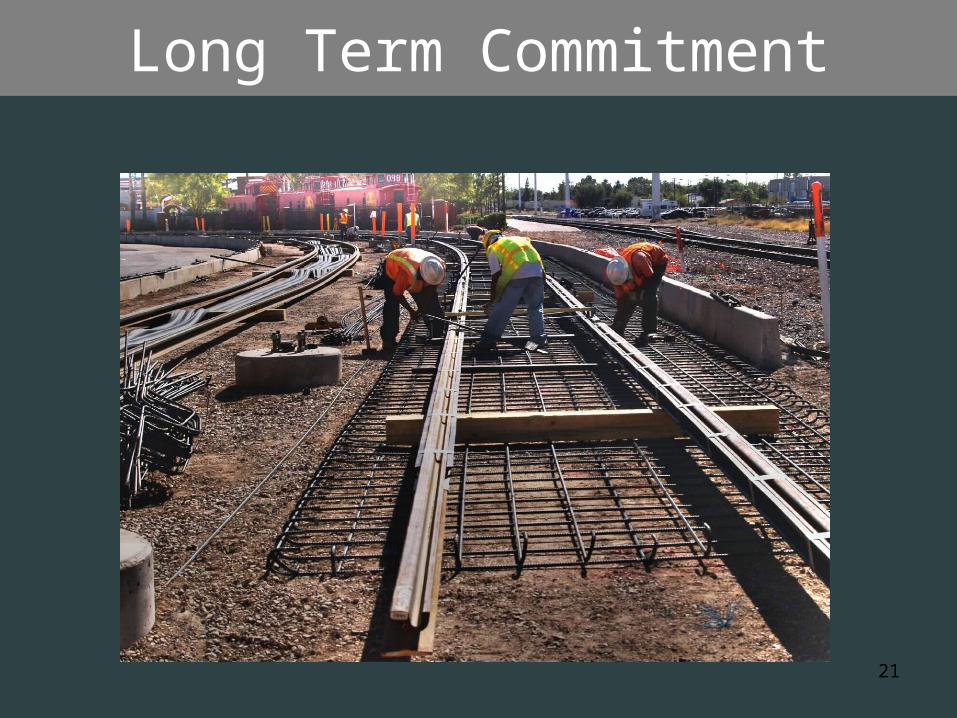
Long Term Commitment

22
www.America2050.org
www.rpa.org
Related Documents