(1) 1. INTRODUCTION All measurements of human development have put Kerala on top of all the major States of India. The Planning Commission of India has worked out the Human Development Index (HDI) at 0.638 for Kerala against 0.472 for All India, for the year 2001 1 . Kerala has the highest life expectancy, literacy and lowest infant mortality, though per capita monthly expenditure is not the highest. In terms of Net Domestic Product, Keralas rank amongst States falls in the middle, though it holds the highest HDI rank. Per capita income of Kerala at constant prices in 2001-02 was Rs. 11,046 crore. It was marginally higher than the per capita income for India (Rs.10,754 crore). But the rate of growth in Kerala during this year was lesser than for India. Kerala has a rich heritage of soco- economic development due to several factors. With a coastline of 590 kms., the State has had a rewarding maritime tradition. It has been trading with the Gulf countries for many Centuries, especially in spices. It has received the missionaries of Christianity since the first Century AD. Along with these missionaries came education and health care. The monarchs who ruled Kerala encouraged art and literature and made the same accessible to men and women alike. The southern part of Kerala under the Travancore and Cochin Maharajas could also boast of a good infrastructure of roads and irrigation systems, which ensured relatively higher prosperity for the people. South India in general and Kerala in particular was not subjected to the ravages of invaders and insecurity of life and property, as was the case in North India. The State of Kerala took off from a comparatively higher level of social development, when it was formed in 1956 under States Reorganization in India. 1 The HDI is a composite of variables capturing attainments in three dimensions of human development viz., economic, educational and health. These have been captured by per capita monthly expenditure adjusted for inequality; a combination of literacy rate and intensity of formal education; and a combination of life expectancy at age 1 and infant mortality rate. Table 1.1 Domestic Product and Per Capita Income, Kerala/India (Rs. crore) ITEM KERALA INDIA 2000-01 2001-02 2000-01 2001-02 Net Domestic Product (NDP) At current prices 63,094 69,602 17,19,868 18,76,955 (10.8) (10.3) (8.9) (9.1) At 1993-94 prices 34,450 36,079 10,62,616 11,23,543 (5.3) (4.7) (4.2) (5.7) Per Capita Income At current prices 19,463 21310 16,707 17,978 (9.9) (9.5) (6.9) (7.6) At 1993-94 prices 10,627 11046 10,306 10,754 (4.4) (3.9) (2.4) (4.3) Source: Government of Kerala, State Planning Board, Economic Review, 2002 Figures in brackets indicate change over the previous year.

Welcome message from author
This document is posted to help you gain knowledge. Please leave a comment to let me know what you think about it! Share it to your friends and learn new things together.
Transcript
(1)
1. INTRODUCTION
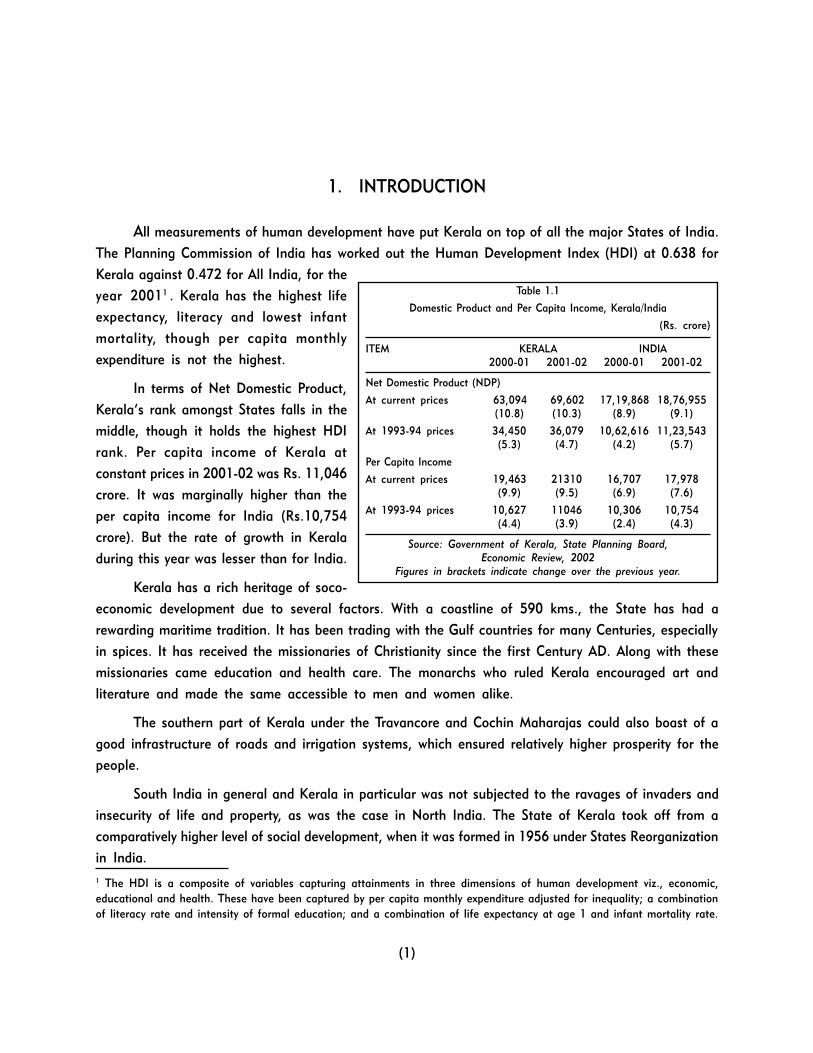
All measurements of human development have put Kerala on top of all the major States of India.
The Planning Commission of India has worked out the Human Development Index (HDI) at 0.638 for
Kerala against 0.472 for All India, for the
year 20011 . Kerala has the highest life
expectancy, literacy and lowest infant
mortality, though per capita monthly
expenditure is not the highest.
In terms of Net Domestic Product,
Kerala�s rank amongst States falls in the
middle, though it holds the highest HDI
rank. Per capita income of Kerala at
constant prices in 2001-02 was Rs. 11,046
crore. It was marginally higher than the
per capita income for India (Rs.10,754
crore). But the rate of growth in Kerala
during this year was lesser than for India.
Kerala has a rich heritage of soco-
economic development due to several factors. With a coastline of 590 kms., the State has had a
rewarding maritime tradition. It has been trading with the Gulf countries for many Centuries, especially
in spices. It has received the missionaries of Christianity since the first Century AD. Along with these
missionaries came education and health care. The monarchs who ruled Kerala encouraged art and
literature and made the same accessible to men and women alike.
The southern part of Kerala under the Travancore and Cochin Maharajas could also boast of a
good infrastructure of roads and irrigation systems, which ensured relatively higher prosperity for the
people.
South India in general and Kerala in particular was not subjected to the ravages of invaders and
insecurity of life and property, as was the case in North India. The State of Kerala took off from a
comparatively higher level of social development, when it was formed in 1956 under States Reorganization
in India.
1 The HDI is a composite of variables capturing attainments in three dimensions of human development viz., economic,educational and health. These have been captured by per capita monthly expenditure adjusted for inequality; a combinationof literacy rate and intensity of formal education; and a combination of life expectancy at age 1 and infant mortality rate.
Table 1.1
Domestic Product and Per Capita Income, Kerala/India
(Rs. crore)
ITEM KERALA INDIA
2000-01 2001-02 2000-01 2001-02
Net Domestic Product (NDP)
At current prices 63,094 69,602 17,19,868 18,76,955(10.8) (10.3) (8.9) (9.1)
At 1993-94 prices 34,450 36,079 10,62,616 11,23,543(5.3) (4.7) (4.2) (5.7)
Per Capita Income
At current prices 19,463 21310 16,707 17,978(9.9) (9.5) (6.9) (7.6)
At 1993-94 prices 10,627 11046 10,306 10,754(4.4) (3.9) (2.4) (4.3)
Source: Government of Kerala, State Planning Board,
Economic Review, 2002
Figures in brackets indicate change over the previous year.
(2)
Kerala squeezed between the Western Ghats and the Arabian Sea has a small share of the land
area of the sub-continent. But blessed with rich land and abundant water and other resources, habitation
has been intense, contributing to high density of population.
The highlands of the State slope down from the Western Ghats which rise to an average height
of 900 mts. with a number of peaks well over 1,800 mts. in altitude. The agro-climate of this region
has been highly suitable for plantation crops � tea, coffee and cardamom. The midlands situating
between the highlands and the lowlands of the coast with rich but porous soil have sustained a wide
variety of tree crops and spices � coconut, arecanut, cashew, pepper, ginger, turmeric etc. The versatile
rice crops are to be seen in all regions at various altitudes including the lowlands. The coastal region
has a rich eco-system of deltaic and estuarian areas. These areas, together with the Arabian Sea front
are rich in marine resources. Washed by 44 rivers and exposed to two monsoons, the State is doubly
blessed and has a strong agrarian base for its economy.
Industrial development has lagged behind with few large industrial units. The high potential for
hydropower generation from its rivers has not translated into large investments of capital in manufacturing.
The introduction of land reforms and abolition of tenancy brought in some kind of re-distributive
justice and lower levels of poverty in the State. Of course, the land under plantation crops like tea,
coffee, rubber and cardamom were exempted from the land ceiling provisions which excluded a
substantial proportion of land from the impact of land reforms. It also caused deprivations to small
landlords who were not actual cultivators. They had no other assets when they gave up ownership of
land to the tenants, nor was employment easily available to them in the secondary and tertiary sectors
in the State. The Namboodaries were specially one group that belonged to this class and suffered
deprivations due to the change in their economic status. They were brought down to the lower middle
class category from being jenmis (land lords) holding large extents of land.
Land holdings in Kerala are very small. The average size of land holding now is 0.27 hectares.
It is held by 62.97 lakh land holders. Land under food crop cultivation has also been declining rapidly
with increasing population. The land under paddy cultivation has reduced from 8 lakh hectares to 3.22
lakh hectares. This has significantly reduced production of paddy as well as employment in agriculture.
The most significant problem of Kerala is matching its human resource with the available employment
opportunities in the State at the level of investment that is taking place. A significant proportion of
the population migrates to other parts of the world and other parts of India for employment, which
adds to the State�s Domestic Product, and is an important source of foreign exchange earning for the
country.
The levels of wages in Kerala are higher than most parts of the country. Workers from neighbouring
States find it attractive to migrate into Kerala and take up many of the unskilled jobs and depress
wage levels, making them less attractive for the educated manpower of Kerala. The problem of
unemployment, particularly for the educated is most severe in the State. Women are more among the
unemployed than men.

(3)
The administrative budget of Kerala under successive Governments of the earlier decades and
Five Year Plans concentrated on education and health. Even now these sectors account for significant
proportions of State Budget Expenditure.
The people of Kerala follow different faiths � Hinduism,
Islam, Christianity and Judaism. Numerically, the faith-mix of
the population of Kerala is strikingly different from that of
India as a whole. Though the Hindus are the majority community,
their proportion in the population in the State is much lesser.
Muslims and Christians have a substantial presence. In the
Muslim community there are both descendants of Arab merchants
who married local women as well as native converts. There is
considerable diversity among Christians - Catholics and
Protestants and among the Catholics, the Roman, Latin and
the Syrian.
Like in other parts of India, the Hindu community is
characterized by caste and community based stratification.
The principal communities among the Hindus are Namboodiri
Brahmins, Nairs, Ezhavas/Thiyas and Harijans consisting of several sub-castes/communities, pulayas
and parayas. Depending upon community practices, the status of women also varied in different
communities.
The State is home only for a relatively small proportion of the adivasi population of the country.
In the current mix of population in Kerala, Scheduled Tribes constitute only 1.1%. Similarly, the
population of Scheduled Castes is around 9.9% which is comparatively a smaller proportion of the
population compared to several other States.
Historically, women in Kerala enjoyed a significantly higher status compared to most other parts
of India. Some of the important factors which contributed to this were:
● Enlightened policies of the Governments of the erstwhile princely States;
● Access to education;
● Communitarianism of a high order; the community organizations of the Christians (the Church
institutions), Hindus (the Nair Service Society and SNDP Yogam of Ezhavas) etc. organized their
constituents, exposed them significantly to education, facilitated access to health and employment
and created the necessary infrastructure for the purpose;
● The matrilineal system of inheritance of property which was also in the nature of affirmative
system conducive to special protection for women; and
● Matrilocal residence of women after marriage with their spouses.
Table 1.2
Faith Mix of Population � India and Kerala
Religion India Kerala
Hindus 82.00 57.28
Muslims 12.12 23.33
Christians 2.34 19.32
Sikhs 1.94 0.01
Buddhists 0.96 -
Jains 0.40 0.01
Others 0.39 0.01
Religion not stated 0.05 0.04
Source: Registrar General and Census
Commissioner, India, Census of India � 1991,
State Profile 1991.
(4)
The beneficial impacts of the
joint family system and matriliny on
the status of women have been
described in terms of � strength and
social security flowing from property
entitlement, freedom of socialization
without constraints on female visibility
and mobility, trauma-free widowhood,
absence of child marriage, absence
of controversies regarding legitimacy
children because of identification of
the children with the mother etc.2
After achievement of
Independence, especially after
formation of Kerala, the people have
been exposed to the social trends
and practices elsewhere in the country.
Nuclear families have emerged with
the termination of the joint family
system. Even as matriliny is not the
order of the day, the evils of dowry
system are becoming rampant. In-
country and out-country migration of
women as well as men, while
enhancing incomes, has brought in
its wake disruptions in family life
generating traumatic experiences.
There is a school of thought
that the so-called �High Status� of
women of Kerala is illusory and that
the developments since achievement
of Independence and formation of
the State of Kerala, have not
necessarily contributed to enhancement in the status of women. The interactions of the National
Commission for Women with the Civil Society in Kerala have reflected several factors that detract from
women�s well being. These factors would seem to call for an objective demystification of the so-called
�High Status� of women in Kerala.
2 Gender Profile- Kerala, Leela Gulati and Ramalingam, Royal Netherlands Embassy, New Delhi, India.
Demystified �High Status� of Women In Kerala
● In recent years, there are indications that the earlier advantages reflectedin Kerala�s favourable female sex ratio cannot be taken for granted forany more.
● Mushroom growth of ultra sonagraphy clinics and evidence relating toabortions lend credibility to the possible practice of sex selective abortions.
● There is serious concern in regard to masculinization of juvenile sex ratio,though it is much lesser than for All India; fertility decline experienced inKerala may result in a masculinization of juvenile sex ratios through the�intensification� effect. The space left for daughters narrows down.
● Women now have individual rights over their share of Taravad property butthis right has been achieved within a legal framework of dependence onmen as husbands. Men as husbands and fathers have gained access tocontrol over women in ways that they did not have earlier.
● There has been a tendency for men to move away from farming to otheroccupations in the context of changing value of land and the decline offarming as a favoured occupation. This has wider consequences for genderrelations of women who remain in the house and have to take over anincreasing share of responsibility for farming, importance of which as asource of family income is declining.
● Despite education, gender segregated roles of women in the householdscontinue.
● Marriage has come to be central to a woman�s social identity whichnecessitates the control of her sexuality, behaviour and independence.
● External migration and its associated processes such as remittances fromabroad have been linked to the growth of consumer practices such as inlavish marriages and provision of dowries with dangerous implications forwomen.
● Women who marry migrants tend to withdraw from work indicating aparticular status attached to �domestication� in terms of the self-identityof the migrant husband.
● Studies on migration bring out the psychological trauma faced by �GulfWives� who are on average better educated than their husbands whoemigrate for work.
● Gender differences in education prevail in technical fields.
● Failure in examinations, mismatch between expectations of educated jobseekers and levels of education, marital disharmony including because ofalcoholism amongst husbands, mental torture etc. are factors whichtraumatize women and drive them to suicides.
● Feminization of jobs in terms of access to segregated jobs prevails andthis allows little bargaining power in the nucleated families.
● There is evidence of asymmetrical position for women in occupationaldistribution. There is sex discrimination in levels of wages in varioussectors � informal, manufacturing and even professional.
Source: Mridul Eapen and Praveena Kodoth, Demystifying the �High Status� of
Women in Kerala, Centre for Development Studies, Thiruvananthapuram, 2001.
(5)
2. DEMOGRAPHIC PROFILE
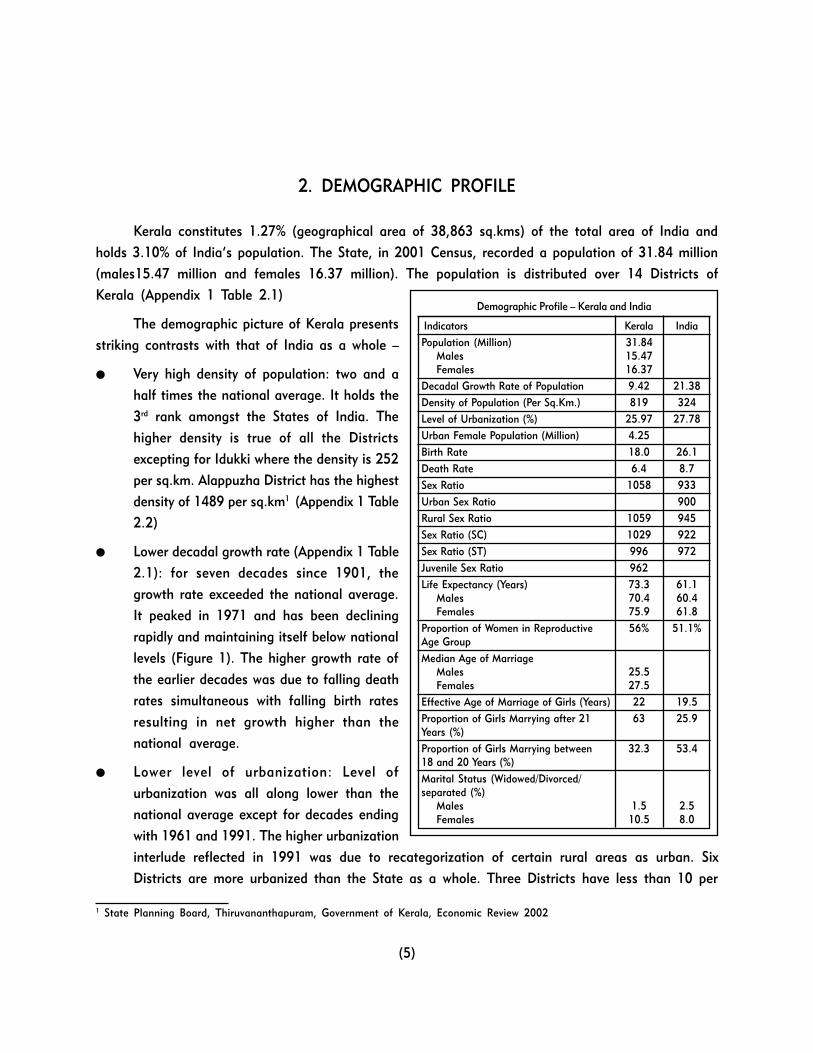
Kerala constitutes 1.27% (geographical area of 38,863 sq.kms) of the total area of India and
holds 3.10% of India�s population. The State, in 2001 Census, recorded a population of 31.84 million
(males15.47 million and females 16.37 million). The population is distributed over 14 Districts of
Kerala (Appendix 1 Table 2.1)
The demographic picture of Kerala presents
striking contrasts with that of India as a whole �
● Very high density of population: two and a
half times the national average. It holds the
3rd rank amongst the States of India. The
higher density is true of all the Districts
excepting for Idukki where the density is 252
per sq.km. Alappuzha District has the highest
density of 1489 per sq.km1 (Appendix 1 Table
2.2)
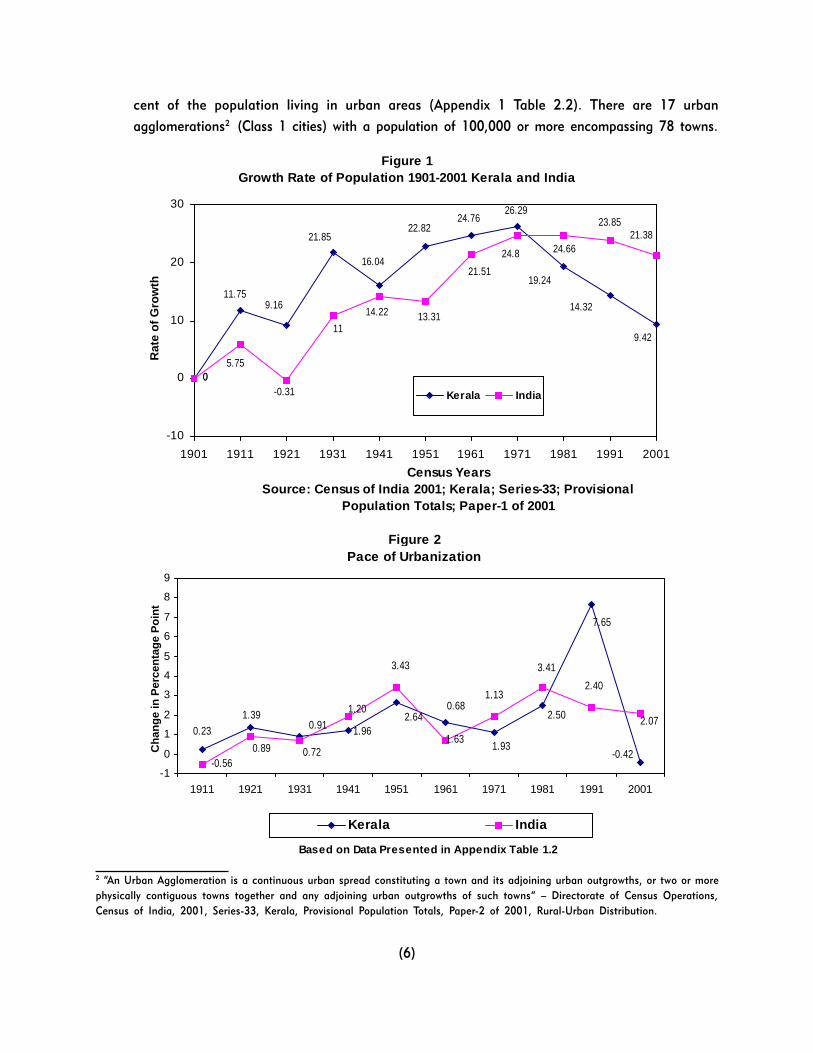
● Lower decadal growth rate (Appendix 1 Table
2.1): for seven decades since 1901, the
growth rate exceeded the national average.
It peaked in 1971 and has been declining
rapidly and maintaining itself below national
levels (Figure 1). The higher growth rate of
the earlier decades was due to falling death
rates simultaneous with falling birth rates
resulting in net growth higher than the
national average.
● Lower level of urbanization: Level of
urbanization was all along lower than the
national average except for decades ending
with 1961 and 1991. The higher urbanization
interlude reflected in 1991 was due to recategorization of certain rural areas as urban. Six
Districts are more urbanized than the State as a whole. Three Districts have less than 10 per
Demographic Profile � Kerala and India
Indicators Kerala India
Population (Million) 31.84Males 15.47Females 16.37
Decadal Growth Rate of Population 9.42 21.38
Density of Population (Per Sq.Km.) 819 324
Level of Urbanization (%) 25.97 27.78
Urban Female Population (Million) 4.25
Birth Rate 18.0 26.1
Death Rate 6.4 8.7
Sex Ratio 1058 933
Urban Sex Ratio 900
Rural Sex Ratio 1059 945
Sex Ratio (SC) 1029 922
Sex Ratio (ST) 996 972
Juvenile Sex Ratio 962
Life Expectancy (Years) 73.3 61.1Males 70.4 60.4Females 75.9 61.8
Proportion of Women in Reproductive 56% 51.1%Age Group
Median Age of MarriageMales 25.5Females 27.5
Effective Age of Marriage of Girls (Years) 22 19.5
Proportion of Girls Marrying after 21 63 25.9Years (%)
Proportion of Girls Marrying between 32.3 53.418 and 20 Years (%)
Marital Status (Widowed/Divorced/separated (%)
Males 1.5 2.5Females 10.5 8.0
1 State Planning Board, Thiruvananthapuram, Government of Kerala, Economic Review 2002
(6)
cent of the population living in urban areas (Appendix 1 Table 2.2). There are 17 urban
agglomerations2 (Class 1 cities) with a population of 100,000 or more encompassing 78 towns.
Figure 1Growth Rate of Population 1901-2001 Kerala and India
00
21.85
11.759.16
16.04
22.8224.76
26.29
19.24
14.32
9.42
14.22
5.75
-0.31
1113.31
21.51
24.8 24.66
23.8521.38
-10
0
10
20
30
1901 1911 1921 1931 1941 1951 1961 1971 1981 1991 2001
Census Years Source: Census of India 2001; Kerala; Series-33; Provisional
Population Totals; Paper-1 of 2001
Rat
e of
Gro
wth
Kerala India
2 �An Urban Agglomeration is a continuous urban spread constituting a town and its adjoining urban outgrowths, or two or more
physically contiguous towns together and any adjoining urban outgrowths of such towns� � Directorate of Census Operations,
Census of India, 2001, Series-33, Kerala, Provisional Population Totals, Paper-2 of 2001, Rural-Urban Distribution.
Figure 2 Pace of Urbanization
-0.56
0.23
1.390.91
1.202.64
1.63
1.13
2.50
7.65
-0.420.89 0.72
1.96
3.43
0.68
1.93
3.41
2.40
2.07
-1
0
1
2
3
4
5
6
7
8
9
1911 1921 1931 1941 1951 1961 1971 1981 1991 2001
Based on Data Presented in Appendix Table 1.2
Cha
nge
in P
erce
ntag
e P
oint
Kerala India
(7)
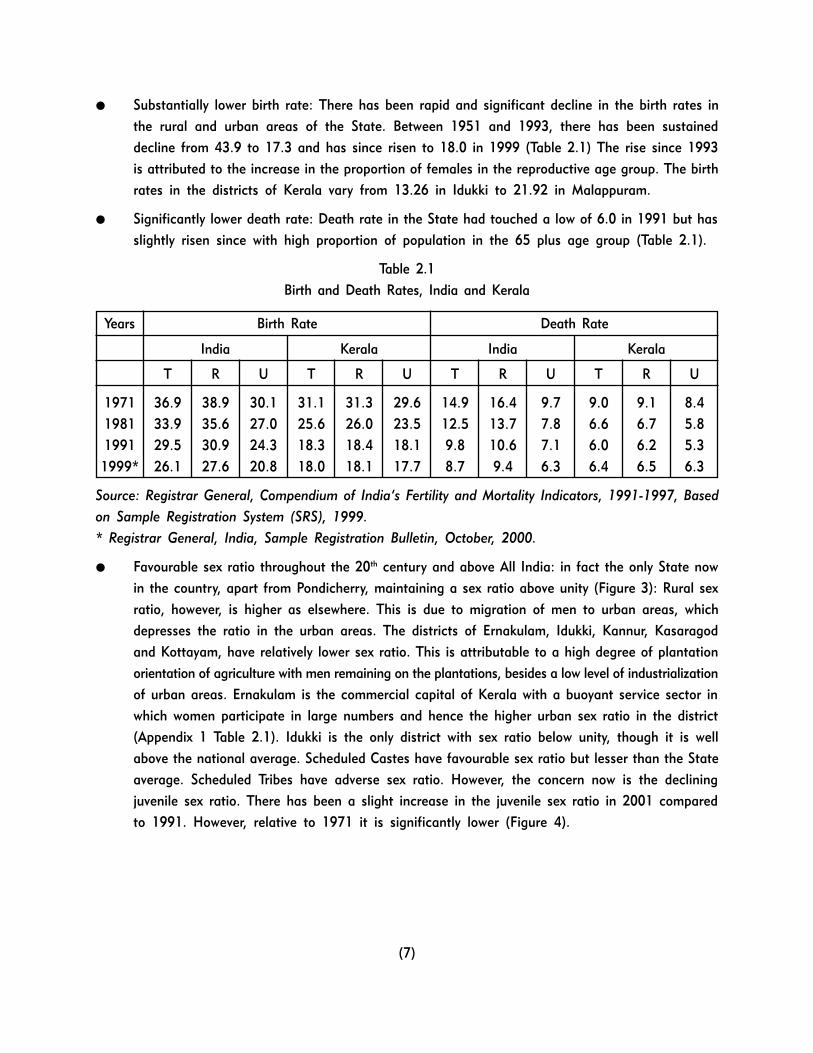
● Substantially lower birth rate: There has been rapid and significant decline in the birth rates in
the rural and urban areas of the State. Between 1951 and 1993, there has been sustained
decline from 43.9 to 17.3 and has since risen to 18.0 in 1999 (Table 2.1) The rise since 1993
is attributed to the increase in the proportion of females in the reproductive age group. The birth
rates in the districts of Kerala vary from 13.26 in Idukki to 21.92 in Malappuram.
● Significantly lower death rate: Death rate in the State had touched a low of 6.0 in 1991 but has
slightly risen since with high proportion of population in the 65 plus age group (Table 2.1).
Table 2.1
Birth and Death Rates, India and Kerala
Years Birth Rate Death Rate
India Kerala India Kerala
T R U T R U T R U T R U
1971 36.9 38.9 30.1 31.1 31.3 29.6 14.9 16.4 9.7 9.0 9.1 8.4
1981 33.9 35.6 27.0 25.6 26.0 23.5 12.5 13.7 7.8 6.6 6.7 5.8
1991 29.5 30.9 24.3 18.3 18.4 18.1 9.8 10.6 7.1 6.0 6.2 5.3
1999* 26.1 27.6 20.8 18.0 18.1 17.7 8.7 9.4 6.3 6.4 6.5 6.3
Source: Registrar General, Compendium of India�s Fertility and Mortality Indicators, 1991-1997, Based
on Sample Registration System (SRS), 1999.
* Registrar General, India, Sample Registration Bulletin, October, 2000.
● Favourable sex ratio throughout the 20th century and above All India: in fact the only State now
in the country, apart from Pondicherry, maintaining a sex ratio above unity (Figure 3): Rural sex
ratio, however, is higher as elsewhere. This is due to migration of men to urban areas, which
depresses the ratio in the urban areas. The districts of Ernakulam, Idukki, Kannur, Kasaragod
and Kottayam, have relatively lower sex ratio. This is attributable to a high degree of plantation
orientation of agriculture with men remaining on the plantations, besides a low level of industrialization
of urban areas. Ernakulam is the commercial capital of Kerala with a buoyant service sector in
which women participate in large numbers and hence the higher urban sex ratio in the district
(Appendix 1 Table 2.1). Idukki is the only district with sex ratio below unity, though it is well
above the national average. Scheduled Castes have favourable sex ratio but lesser than the State
average. Scheduled Tribes have adverse sex ratio. However, the concern now is the declining
juvenile sex ratio. There has been a slight increase in the juvenile sex ratio in 2001 compared
to 1991. However, relative to 1971 it is significantly lower (Figure 4).

(8)
● Longer life expectancy: Life expectancy at birth is the highest for males (70.4 years) and females
(75.9 years) in Kerala compared to all the other States of the country. Between 1970-75 and
1993-97, there was a life expectancy gain of more than 11 years for all persons in the State.
Females gained 12.8 years. (Appendix 1 Table 2.3). The higher expectancy of life for females
raises the overall sex ratio as well as sex ratio in the highest age group.
● Higher effective age of marriage for girls: The effective age of marriage for girls in Kerala was
22 years against 19.5 years (1997) for All India. Majority of females in Kerala married after 21
years and those marrying before the legal age for marriage of 18 years was only less than 5%.
In the contrasts between rural and urban areas, the age of marriage varies in a narrow range�
of less than a year in Kerala and slightly more than a year for All India. In urban Kerala females
marry a little earlier than in rural areas, while in urban India, females marry a little later than
Figure 3Trends in Sex Ratio 1901 - 2001 Kerala and India
105810361032
10161022102810271022
10111004 1008
933927934930941946945950955
964972
900920940960980
1000102010401060
1901 1911 1921 1931 1941 1951 1961 1971 1981 1991 2001
Census Years
Source: Census of India 2001; Kerala; Series-33; Provis ional
Fem
ales
Per
100
0 M
ales
Kerala India
Figure 4 Overall and juvenile sex ratios in Kerala through
1058
976 970 958 962
1036
1016 1032
900 920 940 960 980
1000 1020 1040 1060 1080
1971 1981 1991 2001
Total Population Population 0-6 Years
(9)
in rural areas (1993). Though Kerala is quite progressive compared to rest of India in regard
to the age of marriage of girls, there are in fact intra State variations.3 While in four districts
(Ernakulam, Kottayam, Alapuzha and Pathanamthitta) the percentage of girls marrying before
18 years is zero, it is as high as 35.7% in Malapuram district. Wayanad, Pallakad, Kozhikode,
Kasaragod and Kannur are districts where the percentage of girls marrying before 18 years
ranges from 8.4% to 19%.
�Unlike most states of India, very early marriage is not common in Kerala. The median age at
first marriage for women age 25-49 is 20 years, much higher than the median, at 16 years, for
the country as a whole. Only 14 per cent of women age 15-19 are already married, and this
proportion is only 16 per cent even in rural areas where age at marriage tends to be lower than
in urban areas. Older women are more likely than younger women to have married at an early
age; 6 per cent of women currently age 35-49 married before they were 15, compared with 1
per cent of women currently age 15-19. Although this finding indicates that the proportion of
women who marry young continues to decline in Kerala, one in six of even the younger women
(age 20-24) married before reaching the legal minimum age of 18 years. On average, women
are about six years younger than the men they marry.�4
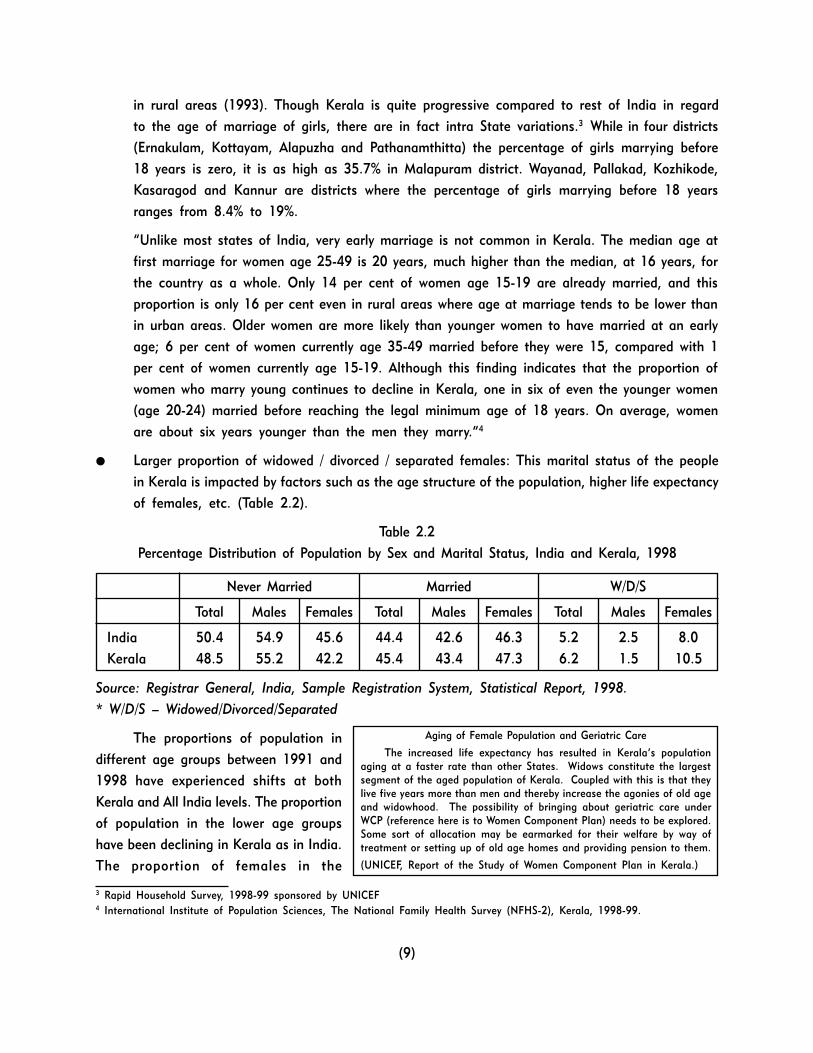
● Larger proportion of widowed / divorced / separated females: This marital status of the people
in Kerala is impacted by factors such as the age structure of the population, higher life expectancy
of females, etc. (Table 2.2).
Table 2.2
Percentage Distribution of Population by Sex and Marital Status, India and Kerala, 1998
Never Married Married W/D/S
Total Males Females Total Males Females Total Males Females
India 50.4 54.9 45.6 44.4 42.6 46.3 5.2 2.5 8.0
Kerala 48.5 55.2 42.2 45.4 43.4 47.3 6.2 1.5 10.5
Source: Registrar General, India, Sample Registration System, Statistical Report, 1998.
* W/D/S � Widowed/Divorced/Separated
The proportions of population in
different age groups between 1991 and
1998 have experienced shifts at both
Kerala and All India levels. The proportion
of population in the lower age groups
have been declining in Kerala as in India.
The proportion of females in the
3 Rapid Household Survey, 1998-99 sponsored by UNICEF4 International Institute of Population Sciences, The National Family Health Survey (NFHS-2), Kerala, 1998-99.
Aging of Female Population and Geriatric Care
The increased life expectancy has resulted in Kerala�s populationaging at a faster rate than other States. Widows constitute the largestsegment of the aged population of Kerala. Coupled with this is that theylive five years more than men and thereby increase the agonies of old ageand widowhood. The possibility of bringing about geriatric care underWCP (reference here is to Women Component Plan) needs to be explored.Some sort of allocation may be earmarked for their welfare by way oftreatment or setting up of old age homes and providing pension to them.
(UNICEF, Report of the Study of Women Component Plan in Kerala.)
(10)
reproductive age group of 15-49 has increased and come to be more for Kerala than for India - 56%
and 51.1% respectively. The lowering of birth rate and fertility rate has helped Kerala contain the
population growth rate despite the increase in the proportion of females in the reproductive age group.
The proportion of females in the 50 plus age group has been much higher for Kerala in 1991 and is
becoming even more in 1998 contributing to larger number of elderly women (Appendix 1 Table 2.4).
The median age for the population of Kerala is significantly higher at 25.5 years for males and 27.3
years for females compared to All India and other States. The female to male sex ratio in different
age groups is above unity in all age groups except in the 5-14 age group. The highest sex ratio is in
the 65 plus age group due to the higher life expectancy for females.

(11)
3. HEALTH CARE INFRASTRUCTURE AND SERVICES
Health, like education, was given special attention in Kerala since long time in pre-Independence
periods. This was due to the enlightened monarchs of parts of what is Kerala today. Important health-
related subjects including nursing were built into the school curriculum for girls. With the introduction
of formal professional courses for nursing and establishment of public and private educational institutions
for the purpose even since the early years of the last century, Kerala has come to be reputed for its
specialization in nursing discipline. It is no exaggeration to say that today Kerala nurses are serving
humanity worldwide. If the people of Kerala in general have far superior health status than of the
country as a whole, one of the important contributory factors is the tradition of special attention being
given in governance to health, health infrastructure including medical manpower and paramedical
personnel.
The accessibility to health infrastructure
and services is superior in Kerala as compared
to other States and All India. For over a
decade now, medical staff strength including
that of paramedical staff in the Government
health care delivery system has steadily
increased. More pronounced expansion has
been that of the nursing staff strength.
A specialty of the health scenario in
Kerala is that adoption of the western system
of medicine has been without detriment to
the indigenous systems. Indeed, affirmative
policies have been implemented both at the
Central and State Government levels for the
preservation and development of Ayurveda,
Siddha, Unani and Homeopathy. This
development has come about both in the
public and private sectors (Appendix 1 Table
3.1). As part of decentralization of power,
2621 medical institutions have been
transferred to local bodies. The appointment
of all categories of personnel and the supply
Table 3.1
Medical Infrastructure and Expenditure in Kerala
● Sub-centres� Spatial distribution of sub-centres 1 for every 6.16 Sq.
Kms.� Population served per sub-centre 5000
● Primary Health Centres� Spatial distribution of Primary
Health Centres 1 for every 33.3 Sq.Kms.
� Population served per Primary 25000Health Centre
● Population served by Community 1 per 25000Health Centres
● Expansion of medical staff strength� Over all expansion 0.9% per annum� Nurses 3.1% per annum� Pharmacists 0.3% per annum� Field Staff 0.4% per annum
● Health Expenditure� Expansion of per capita 300%
expenditure on health includingfamily welfare (1990-91 to2000-01)
� Expansion of expenditure on 5.3% to 5.5%health and family welfare(1995-96 to 2001-02)
� Public per capita expenditure on Rs.221/-health (2000-01)
� Private per capita expenditure Rs.793/-on health (1997)
Source: Compiled for this report from the State Planning Board,Economic Review 2002, Government of Kerala
(12)
of medicines continue to be with the health department of the State Government while construction
of buildings, conduct of medical camps and health awareness programmes are carried on at the local
level.
Despite the conjoint development of the various systems of medicine, peoples� preferences are
dominated by primacy of option to the Allopathic system. According to a study,1 in both rural and
urban Kerala, more than 80% of the expenditure was on allopathic treatment; 53% of the urban
households incurred expenditure on allopathic treatment, 14.5% on ayurvedic treatment and 6% on
homeopathic treatment. The figures for rural households were 53.6%, 10.8% and 2.3% respectively.
Unlike in India as a whole, more women than men avail of institutional facilities for treatment
of disorders. The reason for this is high proportion of institutional delivery of children, higher proportion
of aged women than of men and higher incidence of female morbidity � 155.8/1000 cases of chronic
illness against 137.5/1000 for males.
�More than half of the households in Kerala (58 per cent) use private hospitals, clinics, or
doctors for treatment when a family member is ill. More than one-third (38 per cent) normally use the
public medical sector. Even among households with a low standard of living, more than two-fifths
normally use the private medical sector when members become ill. Most respondents are generally
satisfied with the health care they receive. Ratings on the quality of services are consistently better
for private-sector facilities than for public-sector facilities.�2
Institutional delivery of children is generally the order of the day. Ninety seven percent of all
child deliveries take place in institutions. About 3 lakh deliveries are reported annually in Kerala.
Greater access to medical services, women�s education, high level of health awareness and commitment
to single/two child norm are factors contributing to high institutional deliveries. The superior maternal
and child health care in Kerala is also attributable to institutional access.
However, there is a criticism about women opting for avoidable caesarian operations and over
medicalization.3
Mortality
Mortality rates in Kerala start rising past 40 years of age. They are the highest in the 70 plus
age groups. This reflects high life expectancy. Infant and child mortality rates as also mortality rates
among the adolescents and the youth are quite low. Overall mortality rates are generally higher in rural
areas compared to urban areas. Female mortality rates are generally lesser than those of males in
rural as well as urban areas excepting in the age group of 0-4 years. This pattern is discernible in the
data on age specific mortality rates (Appendix 1 Table 3.2).
1 Report of the Study on Impact of Development Programmes on Quality of Life Kerala Statistical Institute, Thiruvananthapuram,
December, 19992 International Institute of Population Sciences, The National Family Health Survey (NFHS-2), Kerala, 1998-99.3 SAKHI, Resource Centre for Women, Kerala, Status of Women in Kerala.
(13)
● In the three decades since 1971 crude death rates as well as infant, neonatal, postnatal and
peri natal mortality rates (Appendix 1 Table 3.3) registered steep decline. This is due to substantial
improvement in health care.
● Generally, mortality rates are higher in the rural areas compared to the urban areas.
● Female rural infant mortality in Kerala is higher than rural male infant mortality but lower than
both urban male and female infant mortalities (1997).4
● The lower child mortality rate in the rural areas is significant.
● �The child mortality rate at 3 deaths at age 1-4 years per 1000 children reaching age 1 has
almost halved from its level in NFHS-1 of 8 deaths per 1000. Each of the infant and child
mortality rates in Kerala is not only the lowest by far among all of the Indian States, but each
of them is also a fraction of the corresponding rates for the country as a whole.�5
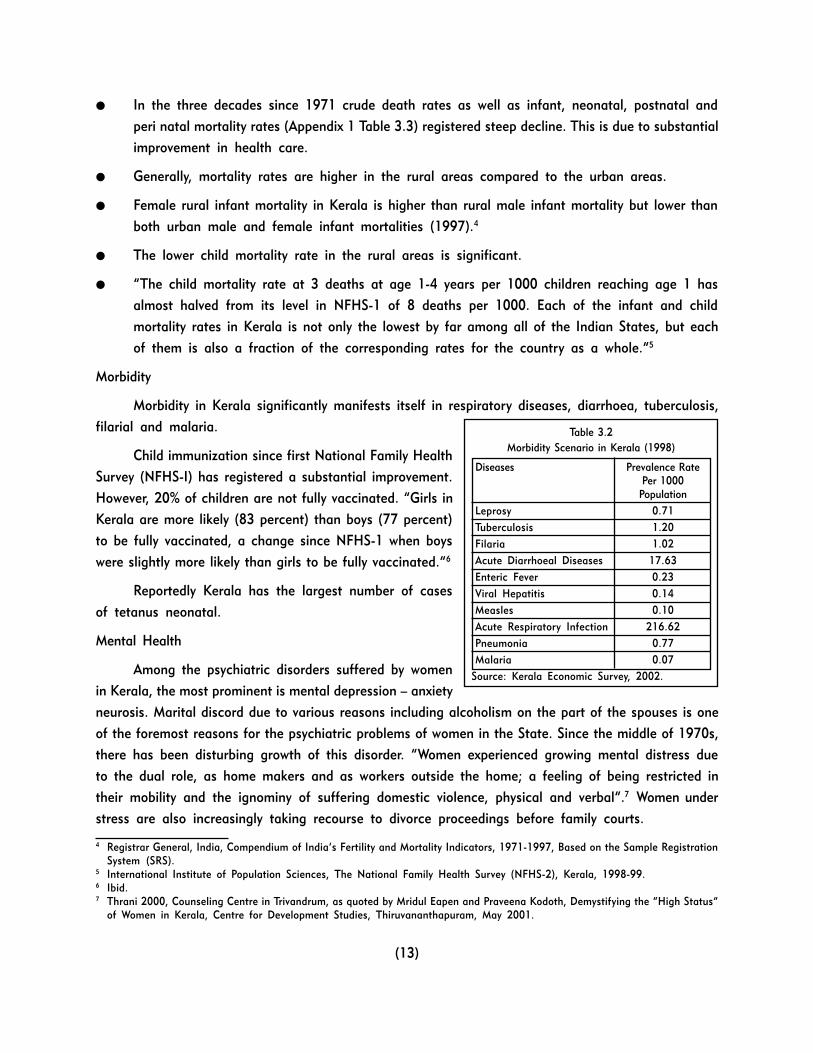
Morbidity
Morbidity in Kerala significantly manifests itself in respiratory diseases, diarrhoea, tuberculosis,
filarial and malaria.
Child immunization since first National Family Health
Survey (NFHS-I) has registered a substantial improvement.
However, 20% of children are not fully vaccinated. �Girls in
Kerala are more likely (83 percent) than boys (77 percent)
to be fully vaccinated, a change since NFHS-1 when boys
were slightly more likely than girls to be fully vaccinated.�6
Reportedly Kerala has the largest number of cases
of tetanus neonatal.
Mental Health
Among the psychiatric disorders suffered by women
in Kerala, the most prominent is mental depression � anxiety
neurosis. Marital discord due to various reasons including alcoholism on the part of the spouses is one
of the foremost reasons for the psychiatric problems of women in the State. Since the middle of 1970s,
there has been disturbing growth of this disorder. �Women experienced growing mental distress due
to the dual role, as home makers and as workers outside the home; a feeling of being restricted in
their mobility and the ignominy of suffering domestic violence, physical and verbal�.7 Women under
stress are also increasingly taking recourse to divorce proceedings before family courts.
Table 3.2
Morbidity Scenario in Kerala (1998)
Diseases Prevalence Rate
Per 1000
Population
Leprosy 0.71
Tuberculosis 1.20
Filaria 1.02
Acute Diarrhoeal Diseases 17.63
Enteric Fever 0.23
Viral Hepatitis 0.14
Measles 0.10
Acute Respiratory Infection 216.62
Pneumonia 0.77
Malaria 0.07
Source: Kerala Economic Survey, 2002.
4 Registrar General, India, Compendium of India�s Fertility and Mortality Indicators, 1971-1997, Based on the Sample RegistrationSystem (SRS).
5 International Institute of Population Sciences, The National Family Health Survey (NFHS-2), Kerala, 1998-99.6 Ibid.7 Thrani 2000, Counseling Centre in Trivandrum, as quoted by Mridul Eapen and Praveena Kodoth, Demystifying the �High Status�
of Women in Kerala, Centre for Development Studies, Thiruvananthapuram, May 2001.

(14)
Saturday Syndrome
For a large number of Gulf wives, mainly young ones, Saturday is the day when the Gulf wives complain of mental
distress and come for psychologist�s help. This is because their husbands mostly make the occasional phone calls home on
Friday evening (as the long-distance calls cost less on Friday in many Gulf countries). After their husbands� speaking with
them or the in-laws, the women become highly troubled and depressed and show symptoms of mental illness.
However, there seems to be a tendency among mental specialists and medical men to equate the mental problems of
the teenage wives with those of the Gulf wives.
The Gulf wives face the pains of two conditions: teenage marriage and the long separation from husbands. Since the
Gulf wives� problems (�Gulf syndrome�) get more attention, the problems of teenage marriage are hardly noticed. The fact
is that it is the teenage marriage that turns the Gulf syndrome into a complex one.
Also, while Gulf wives can afford, and have more access to, psychiatric help, the silent majority of mentally ill teenagers
in the poor village homes go unnoticed. A section of these suffering girls go to the faith healers who sometimes seem to offer
temporary relief.
Sadly, no community leader or Government agency has realized the extent of mental illness � like they have not realized
the extent and impact of teenage marriage in the district.
(Prof. Mohammed, Malappuram, Kerala)
Reproductive Health
Fertility
There has been spectacular decline in fertility rate in Kerala from the level of 4.2 over the last
three decades. As of 1998, it is 1.8 which amounts to crossing the replacement level of population
(Appendix 1 Table 3.4). However, in the age group of 15-19, the cumulative fertility rate in the State
is 7.4.8 In some places in Kerala, women
reach grandmotherhood at a rather young
age. �Higher than replacement level fertility
is found in Kerala only among the Muslim
population which has a fertility rate of 2.46
children per woman. Despite low levels of
overall fertility, urban rural differences still
persist in Kerala with rural women having
0.56 children more than urban women.
Fertility is much lower among scheduled caste
women than among other women.�9
Levels of education of women influence
fertility rates. According to NFHS-2 fertility
rates with reference to the illiterate
significantly declined among the literate (less
than middle school complete), middle school
complete and high school complete and above
in that order.
30-year-old grandmothers of Malabar
Among the Muslims, because of the practice of teenage marriage,young grandmothers continue to �take birth�. About two-thirds of theMuslim girls in Malappuram district are married off before the legalage of 18 and a large number of them conceive in the first year ofmarriage. In spite of all the changes taking place around them in thesocial, economic, educational and technological fields, teenage marriageand adolescent childbirth survive in the Muslim community.
Though young grandmothers existed in the past too, the newgeneration, unlike their earlier ones, undergo a lot of psychologicalstress and social strain. This is because of the drastic changes in thesocial environment, their (high school) education and the impact ofthe media. Added to these is the fact that many of these women areGulf wives, thus suffering from additional emotional problems. Thereis a wide gap between the young grandmothers� chronological ageand �social age�. Though they are and do feel young, these womenare socially programmed to act old. Like other 30-plus women, theyhave a lot of life in them, but are forced to mask it. This createsimmense psychological tension.
�They suffer from middle-age blues at the peak of their youth,�a psychologist in Malappuram district said, while admitting thatpsychologists were yet to probe the specific mothers. �They are trappedbetween youth and middle age,� he goes on. �In a sense, they areforced to feel �menopaused� in 10 or 15 years in advance.�
(By K.P.M. Basheer, The Hindu, Friday, March 9, 2001)
8 Registrar General, India, Sample Registration System, Statistical Report, 1998.9 International Institute of Population Sciences, The National Family Health Survey (NFHS-2), Kerala, 1998-99.
(15)
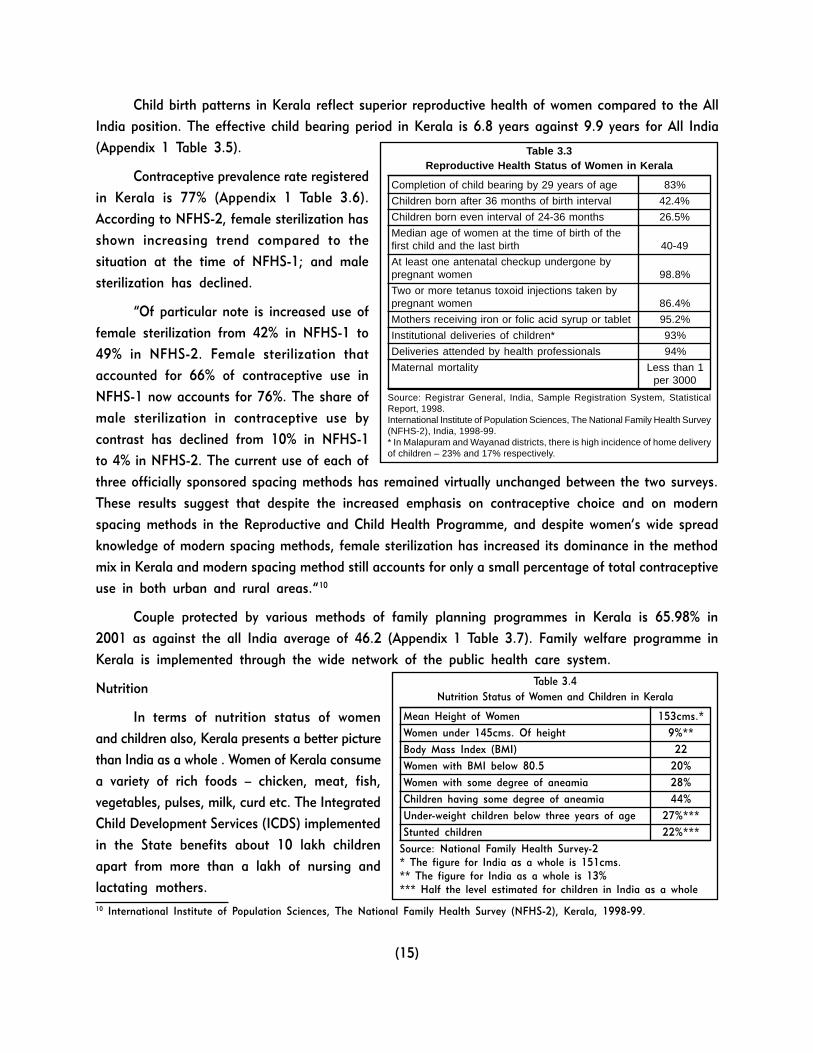
Child birth patterns in Kerala reflect superior reproductive health of women compared to the All
India position. The effective child bearing period in Kerala is 6.8 years against 9.9 years for All India
(Appendix 1 Table 3.5).
Contraceptive prevalence rate registered
in Kerala is 77% (Appendix 1 Table 3.6).
According to NFHS-2, female sterilization has
shown increasing trend compared to the
situation at the time of NFHS-1; and male
sterilization has declined.
�Of particular note is increased use of
female sterilization from 42% in NFHS-1 to
49% in NFHS-2. Female sterilization that
accounted for 66% of contraceptive use in
NFHS-1 now accounts for 76%. The share of
male sterilization in contraceptive use by
contrast has declined from 10% in NFHS-1
to 4% in NFHS-2. The current use of each of
three officially sponsored spacing methods has remained virtually unchanged between the two surveys.
These results suggest that despite the increased emphasis on contraceptive choice and on modern
spacing methods in the Reproductive and Child Health Programme, and despite women�s wide spread
knowledge of modern spacing methods, female sterilization has increased its dominance in the method
mix in Kerala and modern spacing method still accounts for only a small percentage of total contraceptive
use in both urban and rural areas.�10
Couple protected by various methods of family planning programmes in Kerala is 65.98% in
2001 as against the all India average of 46.2 (Appendix 1 Table 3.7). Family welfare programme in
Kerala is implemented through the wide network of the public health care system.
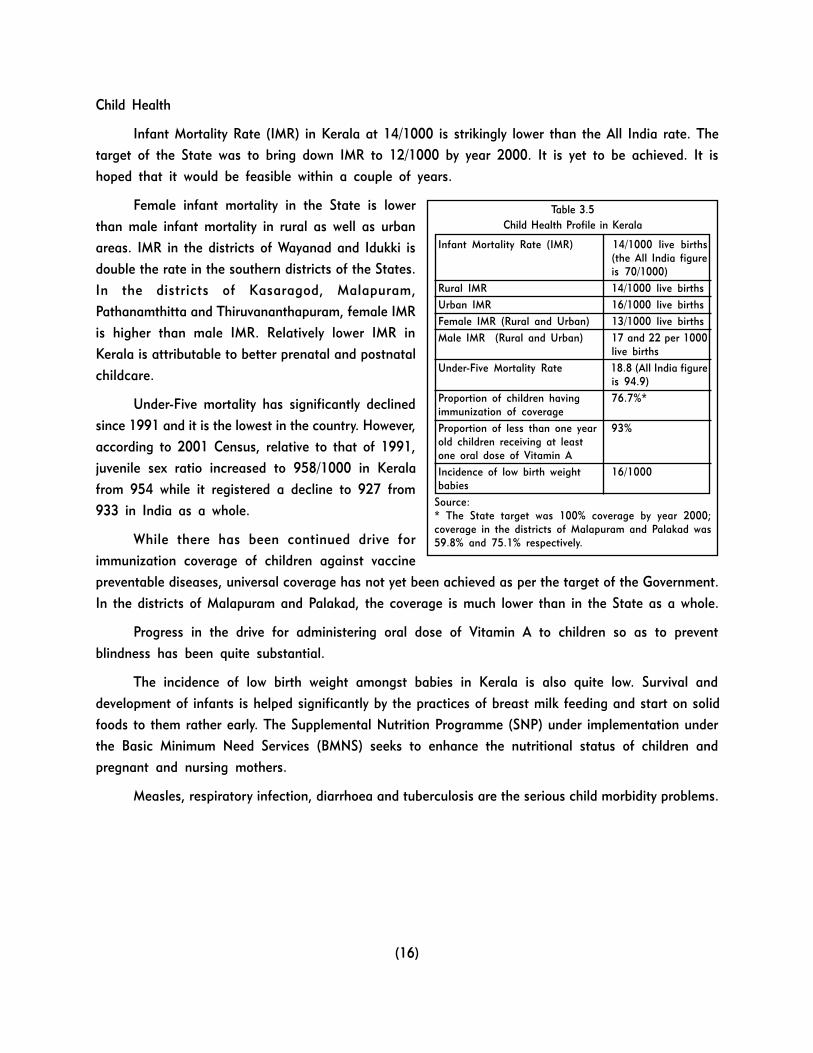
Nutrition
In terms of nutrition status of women
and children also, Kerala presents a better picture
than India as a whole . Women of Kerala consume
a variety of rich foods � chicken, meat, fish,
vegetables, pulses, milk, curd etc. The Integrated
Child Development Services (ICDS) implemented
in the State benefits about 10 lakh children
apart from more than a lakh of nursing and
lactating mothers.
Table 3.3Reproductive Health Status of Women in Kerala
Completion of child bearing by 29 years of age 83%
Children born after 36 months of birth interval 42.4%
Children born even interval of 24-36 months 26.5%
Median age of women at the time of birth of thefirst child and the last birth 40-49
At least one antenatal checkup undergone bypregnant women 98.8%
Two or more tetanus toxoid injections taken bypregnant women 86.4%
Mothers receiving iron or folic acid syrup or tablet 95.2%
Institutional deliveries of children* 93%
Deliveries attended by health professionals 94%
Maternal mortality Less than 1per 3000
Source: Registrar General, India, Sample Registration System, StatisticalReport, 1998.International Institute of Population Sciences, The National Family Health Survey(NFHS-2), India, 1998-99.* In Malapuram and Wayanad districts, there is high incidence of home deliveryof children – 23% and 17% respectively.
Table 3.4
Nutrition Status of Women and Children in Kerala
Mean Height of Women 153cms.*
Women under 145cms. Of height 9%**
Body Mass Index (BMI) 22
Women with BMI below 80.5 20%
Women with some degree of aneamia 28%
Children having some degree of aneamia 44%
Under-weight children below three years of age 27%***
Stunted children 22%***
Source: National Family Health Survey-2* The figure for India as a whole is 151cms.** The figure for India as a whole is 13%*** Half the level estimated for children in India as a whole
10 International Institute of Population Sciences, The National Family Health Survey (NFHS-2), Kerala, 1998-99.
(16)
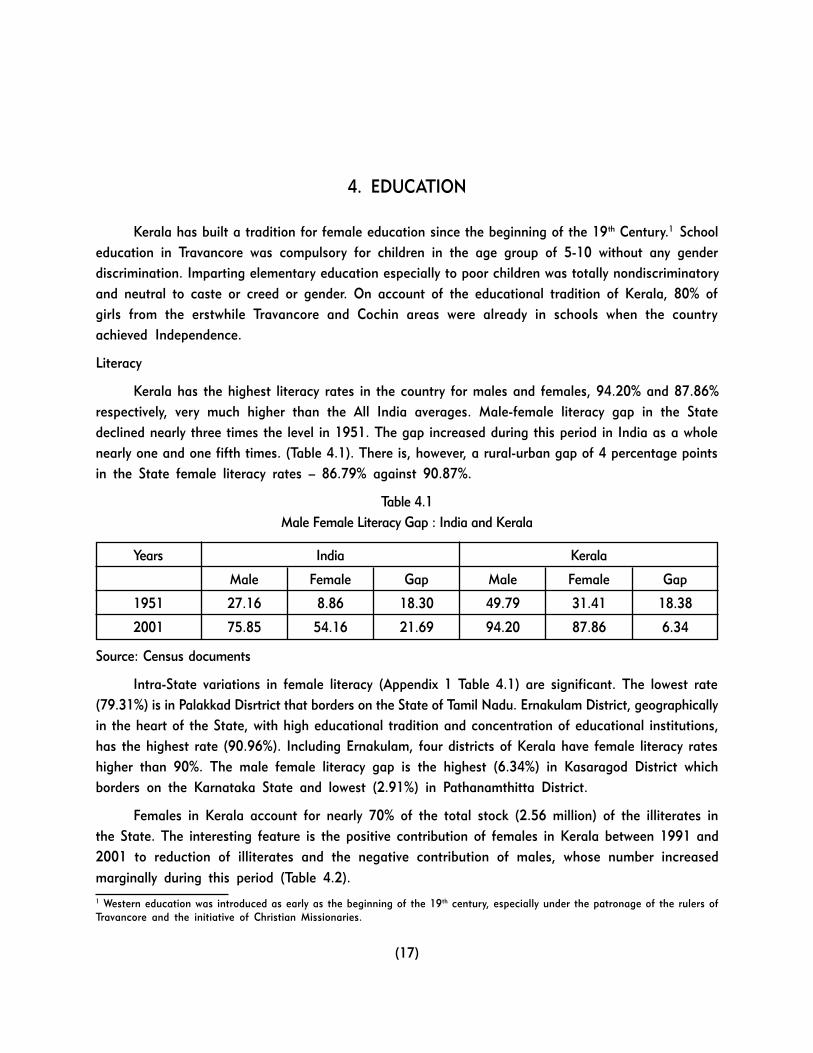
Child Health
Infant Mortality Rate (IMR) in Kerala at 14/1000 is strikingly lower than the All India rate. The
target of the State was to bring down IMR to 12/1000 by year 2000. It is yet to be achieved. It is
hoped that it would be feasible within a couple of years.
Female infant mortality in the State is lower
than male infant mortality in rural as well as urban
areas. IMR in the districts of Wayanad and Idukki is
double the rate in the southern districts of the States.
In the districts of Kasaragod, Malapuram,
Pathanamthitta and Thiruvananthapuram, female IMR
is higher than male IMR. Relatively lower IMR in
Kerala is attributable to better prenatal and postnatal
childcare.
Under-Five mortality has significantly declined
since 1991 and it is the lowest in the country. However,
according to 2001 Census, relative to that of 1991,
juvenile sex ratio increased to 958/1000 in Kerala
from 954 while it registered a decline to 927 from
933 in India as a whole.
While there has been continued drive for
immunization coverage of children against vaccine
preventable diseases, universal coverage has not yet been achieved as per the target of the Government.
In the districts of Malapuram and Palakad, the coverage is much lower than in the State as a whole.
Progress in the drive for administering oral dose of Vitamin A to children so as to prevent
blindness has been quite substantial.
The incidence of low birth weight amongst babies in Kerala is also quite low. Survival and
development of infants is helped significantly by the practices of breast milk feeding and start on solid
foods to them rather early. The Supplemental Nutrition Programme (SNP) under implementation under
the Basic Minimum Need Services (BMNS) seeks to enhance the nutritional status of children and
pregnant and nursing mothers.
Measles, respiratory infection, diarrhoea and tuberculosis are the serious child morbidity problems.
Table 3.5
Child Health Profile in Kerala
Infant Mortality Rate (IMR) 14/1000 live births(the All India figureis 70/1000)
Rural IMR 14/1000 live births
Urban IMR 16/1000 live births
Female IMR (Rural and Urban) 13/1000 live births
Male IMR (Rural and Urban) 17 and 22 per 1000live births
Under-Five Mortality Rate 18.8 (All India figureis 94.9)
Proportion of children having 76.7%*immunization of coverage
Proportion of less than one year 93%old children receiving at leastone oral dose of Vitamin A
Incidence of low birth weight 16/1000babies
Source:* The State target was 100% coverage by year 2000;coverage in the districts of Malapuram and Palakad was59.8% and 75.1% respectively.
(17)
4. EDUCATION
Kerala has built a tradition for female education since the beginning of the 19th Century.1 School
education in Travancore was compulsory for children in the age group of 5-10 without any gender
discrimination. Imparting elementary education especially to poor children was totally nondiscriminatory
and neutral to caste or creed or gender. On account of the educational tradition of Kerala, 80% of
girls from the erstwhile Travancore and Cochin areas were already in schools when the country
achieved Independence.
Literacy
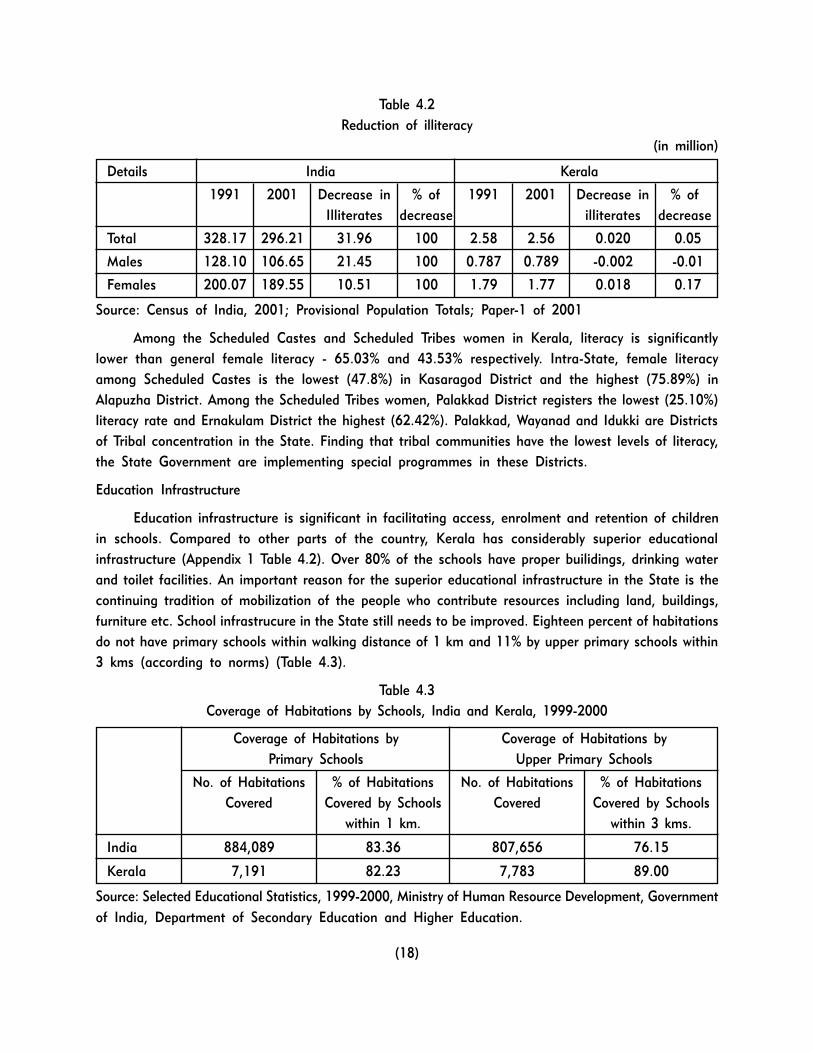
Kerala has the highest literacy rates in the country for males and females, 94.20% and 87.86%
respectively, very much higher than the All India averages. Male-female literacy gap in the State
declined nearly three times the level in 1951. The gap increased during this period in India as a whole
nearly one and one fifth times. (Table 4.1). There is, however, a rural-urban gap of 4 percentage points
in the State female literacy rates � 86.79% against 90.87%.
Table 4.1
Male Female Literacy Gap : India and Kerala
Years India Kerala
Male Female Gap Male Female Gap
1951 27.16 8.86 18.30 49.79 31.41 18.38
2001 75.85 54.16 21.69 94.20 87.86 6.34
Source: Census documents
Intra-State variations in female literacy (Appendix 1 Table 4.1) are significant. The lowest rate
(79.31%) is in Palakkad Disrtrict that borders on the State of Tamil Nadu. Ernakulam District, geographically
in the heart of the State, with high educational tradition and concentration of educational institutions,
has the highest rate (90.96%). Including Ernakulam, four districts of Kerala have female literacy rates
higher than 90%. The male female literacy gap is the highest (6.34%) in Kasaragod District which
borders on the Karnataka State and lowest (2.91%) in Pathanamthitta District.
Females in Kerala account for nearly 70% of the total stock (2.56 million) of the illiterates in
the State. The interesting feature is the positive contribution of females in Kerala between 1991 and
2001 to reduction of illiterates and the negative contribution of males, whose number increased
marginally during this period (Table 4.2).
1 Western education was introduced as early as the beginning of the 19th century, especially under the patronage of the rulers ofTravancore and the initiative of Christian Missionaries.
(18)
Table 4.2
Reduction of illiteracy
(in million)
Details India Kerala
1991 2001 Decrease in % of 1991 2001 Decrease in % of
Illiterates decrease illiterates decrease
Total 328.17 296.21 31.96 100 2.58 2.56 0.020 0.05
Males 128.10 106.65 21.45 100 0.787 0.789 -0.002 -0.01
Females 200.07 189.55 10.51 100 1.79 1.77 0.018 0.17
Source: Census of India, 2001; Provisional Population Totals; Paper-1 of 2001
Among the Scheduled Castes and Scheduled Tribes women in Kerala, literacy is significantly
lower than general female literacy - 65.03% and 43.53% respectively. Intra-State, female literacy
among Scheduled Castes is the lowest (47.8%) in Kasaragod District and the highest (75.89%) in
Alapuzha District. Among the Scheduled Tribes women, Palakkad District registers the lowest (25.10%)
literacy rate and Ernakulam District the highest (62.42%). Palakkad, Wayanad and Idukki are Districts
of Tribal concentration in the State. Finding that tribal communities have the lowest levels of literacy,
the State Government are implementing special programmes in these Districts.
Education Infrastructure
Education infrastructure is significant in facilitating access, enrolment and retention of children
in schools. Compared to other parts of the country, Kerala has considerably superior educational
infrastructure (Appendix 1 Table 4.2). Over 80% of the schools have proper builidings, drinking water
and toilet facilities. An important reason for the superior educational infrastructure in the State is the
continuing tradition of mobilization of the people who contribute resources including land, buildings,
furniture etc. School infrastrucure in the State still needs to be improved. Eighteen percent of habitations
do not have primary schools within walking distance of 1 km and 11% by upper primary schools within
3 kms (according to norms) (Table 4.3).
Table 4.3
Coverage of Habitations by Schools, India and Kerala, 1999-2000
Coverage of Habitations by Coverage of Habitations by
Primary Schools Upper Primary Schools
No. of Habitations % of Habitations No. of Habitations % of Habitations
Covered Covered by Schools Covered Covered by Schools
within 1 km. within 3 kms.
India 884,089 83.36 807,656 76.15
Kerala 7,191 82.23 7,783 89.00
Source: Selected Educational Statistics, 1999-2000, Ministry of Human Resource Development, Government
of India, Department of Secondary Education and Higher Education.
(19)
Enrolment, Drop out and Attendance Ratios
School enrolment in Kerala has been declining significantly since late 1970s owing to the sharp
decline in the rate of growth of population. In 2001-02, enrolment was down to 5.10 million from 5.91
million in 1992. During this period, enrolment at Lower Primary and Upper Primary Levels decreased
but High School enrolment (Secondary Level) increased marginally.2
There is no gender gap in school enrolment in Kerala as in other States.
● Girls constituted 49.10% of all students (2.58 million against a total of 5.25 million). At the
Lower Primary, Upper Primary and High School Levels, girls constituted 49.07%, 48.15% and
50.19% respectively of all students (Appendix 1 Table 4.3).3
● Primary and elementary level enrolments are substantially higher compared to All India ratios.
This reflects community practices, in Kerala, of sending children for initial enrolment (in classes
I to V) consistent with their school age. In other parts of the country, children outside the
relevant school age are also enrolled in addition to the school age children. This enhances the
Gross Enrolment Ratios.
● Higher enrolment ratios at the elementary level compared to All India signifies better school
attendance and retention in Kerala. This is also manifested in the overall negative drop-out rates
(1999-2000) for both boys and girls at the Primary and Elementary levels in Kerala. This
contrasts with the high drop-out phenomenon at the All India level (Appendix 1 Table 4.4).
● Net school attendance rates for both girls and boys in urban and rural areas in Kerala at primary
and upper primary levels are very high compared to All India (Appendix 1 Table 4.4).
● At the Higher Secondary level, there were 1254 schools in year 2002 with a student intake of
0.24 million. The proportion of girl students among the total students who passed in higher
secondary in 2002 constituted 58%.
● The vocational stream of Higher Secondary education was started in 1983-84. The infrastructure
for the stream in the State consists of 375 Vocational Higher Secondary schools offering a
diversity of subjects in multiple disciplines � 45 subjects in the 8 disciplines of engineering
technology, agriculture, animal husbandry, fisheries, paramedical, physical education, home science
and business and commerce. A significant feature in the performance of the school vocational
stream is that intake of girls exceeded that of boys.4
● Scheduled Castes and Scheduled Tribes enrolled in schools (year 2000) was 0.62 million, constituting
11.77% of total enrolment (Appendix 1 Table 4.5).
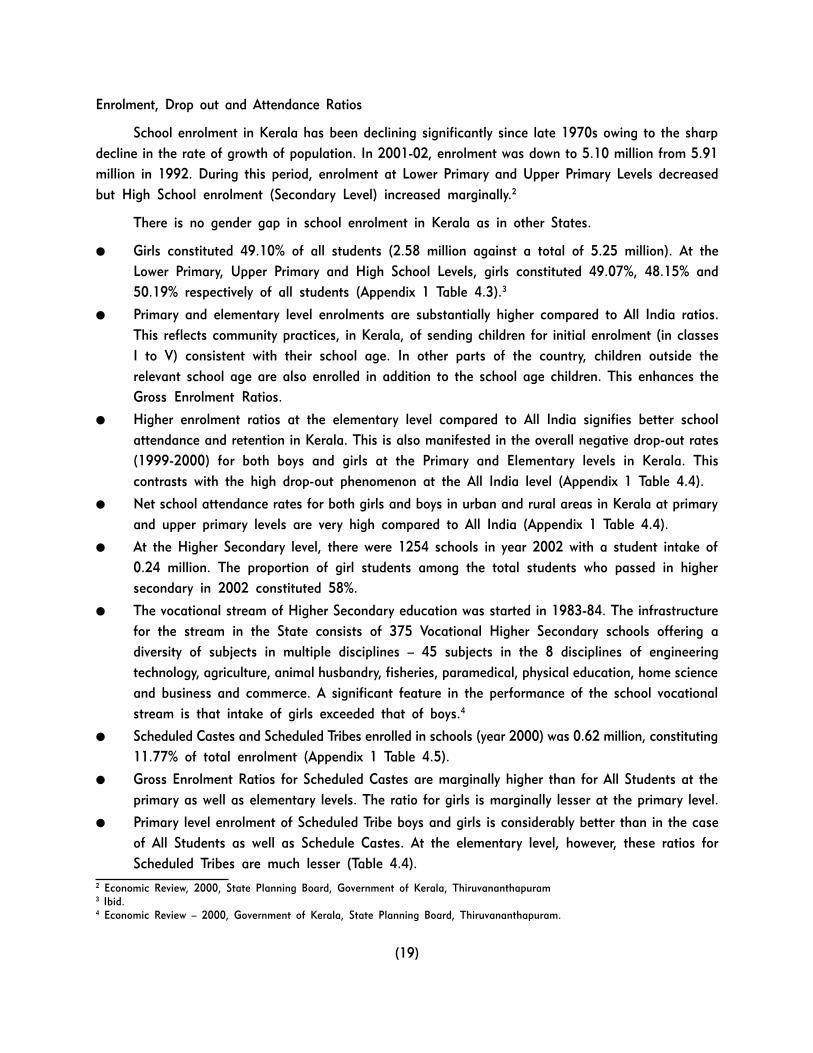
● Gross Enrolment Ratios for Scheduled Castes are marginally higher than for All Students at the
primary as well as elementary levels. The ratio for girls is marginally lesser at the primary level.
● Primary level enrolment of Scheduled Tribe boys and girls is considerably better than in the case
of All Students as well as Schedule Castes. At the elementary level, however, these ratios for
Scheduled Tribes are much lesser (Table 4.4).
2 Economic Review, 2000, State Planning Board, Government of Kerala, Thiruvananthapuram3 Ibid.4 Economic Review � 2000, Government of Kerala, State Planning Board, Thiruvananthapuram.
(20)
Table 4.4
Gross Enrolment Ratio of SC/ST Students at School Level, 2000
Primary Elementary
Boys Girls Boys Girls
All Students 85.80 84.74 97.78 93.36
Scheduled Castes 87.76 84.18 100.29 94.92
Scheduled Tribes 101.49 99.25 83.11 77.18
Source: Selected Educational Statistics, 1999-2000, Ministry of Human Resource Development, Government
of India, Department of Secondary Education and Higher Education.
Teacher-Pupil Ratio
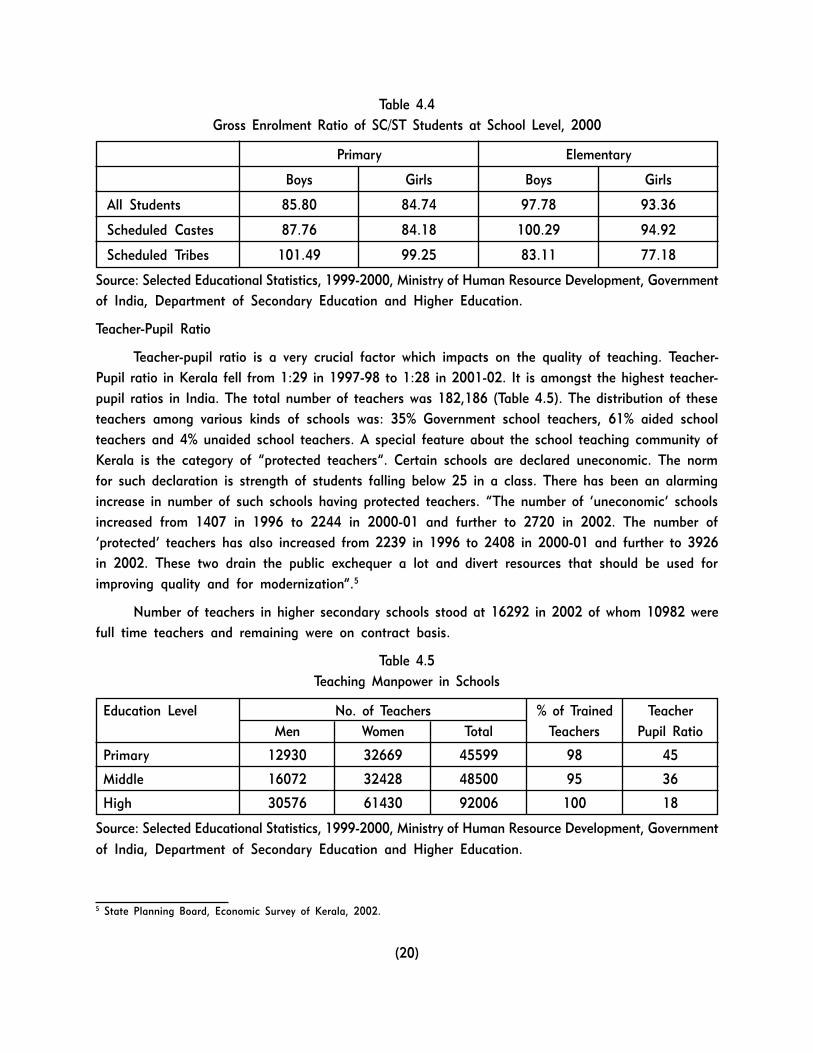
Teacher-pupil ratio is a very crucial factor which impacts on the quality of teaching. Teacher-
Pupil ratio in Kerala fell from 1:29 in 1997-98 to 1:28 in 2001-02. It is amongst the highest teacher-
pupil ratios in India. The total number of teachers was 182,186 (Table 4.5). The distribution of these
teachers among various kinds of schools was: 35% Government school teachers, 61% aided school
teachers and 4% unaided school teachers. A special feature about the school teaching community of
Kerala is the category of �protected teachers�. Certain schools are declared uneconomic. The norm
for such declaration is strength of students falling below 25 in a class. There has been an alarming
increase in number of such schools having protected teachers. �The number of �uneconomic� schools
increased from 1407 in 1996 to 2244 in 2000-01 and further to 2720 in 2002. The number of
�protected� teachers has also increased from 2239 in 1996 to 2408 in 2000-01 and further to 3926
in 2002. These two drain the public exchequer a lot and divert resources that should be used for
improving quality and for modernization�.5
Number of teachers in higher secondary schools stood at 16292 in 2002 of whom 10982 were
full time teachers and remaining were on contract basis.
Table 4.5
Teaching Manpower in Schools
Education Level No. of Teachers % of Trained Teacher
Men Women Total Teachers Pupil Ratio
Primary 12930 32669 45599 98 45
Middle 16072 32428 48500 95 36
High 30576 61430 92006 100 18
Source: Selected Educational Statistics, 1999-2000, Ministry of Human Resource Development, Government
of India, Department of Secondary Education and Higher Education.
5 State Planning Board, Economic Survey of Kerala, 2002.
(21)
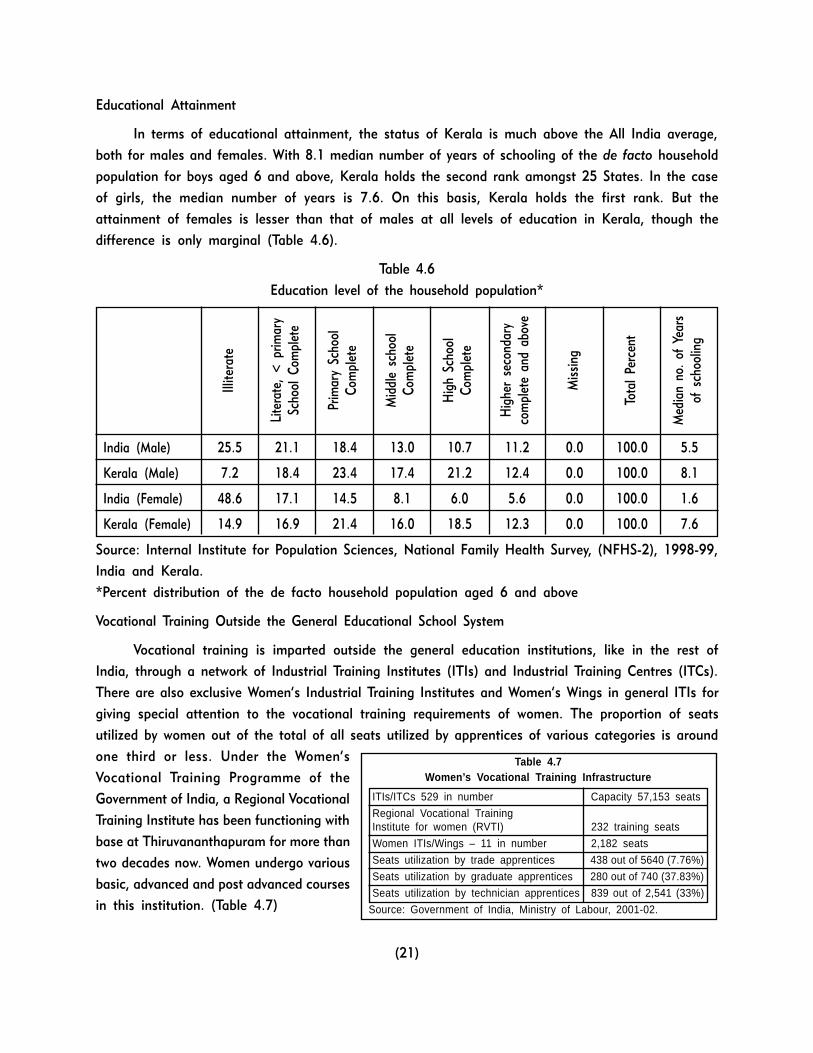
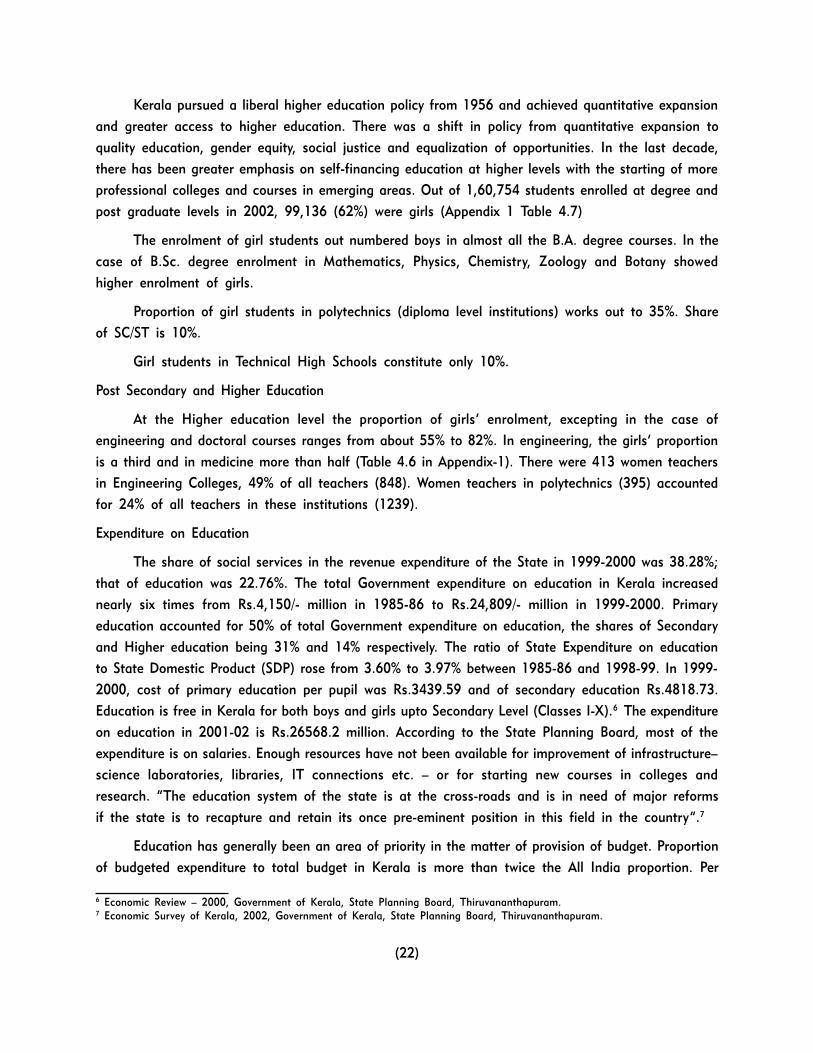
Educational Attainment
In terms of educational attainment, the status of Kerala is much above the All India average,
both for males and females. With 8.1 median number of years of schooling of the de facto household
population for boys aged 6 and above, Kerala holds the second rank amongst 25 States. In the case
of girls, the median number of years is 7.6. On this basis, Kerala holds the first rank. But the
attainment of females is lesser than that of males at all levels of education in Kerala, though the
difference is only marginal (Table 4.6).
Table 4.6
Education level of the household population*
India (Male) 25.5 21.1 18.4 13.0 10.7 11.2 0.0 100.0 5.5
Kerala (Male) 7.2 18.4 23.4 17.4 21.2 12.4 0.0 100.0 8.1
India (Female) 48.6 17.1 14.5 8.1 6.0 5.6 0.0 100.0 1.6
Kerala (Female) 14.9 16.9 21.4 16.0 18.5 12.3 0.0 100.0 7.6
Source: Internal Institute for Population Sciences, National Family Health Survey, (NFHS-2), 1998-99,
India and Kerala.
*Percent distribution of the de facto household population aged 6 and above
Vocational Training Outside the General Educational School System
Vocational training is imparted outside the general education institutions, like in the rest of
India, through a network of Industrial Training Institutes (ITIs) and Industrial Training Centres (ITCs).
There are also exclusive Women�s Industrial Training Institutes and Women�s Wings in general ITIs for
giving special attention to the vocational training requirements of women. The proportion of seats
utilized by women out of the total of all seats utilized by apprentices of various categories is around
one third or less. Under the Women�s
Vocational Training Programme of the
Government of India, a Regional Vocational
Training Institute has been functioning with
base at Thiruvananthapuram for more than
two decades now. Women undergo various
basic, advanced and post advanced courses
in this institution. (Table 4.7)
Illit
erat
e
Lite
rate
, <
pri
mar
y
Scho
ol C
ompl
ete
Prim
ary
Scho
ol
Com
plet
e
Mid
dle
scho
ol
Com
plet
e
Hig
h Sc
hool
Com
plet
e
Hig
her
seco
ndar
y
com
plet
e an
d ab
ove
Mis
sing
Tota
l Pe
rcen
t
Med
ian
no.
of Y
ears
of s
choo
ling
Table 4.7Women’s Vocational Training Infrastructure
ITIs/ITCs 529 in number Capacity 57,153 seats
Regional Vocational TrainingInstitute for women (RVTI) 232 training seats
Women ITIs/Wings – 11 in number 2,182 seats
Seats utilization by trade apprentices 438 out of 5640 (7.76%)
Seats utilization by graduate apprentices 280 out of 740 (37.83%)
Seats utilization by technician apprentices 839 out of 2,541 (33%)
Source: Government of India, Ministry of Labour, 2001-02.
(22)
Kerala pursued a liberal higher education policy from 1956 and achieved quantitative expansion
and greater access to higher education. There was a shift in policy from quantitative expansion to
quality education, gender equity, social justice and equalization of opportunities. In the last decade,
there has been greater emphasis on self-financing education at higher levels with the starting of more
professional colleges and courses in emerging areas. Out of 1,60,754 students enrolled at degree and
post graduate levels in 2002, 99,136 (62%) were girls (Appendix 1 Table 4.7)
The enrolment of girl students out numbered boys in almost all the B.A. degree courses. In the
case of B.Sc. degree enrolment in Mathematics, Physics, Chemistry, Zoology and Botany showed
higher enrolment of girls.
Proportion of girl students in polytechnics (diploma level institutions) works out to 35%. Share
of SC/ST is 10%.
Girl students in Technical High Schools constitute only 10%.
Post Secondary and Higher Education
At the Higher education level the proportion of girls� enrolment, excepting in the case of
engineering and doctoral courses ranges from about 55% to 82%. In engineering, the girls� proportion
is a third and in medicine more than half (Table 4.6 in Appendix-1). There were 413 women teachers
in Engineering Colleges, 49% of all teachers (848). Women teachers in polytechnics (395) accounted
for 24% of all teachers in these institutions (1239).
Expenditure on Education
The share of social services in the revenue expenditure of the State in 1999-2000 was 38.28%;
that of education was 22.76%. The total Government expenditure on education in Kerala increased
nearly six times from Rs.4,150/- million in 1985-86 to Rs.24,809/- million in 1999-2000. Primary
education accounted for 50% of total Government expenditure on education, the shares of Secondary
and Higher education being 31% and 14% respectively. The ratio of State Expenditure on education
to State Domestic Product (SDP) rose from 3.60% to 3.97% between 1985-86 and 1998-99. In 1999-
2000, cost of primary education per pupil was Rs.3439.59 and of secondary education Rs.4818.73.
Education is free in Kerala for both boys and girls upto Secondary Level (Classes I-X).6 The expenditure
on education in 2001-02 is Rs.26568.2 million. According to the State Planning Board, most of the
expenditure is on salaries. Enough resources have not been available for improvement of infrastructure�
science laboratories, libraries, IT connections etc. � or for starting new courses in colleges and
research. �The education system of the state is at the cross-roads and is in need of major reforms
if the state is to recapture and retain its once pre-eminent position in this field in the country�.7
Education has generally been an area of priority in the matter of provision of budget. Proportion
of budgeted expenditure to total budget in Kerala is more than twice the All India proportion. Per
6 Economic Review � 2000, Government of Kerala, State Planning Board, Thiruvananthapuram.7 Economic Survey of Kerala, 2002, Government of Kerala, State Planning Board, Thiruvananthapuram.
(23)
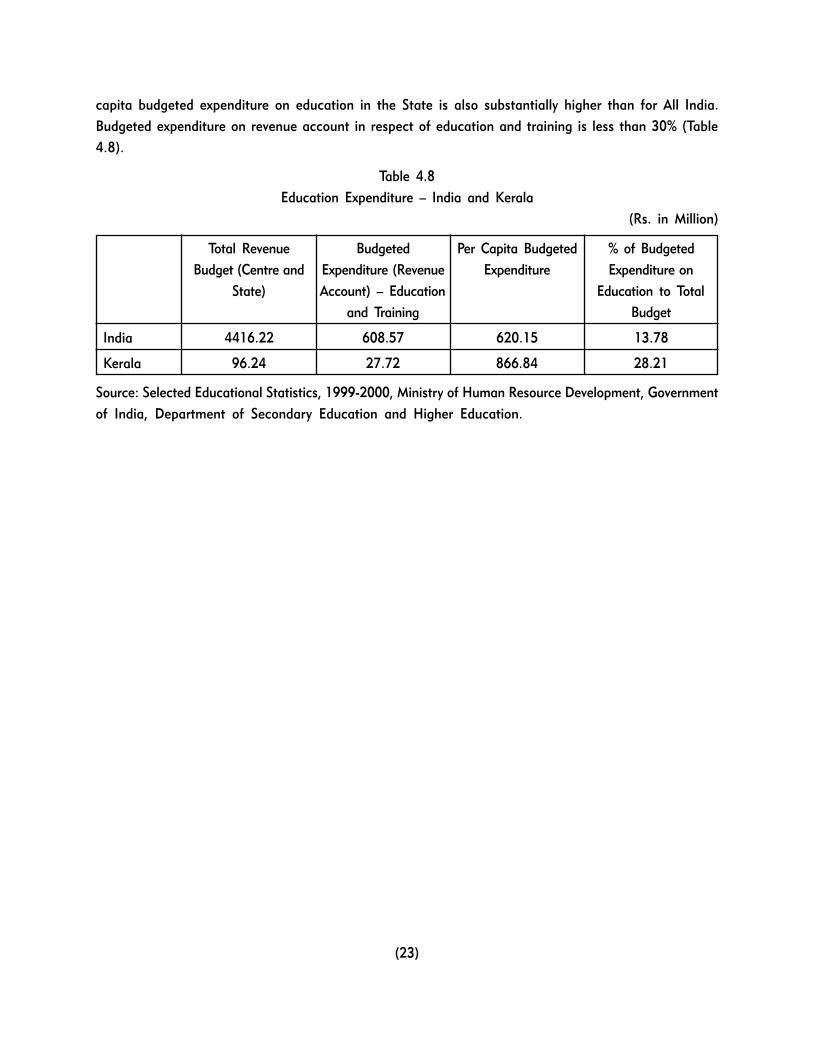
capita budgeted expenditure on education in the State is also substantially higher than for All India.
Budgeted expenditure on revenue account in respect of education and training is less than 30% (Table
4.8).
Table 4.8
Education Expenditure � India and Kerala
(Rs. in Million)
Total Revenue Budgeted Per Capita Budgeted % of Budgeted
Budget (Centre and Expenditure (Revenue Expenditure Expenditure on
State) Account) � Education Education to Total
and Training Budget
India 4416.22 608.57 620.15 13.78
Kerala 96.24 27.72 866.84 28.21
Source: Selected Educational Statistics, 1999-2000, Ministry of Human Resource Development, Government
of India, Department of Secondary Education and Higher Education.
(25)
5. EMPLOYMENT
Historical Perspective and Employment Profile of Women
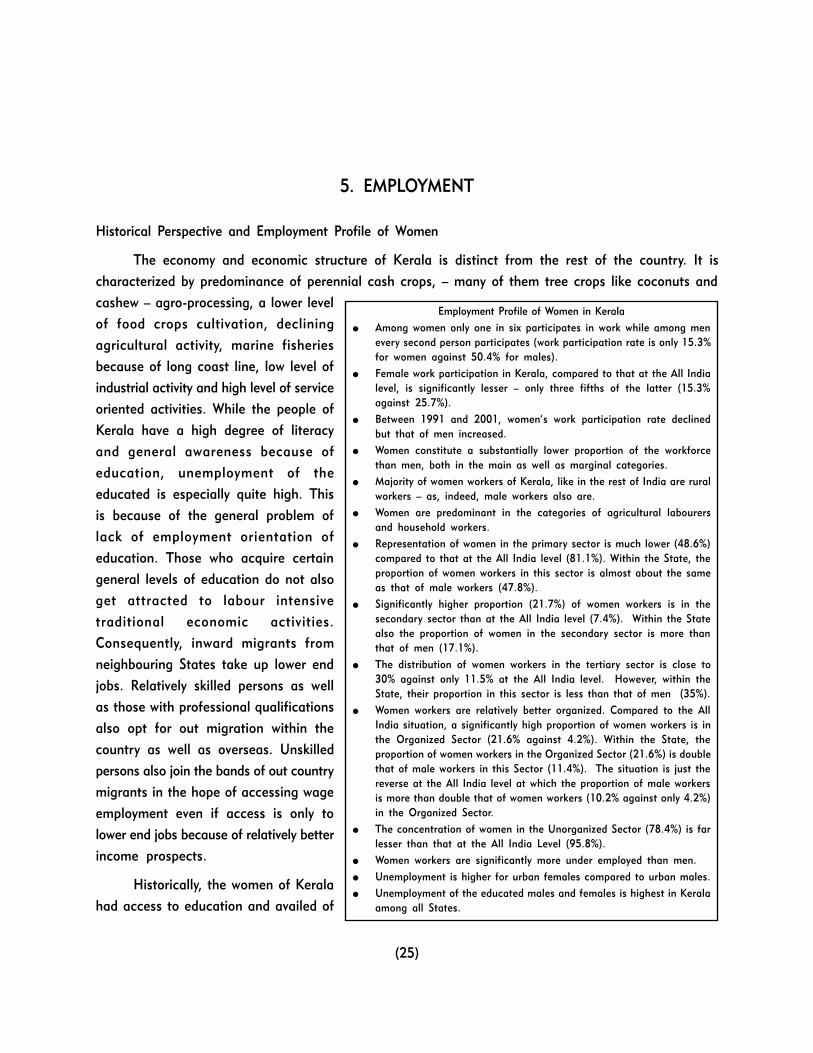
The economy and economic structure of Kerala is distinct from the rest of the country. It is
characterized by predominance of perennial cash crops, � many of them tree crops like coconuts and
cashew � agro-processing, a lower level
of food crops cultivation, declining
agricultural activity, marine fisheries
because of long coast line, low level of
industrial activity and high level of service
oriented activities. While the people of
Kerala have a high degree of literacy
and general awareness because of
education, unemployment of the
educated is especially quite high. This
is because of the general problem of
lack of employment orientation of
education. Those who acquire certain
general levels of education do not also
get attracted to labour intensive
traditional economic activities.
Consequently, inward migrants from
neighbouring States take up lower end
jobs. Relatively skilled persons as well
as those with professional qualifications
also opt for out migration within the
country as well as overseas. Unskilled
persons also join the bands of out country
migrants in the hope of accessing wage
employment even if access is only to
lower end jobs because of relatively better
income prospects.
Historically, the women of Kerala
had access to education and availed of
Employment Profile of Women in Kerala
● Among women only one in six participates in work while among menevery second person participates (work participation rate is only 15.3%for women against 50.4% for males).
● Female work participation in Kerala, compared to that at the All Indialevel, is significantly lesser � only three fifths of the latter (15.3%against 25.7%).
● Between 1991 and 2001, women�s work participation rate declinedbut that of men increased.
● Women constitute a substantially lower proportion of the workforcethan men, both in the main as well as marginal categories.
● Majority of women workers of Kerala, like in the rest of India are ruralworkers � as, indeed, male workers also are.
● Women are predominant in the categories of agricultural labourersand household workers.
● Representation of women in the primary sector is much lower (48.6%)compared to that at the All India level (81.1%). Within the State, theproportion of women workers in this sector is almost about the sameas that of male workers (47.8%).
● Significantly higher proportion (21.7%) of women workers is in thesecondary sector than at the All India level (7.4%). Within the Statealso the proportion of women in the secondary sector is more thanthat of men (17.1%).
● The distribution of women workers in the tertiary sector is close to30% against only 11.5% at the All India level. However, within theState, their proportion in this sector is less than that of men (35%).
● Women workers are relatively better organized. Compared to the AllIndia situation, a significantly high proportion of women workers is inthe Organized Sector (21.6% against 4.2%). Within the State, theproportion of women workers in the Organized Sector (21.6%) is doublethat of male workers in this Sector (11.4%). The situation is just thereverse at the All India level at which the proportion of male workersis more than double that of women workers (10.2% against only 4.2%)in the Organized Sector.
● The concentration of women in the Unorganized Sector (78.4%) is farlesser than that at the All India Level (95.8%).
● Women workers are significantly more under employed than men.
● Unemployment is higher for urban females compared to urban males.
● Unemployment of the educated males and females is highest in Keralaamong all States.
(26)
this access as much as men did. Education facilitated women�s access to employment as well even
from the early 20th century. Salaried employment of women had become quite common by the beginning
of the second quarter of the 20th century. Mary Poonen (1886-1976) was an early role model of
women�s development; she distinguished herself as an academic and doctor. One frequently came
across surviving women of the earlier generations who retired as heads of educational institutions,
functionaries in the medical profession and other public offices. Teaching and nursing have been
among the preferred vocations for Kerala women whether within the country or outside. Employment
of women in agriculture has not been as large a proportion as in the rest of India, due to the nature
of cropping in Kerala. The organization of labour intensive agro based traditional industries like coir,
cashew processing, plantations and spices (rubber, tea, coffee, cardamom etc.) attract significant
female labour. Indeed, women are considered as specially skilled in these industries.
Kerala is reputed to be a State of vibrant Trade Unionism. However, like elsewhere in the
country, women have not been significant in the Trade Unions.
Market conditions too have always tended to have impacts on conditions and quality of employment,
especially of women. Many of the commercial crops of Kerala are export oriented and adverse fluctuations
in the international prices of commodities often drive the employers to seek out economies in business,
and one area sought to be adjusted against price fluctuations is labour. In the process, implementation
of labour laws like the Minimum Wages Act, Payment of Wages Act, Equal Remuneration Act etc. gets
undermined.
The decline of female workers in the primary sector has been attributed to change in the
cropping pattern in Kerala � shift of substantial areas to perennial crops, coconut and rubber and
reduction in area under women intensive paddy cultivation. Employment of women in the secondary
sector is still significantly oriented towards traditional industries. Some of these industries like cashew
are also �seasonal� on account of problems of securing adequate raw materials for processing throughout
the year. Some of the industrial activities like shrimp processing etc. are also contracted out to be
undertaken on cottage basis � on the basis of what is referred to as �kudil vyavasayam�. While the
increase of women workers in the tertiary sector is seemingly impressive, the quality of employment
in this sector is not necessarily so, many jobs being peripheral and precarious. The comparative
Employment Profile of women in Kerala and India is represented in Appendix 1 Table 5.1.
Work Participation and Occupational Shifts
The analysis of women�s work participation and occupational shifts show the following trends:
● Decline in women�s work participation; (between 1981 and 2001, women�s work participation
rate declined but that of men increased.) (Appendix 1 Table 5.2).
● Decline in the proportion of women in the primary as well as secondary sectors in rural areas;
● Increase in urban areas in both primary and secondary sectors;
(27)
● Substantial decline of women workers in the category of agricultural labourers and increase in
the category of cultivators.
● Increase in the proportion of women workers in the tertiary sector in rural areas and decrease
in urban areas.
District level work participation rates show wide variations (Appendix 1 Table 5.3.)
The 55th round of National Sample Survey has also largely reflected the trends in occupational
shifts presented above. Many of the domestic activities carried out by women are indeed economic
activities. Examples are: processing of grains, poultry, kitchen gardening, household dairy related
activities etc. These activities do also have opportunity costs but are not reflected in the national
accounts.
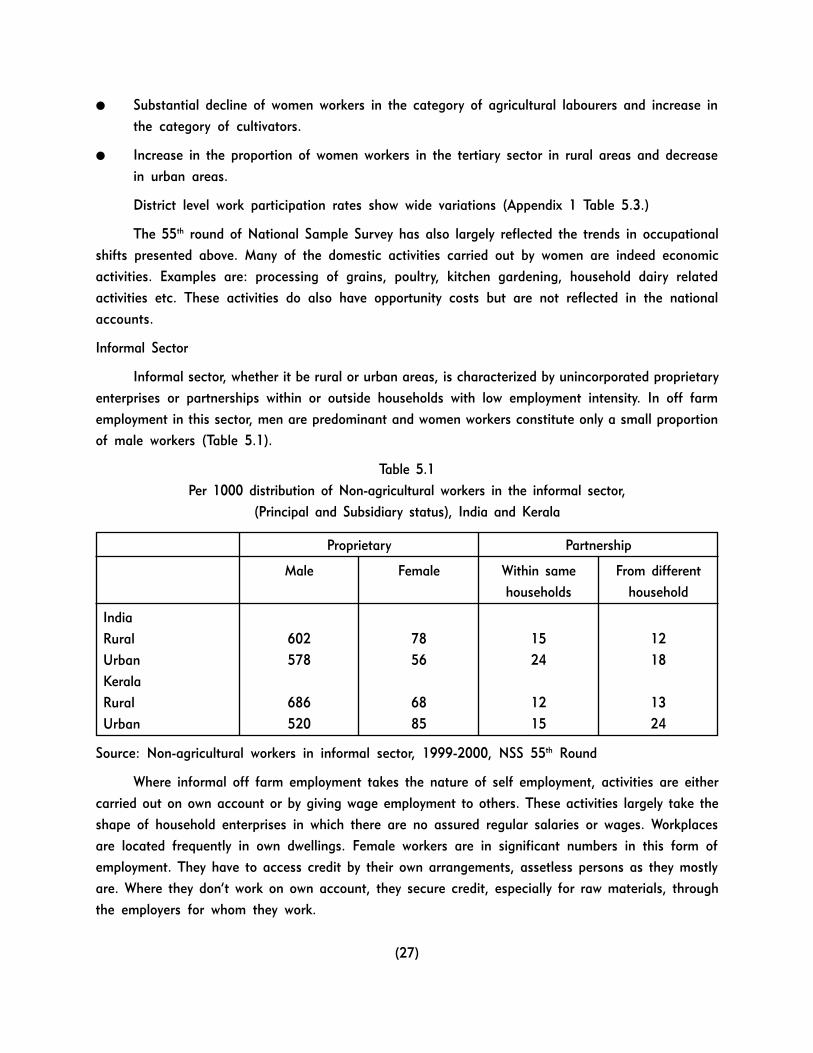
Informal Sector
Informal sector, whether it be rural or urban areas, is characterized by unincorporated proprietary
enterprises or partnerships within or outside households with low employment intensity. In off farm
employment in this sector, men are predominant and women workers constitute only a small proportion
of male workers (Table 5.1).
Table 5.1
Per 1000 distribution of Non-agricultural workers in the informal sector,
(Principal and Subsidiary status), India and Kerala
Proprietary Partnership
Male Female Within same From different
households household
India
Rural 602 78 15 12
Urban 578 56 24 18
Kerala
Rural 686 68 12 13
Urban 520 85 15 24
Source: Non-agricultural workers in informal sector, 1999-2000, NSS 55th Round
Where informal off farm employment takes the nature of self employment, activities are either
carried out on own account or by giving wage employment to others. These activities largely take the
shape of household enterprises in which there are no assured regular salaries or wages. Workplaces
are located frequently in own dwellings. Female workers are in significant numbers in this form of
employment. They have to access credit by their own arrangements, assetless persons as they mostly
are. Where they don�t work on own account, they secure credit, especially for raw materials, through
the employers for whom they work.
(28)
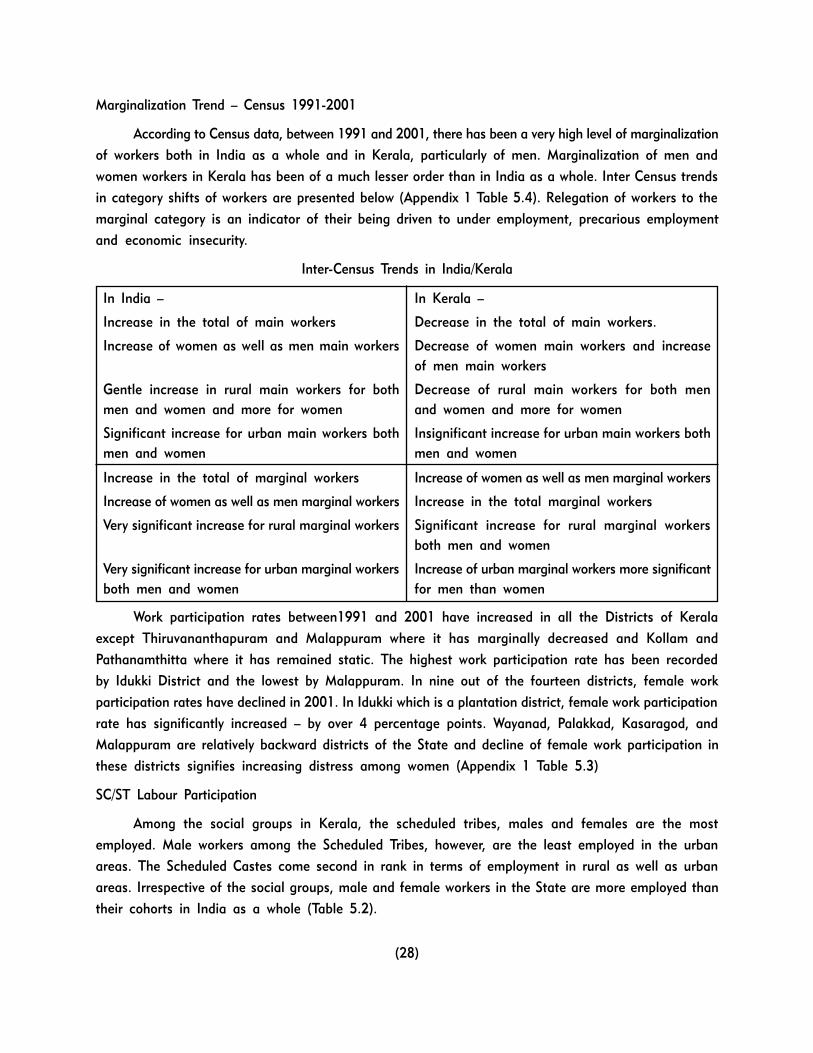
Marginalization Trend � Census 1991-2001
According to Census data, between 1991 and 2001, there has been a very high level of marginalization
of workers both in India as a whole and in Kerala, particularly of men. Marginalization of men and
women workers in Kerala has been of a much lesser order than in India as a whole. Inter Census trends
in category shifts of workers are presented below (Appendix 1 Table 5.4). Relegation of workers to the
marginal category is an indicator of their being driven to under employment, precarious employment
and economic insecurity.
Inter-Census Trends in India/Kerala
Work participation rates between1991 and 2001 have increased in all the Districts of Kerala
except Thiruvananthapuram and Malappuram where it has marginally decreased and Kollam and
Pathanamthitta where it has remained static. The highest work participation rate has been recorded
by Idukki District and the lowest by Malappuram. In nine out of the fourteen districts, female work
participation rates have declined in 2001. In Idukki which is a plantation district, female work participation
rate has significantly increased � by over 4 percentage points. Wayanad, Palakkad, Kasaragod, and
Malappuram are relatively backward districts of the State and decline of female work participation in
these districts signifies increasing distress among women (Appendix 1 Table 5.3)
SC/ST Labour Participation
Among the social groups in Kerala, the scheduled tribes, males and females are the most
employed. Male workers among the Scheduled Tribes, however, are the least employed in the urban
areas. The Scheduled Castes come second in rank in terms of employment in rural as well as urban
areas. Irrespective of the social groups, male and female workers in the State are more employed than
their cohorts in India as a whole (Table 5.2).
In India �
Increase in the total of main workers
Increase of women as well as men main workers
Gentle increase in rural main workers for both
men and women and more for women
Significant increase for urban main workers both
men and women
Increase in the total of marginal workers
Increase of women as well as men marginal workers
Very significant increase for rural marginal workers
Very significant increase for urban marginal workers
both men and women
In Kerala �
Decrease in the total of main workers.
Decrease of women main workers and increase
of men main workers
Decrease of rural main workers for both men
and women and more for women
Insignificant increase for urban main workers both
men and women
Increase of women as well as men marginal workers
Increase in the total marginal workers
Significant increase for rural marginal workers
both men and women
Increase of urban marginal workers more significant
for men than women
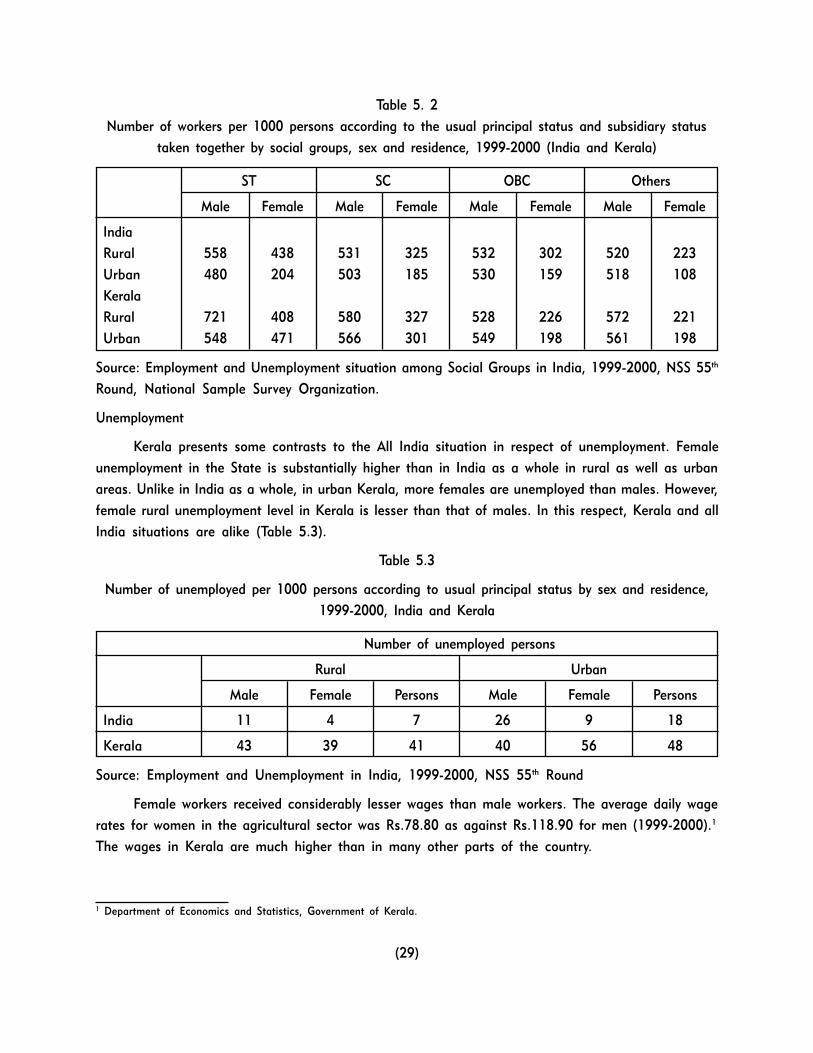
(29)
Table 5. 2
Number of workers per 1000 persons according to the usual principal status and subsidiary status
taken together by social groups, sex and residence, 1999-2000 (India and Kerala)
ST SC OBC Others
Male Female Male Female Male Female Male Female
India
Rural 558 438 531 325 532 302 520 223
Urban 480 204 503 185 530 159 518 108
Kerala
Rural 721 408 580 327 528 226 572 221
Urban 548 471 566 301 549 198 561 198
Source: Employment and Unemployment situation among Social Groups in India, 1999-2000, NSS 55th
Round, National Sample Survey Organization.
Unemployment
Kerala presents some contrasts to the All India situation in respect of unemployment. Female
unemployment in the State is substantially higher than in India as a whole in rural as well as urban
areas. Unlike in India as a whole, in urban Kerala, more females are unemployed than males. However,
female rural unemployment level in Kerala is lesser than that of males. In this respect, Kerala and all
India situations are alike (Table 5.3).
Table 5.3
Number of unemployed per 1000 persons according to usual principal status by sex and residence,
1999-2000, India and Kerala
Number of unemployed persons
Rural Urban
Male Female Persons Male Female Persons
India 11 4 7 26 9 18
Kerala 43 39 41 40 56 48
Source: Employment and Unemployment in India, 1999-2000, NSS 55th Round
Female workers received considerably lesser wages than male workers. The average daily wage
rates for women in the agricultural sector was Rs.78.80 as against Rs.118.90 for men (1999-2000).1
The wages in Kerala are much higher than in many other parts of the country.
1 Department of Economics and Statistics, Government of Kerala.
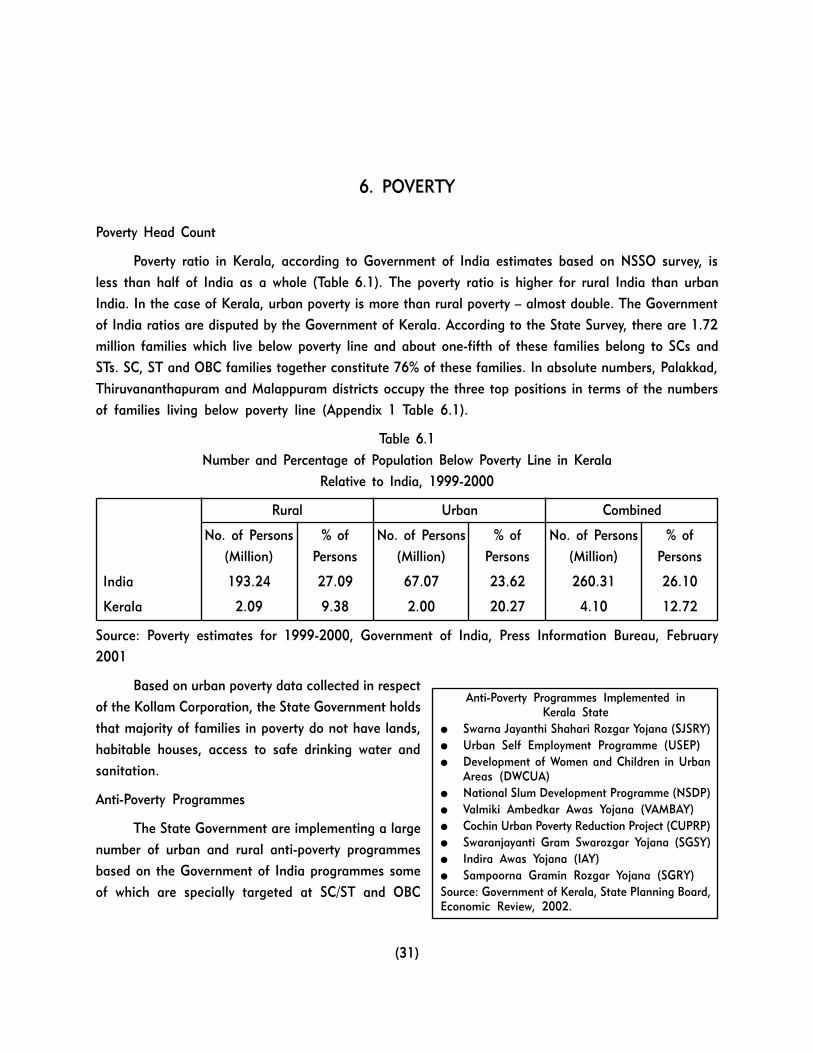
(31)
6. POVERTY
Poverty Head Count
Poverty ratio in Kerala, according to Government of India estimates based on NSSO survey, is
less than half of India as a whole (Table 6.1). The poverty ratio is higher for rural India than urban
India. In the case of Kerala, urban poverty is more than rural poverty � almost double. The Government
of India ratios are disputed by the Government of Kerala. According to the State Survey, there are 1.72
million families which live below poverty line and about one-fifth of these families belong to SCs and
STs. SC, ST and OBC families together constitute 76% of these families. In absolute numbers, Palakkad,
Thiruvananthapuram and Malappuram districts occupy the three top positions in terms of the numbers
of families living below poverty line (Appendix 1 Table 6.1).
Table 6.1
Number and Percentage of Population Below Poverty Line in Kerala
Relative to India, 1999-2000
Rural Urban Combined
No. of Persons % of No. of Persons % of No. of Persons % of
(Million) Persons (Million) Persons (Million) Persons
India 193.24 27.09 67.07 23.62 260.31 26.10
Kerala 2.09 9.38 2.00 20.27 4.10 12.72
Source: Poverty estimates for 1999-2000, Government of India, Press Information Bureau, February
2001
Based on urban poverty data collected in respect
of the Kollam Corporation, the State Government holds
that majority of families in poverty do not have lands,
habitable houses, access to safe drinking water and
sanitation.
Anti-Poverty Programmes
The State Government are implementing a large
number of urban and rural anti-poverty programmes
based on the Government of India programmes some
of which are specially targeted at SC/ST and OBC
Anti-Poverty Programmes Implemented inKerala State
● Swarna Jayanthi Shahari Rozgar Yojana (SJSRY)● Urban Self Employment Programme (USEP)● Development of Women and Children in Urban
Areas (DWCUA)● National Slum Development Programme (NSDP)● Valmiki Ambedkar Awas Yojana (VAMBAY)● Cochin Urban Poverty Reduction Project (CUPRP)● Swaranjayanti Gram Swarozgar Yojana (SGSY)● Indira Awas Yojana (IAY)● Sampoorna Gramin Rozgar Yojana (SGRY)Source: Government of Kerala, State Planning Board,Economic Review, 2002.

(32)
families as well as women. (This apart, the State Government is also implementing the special component
plan for SCs, Tribal Sub-Plan for tribals and State schemes for SCs/STs. SGSY and DWCUA are two
anti-poverty programmes respectively in the rural and urban areas with special emphasis on women�s
development.
Under the SGSY which is a credit cum subsidy scheme, group approach is followed, special
emphasis being on running of micro enterprises. It is ensured that 40% of the beneficiaries are women.
More than 4500 groups are being assisted under this programme.
Under DWCUA, urban poor women are helped in setting up gainful employment through group
activity. This scheme is distinguished by the special incentive extended to the poor women of urban
areas who decide to setup self-employment enterprise as a group as opposed to individual efforts.
Groups of urban poor women identify an economic activity suited to their skill, training, aptitude and
local condition. Besides generating income, the synergy of the group helps the women to empower
themselves for combating poverty. Minimum number for a group is fixed as 10. Ordinarily the project
cost is Rs.2.5 lakhs or below, but varies from project to project. The DWCUA group is given a subsidy
of 1.25 lakhs or 50% of the cost of the project which ever is less. To ensure the contribution of
members, 5% of the project cost is brought in as their share, either in cash or in kind or as both. The
banks normally sanction 95% of the project cost as loan amount. When the thrift of the poor population
reaches a sizeable limit, the Thrift and Credit Societies also sanction loan. As of end March, 2003,
over 1000 DWCUA Groups were in operation in the State.
Successive Governments in Kerala have introduced as many as 35 social security schemes and
over 3% of the state budget is spent on social security measures. Reduction of income insecurity has
been the primary objective of social security measures as over 87 per cent of the people are in the
informal sector of the economy and substantial number of them are women.
There are 48 welfare institutions in the state under the Social Welfare Department with a
sanctioned strength of over 5000. At present care and protection is provided only to about 2500
inmates. Through a network of 420 orphanages in the State, over 40,000 inmates are given care. Care
and protection under these institutions also is largely for the benefit of women.
Rehabilitation of the Disabled
Considerable work is being done in the State for the rehabilitation of the disabled. It is estimated
that there are 3,79,000 disabled in the State. The proportion of women among them is 43% (Table
6.2) The Economic and Social Commission for Asia and Pacific (ESCAP) at its 48th Session in 1992
declared the period 1993-2002 as the Decade of Disabled Persons in order to achieve the decade goal
of �Full participation and equality of people with disabilities. Consistent with the goals of ESCAP
Declaration, several intervention measures for the benefit of the disabled in the State are under
implementation.
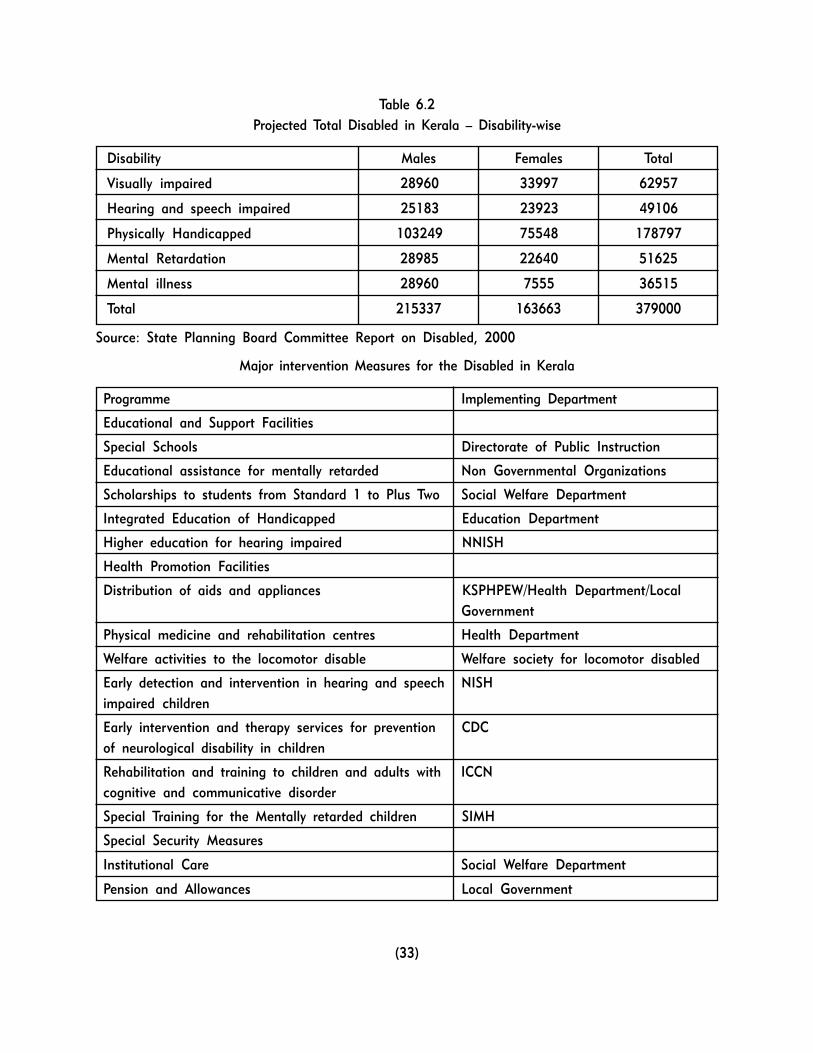
(33)
Table 6.2
Projected Total Disabled in Kerala � Disability-wise
Disability Males Females Total
Visually impaired 28960 33997 62957
Hearing and speech impaired 25183 23923 49106
Physically Handicapped 103249 75548 178797
Mental Retardation 28985 22640 51625
Mental illness 28960 7555 36515
Total 215337 163663 379000
Source: State Planning Board Committee Report on Disabled, 2000
Major intervention Measures for the Disabled in Kerala
Programme Implementing Department
Educational and Support Facilities
Special Schools Directorate of Public Instruction
Educational assistance for mentally retarded Non Governmental Organizations
Scholarships to students from Standard 1 to Plus Two Social Welfare Department
Integrated Education of Handicapped Education Department
Higher education for hearing impaired NNISH
Health Promotion Facilities
Distribution of aids and appliances KSPHPEW/Health Department/Local
Government
Physical medicine and rehabilitation centres Health Department
Welfare activities to the locomotor disable Welfare society for locomotor disabled
Early detection and intervention in hearing and speech NISH
impaired children
Early intervention and therapy services for prevention CDC
of neurological disability in children
Rehabilitation and training to children and adults with ICCN
cognitive and communicative disorder
Special Training for the Mentally retarded children SIMH
Special Security Measures
Institutional Care Social Welfare Department
Pension and Allowances Local Government
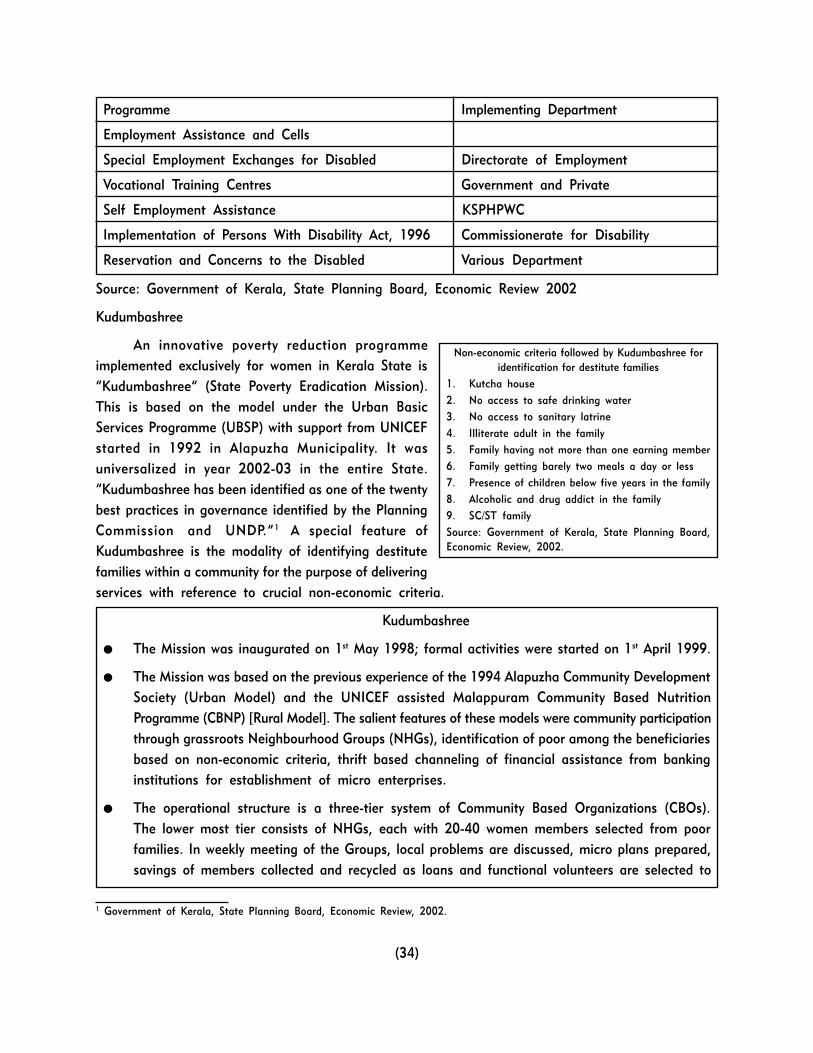
(34)
Programme Implementing Department
Employment Assistance and Cells
Special Employment Exchanges for Disabled Directorate of Employment
Vocational Training Centres Government and Private
Self Employment Assistance KSPHPWC
Implementation of Persons With Disability Act, 1996 Commissionerate for Disability
Reservation and Concerns to the Disabled Various Department
Source: Government of Kerala, State Planning Board, Economic Review 2002
Kudumbashree
An innovative poverty reduction programme
implemented exclusively for women in Kerala State is
�Kudumbashree� (State Poverty Eradication Mission).
This is based on the model under the Urban Basic
Services Programme (UBSP) with support from UNICEF
started in 1992 in Alapuzha Municipality. It was
universalized in year 2002-03 in the entire State.
�Kudumbashree has been identified as one of the twenty
best practices in governance identified by the Planning
Commission and UNDP.�1 A special feature of
Kudumbashree is the modality of identifying destitute
families within a community for the purpose of delivering
services with reference to crucial non-economic criteria.
Kudumbashree
● The Mission was inaugurated on 1st May 1998; formal activities were started on 1st April 1999.
● The Mission was based on the previous experience of the 1994 Alapuzha Community Development
Society (Urban Model) and the UNICEF assisted Malappuram Community Based Nutrition
Programme (CBNP) [Rural Model]. The salient features of these models were community participation
through grassroots Neighbourhood Groups (NHGs), identification of poor among the beneficiaries
based on non-economic criteria, thrift based channeling of financial assistance from banking
institutions for establishment of micro enterprises.
● The operational structure is a three-tier system of Community Based Organizations (CBOs).
The lower most tier consists of NHGs, each with 20-40 women members selected from poor
families. In weekly meeting of the Groups, local problems are discussed, micro plans prepared,
savings of members collected and recycled as loans and functional volunteers are selected to
1 Government of Kerala, State Planning Board, Economic Review, 2002.
Non-economic criteria followed by Kudumbashree for
identification for destitute families
1. Kutcha house
2. No access to safe drinking water
3. No access to sanitary latrine
4. Illiterate adult in the family
5. Family having not more than one earning member
6. Family getting barely two meals a day or less
7. Presence of children below five years in the family
8. Alcoholic and drug addict in the family
9. SC/ST family
Source: Government of Kerala, State Planning Board,Economic Review, 2002.

(35)
work in areas of community health, income generation and infrastructure. The next higher tier
consists of Area Development Societies (ADSs) at the Ward level for 8-10 NHGs. Activities are
determined by the representatives elected from the federating NHGs. Ward level Monitoring
and Advisory Committees are formed with the concerned Ward members as Chairpersons.
Priorities for action are decided in tune with the policy framework of the Local self-government
bodies. Mini Plans are prepared based on Group level Micro Plans. The third tier consists of
the Community Development Societies (CDSs) at the Panchayat/Municipal level. These Societies
are registered under the Societies Registration Act. At this tier also, Monitoring and Advisory
Committees are formed under the chairmanship of the concerned Panchayat Presidents/Municipal
Chairpersons. Based on the Micro Plans and Mini Plans prepared at the lower tiers, the CDS
Plans which are also the anti-poverty sub-plans of the local self-government are prepared.
Kudumbashree is recognized and accepted by the local self-governments as a further step in
the process of decentralization.
● The areas of concentration of the Kudumbashree are housing, safe drinking water, sanitation
and entrepreneurship development.
● In the management of thrift and credit, sustainability of loaning programmes is ensured through
linkage of loans with savings and promptitude in repayment of loans in weekly meetings of
NHGs. Operations are transparent and transaction costs are low. Without collateral securities,
loan repayments are ensured through peer pressure. So far nearly 14000 Micro Enterprises
have been established. As at the end of July 2001, credit of Rs.220 million had been advanced
against thrift of Rs.310 million. The turnover target set for Micro Enterprises for year 2001-
02 was Rs.735 million.
● A special feature of Kudumbashree has been that it has reached out to primitive tribal Groups�
the Koragas of Kasargod, Paniyas and Kattunayakans of Wayanad of Malappuram, Kadars of
Thrichur and Kurumbars of Attappadi in Palakkad districts of the State.
(Kudumbashree, Concept Organization and Activities, State Poverty Eradication Mission, Thiruvananthapuram)
Housing, Sanitation and Environment
Housing, access to safe drinking water, sanitation, and energy at the household level are basic
minimum needs for healthy living conditions and environment. Inadequacies in the satisfaction of these
needs are harsher on women than men because they are more tied down to domestic chores and
household responsibilities.
Housing sector has witnessed significant growth over the last three decades. This growth in
Kerala State is attributable to replacement of the joint family system by that of nuclear families, land
reforms under which kudikidappu rights (residential rights) were granted to resident labourers of pre-
reform times, inward remittances by in country and out country economic migrants, apart from
provision of house sites and targeted weaker section housing programmes. Despite the housing sector

(36)
growth, there are still considerable
shortages in the supply of housing
units. Millions still do live in semi
permanent or kutcha (crude) and
improvised structures. Quality of
construction of many of the dwelling
units leaves much to be desired, not
to speak of the lack of privacy for
women members of households.
Safe drinking water from
protected water supply sources are
not also accessible for millions in the
State. Nor do they have house tap
connections,
Though Kerala is in high rainfall
zone, water scarcity is frequent
because of failure of monsoons, often
successive and consequent fall in the
water table. In addition, residents in
coastal areas have the problem of
salinity intrusion in the well water. The
soil of Kerala is largely porous laterite
and water contamination due to sub
soil seepage also adversely affects
potability. There is high incidence of
water borne diseases; the State
Directorate of Health Services has
reported (2000) 0.6 million cases of
acute diarrhoea. Supply of adequate
protected water continues to be a
major concern both in rural and urban
areas, and an issue of development.2
A fairly significant proportion
of households are not equipped with
any toilet facility. Majority of the households having toilet facilities are fitted with pit toilets and flush
toilets are rather low in proportion.
Housing, Sanitation and Environment
Housing
Growth in housing stock in 30 years 2.8 million 5.5million
Shortage of dwelling units 50,000
Dwelling units requiring repair/reconstruction 800,000
Proportion of households living in pucca houses 80%Urban Areas 89%Rural Areas 77%
Proportion of households living in semi-pucca houses 13%Urban Areas 7%Rural Areas 16%
Proportion of households living in kutcha construction 7%Urban Areas 4%Rural Areas 8%
Protected Water Supply
Proportion of population having access to protectedwater supply
Urban Population 69%Rural Population 51%
Households connected with house taps 6.1 lakhs(10.47% of allhouseholds)
Energy
Proportion of households with access to variousenergy sources
Urban AreasLiquid Petroleum Gas (LPG) 30%Kerosene 5%Wood fuel 64%
Rural AreasLiquid Petroleum Gas (LPG) 11%Kerosene 2%Wood fuel 86%
Electric Supply
Proportion of households having electric supplyUrban Areas 88%Rural Areas 67%
Toilet
Proportion of households with toiletsUrban Areas
Flush toilets 26%Pit toilets 67%No facilitates 7%
Rural AreasFlush toilets 15%Pit toilets 67%No facilitates 17%
Source: International Institute for Population Sciences, NFHS-2, 1998-99, Kerala.
2 Economic Review 2000, Government of Kerala, State Planning Board, Thiruvananthapuram.
(37)
Considerable strides have been made in rural electrification but there are substantial shortfalls
in electricity supply at the household level though coverage in this respect is much greater in the State
compared to many others.
Domestic fuel consumption in the State is dominated by use of wood fuel though supply of
kerosene and liquid petroleum gas has generally increased. Wood fuel used in Kerala includes coconut
residues. Smoky domestic working environment common during wood fuel usage poses serious health
hazards for women. According to the Directorate of Health Services, in 1999-2000, the incidence of
Acute Respiratory Infection was in 5.6 million cases that included cases in which there were 1000
mortalities. Under the Integrated Rural Energy Programme (IREP) which is under implementation in 28
Rural Development Blocks, improved chulahs (fixed family chulahs, family portable chulahs and community
chulahs) are being installed.
In terms of all the parameters � housing, water supply, sanitation, energy use and supply of
electricity, living conditions, especially for women are still quite harsh. This is more so in the case of
rural areas.
Female Headed Households
The proportion of female headed households in Kerala has been increasing since 1961 and as
of 1999, the proportion was 22.1%, more than double the proportion in India as a whole which is
10.3%3 . Desertion, death, divorce, migration etc. are the basic reasons for households becoming
female-headed. Districts having relatively higher incidence of female-headed households are Kannur,
Palakkad, Kollam, Malapuram and Kozhikode.
Women�s Component Plan
A special feature in respect of investing on women�s development is the implementation of the
Women�s Component Plan since 1998. Kerala is, indeed, the only State in the country which implements
this Plan.
�In Kerala in addition to general development, gender specific schemes have been formulated
and implemented. In the 2001-02 budget there were as many as 30 schemes specifically drawn up and
implemented for women. Nearly 5 per cent of the plan outlay is spent on women specific schemes
including grant in aid allocation to Local Self Government Institutions (LSGIs).�4
3 Census of Kerala, 1961 and International Institute for Population Sciences, NFHS �2, Kerala.4 Government of Kerala, State Planning Board, Economic Review, 2002.
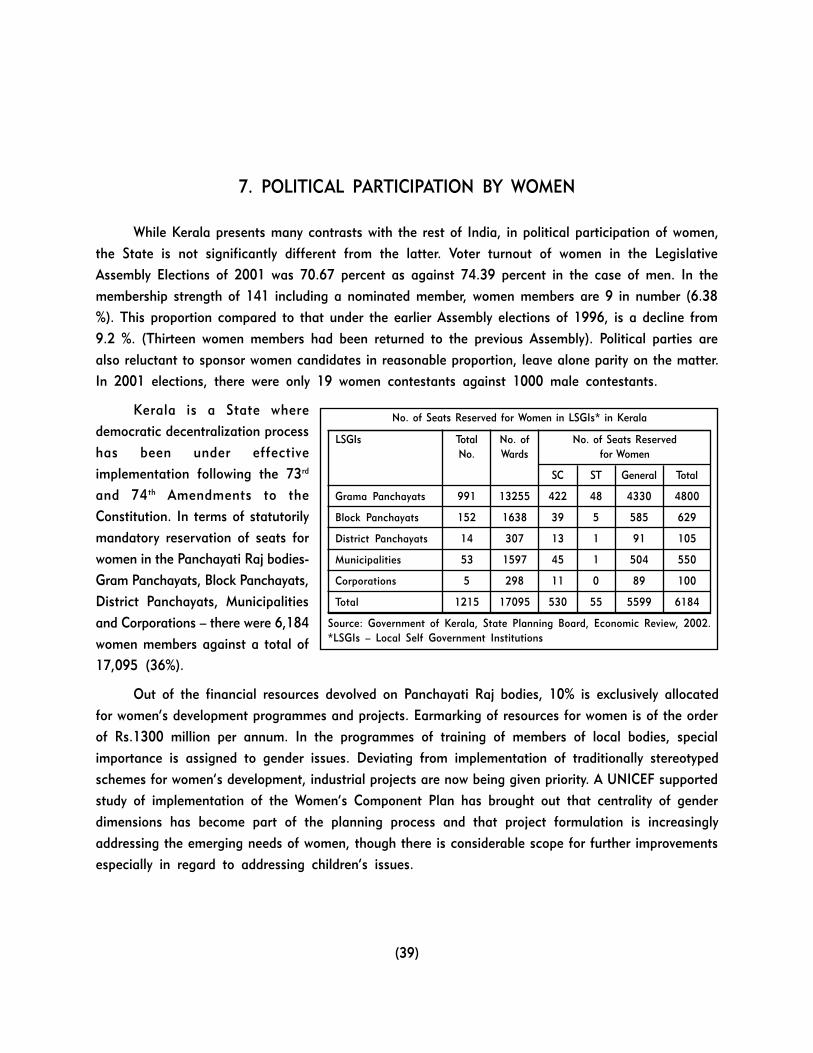
(39)
7. POLITICAL PARTICIPATION BY WOMEN
While Kerala presents many contrasts with the rest of India, in political participation of women,
the State is not significantly different from the latter. Voter turnout of women in the Legislative
Assembly Elections of 2001 was 70.67 percent as against 74.39 percent in the case of men. In the
membership strength of 141 including a nominated member, women members are 9 in number (6.38
%). This proportion compared to that under the earlier Assembly elections of 1996, is a decline from
9.2 %. (Thirteen women members had been returned to the previous Assembly). Political parties are
also reluctant to sponsor women candidates in reasonable proportion, leave alone parity on the matter.
In 2001 elections, there were only 19 women contestants against 1000 male contestants.
Kerala is a State where
democratic decentralization process
has been under effective
implementation following the 73rd
and 74th Amendments to the
Constitution. In terms of statutorily
mandatory reservation of seats for
women in the Panchayati Raj bodies-
Gram Panchayats, Block Panchayats,
District Panchayats, Municipalities
and Corporations � there were 6,184
women members against a total of
17,095 (36%).
Out of the financial resources devolved on Panchayati Raj bodies, 10% is exclusively allocated
for women�s development programmes and projects. Earmarking of resources for women is of the order
of Rs.1300 million per annum. In the programmes of training of members of local bodies, special
importance is assigned to gender issues. Deviating from implementation of traditionally stereotyped
schemes for women�s development, industrial projects are now being given priority. A UNICEF supported
study of implementation of the Women�s Component Plan has brought out that centrality of gender
dimensions has become part of the planning process and that project formulation is increasingly
addressing the emerging needs of women, though there is considerable scope for further improvements
especially in regard to addressing children�s issues.
No. of Seats Reserved for Women in LSGIs* in Kerala
LSGIs Total No. of No. of Seats Reserved
No. Wards for Women
SC ST General Total
Grama Panchayats 991 13255 422 48 4330 4800
Block Panchayats 152 1638 39 5 585 629
District Panchayats 14 307 13 1 91 105
Municipalities 53 1597 45 1 504 550
Corporations 5 298 11 0 89 100
Total 1215 17095 530 55 5599 6184
Source: Government of Kerala, State Planning Board, Economic Review, 2002.*LSGIs � Local Self Government Institutions
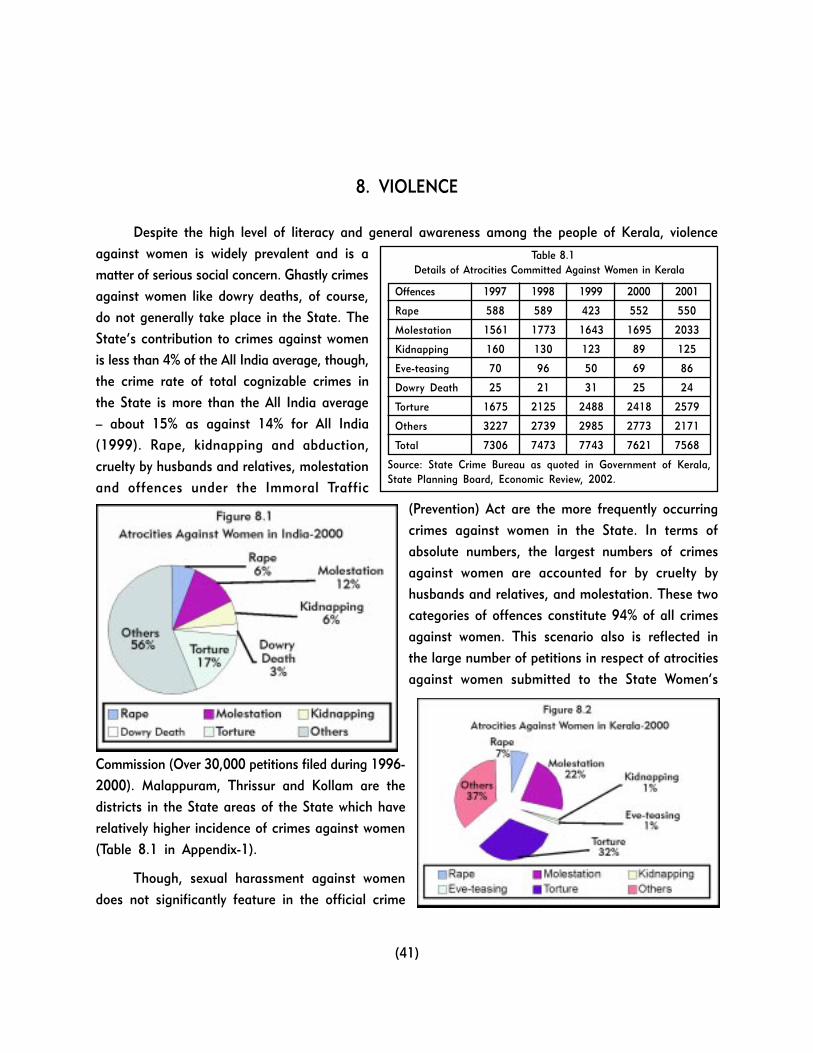
(41)
8. VIOLENCE
Despite the high level of literacy and general awareness among the people of Kerala, violence
against women is widely prevalent and is a
matter of serious social concern. Ghastly crimes
against women like dowry deaths, of course,
do not generally take place in the State. The
State�s contribution to crimes against women
is less than 4% of the All India average, though,
the crime rate of total cognizable crimes in
the State is more than the All India average
� about 15% as against 14% for All India
(1999). Rape, kidnapping and abduction,
cruelty by husbands and relatives, molestation
and offences under the Immoral Traffic
(Prevention) Act are the more frequently occurring
crimes against women in the State. In terms of
absolute numbers, the largest numbers of crimes
against women are accounted for by cruelty by
husbands and relatives, and molestation. These two
categories of offences constitute 94% of all crimes
against women. This scenario also is reflected in
the large number of petitions in respect of atrocities
against women submitted to the State Women�s
Commission (Over 30,000 petitions filed during 1996-
2000). Malappuram, Thrissur and Kollam are the
districts in the State areas of the State which have
relatively higher incidence of crimes against women
(Table 8.1 in Appendix-1).
Though, sexual harassment against women
does not significantly feature in the official crime
Table 8.1
Details of Atrocities Committed Against Women in Kerala
Offences 1997 1998 1999 2000 2001
Rape 588 589 423 552 550
Molestation 1561 1773 1643 1695 2033
Kidnapping 160 130 123 89 125
Eve-teasing 70 96 50 69 86
Dowry Death 25 21 31 25 24
Torture 1675 2125 2488 2418 2579
Others 3227 2739 2985 2773 2171
Total 7306 7473 7743 7621 7568
Source: State Crime Bureau as quoted in Government of Kerala,State Planning Board, Economic Review, 2002.
(42)
records, it does remain a problem in Kerala. This is reflected in the level of awareness about this
problem among women. According to SAKSHI, a Delhi based NGO, more than 90% of working women
in Kerala are aware of sexual harassment in the work place (the highest level of awareness among all
States). Complaints committees to address the problem of sexual harassment are in place in most of
the Government Departments as well as Public Sector Enterprises. A status note on the constitution/
functioning of these committees has been documented by the National Commission for Women based
on its dialogue with various agencies they had at Thiruvananthapuram in May 2003 (Appendix 4 �
Paper 4).
Kerala has one of the highest suicide rates in the country, 27 per lakh population (16 per lakh
for women and 39 per lakh for men) which is three times the national average. The incidence of
completed suicides is higher for men while attempted suicides are higher for females.1 During 2001,
there were 9572 suicide cases registered of which 2785 were those of women which constituted 29
percent.2
Domestic violence in Kerala is as rampant as in other parts of the country. �Three out of five
women accept at least one of six reasons as justification for a husband beating his wife. 10% of ever-
married women have experienced beating or physical mistreatment since age 15 and 4 percent experienced
such violence in the 12 months preceding the survey. Most of these women have been beaten or
physically mistreated by their husbands�.3
1 Mridul Eapen and Praveena Kodoth, Demystifying the high status of women in Kerala, Centre for Development Studies,Thiruvananthapuram, May 2001.
2 Government of Kerala, State Planning Board, Economic Review, 20023 NHFS-2, Kerala, 1998-99
(43)
9. WOMEN AND PROPERTY RIGHTS
The Hindu Succession Act of 1956 established the currently prevalent Hindu Personal Law. It
contained special provisions in respect of matrilineal communities among Hindus. So far as Kerala is
considered, marumakkathayam and aliyasanthana, were the customary matrilineal1 systems. Under the
special provisions of the Act, all prevailing differences in the rules of devolution customarily applicable
to matrilineal Kerala Hindus were eliminated. The children of pre-deceased sons and daughters were
brought on par in the matter of succession to property. (Earlier, lineal descendants of pre-deceased
daughters had been favoured). The special provisions of the Act also eliminated all prevailing differences
in different types of landed property � self-acquired, separated, and joint family property (taravad or
tavazhi). A person�s share in the joint family property was deemed to be that which it would have been
had the joint property been partitioned on a per capita basis among all members holding interest in
the taravad.
In 1976, the Kerala Joint Hindu Family System (Abolition) Act was enacted by the State Government.
It explicitly removed the vestiges of matrilineal joint estates. Under this law, all family members with
an interest in the Hindu undivided family estate were deemed as holding their shares separately as full
owners. In the devolution of property, preferences in favour of children of pre-deceased daughters were
eliminated. All surviving matrilineal joint family estates were deemed as partitioned on a per capita
basis. Further testamentary rights for all property were conferred on both men and women. Advantages
that sons had enjoyed over daughters in joint family property among patrilineal Hindus in Kerala were
also eliminated.
While the laws relating to inheritance among Hindus have been enacted with the intent to
terminate gender discrimination, there are views that the change at scenario has not necessarily been
an unqualified blessing for women �
�The effects on women of the changes in inheritance practices are mixed. On the one hand, it
can be argued that women have gained in that they now have individual rights in landed property over
which legally they have absolute control, while earlier control over management was essentially in male
hands through the Karanavan. However, class differentiation and poverty among the Nairs2 have
1 Inheritance of property was by matrilineal joint families which were known as taravads. They consisted of the matrilinealdescendants of a common ancestress � a set of sisters and brothers, their mother, sisters� children and sisters� daughters� children.The taravads had a common residence and enjoyed property collectively. The communities, which followed the matrilineal systems,were the Nair and Tiyyas and Mappila Muslims of some parts of Kerala. Namboodiri Brahmins also had joint family system. Theylived in groups in common residence, the Illoms. Descent of property among them was patrilineal.2 One of the communities of Kerala which followed the Marumakathayam system.
(44)
increased with the break-up of the taravads, and many Nair women whose economic needs would
previously have been taken care of by the joint family estate are today landless and poor.�3
�For the women of Kerala, the disappearance of matriliny and its replacement by patrilineal
monogamous households should have represented a retrogressive step�� Women did not realize then
what they were being asked to give up.�4
�Women now have individual rights over their share of Taravad property but this right has been
achieved within a legal framework of dependence on men as husbands. Men as husbands and fathers
have gained access to control over women in ways that they did not have earlier.�5
So far as the Christians of Kerala are concerned, they were covered by the Cochin Christian
Succession Act, 1921 and the Travancore Christian Succession Act, 1916 � in Cochin and Travancore
areas respectively. These Acts reflected a lot of gender inequalities. A widow or mother, for instance,
under the Travancore Act could only inherit life interest in land and other immovable property. Even
this was to be forfeited on remarriage. With the formation of the Travancore-Cochin State, the Indian
Succession Act of 1925 should have superseded the Travancore and Cochin laws. However, a 1956
court judgement had the effect of saving the Travancore and Cochin laws. In 1983, Mary Roy, a
Travancore Christian challenged the Constitutional validity of application of the old laws on grounds
of equality of sexes guaranteed under the Constitution. In 1986, the Supreme Court held that the 1925
law, the Indian Succession Act, was the law that could hold the ground. As a result of this judgement
of the Supreme Court, daughters can claim equality of right over fathers� property.
Though rights may be vested in women by law, social practices on ground may vary and may
not necessarily be in terms of exercise of legal rights. Even after lapse of 15 years after the enactment
of the Hindu Succession Act, it was found in studies that still �family land� and �individual land�
devolved differently following the old concepts of �joint family estate� and their indivisibility, �self-
acquired property� etc. �Recent research in Central Trivancore, by two doctoral students indicates that
although women�s property rights are still recognized, women usually inherit a house but are less likely
to get agricultural land.�6
The Supreme Court judgement in Mary Roy case was also not without protests from the Kerala
Christian community on several grounds. ���the protests against the Supreme Court ruling has been
supported by the Synod of Christian Churches which conducted a �pulpit campaign� and arranged legal
counsel to help draft wills to disinherit female heirs.�7
3 Bina Agarwal, A Field of One�s Own, Gender and Land Rights in South Asia, 1994.4 Gender Profile-Kerala, Leela Gulati and Ramalingam, Royal Netherlands Embassy, New Delhi, India.5 Mridul Eapen and Praveena Kodoth, Demystifying the �High Status� of Women in Kerala, Centre for Development Studies,
Thiruvananthapuram, 2001.6 Bina Agarwal, A Field of One�s Own, Gender and Land Rights in South Asia, 1994.7 Ibid.
(45)
It is the general experience that in most of the States in which land reforms have been introduced
by law, there is gender discrimination in respect of fixation of land ceilings (land ceilings are fixed in
relation to family units, usually of five members) � more specifically, in the definition of the term
�family�, in provision of additional allotments and in the wife being allowed to be counted as an
independent unit. Unlike in most of the States, gender discrimination has been avoided in application
of land ceiling provisions in Kerala. Wife is included in the definition of the term �family�. Unmarried
adult daughters are also counted as separate units like unmarried adult sons are.
The present day property inheritance practices at the societal level juxtaposed with legal entitlements
deserve to be studied specially in the perspective of the experience of actual exercise of rights.
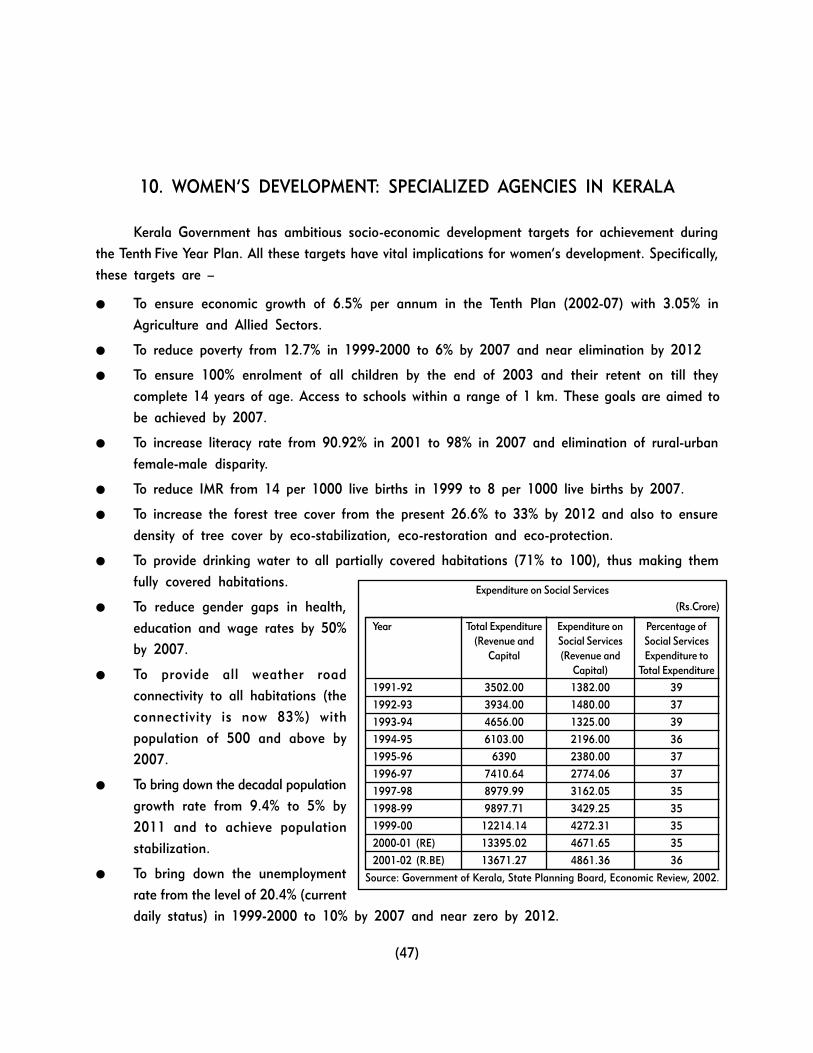
(47)
10. WOMEN�S DEVELOPMENT: SPECIALIZED AGENCIES IN KERALA
Kerala Government has ambitious socio-economic development targets for achievement during
the Tenth Five Year Plan. All these targets have vital implications for women�s development. Specifically,
these targets are �
● To ensure economic growth of 6.5% per annum in the Tenth Plan (2002-07) with 3.05% in
Agriculture and Allied Sectors.
● To reduce poverty from 12.7% in 1999-2000 to 6% by 2007 and near elimination by 2012
● To ensure 100% enrolment of all children by the end of 2003 and their retent on till they
complete 14 years of age. Access to schools within a range of 1 km. These goals are aimed to
be achieved by 2007.
● To increase literacy rate from 90.92% in 2001 to 98% in 2007 and elimination of rural-urban
female-male disparity.
● To reduce IMR from 14 per 1000 live births in 1999 to 8 per 1000 live births by 2007.
● To increase the forest tree cover from the present 26.6% to 33% by 2012 and also to ensure
density of tree cover by eco-stabilization, eco-restoration and eco-protection.
● To provide drinking water to all partially covered habitations (71% to 100), thus making them
fully covered habitations.
● To reduce gender gaps in health,
education and wage rates by 50%
by 2007.
● To provide all weather road
connectivity to all habitations (the
connectivity is now 83%) with
population of 500 and above by
2007.
● To bring down the decadal population
growth rate from 9.4% to 5% by
2011 and to achieve population
stabilization.
● To bring down the unemployment
rate from the level of 20.4% (current
daily status) in 1999-2000 to 10% by 2007 and near zero by 2012.
Expenditure on Social Services
(Rs.Crore)
Year Total Expenditure Expenditure on Percentage of
(Revenue and Social Services Social Services
Capital (Revenue and Expenditure to
Capital) Total Expenditure
1991-92 3502.00 1382.00 39
1992-93 3934.00 1480.00 37
1993-94 4656.00 1325.00 39
1994-95 6103.00 2196.00 36
1995-96 6390 2380.00 37
1996-97 7410.64 2774.06 37
1997-98 8979.99 3162.05 35
1998-99 9897.71 3429.25 35
1999-00 12214.14 4272.31 35
2000-01 (RE) 13395.02 4671.65 35
2001-02 (R.BE) 13671.27 4861.36 36
Source: Government of Kerala, State Planning Board, Economic Review, 2002.
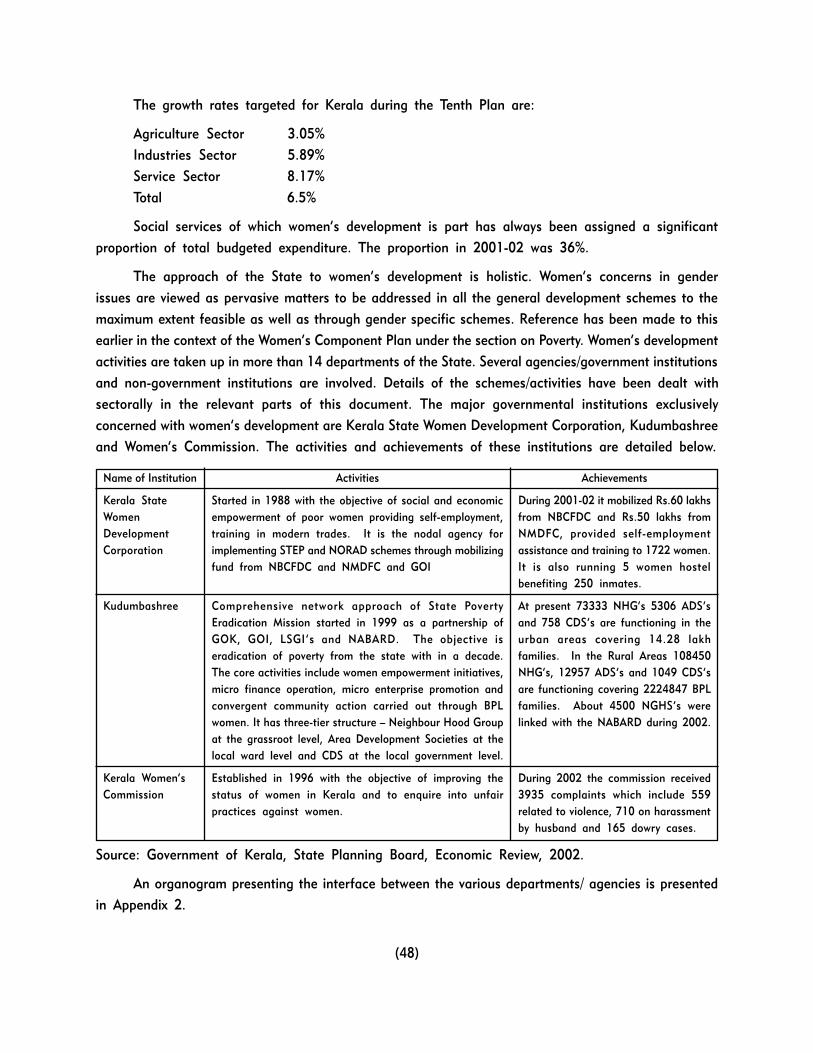
(48)
The growth rates targeted for Kerala during the Tenth Plan are:
Agriculture Sector 3.05%
Industries Sector 5.89%
Service Sector 8.17%
Total 6.5%
Social services of which women�s development is part has always been assigned a significant
proportion of total budgeted expenditure. The proportion in 2001-02 was 36%.
The approach of the State to women�s development is holistic. Women�s concerns in gender
issues are viewed as pervasive matters to be addressed in all the general development schemes to the
maximum extent feasible as well as through gender specific schemes. Reference has been made to this
earlier in the context of the Women�s Component Plan under the section on Poverty. Women�s development
activities are taken up in more than 14 departments of the State. Several agencies/government institutions
and non-government institutions are involved. Details of the schemes/activities have been dealt with
sectorally in the relevant parts of this document. The major governmental institutions exclusively
concerned with women�s development are Kerala State Women Development Corporation, Kudumbashree
and Women�s Commission. The activities and achievements of these institutions are detailed below.
Source: Government of Kerala, State Planning Board, Economic Review, 2002.
An organogram presenting the interface between the various departments/ agencies is presented
in Appendix 2.
Name of Institution
Kerala State
Women
Development
Corporation
Kudumbashree
Kerala Women�s
Commission
Activities
Started in 1988 with the objective of social and economic
empowerment of poor women providing self-employment,
training in modern trades. It is the nodal agency for
implementing STEP and NORAD schemes through mobilizing
fund from NBCFDC and NMDFC and GOI
Comprehensive network approach of State Poverty
Eradication Mission started in 1999 as a partnership of
GOK, GOI, LSGI�s and NABARD. The objective is
eradication of poverty from the state with in a decade.
The core activities include women empowerment initiatives,
micro finance operation, micro enterprise promotion and
convergent community action carried out through BPL
women. It has three-tier structure � Neighbour Hood Group
at the grassroot level, Area Development Societies at the
local ward level and CDS at the local government level.
Established in 1996 with the objective of improving the
status of women in Kerala and to enquire into unfair
practices against women.
Achievements
During 2001-02 it mobilized Rs.60 lakhs
from NBCFDC and Rs.50 lakhs from
NMDFC, provided self-employment
assistance and training to 1722 women.
It is also running 5 women hostel
benefiting 250 inmates.
At present 73333 NHG�s 5306 ADS�s
and 758 CDS�s are functioning in the
urban areas covering 14.28 lakh
families. In the Rural Areas 108450
NHG�s, 12957 ADS�s and 1049 CDS�s
are functioning covering 2224847 BPL
families. About 4500 NGHS�s were
linked with the NABARD during 2002.
During 2002 the commission received
3935 complaints which include 559
related to violence, 710 on harassment
by husband and 165 dowry cases.
(49)
11. PUBLIC HEARINGS AND DIALOGUES OF THE NATIONAL COMMISSION
FOR WOMEN WITH EXPERTS, NGOS AND GOVERNMENT OF KERALA
Meeting of the Expert Committee on Economic Empowerment of Women
The National Commission held a meeting of an Expert Committee on Economic Empowerment
of Women in April 2003 to identify the major issues that needed to be tackled. The issues that
emerged as affecting women were �
● Predominant relegation of women to agricultural labour and consequent vulnerability;
● Women�s predominance in informal/unorganized sector employment and precariousness and
insecurity arising out of it;
● Occupational segregation;
● Gender based disparities in earnings;
● Non-payment of minimum wages in accordance with the law;
● Denial of social security
● Low skill development;
● Opposition to acquiring non-traditional skills � example, masonry
● Negative impacts of liberalization of trade and globalization;
● Displacement owing to introduction of new technologies;
● Negative impacts of changing market conditions;
● Violence at workplace; and
● Lack of access to assets in the absence of property rights.
The major recommendations were to intensify the formation of Self Help Groups and their
linkage to markets, skills, credit and resources through a process of gender budgeting. Gist of the
discussions is presented in Appendix 3.
Public Hearings
Most of the above points discussed by the Expert Committee on Economic Empowerment of
Women came up during the public hearings in the various sectors in which women were working in
Kerala. (The NCW conducted public hearings in Kerala in September, 2001 and September, 2003. The
public hearing held in September, 2001 had workers from the plantation sector, special economic zone
and fish processing industry. The public hearing conducted in September, 2003 had domestic workers,
bamboo workers, agricultural workers and workers in the fish processing industry).
(50)
The major issues that emerged in the public hearings were the decline of employment opportunities
due to globalization and other market changes, closing down of plantation estates, lack of housing,
health, education and transport facilities to workers, lowering of wages, declining employment opportunities,
harassment at the workplace, inadequate social security measures in the special economic zone and
absence of it for domestic workers, poor working conditions, exploitation of domestic workers with low
wages and long hours of work, Influx of cheap labour for domestic work from neighbouring State,
increasing poverty etc. Apart from this, many of the participants referred to domestic violence due to
alcoholism. The reports of the public hearings are placed in Appendix 3.
Dialogue with NGOs
The NCW held a workshop at Thiruvananthapuram on 19th May, 2003 on Strategies for Economic
Empowerment. The Hon�ble Chief Minister who inaugurated the workshop said economic empowerment
could not be seen in isolation from political and social empowerment. Women suffered most when the
income of a family was hit. The government had attempted to enhance the process of women�s
empowerment through implementation of the various provisions for decentralization such as reservation
of positions for women. Kudumbashree programme had become a model for economic empowerment
of women. However, there continued to be other challenges such as dowry, sexual exploitation of
women etc. Attitudes and mindsets had to change for genuine empowerment to be achieved. The
Kudumbashree model and the interventions made by NABARD were presented at this meeting. The
Director, Centre for Development Studies referred to unemployment of the educated in Kerala as the
greatest concern. He also established a link between education and violence and stated that less
educated women were subjected to greater violence than the more educated women. The Member
Secretary of the Kerala State Planning Board explained the process of decentralization and women�s
empowerment in Kerala. (The summary report is placed in Appendix 4.).
This was followed by a workshop on the Status of Women in Kerala on 20th May, 2003. The
Minister for Industries and Social Welfare, Shri P.K. Kunhalikutty inaugurating the workshop said that
the real challenge for Kerala was to sustain the achievement already made for women�s empowerment
in the State. Other eminent speakers included Justice Sukumaran and Savithri Lakshmanan. This was
followed with a detailed discussion with the representatives of the NGOs. The summary report is
placed in Appendix 4.
Interaction with State Government Departments and Public Sector Enterprises
The Chairman, NCW held a meeting with all the departments and public sector enterprises of
the State and Central Government in Kerala to review the functioning of Complaints Committee in
Workplace on 20th May, 2003. The report of the review meeting is placed in Appendix 4.
The NCW visiting team held a detailed discussion with the Secretaries to the Government of
Kerala on 21st May, 2003. Minutes are placed at Appendix 4. The issues brought to their notice related
to �
(51)
● Gender Sensitization of Police;
● Inadequacies in the functioning of the Family Courts;
● Poor Implementation of Dowry Prohibition Act;
● The incidence of female foeticide;
● Impact of sex tourism on women and girls;
● Consultation of the Government with the State Women�s Commission;
● Condition of prisons;
● Inadequacy of rescue and short stay homes;
● Sexual harassment at workplace;
● Violation of the Minimum Wages Act;
● Decline of employment of women in agriculture;
● Child marriages;
● Unsatisfactory implementation of Women�s Component Plan at the Panchayats; and
● Welfare of the women belonging to SC/ST etc.
The Secretary, Social Welfare promised to coordinate action on all the points raised by the NCW.
(53)
12. CONCLUSION
The scenario in Kerala presents a paradox. Women have very high level of achievements on all
social development indicators namely, education and health. The laws relating to property rights are
also more progressive with a long tradition of matriliny. Yet the economic, social and political empowerment
of women is not complete. Women lag behind in their political empowerment as indicated by the low
representation in elections to the legislature; lowest work participation with a high level of unemployment
experienced by women, particularly educated women; the mental stress of employed and educated
women in not being able to maintain domestic harmony for a variety of reasons. The increasing
violence and suicides also stand in contradiction to the high levels of attainment in social development.
The data presented and the analysis brought out in all the sections relating to demography, health,
education, employment, political participation and violence bear out this situation.
What emerges clearly is the social mindset which does not recognize gender equality and
maintains discrimination. The State Government have unique programmes like the Kudumbashree, and
have unique strategies like the Women�s Component Plan at the Panchayat level. The Kudumbashree
has made a mark in helping large numbers of women access skill development and incomes. The
Women�s Component Plan seems to have missed out the �spirit� of making this special component of
10% an additionality to the general development activities of the Panchayat to benefit women.
The declining agriculture, the inadequate growth of industries and the lack of capacity of the
tertiary sector to absorb the large numbers of persons with various levels of education is a major
concern. The large inflow of remittances from the migrants has not translated into investments that
could generate massive employment within the State. The pressures of liberalization of trade and
globalization of markets have caused great threats to employment in the plantations as also the
manufacturing sectors in the State. Development of alternate skills and identification of new products
for markets seem to be slow, resulting in the employment crisis that has hit the job seekers.
Wage discrimination and poor implementation of minimum wages in some sectors and low wages
in others are problems faced by many, which threaten their economic security. Influx of labour from
neighbouring low wage States confounds the problem further.
Intensive drive for expanding tourism brings with it problems like sexual exploitation of women
and children.
Gender justice should now come about by increasing efforts of gender sensitization across the
board and addressing the males in the society. The school curricula, the media and all training
(54)
initiatives have to be oriented to changing the social mindset which does not provide space for the
female in the decision making process.
Women of Kerala are developed in terms of social indicators. But these indicators do not seem
to add up to empowerment. Women are educated, frequently more than men, but are unemployed also
more than men. They live longer than men. Poor quality of life makes it burdensome and prolongs the
burden. Women are more aware. Nonetheless, they continue to be abused. This scenario should give
food for thought. Are we chasing a shadow in pursuit of indicators? Can archaic mindsets be beaten
into the framework of indicators and changes measured?

(55)
Appendix 1
STATISTICAL TABLES
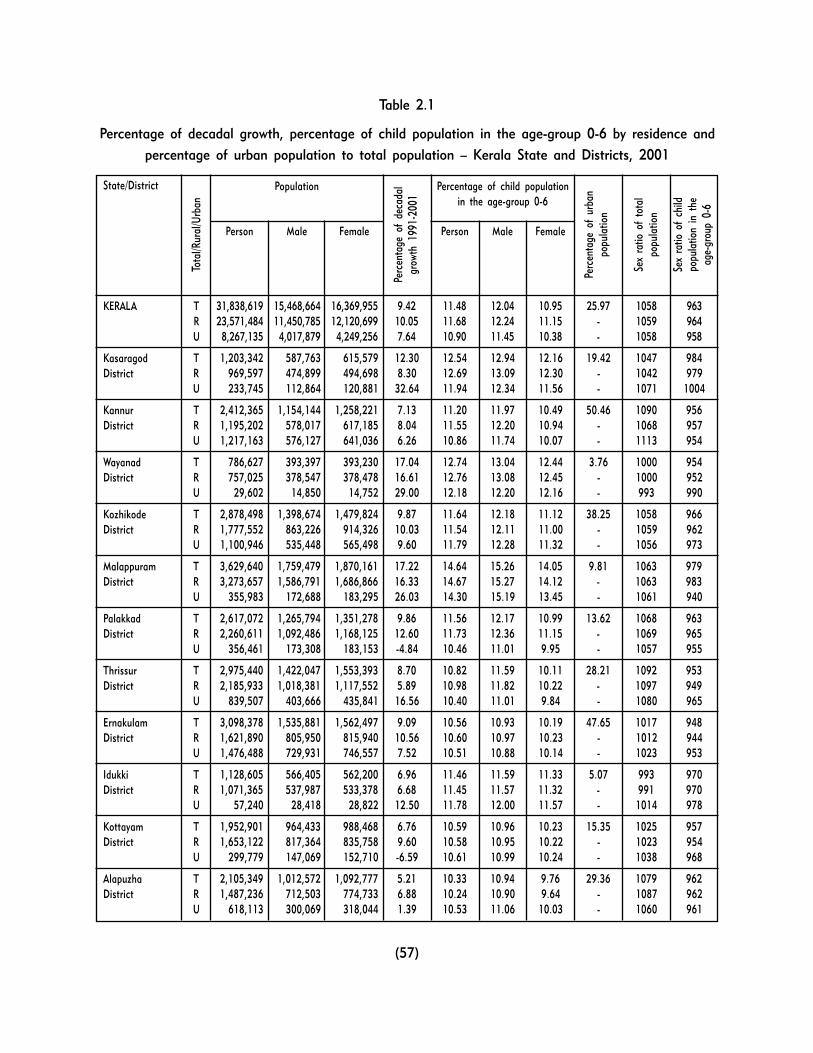
(57)
Table 2.1
Percentage of decadal growth, percentage of child population in the age-group 0-6 by residence and
percentage of urban population to total population � Kerala State and Districts, 2001
State/District
Person Male Female Person Male Female
KERALA T 31,838,619 15,468,664 16,369,955 9.42 11.48 12.04 10.95 25.97 1058 963
R 23,571,484 11,450,785 12,120,699 10.05 11.68 12.24 11.15 - 1059 964
U 8,267,135 4,017,879 4,249,256 7.64 10.90 11.45 10.38 - 1058 958
Kasaragod T 1,203,342 587,763 615,579 12.30 12.54 12.94 12.16 19.42 1047 984District R 969,597 474,899 494,698 8.30 12.69 13.09 12.30 - 1042 979
U 233,745 112,864 120,881 32.64 11.94 12.34 11.56 - 1071 1004
Kannur T 2,412,365 1,154,144 1,258,221 7.13 11.20 11.97 10.49 50.46 1090 956District R 1,195,202 578,017 617,185 8.04 11.55 12.20 10.94 - 1068 957
U 1,217,163 576,127 641,036 6.26 10.86 11.74 10.07 - 1113 954
Wayanad T 786,627 393,397 393,230 17.04 12.74 13.04 12.44 3.76 1000 954District R 757,025 378,547 378,478 16.61 12.76 13.08 12.45 - 1000 952
U 29,602 14,850 14,752 29.00 12.18 12.20 12.16 - 993 990
Kozhikode T 2,878,498 1,398,674 1,479,824 9.87 11.64 12.18 11.12 38.25 1058 966District R 1,777,552 863,226 914,326 10.03 11.54 12.11 11.00 - 1059 962
U 1,100,946 535,448 565,498 9.60 11.79 12.28 11.32 - 1056 973
Malappuram T 3,629,640 1,759,479 1,870,161 17.22 14.64 15.26 14.05 9.81 1063 979District R 3,273,657 1,586,791 1,686,866 16.33 14.67 15.27 14.12 - 1063 983
U 355,983 172,688 183,295 26.03 14.30 15.19 13.45 - 1061 940
Palakkad T 2,617,072 1,265,794 1,351,278 9.86 11.56 12.17 10.99 13.62 1068 963District R 2,260,611 1,092,486 1,168,125 12.60 11.73 12.36 11.15 - 1069 965
U 356,461 173,308 183,153 -4.84 10.46 11.01 9.95 - 1057 955
Thrissur T 2,975,440 1,422,047 1,553,393 8.70 10.82 11.59 10.11 28.21 1092 953District R 2,185,933 1,018,381 1,117,552 5.89 10.98 11.82 10.22 - 1097 949
U 839,507 403,666 435,841 16.56 10.40 11.01 9.84 - 1080 965
Ernakulam T 3,098,378 1,535,881 1,562,497 9.09 10.56 10.93 10.19 47.65 1017 948District R 1,621,890 805,950 815,940 10.56 10.60 10.97 10.23 - 1012 944
U 1,476,488 729,931 746,557 7.52 10.51 10.88 10.14 - 1023 953
Idukki T 1,128,605 566,405 562,200 6.96 11.46 11.59 11.33 5.07 993 970District R 1,071,365 537,987 533,378 6.68 11.45 11.57 11.32 - 991 970
U 57,240 28,418 28,822 12.50 11.78 12.00 11.57 - 1014 978
Kottayam T 1,952,901 964,433 988,468 6.76 10.59 10.96 10.23 15.35 1025 957District R 1,653,122 817,364 835,758 9.60 10.58 10.95 10.22 - 1023 954
U 299,779 147,069 152,710 -6.59 10.61 10.99 10.24 - 1038 968
Alapuzha T 2,105,349 1,012,572 1,092,777 5.21 10.33 10.94 9.76 29.36 1079 962District R 1,487,236 712,503 774,733 6.88 10.24 10.90 9.64 - 1087 962
U 618,113 300,069 318,044 1.39 10.53 11.06 10.03 - 1060 961
Tota
l/Rur
al/U
rban
Perc
enta
ge o
f de
cada
lgr
owth
199
1-20
01
Perc
enta
ge o
f ur
ban
popu
latio
n
Sex
ratio
of
tota
lpo
pula
tion
Sex
ratio
of
child
popu
latio
n in
the
age-
grou
p 0-
6
Population Percentage of child populationin the age-group 0-6
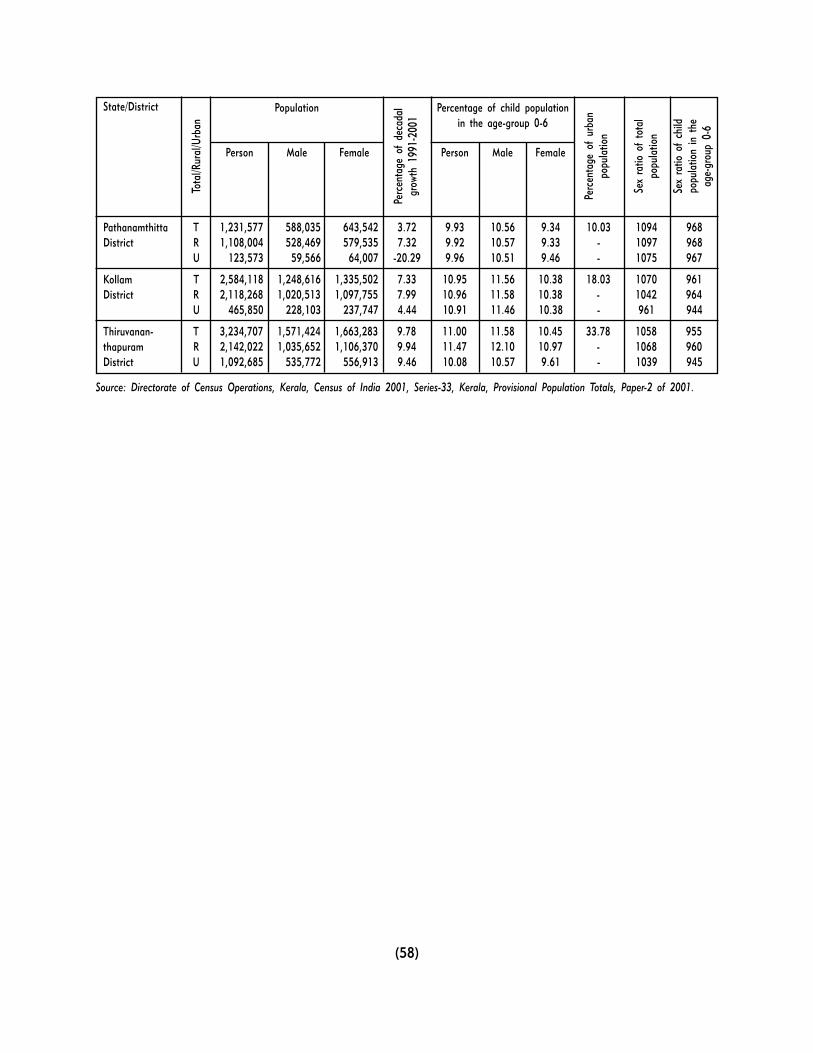
(58)
State/District
Person Male Female Person Male Female
Pathanamthitta T 1,231,577 588,035 643,542 3.72 9.93 10.56 9.34 10.03 1094 968District R 1,108,004 528,469 579,535 7.32 9.92 10.57 9.33 - 1097 968
U 123,573 59,566 64,007 -20.29 9.96 10.51 9.46 - 1075 967
Kollam T 2,584,118 1,248,616 1,335,502 7.33 10.95 11.56 10.38 18.03 1070 961District R 2,118,268 1,020,513 1,097,755 7.99 10.96 11.58 10.38 - 1042 964
U 465,850 228,103 237,747 4.44 10.91 11.46 10.38 - 961 944
Thiruvanan- T 3,234,707 1,571,424 1,663,283 9.78 11.00 11.58 10.45 33.78 1058 955thapuram R 2,142,022 1,035,652 1,106,370 9.94 11.47 12.10 10.97 - 1068 960District U 1,092,685 535,772 556,913 9.46 10.08 10.57 9.61 - 1039 945
Source: Directorate of Census Operations, Kerala, Census of India 2001, Series-33, Kerala, Provisional Population Totals, Paper-2 of 2001.
Tota
l/Rur
al/U
rban
Perc
enta
ge o
f de
cada
lgr
owth
199
1-20
01
Perc
enta
ge o
f ur
ban
popu
latio
n
Sex
ratio
of
tota
lpo
pula
tion
Sex
ratio
of
child
popu
latio
n in
the
age-
grou
p 0-
6
Population Percentage of child populationin the age-group 0-6
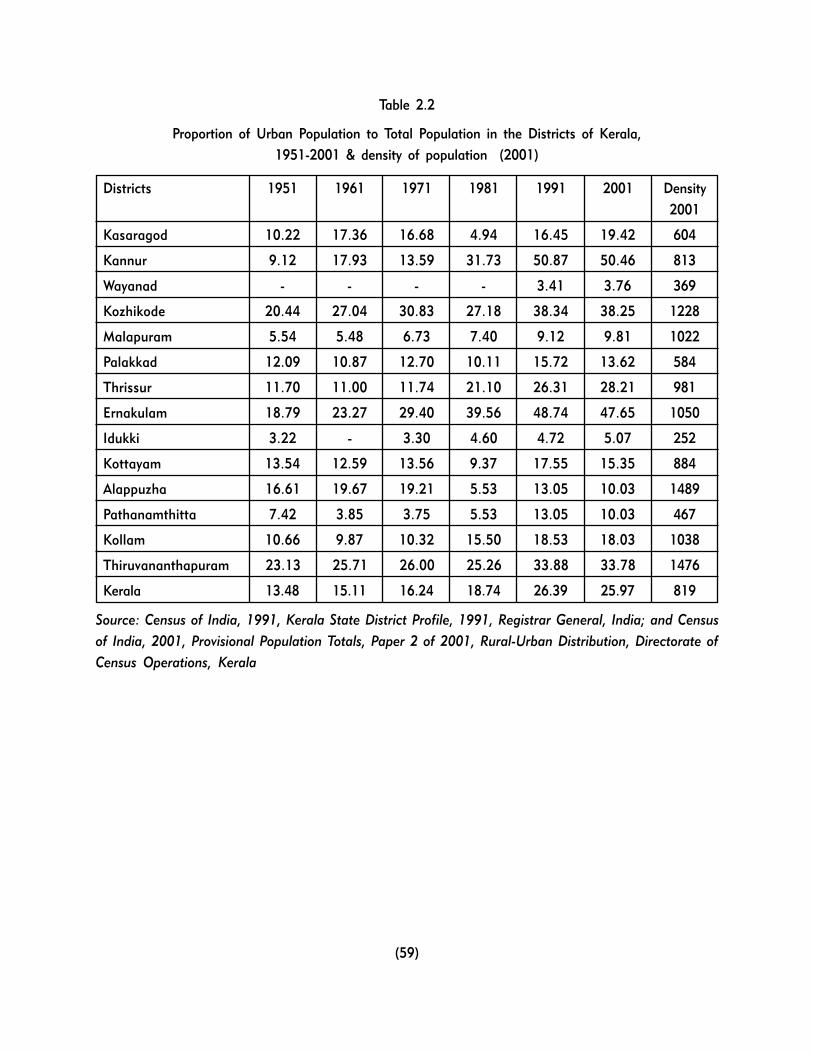
(59)
Table 2.2
Proportion of Urban Population to Total Population in the Districts of Kerala,
1951-2001 & density of population (2001)
Districts 1951 1961 1971 1981 1991 2001 Density
2001
Kasaragod 10.22 17.36 16.68 4.94 16.45 19.42 604
Kannur 9.12 17.93 13.59 31.73 50.87 50.46 813
Wayanad - - - - 3.41 3.76 369
Kozhikode 20.44 27.04 30.83 27.18 38.34 38.25 1228
Malapuram 5.54 5.48 6.73 7.40 9.12 9.81 1022
Palakkad 12.09 10.87 12.70 10.11 15.72 13.62 584
Thrissur 11.70 11.00 11.74 21.10 26.31 28.21 981
Ernakulam 18.79 23.27 29.40 39.56 48.74 47.65 1050
Idukki 3.22 - 3.30 4.60 4.72 5.07 252
Kottayam 13.54 12.59 13.56 9.37 17.55 15.35 884
Alappuzha 16.61 19.67 19.21 5.53 13.05 10.03 1489
Pathanamthitta 7.42 3.85 3.75 5.53 13.05 10.03 467
Kollam 10.66 9.87 10.32 15.50 18.53 18.03 1038
Thiruvananthapuram 23.13 25.71 26.00 25.26 33.88 33.78 1476
Kerala 13.48 15.11 16.24 18.74 26.39 25.97 819
Source: Census of India, 1991, Kerala State District Profile, 1991, Registrar General, India; and Census
of India, 2001, Provisional Population Totals, Paper 2 of 2001, Rural-Urban Distribution, Directorate of
Census Operations, Kerala

(60)
Table 2.3
Life Expectancy at Birth
State All Persons Male Female Difference in
life expectancy
for females
All India 61.1 60.4 61.8 1.4
Rural 59.9 59.3 60.2 0.9
Urban 66.6 65.1 68.0 2.9
Kerala 73.3 70.4 75.9 5.5
Rural 73.2 70.6 75.2 4.6
Urban 73.8 69.7 76.0 6.3
Gain in Life Expectation
Between 1970-75 and
1993-97 11.1 9.4 12.8 3.4
Rural 11.5 9.9 12.3 2.4
Urban 10.3 8.7 9.7 1.0
Source: Registrar General, India, Sample Registration System based on Life Tables, 1993-97 and Registrar
General, India, Compendium of India�s Fertility and Mortality Indicators, 1971-1997, Based on the
Sample Registration System (SRS)
Table 2.4
Proportion of Population by Age Groups
Age Group All India Kerala
Males (%) Females (%) Males (%) Females (%) Male Female Sex
Ratio
1991 1998 1991 1998 1991 1998 1991 1998 NFHS-2 (1998-99)
0-4 12.03 11.7 12.40 11.3 9.6 9.7 8.8 8.6 8.7 8.4 1,021
5-14 25.13 24.4 24.95 23.7 21.2 19.3 20.0 17.1 19.9 17.2 923
15-29 26.26 27.7 26.88 27.4 29.4 28.2 31.0 29.8 28.6 29.3 1,093
30-49 22.81 23.6 22.37 23.7 24.3 26.4 21.7 26.8 25.2 26.9 1,139
50-64 9.13 8.9 8.82 9.3 9.9 10.7 10.1 10.8 10.8 10.9 1,076
65 plus 4.63 3.8 4.58 4.3 5.5 5.7 6.2 6.7 6.8 7.3 1,153
Total 100 100 100 100 100 100 100 100 100 100 934
Source: Registrar General of India, 1991 Census and Registrar General, India, Sample Registration System, Statistical
Report, 1998
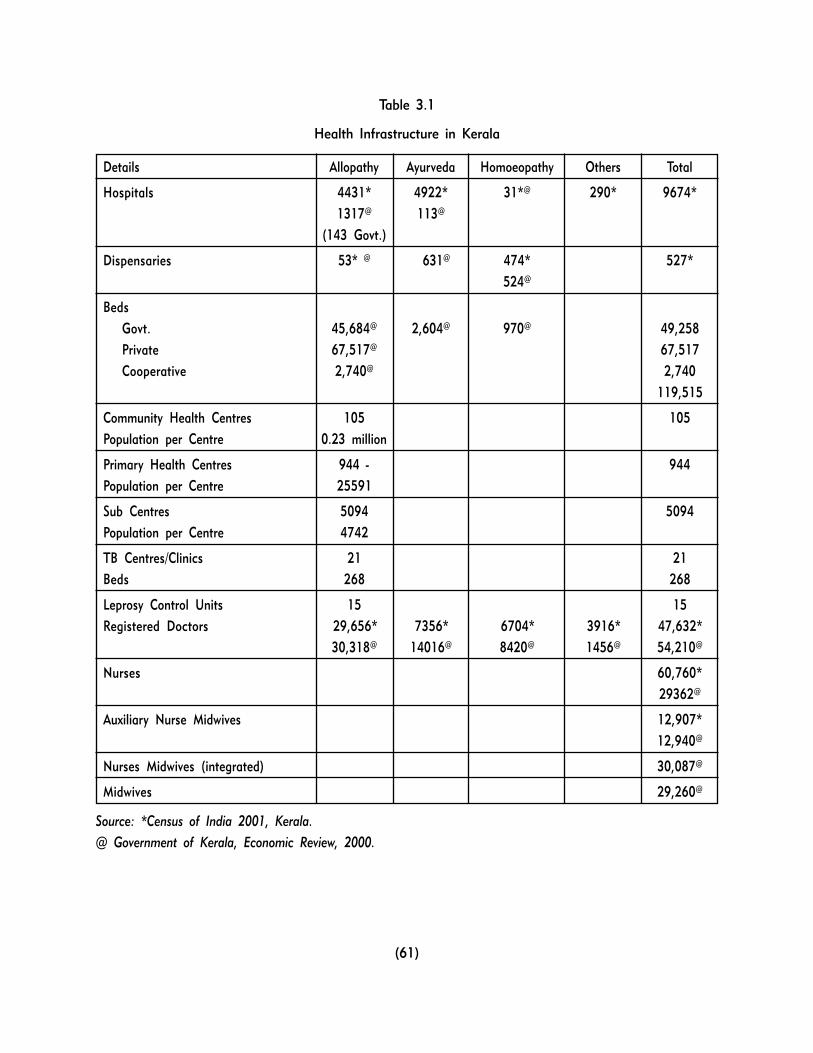
(61)
Table 3.1
Health Infrastructure in Kerala
Details Allopathy Ayurveda Homoeopathy Others Total
Hospitals 4431* 4922* 31*@ 290* 9674*
1317@ 113@
(143 Govt.)
Dispensaries 53* @ 631@ 474* 527*
524@
Beds
Govt. 45,684@ 2,604@ 970@ 49,258
Private 67,517@ 67,517
Cooperative 2,740@ 2,740
119,515
Community Health Centres 105 105
Population per Centre 0.23 million
Primary Health Centres 944 - 944
Population per Centre 25591
Sub Centres 5094 5094
Population per Centre 4742
TB Centres/Clinics 21 21
Beds 268 268
Leprosy Control Units 15 15
Registered Doctors 29,656* 7356* 6704* 3916* 47,632*
30,318@ 14016@ 8420@ 1456@ 54,210@
Nurses 60,760*
29362@
Auxiliary Nurse Midwives 12,907*
12,940@
Nurses Midwives (integrated) 30,087@
Midwives 29,260@
Source: *Census of India 2001, Kerala.
@ Government of Kerala, Economic Review, 2000.
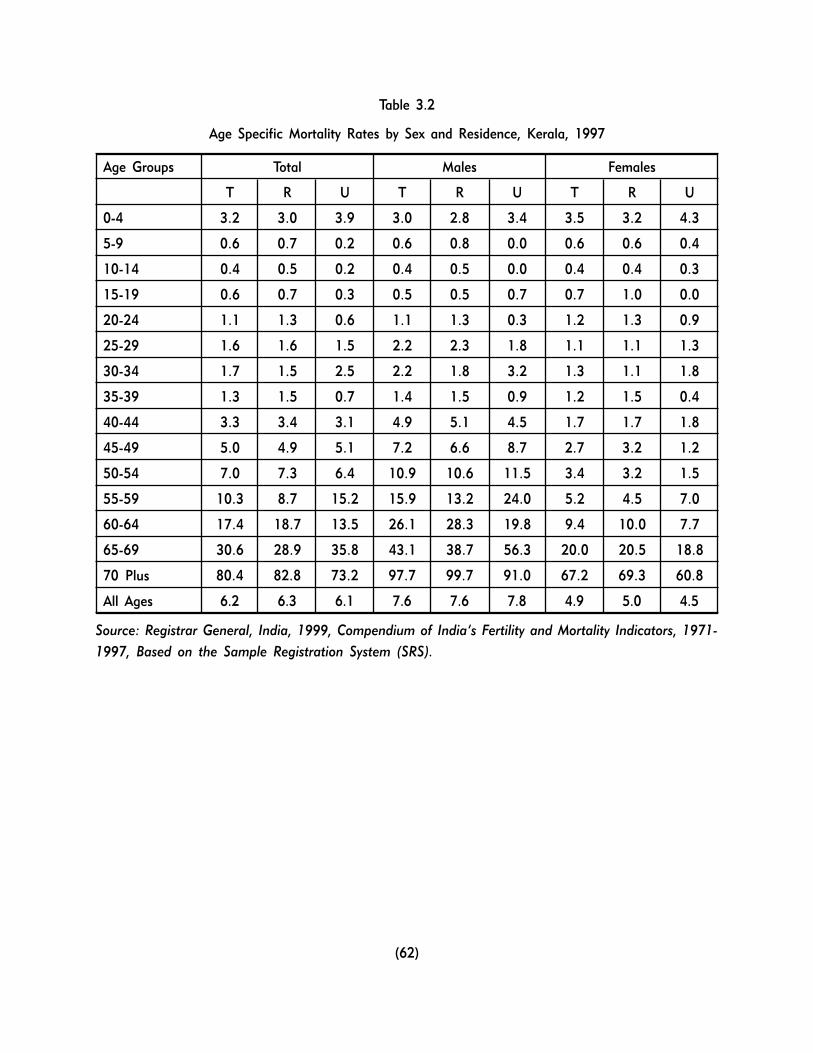
(62)
Table 3.2
Age Specific Mortality Rates by Sex and Residence, Kerala, 1997
Age Groups Total Males Females
T R U T R U T R U
0-4 3.2 3.0 3.9 3.0 2.8 3.4 3.5 3.2 4.3
5-9 0.6 0.7 0.2 0.6 0.8 0.0 0.6 0.6 0.4
10-14 0.4 0.5 0.2 0.4 0.5 0.0 0.4 0.4 0.3
15-19 0.6 0.7 0.3 0.5 0.5 0.7 0.7 1.0 0.0
20-24 1.1 1.3 0.6 1.1 1.3 0.3 1.2 1.3 0.9
25-29 1.6 1.6 1.5 2.2 2.3 1.8 1.1 1.1 1.3
30-34 1.7 1.5 2.5 2.2 1.8 3.2 1.3 1.1 1.8
35-39 1.3 1.5 0.7 1.4 1.5 0.9 1.2 1.5 0.4
40-44 3.3 3.4 3.1 4.9 5.1 4.5 1.7 1.7 1.8
45-49 5.0 4.9 5.1 7.2 6.6 8.7 2.7 3.2 1.2
50-54 7.0 7.3 6.4 10.9 10.6 11.5 3.4 3.2 1.5
55-59 10.3 8.7 15.2 15.9 13.2 24.0 5.2 4.5 7.0
60-64 17.4 18.7 13.5 26.1 28.3 19.8 9.4 10.0 7.7
65-69 30.6 28.9 35.8 43.1 38.7 56.3 20.0 20.5 18.8
70 Plus 80.4 82.8 73.2 97.7 99.7 91.0 67.2 69.3 60.8
All Ages 6.2 6.3 6.1 7.6 7.6 7.8 4.9 5.0 4.5
Source: Registrar General, India, 1999, Compendium of India�s Fertility and Mortality Indicators, 1971-
1997, Based on the Sample Registration System (SRS).
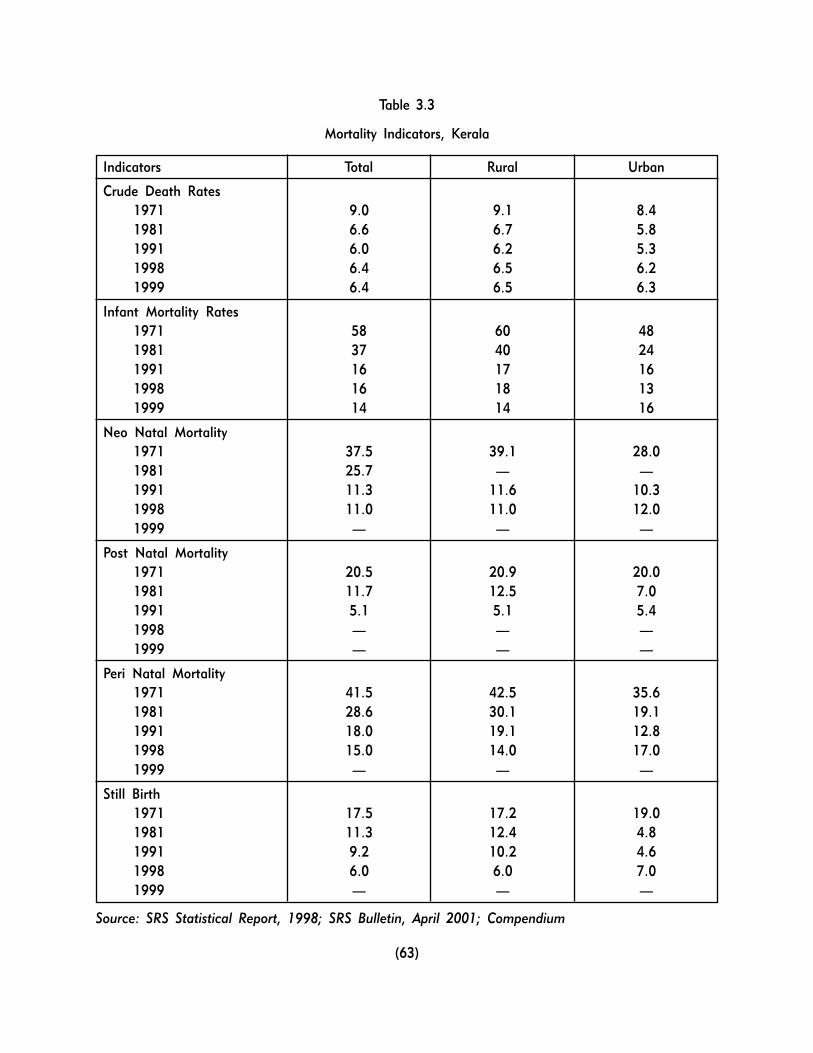
(63)
Table 3.3
Mortality Indicators, Kerala
Indicators Total Rural Urban
Crude Death Rates1971 9.0 9.1 8.41981 6.6 6.7 5.81991 6.0 6.2 5.31998 6.4 6.5 6.21999 6.4 6.5 6.3
Infant Mortality Rates1971 58 60 481981 37 40 241991 16 17 161998 16 18 131999 14 14 16
Neo Natal Mortality1971 37.5 39.1 28.01981 25.7 � �1991 11.3 11.6 10.31998 11.0 11.0 12.01999 � � �
Post Natal Mortality1971 20.5 20.9 20.01981 11.7 12.5 7.01991 5.1 5.1 5.41998 � � �1999 � � �
Peri Natal Mortality1971 41.5 42.5 35.61981 28.6 30.1 19.11991 18.0 19.1 12.81998 15.0 14.0 17.01999 � � �
Still Birth1971 17.5 17.2 19.01981 11.3 12.4 4.81991 9.2 10.2 4.61998 6.0 6.0 7.01999 � � �
Source: SRS Statistical Report, 1998; SRS Bulletin, April 2001; Compendium
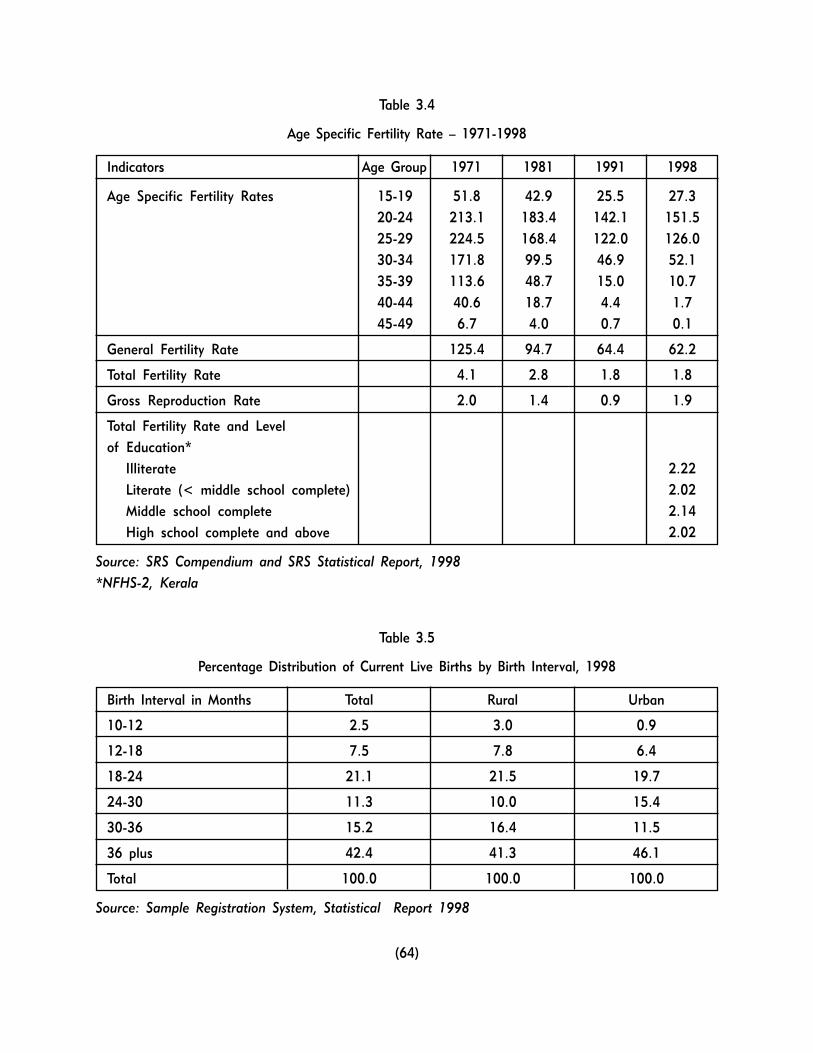
(64)
Table 3.4
Age Specific Fertility Rate � 1971-1998
Indicators Age Group 1971 1981 1991 1998
Age Specific Fertility Rates 15-19 51.8 42.9 25.5 27.3
20-24 213.1 183.4 142.1 151.5
25-29 224.5 168.4 122.0 126.0
30-34 171.8 99.5 46.9 52.1
35-39 113.6 48.7 15.0 10.7
40-44 40.6 18.7 4.4 1.7
45-49 6.7 4.0 0.7 0.1
General Fertility Rate 125.4 94.7 64.4 62.2
Total Fertility Rate 4.1 2.8 1.8 1.8
Gross Reproduction Rate 2.0 1.4 0.9 1.9
Total Fertility Rate and Level
of Education*
Illiterate 2.22
Literate (< middle school complete) 2.02
Middle school complete 2.14
High school complete and above 2.02
Source: SRS Compendium and SRS Statistical Report, 1998
*NFHS-2, Kerala
Table 3.5
Percentage Distribution of Current Live Births by Birth Interval, 1998
Birth Interval in Months Total Rural Urban
10-12 2.5 3.0 0.9
12-18 7.5 7.8 6.4
18-24 21.1 21.5 19.7
24-30 11.3 10.0 15.4
30-36 15.2 16.4 11.5
36 plus 42.4 41.3 46.1
Total 100.0 100.0 100.0
Source: Sample Registration System, Statistical Report 1998
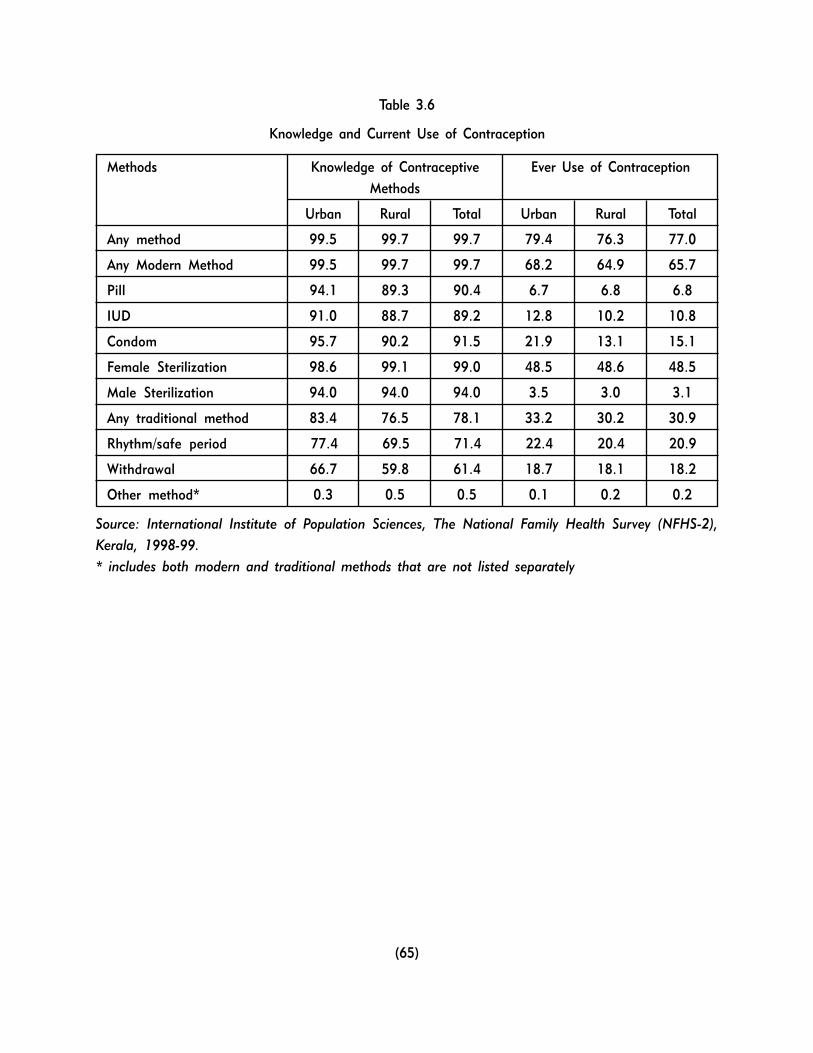
(65)
Table 3.6
Knowledge and Current Use of Contraception
Methods Knowledge of Contraceptive Ever Use of Contraception
Methods
Urban Rural Total Urban Rural Total
Any method 99.5 99.7 99.7 79.4 76.3 77.0
Any Modern Method 99.5 99.7 99.7 68.2 64.9 65.7
Pill 94.1 89.3 90.4 6.7 6.8 6.8
IUD 91.0 88.7 89.2 12.8 10.2 10.8
Condom 95.7 90.2 91.5 21.9 13.1 15.1
Female Sterilization 98.6 99.1 99.0 48.5 48.6 48.5
Male Sterilization 94.0 94.0 94.0 3.5 3.0 3.1
Any traditional method 83.4 76.5 78.1 33.2 30.2 30.9
Rhythm/safe period 77.4 69.5 71.4 22.4 20.4 20.9
Withdrawal 66.7 59.8 61.4 18.7 18.1 18.2
Other method* 0.3 0.5 0.5 0.1 0.2 0.2
Source: International Institute of Population Sciences, The National Family Health Survey (NFHS-2),
Kerala, 1998-99.
* includes both modern and traditional methods that are not listed separately
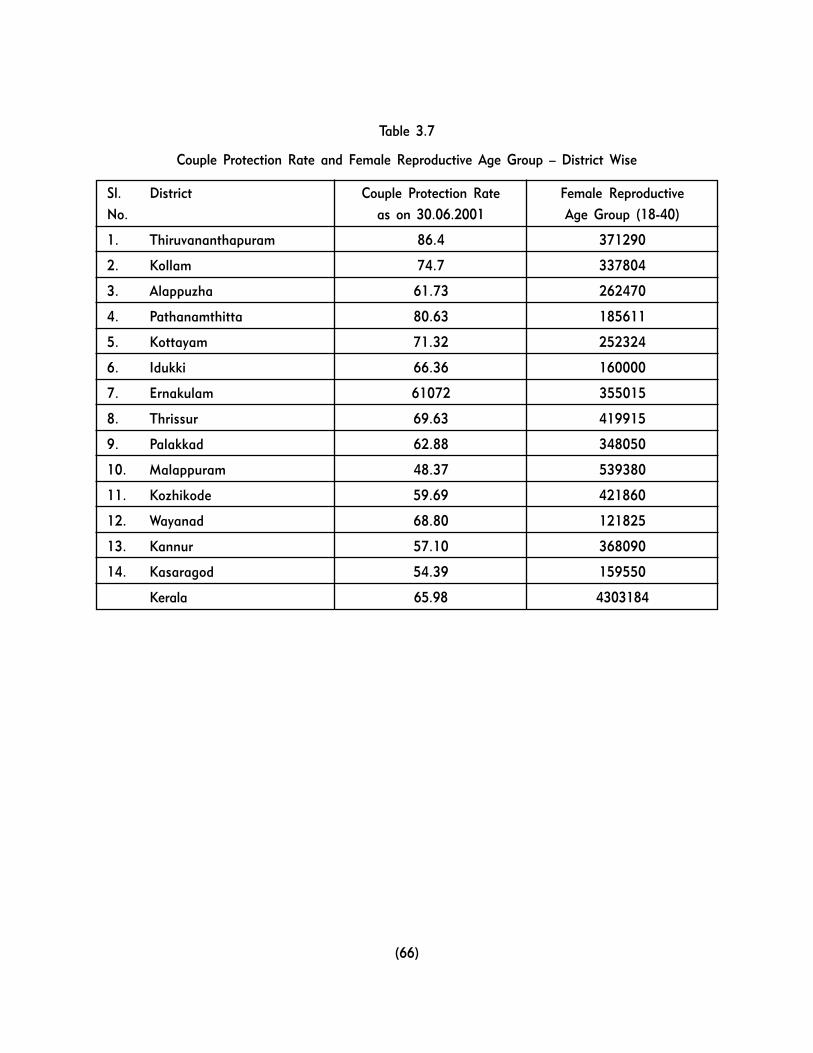
(66)
Table 3.7
Couple Protection Rate and Female Reproductive Age Group � District Wise
Sl. District Couple Protection Rate Female Reproductive
No. as on 30.06.2001 Age Group (18-40)
1. Thiruvananthapuram 86.4 371290
2. Kollam 74.7 337804
3. Alappuzha 61.73 262470
4. Pathanamthitta 80.63 185611
5. Kottayam 71.32 252324
6. Idukki 66.36 160000
7. Ernakulam 61072 355015
8. Thrissur 69.63 419915
9. Palakkad 62.88 348050
10. Malappuram 48.37 539380
11. Kozhikode 59.69 421860
12. Wayanad 68.80 121825
13. Kannur 57.10 368090
14. Kasaragod 54.39 159550
Kerala 65.98 4303184
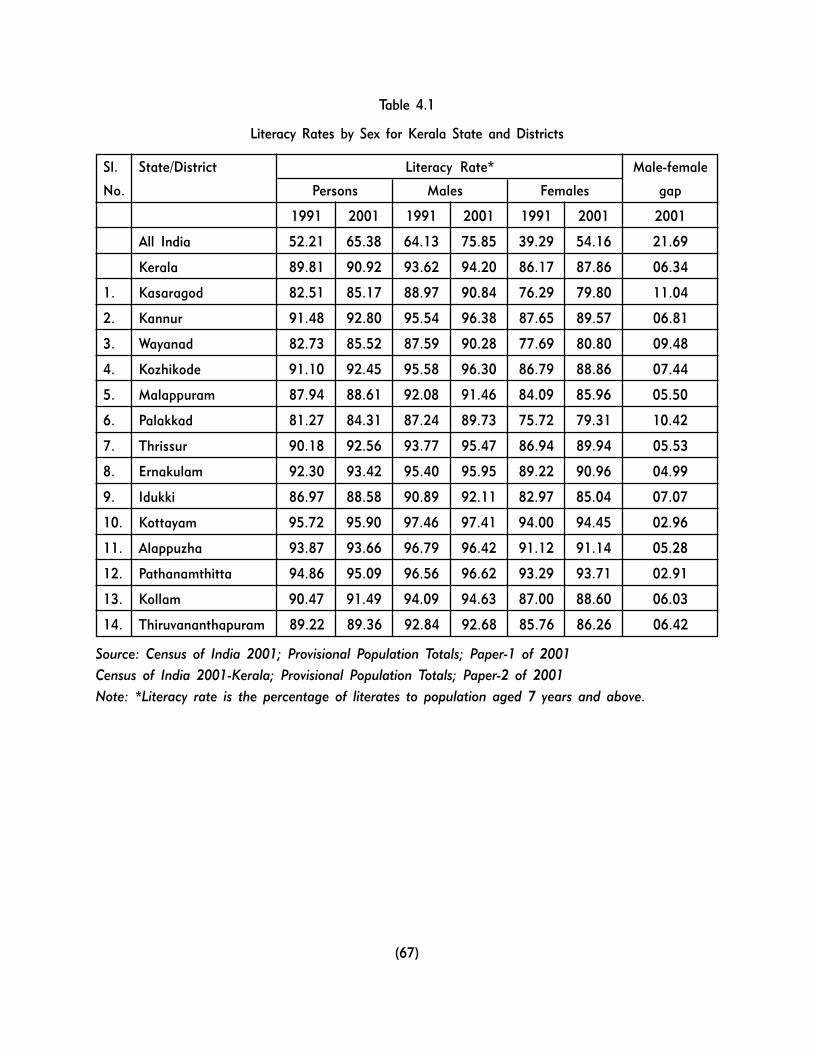
(67)
Table 4.1
Literacy Rates by Sex for Kerala State and Districts
Sl. State/District Literacy Rate* Male-female
No. Persons Males Females gap
1991 2001 1991 2001 1991 2001 2001
All India 52.21 65.38 64.13 75.85 39.29 54.16 21.69
Kerala 89.81 90.92 93.62 94.20 86.17 87.86 06.34
1. Kasaragod 82.51 85.17 88.97 90.84 76.29 79.80 11.04
2. Kannur 91.48 92.80 95.54 96.38 87.65 89.57 06.81
3. Wayanad 82.73 85.52 87.59 90.28 77.69 80.80 09.48
4. Kozhikode 91.10 92.45 95.58 96.30 86.79 88.86 07.44
5. Malappuram 87.94 88.61 92.08 91.46 84.09 85.96 05.50
6. Palakkad 81.27 84.31 87.24 89.73 75.72 79.31 10.42
7. Thrissur 90.18 92.56 93.77 95.47 86.94 89.94 05.53
8. Ernakulam 92.30 93.42 95.40 95.95 89.22 90.96 04.99
9. Idukki 86.97 88.58 90.89 92.11 82.97 85.04 07.07
10. Kottayam 95.72 95.90 97.46 97.41 94.00 94.45 02.96
11. Alappuzha 93.87 93.66 96.79 96.42 91.12 91.14 05.28
12. Pathanamthitta 94.86 95.09 96.56 96.62 93.29 93.71 02.91
13. Kollam 90.47 91.49 94.09 94.63 87.00 88.60 06.03
14. Thiruvananthapuram 89.22 89.36 92.84 92.68 85.76 86.26 06.42
Source: Census of India 2001; Provisional Population Totals; Paper-1 of 2001
Census of India 2001-Kerala; Provisional Population Totals; Paper-2 of 2001
Note: *Literacy rate is the percentage of literates to population aged 7 years and above.
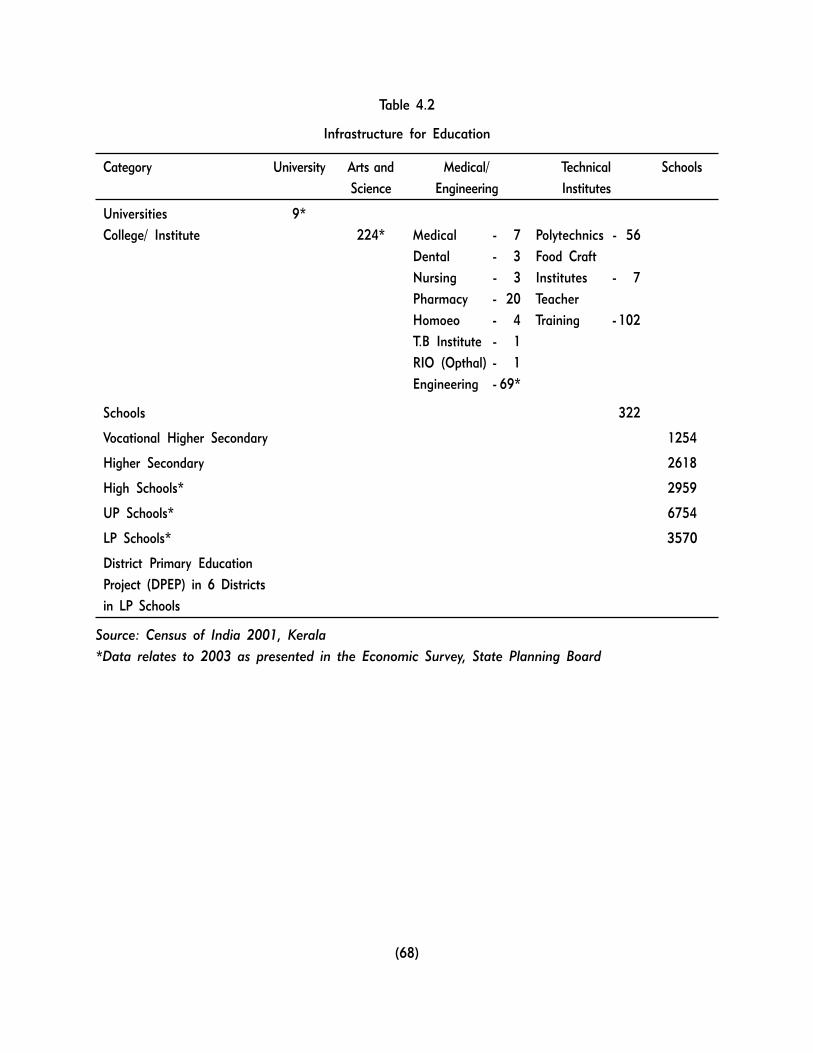
(68)
Table 4.2
Infrastructure for Education
Category University Arts and Medical/ Technical Schools
Science Engineering Institutes
Universities 9*
College/ Institute 224* Medical - 7 Polytechnics - 56
Dental - 3 Food Craft
Nursing - 3 Institutes - 7
Pharmacy - 20 Teacher
Homoeo - 4 Training - 102
T.B Institute - 1
RIO (Opthal) - 1
Engineering - 69*
Schools 322
Vocational Higher Secondary 1254
Higher Secondary 2618
High Schools* 2959
UP Schools* 6754
LP Schools* 3570
District Primary Education
Project (DPEP) in 6 Districts
in LP Schools
Source: Census of India 2001, Kerala
*Data relates to 2003 as presented in the Economic Survey, State Planning Board
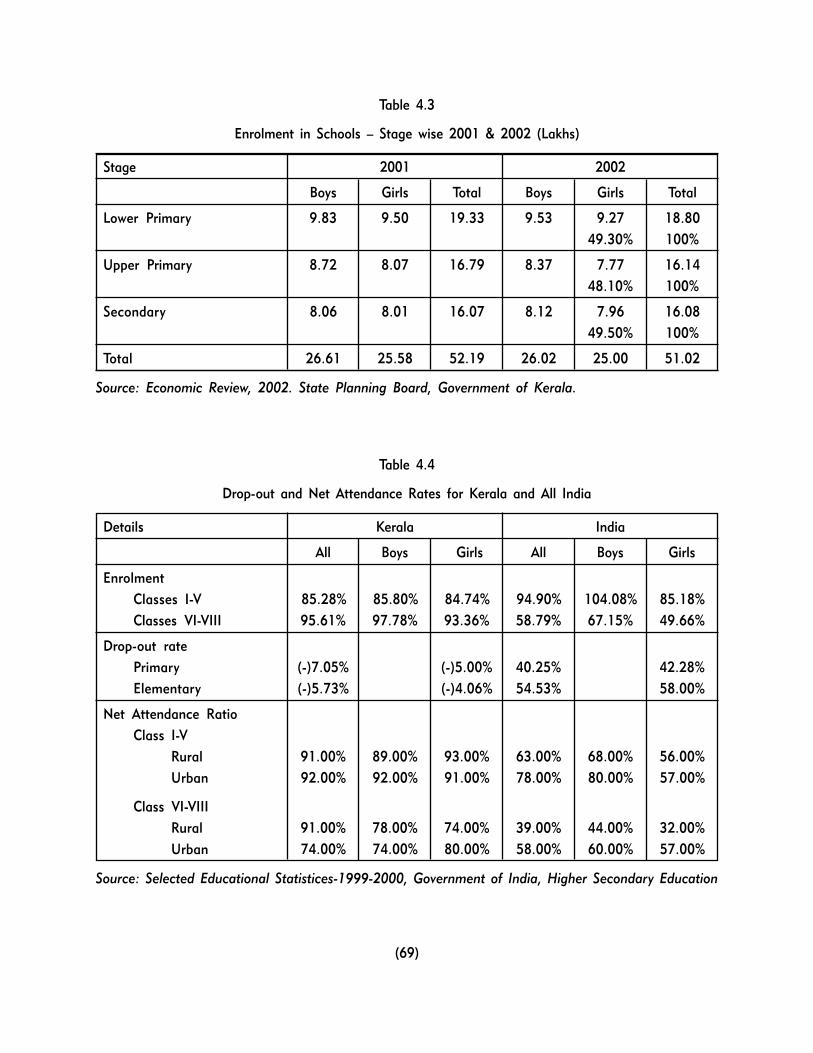
(69)
Table 4.3
Enrolment in Schools � Stage wise 2001 & 2002 (Lakhs)
Stage 2001 2002
Boys Girls Total Boys Girls Total
Lower Primary 9.83 9.50 19.33 9.53 9.27 18.80
49.30% 100%
Upper Primary 8.72 8.07 16.79 8.37 7.77 16.14
48.10% 100%
Secondary 8.06 8.01 16.07 8.12 7.96 16.08
49.50% 100%
Total 26.61 25.58 52.19 26.02 25.00 51.02
Source: Economic Review, 2002. State Planning Board, Government of Kerala.
Table 4.4
Drop-out and Net Attendance Rates for Kerala and All India
Details Kerala India
All Boys Girls All Boys Girls
Enrolment
Classes I-V 85.28% 85.80% 84.74% 94.90% 104.08% 85.18%
Classes VI-VIII 95.61% 97.78% 93.36% 58.79% 67.15% 49.66%
Drop-out rate
Primary (-)7.05% (-)5.00% 40.25% 42.28%
Elementary (-)5.73% (-)4.06% 54.53% 58.00%
Net Attendance Ratio
Class I-V
Rural 91.00% 89.00% 93.00% 63.00% 68.00% 56.00%
Urban 92.00% 92.00% 91.00% 78.00% 80.00% 57.00%
Class VI-VIII
Rural 91.00% 78.00% 74.00% 39.00% 44.00% 32.00%
Urban 74.00% 74.00% 80.00% 58.00% 60.00% 57.00%
Source: Selected Educational Statistices-1999-2000, Government of India, Higher Secondary Education
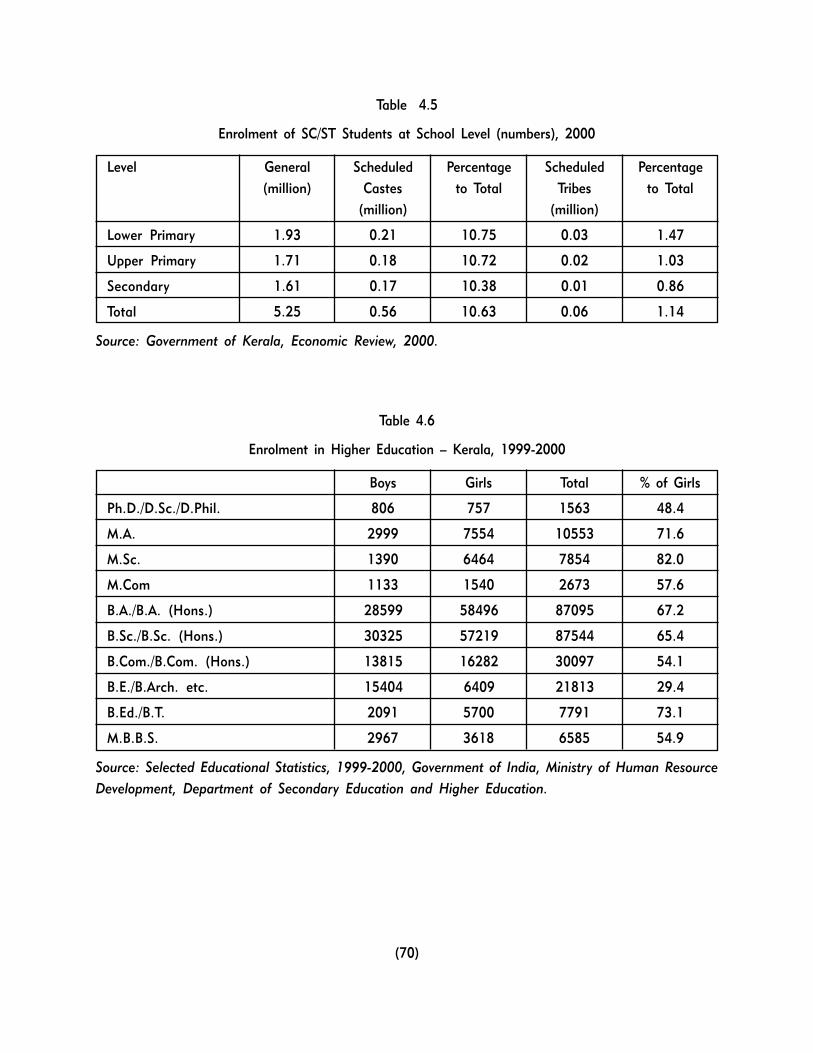
(70)
Table 4.5
Enrolment of SC/ST Students at School Level (numbers), 2000
Level General Scheduled Percentage Scheduled Percentage
(million) Castes to Total Tribes to Total
(million) (million)
Lower Primary 1.93 0.21 10.75 0.03 1.47
Upper Primary 1.71 0.18 10.72 0.02 1.03
Secondary 1.61 0.17 10.38 0.01 0.86
Total 5.25 0.56 10.63 0.06 1.14
Source: Government of Kerala, Economic Review, 2000.
Table 4.6
Enrolment in Higher Education � Kerala, 1999-2000
Boys Girls Total % of Girls
Ph.D./D.Sc./D.Phil. 806 757 1563 48.4
M.A. 2999 7554 10553 71.6
M.Sc. 1390 6464 7854 82.0
M.Com 1133 1540 2673 57.6
B.A./B.A. (Hons.) 28599 58496 87095 67.2
B.Sc./B.Sc. (Hons.) 30325 57219 87544 65.4
B.Com./B.Com. (Hons.) 13815 16282 30097 54.1
B.E./B.Arch. etc. 15404 6409 21813 29.4
B.Ed./B.T. 2091 5700 7791 73.1
M.B.B.S. 2967 3618 6585 54.9
Source: Selected Educational Statistics, 1999-2000, Government of India, Ministry of Human Resource
Development, Department of Secondary Education and Higher Education.
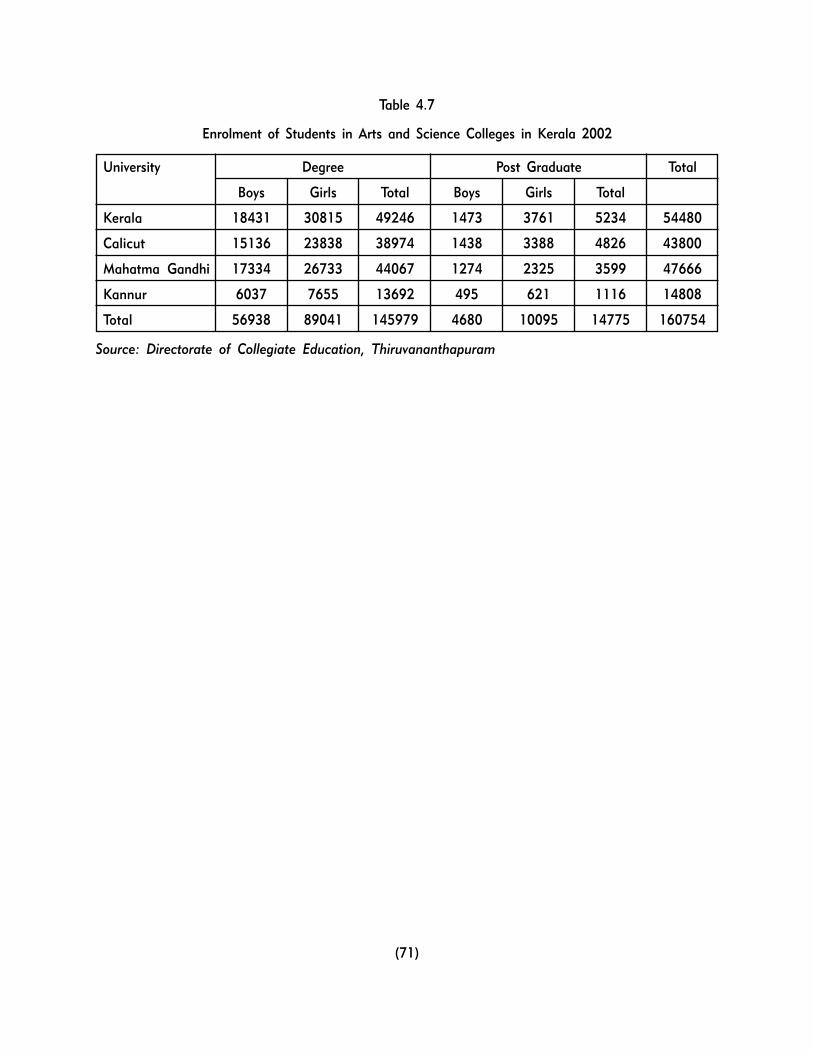
(71)
Table 4.7
Enrolment of Students in Arts and Science Colleges in Kerala 2002
University Degree Post Graduate Total
Boys Girls Total Boys Girls Total
Kerala 18431 30815 49246 1473 3761 5234 54480
Calicut 15136 23838 38974 1438 3388 4826 43800
Mahatma Gandhi 17334 26733 44067 1274 2325 3599 47666
Kannur 6037 7655 13692 495 621 1116 14808
Total 56938 89041 145979 4680 10095 14775 160754
Source: Directorate of Collegiate Education, Thiruvananthapuram
(73)
EMPLOYMENT AND OCCUPATION STRUCTURE
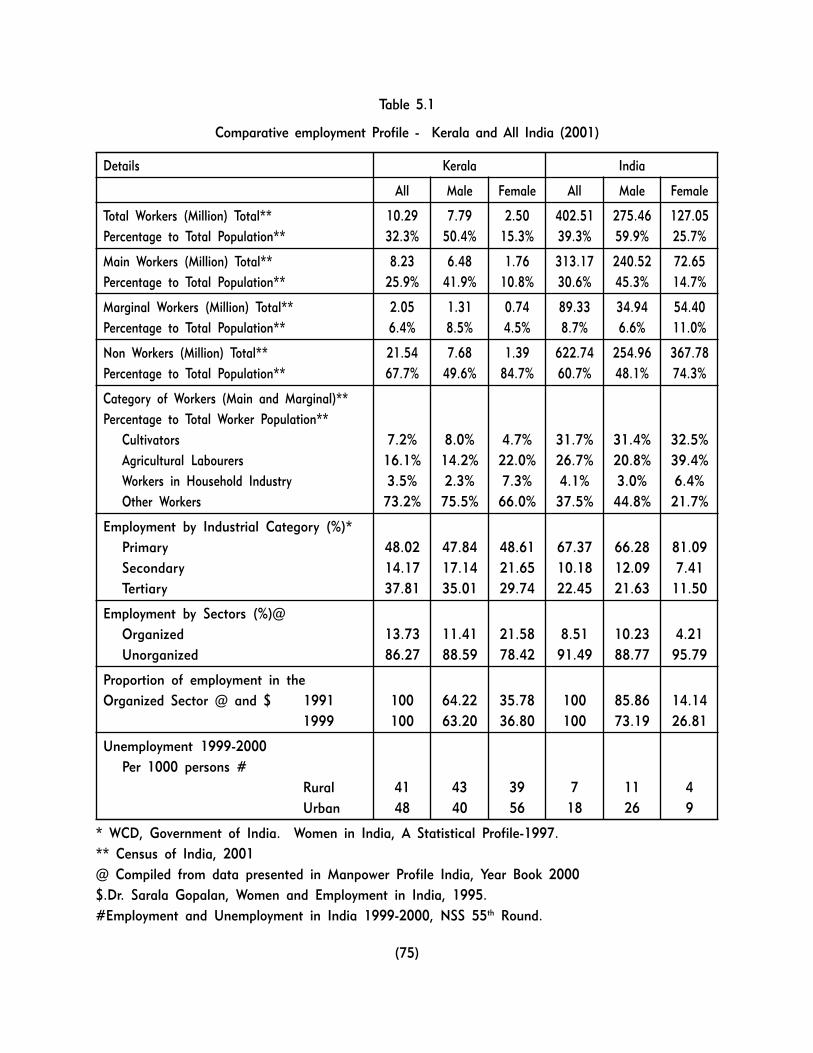
(75)
Table 5.1
Comparative employment Profile - Kerala and All India (2001)
Details Kerala India
All Male Female All Male Female
Total Workers (Million) Total** 10.29 7.79 2.50 402.51 275.46 127.05
Percentage to Total Population** 32.3% 50.4% 15.3% 39.3% 59.9% 25.7%
Main Workers (Million) Total** 8.23 6.48 1.76 313.17 240.52 72.65
Percentage to Total Population** 25.9% 41.9% 10.8% 30.6% 45.3% 14.7%
Marginal Workers (Million) Total** 2.05 1.31 0.74 89.33 34.94 54.40
Percentage to Total Population** 6.4% 8.5% 4.5% 8.7% 6.6% 11.0%
Non Workers (Million) Total** 21.54 7.68 1.39 622.74 254.96 367.78
Percentage to Total Population** 67.7% 49.6% 84.7% 60.7% 48.1% 74.3%
Category of Workers (Main and Marginal)**
Percentage to Total Worker Population**
Cultivators 7.2% 8.0% 4.7% 31.7% 31.4% 32.5%
Agricultural Labourers 16.1% 14.2% 22.0% 26.7% 20.8% 39.4%
Workers in Household Industry 3.5% 2.3% 7.3% 4.1% 3.0% 6.4%
Other Workers 73.2% 75.5% 66.0% 37.5% 44.8% 21.7%
Employment by Industrial Category (%)*
Primary 48.02 47.84 48.61 67.37 66.28 81.09
Secondary 14.17 17.14 21.65 10.18 12.09 7.41
Tertiary 37.81 35.01 29.74 22.45 21.63 11.50
Employment by Sectors (%)@
Organized 13.73 11.41 21.58 8.51 10.23 4.21
Unorganized 86.27 88.59 78.42 91.49 88.77 95.79
Proportion of employment in the
Organized Sector @ and $ 1991 100 64.22 35.78 100 85.86 14.14
1999 100 63.20 36.80 100 73.19 26.81
Unemployment 1999-2000
Per 1000 persons #
Rural 41 43 39 7 11 4
Urban 48 40 56 18 26 9
* WCD, Government of India. Women in India, A Statistical Profile-1997.
** Census of India, 2001
@ Compiled from data presented in Manpower Profile India, Year Book 2000
$.Dr. Sarala Gopalan, Women and Employment in India, 1995.
#Employment and Unemployment in India 1999-2000, NSS 55th Round.
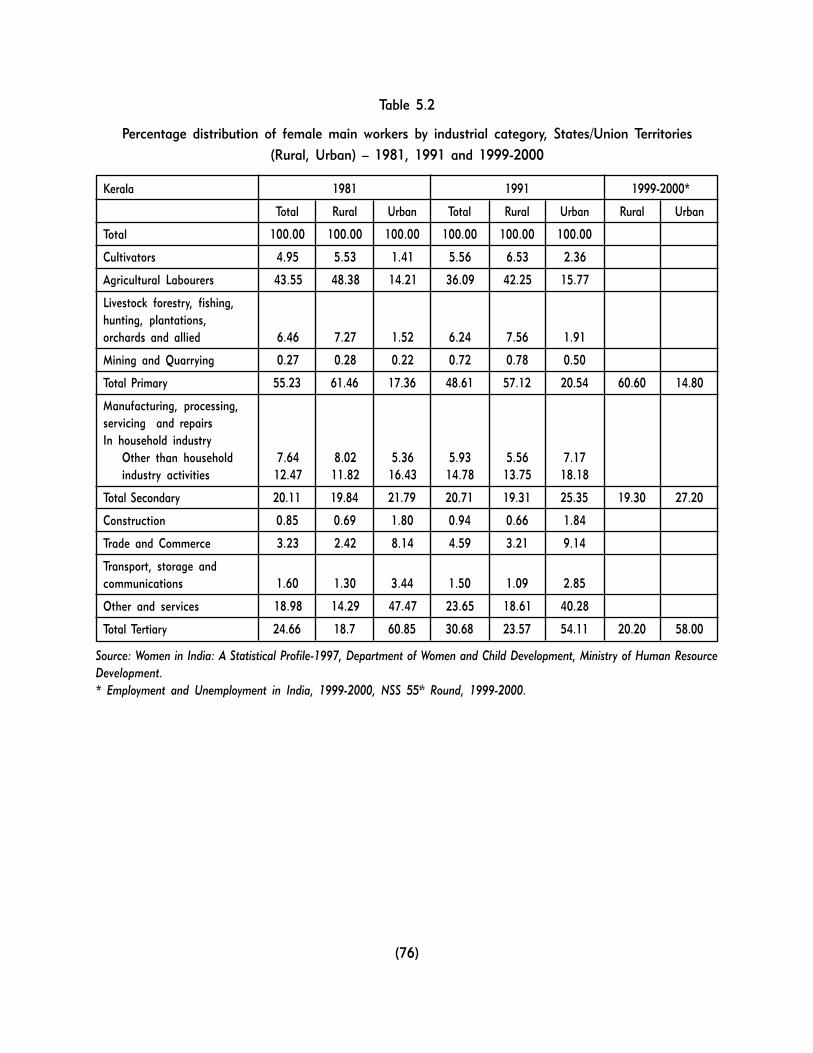
(76)
Table 5.2
Percentage distribution of female main workers by industrial category, States/Union Territories
(Rural, Urban) � 1981, 1991 and 1999-2000
Kerala 1981 1991 1999-2000*
Total Rural Urban Total Rural Urban Rural Urban
Total 100.00 100.00 100.00 100.00 100.00 100.00
Cultivators 4.95 5.53 1.41 5.56 6.53 2.36
Agricultural Labourers 43.55 48.38 14.21 36.09 42.25 15.77
Livestock forestry, fishing,hunting, plantations,orchards and allied 6.46 7.27 1.52 6.24 7.56 1.91
Mining and Quarrying 0.27 0.28 0.22 0.72 0.78 0.50
Total Primary 55.23 61.46 17.36 48.61 57.12 20.54 60.60 14.80
Manufacturing, processing,servicing and repairsIn household industry
Other than household 7.64 8.02 5.36 5.93 5.56 7.17industry activities 12.47 11.82 16.43 14.78 13.75 18.18
Total Secondary 20.11 19.84 21.79 20.71 19.31 25.35 19.30 27.20
Construction 0.85 0.69 1.80 0.94 0.66 1.84
Trade and Commerce 3.23 2.42 8.14 4.59 3.21 9.14
Transport, storage andcommunications 1.60 1.30 3.44 1.50 1.09 2.85
Other and services 18.98 14.29 47.47 23.65 18.61 40.28
Total Tertiary 24.66 18.7 60.85 30.68 23.57 54.11 20.20 58.00
Source: Women in India: A Statistical Profile-1997, Department of Women and Child Development, Ministry of Human Resource
Development.
* Employment and Unemployment in India, 1999-2000, NSS 55th Round, 1999-2000.
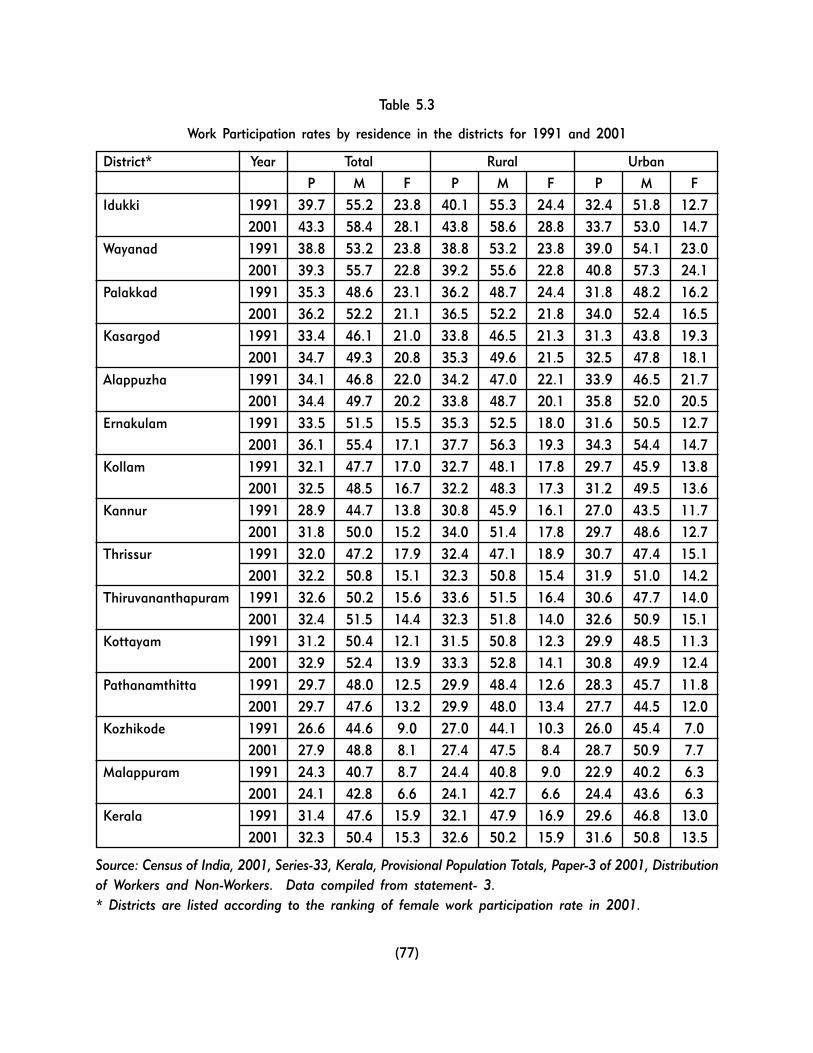
(77)
Table 5.3
Work Participation rates by residence in the districts for 1991 and 2001
District* Year Total Rural Urban
P M F P M F P M F
Idukki 1991 39.7 55.2 23.8 40.1 55.3 24.4 32.4 51.8 12.7
2001 43.3 58.4 28.1 43.8 58.6 28.8 33.7 53.0 14.7
Wayanad 1991 38.8 53.2 23.8 38.8 53.2 23.8 39.0 54.1 23.0
2001 39.3 55.7 22.8 39.2 55.6 22.8 40.8 57.3 24.1
Palakkad 1991 35.3 48.6 23.1 36.2 48.7 24.4 31.8 48.2 16.2
2001 36.2 52.2 21.1 36.5 52.2 21.8 34.0 52.4 16.5
Kasargod 1991 33.4 46.1 21.0 33.8 46.5 21.3 31.3 43.8 19.3
2001 34.7 49.3 20.8 35.3 49.6 21.5 32.5 47.8 18.1
Alappuzha 1991 34.1 46.8 22.0 34.2 47.0 22.1 33.9 46.5 21.7
2001 34.4 49.7 20.2 33.8 48.7 20.1 35.8 52.0 20.5
Ernakulam 1991 33.5 51.5 15.5 35.3 52.5 18.0 31.6 50.5 12.7
2001 36.1 55.4 17.1 37.7 56.3 19.3 34.3 54.4 14.7
Kollam 1991 32.1 47.7 17.0 32.7 48.1 17.8 29.7 45.9 13.8
2001 32.5 48.5 16.7 32.2 48.3 17.3 31.2 49.5 13.6
Kannur 1991 28.9 44.7 13.8 30.8 45.9 16.1 27.0 43.5 11.7
2001 31.8 50.0 15.2 34.0 51.4 17.8 29.7 48.6 12.7
Thrissur 1991 32.0 47.2 17.9 32.4 47.1 18.9 30.7 47.4 15.1
2001 32.2 50.8 15.1 32.3 50.8 15.4 31.9 51.0 14.2
Thiruvananthapuram 1991 32.6 50.2 15.6 33.6 51.5 16.4 30.6 47.7 14.0
2001 32.4 51.5 14.4 32.3 51.8 14.0 32.6 50.9 15.1
Kottayam 1991 31.2 50.4 12.1 31.5 50.8 12.3 29.9 48.5 11.3
2001 32.9 52.4 13.9 33.3 52.8 14.1 30.8 49.9 12.4
Pathanamthitta 1991 29.7 48.0 12.5 29.9 48.4 12.6 28.3 45.7 11.8
2001 29.7 47.6 13.2 29.9 48.0 13.4 27.7 44.5 12.0
Kozhikode 1991 26.6 44.6 9.0 27.0 44.1 10.3 26.0 45.4 7.0
2001 27.9 48.8 8.1 27.4 47.5 8.4 28.7 50.9 7.7
Malappuram 1991 24.3 40.7 8.7 24.4 40.8 9.0 22.9 40.2 6.3
2001 24.1 42.8 6.6 24.1 42.7 6.6 24.4 43.6 6.3
Kerala 1991 31.4 47.6 15.9 32.1 47.9 16.9 29.6 46.8 13.0
2001 32.3 50.4 15.3 32.6 50.2 15.9 31.6 50.8 13.5
Source: Census of India, 2001, Series-33, Kerala, Provisional Population Totals, Paper-3 of 2001, Distribution
of Workers and Non-Workers. Data compiled from statement- 3.
* Districts are listed according to the ranking of female work participation rate in 2001.
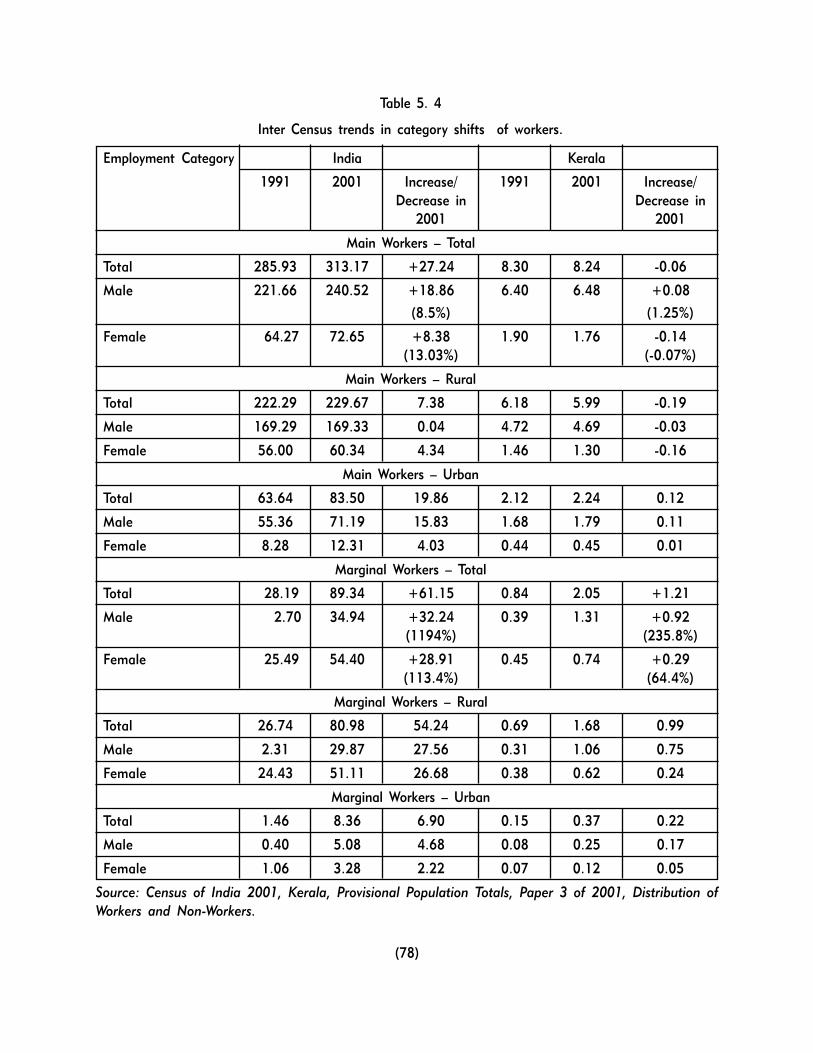
(78)
Table 5. 4
Inter Census trends in category shifts of workers.
Employment Category India Kerala
1991 2001 Increase/ 1991 2001 Increase/
Decrease in Decrease in
2001 2001
Main Workers � Total
Total 285.93 313.17 +27.24 8.30 8.24 -0.06
Male 221.66 240.52 +18.86 6.40 6.48 +0.08
(8.5%) (1.25%)
Female 64.27 72.65 +8.38 1.90 1.76 -0.14(13.03%) (-0.07%)
Main Workers � Rural
Total 222.29 229.67 7.38 6.18 5.99 -0.19
Male 169.29 169.33 0.04 4.72 4.69 -0.03
Female 56.00 60.34 4.34 1.46 1.30 -0.16
Main Workers � Urban
Total 63.64 83.50 19.86 2.12 2.24 0.12
Male 55.36 71.19 15.83 1.68 1.79 0.11
Female 8.28 12.31 4.03 0.44 0.45 0.01
Marginal Workers � Total
Total 28.19 89.34 +61.15 0.84 2.05 +1.21
Male 2.70 34.94 +32.24 0.39 1.31 +0.92(1194%) (235.8%)
Female 25.49 54.40 +28.91 0.45 0.74 +0.29(113.4%) (64.4%)
Marginal Workers � Rural
Total 26.74 80.98 54.24 0.69 1.68 0.99
Male 2.31 29.87 27.56 0.31 1.06 0.75
Female 24.43 51.11 26.68 0.38 0.62 0.24
Marginal Workers � Urban
Total 1.46 8.36 6.90 0.15 0.37 0.22
Male 0.40 5.08 4.68 0.08 0.25 0.17
Female 1.06 3.28 2.22 0.07 0.12 0.05
Source: Census of India 2001, Kerala, Provisional Population Totals, Paper 3 of 2001, Distribution of
Workers and Non-Workers.

(79)
POVERTY
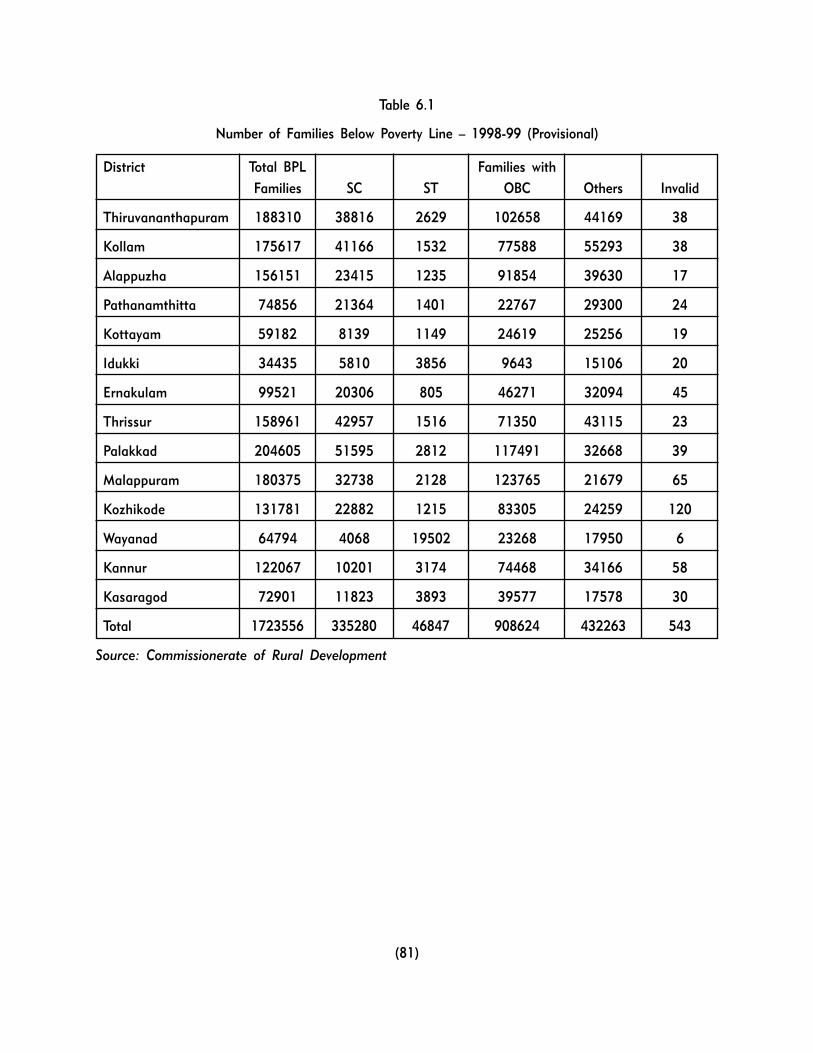
(81)
Table 6.1
Number of Families Below Poverty Line � 1998-99 (Provisional)
District Total BPL Families with
Families SC ST OBC Others Invalid
Thiruvananthapuram 188310 38816 2629 102658 44169 38
Kollam 175617 41166 1532 77588 55293 38
Alappuzha 156151 23415 1235 91854 39630 17
Pathanamthitta 74856 21364 1401 22767 29300 24
Kottayam 59182 8139 1149 24619 25256 19
Idukki 34435 5810 3856 9643 15106 20
Ernakulam 99521 20306 805 46271 32094 45
Thrissur 158961 42957 1516 71350 43115 23
Palakkad 204605 51595 2812 117491 32668 39
Malappuram 180375 32738 2128 123765 21679 65
Kozhikode 131781 22882 1215 83305 24259 120
Wayanad 64794 4068 19502 23268 17950 6
Kannur 122067 10201 3174 74468 34166 58
Kasaragod 72901 11823 3893 39577 17578 30
Total 1723556 335280 46847 908624 432263 543
Source: Commissionerate of Rural Development
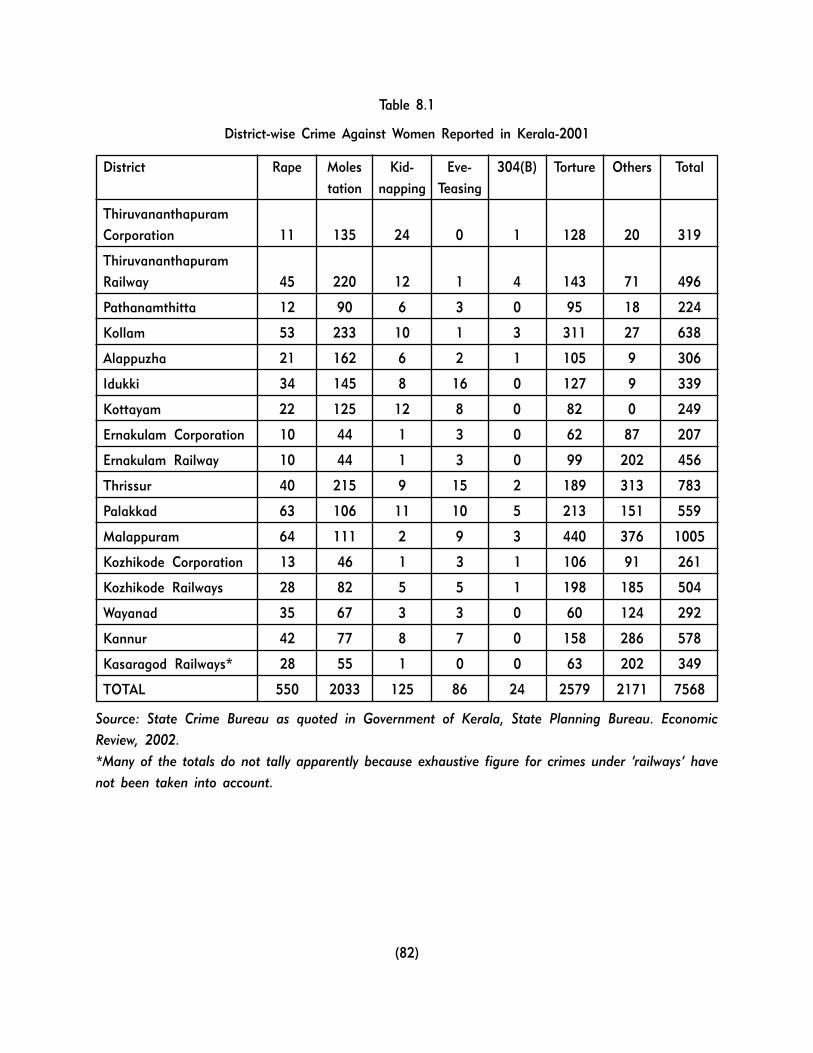
(82)
Table 8.1
District-wise Crime Against Women Reported in Kerala-2001
District Rape Moles Kid- Eve- 304(B) Torture Others Total
tation napping Teasing
Thiruvananthapuram
Corporation 11 135 24 0 1 128 20 319
Thiruvananthapuram
Railway 45 220 12 1 4 143 71 496
Pathanamthitta 12 90 6 3 0 95 18 224
Kollam 53 233 10 1 3 311 27 638
Alappuzha 21 162 6 2 1 105 9 306
Idukki 34 145 8 16 0 127 9 339
Kottayam 22 125 12 8 0 82 0 249
Ernakulam Corporation 10 44 1 3 0 62 87 207
Ernakulam Railway 10 44 1 3 0 99 202 456
Thrissur 40 215 9 15 2 189 313 783
Palakkad 63 106 11 10 5 213 151 559
Malappuram 64 111 2 9 3 440 376 1005
Kozhikode Corporation 13 46 1 3 1 106 91 261
Kozhikode Railways 28 82 5 5 1 198 185 504
Wayanad 35 67 3 3 0 60 124 292
Kannur 42 77 8 7 0 158 286 578
Kasaragod Railways* 28 55 1 0 0 63 202 349
TOTAL 550 2033 125 86 24 2579 2171 7568
Source: State Crime Bureau as quoted in Government of Kerala, State Planning Bureau. Economic
Review, 2002.
*Many of the totals do not tally apparently because exhaustive figure for crimes under �railways� have
not been taken into account.

(83)
Appendix 2
ORGANOGRAM
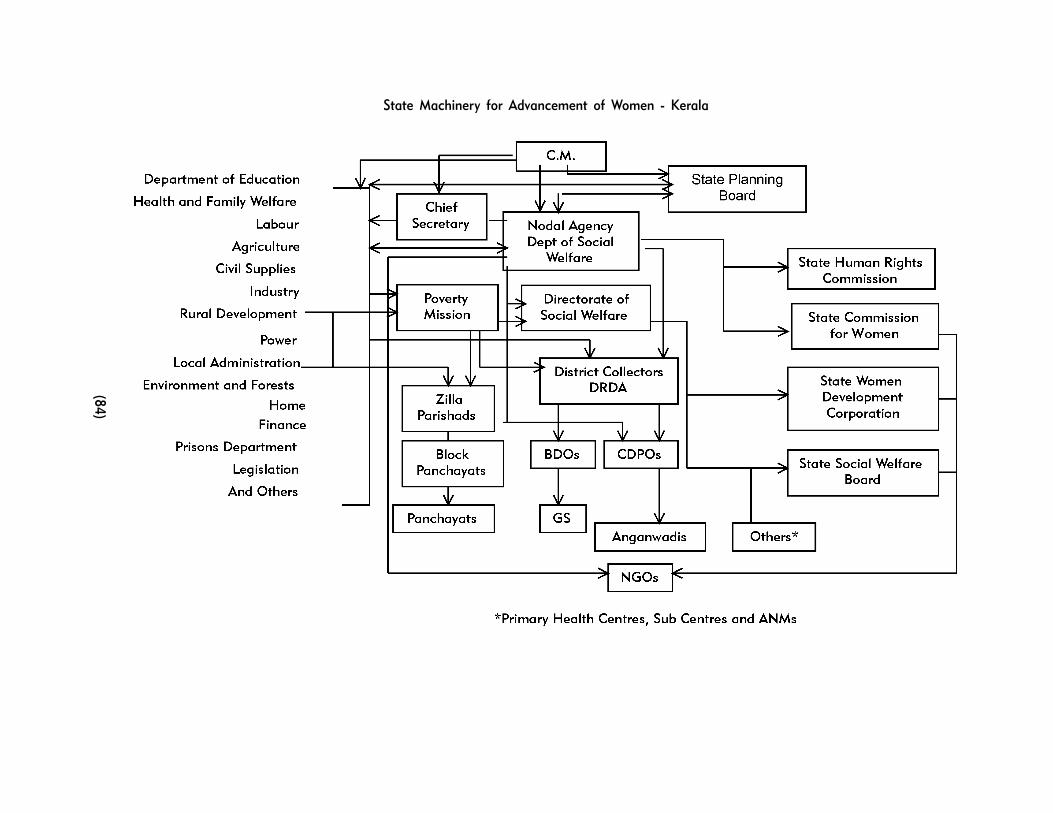
(84)
State Machinery for Advancement of Women - Kerala
(85)
Appendix 3
PUBLIC HEARINGS
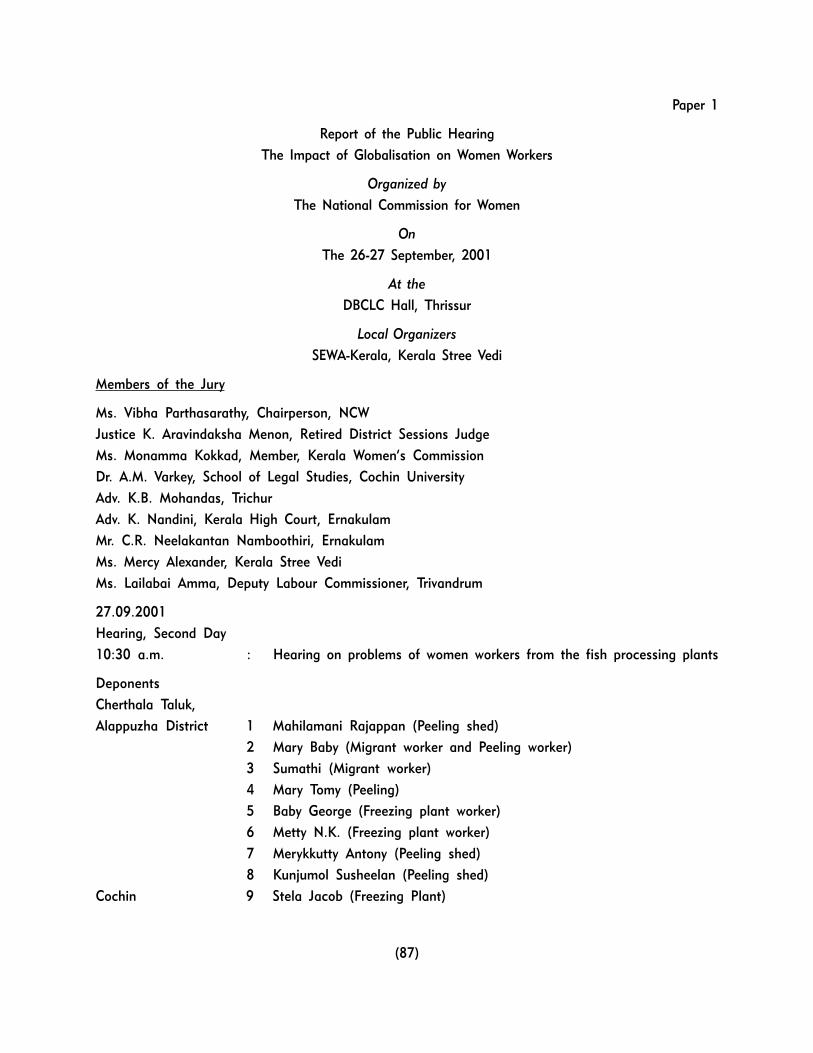
(87)
Paper 1
Report of the Public Hearing
The Impact of Globalisation on Women Workers
Organized by
The National Commission for Women
On
The 26-27 September, 2001
At the
DBCLC Hall, Thrissur
Local Organizers
SEWA-Kerala, Kerala Stree Vedi
Members of the Jury
Ms. Vibha Parthasarathy, Chairperson, NCW
Justice K. Aravindaksha Menon, Retired District Sessions Judge
Ms. Monamma Kokkad, Member, Kerala Women�s Commission
Dr. A.M. Varkey, School of Legal Studies, Cochin University
Adv. K.B. Mohandas, Trichur
Adv. K. Nandini, Kerala High Court, Ernakulam
Mr. C.R. Neelakantan Namboothiri, Ernakulam
Ms. Mercy Alexander, Kerala Stree Vedi
Ms. Lailabai Amma, Deputy Labour Commissioner, Trivandrum
27.09.2001
Hearing, Second Day
10:30 a.m. : Hearing on problems of women workers from the fish processing plants
Deponents
Cherthala Taluk,
Alappuzha District 1 Mahilamani Rajappan (Peeling shed)
2 Mary Baby (Migrant worker and Peeling worker)
3 Sumathi (Migrant worker)
4 Mary Tomy (Peeling)
5 Baby George (Freezing plant worker)
6 Metty N.K. (Freezing plant worker)
7 Merykkutty Antony (Peeling shed)
8 Kunjumol Susheelan (Peeling shed)
Cochin 9 Stela Jacob (Freezing Plant)

(88)
12:30 Hearing on the problems of the women workers in the Special Economic Zone
1 Alice M.J. (Tata Ceramics)
2 Sreedevi M.S. (Tata Ceramics)
3 Jayalekshmi (AVT)
4 Kumari P.A. (Steriltex)
01:30 p.m. : Lunch Break
03:00 p.m. : Response and Verdict of the Jury
Inauguration
In her inaugural address Ms. Vibha Parthasarathy stated that this Public Hearing was being
organized by the National Commission for Women in order to see whether women workers are covered
by the rights afforded to them by the Constitution and if not to find ways and means by which this
can be done. Over the last decade, Globalization and Privatization are impacting on the people in
different ways. Through the visual and print media, this is creating a new life style for the people.
Through the first hand information gathered at these Public Hearings and separate studies undertaken
by the Commission, it is intended to come up with a series of recommendations in December when
the Commission will organize a National Workshop in the Capital.
Prof. Sara Joseph highlighted the fact that globalization has seriously affected those at the
bottom of the economic ladder. With godowns overflowing with food grains, there have been several
cases of hunger deaths in the country. There have been reports of the people attacking food outlets
in utter desperation. Farmers are caught in the debt trap and agricultural workers are jobless. The
traditional employment sectors are collapsing and the environment being threatened by ongoing
developments. The media is creating an artificial culture and the economic reforms are throwing
people into the debt trap. Women have begun to resist this. It is they who decide what they have to
bring into their kitchens and homes. The self help groups that women are creating is an alternate
banking system which develops the awareness of the women. It is through these people�s movements
and struggles for alternatives that we will fight globalization.
The first session of the Hearing focused on the women workers in the Plantation sector.
Deponents:
Kamalam : I am 46 years old and my husband is Balakrishnan and we have two children, a boy
and a girl. Both of them are married and my husband works in a tea shop and earns enough money
for his own needs. My hometown is in Nenmara in Palaghat district. When I was in the 5th standard
I came to my aunt�s house in Wayanad as she had work in the Nedumpala estate. I studied here up
to class 7 and while I was studying I started working in the estate and was soon made permanent.
Two years later, I was married to my aunt�s son when I was 16 years old. I had my first child when
I was 17. My husband drank and even treated me roughly. He used to collect my wages and if I asked
(89)
questions I was beaten so I kept quiet. It is only since 10 years now that I know what exactly I earn.
He still drinks but there are no other problems.
I wake up at 3a.m., cook all the food and leave for work at 7.45a.m. Work on the plantation
starts at 8a.m. till 12 noon and again from 1-5p.m. My husband earlier was a temporary worker on
this estate too but just for two years.
I married my daughter with a loan from my PF. Now there are several problems at work
especially after the fall in tea prices. The management wants to reduce our wages as we now get
Rs.78.20 a day. We have opposed this. According to the Plantation Act, we have to get our minimum
wage for plucking 14kg. of tea. But now this is not possible as we are forced to pluck 30 kg. if we
do not reach these targets, we are scolded and abused and this is very painful. They tell us we need
not come back for work. For those of us who fall sick there is no go. Earlier we all helped each other
to reach the target of 24kg but now this is not possible as 30 kg is too much to cut. We now use a
sheers and this is again a cause of ill health. But this is no problem to the company.
The quarters we live in are in a really bad state and they do not maintain them. The houses were
wired 14 years ago but we got electricity only a few weeks ago. The company hospital too is in a poor
state. I was admitted there for 38 days as I had a bad stomach ache. They took 5 x-rays and said
I had an ulcer. When my son asked that I be transferred to another hospital they refused. I then went
to private hospital and I had a fibroid in the uterus. I underwent a surgery which cost Rs. 14,000 and
the company did not pay a pie. They only gave me half pay leave for 28 days. Even the union was
not able to do anything to help me get my due.
There are two sections of the estate and where I work there are 120 workers. After the fall in
tea prices, there are all kinds of problems for the workers. There is discrimination against the workers
too. For those of us who are slow, we are sent to the poorer areas were it is impossible to pluck 30
kg a day. By making the permanent workers work more, the temporary workers are reduced.
There is no school here and the children have to walk 5 km each way to school. There have been
several discussions with the management as the government was willing to run a school here if the
company gave them the space. But this has not yet happened. There is a high school 14 km away and
if a child is studying there s/he needs Rs.5/- daily for the bus fare. There are no other transport
facilities. As there is no work for the youngsters, they are getting into bad ways. This has to change
somehow.
Subara Bee is a temporary worker on the same estate and adds:
I am 30 years old and came here from Malapuram with my family of 7 children. I studied only
up to the 7 standard but can read well. As I was the oldest child and as my mother went to work,
I had to give up my studies to care for the family. I was married at 13 years of age had my first child
at 14. My husband was a worker in the near Rippon Estate He was a very cruel man and tortured me
a lot. When I had my first child I heard that he married again. He disappeared for some time and when
(90)
he came back I was pregnant again. Three months later he left the place again and I did not see him
for two and a half years. He returned and stayed with me for 9 months and I had another child. When
he realized that I would get no special allowance at this pregnancy, he left and I have not seen him
since. By this time he had pawned and sold all my gold.
I have started working from the age of 11 because there was very little food in the home. I used
to do coolie work of weeding and plucking coffee. I used to get Rs.2.50 a day and my husband took
all the money from me. There have been several days when my children and I went to be hungry. Now
my children are studying in the 10th, 9th and 6th standards. Now I am the second wife of another
man who married me because he did not have children by the first wife. I had to pay a dowry of
Rs.100,000/-.
I have been a temporary worker on the Nedumpala estate for the past 16 years. I haven�t been
made permanent yet as the management has made no body permanent for the past 5 year. Since the
past two years as temporary workers we are forced to pluck 30 kgs. of tea now and we are told not
to come to work if we cannot do this. It is very difficult for women to be made permanent of the
pretext that we take maternity leave. We are also forced to do the general work of spraying etc and
for this there are no protective measures. So many of us are ill with breathlessness and headaches
and many of our children suffer from TB.
Now there are 3 young women and 42 males who have no work and I fear these will soon turn
to anti social activities. When the owners were making profits, they did not tell us about it, but now
in the time of crisis they come to take for us and tell us to cooperate.
Nelliampathy Chandramala Estate
Kunjamma Joseph: I have passed the 10th std. And have typewriting lower and have done the
higher course as well. My husband is a construction workers and our 3 children are studying. Our
parents are from Punaloor and came here to work in the estate. It was the writer in the estate who
helped me study. My sisters only studied up to the 4th std. The high school has come here only since
six years. We had to walk a long way to school, as there are only state buses on which there are no
concessions even now. We need Rs.25/- a day for transport and this is the reason why no one sends
the children to school. I have married my sister�s brother in law. They came here from Madurai. I
married in 1985 and he left in 1988 and returned five years ago. Now we are together.
My mother worked for 33 years on this tea estate. In 1986 I started working on this estate and
became permanent in 1994. My mother retired in 1999. There are three tea estates in Neelliampathy.
It is mainly women who pluck the tea and the work like weeding, digging, spraying etc is done by men.
In the tree sections there are altogether 3000 workers. In Chandramala itself there are 485 permanent
and 115 temporary workers. The work timings are from 7.30 am to 4.30 pm. Normally pesticide is
applied once in 15 days and manuring is thrice a year. But now since the price of tea has fallen, this
maintenance work is also reduced. Last year we got 20% bonus, but his year we received only 8.33%
bonus. We all went on strike to oppose this on May 15 but the company locked out and reopened only
(91)
on June 1st. On June 7th we got back to work with nothing achieved. On the contrary the management
got even more strict and insists on us coming on time and taking no breaks and for those who are
ill there is no excuse. When we take advance, Rs.4/- is reduced from our daily wages.
The big problem is that our men drink a lot and then violently harass us women. Many of us
women have lost our health because of this. Unemployment and drunkenness, the transport costs and
ill health are all the various problems we face. In these circumstances, if the managements take a firm
stand; we will all loose our work.
In the last elections, I stood for the panchayat elections and was elected. There are 4 of us
women in the panchayat. Seven of us are estate workers. My parents were members of the AITUC
union. I am also the secretary of the women�s mandalam.
Waryad Chembra Peak Estate
Elsy: I am 51 years old and since 35 years have been working on this estate. I have been a
permanent worker since 1977. We have come here from Cochin and we have 5 children. Since the past
25 years I am an active worker in the Plantation workers union and am the president of our unit.
I have mainly been plucking coffee and weeding. There are 391 acres of land in this estate and
despite the fact that we grow different things, the main crop is coffee. The head office of our estate
is in Bangalore. There are 92 permanent workers here and 40 temporary workers. Of these 72 are
women and 70 men. This was an estate with a very high production. When prices were high, the
management even gave us clothes. In the plucking season, they employ casual workers from Karnataka.
On the 7th of every month we got our pay. Since this July, we are paid on the 10th of the month.
After the harvest in April, all of us got annual leave. This was leave with pay and minimum bonus
together with travel costs. This year we did not get this bonus as they told us that the prices of coffee
had fallen and they incurred a loss. After the union leaders made a noise, we got this bonus. Every
year we got Rs.250/- for the books of the school going children. They reduced this at the time of giving
us the Onam bonus. But this year they said they could not give this to us. At the end of June there
were discussions with the management and the management put forward thirty demands. Among them
they wanted to reduce the permanent workers, dismiss the medical attender, have only one instead of
two ayas in the crèche and one driver instead of two, no mechanic, no cleaners in the office and to
extend the working hours, no health treatment from private hospitals and for those on medication, no
work. This is an estate on which much pesticide is used including the banned endosulfan. Even the
water we bath in has the pesticide and many of us suffer from breathlessness and giddiness. This year
the estate has not been maintained. As we did not agree with the demands of the management, the
decision was postponed and they have not called for talks since then. Then we got to know from the
notice in the muster room that there is no bonus for us this year. No other advances too are permitted.
After some time we did not see our Commercial Manager who had promised to negotiate for us. This
August 11th, we read that 21 workers have been dismissed. They got their dismissal notice together
(92)
with a Cheque with all their benefits. Whey they refused these cheques, the next day the estate was
locked out. They did this with police protection. The dismissed workers had from over 10-23 years
service.
All of us are in dire straits. We organized a march to the Collectorate asking at least for free
rations. We have been informed that the district labour officer will negotiate. The management thinks
that the workers will go to other places in desperation although they are not going to close down the
estate. All the unions are on strike as this has affected all the workers and we are left hungry.
Cheruvally Rubber Estate: Harrison Malayalam Ltd. Erumely
Anthoniamma: I am 53 years old. I was married when I was 18 years old. It is 12 years since
I lost my husband and I have a son 16 years old. My mother lives with me. We came here from
Tenkashi in Tamil Nadu. Our father died young and because of the difficulties at home I started
working from the age of 13. At that time I got Rs.1.25 as daily wage. Since 1969 I am a permanent
worker here.
My main work was rubber tapping. The work time is from 7.00 a.m. to 1.30 p.m. We have to
tap the rubber, collect it and take it to the milk station. We are supposed to tap three blocks of 400
trees each once in three days. We used to get a half hour break in between but that is reduced to
15 minutes now. Now I am doing slaughter tapping and this work is very hard. I have to carry a ladder
of 7-7 and a half feet, which weighs around 20 kg. although according to the law the ladder has to
be 3 feet only. Because of this many of us women are ill and have undergone a hysterectomy surgery.
Back aches and pain in the arms is usual. Several women have even fallen from the ladders. The male
supervisors also threaten and laugh at us and never help us when we fall. I also have to carry the knife
and the bucket in which I collect the latex and the hardened rubber. Most of the women get help from
their children or we will not be able to meet the target. Because of this the education of the children
is affected. If we arrive even a few minutes late for work, they do not engage us that day. We are
scolded and threatened all the time and even punished if we do not meet the targets. In order to
increase production they inject chemical hormones in the trees. This has increased the production,
which means that our work load has also increased. During season times we get work by 5am. We have
to collect 8 kg. dry rubber for the minimum wage. For this we need at least 25 kg. milk, even in the
measuring they cheat us and we cannot question them. In the rainy season, they reduce the quantity
saying it is watery.
Although we soil our clothes at work, they do not give us uniform according to the Plantation
Act. They even refuse to pay our medical bills and have reduced our bonus to the minimum. The
company has not paid their share of the PF and they insist that we work on Sundays. We are now paid
on the 14 instead of on the 7th of the month. When the management enforced the D-4 system we
went on strike in March 9th this year and since then as the management has not called for talks, we
have been out of work. None of us have any savings. We are all in debt. I do not have a cent of land
to call my own. We have decided to struggle on to get our rights.
(93)
Mahavir Plantations, Bonacaud
Baby: I am 52 years old. We had 3 children of which one died. My husband has been disabled
since one year with a stroke. In 1968, I came here from Tengapatinam in Tamil Nadu. I have studied
up to the 8th standard and married when I was 17 years old.
I have mainly been a tea plucker and in the beginning got Rs.1.50 as daily wage. This was an
estate where there were over 1000 workers and those who retired were replaced. But now as the prices
have fallen, there is no replacement and our workload has increased. Since 5 years the payments
started getting irregular despite the fact that the production remained the same. We began to get our
salaries once in three months and later once in six months. Then we started to strike and in 1999
December we reached an agreement with the management who promised to pay our dues in three
instalments. But since then he is absconding. He has not paid the company�s share of PF since 1997.
Now we are still due 26 months salary. Although there are all the facilities on the estate, nothing has
been functioning since the past five years. We have to come to Vithura to get to a hospital and school
now, which is Rs.14/- up and down. Children are not having concession. Our children live in orphanages
in order to study. This Onam we received Rs.1000/- and 5kg rice from the government. We are all in
debt and try to eat what we collect in the forest and around. We are all still working and plucking the
tea but we are being cheated by the local managers who do not give us our due. When my son died
in an accident in Madras, I could not go because I had no money.
Farm Sector
Deponents
Ancy Sebastian: I am 48 years old. I have been married since 26 years. We have three children.
My daughter has just completed her nursing and the two boys are studying. One completed his B.Com.
and doing a computer course and the second completed his 12th and doing a computer course.
In 1962, we moved from Moovatupuzha and as squatters we occupied some land in Poovaram
thottil, Wayanad. I came with my parents and 8 of us children and we started farming. We grew lemon
grass and made oil and as we had some wet land we also grew paddy for some time and later shifted
to tapioca, pepper and cashew. In the early 70s we planted 300 rubber trees but as they did not
proper, we grew aracnut instead. Then we also uprooted the cashew and planted coconuts. We also
had some cows and buffaloes. And we managed to live like this. As it was difficult to get firewood,
in 1980 we stopped making lemon grass oil and stopped growing the grass too.
I was married in 1975 into another farming family and we had 5 acres of land. We grew mainly
arecanut, coconut and rubber and my husband and I did all the work. But with the hard work both
of us got ill and so we had to hire labour to help us. Annually we get 12 quintals arecanut and 6-
7000 coconuts and 16 rubber sheets per day. But the production has been falling because of disease
and natural calamities.
We also have high expenses. For arecanut we require 110 quintals of manure, waste, dung and
chemical fertilizer. We have to use pesticide two to three times a year. It is Rs.125/- per kg. of pesticide
(94)
and coolie for the two workers is Rs.150/- each and food. We need about 5-6 kg. of pesticide a day.
For plucking the aracanuts it is Rs.2.50 per tree. To open them it is Rs.4.00 per kg. To pluck the
coconuts it is Rs.3.50 and dig the pit around it is Rs.7/- per tree. We require 4 quintals of manure
a year for the coconuts. Only if we do all this will the coconuts yield well.
For the rubber, we have to pay Rs.60/- per plot (300 trees). Even if the trees are less, the
minimum is Rs.60/- but for more trees we have to pay more. We have lost more of the pepper we had
and we get about 20 kg. at the most. We had also grown ginger but even that was diseased and we
stopped. Growing all this for the costs today is not viable.
We have taken loans both for constructing our house and for the farm but our house is not yet
complete and we are deep in debt both from the bank and from friends. We have also pledged all our
gold in the bank and have a debt of Rs.400,000 today. When the prices of the products rose in the
80s, many things changed for the better in our lives. We got a fridge, phone and TV and the wages
for the labour increased. With this the amount paid in dowry also increased. But with the fall in prices,
we have all been ruined. There is no price for the products we sell, but there is no reduction in the
prices for the things that we buy. When rubber was Rs.68/70/- a kg., the prices of rubber slippers was
Rs.50-60 but now when the prices of rubber has fallen to Rs.28/-, the price of the slippers remains
the same. Even the electricity charges and the but charges have increased.
As both of us are sickly, we are not able to do much work ourselves and the costs of medicine
have also increased. Doctors fees are also much and this is a big expense for us each month.
Educating the children is also expensive. Now that our daughter is to be married, the rates quoted for
the dowry are impossible. And we are not able to sleep thinking about all this. In order to meet all
our expenses, even if we want to sell our land and make some money, there are no takers for the land.
In this situation, we do only the work that we can do ourselves. And so we cannot maintain the farm
by manuring it etc., because of this even the labourers do not have work. We do not know how far
we can go like this. We only hope things will change for the better and we live in this hope.
Elizabeth Ommen: I am 36 years old. I come from a family where all were in agriculture. I studies
up to the Pre-degree. But because of financial difficulties, I stopped my studies. My father died in
January 1990 and this was a big shock for us. My father had taken Rs.1900/- as loan from the
Manathavady Syndicate bank to grow coffee. He paid back over Rs.8000/- as interest and we had a
balance of Rs.3000/- to pay. My father went around ploughing people�s land and he wanted to sell the
bulls in order to repay the loan. But at that time there was an announcement of the Prime Minister
V.P. Singh to write off debts up to Rs.10,000/- and so we did not pay the balance Rs.3000/-. But in
1990 January without any warning, the bank officials came to auction our land. Our father was not
at home and moreover he had got a stay order to postpone the auction till the end of January. The
auctioneers ordered us to vacate the house and all the neighbours gathered and we promised to pay
back the money by 5 p.m. but they did not listen. As my marriage was fixed, we gave them the two
sovereigns of gold necklace we had bought. That night my father committed suicide. Haring this, the
(95)
thahasildar returned the necklace and we paid back all the money that week. In July 1991, we received
a letter saying that our debts had been written off and we were returned Rs.3330/-.
Father�s death was a big obstacle in our lives. My brother stopped his studies. My marriage was
postponed. Our main crops were coffee and pepper and we made lemon grass oil and we stopped this
when firewood became scarce. Because of the wild pigs we could not plant tapioca. We grew vegetables
for our own consumption and gradually disease killed all our pepper too. In 1989-90, we used to get
2 quintals pepper but this has drastically reduced now to 45-50kg. We also have arecanut but these
trees are still young. But even this prices has fallen. Our main production is now coffee.
In 1997, I was married but my family is in more than Rs.80,000/- debt for my marriage and
other things. In this situation, the prices of our produce have also fallen. In 2000, my brother got 5
quintals coffee and selling this he did not even get sufficient to pay the interest on our loans. We
mortgaged 1 acre of land belonging to my mother and got Rs.20,000/- more loan. We also took
another Rs.2,000/- as loan to pay the interest.
In order to increase our earnings, my brother took some land on lease and planted 4,000
bananas but we lost some of this because of the storm and with the low prices he ended in a loss.
The next year, he planted 1,500 bananas and even that ended in a loss. But this year, he planted only
in our own land and we have managed to come out without profit or loss. During this time, we received
auction notices for the half-acre land in my name. I pledged my gold and paid back this loan.
Even though that is a very small family they cannot make ends meet and my fate now is no
different. We have 2 acres land with our two children and my mother-in-law. Rubber and coconut are
the main crops and we have 2 cows. We get tapioca for our own use but no other food crops and we
have debts too. We work ourselves and now with the fall in prices even with our own work we make
no profits. We wonder what will be our future. All that we sell has no price abut there is no price
reduction in all we buy. We feel that it is only if the government intervenes that things can improve.
Mary Eapen: I am 56 years old. I have one daughter who is married and lives separately and
only my husband live on our land. I was born in Palai and because it was difficult to survive there we
moved to Rajakad in Idukki district where we had 90 cents of land. I was married there but then we
moved to Pulpally in Wayanad in 1977. We lived there for 7 years on 1 acre 90 cents of land and after
that moved to Kakkadam Poiyil. Here we have 2 acres land since the past 16 years. My husband is
a TB and asthma patient and constantly needs medicine and now because it is so difficult I have not
bought medicine for the last one month.
My daughter is married and she and her husband are also farm workers. In 1985, we pawned
1 acre of land and got a loan of Rs.12,800/- from the Eranad Farmers Cooperative Bank, Mangery
for coconut farming. We planted 60 coconuts but these were all destroyed by the wild pigs. But the
climate here is not suited to coconuts. Since the loans was for coconut, the bank did not allow us to
plant arecanut but we did plant 500 arecanut trees. Even that the pigs destroyed, 160 in one day
besides that there is the disease and so it is impossible to make ends meet. I informed the bank about
(96)
our difficulties but they insisted that we repay the loans. One day in desperation I was running away
madly and the storekeeper seeing my grief, offered the money to install a solar fence to keep off the
wild animals and I did this.
Now we have 20 coconut palms and some arecanut. In 2000, we got 10 quintals of arecanut
and 15kg of pepper. In February 2001, we got a bank notice saying we had to pay back Rs.
36,688/- or they would confiscate the land. Then our local leaders met the Chief Minister and others
and we were told that the confiscation measures would be withheld and this was published in the
Deepika News. But that day itself, the bank auctioned our land to the bank. The next day I went and
paid Rs.8,000/- to the bank from the sale of our ginger. First the Manager refused to take back the
money but later insisted that I give him all the earnings from the land and he insisted that I sign a
papers saying that the entire amount would be repaid by August 2001. Although we only mortgaged
on acre of land, the bank has take possession of the two acres accounted for in our title deeds. Of
this I have given 1 acre 30 cents to my daughter as the only dowry. Now the bank can throw us out
of our house at any time. If prices were good, we would certainly have been able to pay back our loan
little by little but now neither the products nor the land have any value. It is also time to renew the
solar fence, but I just cannot think of it.
Rosa John: I am 63 years old and have two children. My husband died of cancer. I was married
at the age of 14 and we came to Wayanad from Thodupuzha as servants of the landlord we were
working with. We worked as slaves for nine years. I dig the fields and do all the agricultural work and
initially we women got 50ps and the men got Rs.1.25. We carried our babies with us to work. When
it was impossible to live on what we earned, we took some land on lease. We gave the owner half the
crop of paddy as rent and we worked on our land only when we were off work with the landlord and
live that we were able to buy 28 cents of land with Rs.650/- that we saved. We then worked as coolies
and made our living. My husband tapped rubber too and I did all other kinds of heavy work and I could
earn up to Rs.70/- a day. We also took land on lease to grow ginger. Earlier we got Rs.3-400/- for a
quintal of ginger and there was regular work in those days. But since the last year, nobody calls us
for work as they tell us that agriculture is not viable. At this time my husband got cancer and I need
a lot of money for his treatment. I sold a part of our land and now have 13 cents only. There is even
no work in the time of the coffee harvest. Earlier I would earn around Rs.100/- a day in the harvest
time but now nobody calls us to harvest even if we demand less. We are now really in bad shape and
the daily wages have fallen to Rs.60/-. One day I asked for Rs.5/- more and with that the landlord
stopped calling me for work.
My daughter is married. I live with my son who is a painter but now there is no work and for
him too the wages have fallen to Rs.125/-. We need at least two and a half kilogram of rice a day
and we die to eat fish once in a way. We have sold several of our vessels. The panchayat gave us a
loan of Rs.20,000/- to build our house but even that is not completed and I do not know how we will
go ahead. With the fall in prices, people like me are the worst hit and we really hope the Government
will understand our plight and do something to help us.
(97)
Sreemathi: I am 65 years old. I have 2 boys and two girls and all of them are married. My
husband died two years ago. I have studied till 2nd standard. My family has migrated from the eastern
side of Thrissur to the western side. There we both worked as coolie workers. In between we acquired
90 cents of land of forestland. We started cultivating this land and at the same time continued to work
outside. In olden days, in my village the main crops were paddy, plantain, vegetables and various types
of roots. Pepper and coconut were the only cash crops. For paddy harvesting we used to get one share
after 8 �paras� go to the worker. Later it became 5:1. But now most of the paddy lands have been
converted to other cultivation. In olden days, even though the wages were less we were getting enough
food to feed the family. The amount of rice we get during one harvesting were enough for one family.
We used to make different items from the root items.
Slowly all these lands have been converted to rubber plantations. Initially the rubber board
encouraged the farmers to cultivate rubber with subsidies. They demanded to cut the trees in the land
(mango trees, jack fruit trees, fuel wood and other wood trees) for getting subsidies. Most of the lands
were full of these varieties of trees and that time we got the work of shifting these woods from the
land. As most of the farmers were having land varying from 2-3 acres, they themselves started to tap
it. Otherwise they used to take men for tapping. But now with the fall in prices most of them are doing
it by themselves or not tapping at all. Rubber was pushing out women from work. Then I turned to
brick making in Puthoor Padam which was known for its paddy cultivation. There also we faced crisis
and then I turned in to construction work. I worked there as a coolie worker. Now there is also no work.
My neighborhood women were supposed to come for this hearing but she could not turn up because
of the fear of losing the construction work. Once they won�t go the employer will take other person
replacing them. The construction field is also too dim as there is no money with the people to invest.
Now my health status is very bad and I am not able to do any hard jobs. Moreover there are
no work even for the men. My sister in law was running a small hotel and now she closed it as nobody
is paying ready cash. Everything will be on credit.
Comparing to the olden days the wage has increased. But the prices of all other things that we
need have increased. Even to get ration we have to pay much. Now I am making garlands for the local
temple and also doing cleaning and cooking for the temple priest. I am earning an amount of Rs.
300/- per month.
Now my son has kicked me out from my own house and he is torturing me a lot. Now I am
staying with my daughter and I have to pay Rs. 6/- everyday for bus to go for work.
Special Economic Zone (SEZ)
Luxy Babu: I am 35 years old, married with two children. My husband is a painter on wage work.
I have joined Trend Setters in 1991 June. I am one of those who joined in the industry right from its
inception. Initially I received a monthly salary of Rs.300/- per month for the first three months which
was increased to Rs.500/- and then an increment of Rs.100/- each following year. At the closure time,
(98)
I was receiving a salary of Rs.1,647/- a month and initially I got Rs.7/- an hour as overtime and
towards the end Rs.15/- per hour. On Sundays the overtime was doubled.
The working hours were from 8am to 5pm. There were supervisors to supervise our work so that
we were allowed no relaxing. Cutting was by machine according to a fixed pattern. Each worker worked
only on one particular piece and I only did pockets all my tenure. There was no skill up gradation, and
great monotony in work. In this factory, they got their lunch and two teas. There was a nurse to attend
to illness. Initially, there were 1,000 women employed and these were gradually reduced in order to
take casual workers and at the time of lock out there were about 600 permanent workers altogether.
This was a big loss for me. I only expected a total of Rs.2,000/- but instead we lost our jobs. They
even suggested that our food be stopped in order to give us the rise. The management did not get
into any negotiations. They just closed and disappeared. We did not get our dues and we wonder why
the company closed down. This is the case with many companies. As even my husband does not get
work regularly, this work was important for me to have money to feed our children. Now I go for piece
rate work and earn Rs.1000-15000/- a month.
Jayalekshmi: I am 27 years old and have two brothers and two sisters. My parents are unemployed
and two of my brothers work in private companies. While I was in my Pre-Degree, I joined Midland
Latex Pvt. Ltd., an AVT group company. For the first four months, I was employed as a temporary
worker and paid a salary of Rs.400/- a month.
Then I was taken on as a trainee and given an increment of Rs.30/-. This increment was given
as an incentive to encourage me. After that there was a probationary period of six months. I received
a salary of Rs.1,500/- a month. In 1992, I was confirmed with a pay scale of basic Rs.450/-, plus house
rent allowance and DA making a total of Rs.1,800/-. In 1998, the union leaders asked us to join them
for a strike to ask for a wage hike of Rs.1,000/- per head. The management requested us to keep away
from the strike and promised us an increment of Rs.500/-. But the union leaders did not agree and
we went ahead with the strike. After a month the management called for discussions. At that time
there was only the CPM led CEPZ Workers Association and one Janatha Dal Union called the CEPZ
Workers Federation. Finally the management agreed to pay Rs.250/- per head and stated that this
agreement would be valid for three years. But in between in 1999, the management started to lay off
workers. During this period, the women workers were obliged to work two weeks with a compulsory
one hour over time for which we got no extra wage. But the men were made to work only one week
without overtime.
During this layoff the management employed casual workers and so we understood that this was
a strategy to move towards contract work. The management also applied for retrenchment of 53
permanent women workers while men who were far junior were kept on. I was one of the committee
members of the CPM led union and I approached the leaders. They advised us to accept the retrenchment
notice and leave the company as the management promised men one more increment with the work
continued. Unable to accept this, we women created our own union and gave a representation to the
(99)
Labour and Rehabilitation Secretary. He called a meeting with the management and the unions, but
our union was excluded as we had registered only after the notice was served. So there was nobody
to speak for us. Only 11 senior workers were retained and the rest not reinstated so we were forced
to go to the High Court. The Single Bench verdict was in our favour and advised the management to
continue with production and if the number of workers was in excess, retrenchment should take place
on basis of seniority. So the next day although we entered the company, the management did not allow
us to work and on the next day, the management got a stay order from the Division Bench of the High
Court and so we were ousted. We approached the court to withdraw the stay order but we lost. Those
11 workers that were earlier retained were also retrenched the next day.
There were altogether 93 female and 100 male workers in the company. All were permanent but
15 had earlier resigned as the management transferred them to Pondicherry. In April 2000, the
company was finally closed given a handsome amount to all the male and 25 female workers who were
still working in the company. All others were given a small compensation.
While we worked, the management harassed us no even giving us the recognized holidays like
Vishu, Easter etc. Absenting ourselves on such days was calculated as loss of pay leave. We had a total
of six casual leaves but this was not sanctioned on the days that we wanted. The company was
reluctant to take on married women because of the leave benefits due to them. In our company almost
all male workers were from outside the district as also around 25 female workers. They all lived in very
congested rented rooms.
I sincerely hope that the National Commission for Women will take measures to see that the
existing labour laws are applied in the SEZ. Shelters and health facilities especially for the female
workers should be provided. This will help my sisters who get work in the zone in the future. And also
we should be appointed in the company if it is reopening again.
P.A. Kumari: I am 32 years old and have 2 brothers and 4 sisters of which 2 sisters are married.
I am single. My father is a coolie worker therefore it was important for me to find some work. I have
studied upto my degree but have not passed. I finally got work at Steriltex India Pvt. Ltd. in February
1997 after two years in AVT Rubbers where I got Rs.750/- a month at the time of retrenchment.
Steriltex started working in 1995 April producing gloves by a USA based NRI. It was a small
multinational company as it has sister concerns in Malaysia, China, Taiwan, USA, South Korea and
Canada. I started as a temporary worker and the company appointed me as a general worker in 1998
and I was confirmed as a general worker trainee. Initially, I received a salary of Rs.650/- which
continued for one year. Then it was increased to Rs.1,000/- and later to Rs.1,250/-. After confirmation,
I was on a scale of basic of Rs.745/- with DA making a total of Rs.1,700/- a month. In addition Rs.
125/- was given as house rent allowance. I have paid PF every month till the company refused to take
it in August 1999. Nobody in the company receives any documentation of their wages or deductions.
While the employee�s share was being deducted for PF etc. the employers only paid their share for the
first 9 months. There are altogether 126 permanent workers and about 100 contract workers. After
(100)
1998, nobody has been appointed as a trainee. The company paid 8.33 bonus for the year 1997-98,
1998-99. We workers were paid Rs,.2/- per head to the union and a percentage of the bonus with
which the union constructed a union office.
The company has a production capacity of 4 lakhs pieces of gloves a day. Slowly this was
reduced to around 50,000 pieces at the time of closure in April 2000. A punching system was
introduced but this was stopped a few months before the closure of the company. The company claims
that closure was due to the shortage of material. Although the workers worked on till April, wages were
not paid from January onwards.
We had a CPM led union in the company. I was one of the committee members. We were assured
by the union that this was only a temporary closure and that work would resume. So we too kept silent
and then we came to know that the leaders would not really help us so we started a strike in November
and gave our petitions to all the concerned bodies. We staged a dharna before the SEPZ Development
Commissioner�s office, and then we met the Collector. We also led a march towards the house of one
of the Board members but the police stopped us. The collector discussed the issue with the additional
District magistrate and on his instructions the management paid the wage of January 2000.
I request the National Commission for Women to make an enquiry into the conditions of work
in SEPZ and see that the labour laws are applied and that we get our due compensation.
Sreedevi MS: I am 33 years old, 10th failed. I was married at the age of 19 years. I got 8
sovereigns of gold and Rs.10,000/- as dowry but the marriage lasted for 10 months only. My husband
was a drunkard and was on drugs and he used to beat me. I demanded a divorce and then I had to
go back to my parent�s house and was dependent on my father. I have one child for whom I needed
money to educate and so I had to look out for work. I first went to a printing press for work but since
we were expected to oblige the owner for various things, I gave up the work there after six months.
I actually had no gains from there. Later, with the help of a Municipal Councillor, I found a job in Tata
Ceramics in the CEPZ complex in July 1996.
At the start, I got Rs.850/- in the first months which increased to Rs. 950 and then to Rs.
1,070/- and later to Rs.1,200/- and this remained for the next years. Gradually the workers began to
organize under the established trade unions but it was clear that the demands of the workers were
different from the priorities of the union leaders who were under the hold of the party leaders. Neither
of the two major parties were interested in the issues of CEPZ, so we organized an independent trade
union. We first sent a letter to the District Labour officer regarding the low wages and asking for a
rise but there was no positive response. Then we went to the Assistant Labor Commissioner and then
to the Regional Joint Labour Commissioner and he called a meeting of the CEPZ Development Commissioner
and the union leaders for a discussion. But these talks also achieved nothing and so the workers
decided to go on a joint strike and we went on a three-day warning strike. The management then
called us for discussions and offered to raise the wages by Rs.350/- and we did not accept that and
then without any warning, the company declared a lockout. For three months the factory was closed
(101)
and during this time we kept watch on the factory in groups day and night, the men taking the night
watch. We used all kinds of pressure tactics and so the management called for talks again and agreed
to give each worker a rise of Rs.600/- and so we decided to go back to work. But for this the quantum
of work was also stipulated. This settlement was in February 1998 and was valid for 2 years. In 2000
May, the agreement was renewed and DA was introduced. There was an additional allowance (of
Rs.500/0) if we packed 2.80 lakhs pieces in a month.
This company started in 1994 and in 1995 it started the production of ceramics. There are
about 235 permanent workers and 400 trainees and 200 contract labourers. Of these, besides the
permanent workers, 70% of the rest are women. The trainees get work for 5-5½ months and then a
laid off for 10-15 days and then they are called back for work. This is a continuous process. The agent
who supplies the contract labour is one Soman. He even brought three child labour at one point but
the other workers did not permit this. The contract workers get Rs.50/- per day out of which they have
to give Rs.5/- to the contractor.
There are 4 shifts of work: 8am to 4pm, 4pm to 12 night and 12 night 8am, 10am to 6pm.
Those who work in the evening shift get Rs.4/- extra per day and the two night shifts get an extra Rs.
5/- per shift. Women work on the 8am to 4pm shift.
The permanent workers have the ESI, PF etc. we get a casual leave of 7 days and one earned
leave for every 20 days work, there are 11 holidays, ESI privilege leave to the maximum of 18 days.
To qualify for this the ESI doctor has to certify and this is difficult to get and the doctors hold us to
ransom often, as we have to bribe them. When I was admitted for an appendix surgery the ESI doctor
did not give me a certificate and so I did not get the privilege leave. On one occasion we organized
a big strike before the ESI hospital as our contribution to the ESI is deducted from our salary every
month and we get no benefit from it. Ours is probably the only company in CEPZ in which we get an
appointment letter and a pay slip. We have to pay Rs.20/- as professional tax every month.
In the midst of these difficulties, the management tells us that the goods from China that are
being imported into India are cheaper than ours and so we are loosing our orders. Recently, we had
an order from England and we received the initial order but at very short notice, the order was
withdrawn. Now the management is making big pressure on the permanent workers imposing more
production demands on us so that the production costs are reduced. The increases in electricity costs
are also another problem that has added to production costs. They have told us that they will give us
an incentive if we increase production and reduce the casual workers. Now there are discussions
between the management and us as to the manner in which we can keep production going so that
we do not have to close the factory. We cannot think of a time when we will not have work and so
we are making all efforts to cooperate with the management.
Fish Processing Sector
Stella: My name is Stella and I am 47 years old and live in a very densely populated island called
Vypin. I have studied up to the 7th standard and have 2 children. My husband is unemployed. I started
(102)
working from very young. When I was in the 3rd standard. I was also going to work. I worked initially
in a peeling shed for over 15 years and from there I went to a little company where the owner offered
more wages. So several of us went there. There we got 30ps for pealing a basin of shrimps (supposed
to be 3.5kg but it is often a kilo more). The rate gradually increased.
In 1995-96, I joined a women�s group called the Maltsya Thozilzli Vanitha Veedi and this made
the management insecure and they wanted to trap us in some way. One day in the pretext that they
saw on shrimp in the waste and so refused to give me work. The next day they put me in the weighing
machine where I had to do my peeling alone and would be asked to do other work as well. I was very
angered and so stopped going there to work. I had worked there for 22 years by this time and I left
without a single benefit.
As we are not accepted as workers having no appointment order etc. we get absolutely no
benefits. In 1997-98, we heard that the State Government created a Welfare Fund for Fisheries Allied
workers and we tried to join this fund. The owner refused to sign our application forms and so none
of us could join this fund. There were about 45 of us working for this man at that time. Then we heard
that there was an enquiry and after that the manager made a guise of closing the factory. Work was
not regular and work was more dispersed. Recently they have opened the factory. After I lost this work
I began to work in the port sorting the coffee beans for a company but since the last two years I go
to a processing company to peal cuttle fish and squid. We are not recognized as workers with benefits
but at certain off-season times we get some extra allowance or free rations. We work from 7am to
6pm and get Rs.2/- to peel 2kg of material. There are several unemployed workers and so if we are
late even one day, we loose our work. So there is no job security but there are no other problems.
We have several health problems because we work constantly in wet atmosphere with no gloves
etc. and for this we get no benefits from the management.
Mary Chanthanthara: I am 44 years old and come from Kumbalinji in Ernakulam district. We
were 8 children and our parents were sickly, so all of us were obliged to work to earn some money
for the family. I started working from the age of 12 doing coir work. From 18 years onwards I started
going to the prawn peeling sheds and other processing units. I used to do peeling, washing, grading
etc. In 1976, I went to Calcutta, Vishakapatnam and then to Mangalore. We used to get work only
for one year in each place. Grading was my main job and the wage was Rs.150/- after all the expenses
were deducted. 150-175 of us women used to stay in one big hall and there were three monthly offs
and we had to stay on even if there was no work.
I got married in Mangalore in 1979. My husband was also working there. When I was carrying
my first son I had to do overtime and night work. I had problems there and my husband took me back
to Kerala. When my son was a year old, I started to go to the peeling shed again. At that time I got
Rs.1.50 for one basin of prawns. Now it has increased to Rs.3/-. Some owners give an extra token,
which is like a bonus for us I would normally peel 10-15 basins a day when the landing are good.
Although the basin is supposed to weigh one and a half kg, they normally fill it with 2kg. During the
(103)
season, we are not allowed to leave the shed until all the catch is completed. If we resist we are not
taken on the following day.
Most of us do not even leave the shed for food and we are in the ice-cold water the whole day.
Sometimes we peel for 3-4 days continuous days and then our fingers bleed and sometimes get
infected too as we use no gloves etc. No medicine is provided and none of the owners consider this
an occupational health hazard. My medicine is to boil tea, mix salt with it and soak my hand in this
for relief. If we do not work even for a day it is we who suffer as the owners get as many workers
as they want. So we are the loosers.
As we are not considered workers in the industry, we do not get any benefits and are not
included in any welfare schemes. I used to get 5kg of rice from my owner at Onam but since the last
2 years he has been giving us Rs.50/-. I have been a member of the Maltsya Mazdoor Sabha Union
since the past 5 years through which we have tried to struggle for better conditions but to no avail.
Our main plea is to get free rations during the monsoon ban for trawling.
Now I have three children and my husband has become a drunkard. Although he is a fisherman,
he rarely goes to work. I have suffered a lot living with him as he is violent with me. My workday is
very long and often I have slept outside the house with my children because of my drunken husband.
My house is in a very bad shape and we don�t have work now because the catches have been poor.
Once in two to three years, the owners shut down the sheds and move to other places and so we are
left high and dry.
Mahilamani: I am 38 years old and I come from Chandiroor in Ernakulam district. My husband
is Rajan and he is a coolie worker. I have two children.
I started working at the age of 16 years. My father passed away at my early age and I was
obliged to go for work to look after my family. I worked in a freezing plant and I used to get Rs.
6/- for a day�s work. After my marriage I am going to peeling sheds for work. Morning 8 we will start
peeling, which goes on till 5 or 6 in the evening. We won�t even get up for tea. I used to peel 15-20
basins of prawns during season. Normally a basin of prawns should weigh 1kg, but we always will get
2kg. If we resist there won�t be any job for us any more.
The working situation is very bad. The sheds will be congested with 50-60 workers sitting in a
very small place. The floor will always be slippery and most of us will be falling there and getting
cracks. If we peel continuously for 3-4 days or fingers will bleed and become infectious. If we won�t
go for work our family will only suffer. We are not given identity cards and our names are not
registered. If the labour officer comes for inspection the owners will ask us to put signatures against
some fake names. If we are not willing then we will be thrown out from work. My husband is a
drunkard and I have to look after my family. He destroyed everything at my house. My two sons were
studying and both of them stopped their studies because of our troubles. There are no benefits for
our children. We are not even considered as workers.
(104)
Recently in our shed they started giving us one token a day as a welfare fund. If we peel for
30 tokens one more will be given to us and we will get that during month end. I am working for the
last 38 years. After so many agitations we got 5 kg. rice during this onam.
We don�t have work for the last one-month because the catches have been very bad. Since we
are not having any benefits our houses are struggling. We can�t do any other work also. I am a
committee member of the Matsya Mazdoor Sabha and we did many strikes for the last 6 years.
Nothing happened after such long years of struggle. We do not have any benefits either from the
owners or from the government. Our main demand is to get free ration when we are not having work
especially during the monsoon ban for trawling and to recognize us as workers. If this condition
continues you an expect hunger deaths also from our areas.
Betty: I am 30 years old. I have two children. I got married 6 years back. I started working in
a processing plant at the age of 16. Our main task is to process the peeled prawns and fish and then
pack it with quality. Our work place is fully air-conditioned. We have to stand in this room without any
precautions. Both day and night shifts are there. The working hours are from 9a.m. to 6p.m. 6p.m.
to 3a.m. After 3a.m. there is an overtime allowance of Rs.3/- per hour. We are taken as contract
workers without any benefits. There are no registration books. If there are 100 workers without any
with 10 names. We are forced to put signatures with fake names. Otherwise we will be thrown out and
the owners have to give more money to the officer coming for inspection. Now I am getting Rs.
65/- a day without any benefits. The working conditions are terrible with most of us having body pains.
So may women stopped working because of ill health. Once the labour officer came and we were
forced to say that we are getting Rs.2500 instead of Rs. 1800.
Unmarried young girls are preferred to work in the freezing plants. Once they find us not fit or
if we are over age we will be thrown out. The young girls are even used by the owners and others.
Because of the fear of losing jobs most of the girls won�t say anything. Otherwise their family will be
suffering. Now I am a member of the Matsya Mazdoor Sabha and we had several agitations to get
acknowledgement as workers and in to include us in other welfare schemes. But nothing has happened
till now and I came here with very little hope. Since the Women�s Commission Chairperson is a woman
I expect her to realize our plights.
Verdict of the Jury
Under the auspices if the National Women�s Commission, the Public Hearing on the Impact of
Globalization on Women workers in Kerala held in Thrissur on the 26-27th Sept. we have listened to
over 40 deponents from the Plantation Sector, the Farm sector, the Fish processing industry and the
Special Export Processing Zone-Cochin. We have tried to understand the problems that these workers
face in their work but in this short time we do not pretend to have a complete understanding of the
same. We herewith submit our verdict to the National Commission for Women.
We understand that globalization has not been a demand by the people but has been forced on
them. We are therefore convinced that the impact of these changes have to be borne by the creators
(105)
of these problems. It is of concern that the greatest impact of these changes are experienced by the
women at the lowest rungs of the social ladder. Work pressure has substantially increased and the
service facilities like public health etc. have been greatly reduced. Women are increasingly made to do
the work earlier done by men and yet there is no equal wage for equal work. The intervention of the
government on these issues is urgently required.
The Plantation Sector
The deponents came from the various estates: Nedumpala Harrison Malayalam Estate and
Wariad Estates-Wayanad, Chandramala Tea Estate, AVT Lilly Estate, Anamada Estate, Cherunelly-
Nelliampathy, MNJ Plantations-Chittar, Pathanamthitta, Harrison Malayalam-Cheruvally Rubber Estate,
Erumaly, Vegetable and Orange Government Farm-Nelliampathy.
Globalization has not had a positive impact on the plantation sector. The price of almost all
plantation crops has fallen. Tea prices are not as low as that of coffee. Unable to break even, the small
plantations have either closed down or sold out their land in small pieces. The workers are left by the
wayside. In order to reduce production costs, the workload of the women workers has been greatly
increased. In most cases the women are engaged as temporary workers. Because of the family
responsibilities, women are not able to meet this excess work pressure and this is used as an excuse
for not making them permanent. Women are expected to be at work by 8 a.m. and even if they are
a few minutes late, they are not admitted for work.
Despite several years of work, these women are not entitled to gratuity. Several of the provisions
in the Plantation and Factories acts, regarding the workplace, are not complied with, e.g. A safe
atmosphere for work as the women workers are often abused by the supervisors. Lockouts are announced
without following approved procedures. The workers are not able to organize for their rights as the
management avoids discussion with them and even refuses to appear before the government bodies.
In the recent past none of the reconciliation talks have been in favour of the workers.
Women are exposed to health problems that are work related as dangerous pesticides are used
without necessary protective measures.
In the coffee plantations there are over 1 lakh workers including agricultural workers mainly in
small holdings. During the last five year the price has come down form Rs.65-75/- to Rs.28/- in 2001.
This has had a devastating effect on the farmers. There is therefore a treat to sell out in small pieces
and to move from a wage system to a share system. If the workers are not willing for this, the
harvesting is withheld.
Recommendations
● Implement rights and safety measures assured in the Indian Constitution namely article 21, 14,
16, 48, and 51 as early as possible. Provisions of the existing Labour Laws like the Plantation
Labour Act, the Minimum Wage Act, the Industrial Dispute Act, Payment of Gratuity Act,
Payment of Bonus Act, the Kerala Agricultural Labour Act should be implemented. The anti
worker polices should be withdrawn.
(106)
● Ensure job security. Take measures to reopen the Wayanad Wariad Chembra Peak Estate, Mahavir
Plantations, Bonacaud, Peermedu Estate. The Government should also intervene in the reopening
of the smaller estates.
● Measures must be taken to see that housing, health, education and transport facilities are
assured to the workers.
● In this time of crisis, when owners are unable to run the estates because they no longer viable,
the government should stay fragmentation and the sale of the land. Government should build
support measures for the creation of workers cooperatives and assist in the marketing of the
products.
● The Government farms that are now running at a loss should be reexamined and should continue
as food farms in the future too.
● Plantations that were started for the welfare of the adivasis by the government, should handed
over to the adivasis like Aralam and the Sugandhagiri farms.
● In areas where famine deaths have occurred because of long closure of the estates, the government
should extend health and education facilities together with free ration to the workers.
● In the high range areas, education facilities for the children and transport concessions should
be specially extended.
The Farm Sector
Listening to the testimonies of the small-scale farmers and the agricultural labourers, it has
become more clear that for the last 20 years they are the victims of the government policies and of
the globalization process. Despite the fact that the growers price is falling substantially the market
price both for the raw and value added products at the consumer level have been increasing (e.g.
Rubber).
They are forced to adopt the �modern� agricultural methods and at the same time have been
fallen in to the trap of huge debts and auction because of the small amount they have taken for their
land. These had led to the suicide of many of the farmers.
Recommendations
● Government has the full responsibility for solving the indebtedness of the small-scale farmers.
The government should take immediate measures to write off the huge amount of interest the
farmers are forced to pay and give time for them to pay back the actual amount. The Government
should block the revenue recovery measures that are taking place.
● Government should take the responsibility of supporting the farmers who are cultivating food
crops through subsides, interest free loans, minimum support prices according to the production
crops etc.
(107)
● The government should promote farmers involved with organic farming and develop markets for
their products.
● Free zones should developed where the farmers can sell their own products.
● The farmers should own their products including value addition.
● The government should take immediate measures to implement all the rights of the women
agricultural labourers according to law such as equal wage for equal work, health facilities,
maternity benefits etc.,
● The Government should redefine the BPL/APL criteria.
Fish processing Industry
The immense competition developed in the fishing sector is a visible impact of the globalization.
This has led to the huge destruction of marine resources. The non-availability of prawns and other
fishes used in huge quantities for exports are good examples of this. This is reducing considerably the
jobs of the enormous number of women workers in the processing zones. They are having job stability
and the noxious working conditions are affecting their health. The wages are very less and the peeling
is on piece-rate contract. The grading and freezing jobs are on daily basis. In order to compete in the
global market, the exporters are reducing the production costs which directly cut down the benefits
of the workers.
Recommendations
● The factories act, minimum wages act, contract labour (regulation and abolition) act and migration
labour act should be implemented timely and strictly. There should be proper job stability.
● In the light or the severe health hazards of the workers in the processing plants proper safety
and healthy measures should be taken care. Measures should be taken to eliminate occupational
injuries like slipping on the floor.
● The Marine Regulation Act should be implemented and thereby make sure the availability of
fishes and prawns.
● During the monsoon when there is ban in trolling there should be free-ration and health facilities
for the workers.
● The workers should be given full rights to unionise.
● Projects should be implemented to ensure social security and welfare for the workers. E.g. The
registering of the sheds and the issuing of identity cards to the workers.
● Permission should be granted to selected NGOs and women�s organizations to inspect the
premises of the factories and check on the working conditions of the workers.
● Educational grants should be provided for the children of the fish processing workers.
(108)
The Special Economic Zone
Created with the specific objective of providing work opportunities, this Special Economic Zone
does not in practice implement existing labour regulations. The existence of the companies themselves
is very unpredictable. In times of profit making, the workers are not given decent wages, in times of
market slump, these industries are closed indiscriminately leaving the workers high and dry. All the
insecurities of the market are finally borne by the workers.
Recommendations
● Implement the existing Industrial Dispute Act and other labour laws applicable to this sector.
● Revise the Minimum Wage Act according to present price index and bring all the industries in
this sector under the act.
● Uphold the Labour security Measures as they exist and implement them.
● Supply the workers with identity cards.
● Provide accommodation facilities and health facilities for the workers
Of the Jury of eight, there was one dissenting note by Justice Aravindaksha Menon.
Dissenting Note:
Globalization is a stated policy of the Indian Government. The deponents at this Hearing have
stated that it is Globalization that is the cause for the fall in prices of agricultural products. This
affects not only their employment opportunities but has also increased the work burden of those who
continue to work. But their claim that globalization has been thrust on the population is incorrect. It
is a policy of a government that has been democratically elected by the majority in this country.
Neither does this have an impact on the workers only of Kerala. But the difficulties created by this
Policy should be brought to the notice of the Government. I am of the opinion that the Government
should consider these problems seriously.
It is not the absence of legislation that creates hardships for the workers on the plantations but
the fact that existing legislation is not property implemented. It appears that the Plantation Act is not
being followed voluntarily and hence should be officially implemented. For this the government should
take proactive steps.
There is insufficient consideration paid to the health of the workers. The use of pesticides and
chemical manure, impacts on their health and proper preventive measures are not adopted. Special
legislation should be enacted for this.
The disintegration of the plantations and their sale as small holdings should be studied by the
government and remedial measures should be enacted for each particular case.
If and where adivasis are engaged as temporary labour, they should receive the stipulated
minimum wage and if not this should be brought to the notice of the government.
(109)
The fact that farmers were forced by the government to go in for rubber as a crop is not true.
It can be said that farmers desired it.
In order to write off the farmers debts, a just policy should be worked out by the government.
Until then any measures to confiscate the land because of bad debts, should be withheld.

(111)
Paper 2
Gist of Public Hearing Organized by NCW on Impact of Globalization on Women Domestic Workers,
Organized by the Center for Women�s Studies and Development, Research Institute,
Rajagiri College of Social Sciences, Kalamassery, Kochi, Kerala, September, 2003
NCW Public Hearings
The National Commission for Women held Public Hearings to get first hand information on the
conditions of employment of women in Kerala. Irrespective of the sector of employment, the general
complaint was that prescribed minimum wages were not paid to women workers. For example, it was
observed in the hearings that in the Plantations in Wayanad and Nelliampathy, women did not receive
minimum wages in many of the estates. Work opportunities were on the decline owing to cost cutting
measures enforced by employers who were affected by low prices for many of the agricultural products.
The cash crops of Kerala were severely affected by market competition by the removal of quantitative
restrictions in trade and liberalized import of many of these commodities from cheaper markets.
The conditions of work in the fish processing units were deteriorating. Owing to liberalization
of trade, lot of work had moved from large units to smaller cottage units to be competitive in the
market. Working conditions deteriorated with lesser facilities and greater occupational hazards. Workers�
health was in jeopardy owing to the humid and cold environment in the work sheds. Numbness and
injuries to the fingers were common complaints. There were no social security measures to provide
health care facilities to the women workers.
Domestic workers were not unionized. They had long hours of work, low wages and insecurity
of employment. The possibility of substitution by cheaper labour from Tamilnadu was a serious threat
that made them remain silent and not complain. They suffered various kinds of harassment at the work
place.
Bamboo Workers
The Bamboo mat weaving industry was not any longer attracting workers from the younger
generation. The older workers were largely fighting their ageing and trying to remain in the industry,
which was shrinking. The competition from substitutes (plastics), the declining supplies of raw material
and low prices for bamboo mats increased their helplessness. They were too old to learn new skills
and move to other sectors of work. They had no social security.
Women Domestic Workers
At a public hearing held in September, 2003 in Kerala by the NCW. It was highlighted that the
employment opportunities of domestic workers declined. Domestic workers lived in object poverty
without any social security. Agricultural productivity had declined and employment was shifting out of
the sector. The modernization of traditional sectors also let to declining employment opportunities. The
influx of women workers from the neighbouring States, especially from Tamil Nadu, who are available
(112)
at lower wages took away job opportunities from the local people. Women domestic workers were not
organized and therefore their voices were not heard. They were exploited and entreated physically,
mentally and sexually by the employers. But these did not come to limelight as the victims maintained
silence for fear of losing their jobs, as they had no alternatives.
Grievances/Complaints
Following were the important grievances put forth by the participants during the public hearing:
● For the permanent workers, there is no stipulated time and they are forced to work from dawn
to dusk;
● Most of them are not allowed to take leave even if there is a genuine reason;
● The part time workers are burdened with strenuous working conditions as they move from one
house to another for the domestic work.
● Domination of Tamil workers increases the unemployment level of these women in this sector.
● There are no welfare schemes/unions/service organisations to hear/solve the varied problems of
these women;
● Remuneration paid for the exhaustive work is very low;
● Physical and sexual harassment is quite common;
● Inhuman treatments are meted out to many of the domestic workers at the hands of the
employers;
● Due to the constant use of detergents health problems especially skin diseases confront these
women workers;
● The elderly workers are experiencing a lot of physical ailments viz. back pain, eyesight, asthma
etc.
● Those who are registered with the private recruiting agencies have to give commission for
placement, as they do not have the bargaining ability;
● There is no social security measures for the domestic workers.
Important Recommendations1
● Minimum remuneration should be fixed for the domestic workers;
● Skill training should be given to workers so as to increase their efficiency, resulting in better
remuneration;
● Convert domestic work a respectable profession by appropriate skill upgradation;
● Treat domestic workers as a special category and evolve specific policies ad programmes for
their well-being;
● Establish linkages with other women organisations to support their causes and grievances;
1 Report of the Public Hearing on Impact of Globalization on Women Domestic Workers, Sponsored by the National Commissionfor Women, New Delhi, September, 2003.

(113)
● A separate wing catering to the needs of the domestic workers should be set up with the State
Social Welfare Development;
● They should be made to register themselves in the above wing of the social welfare department;
● Welfare measures viz. pension, medical aid, marriage allowance, bonus etc. should be provided;
● Research studies should be undertaken to unearth the real situation of the domestic workers
with more emphasis on case studies;
● Legal awareness programmes should be organized frequently to conscientise them about their
rights and responsibilities;
● A separate policy for the domestic workers should be introduced.
Agricultural Workers
Agriculture in Kerala has been adversely affected with the steep fall in prices of most of the farm
commodities. 80% of Kerala�s agriculture involves cash crops. Kerala accounts for 45% of the area
under plantation crops (rubber, tea, coffee and cardamom) in India, contributing to 92% of the
national production of rubber, 71% for cardamom, 21% for coffee and 9% for tea. The Export-Import
Policy, 1997-2002 and the modifications and amendments introduced in April, 1999 and 2000 have
removed quantitative restrictions on the import of 1,948 commodities. The liberalization of imports has
seriously affected the economy of Kerala. In the plantation crops, women account for more than 60%.
Many of the estates have ceased to function and the workers have been forced look for work elsewhere
due to crash in the prices of the products.
The fall in prices have also affected small farms with mixed crops. The fall in prices have
compelled the farmers to reduce the number of workers and also wages in several areas.2
Fish Processing
The fish processing industry is a women intensive industry. Earlier the fish processing industry
were in large units. There is now a mushrooming of large number of small units in the Unorganized
Sector with very little protection for the women workers. The petition from 56,250 women workers in
Cherthala taluk referred to the low wages of Rs.30/- per day for 10-12 hours of work. The environment
of work is appalling in wet and humid conditions. Many time women fall and dislocate their job. They
get cuts and pricks on the wet rule and fingers and thy arc their prone to bacterial and viral infections.
Apart from these infections their sitting postures also give rise to many health problems. Sitting on
wet floors hours together leads to circulatory problem resulting in numbness. Their feet get fungus due
to the ice and cold water. Most of the women suffer from bronchial diseases. Approximately 82.9%
of the women complain of backache with 30% having it very regularly. Headache holds the second rank
with 80.9% suffering from it.
2 Report of the Public Hearing, The Impact of Globalization on Women Workers in Kerala, Organized by the National Commissionfor Women, 26-27 September, 2001, Thrissur.
(115)
Appendix 4
DIALOGUE WITH THE NGOS AND STATE GOVERNMENT

(117)
Paper 1
Meeting of the Expert Committee on Economic Empowerment of Women
held by NCW on 08.04.2003, at New Delhi
The Expert Committee of NCW on Economic Empowerment recognized that in the country as a
whole, women workers were denied their rightful wages as there was discrimination in the payment of
wages. Dr. Mukul Mukherjee pointed out that economic reforms initiated during the last two decades
have paved the way towards an open economy that is the hallmark of globalization, but these often
have adverse implication for women. �This is evident in signs of decline in women�s employment,
specially in rural areas�.new technologies and new products enter the market, tastes and preferences
change, induced by a barrage of market promotion tactics. As a result, many products lose their
markets and this has a cascading effect. There is a displacement effect for a large segment of women
workers deriving subsistence from these occupations. This is a specially worrisome trend, because it
is very difficult for women to find adequate alternative employment in the newly emerging sectors
because of their general lack of requisite resources and capabilities. There was overcrowding of women
in the informal or so-called unorganized sectors. Informal or unorganized sector refers to the multitude
of small labour productive units or micro-enterprises, characterized by low skill, low productivity, poor
income, little scope for upward mobility and little relief by way of social security or collective bargaining.
While the share of women workers in the total labour force is about one-third, in the informal sector
occupations such as bidi-making, match-making or domestic service, their share is as high as 70-90
per cent. Women�s work patterns hamper their empowerment. This work pattern is characterized by
occupational segregation and gender based disparities in earnings. Women�s over representation in the
informal/unorganized sector is known for its handicaps and uncertainties. Their preponderance as
agricultural labour is one of the most vulnerable occupations.�1 When economic crises deepen and
women are compelled to take up additional work, there is a rising pressure on the girl child affecting
her future prospects. Due to this, instead of narrowing disparities we have a situation of persistent
gender gaps impede progress towards women�s empowerment.2
Ms. Padma Ramachandran, in enumerating the problems faced by women in Kerala that needed
to be addressed, mentioned3
(i) Non-payment of minimum wages in accordance with the Act.
(ii) Opposition of males to masons work being done by women.
(iii) Toilet facilities for girls in schools.
(iv) Scholarships for girls for taking up maths and science, and
(v) Establishing women crafts villages in all tourist complexes.
1 Excerpts from the note of discussions of the meeting of the Expert Committee on Economic Empowerment of Women held byNCW on 8-4-2003, at New Delhi.
2 Ibid3 Ibid
(119)
Paper 2
Dialogue with the NGOs and State Government
Summary Report of Workshop on �Strategies for Economic Empowerment�, 19th May 2003, Organized by
the National Commission for Women and State Commission for Women
The workshop commenced with the welcome speech by M. Kamalam, the Chairperson of the
Kerala State Commission for Women.
The workshop was presided over by Dr. Poornima Advani, Chairperson of the National Commission
for Women and the inaugural address was by the Hon�ble Chief Minister of Kerala.
The objective of the workshop was to be able to get the grassroots voice. It is important to keep
in mind that women too have the right to live and this also means the right to live with dignity.
Some of the concerns are violence, globalization and specific problems of Kerala State issues
of violence and empowerment closely linked. It is hoped that the workshops could come out with policy
recommendations, both short and long term and a list of do-ables. Inner strength of women biggest
resource. It was hoped that the Government of Kerala would consider seriously the recommendations
and issues emerging from the workshop and address them.
The Chief Minister promised to consider the recommendations emerging from the workshop.
Economic empowerment cannot be seen as isolated from political and social empowerment, women
suffer most when the income of a family is hit. The government has attempted to enhance the process
of women empowerment through the various provisions under decentralization such as reservation for
women. Kudumbashree programme has become a model for economic empowerment of women.
However, there continue to be other challenges such as dowry, the sexual exploitation of women. It
is imperative that empowerment precludes security. Attitudes and mindsets have to change for genuine
empowerment to be achieved.
Dr. Sarala Gopalan, Advisor, National Commission for Women, emphasized the need to emerge
from women being �victims� to being �problem solvers and change agents. In the Kerala context there
are definite contradictions � despite the high literacy rate, work participation and political participation
is low. Programmes like Kudumbashree are success stories and give us hope.
Lissy Jose, Member, Kerala State Commission for Women, gave the vote of thanks. She observed
that the Constitution guaranteed equal rights but the attainment of these for women still remained a
distant dream. She hoped that the discussions of the next few days would be fruitful.
K.P. Kannan, Director, Centre for Development Studies, presented the keynote address on Economic
Empowerment.
He provided statistics to bear out the fact that the performance of girls in education in terms
of participation in primary school, dropout rate, vocational education, degree and other development
indicators such as low fertility, low IMR, low birth rate etc. are favourable to women. However, work
(120)
participation rate is lower than the all India average. This is not a cause of undue worry since the
reason is Kerala women have more of a choice, and demand for labour in agriculture is comparatively
low.
The concern in Kerala was more in terms of educated unemployment. The strategy to address
this would be to provide women with skills to develop their status in the labour market, after a careful
study of emerging areas of demand and according to a prioritization of activities for which there would
be demand.
An economic base is a foundation for empowerment. Studies show that there is a definite link
between education and violence. It was seen that lesser educated women. The keynote address was
followed by a question-answer session.
This was followed by the presentation of papers. Mr. John Kurien, General Manager of NABARD
made a presentation on Economic Empowerment and Micro Credit. It provided an overview of NABARD�s
work with SHGs and constitutes one of the largest micro credit programmes in the world. Despite the
high success rate and the various challenges that have been overcome as a result of the NABARD
intervention, there remain issues of concern such as sustainability, graduation from SHGs to small
micro enterprises.
Change in mindset and attitudes. Government to provide backward and forward linkages to
ensure sustainability.
Various question and issues were raised; one of the chief concerns raised by Panchayats was that
banks consistently refused them loans despite their considerable savings. The GM of NABARD assured
them that this situation could be rectified.
Mr. T.K. Jose, Executive Director, Kudumbashree presented a paper on the Kudumbashree Experience
in Economic Empowerment. Kudumbashree has defined empowerment, according to them there are
four facets of empowerment, which are:
� Physical;
� Social and Cultural;
� Economic; and
� Political
The presentation of Shri. T.K.Jose on the strategies for economic empowerment on 19th May
2003, at Trivandrum at the NCW workshop highlighted the following issues:-
(i) Low level of work participation of women in Kerala;
(ii) Unemployment and under-employment among educated women in Kerala;
(iii) Positive relationship with reduction in violence against women and high education;
(iv) Scope for micro credit as a tool for economic empowerment;
(121)
(v) The role of SHGs in promoting micro credit;
(vi) The correlation between micro credit and poverty reduction;
(vii) Four facets of empowerment - physical, socio-cultural, economic and political;
(viii) The role of Community Based Organizations (CBOs) in women employment;
(ix) Poverty reduction through micro finance, micro capital, micro-enterprises process;
(x) Correlation between decentralization and poverty reduction;
(xi) Importance of community participation;
(xii) Role of SHGs in enhancing community participation in grass-roots democracy;
(xiii) Gender sensitization through bureaucratic action;
(xiv) Economic empowerment only a necessary condition but not a sufficient condition for social
change;
(xv) Increasing burden on women due to micro finance and micro enterprise.
In the presentation, the following were indicated as shared experience �
● Even the poor can be made entrepreneurs;
● Project identification is vital, but identification of entrepreneur is critical;
● Skill development is important for ensuring success;
● Entrepreneur can be created through careful nurturing and hand-holding;
● Developing entrepreneurs and not enterprises;
● Financial intermediation is required for development of the poor. Appropriate dialogue with
banks is necessary;
● Community based network has provided marketing. Initial marketing is the neighbourhood itself,
● Poverty reduction through stereotype programmes is not enough. Complementarity between
Government and other agencies is necessary.
Summing up the presentation and responding to queries from members, Shri Jose mentioned
that -
(i) Turbulence is now seen in traditional sector in Kerala because of inflow of labour from Tamil
Nadu. Bargaining power of labour in Kerala has been affected;
(ii) Duty free import of tea from Sri Lanka has affected plantation workers;
(iii) State level budgeting � it should go down to the level of Panchayats;
(iv) There are sporadic and localized efforts against globalization. Panchayat movement in Kerala
has stopped the onslaught of Pepsi and Coca Cola and also illegal mining of rare earth minerals.
These are tangible action against globalization and can be case analysis for other States.
(122)
(v) Networking with other women organization is necessary. Awareness and knowledge and confidence
building are needed;
(vi) Capacity building and human resource development at Panchayat level. In the absence of proper
training, it is not making headway.
Taking into consideration the gravity of the problem, it was agreed by the members of the
Committee attending the meeting, to form a Core Group to finalize the recommendations to Central
Government.
The recommendations that have emerged during discussions of the Expert Committee of the
National Commission for Women include �
● Maintenance of a violence-free environment is an essential pre-condition for women�s participation
in various activities including income generating activities.
● Another basic premise for economic empowerment is proper recognition and reporting of women�s
work, both market-linked and otherwise.
● Equally important are property rights and ownership of assets for women, specially land rights.
As land is perhaps the most precious asset in rural India, the agenda for women�s economic
empowerment has to include land reforms measures that secure women�s entitlement to land.
● More effective implementation and monitoring of labour laws such as Minimum Wages Act or
Equal Remuneration Act or Bidi and Cigar Workers (Conditions of Employment) Act.
● The SHGs should not only focus on provision of micro credit but have a holistic approach and
provide support services including awareness of marketing and enhance capability of the women
members. The SEWA model was advocated. The SHG for poverty groups require special attention.
● Skill building for women is of crucial importance especially skills which can help them get stable
income and withstand the impact of globalization.
● Women Development Corporations should be made the nodal points for chocking out action
plans for the economic empowerment of women.
● Gender analysis should be done in planning, monitoring and evaluating the impacts of revenue
raising and expenditure allocation at national, sub-national and/or local level.
● Implement strategies for women�s participation in economic decision making through their engagement
in budgetary processes.
The processes moving from a community-based organization to a micro enterprise were explained.
Case studies were used to illustrate these. Strategies used in empowering the poor were shared.
Essentially the aim is to work for a participatory poverty alleviation programme with the support of
Panchayati Raj Institutions, Government of Kerala and NABARD.
(123)
There was a question and answer session following the presentation.
The moderator observed that economic empowerment therefore links to social empowerment.
Economic empowerment is not automatic there are various processes to go through.
Mr. S.M. Vijayanand, Member Secretary, State Planning Board presented a paper on Decentralization,
Panchayati Raj and Women Empowerment. The one-third reservation of seats for women in the Panchayati
Raj has contributed to empowerment - a study by KILA has shown that the confidence of women has
increased tremendously in a period of four years.
Ten percent of funds have been set apart as women component plan. Government of Kerala is
hoping to improve social audit to monitor the way funds are being used.
Government is also hoping to introduce gender budgeting and is looking for some technical
support to actually operationalise this.
Sarada Muraleedharan, IAS
Women merely contributing to the family income by itself cannot constitute empowerment. Their
role in decision-making is the key.
Societal attitudes towards women in power still need to be changed � a conducive environment
needs to be created. Empowerment for one section implies that another section stands a little dis-
empowered. It is also seen in the Women Component Plan that it is not monitored adequately � the
more difficult the scheme, the easier it is to give it the go-by.
Gender sensitization training to be given not only to women but also men. It is important to think
through the gender implications of development programmes e.g. mechanization in agriculture.
This was followed by a session on sharing of experiences by five women entrepreneurs under the
Kudumbashree Programme. Women micro entrepreneurs groups (10 each) presented their stories �
they were involved in a range of products and services from payasam mid, dairy products, door to door
supermarket, Information Technology unit in school, data entry unit. Sarala Gopalan observed that
these women had self-confidence and pride in what they were doing and all reported changing attitudes
in their own family.
(125)
Paper 3
Summary Report of Workshop of �Status of Women in Kerala, 20th May, 2003
Organized by the National Commission for Women and State Commission for Women
The inaugural speech was by the Minister for Industries and Social Welfare, P.K. Kunhalikutty.
The Minister said that the real challenge was to sustain and develop the achievements already
made in the area of women empowerment. From the part of the Government, necessary steps would
be taken to ensure that the deliberations and emerging issues and recommendations were translated
into action.
Dr. Poornima Advani said that the greatest challenge was to ensure gender sensitive governance
and the greatest strength was women�s collectivity. It is the concern of NCW to hear the voice of the
voiceless. All policy formulations should be in consultation with women who are in the field.
It is also time to stop seeing women as objects of welfare and constitute a Department for
Women and Child along the lines of a Ministry of Social Justice and Empowerment.
Justice Sukumaran referred to various cases in maintenance, harassment of women in power etc.
which brought out the fact that there still remained various problems to be addressed. Article 15
ensures special protection and care of women. The complexity of women�s problems is such that it can
be effectively addressed only on a decentralized basis. The importance of legal education and the need
for relief measures such as short stay homes was emphasized by him.
Savithri Lakshmanan said that it is important the initiatives to address women issues should not
be politicized. The system still discriminates against women. But it is important not to get caught in
the jargon but instead emphasize on action.
Ms. P. Kulsu, Member, Kerala Women�s Commission gave the vote of thanks.
The inaugural session was followed by NGO interaction where activists on NGO�s brought out
issues concerning the status of women and provided suggestions on action points:
The issues that raised were:
� Non action on a sexual harassment case against a Senior IAS official where the offender was
a Minister.
� Cases of sexual harassment on the increase and the situation of no action against offenders
leads to a sense of helplessness.
� The attitude of running down those who speak out against sexual harassment is worrying.
� The necessity of short stay home.
� Procedures that are unfavourable to women e.g. the case of Constable Vinaya where she tried
to change the section in forms which asks for the name of the father/husband.
(126)
� Despite the sex racket case that was unearthed, in Kozhikode, no action has been taken. The
manner in which the complaint of sexual harassment registered to the Complaints Committee
of Calicut University by P.E. Usha has been trivialized and sensationalized leads to a sense of
frustration. Women are very vulnerable e.g. case of burn victim who was molested in a hospital,
women suffering as a result of communal killings in Kozhikode are all matters of grave concern.
� Women are not safe within their homes � cases of domestic violence on the increase. The
statistics for sexual harassment are alarming. Cases also of sexual harassment of children.
� Sexual harassment of plantation workers who are women.
� Women do not even have access to toilets in public places, school children do not have proper
water and toilet facilities.
� Ration Card discriminatory � asks for the name of the man of the house and his relationship
to other members of the family.
� Attitude of police to women in distress/social workers � police need to be sensitized.
� Most women are now in the unorganized sector and no labour standards are applicable there.
� Female foeticide case increasing as evident from declining female-male ratio in the 0-6 age
group.
� The PNDT Act needs to be implemented more strictly.
� Women�s bodies used as commodities �increasing caesarians from 35-60 percent as against the
WHO standard of 15%.
� The problems of widows need special attention.
� Women in the fishing sector subject to discrimination.
� Women become victims of political conflicts and killings and lost their near and dear ones.
� Various gender stereotypes perpetuated in the education system.
� Early marriage is a big problem in Malappuram District among the Muslim community.
� In Wayanad District, the phenomenon of �Mysore� marriages where women are married to men
from Karnataka without dowry but are then abandoned.
� Human rights violation in the Muthanga case, where a tribal woman was sexually exploited and
killed.
� The problem of drug addiction is acute in Idukki District.
� Need to improve condition of women in traditional industries.
� Dowry harassment and dowry deaths are on the increase.
(127)
� Dowry in Christian community � efforts by social workers to get these recorded so that they can
be reclaimed when the woman wants � ten percent of the dowry amount goes to the Church.
� RDO not acting as dowry Prohibition Officer.
� Hospital timings in Alappuzha, not conducive to women � women are free only in the afternoons,
but hospitals are closed then.
� Sex tourism on the rise.
� The case of Vinaya a woman constable who fought to improve the conditions of women police
was suspended. Despite a Court Order that she be reinstated, she has been again given suspension.
� Alcoholism of husbands is the biggest problem for women.
� Demographic profile shows that the number of aging women are on the increase and their
specific problems need to be attended to.
� One-stop crisis centre in hospitals essential.
� HIV/AIDS counseling before marriage.
� Given the backdrop of divorce cases, joint title deed to be necessary.
� Mental health � increasing tendency to suicide.
� Problem of sex workers � they are subject to police harassment and this is justified under PITA.
� Education � school dropouts especially among tribals.
� Women unsafe in bus stands � presence of women police will be reassuring.
� Ladies compartments in train � why located at the back � presence of women police will provide
as sense of security.
� Problem of destitute old women � steps to provide shelter to them.
� Women to be trained in physical self-defense.
� Legal education and training on legal rights.
� Kovalam � enquiry on marriages with foreigners.
� Kovalam � Sexually Transmitted Diseases increasing.
� Conditions of sales girls, nurses, paramedical staff.
� More Family Courts needed.
� Capacity of women to be built up to take up new roles and responsibilities.
(129)
Paper 4
Meeting on Sexual Harassment � Functioning of Complaints Committee in Workplaces,
20 May, 2003 � Organized by National Commission for Women
It is mandatory to have a Complaints Committee in every work place as per the Supreme Court
directive. The Complaints Committee should be headed by a woman, 50% of the members should be
women. There should also be a third party, preferably an NGO as member. The committee should meet
preferably every three months. Periodic reports are to be submitted.
The meeting was to take a quick assessment of the status and functioning of the Complaints
Committee in various workplaces.
Collegiate Education Department � Committee in place as per directives for the last two years.
No complaints received so far. Publicity given and there is awareness about its existence.
Hindustan Latex Ltd. Set up 2 years back. Training provided to women on its role and objective.
No complaints received so far. Guidelines circulated in Malayalam and survey conducted among
women employees.
Vikram Sarabhai Space Centre Third Party is a Government Department. Publicity given. 2-3
complaints received but these are not of sexual harassment. Needs to be reconstituted.
NABARD Committee in place but no third party representative. There was a complaint but
complainant was not willing to give it in writing and hence not taken up.
Needs to be reconstituted and inform NCW about action taken.
Department of Civil Supplies Committee in place as per directive. No complaints received so far.
But no proper follow up.
Directorate of Medical Education Committee in place as per directive. No complaints received so
far.
Directorate of Economics and Statistics Committee in place as per directive. Publicity given.
Meet only once a year. This is to be rectified. Also third party nominee should be an NGO/independent
representative.
This is to be reconstituted and meetings convened more frequently. NCW to be informed.
Directorate of Ayurvedic Medical Education Committee not constituted.
Committee to be constituted and action taken to be intimated to the NCW.
Department of Irrigation One complaint so far. No third party representative. No information on
last meeting. Chairperson retired.
Valid Committee to be constituted and NCW informed on action taken.
(130)
Department of Indian Systems of Medicine Step to be taken to add third party and this to be
intimated to the NCW. No complaints received so far.
Department of Prison Constituted only six months back. Not proper representative at the meeting.
Kerala State Handloom Development Corporation One complaint received. No third party
representative. Action to be taken and NCW to be informed.
Local Fund Audit Committee No committee. Vigilance Committee is not a substitute. Action to
be taken and NCW informed.
Kerala Tourism Development Corporation Committee in place as per directive. No complaints
received so far. Amended service rules.
Directorate of Fisheries 25 members. 3 NGO nominees. Periodic meetings. No complaints so far.
Reserve Bank of India, Thiruvananthapuram Branch Committee constituted in accordance with
directives. Two complaints received and action taken.
Canara Bank a male member heading the Committee. No third party. But this will be reconstituted
and NCW informed.
Forest Department set up 2 years back in accordance with directives. One case received but this
has gone to Court since a Minister is involved.
Directorate of Higher Secondary Education has 13 members representing all non teaching and
teaching members of schools. Meet once a year. No complaints so far. Process of nomination of
members to be based on consensus.
Kerala State Road Transport Corporation Committee set up as per directives. Complaints received
were �minor� and could be sorted out through counseling.
Department of Education, Directorate of Public Instruction Committee in place but no third party
representatives. Action taken on harassment of girl students. No complaints received so far.
Labour Department Committee in place as per directives. Publicity given. Officers sent for training.
Life Insurance Corporation of India Committee in place as per directives. No complaints received
so far.
Kerala State Electricity Board Committee set up as per directives.
In 2001, 17 sittings held, 33 persons heard, 10 complaints received. Action taken and final
reports on 7, 3 pending action.
In 2002, 13 sittings held, 25 persons heard, 4 complaints final report.
In 2003, 2 sittings, 1 person heard, 3 complaints received.
Of these 2 were sexual harassment complaints and in one case, accused person was suspended,
and in another, transfer recommended.
(131)
Action is pending on initiative to amend service rules.
Method for processing was explained.
Tourism Department Committee constituted as per directive. Third Party representative not in
place.
Needs to be reconstituted and NCW informed.
Technical Education Department Committee in place as per directive but no complaint so far.
Meet once a year.
Treasury Department Committee constituted as per directives. Additional training also provided.
All India Radio, Thiruvananthapuram No third party representative. This needs to be reconstituted.
Two complaints received and warning given. Meet only once in 6 months. Frequency of meetings to
be increased. Complaints received by Director can also be taken up by Committee.
Public Relations Department Though Committee constituted, one member working in Secretariat
and on retired.
To be reconstituted and NCW informed.
Civil Supplies Corporation Meet twice a year. Six complaints received and 5 redressed, one still
under enquiry.
Panchayat Department Committee as per directive in place. No complaints received so far.
Commissionerate of Rural Development Committee constituted as per directive. One complaint
came up but was not under the purview of the Commissionerate. Awareness programmes and discussions
conducted.
Income Tax Department No Committee in Thiruvananthapuram. Complaints are forwarded to
Kochi.
To be set up in Thiruvananthapuram and NCW informed.
Kerala State Insurance Department Committee in place as per directives. No complaints received
so far.
Department of Survey and Land Records Committee constituted as per directive. No complaints
received so far.
Health Services Department Committee in place. One complaint received so far and the doctor
concerned was transferred.
The Chairperson of the National Commission for Women emphasized the following points:
● It is important that women get to know about the Committee and have fifth in it. Necessary
steps to be taken in this regard.
(132)
● Every work place needs to have a Committee � Complaints Committee should not be only in the
Central Office so that suffering women have recourse to justice at a convenient place.
● The presence of third party is important so that women feel free to approach someone not
connected to the workplace.
● Systems of nomination to the Committee should be based on consensus and be transparent.
● Meetings to be convened frequently. Meeting once a year is not effective.
● Periodic reports to be submitted.
● Suo moto notice can be taken of a complaint. In this case, it is the spirit of the law which is
to be internalized.
● The lack of complaints implies (A) there are no complaints (B) women do have the confidence
to give a complaint. The (B) possibility is to be minimized.
● Committee should be by rotation.
A question was raised about monitoring of reports submitted and whether any action is taken
on them.
The Chairperson thanked the representatives from various Departments and organizations for
providing their statements on the functioning of the Complaints Committee.
(133)
Paper 5
Minutes of the meeting held on 21st May, 2003 between the visiting team of National Commission for
Women (NCW) led by Dr. Poornima Advani, Chairperson, NCW and the Secretaries and Head of the
Department of Government of Kerala in the Conference Hall of the Secretariat of the Kerala Government
at Thiruvananthapuram
The Chairperson, NCW thanked the officers for extending their cooperation to NCW for the
conduct of the Workshops in the State. She was awaiting the responses of the State Government to
the questionnaire already sent by the Commission. She requested to those departments, who had
defaulted, to expedite their response for the completion of the preparation of the gender profile of the
State.
Briefly, outlining the purpose of the meeting, the Chairperson emphasized that the Commission
would like to discuss the issues raised by the NGOs during the meeting held with them on20.05.2003
so that the State Government may consider these for action plan/remedial steps. The following issues
raised the by NGOs were discussed.
Violence Against Women
It was noted that violence against women was on the rise. A lot of young girls were being
abducted for sexual pleasure. The fear of affliction of HIV/AIDS had lured them to young girls. All
public places including bus stand etc. had become very insecure for girls and young women. The Home
Secretary said that they were seized of the problem. Additional police patrolling in sensitive areas in
plain clothes had been organized. He further mentioned that most police stations have a separate
women police cell and there are 4 Police Mahila Stations. After detailed discussions, the following
decisions were arrived at:
● Gender sensitization of the police would be made an integral part of police training programme.
● The curriculum of training of the police force for gender sensitization would be reviewed and
improved.
● Gender sensitization programme for faculty/trainers in the training programme will be strengthened.
● For changing the mindset of the people, the State Government would launch general awareness
programmes.
● Recruitment of women to the police force should be increased.
● The girls/young women may be taught Self Defence Courses.
● The positioning of women�s compartment in the train which now situates at the end of the train
would be reviewed in consultation with the Railway Authorities to ensure their safety and security.
Family Courts
The Home Secretary clarified that the number of Family Courts was increased from 7 to 9 and
the State Government would like to set up one Family Court in each District. CP, NCW pointed to the
(134)
presence of more men than women judges in the Family Courts. She also stated that the State
Government should adopt the pattern of the State Government of Maharashtra for improving the
working of Family Court i.e. two consellors should be appointed per judge and the counsellors should
be social workers/women activists who could devote time and work for the cause of women. It should
not be difficult for the State Government to identify such workers as the education and literacy levels
of women in Kerala was quite high and qualified persons would be available.
The Chairperson also suggested that the State Government may ask the Family Courts to hold
camp hearings so that the cases could be disposed of quickly and would avoid travelling long distances.
It was also suggested by the team of NCW that the State Government may consider delegating
the powers of the Family Court to the SDM to the extent that the papers etc. could be filed there.
The Home Secretary assured that the State Government would look into all these suggestions.
Dowry
The Chairperson, NCW stated that the subject matter was discussed at length in the NGO
meeting held on 20.05.2003. The women activists were of firm opinion that the problem of dowry was
on the increase in Kerala and was ruining many families. The Dowry Prohibition Act was rarely invoked
and the institution of Dowry Prohibition officer is defunct and non-functional to such an extent, that
most people were not aware of the designated Dowry Prohibition Officer.
During discussion, it emerged that the Revenue Officer is the designated Dowry Prohibition
Officer (DPO) who is burdened with a lot of work and is, therefore, able to give dowry matters only
a low priority. The role of the DOP was also questioned as the matter had to be reported to the police,
who could themselves take action. May be the Act should be amended.
The Chairperson, NCW, suggested that the meeting of the existing Dowry Prohibition Officers
may be convened to discuss their problem and come out with a remedial action plan. She also
suggested that a suitable officer, who could devote adequate time for the purpose should also be
identified and notified. The Home Secretary agreed to all the suggestions.
The practice of the church taking 10% of the dowry as donation in certain Christian communities
was highlighted in the NGO meeting. Dowry was undervalued by the parties and a lower valued
registered to reduce the donation. This had an adverse impact on the girl in the event of divorce
though the practice of registration was good. Even in other cases, dowry is undervalued. The Home
Secretary promised to look into this.
Female Foeticide
The Health Secretary, outlining the steps taken by the State Government for implementation of
PNDT Act, stated that all Ultra sound machines, including the mobile ones, except where the Clinics
have moved Courts for non-registration, have been registered. All the CMOs who have been designated,
as appropriate authority are performing their duties well and take regular meetings. He further stated
(135)
that he personally monitors the works and files affidavit every 3rd month. However, he had no rationale
for adverse juvenile sex ratio in Malappuram and Kozhikode. A single-child norm he thought could be
one of the reason for such a tilt. This argument was not accepted as such adverse sex ratio could only
become feasible with sex selected conception, which was as yet not common. The Health Secretary
informed that a study has been launched and its results would be available in 2-3 months time. The
outcome of the study would be informed to NCW.
It was further decided that steps would be taken for giving more publicity to the provisions of
the PNDT Act and to establish a connection Women Commission would bring this provision of the Act
to the notice of all concerned.
It was also decided that a meeting with the NGOs would be convened so that they could have
first hand information about the implementation of the policies of the Government and the health
vision/document 2005 of the State Government.
Sex Tourism
Secretary (Tourism) stated that to check sex tourism, the State Government has created Tourism
Police, who keeps vigilance to ensure that the marriages for sex pleasures such as an old men marrying
a young girl for sexual gratification does not take place. In massage centres, massage is done by
women to women and men to men. This is only voluntary and not administered through Act. The State
Government promotes high quality tourism.
After detailed discussion on the subject and taking into consideration the gravity of the problem
and the networking of the customer, commercial sex worker, trapped young girls, as well as the role
of the police, the hotel between women patients who have attended the Clinic and who have subsequently
carried out abortions.
Health Facilities
During the NGO meeting it was reported that, there was acute shortage of hospital beds in the
state. It was very common for patients to sleep in the corridors and sometimes even on the roads
leading to the hospitals. The Health Secretary was shocked to hear this.
He mentioned that population policy would be formulated which would take care of the rising
incidence of HIV/AIDS and in which provision of health insurance is also being thought of.
The CP, NCW desired to know whether the Chairperson of State Women Commission has been
consulted on that policy. Reply to this query was in the negative. Considering the statutory requirement
of consultation on all the policy matters relating to the women, it was decided that the Secretary,
Department of Social Justice as well as Chairperson of State and Autoriksha/Taxi drivers, it was
decided that a help line would be created and would be given wide publicity which would encourage
the public to report the sex tourism to the police whenever they come across such cases.
(136)
Condition of Prisons
The CP, NCW stated that she visited Wayanad jail after dusk sometime ago. She observed the
condition of the women inmates was appalling. It was over crowded. There was no light. There was
one bucket of water for 5 persons for all their needs. The Home Secretary informed that a new Mahila
Jail is being constructed to solve the problem of over crowding. DIG (Prison) visits Jails to ensure that
the basic facilities to the prisoners are provided.
It was decided that the instructions will be issued to all the Jail Authorities envisaging the check
points which they should keep in mind for improving the conditions of jails.
Misuse of Section 8 of PITA
The CP, NCW mentioned that she visited Calicut Jail one year ago. She was informed by the
women around Bangladesh colony that police was misusing Section 8 of PITA under allegation of
soliciting. The police authorities should not invoke such provisions to harass women.
Rescue and Short Stay Home
The NGO voiced inadequacy of short stay homes in the State. The Secretary, (Social Welfare)
admitted that these homes were not sufficient and these homes were running in different districts/
places with names. He said that they were trying to review the working of these homes and integrate
them in a scheme. The CP, NCW asked him to ensure that these homes were managed by women and
in no circumstances it should be headed by men. The Secretary assured the Commission that they
would pay heed to her direction.
He further clarified that they would review the State Policy 1996 for women and a new policy
would be formulated soon.
Sexual Harassment at Work Place
It was noted that inspite of the issue of guidelines by the Chief Secretary in April, 2001 for
constituting Complaint Committees in accordance with the directives of the Supreme Court in the
�Vishaka Judgment to check sexual harassment at work place many departments have not constituted
the Complaints Committees. It was also noted that in some cases the constituted Committee was
without third parties. The Secretary, Social Justice, assured the Commission that the matter would be
reviewed shortly and the compliance of the Supreme Court directives and rectification of the faulty
composition of the Complaint Committee would be intimated.
Fisherwomen
The Secretary (Fisheries) informed that there was no complaint of wage discrimination and lack
of catch by the fisherwomen. There was a system of pucca auction for the catch. He regretted his
inability to throw light on wage discrimination between men and women in processing units in response
to a query from the NCW team.
(137)
Education
The Secretary (Education) informed that taking into consideration the National Policy of Education
which prescribes people teacher ratio as 40:1. Seven schools have been closed. No teacher has been
retrenched. They have shifted teachers. He assured that toilet with water facilities would be constructed
within six month in all schools of the State. He further assured that the State Government would
continue to review the textbooks to make them gender sensitive.
State Legislations for Women
As the Secretary (Law) could not be present because of preoccupation, Secretary (Social Welfare)
assured the team that he would send a separate note to the Law Secretary and would apprise the
Commission of the latest position.
Child Marriages
NGOs had informed NCW that child marriages were not uncommon and were taking place in
some districts. Perhaps the provisions of the Act are not know to the public. For bringing change in
the mindset of the society and stop child marriages, NCW recommended that following steps be taken:
● Holding Seminars/Awareness Camps.
● Creating awareness among youth.
● Highlighting disadvantages of the child marriages in the books.
● Social mobilization through NGOs.
Economic Empowerment
● The violation of Minimum Wage Act would be checked.
● A study would be launched on the decline of employment of women in agriculture.
● Survey of BPL would be expedited.
● Social Welfare Department would write to all Departments to take a holistic view of women�s
needs and integrate all development activities and schemes towards that end.
● The clash between self help groups organized by the Panchayats under Kudumbashree and
others by the BDOs was becoming an irritant. This will be sorted out to smoothen the functioning
of poverty alleviation programmes. The rivalry between departmental officers would have to be
addressed and their work coordinated to benefit poor women.
● The banks would be urged to advance loans to SHGs.
Political Empowerment
The expenditure on women seems to get limited to the 10% women component funds in the
Panchayat without giving them the benefit of expenditure of the 905 of the 90% of the funds. Such
reduction of allocations for meeting women�s needs is unfair and needs to be rectified.
(138)
Welfare of the Women Belonging to SC/ST
● The disbursement of relief money in Wayanad should be closely monitored by the SC/ST department
to ensure prompt payment.
● Confidence building measures in the disturbed areas of Wayanad should be undertaken immediately.
● The ATR on the recommendations of the report of NCW of Muthanga Tribals of Wayanad district
would be intimated very shortly.
● Efforts would be made to bring SCs/STs in the mainstream.

(139)
BIBLIOGRAPHY
Agarwal, Bina (1994). A Field of One�s Own, Gender and Land Rights in South Asia.
Directorate of Census Operations, Kerala (2001). Census of India, 2001, Series-33, Kerala,
Provisional Population Totals, Paper-1 of 2001,Provisional Population Totals.
Directorate of Census Operations, Kerala (2001). Census of India, 2001, Series-33, Kerala,
Provisional Population Totals, Paper-2 of 2001, Rural-Urban Distribution.
Directorate of Census Operations, Kerala (2001). Census of India, 2001, Series-33, Kerala,
Provisional Population Totals, Paper-3 of 2001, Distribution of Workers and Non-Workers.
Eapen, Mridul and Praveena Kodoth (2001) Demystifying the high status of women in Kerala,
Centre for Development Studies, Thiruvananthapuram.
Gopalan, Dr. Sarala (1995). Women and Employment in India.
Gopalan, Dr. Sarala, Towards Equality - The Unfinished Agenda, Status of Women in India-2001�
Update of the Report of the Committee on Status of Women, December 1974, for National Commission
for Women.
Government of India, Planning Commission. Tenth Five Year Plan, 2002-2007, Volumes I-III.
Government of India (2002). Economic Survey 2001-02.
Government of India, Ministry of Human Resource Development, Department of Women and
Child Development (1997). Women in India: A Statistical Profile-1997.
Government of India, Ministry of Human Resource Development, Department of Secondary
Education and Higher Education, Planning Monitoring and Statistics Division (2001). Selected Educational
Statistics.
Government of Kerala, State Planning Board. Economic Review 2000, Thiruvananthapuram.
Government of Kerala, State Planning Board. Economic Review 2002, Thiruvananthapuram.
Gulati, Leela and Ramalingam (Not Dated). Gender Profile � Kerala, Royal Netherlands Embassy,
New Delhi, India.
International Institute for Population Sciences (2000). National Family Health Survey (NFHS-2),
India, 1998-99.
___________ (2001b). National Family Health Survey (NFHS-2), Kerala, 1998-99.
(140)
Kudumbashree (State Poverty Eradication Mission), Concept, Organisation and Activities,
Thiruvanthapuram.
Lok Sabha Secretariat (1997). Fifty Years of Indian Parliamentary Democracy, 1947-1997, New
Delhi.
National Crime Records Bureau (1999). Crime in India.
National Sample Survey Organisation, Ministry of Statistics and Programme Implementation,
Government of India, (2001a). Employment and Unemployment in India, 1999-2000, Key Results, NSS
55th Round.
Registrar General, India (1991a). Census of India, 1991, State Profile � 1991.
___________ (1991c). Census of India, 1991, Kerala State District Profile.
___________ (1999). Compendium of India�s Fertility and Mortality Indicators, 1971-1997, Based
on the Sample Registration System (SRS).
___________ (2000a). SRS Analytical Studies, Report No.1 of 2000, SRS Based Abridged Life
Table, 1992-96 and 1993-97.
___________ (2000b). Sample Registration System, Statistical Report, 1998.
___________ (2001). Census of India, 2001, Series 1, India, Provisional Population Totals, Paper-
1 of 2001.
Sakhi Resource Center for Women in Collaboration with UNIFEM (2002). Support Services to
Counter Violence against Women in Kerala, A Resource Directory.
UNICEF (2001). Report of the Study of Women Component Plan in Kerala, Chennai.
Vijayanand, S.M. (2001). Issues Related to Administrative Decentralization and Administering of
Decentralization, Lessons from the Kerala Experience, 2nd State Finance Commission, Kerala.
A SITUATIONAL ANALYSIS OF WOMEN
IN KERALA
BY
SARALA GOPALAN
JANUARY, 2004
NATIONAL COMMISSION FOR WOMEN
NEW DELHI
FOREWORD
The existential pathos of a woman�s life has been inimitably captured by the great
Hindi poet, Shri Maithilisharan Gupta, in a memorable couplet which says, �Alas, woman!
Thy destiny is eternal sacrifice, eternal suffering!�
Despite the exalted position given to women in some of India�s religious texts and
the exceptional attainments of individual women in fields as diverse as philosophy, statecraft
and even warfare, the profile of the average woman through the ages has been that of
a perpetually poor, perpetually pregnant and perpetually powerless being.
Independent India has tried to redeem the situation by proclaiming equality of the
sexes as a Fundamental Right under the Constitution and directing state policy towards
removing the various disabilities that thwart women in realising their potential. Five decades
of Independence have also seen a plethora of laws passed by the State and Federal
Governments to protect women from violence and discrimination and to strengthen their
entitlements in the social and economic fields. Numerous committees and commissions
have x-rayed the position of women, the advances made by them and the obstacles faced
by them, and they have made umpteen recommendations to improve the situation. Scores
of schemes have been floated by various Ministries of the Government to address women�s
problems, particularly those relating to education, health, nutrition, livelihood and personal
laws. In the institutional area, independent administrative departments to give undivided
attention to women�s problems have sprung up at the Centre as well as in the States.
Development corporations were an innovation of the Eighties to energise economic benefit
schemes. The Nineties saw the setting up of the National Commission for Women (NCW)
and State Commissions in various States to inquire into the working of various legal and
constitutional provisions concerning women, to investigate cases of violation of women�s
rights and generally to advise on the socio-economic policy framework in order to mainstream
women�s concerns. In recent years, the Governments, Central and State, have also articulated
comprehensive policies for the empowerment of women through a variety of instruments
and approaches focusing on an explicit vision of equal partnership of women in all walks
of life.
(i)

Credit must also be given to a robust women�s movement which has often given
forceful expression to women�s aspirations and joined issue with all the organs of
state � legislative, executive and judicial � for reviewing the age-old prescriptions of a
patriarchal society. Often they have networked effectively with the international community
and fora in the quest for worldwide solidarity on issues affecting women. These interactions
have often times changed the idiom of discourse on women�s right to justice and development.
The half-century of struggle and reform has undoubtedly had considerable impact
on women�s world. Some of the key indicators of development have perked up significantly;
women�s life expectancy has risen; education levels have improved; economic participation
has grown. But there are areas of darkness too; crimes against women, both at home and
outside, continue unabated; traditional economic occupations have withered in the face of
global competition; there is increasing commodification of women�s persona and vulgarisation
of their image in the media�s marketplace. The new economic regime, where Sensex
swamps sensibility, has meant the precipitate withdrawal of the state from many fields
leaving the weak, including women, in the cold. Similarly laws change; minds don�t. Therefore
between progressive legislation and sensitive enforcement falls a long shadow. Critics also
point out that whatever advances have been made remain confined to urban India and the
vast hinterland resists change obstinately.
The overall picture is thus a mixed one leaving the profile of the average Indian
woman not substantially altered. But in this vast country there is no average Indian
woman. As in all other matters, diversity marks the Indian woman�s picture too. How
society and economy are coping with the forces of modernisation differs substantially from
region to region. The geography of a state provides its own constraints and opportunities;
history gives its own moorings to values and momentum to change. Thus the regional
profile is superimposed on the national profile. The NCW has therefore commissioned
these studies to gauge how women�s life has been changing or not changing in different
States of the country, and to situate these studies in the historical and geographical
context of each region or State so that progress can be measured across time and across
space. Such spatial comparisons can highlight what lessons there are to be learnt from
the �leading� areas and equally they help in focusing the attention on the �lagging� areas.
Regionally disaggregated data helps in benchmarking progress of different regions, areas
or districts, and can be used for improving performance by attempting to raise the performance
levels of the laggards to the average of the State and then matching the State�s average
to the national average. Interesting insights can also be gleaned from the experience of
implementing agencies, both governmental and non-governmental, in dealing with different
(ii)
problems. Some of these may be rooted in the soil of the region and may not lend
themselves to replication but many others can be useful examples to emulate. That is how
Best Practices become common practices.
These studies have been carried out by different research groups having special
knowledge and interest in the area � its people, its history, its administration, its cultural
ambience etc. They have interacted with official agencies as well as with leading NGOs
working with women in the respective areas. The NCW has given a helping hand by
providing information from its own database where available and also by interacting with
the government of the State to set the stage for these exercises. The result is in your
hands.
It is our hope that this effort will eventually result in the compilation of a comprehensive
index of gender development focusing on the key issues in women�s lives thus enabling
comparisons of achievements and gaps regionally and nationally. This will help scholars
and administrators alike.
Poornima Advani
(iii)
PREFACE
Non-discrimination is part and parcel of the basic structure of the Constitution of India. Officially,
the Government of India is committed to eliminating all forms of discrimination against women. Even
so, in practice, women in the country are subject to cascading discrimination. The women�s movement
is struggling against it. At the national and sub-national levels, efforts are being made to bring about
equality of sexes in the true sense of the expression. For the purpose, investments are being made on
women�s development, institutional structures have been created not only to perform watchdog functions
but also to implement, coordinate and direct gender specific initiatives. The National Commission for
Women (NCW), the apex women�s development institution in the country, in this context, has commissioned
situational analysis of women in the various States, one of which is Kerala.
Eminent social scientists and analysts quote Kerala as a model among developing societies for
forging human development including in terms of eliminating gender discrimination.
I am privileged to have been called upon by the NCW to make the situational analysis of women
in this model State. I have made a humble effort. This document is the output of this effort. I have
great pleasure in submitting it to the Commission.
New Delhi, 21st January, 2004 Dr. SARALA GOPALAN
(v)
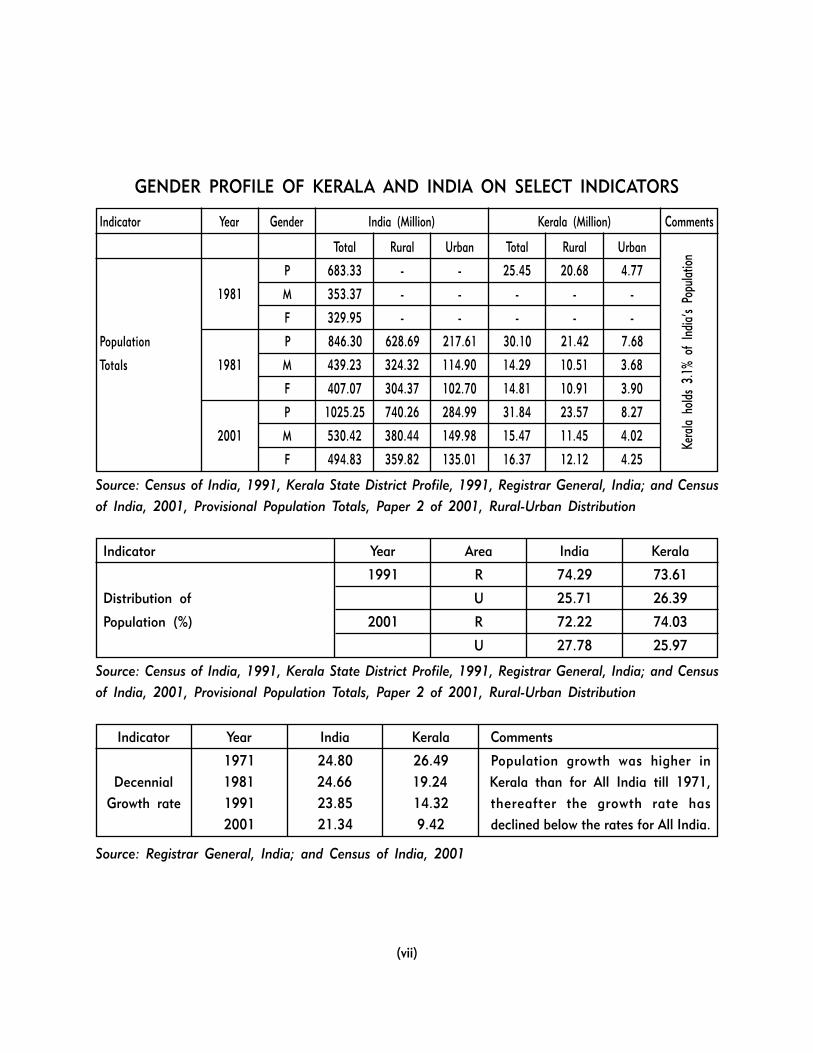
GENDER PROFILE OF KERALA AND INDIA ON SELECT INDICATORS
Indicator Year Gender India (Million) Kerala (Million) Comments
Total Rural Urban Total Rural Urban
P 683.33 - - 25.45 20.68 4.77
1981 M 353.37 - - - - -
F 329.95 - - - - -
Population P 846.30 628.69 217.61 30.10 21.42 7.68
Totals 1981 M 439.23 324.32 114.90 14.29 10.51 3.68
F 407.07 304.37 102.70 14.81 10.91 3.90
P 1025.25 740.26 284.99 31.84 23.57 8.27
2001 M 530.42 380.44 149.98 15.47 11.45 4.02
F 494.83 359.82 135.01 16.37 12.12 4.25
Source: Census of India, 1991, Kerala State District Profile, 1991, Registrar General, India; and Census
of India, 2001, Provisional Population Totals, Paper 2 of 2001, Rural-Urban Distribution
Indicator Year Area India Kerala
1991 R 74.29 73.61
Distribution of U 25.71 26.39
Population (%) 2001 R 72.22 74.03
U 27.78 25.97
Source: Census of India, 1991, Kerala State District Profile, 1991, Registrar General, India; and Census
of India, 2001, Provisional Population Totals, Paper 2 of 2001, Rural-Urban Distribution
Indicator Year India Kerala Comments
1971 24.80 26.49 Population growth was higher in
Decennial 1981 24.66 19.24 Kerala than for All India till 1971,
Growth rate 1991 23.85 14.32 thereafter the growth rate has
2001 21.34 9.42 declined below the rates for All India.
Source: Registrar General, India; and Census of India, 2001
Kera
la h
olds
3.1
% o
f In
dia�
s Po
pula
tion
(vii)
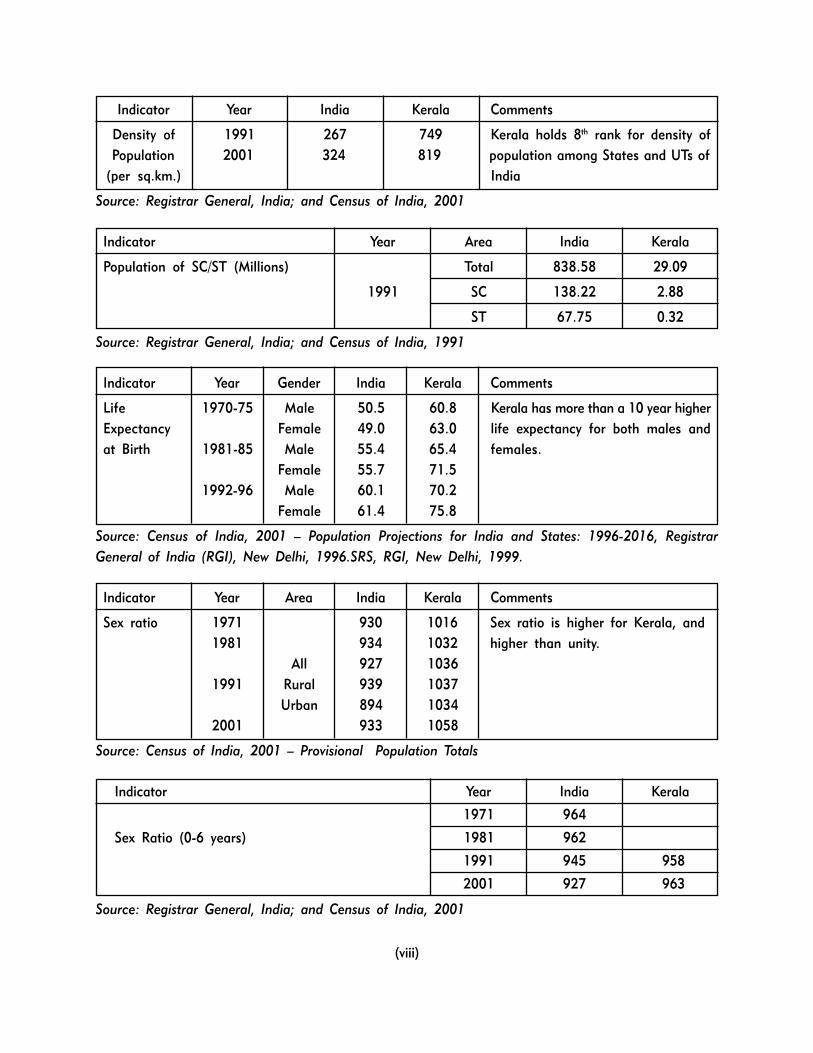
Indicator Year India Kerala Comments
Density of 1991 267 749 Kerala holds 8th rank for density of
Population 2001 324 819 population among States and UTs of
(per sq.km.) India
Source: Registrar General, India; and Census of India, 2001
Indicator Year Area India Kerala
Population of SC/ST (Millions) Total 838.58 29.09
1991 SC 138.22 2.88
ST 67.75 0.32
Source: Registrar General, India; and Census of India, 1991
Indicator Year Gender India Kerala Comments
Life 1970-75 Male 50.5 60.8 Kerala has more than a 10 year higher
Expectancy Female 49.0 63.0 life expectancy for both males and
at Birth 1981-85 Male 55.4 65.4 females.
Female 55.7 71.5
1992-96 Male 60.1 70.2
Female 61.4 75.8
Source: Census of India, 2001 � Population Projections for India and States: 1996-2016, Registrar
General of India (RGI), New Delhi, 1996.SRS, RGI, New Delhi, 1999.
Indicator Year Area India Kerala Comments
Sex ratio 1971 930 1016 Sex ratio is higher for Kerala, and
1981 934 1032 higher than unity.
All 927 1036
1991 Rural 939 1037
Urban 894 1034
2001 933 1058
Source: Census of India, 2001 � Provisional Population Totals
Indicator Year India Kerala
1971 964
Sex Ratio (0-6 years) 1981 962
1991 945 958
2001 927 963
Source: Registrar General, India; and Census of India, 2001
(viii)
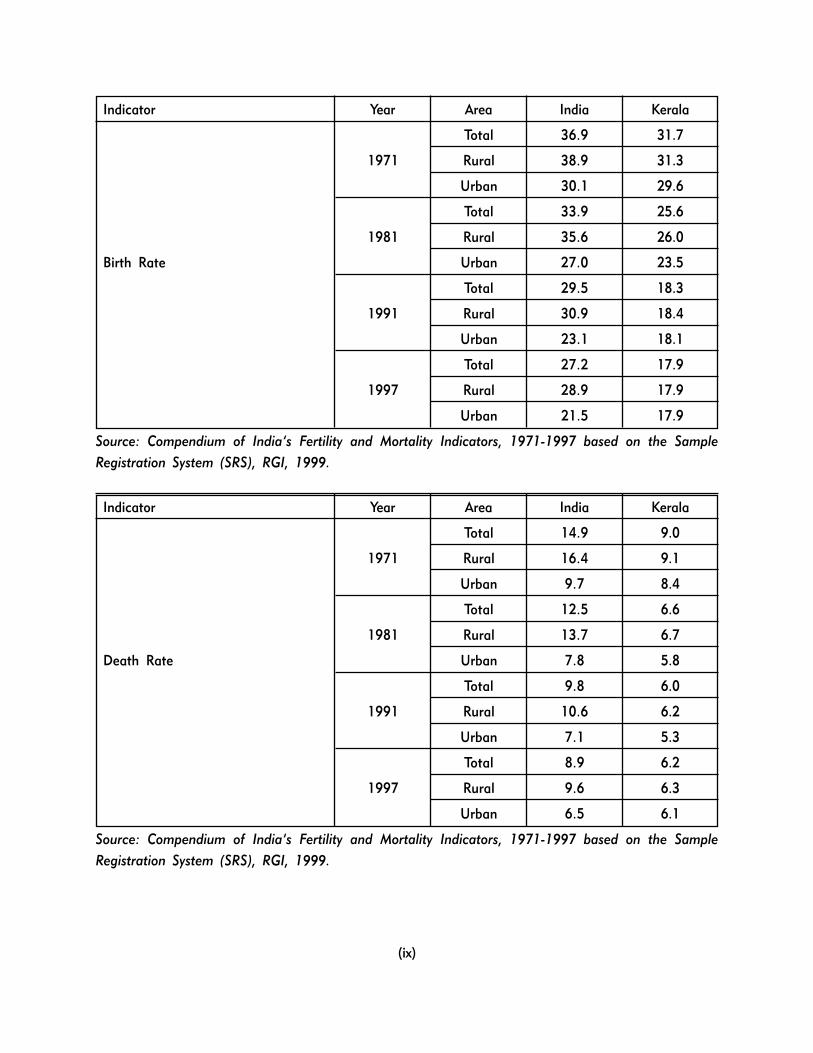
Indicator Year Area India Kerala
Total 36.9 31.7
1971 Rural 38.9 31.3
Urban 30.1 29.6
Total 33.9 25.6
1981 Rural 35.6 26.0
Birth Rate Urban 27.0 23.5
Total 29.5 18.3
1991 Rural 30.9 18.4
Urban 23.1 18.1
Total 27.2 17.9
1997 Rural 28.9 17.9
Urban 21.5 17.9
Source: Compendium of India�s Fertility and Mortality Indicators, 1971-1997 based on the Sample
Registration System (SRS), RGI, 1999.
Indicator Year Area India Kerala
Total 14.9 9.0
1971 Rural 16.4 9.1
Urban 9.7 8.4
Total 12.5 6.6
1981 Rural 13.7 6.7
Death Rate Urban 7.8 5.8
Total 9.8 6.0
1991 Rural 10.6 6.2
Urban 7.1 5.3
Total 8.9 6.2
1997 Rural 9.6 6.3
Urban 6.5 6.1
Source: Compendium of India�s Fertility and Mortality Indicators, 1971-1997 based on the Sample
Registration System (SRS), RGI, 1999.
(ix)
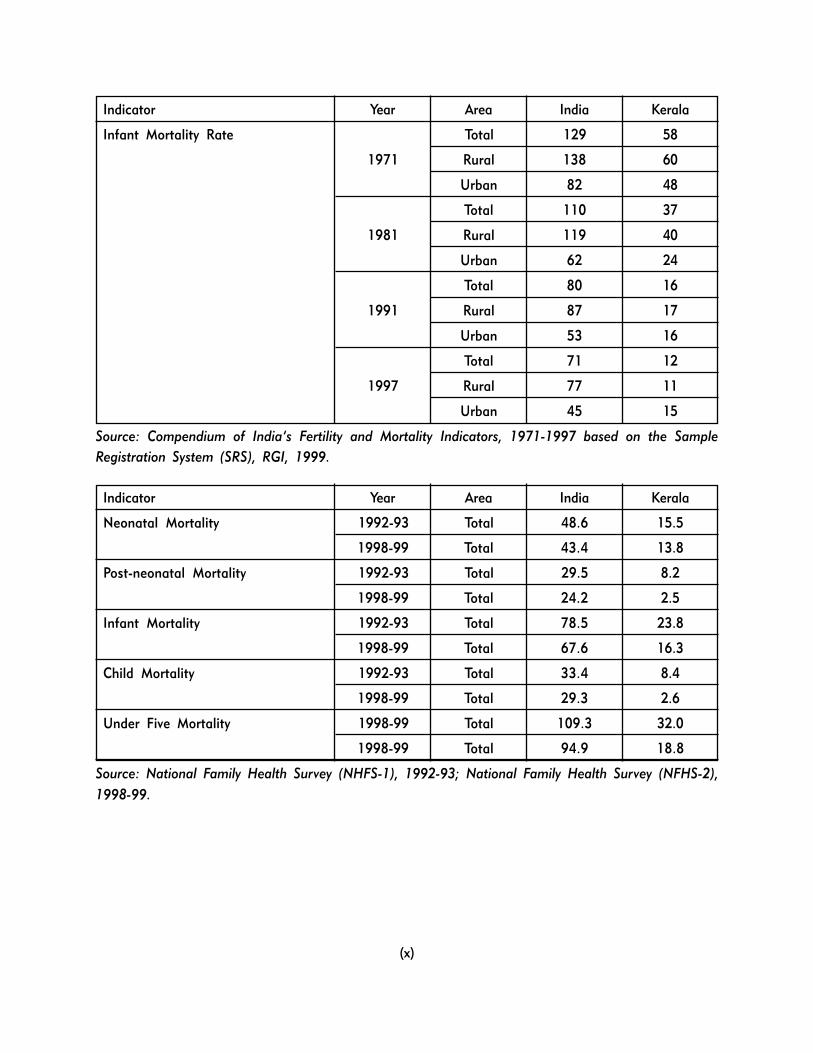
Indicator Year Area India Kerala
Infant Mortality Rate Total 129 58
1971 Rural 138 60
Urban 82 48
Total 110 37
1981 Rural 119 40
Urban 62 24
Total 80 16
1991 Rural 87 17
Urban 53 16
Total 71 12
1997 Rural 77 11
Urban 45 15
Source: Compendium of India�s Fertility and Mortality Indicators, 1971-1997 based on the Sample
Registration System (SRS), RGI, 1999.
Indicator Year Area India Kerala
Neonatal Mortality 1992-93 Total 48.6 15.5
1998-99 Total 43.4 13.8
Post-neonatal Mortality 1992-93 Total 29.5 8.2
1998-99 Total 24.2 2.5
Infant Mortality 1992-93 Total 78.5 23.8
1998-99 Total 67.6 16.3
Child Mortality 1992-93 Total 33.4 8.4
1998-99 Total 29.3 2.6
Under Five Mortality 1998-99 Total 109.3 32.0
1998-99 Total 94.9 18.8
Source: National Family Health Survey (NHFS-1), 1992-93; National Family Health Survey (NFHS-2),
1998-99.
(x)
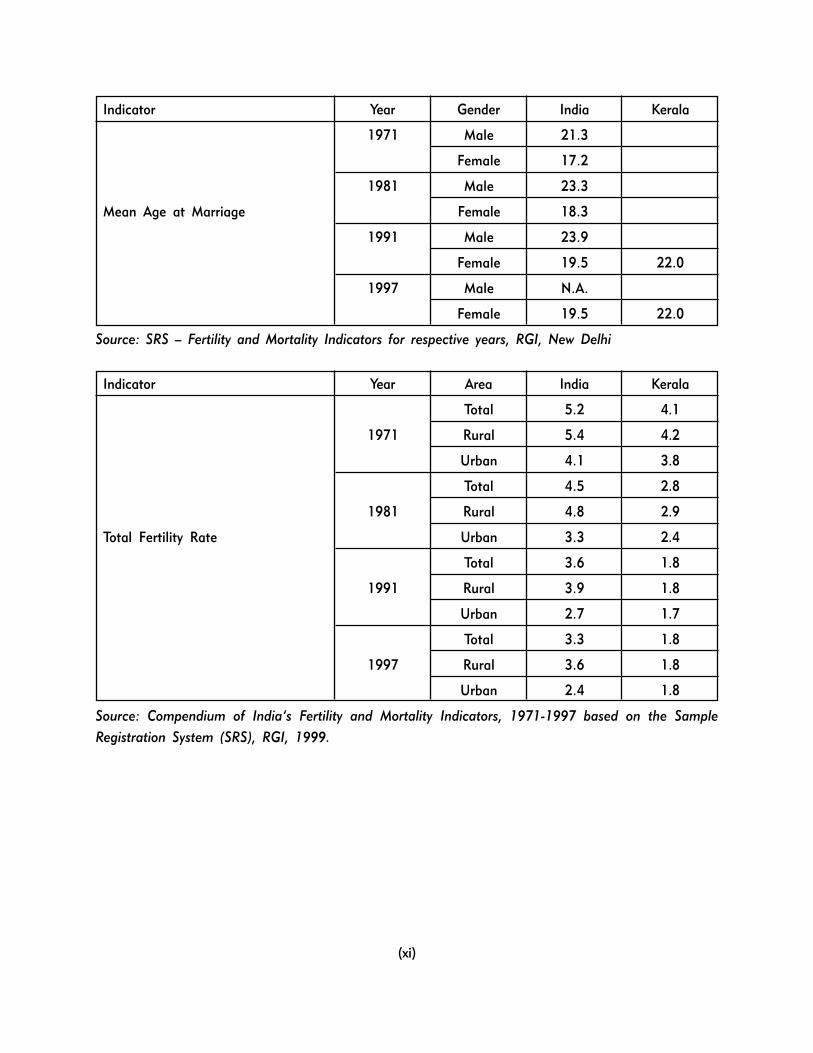
Indicator Year Gender India Kerala
1971 Male 21.3
Female 17.2
1981 Male 23.3
Mean Age at Marriage Female 18.3
1991 Male 23.9
Female 19.5 22.0
1997 Male N.A.
Female 19.5 22.0
Source: SRS � Fertility and Mortality Indicators for respective years, RGI, New Delhi
Indicator Year Area India Kerala
Total 5.2 4.1
1971 Rural 5.4 4.2
Urban 4.1 3.8
Total 4.5 2.8
1981 Rural 4.8 2.9
Total Fertility Rate Urban 3.3 2.4
Total 3.6 1.8
1991 Rural 3.9 1.8
Urban 2.7 1.7
Total 3.3 1.8
1997 Rural 3.6 1.8
Urban 2.4 1.8
Source: Compendium of India�s Fertility and Mortality Indicators, 1971-1997 based on the Sample
Registration System (SRS), RGI, 1999.
(xi)
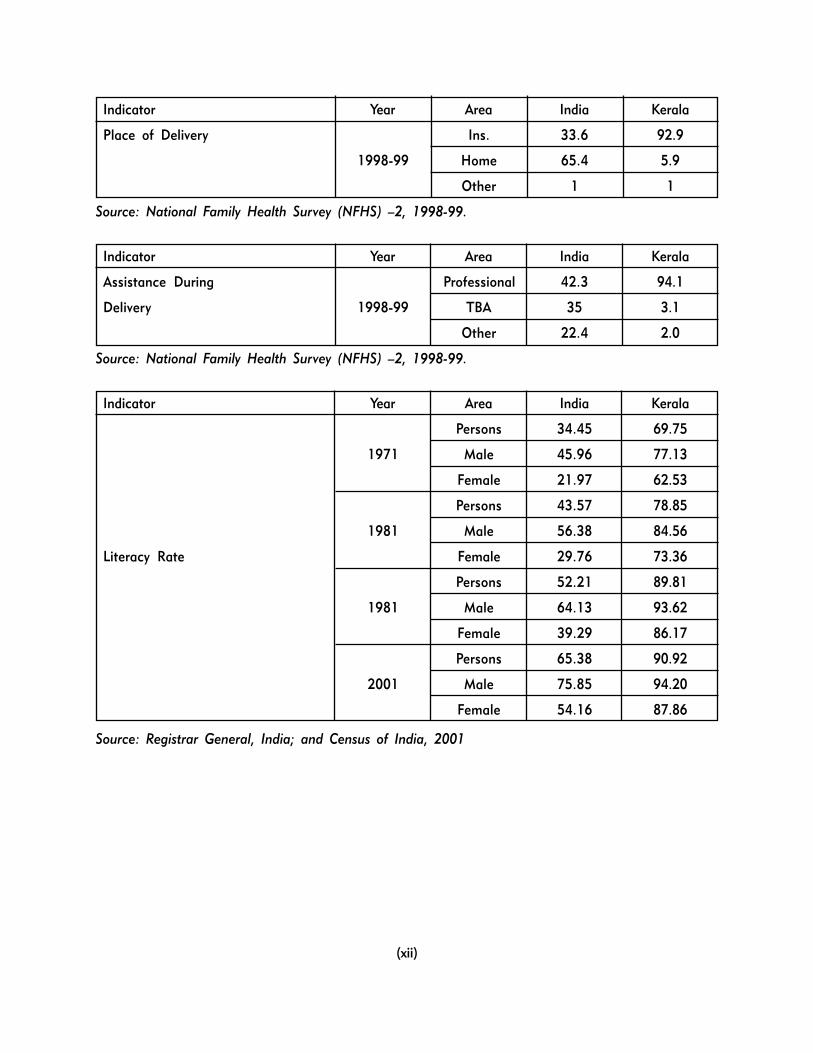
Indicator Year Area India Kerala
Place of Delivery Ins. 33.6 92.9
1998-99 Home 65.4 5.9
Other 1 1
Source: National Family Health Survey (NFHS) �2, 1998-99.
Indicator Year Area India Kerala
Assistance During Professional 42.3 94.1
Delivery 1998-99 TBA 35 3.1
Other 22.4 2.0
Source: National Family Health Survey (NFHS) �2, 1998-99.
Indicator Year Area India Kerala
Persons 34.45 69.75
1971 Male 45.96 77.13
Female 21.97 62.53
Persons 43.57 78.85
1981 Male 56.38 84.56
Literacy Rate Female 29.76 73.36
Persons 52.21 89.81
1981 Male 64.13 93.62
Female 39.29 86.17
Persons 65.38 90.92
2001 Male 75.85 94.20
Female 54.16 87.86
Source: Registrar General, India; and Census of India, 2001
(xii)
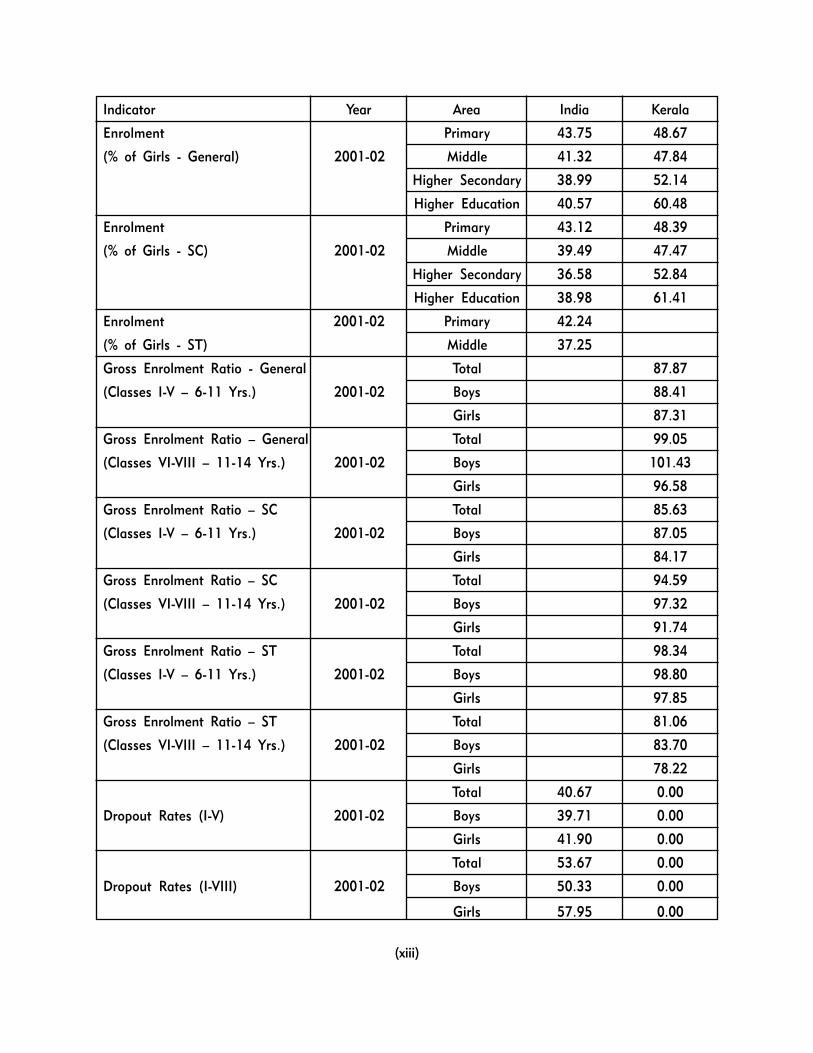
Indicator Year Area India Kerala
Enrolment Primary 43.75 48.67
(% of Girls - General) 2001-02 Middle 41.32 47.84
Higher Secondary 38.99 52.14
Higher Education 40.57 60.48
Enrolment Primary 43.12 48.39
(% of Girls - SC) 2001-02 Middle 39.49 47.47
Higher Secondary 36.58 52.84
Higher Education 38.98 61.41
Enrolment 2001-02 Primary 42.24
(% of Girls - ST) Middle 37.25
Gross Enrolment Ratio - General Total 87.87
(Classes I-V � 6-11 Yrs.) 2001-02 Boys 88.41
Girls 87.31
Gross Enrolment Ratio � General Total 99.05
(Classes VI-VIII � 11-14 Yrs.) 2001-02 Boys 101.43
Girls 96.58
Gross Enrolment Ratio � SC Total 85.63
(Classes I-V � 6-11 Yrs.) 2001-02 Boys 87.05
Girls 84.17
Gross Enrolment Ratio � SC Total 94.59
(Classes VI-VIII � 11-14 Yrs.) 2001-02 Boys 97.32
Girls 91.74
Gross Enrolment Ratio � ST Total 98.34
(Classes I-V � 6-11 Yrs.) 2001-02 Boys 98.80
Girls 97.85
Gross Enrolment Ratio � ST Total 81.06
(Classes VI-VIII � 11-14 Yrs.) 2001-02 Boys 83.70
Girls 78.22
Total 40.67 0.00
Dropout Rates (I-V) 2001-02 Boys 39.71 0.00
Girls 41.90 0.00
Total 53.67 0.00
Dropout Rates (I-VIII) 2001-02 Boys 50.33 0.00
Girls 57.95 0.00
(xiii)
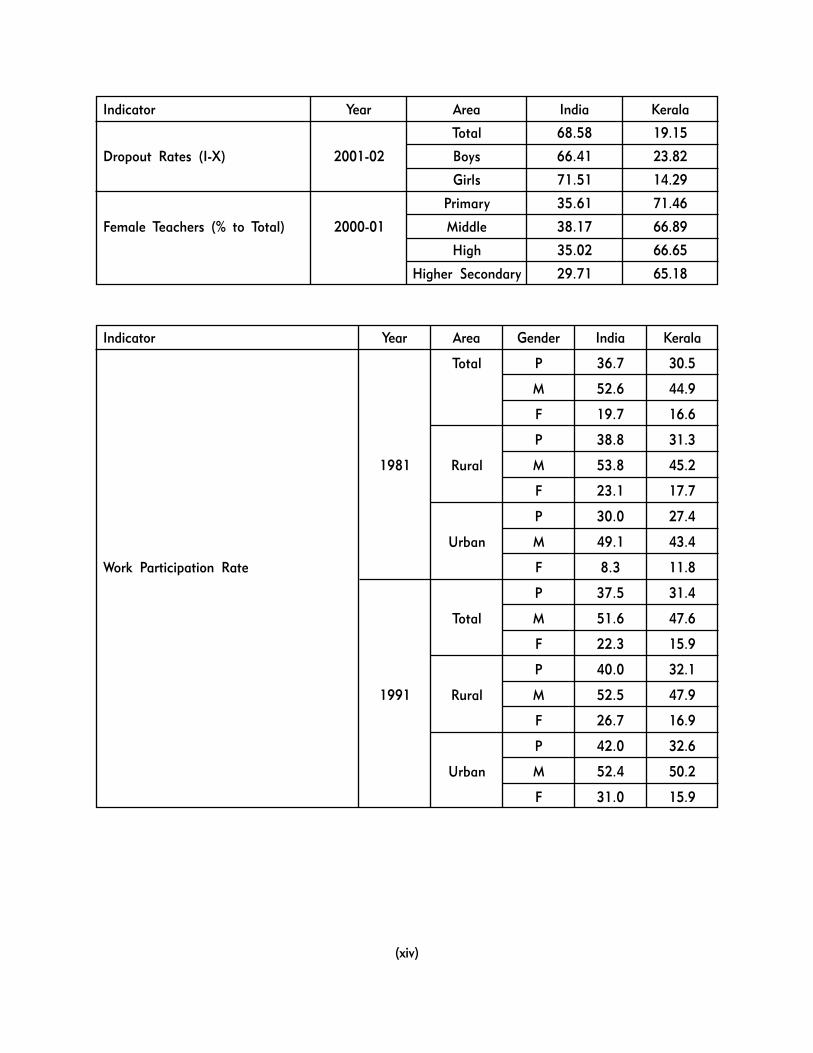
Indicator Year Area India Kerala
Total 68.58 19.15
Dropout Rates (I-X) 2001-02 Boys 66.41 23.82
Girls 71.51 14.29
Primary 35.61 71.46
Female Teachers (% to Total) 2000-01 Middle 38.17 66.89
High 35.02 66.65
Higher Secondary 29.71 65.18
Indicator Year Area Gender India Kerala
Total P 36.7 30.5
M 52.6 44.9
F 19.7 16.6
P 38.8 31.3
1981 Rural M 53.8 45.2
F 23.1 17.7
P 30.0 27.4
Urban M 49.1 43.4
Work Participation Rate F 8.3 11.8
P 37.5 31.4
Total M 51.6 47.6
F 22.3 15.9
P 40.0 32.1
1991 Rural M 52.5 47.9
F 26.7 16.9
P 42.0 32.6
Urban M 52.4 50.2
F 31.0 15.9
(xiv)
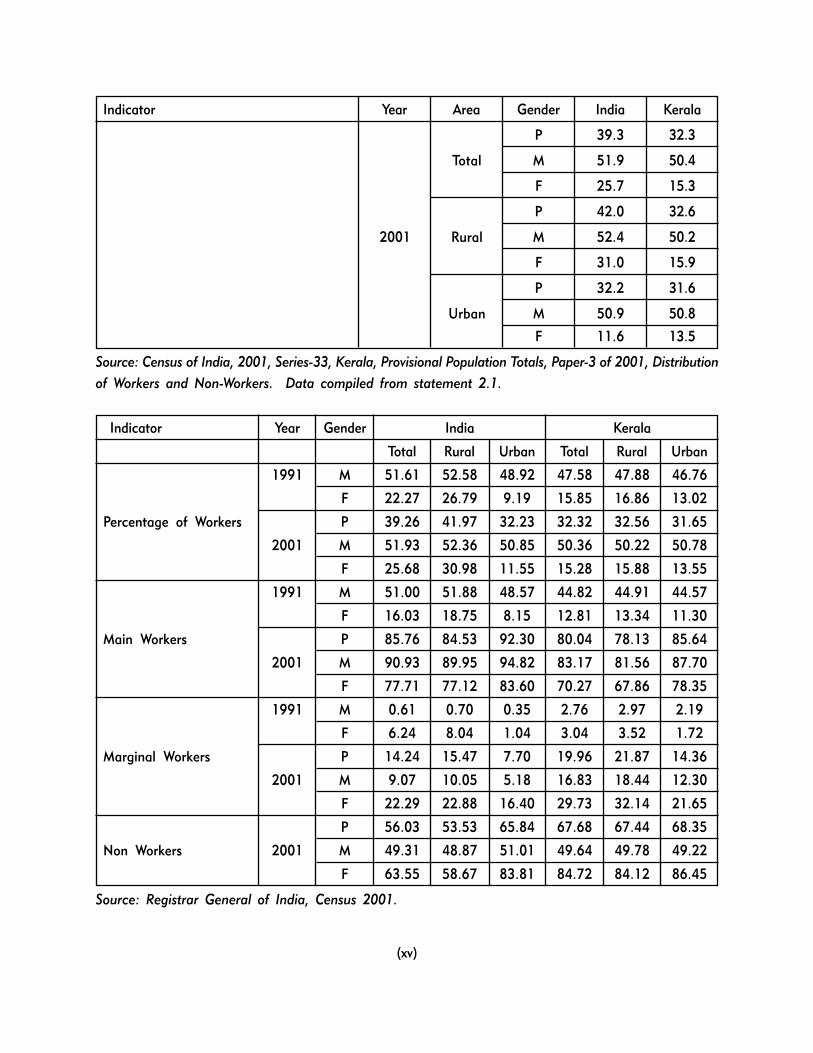
Indicator Year Area Gender India Kerala
P 39.3 32.3
Total M 51.9 50.4
F 25.7 15.3
P 42.0 32.6
2001 Rural M 52.4 50.2
F 31.0 15.9
P 32.2 31.6
Urban M 50.9 50.8
F 11.6 13.5
Source: Census of India, 2001, Series-33, Kerala, Provisional Population Totals, Paper-3 of 2001, Distribution
of Workers and Non-Workers. Data compiled from statement 2.1.
Indicator Year Gender India Kerala
Total Rural Urban Total Rural Urban
1991 M 51.61 52.58 48.92 47.58 47.88 46.76
F 22.27 26.79 9.19 15.85 16.86 13.02
Percentage of Workers P 39.26 41.97 32.23 32.32 32.56 31.65
2001 M 51.93 52.36 50.85 50.36 50.22 50.78
F 25.68 30.98 11.55 15.28 15.88 13.55
1991 M 51.00 51.88 48.57 44.82 44.91 44.57
F 16.03 18.75 8.15 12.81 13.34 11.30
Main Workers P 85.76 84.53 92.30 80.04 78.13 85.64
2001 M 90.93 89.95 94.82 83.17 81.56 87.70
F 77.71 77.12 83.60 70.27 67.86 78.35
1991 M 0.61 0.70 0.35 2.76 2.97 2.19
F 6.24 8.04 1.04 3.04 3.52 1.72
Marginal Workers P 14.24 15.47 7.70 19.96 21.87 14.36
2001 M 9.07 10.05 5.18 16.83 18.44 12.30
F 22.29 22.88 16.40 29.73 32.14 21.65
P 56.03 53.53 65.84 67.68 67.44 68.35
Non Workers 2001 M 49.31 48.87 51.01 49.64 49.78 49.22
F 63.55 58.67 83.81 84.72 84.12 86.45
Source: Registrar General of India, Census 2001.
(xv)
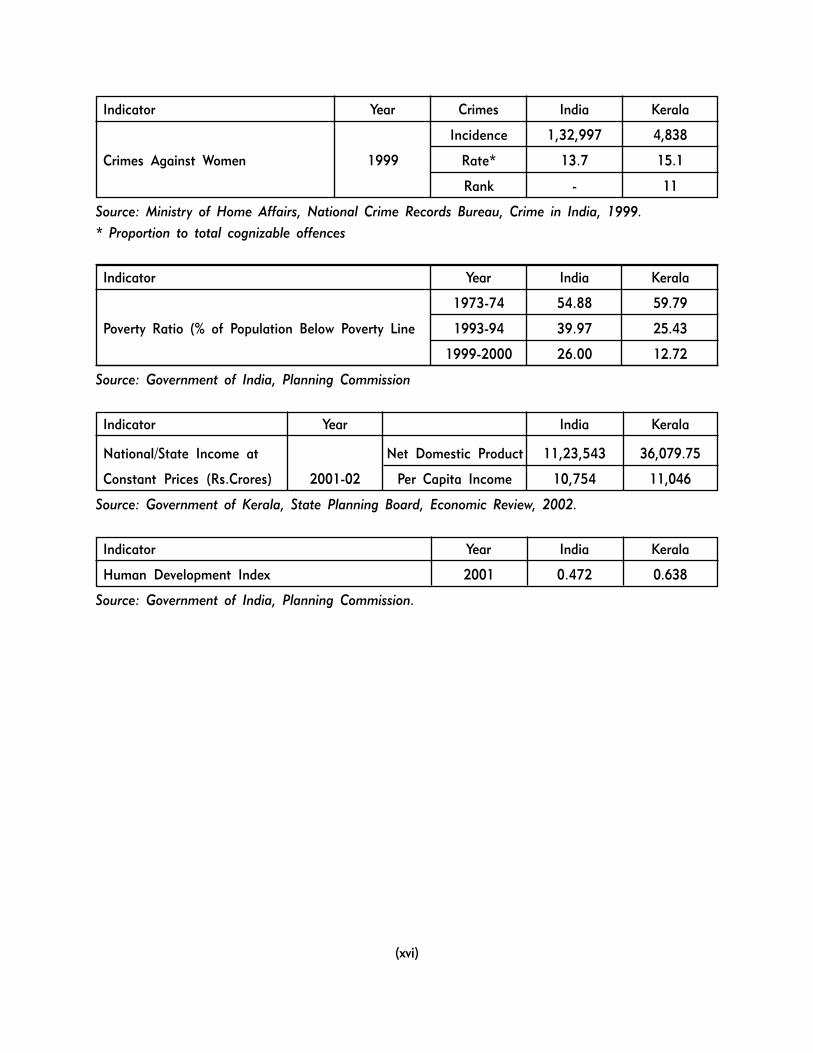
Indicator Year Crimes India Kerala
Incidence 1,32,997 4,838
Crimes Against Women 1999 Rate* 13.7 15.1
Rank - 11
Source: Ministry of Home Affairs, National Crime Records Bureau, Crime in India, 1999.
* Proportion to total cognizable offences
Indicator Year India Kerala
1973-74 54.88 59.79
Poverty Ratio (% of Population Below Poverty Line 1993-94 39.97 25.43
1999-2000 26.00 12.72
Source: Government of India, Planning Commission
Indicator Year India Kerala
National/State Income at Net Domestic Product 11,23,543 36,079.75
Constant Prices (Rs.Crores) 2001-02 Per Capita Income 10,754 11,046
Source: Government of Kerala, State Planning Board, Economic Review, 2002.
Indicator Year India Kerala
Human Development Index 2001 0.472 0.638
Source: Government of India, Planning Commission.
(xvi)
TABLE OF CONTENTS
Subject Pages
Foreword i-iii
Preface v
Gender Profile of Kerala and India on Select Indicators vii-xvi
1. Introduction 1-4
2. Demographic Profile 5-10
3. Health Care Infrastructure and Services 11-16
Mortality 12
Morbidity 13
Mental Health 13
Reproductive Health 14
Fertility 14
Nutrition 15
Child Health 16
4. Education 17-23
Literacy 17
Education Infrastructure 18
Enrolment, Drop out and Attendance Ratios 19
Teacher-Pupil Ratio 20
Educational Attainment 21
Vocational Training Outside the General Educational School System 21
Post Secondary and Higher Education 22
Expenditure on Education 22
5. Employment 25-29
Historical Perspective and Employment Profile of Women 25
Work Participation and Occupational Shifts 26
Informal Sector 27
Marginalization Trend � Census 1991-2001 28
SC/ST Labour Participation 28
Unemployment 29
Subject Pages
6. Poverty 31-37
Poverty Head Count 31
Anti-Poverty Programmes 31
Rehabilitation of the Disabled 32
Kudumbashree 34
Housing, Sanitation and Environment 35
Female Headed Households 37
Women�s Component Plan 37
7. Political Participation by Women 39
8. Violence 41-42
9. Women and Property Rights 43-45
10. Women�s Development: Specialized Agencies in Kerala 47-48
11. Public Hearings and Dialogues of the National Commission for
Women with Experts, NGOs and Government of Kerala 49-51
Meeting of the Expert Committee on Economic Empowerment of Women 49
Public Hearings 49
Dialogue with NGOs 50
Interaction with State Government Departments and Public Sector Enterprises 50
12. Conclusion 53-54
Appendix 1 : Statistical Tables 55-82
Demography
Table 2.1 - Percentage of decadal growth, percentage of child population
in the age-group 0-6 by residence and percentage of urban
population to total population � Kerala State and Districts, 2001 57-58
Table 2.2 - Proportion of Urban Population to Total Population in the Districts
of Kerala, 1951-2001 & density of population (2001) 59
Table 2.3 - Life Expectancy at Birth 60
Table 2.4 - Proportion of Population by Age Groups 60
Health
Table 3.1 - Health Infrastructure in Kerala 61
Table 3.2 - Age Specific Mortality Rates by Sex and Residence, Kerala, 1997 62
Table 3.3 - Mortality Indicators, Kerala 63
Table 3.4 - Age Specific Fertility Rate � 1971-1998 64

Subject Pages
Table 3.5 - Percentage Distribution of Current Live Births by Birth Interval, 1998 64
Table 3.6 - Knowledge and Current Use of Contraception 65
Table 3.7 - Couple Protection Rate and Female Reproductive Age Group � District Wise 66
Education
Table 4.1 - Literacy Rates by Sex for Kerala State and Districts 67
Table 4.2 - Infrastructure for Education 68
Table 4.3 - Enrolment in Schools � Stage wise 2001 & 2002 (Lakhs) 69
Table 4.4 - Drop-out and Net Attendance Rates for Kerala and All India 69
Table 4.5 - Enrolment of SC/ST Students at School Level (numbers), 2000 70
Table 4.6 - Enrolment in Higher Education, Kerala, 1999-2000 70
Table 4.7 - Enrolment of Students in Arts and Science Colleges in Kerala 2002 71
Employment
Table 5.1 - Comparative employment Profile - Kerala and All India (2001) 75
Table 5.2 - Percentage distribution of female main workers by industrial category,
States/Union Territories (Rural, Urban) � 1981, 1991 and 1999-2000 76
Table 5.3 - Work Participation rates by residence in the districts for 1991 and 2001 77
Table 5.4 - Inter Census trends in category shifts of workers. 78
Poverty
Table 6.1 - Number of Families Below Poverty Line � 1998-99 (Provisional) 81
Violence
Table 8.1 - District-wise Crime Against Women Reported in Kerala-2001 82
Appendix 2 : Organogram - State Machinery for Advancement of Women � Kerala 83
Appendix 3 : Public Hearings 85-113
Paper 1 : Report of the Public Hearing: The Impact of Globalization on Women
Workers, Organized by the National Commission for Women on the
26-27 September, 2001 87-109
Paper 2 : Gist of Public Hearing Organized by NCW on Impact of Globalization
on Women Domestic Workers, Organized by the Center for Women�s
Studies and Development, Research Institute, Rajagiri College of
Social Sciences, Kalamassery, Kochi, Kerala, September, 2003 111-113
Subject Pages
Appendix 4 : Dialogue with the NGOs and State Government 115-138
Paper 1 : Meeting of the Expert Committee on Economic Empowerment of
Women held by NCW on 08.04.2003, at New Delhi 117
Paper 2 : Dialogue with the NGOs and State Government 119-123
Paper 3 : Summary Report of Workshop of �Status of Women in Kerala,
20th May, 2003, Organized by the National Commission for Women
and Sate Commission for Women 125-127
Paper 4 : Meeting on Sexual Harassment � Functioning of Complaints
Committee in Workplaces, 20 May, 2003 � Organized by
National Commission for Women 129-132
Paper 5 : Minutes of the meeting held on 21st May, 2003 between the
visiting team of National Commission for Women (NCW) led by
Dr. Poornima Advani, Chairperson, NCW and the Secretaries and
Head of the Department of Government of Kerala in the
Conference Hall of the Secretariat of the Kerala Government at
Thiruvananthapuram 133-138
Bibliography 139-140
Related Documents