1. INTRODUCTION AND EXPLANATORY NOTES Shipboard Scientific Party 1 SCIENTIFIC OBJECTIVES Leg 42A of the Deep Sea Drilling Project was scheduled to continue the geological exploration of the Mediterranean (Figure 1). The 1970 drilling during Leg 13 discovered the basin-wide occurrence of a Messinian evaporite formation. Studies of the drill cores also yielded considerable information on the Messinian salinity crisis and on the Plio-Quaternary history of this inland sea. However, this first Deep Sea Drilling cruise to the Mediterranean was designed as a reconnaissance. A total of 14 sites were drilled east of Gibraltar, and in most of those we failed to penetrate deeper than the Plio-Quaternary, or the upper Messin- ian. Little information was gathered on the pre-Messin- ian history of the Mediterranean. The lack of such data was particularly vexing because a definitive interpreta- tion on the genesis of the Mediterranean Evaporite Formation depends upon a knowledge of the state of tectonic evolution of the Mediterranean prior to the Messinian salinity crisis. The planning of the second Mediterranean cruise began in earnest in 1972 after a reorganization of the Mediterranean Advisory Panel. Marine geological and geophysical investigations of the Mediterranean were carried out mainly by the European organizations following the 1970 cruise. We relied heavily in our planning on the French I.F.P.-CNEXO data for sites in the Balearic and Levantine basins, on the Italian (Trieste and Bologna) data for sites in the Tyrrhenian and the Ionian basins, and on the German (Hannover) and British (Cambridge) data for Aegean sites. Valu- able information was also made available to us by 1 Kenneth J. Hsü (Co-chief scientist), Eidg. Technisches Hoch- schule, Geologisches Institut, Zurich, Switzerland; Lucien Montadert (Co-chief scientist), Division Geologie, Institut Francais du Petrole, Rueil Malmaison, France; Daniel Bernoulli, Geologisch-palaontolo- gisches Institut der Universitat Basel, Basel, Switzerland; Germaine Bizon, Bureau d'Etudes Industrielles et de Cooperation de 1'Institut Francais du Petrole, Rueil Malmaison, France; Maria Cita, Instituto di Geologia, Universita degli Studi di Milano, Milano, Italy; Al Erickson, Department of Geology, University of Georgia, Athens, Georgia; Frank Fabricius, Institut fur Geologie Techn. Universitat, Munich, Germany; Robert E. Garrison, University of California, Santa Cruz, California; Robert B. Kidd, Institute of Oceanographic Sciences, Wormley, United Kingdom; Frederic Me'lieres,Laboratoire de Geologie Dynamique, University of Paris, Paris, France; Carla Müller, Geologisch-Paleontologisches Instutut der Johann Wolfgang Geothe-Universitat, Frankfurt, Germany (Present address: Bureau d'Etudes Industrielles et de Cooperation de L'Institut Francais du Petrole, Rueil Malmaison, France); Ramil C. Wright, Beloit College, Department of Geology, Beloit, Wisconsin (Present address: Depart- ment of Geology, The Florida State University, Tallahassee, Florida. colleagues based in Isreal, the Soviet Union, and in the United States. We are proud of the fact that the seed for IPOD was planted after the first Mediterranean cruise, when W. Nierenburg, then chairman of the JOIDES Executive Committee and head of the Deep Sea Drilling Project officially invited international participation during a post-cruise press conference at Paris on 9 October 1970. The international contact required by the planning for the second Mediterranean cruise did much to sustain the spirit of cooperation and mutual assistance, which has made the IPOD one of the most productive international scientific ventures. Planning for the second Mediterranean drilling was restrained by two controlling factors: depth of penetra- tion of a single-bit hole, and the safety aspects of drilling into an evaporite basin. Although a Mediterra- nean cruise had been initially scheduled for the latter part of the third phase of the DSDP drilling, it was almost abolished altogether in 1972 when scientists interested in other oceans questioned if useful informa- tion could be obtained by sending the Glomar Chal- lenger east of Gibraltar for a second time. None was in favor of drilling another series of shallow bore holes penetrating only to the top of the Mediterranean Evaporite. It was not until the autumn of 1972 at a meeting in Zurich that the JOIDES Planning Commit- tee was convinced that we could drill into pre-Messin- ian lithologies and could do so safely. The strategy was to search for areas where the Mediterranean Evaporite formation had been largely or completely removed by erosion (as at the eventual Sites 371, 372, 373, 375, 377) or areas where the evaporite did not form structures with closures that could trap hydrocarbons (as at Sites 374, 376, 378). The Mediterranean panel members met three times with the JOIDES Safety Panel. Extremely detailed site surveying was carried out by the I.F.P. before the drilling program was approved. The main scientific objectives of the cruise were twofold: first, we intended to obtain information which would allow reconstruction of the tectonic evolution of the Mediterranean. This study should provide us with a key to an understanding of the birth and demise (through orogeny) of small ocean basins, which have been referred to as geosynclines in classical geological literature. For this purpose we needed to sample the basement underlying the oldest sediments of the Medi- terranean in order to determine its age and composi- tion so that we could interpret its origin. Holes 371 and 373A were scheduled mainly for this purpose. Unfortu- nately we had to stop short of basement in Hole 371 because of a ruling by the Safety Panel. We were

Welcome message from author
This document is posted to help you gain knowledge. Please leave a comment to let me know what you think about it! Share it to your friends and learn new things together.
Transcript

1. INTRODUCTION AND EXPLANATORY NOTES
Shipboard Scientific Party1
SCIENTIFIC OBJECTIVES
Leg 42A of the Deep Sea Drilling Project wasscheduled to continue the geological exploration of theMediterranean (Figure 1). The 1970 drilling duringLeg 13 discovered the basin-wide occurrence of aMessinian evaporite formation. Studies of the drillcores also yielded considerable information on theMessinian salinity crisis and on the Plio-Quaternaryhistory of this inland sea. However, this first Deep SeaDrilling cruise to the Mediterranean was designed as areconnaissance. A total of 14 sites were drilled east ofGibraltar, and in most of those we failed to penetratedeeper than the Plio-Quaternary, or the upper Messin-ian. Little information was gathered on the pre-Messin-ian history of the Mediterranean. The lack of such datawas particularly vexing because a definitive interpreta-tion on the genesis of the Mediterranean EvaporiteFormation depends upon a knowledge of the state oftectonic evolution of the Mediterranean prior to theMessinian salinity crisis.
The planning of the second Mediterranean cruisebegan in earnest in 1972 after a reorganization of theMediterranean Advisory Panel. Marine geological andgeophysical investigations of the Mediterranean werecarried out mainly by the European organizationsfollowing the 1970 cruise. We relied heavily in ourplanning on the French I.F.P.-CNEXO data for sites inthe Balearic and Levantine basins, on the Italian(Trieste and Bologna) data for sites in the Tyrrhenianand the Ionian basins, and on the German (Hannover)and British (Cambridge) data for Aegean sites. Valu-able information was also made available to us by
1 Kenneth J. Hsü (Co-chief scientist), Eidg. Technisches Hoch-schule, Geologisches Institut, Zurich, Switzerland; Lucien Montadert(Co-chief scientist), Division Geologie, Institut Francais du Petrole,Rueil Malmaison, France; Daniel Bernoulli, Geologisch-palaontolo-gisches Institut der Universitat Basel, Basel, Switzerland; GermaineBizon, Bureau d'Etudes Industrielles et de Cooperation de 1'InstitutFrancais du Petrole, Rueil Malmaison, France; Maria Cita, Institutodi Geologia, Universita degli Studi di Milano, Milano, Italy; AlErickson, Department of Geology, University of Georgia, Athens,Georgia; Frank Fabricius, Institut fur Geologie Techn. Universitat,Munich, Germany; Robert E. Garrison, University of California,Santa Cruz, California; Robert B. Kidd, Institute of OceanographicSciences, Wormley, United Kingdom; Frederic Me'lieres,Laboratoirede Geologie Dynamique, University of Paris, Paris, France; CarlaMüller, Geologisch-Paleontologisches Instutut der Johann WolfgangGeothe-Universitat, Frankfurt, Germany (Present address: Bureaud'Etudes Industrielles et de Cooperation de L'Institut Francais duPetrole, Rueil Malmaison, France); Ramil C. Wright, Beloit College,Department of Geology, Beloit, Wisconsin (Present address: Depart-ment of Geology, The Florida State University, Tallahassee, Florida.
colleagues based in Isreal, the Soviet Union, and in theUnited States. We are proud of the fact that the seedfor IPOD was planted after the first Mediterraneancruise, when W. Nierenburg, then chairman of theJOIDES Executive Committee and head of the DeepSea Drilling Project officially invited internationalparticipation during a post-cruise press conference atParis on 9 October 1970. The international contactrequired by the planning for the second Mediterraneancruise did much to sustain the spirit of cooperation andmutual assistance, which has made the IPOD one ofthe most productive international scientific ventures.
Planning for the second Mediterranean drilling wasrestrained by two controlling factors: depth of penetra-tion of a single-bit hole, and the safety aspects ofdrilling into an evaporite basin. Although a Mediterra-nean cruise had been initially scheduled for the latterpart of the third phase of the DSDP drilling, it wasalmost abolished altogether in 1972 when scientistsinterested in other oceans questioned if useful informa-tion could be obtained by sending the Glomar Chal-lenger east of Gibraltar for a second time. None was infavor of drilling another series of shallow bore holespenetrating only to the top of the MediterraneanEvaporite. It was not until the autumn of 1972 at ameeting in Zurich that the JOIDES Planning Commit-tee was convinced that we could drill into pre-Messin-ian lithologies and could do so safely. The strategy wasto search for areas where the Mediterranean Evaporiteformation had been largely or completely removed byerosion (as at the eventual Sites 371, 372, 373, 375,377) or areas where the evaporite did not formstructures with closures that could trap hydrocarbons(as at Sites 374, 376, 378). The Mediterranean panelmembers met three times with the JOIDES SafetyPanel. Extremely detailed site surveying was carriedout by the I.F.P. before the drilling program wasapproved.
The main scientific objectives of the cruise weretwofold: first, we intended to obtain information whichwould allow reconstruction of the tectonic evolution ofthe Mediterranean. This study should provide us with akey to an understanding of the birth and demise(through orogeny) of small ocean basins, which havebeen referred to as geosynclines in classical geologicalliterature. For this purpose we needed to sample thebasement underlying the oldest sediments of the Medi-terranean in order to determine its age and composi-tion so that we could interpret its origin. Holes 371 and373A were scheduled mainly for this purpose. Unfortu-nately we had to stop short of basement in Hole 371because of a ruling by the Safety Panel. We were

INTRODUCTION AND EXPLANATORY NOTES
40°
-30° N40°E
30°
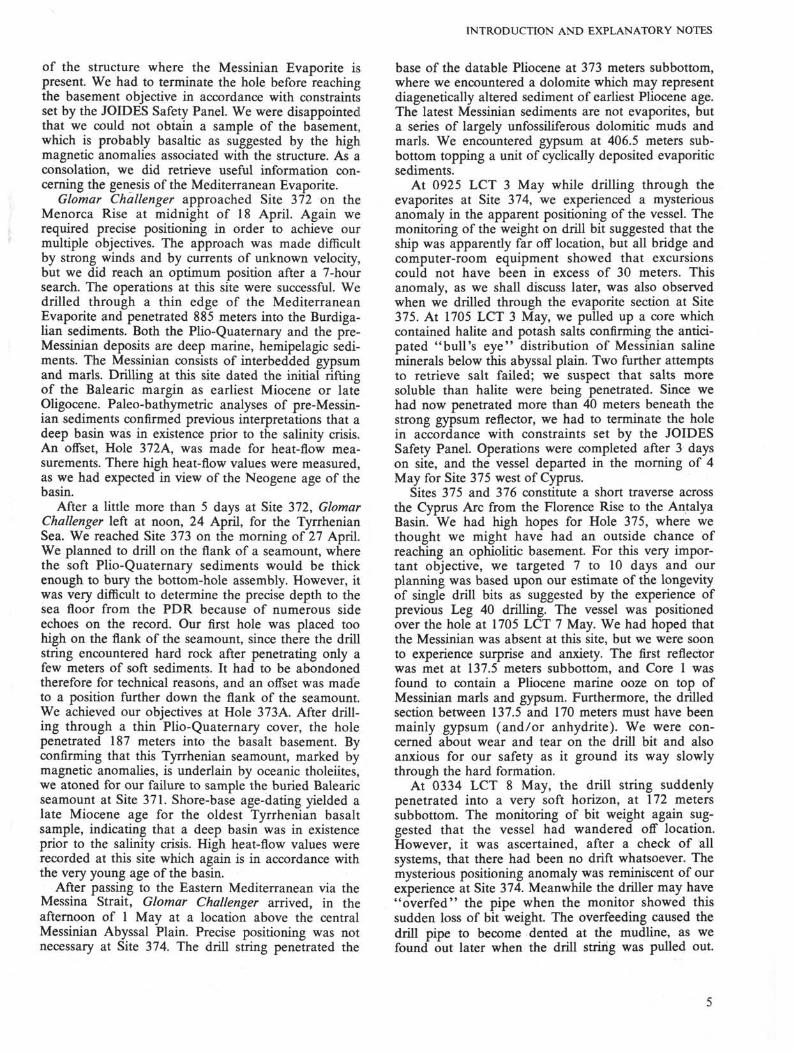
Figure 1. Map of Mediterranean with Leg 42 A sites shown in relation to Leg 13 sites.
successful in penetrating almost 200 meters into basaltin Hole 373A under the Tyrrhenian Abyssal Plain.
Our second main objective was to obtain informa-tion necessary for a definitive interpretation of thehistory of the Messinian Salinity Crisis. Again we wererequired to drill into the pre-Messinian sediment se-quences in order to study their depositional environ-ments, their paleobiogeographical province, and theirgeologic history. We accomplished those objectives bydrilling Holes 372, 375, and 377. We also needed tohave continuously cored sections of the MediterraneanEvaporite Formation to study the evolution of thesalinity crisis itself. These continuous sections wereobtained at Sites 374 and 376. In addition we plannedto explore a Mediterranean basin hitherto undrilled,namely the Aegean in order to precisely determine theextent of the evaporite formation. Consequently Site378 was drilled in the Cretan Basin.
Naturally, all sites had multiple objectives. Thisassignment of main goals serves to focus the attentionof readers who might wish to look for specific informa-tion in this volume.
An additional scientific objective of our cruise wasto conduct geothermal studies. The heat-flow measure-ments during several previous DSDP legs had not beenparticularly successful. The Mediterranean DSDP holesshould be more suitable than open ocean holes forsuch studies. The firm, but not hard, Plio-Quaternarysediments are thick enough to enable the penetrationand stabilization of the heat-flow probe down to a fewhundred meters below the sea floor, where the temper-ature gradient should remain undisturbed by short-term thermal events. Furthermore, the weather in thisinland sea could be, as eventually proved to be thecase, ideal (namely, little wind and low swells) for theoperations involved in making geothermal measure-
ments. We hoped that the heat-flow values wouldprovide additional information with which to unravelthe complicated history of the Mediterranean Sea.During Leg 42A successful heat-flow measurementswere made at Sites 372, 373, 374, 376, and 378. Theyrepresent to date one of the best sets of heat-flowvalues ever measured from beneath the ocean floor.
Another advantage of drilling in the Mediterraneanis that the usefulness of the deep-sea data could bemaximized through a comparison of the deep-searecord with the record on land, where the geology hasbeen thoroughly investigated. We are including in thisvolume three sets of comparative geological studies:between Site 372 and the Balearic Islands, betweenSite 374 and the Ionian Islands, and between Sites375/376 and Cyprus. Our synthesis chapters also madeextensive use of the geological data of the circum-Mediterranean region.
CRUISE NARRATIVE
Glomar Challenger left Malaga in the early morninghours of 4 April 1975 and arrived at Istanbul at aboutnoon, 21 May. During the 5 weeks at sea, 11 holeswere drilled at 8 sites (Figure 1). Some 4500 meters ofstratigraphic section were penetrated, and the oldestformation reached was the lower Miocene (Figure 2).
On 16 April, we started to drill our first hole at Site371 in the South Balearic Basin. The objective was tosample basement on a structural high where the eva-porite cover should have been removed by erosion.The basement topography under the site was ruggedand precise positioning was difficult. The drill site waseventually located 1.3 sea miles east and down thebasement slope from the original target location. Thisoffset necessitated slow drilling through the semiconsol-idated Pliocene marls. Also it was located on the flank
INTRODUCTION AND EXPLANATORY NOTES
of the structure where the Messinian Evaporite ispresent. We had to terminate the hole before reachingthe basement objective in accordance with constraintsset by the JOIDES Safety Panel. We were disappointedthat we could not obtain a sample of the basement,which is probably basaltic as suggested by the highmagnetic anomalies associated with the structure. As aconsolation, we did retrieve useful information con-cerning the genesis of the Mediterranean Evaporite.
Glomar Challenger approached Site 372 on theMenorca Rise at midnight of 18 April. Again werequired precise positioning in order to achieve ourmultiple objectives. The approach was made difficultby strong winds and by currents of unknown velocity,but we did reach an optimum position after a 7-hoursearch. The operations at this site were successful. Wedrilled through a thin edge of the MediterraneanEvaporite and penetrated 885 meters into the Burdiga-lian sediments. Both the Plio-Quaternary and the pre-Messinian deposits are deep marine, hemipelagic sedi-ments. The Messinian consists of interbedded gypsumand marls. Drilling at this site dated the initial riftingof the Balearic margin as earliest Miocene or lateOligocene. Paleo-bathymetric analyses of pre-Messin-ian sediments confirmed previous interpretations that adeep basin was in existence prior to the salinity crisis.An offset, Hole 3 72A, was made for heat-flow mea-surements. There high heat-flow values were measured,as we had expected in view of the Neogene age of thebasin.
After a little more than 5 days at Site 372, GlomarChallenger left at noon, 24 April, for the TyrrhenianSea. We reached Site 373 on the morning of 27 April.We planned to drill on the flank of a seamount, wherethe soft Plio-Quaternary sediments would be thickenough to bury the bottom-hole assembly. However, itwas very difficult to determine the precise depth to thesea floor from the PDR because of numerous sideechoes on the record. Our first hole was placed toohigh on the flank of the seamount, since there the drillstring encountered hard rock after penetrating only afew meters of soft sediments. It had to be abondonedtherefore for technical reasons, and an offset was madeto a position further down the flank of the seamount.We achieved our objectives at Hole 373A. After drill-ing through a thin Plio-Quaternary cover, the holepenetrated 187 meters into the basalt basement. Byconfirming that this Tyrrhenian seamount, marked bymagnetic anomalies, is underlain by oceanic tholeiites,we atoned for our failure to sample the buried Balearicseamount at Site 371. Shore-base age-dating yielded alate Miocene age for the oldest Tyrrhenian basaltsample, indicating that a deep basin was in existenceprior to the salinity crisis. High heat-flow values wererecorded at this site which again is in accordance withthe very young age of the basin.
After passing to the Eastern Mediterranean via theMessina Strait, Glomar Challenger arrived, in theafternoon of 1 May at a location above the centralMessinian Abyssal Plain. Precise positioning was notnecessary at Site 374. The drill string penetrated the
base of the datable Pliocene at 373 meters subbottom,where we encountered a dolomite which may representdiagenetically altered sediment of earliest Pliocene age.The latest Messinian sediments are not evaporites, buta series of largely unfossiliferous dolomitic muds andmarls. We encountered gypsum at 406.5 meters sub-bottom topping a unit of cyclically deposited evaporiticsediments.
At 0925 LCT 3 May while drilling through theevaporites at Site 374, we experienced a mysteriousanomaly in the apparent positioning of the vessel. Themonitoring of the weight on drill bit suggested that theship was apparently far off location, but all bridge andcomputer-room equipment showed that excursionscould not have been in excess of 30 meters. Thisanomaly, as we shall discuss later, was also observedwhen we drilled through the evaporite section at Site375. At 1705 LCT 3 May, we pulled up a core whichcontained halite and potash salts confirming the antici-pated "bulFs eye" distribution of Messinian salineminerals below this abyssal plain. Two further attemptsto retrieve salt failed; we suspect that salts moresoluble than halite were being penetrated. Since wehad now penetrated more than 40 meters beneath thestrong gypsum reflector, we had to terminate the holein accordance with constraints set by the JOIDESSafety Panel. Operations were completed after 3 dayson site, and the vessel departed in the morning of 4May for Site 375 west of Cyprus.
Sites 375 and 376 constitute a short traverse acrossthe Cyprus Arc from the Florence Rise to the AntalyaBasin. We had high hopes for Hole 375, where wethought we might have had an outside chance ofreaching an ophiolitic basement. For this very impor-tant objective, we targeted 7 to 10 days and ourplanning was based upon our estimate of the longevityof single drill bits as suggested by the experience ofprevious Leg 40 drilling. The vessel was positionedover the hole at 1705 LCT 7 May. We had hoped thatthe Messinian was absent at this site, but we were soonto experience surprise and anxiety. The first reflectorwas met at 137.5 meters subbottom, and Core 1 wasfound to contain a Pliocene marine ooze on top ofMessinian marls and gypsum. Furthermore, the drilledsection between 137.5 and 170 meters must have beenmainly gypsum (and/or anhydrite). We were con-cerned about wear and tear on the drill bit and alsoanxious for our safety as it ground its way slowlythrough the hard formation.
At 0334 LCT 8 May, the drill string suddenlypenetrated into a very soft horizon, at 172 meterssubbottom. The monitoring of bit weight again sug-gested that the vessel had wandered off location.However, it was ascertained, after a check of allsystems, that there had been no drift whatsoever. Themysterious positioning anomaly was reminiscent of ourexperience at Site 374. Meanwhile the driller may have"overfed" the pipe when the monitor showed thissudden loss of bit weight. The overfeeding caused thedrill pipe to become dented at the mudline, as wefound out later when the drill string was pulled out.

INTRODUCTION AND EXPLANATORY NOTES
Tortonian marls were sampled when Core 4 (cutbetween 245.5-252 m subbottom) was retrieved. Mean-while, we were advised that we should spot-core inorder to save wear on the bearings of the drill bit andthus prolong the life of the bit. Cores were taken atabout 100-meter intervals until 574.5 meters subbot-tom. Since by now we had drilled into stiff marls ofSerravalian age, we had to raise the barrel at shorterand shorter coring intervals. Also all the pre-Messiniancores contained gas. We were permitted to drill aheadas the methane/ethane ratio was 1000 or more. Justafter penetrating a Langhian limestone at 675.5 meterswe were witnesses to an exciting spectacle reminiscentof a "derrick blowout," but we soon realized withrelief that this apparent catastrophe was caused by abroken rotary hose. After a Burdigalian core was cutfrom 817.5 to 821.5 meters subbottom and raised ondeck, it was found that the hole diameter had becomeso small that the bottom-hole assembly was becomingjammed. Reluctantly we had to abandon the hole. Wewere still far from the basement, but had uncovered asection that is practically identical to the coeval landsection on Cyprus. This discovery made us confidentthat we could use the information from the island tointerpret the geology of this part of the Mediterranean.
Glomar Challenger arrived at Site 376 at 1820 LCT10 May. We drilled through the marine Plio-Quater-nary, and found below a thick section of euryhalineMessinian deposits. The drill string hit the gypsumreflector at 134 meters subbottom and went throughsome very hard drilling before a halite core was raisedfrom 207 meters subbottom depth. At 1230 LCT 12May while the salt core was being cut, there was asudden loss of pump pressure. Various possibilities thatmight have caused the loss (such as a defective pump,etc.) were ruled out. Our operations manager wasconvinced that we had drilled into a zone of "lostcirculation," probably a cavernous zone where theMessinian evaporites were partly leached out. We nowrealized that drilling into caverns might also have beenthe cause of the mysterious positioning-anomalies weencountered when penetrating the evaporite sections ofSites 374 and 375. The last core, which also containedhalite, gave off a very strong odor of hydrocarbon. Wedecided to terminate drilling for safety reasons. Heat-flow measurements were made at Site 376, and the lowvalue measured confirm the old age of the basementthere.
We were now faced with a dilemma. Our stay at thesites near Cyprus was cut short because of the drill bitfailure at Site 375 and because of the safety considera-tions at Site 376. An originally targeted site onEratosthenes Seamount could not be drilled becausethe sedimentary cover there was considered too thin tobury the bottom-hole assembly. It was still too early tosail to the Aegean. After considerable discussion, it wasdecided to turn back westward to redrill DSDP Site126 on the Mediterranean Ridge. This was in the hopethat we could now penetrate much deeper than in ourfirst drilling attempt there 5 years ago, bearing in mindthe considerable improvement in drilling equipmentsince that time.
WESTERN
MEDITERRANEAN
0—i
100—
2 0 0 —
3 0 0 -
4 0 0 -
SJ 500—
600—
700-
800—
SOUTHBALEARIC
BASIN
371
MENORCA TYRRHENIAN
RISE BASIN
372 373 A
>-
<zLU
- <3
o
"\\\\_
LU
zLU
uOQ.
LUQ_Q_3
"2"
—
-—• * "
—
_ .
" _ T :
—_.. _
_.. .*
—
~.i-~—
......
MIO.TD = 551m
>-<zLUa3
σPLIO.VΛ/Λ
u.MIO
LU
zLU
MIO
LU_ lQ
1
LU
ZLU
u
MIO
LU
o
-LJ 1
— - 4 1ii 1
SiJ
— j 1 —
J_ J
J
— 1 — -
11311 1
1
><zLU^ _<3
σ
_U .PUQ
LU
zLU
8l α!
L U — '
ZLU
IOC
3
1L
. -L -
L. .
L-J. .
L
i
mm
TD=457 5m
TD=885m
Figure 2. General stratigraphy of the Leg 42A drill sites.

EASTERN
M E D I T E R R A N E A N
INTRODUCTION AND EXPLANATORY NOTES
IONIAN MEDITERRANEAN
BASIN RIDGE CLEFT CRETAN BASIN
374 377 378 378 A
<
UJ
|
σ
7
-Q3
PLÒ
U.M
IO.
E
TD=457m
r ur
AR
Y
ZUJ
' <3
σAT
* /L-MMIQ
__i_.L
— 1 _
L
- r 1
i
L
L1
L_ J _ .
\ &
TD=2ó3m
QU
ATE
RN
AR
YU.
PLI
OC
EN
E
LPLIQΛ I IΛ.'WJ.W
MIO.
"_ _L. a..__L. J_.
L--L .
L_ J _ .
A_ Ji ~iI ~ I
I ~ I •
I ~ I -
i—i-
J~i:
i — i .
QU
AT
ER
NA
RY
U P
LIO
CE
NE
L.PLIO
ΛUΛMIO
L_ J_.
L
L
_ X. J_.
rii_.l - l -
cÉÉ
T-1-I.C
T:
• ~ • l
- 1 -
- 1 -
» l -
-i-- k- 1 '- I -3
l~l-
TD=343 5m TD-343 5m
CoredInterval
Basalt
Volcanic Ash/
Breccia
Clays andClaystones
Muds and
Mud stones
Nannofossil
Oozes/Chalks
Marls/Marlstones
i -4- -£. -x-U- U. -L.
Limestones
Gypsum
Anhydrite
Halite
Dolomitic Muds
and Mudstones
Dolomitic Marls
and Marlstones
Dolom i te/Dolomi ticLimestones
Interbedded
Lithologies
FLORENCE RISE
375 376
p ^L
.PLIO
CE
NE
-
>
QU
ATE
RN
AR
Y
Z
PER
M
IOC
E
α.
NE
U
L.M
IO.
> M
.MIO
CE
I L_ -J- .
L_ _ L -
L. _L _
L. Δ. .
L
" _ X
" L_ _l_ .
ii—i •
i z
'7Ip• l -
iET|
-1 -
i -
f-FF
i-
F
—
_
—
-—
—'
—
—
—
—1 -—-
1 -—1 -—
T÷ΠZ
F !-1-1
1 ~/1 — \r~ 1 ~r1 ~r1
*' n1 •/1'
TD=821 5m
U I
U.
MIO
CE
N
L._!_ .
L. JL.
T÷fI-I1 - 1 -
1 — 1 •
2
TD=21ó 5m
—100
—200
—300
—400
—500
—600
—700
—800
— 900
Figure 2. (Continued).

INTRODUCTION AND EXPLANATORY NOTES
On the morning of 15 May Glomar Challengerreached Site 377 where a cleft cuts across the Mediter-ranean Ridge. In the cleft itself the Quaternary directlyoverlies pre-Messinian sediments. The hole penetratedinto the middle Miocene after 1 day of drilling. How-ever, drilling rate became very slow and we weredrilling into poorly fossiliferous clastic sediments. Wewere forced to abandon the hole to save time fordrilling at the Aegean site.
Site 378 was located in the north Cretan Basin. Thevessel was positioned at 1730 LCT 17 May. Afterdrilling through a marine Plio-Quaternary sequence,Holes 378 and 378A were terminated in Messinianselenitic gypsum. The operations were completed atSite 378 before 7 o'clock, 19 May, so that GlomarChallenger could make her port call at Istanbul atnoon 21 May. We reached Istanbul on schedule.
During the 37 days at sea, Glomar Challengertraveled 3217 nautical miles, drilled 11 holes at 8 sites.In 150 attempts we cored 1192.2 meters and recovered670 meters (or 30 m more than Leg 13 drilling with 54days at sea). Water depth of the holes ranged from1845 to 4090 meters. The maximum penetration was885 meters at Site 372. Total penetration was 4461.5meters of stratigraphic section. (For full details, seeTable 1.)
In retrospect, some of us might have missed theexhilaration and excitement of first discovery as experi-enced during the Leg 13 cruise. The task of this seconddrilling expedition was more somber and certainlymore difficult. Nevertheless, we experienced our shareof joy, anxiety, and sometimes of disappointment. Inall, the scientific accomplishments of the cruise and itstechnical achievements were not inconsiderable. Wedid what could not be done 5 years ago; namely, topenetrate the Mediterranean Evaporite and establish apre-Messinian history for the deep Mediterranean; andto sample oceanic basement in a Mediterranean basin.
RESPONSIBILITIES FOR AUTHORSHIPChapters 2 to 8 (Part I) of this volume present the
basic shipboard data and discussions on the holesdrilled during Leg 42A. The authorship of these sitechapters is collectively that of the shipboard scientificparty with ultimate responsibility lying with the co-chief scientists, Ken Hsü and Lucien Montadert. Eachwas compiled by Robert B. Kidd, the Leg 42A sciencecoordinator and volume editor, to a standard format aslisted below, with the respective authors of each sectionin parentheses
Site Summary DataBackground and Objectives (Montadert and Hsü)Operations (Hsü and Montadert)
Site ApproachDrilling Program
Lithology(Kidd, Meliérès, Garrison, Fabricius, andBernoulli)
Geochemical Measurements (Hsü and Fabricius)Physical Properties (Erickson)Biostratigraphy
Summary (Bizon and Müller)
Nannofossils (Müller)Planktonic Foraminifers (Cita)Planktonic Foraminifers (Bizon)Benthic Foraminifers (Wright)
Sedimentation Rates (Kidd)Correlation of Seismic Reflection Profiles with Drill-
ing Results (Montadert)Summary and Conclusions (Hsü and Montadert)ReferencesHole Summary DiagramCore Summary FormsCore PhotographsThe interpretations of individual authors have been
retained in the section for which they were responsible.Consequently, conflicting interpretations are sometimesapparent between individual sections, or between aparticular section and the summary and conclusions,the latter represent an attempt by the co-chief scientistsat a consensus viewpoint. Authorship of papers dealingwith special topics (Part II) and the Synthesis Chapters(Part III) is cited in the text. It should be pointed outhere that the interpretations expressed in these individ-ual contributions are those of their authors and in somecases to not reflect the views of the co-chief scientistsand the remainder of the shipboard party. Althoughthe shipboard scientists reviewed drafts of all manu-script, our policy was to allow complete "freedom ofspeech" in these parts of the volume. The chapters ofPart IV, on the other hand again represent a consensusof the views of the shipboard party. The reader shouldnote also that downhole heat-flow measurement, al-though a shipboard study, is reported by Erickson inChapter 36 of Part II.
SURVEY AND DRILLING DATA
SurveysThe presite survey data, kindly supplied to the
JOIDES Mediterranean Advisory Panel by the variousorganizations and institutions active in the area and onwhich the site selections were based, is acknowledgedin the relevant site chapters.
A shipboard precision echo-sounder together withseismic profiling equipment, was used to determinespecific site locations. These data are discussed in thesections dealing with site approach. En route betweensites, continuous observations were made of depth,magnetic field intensity, and subbottom structure (seeAppendix IV). Underway depths were recorded on aGifft precision graphic recorder (PGR). The depthswere read on the basis of an assumed 800 fathoms/secsounding velocity. The sea depth (in m) was corrected(1) according to the tables of Matthews (1939) and(2) for the depth of the hull transducer, 6 metersbelow sea level. In addition, any depths referred to thedrilling platform have been calculated under the as-sumption that this level is 10 meters above the waterline.
The seismic profiling system aboard Glomar Chal-lenger consisted of two Bolt airguns, a Scripps-designedhydrophone array, Bolt amplifiers, two bandpass filters

INTRODUCTION AND EXPLANATORY NOTES
TABLE 1Coring Summary
Hole
371372372A373373A37437537637737837 8 A
Total
Dates(1975)
16-18 Apr.19-24 Apr.24-25 Apr.
27-29 Apr.1-4 May7-10 May
10-12 May15-16 May17-18 May18-19 May
Latitude
37°01.88'N40°01.86'N40°01.90'N
39°43.68'N35°50.87'N34°45.74'N34°52.32'N35°09.25'N35°55.67'N35°55.67'N
Longitude
05°14.55'E04°47.79'E04°47.79'E
12°59.56'E18°11.78'E31°45.58'E31°48.45'E21°25.86'E25°06.97'E25°06.97'E
WaterDepth
(m)
279226992695
3517407819002101371818351835
Penetration(m)
551.0885.0154.5
457.5457.0821.5216.5263.0312.0343.5
4461.0
No. ofCores
846
0
12241323
411
9
150
MetersCored
62.0431.0Drilled
114.0153.5
73.0202.5
10.0100.246.0
1192.2
MetersRecovered
43.3315.9
for heat flow
27.577.266.976.4
8.234.820.0
670.2
%Recovery
70.073.3
24.150.391.637.782.034.743.5
56.2
OldestSediment
Upper MioceneLower Miocene
Lower PlioceneUpper MioceneLower MioceneUpper MioceneMiddle MioceneLower PlioceneUpper Miocene
and two EDO recorders, usually recording at twodifferent filter settings.
Drilling Characteristics
The taking of cores in a particular hole may becontinuous, but more often is interspersed by drilled,but uncored, intervals of variable length (spot coring).
Due to circulation of water down the hole, drillcuttings are flushed out of the hole onto the sea bed(an "open system") and cannot be examined.
The only information available about sedimentarymaterial between cores, other than from seismic data,is from an examination of the behavior of the drillstring as observed on the drill platform. The harder thelayer being drilled, the slower and more difficult it is topenetrate. The most prominent of such layers areknown as "drill breaks." There are, however, a num-ber of other factors which determine the rate ofpenetration, so it is not possible to relate this directly tothe hardness of the layers. The following parametersare recorded on the drilling recorder, and all influencethe rate of penetration.
1) Weight on the bit. This can vary in three stepsfrom zero, when the bit is suspended above the bottomof the hole to 40,000 pounds when two of the threebumper subs are collapsed and the whole bottomassembly bears on the bit. The aim of the driller, is, byreference to the weight indicator, to maintain constantbit weight by lowering the drill string when necessary.However, this is extremely difficult to do in conditionsof swell, when the heave of the drill platform mayexceed the avalable extention (6 ft) of the bumpersubs.
2) Revolutions per minute. The revolutions perminute (rpm) a r e related to the torque applied to thetop of the drill string, and a direct analysis of the twoshould give the resistance to drilling. However, the rpmrecord is not detailed enough to do this. Nevertheless,visual observations of the rate of drill string rotationare useful in assessing bit behavior. In particular, it canbe seen that when the drill bit becomes jammed invery resistant rock; rotation stops, the bit becomes freeand the drill string untwists.
Drilling Disturbance
Most cores, when split and examined aboardGlomar Challenger, show signs of having been dis-turbed to a greater or lesser extent by the drillingprocess. Such signs are the concave downward appear-ance of many originally horizontal bedding planes, thehaphazard mixing of lumps of sediment having differ-ing lithologies, and the near fluid state of some sedi-ments.
Coring disturbance is particularly noticeable in theupper 100 meters or so of soft, unlithified sediments.At the other extreme, well-consolidated sedimentaryand igneous rocks can also be reduced to rubble by thecoring process. Variations in lithology are not the onlyfactors determining the amount of coring disturbance.Differences in the type of drilling bit used and drillingtechniques employed are also important. Clearly toosome sediment disturbance, and even some fracturingdisplayed by the cores, may be original predrillingfeatures. Appendix I (Kidd, this volume) is devoted tothe illustration and discussion of some types of distur-bance encountered on Leg 42A.
Artificial Stratigraphic Contacts
When the drilling schedule called for spot coring, itwas common practice on Leg 42A to leave the corebarrel in the drill string while "washing ahead."Ideally the circulating fluids should remove all thematerials from the uncored interval. However, it oftenhappened that some sediments from the uncored inter-val managed to get inside the core barrel. Conse-quently, an artificial contact between sediment from anuncored horizon and that from a cored interval wasfound, especially after a long period of "washingahead." Under these circumstances the depth of theartificial contact was usually not taken as the truecontact depth. Instead we tried to determine contacts inan uncored interval with the help of the driller's recordof drilling characteristics together with careful exami-nation of drilling artifacts such as downhole contami-nants (debris slumped downhole), rocks dropped fromthe barrel of the previous core, etc.

INTRODUCTION AND EXPLANATORY NOTES
SHIPBOARD SCIENTIFIC PROCEDURES
Numbering of Sites, Holes, Cores, SamplesDrill site numbers run consecutively from the first
site drilled by the Glomar Challenger in 1968, thuseach site number is unique. A site refers to the hole, orholes, drilled while using one acoustic positioningbeacon. Several holes may be drilled at a single localityby pulling the drill string above the sea floor ("mudline") and offsetting the ship some distance (usually100 m or more) from the previous hole. This some-times becomes necessary (as at Hole 373A) wherethere is insufficient soft sediment at the first location to"spud in" or bury the bottom-hole assembly (BHA).
The first (or only) hole drilled at a site takes the sitenumber. Additional holes at the same site are furtherdistinguished by a letter suffix. The first hole has onlythe site number; the second has the site number withsuffix "A"; the third has the site number with suffix"B" ; and so forth. It is important for samplingpurposes to distinguish the holes drilled at a site, sincerecovered sediments or rocks usually do not come fromequivalent positions in the stratigraphic column atdifferent holes.
Cores are numbered sequentially from the topdown. In the ideal case, they consist of 9 meters ofsediment or rock in a 6.6-cm-diameter plastic liner. Inaddition, a short sample is obtained from the corecatcher (a multifingered device at the bottom of thecore barrel which prevents cored materials from slidingout during core-barrel recovery). This usually amountsto about 20 cm of sediment and is stored separately.This sample, from each core, represents the loweststratum recovered in the particular cored interval. Thecore-catcher sample is designated by CC (e.g., 378A-4,CC, is the core-catcher sample of the fourth core takenin the second hole drilled at Site 3780).
The cored interval is the interval in meters belowthe sea floor measured from the point at which coringfor a particular core was started to the point at which itwas terminated. This interval is generally 9.5 meters(nominal length of a core barrel) but may be shorter ifconditions dictate. Cores and cored intervals need notbe contiguous. In soft sediment, the drill string can be"washed ahead" without recovering core by applyingsufficiently high pump pressure to wash sediment outof the way of the bit. In a similar manner, a center bit,which fills the opening in the bit face, can replace thecore barrel if drilling ahead without coring is necessary.
When a core is brought aboard Glomar Challenger ,it is labeled and the plastic liner and core cut into 1.5-meter sections. A full, 9-meter core would thus consistof six sections, numbered from the top down, 1 to 6.(The discrepancy between the 9-meter core and 9.5-meter core interval is discussed below.) Generally,somewhat less than 9 meters is recovered. In this case,the sections are still numbered starting with one at thetop, but the number of sections is the number of 1.5-meter intervals needed to accommodate the length ofcore recovered; this is illustrated in Figure 3.
CORE CATCHER
SECTION 3 SECTION 2 SECTION 1
VOID
SEDIMENT RECOVERED IN LINER
Figure 3. Numbering of core sections with incompleterecovery.
Thus, as shown, recovery of 3.6 meters of sedimentwould result in a core with three sections, with a voidof 0.9 meter at the top of the first section. By conven-tion, and for convenience in routine data handling atthe Deep Sea Drilling Project, if a core contains alength of material less than the length of the coredinterval, the sections that recovered material are placedin the top of the cored interval, with the top of Section1 (not always the top of the sediment) located at thetop of the cored interval. This is shown in in Figure 4for the core in the above example. Thus, the depthbelow the sea floor of the top of the sediment of thishypothetical core would lie at 150.9 meters (not 150.0m) and the bottom at 154.5 meters (the core-catchersample is regarded as being dimensionless).
It was noted above that a discrepancy exists be-tween the usual coring interval of 9.5 meters and the 9meter length of core recovered. The core liners usedare actually 9.28 meters in length, and the core catcheraccounts for another 0.2 meters. In cases where thecore liner is recovered full to the top, the core is stillcut into 1.5 meter sections, measured from the bottomof the liner, and the extra 0.28 meter section at the topis designated Section 0, or the "zero section." The zerosection is ignored in calculations of depth below thesea floor of cores or levels within cores.
Samples taken from core sections are designated bythe interval in centimeters from the top of the coresection from which the sample was extracted; thesample size, in cc (cm3), is also given. Thus, a fullsample designation would consist of the followinginformation:
Leg (Optional)Site(Hole, if other than first hole)Core NumberSection NumberInterval in centimeters from top of sectionSite 378A-1-2,122-124 cm (10-cc) designates a 10-
cc sample taken from Section 2 of Core 1 from thesecond hole drilled at Site 378. The depth below thesea floor for this sample would then be the depth tothe top of the cored interval (46 m in the exampleabove) plus 3 meters for Sections 1 and 2, plus 122 cm(depth below the top of Section 3), or 50.2 meters.(Note, however, that subsequent sample requestsshould refer to a specific interval within a core section[in cm] rather than level [m] below sea floor).
10

INTRODUCTION AND EXPLANATORY NOTES
150 m
oo
159.5 m
CDCO
oLU
C/O
LU
o
LU
150.9 m
154.5 m
Figure 4. Position of incomplete sediment recovery withinthe cored interval.
Handling of Cores
The first analysis of the material recovered by anindividual core is the core catcher. Rapid paleontologi-cal and lithological analysis of this material from thebase of the cored interval is carried out in order tomake decisions as to whether to drill ahead or to takeanother core.
After a core is brought up to the drill platform, it iscut, sealed, and labeled before beginning its routineprogress through the shipboard analytical procedure.Often samples for organic geochemistry are taken atthis stage.
In the core laboratory on Glomar Challenger , afterphysical property measurements requiring unsplit coresare made (such as thermal conductivity and density-porosity measurements using gamma ray attenuationtechniques) the 1.5-meter sections of sediment core andliner are split lengthwise. One-half is designated the"archive" half, which is described by the shipboardsedimentologists and photographed; and the other isthe "working" half, which is sampled by both theshipboard sedimentologists and paleontologists forfurther shipboard and shore-based analysis. Almost allzero sections recovered on Leg 42A were split anddescribed.
Well-consolidated basalts and evaporite rocks werealso split in half lengthwise, and great care was takento maintain relative superposition of the sequences.Each piece of rock was numbered separately andarrows were drawn showing the uphole orientation onboth sides prior to splitting. Furthermore, after descrip-tion, photography, and sampling, each half-section wastightly encased in plastic tubing to avoid confusion dueto subsequent handling.
Sampling
In the core laboratory samples for routine shore-based analysis such as grain size, X-ray minerologyand total carbonate content were taken from theworking half, labeled, and sealed. Because of the highlevel of pre-cruise interest in Leg 42A, samples weretaken at this stage for numerous shore-based workers,whose contributions can be read in Part II of thisvolume. In addition, samples were regularly taken forimmediate shipboard analysis, such as total carbonateby the "carbonate bomb" method. Routine sampleswere taken for smear slide, carbonate, grain size, andX-ray analysis. The location of these samples is shownon the core forms in a column using appropriatesymbols (see Sample Core Form, Figure 5). Theworking half was then sent to the paleontology labora-tory, where samples for both shipboard and shore-based studies of nannofossils, foraminifers, Radiolaria,diatoms, silicoflagellates, and other fossil groups weretaken.
Material obtained from core catchers, and not usedup in the initial examination, was retained (in freezerboxes) for subsequent work. Sometimes pebbles partic-ularly important to the interpretation of the site wereextracted from the core and stored separately in la-beled containers as a measure against loss. On occa-
11

INTRODUCTION AND EXPLANATORY NOTES
sions where the liners contained only sediment-ladenwater, the water was usually collected in a bucket,allowed to settle, and the residue was stored in freezerboxes. All samples are deposited in cold storage at theDSDP East Coast Repository at Lamont-Doherty Geo-logical Observatory and are available to investigators.
LITHOLOGIC STUDIESThe archive half of the split section is used only for
descriptive purposes. The cut surface of each is scrapedto emphasize the sedimentary features and the color,texture, structure, and composition of the varyingEthologies. Each section is described individually on aVisual Description Form. Smear slides are made andare examined using the shipboard petrographic micro-scopes. These, in conjunction with the "carbonatebomb" results, provide the basic shipboard informa-tion on lithology. The archive half is then photo-graphed.
Core FormsThe basic descriptive data, both lithologic and
biostratigraphic, for each section of a particular coreare combined to produce the Core Summary Forms,which accompany each site chapter. These are firstcompiled aboard ship, but are upgraded later usingpostcruise shore-based data. A sample core form isillustrated in Figure 5. Most data are symbolized, but ashort description is provided giving the essential litho-logic information in the following order: Sediment orrock name, Sediment disturbance, Color name andMunsell or GSA number, Sedimentary structures andother special features, Composition from smear slidesand bulk X-ray analysis, Grain size and carbonatedata. Many cores contain important minor lithologiesas well as a basic lithology. The description of themajor lithology is so indicated in most cases; however,descriptive information for minor lithologies is in-cluded wherever possible.
As noted previously, the rotary drill-coring tech-nique quite often results in disturbance of the coredsediments (see Appendix I). This is especially true ofthe softer unconsolidated sediments. A qualitativeestimate of the degree of deformation is given as asymbol on the core logs (see Sample Core Form,Figure 5).
Color names and numbers are derived by referenceto the GSA Rock Color Chart (Goddard et al., 1963).The reader is advised that colors recorded in corebarrel summaries were determined during shipboardexamination immediately after splitting core sections.Experience with carbonate sediments shows that manyof the colors will fade or disappear with time, afteropening and storage. Colors particularly susceptible torapid fading are purple, light and medium tints ofblue, light bluish-gray, dark greenish-black, light tintsof green, and pale tints of orange. These colors changeto white or yellowish-white or pale tan.
Smear Slide AnalysisSmear slides are prepared from minute amounts (1
or 2 mm3) of sediment taken with a spatula, puddled
and smeared with distilled water on a glass slide,dried, and set under a cover-slip with Caedex. Theirexamination by petrographic microscope provides arapid means of mineral identification. They are thebasic source of lithologic information used onboardship, although thin sections are used in studies ofbasalts and other hard rocks.
Smear slide estimates of mineral abundances arebased on the percentage of the area of the smear slidecovered by each component. Past experience hasshown that accuracy may approach a percent or so forvery distinctive minor constituents, but that for majorconstituents, accuracy of ±10% is considered very good.The accuracy of this technique aboard ship is muchenhanced when employed, as on Leg 42A, in conjunc-tion with numerous carbonate bomb measurements(see below).
Of more importance than absolute accuracy to thesedimentologist are relative changes in componentabundance. Consequently, although absolute percent-ages are used in the JOIDES classification scheme,only relative abundances are reported in the composi-tion section of the Leg 42A core forms, thus: D =Dominant, estimated as 75% to 100% of the totalsediment; A = Abundant, estimated as 25% to 75% ofthe total sediment; C = Common, estimated as 5% to25% of the total sediment; R = Rare, estimated as 1%to 5% of the total sediment; T = Trace, estimated asless than 1% of the total sediment.
Frequently sediment components from the samesample fall in the same abundance categories. On thecore forms the listings of components from smear slidesreflect in descending order of estimated abundance.
"Carbonate Bomb" Data (B)During Leg 42A, extensive use was made of the
"carbonate bomb" device (Muller and Gastner, 1971)as an aid in sediment classification. All total carbonatepercentages measured by this method are recorded onthe core summary forms, as are levels of sampling (B).Accuracy to within ±5% total carbonate has beenquoted for the device. However, postcruise shore-basedstudies suggest that it may be somewhat less accuratethan this, particularly for high carbonate sediments orfor complex mixtures of sedimentary componentswhere carbonate is low (see below). Also the "bomb"device is probably considerably less accurate wheredolomitic sediments are encountered.
At the Technische Universitat, Munich, shore base,80 shipboard "bomb" measurements were checked bythe LECO method using splits of the same suite ofsamples (from Sites 375 and 376). A systematic differ-ence was observed between the results of the twotechniques: (1) When CO2 pressure readings on thecarbonate bomb were in the range 0.40 to 0.65, bothmethods did give comparable values with a maximumdifference of ±5% CaCO3 (weight). (2) With CO2pressure readings on the "bomb" in the range 0 to 40,the LECO values were always higher, by 7% to 12%CaCO3 (weight) in the lower half of the range and by1% to 7% (weight) in the upper part. (3) With CO2pressure readings on the "bomb" above 0.65 the
12

INTRODUCTION AND EXPLANATORY NOTES
SITE HOLE CORE CORED INTERVAL
ZONESFOSSIL
CHARACTER
PLANKTFORAMS LITHOLOGY LITHOLOGIC DESCRIPTION
c _ ? _
0.5—
1.0—
siltylamina
1 sandy bed
sandylamina
7 / / / / λproven
sapropel layer>1 cm thick Λ
^2% organic csrbon/
CORE
CATCHER
Color and specialremarks
10YR 5/3
10YR 3/2
- Pteropods
- Sandy pockets
Normal graded bed
Length of verticalarrow denotesthickness ofgraded unit.
-?- Reversely graded bed
ZoophycosBurrow
GENERAL DESCRIPTIONGeneral lithology, color variation,deformation, intercalated lith-ologies, etc.
MAJOR LITHOLOGY
Name and representative smear slide(s)SS 2-60 = smear slide Section 2 at 60 cm.Composition:D = Dominant - estimated as 75-100%A = Abundant - estimated as 25-75%C = Common - estimated as 5-25%R = Rare - estimated as 1-5%T = Trace - estimated as less than 1%
Representative textural analysis andlocation (grain size: 4-30).Representative bulk X-ray mineralogicalanalysis and location (X-ray: 5-26).
Representative DSDP/LECO carbonateanalysis and location LECO: 5-28).
MINOR LITHOLOGIES
Detailed as above.
BOMB
Location and percentages CaCθ3of all carbonate bomb measurementsmade aboard ship.
Information on Zero Section whereapplicable.
Figure 5. Sample core form.
13
INTRODUCTION AND EXPLANATORY NOTES
LECO values are always lower, by 1% to 13% CaCO3(weight).
The LECO method (combustion by inductive heat-ing in an O2 atmosphere) is considered more reliablethan the "carbonate bomb" method. It is thought, bythe Leg 42A sedimentologists, that the systematicdifferences noted above probably could be reduced bythe use of standardized sets of natural marine sedi-ments of known CaCO3 content in the periodic calibra-tion of the "bomb" device rather than syntheticCaCO3 as at present. The latter does not appear toyield a reliable calibration curve.
A scan of the CaCO3 values recorded on the coresummary forms for both shipboard "carbonate bomb"and DSDP shore-based LECO measurements reflectsthe conclusions arrived at above. However, it is impor-tant to note that the "carbonate bomb" device isemployed aboard Glomar Challenger primarily as anaid in the accurate naming of sediments in conjunctionwith the smear slide observations and that within thebounds of the JOIDES sediment classification, thediscrepancies noted would not change the names givento sediments onboard ship.
Appendix II lists all carbonate bomb data for theLeg 42A drill sites together with the results of DSDPshore based LECO measurements. Plots of both,against depth in the hole, accompany the hole sum-mary diagrams.
Sediment ClassificationThe sediment classification used on Leg 42A was
devised by the JOIDES Panel on Sedimentary Petrol-ogy and Physical Properties, and adopted for use bythe JOIDES Planning Committee in March 1974. It isreproduced in part below.
As allowed by the basic premises of the classifica-tion, the Leg 42A sedimentologists often adoptedadditional descriptive terms and symbols to take ac-count of the greater complexity of the Mediterraneansediments in relation to those of open ocean basins.
The only modification found necessary to theJOIDES classification itself was to the "TransitionalBiogenic Calcareous Sediments" category; that is, themarls and marlstones (>30% CaCO3 and >30% slit andclay). The existing single symbol/category was splitinto five, taking into account dolomite content, andnow includes: marls, marlstones, dolomitic marls, dolo-mitic marlstones, and dolomitic muds and mudstones.
Lithologic Classification Scheme
The following define compositional class boundaries and use ofqualifiers in the lithologic classification scheme:
1).Compositional Class Boundariesa) CaCO3 content (determined by carbonate bomb): 30 and
60%. With a 5% precision and given the natural frequencydistribution of CaCO3 contents in oceanic sediments, theseboundaries can be reasonably ascertained.
b) Biogenic Opal Abundance (expressed as percent siliceousskeletal remains in smear slides): 10, 30, and 50%. Smearslide estimates of identifiable siliceous skeletal materialgenerally imply a significantly higher total opal abun-dance. The boundaries have been set to take this intoaccount.
c) Abundance of Authigenic Components (zeolites, Fe, andMn micronodules etc.), fish bones, and other indicators ofvery slow sedimentation (estimated in smear slides);semiquantitative boundary: common 10%. These compo-nents are quite conspicuous and a semiquantitative esti-mate is adequate. Even a minor influx of calcareous,siliceous, or terrigenous material will, because of the largedifference in sedimentation rate, dilute them to insignifi-cance.
d) Abundance of Terrigenous Detrital Material (estimatedfrom smear slides): 30%.
e) Qualifiers: Numerous qualifiers are suggested; the optionsshould be used freely. However, components of less than5% (in smear slide) should not be used as a qualifierexcept in special cases. The most important componentsshould be the last qualifier. No more than two qualifiersshould be used.
Description of Sediment Types
1) Pelagic Clay—Principally authigenic pelagic deposits that accu-mulate at very slow rates. The class is often termed brown clay, orred clay, but since these terms are confusing, they are not recommen-ded.
a) Boundary with terrigenous sediments: Where authigeniccomponents (Fe/Mn micronodules, zeolites), fish debris,etc. become common in smear slides. NOTE: Because oflarge discrepancy in accumulation rates, transitional de-posits may be exceptional.
b) Boundary with siliceous sediments: 30% identifiable sili-ceous remains.
c) Boundary with calcareous biogenous sediments: Gener-ally the sequence is one passing from pelagic clay throughsiliceous ooze to calcareous ooze, with one importantexception: at the base of many oceanic sections, black,brown or red clays occur directly on basalt, overlain by orgrading up into calcareous sediments. Most of the basalclayey sediments are rich in iron, magnanesse and metallictrace elements. For proper identification they require moreelaborate geochemical work than is available on board.These sediments are placed in the "Special Rock" cate-gory, but care should be taken to distinguish them fromordinary pelagic clays.
2) Pelagic Siliceous Biogenic Sediments—These are distinguishedfrom the previous category because they have more than 30%identifiable siliceous microfossils. They are distinguished from thefollowing category by a CaCO3 content of less than 30%. There aretwo classes: Pelagic biogenic siliceous sediments (containing less than30% silt and clay); and transitional biogenic siliceous sediments(containing more than 30% silt and clay and more than 10%diatoms).
a) Pelagic biogenic siliceous sediments:soft: Siliceous ooze (radiolarian ooze, diatomaceous ooze,
depending on dominant component).hard: radiolarite porcellanite
diatomite chert(i) Qualifiers:
Radiolaria dominant: radiolarian ooze or radio-larite.Diatoms dominant: diatom ooze or diatomite.Where uncertain: siliceous (biogenic) ooze, or chert
(i) Qualifiers - In this group numerous qualifiers arepossible usually based on minor constituent, forexample: glauconitic, pyritic, feldspathic.In the sand and sandstone category, conventionaldivisions such as arkose, graywacke, etc. are ofcourse, acceptable, providing the scheme is prop-erly identified. Clays, muds, silts, and sands con-taining 10-30% CaCO3 shall be called calcareous.
b) Volcanogenic Sediments Pyroclastic rocks are describedaccording to the textural and compositional scheme ofWentworth and Williams (1932). The textural groups are:Volcanic breccia >32 mmVolcanic lapilli <32 mmVolcanic ash (tuff, if indurated) <4 mm
14

INTRODUCTION AND EXPLANATORY NOTES
Compositionally, these pyroclastic rocks are described asvitric (glass), crystal or lithic.
c) Clastic sediments of volcanic provenance are described inthe same fashion as the terrigenous sediments, noting thedominant composition of the volcanic grains where possi-ble.
5) Special Rock Types—The definition and nomenclature ofsediment and rock types not included in the system described aboveare left to the discretion of shipboard scientists with the recommen-dation that they adhere as closely as is practical to conventionalterminology. Sources from which additional descriptive terminologywas derived by Leg 42A geologists are referenced in the text. In thiscategory fall such rocks as:
Intrusive and extrusive igneous rocksEvaporites; halite, anhydrite, gypsum (as a rock), etc.Shallow water limestone (biostromal, biohermal,coquina, oolite, etc.)DolomiteGravels, congolomerates, brecciasMetalliferous brown claysConcretions, barite, iron-manganese, phosphorite, pyrite,etc.Coal, asphalt, sapropels (see below), and many others.
Two terms used in Part I of this volume warrantspecial mention:
SapropelsLayers rich in organic carbon set in marine sediment
sequences were first described from Mediterraneanpiston cores by Kullenberg (1952) and were referredto as "sapropelitic layers" by Olausson (1960-1961).Over subsequent years such layers have become knownsimply as "sapropels." On Leg 42A it was recognizedthat large variations in organic carbon content werelikely between layers and some distinction was neces-sary between true sapropels and less organic-richsapropelic layers, as an aid to environmental interpre-tation (see Chapter 13). Furthermore, this specialterminology should refer only to discrete layers (atleast 1 cm thick) containing greater than 0.5% organiccarbon content, within normal open marine pelagicsediment sequences. Thus diatomaceous organic-richsediments within evaporitic sequences and thick sedi-mentary successions rich in organic carbon throughoutdo not qualify.
Consequently, dark layers encountered within nor-mal pelagic sediments were subsequently given thefollowing terminology, using the results of shore-basedorganic carbon measurements made at the DSDP LaJolla, Technische Universitat, Munich, and I.F.P., Parisshore-base laboratories: -
Greater than 2.0% organic carbon = sapropel0.5% to 2.0% organic carbon = sapropelic layerLess than 0.5% organic carbon = normal marine
sediment (classified by the JOIDES scheme).
StromatoliteStromatolite is used throughout Part I of this volume
to denote a sedimentary structure, a form of laminationwhich is frequently developed in anhydrite evaporiticrocks ("stromatolites"). They closely resemble certainmodern and ancient laminated algal sediments (Garri-son et al., this volume). However, identification ofalgal filaments is necessary to positively define environ-ments. The structure was used only loosely as an
environmental indicator aboard ship and shore-basestudies were conducted to confirm the existence ofalgal filaments (Awramik, this volume).
Lithologic SymbolsFigure 6 displays the set of lithological symbols
which accompany the JOIDES classification, includingthe modifications employed during Leg 42A. Thesesymbols are used on the core summary forms and forillustrations throughout Part I of this volume.
Hole Summary DiagramsFor each hole a summary diagram is drawn and
accompanies each site chapter. This is primarily acompilation of the lithologic and biostratigraphic datadisplayed on the core forms. Again these are initiallydrawn aboard ship and are later modified to takeaccount of shore-base data. Downhole plots of carbon-ate content and X-ray mineralogical data, accompanyeach diagram.
Lithostratigraphic TerminologyMany different lithologies were encountered on Leg
42A. With the exception of our general use of the term"Mediterranean Evaporite Formation," no formal rockstratigraphic units are employed in the site chapters.The sediments are informally divided into units andsubunits. For each site, these unit designations areoutlined in a table in the lithology section and also inthe appropriate hole summary diagram. Boundariesbetween specific units and subunits in cored intervalswere both sharp and gradational. If a boundary occur-red between cores, it was placed in the middle of thedrilled interval, unless biostratigraphic evidencedeemed otherwise.
ROUTINE SHORE-BASED ANALYSESIn a number of cases sediment names have been
modified from those given aboard ship to take intoaccount the shore-based data.
Carbon-Carbonate AnalysesShore-based carbon-carbonate analysis, was with a
LECO acid-base semiautomatic carbon determinator.Step-by-step procedures used at the DSDP La JollaLaboratory are reported in Bader et al. (1970), and adiscussion of the method, its calibration, and its preci-sion can be found in Boyce and Bode (1972).
Total carbon and organic carbon (carbon remainingafter treatment with hydrochloric acid) are determinedin terms of weight percent, and the theoretical percent-age of calcium carbonate is calculated from the follow-ing relationship:
Percent calcium carbonate (CaCO3) = (% totalC - %C after acidification) × 8.33.
However, carbonate sediments may also includemagnesium, iron, or other carbonates; this mayresult in "calcium" carbonate values greater thanthe actual content of calcium carbonate. In DSDP

INTRODUCTION AND EXPLANATORY NOTES
Pelagic
Non-biogenic
Pelagic Clay
Siliceous Biogenic
Pelagic Siliceous Biogenic - Soft
Diatom Ooze Radiolarian OozeDiatom-Rad orSiliceous Ooze
Pelagic Siliceous Biogenic - Hard
Diatomite Radiolariate Porcellariite Chert
Δ Δ Δ Δ ΔΔ Δ Δ Δ
Δ Δ Δ Δ ΔΔ Δ Δ Δ Δ
Δ Δ Δ Δ ΔΔ Δ Δ Δ
Λ _ A A A, A A A A
a. A A A AA A A A
A A A A
SB7
Transitional Biogenic Siliceous Sediments
Siliceous Component <50% Siliceous Component
Siliceous ModifierSymbol and According toHard or Soft.
Calcareous Biogenic
Pelagic Biogenic Calcareous - Soft
Nannofossil Ooze Foraminifer OozeNanno-Foram orForam-Nanno Ooze Calcareous Ooze
o c=> «=> 0 0
OODODDO
Pelagic Biogenic Calcareous - Firm
Nannofossil Chalk Foraminifer ChalkNanno-Foram orForam Nanno Chalk Calcareous Chalk
1
1
1
i
1
1
1 '1
1
1
1
- 1
—
1—
1
1 '
1
1 1
1
1
, '
1 ,
1
CB5 CB6
i ! i ! i ! iTTI I I I
T!i! i ! i ;' i ' i ri : i : ii; i; i; ITJ: i : i : i : i :
CB7
Pelagic Biogenic Calcareous - Hard
Limestone
CB91
1
1
1 - * -
1" 1 —
L_
i
1
Transitional Biogenic Calcareous Sediments
(Nannofossil) Marls and Marlstones
Dolomitic Marls Dolomitic Marlstones
-1-1
-1-1
1 — 1— 1 —1 — 1
— 1 _1 — 1
— 1 —1 — I
— 1 _
1
11
1mmm
11
1 -1 T.
1 "1 r
Terrigenous Sediments Qualifiers Letter Overprint (as per examples)^-^-- Zeolite Al Glauconite A3 Siderite A4 (other may be designated)
Clay/Claystone Mud/Mudstone Shale (Fissile) Sandy mud/Sandy mudstone Silt/Siltstone Sand/Sandstone
Silty Sand/Sandy Silt
Pyroclastic
Volcanic Ash Volcanic Lapilli Volcanic Breccia
T7
T5
Evaporites
Halite Anhydrite Gypsum
Concretions
Drawn Circle with Symbol (others may be designated)
Special Rock Types (Mn)= Manganese
Barite ?)= Pyr Zeolite
Gravel Conglomerate BrecciaBasicIgneous
AcidIgneous Coals Dolomite
SR7
Figure 6. Graphic symbols to accompany the lithologic classification scheme used on Leg 42A.
16

INTRODUCTION AND EXPLANATORY NOTES
determinations, all carbonate is assumed to becalcium carbonate.Precision of the determination is as follows:
Total carbonate (within 1.2 to 12%) = ±0.3% absoluteTotal carbon (within 0 to 1.2%) ±0.06% absoluteOrganic carbon - ±0.06% absoluteCalcium carbonate(within 10% to 100%) = ±3% absolute(within 0 to 10%) = ±1% absolute
Appendix II lists these data for Leg 42A, to-gether with the results of carbonate bomb measure-ments, and all levels of sampling are displayed onthe core forms with representative samples quoted.Plots accompany the hole summary diagrams.
Grain Size AnalysesThe DSDP shore-based grain size analyses, pre-
sented on the core summary forms and in Appendix V,were derived by standard sieve and and pipette tech-niques, as described in detail in Bader et al. (1970),with modified settling times as in Boyce (1972).
Bulk X-ray Mineralogical AnalysesBulk X-ray mineralogical analyses were made at the
University of Paris shorebase (see Appendix III).Procedures are outlined in more detail in Mélières et al.(this volume). Quantitative measurements were madewith an internal standard (Na F) on material dried at40 °C, without further processing such as washing indistilled water. The data are computed in percent ofthe crystalline fraction. Precision is considered to be±10%. Trace amounts refer to percentages of less than0.5%. "Opal" percentages refer to opal CT in the senseof Jones and Segnit (1971), meaning a disorderedmixture of cristobalite and tridymite. "Calcite" in-cludes Mg-calcite where it occurs, while "dolomite"similarly includes Ca-dolomite. "Smectite" percentagesare derived from the area of the expanded peak at 17Åunder glycol. Because these analyses are of bulk miner-alogy, pyrite which appears to be frequently present inthe fine fraction on smear slides is rarely reported inlistings on the core summary forms.
GEOCHEMICAL MEASUREMENTSShipboard geochemical measurements were routi-
nely made during Leg 42A. The standard DSDPprocedures for interstitial water and allied studies wereemployed. These are adequately described in Water-man (1970) and in Whitmarsh, Weser, Ross, et al.(1974).
PHYSICAL PROPERTIES.Physical property measurements of bulk wet density,
porosity, permeability, water content, compressionalvelocity, and shear strength were made during Leg42A. The measurement techniques and sampling con-siderations have been carefully described (Boyce,1973) and will only be outlined briefly in the followingdiscussion. Further discussions of the routine physicalproperty measurements, centering principally on cer-
tain problems with the techniques and their effects onthe quality of the data, can be found in a paper byBennett and Keller (1973). Anyone intending to drawgeologically relevant conclusions based on the physicalproperty data presented in this volume is urged to readboth papers. At drill sites where downhole temperaturedata were obtained, thermal conductivity measure-ments were made in order to permit calculation of therate of heat flow through the sea floor. Methods ofdownhole temperature measurement are described inErickson (this volume).
Sonic Velocity DataMeasurements of compressional wave velocities in
sediments were made using the Hamilton frame appa-ratus (see Appendix VI, Table 1). All measurementswere made at room temperature and pressure after thecores had reached thermal equilibrium with the labora-tory, and soon after they were opened. Most of thedata are obtained by measuring the length of timerequired for sound to traverse a path through thesediment and plastic core liner between a 400 kHzacoustic transducer and receiver. This method assumesgood acoustic contact between the liner and the sedi-ment, a conditions which may not be fulfilled if thesediment does not completely fill the core liner. Correc-tions must be made to account for the thickness of theliner and the length of time required for the sound topass through the liner. The corrections routinely ap-plied presuppose liners of constant sound velocity andthickness. The second parameter, thickness, is knownto vary widely from shipment to shipment and evenwithin a given section of liner. Thus measurements ofsound velocity of material in a split liner are subject toerrors not present when measurements are made di-rectly on material consolidated enough to be shapedand put between the transducers.
Where consolidation was sufficient, the ends andsides of chunks of unsplit core were cut or shaped intoflat, parallel faces with normals parallel and perpendic-ular to the long axis of the core, taking care tominimize disturbance to the sample. The velocity wasdetermiined directly on these chunks in both directions,and the horizontal and vertical velocities could then becompared in order to detect the presence of seismicanisotropy. (See Appendix VI, Table 2).
On Leg 42A, a substantial difference was found toexist between horizontal velocities (parallel to bed-ding) routinely measured through the liner in splitcores, and the vertical velocities required to computethe thickness of sedimentary layers from travel timedata. Thus it is clear that neglect of acoustic anisotropycan seriously affect realistic interpretation of seismicdata from drilling results.
Gravimetric DataBulk property measurements were made on sedi-
ment samples obtained from the central, presumablyundisturbed portion of the sediment cores using small(<l cc) syringe-type samplers and larger ( 20 cc)
17

INTRODUCTION AND EXPLANATORY NOTES
stainless steel cylinders of known volume. The sedi-ment samples were weighed wet and again after dryingat 110°C for 24 hours and computations of bulk wetdensity, porosity, and water content were made (Ap-pendix VI, Tables 3 to 5).
The extremely small volume of the syringe samplecan result in substantial errors in measuring bothweight and volume differences, and the small diameterof the syringe makes representative sampling of coarse-grained, highly porous and/or well-compacted sedi-ments almost impossible. Comparison of the wet bulkdensity data taken with the two techniques indicatesthat the variability of the syringe data is much higherthan that of data obtained using the cylinder-samplingtechnique. Further comparison of the syringe data withdensities measured using the larger volume cylindersamples, as well as with densities determined bygamma ray attenuation methods, suggests that thesyringe density data may be systematically low. Thestandard deviation of the syringe data is approximatelytwice as large as the standard deviations of the densityvalues obtained using the other two measurementmethods. Thus bulk-properties determined using sy-ringe sampling techniques cannot be used to define anyother than the most dramatic changes in sedimentphysical properties.
The larger volume of the samples obtained using thestainless steel cylinders permits a significant reductionin the errors in the volume and weight measurements.The sampling procedure was to push the sharpenedend of a thin-walled cylinder of known weight andvolume into the sediment until its lower end madecontact with the curved wall of the core liner and itsupper end was slightly buried beneath the surface ofthe freshly split core. Pliers were then used to gentlyrock the cylinder back and forth in order to breaksuction between the bottom of the sediment sampleand the inside of the core liner. The cylinder waswithdrawn with the sediment protruding from bothends and the sediment was carefully shaved and cutback until it was flush with the end of the cylinder.This ensured that the volume of sediment was thesame as the previously measured internal volume ofthe cylinder. The sediment-filled cylinder was thenweighed and dried for at least 24 hr at 110°C, afterwhich it was weighed again.
Representative sampling was difficult in coarse-grained sediments due to the tendency for the largergrains to dig into the surface of the sample as the endswere being smoothed. In poorly compacted, plasticsediments the friction of the sediment plug against theinside of the cylinder tended to compress the plug orprevent it from entering the cylinder smoothly, thuscausing some mechanical disturbance. In more com-pact sediments the cylinder tended to fracture thesediment before it had become fully inserted, or tobreak the plug loose from the remaining sediment insuch a way that the ends of the plug did not protrudefrom, or even reach, the ends of the cylinder. In thesecases where the volume was not accurately known thesample was only used to determine water content.
In sediments which could be sampled effectively,plexiglas plates were fastened over the ends of thecylinder to prevent drying, and the attenuation ofgamma rays through both the plexiglas and the samplewas determined, thus permitting calculation of the wetbulk density, on the basis of gamma ray attenuationdata. In this way the bulk-wet density values obtainedusing both gravimetric and gamma ray attenuationtechniques could be compared and the gamma rayattenuation technique could be calibrated using themore direct gravimetric data.
GRAPE Data
Measurement of the attenuation of a pencil-sizedbeam of gamma rays passing through a known thick-ness of sediment (or rock) permits calculation of thebulk wet density and porosity of the material. Theaccuracy of the method as applied to sediment or rockis strongly dependent upon the homogeneity, consist-ency, and dimensional stability of the sediment as itpasses through the gamma ray beam. Because ofcoring disturbance and the mechanical properties ofthe sediment, it is common for very soft or very hardsediment to only partially fill the core liner. Often acore of relatively undisturbed sediment or rock willhave a variable and smaller diameter than the innerdiameter of the core liner. The length of the gammaray path through both the sediment and through theair, water, or slurry between the sediment core and thewalls of the core liner must be known in order tocompensate for the effects of the varying geometry.Furthermore, the wet bulk density of the surroundingslurry, if any, must be measured separately usinggravimetric techniques in order to correct for thepresence of material other than the undisturbed portionof the core itself. All of these variables are difficult toestimate accurately and are time consuming to mea-sure. If neglected, they can produce both highly varia-ble and anomalously low values of wet bulk densityvalues and high values of porosity. The most repre-sentative wet bulk density values for a particular typeof sediment are probably the maximum values re-corded. However, it is worth noting that the expulsionof interstitial fluids because of compaction duringcoring can produce higher wet bulk density values thanthe actual in situ density. Great care must be taken indrawing geological deductions from data obtainedusing the gamma ray attenuation technique.
Shear Strength
Measurements of the shear strength of sedimentwere made at only a few drill sites (Appendix VI,Table 6). The values were obtained by measuring thetorque required to shear the sediment as it was appliedto a four-bladed rectangular vane having known widthand height. The method is capable of providing mean-ingful quantitative data for clayey sediments. However,when used for sediment types other than clays theinterpretation of the data becomes much more qualita-tive. Because of the generally clastic nature of thesediments encountered during Leg 42A, the vane shear
18

INTRODUCTION AND EXPLANATORY NOTES
data presented should be considered of limited valueas a basis for geological or engineering conclusions.
Thermal Conductivity
Thermal conductivity measurements were made inunconsolidated sediment cored at sites where down-hole temperature data were obtained (Appendix VI,Table 7). The measurements were made using thetransient needle-probe technique described by VonHerzen and Maxwell (1959). In this technique a hypo-dermic needle containing both a uniform heater wirehaving known electrical properties and a temperaturesensing thermistor is inserted into the sediment througha hole drilled in the core liner. A known voltage isapplied to the heater wire causing the needle toapproximate a linear heat source. The temperature riseis monitored for about 5 min after heater turn-on andthe rate of temperature increase thus derived, in con-junction with knowledge of the rate of heat release perunit length (Q) of the needle, permits calculation of thethermal conductivity of a small, cylindrical volume ofsediment immediately adjacent to the needle probe.
The temperature-time data were fitted to a curve ofthe form shown in Equation 1:
T(t) = A + Bt + C In(t)
where T(t) is the temperature at time t after the heaterwas turned on, and A, B, and C are coefficientsdetermined from a curve-fitting program. The Bt termin Equation 1 allows for a gradual linear temperaturechange with time to compensate for the combinedeffects of the approach of the core to room tempera-ture, as well as variations in room temperature in thearea where the cores are stored before and during theconductivity measurement. The C coefficient along withthe heat release per unit length (Q) of the needle-probeis used to compute the thermal conductivity K accord-ing to Equation 2:
K " 4 π C
For heat-flow calculations, the thermal conductivity val-ues obtained aboard ship must be corrected back to thein situ value corresponding to the pressure and tempera-ture conditions beneath the sea floor. The temperatureand pressure corrections KT and Kp suggested byRatcliffe (1960) were modified for use in boreholes, asshown in Equations 3 and 4:
Ti)/400
Δ K p = K o b s ( Z w +
whereA"obs = measured thermal conductivity (mcal/cm sec°C),Tw = bottom water temperature (°C),Z H = subbottom depth (m),
dT/dZ = average geothermal gradient (°C/m),r L
= core temperature at the beginning ofmeasurement (°C),
Z w = water depth (m), andsed = average sediment density (g/cc).
The thermal conductivity values discussed in the sitereports and listed in Table 7 of Appendix VI are thevalues measured at laboratory temperature and pres-sure. They have not been corrected to subbottomconditions.
BIOSTRATIGRAPHY
As a basic reference linking planktonic microfossilzonations to the absolute time scale, the Leg 42Apaleontologists used Ryan et al. (1974).
Nannofossils
Determination of the nannofossil zones for theQuaternary and Neogene sequences during Leg 42Awas based on the standard nannoplankton zonation(Martini, 1971). Because of the particular developmentand history of the Mediterranean, some difficulty wasencountered in determining zones in the middle andlower Miocene. Figure 7 shows the likely correlation ofthese zones with the planktonic foraminiferal zonationused on Leg 42A.
Planktonic Foraminifera
Two planktonic foraminiferal specialists were pre-sent in the Leg 42A shipboard party. The reader iscautioned that, because the Mediterranean is an area inwhich planktonic foraminiferal biozonation is in a stateof flux, the assignment of some boundaries and/or theinterpretations derived from the biostratigraphy bythese two workers can vary considerably. In general,however, it was agreed that for shipboard studies thePliocene biozonation should be that proposed by Citaand the Miocene biozonation that proposed by Bizon.The Pliocene-Pleistocene biozonation used on Leg 42Aand its correlation with other published zonations areas shown in Figure 8. It is described in full in Cita(1975). The Miocene biozonation prepared for Leg42A by Bizon is outlined in Figure 9. The zonationfollows as nearly as possible that for tropical areas(Caribbean) given in Bolli and Premoli-Silva (1973).The figure shows a general framework, and correla-tions with both Bolli and Premoli-Silva (1973) and
Blow (1969). It was used for the two deep holesdrilled in the western and eastern Mediterranean (Sites372 and 375, respectively). It is possible to furthersubdivide some of the intervals at Site 372, particularlythe Globorotalia mayeri Zone, where representatives ofthe Globorotalia menardii group and Globorotaliamiozea group are present and sometimes abundant. Onthe other hand, at Site 375 the sediments are generallytoo poor in planktonic foraminifer to use a morerefined biozonation.
19
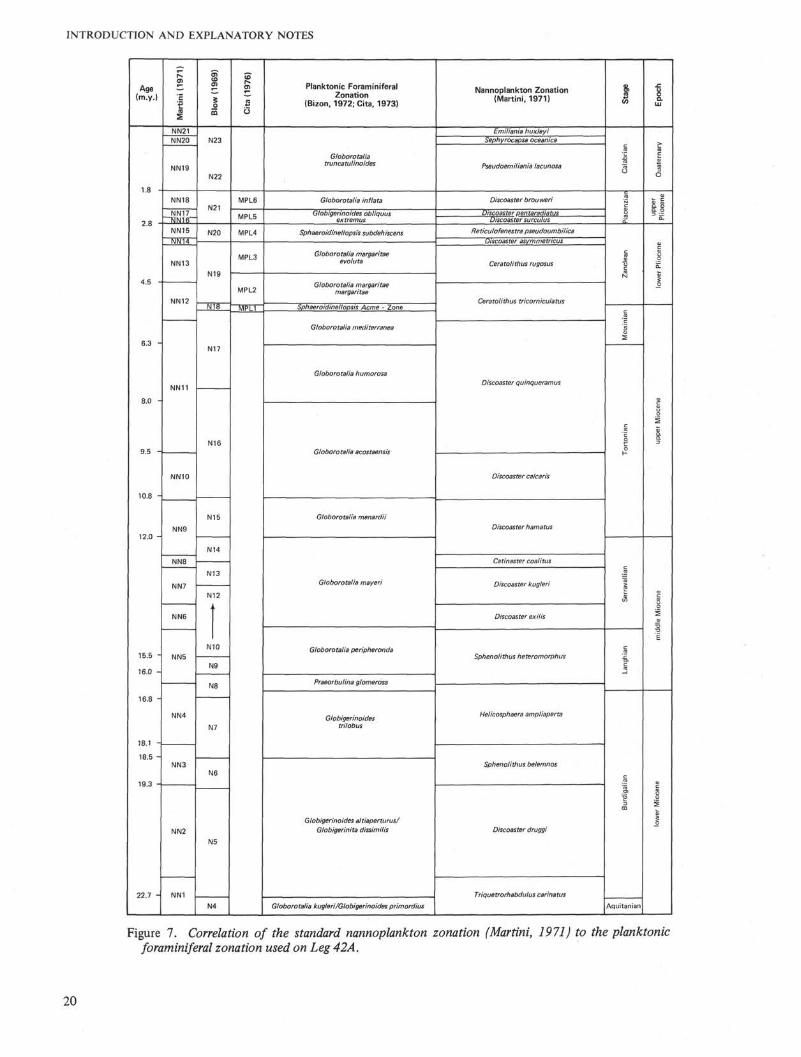
INTRODUCTION AND EXPLANATORY NOTES
Age(m.y.)
1.8
15.5
16.0
18.1
18.5
Tns~
Planktonic ForaminiferalZonation
(Bizon, 1972; Cita, 1973)
Globorotaliatrunca tulinoides
Globorotalia inflata
Globigerinoides obliquuse×tremus
Sphaeroidinellopsis subdehiscens
Globorotalia margaritaeevoluta
Globorotalia margaritaemargaritae
Sphaeroidinellopsis Acme - Zc
Globorotalia mediterranea
Globorotalia humorosa
Globorotalia acostaensis
Globorotalia menardii
Globorotalia mayeri
Globorotalia peripheronda
Praeorbulina glomerosa
Globigerinoidestrilobus
Globigerinoides altiaperturus/Globigerinita dissimilis
Globorotalia kuglen/Globigerinoides primordius
Nannoplankton Zonation(Martini, 1971)
Emiliania huxleyiSephyrocapsa oceanica
Pseudoemiliania lacunosa
Discoaster brou wen
Discoaster pentaradiatus)iscoaster surculus
Reticulofenestra pseudoumbilica
Ceratolithus rugosus
Ceratolithus tricorniculatus
Discoaster quinqueramus
Discoaster calcaris
Discoaster hamatus
Catinaster coalitus
Discoaster kugleri
Discoaster e×ilis
Sphenol/thus heteromorphus
Helicosphaera ampliaperta
Sphenolithus belemnos
Discoaster druggi
Triquetrorhabdulus carinatus
Aquitanian
Figure 7. Correlation of the standard nannoplankton zonation (Martini, 1971) to the planktonicforaminiferal zonation used on Leg 42A.
20

INTRODUCTION AND EXPLANATORY NOTES
Definition of Zones
Globorotalia kugleri/ Globigerinoides primordius ZoneDefinition: Interval with zonal markers from the
first occurrence of Globigerinoides primordius to the lastoccurrence of Globorotalia kugleri.
Globigerinoides altiaperturus I Globigerinita dissimilisZone
Definition: Interval with zonal markers from the lastoccurrence of Globorotalia kugleri (or the first appear-ance of Globigerinoides altiaperturus) to the last occur-rence of Globigerinita dissimilis and Globigerinitraunicaeris.
Globigerinoides trilobus ZoneDefinition: Interval with zonal marker from the last
occurrence of Globigerinita dissimilis and Globigerinitaunicaeris to the first occurrence of Praeorbulina glom-erosa. This interval corresponds roughly to the Globige-rinatella insueta Zone of tropical areas.
Praeorbulina glomerosa ZoneDefinition: Interval with zonal marker, from the first
evolutionary occurrence of Praeorbulina glomerosafrom Globigerinoides bisphericus-sicanus to the firstevolutionary occurrence of Orbulina suturalis.
Globorotalia fohsi peripheroronda ZoneDefinition: Interval with zonal marker, from the first
evolutionary occurrence of Orbulina suturalis fromPraeorbulina glomerosa to the last occurrence of Globo-rotalia fohsi peripheroronda, which occurs in the Carib-bean area within the range of Globorotalia fohsi Zone.
Globorotalia mayeri ZoneDefinition: Interval with zonal marker from the last
occurrence of Globorotalia fohsi peripheroronda to thelast occurrence of Globorotalia mayeri and Globorotaliasiakensis.
Globorotalia menardii ZoneDefinition: Interval with zonal marker from the last
occurrence of Globorotalia mayeri and Globorotaliasiakensis to the first occurrence of Globorotaliaacostaensis. Globorotalia continuosa is generally wellrepresented in this zone.
Globorotalia acostaensis ZoneDefinition: Interval with zonal marker from the first
evolutionary occurrence of Globorotalia acostaensisfrom Globortalia continuosa to the first evolutionaryoccurrence of Globorotalia humerosa from Globorotaliaacostaensis. In this zone, the successive occurrences ofGloborotalia pseudomioceanica and Globigerinoidesobliquus extremus are observed.
Globorotalia humerosa ZoneDefinition: Interval with zonal marker from the first
evolutionary occurrence of Globorotalia humerosa fromGloborotalia acostaensis to the first occurrence ofGloborotalia margaritae/Sphaeroidinellopsis acme.
In the Mediterranean area, this interval can besubdivided into two subzones:
Globorotalia humerosa SubzoneDefinition: Interval with subzonal marker from the
first occurrence of Globorotalia humerosa to the firstoccurrence of Globorotalia mediterranea.
Globorotalia mediterranea SubzoneDefinition: Interval from the first occurrence of
Globorotalia mediterranea to the first occurrence ofGloborotalia margaritae I Sphaeroidinellopsis acme. Theupper part of this zone can be clearly recognized insouthern Spain (Bizon and Montenat, in press) whereevaporites are not always present.
Benthic ForaminifersAnalyses of benthic foraminiferal assemblages were
the primary source of paleobathymetric informationcollected during Leg 42 A (Wright, this volume). It isimportant to record here some explanation of thebathymetric terms and zonation employed.
The conventional bathymetric zonation of the oceanfloor is based on bottom configuration and the depth atwhich certain biologically significant phenomena occur.This zonation is discussed by Hedgepeth (1957) andIngle (1973). Unfortunately, the Mediterranean Sea istopographically and hydrographically unlike the openocean basins of the world. In particular, the hypso-graphic curve of the Mediterranean is significantlydifferent from that of the world's oceans (Figure 10)and the character and position of water masses in theMediterranean differs from their counterparts in theopen ocean basins (Nielsen, 1912). Therefore, thepaleobathymetry of Leg 42A sites is based on abathymetric zonation designed specifically for theMediterranean Sea, by reference to its own hypso-graphic curve, and on the benthic foraminferal distri-bution within the Mediterranean itself (Parker, 1958;Cita and Zocchi, in press). This zonation is given inTable 2 below.
TABLE 2Bathymetric Zonation used on Leg 42A
Zone
Inner NeriticOuter NeriticUpper EpibathyalLower EpibathyalUpper MesobathyalMid MesobathyalLower MesobathyalInfrabathyal
Upper Limit (m)
050
150-200500-700
1000-130018002500
>4000
Lower Limit (m)
50150-200500-700
1000-1300180025004000
21

INTRODUCTION AND EXPLANATORY NOTES
OTHER MEDITERRANEAN BIOZONATIONS SINCE 1972
50
100
150
MEDITERRANEANREGION -SITE 132
T/7Å
LEG 42A(Cita, 1975)
Zachariasse,1975
N22
MPL6
Globorotalia inflateInterval-zone
MPL5
Globigerinoideselongatus
Interval-zone
Globorotaliainflate
Assemblage-zone
Globorotaliabononiensis
Interval-zone
MPL4Sphaeroidinellopsis
subdehiscensInterval-zone
MPL3
Globorotaliamargaritae/
G. puncticulata
Concurrent-range-zone
Globorotaliapuncticulata
Interval-zone
MPL2
Globorotaliamargaritaemargaritae
Interval-zone
Globorotaliamargaritae
Interval-zone
SphaeroidinellopsisAcme-zone MPL1
N17Globorotaliaconomiozea
Interval-zone
Colalongo et al.,1972
Globigerinapachyderma
Globorotaliainflata
ε>
Globorotaliacrassaformis
Globorotaliaaemiliana
— —1—1— —G. bononiensis
G. puncticulata
G. hirsutapraehirsuta
Sphaeroidinellopsis
G. tumidaplesiotumida
Bizon and Bizon,1972
Globorotaliatrunca tulinoides
Globorotaliainflata/
G. tosaensis
Globorotaliacrassaformis
Globorotaliapuncticulata
Globorotaliamargaritae
Globorotaliadutertrei/
G. humerosa
Figure 8. Correlation of the planktonic foraminiferal biozonation used for the Pliocene and Pleistocene on Leg 42A (fromto the left shows the paleomagnetic interpretation ofDSDPSite 132. Next column locates datum planes recognized eitherB = extinction horizon of Discoaster brouweri; S = extinction horizon of Sphaeroidinellopsis; M = extinction horizon ofwhich are considered biostratigraphically well founded and which are calibrated to the paleomagnetic stratigraphy. Dashedmagnetic stratigraphy. Dashed lines with question marks indicate correlations biostratigraphically uncertain and which are
22

INTRODUCTION AND EXPLANATORY NOTES
NONMEDITERRANEAN AREAS
Berggren and Amourer,1973
t
Globigerinoidesobliqua
•> . ">
Globorotaliamiocenica/
G. exilis
G. altispira/~\^ G. multicamerata
G. subdehiscens/Globoquadrina
altispira
Globorotaliamargaritae/
G. subdehiscens
Globigerinanepenthes/
Globorotaliamargaritae
PL6
PL5
FL4/~
PL3PL2
PTI
Bolli and Premoli-Silva,
(
CO
cδoε
it.
1CO
E
ota
Ha
ob
on
U
— 7 —
1973
Globorotaliatrunca tulino idestruncatulinoides
3. truncatulinoidescf. tosaensis
Globorotaliaexilis
Globigerinoidestrilobus
fistulosus
Globorotaliamargaritae
evoluta
Globorotaliamargaritaemargaritae
— — 7 — 7 —
Globorotaliadutertrei
Blow,1969
N22
Globorotaliatruncatulinoides
C^t r\htr\tT\ tziltz)\JlfJUUf Ulcfilα
tosaensis
7 7
Sphaeroidinelladehiscens/
Globoquadrinaaltispira
G. turn id a/S. subdehiscens
Globorotaliaplesiotumida
N21
N20
N19
"NT8
N17
UJ
<
LU-^^—LUO
o
LU
O_
LU
~z.LUCJ
o_ JQ .
LU
~Z.LU
O
Citα, 1975) with other biozonations proposed since 1972, for the Mediterranean and for non-Mediterranean areas. The columnat Site 132, or in the Capo Rossello section, or in both, and discussed in her text. From top to bottom, they are as follows:Globorotalia margaritae; P = Globorotalia puncticulata datum; A = Ceratolithus acutus datum. Solid lines indicate correlationslines indicate correlations which are considered biostratigraphically well founded, but which are not calibrated to the paleo-not calibrated paleomagnetically.
23

INTRODUCTION AND EXPLANATORY NOTES
Correlations after Postuma, 1971
Key ForaminiferalDatum Planes
(Ryan, et al., 1974)
Miocene-Plioceneboundary 5.2-*-
Age(m.y.)
- 5 -
G. mediterranea (I.A.) 6.3-
G. humerosa (I.A.) 8.0-
G. obliquuse×tremus (I.A.) 9.8-
G. acostaensis (I.A.) 10.8-
G. mayeri (E.) 12.0-
G. nepenthes (I.A.) 12.7-
G. menardii (I.A.) 13.4-
G. fohsi fohsi (I.A.) 15.5-
O. suturalis (I.A.) 16.0-
G. bisphericus (I.A.) 16.8-
G. dissimilis (E.) 18.5-
- 10 -
G. kugleri (E.) 22.7-
- 15
- 20 -
Leg 42A
Globorotaliahumerosa
Globorotaliamediterranea
Globorotaliahumerosa
Globorotaliaacostaensis
Globorotaliamenardii
Globorotaliamayeri
Globorotalia fohsiperipheroronda
Praeorbulina glomerosa
Globigerinoides trilobus
Globigerinoides altiaperturus/Globigerinita dissimilis
Globorotalia kugleri/
Globigerinoidesprimordius
Bolli and Premoli-Silva(1973)
Neogloboquadrinadutertrei
Globorotaliaacostaensis
Globorotaliamenardii
Globorotaliamayeri
Globigerinoides ruber
Globorotalia fohsi robusta
Globorotalia fohsilobata
Globorotalia fohsifohsi
Globorotalia fohsi peripheroronda
Praeorbulina glomerosa
Globigerinatella insueta
Globigerinitastainforth i
Globigerinitadissimilis
Globigerinoidesprimordius
N17
N16
N15
N14_ — -N13
N12
N11
N10
N9
N8
N7
N6
N5
N4
Planktonic ForaminiferalDatum LevelsSites 372-375
G. mediterranea (I.A.)
G. humerosa (I.A.)
G. e×tremus (I.A.)G. pseudomiocenica (I.A.)
G. acostaensis (I.A.)
G. mayeri/ (E.)G. siakensis
G. fohsi peripheroronda (E.
O. suturalis (I.A.)
P. glomerosa (I.A.)
G. aissimilis (E.)G. unicavus (E.)
G. kugleri (E.)
Figure 9. Miocene biozonation with planktonic foraminiferal datum planes used on Leg 42A and its correlation to otherbiozonations by Bolli et al, 1973 and Blow, 1969.
24

INTRODUCTION AND EXPLANATORY NOTES
u
1000
2000
- 3000
I4000
5000
6000
7000
\
\
\
\
\
\
\
\\
Mediterrane•(after Ciabat
World•s Oce(after Kossin
\
nSeati and Marabini, 1973)
a. 1921)\
\\
\\
0 10 20 30 40 50 60 70 80 90 100
Cumulative Percent of Sea Floor
Figure 10. Hypsographic curves for the Mediterranean andthe open ocean basins.
REFERENCES
Bader, R. G. et al., 1970, Initial Reports of the Deep SeaDrilling Project Volume 4, Washington (U.S. GovernmentPrinting Office), Appendix III p. 745-753.
Bennett, R. H. and Keller, G. H., 1973, Physical propertiesevaluation, In Van Andel, T. H., Heath, G. R., et al.,Initial Reports of the Deep Sea Drilling Project, Volume16; Washington (U.S. Government Printing Office), p.513-519.
Blanc-Vernet, L., 1969. Contribution a Petude des Foramini-feres de Mediterranee: Extr. Recueil Trav. Stat. Mar.D'Endoume, Bull. 64-48, p. 1-281.
Berggren, W. A. and Amdurer, M, 1973. Late Paleogene(Oligocene) and Neogene planktonic foraminiferal bios-tratigraphy of the Atlantic Ocean (Lat. 30 °N to Lat.30°S); Riv. Ital. Paleont. Strat., v. 79, p. 337-392.
Bizon, J. J. and Bizon, G., 1972. Atlas des principauxForaminiferes planctoniques du bassin Mediterranean,Oligocene a Quaternaire; Eol. Techniq, Paris, p. 1-316.
Blow, W. H., 1969. Late middle Eocene to Recent planktonicforaminiferal biostratigraphy: 1st Intern. Conf. Plankt.Microfossils Proc. (Geneva, 1967), p. 199-421.
Bolli, H. M. and Premoli-Silva, I., 1973. Oligocene to Recentplanktonic foraminifera and stratigraphy of the Leg 15sites in the Caribbean, In Edgar, N.T., Saunders, J. B., etal., Initial Reports of the Deep Sea Drilling Project,Volume 15: Washington (U.S. Government Printing Of-fice), p. 475-498.
Boyce, R. E., 1972. Grain size analyses, Leg 9. In Hays, J. D.et al., Initial Reports of the Deep Sea Drilling Project,Volume 9: Washington (U.S. Government Printing Of-fice), p. 779-798.
, 1973. Physical properties - methods. In Ed-gar, N. T., Saunders, J. B., et al., Initial Reports of theDeep Sea Drilling Project, Volume 15; Washington (U.S.Government Printing Office), p. 1115-1127.
Boyce, R. E., and Bode G. W., 1972. Carbon and carbonateanalyses, Leg 9 Deep Sea Drilling Project. In Hays, J. D.,et al., Initial Reports of the Deep Sea Drilling Project,Volume 9: Washington (U.S. Government Printing Of-fice), p. 797-816.
Cita, M. B., 1975. Planktonic foraminiferal biozonation of theMediterranean Pliocene deep sea record: A Revision: Riv.Ital. Pal. Strat., v. 81.
Cita, M. B. and Zocchi, M., in press. Distribution patterns ofbenthic foraminifera on the floor of the MediterraneanSea: Micropaleontol., Spec. PubL
Colalongo, M. L., Padovani, A., Sartoni, S., Tampieri, R.,D'Onofrio, S., Elmi, C, Francavilla, F., Manzoni, M.,Poluzzi, A., and Russo, A., 1972. Biostratigrafia e cronos-tratigrafia del Pliocene: Boll. Soc. Geol. Ital. v. 91, p. 489-510.
Goddard, E. N., et al., 1963. Rock Color Chart: New York(Geol. Soc. Am.).
Hedgepeth, J. W., 1957. Classification of marine environ-ments: Geol. Soc. Am. Mem. 67, v. 1, p. 17.
Ingle, J. I., Jr., 1973. Neogene foraminifera from the North-eastern Pacific Ocean, Leg 18, Deep Sea Drilling Project.In Kulm, L. D., von Huene, R., et al., Initial Reports ofthe Deep Sea Drilling Project, Volume 18: Washington(U.S. Government Printing Office), p. 517-567.
Jones, J. B. and Segnit, E. R., 1971. The nature of opal, inNomenclature and constituent phases: J. Geol. Soc,Australia, v. 18, p. 57-68.
Kullenberg, B., 1952. On the salinity of the water containedin marine sediments; Medd. Oceanografiska Inst. Gote-borg, v. 21.
Martini, E., 1971. Standard Tertiary and Quaternary calcare-ous nannoplankton zonation, In Forinall, A. (Ed.) SecondPlankt. Conf. Proc, Roma 1970, Rome (Teenoscienza), p.739-785.
Matthews, D. J., 1939. Tables of the velocity of sound inpure water and in seawater: Hydrographic Department,Admiralty, London.
Mélières et al., 1977. Leg 42A: X-ray Mineralogical Studies:this volume.
Müller, G. and Gastner, M., 1971. The "Karbonate Bombe;"A Simple Device for the Determination of the CarbonateContent in Sediments, Soils and Other Materials; N. Jb.Miner. Mh., v. 10, p. 466-469.
Nielsen, J. N., 1912. Hydrography of the Mediterranean andadjacent waters: Rep. Danish Oceanogr. Exp. Medit, v. 1,p. 77-192.
Olausson, E., 1960. Description of sediment from the Medi-terranean and the Red Sea; Rept. Swedish Deep-SeaExped., 1947-48, v. 8, p. 287.
, 1961, Studies of deep sea cores. Sedimentcores from the Mediterranean Sea and the Red Sea: Rept.Swedish Deep-Sea Exped., 1947-48, v. 8, p. 337.
Parker, F. L., 1958. Eastern Mediterranean Foraminifera:Rept. Swedish Deep-Sea Exped., v. 8, p. 217-285.
Postuma, J. A, 1971. Manual of planktonic foraminifera:New York, Elsevier Publ. Co., p. 1-420.
Ratcliffe, E. H., 1960. The thermal conductivities of oceansediments: J. Geophys. Res., v. 65, p. 1535-1541.
Ryan, W. B. F., Cita, M. B., Dreyfus, M., Rawson, L. H.,Burkle, and Saito, T., 1974. A paleomagnetic assignmentof Neogene stage boundaries and the development ofisochronous datum planes between the Mediterranean, thePacific and Indian Oceans in order to investigate theresponse of the World Ocean to the Mediterranean"Salinity Crisis": Riv. Ital. Pal., v. 80, p. 631-688.
Von Herzen, R. and Maxwell, A. E., 1959. The measurementof thermal conductivity of deep sea sediments by aneedle-probe method: J. Geophys. Res., v. 64, p. 1557-1563.
Waterman, L. S., 1970. Interstitial water program, ShipboardManual: Deep Sea Drilling Project Manuscript Report,May 1970: Scripps Institution of Oceanography, p. 141.
25

INTRODUCTORY AND EXPLANATORY NOTES
Wentworth, C. K., 1922. A scale of grade and class terms of Explanatory notes. In Initial Reports of the Deep Seaclastic sediments, J. Geol., v. 30, p. 377. Drilling Project, Volume 23: Washington (U.S. Govern-
Wentworth, C. K. and H. Wüliams, 1932. The classification ment Printing Office), p. 20-29.and terminology of the pyroclastic rocks; Rept. Comm. Zachariasse, W. J., 1975. Planktonic foraminiferal biostratig-Sed. Nat. Research Council, Bull. No. 89, p. 19-53. raphy of the late Neogene of Crete (Greece): Utrecht
Whitmarsh, R. B., Weser, O. E., Ross, D. A., et al., 1974. Micropal. Bull. 11, p. 1-171.
26
Related Documents