REGIONAL WORKSHOP “EEA CORE SET OF INDICATOR FOR THE WEST BALKAN COUNTRIES” 1 11-12 December 2008 Skopje ALBANIAN FOREST AND ENVIRONMENTAL AGENCY FILE PREKA

1 11-12 December 2008 Skopje ALBANIAN FOREST AND ENVIRONMENTAL AGENCY FILE PREKA.
Jan 01, 2016
Welcome message from author
This document is posted to help you gain knowledge. Please leave a comment to let me know what you think about it! Share it to your friends and learn new things together.
Transcript
REGIONAL WORKSHOP “EEA CORE SET OF INDICATOR FOR THE WEST
BALKAN COUNTRIES”
1
11-12 December 2008Skopje
ALBANIAN FOREST AND ENVIRONMENTAL AGENCY
FILE PREKA
Country statistics – produced indicators
2006Air pollution
▪ Annually average values of SSM ▪ Annually average values of PM10▪ Annually average values of SO2 ▪ Annually average values of NO2 ▪ Annually average values of Lead▪ Annually average values of O3 ▪ Annually and monthly average values of dried
sediment▪ DATA SOURCE: PHI, AEFThe Content of elements on the heavy metals, INPRadon monitoring in internal ambient in the air of soil
and drinking waterThe noise monitoring during day and night
2
2008BIODIVERSITY
▪ Threatened and protected vegetative species
▪ Types of species (BRI)
▪ Number of threatened types according to IUCN categories
▪ Types of plants protected by the EU Directives and Conventions and International instruments
▪ Monitoring of rare, threatened and endemic type habitats and their “ex situ” conservation in the Botanical Garden
▪ Vegetation of the low river beds and fresh water areas (hygrohygrohidrophyte
▪ The Fauna monitored by the Faculty of Natural Sciences
▪ Threatened and protected fauna species
▪ Designated areas
▪ Forests - Forest monitoring 2005 – 2007 (Monitored by the Agency of Environment and Forests)
▪ Monitoring of forest species at risk of extinction or threat:
▪ Monitoring the diversity of the forest ecosystems and habitats 3
4
▪ Biomonuments in Albania, monitoring of some of the odoriferous and medicinal plants in the southern and southeastern region and the sage situation in some southern and northern areas of the country
▪ Pastures
2006BIODIVERSITY
CLIMATE CHANGES
5
► CO2 GREEN HOUSE GAS EMISSIONS
► CH4 EMISSIONS 2005 – 2006
► NO2 EMISSIONS 2005 – 2006
► GES Emission in CO2 for 2005► GHG from economic sectors (CO2 equivalent)
Fire woods used as fuel included in the energy sectors as for 2005 – 2006
Assessment of measures undertake until now to reduce green house effect gases based on Strategy and Energy Sector Action Plan, as the sector with the most influence in total GES in 2005 – 2006 years.
SOIL
6
● Degradation of soil - The landslide monitoring - The monitoring of erode soils in rivers side, sea and deposit of ingrained among overflow - The monitoring of ingrained deposit - The monitoring of quality and quantity solid bearer hanging in drain net and water of rivers- Monitoring of landslide - Evaluation of soil indicators- Monitoring of microbiological activity of agricultural soils
● Water quality for watering
WASTE
7
■ Urban waste generation■ Waste generation in Sharra landfill■ Solid waste from mining industry
WATERS
8
□ Oxygen-depleting substances in river□ Biochemical Oxygen Demand□ Content of total phosphorus in main rivers of Albania for period 2001-2007□ The content of nitrite (mg/l) in main rivers of Albania for year 2005□ Lake water quality□ The assessment of trophic condition of lagoons in Adriatic shoreline. □ The quality of groundwater
□
9
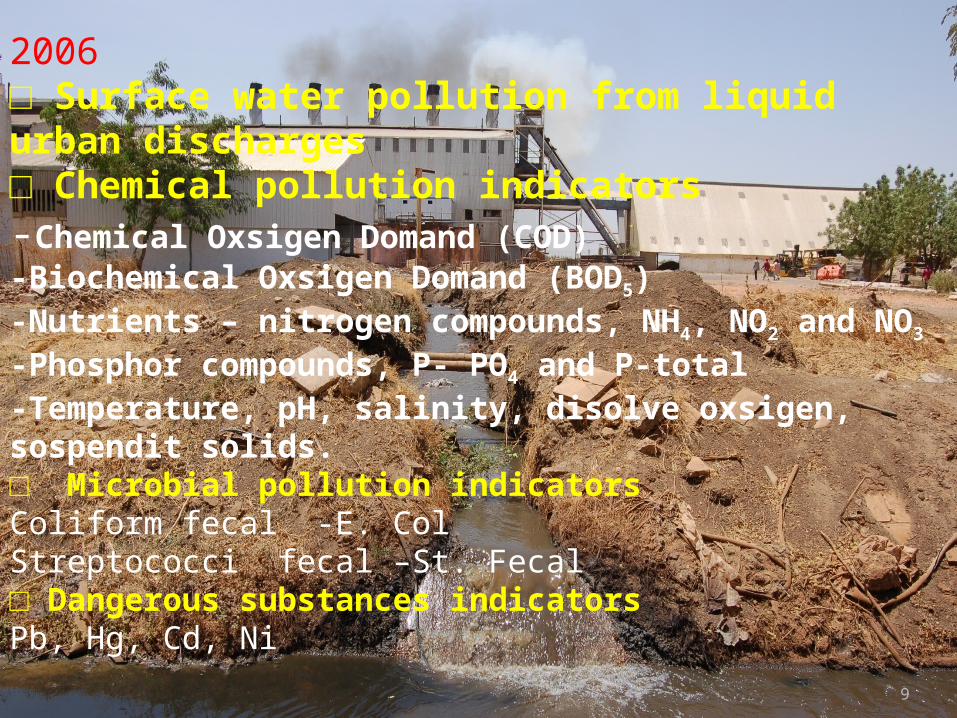
2006□ Surface water pollution from liquid urban discharges□ Chemical pollution indicators-Chemical Oxsigen Domand (COD)-Biochemical Oxsigen Domand (BOD5) -Nutrients – nitrogen compounds, NH4, NO2 and NO3
-Phosphor compounds, P- PO4 and P-total-Temperature, pH, salinity, disolve oxsigen, sospendit solids.□ Microbial pollution indicators Coliform fecal -E. ColStreptococci fecal –St. Fecal□ Dangerous substances indicatorsPb, Hg, Cd, Ni
ADDING 2008 INDICATORS
10
ENERGYCSI – 027 Final energy consumption by sectorCSI – 029 Primary energy consumption by fuel
FISHERIESCSI – 034 Fishing fleet capacityCSI – 032 Status of marine stocks
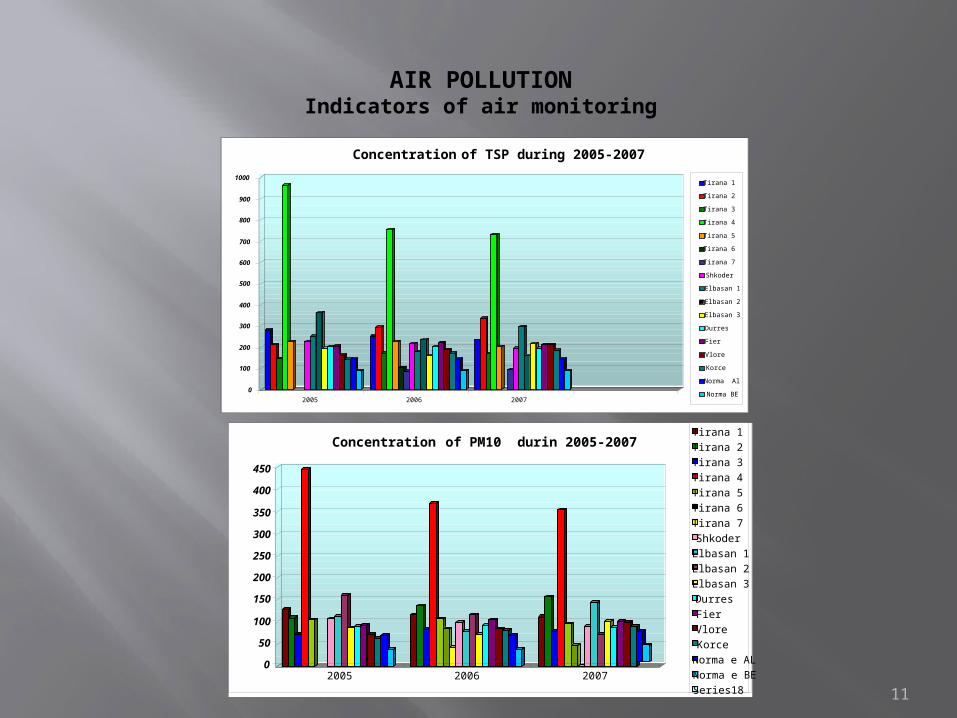
AIR POLLUTIONIndicators of air monitoring
11
0
100
200
300
400
500
600
700
800
900
1000
2005 2006 2007
Concentration of TSP during 2005-2007
Tirana 1
Tirana 2
Tirana 3
Tirana 4
Tirana 5
Tirana 6
Tirana 7
Shkoder
Elbasan 1
Elbasan 2
Elbasan 3
Durres
Fier
Vlore
Korce
Norma Al
Norma BE
0
50
100
150
200
250
300
350
400
450
2005 2006 2007
Concentration of PM10 durin 2005-2007Tirana 1
Tirana 2
Tirana 3
Tirana 4
Tirana 5
Tirana 6
Tirana 7
Shkoder
Elbasan 1
Elbasan 2
Elbasan 3
Durres
Fier
Vlore
Korce
Norma e AL
Norma e BE
Series18
12
0
10
20
30
40
50
60
2005 2006 2007
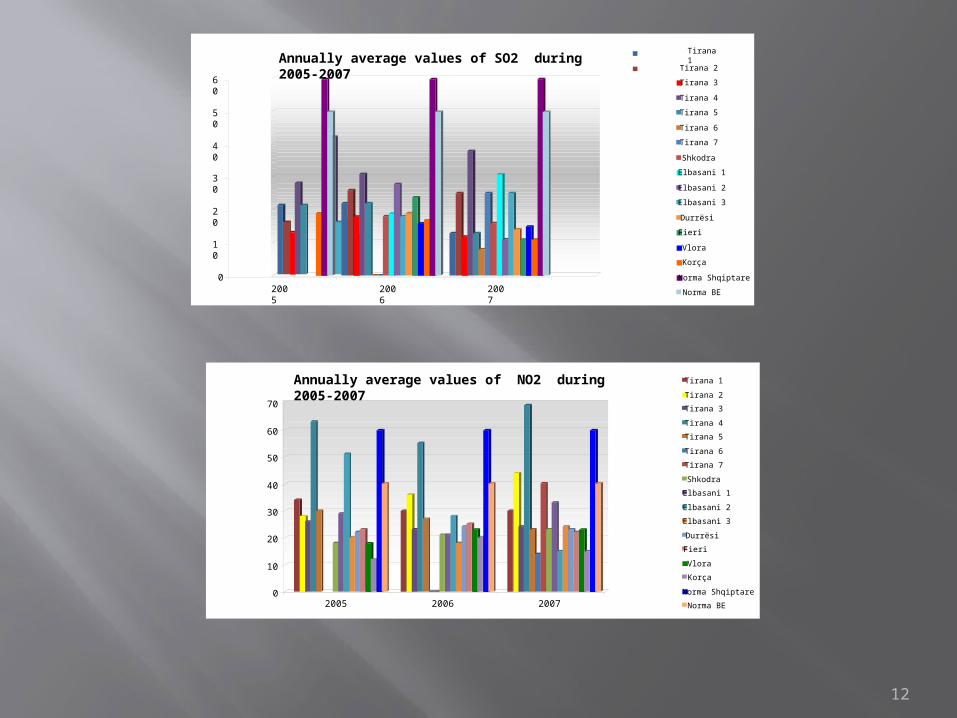
Annually average values of SO2 during 2005-2007
Tirana 1
Tirana 2
Tirana 3
Tirana 4
Tirana 5
Tirana 6
Tirana 7
Shkodra
Elbasani 1
Elbasani 2
Elbasani 3
Durrësi
Fieri
Vlora
Korça
Norma Shqiptare
Norma BE
Annually average values of SO2 during 2005-2007
0
10
20
30
40
50
60
70
2005 2006 2007
Annually average values of NO2 during 2005-2007
Tirana 1
Tirana 2
Tirana 3
Tirana 4
Tirana 5
Tirana 6
Tirana 7
Shkodra
Elbasani 1
Elbasani 2
Elbasani 3
Durrësi
Fieri
Vlora
Korça
Norma Shqiptare
Norma BE
Annually average values of NO2 during 2005-2007
13
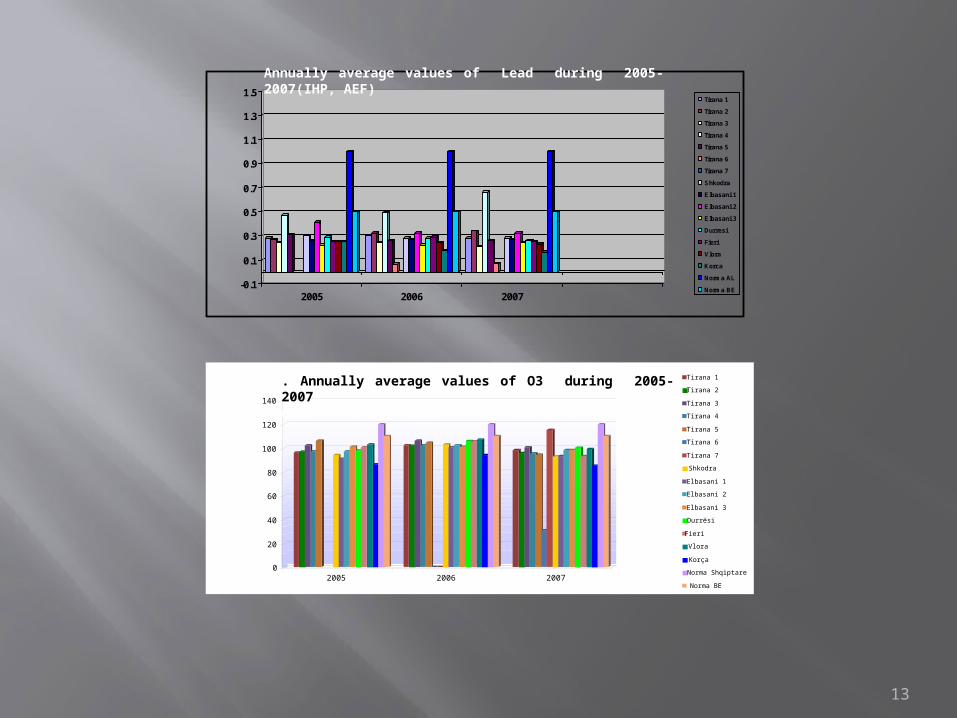
-0.1
0.1
0.3
0.5
0.7
0.9
1.1
1.3
1.5
2005 2006 2007
Tirana 1
Tirana 2
Tirana 3
Tirana 4
Tirana 5
Tirana 6
Tirana 7
Shkodra
Elbasani 1
Elbasani 2
Elbasani 3
Durresi
Fieri
Vlora
Korca
Norma AL
Norma BE
Annually average values of Lead during 2005-2007(IHP, AEF)
0
20
40
60
80
100
120
140
2005 2006 2007
. Annually average values of O3 during 2005-2007ually average values of O3 during 2005-2007
Tirana 1
Tirana 2
Tirana 3
Tirana 4
Tirana 5
Tirana 6
Tirana 7
Shkodra
Elbasani 1
Elbasani 2
Elbasani 3
Durrësi
Fieri
Vlora
Korça
Norma Shqiptare
Norma BE
14
205
129
193
58
3547
59
70
350
200
308
33
41.4
39
350
200
316
7264
59
350
200
0
50
100
150
200
250
300
350
400
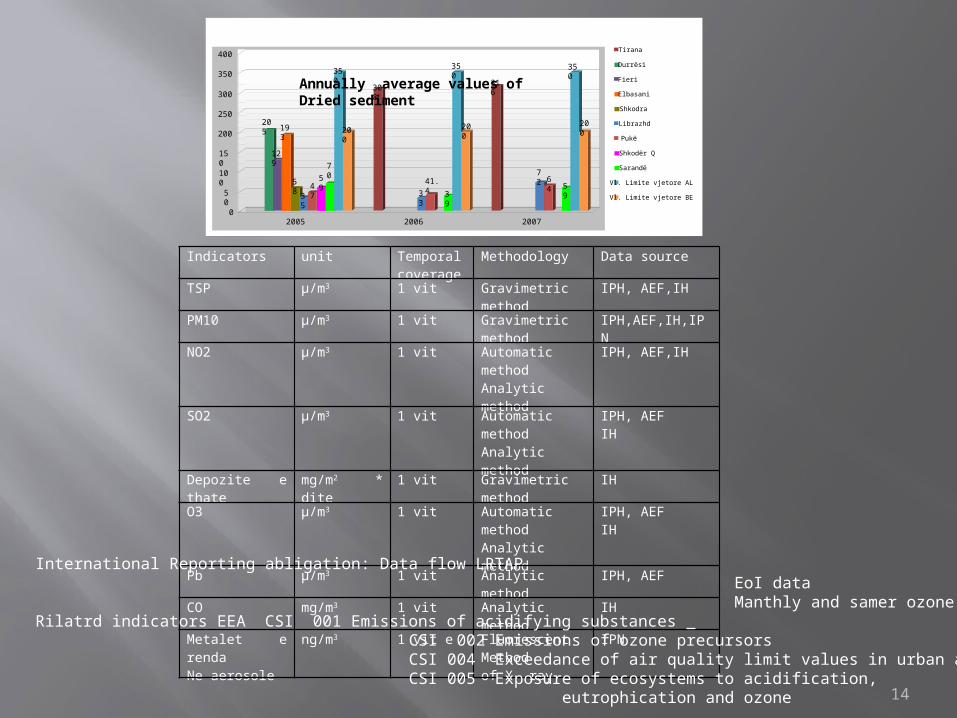
2005 2006 2007
Tirana
Durrësi
Fieri
Elbasani
Shkodra
Librazhd
Pukë
Shkodër Q
Sarandë
Vl. Limite vjetore AL
Vl. Limite vjetore BE
Annually average values of Dried sediment
Indicators unit Temporal coverage
Methodology Data source
TSP μ/m3 1 vit Gravimetric method
IPH, AEF,IH
PM10 μ/m3 1 vit Gravimetric method
IPH,AEF,IH,IPN
NO2 μ/m3 1 vit Automatic methodAnalytic method
IPH, AEF,IH
SO2 μ/m3 1 vit Automatic methodAnalytic method
IPH, AEFIH
Depozite e thate
mg/m2 * dite 1 vit Gravimetric method
IH
O3 μ/m3 1 vit Automatic methodAnalytic method
IPH, AEFIH
Pb μ/m3 1 vit Analytic method
IPH, AEF
CO mg/m3 1 vit Analytic method
IH
Metalet e renda Ne aerosole
ng/m3 1 vit e Fluorescent Methodof X ray
IPN
International Reporting abligation: Data flow LRTAP EoI data Manthly and samer ozone data Rilatrd indicators EEA CSI 001 Emissions of acidifying substances CSI 002 Emissions of ozone precursors CSI 004 Exceedance of air quality limit values in urban areas CSI 005 Exposure of ecosystems to acidification, eutrophication and ozone
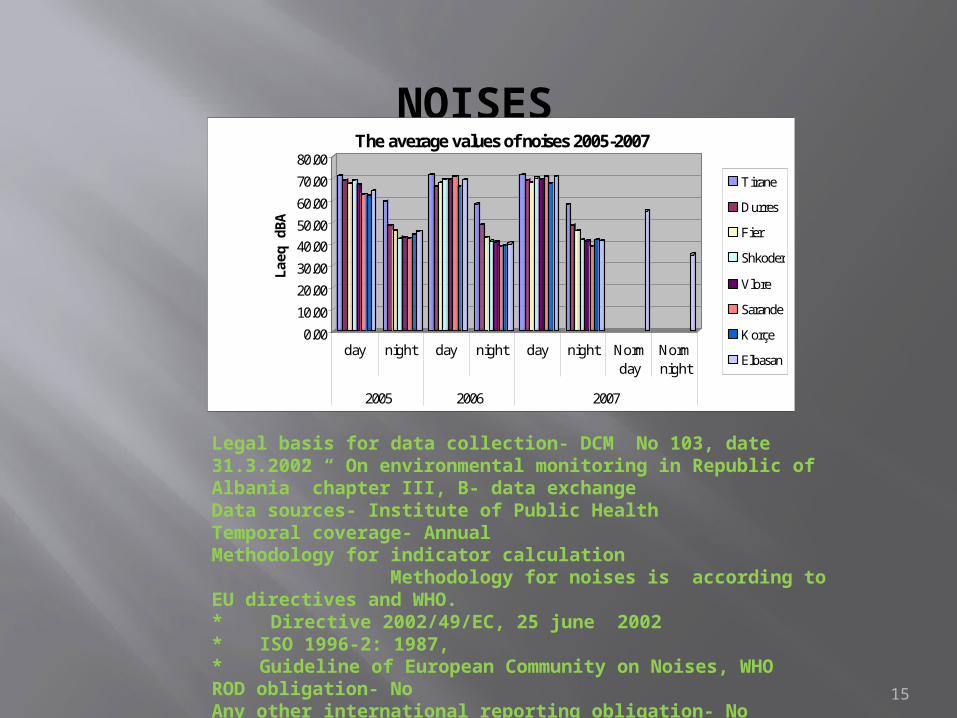
NOISES
Legal basis for data collection- DCM No 103, date 31.3.2002 “ On environmental monitoring in Republic of Albania” chapter III, B- data exchangeData sources- Institute of Public HealthTemporal coverage- AnnualMethodology for indicator calculation Methodology for noises is according to EU directives and WHO. * Directive 2002/49/EC, 25 june 2002 * ISO 1996-2: 1987,* Guideline of European Community on Noises, WHOROD obligation- NoAny other international reporting obligation- No
15
0.00
10.00
20.00
30.00
40.00
50.00
60.00
70.00
80.00
Lae
q d
BA
day night day night day night Normday
Normnight
2005 2006 2007
The average values of noises 2005-2007
Tirane
Durres
Fier
Shkoder
Vlore
Sarande
Korçe
Elbasan
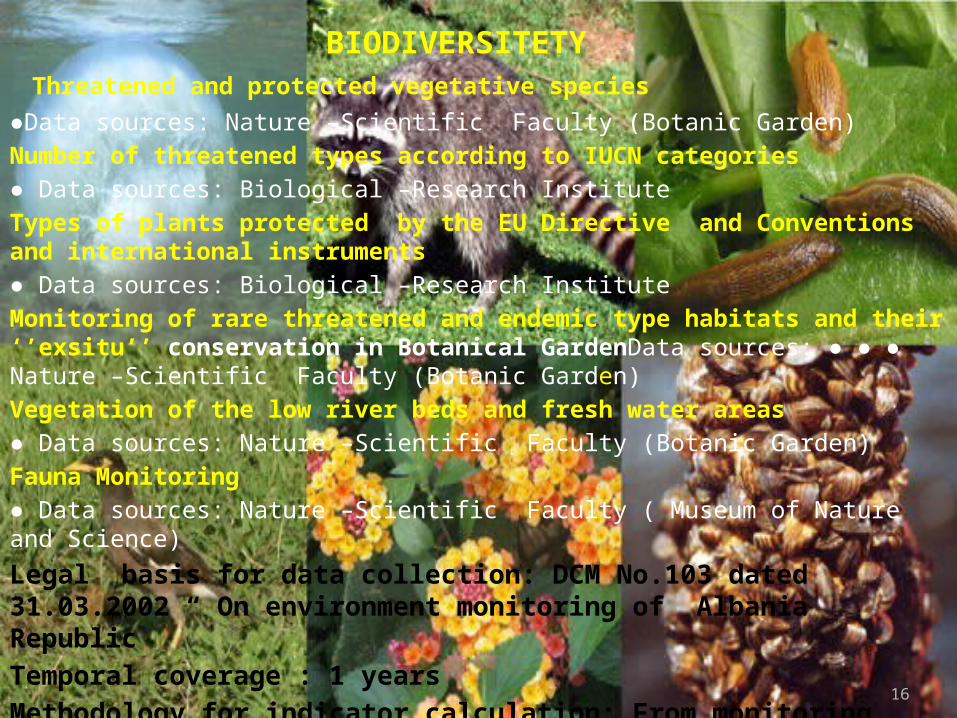
BIODIVERSITETY Threatened and protected vegetative species
●Data sources: Nature –Scientific Faculty (Botanic Garden)Number of threatened types according to IUCN categories● Data sources: Biological –Research InstituteTypes of plants protected by the EU Directive and Conventions and international instruments● Data sources: Biological –Research InstituteMonitoring of rare threatened and endemic type habitats and their ‘’exsitu’’ conservation in Botanical GardenData sources: ● ● ● Nature –Scientific Faculty (Botanic Garden)Vegetation of the low river beds and fresh water areas● Data sources: Nature –Scientific Faculty (Botanic Garden)Fauna Monitoring● Data sources: Nature –Scientific Faculty ( Museum of Nature and Science)
Legal basis for data collection: DCM No.103 dated 31.03.2002 “ On environment monitoring of Albania RepublicTemporal coverage : 1 yearsMethodology for indicator calculation: From monitoring expeditions
16
17
Fauna groupSpecies in Threatened species at Species protected by
Total National level
(IUCN) Convention
CITES Convention
Protocol
EU Directive on Habitat
Bonne Convention
EU Directive on pultry
World level
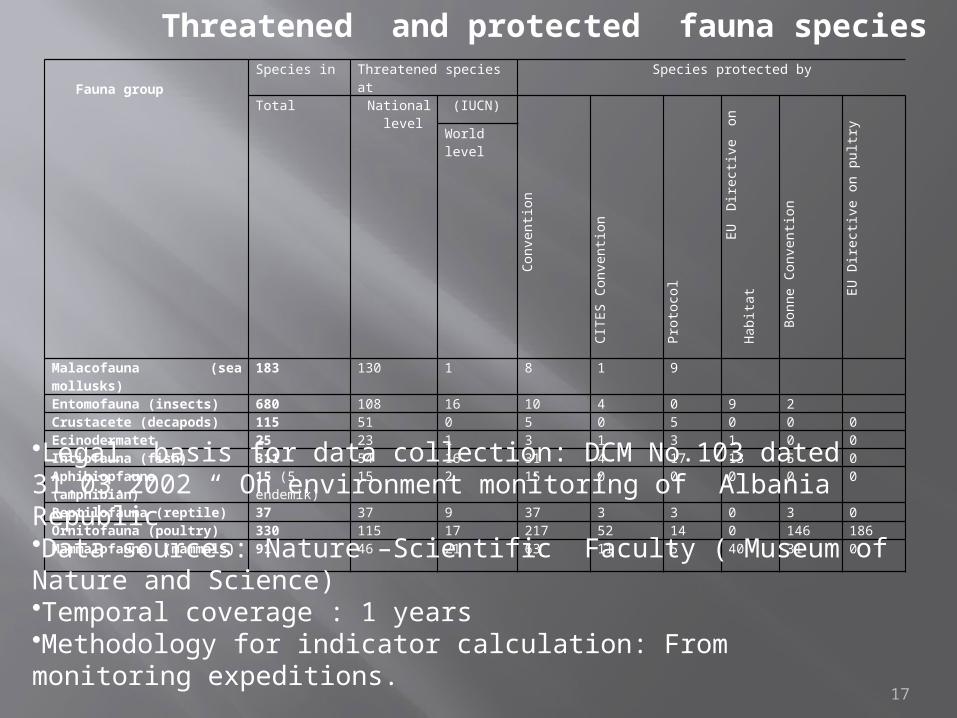
Malacofauna (sea mollusks) 183 130 1 8 1 9
Entomofauna (insects) 680 108 16 10 4 0 9 2Crustacete (decapods) 115 51 0 5 0 5 0 0 0Ecinodermatet 25 23 1 3 1 3 1 0 0Ihtiofauna (fish) 311 54 16 31 4 17 13 5 0Aphibiopfauna (amphibian) 15 (5 endemik) 15 2 15 0 0 0 0 0
Reptilofauna (reptile) 37 37 9 37 3 3 0 3 0Ornitofauna (poultry) 330 115 17 217 52 14 0 146 186Mammalofauna (mammals) 91 46 21 63 11 5 40 31 0
Threatened and protected fauna species
•Legal basis for data collection: DCM No.103 dated 31.03.2002 “ On environment monitoring of Albania Republic•Data sources: Nature –Scientific Faculty ( Museum of Nature and Science)•Temporal coverage : 1 years•Methodology for indicator calculation: From monitoring expeditions.
18
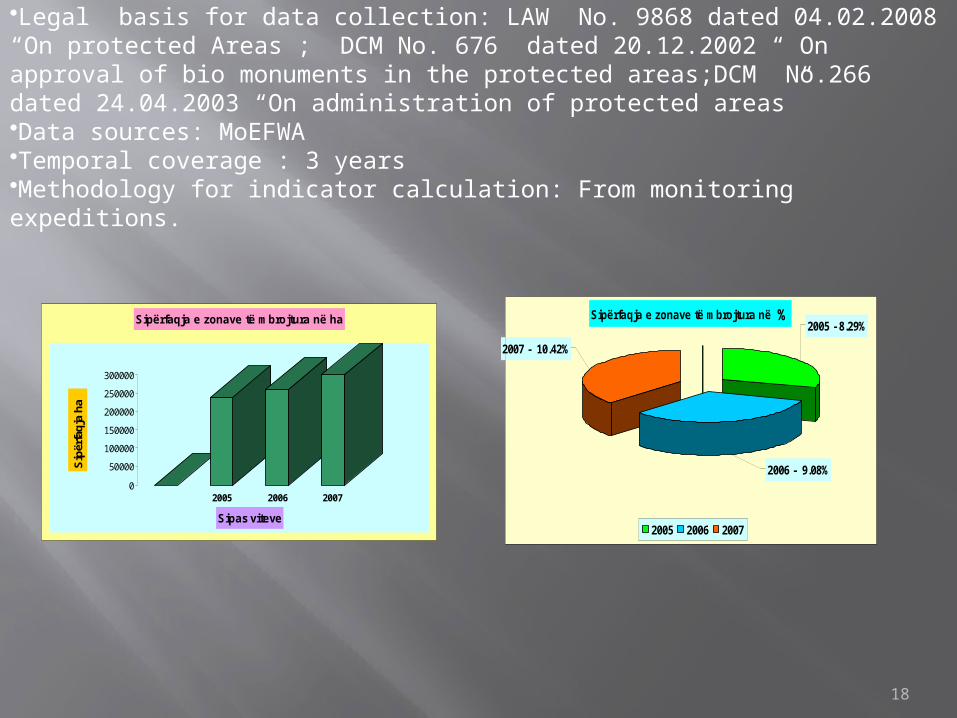
Protected Areas•Legal basis for data collection: LAW No. 9868 dated 04.02.2008 “On protected Areas ; DCM No. 676 dated 20.12.2002 “ On approval of bio monuments in the protected areas;DCM No.266 dated 24.04.2003 “On administration of protected areas” •Data sources: MoEFWA •Temporal coverage : 3 years•Methodology for indicator calculation: From monitoring expeditions.
0
50000
100000
150000
200000
250000
300000
Sip
ërfa
qja
ha
2005 2006 2007
Sipas viteve
Sipërfaqja e zonave të mbrojtura në ha Sipërfaqja e zonave të mbrojtura në %
2007 - 10.42%
2006 - 9.08%
2005 - 8.29%
2005 2006 2007
19
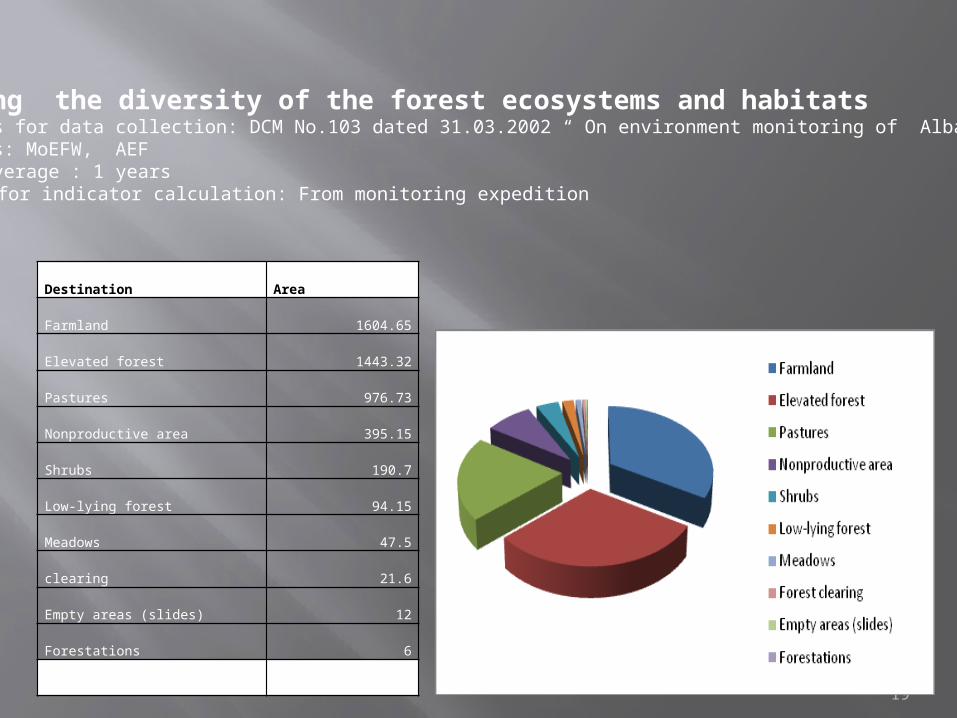
Destination Area
Farmland 1604.65
Elevated forest 1443.32
Pastures 976.73
Nonproductive area 395.15
Shrubs 190.7
Low-lying forest 94.15
Meadows 47.5
clearing 21.6
Empty areas (slides) 12
Forestations 6
Total 4791.8
Monitoring the diversity of the forest ecosystems and habitats•Legal basis for data collection: DCM No.103 dated 31.03.2002 “ On environment monitoring of Albania Republic•Data sources: MoEFW, AEF•Temporal coverage : 1 yearsMethodology for indicator calculation: From monitoring expedition
CLIMATE CHANGE GRAPH
20
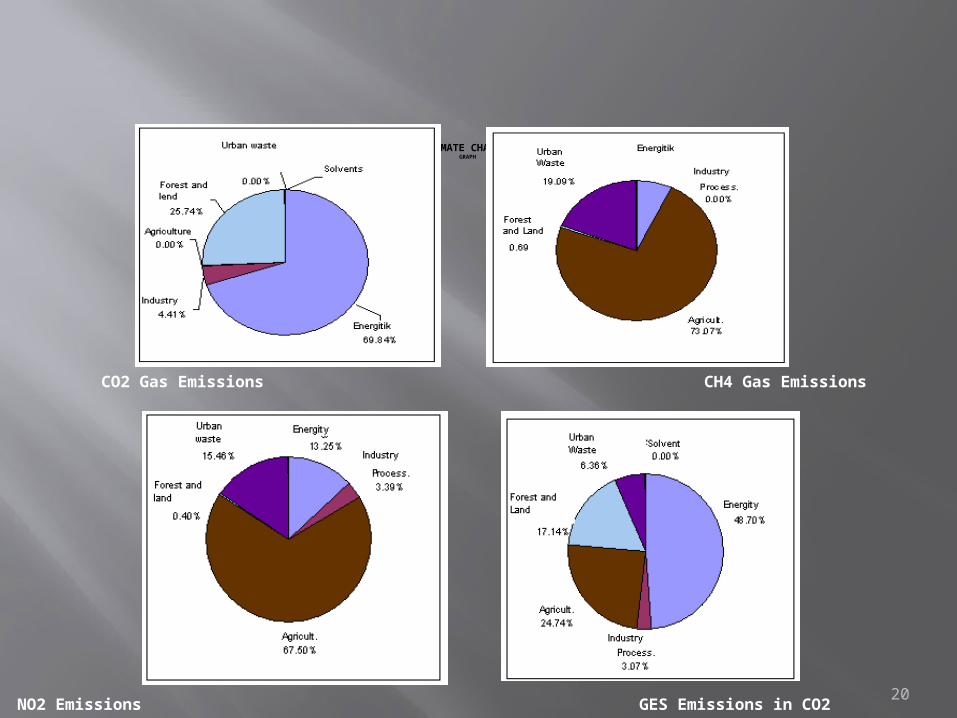
CO2 Gas Emissions CH4 Gas Emissions
NO2 Emissions GES Emissions in CO2
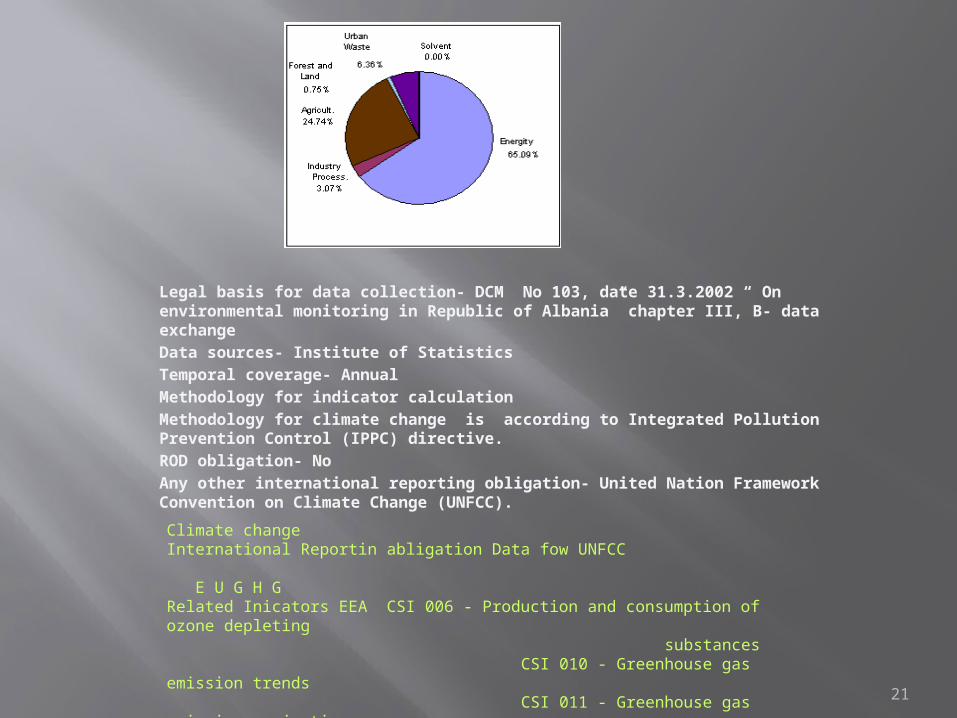
Legal basis for data collection- DCM No 103, date 31.3.2002 “ On environmental monitoring in Republic of Albania” chapter III, B- data exchangeData sources- Institute of StatisticsTemporal coverage- AnnualMethodology for indicator calculationMethodology for climate change is according to Integrated Pollution Prevention Control (IPPC) directive. ROD obligation- NoAny other international reporting obligation- United Nation Framework Convention on Climate Change (UNFCC).
21
Climate change International Reportin abligation Data fow UNFCC E U G H GRelated Inicators EEA CSI 006 - Production and consumption of ozone depleting substances CSI 010 - Greenhouse gas emission trends CSI 011 - Greenhouse gas emission projections
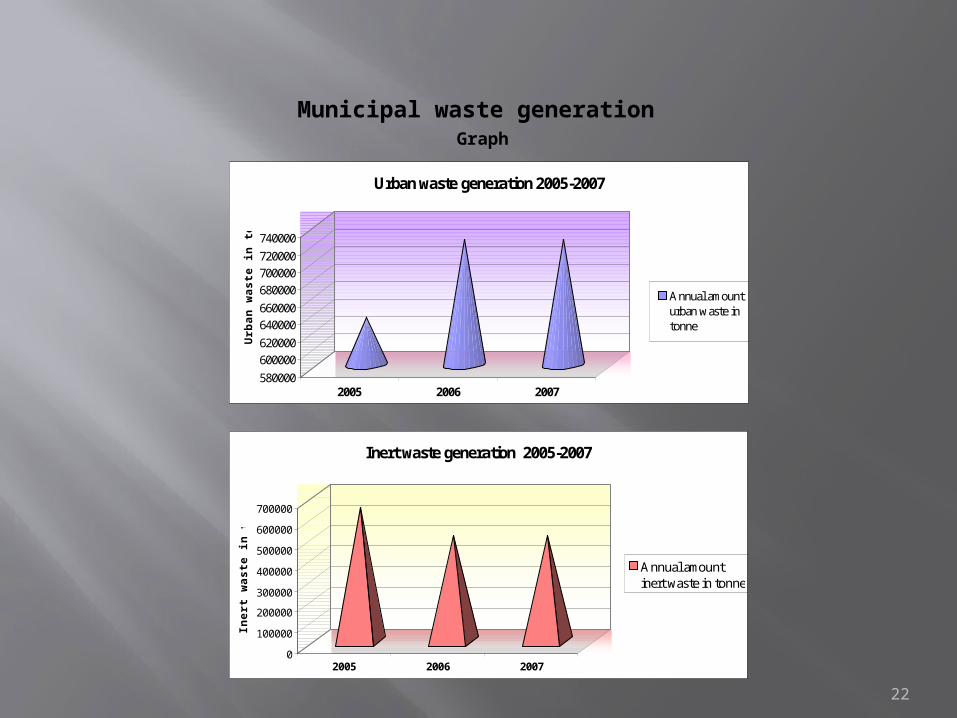
Municipal waste generation Graph
22
580000
600000
620000
640000
660000
680000
700000
720000
740000U
rban
was
te in
ton
ne
2005 2006 2007
Urban waste generation 2005-2007
Annual amounturban waste intonne
0
100000
200000
300000
400000
500000
600000
700000
Iner
t w
aste
in t
onne
2005 2006 2007
Inert waste generation 2005-2007
Annual amountinert waste in tonne
23
0.17
0.175
0.18
0.185
0.19
0.195
0.2
0.205
0.21W
aste
to
nn
e/in
hab
itan
t/ye
ar
2005 2006 2007
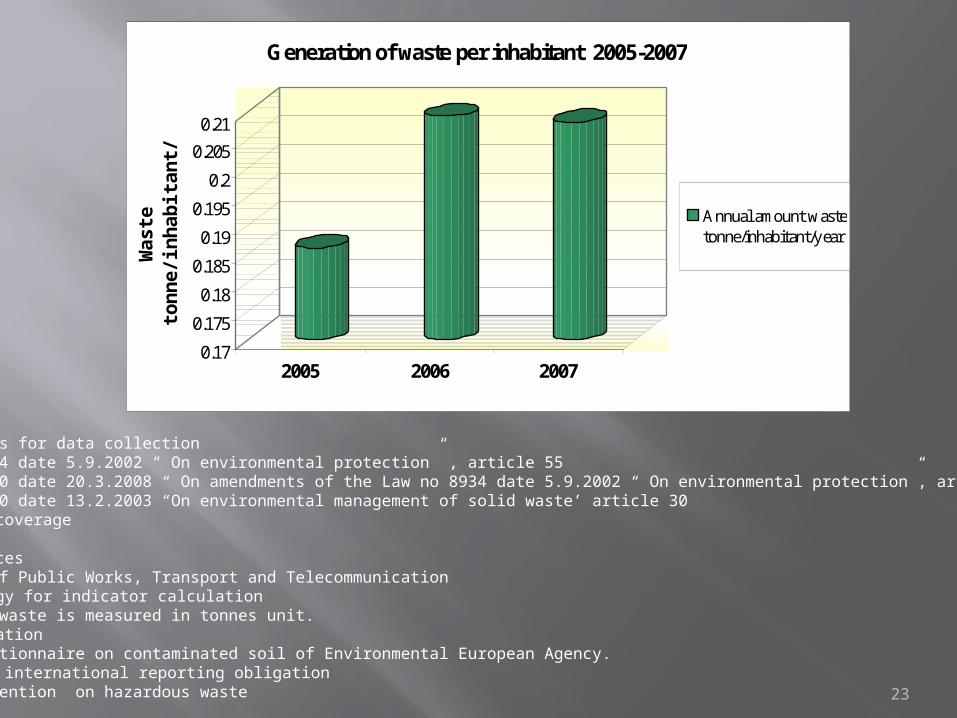
Generation of waste per inhabitant 2005-2007
Annual amount wastetonne/inhabitant/year
Legal basis for data collectionLaw no 8934 date 5.9.2002 “ On environmental protection” , article 55Law no 9890 date 20.3.2008 “ On amendments of the Law no 8934 date 5.9.2002 “ On environmental protection”, article 6.Law no 9010 date 13.2.2003 “On environmental management of solid waste’ article 30•Temporal coverageAnnual•Data sourcesMinistry of Public Works, Transport and Telecommunication•Methodology for indicator calculation Amount of waste is measured in tonnes unit. •ROD obligationYes. Questionnaire on contaminated soil of Environmental European Agency.•Any other international reporting obligationBasel Convention on hazardous waste
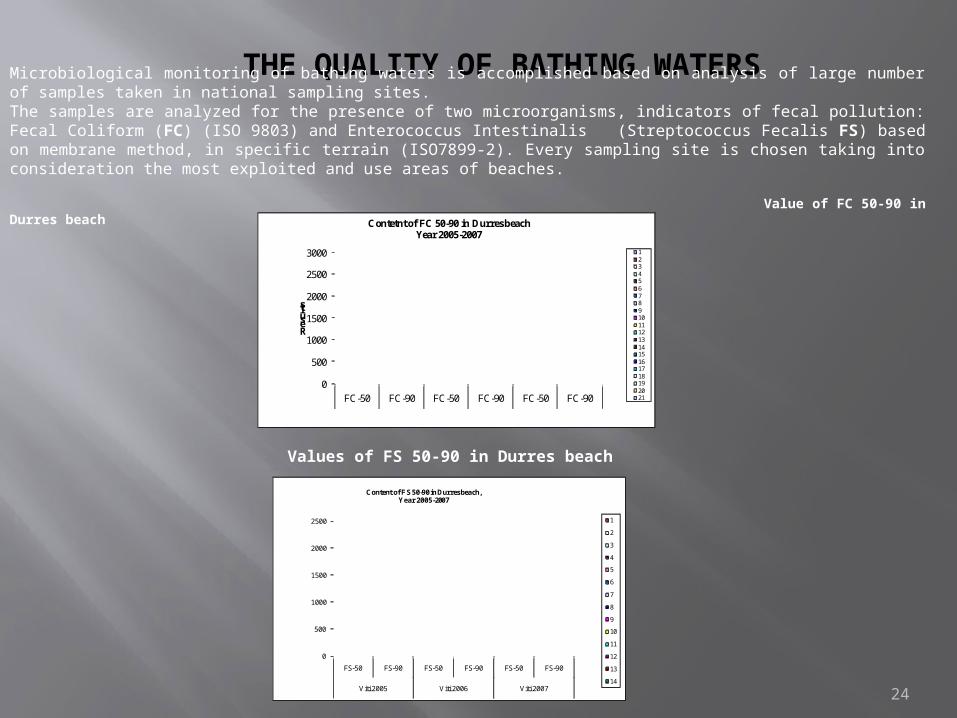
THE QUALITY OF BATHING WATERS
24
Microbiological monitoring of bathing waters is accomplished based on analysis of large number of samples taken in national sampling sites. The samples are analyzed for the presence of two microorganisms, indicators of fecal pollution: Fecal Coliform (FC) (ISO 9803) and Enterococcus Intestinalis (Streptococcus Fecalis FS) based on membrane method, in specific terrain (ISO7899-2). Every sampling site is chosen taking into consideration the most exploited and use areas of beaches.
Value of FC 50-90 in Durres beach
0
500
1000
1500
2000
2500
3000
FC-50 FC-90 FC-50 FC-90 FC-50 FC-90
Results
Contetnt of FC 50-90 in Durres beachYear 2005-2007
123456789101112131415161718192021
0
500
1000
1500
2000
2500
FS-50 FS-90 FS-50 FS-90 FS-50 FS-90
Viti 2005 Viti 2006 Viti 2007
Content of FS 50-90 in Durres beach,Year 2005-2007
1
2
3
4
5
6
7
8
9
10
11
12
13
14
Values of FS 50-90 in Durres beach
25
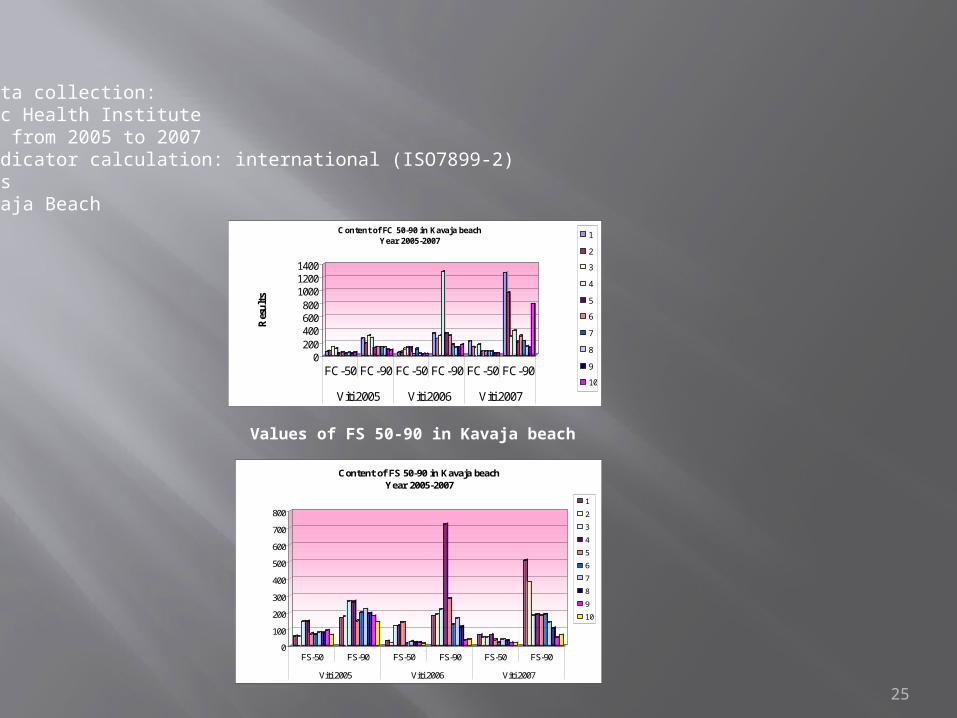
Legal basis for data collection: Data source: Public Health InstituteTemporal coverage: from 2005 to 2007Methodology for indicator calculation: international (ISO7899-2)ROD obligation: yesValue of FC in Kavaja Beach
0200400600800
100012001400
Res
ult
s
FC-50 FC-90 FC-50 FC-90 FC-50 FC-90
Viti 2005 Viti 2006 Viti 2007
Content of FC 50-90 in Kavaja beachYear 2005-2007
1
2
3
4
5
6
7
8
9
10
Values of FS 50-90 in Kavaja beach
0
100
200
300
400
500
600
700
800
FS-50 FS-90 FS-50 FS-90 FS-50 FS-90
Viti 2005 Viti 2006 Viti 2007
Content of FS 50-90 in Kavaja beach Year 2005-2007
1
2
3
4
5
6
7
8
9
10
26
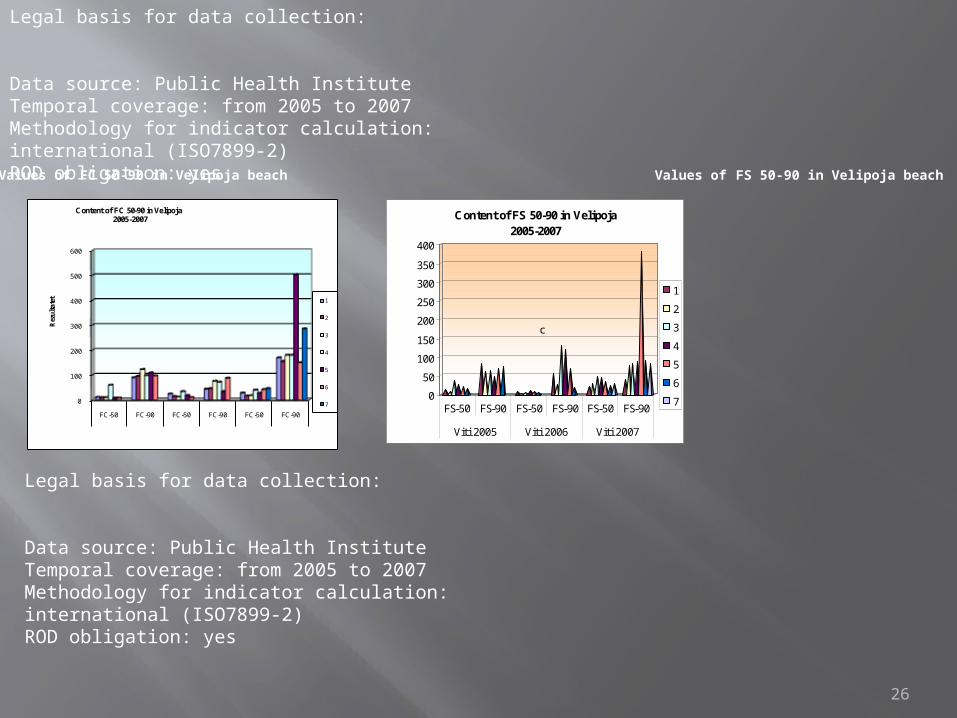
Legal basis for data collection: Data source: Public Health InstituteTemporal coverage: from 2005 to 2007Methodology for indicator calculation: international (ISO7899-2)ROD obligation: yes
0
100
200
300
400
500
600
FC-50 FC-90 FC-50 FC-90 FC-50 FC-90
Rez
ult
ate
t
Content of FC 50-90 in Velipoja 2005-2007
1
2
3
4
5
6
7
0
50
100
150
200
250
300
350
400
FS-50 FS-90 FS-50 FS-90 FS-50 FS-90
Viti 2005 Viti 2006 Viti 2007
Content of FS 50-90 in Velipoja2005-2007
1
2
3
4
5
6
7
c
Values of FC 50-90 in Velipoja beach Values of FS 50-90 in Velipoja beach
Legal basis for data collection: Data source: Public Health InstituteTemporal coverage: from 2005 to 2007Methodology for indicator calculation: international (ISO7899-2)ROD obligation: yes
27
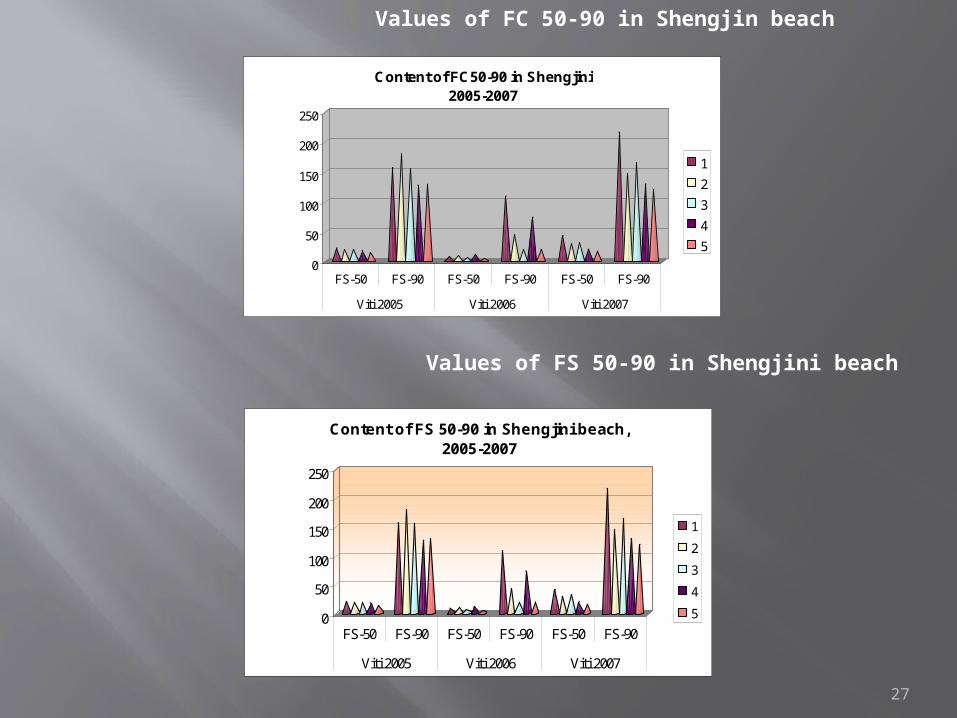
Values of FC 50-90 in Shengjin beach
0
50
100
150
200
250
FS-50 FS-90 FS-50 FS-90 FS-50 FS-90
Viti 2005 Viti 2006 Viti 2007
Content of FC50-90 in Shengjini2005-2007
1
2
3
4
5
0
50
100
150
200
250
FS-50 FS-90 FS-50 FS-90 FS-50 FS-90
Viti 2005 Viti 2006 Viti 2007
Content of FS 50-90 in Shengjini beach, 2005-2007
1
2
3
4
5
Values of FS 50-90 in Shengjini beach
28
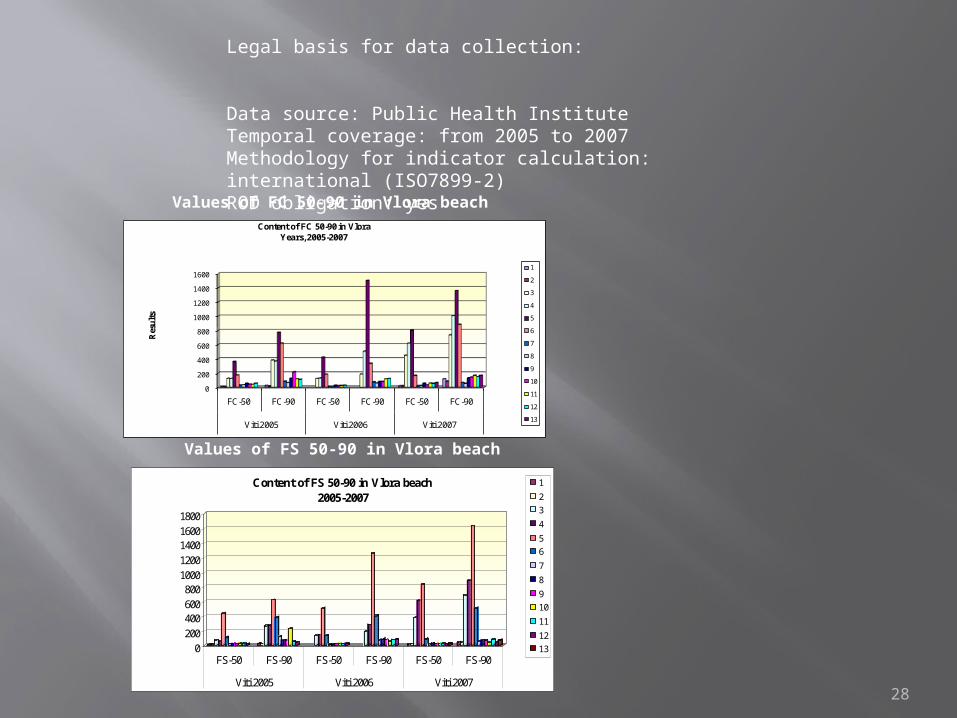
Legal basis for data collection: Data source: Public Health InstituteTemporal coverage: from 2005 to 2007Methodology for indicator calculation: international (ISO7899-2)ROD obligation: yes
Values of FC 50-90 in Vlora beach
0
200
400
600
800
1000
1200
1400
1600
FC-50 FC-90 FC-50 FC-90 FC-50 FC-90
Viti 2005 Viti 2006 Viti 2007
Res
ults
Content of FC 50-90 in Vlora Years, 2005-2007
1
2
3
4
5
6
7
8
9
10
11
12
13
0
200
400600
8001000
1200
14001600
1800
FS-50 FS-90 FS-50 FS-90 FS-50 FS-90
Viti 2005 Viti 2006 Viti 2007
Content of FS 50-90 in Vlora beach 2005-2007
1
2
3
4
5
6
7
8
9
10
11
12
13
Values of FS 50-90 in Vlora beach
29
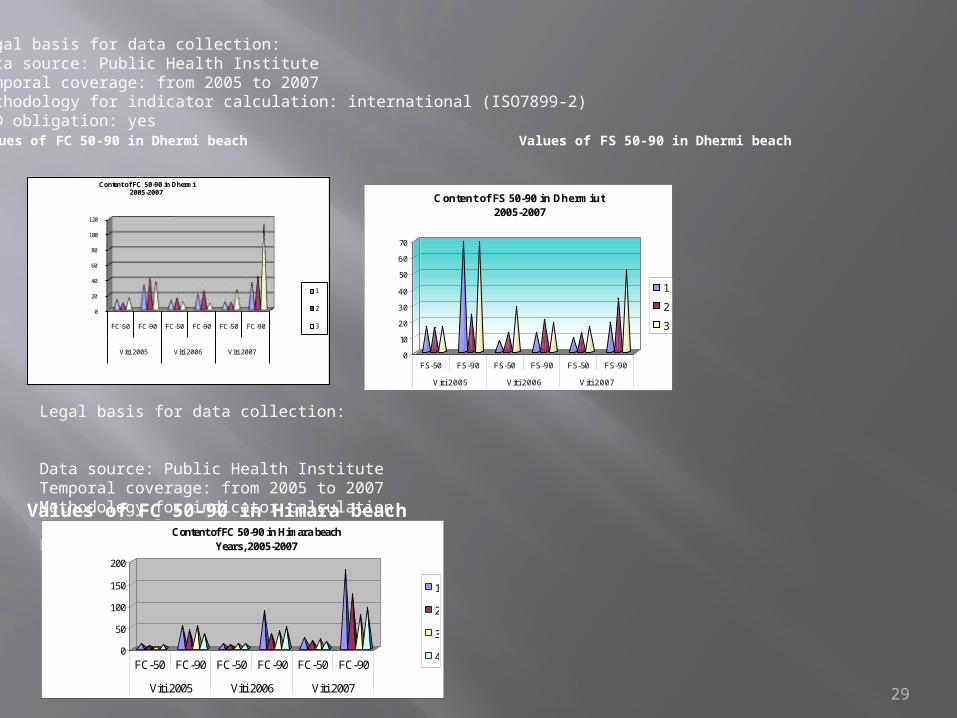
Legal basis for data collection: Data source: Public Health InstituteTemporal coverage: from 2005 to 2007Methodology for indicator calculation: international (ISO7899-2)ROD obligation: yesValues of FC 50-90 in Dhermi beach Values of FS 50-90 in Dhermi beach
0
20
40
60
80
100
120
FC-50 FC-90 FC-50 FC-90 FC-50 FC-90
Viti 2005 Viti 2006 Viti 2007
Content of FC 50-90 in Dhermi 2005-2007
1
2
3
0
10
20
30
40
50
60
70
FS-50 FS-90 FS-50 FS-90 FS-50 FS-90
Viti 2005 Viti 2006 Viti 2007
Content of FS 50-90 in Dhermiut 2005-2007
1
2
3
Legal basis for data collection: Data source: Public Health InstituteTemporal coverage: from 2005 to 2007Methodology for indicator calculation: international (ISO7899-2)ROD obligation: yes
0
50
100
150
200
FC-50 FC-90 FC-50 FC-90 FC-50 FC-90
Viti 2005 Viti 2006 Viti 2007
Content of FC 50-90 in Himara beachYears, 2005-2007
1
2
3
4
Values of FC 50-90 in Himara beach
30
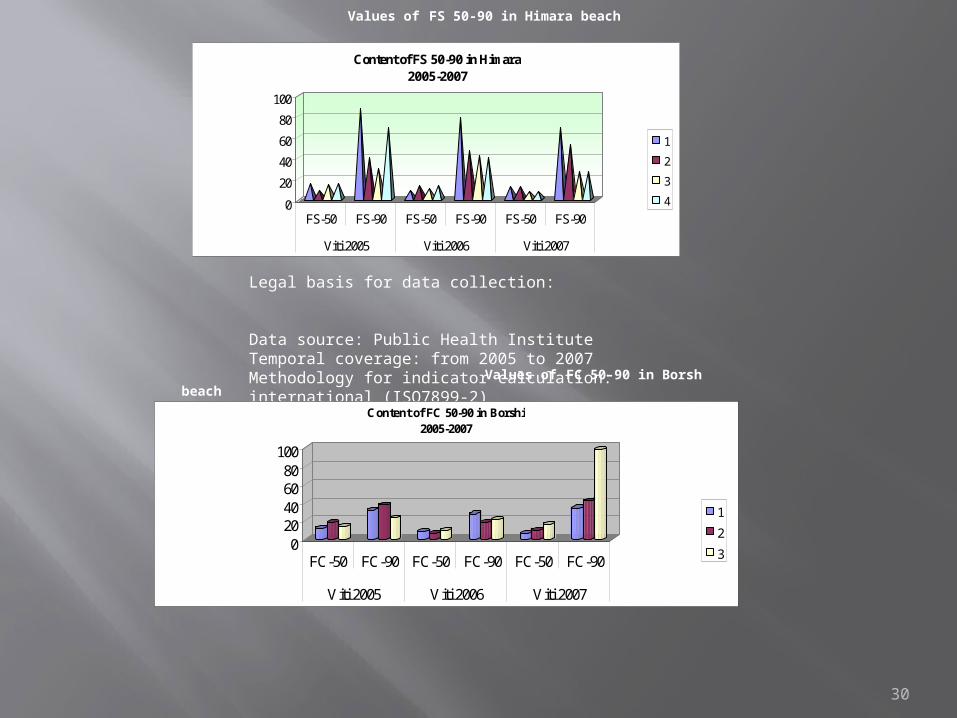
Values of FS 50-90 in Himara beach
0
20
40
60
80
100
FS-50 FS-90 FS-50 FS-90 FS-50 FS-90
Viti 2005 Viti 2006 Viti 2007
Content of FS 50-90 in Himara 2005-2007
1
2
3
4
Legal basis for data collection: Data source: Public Health InstituteTemporal coverage: from 2005 to 2007Methodology for indicator calculation: international (ISO7899-2)ROD obligation: yes
020406080
100
FC-50 FC-90 FC-50 FC-90 FC-50 FC-90
Viti 2005 Viti 2006 Viti 2007
Content of FC 50-90 in Borshi 2005-2007
1
2
3
Values of FC 50-90 in Borsh beach
31
0
10
20
30
40
50
60
FS-50 FS-90 FS-50 FS-90 FS-50 FS-90
Viti 2005 Viti 2006 Viti 2007
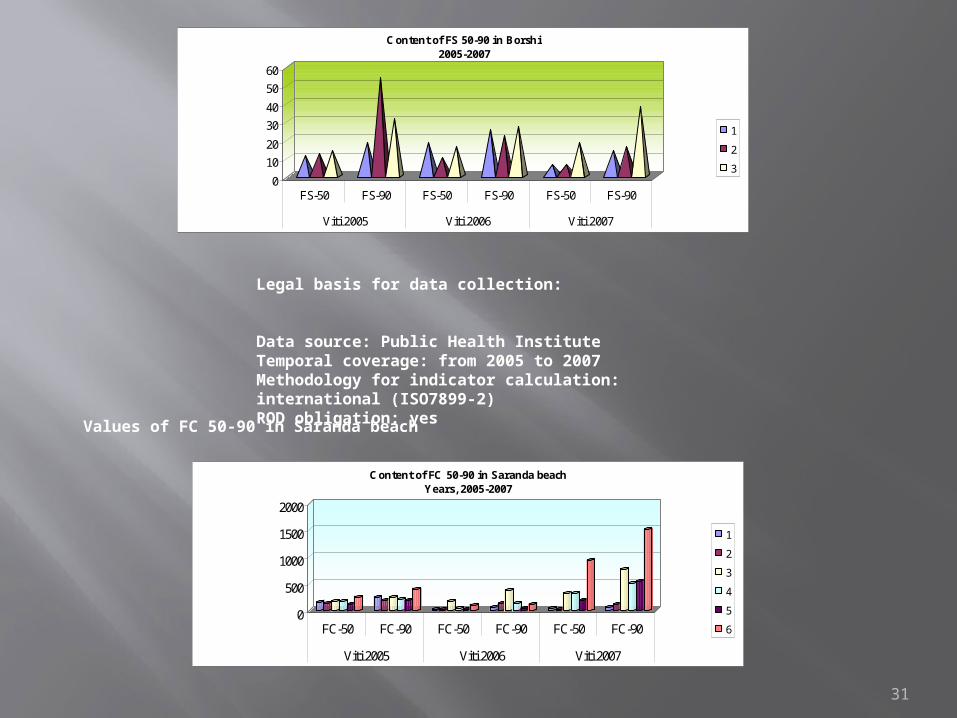
Content of FS 50-90 in Borshi 2005-2007
1
2
3
Legal basis for data collection: Data source: Public Health InstituteTemporal coverage: from 2005 to 2007Methodology for indicator calculation: international (ISO7899-2)ROD obligation: yes
Values of FC 50-90 in Saranda beach
0
500
1000
1500
2000
FC-50 FC-90 FC-50 FC-90 FC-50 FC-90
Viti 2005 Viti 2006 Viti 2007
Content of FC 50-90 in Saranda beachYears, 2005-2007
1
2
3
4
5
6
32
0
200
400
600800
1000
12001400
FS-50 FS-90 FS-50 FS-90 FS-50 FS-90
Viti 2005 Viti 2006 Viti 2007
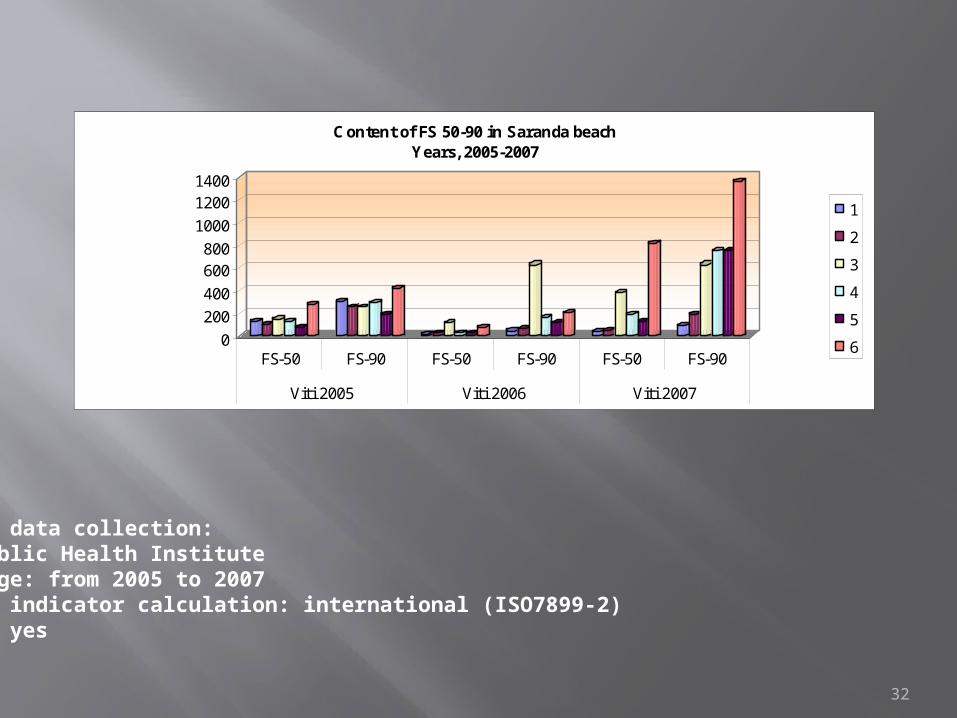
Content of FS 50-90 in Saranda beach Years, 2005-2007
1
2
3
4
5
6
Legal basis for data collection: Data source: Public Health InstituteTemporal coverage: from 2005 to 2007Methodology for indicator calculation: international (ISO7899-2)ROD obligation: yes
33
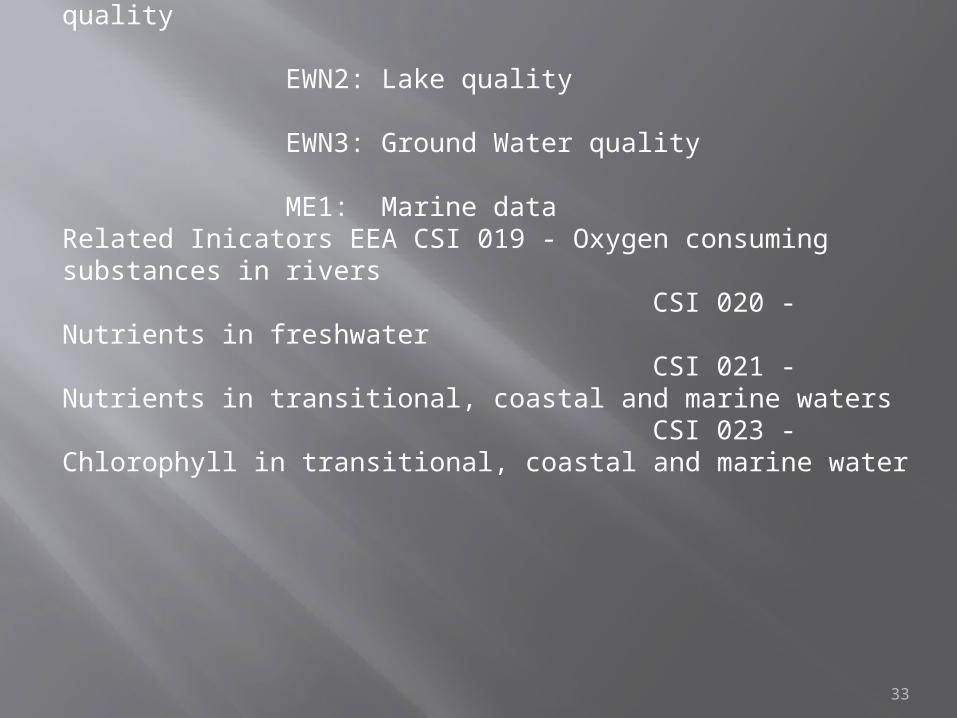
Water International Reportin abligation Data fow EWN1: River quality EWN2: Lake quality EWN3: Ground Water quality ME1: Marine data Related Inicators EEA CSI 019 - Oxygen consuming substances in rivers CSI 020 - Nutrients in freshwater CSI 021 - Nutrients in transitional, coastal and marine waters CSI 023 - Chlorophyll in transitional, coastal and marine water
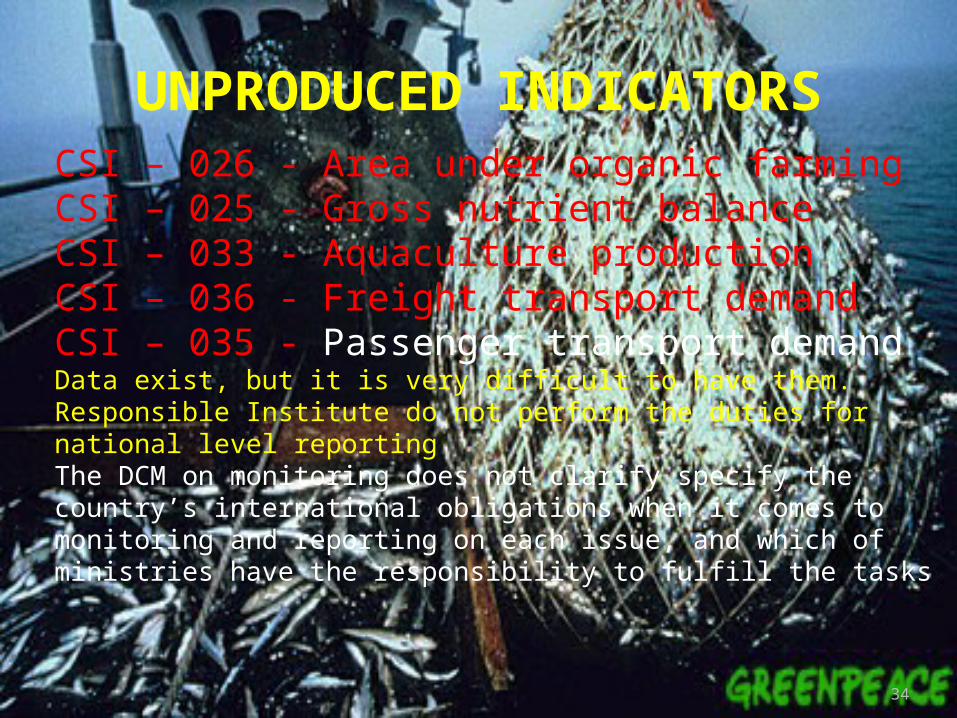
UNPRODUCED INDICATORS
34
CSI – 026 - Area under organic farming CSI – 025 - Gross nutrient balance CSI – 033 - Aquaculture production CSI – 036 - Freight transport demand CSI – 035 - Passenger transport demand Data exist, but it is very difficult to have them. Responsible Institute do not perform the duties for national level reporting The DCM on monitoring does not clarify specify the country’s international obligations when it comes to monitoring and reporting on each issue, and which of ministries have the responsibility to fulfill the tasks
35
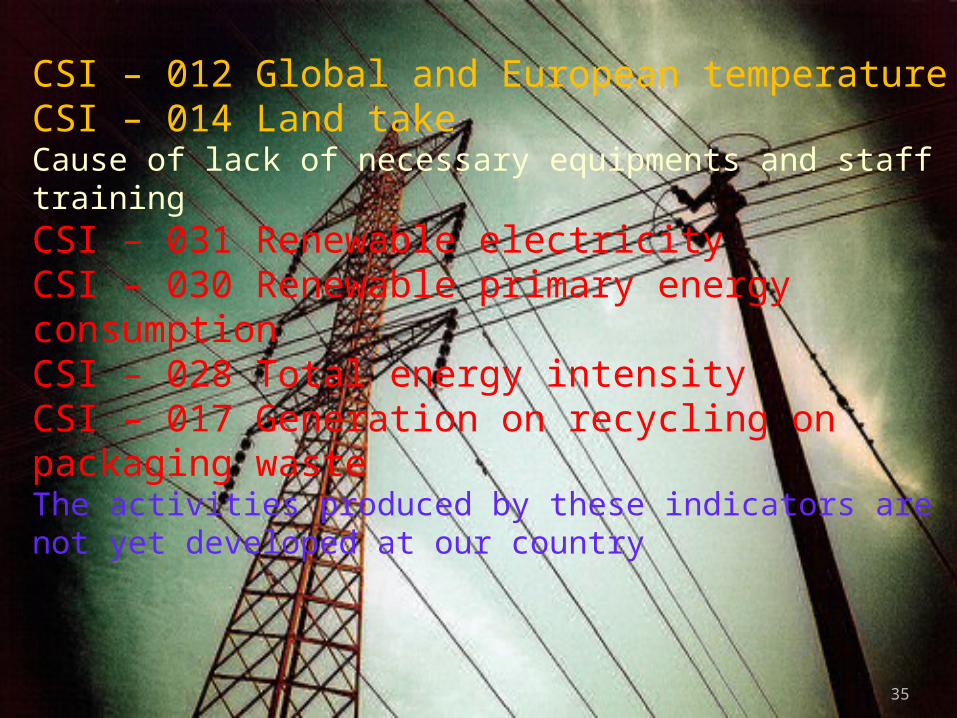
CSI – 012 Global and European temperatureCSI – 014 Land take Cause of lack of necessary equipments and staff trainingCSI – 031 Renewable electricityCSI – 030 Renewable primary energy consumptionCSI – 028 Total energy intensityCSI – 017 Generation on recycling on packaging wasteThe activities produced by these indicators are not yet developed at our country
36
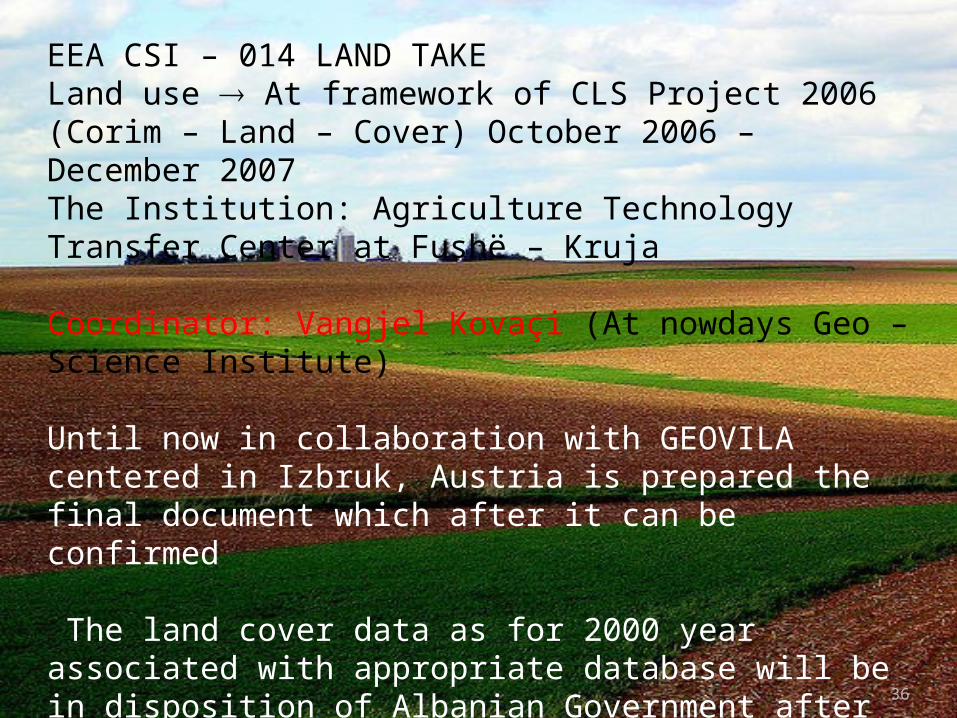
EEA CSI – 014 LAND TAKE Land use - At framework of CLS Project 2006(Corim – Land – Cover) October 2006 – December 2007The Institution: Agriculture Technology Transfer Center at Fushë – Kruja Coordinator: Vangjel Kovaçi (At nowdays Geo – Science Institute) Until now in collaboration with GEOVILA centered in Izbruk, Austria is prepared the final document which after it can be confirmed The land cover data as for 2000 year associated with appropriate database will be in disposition of Albanian Government after december 15/2008
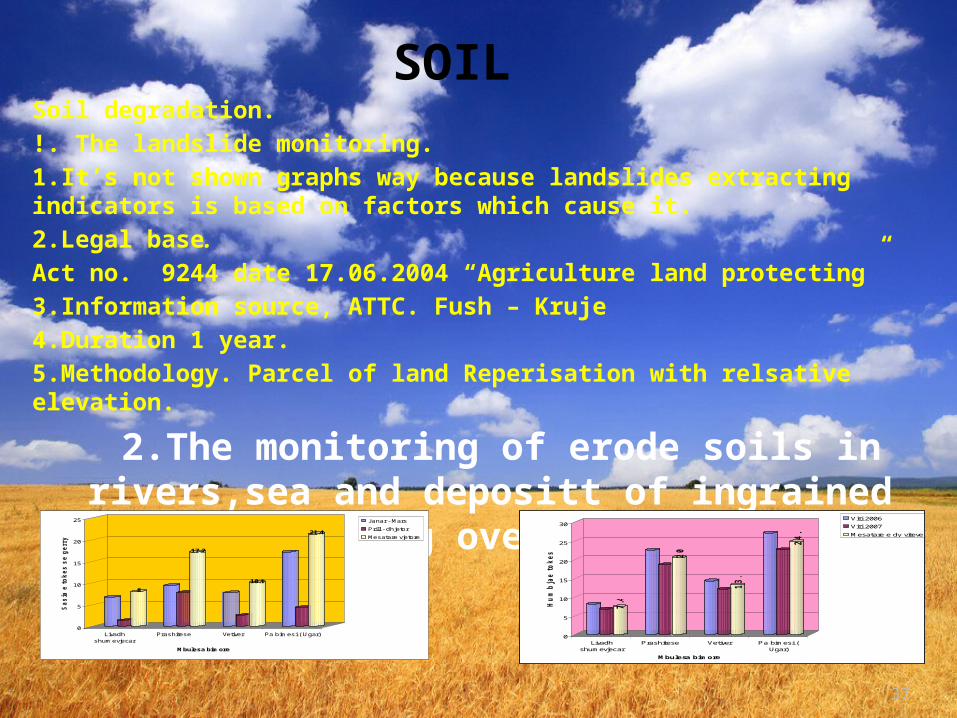
SOILSoil degradation. !. The landslide monitoring.1.It’s not shown graphs way because landslides extracting indicators is based on factors which cause it.2.Legal base.Act no. 9244 date 17.06.2004 “Agriculture land protecting”3.Information source, ATTC. Fush – Kruje4.Duration 1 year.5.Methodology. Parcel of land Reperisation with relsative elevation.
2.The monitoring of erode soils in rivers,sea and depositt of ingrained among
overfllow
37
8
17.2
10.1
21.4
0
5
10
15
20
25
Sa
sia
e t
ok
es
se
ge
rry
er T
on
/ha
Livadhshumevjecar
Prashitese Vetiver Pa bimesi ( Ugar)
Mbulesa bimore
Janar - Mars
Prill - dhjetor
Mesatare vjetore
7.4
20
.
13
.2
24
.8
0
5
10
15
20
25
30
Hu
mb
jae t
okes T
on
/ha
Livadhshumevjecar
Prashitese Vetiver Pa bimesi (Ugar)
Mbulesa bimore
Viti 2006
Viti 2007
Mesatare e dy viteve
38
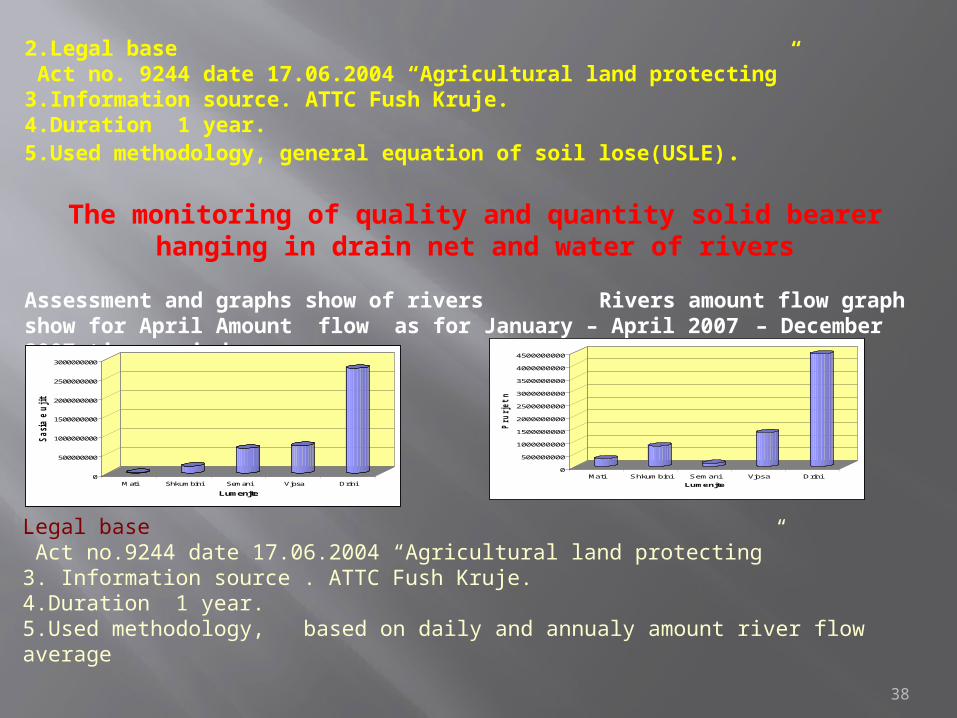
2.Legal base Act no. 9244 date 17.06.2004 “Agricultural land protecting”3.Information source. ATTC Fush Kruje. 4.Duration 1 year.5.Used methodology, general equation of soil lose(USLE).
The monitoring of quality and quantity solid bearer hanging in drain net and water of rivers
Assessment and graphs show of rivers Rivers amount flow graph show for April Amount flow as for January – April 2007 – December 2007 time period
0
500000000
1000000000
1500000000
2000000000
2500000000
3000000000
Sasia
e u
jit
ne m
3
Mati Shkumbini Semani Vjosa Drini
Lumenjte
0
500000000
1000000000
1500000000
2000000000
2500000000
3000000000
3500000000
4000000000
4500000000
Pru
rje
t n
e M
3
Mati Shkumbini Semani Vjosa Drini
Lumenjte
Legal base Act no.9244 date 17.06.2004 “Agricultural land protecting”3. Information source . ATTC Fush Kruje. 4.Duration 1 year.5.Used methodology, based on daily and annualy amount river flow average
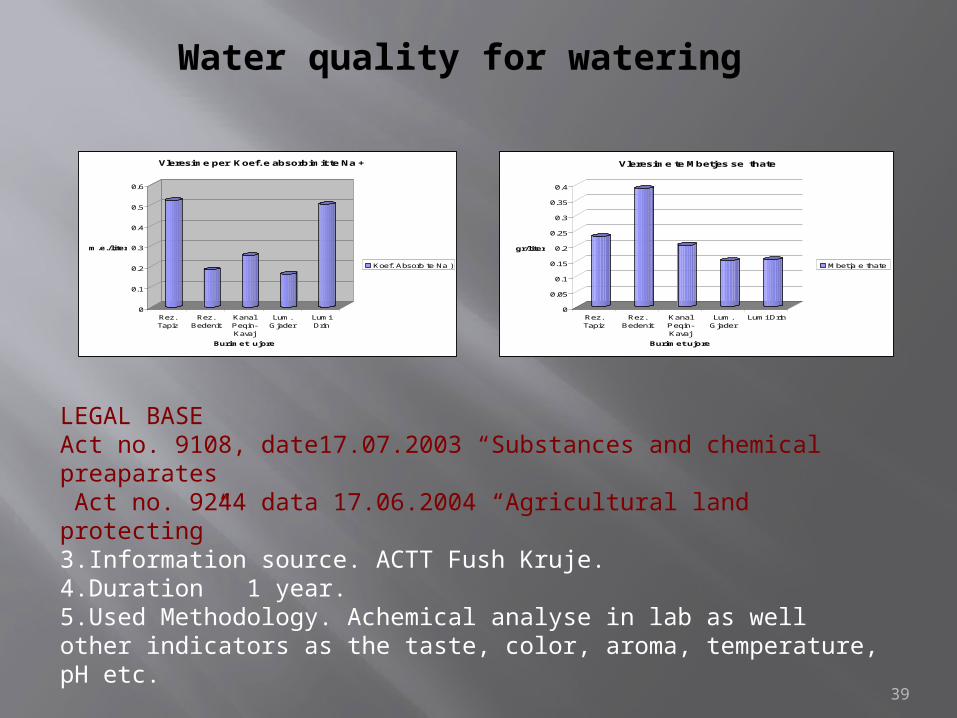
Water quality for watering
39
0
0.1
0.2
0.3
0.4
0.5
0.6
m.e./liter
Rez.Tapiz
Rez.Bedenit
KanalPeqin-Kavaj
Lum.Gjader
LumiDrin
Burimet ujore
Vleresime per Koef. e absorbimit te Na +
Koef. Absorb te Na )
0
0.05
0.1
0.15
0.2
0.25
0.3
0.35
0.4
gr/liter
Rez.Tapiz
Rez.Bedenit
KanalPeqin-Kavaj
Lum.Gjader
Lumi Drin
Burimet ujore
Vleresime te Mbetjes se thate
Mbetja e thate
LEGAL BASEAct no. 9108, date17.07.2003 “Substances and chemical preaparates Act no. 9244 data 17.06.2004 “Agricultural land protecting”3.Information source. ACTT Fush Kruje. 4.Duration 1 year.5.Used Methodology. Achemical analyse in lab as well other indicators as the taste, color, aroma, temperature, pH etc.
40
THANK YOU FOR YOU
ATTENTION
Related Documents


![JAVNO SOOBRA]AJNO PRETPRIJATIE SKOPJE - SKOPJE · Bulevar Aleksandar Makedonski 10, 1000 Skopje / e-mail: jsp1@jsp.com.mk . JSP SKOPJE NQP SHKUP JAVNO …](https://static.cupdf.com/doc/110x72/5b4a73317f8b9a93238c412b/javno-soobraajno-pretprijatie-skopje-bulevar-aleksandar-makedonski-10-1000.jpg)
