+ NEKSDC CCSSM HS Statistics and Probability Elaine Watson, Ed.D. March 13, 2013

+ NEKSDC CCSSM HS Statistics and Probability Elaine Watson, Ed.D. March 13, 2013.
Dec 26, 2015
Welcome message from author
This document is posted to help you gain knowledge. Please leave a comment to let me know what you think about it! Share it to your friends and learn new things together.
Transcript

+
NEKSDC CCSSM HS Statistics and Probability
Elaine Watson, Ed.D.March 13, 2013

+Arthur Benjamin TED Talk: Teach Statistics Before Calculus

+Essential Questions
How do we organize data so we can describe it?
What is an adequate description of data?How do we interpret and analyze data?How is statistics different from
mathematics?Why is probability so closely linked to
statistics?

+Structure of Presentation General Overview of Statistics and Probability
GAISE Report Levels A, B, C Components of Statistical Problem Solving
Link Between Statistics and Probability Statistics Framework:
Population versus Sample Descriptive Statistics and Inferential Statistics
Common Core Statistics and Probability K – 5 Data (Categorical and Measurement) 6 – 8 Statistics HS Statistics
Time to Work Problems Illustrative Mathematics Other Text Resources

+Activity:
There are six tasks.
Randomly draw a task
Work through your task
Share your answer with the group
How are the tasks alike?
How are the tasks different?
What CCSSM Math Practice Standards did you use?
How does this activity relate to Probability and Statistics?

+Permutations Tasks What are all three-digit numbers that you can make using each of
the digits 1, 2, and 3, and using each digit only once?
Angel, Barbara, and Clara run a race. Assuming there is no tie, what are all the possible outcomes of the race (first, second, third)?
You are watching Angel, Barbara, and Clara playing on a merry-go-round. As the merry-go-round spins, what are all the different ways that you see them from left to right?
You want to form two partners from among Angel, Barbara, and Clara, by the following procedure: You choose one of them, and then let that child choose her partner. What are all the possible outcomes of this process?
In a 3 x 3 grid square, color three of the (unit) squares blue, in such a way that there is at most one blue square in each row and in each column. What are all the ways of doing this?
Find all of the symmetries of an equilateral triangle.
https://www.math.purdue.edu/~goldberg/Math453/eqi-slides-web.pdf

+The Difference between Statistics and Mathematics“Statistics is a methodological discipline. It exist not for itself, but rather to offer to other fields of study a coherent set of ideas and tools for dealing with data. The need for such a discipline arises from the omnipresence of variability.”
Moore and Cobb, 1997
Statistical problem solving and decision making depend on understanding, explaining, and quantifying the variability in the data.
It is this focus on variability in data that sets apart statistics from mathematics.
GAISE Report

+The Nature of Variability Measurement Variability
Measuring devices can produce unreliable results Changes in the system being measured (blood pressure from one
moment to the next)
Natural Variability Individuals differ in size, aptitudes, abilities, opinions, emotional
responses
Induced Variability Planting seeds in two different locations with different conditions A carefully designed experiment can help determine the effects
of different factors
Sampling Variability We use a sample of a population to make an estimate of a whole
population. However, it is rare for two samples to have identical results. Proper sampling techniques and adequate sampling size help to lower sampling variation.
GAISE Report

+The Role of Context“The focus on variability naturally gives statistics a particular content that sets it apart from mathematics, itself, and from other mathematical sciences but there is more than just content that distinguishes statistical thinking from mathematics. Statistics requires a different kind of thinking, because data are not just numbers, they are numbers with a context. In mathematics, context obscures structure. In data analysis, context provides meaning.”
Moore and Cobb, 1997
GAISE Report

+What is the role of context?
Mexico 2000
Male MaleFemale
Female
United States 2000
Population (in millions) Population (in millions)
Statistics in Action (Watkins, Scheaffer, Cobb) Key Curriculum Press, 2004

+Components of Statistical Problem SolvingI. Formulate Questions
II. Collect Data
III. Analyze Data
IV. Interpret Results
C
Compare to CCSSM Modeling Cycle

+Statistics is Modeling ★
In the HS CCSSM Standards, Modeling is considered not only a Practice Standard, but also one of the six Conceptual Categories (Numbers & Quantity, Algebra, Functions, Modeling, Geometry, Statistics & Probability)
The Modeling standards are interspersed throughout the Numbers & Quantity, Algebra, Functions, and Geometry Conceptual Categories and are indicated with a ★.
However, ALL standards in the the Statistics Conceptual Category are considered modeling standards. As a result, the Category is marked with a ★, but the individual standards are not.

+Statistical Education: A Developmental ProcessGAISE Report: 3 Levels of Statistical Understanding
Level AStudents develop “data sense” – an understanding that data are more than just numbers. Statistics changes numbers into information.Level BStudents see statistical reasoning as a process for solving problems through data and quantitative reasoningLevel CStudents extend concepts learned in Levels A and B to cover a wider scope of investigatory issues, and develop a deeper understanding of inferential reasoning and its connection to probability. Students also should have an increased ability to explain statistical reasoning to others.

+Statistical Education: A Developmental Process
Although these three levels may parallel grade levels, they are based on development in statistical literacy, not age.
Thus, a student who has no prior experience with statistics will need to begin with Level A concepts and activities before moving to Level B and Level C.
For this reason, we will spend time looking at the 6 – 8 Standards, since many students currently in HS may be at Level A or B.
The learning is more teacher driven at Level A, but becomes more student-driven at Levels B and C.

+GAISE Framework Levels A,B,C in the Statistical Modeling Process
As we go through the next few slides on the Statistical Modeling Process…
Refer to the one-page handout from the GAISE Document that has a Table with Column Headings
Level A, Level B, Level C
and Row Headings
I. Formulate Questions, II. Collect Data, III. Analyze Data, and IV. Interpret Results

+Components of Statistical Problem Solving
I. Formulate Questions
Clarify the problem at hand
Formulate one (or more) questions that can be answered with data
The question should anticipate variability
Which of these questions anticipates variability?
How tall am I? How tall are adult men in the USA?
Discuss the horizontal progression in the Formulate Question row across Levels A, B, C
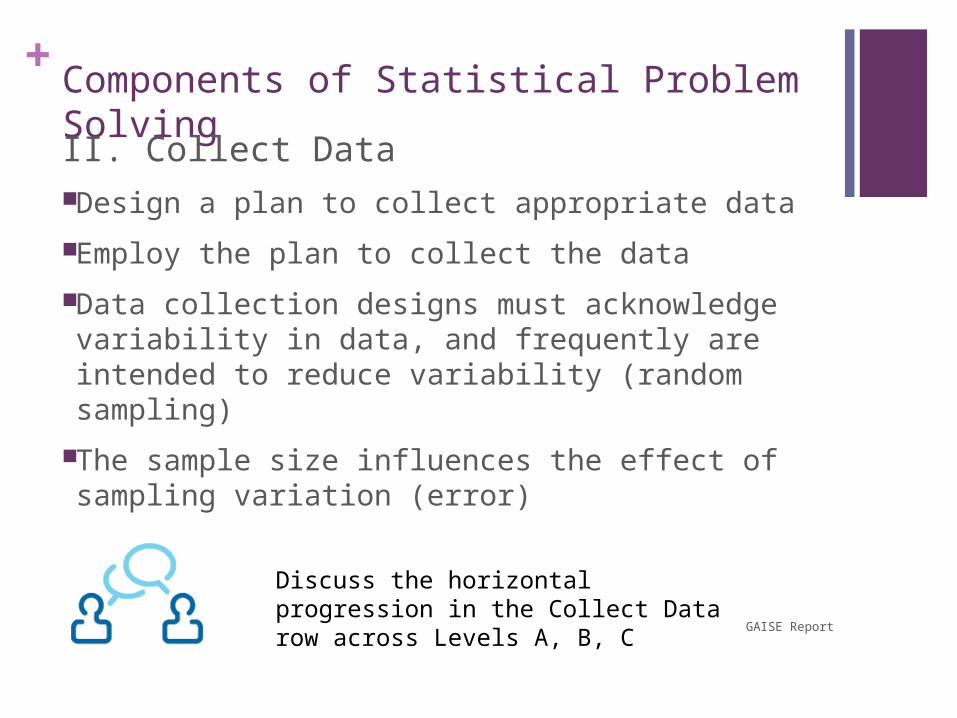
+Components of Statistical Problem SolvingII. Collect Data Design a plan to collect appropriate data
Employ the plan to collect the data
Data collection designs must acknowledge variability in data, and frequently are intended to reduce variability (random sampling)
The sample size influences the effect of sampling variation (error)
GAISE Report
Discuss the horizontal progression in the Collect Data row across Levels A, B, C

+Components of Statistical Problem SolvingIII. Analyze Data Select appropriate graphical and numerical methods
Use these methods to analyze the data
The main purpose of statistical analysis is to give an accounting of the variability in the data 42% of those polled support the candidate with a
margin of error +/- 3% at the 95% confidence level Test scores are described as “normally distributed
with mean 450 and standard deviation 100
GAISE Report
Discuss the horizontal progression in the Analyze Data row across Levels A, B, C

+Components of Statistical Problem Solving
IV. Interpret Results
Interpret the analysis
Relate the interpretation to the original question
Statistical interpretations are made in the presence of variability and must allow for it.
Looking beyond the data to make generalizations must allow for variability in the data.
GAISE ReportDiscuss the horizontal progression in the Interpret Results row across Levels A, B, C

+At the point of question formulation, the statistician anticipates the data collection, the nature of the analysis, and the possible interpretations – all of which involve possible sources of variability.
1. Formulate Question
2. Collect Data
3. Analyze
Data
4. Interpret Results
Variability
Variability
Variability

+In the end, the mature practitioner reflects upon all aspects of data collection and analysis as well as the question itself when interpreting results.
1. Formulate Question
2. Collect Data
3. Analyze
Data
4. Interpret Results

+Likewise, he or she links data collection and analysis to each other and the other two components.
1. Formulate Question
2. Collect Data
3. Analyze
Data
4. Interpret Results

+Statistical Education: A Developmental ProcessThe mature practitioner understands the role of variability in the statistical problem-solving process.
Beginning students cannot be expected to make all of these linkages. They require years of experience and training.
The GAISE Report, therefore, provides a framework for statistical education over three levels for K – 12.
A mature practicing statistician would go beyond these three levels.
+Resources for Deeper Study of Statistics and Probability StandardsSee handout for links to the following resources:
The GAISE Report
Progressions Documents 6 – 8 Statistics and Probability High School Statistics and Probability

+What is Meant by Statistics and Probability?
Julie Conrad
Statistics is the study of what has already happened to find the structure.
Probability is using the structure to predict the future.

+Probability: An essential tool in mathematical modeling and in statistics The use of probability as a mathematical model
and the use of probability as a tool in statistics employ not only different approaches, but also different kinds of reasoning.
Two problems and the nature of the solutions will illustrate the difference…
GAISE Report

+Probability: An essential tool in mathematical modeling and in statistics Problem 1:
Assume a coin is “fair.”
Question: If we toss the coin five times, how many heads will we get?
Problem 2:You pick up a coin.
Question: Is this a fair coin?
Problem 1 is a mathematical probability problem.
Problem 2 is a statistics problem that can use the mathematical
probability model determined in Problem 1 as a tool to seek as solution.
GAISE Report

+Link between Probability and Statistics
Probability shows you the likelihood, or chances, for each of the various future outcomes, based on a set of assumptions about how the world works.
Allows you to handle randomness (uncertainty) in a consistent, rational manner.
Forms the foundation for statistical inference (drawing conclusions from data), sampling, linear regression, forecasting, risk management.

+Link between Probability and Statistics
With Statistics, you go from observed data to generalizing how the world works.
The 7 hottest years on record occurred in
the most recent decade.
There is global warming
Perhaps without
justification
http://pages.stern.nyu.edu/~churvich/Undergrad/Handouts2/07-Prob.pdf

+Link between Probability and StatisticsWith Probability, you start with an assumption about how the world works, and then figure out what kind of data you are likely to see.
Probability provides the justification for statistics.
Probability is the only scientific basis for decision-making in the face of uncertainty.
Assume no global warming.
How likely would we be to get such high temperatures as we have been having?
http://pages.stern.nyu.edu/~churvich/Undergrad/Handouts2/07-Prob.pdf

+Looking at the World through a Statistical Lens
From a statistics lens, if you are given a jar of different colored jelly beans (the world), you won’t be able to see what’s in the jar.
You will use a sampling method to collect information to infer the percentage of each color of jelly beans.
Julie Conrad
In the world of jelly beans
in this jar

+Looking at the World from a Probability Lens
From a probability lens, you know the percentage of each color of jelly beans. (how this world works)
You predict what’s going to happen when you choose one at random.
Julie Conrad
In the world of jelly beans in
this jar, I know that 20% are
red
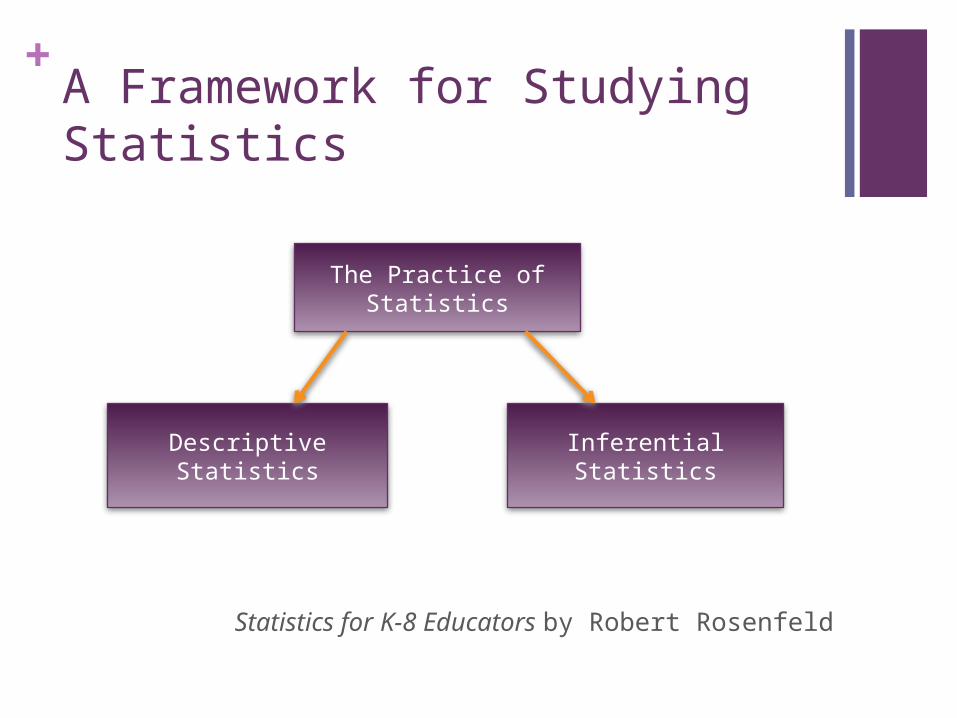
+A Framework for Studying Statistics
Statistics for K-8 Educators by Robert Rosenfeld
The Practice of Statistics
Descriptive Statistics Inferential Statistics

+A Framework for Studying Statistics
Descriptive Statistics
GraphsMeasures of Center
Measures of
Variability
Measures of Relationship
Placement of Individuals
Normal Curve
Statistics for K-8 Educators by Robert Rosenfeld

+A Framework for Studying Statistics
Inferential Statistics
Connections between statistics and
probability
Confidence Intervals
Statistical Significance
Inference and Margin of
ErrorCorrelation
Statistics for K-8 Educators by Robert Rosenfeld
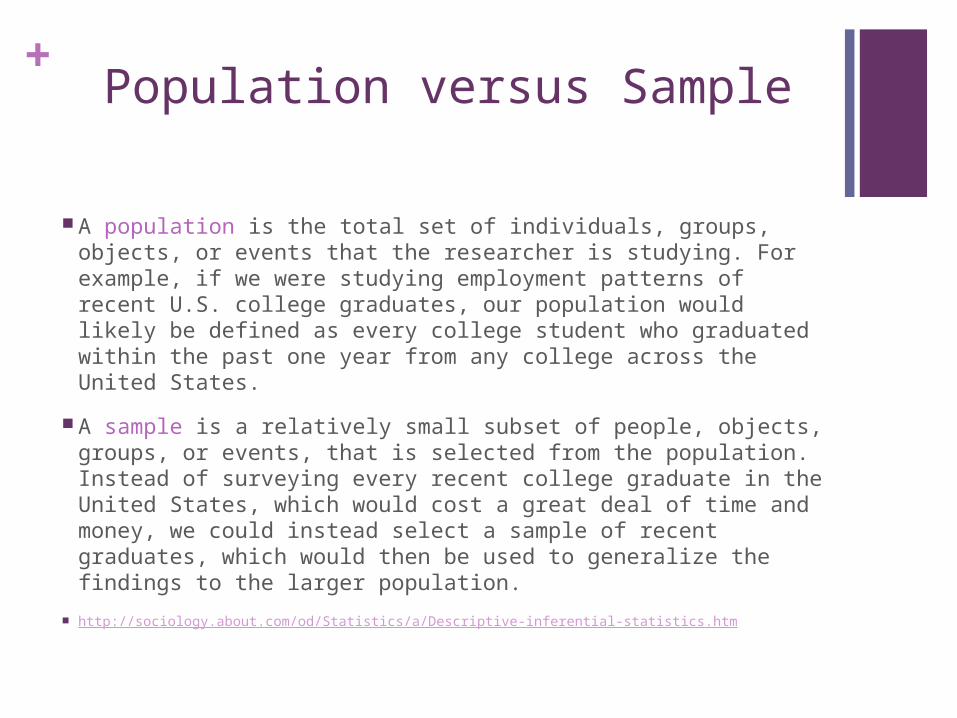
+Population versus Sample
A population is the total set of individuals, groups, objects, or events that the researcher is studying. For example, if we were studying employment patterns of recent U.S. college graduates, our population would likely be defined as every college student who graduated within the past one year from any college across the United States.
A sample is a relatively small subset of people, objects, groups, or events, that is selected from the population. Instead of surveying every recent college graduate in the United States, which would cost a great deal of time and money, we could instead select a sample of recent graduates, which would then be used to generalize the findings to the larger population.
http://sociology.about.com/od/Statistics/a/Descriptive-inferential-statistics.htm

+Descriptive Statistics
Descriptive statistics includes statistical procedures that we use to describe the population we are studying. The data could be collected from either a sample or a population, but the results help us organize and describe data. Descriptive statistics can only be used to describe the group that is being studying. That is, the results cannot be generalized to any larger group.
Descriptive statistics are useful and serviceable if you do not need to extend your results to any larger group. However, much of social sciences tend to include studies that give us “universal” truths about segments of the population, such as all parents, all women, all victims, etc.
http://sociology.about.com/od/Statistics/a/Descriptive-inferential-statistics.htm

+Inferential Statistics
Inferential statistics is concerned with making predictions or inferences about a population from observations and analyses of a sample. That is, we can take the results of an analysis using a sample and can generalize it to the larger population that the sample represents. In order to do this, however, it is imperative that the sample is representative of the group to which it is being generalized.

+Compare and Contrast Different Representations of the Same Data Activity:
Look at the four graphical representations of the same data set on page 42
Compare and contrast the graphs What does each communicate? Which do you think is the best representation of the data?
Justify your answer for why you chose this representation?

+K – 5 Foundation for Statistics
Two paths for K – 5 Data Standards
Categorical DataMeasurement
Data
Sorting
Representing on Bar Graphs
Measuring
Representing on Line Plots
Supports later work
on bivariate data and two-way tables in Grade 8
Supports later work
on histograms and box plots in
MS

+Grade 6 Common Core:Statistics BeginsIn Grades K – 5, students have learned to represent and interpret data using line plots and bar graphs.
6.SP.2 Understand that a set of data collected to answer a statistical question has a distribution which can be described by its center, spread, and overall shape.
Students learn to represent data using
histograms and box plots.

+Common Core Grade 6
Grade 6 Develop understanding of statistical variability.
Understand that a set of data collected to answer a statistical question has a distribution which can be described by its center, spread, and overall shape.
Recognize that a measure of center for a numerical data set summarizes all of its values with a single number (mean, median, mode), while a measure of variation describes how its values vary with a single number (mean absolute deviation or interquartile range).

+Grade 6: Summarize and DescribeDistributionsDescribe Data by Measures of Center: Mean, Median, Mode
Big Idea: You should not decide which measure or measures of center to use until you know the reason you are doing it. Pick one that helps you tell the story of your data. If you have a very small set of data, you may prefer not to do any of them, but just to show all the data
Statistics for K-8 Educators by Robert Rosenfeld

+Grade 6: Summarize and Describe Distributions
Describe Data by Measures of Variation: What is the spread of the data?
Range:
20 – 13 = 7
Interquartile Range:
18 – 16 = 2

+Grade 6: Summarize and DescribeDistributionsDescribe Data by Measures of Variation: How do numbers tend to spread out from the center?
X: 4, 5, 7, 12
Mean = 7
Mean deviations: -3, -2, 0, 5
Absolute values of deviations: 3, 2, 0, 5
Mean absolute deviation: (3 + 2 + 0 + 5)/4 = 10/4 = 2.5
Mean absolute deviation is introduce in Grade 6

+Standard Deviation is not introduced until HS
Another Measures of Variation: How do numbers tend to spread out from the center?
Standard Deviation – also summarizes how the individual numbers in a set differ from the mean, but it is based on the squares of the deviations rather than their absolute values.
X: 4, 5, 7, 12 Standard Deviation is introduced in HS in Common Core
Mean deviations: -3, -2, 0, 5
Squares of the deviations: 9, 4, 0, 25
Mean of the squares: (9 + 4 + 0 + 25)/4 = 38/4 = 9.5
SD = square root (9.5) = 3.089.5 (the square of the SD) is called the variance and is used as a measure of variation in more advanced work

+MAD or SD?
Measures of Variation: Which do I use?
The mean absolute deviation is gaining popularity as the best way to introduce measuring variability in grades K – 12, saving standard deviation for more advanced work.
In research, the mean absolute deviation is often chosen as the measure of variability when the median is used as the measure of center, while the standard deviation is used when the mean is the measure of center.
Statistics for K-8 Educators by Robert Rosenfeld

+Grade 6: Summarize and DescribeDistributionsDescribe Data by Overall shape of data distribution:
Normal DistributionBimodal Distribution
Uniform Distribution
Skewed LeftSkewed Right

+Grade 6: Summarize and DescribeDistributions Display numerical data in plots on a number line,
including dot plots, histograms, and box plots.

+Grade 6: Summarize and DescribeDistributionsSummarize numerical data sets in relation to their context, such as by:
Reporting the number of observations.
Describing the nature of the attribute under investigation,
including how it was measured
and its units of measurement.

+Grade 6: Summarize and DescribeDistributionsSummarize numerical data sets in relation to their context, such as by:
Giving quantitative measures of center (median and/or mean) and variability (interquartile range and/or mean absolute deviation), as well as describing any overall pattern and any striking deviations from the overall pattern with reference to the context in which the data were gathered.

+Grade 6: Summarize and DescribeDistributionsSummarize numerical data sets in relation to their context, such as by:
Relating the choice of measures of center and variability to the shape of the data distribution and the context in which the data were gathered.
Which is the best measure of center for this data set?

+Work and Share
Go to Illustrative Mathematics and check out the illustrations for Grade 6 Statistics and Probability.
Be prepared to share your opinions about the tasks.
+Grade 7: Random Sampling
Understand that: Statistics can be used to gain information
about a population by examining a sample of the population;
Generalizations about a population from a sample are valid only if the sample is representative of that population.
Random sampling tends to produce representative samples and support valid inferences.

+Grade 7: Random Sampling
Use data from a random sample to draw inferences about a population with an unknown characteristic of interest.
Generate multiple samples (or simulated samples) of the same size to gauge the variation in estimates or predictions.
For example:
Estimate the mean word length in a book by randomly sampling words from the book;
Predict the winner of a school election based on randomly sampled survey data. Gauge how far off the estimate or prediction might be.

+Draw informal comparative inferences about two populations.
Informally assess the degree of visual overlap of two numerical data distributions with similar variabilities, measuring the difference between the centers by expressing it as a multiple of a measure of variability.
For example, the mean height of players on the basketball team is 10 cm greater than the mean height of players on the soccer team, about twice the variability (mean absolute deviation) on either team; on a dot plot, the separation between the two distributions of heights is noticeable.

+Draw informal comparative inferences about two populations.
Use measures of center and measures of variability for numerical data from random samples to draw informal comparative inferences about two populations.
For example, decide whether the words in a chapter of a seventh-grade science book are generally longer than the words in a chapter of a fourth-grade science book.

+Probability of a Chance Event is a Number Between 0 and 1 Understand that the probability of a chance event is a
number between 0 and 1 that expresses the likelihood of the event occurring.
Larger numbers indicate greater likelihood.
A probability near 0 indicates an unlikely event, a probability around 1/2 indicates an event that is neither unlikely nor likely, and a probability near 1 indicates a likely event.

+Approximate Probability by Collecting Data, Observing, and Predicting
Approximate the probability of a chance event by collecting data on the chance process that produces it and observing its long-run relative frequency, and predict the approximate relative frequency given the probability.
For example, when rolling a number cube 600 times, predict that a 3 or 6 would be rolled roughly 200 times, but probably not exactly 200 times.

+Develop, Use, and Evaluate Probability Models Develop a probability model and use it to find
probabilities of events. Compare probabilities from a model to observed frequencies; if the agreement is not good, explain possible sources of the discrepancy.
Develop a uniform probability model by assigning equal probability to all outcomes, and use the model to determine probabilities of events.
For example, if a student is selected at random from a class, find the probability that Jane will be selected and the probability that a girl will be selected.

+Develop, Use, and Evaluate Probability Models Develop a probability model (which may not be
uniform) by observing frequencies in data generated from a chance process.
For example, find the approximate probability that a spinning penny will land heads up or that a tossed paper cup will land open-end down.
Do the outcomes for the spinning penny appear to be equally likely based on the observed frequencies?

+Probability of Compound EventsUsing Organized Lists, Tables, Tree Diagrams, Simulation Understand that, just as with simple events, the probability of a
compound event is the fraction of outcomes in the sample space for which the compound event occurs.
Represent sample spaces for compound events using methods such as organized lists, tables and tree diagrams. For an event described in everyday language (e.g., “rolling double sixes”), identify the outcomes in the sample space which compose the event.
Design and use a simulation to generate frequencies for compound events.
For example, use random digits as a simulation tool to approximate the answer to the question: If 40% of donors have type A blood, what is the probability that it will take at least 4 donors to find one with type A blood?
+Work and Share
Go to Illustrative Mathematics and check out the illustrations for Grade 7 Statistics and Probability.
Be prepared to share your opinions about the tasks.

+Grade 8:Investigate patterns of association in bivariate data. Construct and interpret scatter plots for bivariate
measurement data to investigate patterns of association between two quantities.
Describe patterns such as clustering, outliers, positive or negative association, linear association, and nonlinear association.

+Grade 8:Investigate patterns of association in bivariate data. Know that straight lines are widely used to model
relationships between two quantitative variables.
For scatter plots that suggest a linear association, informally fit a straight line, and informally assess the model fit by judging the closeness of the data points to the line.

+Grade 8:Investigate patterns of association in bivariate data. Students in Grade 8 study linear functions, which gives them experience with the concept of m and b in of f(x) = mx + b
Use the equation of a linear model to solve problems in the context of bivariate measurement data, interpreting the slope and intercept.
For example, in a linear model for a biology experiment, interpret a slope of 1.5 cm/hr as meaning that an additional hour of sunlight each day is associated with an additional 1.5 cm in mature plant height.

+Grade 8:Investigate patterns of association in bivariate data.
Understand that patterns of association can also be seen in bivariate categorical data by displaying frequencies and relative frequencies in a two-way table.
Construct and interpret a two-way table summarizing data on two categorical variables collected from the same subjects.
Use relative frequencies calculated for rows or columns to describe possible association between the two variables.
For example, collect data from students in your class on whether or not they have a curfew on school nights and whether or not they have assigned chores at home. Is there evidence that those who have a curfew also tend to have chores?

+Work and Share
Go to Illustrative Mathematics and check out the illustrations for Grade 8 Statistics and Probability.
Be prepared to share your opinions about the tasks.

+HS Statistical Analysis
Teaching Channel Video
Statistical Analysis Lesson to Rank Baseball Players

+HS Common CoreStatistics and Probability Domains
Interpreting Categorical and Quantitative Data (S-ID)
Making Inferences and Justifying Conclusions (S-IC)
Conditional Probability and the Rules of Probability (S-CP)
Using Probability to Make Decisions (S-MD)

+Interpreting Categorical and Quantitative Data (S-ID)
Summarize, represent, and interpret data on a single count or measurement variable
dot plots, histograms, and box plots
Use statistics appropriate to the shape of the data distribution to compare center (median, mean) and spread (interquartile range, standard deviation) of two or more different data sets.
Interpret differences in shape, center, and spread in the context of the data sets, accounting for possible effects of extreme data points (outliers).

+Interpreting Categorical and Quantitative Data (S-ID)
Summarize, represent, and interpret data on a single count or measurement variable
Use the mean and standard deviation of a data set to fit it to a normal distribution and to estimate population percentages.
Recognize that there are data sets for which such a procedure is not appropriate.
Use calculators, spreadsheets, and tables to estimate areas under the normal curve.
+Interpreting Categorical and Quantitative Data (S-ID)
Summarize, represent, and interpret data on two categorical and quantitative variables
Summarize categorical data for two categories in two-way frequency tables.
Interpret relative frequencies in the context of the data (including joint, marginal, and conditional relative frequencies).
Recognize possible associations and trends in the data.

+Interpreting Categorical and Quantitative Data (S-ID)
Summarize, represent, and interpret data on two categorical and quantitative variables
Represent data on two quantitative variables on a scatter plot, and describe how the variables are related.
Fit a function to the data; use functions fitted to data to solve problems in the context of the data.
Use given functions or choose a function suggested by the context. Emphasize linear, quadratic, and exponential models. Informally assess the fit of a function by plotting and analyzing
residuals. Fit a linear function for a scatter plot that suggests a linear
association.

+Interpreting Categorical and Quantitative Data (S-ID)
Interpret Linear Models
Interpret the slope (rate of change) and the intercept (constant term) of a linear model in the context of the data.
Compute (using technology) and interpret the correlation coefficient of a linear fit.
Distinguish between correlation and causation.

+Correlation and Causation
TED Talk on Correlation and Causation

+Making Inferences and Justifying Conclusions (S-IC)
Understand and evaluate random processes underlying statistical experiments
Understand statistics as a process for making inferences about population parameters based on a random sample from that population.
Decide if a specified model is consistent with results from a given data-generating process, e.g., using simulation.
For example, a model says a spinning coin falls heads up with probability 0.5. Would a result of 5 tails in a row cause you to question the model?

+Making Inferences and Justifying Conclusions (S-IC)
Make inferences and justify conclusions from sample surveys, experiments, and observational studies
Recognize the purposes of and differences among sample surveys, experiments, and observational studies; explain how randomization relates to each.
Use data from a sample survey to estimate a population mean or proportion; develop a margin of error through the use of simulation models for random sampling.

+Making Inferences and Justifying Conclusions (S-IC)
Make inferences and justify conclusions from sample surveys, experiments, and observational studies
Use data from a randomized experiment to compare two treatments; use simulations to decide if differences between parameters are significant.
Evaluate reports based on data.
+Conditional Probability and Rules of Probability (S-CP)
Understand independence and conditional probability and use them to interpret data
Describe events as subsets of a sample space (the set of outcomes) using characteristics (or categories) of the outcomes, or as unions, intersections, or complements of other events (“or,” “and,” “not”).
Understand that two events A and B are independent if the probability of A and B occurring together is the product of their probabilities, and use this characterization to determine if they are independent.

+Conditional Probability and Rules of Probability (S-CP)
Understand independence and conditional probability and use them to interpret data
Understand the conditional probability of A given B as P(A and B)/P(B), and interpret independence of A and B as saying that the conditional probability of A given B is the same as the probability of A, and the conditional probability of B given A is the same as the probability of B.

+Conditional Probability and Rules of Probability (S-CP)
Understand independence and conditional probability and use them to interpret data
Today there is a 55% chance of rain, a 20% chance of lightning, and a 15% chance of lightning and rain together. Are the two events “rain today” and ”lightning today” independent events? Justify your answer.
Now suppose that today there is a 60% chance of rain, a 15% chance of lightning, and a 20% chance of lightning if it’s raining. What is the chance of both rain and lightning today?
Now suppose that today there is a 55% chance of rain, a 20% chance of lightning, and a 15% chance of lightning and rain. What is the chance that we will have rain or lightning today?
Now suppose that today there is a 50% chance of rain, a 60% chance of rain or lightning, and a 15% chance of rain and lightning. What is the chance that we will have lightning today?

+Conditional Probability and Rules of Probability (S-CP)
Understand independence and conditional probability and use them to interpret data
Construct and interpret two-way frequency tables of data when two categories are associated with each object being classified.
Use the two-way table as a sample space to decide if events are independent and to approximate conditional probabilities.
For example, collect data from a random sample of students in your school on their favorite subject among math, science, and English.

+Conditional Probability and Rules of Probability (S-CP)
Understand independence and conditional probability and use them to interpret data
Estimate the probability that a randomly selected student from your school will favor science given that the student is in tenth grade.
Do the same for other subjects and compare the results.
Recognize and explain the concepts of conditional probability and independence in everyday language and everyday situations.
For example, compare the chance of having lung cancer if you are a smoker with the chance of being a smoker if you have lung cancer.

+Conditional Probability and Rules of Probability (S-CP)
Use the rules of probability to compute probabilities of compound events in a uniform probability model
Find the conditional probability of A given B as the fraction of B's outcomes that also belong to A, and interpret the answer in terms of the model.
Apply the Addition Rule, P(A or B)=P(A)+P(B)−P(A and B), and interpret the answer in terms of the model.

+Conditional Probability and Rules of Probability (S-CP)
Use the rules of probability to compute probabilities of compound events in a uniform probability model
Honors or Year 4
(+) Apply the general Multiplication Rule in a uniform probability model, P(A and B)=P(A)P(B|A)=P(B)P(A|B), and interpret the answer in terms of the model.
(+) Use permutations and combinations to compute probabilities of compound events and solve problems.

+Using Probability to Make Decisions (S-MD)
Calculate Expected Values and Use Them to Solve Problems
All of the Standards in this Domain are for Honors Students or Year 4 Classes. They will not be assessed by SBAC.

+Work and Share
Go to Illustrative Mathematics and check out the illustrations for HS Statistics and Probability.
Be prepared to share your opinions about the tasks.

+Essential Questions Revisited
How do we organize data so we can describe it?
What is an adequate description of data?How do we interpret and analyze data?How is statistics different from
mathematics?Why is probability so closely linked to
statistics?
Related Documents