Action Plan for Industrial Cluster in Severely Polluted Areas Monitoring, sampling, analysis of Stack, Ambient Air Quality, Surface Water, Ground Water, Waste Water चब ू र Chembur February, 2019

Welcome message from author
This document is posted to help you gain knowledge. Please leave a comment to let me know what you think about it! Share it to your friends and learn new things together.
Transcript
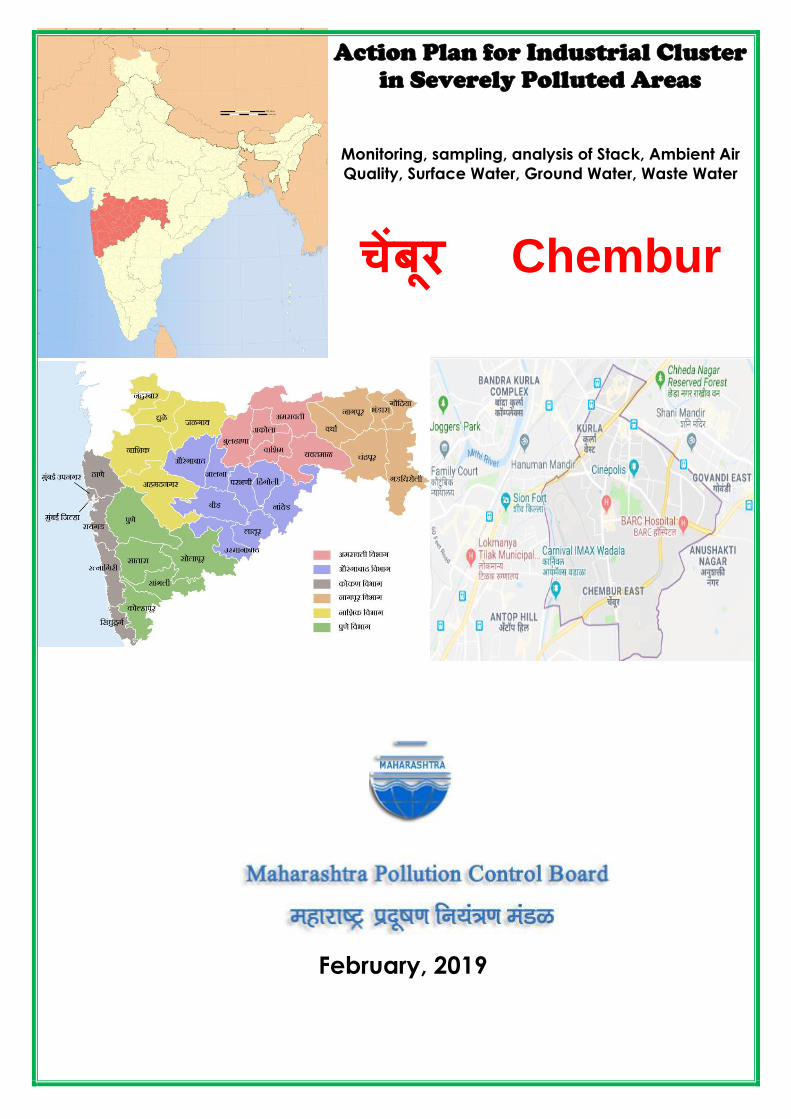
Action Plan for Industrial Cluster
in Severely Polluted Areas
Monitoring, sampling, analysis of Stack, Ambient Air
Quality, Surface Water, Ground Water, Waste Water
चेंबूर Chembur
February, 2019
Severely Polluted Areas: Monitoring, sampling, analysis of Stack, Ambient Air Quality, Surface Water, Ground Water, Waste Water
Chembur 2
Index
Acknowledgement: ............................................................................................. 3
Abbreviations: ................................................................................................... 4
1. Introduction: ............................................................................................. 5
2. Scope of Work ............................................................................................ 6
2.1 Stack Emission Parameters ....................................................................... 6
2.2 Ambient Air Quality Parameters ................................................................ 7
2.3 Water/Waste Water Parameters ................................................................ 7
2.4 Methodology followed in Sampling and Analysis ........................................ 10
3. Result of Analysis: ................................................................................... 10
3.1 Stack Emission: .................................................................................... 10
3.2 Ambient Air Quality: .............................................................................. 12
3.3 Water/ Waste Water Quality: .................................................................. 17
3.4 Ground Water Quality: ........................................................................... 28
4. Summary of the results ............................................................................ 37
4.1 Stack Emission Monitoring: ..................................................................... 37
4.2 Ambient Air Quality Monitoring: .............................................................. 37
4.3 Waste Water Quality Monitoring: ............................................................. 38
4.4 Ground Water Quality Monitoring: ........................................................... 39
5. CEPI Score ............................................................................................... 40
5.1 Comparison of CEPI scores: .................................................................... 42
6. Conclusion ............................................................................................... 44
7. Efforts taken for reduction in pollution .................................................... 46
8. Photographs ............................................................................................ 48
9. References ............................................................................................... 51
10. Annexure ................................................................................................. 52
Annexure I Health related data in impact on humans ............................................ 52
Annexure II: Stack Emission Sampling and Analysis Methodology ........................... 53
Annexure III: Ambient Air Sampling and Analysis Methodology .............................. 55
Annexure IV: Water/Wastewater Sampling and Analysis Methodology ..................... 57
Annexure V: National Ambient Air Quality Standards, 2009 .................................... 61
Annexure VI: General Standards for Discharge of Environmental Pollutants, Part A:
Effluents (The Environment (Protection) Rules, 1986, Schedule VI) ......................... 62
Annexure VII: Drinking Water Specification-IS 10500:2012 ................................... 66
Annexure VIII: CPCB Water Quality Criteria: ........................................................ 70
Annexure IX: Water Quality Parameters Requirements and Classification ................. 71
Severely Polluted Areas: Monitoring, sampling, analysis of Stack, Ambient Air Quality, Surface Water, Ground Water, Waste Water
Chembur 3
Acknowledgement:
We gratefully acknowledge E. Ravendiran, Member Secretary, Maharashtra Pollution
Control Board, for entrusting this very important and prestigious project to us.
Our special thanks are to Regional and Sub Regional Officer of the concerned areas, for
guidance during the sampling. The contribution of Shri V. M Motghare (Joint director
APC) and Mr. Sameer Hundlekar (Field officer) is appreciated.
We would also like to extend our thanks to the concerned staff of Regional Hospitals,
who has provided us the health data, which is the most important component of this
revised concept of CEPI.
By undertaking this project and completing in schedule time, we consider ourselves very
lucky since we have helped the mankind by giving the data on pollution load and further
action by the Board, to bring down the pollution level.
We also thank our associates for working on this project for making the write up, making
graphs and feeding the data on computer.
This acknowledgement will be incomplete if we do not thank our laboratory analysts and
others who made this project a success by timely analysing the samples.
We also thank our sampling team members for conducting the sampling in this vast
area.
Severely Polluted Areas: Monitoring, sampling, analysis of Stack, Ambient Air Quality, Surface Water, Ground Water, Waste Water
Chembur 4
Abbreviations:
APHA American Public Health Association
BDL Below Detection Limit
BOD Biochemical Oxygen Demand
CEPI Comprehensive Environmental Pollution Index
CETP Common Effluent Treatment Plant
COD Chemical Oxygen Demand
CPA Critically Polluted Areas
SPA Severely Polluted Areas
DO Dissolved Oxygen
ETP Effluent Treatment Plant
MIBK Methyl Isobutyl Ketone
MPCB Maharashtra Pollution Control Board
NAAQS National Ambient Air Quality Standards
NOx Oxides of Nitrogen
ND Not Detected
PAH Poly Aromatic Hydrocarbons
PCB Poly Chlorinated Biphenyls
PCT Poly Chlorinated Terphenyls
PM10 Particulate Matter (size less than 10 µm)
PM2.5 Particulate Matter (size less than 2.5 µm)
SO2 Sulphur Dioxide
STAP Short Term Action Plan
WHO World Health Organization
Severely Polluted Areas: Monitoring, sampling, analysis of Stack, Ambient Air Quality, Surface Water, Ground Water, Waste Water
Chembur 5
1. Introduction:
Although industries contribute significantly to India’s economic growth and
development, the increase in pollution of land, water, air, noise and resulting
degradation of environment that they have caused, cannot be overlooked. Industries
are responsible for four types of pollution: a) Air b) water c) land d) noise. Rapid
industrialization carries with it the seeds of environmental damage. Pollution of natural
environment not only affects people but also have adverse impact on economic growth
in the long run. Analysis of pollution load shows that there are few industries in the
country which contribute to more than 90percent of the pollution. Hence, scientists are
exploring the quantum of pollution load as well as to device certain strategies and
technologies so that our sustainable development would not be jeopardized otherwise
our long cherished dream of establishing eco-socialism on this watery planet could not
come true.
Industrial pollution takes on many faces. It contaminates many sources of drinking
water, releases unwanted toxins into the air and reduces the quality of soil all over the
world. Every litre of waste water discharged by our industries pollute eight times the
quantity of fresh water. The extent of pollution varies with the size of the industry, the
nature of the industry, the type of products used and produced etc. In view of this,
Central Pollution Control Board (CPCB) has evolved the concept of Comprehensive
Environmental Pollution Index (CEPI) during 2009-10 as a tool for comprehensive
environmental assessment of prominent industrial clusters and formulation of remedial
Action Plans for the identified critically polluted areas. Later-on proposals were received
from the SPCBs, State Governments, and Industrial Associations and concerned Stake-
holders for revisiting the criteria of assessment under CEPI concept. After careful
examination and consideration of the suggestions of concerned stake-holders, it was
decided to prepare the revised concept of CEPI by eliminating the subjective factors but
retaining the factors which can be measured precisely. Hence, revised concept came into
existence, which is termed as Revised CEPI Version 2016.
The present report is also based on the revised CEPI version 2016. The results of the
application of the Comprehensive Environmental Pollution Index (CEPI) to selected
industrial clusters or areas are presented in this report. The main objective of the study
is to identify polluted industrial clusters or areas in order to take concerted action and to
centrally monitor them at the national level to improve the current status of their
environmental components such as air and water quality data, ecological damage, and
visual environmental conditions. A total of 88 industrial areas or clusters have been
selected by the Central Pollution Control Board (CPCB) in consultation with the Ministry
of Environment & Forests Government of India for the study. The index captures the
various dimensions of environment including air, water and land. Comprehensive
Environmental Pollution Index (CEPI), which is a rational number to characterize the
environmental quality at a given location following the algorithm of source, pathway and
receptor have been developed.
Chembur is a suburb in eastern Mumbai, India. Chembur has pollution problems and was
ranked 46th in a list of the most polluted industrial clusters in India. Effluents from oil
refineries, fertilizer plants and reactors located in Chembur are also said to have polluted
sea water in Thane Creek and affected marine life. The Deonar dumping ground in
Deonar has caused health issues for the residents of Chembur. In 2008, around 40
residents of Chembur went on a hunger strike to protest against the frequent fires and
smoke. Again in 2012, the residents complained to the Brihanmumbai Municipal
Corporation on the smoke coming out of the dumping ground, which has been affecting
asthma patients.
Severely Polluted Areas: Monitoring, sampling, analysis of Stack, Ambient Air Quality, Surface Water, Ground Water, Waste Water
Chembur 6
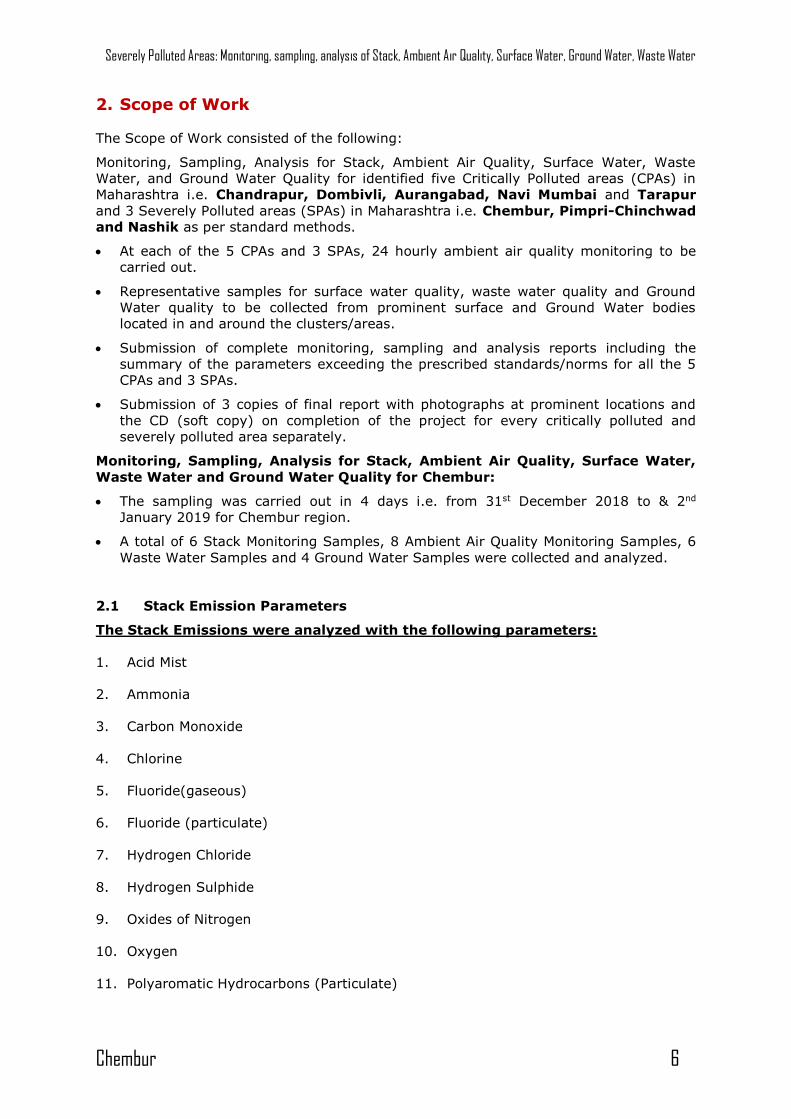
2. Scope of Work
The Scope of Work consisted of the following:
Monitoring, Sampling, Analysis for Stack, Ambient Air Quality, Surface Water, Waste
Water, and Ground Water Quality for identified five Critically Polluted areas (CPAs) in
Maharashtra i.e. Chandrapur, Dombivli, Aurangabad, Navi Mumbai and Tarapur
and 3 Severely Polluted areas (SPAs) in Maharashtra i.e. Chembur, Pimpri-Chinchwad
and Nashik as per standard methods.
At each of the 5 CPAs and 3 SPAs, 24 hourly ambient air quality monitoring to be
carried out.
Representative samples for surface water quality, waste water quality and Ground
Water quality to be collected from prominent surface and Ground Water bodies
located in and around the clusters/areas.
Submission of complete monitoring, sampling and analysis reports including the
summary of the parameters exceeding the prescribed standards/norms for all the 5
CPAs and 3 SPAs.
Submission of 3 copies of final report with photographs at prominent locations and
the CD (soft copy) on completion of the project for every critically polluted and
severely polluted area separately.
Monitoring, Sampling, Analysis for Stack, Ambient Air Quality, Surface Water,
Waste Water and Ground Water Quality for Chembur:
The sampling was carried out in 4 days i.e. from 31st December 2018 to & 2nd
January 2019 for Chembur region.
A total of 6 Stack Monitoring Samples, 8 Ambient Air Quality Monitoring Samples, 6
Waste Water Samples and 4 Ground Water Samples were collected and analyzed.
2.1 Stack Emission Parameters
The Stack Emissions were analyzed with the following parameters:
1. Acid Mist
2. Ammonia
3. Carbon Monoxide
4. Chlorine
5. Fluoride(gaseous)
6. Fluoride (particulate)
7. Hydrogen Chloride
8. Hydrogen Sulphide
9. Oxides of Nitrogen
10. Oxygen
11. Polyaromatic Hydrocarbons (Particulate)
Severely Polluted Areas: Monitoring, sampling, analysis of Stack, Ambient Air Quality, Surface Water, Ground Water, Waste Water
Chembur 7
12. Suspended Particulate Matter
13. Sulphur Dioxide
14. Benzene
15. Toluene
16. Xylene
17. Volatile Organic Compounds (VOCs)
2.2 Ambient Air Quality Parameters
The Ambient Air Quality was analyzed with the following parameters:
1. Sulphur Dioxide (SO2)
2. Nitrogen Dioxide (NO2)
3. Particulate Matter (PM10)
4. Particulate Matter (PM2.5)
5. Ozone (O3)
6. Lead (Pb)
7. Carbon Monoxide (CO)
8. Ammonia (NH3)
9. Benzene (C6H6)
10. Benzo (a) Pyrene (BaP) (Particulate Phase Only)
11. Arsenic (As)
12. Nickel (Ni)
2.3 Water/Waste Water Parameters
The Water/Waste Water was analyzed with the following parameters:
a. Prominent Surface Water bodies such as outfalls of CETPs, ETPs, treated effluent
drainage, river, canal, ponds, lakes and other such water supply resources flowing
through the area or flowing adjoining the CPA.
b. Ground Water Quality data of prominent ground water resources such as observation
wells of Central Ground Water Board, drinking water wells, hand pumps, bore wells,
hand pumps, bore wells and other such water supply resources located in the
industrial cluster/area under consideration or in the peripheral areas.
Severely Polluted Areas: Monitoring, sampling, analysis of Stack, Ambient Air Quality, Surface Water, Ground Water, Waste Water
Chembur 8
Basic water quality parameters for surface water and ground water both are as
follows:
i. Simple Parameters:
1. Sanitary Survey
2. General Appearance
3. Colour
4. Smell
5. Transparency
6. Ecological(Presence of animals like fish, insects) (Applicable to only surface water)
ii. Regular Monitoring Parameters:
7. pH
8. Oil & Grease
9. Suspended Solids
10. Dissolved Oxygen (% saturation) (Not applicable for ground waters)
11. Chemical Oxygen Demand
12. Biochemical Oxygen Demand
13. Electrical Conductivity
14. Nitrite-Nitrogen
15. Nitrate-Nitrogen
16. (NO2 + NO3)-Nitrogen
17. Free Ammonia
18. Total Residual Chlorine
19. Cyanide
20. Fluoride
21. Sulphide
Severely Polluted Areas: Monitoring, sampling, analysis of Stack, Ambient Air Quality, Surface Water, Ground Water, Waste Water
Chembur 9
22. Dissolved Phosphate
23. Sodium Absorption Ratio (SAR)
24. Total Coliforms (MPN/100 ml)
25. Faecal Coliforms (MPN/100 ml)
iii. Special Parameters:
26. Total Phosphorous
27. Total Kjeldahl Nitrogen(TKN)
28. Total Ammonia (NH4 +NH3)-Nitrogen
29. Phenols
30. Surface Active Agents
31. Organo Chlorine Pesticides
32. Polynuclear aromatic hydrocarbons (PAH)
33. Polychlorinated Biphenyls (PCB)and Polychlorinated Terphenyls (PCT)
34. Zinc
35. Nickel
36. Copper
37. Hexavalent Chromium
38. Chromium (Total)
39. Arsenic (Total)
40. Lead
41. Cadmium
42. Mercury
43. Manganese
44. Iron
Severely Polluted Areas: Monitoring, sampling, analysis of Stack, Ambient Air Quality, Surface Water, Ground Water, Waste Water
Chembur 10
45. Vanadium
46. Selenium
47. Boron
iv. Bioassay (Zebra Fish) Test: For specified samples only.
2.4 Methodology followed in Sampling and Analysis
Industries, places and locations that have been chosen for the sampling are
representative of the city/area. Sampling has been done at the potential polluted areas
so as to arrive at the CEPI. This will further help the authorities to monitor the areas in
order to improve the current status of their environmental components such as air and
water quality data, ecological damage and visual environmental conditions. Methodology
for sampling, preservation and analysis have been done according to the references
incorporated. Methodology of various types of parameters is presented under following
annexure:
1. Stack Emission Sampling and Analysis Methodology – Annexure II
2. Ambient Air Sampling and Analysis Methodology - Annexure III
3. Water/Wastewater Sampling and Analysis Methodology - Annexure IV
3. Result of Analysis:
Results of Analysis are tabulated below for Stack Emission Monitoring, Ambient Air
Quality Monitoring, Waste Water Analysis and Water Analysis. These are followed by
their respective graphical representation.
Kindly note:
NA specifies the sample is not analysed for the specific parameter.
ND specifies that even though the sample was analysed for the parameter, it was
not detected.
BDL specifies that the result obtained is below detection limit.
Please Note: Industrial clusters observed with below detection limit parameters are NOT included in the graphs
3.1 Stack Emission:
Stack Emission Monitoring Results are compared against The Environment (Protection)
Rules, 1986 General Emission Standard - Part D.
Sr. Name of Industry Stack Identity Table No.
1. Bharat Petroleum Corporation Ltd. CCR HRSG -101
F2001 I
2. RCF Mahul Stack 2 I
3. RCF Mahul Stack 1 I
Severely Polluted Areas: Monitoring, sampling, analysis of Stack, Ambient Air Quality, Surface Water, Ground Water, Waste Water
Chembur 11
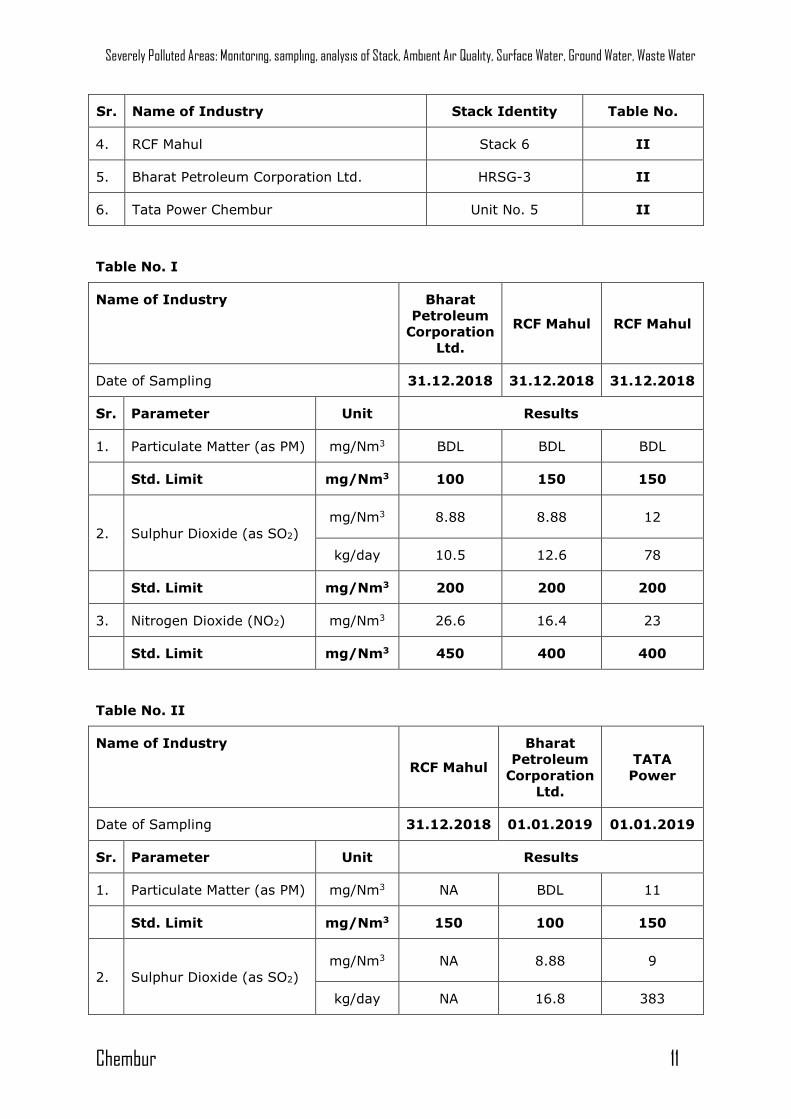
Sr. Name of Industry Stack Identity Table No.
4. RCF Mahul Stack 6 II
5. Bharat Petroleum Corporation Ltd. HRSG-3 II
6. Tata Power Chembur Unit No. 5 II
Table No. I
Name of Industry Bharat
Petroleum
Corporation
Ltd.
RCF Mahul RCF Mahul
Date of Sampling 31.12.2018 31.12.2018 31.12.2018
Sr. Parameter Unit Results
1. Particulate Matter (as PM) mg/Nm3 BDL BDL BDL
Std. Limit mg/Nm3 100 150 150
2. Sulphur Dioxide (as SO2)
mg/Nm3 8.88 8.88 12
kg/day 10.5 12.6 78
Std. Limit mg/Nm3 200 200 200
3. Nitrogen Dioxide (NO2) mg/Nm3 26.6 16.4 23
Std. Limit mg/Nm3 450 400 400
Table No. II
Name of Industry
RCF Mahul
Bharat
Petroleum
Corporation
Ltd.
TATA
Power
Date of Sampling 31.12.2018 01.01.2019 01.01.2019
Sr. Parameter Unit Results
1. Particulate Matter (as PM) mg/Nm3 NA BDL 11
Std. Limit mg/Nm3 150 100 150
2. Sulphur Dioxide (as SO2)
mg/Nm3 NA 8.88 9
kg/day NA 16.8 383
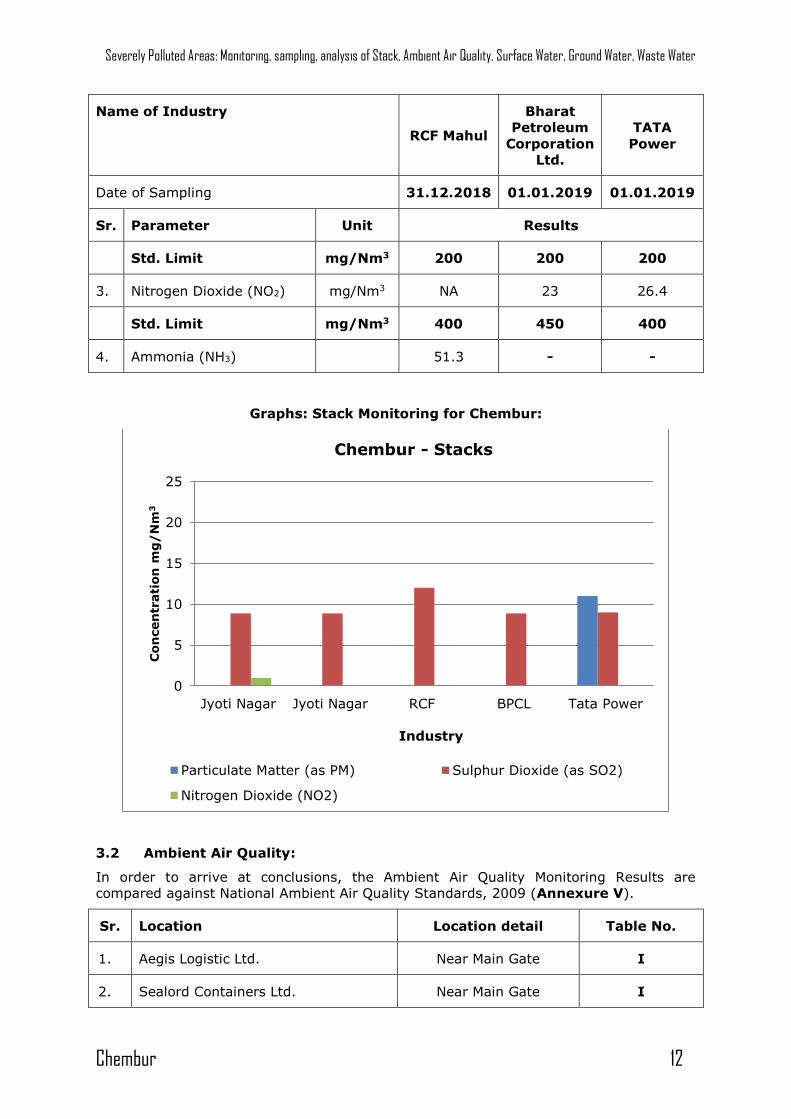
Severely Polluted Areas: Monitoring, sampling, analysis of Stack, Ambient Air Quality, Surface Water, Ground Water, Waste Water
Chembur 12
Name of Industry
RCF Mahul
Bharat
Petroleum
Corporation
Ltd.
TATA
Power
Date of Sampling 31.12.2018 01.01.2019 01.01.2019
Sr. Parameter Unit Results
Std. Limit mg/Nm3 200 200 200
3. Nitrogen Dioxide (NO2) mg/Nm3 NA 23 26.4
Std. Limit mg/Nm3 400 450 400
4. Ammonia (NH3) 51.3 - -
Graphs: Stack Monitoring for Chembur:
3.2 Ambient Air Quality:
In order to arrive at conclusions, the Ambient Air Quality Monitoring Results are
compared against National Ambient Air Quality Standards, 2009 (Annexure V).
Sr. Location Location detail Table No.
1. Aegis Logistic Ltd. Near Main Gate I
2. Sealord Containers Ltd. Near Main Gate I
0
5
10
15
20
25
Jyoti Nagar Jyoti Nagar RCF BPCL Tata Power
Con
cen
trati
on
mg
/N
m3
Industry
Chembur - Stacks
Particulate Matter (as PM) Sulphur Dioxide (as SO2)
Nitrogen Dioxide (NO2)
Severely Polluted Areas: Monitoring, sampling, analysis of Stack, Ambient Air Quality, Surface Water, Ground Water, Waste Water
Chembur 13
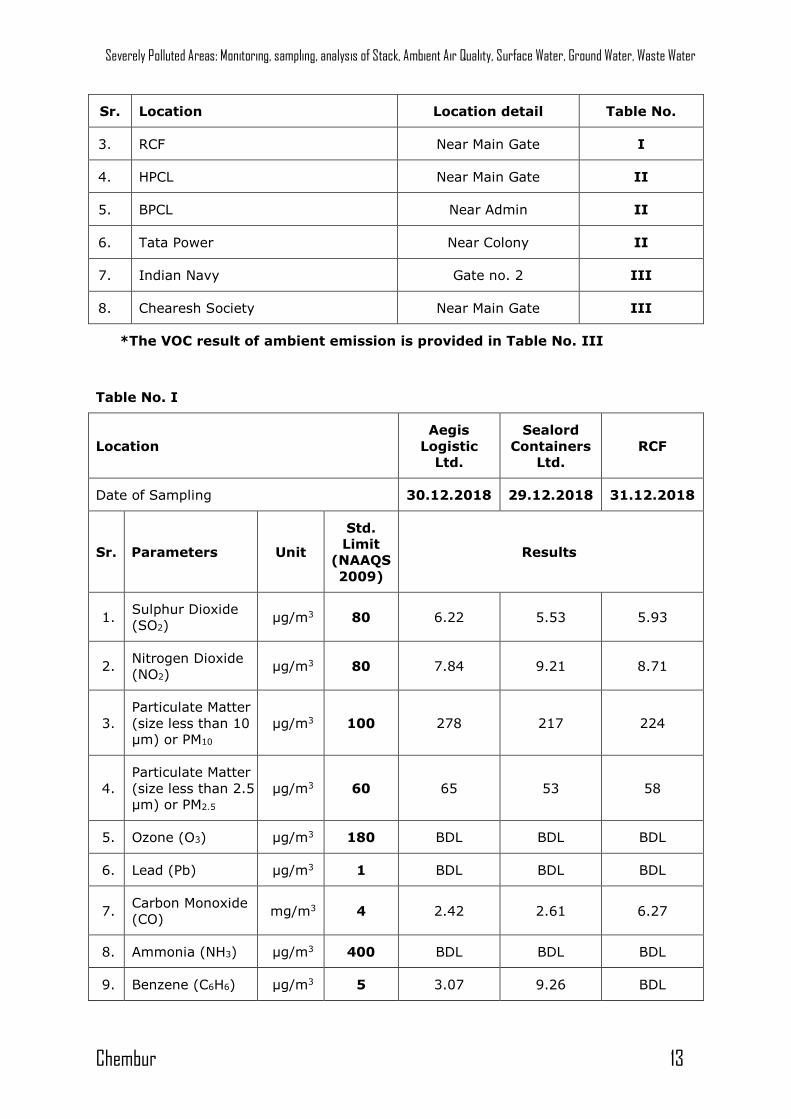
Sr. Location Location detail Table No.
3. RCF Near Main Gate I
4. HPCL Near Main Gate II
5. BPCL Near Admin II
6. Tata Power Near Colony II
7. Indian Navy Gate no. 2 III
8. Chearesh Society Near Main Gate III
*The VOC result of ambient emission is provided in Table No. III
Table No. I
Location
Aegis
Logistic
Ltd.
Sealord
Containers
Ltd.
RCF
Date of Sampling 30.12.2018 29.12.2018 31.12.2018
Sr. Parameters Unit
Std.
Limit
(NAAQS
2009)
Results
1. Sulphur Dioxide
(SO2) µg/m3 80 6.22 5.53 5.93
2. Nitrogen Dioxide
(NO2) µg/m3 80 7.84 9.21 8.71
3.
Particulate Matter
(size less than 10
µm) or PM10
µg/m3 100 278 217 224
4.
Particulate Matter
(size less than 2.5
µm) or PM2.5
µg/m3 60 65 53 58
5. Ozone (O3) µg/m3 180 BDL BDL BDL
6. Lead (Pb) µg/m3 1 BDL BDL BDL
7. Carbon Monoxide
(CO) mg/m3 4 2.42 2.61 6.27
8. Ammonia (NH3) µg/m3 400 BDL BDL BDL
9. Benzene (C6H6) µg/m3 5 3.07 9.26 BDL
Severely Polluted Areas: Monitoring, sampling, analysis of Stack, Ambient Air Quality, Surface Water, Ground Water, Waste Water
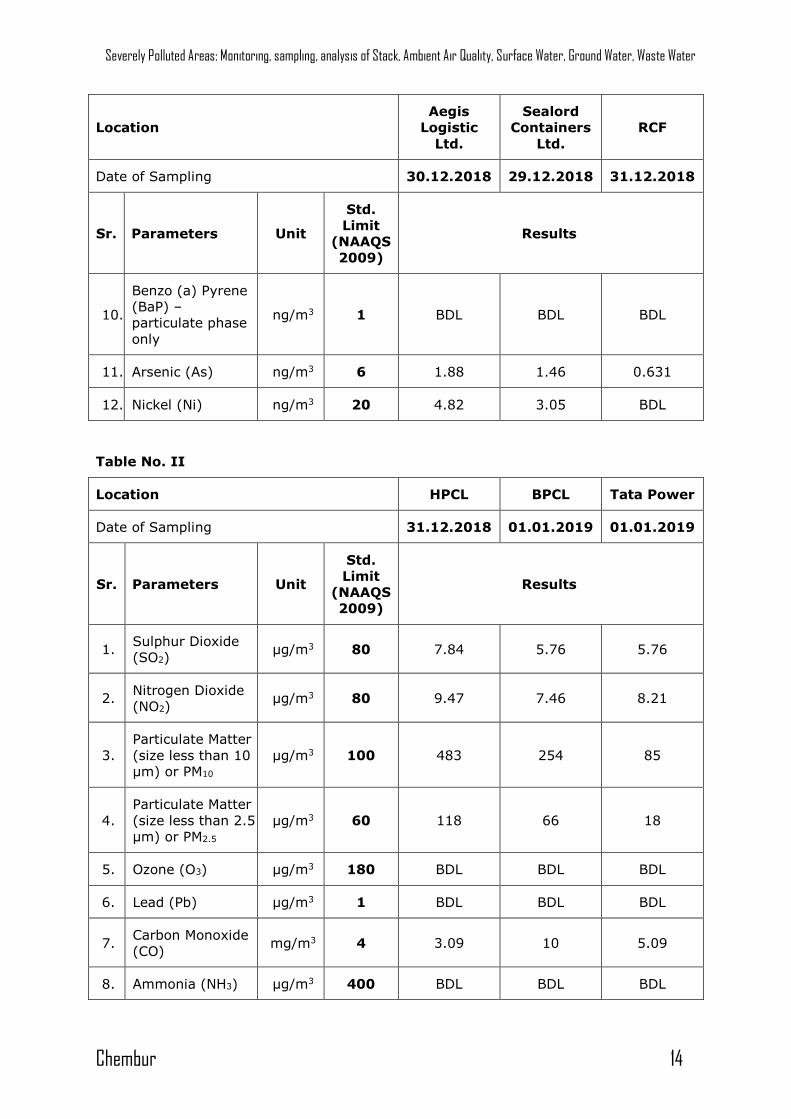
Chembur 14
Location
Aegis
Logistic
Ltd.
Sealord
Containers
Ltd.
RCF
Date of Sampling 30.12.2018 29.12.2018 31.12.2018
Sr. Parameters Unit
Std.
Limit
(NAAQS
2009)
Results
10.
Benzo (a) Pyrene
(BaP) –
particulate phase
only
ng/m3 1 BDL BDL BDL
11. Arsenic (As) ng/m3 6 1.88 1.46 0.631
12. Nickel (Ni) ng/m3 20 4.82 3.05 BDL
Table No. II
Location HPCL BPCL Tata Power
Date of Sampling 31.12.2018 01.01.2019 01.01.2019
Sr. Parameters Unit
Std.
Limit
(NAAQS
2009)
Results
1. Sulphur Dioxide
(SO2) µg/m3 80 7.84 5.76 5.76
2. Nitrogen Dioxide
(NO2) µg/m3 80 9.47 7.46 8.21
3.
Particulate Matter
(size less than 10
µm) or PM10
µg/m3 100 483 254 85
4.
Particulate Matter
(size less than 2.5
µm) or PM2.5
µg/m3 60 118 66 18
5. Ozone (O3) µg/m3 180 BDL BDL BDL
6. Lead (Pb) µg/m3 1 BDL BDL BDL
7. Carbon Monoxide
(CO) mg/m3 4 3.09 10 5.09
8. Ammonia (NH3) µg/m3 400 BDL BDL BDL
Severely Polluted Areas: Monitoring, sampling, analysis of Stack, Ambient Air Quality, Surface Water, Ground Water, Waste Water
Chembur 15
Location HPCL BPCL Tata Power
Date of Sampling 31.12.2018 01.01.2019 01.01.2019
Sr. Parameters Unit
Std.
Limit
(NAAQS
2009)
Results
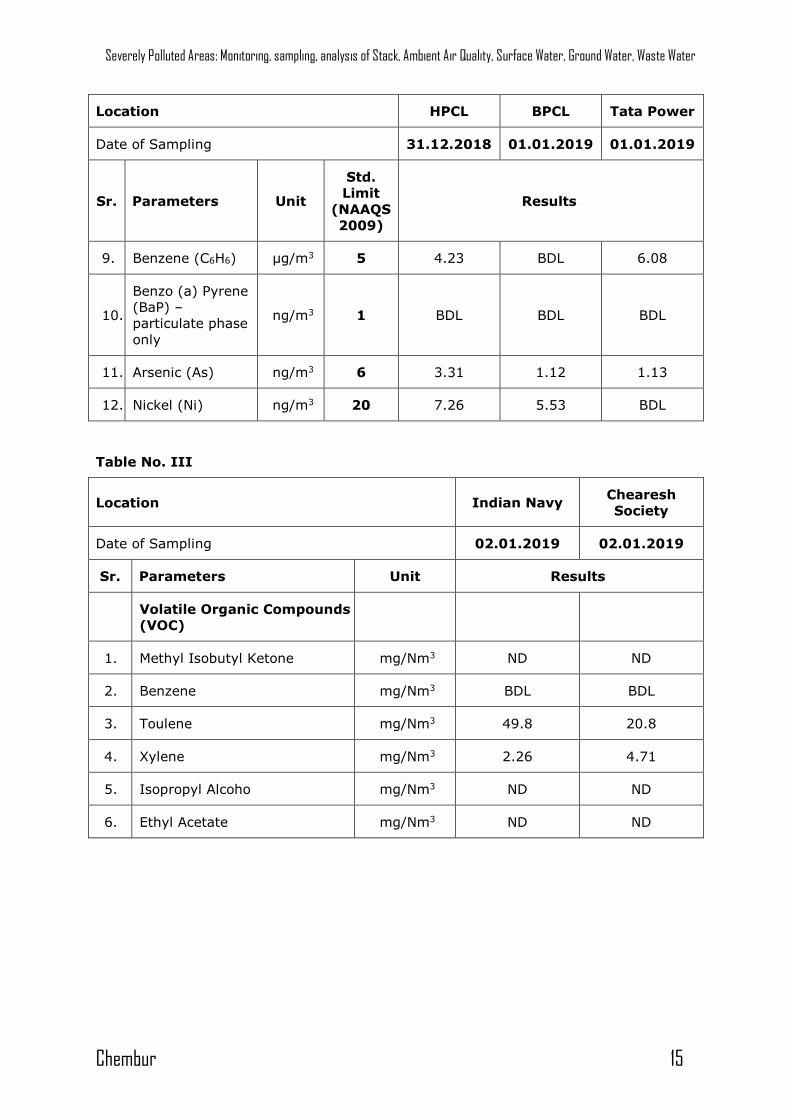
9. Benzene (C6H6) µg/m3 5 4.23 BDL 6.08
10.
Benzo (a) Pyrene
(BaP) –
particulate phase
only
ng/m3 1 BDL BDL BDL
11. Arsenic (As) ng/m3 6 3.31 1.12 1.13
12. Nickel (Ni) ng/m3 20 7.26 5.53 BDL
Table No. III
Location Indian Navy Chearesh
Society
Date of Sampling 02.01.2019 02.01.2019
Sr. Parameters Unit Results
Volatile Organic Compounds
(VOC)
1. Methyl Isobutyl Ketone mg/Nm3 ND ND
2. Benzene mg/Nm3 BDL BDL
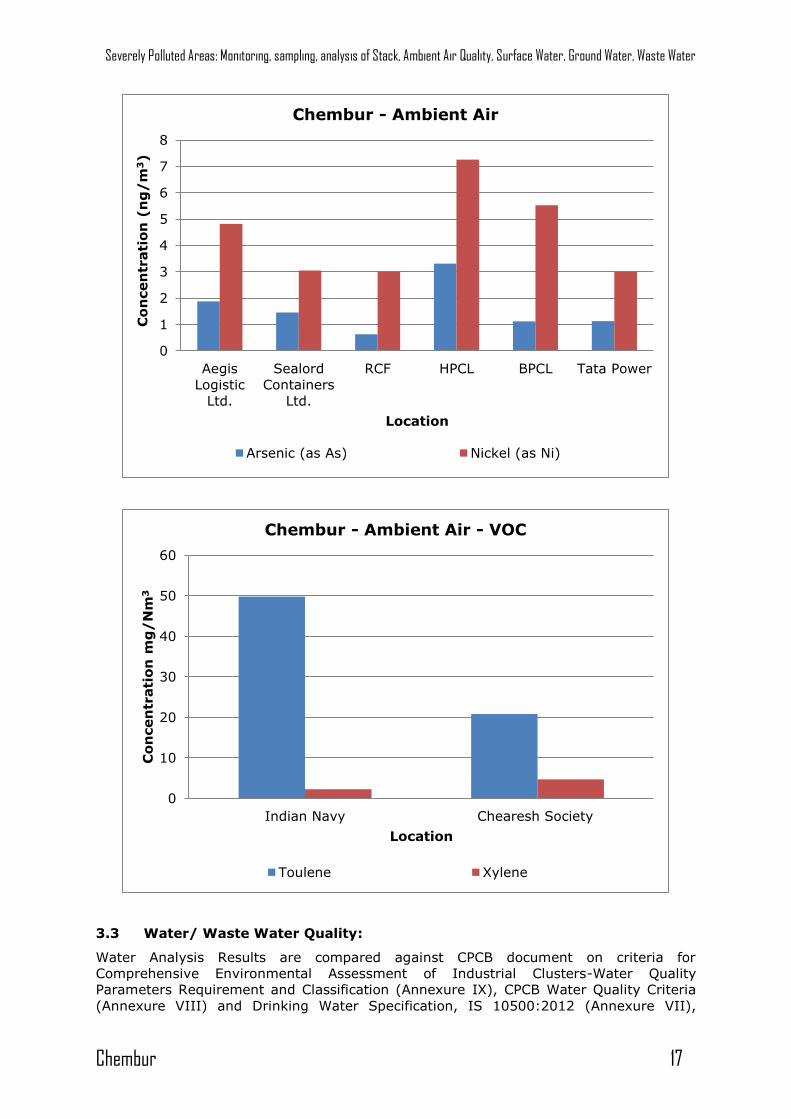
3. Toulene mg/Nm3 49.8 20.8
4. Xylene mg/Nm3 2.26 4.71
5. Isopropyl Alcoho mg/Nm3 ND ND
6. Ethyl Acetate mg/Nm3 ND ND
Severely Polluted Areas: Monitoring, sampling, analysis of Stack, Ambient Air Quality, Surface Water, Ground Water, Waste Water
Chembur 16
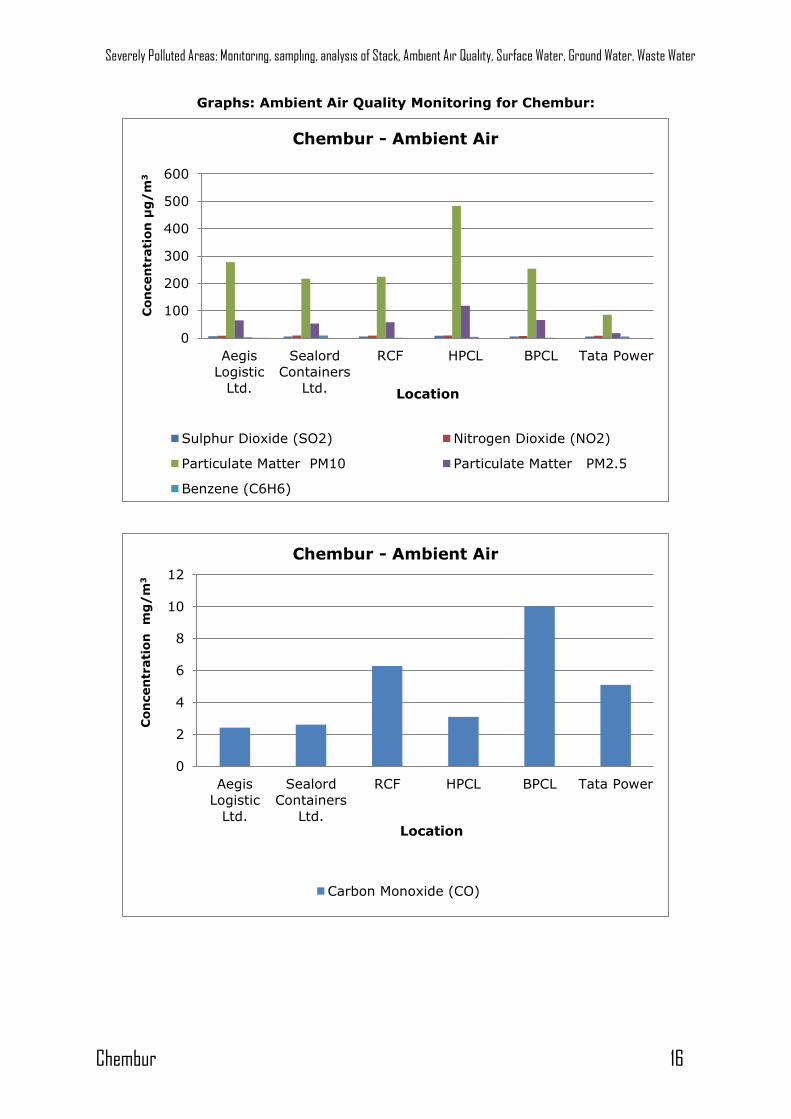
Graphs: Ambient Air Quality Monitoring for Chembur:
0
100
200
300
400
500
600
Aegis
Logistic
Ltd.
Sealord
Containers
Ltd.
RCF HPCL BPCL Tata Power
Con
cen
trati
on
µg
/m
3
Location
Chembur - Ambient Air
Sulphur Dioxide (SO2) Nitrogen Dioxide (NO2)
Particulate Matter PM10 Particulate Matter PM2.5
Benzene (C6H6)
0
2
4
6
8
10
12
Aegis
Logistic
Ltd.
Sealord
Containers
Ltd.
RCF HPCL BPCL Tata Power
Con
cen
trati
on
m
g/
m3
Location
Chembur - Ambient Air
Carbon Monoxide (CO)
Severely Polluted Areas: Monitoring, sampling, analysis of Stack, Ambient Air Quality, Surface Water, Ground Water, Waste Water
Chembur 17
3.3 Water/ Waste Water Quality:
Water Analysis Results are compared against CPCB document on criteria for
Comprehensive Environmental Assessment of Industrial Clusters-Water Quality
Parameters Requirement and Classification (Annexure IX), CPCB Water Quality Criteria
(Annexure VIII) and Drinking Water Specification, IS 10500:2012 (Annexure VII),
0
1
2
3
4
5
6
7
8
Aegis
Logistic
Ltd.
Sealord
Containers
Ltd.
RCF HPCL BPCL Tata Power
Co
ncen
trati
on
(n
g/
m3)
Location
Chembur - Ambient Air
Arsenic (as As) Nickel (as Ni)
0
10
20
30
40
50
60
Indian Navy Chearesh Society
Co
ncen
trati
on
mg
/N
m3
Location
Chembur - Ambient Air - VOC
Toulene Xylene
Severely Polluted Areas: Monitoring, sampling, analysis of Stack, Ambient Air Quality, Surface Water, Ground Water, Waste Water
Chembur 18
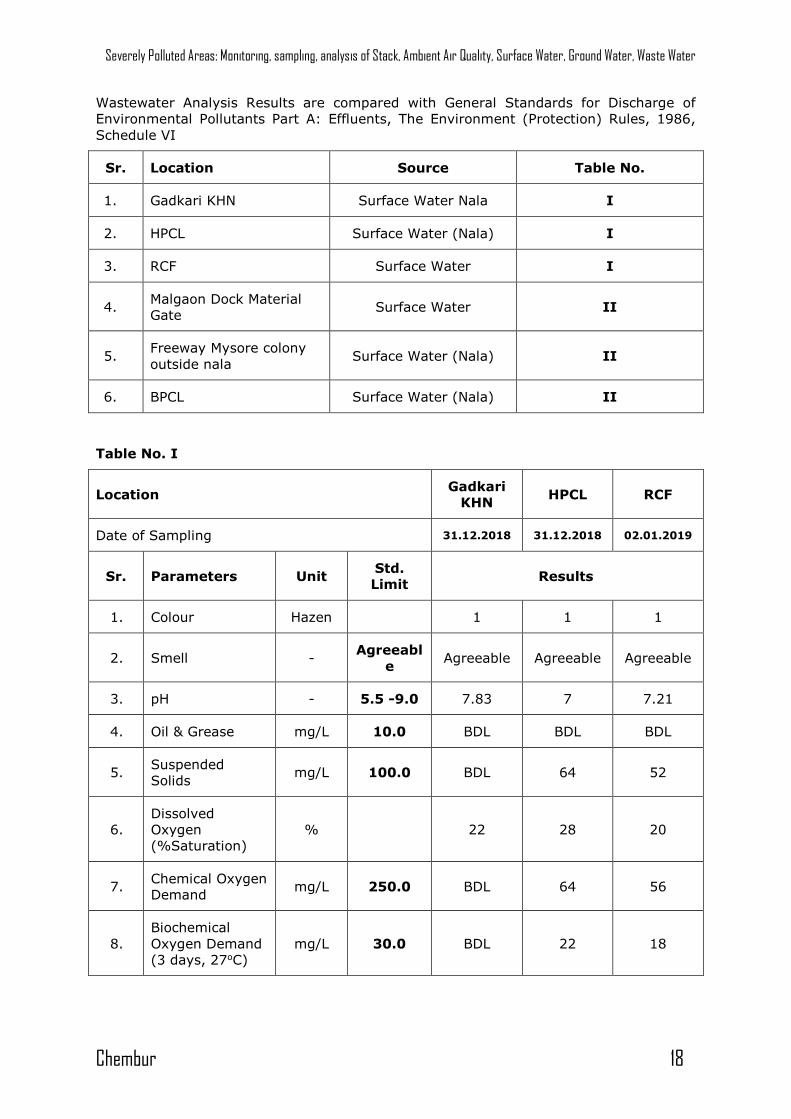
Wastewater Analysis Results are compared with General Standards for Discharge of
Environmental Pollutants Part A: Effluents, The Environment (Protection) Rules, 1986,
Schedule VI
Sr. Location Source Table No.
1. Gadkari KHN Surface Water Nala I
2. HPCL Surface Water (Nala) I
3. RCF Surface Water I
4. Malgaon Dock Material
Gate Surface Water II
5. Freeway Mysore colony
outside nala Surface Water (Nala) II
6. BPCL Surface Water (Nala) II
Table No. I
Location Gadkari
KHN HPCL RCF
Date of Sampling 31.12.2018 31.12.2018 02.01.2019
Sr. Parameters Unit Std.
Limit Results
1. Colour Hazen 1 1 1
2. Smell - Agreeabl
e Agreeable Agreeable Agreeable
3. pH - 5.5 -9.0 7.83 7 7.21
4. Oil & Grease mg/L 10.0 BDL BDL BDL
5. Suspended
Solids mg/L 100.0 BDL 64 52
6.
Dissolved
Oxygen
(%Saturation)
% 22 28 20
7. Chemical Oxygen
Demand mg/L 250.0 BDL 64 56
8.
Biochemical
Oxygen Demand
(3 days, 27oC)
mg/L 30.0 BDL 22 18
Severely Polluted Areas: Monitoring, sampling, analysis of Stack, Ambient Air Quality, Surface Water, Ground Water, Waste Water
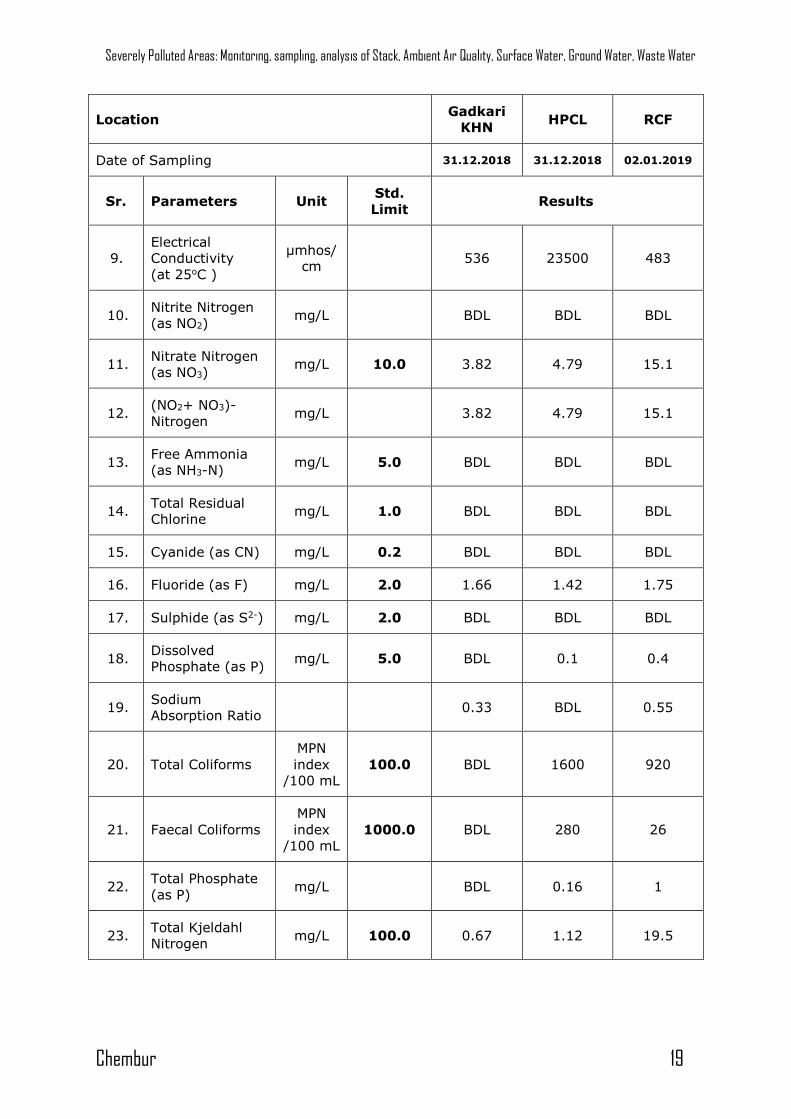
Chembur 19
Location Gadkari
KHN HPCL RCF
Date of Sampling 31.12.2018 31.12.2018 02.01.2019
Sr. Parameters Unit Std.
Limit Results
9.
Electrical
Conductivity
(at 25oC )
μmhos/
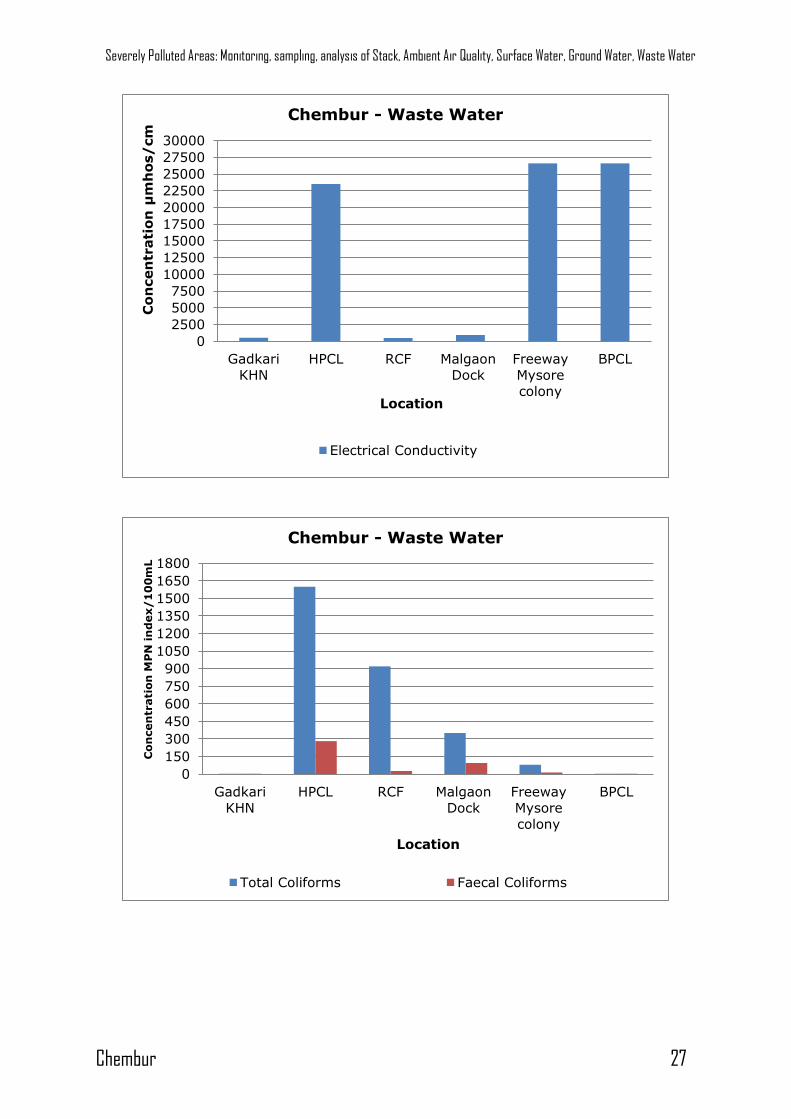
cm 536 23500 483
10. Nitrite Nitrogen
(as NO2) mg/L BDL BDL BDL
11. Nitrate Nitrogen
(as NO3) mg/L 10.0 3.82 4.79 15.1
12. (NO2+ NO3)-
Nitrogen mg/L 3.82 4.79 15.1
13. Free Ammonia
(as NH3-N) mg/L 5.0 BDL BDL BDL
14. Total Residual
Chlorine mg/L 1.0 BDL BDL BDL
15. Cyanide (as CN) mg/L 0.2 BDL BDL BDL
16. Fluoride (as F) mg/L 2.0 1.66 1.42 1.75
17. Sulphide (as S2-) mg/L 2.0 BDL BDL BDL
18. Dissolved
Phosphate (as P) mg/L 5.0 BDL 0.1 0.4
19. Sodium
Absorption Ratio 0.33 BDL 0.55
20. Total Coliforms
MPN
index
/100 mL
100.0 BDL 1600 920
21. Faecal Coliforms
MPN
index
/100 mL
1000.0 BDL 280 26
22. Total Phosphate
(as P) mg/L BDL 0.16 1
23. Total Kjeldahl
Nitrogen mg/L 100.0 0.67 1.12 19.5
Severely Polluted Areas: Monitoring, sampling, analysis of Stack, Ambient Air Quality, Surface Water, Ground Water, Waste Water
Chembur 20
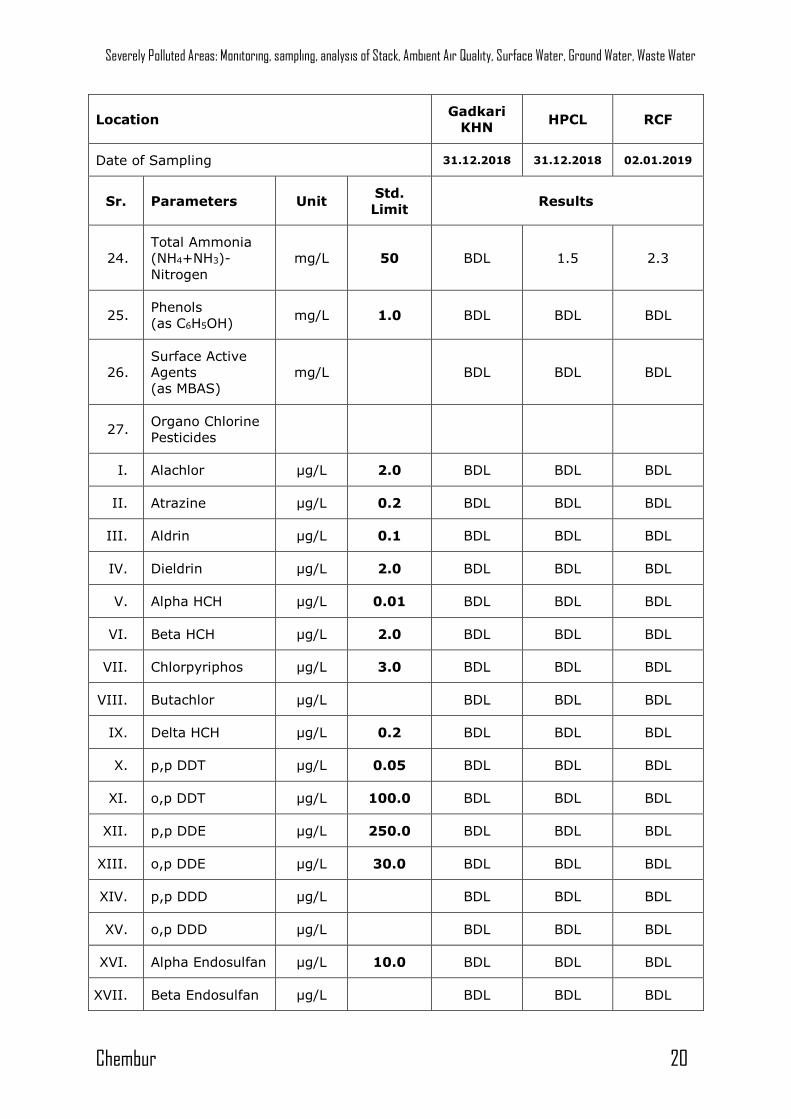
Location Gadkari
KHN HPCL RCF
Date of Sampling 31.12.2018 31.12.2018 02.01.2019
Sr. Parameters Unit Std.
Limit Results
24.
Total Ammonia
(NH4+NH3)-
Nitrogen
mg/L 50 BDL 1.5 2.3
25. Phenols
(as C6H5OH) mg/L 1.0 BDL BDL BDL
26.
Surface Active
Agents
(as MBAS)
mg/L BDL BDL BDL
27. Organo Chlorine
Pesticides
I. Alachlor µg/L 2.0 BDL BDL BDL
II. Atrazine µg/L 0.2 BDL BDL BDL
III. Aldrin µg/L 0.1 BDL BDL BDL
IV. Dieldrin µg/L 2.0 BDL BDL BDL
V. Alpha HCH µg/L 0.01 BDL BDL BDL
VI. Beta HCH µg/L 2.0 BDL BDL BDL
VII. Chlorpyriphos µg/L 3.0 BDL BDL BDL
VIII. Butachlor µg/L BDL BDL BDL
IX. Delta HCH µg/L 0.2 BDL BDL BDL
X. p,p DDT µg/L 0.05 BDL BDL BDL
XI. o,p DDT µg/L 100.0 BDL BDL BDL
XII. p,p DDE µg/L 250.0 BDL BDL BDL
XIII. o,p DDE µg/L 30.0 BDL BDL BDL
XIV. p,p DDD µg/L BDL BDL BDL
XV. o,p DDD µg/L BDL BDL BDL
XVI. Alpha Endosulfan µg/L 10.0 BDL BDL BDL
XVII. Beta Endosulfan µg/L BDL BDL BDL
Severely Polluted Areas: Monitoring, sampling, analysis of Stack, Ambient Air Quality, Surface Water, Ground Water, Waste Water
Chembur 21
Location Gadkari
KHN HPCL RCF
Date of Sampling 31.12.2018 31.12.2018 02.01.2019
Sr. Parameters Unit Std.
Limit Results
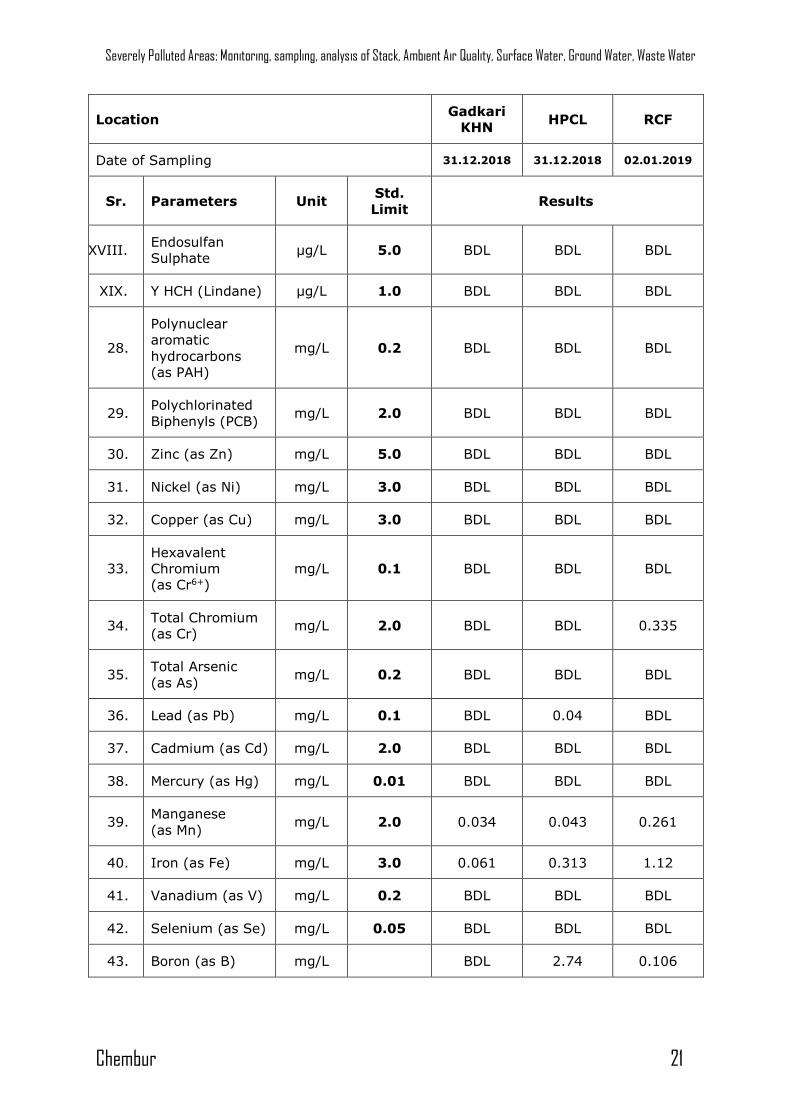
XVIII. Endosulfan
Sulphate µg/L 5.0 BDL BDL BDL
XIX. Y HCH (Lindane) µg/L 1.0 BDL BDL BDL
28.
Polynuclear
aromatic
hydrocarbons
(as PAH)
mg/L 0.2 BDL BDL BDL
29. Polychlorinated
Biphenyls (PCB) mg/L 2.0 BDL BDL BDL
30. Zinc (as Zn) mg/L 5.0 BDL BDL BDL
31. Nickel (as Ni) mg/L 3.0 BDL BDL BDL
32. Copper (as Cu) mg/L 3.0 BDL BDL BDL
33.
Hexavalent
Chromium
(as Cr6+)
mg/L 0.1 BDL BDL BDL
34. Total Chromium
(as Cr) mg/L 2.0 BDL BDL 0.335
35. Total Arsenic
(as As) mg/L 0.2 BDL BDL BDL
36. Lead (as Pb) mg/L 0.1 BDL 0.04 BDL
37. Cadmium (as Cd) mg/L 2.0 BDL BDL BDL
38. Mercury (as Hg) mg/L 0.01 BDL BDL BDL
39. Manganese
(as Mn) mg/L 2.0 0.034 0.043 0.261
40. Iron (as Fe) mg/L 3.0 0.061 0.313 1.12
41. Vanadium (as V) mg/L 0.2 BDL BDL BDL
42. Selenium (as Se) mg/L 0.05 BDL BDL BDL
43. Boron (as B) mg/L BDL 2.74 0.106
Severely Polluted Areas: Monitoring, sampling, analysis of Stack, Ambient Air Quality, Surface Water, Ground Water, Waste Water
Chembur 22
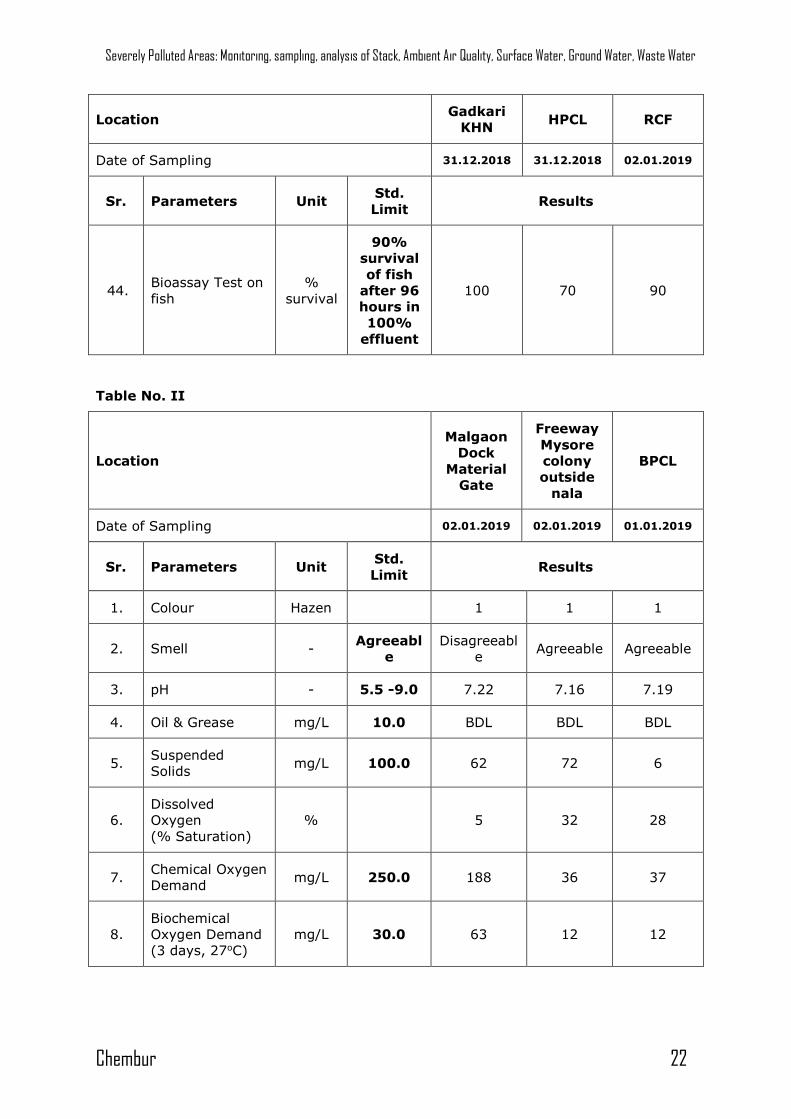
Location Gadkari
KHN HPCL RCF
Date of Sampling 31.12.2018 31.12.2018 02.01.2019
Sr. Parameters Unit Std.
Limit Results
44. Bioassay Test on
fish
%
survival
90%
survival
of fish
after 96
hours in
100%
effluent
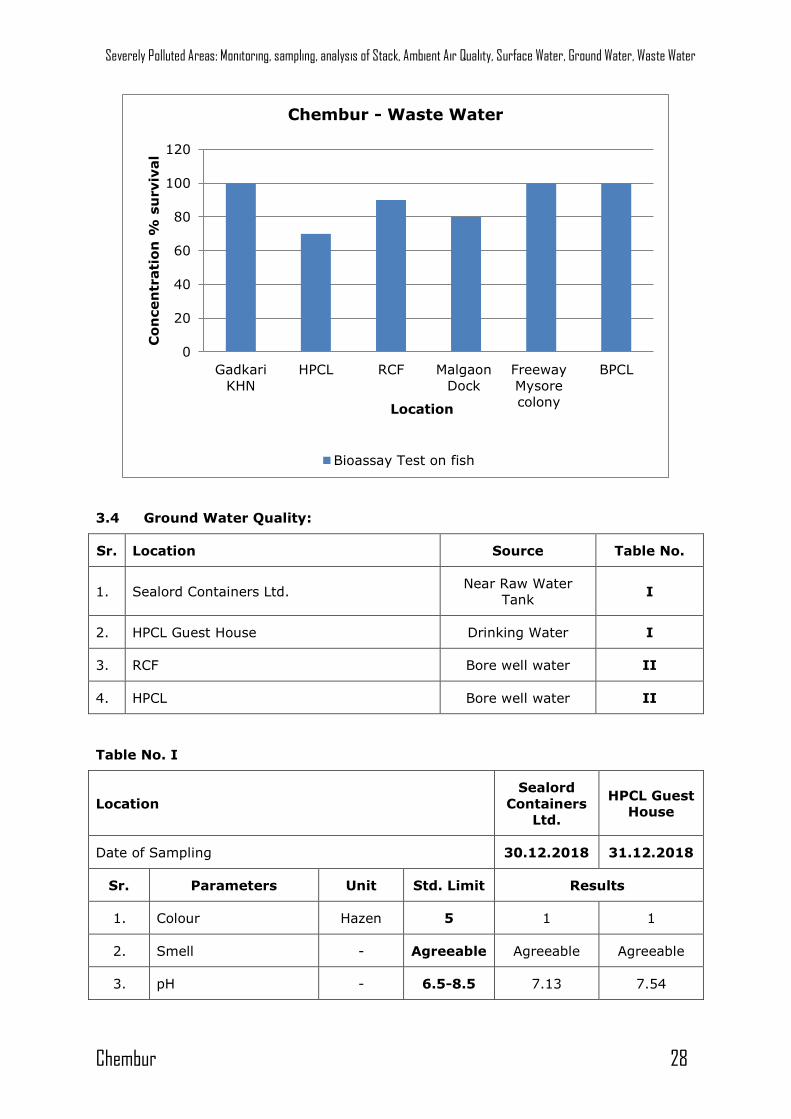
100 70 90
Table No. II
Location
Malgaon
Dock
Material
Gate
Freeway
Mysore
colony
outside
nala
BPCL
Date of Sampling 02.01.2019 02.01.2019 01.01.2019
Sr. Parameters Unit Std.
Limit Results
1. Colour Hazen 1 1 1
2. Smell - Agreeabl
e
Disagreeabl
e Agreeable Agreeable
3. pH - 5.5 -9.0 7.22 7.16 7.19
4. Oil & Grease mg/L 10.0 BDL BDL BDL
5. Suspended
Solids mg/L 100.0 62 72 6
6.
Dissolved
Oxygen
(% Saturation)
% 5 32 28
7. Chemical Oxygen
Demand mg/L 250.0 188 36 37
8.
Biochemical
Oxygen Demand
(3 days, 27oC)
mg/L 30.0 63 12 12
Severely Polluted Areas: Monitoring, sampling, analysis of Stack, Ambient Air Quality, Surface Water, Ground Water, Waste Water
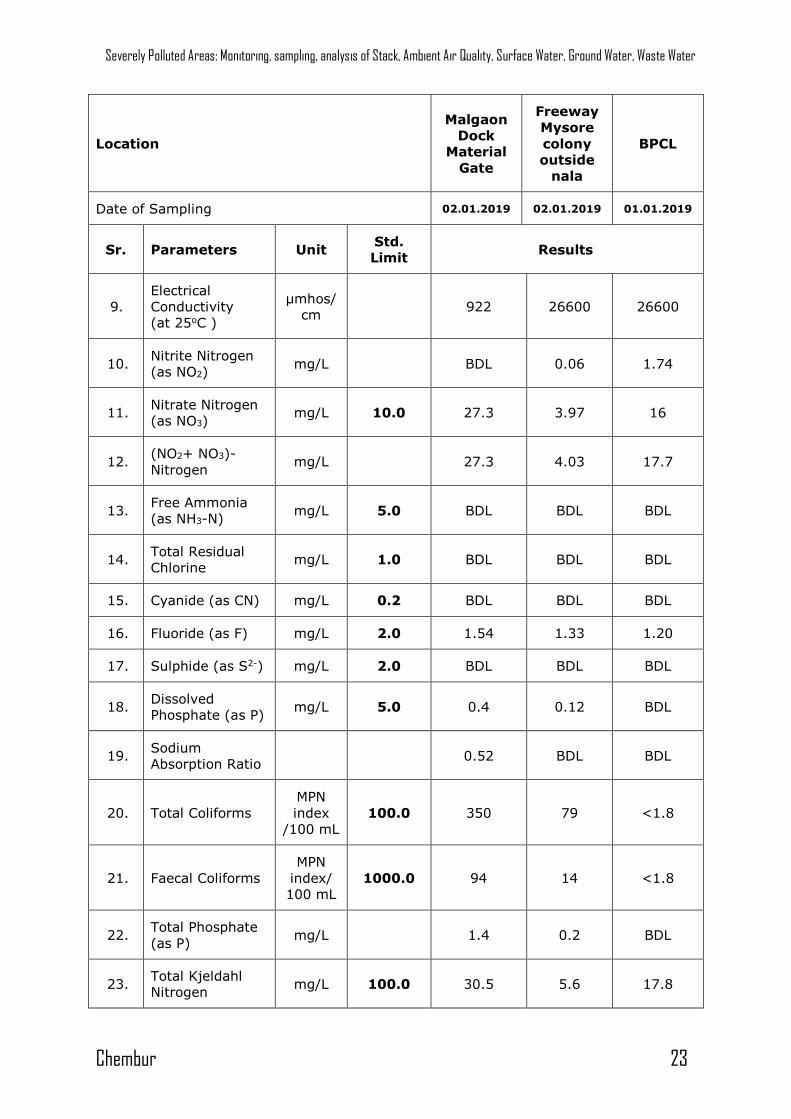
Chembur 23
Location
Malgaon
Dock
Material
Gate
Freeway
Mysore
colony
outside
nala
BPCL
Date of Sampling 02.01.2019 02.01.2019 01.01.2019
Sr. Parameters Unit Std.
Limit Results
9.
Electrical
Conductivity
(at 25oC )
μmhos/
cm 922 26600 26600
10. Nitrite Nitrogen
(as NO2) mg/L BDL 0.06 1.74
11. Nitrate Nitrogen
(as NO3) mg/L 10.0 27.3 3.97 16
12. (NO2+ NO3)-
Nitrogen mg/L 27.3 4.03 17.7
13. Free Ammonia
(as NH3-N) mg/L 5.0 BDL BDL BDL
14. Total Residual
Chlorine mg/L 1.0 BDL BDL BDL
15. Cyanide (as CN) mg/L 0.2 BDL BDL BDL
16. Fluoride (as F) mg/L 2.0 1.54 1.33 1.20
17. Sulphide (as S2-) mg/L 2.0 BDL BDL BDL
18. Dissolved
Phosphate (as P) mg/L 5.0 0.4 0.12 BDL
19. Sodium
Absorption Ratio 0.52 BDL BDL
20. Total Coliforms
MPN
index
/100 mL
100.0 350 79 <1.8
21. Faecal Coliforms
MPN
index/
100 mL
1000.0 94 14 <1.8
22. Total Phosphate
(as P) mg/L 1.4 0.2 BDL
23. Total Kjeldahl
Nitrogen mg/L 100.0 30.5 5.6 17.8
Severely Polluted Areas: Monitoring, sampling, analysis of Stack, Ambient Air Quality, Surface Water, Ground Water, Waste Water
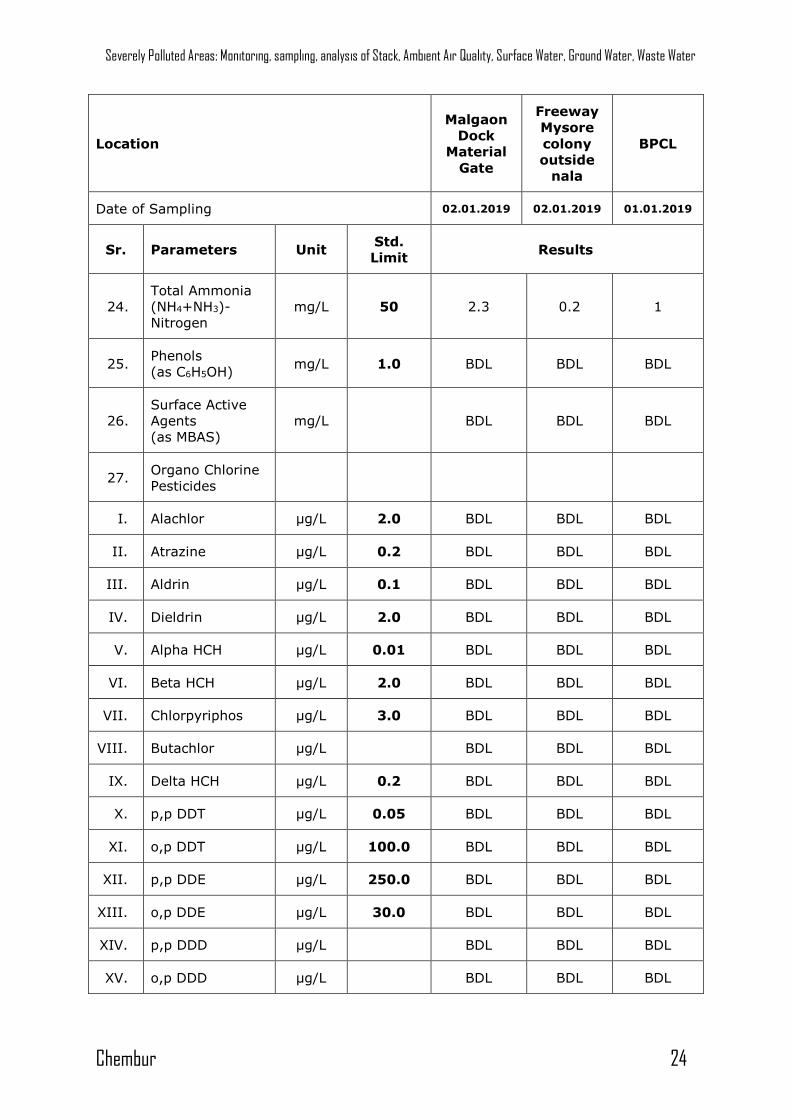
Chembur 24
Location
Malgaon
Dock
Material
Gate
Freeway
Mysore
colony
outside
nala
BPCL
Date of Sampling 02.01.2019 02.01.2019 01.01.2019
Sr. Parameters Unit Std.
Limit Results
24.
Total Ammonia
(NH4+NH3)-
Nitrogen
mg/L 50 2.3 0.2 1
25. Phenols
(as C6H5OH) mg/L 1.0 BDL BDL BDL
26.
Surface Active
Agents
(as MBAS)
mg/L BDL BDL BDL
27. Organo Chlorine
Pesticides
I. Alachlor µg/L 2.0 BDL BDL BDL
II. Atrazine µg/L 0.2 BDL BDL BDL
III. Aldrin µg/L 0.1 BDL BDL BDL
IV. Dieldrin µg/L 2.0 BDL BDL BDL
V. Alpha HCH µg/L 0.01 BDL BDL BDL
VI. Beta HCH µg/L 2.0 BDL BDL BDL
VII. Chlorpyriphos µg/L 3.0 BDL BDL BDL
VIII. Butachlor µg/L BDL BDL BDL
IX. Delta HCH µg/L 0.2 BDL BDL BDL
X. p,p DDT µg/L 0.05 BDL BDL BDL
XI. o,p DDT µg/L 100.0 BDL BDL BDL
XII. p,p DDE µg/L 250.0 BDL BDL BDL
XIII. o,p DDE µg/L 30.0 BDL BDL BDL
XIV. p,p DDD µg/L BDL BDL BDL
XV. o,p DDD µg/L BDL BDL BDL
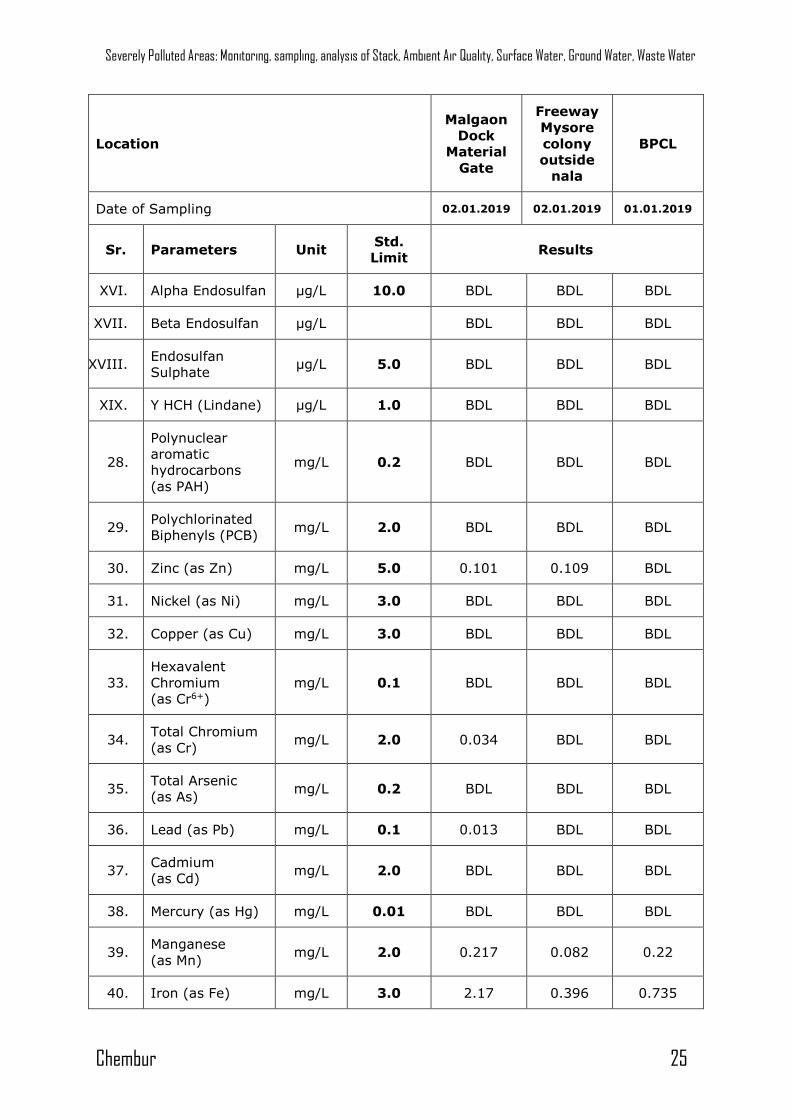
Severely Polluted Areas: Monitoring, sampling, analysis of Stack, Ambient Air Quality, Surface Water, Ground Water, Waste Water
Chembur 25
Location
Malgaon
Dock
Material
Gate
Freeway
Mysore
colony
outside
nala
BPCL
Date of Sampling 02.01.2019 02.01.2019 01.01.2019
Sr. Parameters Unit Std.
Limit Results
XVI. Alpha Endosulfan µg/L 10.0 BDL BDL BDL
XVII. Beta Endosulfan µg/L BDL BDL BDL
XVIII. Endosulfan
Sulphate µg/L 5.0 BDL BDL BDL
XIX. Y HCH (Lindane) µg/L 1.0 BDL BDL BDL
28.
Polynuclear
aromatic
hydrocarbons
(as PAH)
mg/L 0.2 BDL BDL BDL
29. Polychlorinated
Biphenyls (PCB) mg/L 2.0 BDL BDL BDL
30. Zinc (as Zn) mg/L 5.0 0.101 0.109 BDL
31. Nickel (as Ni) mg/L 3.0 BDL BDL BDL
32. Copper (as Cu) mg/L 3.0 BDL BDL BDL
33.
Hexavalent
Chromium
(as Cr6+)
mg/L 0.1 BDL BDL BDL
34. Total Chromium
(as Cr) mg/L 2.0 0.034 BDL BDL
35. Total Arsenic
(as As) mg/L 0.2 BDL BDL BDL
36. Lead (as Pb) mg/L 0.1 0.013 BDL BDL
37. Cadmium
(as Cd) mg/L 2.0 BDL BDL BDL
38. Mercury (as Hg) mg/L 0.01 BDL BDL BDL
39. Manganese
(as Mn) mg/L 2.0 0.217 0.082 0.22
40. Iron (as Fe) mg/L 3.0 2.17 0.396 0.735
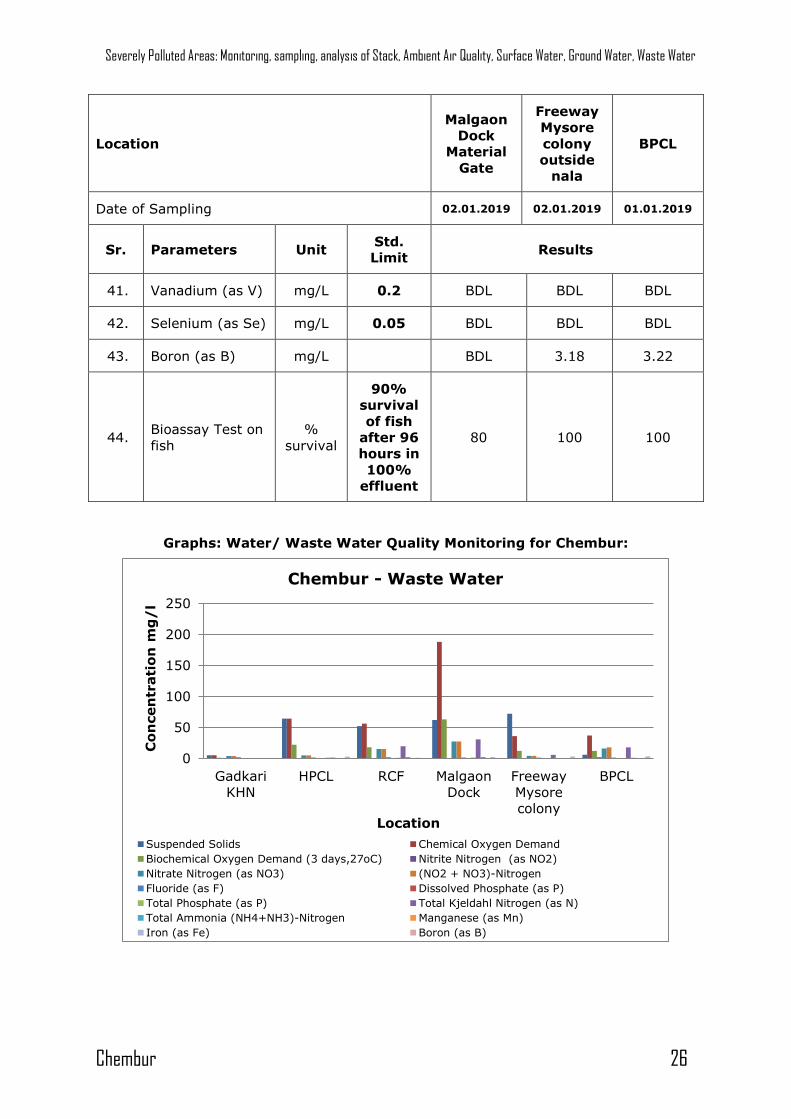
Severely Polluted Areas: Monitoring, sampling, analysis of Stack, Ambient Air Quality, Surface Water, Ground Water, Waste Water
Chembur 26
Location
Malgaon
Dock
Material
Gate
Freeway
Mysore
colony
outside
nala
BPCL
Date of Sampling 02.01.2019 02.01.2019 01.01.2019
Sr. Parameters Unit Std.
Limit Results
41. Vanadium (as V) mg/L 0.2 BDL BDL BDL
42. Selenium (as Se) mg/L 0.05 BDL BDL BDL
43. Boron (as B) mg/L BDL 3.18 3.22
44. Bioassay Test on
fish
%
survival
90%
survival
of fish
after 96
hours in
100%
effluent
80 100 100
Graphs: Water/ Waste Water Quality Monitoring for Chembur:
0
50
100
150
200
250
Gadkari
KHN
HPCL RCF Malgaon
Dock
Freeway
Mysore
colony
BPCL
Co
ncen
trati
on
mg
/l
Location
Chembur - Waste Water
Suspended Solids Chemical Oxygen Demand
Biochemical Oxygen Demand (3 days,27oC) Nitrite Nitrogen (as NO2)
Nitrate Nitrogen (as NO3) (NO2 + NO3)-Nitrogen
Fluoride (as F) Dissolved Phosphate (as P)
Total Phosphate (as P) Total Kjeldahl Nitrogen (as N)
Total Ammonia (NH4+NH3)-Nitrogen Manganese (as Mn)
Iron (as Fe) Boron (as B)
Severely Polluted Areas: Monitoring, sampling, analysis of Stack, Ambient Air Quality, Surface Water, Ground Water, Waste Water
Chembur 27
0
2500
5000
7500
10000
12500
15000
17500
20000
22500
25000
27500
30000
Gadkari
KHN
HPCL RCF Malgaon
Dock
Freeway
Mysore
colony
BPCL
Co
ncen
trati
on
μmhos/cm
Location
Chembur - Waste Water
Electrical Conductivity
0
150
300
450
600
750
900
1050
1200
1350
1500
1650
1800
Gadkari
KHN
HPCL RCF Malgaon
Dock
Freeway
Mysore
colony
BPCL
Co
ncen
trati
on
MP
N in
dex/
10
0m
L
Location
Chembur - Waste Water
Total Coliforms Faecal Coliforms
Severely Polluted Areas: Monitoring, sampling, analysis of Stack, Ambient Air Quality, Surface Water, Ground Water, Waste Water
Chembur 28
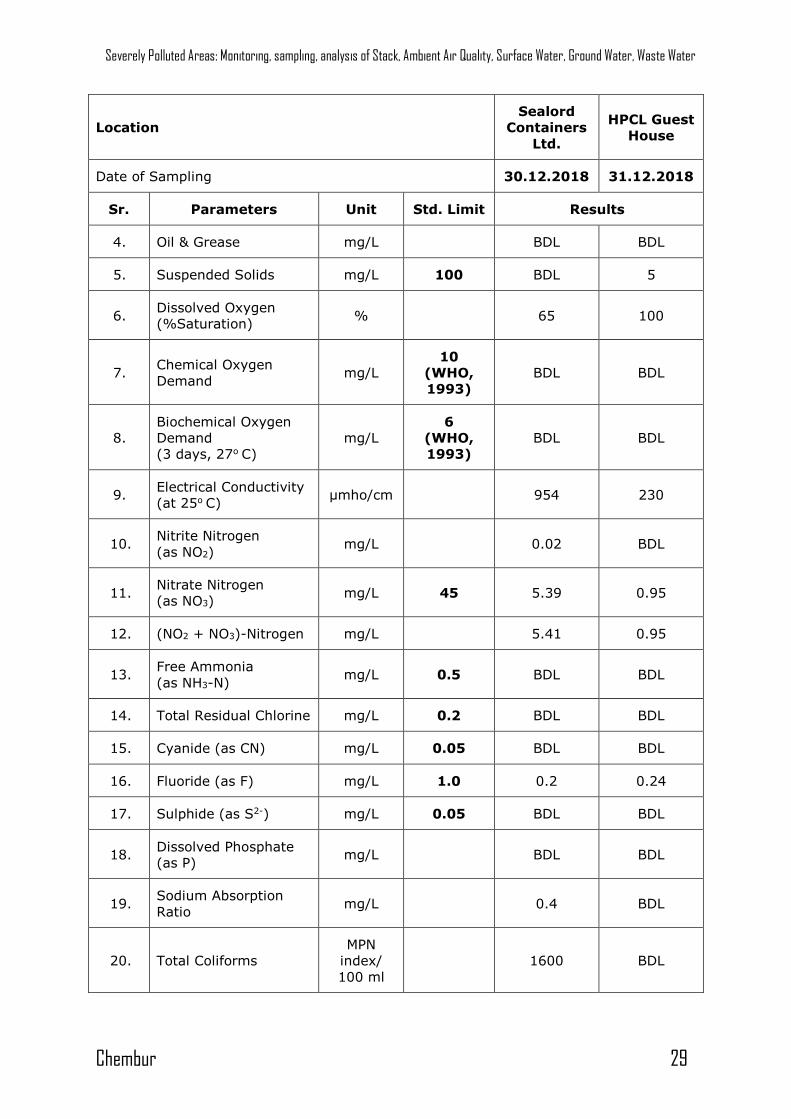
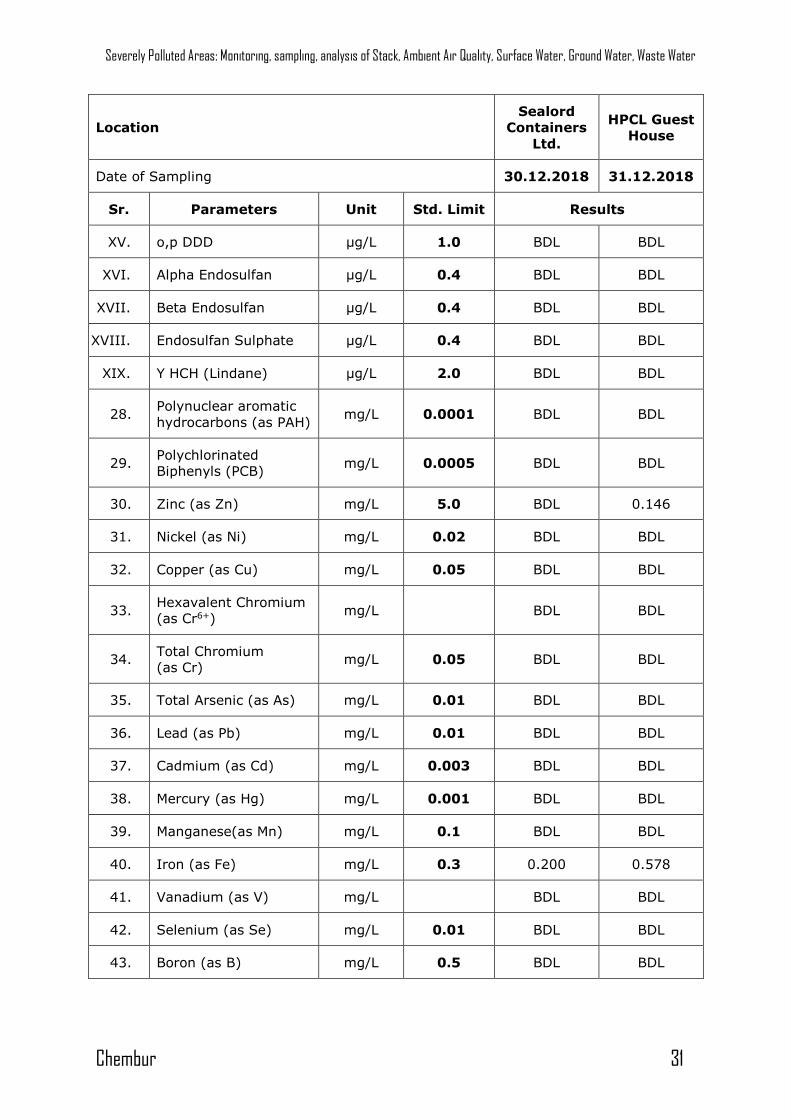
3.4 Ground Water Quality:
Sr. Location Source Table No.
1. Sealord Containers Ltd. Near Raw Water
Tank I
2. HPCL Guest House Drinking Water I
3. RCF Bore well water II
4. HPCL Bore well water II
Table No. I
Location
Sealord
Containers
Ltd.
HPCL Guest
House
Date of Sampling 30.12.2018 31.12.2018
Sr. Parameters Unit Std. Limit Results
1. Colour Hazen 5 1 1
2. Smell - Agreeable Agreeable Agreeable
3. pH - 6.5-8.5 7.13 7.54
0
20
40
60
80
100
120
Gadkari
KHN
HPCL RCF Malgaon
Dock
Freeway
Mysore
colony
BPCL
Co
ncen
trati
on
% s
urviv
al
Location
Chembur - Waste Water
Bioassay Test on fish
Severely Polluted Areas: Monitoring, sampling, analysis of Stack, Ambient Air Quality, Surface Water, Ground Water, Waste Water
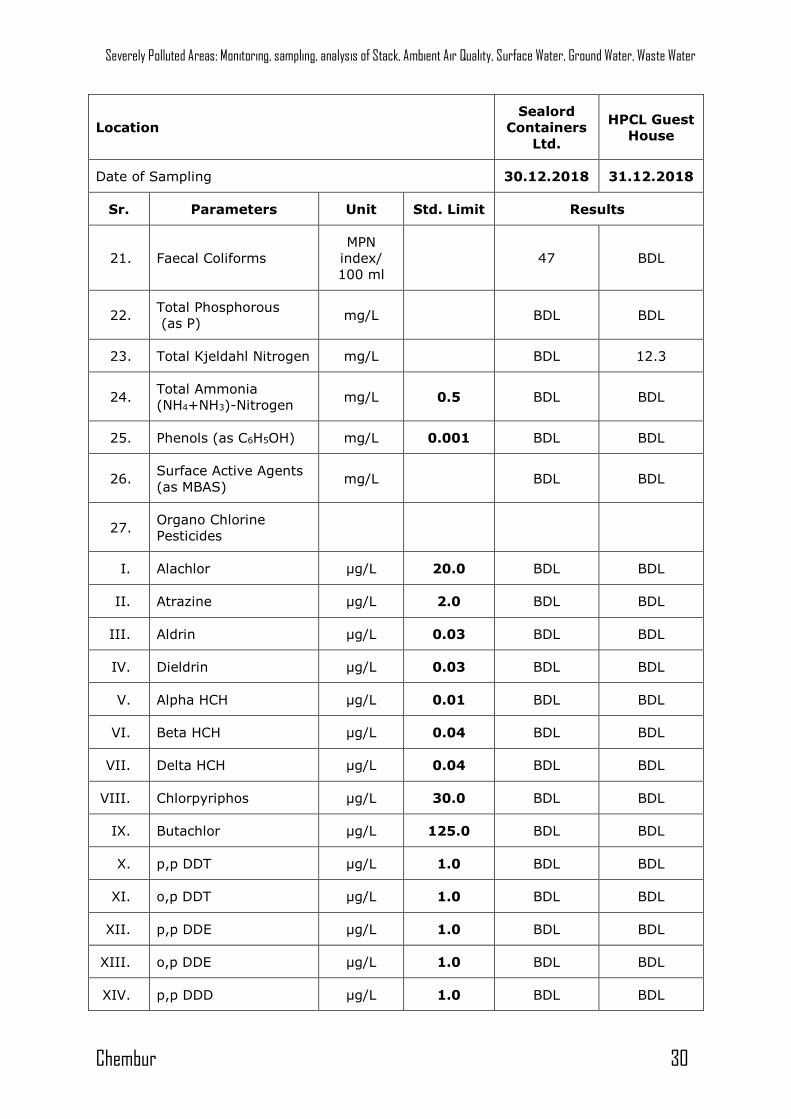
Chembur 29
Location
Sealord
Containers
Ltd.
HPCL Guest
House
Date of Sampling 30.12.2018 31.12.2018
Sr. Parameters Unit Std. Limit Results
4. Oil & Grease mg/L BDL BDL
5. Suspended Solids mg/L 100 BDL 5
6. Dissolved Oxygen
(%Saturation) % 65 100
7. Chemical Oxygen
Demand mg/L
10
(WHO,
1993)
BDL BDL
8.
Biochemical Oxygen
Demand
(3 days, 27o C)
mg/L
6
(WHO,
1993)
BDL BDL
9. Electrical Conductivity
(at 25o C) µmho/cm 954 230
10. Nitrite Nitrogen
(as NO2) mg/L 0.02 BDL
11. Nitrate Nitrogen
(as NO3) mg/L 45 5.39 0.95
12. (NO2 + NO3)-Nitrogen mg/L 5.41 0.95
13. Free Ammonia
(as NH3-N) mg/L 0.5 BDL BDL
14. Total Residual Chlorine mg/L 0.2 BDL BDL
15. Cyanide (as CN) mg/L 0.05 BDL BDL
16. Fluoride (as F) mg/L 1.0 0.2 0.24
17. Sulphide (as S2-) mg/L 0.05 BDL BDL
18. Dissolved Phosphate
(as P) mg/L BDL BDL
19. Sodium Absorption
Ratio mg/L 0.4 BDL
20. Total Coliforms
MPN
index/
100 ml
1600 BDL
Severely Polluted Areas: Monitoring, sampling, analysis of Stack, Ambient Air Quality, Surface Water, Ground Water, Waste Water
Chembur 30
Location
Sealord
Containers
Ltd.
HPCL Guest
House
Date of Sampling 30.12.2018 31.12.2018
Sr. Parameters Unit Std. Limit Results
21. Faecal Coliforms
MPN
index/
100 ml
47 BDL
22. Total Phosphorous
(as P) mg/L BDL BDL
23. Total Kjeldahl Nitrogen mg/L BDL 12.3
24. Total Ammonia
(NH4+NH3)-Nitrogen mg/L 0.5 BDL BDL
25. Phenols (as C6H5OH) mg/L 0.001 BDL BDL
26. Surface Active Agents
(as MBAS) mg/L BDL BDL
27. Organo Chlorine
Pesticides
I. Alachlor µg/L 20.0 BDL BDL
II. Atrazine µg/L 2.0 BDL BDL
III. Aldrin µg/L 0.03 BDL BDL
IV. Dieldrin µg/L 0.03 BDL BDL
V. Alpha HCH µg/L 0.01 BDL BDL
VI. Beta HCH µg/L 0.04 BDL BDL
VII. Delta HCH µg/L 0.04 BDL BDL
VIII. Chlorpyriphos µg/L 30.0 BDL BDL
IX. Butachlor µg/L 125.0 BDL BDL
X. p,p DDT µg/L 1.0 BDL BDL
XI. o,p DDT µg/L 1.0 BDL BDL
XII. p,p DDE µg/L 1.0 BDL BDL
XIII. o,p DDE µg/L 1.0 BDL BDL
XIV. p,p DDD µg/L 1.0 BDL BDL
Severely Polluted Areas: Monitoring, sampling, analysis of Stack, Ambient Air Quality, Surface Water, Ground Water, Waste Water
Chembur 31
Location
Sealord
Containers
Ltd.
HPCL Guest
House
Date of Sampling 30.12.2018 31.12.2018
Sr. Parameters Unit Std. Limit Results
XV. o,p DDD µg/L 1.0 BDL BDL
XVI. Alpha Endosulfan µg/L 0.4 BDL BDL
XVII. Beta Endosulfan µg/L 0.4 BDL BDL
XVIII. Endosulfan Sulphate µg/L 0.4 BDL BDL
XIX. Y HCH (Lindane) µg/L 2.0 BDL BDL
28. Polynuclear aromatic
hydrocarbons (as PAH) mg/L 0.0001 BDL BDL
29. Polychlorinated
Biphenyls (PCB) mg/L 0.0005 BDL BDL
30. Zinc (as Zn) mg/L 5.0 BDL 0.146
31. Nickel (as Ni) mg/L 0.02 BDL BDL
32. Copper (as Cu) mg/L 0.05 BDL BDL
33. Hexavalent Chromium
(as Cr6+) mg/L BDL BDL
34. Total Chromium
(as Cr) mg/L 0.05 BDL BDL
35. Total Arsenic (as As) mg/L 0.01 BDL BDL
36. Lead (as Pb) mg/L 0.01 BDL BDL
37. Cadmium (as Cd) mg/L 0.003 BDL BDL
38. Mercury (as Hg) mg/L 0.001 BDL BDL
39. Manganese(as Mn) mg/L 0.1 BDL BDL
40. Iron (as Fe) mg/L 0.3 0.200 0.578
41. Vanadium (as V) mg/L BDL BDL
42. Selenium (as Se) mg/L 0.01 BDL BDL
43. Boron (as B) mg/L 0.5 BDL BDL
Severely Polluted Areas: Monitoring, sampling, analysis of Stack, Ambient Air Quality, Surface Water, Ground Water, Waste Water
Chembur 32
Location
Sealord
Containers
Ltd.
HPCL Guest
House
Date of Sampling 30.12.2018 31.12.2018
Sr. Parameters Unit Std. Limit Results
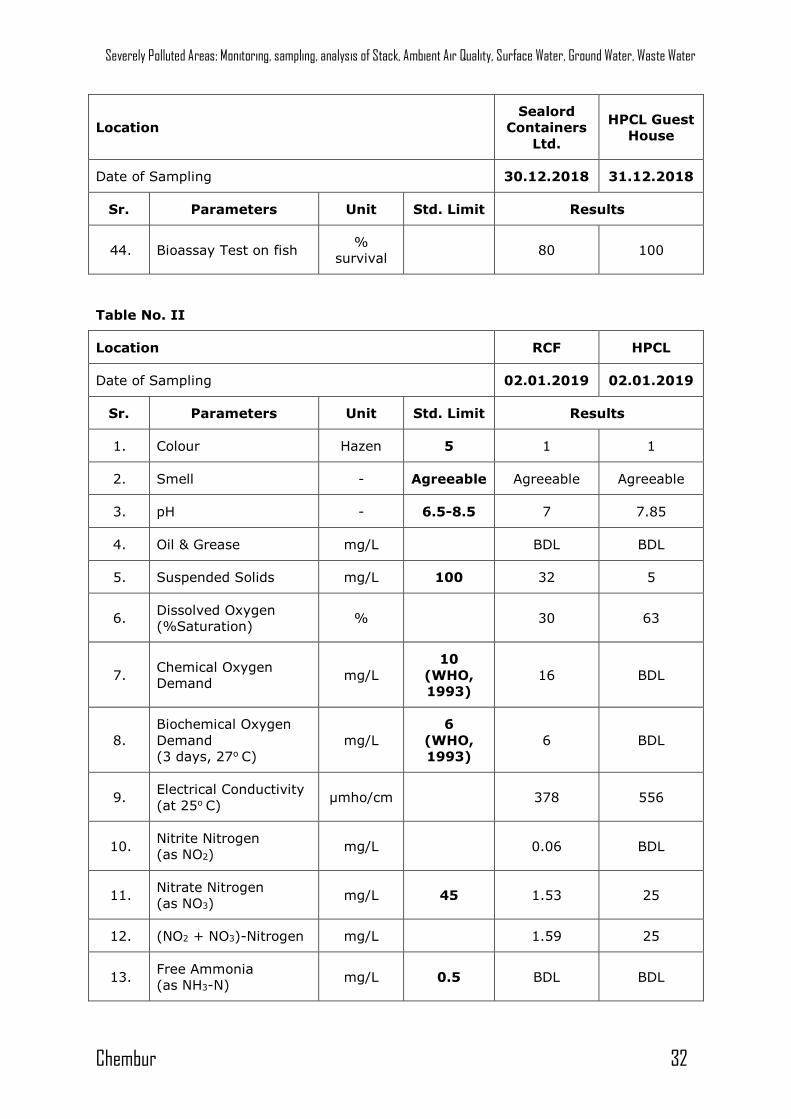
44. Bioassay Test on fish %
survival 80 100
Table No. II
Location RCF HPCL
Date of Sampling 02.01.2019 02.01.2019
Sr. Parameters Unit Std. Limit Results
1. Colour Hazen 5 1 1
2. Smell - Agreeable Agreeable Agreeable
3. pH - 6.5-8.5 7 7.85
4. Oil & Grease mg/L BDL BDL
5. Suspended Solids mg/L 100 32 5
6. Dissolved Oxygen
(%Saturation) % 30 63
7. Chemical Oxygen
Demand mg/L
10
(WHO,
1993)
16 BDL
8.
Biochemical Oxygen
Demand
(3 days, 27o C)
mg/L
6
(WHO,
1993)
6 BDL
9. Electrical Conductivity
(at 25o C) µmho/cm 378 556
10. Nitrite Nitrogen
(as NO2) mg/L 0.06 BDL
11. Nitrate Nitrogen
(as NO3) mg/L 45 1.53 25
12. (NO2 + NO3)-Nitrogen mg/L 1.59 25
13. Free Ammonia
(as NH3-N) mg/L 0.5 BDL BDL
Severely Polluted Areas: Monitoring, sampling, analysis of Stack, Ambient Air Quality, Surface Water, Ground Water, Waste Water
Chembur 33
Location RCF HPCL
Date of Sampling 02.01.2019 02.01.2019
Sr. Parameters Unit Std. Limit Results
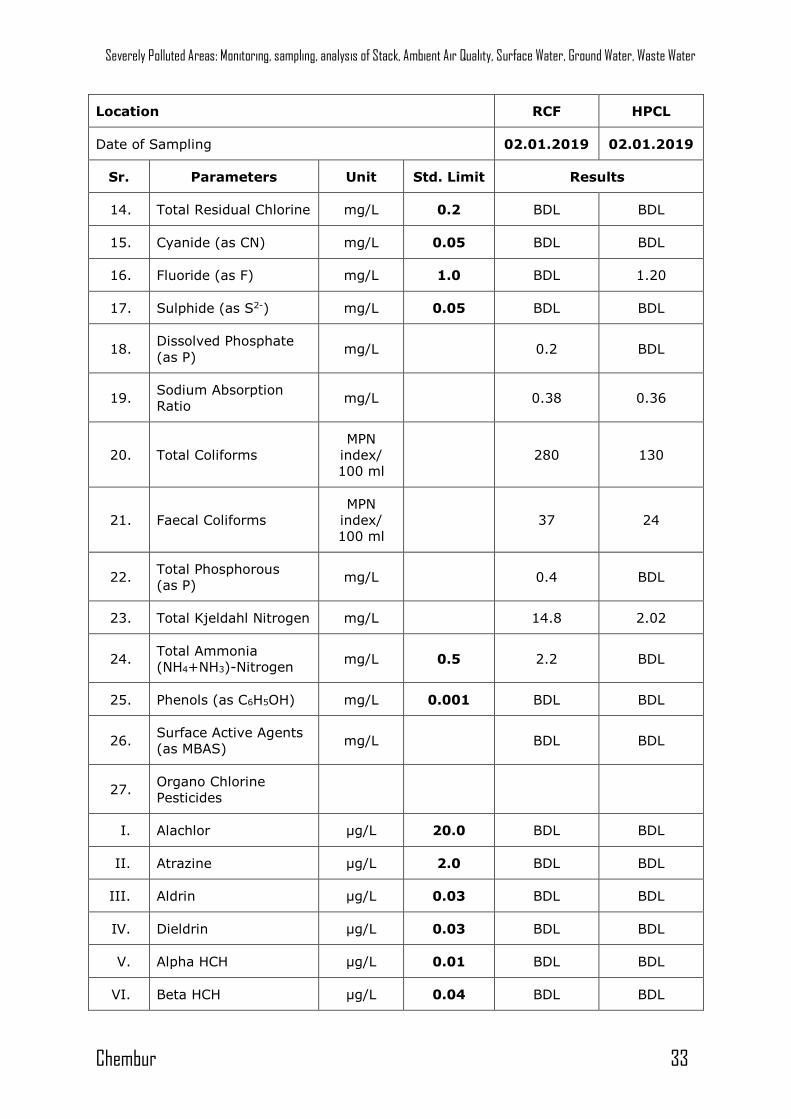
14. Total Residual Chlorine mg/L 0.2 BDL BDL
15. Cyanide (as CN) mg/L 0.05 BDL BDL
16. Fluoride (as F) mg/L 1.0 BDL 1.20
17. Sulphide (as S2-) mg/L 0.05 BDL BDL
18. Dissolved Phosphate
(as P) mg/L 0.2 BDL
19. Sodium Absorption
Ratio mg/L 0.38 0.36
20. Total Coliforms
MPN
index/
100 ml
280 130
21. Faecal Coliforms
MPN
index/
100 ml
37 24
22. Total Phosphorous
(as P) mg/L 0.4 BDL
23. Total Kjeldahl Nitrogen mg/L 14.8 2.02
24. Total Ammonia
(NH4+NH3)-Nitrogen mg/L 0.5 2.2 BDL
25. Phenols (as C6H5OH) mg/L 0.001 BDL BDL
26. Surface Active Agents
(as MBAS) mg/L BDL BDL
27. Organo Chlorine
Pesticides
I. Alachlor µg/L 20.0 BDL BDL
II. Atrazine µg/L 2.0 BDL BDL
III. Aldrin µg/L 0.03 BDL BDL
IV. Dieldrin µg/L 0.03 BDL BDL
V. Alpha HCH µg/L 0.01 BDL BDL
VI. Beta HCH µg/L 0.04 BDL BDL
Severely Polluted Areas: Monitoring, sampling, analysis of Stack, Ambient Air Quality, Surface Water, Ground Water, Waste Water
Chembur 34
Location RCF HPCL
Date of Sampling 02.01.2019 02.01.2019
Sr. Parameters Unit Std. Limit Results
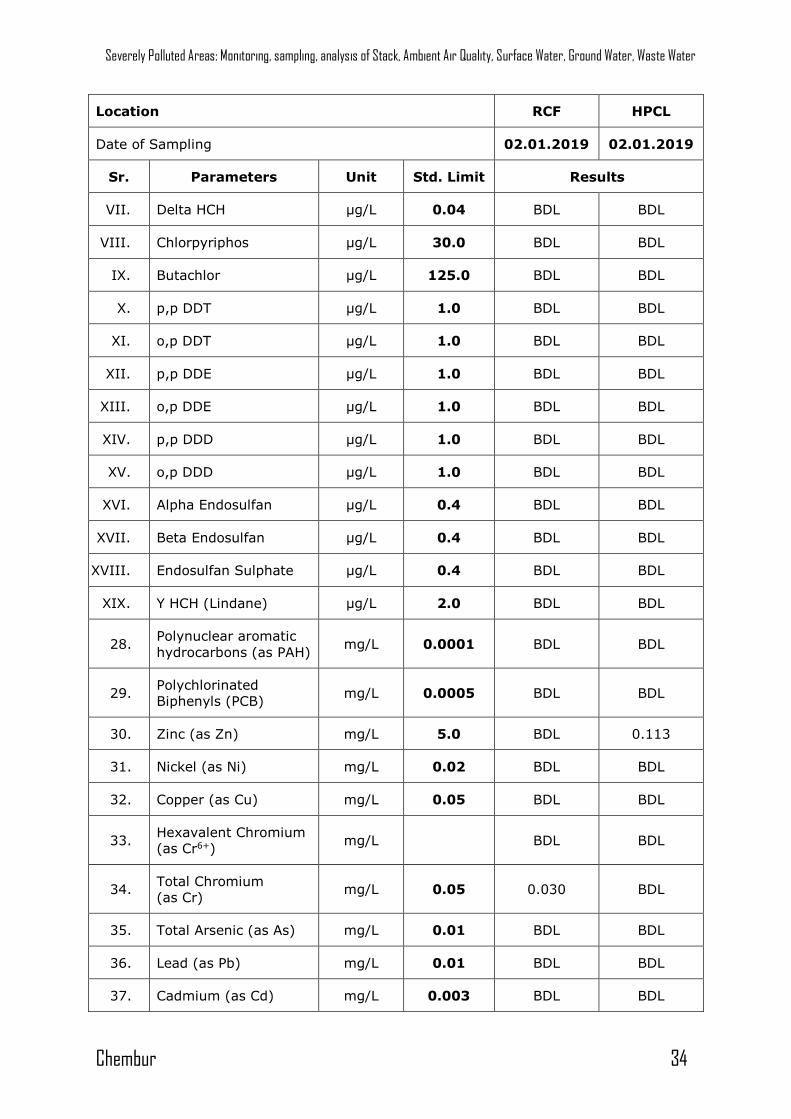
VII. Delta HCH µg/L 0.04 BDL BDL
VIII. Chlorpyriphos µg/L 30.0 BDL BDL
IX. Butachlor µg/L 125.0 BDL BDL
X. p,p DDT µg/L 1.0 BDL BDL
XI. o,p DDT µg/L 1.0 BDL BDL
XII. p,p DDE µg/L 1.0 BDL BDL
XIII. o,p DDE µg/L 1.0 BDL BDL
XIV. p,p DDD µg/L 1.0 BDL BDL
XV. o,p DDD µg/L 1.0 BDL BDL
XVI. Alpha Endosulfan µg/L 0.4 BDL BDL
XVII. Beta Endosulfan µg/L 0.4 BDL BDL
XVIII. Endosulfan Sulphate µg/L 0.4 BDL BDL
XIX. Y HCH (Lindane) µg/L 2.0 BDL BDL
28. Polynuclear aromatic
hydrocarbons (as PAH) mg/L 0.0001 BDL BDL
29. Polychlorinated
Biphenyls (PCB) mg/L 0.0005 BDL BDL
30. Zinc (as Zn) mg/L 5.0 BDL 0.113
31. Nickel (as Ni) mg/L 0.02 BDL BDL
32. Copper (as Cu) mg/L 0.05 BDL BDL
33. Hexavalent Chromium
(as Cr6+) mg/L BDL BDL
34. Total Chromium
(as Cr) mg/L 0.05 0.030 BDL
35. Total Arsenic (as As) mg/L 0.01 BDL BDL
36. Lead (as Pb) mg/L 0.01 BDL BDL
37. Cadmium (as Cd) mg/L 0.003 BDL BDL
Severely Polluted Areas: Monitoring, sampling, analysis of Stack, Ambient Air Quality, Surface Water, Ground Water, Waste Water
Chembur 35
Location RCF HPCL
Date of Sampling 02.01.2019 02.01.2019
Sr. Parameters Unit Std. Limit Results
38. Mercury (as Hg) mg/L 0.001 BDL BDL
39. Manganese(as Mn) mg/L 0.1 0.355 BDL
40. Iron (as Fe) mg/L 0.3 2.26 BDL
41. Vanadium (as V) mg/L BDL BDL
42. Selenium (as Se) mg/L 0.01 BDL BDL
43. Boron (as B) mg/L 0.5 BDL BDL
44. Bioassay Test on fish %
survival 90 100
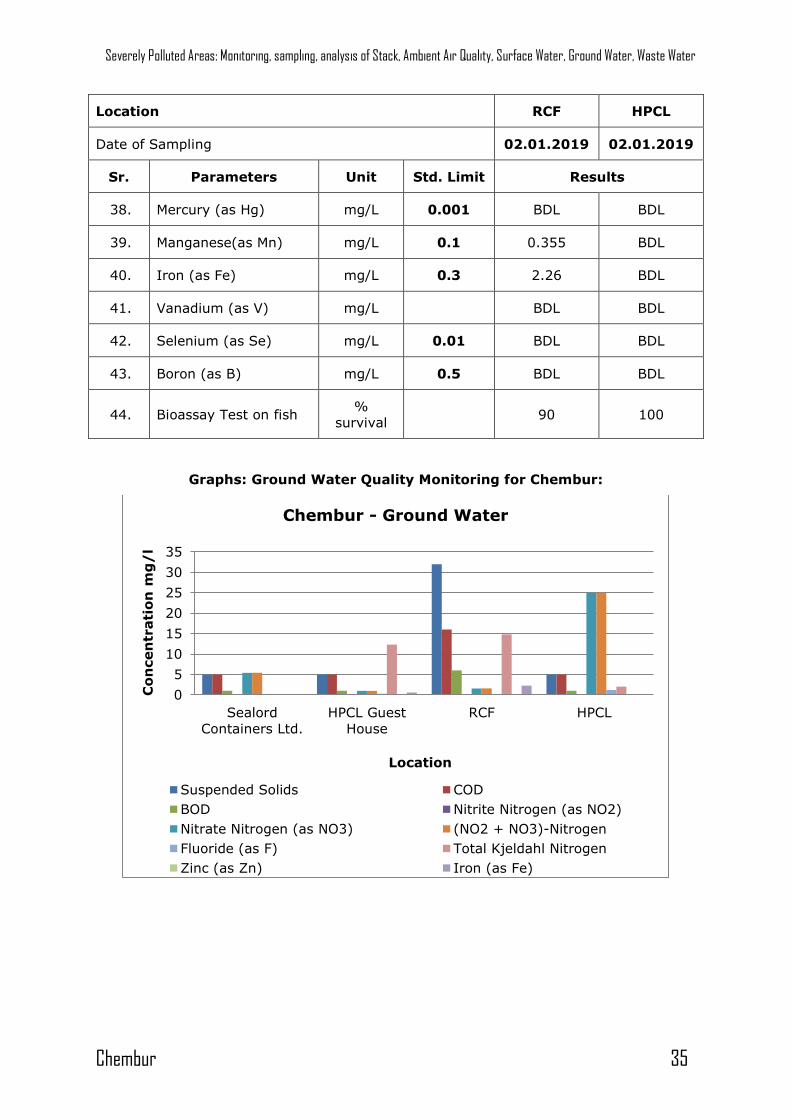
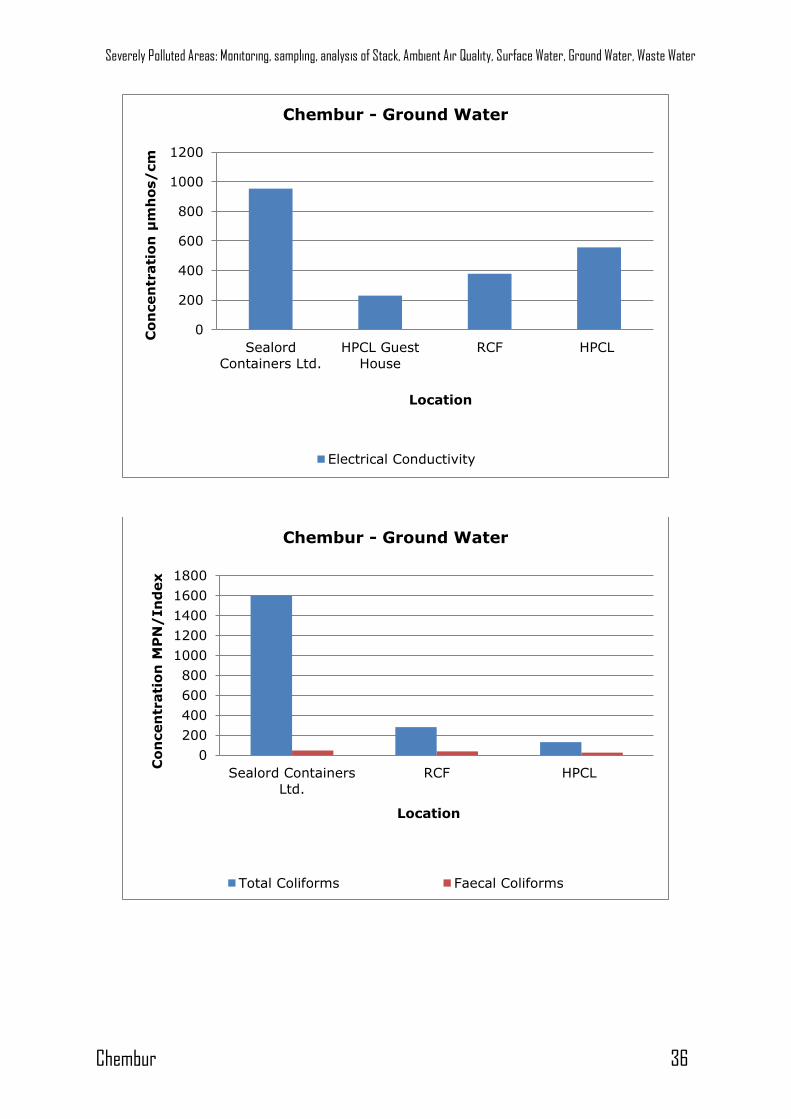
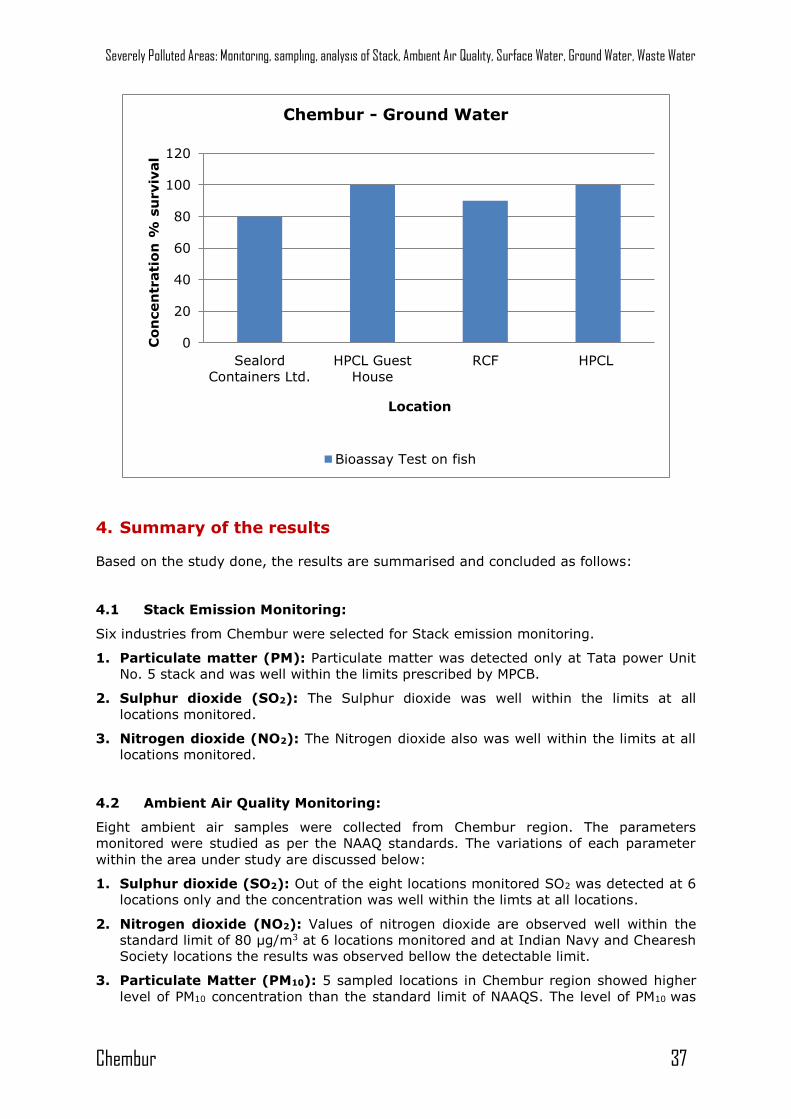
Graphs: Ground Water Quality Monitoring for Chembur:
0
5
10
15
20
25
30
35
Sealord
Containers Ltd.
HPCL Guest
House
RCF HPCL
Co
ncen
trati
on
mg
/l
Location
Chembur - Ground Water
Suspended Solids COD
BOD Nitrite Nitrogen (as NO2)
Nitrate Nitrogen (as NO3) (NO2 + NO3)-Nitrogen
Fluoride (as F) Total Kjeldahl Nitrogen
Zinc (as Zn) Iron (as Fe)
Severely Polluted Areas: Monitoring, sampling, analysis of Stack, Ambient Air Quality, Surface Water, Ground Water, Waste Water
Chembur 36
0
200
400
600
800
1000
1200
Sealord
Containers Ltd.
HPCL Guest
House
RCF HPCL
Co
ncen
trati
on
μmhos/cm
Location
Chembur - Ground Water
Electrical Conductivity
0
200
400
600
800
1000
1200
1400
1600
1800
Sealord Containers
Ltd.
RCF HPCL
Co
ncen
trati
on
MP
N/
In
dex
Location
Chembur - Ground Water
Total Coliforms Faecal Coliforms
Severely Polluted Areas: Monitoring, sampling, analysis of Stack, Ambient Air Quality, Surface Water, Ground Water, Waste Water
Chembur 37
4. Summary of the results
Based on the study done, the results are summarised and concluded as follows:
4.1 Stack Emission Monitoring:
Six industries from Chembur were selected for Stack emission monitoring.
1. Particulate matter (PM): Particulate matter was detected only at Tata power Unit
No. 5 stack and was well within the limits prescribed by MPCB.
2. Sulphur dioxide (SO2): The Sulphur dioxide was well within the limits at all
locations monitored.
3. Nitrogen dioxide (NO2): The Nitrogen dioxide also was well within the limits at all
locations monitored.
4.2 Ambient Air Quality Monitoring:
Eight ambient air samples were collected from Chembur region. The parameters
monitored were studied as per the NAAQ standards. The variations of each parameter
within the area under study are discussed below:
1. Sulphur dioxide (SO2): Out of the eight locations monitored SO2 was detected at 6
locations only and the concentration was well within the limts at all locations.
2. Nitrogen dioxide (NO2): Values of nitrogen dioxide are observed well within the
standard limit of 80 µg/m3 at 6 locations monitored and at Indian Navy and Chearesh
Society locations the results was observed bellow the detectable limit.
3. Particulate Matter (PM10): 5 sampled locations in Chembur region showed higher
level of PM10 concentration than the standard limit of NAAQS. The level of PM10 was
0
20
40
60
80
100
120
Sealord
Containers Ltd.
HPCL Guest
House
RCF HPCL
Co
ncen
trati
on
% s
urviv
al
Location
Chembur - Ground Water
Bioassay Test on fish
Severely Polluted Areas: Monitoring, sampling, analysis of Stack, Ambient Air Quality, Surface Water, Ground Water, Waste Water
Chembur 38
higher at Aegis Logistic Ltd., Sealord Containers Ltd., RCF, HPCL and BPCL with
278 µg/m3, 217 µg/m3, 224 µg/m3, 483 µg/m3 and 254 µg/m3 respectively.
4. Particulate Matter (PM2.5): 3 sampled locations in Chembur region showed higher
level of PM2.5 concentration than the standard limit of NAAQS. The level of PM2.5 was
higher at Aegis Logistic Ltd., HPCL and BPCL with 65 µg/m3, 118 µg/m3 and
66 µg/m3 respectively.
5. .Ozone (O3): Ozone was found to be below detectable limit in all 8 locations
monitored.
6. Lead (Pb): Lead also was found to be below detectable limit in all 8 locations
monitored.
7. Carbon Monoxide (CO): 3 sampled locations in Chembur region showed higher
level of CO concentration than the standard limit of NAAQS. The level of CO was
higher at RCF, BPCL and Tata Power with 6.27 µg/m3, 10 µg/m3 and 5.09 µg/m3
respectively.
8. .Ammonia (NH3): Ammonia was below the detectable limit at all 8 locations
monitored.
9. Benzene (C6H6): Out of 8 locations monitored, 2 locations have benzene
concentration higher than 5 µg/m3 which is the standard limit as per NAAQS. The
level of C6H6 was higher at Sealord Containers Ltd and Tata Power with 9.26 µg/m3
and 9.26 µg/m3 respectively.
10. Benzo(a)pyrene (BaP): BaP was below detectable limit in all 8 locations
monitored.
11. Arsenic (As): At all 8 locations monitored, the concentration of Arsenic was found
well with the standard limit of 6 µg/m3.
12. Nickel (Ni): Concentration of Nickel also At all 8 locations monitored was well within
the standard limit of 20 µg/m3.
4.3 Waste Water Quality Monitoring:
To understand the quality of waste water quality, surface water samples was collected
from 6 surface water source of Chembur. Considering the general parameters, following
are the conclusions:
1. Colour: Colour units were 1 Hazen unit at all six surface water samples collected.
2. Odour: odour of all waste water samples collected is found agreeable except
Malgaon Dock Material Gate surface water.
3. pH: it is observed in between 7 and 7.83 which is well within the range.
4. Suspended Solids: Suspended solids of all 6 water sample was below the
detectable limit at all 6 surface water samples collected.
5. Chemical Oxygen Demand: All samples collected, were well within the limit
required as per standard. The highest COD was observed at Malgaon Dock Material
Gate with 188 mg/L concentration.
6. Biochemical Oxygen Demand: One out of the 6 surface water samples collected
the concentration of BOD have exceeding only at Malgaon Dock Material Gate than
the limit required as per standard of BOD.
7. Sulphide: 6 samples collected were found to have below detectable limit.
8. Total Ammoia: All 6 samples collected had concentration of Total ammonia well
within the limits.
Severely Polluted Areas: Monitoring, sampling, analysis of Stack, Ambient Air Quality, Surface Water, Ground Water, Waste Water
Chembur 39
9. Total Kjeldahl Nitrogen: All 6 water samples collected had TKN concentration well,
within the limit of 100 mg/L.
10. Fish Bioassay: 100% Survival was attained in 3 water samples collected for
Bioassay test.
11. Heavy metals: All the heavy metals are found below the standard limits in all the
samples.
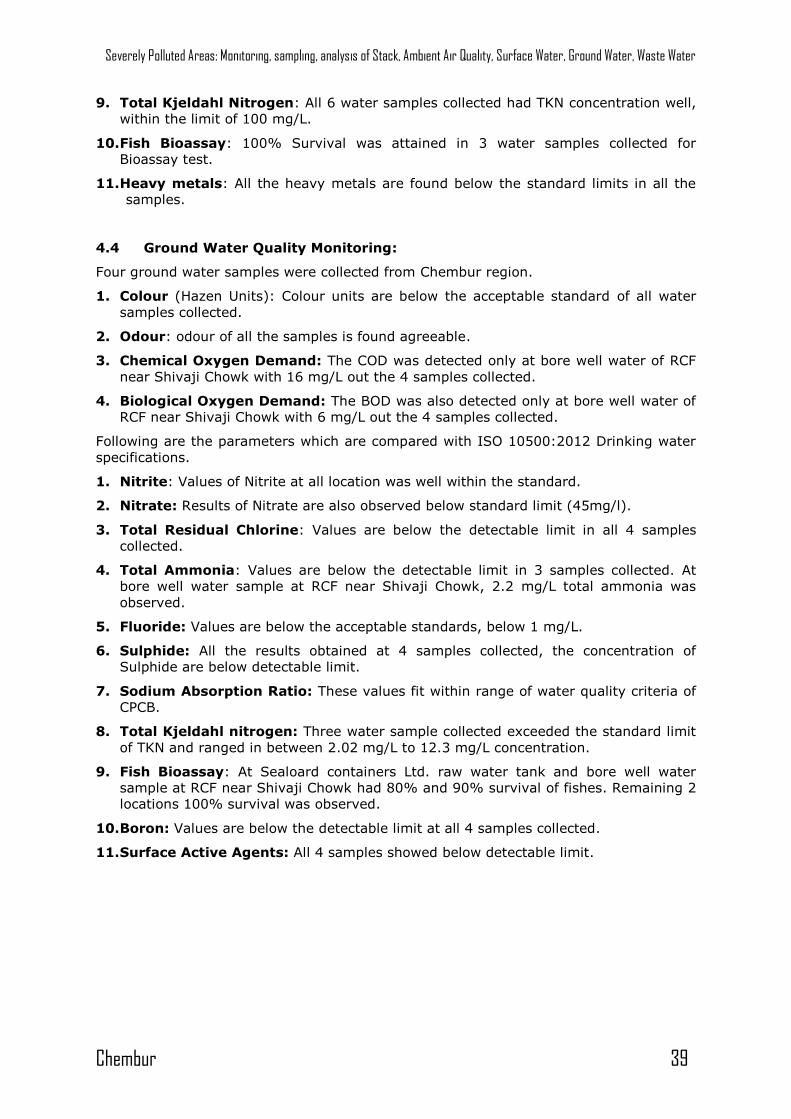
4.4 Ground Water Quality Monitoring:
Four ground water samples were collected from Chembur region.
1. Colour (Hazen Units): Colour units are below the acceptable standard of all water
samples collected.
2. Odour: odour of all the samples is found agreeable.
3. Chemical Oxygen Demand: The COD was detected only at bore well water of RCF
near Shivaji Chowk with 16 mg/L out the 4 samples collected.
4. Biological Oxygen Demand: The BOD was also detected only at bore well water of
RCF near Shivaji Chowk with 6 mg/L out the 4 samples collected.
Following are the parameters which are compared with ISO 10500:2012 Drinking water
specifications.
1. Nitrite: Values of Nitrite at all location was well within the standard.
2. Nitrate: Results of Nitrate are also observed below standard limit (45mg/l).
3. Total Residual Chlorine: Values are below the detectable limit in all 4 samples
collected.
4. Total Ammonia: Values are below the detectable limit in 3 samples collected. At
bore well water sample at RCF near Shivaji Chowk, 2.2 mg/L total ammonia was
observed.
5. Fluoride: Values are below the acceptable standards, below 1 mg/L.
6. Sulphide: All the results obtained at 4 samples collected, the concentration of
Sulphide are below detectable limit.
7. Sodium Absorption Ratio: These values fit within range of water quality criteria of
CPCB.
8. Total Kjeldahl nitrogen: Three water sample collected exceeded the standard limit
of TKN and ranged in between 2.02 mg/L to 12.3 mg/L concentration.
9. Fish Bioassay: At Sealoard containers Ltd. raw water tank and bore well water
sample at RCF near Shivaji Chowk had 80% and 90% survival of fishes. Remaining 2
locations 100% survival was observed.
10. Boron: Values are below the detectable limit at all 4 samples collected.
11. Surface Active Agents: All 4 samples showed below detectable limit.
Severely Polluted Areas: Monitoring, sampling, analysis of Stack, Ambient Air Quality, Surface Water, Ground Water, Waste Water
Chembur 40
5. CEPI Score
Comprehensive Environmental Pollution Index (CEPI) is intended to act as early warning
tool which helps in categorization of industrial clusters/areas in terms of priority of
needing attention.
CPCB had evolved certain methodology to calculate CEPI, in which a score has been
fixed for different environmental components based on the level of pollution. The scoring
system involves an algorithm that takes into account the basic selection criteria. This
approach is based on the basic hazard assessment logic that can be summarized as
below.
Hazard = pollutant source, pathways, and receptor
CPCB has calculated CEPI for the identified critically polluted industrial clusters. It is
calculated separately for air, water, and land. The basic framework and scoring system
of the CEPI – based on three factors namely pollutant, pathway, and receptor – has been
described further under this section.
To overcome the subjectivity, revised concept is proposed by eliminating the subjective
factors as described in the previous section but retaining the factors which can be
measured precisely.
I. Revised concept is prepared by eliminating the debatable factors but retaining the
factors which can be measured precisely.
II. It is decided to develop the Comprehensive Environmental Pollution Index (CEPI)
retaining the existing algorithm of Source, Pathway and Receptor.
III. Health component was also retained in the revised concept in line with the
suggestions of Secretary, MoEFCC during the meeting held in MoEF.
Outlines of revised CEPI 2016 criteria
The outlines of the revised CEPI criteria are as follows:
1. It is proposed to develop the Comprehensive Environmental Pollution Index
(CEPI) based on Sources of pollution, real time observed values of the pollutants
in the ambient air, surface water and ground water in & around the industrial
cluster and health related statistics.
2. For assessment of the environmental quality of the area i.e. CEPI score, the
concept of SNLF i.e. a surrogate number which represents the level of exposure
(a function of percentage sample Exceedance & Exceedance Factor) shall be used.
3. Health component to be evaluated based on the health data available from major
hospitals in the area was also retained in the revised concept.
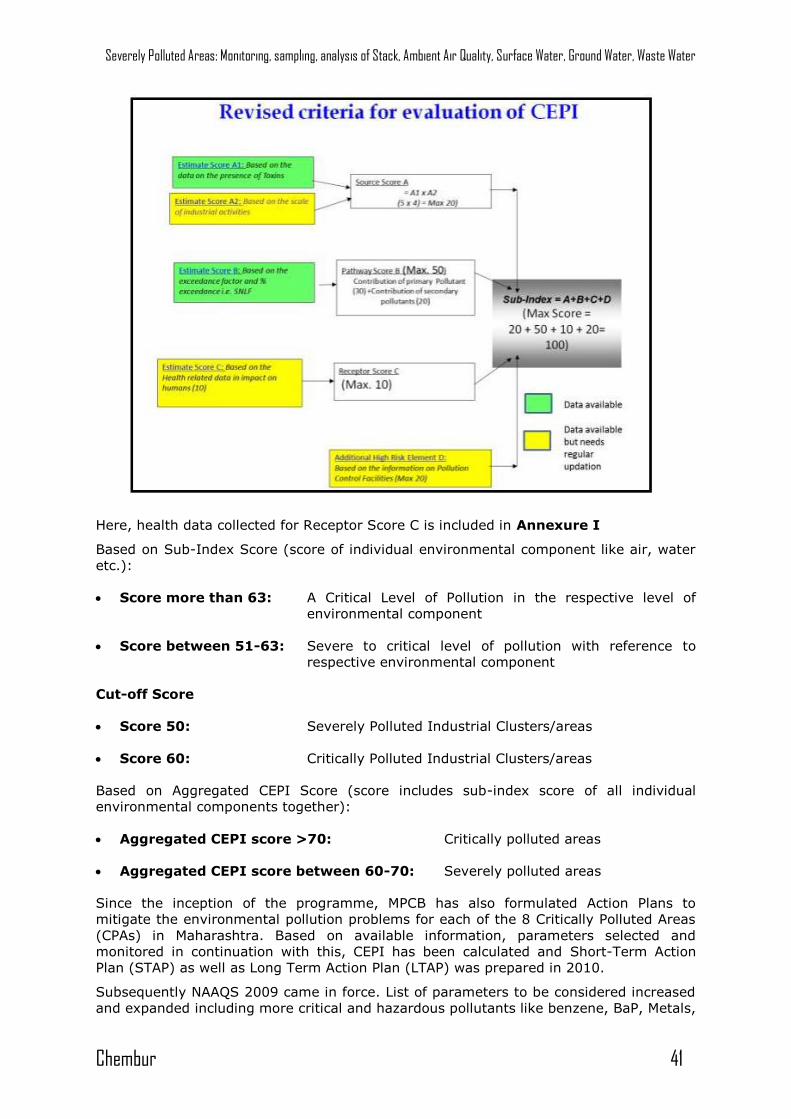
The evaluation criterion of the revised CEPI version 2016 is described in the flowchart
given below:
Severely Polluted Areas: Monitoring, sampling, analysis of Stack, Ambient Air Quality, Surface Water, Ground Water, Waste Water
Chembur 41
Here, health data collected for Receptor Score C is included in Annexure I
Based on Sub-Index Score (score of individual environmental component like air, water
etc.):
Score more than 63: A Critical Level of Pollution in the respective level of
environmental component
Score between 51-63: Severe to critical level of pollution with reference to
respective environmental component
Cut-off Score
Score 50: Severely Polluted Industrial Clusters/areas
Score 60: Critically Polluted Industrial Clusters/areas
Based on Aggregated CEPI Score (score includes sub-index score of all individual
environmental components together):
Aggregated CEPI score >70: Critically polluted areas
Aggregated CEPI score between 60-70: Severely polluted areas
Since the inception of the programme, MPCB has also formulated Action Plans to
mitigate the environmental pollution problems for each of the 8 Critically Polluted Areas
(CPAs) in Maharashtra. Based on available information, parameters selected and
monitored in continuation with this, CEPI has been calculated and Short-Term Action
Plan (STAP) as well as Long Term Action Plan (LTAP) was prepared in 2010.
Subsequently NAAQS 2009 came in force. List of parameters to be considered increased
and expanded including more critical and hazardous pollutants like benzene, BaP, Metals,
Severely Polluted Areas: Monitoring, sampling, analysis of Stack, Ambient Air Quality, Surface Water, Ground Water, Waste Water
Chembur 42
etc. existing in the environment. There was revision of standards (limiting values) as
well. In this present report of February, 2019 prepared by MPCB, CEPI is calculated
considering all these revised standards’ limiting values, list of parameters and complete
scope of monitoring.
5.1 Comparison of CEPI scores:
The result shows that CEPI score of present report is 42.28. The present study is the
compilation of post monsoon season, which also regulates the score value. This time
locations under study were different from past studies. Hence, comparative results
cannot be illustrated and discussed. But the overall CEPI is observed as 42.28 in
Chembur city, which falls below the category of severely polluted areas, according to the
revised CEPI guidelines. Hence, it can be concluded that the industries are following
environmental rules and regulations laid by MoEF and MPCB to control the pollution and
to keep the environment clean and green.
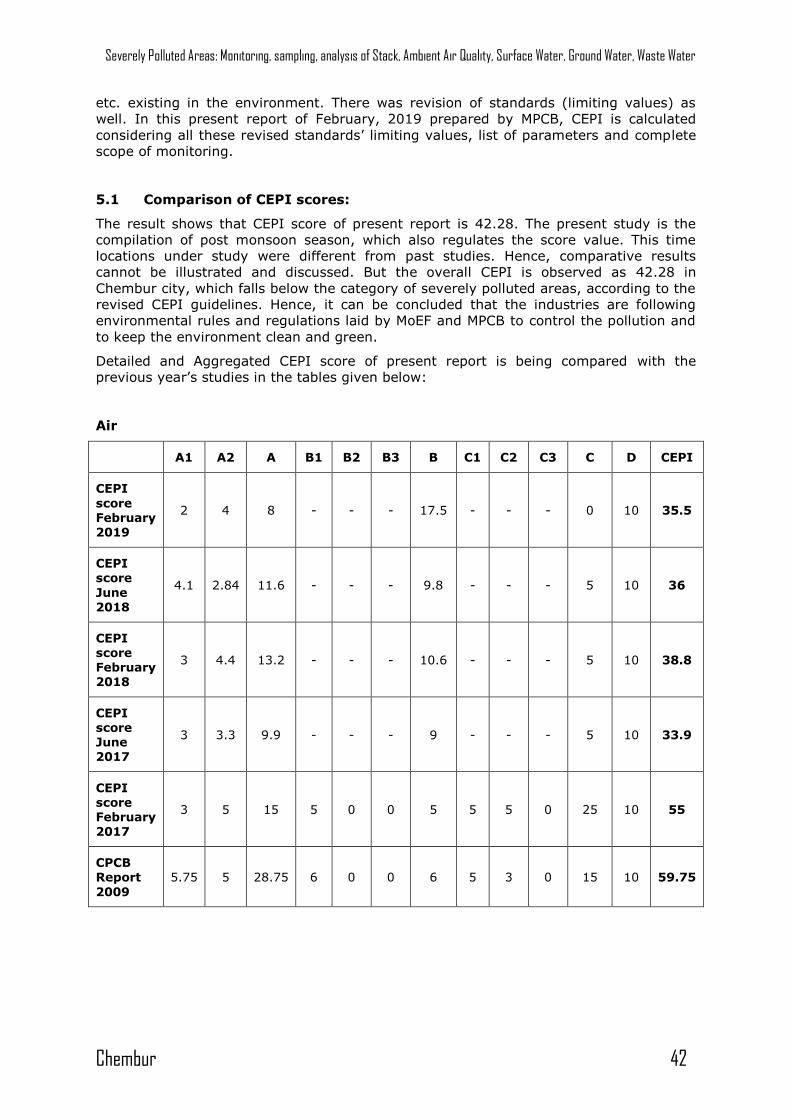
Detailed and Aggregated CEPI score of present report is being compared with the
previous year’s studies in the tables given below:
Air
A1 A2 A B1 B2 B3 B C1 C2 C3 C D CEPI
CEPI
score February 2019
2 4 8 - - - 17.5 - - - 0 10 35.5
CEPI score
June 2018
4.1 2.84 11.6 - - - 9.8 - - - 5 10 36
CEPI score February 2018
3 4.4 13.2 - - - 10.6 - - - 5 10 38.8
CEPI score June 2017
3 3.3 9.9 - - - 9 - - - 5 10 33.9
CEPI score February
2017
3 5 15 5 0 0 5 5 5 0 25 10 55
CPCB Report
2009
5.75 5 28.75 6 0 0 6 5 3 0 15 10 59.75
Severely Polluted Areas: Monitoring, sampling, analysis of Stack, Ambient Air Quality, Surface Water, Ground Water, Waste Water
Chembur 43
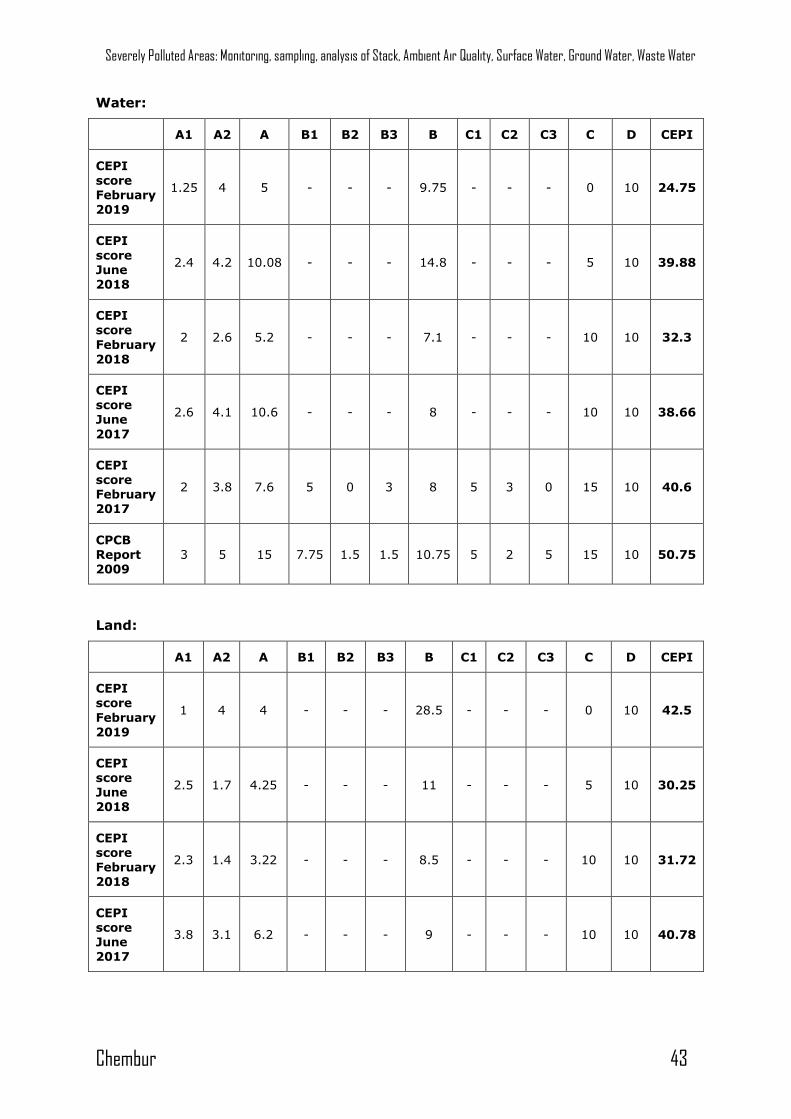
Water:
A1 A2 A B1 B2 B3 B C1 C2 C3 C D CEPI
CEPI score February 2019
1.25 4 5 - - - 9.75 - - - 0 10 24.75
CEPI score June 2018
2.4 4.2 10.08 - - - 14.8 - - - 5 10 39.88
CEPI score
February
2018
2 2.6 5.2 - - - 7.1 - - - 10 10 32.3
CEPI score June
2017
2.6 4.1 10.6 - - - 8 - - - 10 10 38.66
CEPI score February 2017
2 3.8 7.6 5 0 3 8 5 3 0 15 10 40.6
CPCB Report 2009
3 5 15 7.75 1.5 1.5 10.75 5 2 5 15 10 50.75
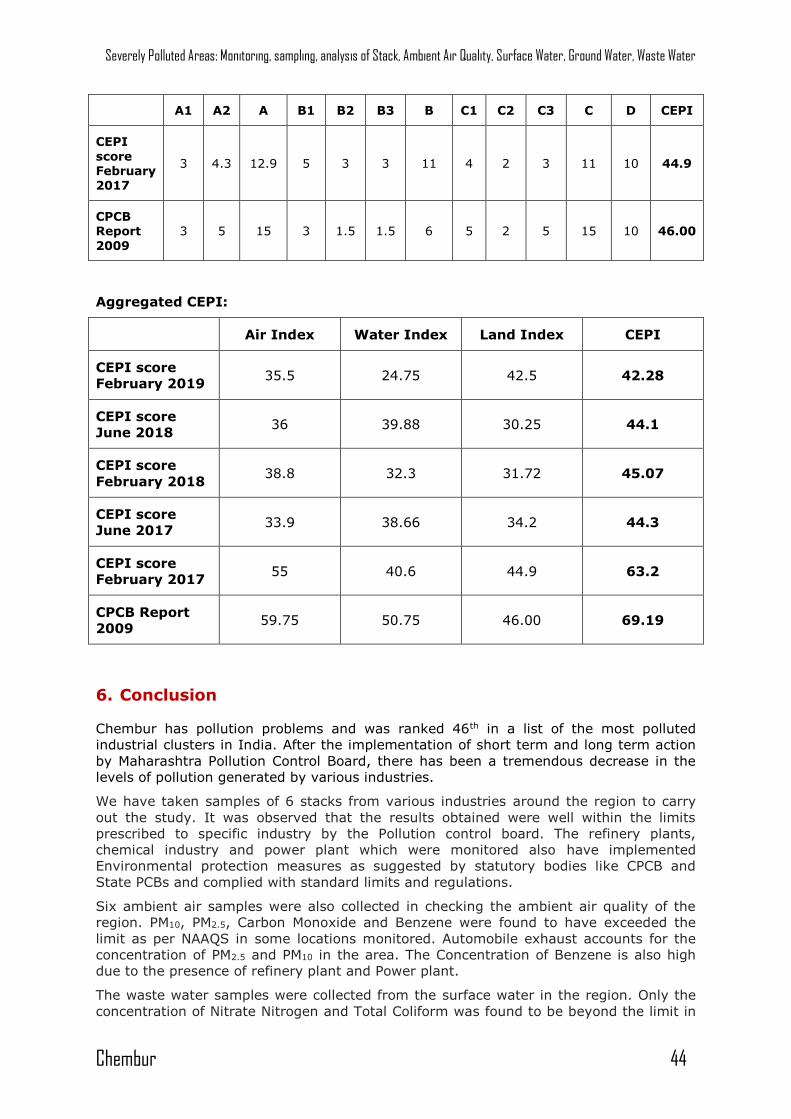
Land:
A1 A2 A B1 B2 B3 B C1 C2 C3 C D CEPI
CEPI score
February 2019
1 4 4 - - - 28.5 - - - 0 10 42.5
CEPI score June 2018
2.5 1.7 4.25 - - - 11 - - - 5 10 30.25
CEPI score February 2018
2.3 1.4 3.22 - - - 8.5 - - - 10 10 31.72
CEPI score June 2017
3.8 3.1 6.2 - - - 9 - - - 10 10 40.78
Severely Polluted Areas: Monitoring, sampling, analysis of Stack, Ambient Air Quality, Surface Water, Ground Water, Waste Water
Chembur 44
A1 A2 A B1 B2 B3 B C1 C2 C3 C D CEPI
CEPI
score February 2017
3 4.3 12.9 5 3 3 11 4 2 3 11 10 44.9
CPCB Report
2009
3 5 15 3 1.5 1.5 6 5 2 5 15 10 46.00
Aggregated CEPI:
Air Index Water Index Land Index CEPI
CEPI score
February 2019 35.5 24.75 42.5 42.28
CEPI score
June 2018 36 39.88 30.25 44.1
CEPI score
February 2018 38.8 32.3 31.72 45.07
CEPI score
June 2017 33.9 38.66 34.2 44.3
CEPI score
February 2017 55 40.6 44.9 63.2
CPCB Report
2009 59.75 50.75 46.00 69.19
6. Conclusion
Chembur has pollution problems and was ranked 46th in a list of the most polluted
industrial clusters in India. After the implementation of short term and long term action
by Maharashtra Pollution Control Board, there has been a tremendous decrease in the
levels of pollution generated by various industries.
We have taken samples of 6 stacks from various industries around the region to carry
out the study. It was observed that the results obtained were well within the limits
prescribed to specific industry by the Pollution control board. The refinery plants,
chemical industry and power plant which were monitored also have implemented
Environmental protection measures as suggested by statutory bodies like CPCB and
State PCBs and complied with standard limits and regulations.
Six ambient air samples were also collected in checking the ambient air quality of the
region. PM10, PM2.5, Carbon Monoxide and Benzene were found to have exceeded the
limit as per NAAQS in some locations monitored. Automobile exhaust accounts for the
concentration of PM2.5 and PM10 in the area. The Concentration of Benzene is also high
due to the presence of refinery plant and Power plant.
The waste water samples were collected from the surface water in the region. Only the
concentration of Nitrate Nitrogen and Total Coliform was found to be beyond the limit in
Severely Polluted Areas: Monitoring, sampling, analysis of Stack, Ambient Air Quality, Surface Water, Ground Water, Waste Water
Chembur 45
some of the samples identified. We can correct this by taking better measures in the
treatment plant so that the outlet water is in the prescribed limit for disposal.
In the ground water samples collected, almost all parameter are found to well within the
standard limit as per ISO 10500:2012 Drinking water specifications. The ground water
collected is from Borewell and is not used for drinking purpose.
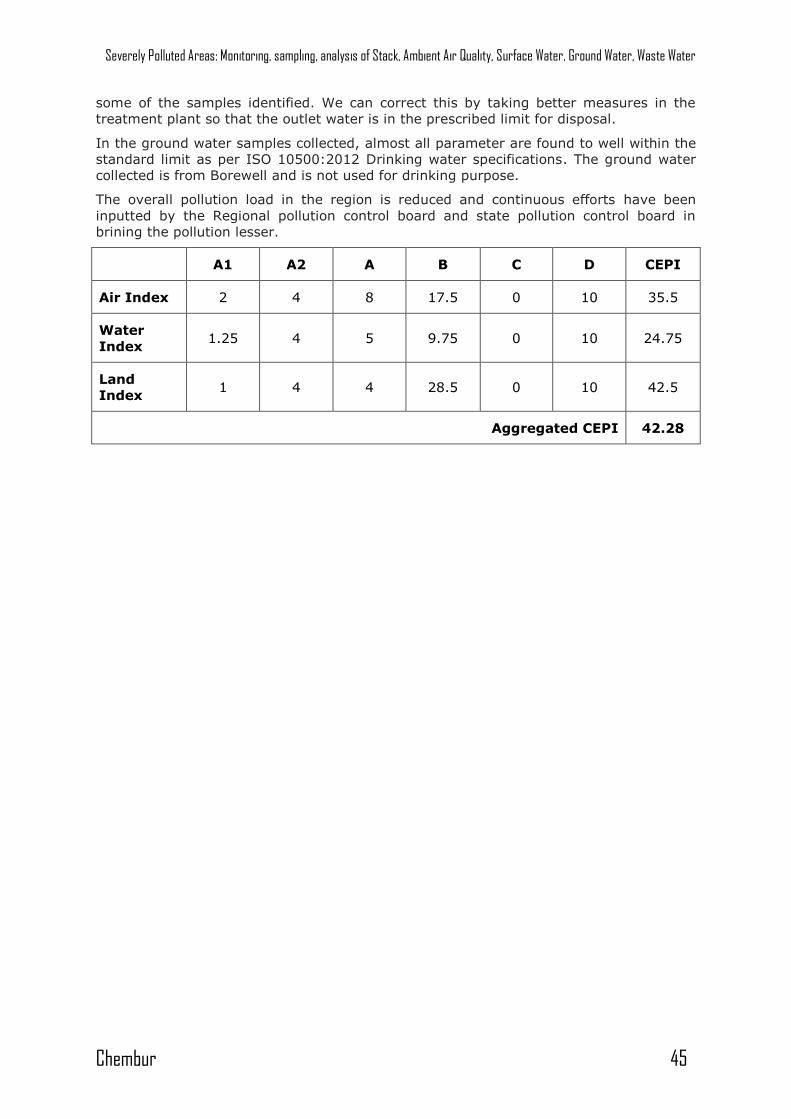
The overall pollution load in the region is reduced and continuous efforts have been
inputted by the Regional pollution control board and state pollution control board in
brining the pollution lesser.
A1 A2 A B C D CEPI
Air Index 2 4 8 17.5 0 10 35.5
Water
Index 1.25 4 5 9.75 0 10 24.75
Land
Index 1 4 4 28.5 0 10 42.5
Aggregated CEPI 42.28
Severely Polluted Areas: Monitoring, sampling, analysis of Stack, Ambient Air Quality, Surface Water, Ground Water, Waste Water
Chembur 46
7. Efforts taken for reduction in pollution
The regional office of Maharashtra pollution control board has taken various initiatives in
reducing the CEPI Score of 69.19 of 2009 to 42.28 of February 2019. Below mentioned
are some of the efforts:
Regional office of MPCB has carried out strict inspection and surveillance of major
industries & identifies non-complying units.
Non Complied identified industries shall upgrade their APC & Shall ensure that the
industries upgrade their APC failing which action to be initiated against industries.
Find below measures taken by major industries in the area as per the directions provided
by MPCB:
1. HPCL
Provided 2 Nos. of ETP to treat trade effluent & floor wash and tank drains.
Mechanical (API) separators and Skim pond to handle cooling water discharge to
sea.
Two train of Su CO-Boiler for FCCU off gases
Utilization of pipelines for transportation of products
Installed De-sulphurization facilities for HSD
Mechanical Oil Recovery & Bio-Remediation treatment of Oily Sludge
Green Fuel Emission Control Projects (including FGD for FCCU off gases)
2. BPCL
Two Sulphur recovery units.
Diesel Hydrodesulphurization facilities for production of low Sulphur diesel.
Provision of 3 Nos. high efficiency Boilers in place of old vintage boilers
Use of De-SOx additive in regenerator of FCCU
Installation of Benzene vapour recovery scheme at Trombay Dispatch Unit
Production of Euro III Grade products
Mechanical Oil Recovery & Bio-Remediation treatment of Oily Sludge
3. Tata Power
Industry has provided Electrostatic Precipitator & Flue Gas Desulphurization units
at Unit No. 5 to control particulate emission & SO2 emission levels. They have
provided ETP at DM Plant.
Installed FGD for Unit 5 and Unit 8
ESP for Unit 5 and unit 8
Low NOx Burner For unit no 7
Installed two STP (Sewage Treatment Plant)
Installed state of art, Screw unloader at coal yard for coal unloading.
Pipe Conveyer for coal movement for unit 5 and unit 8 to reduce the fugitive
emission.
Using imported low ash low Sulphur coal for unit 5 and unit 8
Bioremediation of Oily sludge.
Installed CAAQMS station at two different locations
Severely Polluted Areas: Monitoring, sampling, analysis of Stack, Ambient Air Quality, Surface Water, Ground Water, Waste Water
Chembur 47
Installed Aerators for reducing the condenser outlet temperature
Cooling water system for reduction of temperature of discharge water
100% ash utilization
Adequate green cover development in the plant area
Brick making activity out of bottom ash
4. RCF
Hot flare stack to eliminate the chances of ammonia emission to atmosphere.
De-dusting system on the top of the Prilling Tower to reduces dust emission
problem. Dust emission is 25-30 mg/Nm3
Hydrolyser system for recovery of ammonia from waste water stream.
Installation of New LP/Waste water vent gas scrubber for recovering ammonia
from the LP/Waste water vent gases.
Exporting of MP section Vent gases to Steam Generation Plant thus reducing fuel
consumption in Steam Generation Plant.
Installation of Fume scrubbers to for reaction section.
Addition of urea solution to reactor to reduce NOx emission.
Installation of Spray scrubbers & Ventury cyclones for control of Spherodizer
dust.
Dust cyclones, Bag filters for dust control.
Adoption of granulation technology with high efficiency cyclone, ventury
scrubbers and Tail Gas Scrubbers to reduce dust nuisance.
Addition of urea solution to reactor to reduce NOx emission.
Scrubbers, bag filters, cyclones provided as required.
5. Sea Lord Containers Ltd.
M/s. Sea Lord Containers Ltd & M/s. Aegis Logistics Ltd are located in Mahul,
Ambapada, Chembur area which handling chemicals & Petrochemicals in Tank
Forms.
MPC Board has received frequent complaints from residents of Village Mahul,
regarding the smell nuisance and air pollution due to tankage and allied
operations of M/s. Sea Lord Containers Ltd, & M/s. Aegis Logistics Ltd.
The residents have filed an application no. 40 (WZ) of 2014 in National Green
Tribunal, Western Zone Bench, Pune on the above issue principally alleging odour
nuisance due to the tankages and allied operations of M/s. Sea Lord Containers
Ltd.
In order to address the issues raised in the proper perspective and in view of
need for specialized expertise, Maharashtra Pollution Control Board constituted a
Committee comprising experts in the field such as Petroleum and Explosive
Safety Organization (PESO), Directorate of Industrial Safety and Health (DISH)
and technical experts in the field to study the matter in-depth and give their
recommendations on the issues being raised
Severely Polluted Areas: Monitoring, sampling, analysis of Stack, Ambient Air Quality, Surface Water, Ground Water, Waste Water
Chembur 48
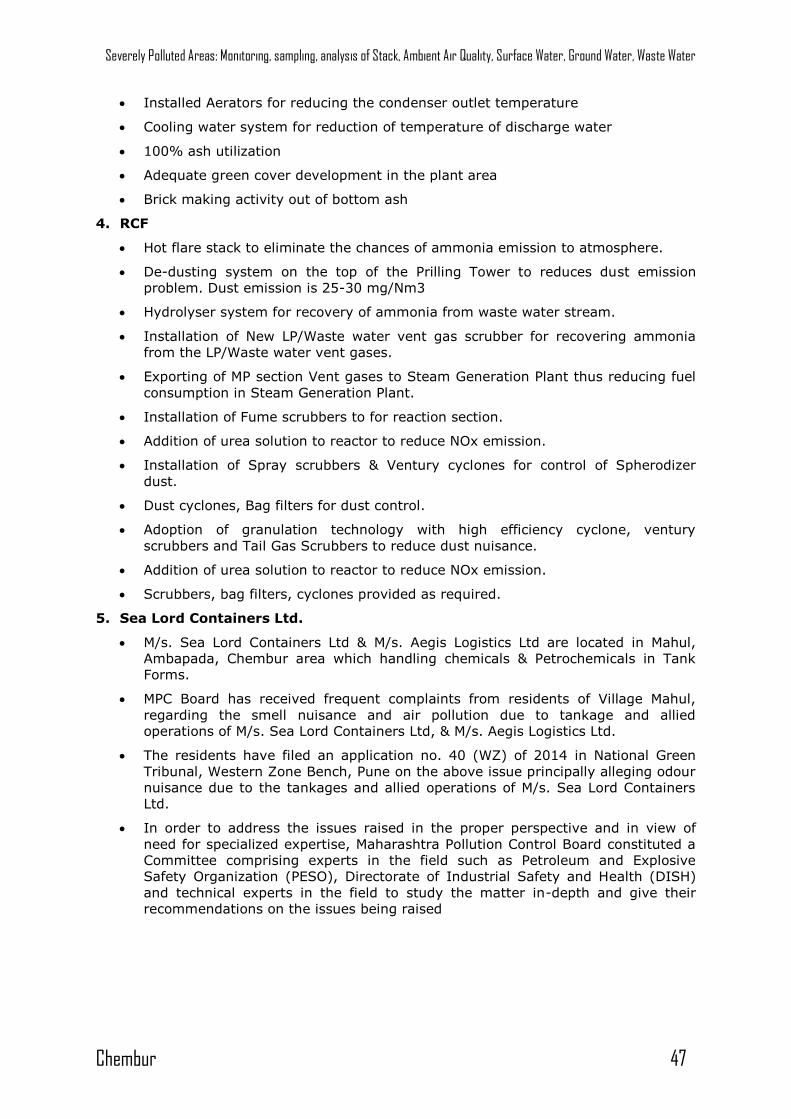
8. Photographs
Ambient Air Monitoring at Tata Power
Ambient Air Monitoring at RCF
Severely Polluted Areas: Monitoring, sampling, analysis of Stack, Ambient Air Quality, Surface Water, Ground Water, Waste Water
Chembur 49
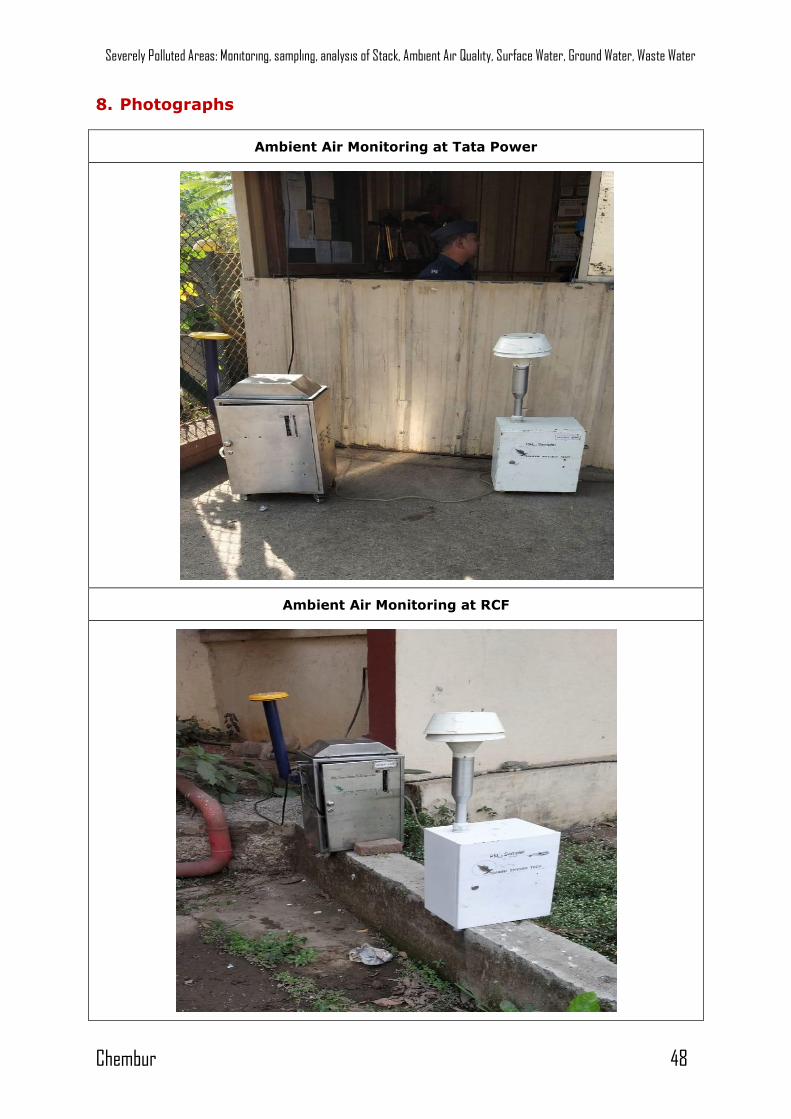
Ambient Air Monitoring at HPCL
Freeway Mysore colony nalah
Severely Polluted Areas: Monitoring, sampling, analysis of Stack, Ambient Air Quality, Surface Water, Ground Water, Waste Water
Chembur 50
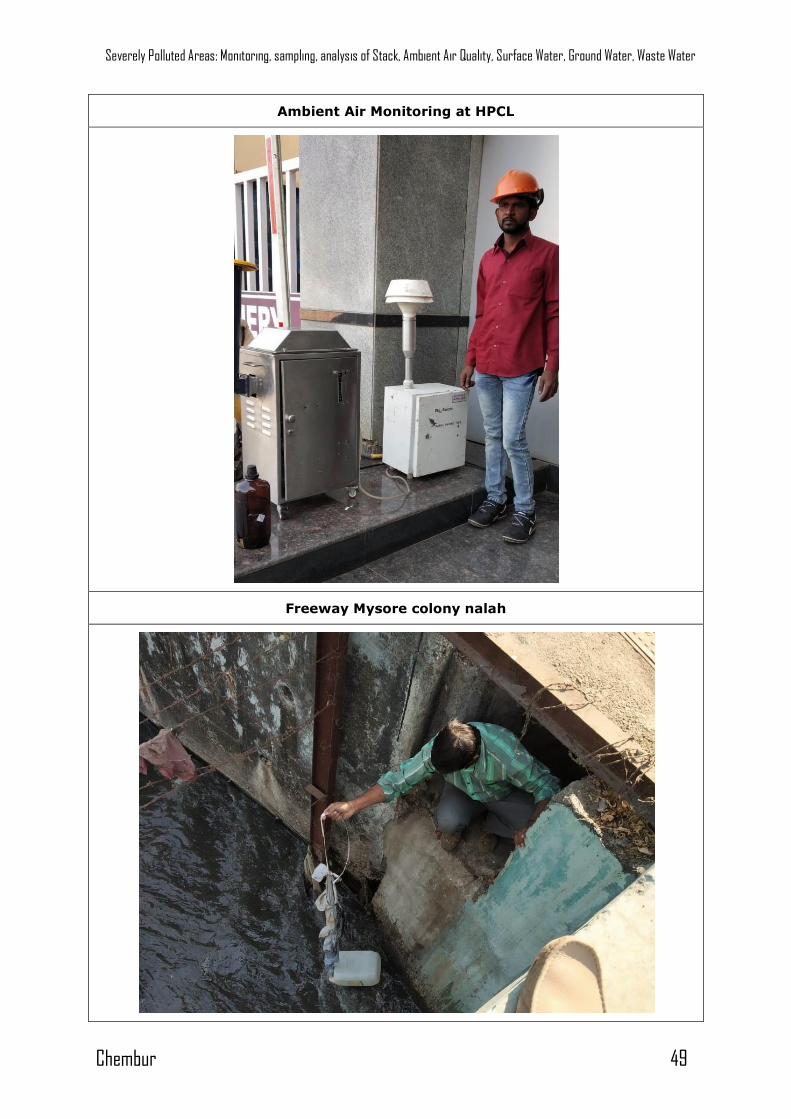
Mazgaon dock nalah
Severely Polluted Areas: Monitoring, sampling, analysis of Stack, Ambient Air Quality, Surface Water, Ground Water, Waste Water
Chembur 51
9. References
1) Criteria for Comprehensive Environmental Assessment of Industrial Clusters,
December 2009, CPCB, EIAS/4/2009-10
2) Comprehensive Environmental Assessment of Industrial Clusters, December
2009, CPCB, EIAS/5/2009-10
3) Action Plan for Industrial Cluster: Chembur, November 2010, MPCB
4) Final Document on Revised CEPI Version – 2016, CPCB No.B-29012/ ESS(CPA)/
2015-16
5) Standard Methods for the Examination of Water and Waste Water, American
Public Health Association, 22nd Edition, 2012.
6) IS 3025 (various parts)
7) www.mpcb.gov.in
8) www.cpcb.gov.in
Severely Polluted Areas: Monitoring, sampling, analysis of Stack, Ambient Air Quality, Surface Water, Ground Water, Waste Water
Chembur 52
10. Annexure
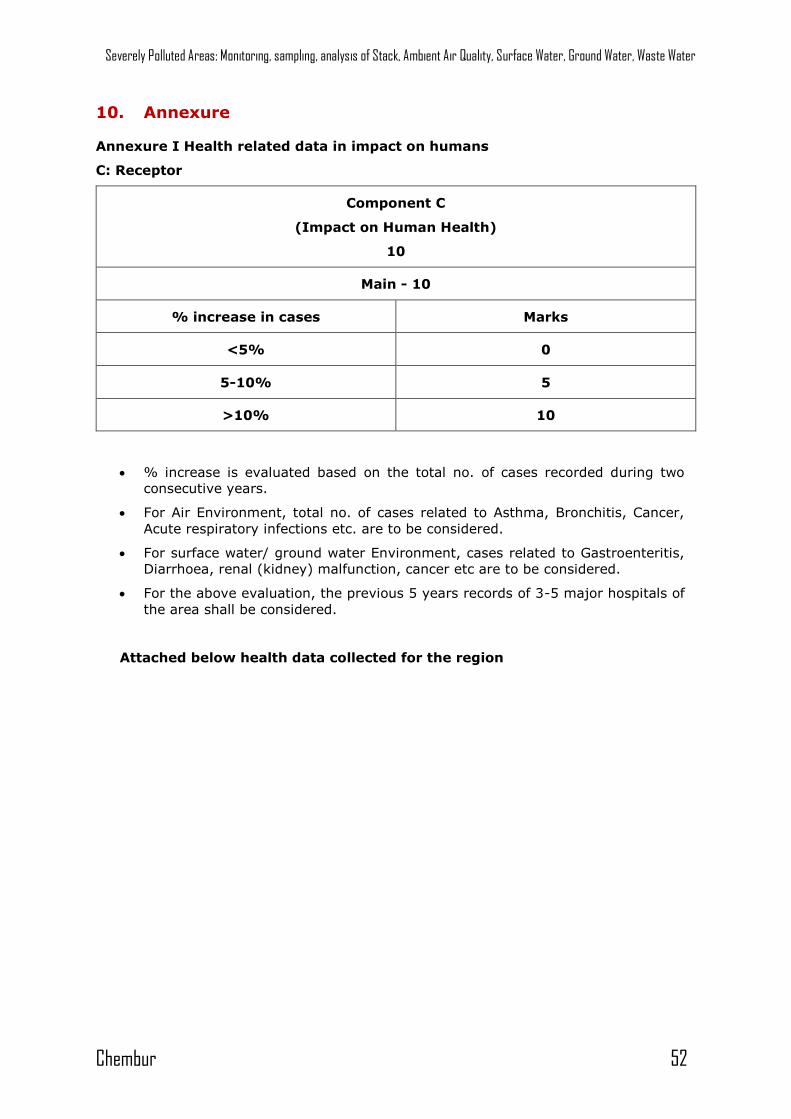
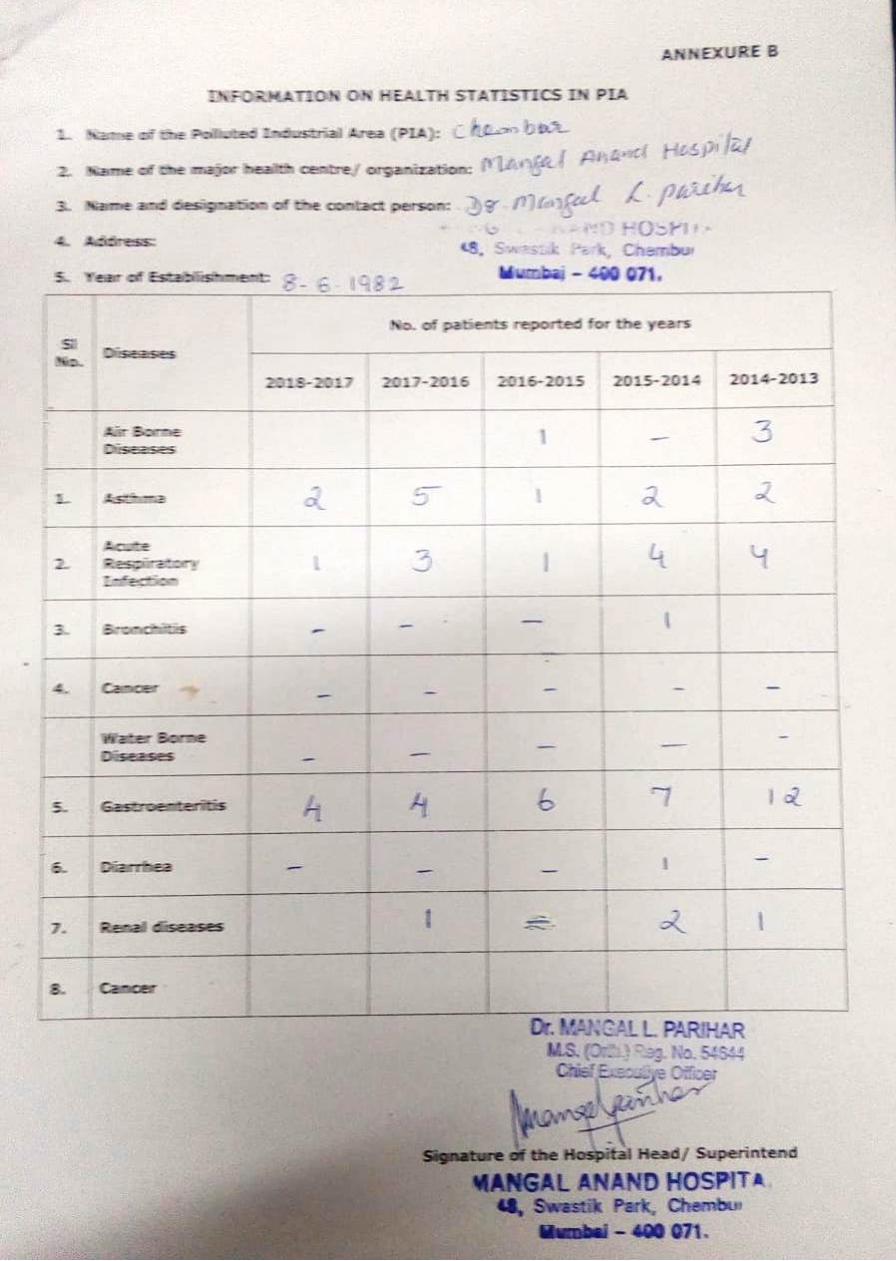
Annexure I Health related data in impact on humans
C: Receptor
Component C
(Impact on Human Health)
10
Main - 10
% increase in cases Marks
<5% 0
5-10% 5
>10% 10
% increase is evaluated based on the total no. of cases recorded during two
consecutive years.
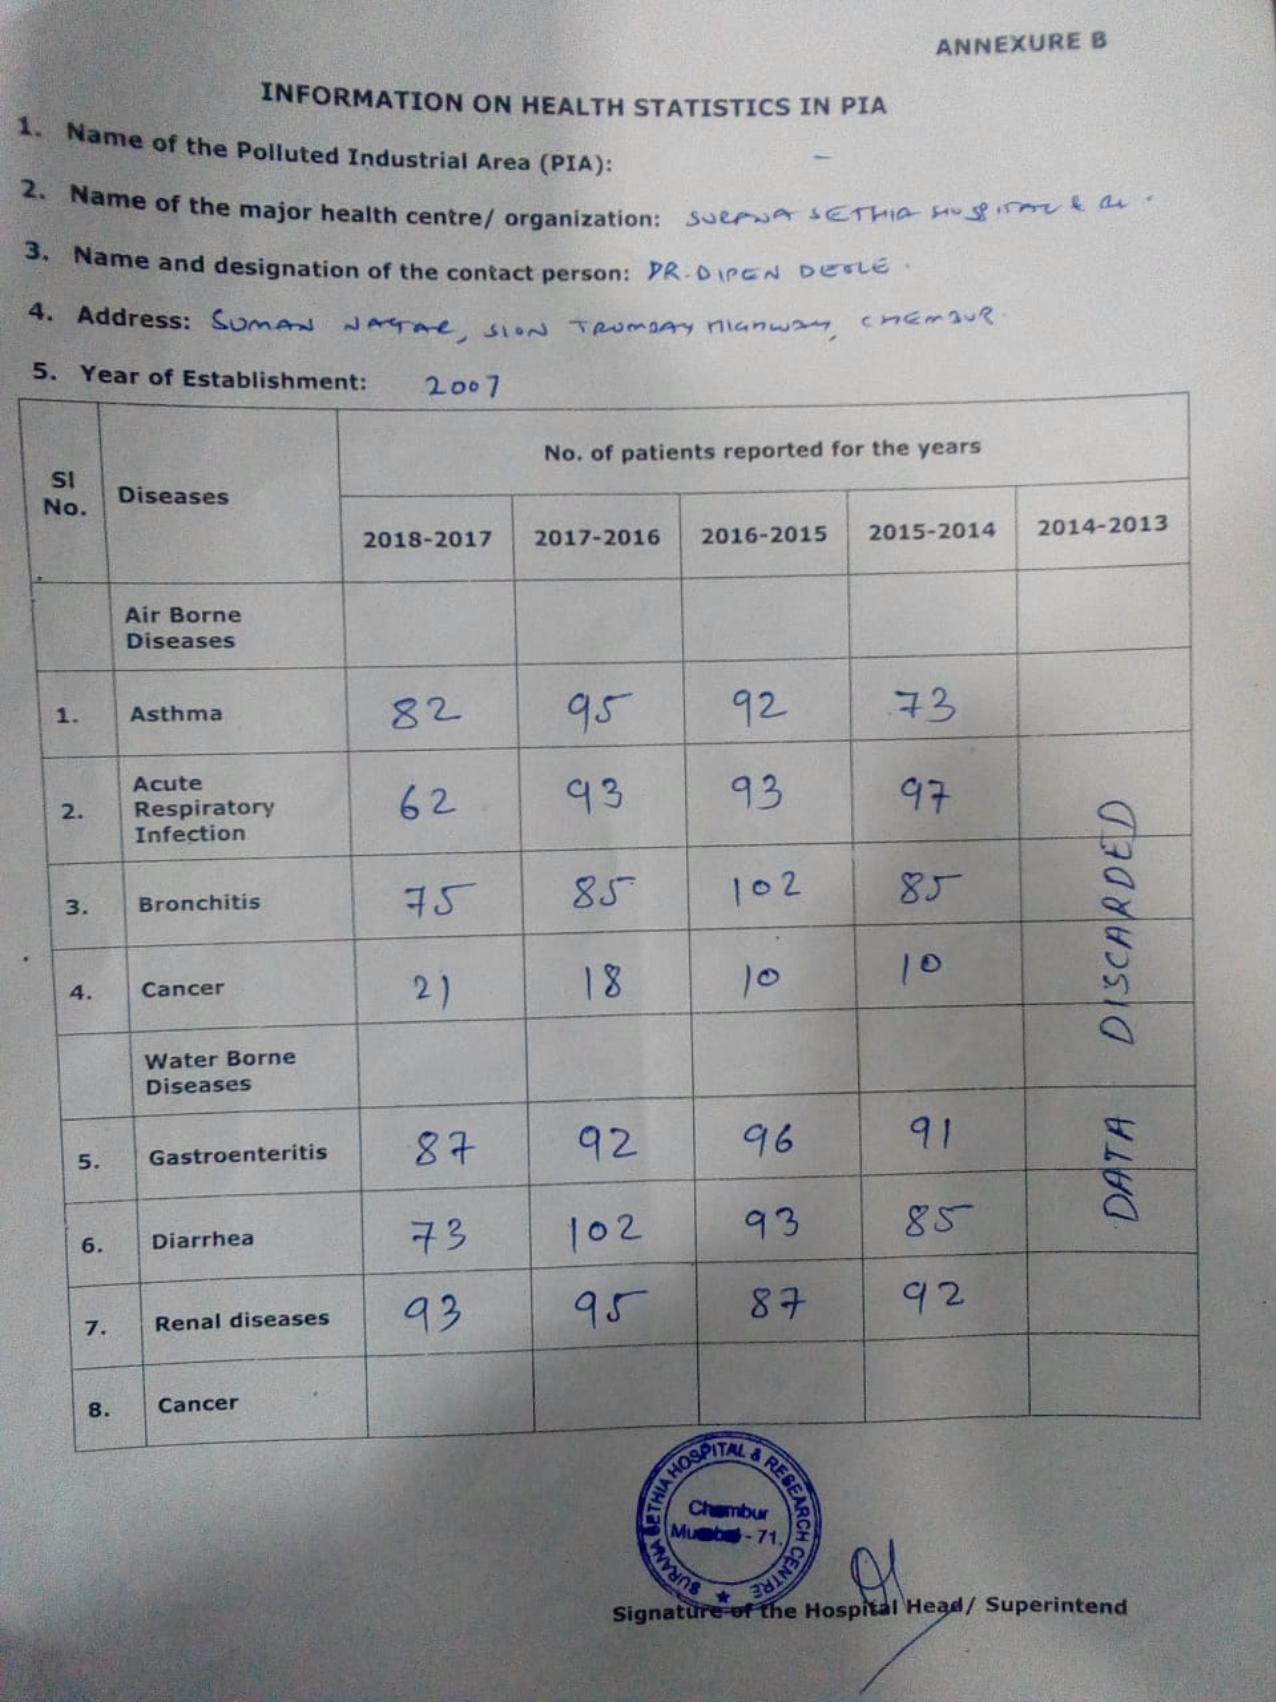
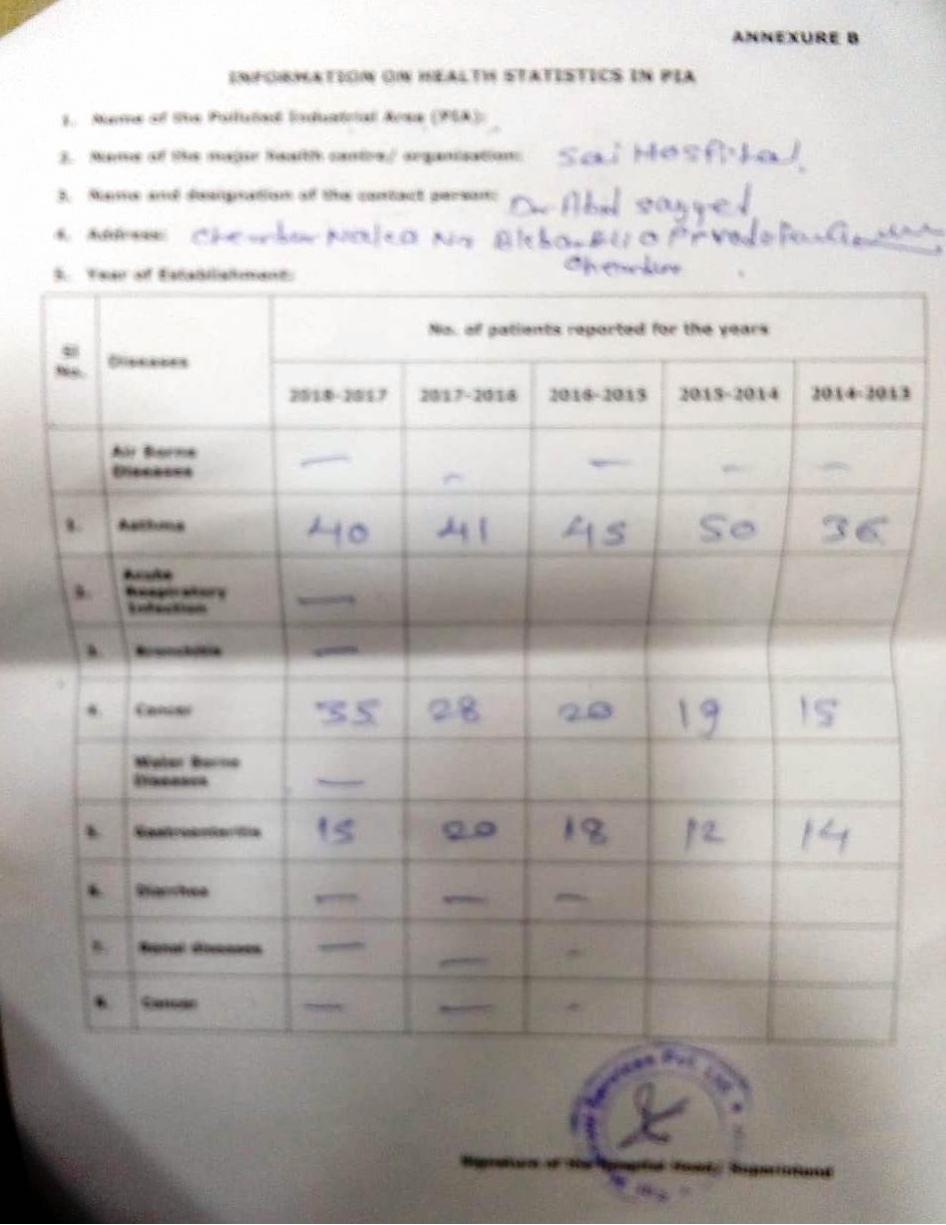
For Air Environment, total no. of cases related to Asthma, Bronchitis, Cancer,
Acute respiratory infections etc. are to be considered.
For surface water/ ground water Environment, cases related to Gastroenteritis,
Diarrhoea, renal (kidney) malfunction, cancer etc are to be considered.
For the above evaluation, the previous 5 years records of 3-5 major hospitals of
the area shall be considered.
Attached below health data collected for the region
Severely Polluted Areas: Monitoring, sampling, analysis of Stack, Ambient Air Quality, Surface Water, Ground Water, Waste Water
Chembur 53
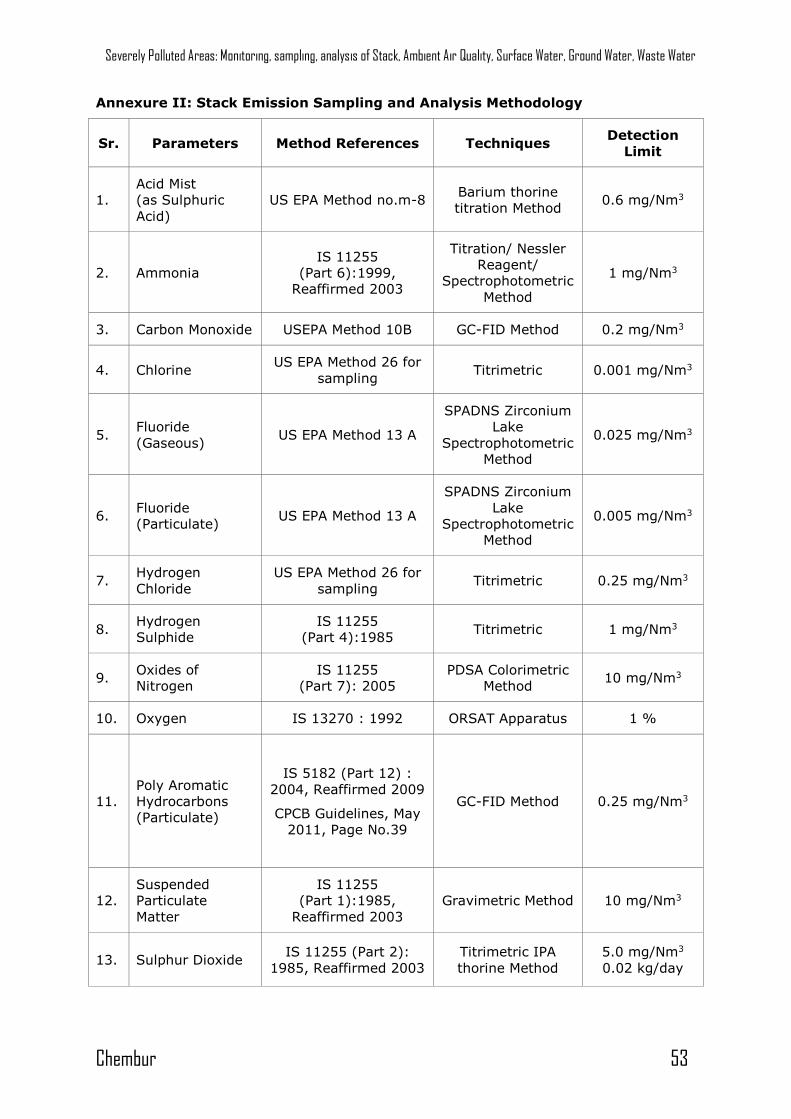
Annexure II: Stack Emission Sampling and Analysis Methodology
Sr. Parameters Method References Techniques Detection
Limit
1.
Acid Mist
(as Sulphuric
Acid)
US EPA Method no.m-8 Barium thorine
titration Method 0.6 mg/Nm3
2. Ammonia
IS 11255
(Part 6):1999,
Reaffirmed 2003
Titration/ Nessler
Reagent/
Spectrophotometric
Method
1 mg/Nm3
3. Carbon Monoxide USEPA Method 10B GC-FID Method 0.2 mg/Nm3
4. Chlorine US EPA Method 26 for
sampling Titrimetric 0.001 mg/Nm3
5. Fluoride
(Gaseous) US EPA Method 13 A
SPADNS Zirconium
Lake
Spectrophotometric
Method
0.025 mg/Nm3
6. Fluoride
(Particulate) US EPA Method 13 A
SPADNS Zirconium
Lake
Spectrophotometric
Method
0.005 mg/Nm3
7. Hydrogen
Chloride
US EPA Method 26 for
sampling Titrimetric 0.25 mg/Nm3
8. Hydrogen
Sulphide
IS 11255
(Part 4):1985 Titrimetric 1 mg/Nm3
9. Oxides of
Nitrogen
IS 11255
(Part 7): 2005
PDSA Colorimetric
Method 10 mg/Nm3
10. Oxygen IS 13270 : 1992 ORSAT Apparatus 1 %
11.
Poly Aromatic
Hydrocarbons
(Particulate)
IS 5182 (Part 12) :
2004, Reaffirmed 2009
CPCB Guidelines, May
2011, Page No.39
GC-FID Method 0.25 mg/Nm3
12.
Suspended
Particulate
Matter
IS 11255
(Part 1):1985,
Reaffirmed 2003
Gravimetric Method 10 mg/Nm3
13. Sulphur Dioxide IS 11255 (Part 2):
1985, Reaffirmed 2003
Titrimetric IPA
thorine Method
5.0 mg/Nm3
0.02 kg/day
Severely Polluted Areas: Monitoring, sampling, analysis of Stack, Ambient Air Quality, Surface Water, Ground Water, Waste Water
Chembur 54
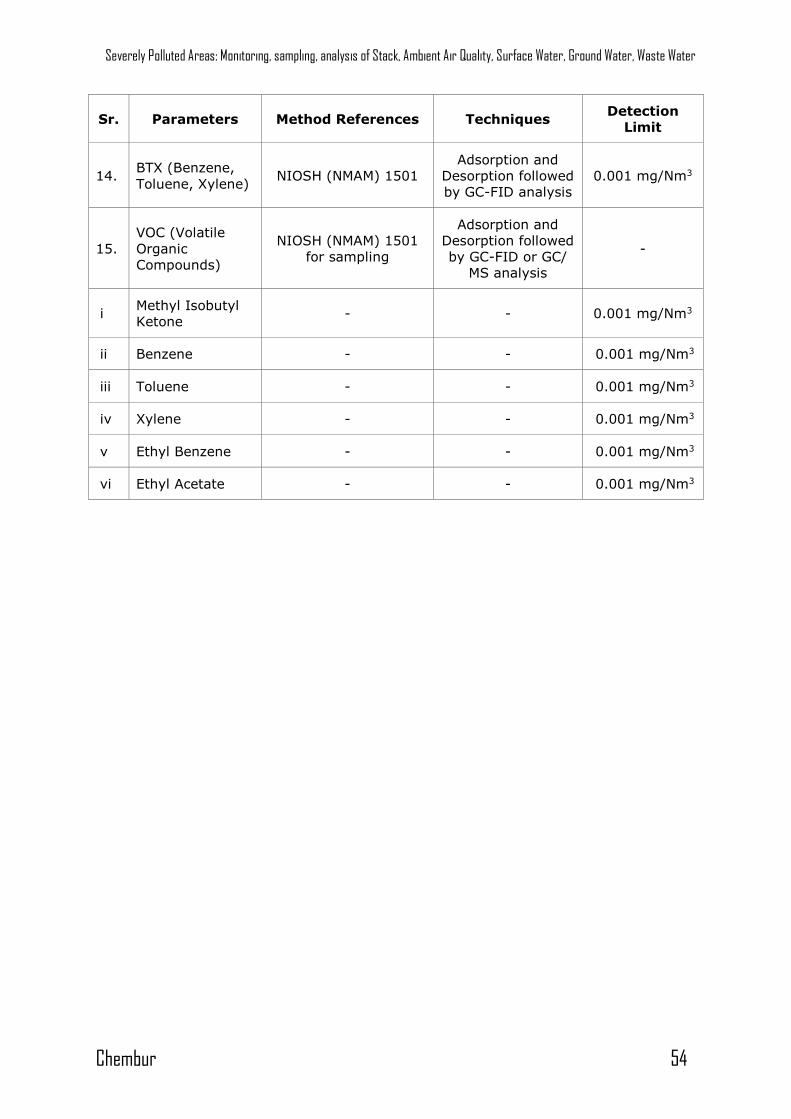
Sr. Parameters Method References Techniques Detection
Limit
14. BTX (Benzene,
Toluene, Xylene) NIOSH (NMAM) 1501
Adsorption and
Desorption followed
by GC-FID analysis
0.001 mg/Nm3
15.
VOC (Volatile
Organic
Compounds)
NIOSH (NMAM) 1501
for sampling
Adsorption and
Desorption followed
by GC-FID or GC/
MS analysis
-
i Methyl Isobutyl
Ketone - - 0.001 mg/Nm3
ii Benzene - - 0.001 mg/Nm3
iii Toluene - - 0.001 mg/Nm3
iv Xylene - - 0.001 mg/Nm3
v Ethyl Benzene - - 0.001 mg/Nm3
vi Ethyl Acetate - - 0.001 mg/Nm3
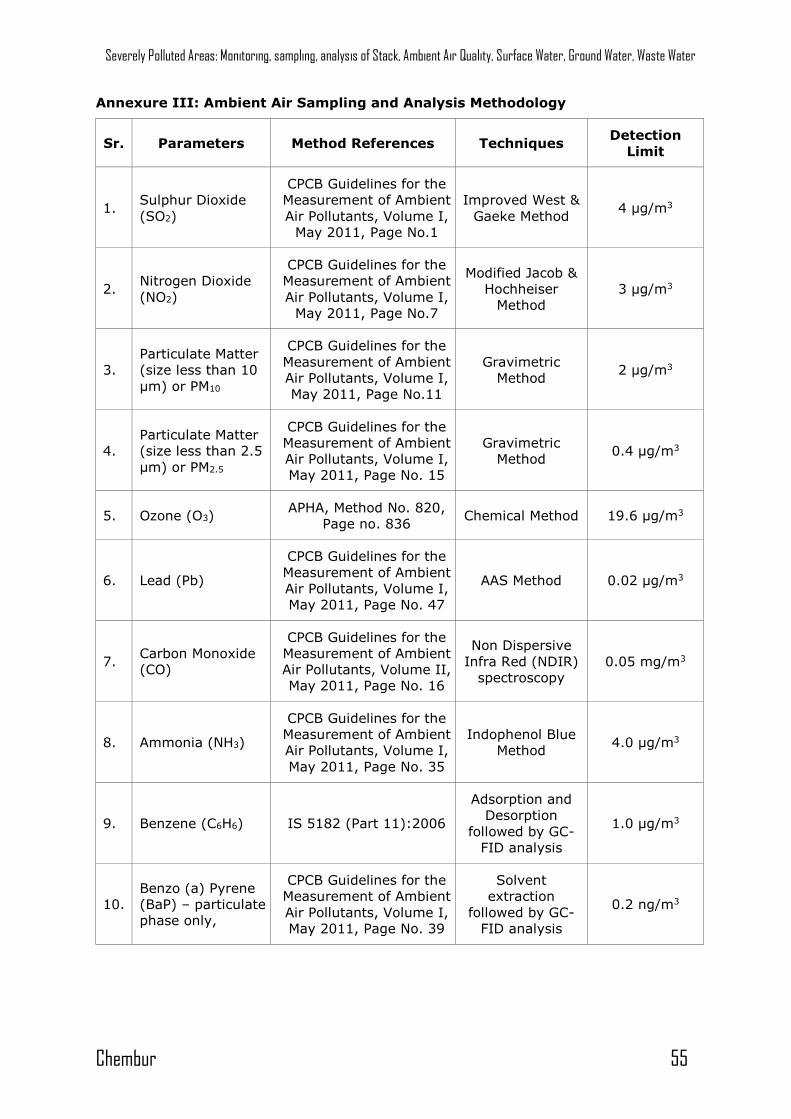
Severely Polluted Areas: Monitoring, sampling, analysis of Stack, Ambient Air Quality, Surface Water, Ground Water, Waste Water
Chembur 55
Annexure III: Ambient Air Sampling and Analysis Methodology
Sr. Parameters Method References Techniques Detection
Limit
1. Sulphur Dioxide
(SO2)
CPCB Guidelines for the
Measurement of Ambient
Air Pollutants, Volume I,
May 2011, Page No.1
Improved West &
Gaeke Method 4 µg/m3
2. Nitrogen Dioxide
(NO2)
CPCB Guidelines for the
Measurement of Ambient
Air Pollutants, Volume I,
May 2011, Page No.7
Modified Jacob &
Hochheiser
Method
3 µg/m3
3.
Particulate Matter
(size less than 10
µm) or PM10
CPCB Guidelines for the
Measurement of Ambient
Air Pollutants, Volume I,
May 2011, Page No.11
Gravimetric
Method 2 µg/m3
4.
Particulate Matter
(size less than 2.5
µm) or PM2.5
CPCB Guidelines for the
Measurement of Ambient
Air Pollutants, Volume I,
May 2011, Page No. 15
Gravimetric
Method 0.4 µg/m3
5. Ozone (O3) APHA, Method No. 820,
Page no. 836 Chemical Method 19.6 µg/m3
6. Lead (Pb)
CPCB Guidelines for the
Measurement of Ambient
Air Pollutants, Volume I,
May 2011, Page No. 47
AAS Method 0.02 µg/m3
7. Carbon Monoxide
(CO)
CPCB Guidelines for the
Measurement of Ambient
Air Pollutants, Volume II,
May 2011, Page No. 16
Non Dispersive
Infra Red (NDIR)
spectroscopy
0.05 mg/m3
8. Ammonia (NH3)
CPCB Guidelines for the
Measurement of Ambient
Air Pollutants, Volume I,
May 2011, Page No. 35
Indophenol Blue
Method 4.0 µg/m3
9. Benzene (C6H6) IS 5182 (Part 11):2006
Adsorption and
Desorption
followed by GC-
FID analysis
1.0 µg/m3
10.
Benzo (a) Pyrene
(BaP) – particulate
phase only,
CPCB Guidelines for the
Measurement of Ambient
Air Pollutants, Volume I,
May 2011, Page No. 39
Solvent
extraction
followed by GC-
FID analysis
0.2 ng/m3
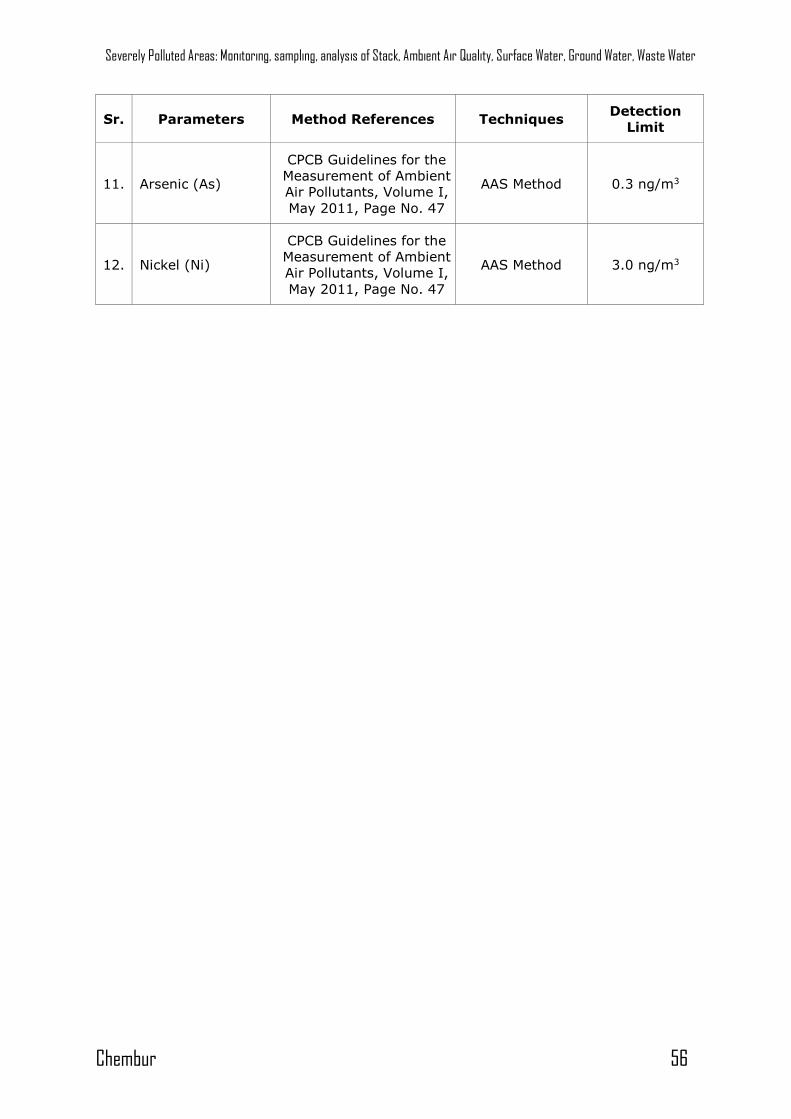
Severely Polluted Areas: Monitoring, sampling, analysis of Stack, Ambient Air Quality, Surface Water, Ground Water, Waste Water
Chembur 56
Sr. Parameters Method References Techniques Detection
Limit
11. Arsenic (As)
CPCB Guidelines for the
Measurement of Ambient
Air Pollutants, Volume I,
May 2011, Page No. 47
AAS Method 0.3 ng/m3
12. Nickel (Ni)
CPCB Guidelines for the
Measurement of Ambient
Air Pollutants, Volume I,
May 2011, Page No. 47
AAS Method 3.0 ng/m3
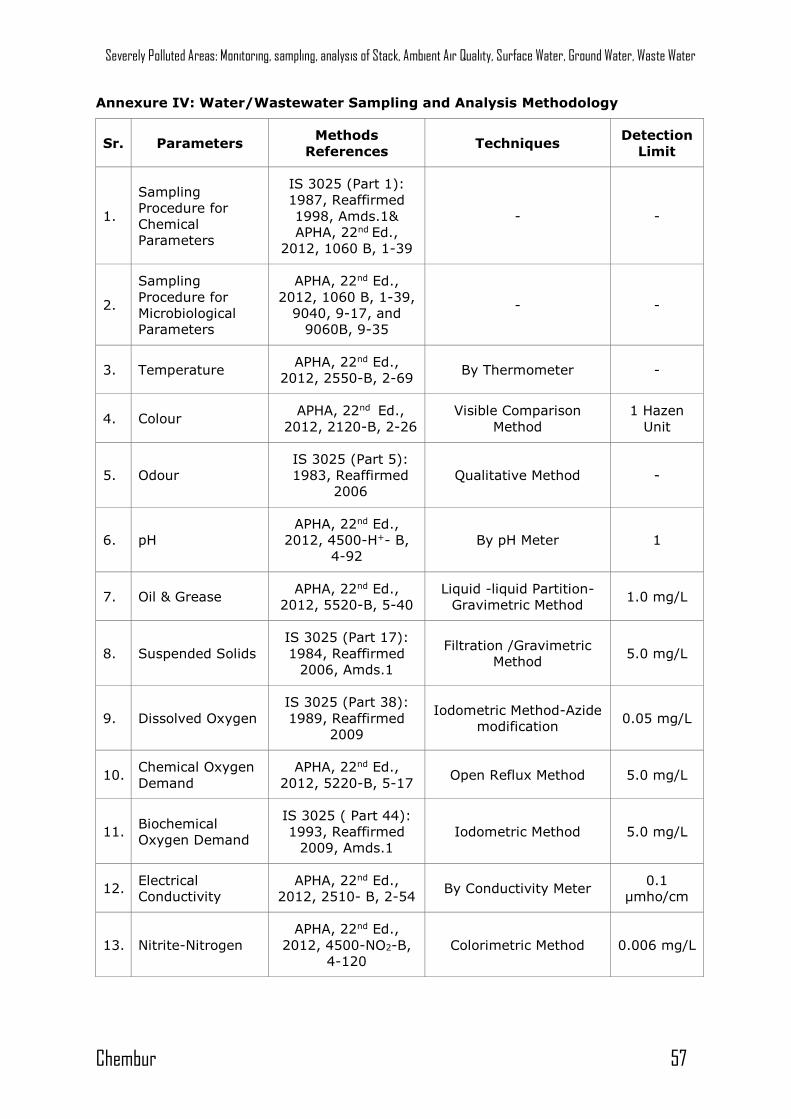
Severely Polluted Areas: Monitoring, sampling, analysis of Stack, Ambient Air Quality, Surface Water, Ground Water, Waste Water
Chembur 57
Annexure IV: Water/Wastewater Sampling and Analysis Methodology
Sr. Parameters Methods
References Techniques
Detection
Limit
1.
Sampling
Procedure for
Chemical
Parameters
IS 3025 (Part 1):
1987, Reaffirmed
1998, Amds.1&
APHA, 22nd Ed.,
2012, 1060 B, 1-39
- -
2.
Sampling
Procedure for
Microbiological
Parameters
APHA, 22nd Ed.,
2012, 1060 B, 1-39,
9040, 9-17, and
9060B, 9-35
- -
3. Temperature APHA, 22nd Ed.,
2012, 2550-B, 2-69 By Thermometer -
4. Colour APHA, 22nd Ed.,
2012, 2120-B, 2-26
Visible Comparison
Method
1 Hazen
Unit
5. Odour
IS 3025 (Part 5):
1983, Reaffirmed
2006
Qualitative Method -
6. pH
APHA, 22nd Ed.,
2012, 4500-H+- B,
4-92
By pH Meter 1
7. Oil & Grease APHA, 22nd Ed.,
2012, 5520-B, 5-40
Liquid -liquid Partition-
Gravimetric Method 1.0 mg/L
8. Suspended Solids
IS 3025 (Part 17):
1984, Reaffirmed
2006, Amds.1
Filtration /Gravimetric
Method 5.0 mg/L
9. Dissolved Oxygen
IS 3025 (Part 38):
1989, Reaffirmed
2009
Iodometric Method-Azide
modification 0.05 mg/L
10. Chemical Oxygen
Demand
APHA, 22nd Ed.,
2012, 5220-B, 5-17 Open Reflux Method 5.0 mg/L
11. Biochemical
Oxygen Demand
IS 3025 ( Part 44):
1993, Reaffirmed
2009, Amds.1
Iodometric Method 5.0 mg/L
12. Electrical
Conductivity
APHA, 22nd Ed.,
2012, 2510- B, 2-54 By Conductivity Meter
0.1
µmho/cm
13. Nitrite-Nitrogen
APHA, 22nd Ed.,
2012, 4500-NO2-B,
4-120
Colorimetric Method 0.006 mg/L
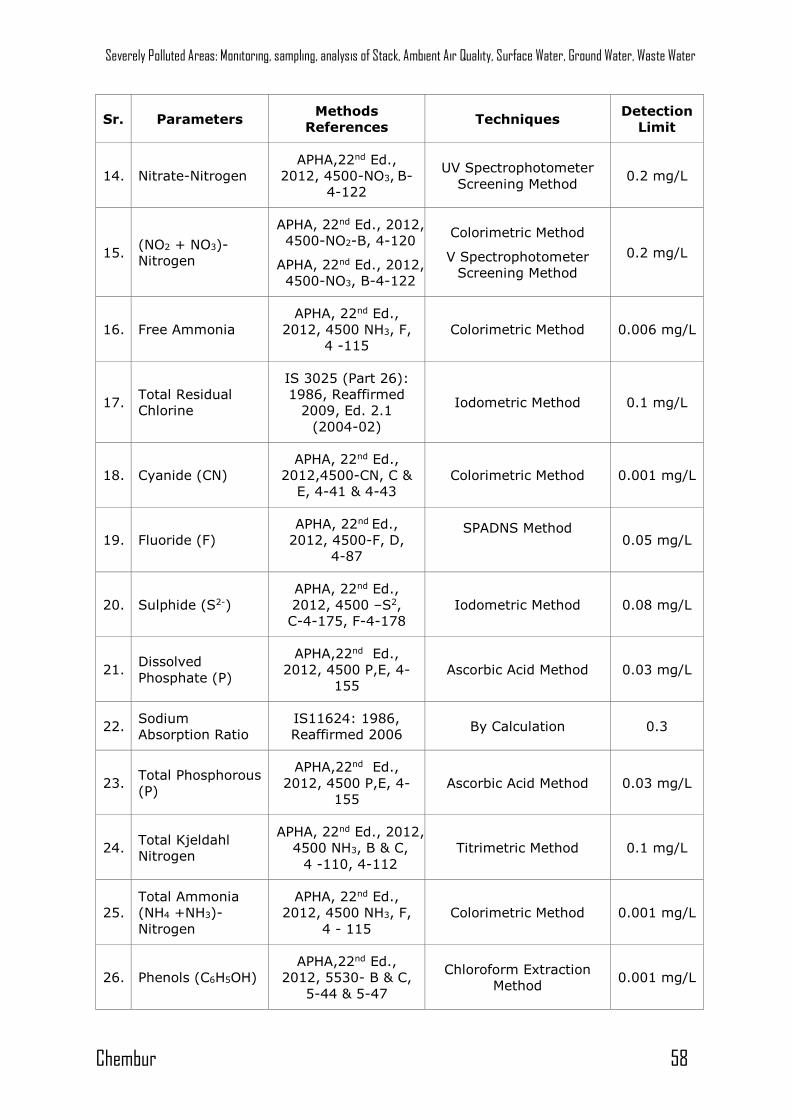
Severely Polluted Areas: Monitoring, sampling, analysis of Stack, Ambient Air Quality, Surface Water, Ground Water, Waste Water
Chembur 58
Sr. Parameters Methods
References Techniques
Detection
Limit
14. Nitrate-Nitrogen
APHA,22nd Ed.,
2012, 4500-NO3, B-
4-122
UV Spectrophotometer
Screening Method 0.2 mg/L
15. (NO2 + NO3)-
Nitrogen
APHA, 22nd Ed., 2012,
4500-NO2-B, 4-120
APHA, 22nd Ed., 2012,
4500-NO3, B-4-122
Colorimetric Method
V Spectrophotometer
Screening Method
0.2 mg/L
16. Free Ammonia
APHA, 22nd Ed.,
2012, 4500 NH3, F,
4 -115
Colorimetric Method 0.006 mg/L
17. Total Residual
Chlorine
IS 3025 (Part 26):
1986, Reaffirmed
2009, Ed. 2.1
(2004-02)
Iodometric Method 0.1 mg/L
18. Cyanide (CN)
APHA, 22nd Ed.,
2012,4500-CN, C &
E, 4-41 & 4-43
Colorimetric Method 0.001 mg/L
19. Fluoride (F)
APHA, 22nd Ed.,
2012, 4500-F, D,
4-87
SPADNS Method
0.05 mg/L
20. Sulphide (S2-)
APHA, 22nd Ed.,
2012, 4500 –S2,
C-4-175, F-4-178
Iodometric Method 0.08 mg/L
21. Dissolved
Phosphate (P)
APHA,22nd Ed.,
2012, 4500 P,E, 4-
155
Ascorbic Acid Method 0.03 mg/L
22. Sodium
Absorption Ratio
IS11624: 1986,
Reaffirmed 2006 By Calculation 0.3
23. Total Phosphorous
(P)
APHA,22nd Ed.,
2012, 4500 P,E, 4-
155
Ascorbic Acid Method 0.03 mg/L
24. Total Kjeldahl
Nitrogen
APHA, 22nd Ed., 2012,
4500 NH3, B & C,
4 -110, 4-112
Titrimetric Method 0.1 mg/L
25.
Total Ammonia
(NH4 +NH3)-
Nitrogen
APHA, 22nd Ed.,
2012, 4500 NH3, F,
4 - 115
Colorimetric Method 0.001 mg/L
26. Phenols (C6H5OH)
APHA,22nd Ed.,
2012, 5530- B & C,
5-44 & 5-47
Chloroform Extraction
Method 0.001 mg/L
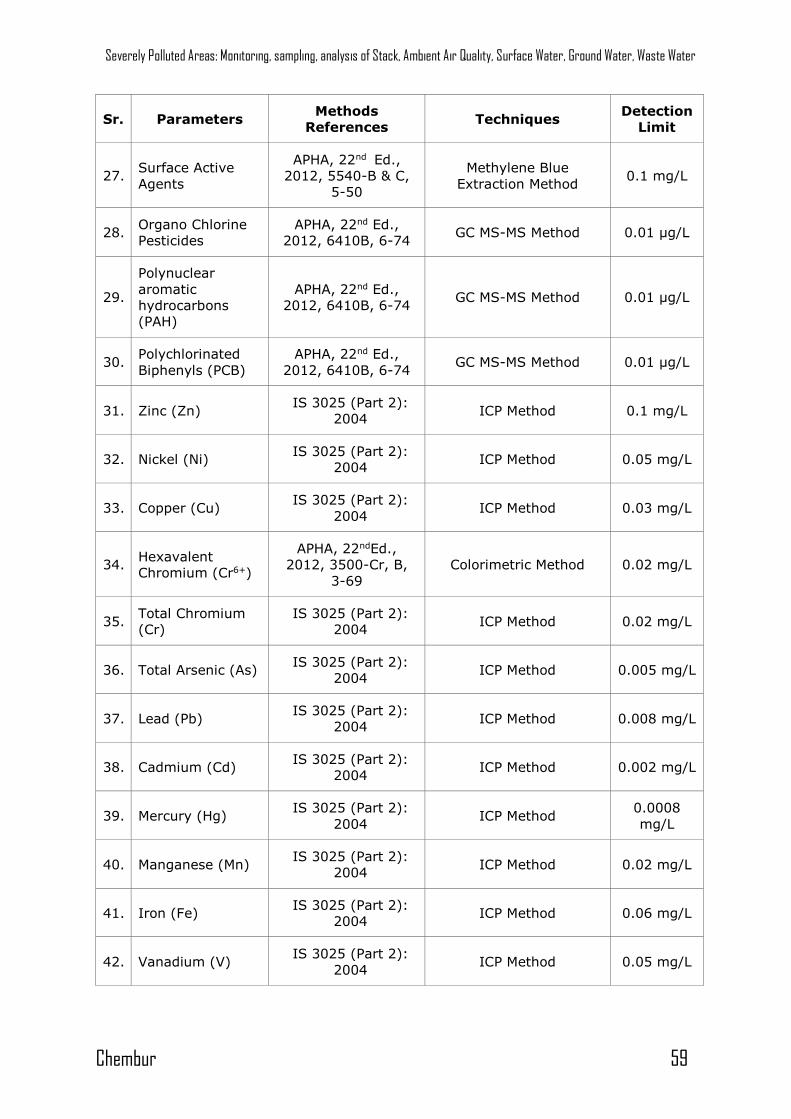
Severely Polluted Areas: Monitoring, sampling, analysis of Stack, Ambient Air Quality, Surface Water, Ground Water, Waste Water
Chembur 59
Sr. Parameters Methods
References Techniques
Detection
Limit
27. Surface Active
Agents
APHA, 22nd Ed.,
2012, 5540-B & C,
5-50
Methylene Blue
Extraction Method 0.1 mg/L
28. Organo Chlorine
Pesticides
APHA, 22nd Ed.,
2012, 6410B, 6-74 GC MS-MS Method 0.01 µg/L
29.
Polynuclear
aromatic
hydrocarbons
(PAH)
APHA, 22nd Ed.,
2012, 6410B, 6-74 GC MS-MS Method 0.01 µg/L
30. Polychlorinated
Biphenyls (PCB)
APHA, 22nd Ed.,
2012, 6410B, 6-74 GC MS-MS Method 0.01 µg/L
31. Zinc (Zn) IS 3025 (Part 2):
2004 ICP Method 0.1 mg/L
32. Nickel (Ni) IS 3025 (Part 2):
2004 ICP Method 0.05 mg/L
33. Copper (Cu) IS 3025 (Part 2):
2004 ICP Method 0.03 mg/L
34. Hexavalent
Chromium (Cr6+)
APHA, 22ndEd.,
2012, 3500-Cr, B,
3-69
Colorimetric Method 0.02 mg/L
35. Total Chromium
(Cr)
IS 3025 (Part 2):
2004 ICP Method 0.02 mg/L
36. Total Arsenic (As) IS 3025 (Part 2):
2004 ICP Method 0.005 mg/L
37. Lead (Pb) IS 3025 (Part 2):
2004 ICP Method 0.008 mg/L
38. Cadmium (Cd) IS 3025 (Part 2):
2004 ICP Method 0.002 mg/L
39. Mercury (Hg) IS 3025 (Part 2):
2004 ICP Method
0.0008
mg/L
40. Manganese (Mn) IS 3025 (Part 2):
2004 ICP Method 0.02 mg/L
41. Iron (Fe) IS 3025 (Part 2):
2004 ICP Method 0.06 mg/L
42. Vanadium (V) IS 3025 (Part 2):
2004 ICP Method 0.05 mg/L
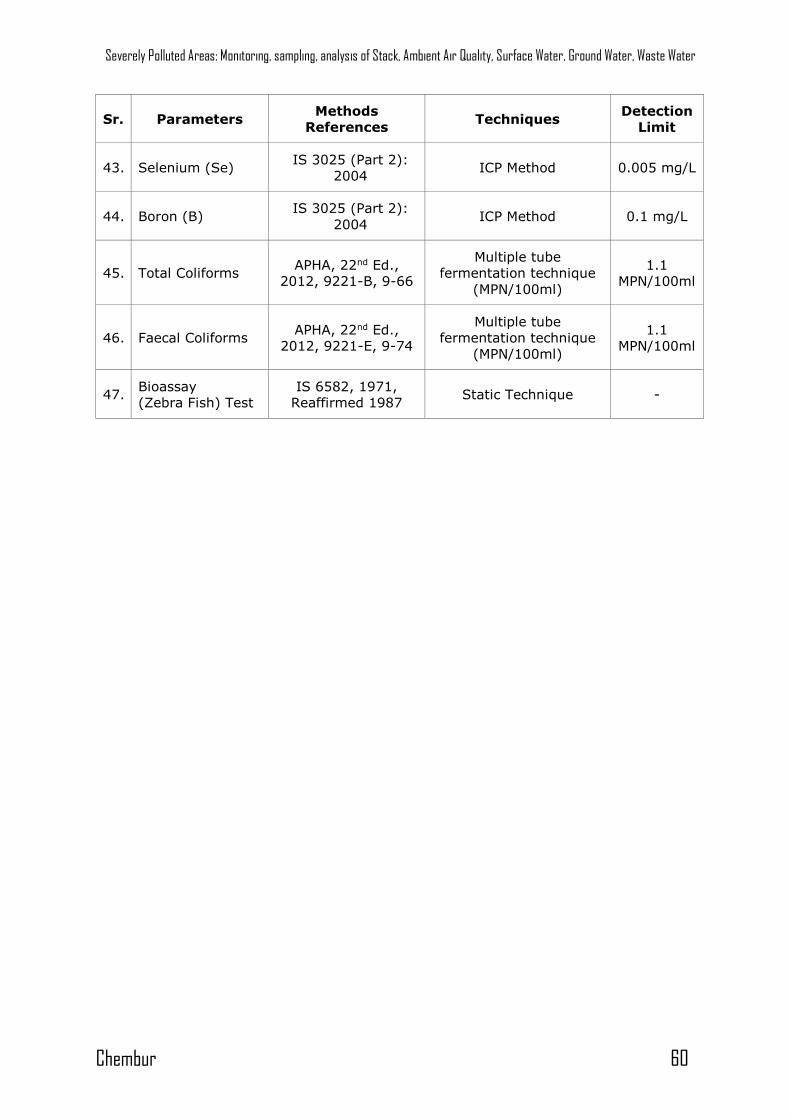
Severely Polluted Areas: Monitoring, sampling, analysis of Stack, Ambient Air Quality, Surface Water, Ground Water, Waste Water
Chembur 60
Sr. Parameters Methods
References Techniques
Detection
Limit
43. Selenium (Se) IS 3025 (Part 2):
2004 ICP Method 0.005 mg/L
44. Boron (B) IS 3025 (Part 2):
2004 ICP Method 0.1 mg/L
45. Total Coliforms APHA, 22nd Ed.,
2012, 9221-B, 9-66
Multiple tube
fermentation technique
(MPN/100ml)
1.1
MPN/100ml
46. Faecal Coliforms APHA, 22nd Ed.,
2012, 9221-E, 9-74
Multiple tube
fermentation technique
(MPN/100ml)
1.1
MPN/100ml
47. Bioassay
(Zebra Fish) Test
IS 6582, 1971,
Reaffirmed 1987 Static Technique -
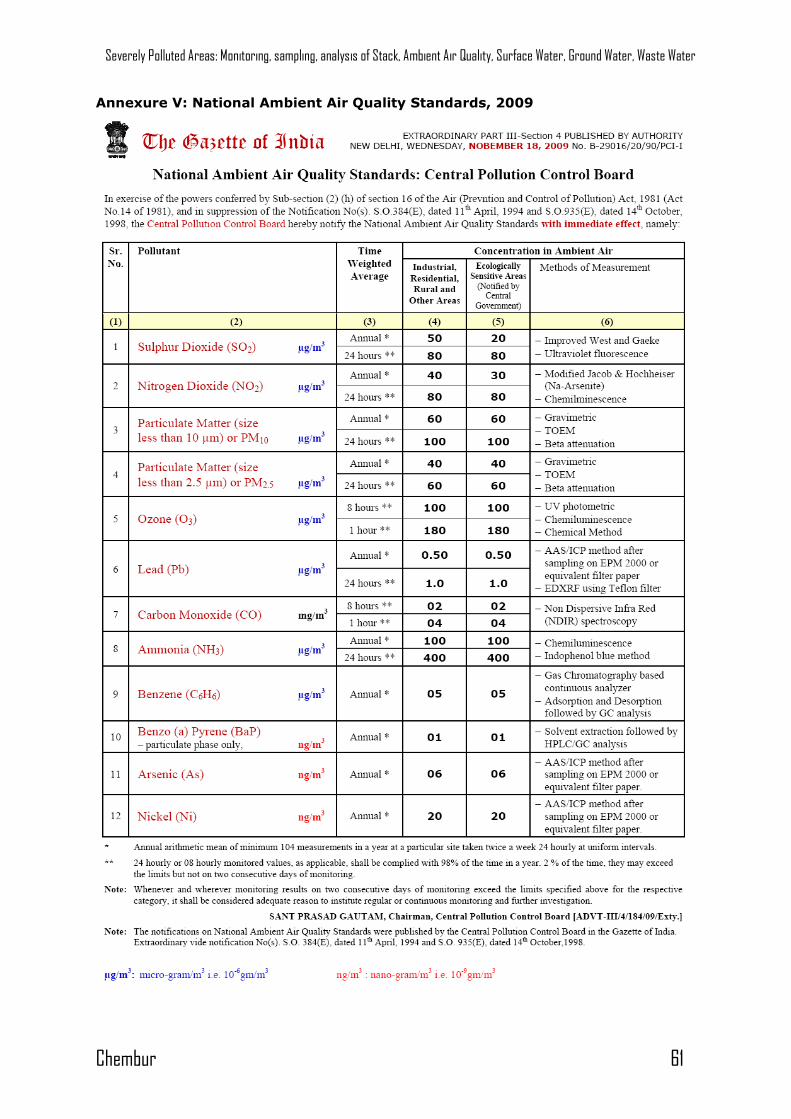
Severely Polluted Areas: Monitoring, sampling, analysis of Stack, Ambient Air Quality, Surface Water, Ground Water, Waste Water
Chembur 61
Annexure V: National Ambient Air Quality Standards, 2009
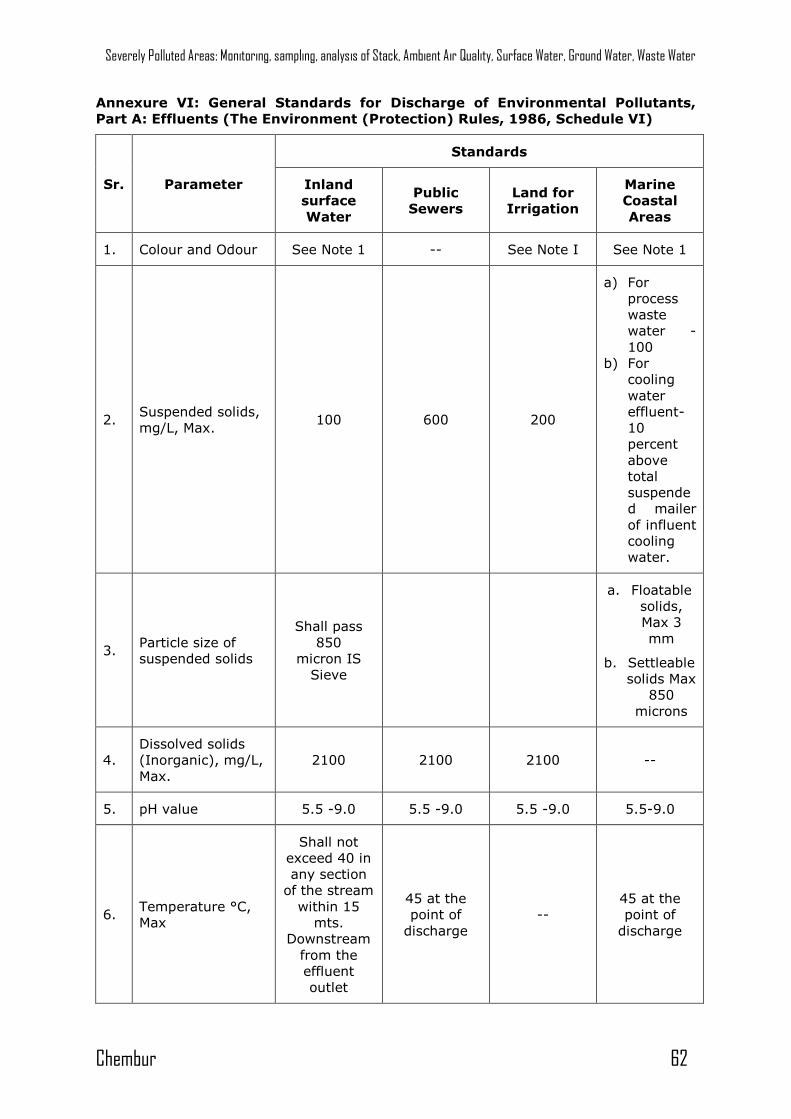
Severely Polluted Areas: Monitoring, sampling, analysis of Stack, Ambient Air Quality, Surface Water, Ground Water, Waste Water
Chembur 62
Annexure VI: General Standards for Discharge of Environmental Pollutants,
Part A: Effluents (The Environment (Protection) Rules, 1986, Schedule VI)
Sr. Parameter
Standards
Inland
surface
Water
Public
Sewers
Land for
Irrigation
Marine
Coastal
Areas
1. Colour and Odour See Note 1 -- See Note I See Note 1
2. Suspended solids,
mg/L, Max. 100 600 200
a) For
process
waste
water -
100
b) For
cooling
water
effluent-
10
percent
above
total
suspende
d mailer
of influent
cooling
water.
3. Particle size of
suspended solids
Shall pass
850
micron IS
Sieve
a. Floatable
solids,
Max 3
mm
b. Settleable
solids Max
850
microns
4.
Dissolved solids
(Inorganic), mg/L,
Max.
2100 2100 2100 --
5. pH value 5.5 -9.0 5.5 -9.0 5.5 -9.0 5.5-9.0
6. Temperature °C,
Max
Shall not
exceed 40 in
any section
of the stream
within 15
mts.
Downstream
from the
effluent
outlet
45 at the
point of
discharge
--
45 at the
point of
discharge
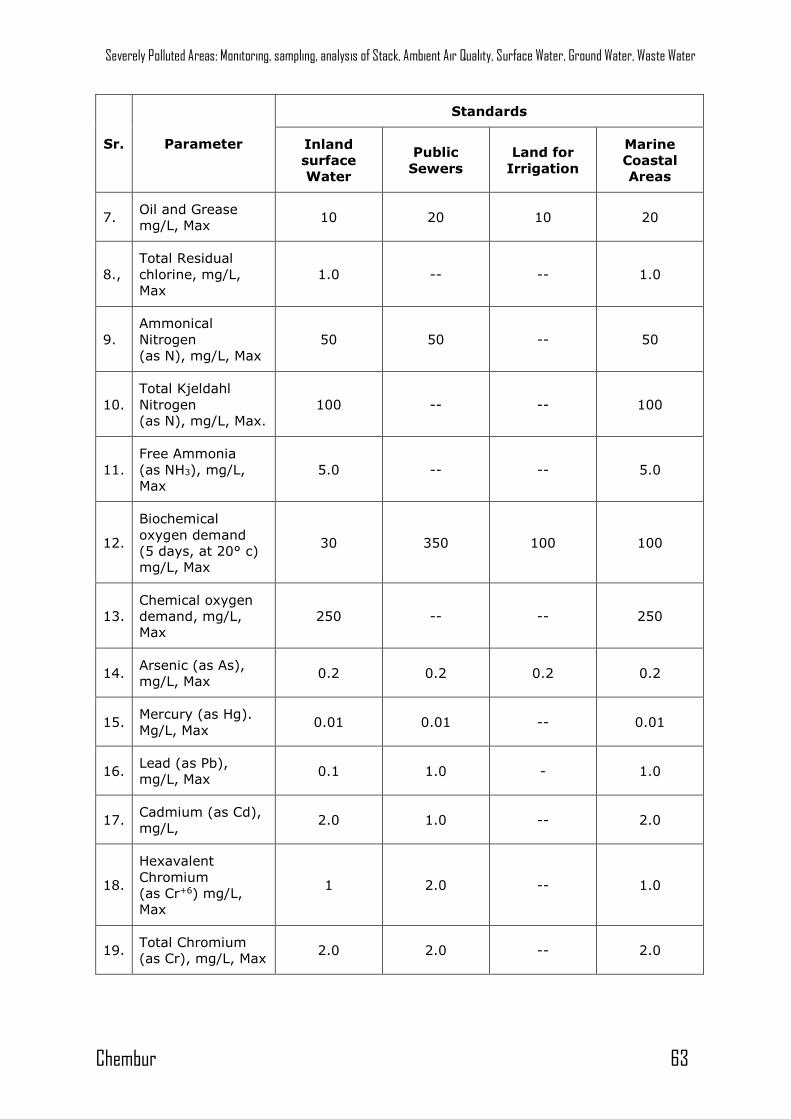
Severely Polluted Areas: Monitoring, sampling, analysis of Stack, Ambient Air Quality, Surface Water, Ground Water, Waste Water
Chembur 63
Sr. Parameter
Standards
Inland
surface
Water
Public
Sewers
Land for
Irrigation
Marine
Coastal
Areas
7. Oil and Grease
mg/L, Max 10 20 10 20
8.,
Total Residual
chlorine, mg/L,
Max
1.0 -- -- 1.0
9.
Ammonical
Nitrogen
(as N), mg/L, Max
50 50 -- 50
10.
Total Kjeldahl
Nitrogen
(as N), mg/L, Max.
100 -- -- 100
11.
Free Ammonia
(as NH3), mg/L,
Max
5.0 -- -- 5.0
12.
Biochemical
oxygen demand
(5 days, at 20° c)
mg/L, Max
30 350 100 100
13.
Chemical oxygen
demand, mg/L,
Max
250 -- -- 250
14. Arsenic (as As),
mg/L, Max 0.2 0.2 0.2 0.2
15. Mercury (as Hg).
Mg/L, Max 0.01 0.01 -- 0.01
16. Lead (as Pb),
mg/L, Max 0.1 1.0 - 1.0
17. Cadmium (as Cd),
mg/L, 2.0 1.0 -- 2.0
18.
Hexavalent
Chromium
(as Cr+6) mg/L,
Max
1 2.0 -- 1.0
19. Total Chromium
(as Cr), mg/L, Max 2.0 2.0 -- 2.0
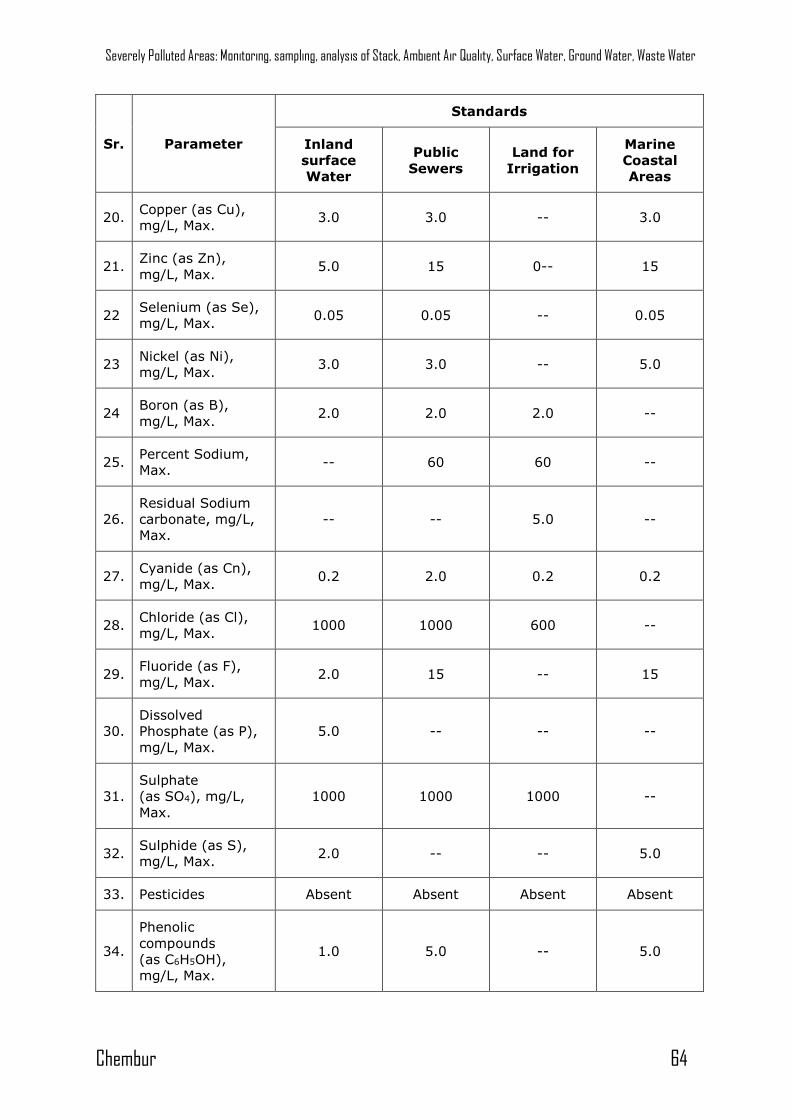
Severely Polluted Areas: Monitoring, sampling, analysis of Stack, Ambient Air Quality, Surface Water, Ground Water, Waste Water
Chembur 64
Sr. Parameter
Standards
Inland
surface
Water
Public
Sewers
Land for
Irrigation
Marine
Coastal
Areas
20. Copper (as Cu),
mg/L, Max. 3.0 3.0 -- 3.0
21. Zinc (as Zn),
mg/L, Max. 5.0 15 0-- 15
22 Selenium (as Se),
mg/L, Max. 0.05 0.05 -- 0.05
23 Nickel (as Ni),
mg/L, Max. 3.0 3.0 -- 5.0
24 Boron (as B),
mg/L, Max. 2.0 2.0 2.0 --
25. Percent Sodium,
Max. -- 60 60 --
26.
Residual Sodium
carbonate, mg/L,
Max.
-- -- 5.0 --
27. Cyanide (as Cn),
mg/L, Max. 0.2 2.0 0.2 0.2
28. Chloride (as Cl),
mg/L, Max. 1000 1000 600 --
29. Fluoride (as F),
mg/L, Max. 2.0 15 -- 15
30.
Dissolved
Phosphate (as P),
mg/L, Max.
5.0 -- -- --
31.
Sulphate
(as SO4), mg/L,
Max.
1000 1000 1000 --
32. Sulphide (as S),
mg/L, Max. 2.0 -- -- 5.0
33. Pesticides Absent Absent Absent Absent
34.
Phenolic
compounds
(as C6H5OH),
mg/L, Max.
1.0 5.0 -- 5.0
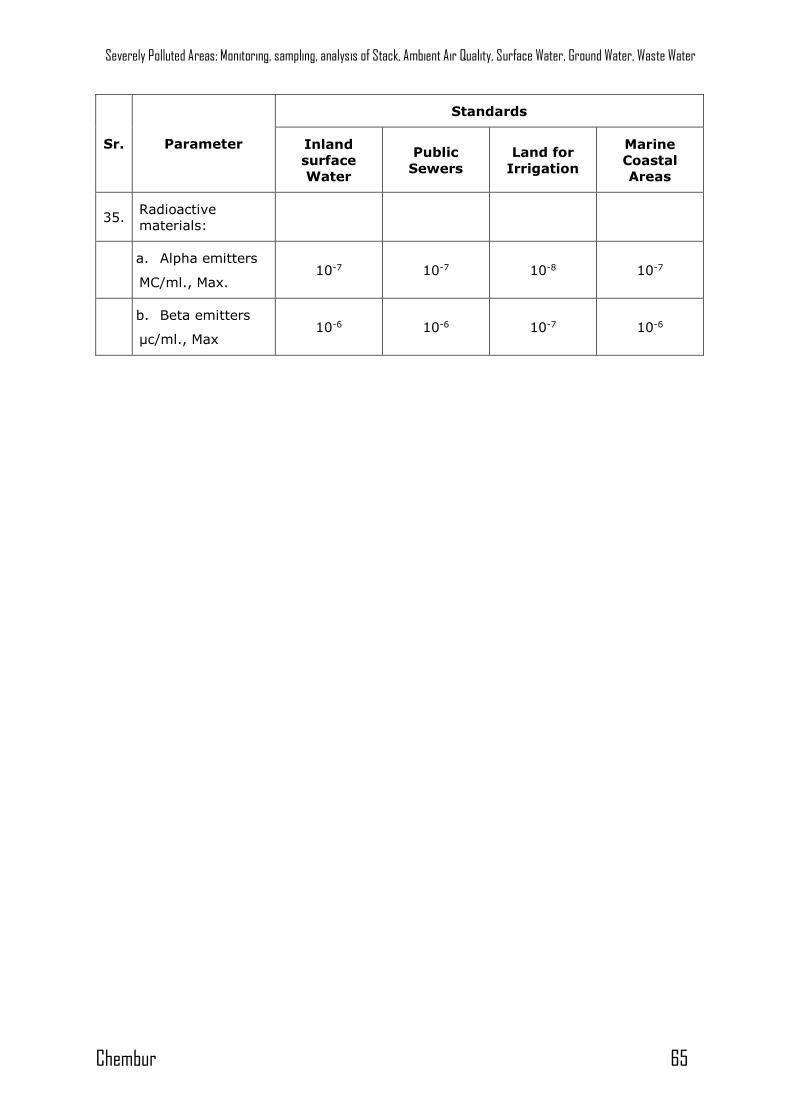
Severely Polluted Areas: Monitoring, sampling, analysis of Stack, Ambient Air Quality, Surface Water, Ground Water, Waste Water
Chembur 65
Sr. Parameter
Standards
Inland
surface
Water
Public
Sewers
Land for
Irrigation
Marine
Coastal
Areas
35. Radioactive
materials:
a. Alpha emitters
MC/ml., Max. 10-7 10-7 10-8 10-7
b. Beta emitters
µc/ml., Max 10-6 10-6 10-7 10-6
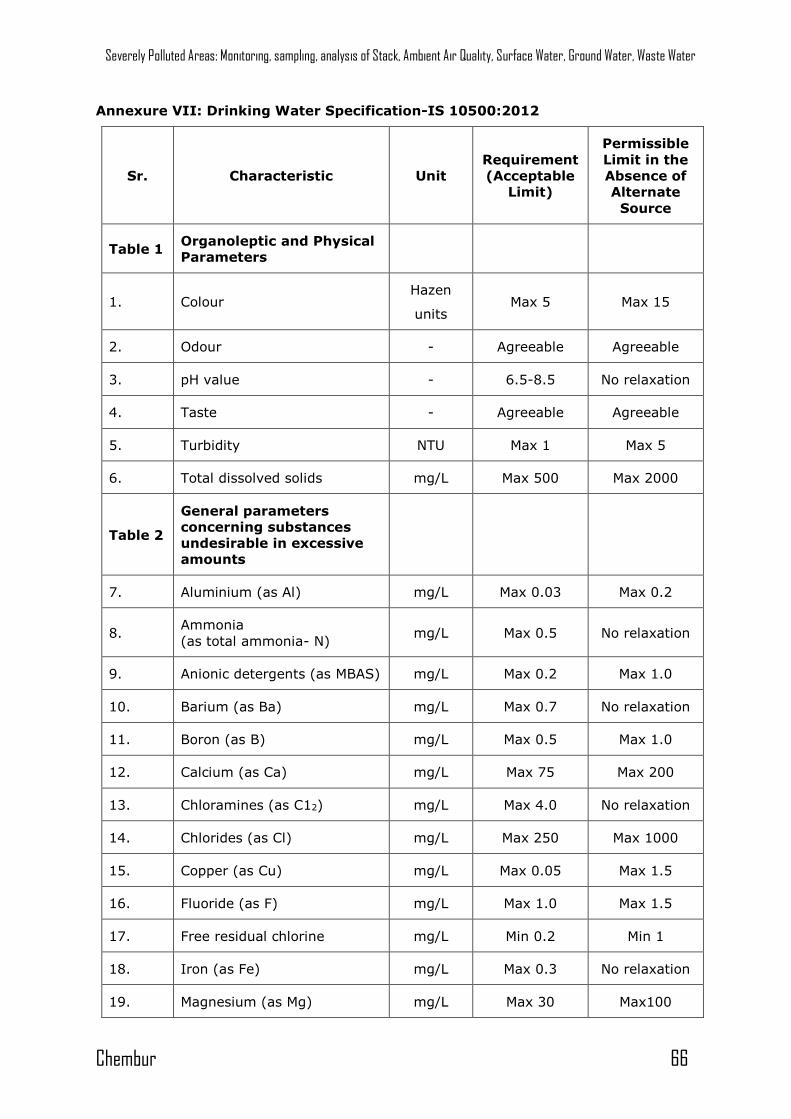
Severely Polluted Areas: Monitoring, sampling, analysis of Stack, Ambient Air Quality, Surface Water, Ground Water, Waste Water
Chembur 66
Annexure VII: Drinking Water Specification-IS 10500:2012
Sr. Characteristic Unit
Requirement
(Acceptable
Limit)
Permissible
Limit in the
Absence of
Alternate
Source
Table 1 Organoleptic and Physical
Parameters
1. Colour Hazen
units Max 5 Max 15
2. Odour - Agreeable Agreeable
3. pH value - 6.5-8.5 No relaxation
4. Taste - Agreeable Agreeable
5. Turbidity NTU Max 1 Max 5
6. Total dissolved solids mg/L Max 500 Max 2000
Table 2
General parameters
concerning substances
undesirable in excessive
amounts
7. Aluminium (as Al) mg/L Max 0.03 Max 0.2
8. Ammonia
(as total ammonia- N) mg/L Max 0.5 No relaxation
9. Anionic detergents (as MBAS) mg/L Max 0.2 Max 1.0
10. Barium (as Ba) mg/L Max 0.7 No relaxation
11. Boron (as B) mg/L Max 0.5 Max 1.0
12. Calcium (as Ca) mg/L Max 75 Max 200
13. Chloramines (as C12) mg/L Max 4.0 No relaxation
14. Chlorides (as Cl) mg/L Max 250 Max 1000
15. Copper (as Cu) mg/L Max 0.05 Max 1.5
16. Fluoride (as F) mg/L Max 1.0 Max 1.5
17. Free residual chlorine mg/L Min 0.2 Min 1
18. Iron (as Fe) mg/L Max 0.3 No relaxation
19. Magnesium (as Mg) mg/L Max 30 Max100
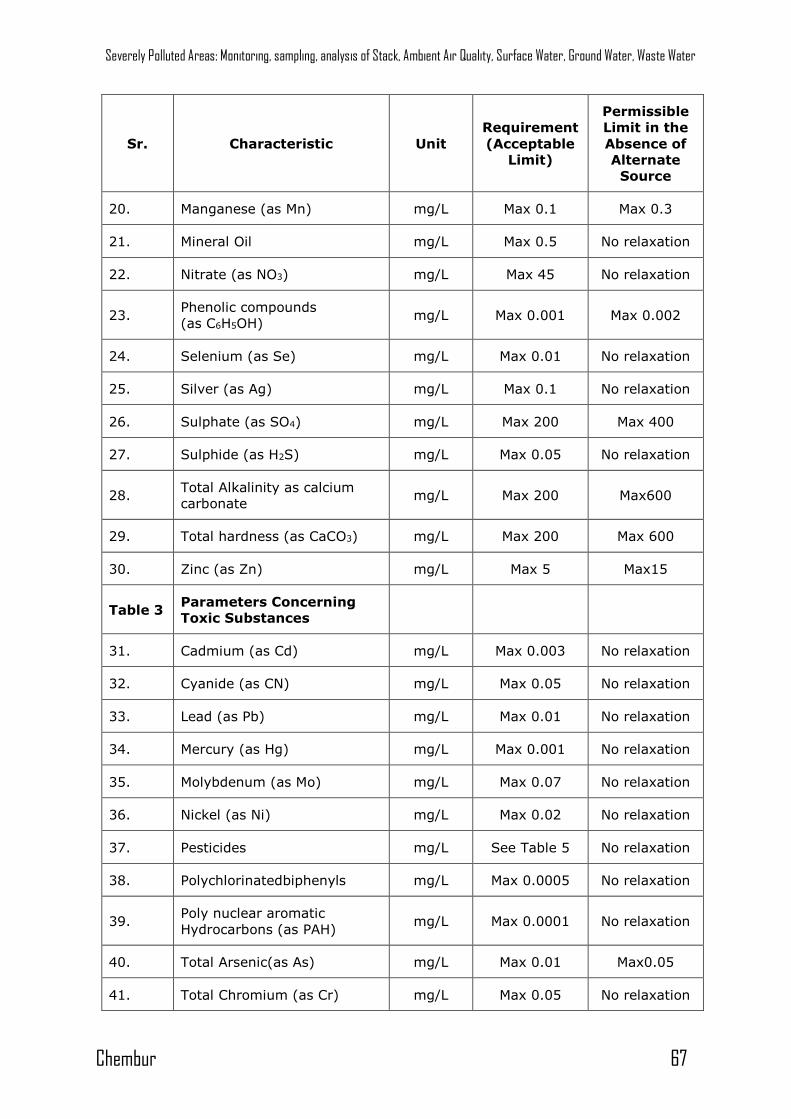
Severely Polluted Areas: Monitoring, sampling, analysis of Stack, Ambient Air Quality, Surface Water, Ground Water, Waste Water
Chembur 67
Sr. Characteristic Unit
Requirement
(Acceptable
Limit)
Permissible
Limit in the
Absence of
Alternate
Source
20. Manganese (as Mn) mg/L Max 0.1 Max 0.3
21. Mineral Oil mg/L Max 0.5 No relaxation
22. Nitrate (as NO3) mg/L Max 45 No relaxation
23. Phenolic compounds
(as C6H5OH) mg/L Max 0.001 Max 0.002
24. Selenium (as Se) mg/L Max 0.01 No relaxation
25. Silver (as Ag) mg/L Max 0.1 No relaxation
26. Sulphate (as SO4) mg/L Max 200 Max 400
27. Sulphide (as H2S) mg/L Max 0.05 No relaxation
28. Total Alkalinity as calcium
carbonate mg/L Max 200 Max600
29. Total hardness (as CaCO3) mg/L Max 200 Max 600
30. Zinc (as Zn) mg/L Max 5 Max15
Table 3 Parameters Concerning
Toxic Substances
31. Cadmium (as Cd) mg/L Max 0.003 No relaxation
32. Cyanide (as CN) mg/L Max 0.05 No relaxation
33. Lead (as Pb) mg/L Max 0.01 No relaxation
34. Mercury (as Hg) mg/L Max 0.001 No relaxation
35. Molybdenum (as Mo) mg/L Max 0.07 No relaxation
36. Nickel (as Ni) mg/L Max 0.02 No relaxation
37. Pesticides mg/L See Table 5 No relaxation
38. Polychlorinatedbiphenyls mg/L Max 0.0005 No relaxation
39. Poly nuclear aromatic
Hydrocarbons (as PAH) mg/L Max 0.0001 No relaxation
40. Total Arsenic(as As) mg/L Max 0.01 Max0.05
41. Total Chromium (as Cr) mg/L Max 0.05 No relaxation
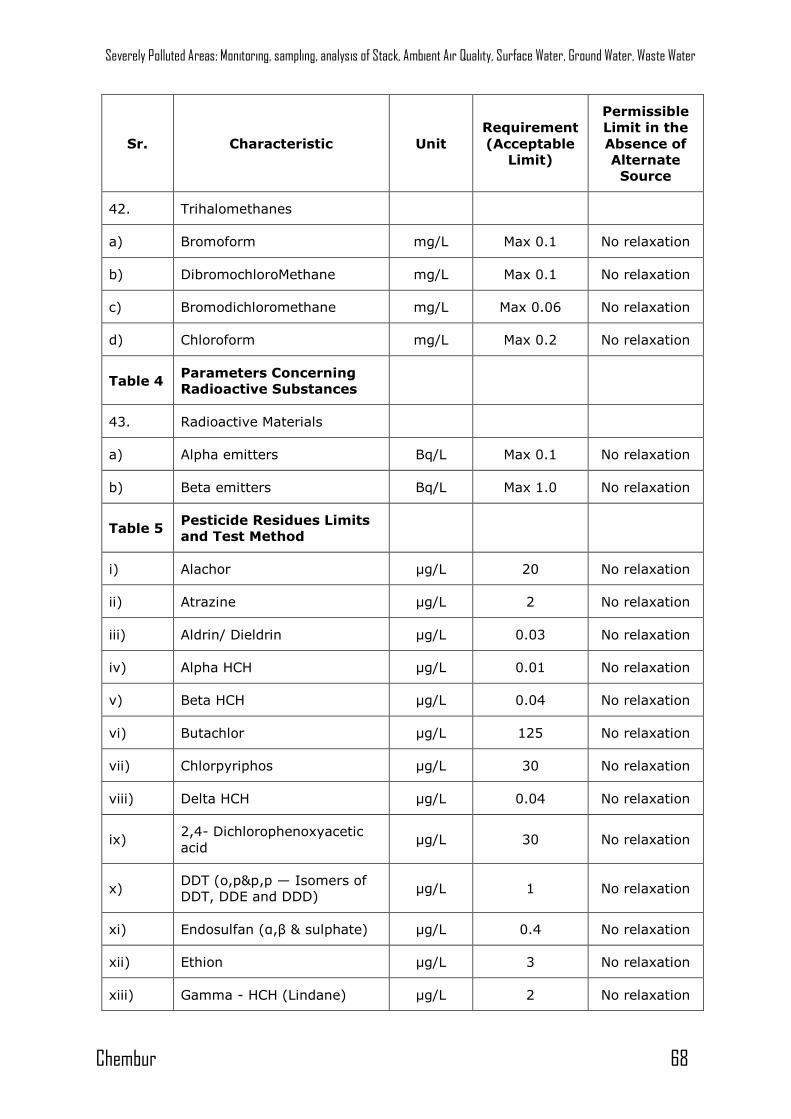
Severely Polluted Areas: Monitoring, sampling, analysis of Stack, Ambient Air Quality, Surface Water, Ground Water, Waste Water
Chembur 68
Sr. Characteristic Unit
Requirement
(Acceptable
Limit)
Permissible
Limit in the
Absence of
Alternate
Source
42. Trihalomethanes
a) Bromoform mg/L Max 0.1 No relaxation
b) DibromochloroMethane mg/L Max 0.1 No relaxation
c) Bromodichloromethane mg/L Max 0.06 No relaxation
d) Chloroform mg/L Max 0.2 No relaxation
Table 4 Parameters Concerning
Radioactive Substances
43. Radioactive Materials
a) Alpha emitters Bq/L Max 0.1 No relaxation
b) Beta emitters Bq/L Max 1.0 No relaxation
Table 5 Pesticide Residues Limits
and Test Method
i) Alachor μg/L 20 No relaxation
ii) Atrazine μg/L 2 No relaxation
iii) Aldrin/ Dieldrin μg/L 0.03 No relaxation
iv) Alpha HCH μg/L 0.01 No relaxation
v) Beta HCH μg/L 0.04 No relaxation
vi) Butachlor μg/L 125 No relaxation
vii) Chlorpyriphos μg/L 30 No relaxation
viii) Delta HCH μg/L 0.04 No relaxation
ix) 2,4- Dichlorophenoxyacetic
acid μg/L 30 No relaxation
x) DDT (o,p&p,p — Isomers of
DDT, DDE and DDD) μg/L 1 No relaxation
xi) Endosulfan (α,β & sulphate) μg/L 0.4 No relaxation
xii) Ethion μg/L 3 No relaxation
xiii) Gamma - HCH (Lindane) μg/L 2 No relaxation
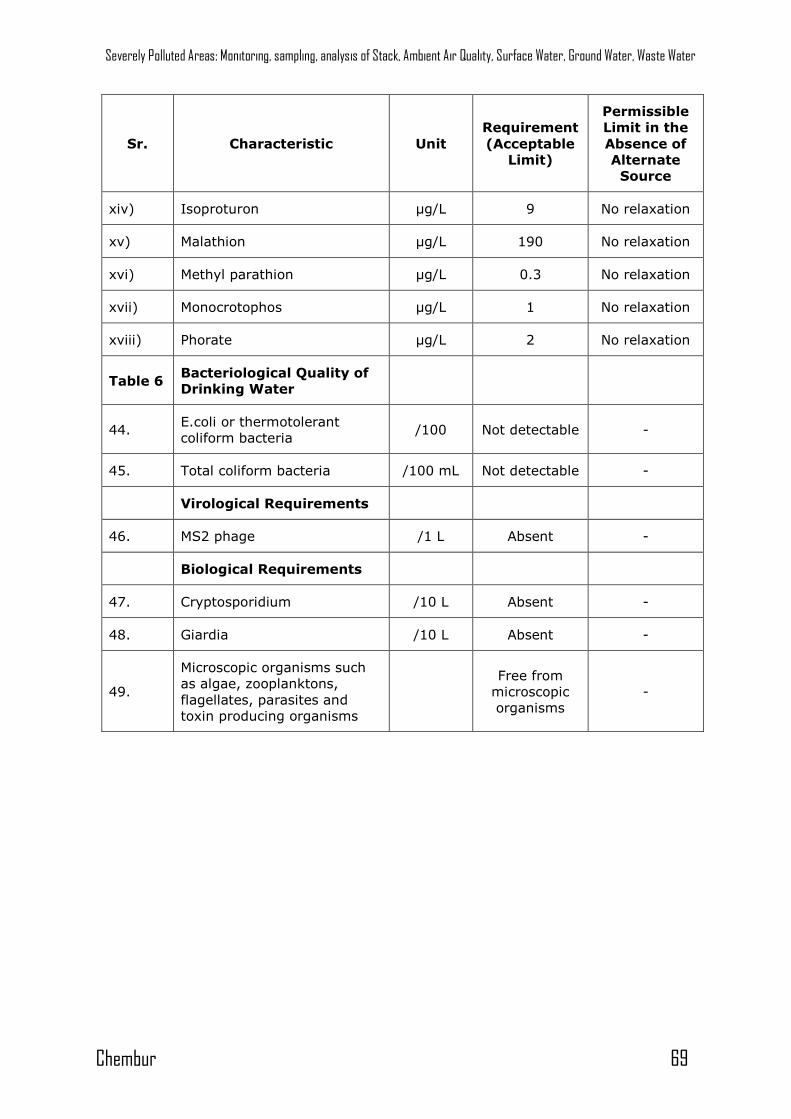
Severely Polluted Areas: Monitoring, sampling, analysis of Stack, Ambient Air Quality, Surface Water, Ground Water, Waste Water
Chembur 69
Sr. Characteristic Unit
Requirement
(Acceptable
Limit)
Permissible
Limit in the
Absence of
Alternate
Source
xiv) Isoproturon μg/L 9 No relaxation
xv) Malathion μg/L 190 No relaxation
xvi) Methyl parathion μg/L 0.3 No relaxation
xvii) Monocrotophos μg/L 1 No relaxation
xviii) Phorate μg/L 2 No relaxation
Table 6 Bacteriological Quality of
Drinking Water
44. E.coli or thermotolerant
coliform bacteria /100 Not detectable -
45. Total coliform bacteria /100 mL Not detectable -
Virological Requirements
46. MS2 phage /1 L Absent -
Biological Requirements
47. Cryptosporidium /10 L Absent -
48. Giardia /10 L Absent -
49.
Microscopic organisms such
as algae, zooplanktons,
flagellates, parasites and
toxin producing organisms
Free from
microscopic
organisms
-
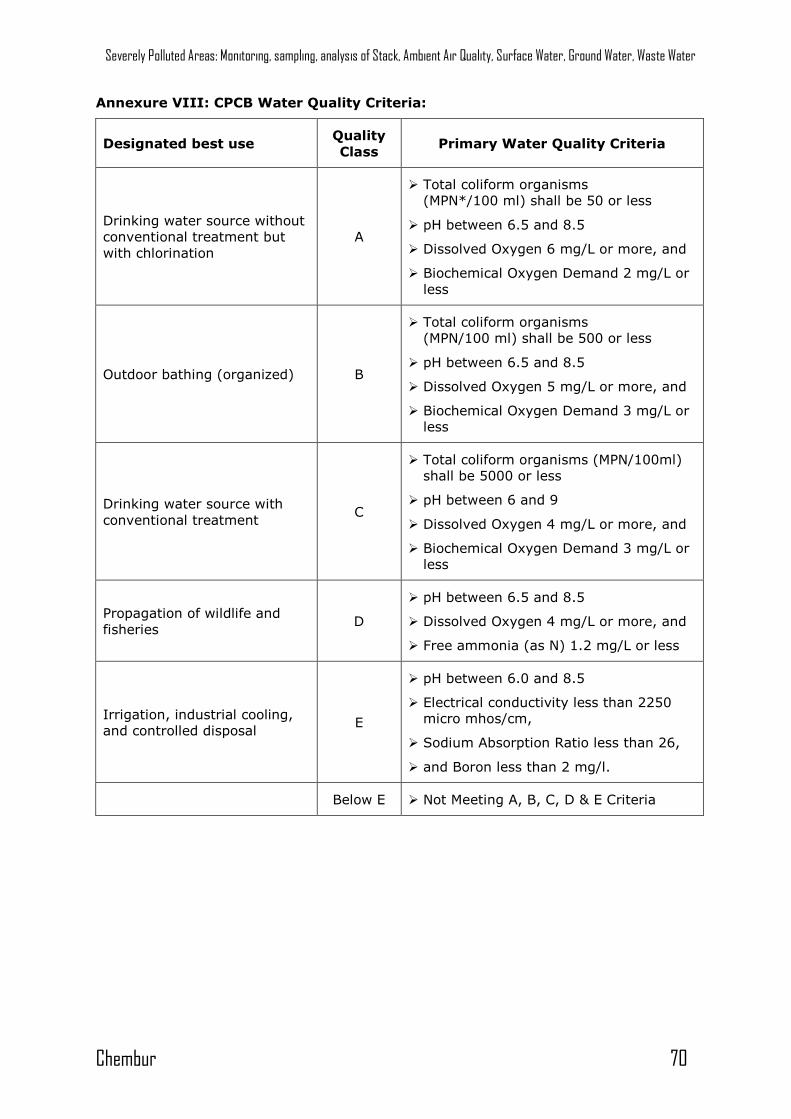
Severely Polluted Areas: Monitoring, sampling, analysis of Stack, Ambient Air Quality, Surface Water, Ground Water, Waste Water
Chembur 70
Annexure VIII: CPCB Water Quality Criteria:
Designated best use Quality
Class Primary Water Quality Criteria
Drinking water source without
conventional treatment but
with chlorination
A
Total coliform organisms
(MPN*/100 ml) shall be 50 or less
pH between 6.5 and 8.5
Dissolved Oxygen 6 mg/L or more, and
Biochemical Oxygen Demand 2 mg/L or
less
Outdoor bathing (organized) B
Total coliform organisms
(MPN/100 ml) shall be 500 or less
pH between 6.5 and 8.5
Dissolved Oxygen 5 mg/L or more, and
Biochemical Oxygen Demand 3 mg/L or
less
Drinking water source with
conventional treatment C
Total coliform organisms (MPN/100ml)
shall be 5000 or less
pH between 6 and 9
Dissolved Oxygen 4 mg/L or more, and
Biochemical Oxygen Demand 3 mg/L or
less
Propagation of wildlife and
fisheries D
pH between 6.5 and 8.5
Dissolved Oxygen 4 mg/L or more, and
Free ammonia (as N) 1.2 mg/L or less
Irrigation, industrial cooling,
and controlled disposal E
pH between 6.0 and 8.5
Electrical conductivity less than 2250
micro mhos/cm,
Sodium Absorption Ratio less than 26,
and Boron less than 2 mg/l.
Below E Not Meeting A, B, C, D & E Criteria
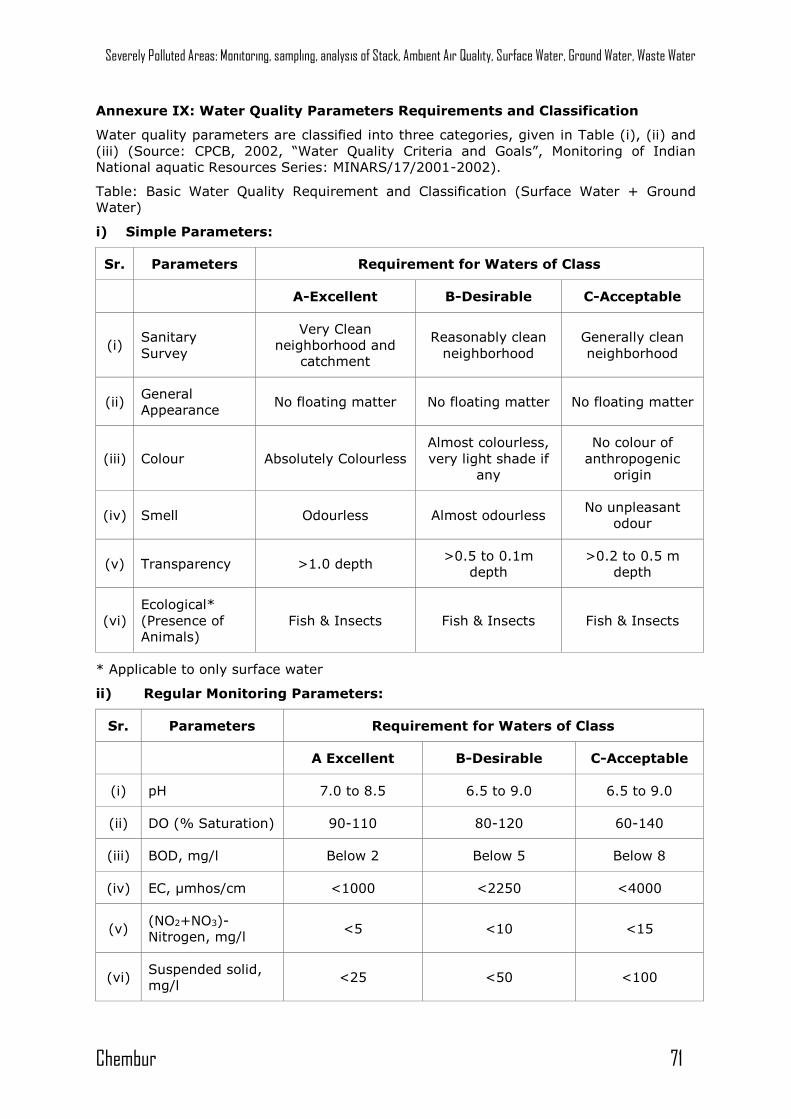
Severely Polluted Areas: Monitoring, sampling, analysis of Stack, Ambient Air Quality, Surface Water, Ground Water, Waste Water
Chembur 71
Annexure IX: Water Quality Parameters Requirements and Classification
Water quality parameters are classified into three categories, given in Table (i), (ii) and
(iii) (Source: CPCB, 2002, “Water Quality Criteria and Goals”, Monitoring of Indian
National aquatic Resources Series: MINARS/17/2001-2002).
Table: Basic Water Quality Requirement and Classification (Surface Water + Ground
Water)
i) Simple Parameters:
Sr. Parameters Requirement for Waters of Class
A-Excellent B-Desirable C-Acceptable
(i) Sanitary
Survey
Very Clean
neighborhood and
catchment
Reasonably clean
neighborhood
Generally clean
neighborhood
(ii) General
Appearance No floating matter No floating matter No floating matter
(iii) Colour Absolutely Colourless
Almost colourless,
very light shade if
any
No colour of
anthropogenic
origin
(iv) Smell Odourless Almost odourless No unpleasant
odour
(v) Transparency >1.0 depth >0.5 to 0.1m
depth
>0.2 to 0.5 m
depth
(vi)
Ecological*
(Presence of
Animals)
Fish & Insects Fish & Insects Fish & Insects
* Applicable to only surface water
ii) Regular Monitoring Parameters:
Sr. Parameters Requirement for Waters of Class
A Excellent B-Desirable C-Acceptable
(i) pH 7.0 to 8.5 6.5 to 9.0 6.5 to 9.0
(ii) DO (% Saturation) 90-110 80-120 60-140
(iii) BOD, mg/l Below 2 Below 5 Below 8
(iv) EC, μmhos/cm <1000 <2250 <4000
(v) (NO2+NO3)-
Nitrogen, mg/l <5 <10 <15
(vi) Suspended solid,
mg/l <25 <50 <100
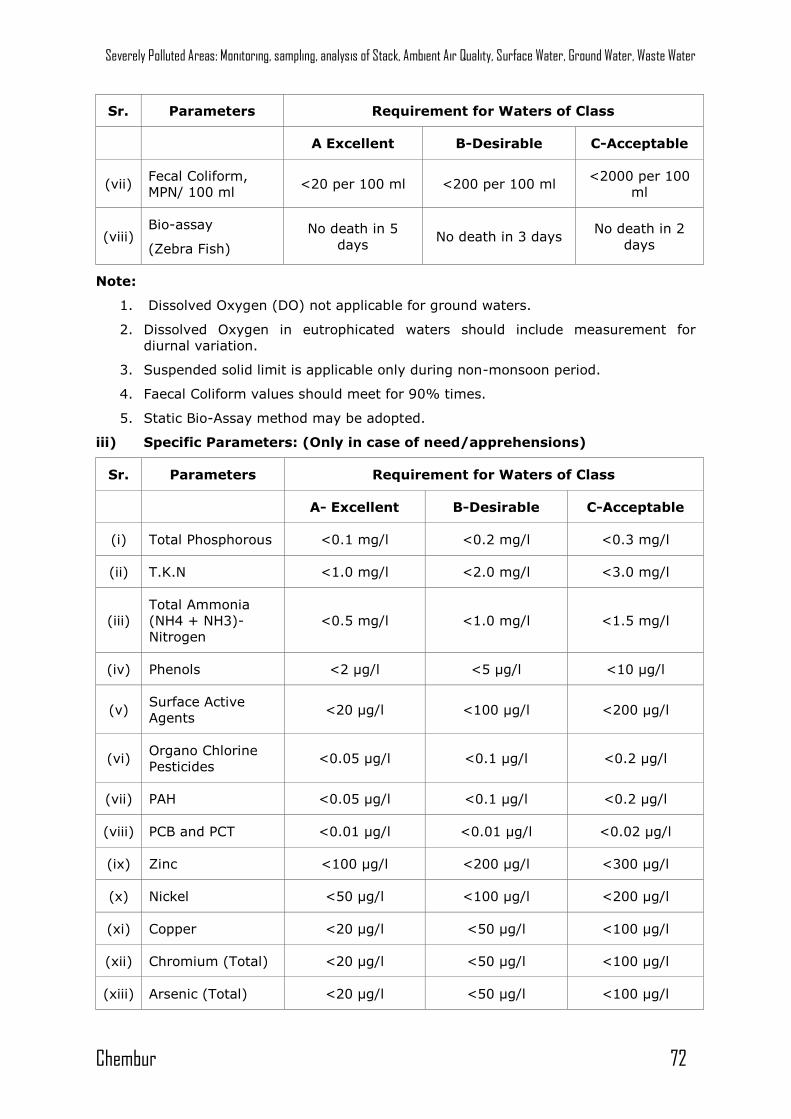
Severely Polluted Areas: Monitoring, sampling, analysis of Stack, Ambient Air Quality, Surface Water, Ground Water, Waste Water
Chembur 72
Sr. Parameters Requirement for Waters of Class
A Excellent B-Desirable C-Acceptable
(vii) Fecal Coliform,
MPN/ 100 ml <20 per 100 ml <200 per 100 ml
<2000 per 100
ml
(viii) Bio-assay
(Zebra Fish)
No death in 5
days No death in 3 days
No death in 2
days
Note:
1. Dissolved Oxygen (DO) not applicable for ground waters.
2. Dissolved Oxygen in eutrophicated waters should include measurement for
diurnal variation.
3. Suspended solid limit is applicable only during non-monsoon period.
4. Faecal Coliform values should meet for 90% times.
5. Static Bio-Assay method may be adopted.
iii) Specific Parameters: (Only in case of need/apprehensions)
Sr. Parameters Requirement for Waters of Class
A- Excellent B-Desirable C-Acceptable
(i) Total Phosphorous <0.1 mg/l <0.2 mg/l <0.3 mg/l
(ii) T.K.N <1.0 mg/l <2.0 mg/l <3.0 mg/l
(iii)
Total Ammonia
(NH4 + NH3)-
Nitrogen
<0.5 mg/l <1.0 mg/l <1.5 mg/l
(iv) Phenols <2 μg/l <5 μg/l <10 μg/l
(v) Surface Active
Agents <20 μg/l <100 μg/l <200 μg/l
(vi) Organo Chlorine
Pesticides <0.05 μg/l <0.1 μg/l <0.2 μg/l
(vii) PAH <0.05 μg/l <0.1 μg/l <0.2 μg/l
(viii) PCB and PCT <0.01 μg/l <0.01 μg/l <0.02 μg/l
(ix) Zinc <100 μg/l <200 μg/l <300 μg/l
(x) Nickel <50 μg/l <100 μg/l <200 μg/l
(xi) Copper <20 μg/l <50 μg/l <100 μg/l
(xii) Chromium (Total) <20 μg/l <50 μg/l <100 μg/l
(xiii) Arsenic (Total) <20 μg/l <50 μg/l <100 μg/l
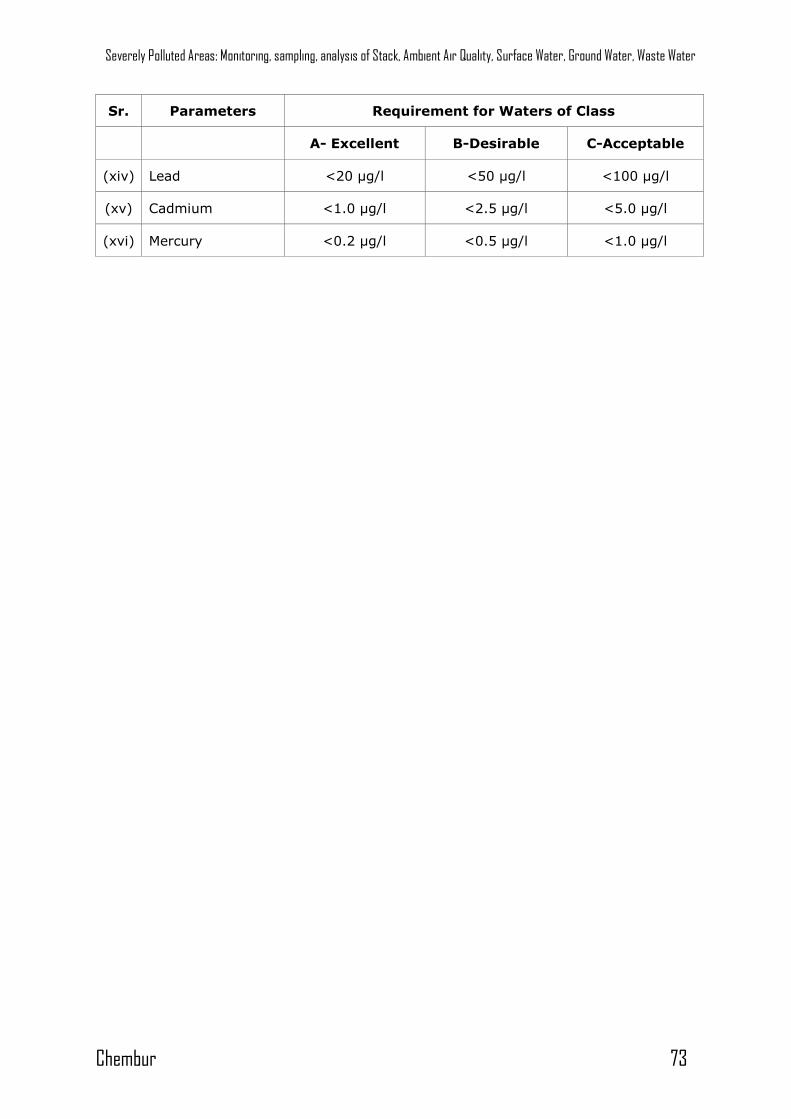
Severely Polluted Areas: Monitoring, sampling, analysis of Stack, Ambient Air Quality, Surface Water, Ground Water, Waste Water
Chembur 73
Sr. Parameters Requirement for Waters of Class
A- Excellent B-Desirable C-Acceptable
(xiv) Lead <20 μg/l <50 μg/l <100 μg/l
(xv) Cadmium <1.0 μg/l <2.5 μg/l <5.0 μg/l
(xvi) Mercury <0.2 μg/l <0.5 μg/l <1.0 μg/l
Related Documents