Welcome message from author
This document is posted to help you gain knowledge. Please leave a comment to let me know what you think about it! Share it to your friends and learn new things together.
Transcript

JUN E 20 15
A Resou rce for Applied Epidem iolog ists

i
Table of Contents
Acknowledgements ...................................................................................................................................... iv
Suggested citation ......................................................................................................................................... v
Chapter 1: Introduction ................................................................................................................................ 1
Definition of Chronic Diseases .................................................................................................................. 1
Changing Patterns and the Need to Focus on Chronic Disease ................................................................ 1
Role of Chronic Disease Epidemiology ...................................................................................................... 2
Purpose of a Chronic Disease Epidemiologist Orientation Manual .......................................................... 3
Organization of a Chronic Disease Epidemiologist Orientation Manual .................................................. 4
Chapter 2: Understanding the Job ................................................................................................................ 7
Know the Chronic Disease Epidemiologist’s Public Health Roles ............................................................. 7
Learn All About Your Organization ......................................................................................................... 10
Meet With Your Colleagues across the Division and Department ......................................................... 11
Develop Short- and Long-term Goals for Your Position .......................................................................... 13
Expanding Chronic Disease Epidemiology Capacity ................................................................................ 13
Build Partnerships with Communities, Academia, and Other Agencies ................................................. 14
Become Active in Local and National Organizations .............................................................................. 15
Join the Council of State and Territorial Epidemiologists (CSTE) ............................................................ 15
Resources ................................................................................................................................................ 15
Become Active in National Organizations ............................................................................................... 17
Chapter 3: Chronic Disease Integration and Collaboration ........................................................................ 19
Recognize Opportunities for Program Integration ................................................................................. 20
Learn from Other States ......................................................................................................................... 21
Think about the Multiple Chronic Conditions Framework and Initiative ............................................... 22
Follow a Systematic Approach to Program Integration .......................................................................... 22
Utilize System Dynamics ......................................................................................................................... 23
Leveraging Funding and Strategies to Prevent and Control Chronic Diseases ....................................... 25
Resources ................................................................................................................................................ 25
Chapter 4: System Approaches and the Social Ecological Model ............................................................... 28
Understand the Levels of Public Health Intervention and Their Influence ............................................ 29
ii
Changing the Context in Communities ................................................................................................... 32
Develop a Coordinated Response ........................................................................................................... 34
Resources and implementation examples .............................................................................................. 36
Chapter 5: Evidence-Based Public Health ................................................................................................... 39
Resources ................................................................................................................................................ 41
Chapter 6: Data Governance....................................................................................................................... 44
Understand the Basics: A Framework for Visualizing Public Health Surveillance.................................. 45
Know the Statutory Authority to Conduct Public Health Action ............................................................ 46
Understand the Data Use Agreement .................................................................................................... 47
Determine Whether Your Project is Research, Surveillance, or Evaluation ........................................... 48
Use Institutional Review Boards (IRBs) When Necessary ....................................................................... 49
Understand Your Obligations under the Health Insurance Portability & Accountability Act (HIPAA) ... 51
Resources ................................................................................................................................................ 54
Chapter 7: Surveillance—Data Sources and Indicators .............................................................................. 56
Review the Purpose of Surveillance ........................................................................................................ 56
Understand the Scope of Surveillance Data ........................................................................................... 57
Selecting a Health Problem for Surveillance and Public Health Action .................................................. 58
Know Data Sources for Chronic Disease Surveillance ............................................................................. 59
Use Chronic Disease Indicators for Surveillance or Guidance ................................................................ 65
Assure Capacity in Mandated Maternal and Child Health Surveillance ................................................. 66
Understanding Oral Health Surveillance ................................................................................................. 67
Using the Healthy People Objectives as Targets ..................................................................................... 69
Find Additional Indicators and Interventions at the Health Indicators Warehouse ............................... 69
Chapter 8: Data Interpretation and Dissemination .................................................................................... 71
Review Concepts Critical for Analyzing and Interpreting Data ............................................................... 71
Understand Concepts Critical for Disseminating Data Results ............................................................... 74
Translate Data for Optimal Messaging to Your Intended Audience ....................................................... 74
Chapter 9: Technical Assistance and Related Programs ............................................................................. 79
Council of State and Territorial Epidemiologists (CSTE) ......................................................................... 79
National Association of Chronic Disease Directors ................................................................................. 80
Association of State and Territorial Dental Directors ............................................................................. 81
Centers for Disease Control and Prevention (CDC) Programs ................................................................ 81
iii
Public Health Informatics ........................................................................................................................ 83
Summary ..................................................................................................................................................... 85
Review Chapters Listed by Essential Functions of a Chronic Disease Epidemiologist ............................ 85
Table of Appendices .................................................................................................................................... 88
Appendix A: Eight Sets of Sample SAS Code to Use with BRFSS Data ................................................... 89
Appendix B: More Links to Helpful Resources ..................................................................................... 110
Appendix C: Acronyms Commonly Used in Chronic Disease Epidemiology ........................................ 115
Appendix D: Position descriptions and Related Workforce Development Resources ......................... 117

iv
Acknowledgements
In September 2004, the Council of State and Territorial Epidemiologists (CSTE) published a white paper entitled Essential Functions of Chronic Disease Epidemiology in State Health Departments by the Chronic Disease Epidemiology Capacity Building Subcommittee. Then in 2008, CSTE published The New State Epidemiologist’s First Days: a Planning Guide. More recently, the CSTE Chronic Disease Epidemiology Capacity Building Subcommittee saw the need for a separate planning guide and orientation manual for the chronic disease epidemiologists in state and local health departments. This manual is the result of the Subcommittee's work and highlights information and resources that an applied chronic disease epidemiologist will need to use regularly.
Many experienced state chronic disease epidemiologists and subject matter experts at CDC and CSTE contributed to this manual:
Renee Calanan, PhD, MS - Colorado Department of Public Health and Environment/CDC,National Center for Chronic Disease Prevention and Health Promotion
Barbara Gabella, MSPH - Colorado Department of Public Health and Environment Matthew D. Ritchey, PT, DPT, OCS, MPH - CDC, National Center for Chronic Disease Prevention
and Health Promotion (formerly also Indiana State Department of Health) Malinda Reddish Douglas, DPH, CPH - Oklahoma State Department of Health Geraldine Perry, DrPH, RDN – CDC, National Center for Chronic Disease Prevention and Health
Promotion Sarojini Kanotra, PhD, MPH - Kentucky Department for Public Health Champ Thomaskutty, MPH - St. Mary's County Health Department, Leonardtown, Maryland
(formerly Indiana State Department of Health) Ihsaan Azzam, MD, PHD, MPH - Nevada State Department of Health Sangeeta Gupta, MD, MPH - Delaware State University Gregg Reed, MPH - Utah Department of Health (formerly North Dakota Department of Health) Carrie Daniels, MS - Oklahoma State Department of Health Sara Huston, PhD - Maine Center for Disease Control and Prevention Nisha Kini, MBBS, MPH - University of Massachusetts Medical School, Worcester, MA (formerly
University of Southern Maine/Maine Center for Disease Control and Prevention) Alison Green-Parsons, BA - Maine Center for Disease Control and Prevention Santosh Nazare, MBBS, MPH - Blue Cross Blue Shield of Michigan (formerly University of Southern
Maine) Charlan Kroelinger, PHD - CDC, National Center for Chronic Disease Prevention and Health
Promotion Violanda Grigorescu, MD, MSPH - CDC, National Center for Chronic Disease Prevention and
Health Promotion MaryCatherine Jones, MPH - Utah Department of Health Bonnie Yu, MA, MS - Florida Department of Public Health Annie Tran, MPH - Council of State and Territorial Epidemiologists
v
We also acknowledge the expertise and helpful comments of Juliet Van Eenwyk, MS, PhD - Washington State Department of Health; Mandy Stahre, MPH, PhD - Washington State Department of Health; Michelle Sandoval MPH, CPH - CDC, National Center for Chronic Disease Prevention and Health Promotion/Indiana State Department of Health; Pratik Pandya, MPH – University of Kansas Medical Center; Paul Z. Siegel, MD, MPH- CDC, National Center for Chronic Disease Prevention and Health Promotion; Jennifer Lemmings, MPH - Council of State and Territorial Epidemiologists; and Nancy Maddox, MHP - Maren Enterprises, Inc.
This publication was supported by Cooperative Agreement Number 5U380T000143-02 from CDC. Its contents are solely the responsibility of the authors and do not necessarily represent the official views of CDC.
A part of this material was adapted with permission, from the Annual Review of Public Health, Volume 30 ©2009 by Annual Reviews www.annualreviews.org.
Suggested citation
Council of State and Territorial Epidemiologists. Chronic Disease Epidemiologist Orientation
Manual: A Resource for Applied Epidemiologists. Atlanta, GA: CSTE; 2015.

1
Chapter 1: Introduction
Definition of Chronic Diseases
Chronic diseases—heart disease, cancer, diabetes, arthritis, stroke, chronic lower respiratory
disease, and others—are illnesses that persist over time, can gradually progress, do not resolve
spontaneously, and may not be cured. They are leading causes of morbidity, mortality, disability,
and decreased quality of life in the United States.1 Chronic diseases account for at least 65% of all
deaths, and about 84% of health spending in the United States.2,3 One out of four Americans have
multiple chronic conditions,3 with hypertension being the most common condition among
Medicare beneficiaries with multiple conditions.4 Additionally, chronic diseases are responsible for
the widest health disparity gap among racial/ethnic groups in the United States. While chronic
diseases are prevalent, costly, and potentially debilitating or fatal, they and/or their sequelae are,
in part, preventable. Preventing chronic diseases is challenging due to a complex etiology: the
interaction of genetics, cumulative behavior, and socio-political and physical environment. Chronic
diseases can be characterized by uncertain etiology, multiple risk factors and a prolonged,
progressive disease course that aging exacerbates. However, many known risk factors for chronic
diseases, such as smoking, unhealthy diet, and physical inactivity, are amenable to change through
interventions targeting individuals and communities.
Changing Patterns and the Need to Focus on Chronic Disease In 1900, three groups of illnesses—(1) pneumonia and influenza; (2) tuberculosis; and (3) gastritis,
enteritis and colitis—accounted for nearly one third of all deaths.5 However, public health and
medical advances helped to prevent and control these conditions and contributed to an increase in
life expectancy in the developed world. These factors, along with the aging of the population, have
led to an increase in the number of U.S. residents living with one or more chronic diseases. 6
Today, heart disease, cancer and stroke account for over half of all deaths—the result of an
epidemiologic transition from acute infectious diseases to noninfectious chronic diseases as the
1 CSTE. Essential Functions of Chronic Disease Epidemiology in State Health Departments. 2004. 2 FastStats: Deaths and Mortality. Centers for Disease Control and Prevention Website. Available at: http://www.cdc.gov/nchs/fastats/deaths.htm. Updated February 6, 2015. Accessed February 16, 2015. 3Anderson G. Chronic Care: Making the Case for Ongoing Care. Princeton, NJ: Robert Wood Johnson Foundation, 2010. Available at: http://www.rwjf.org/content/dam/farm/reports/reports/2010/rwjf54583 Accessed February 16, 2015. 4 Chronic Conditions Chartbook. Centers for Medicare and Medicaid Services Website. Available at:
http://www.cms.gov/Research-Statistics-Data-and-Systems/Statistics-Trends-and-Reports/Chronic-Conditions/Downloads/2012Chartbook.pdf Accessed March 9, 2014. 5 National Center for Health Statistics. Leading Causes of Death, 1900-1998. Centers for Disease Control and Prevention Website. Available at: http://www.cdc.gov/nchs/data/dvs/lead1900_98.pdf Accessed February 20, 2014. 6 Anderson G. Chronic Care: Making the Case for Ongoing Care. Princeton, NJ: Robert Wood Johnson Foundation, 2010. Available at: http://www.rwjf.org/content/dam/farm/reports/reports/2010/rwjf54583 Accessed February 16, 2015.

2
predominant causes of morbidity and mortality, a transition described over 40 years ago.7
Ironically, the epidemiologic transition has been driven by the very technologic and economic
developments that have contributed to longer lives. The transition shifts the primary focus of
healthcare from treating acute, infectious diseases to modifying risk factors to prevent and control
chronic diseases.
The Institute of Medicine described the mission of public health as assuring conditions in which
people can be healthy.8 In 1988, the Centers for Disease Control and Prevention (CDC) established
the National Center for Chronic Disease Prevention and Health Promotion “to create expertise,
information, and tools to support people and communities in preventing chronic diseases and
promoting health for all.”9 With this mission to assure healthy conditions and promote health for
all and with focused funding from CDC, many states have strengthened their chronic disease
programs to support sound data-driven policies and public health interventions. Epidemiology is a
central component of these efforts.
Public health departments prioritize problems that lead to illness, disabili ty, or death (measured by
their high prevalence or high fatality rate), that result in high health care cost, and/or that reduce
quality of life. Chronic diseases in the population meet all three criteria of public health
importance. Therefore, public health departments need to address chronic disease by increasing
their number of chronic disease epidemiologists and by supporting at least one lead chronic
disease epidemiologist to oversee and coordinate data collection, analysis, interpretation, and
translation of data and research to public health practice.10
Role of Chronic Disease Epidemiology
Epidemiology is the “study of the distribution and determinants of health -related states in
specified populations, and the application of this study to control heal th problems”.11
In the case of infectious diseases, the presence of specific causative agents helps epidemiologists
focus on host-agent-environment interactions and recommend interventions to prevent and
control the diseases, especially during outbreaks of acute illness. Chronic diseases, which are not
chronic infectious diseases such as HIV or tuberculosis, often have multi -factorial origins and
complex determinants that play out over a lengthy time period.
The nature of chronic illness dictates that chronic disease epidemiologists understand all three
stages of disease prevention. Primary prevention focuses on protecting healthy individuals from
developing disease or experiencing injury with a focus on reducing risk factors and increasing
protective factors in individuals across a population. Secondary prevention aims to prevent the
7 Omran AR. The epidemiologic transition. Milbank Mem Fund Q. 1971; 49(4):509-38. 8 Institute of Medicine. The Future of Public Health. Washington, D.C.: National Academy Press, 1988. Updated 2002. http://iom.edu/Reports/2002/The-Future-of-the-Publics-Health-in-the-21st-Century.aspx 9 Chronic Disease Prevention and Health Promotion. Centers for Disease Control and Prevention Website. Available at:
http://www.cdc.gov/chronicdisease/about/ Updated November 14, 2014. Accessed February 16,2015. 10 CSTE. Essential Functions of Chronic Disease Epidemiology in State Health Departments. 2004. 11 Last JM. A Dictionary of Epidemiology. 4th ed. New York: Oxford University Press; 2001:62.

3
onset of symptoms in the earliest stages of disease once an illness or risk factors have been
diagnosed or identified. Tertiary prevention deals with minimizing the negative effects of disease
and preventing disease-related complications, total disability, and premature death by improving
healthcare quality and individuals' management of complicated, long-term health problems.
In brief, the role of the chronic disease epidemiologist is to collect, analyze, synthesize, and
disseminate disease-specific information—medical, societal and financial costs, spatial and
temporal disease distribution, and risk factors or causes—so that the epidemiologist can:
Assess the burden of chronic diseases across the lifespan.
Inform policies and evidence-based programmatic activities to prevent and control chronic
diseases.
Promote collaborations with peer colleagues to address age-related chronic disease issues
(e.g., the life span approach), health disparities, social determinants of disease, and health
inequities.
In addition to these functions, chronic disease epidemiologists play a significant role in enhancing
efficiency, focusing (or refocusing) public health program efforts, and allocating scarce resources.
Purpose of a Chronic Disease Epidemiologist Orientation Manual Commonly, state chronic disease epidemiologists serve one categorical program, such as tobacco,
or cancer. However, with recent and ongoing efforts to integrate and coordinate across and
chronic disease programs, the role and influence of a chronic disease epidemiologist will broaden
to address multiple program areas.
This manual is intended to serve as a “quick start” menu of resources for lead chronic disease
epidemiologists working in state, territorial, tribal, or local health departments. Such an
epidemiologist can demonstrate mid-level competencies in epidemiology, also known as CSTE Tier
2 competencies.12 This epidemiologist might serve as the sole epidemiologist in the chronic disease
program or as the lead chronic disease epidemiologist (the single point of contact for chronic
disease epidemiology) responsible for coordinating or integrating chronic disease epidemiology
activities across categorical programs. Throughout its chapters, this manual uses “lead chronic
disease epidemiologist” to refer to this main target audience. This manual provides a road map
and advice for serving in this capacity or role as the “lead chronic disease epidemiologist .”
Additional intended audiences and uses of the information and guidance in this manual include:
Local epidemiologists who serve in a variety of capacities, including addressing chronic
disease issues;
Senior epidemiologists or senior professionals who hire, train, and/or mentor chronic
disease epidemiologists;
12 CSTE, CDC. Applied Epidemiology Competencies. 2008. http://www.cste.org/group/CSTECDCAEC

4
Entry-level chronic disease epidemiologists (CSTE Tier 1) who might focus on one disease
and/or one type of data source and who is interested in increasing their knowledge and
understanding of potential next steps in career development;
Recent graduates in chronic disease epidemiology who have limited applied experience in a
state public health department; and
Epidemiologists with experience at state health departments but who are new to chronic
disease prevention.
However, this manual is not everything to everyone and is not intended to be a comprehensive
epidemiology manual. Still, it is the authors' hope that this manual will encourage discussion and
collaboration to address challenges and spur innovation in the delivery of data-driven chronic
disease epidemiology services throughout the United States.
Organization of the Chronic Disease Epidemiologist Orientation Manual
Chapters 2 through 8 begin with a brief description highlighting the relevant content for each
level of epidemiologist, based on CSTE Tiers 1-3 of epidemiology competencies. A summary at the
end of each chapter organizes the main points related to the three essential public health services
in which epidemiologists are leaders:13
1. Surveillance
2. Communication
3. Consultation
If applicable, summaries will include main points related to evaluation, because there is a growing
need for epidemiologists to respond to impact and accountability requests Therefore, chronic
disease integration elevates the need for epidemiologists to develop and measure SMART
objectives (i.e., objectives that are specific, measurable, achievable, realistic, and time -phased)
and performance measures that demonstrate accountability to funders and provides data to
constituencies. Measuring the impact of an integrated program on the prevalence of a specific
chronic disease (or its risk factors) will meet the needs of the categorical funders and constituent
groups.14 Chapter 9 describes technical assistance offered by professional organizations and public
health agencies that fund, provide training and technical assistance, and build workforce capacity.
The last chapter, the Summary Chapter, is divided into two parts. The first part lists key points
from this manual for the 1st week, 1st month, 1st 90 days, and 1st year. The second part shows the
relationship between the essential public health services, the responsibilities of a lead chronic
disease epidemiologist, and the chapters in this manual.
The Appendices provide links to additional resources and useful details, such as common
acronyms, disease and procedure codes used in health care claims data, useful SAS statistical code
13 CSTE. Essential Functions of Chronic Disease Epidemiology in State Health Departments. 2004. 14 Slonim AB, Callaghan C, Daily L, et al. Recommendations for integration of chronic disease programs: Are your programs linked? Prev Chronic Dis [serial online] 2007. http://www.cdc.gov/pcd/issues/2007/apr/06_0163.htm

5
for using data from the Behavioral Risk Factor Surveillance System, position descriptions, and
more.
Below is a suggested timeline for using this manual and for activities related to building your
competency and your relationships with your supervisor, colleagues, and partners.
In the first week
Read Chapter 2: Understanding the Job.
Copy the checklist in Table 2-1 into an electronic document. Use it to keep track of your
ideas and personal action items that you identify as you read through the rest of the
manual.
Share a copy of the checklist in Table 2-1 with your supervisor.
Ask for and collect or bookmark the documents and resources listed in Table 2-1 (the
checklist).
In the first month
Read Chapter 3: Chronic Disease Integration. Ask your supervisor to read and discuss it.
Meet with key staff and colleagues within the department.
Read through the documents and resources that you have collected.
In the first quarter
Complete a self assessment of your competencies, using the CSTE tool,15 and share with
your supervisor.
Share your ideas and personal action items with your supervisor and ask him or her to
prioritize them based on relevancy to your current job.
Develop individual goals for the first year based on the self assessment and input and
direction from the senior epidemiologist and your supervisor.
Read Chapter 4: System Approaches and Social Ecological Model, Chapter 5: Evidence-
based Public Health, and Chapter 6: Data Governance.
Read additional chapters and related appendices based on the assessment and input.
In the first six months
Read Chapter 7: Surveillance—Data Sources and Indicators, Chapter 8: Data Interpretation
and Dissemination, and Chapter 9: Technical Assistance and Related Programs, if you have
not already read the full chapters.
Discuss long-term goals for the work and for your career with your supervisor.
15 CSTE Workforce: Competencies Website. Available at: http://www.cste.org/group/CSTECDCAEC Accessed February 23, 2014.
6
In the first year
Meet with key external partners.
Attend at least one meeting of every coalition or stakeholder group.
Use the manual as a starting place for any new topic or new assignment, so that you are
aware of the resources and information already available to you. Search the manual f or
keywords related to the topic or assignment.
Submit an abstract for presentation at the annual conference of CSTE, a national or state
public health association, or a CDC-sponsored conference.
Consider setting up a learning community to share with colleagues and partners
information from this manual or the many resources on the web cited in this manual.
Exchange real-world examples and learn from each other.
7
Chapter 2: Understanding the Job
This chapter discusses the roles and responsibilities of a chronic disease epidemiologist at a state
or large local health department and shares resources to help you fulfill the roles and
responsibilities. As a lead epidemiologist with experience at a state health department yet new to
integrated chronic disease prevention, being successful in your job demands being collaborative
across organizational boundaries to address the complexities of multiple chronic diseases. You will
need to build new working relationships quickly, enhance your communication and consult ing
skills, assess your developmental areas and set related growth goals, and seek professional
mentoring beyond your direct supervisor. With these activities in mind, read this chapter. For the
senior epidemiologist or senior professional who supervises or mentors the lead epidemiologist,
you can use this chapter to orient the new lead chronic disease epidemiologist to the broad
context of the job and to identify relevant reading and key people to meet. Think about how long it
took you to learn how the organization really works, review the list of resources at the end and
highlight the topics most valuable to your new chronic disease epidemiologist. For the entry-level
epidemiologist interested in increasing your knowledge and understanding of potential next steps
in career development, read the section on setting goals for your position and click on the
resource link for a capacity assessment.
Know the Chronic Disease Epidemiologist’s Public Health Roles
As outlined in a 2004 CSTE white paper, Essential Functions of Chronic Disease Epidemiology in
State Health Departments,16 the essential functions include, but are not limited to:
Surveillance:
Collecting, analyzing, and interpreting chronic disease surveillance data to assess the burden of
chronic disease and provide information on the distribution and risk factors of chronic diseases
necessary for public health program planning and implementation
o Coordinating and evaluating chronic disease surveillance, according to nationally
developed standards, including establishing and following data use agreements.
Assisting in the evaluation of public health programs.
Monitoring compliance of chronic disease reporting, if mandated by Board of Health rule.
Communication:
Disseminating results of chronic disease surveillance regularly and widely in a variety of
formats to support science-based decisions about health issues by policy-makers, programs leaders,
and the general public.
16CSTE. Essential Functions of Chronic Disease Epidemiology in State Health Departments. 2004.
8
Serving as the state’s point of contact with CDC's National Center for Chronic Diseas e
Prevention and Health Promotion and CSTE as it relates to chronic disease epidemiology.
Assuring that documents produced by chronic disease programs--reports, grants, and
cooperative agreement applications, press releases--receive appropriate epidemiology input.
Consultation:
Providing decision-makers with information necessary for planning, implementing and
evaluating public health programs and policies, and for establishing goals and priorities related
to chronic disease.
o Providing appropriate epidemiology technical support to state chronic disease
programs. This includes (1) epidemiology capacity/activities are coordinated across
individual, categorical chronic disease programs, (2) community health assessment
activities related to chronic disease control are coordinated at the state level, and (3)
chronic disease programs are evaluated on a regular basis.
Capacity building:
Monitoring the adequacy of the state’s chronic disease epidemiology capacity at least every
two years and updating it as appropriate and feasible.
Maintaining a state strategic plan for filling gaps identified during the capacity assessment
process.
Although CSTE recommends these functions for a central, coordinating chronic disease
epidemiologist position in a state health department, referred to as the lead chronic disease
epidemiologist in this manual., chronic disease epidemiologists at various levels would benefit
from understanding the role of the lead chronic disease epidemiologist and how that may differ
from other chronic disease epidemiologists in their agency. A key function reserved solely for the
lead chronic disease epidemiologist is the coordination and integration of chronic disease
epidemiology activities across categorical programs. This function is so important tha t CSTE
recommends that the minimum work force in chronic disease epidemiology include at least one
epidemiologist responsible for overall coordination across chronic disease program areas among a
minimum of five chronic disease epidemiologists total.17
17 Council of State and Territorial Epidemiologists. Position Statement 07-CD-01: State-level Chronic Disease Epidemiology
Capacity. 2007. Available at: http://c.ymcdn.com/sites/www.cste.org/resource/resmgr/PS/07-CD-01.pdf Accessed February 16. 2015.
9
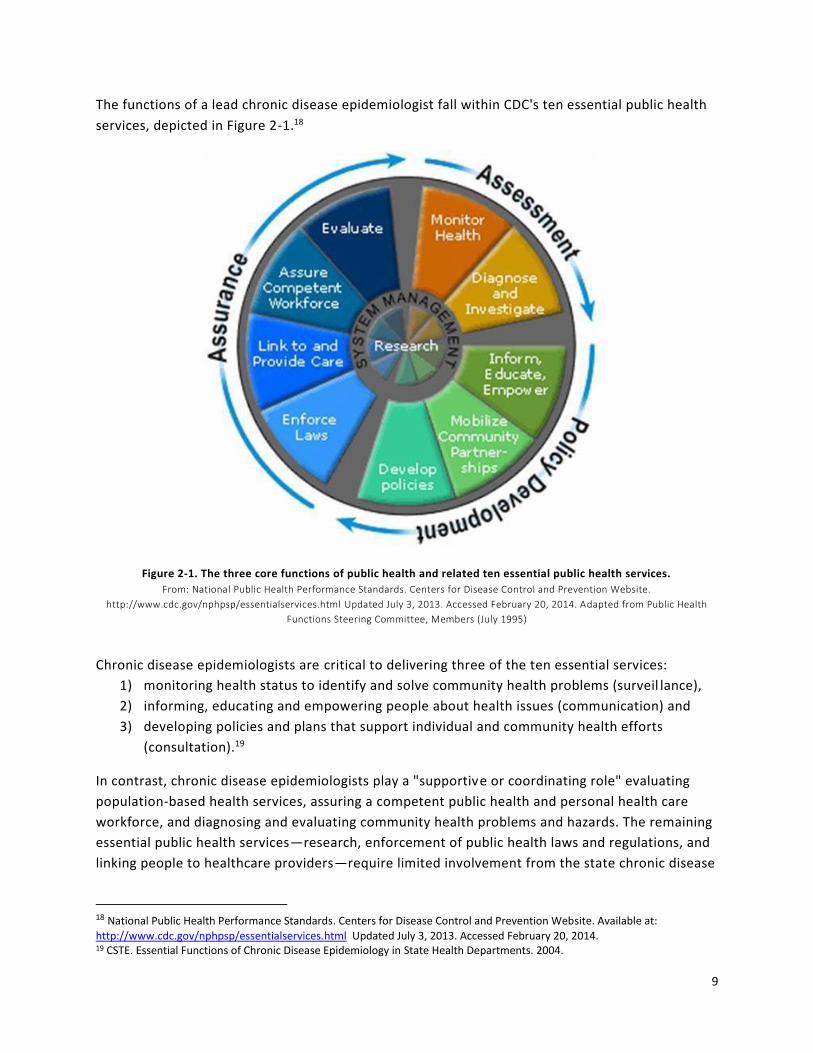
The functions of a lead chronic disease epidemiologist fall within CDC's ten essential public health
services, depicted in Figure 2-1.18
Figure 2-1. The three core functions of public health and related ten essential public health services.
From: National Public Health Performance Standards. Centers for Disease Control and Prevention Website.
http://www.cdc.gov/nphpsp/essentialservices.html Updated July 3, 2013. Accessed February 20, 2014. Adapted from Public Health
Functions Steering Committee, Members (July 1995)
Chronic disease epidemiologists are critical to delivering three of the ten essential services:
1) monitoring health status to identify and solve community health problems (surveil lance),
2) informing, educating and empowering people about health issues (communication) and
3) developing policies and plans that support individual and community health efforts
(consultation).19
In contrast, chronic disease epidemiologists play a "supportive or coordinating role" evaluating
population-based health services, assuring a competent public health and personal health care
workforce, and diagnosing and evaluating community health problems and hazards. The remaining
essential public health services—research, enforcement of public health laws and regulations, and
linking people to healthcare providers—require limited involvement from the state chronic disease
18 National Public Health Performance Standards. Centers for Disease Control and Prevention Website. Available at:
http://www.cdc.gov/nphpsp/essentialservices.html Updated July 3, 2013. Accessed February 20, 2014. 19 CSTE. Essential Functions of Chronic Disease Epidemiology in State Health Departments. 2004.
10
epidemiologist. In addition to prioritizing the ten essential public health services, the CST E white
paper further describes each role and associated duties and provides examples from state health
departments.
These roles can follow a sequence (and cycle) comprising an evidence-based approach to public
health planning:
1) Assess community health problems,
2) Quantify the issue(s),
3) Develop a concise statement of the issue(s) and potential strategies,
4) Determine what is known from the scientific literature,
5) Develop and prioritize program and policy options,
6) Develop an action plan and implement interventions, and
7) Evaluate the programmatic or policy interventions. (See Chapter 5: Evidence-Based Public
Health for more information.)
An evidence-based public health approach (Chapter 5) is particularly important in the face of
limited resources, as it identifies interventions with the greatest reach or impact. Moreover,
evaluations can assess cost-effectiveness. This approach helps to identify and state mutual
benefits and opportunities across disease categories, engage stakeholders, mobilize leaders, and
evaluate the intervention, all principles of integration.20 It can also result in collective impact, the
potentially larger impact that occurs when multiple agencies commit to a shared agenda, pursue
activities that reinforce each other’s work, and measure their efforts.21 The evaluation of the policy
or public health intervention becomes even more important when integrating chronic disease
programs. To keep the support of the funders, experts, and constituencies of a single chronic
disease area, integrated programs will still need to demonstrate the progress and impact of
addressing common risk factors or multiple outcomes through the policy or public health
intervention.
Learn All About Your Organization As a new chronic disease epidemiologist in a leadership position, one of your first tasks is to
understand the organizational context of your position; that is, your role within your program,
your program’s role within the health department and the health department’s role vis-à-vis other
state and local agencies. Although state chronic disease epidemiologists share similar
responsibilities, the chain-of-command and specific job expectations may vary from health
department to health department. Therefore, it is important to know your health department well.
20 Slonim AB, Callaghan C, Daily L, et al. Recommendations for integration of chronic disease programs: Are your programs linked? Prev Chronic Dis [serial online] 2007. http://www.cdc.gov/pcd/issues/2007/apr/06_0163.htm 21 Kania J, Kramer M. Collective impact. Stanford Social Innovation Review. Winter 2011.
11
Here are some important first steps in understanding the organizational context of your new job:
Review the health department’s strategic plan and mission, and vision statements.
Review the health department’s and the division’s organizational charts and decision-
making authorities.
Review the health department director’s priorities.
Inquire about the health department’s relationships with other agencies, including local
public health agencies and relevant federal agencies.
Ask about local public health agencies’ roles and their expectations from the state health
department.
Understand the department’s funding and your program’s grants, budget, and fiscal
calendar.
Review existing and preferred communications procedures.
Review previous press releases, media policies and the approval process for talking to the
media.
Review the policy for releasing reports with the department’s name or logo on it.
Learn how the health department accesses full-text peer-reviewed publications.
Develop relationships with your colleagues across the division and department. (See also
Chapter 3: Chronic Disease Integration and Collaboration.)
Ask colleagues to identify the external experts and constituencies in the categorical areas
of chronic disease.
Inquire about the primary challenges for your program/branch/division, including disease
burden, resource limitations, and political challenges.
Learn about data governance within the department (Chapter 6), including the privacy and
security board, data sharing agreements, data access policies, data release/data
suppression policies, Board of Health rules related to reportable conditions that are
chronic diseases, and the IRB’s role.
Meet With Your Colleagues across the Division and Department Relationships with division and departmental colleagues are crucial to effectively carry out the work of a state chronic disease epidemiologist. Possible colleagues include:
Other chronic disease epidemiologists.
Chronic disease program managers and staff.
Maternal and child health, oral health, injury, mental health, substance abuse,
environmental health, occupational health, and communicable disease program managers,
staff, and epidemiologists.
Division leaders.
Statisticians and data managers, including staff who manage/coordinate vital statistics data,
hospital discharge data, and data from major surveillance systems, such as the Behavioral
Risk Factor Surveillance System (BRFSS) and Youth Risk Behavior Surveillance System

12
(YRBSS). (It is especially important to build a relationship with the BRFSS coordinator. Some
of these persons might be in other organizations, for example, the state department of
education.)
Communications staff, including the department’s public information officer.
Administrative staff.
Build relationships with these colleagues. Understand their roles and how you can assist each
other for an efficient use of staff, funds, and surveillance and intervention efforts. Ask. Listen.
Table 2-1 comprises a simple checklist to help you keep track of documents and other information your colleagues share with you during the orientation period. Table 2-1. Checklist for Sharing Documents, Resources, and Information during Orientation.
Provided To Provide
in Person N/A
Organizational
Charts
Department
Division
Program
Statements Mission
Vision
Program Area-
Specific Info
Strategic plans
Statewide plans
Contact info for personnel, contractors
Copies of grants, budgets, work plans
Copies of cooperative agreements
Data sharing agreements
Data products (fact sheets, reports)
Epidemiologist job description
Suggested
Resources
Websites
Online trainings
Other training materials/resources
Articles/other resources
Upcoming
Events
Calendar—important dates
Appropriate conferences (dates)
Program Area
Communication
Program-specific email policy
SharePoint (or similar) information
Available group email lists
Additional Info __________________________________
__________________________________
__________________________________

13
Develop Short- and Long-term Goals for Your Position
The development of short- and long-term goals will help to focus your efforts and provide a means
to gauge progress. Start by reviewing existing work plans and clarifying the needs of the
program/branch/division. Learn about the health status of state residents, including social
determinants of health and any changing demographic characteristics of the state population.
Specific goals could include time-bound objectives for providing technical assistance to program
staff and other epidemiologists, assessing epidemiology capacity and creating a capacity -building
plan, evaluating current surveillance systems, and developing policies and procedures. 22 A short-
term goal for your position could be to find and review a cost-benefit analysis of the Stanford
chronic disease self-management course. A long-term goal could be to communicate this analysis
to the state legislative committee hearing a bill to expand funding for the Stanford chronic disease
self-management course or to conduct a cost-benefit analysis of adding an evidence-based fall
prevention component to this course. Another long-term goal for your position is to make the case
for expanding the number of chronic disease epidemiologists in your organization or to expand
their capacity.
Expanding Chronic Disease Epidemiology Capacity
Conducting a formal epidemiology capacity assessment is a good first step to document and
address limited capacity or limited public health training of chronic disease epidemiology staff.
CSTE’s Applied Epidemiology Competencies Toolkit defines competencies for four tiers of
practicing epidemiologists and provides competency assessment forms for each. 23
CSTE’s 2009 report on the national assessment of chronic disease epidemiology capacity
recommends that all state-level chronic disease epidemiology programs maintain minimum
staffing levels and have access to key tools and other resources to support their work: 24
A designated coordinating/lead chronic disease epidemiologist and a minimum of five full
time chronic disease epidemiologists, including at least one with doctoral -level training.
Ability to access and analyze key datasets in timely fashion, including state mortality data,
hospital discharge data, tumor registry data, BRFSS data, emergency department/emergency
medical services (EMS) data, and Medicare data. (Because mortality and Medicare data have
been problematic of late, they may require special attention.)
Ability to calculate confidence intervals for BRFSS prevalence estimates and death rates.
Easy access to medical journals.
Adequate information technology (IT) and clerical support services.
22 CDC. Chronic Disease STEPPS—State-based Epidemiology for Public Health Program Support. Atlanta, GA. (Document available from program staff at the National Center for Chronic Disease Prevention and Health Promotion.) 23 CSTE Workforce: Competencies Website. Available at: http://www.cste.org/group/CSTECDCAEC Accessed February 23, 2014. 24 CSTE Chronic Disease Epidemiology Capacity Assessment Workgroup. 2009 National Assessment of Epidemiology Capacity. Supplemental Report: Chronic Disease Epidemiology Capacity Findings and Recommendations. Atlanta, GA: CSTE; 2009. Available at: http://www.cste.org/group/ECA Accessed February 23, 2014.

14
Access to geographic information system (GIS) software for analysis of spatial aspects of
chronic disease, including routine geocoding of population-based, chronic disease data that
lends itself to geocoding, beginning with birth and death data.
Build Partnerships with Communities, Academia, and Other Agencies
Developing strategic partnerships with communities, academia, and other government agencies
can help you meet your goals. For every issue you address, you will find people with mutual
interests and concerns. Undoubtedly, you will find that nurturing relationships takes time and
energy. It is worth the effort. Meeting with constituents on their territory—at their offices,
community centers or staff meetings—is a gracious and appreciated gesture of interest and
sincerity. You should consider establishing relationships with appropriate stakeholders in
community health centers, professional associations, and other state agencies, as they may be
important allies.25 CSTE recommends state chronic disease epidemiologists maintain strong
relationships with key partners to promote efficient use of resources, enhance surveillance, and
plan and implement evidence-based strategies for chronic disease prevention and health
promotion.26 It singles out three classes of partners:
Substance abuse, mental health, and public health preparedness epidemiologists. (In the
absence of state-level substance abuse and/or mental health surveillance capacity, chronic
disease programs should consider incorporating substance abuse and mental health
surveillance into their surveillance activities, as these are major public health issues during
disasters, and chronic disease epidemiologists should be prepared to assist during public
health emergencies.)
Local academic programs.
Other state health agencies.
Academic leaders of schools of public health and colleges of medicine, nursing, and allied health
professions can be important allies, as well. Many chronic disease epidemiologists are guest
lecturers or adjunct faculty in public health graduate programs. Academic appointments may come
with access to on-line libraries, current public health journals, and other resources and services.
Fellow faculty members, for example, can often offer research expertise and consultation. Your
establishing relationships with schools of public health can open up opportunities for student
internships and practicum projects at the public health department. And continuing education
programs can bolster the professional development of your staff. There are many potential
opportunities for joint ventures.
25 CSTE. The New State Epidemiologist’s First Few Days. Posted 2010. http://www.cste2.org/webpdfs/NewStateEpidemiologistOrientationManual.pdf Accessed February 23, 2014. 26 CSTE Chronic Disease Epidemiology Capacity Assessment Workgroup. 2009 National Assessment of Epidemiology Capacity.
Supplemental Report: Chronic Disease Epidemiology Capacity Findings and Recommendations. Atlanta, GA: CSTE; 2009. Available at: http://www.cste.org/group/ECA Accessed February 23, 2014.

15
Similarly, within the health agency, you want to be viewed as an integral part of the team. Make
time to attend meetings and serve on interdepartmental committees. Some of the relationships
you form will be vital to mutual success.
Become Active in Local and National Organizations
Give and get support. Help shape the national public health agenda by becoming active in local and
national organizations. Volunteer for committee assignments and other leadership positions
related to your specialties and interests in national public health and professional organizations,
such as the American Public Health Association, and CDC. In addition, familiarize yourself with the
work of your local public health directors organization, join your state public health association,
and join coalitions (e.g., the state cancer coalition) related to your areas of int erest and
responsibility.
Join the Council of State and Territorial Epidemiologists (CSTE)
CSTE offers both leadership opportunities and a network of peers who can offer their own best
practices and lessons learned from challenges similar to those you face. CSTE are the leaders in
applied epidemiology and surveillance who build the future leaders. CSTE serves as the
professional nexus of practicing epidemiologists from local and tribal organizations, from state and
territories across multiple specialties within epidemiology: chronic disease, infectious disease, oral
health, maternal and child health, substance abuse, occupational, environmental, and injuries.
Where else can epidemiologists tackle together cross-cutting or emerging issues that span any
single funding source or funding agency? You as a lead epidemiologist can benefit from and
contribute to:
Professional development and training via webinars, toolkits, and conferences
Leadership opportunities, including eligibility to represent CSTE on external consultations
and workgroups
Position statements
News and information on current public health issues, including an online subscription to
the Journal of Public Health Management and Practice and the CSTE quarterly newsletter
Advocacy on national policies and issues affecting epidemiology and surveillance
This manual uses previous work of CSTE. So as you read this manual, you will see the valuable resources that CSTE creates. Chapter 9 has additional information about CSTE and its fellowships.
Resources
More in-depth information on topics in this chapter is available at the following Web sites.

16
10 Essential Public Health Services
CDC Web site: http://www.cdc.gov/nphpsp/essentialservices.html
National Public Health Performance Standards Program: http://www.cdc.gov/nphpsp/
includes educational presentations and state and local assessment forms.
Epidemiologists’ Roles and Responsibilities
Essential Functions of Chronic Disease Epidemiology In State Health Departments:
http://www.cste2.org/webpdfs/EssentialFunctionsWhitePaperEditedFinal092204.pdf
CDC/CSTE Applied Epidemiology Competencies Toolkit: Available at the CSTE Workforce:
Competencies Web site. http://www.cste.org/group/CSTECDCAEC This toolkit includes a
joint CDC & CSTE letter, the complete and short summaries of applied epidemiology
competencies, competency assessment forms for each tier, sample position descriptions,
and more.
The World Bank Public Health Surveillance Toolkit: A Guide for Busy Task Managers:
http://siteresources.worldbank.org/INTPH/Resources/376086-
1133371165476/PHSurveillanceToolkit.pdf
Capacity Building
CSTE Epidemiology Competency Assessment Forms:
http://www.cste.org/group/CSTECDCAEC
These forms are can be used to evaluate one’s level of understanding and ability to
perform the competencies at the following levels or tiers:
Tier 1: Entry level or basic epidemiologist
Tier 2: Mid-level epidemiologist
Tier 3a: Senior-level epidemiologist – Supervisor and/or manager
Tier 3b: Senior scientist or subject area expert
CSTE Epidemiology Capacity Assessments: http://www.cste.org/group/ECA
CSTE 2009 National Assessment of Epidemiology Capacity Findings and
Recommendations:
http://c.ymcdn.com/sites/www.cste.org/resource/resmgr/Workforce/2009ECA.pdf
CSTE Supplemental Report: Chronic Disease Epidemiology Capacity Findings and
Recommendations: http://www.cste2.org/webpdfs/09ECACDECFINAL.pdf
Evaluating Surveillance Systems
CDC’s Updated Guidelines for Evaluating Public Health Surveillance Systems:
http://www.cdc.gov/mmwr/preview/mmwrhtml/rr5013a1.htm. Evaluating surveillance systems is
17
important to assess attributes of the systems and their usefulness, and to identify important data
gaps.
Chronic Disease Program Integration
Comprehensive and Integrated Chronic Disease Prevention: Action Planning Handbook for
States and Communities by National Association of Chronic Disease Directors. 2005.
Available at
http://www.prevent.org/data/files/topics/chronicdiseasepreventionaction_planning_hand
book.pdf
Recommendations for Integration of Chronic Disease Programs: Are Your Programs
Linked? Prev Chronic Dis [serial online] 2007.
http://www.cdc.gov/pcd/issues/2007/apr/06_0163.htm
The Community Toolbox (offering nearly 300 topics with practical guidance for community-building)
Table of Contents: http://ctb.ku.edu/en/tablecontents/index.aspx
Logic Models: http://ctb.ku.edu/en/tablecontents/sub_section_main_1877.aspx
Become Active in National Organizations
American Public Health Association Epidemiology Section: www.apha.org/apha-
communities/member-sections/epidemiology Association of Maternal and Child Health
programs: www.amchp.org
Association of State and Territorial Health Officials: www.astho.org/
CDC Chronic Disease Prevention and Health Promotion:
www.cdc.gov/chronicdisease/index.htm
Council of State and Territorial Epidemiologists: www.cste.org
National Association of Chronic Disease Directors: www.chronicdisease.org/

18
Summary
This chapter provides a broad overview and context for your job. The main points related to the
three public health essential services that epidemiologists provide:
Surveillance: Your role is to coordinate and conduct chronic disease surveillance, including
identifying risk and protective factors at the individual and population level and their
relationship to the system level. You will disseminate results of chronic disease surveillance
regularly and widely in a variety of formats.
Communication: Your role is to communicate scientific and technical information in a way
that decision makers can use it. As the lead chronic disease epidemiologist, you might
serve as the single point of contact for chronic disease epidemiology in your department
and with CSTE, CDC’s National Center for Chronic Disease Prevention and Health
Promotion, and the National Association of Chronic Disease Directors.
Consultation: It is often through your consultation that you connect the science and data to
the policy options and policy makers in your state. Ideally, you will consult on any chronic
disease project early to ensure data-driven action. Specifically, your consultation is to (1)
assure that reports, grants, and cooperative agreement applications receive appropriate
epidemiology input, (2) coordinate across individual, categorical chronic disease programs,
(3) connect state activities with state community health assessment, and (4) infuse
evaluation into chronic disease programs and monitor the evaluation results.

19
Chapter 3: Chronic Disease Integration and Collaboration
Various definitions of chronic disease collaboration and integration exist. One oft-quoted
definition of integration is “the strategic alignment of chronic disease categorical program
resources to increase the effectiveness and efficiency of each program in a partnership, wit hout
compromising the integrity of categorical program objectives.”27
Regardless of the precise definition used, the goals of chronic disease integration include, but are
not limited to:
Stimulating learning and capacity building (including having staff members learn about
other programs in more depth).
Increasing efficiency and effectiveness (e.g., by sharing and maximizing resources).
Expanding the reach of programs and communications, particularly to reach underserved
and high-risk populations.
Encouraging dissemination of scientific knowledge, experiences and best practices.
Instituting changes without
increasing burden on partners.
As seen in the textbox example,
opportunities for integration among
public health programs abound.
Some general examples of integration
efforts include:
Developing integrated state plans.
Implementing integrated
interventions.
Collaborating on policy, systems,
or environmental change efforts.
Collaborating on funding
applications.
Collaborating on funding announcements.
27 Slonim AB, Callaghan C, Daily L, Leonard BA, Wheeler FC, Gollmar CW, Young WF. Recommendations for integration of
chronic disease programs: are your programs linked? Prev Chronic Dis [serial online] 2007 Apr. Available from: http://www.cdc.gov/pcd/issues/2007/apr/06_0163.htm. Accessed February 16, 2015.
An Opportunity for Coordination: Combining Cardiovascular Health & Physical Activity
A Cardiovascular Health Unit is working extensively with the African American community to educate, prevent, and treat hypertension. Yet, the Physical Activity and Nutrition Unit in the same health department has virtually no contacts within this population and has been at a loss to get its message across, despite spending significant resources. Can the two units devise a cost-effective—even cost-saving—strategy to work together to jointly advance the effectiveness of their own programs? Included with permission from NACDD. Comprehensive and Integrated Chronic Disease Prevention: Action Planning Handbook for States and Communities. Available at:
http://c.ymcdn.com/sites/www.chronicdisease.org/resource/resmgr/Coordinated_CD_/Coordinated_CD_P4P_action_pl.pdf

20
Aligning policies and programs.
Developing a common set of chronic disease indicators and corresponding data dictionary,
a common reporting format (e.g., fact sheet template), and a common distribution list for
chronic disease communications.
Integrating the content of data reports across diseases, conditions, and risk factors.
Integrating funding for communication efforts.
Enhancing collaboration with external partners.
Sharing staff across programs (i.e., developing job descriptions that include responsibil ities
for more than one program).
Conducting cross-program competency assessments, trainings, and learning communities
(i.e., groups of people who actively engage in learning from one another);
Using common evaluation methodologies across programs.
Sharing lessons learned across programs.
Recognize Opportunities for Program Integration Chronic disease integration and collaboration can occur across all chronic disease -specific
programs and with other programs, such as Maternal and Child Health, Oral Health, Violence and
Injury Prevention, Mental Health, Substance Abuse, Environmental Health, Occupational Health,
and Communicable Disease.
For instance, recognizing the opportunities for collaboration with Maternal and Child Health
Programs requires an understanding of the roles and responsibilities of epidemiologists working in
this field. Maternal and child health epidemiology often focuses on women from pregnancy through
the postpartum period and on children from birth through adolescence. However, the fi eld of
maternal and child health epidemiology is broad and encompasses multiple sub -disciplines focused
on the myriad infectious and chronic diseases that occur among women of reproductive age (15 –44
years) regardless of their pregnancy status. As such, there is a natural intersection between chronic
disease and maternal and child health epidemiology, illustrated by the life course approach to public
health. Women of reproductive age experience the onset of chronic disease as well as the
underlying causes of inherent, latent chronic disease.28 Working together in areas such as diabetes
(including gestational and Type 2 diabetes), hypertension, and heart disease, chronic disease and
maternal and child health epidemiologists can monitor the development and progression of
disease patterns. Both disciplines can then focus on primary prevention efforts targeting women of
childbearing age populations. To do so, however, both chronic disease and maternal and child
health epidemiologists must recognize commonalities in their respective responsibilities:
28 Institute of Medicine Committee on Living Well with Chronic Disease. Living Well With Chronic Illness: A Call for Public Health
Action. Washington, DC: The National Academies Press; 2012. Available at: http://books.nap.edu/openbook.php?record_id=13272

21
Monitoring health status, risk indicators, and health service usage, especially preventive
services.
Investigating determinants and distribution of adverse conditions, risks factors, and
adequate health care utilization.
Developing surveys and surveillance systems.
Conducting needs assessments.
Performing process and impact evaluations of programs and policies.
Assessing program performance.
Conducting quality assurance activities, including analyses and training.
Studying funding and costs, (e.g., service cost-benefit and efficiency analyses).
Inventorying available service resources.
Providing information and analyses for resource allocation decisions.
These commonalities could lead to endless opportunities for the two programs to learn from one
another to improve health outcomes at the population level. Similar lists could be constructed for
other public health programs. In all cases, enhancing collaboration across specialty areas, while
committing to continuously learning the specifics within each area of interest, furthers the field of
epidemiology as a whole.
Learn from Other States
States have recent collaborative efforts between diabetes, tobacco, obesity, aging and disability,
cancer control, and oral health programs to collect and use data on the oral health of persons with
diabetes and/or tobacco users, oropharyngeal cancer and human papillomavirus, obesity
prevalence among children, and health risk factors among seniors. These programs have also
collaboratively shared staff.
Many states use the Behavioral Risk Factor Surveillance System to collect and analyze data on
the oral health of persons with diabetes and/or tobacco users. For example, in 2012, one state
expanded their surveillance system to assess if persons with diabetes get appropriate dental
care services and if persons who smoke tobacco report that dentists encouraged them to stop
smoking.
States have made their results publicly available by publishing fact sheets on oral health among
persons with diabetes and/or oropharyngeal cancer and human papillomavirus.
Several states have collected body mass index (BMI) data to assess obesity rates among Head
Start children as part of the Basic Screening Survey administered by the oral health program,
and many states have also collected BMI data as part of their Basic Screening Survey of
kindergarten and grade school students.
The oral health program and the aging and disability program in one state have collaborated to
expand their oral health assessment on seniors to ask about health risk factors.
Leveraging partnerships for disseminating and using data to drive action, one state is planning
to develop standardized chronic disease data results in a user-friendly format for county
22
medical officers to present with broad audiences at town hall meetings.
Some states share epidemiology and/or evaluation staff between programs, such as the oral
health and heart disease and stroke prevention programs.
Think about the Multiple Chronic Conditions Framework and Initiative
The U.S. Department of Health and Human Services recognizes the large proportion of persons
with multiple chronic conditions, its toll on quality of life, and on health care costs. 29 Given its role
in funding prevention of chronic disease, health services, and research, this department created an
initiative with four major goals:30
1. Foster health care and public health system changes to improve the health of individuals
with multiple chronic conditions
2. Maximize the use of proven self‐care management and other services by individuals with
multiple chronic conditions
3. Provide better tools and information to health care, public health, and social services
workers who deliver care to individuals with multiple chronic conditions
4. Facilitate research to fill knowledge gaps about, and interventions and systems to benefit,
individuals with multiple chronic conditions
This department acknowledges the complexity in improving health of persons with multiple chroni c
conditions and the challenge that this group might be heterogeneous. The Patient Protection and
Affordable Care Act to reform health care in the United States is encouraging “health homes” for
persons with multiple chronic conditions enrolled in Medicaid. As a result of this initiative, the
Centers for Medicare and Medicaid Services provide data on chronic conditions among
beneficiaries.31 For example, state reports on the prevalence of the 15 most common chronic
conditions are available for the years 2007-2011 with comparison to national estimates. The second
report presents the prevalence, utilization and Medicare spending for Medicare beneficiaries with
multiple chronic conditions and allows for the comparison of a specific state to national estimates.
Figures of national data are in a separate chartbook. Finally, the chronic conditions dashboard allows
users to query state data on prevalence and spending and map it. Preventing Chronic Diseases
provides previously-published articles on this topic under their collections.32
Follow a Systematic Approach to Program Integration
To assure successful integration efforts, epidemiologists can follow basic guiding principles: 33
29HHS Initiative on Multiple Chronic Conditions. U.S. Department of Health and Human Services Website. Available at: http://www.hhs.gov/ash/initiatives/mcc/ Accessed March 9, 2014. 30 U.S. Department of Health and Human Services. Multiple Chronic Conditions—A Strategic Framework: Optimum Health and
Quality of Life for Individuals with Multiple Chronic Conditions. Washington, DC. December 2010. 31Chronic Conditions. Centers for Medicare and Medicaid Services Website. Available at: http://www.cms.gov/Research-Statistics-Data-and-Systems/Statistics-Trends-and-Reports/Chronic-Conditions/index.html Accessed March 9, 2014. 32 PCD Collections. Centers for Disease Control and Prevention Website. Available at: http://www.cdc.gov/pcd/collections/index.htm Updated December 12, 2013. Accessed March 9, 2014. 33 Slonim AB, Callaghan C, Daily L, et al. Recommendations for integration of chronic disease programs: Are your programs linked? Prev Chronic Dis [serial online] 2007. Available at: http://www.cdc.gov/pcd/issues/2007/apr/06_0163.htm

23
Do no harm to categorical program integration.
Clearly identify and state mutual benefits and opportunities.
Be guided by efficiency-oriented processes.
Focus on health outcomes.
Evaluate integration outputs and health outcomes.
Engage stakeholders.
Mobilize leaders.
Authorities also recommend specific state health agency actions to support integration of chronic
disease programs:34
Engage the agency leadership.
Develop crosscutting epidemiology and surveillance programs.
Leverage the use of information technology.
Build state and local partnerships.
Develop integrated state plans.
Engage management and administration.
Implement integrated interventions.
Evaluate integration initiatives.
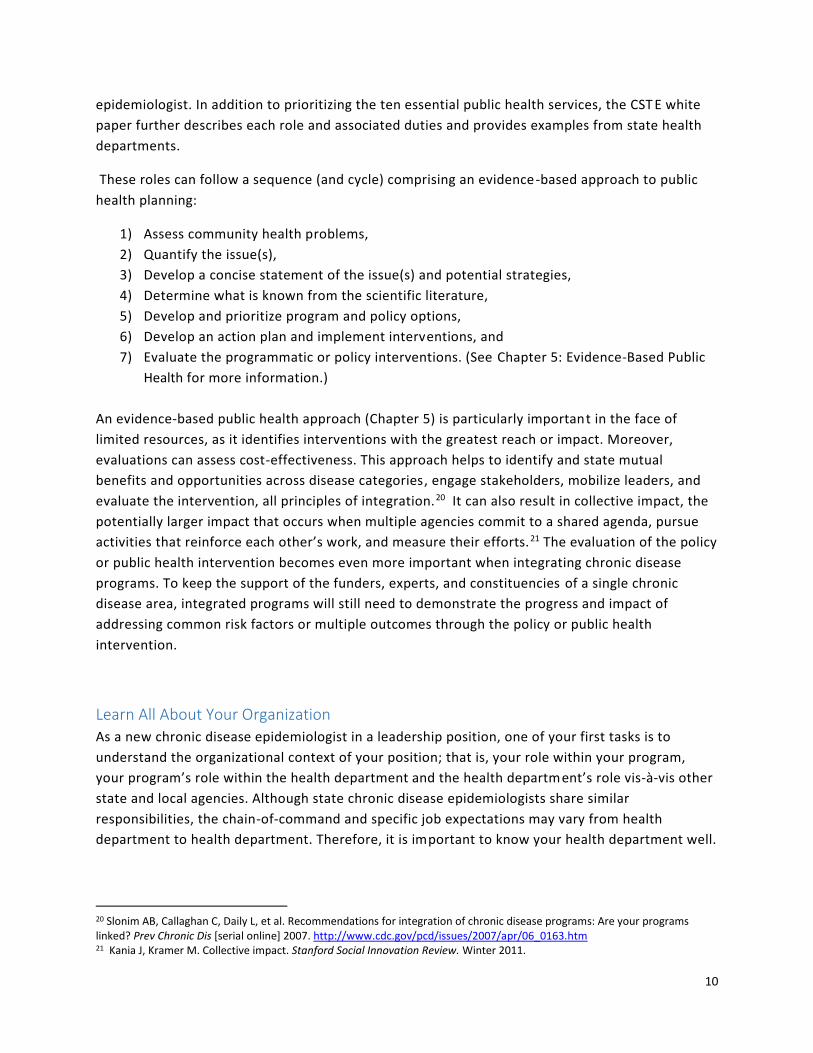
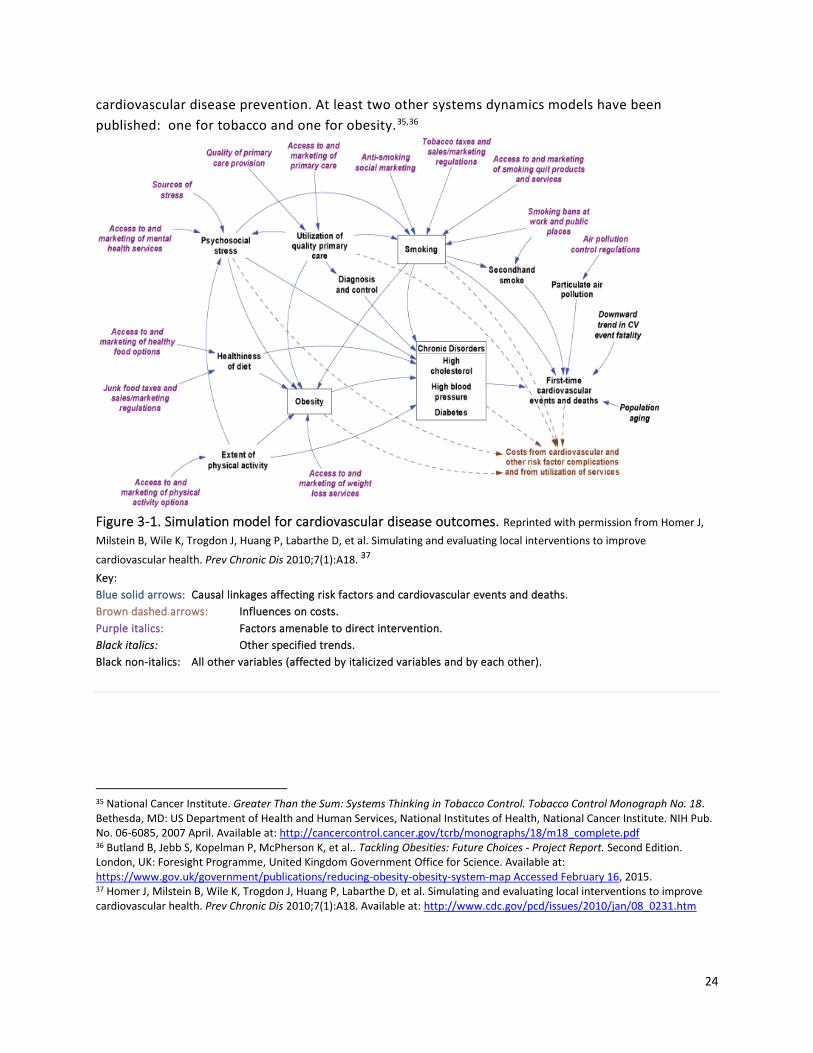
Utilize System Dynamics System dynamics is an approach used to understand relationships and causal mechanisms within
complex systems, such as the social systems in which chronic diseases develop. System dynamics
considers feedback (causal) loops and time delays, and demonstrates the nonlinearity of system
events. A chronic disease system dynamics model or map illustrates, in detailed graphic form, the
complex relationships among risk factors, intermediate outcomes, and disease outcomes. Figure 3 -
1 depicts a system dynamics model for cardiovascular disease, showing the major health
conditions related to cardiovascular disease and their causes. Boxes identify risk f actor prevalences
modeled as dynamic stocks. In Figure 3-1, the three boxes identify the risk factors for first time
cardiovascular events and deaths and their associated costs: obesity, smoking and the chronic
disorders of high cholesterol, high blood pressure, and diabetes. The population flows associated
with these stocks—including people entering the adult population, entering the next age category,
immigrating into the system, dying, etc—are not shown.
In the context of chronic disease collaboration, system dynamics models can highlight potential
areas for collaboration by demonstrating how diverse risk factors, such as smoking and obesity in
Figure 3-1, link to adverse health outcomes, such as cardiovascular disease in Figure 3 -1. Thus,
both smoking prevention and cessation and obesity prevention can be considered part of
34 Slonim AB, Callaghan C, Daily L, et al. Recommendations for integration of chronic disease programs: Are your programs linked? Prev Chronic Dis [serial online] 2007. http://www.cdc.gov/pcd/issues/2007/apr/06_0163.htm
24
cardiovascular disease prevention. At least two other systems dynamics models have been
published: one for tobacco and one for obesity.35,36
Figure 3-1. Simulation model for cardiovascular disease outcomes. Reprinted with permission from Homer J,
Milstein B, Wile K, Trogdon J, Huang P, Labarthe D, et al. Simulating and evaluating local interventions to improve
cardiovascular health. Prev Chronic Dis 2010;7(1):A18. 37 Key:
Blue solid arrows: Causal linkages affecting risk factors and cardiovascular events and deaths.
Brown dashed arrows: Influences on costs.
Purple italics: Factors amenable to direct intervention.
Black italics: Other specified trends.
Black non-italics: All other variables (affected by italicized variables and by each other).
35 National Cancer Institute. Greater Than the Sum: Systems Thinking in Tobacco Control. Tobacco Control Monograph No. 18. Bethesda, MD: US Department of Health and Human Services, National Institutes of Health, National Cancer Institute. NIH Pub. No. 06-6085, 2007 April. Available at: http://cancercontrol.cancer.gov/tcrb/monographs/18/m18_complete.pdf 36 Butland B, Jebb S, Kopelman P, McPherson K, et al.. Tackling Obesities: Future Choices - Project Report. Second Edition. London, UK: Foresight Programme, United Kingdom Government Office for Science. Available at: https://www.gov.uk/government/publications/reducing-obesity-obesity-system-map Accessed February 16, 2015. 37 Homer J, Milstein B, Wile K, Trogdon J, Huang P, Labarthe D, et al. Simulating and evaluating local interventions to improve cardiovascular health. Prev Chronic Dis 2010;7(1):A18. Available at: http://www.cdc.gov/pcd/issues/2010/jan/08_0231.htm
25
Leveraging Funding and Strategies to Prevent and Control Chronic Diseases
To optimize public health’s efficiency and effectiveness, the Centers for Disease Control and
Prevention (CDC) recommends coordinating chronic disease prevention efforts in four key
domains:38
1. Epidemiology, surveillance, and evaluation to inform, prioritize, and monitor diseases and
risk factors and the delivery of interventions.
2. Environmental approaches that reinforce healthful behaviors and expand access to healthy
choices.
3. Health systems interventions that improve the delivery and use of clinical and other
preventive services.
4. Clinical and community linkages to better support chronic disease self -management.
This approach addresses multiple behaviors, environments, and chronic conditions at the same
time, because many of the risk factors for obesity, diabetes, heart disease, and stroke are related
and the proven interventions are similar. So integration is not only an idea that makes sense, this
CDC example demonstrates that funders might require it.
Resources
Background Reading
Slonim AB, Callaghan C, Daily L, Leonard BA, Wheeler FC, Gollmar CW, Young WF.
Recommendations for integration of chronic disease programs: are your programs linked?
Prev Chronic Dis [serial online] 2007 Apr. Available at:
http://www.cdc.gov/pcd/issues/2007/apr/06_0163.htm.
Stillman FA, Schmitt CL, Rosas SR. Opportunity for collaboration: a conceptual model of
success in tobacco control and cancer prevention. Prev Chronic Dis 2012;9:110067. DOI:
http://dx.doi.org/10.5888/pcd9.110067.
Comprehensive and Integrated Chronic Disease Prevention: Action Planning Handbook for
States and Communities, Available at:
http://c.ymcdn.com/sites/www.chronicdisease.org/resource/resmgr/Coordinated_CD_/Co
ordinated_CD_P4P_action_pl.pdf
Recommendations for State Health Agencies: Actions to Support Integration of Chronic
Disease Programs, Available at:
http://c.ymcdn.com/sites/www.chronicdisease.org/resource/resmgr/Coordinated_CD_/Co
ordinated_CD_RecsChecklist.pdf
Program Integration Checklist by the National Association of Chronic Disease Directors
38 The Four Domains of Chronic Disease Prevention: Working Toward Healthy People in Healthy Communities. Centers for Disease Control and Prevention Website. Available at: http://www.cdc.gov/chronicdisease/pdf/four-domains-factsheet-2015.pdf. Accessed April 11, 2015.
26
The National Association of Chronic Disease Directors has developed a checklist of tasks to
help health agency leaders establish and maintain a program integration initiative.
Although not comprehensive, it can be adapted for use with a wide range of integration
efforts. Available at:
http://c.ymcdn.com/sites/www.chronicdisease.org/resource/resmgr/Coordinated_CD_/Co
ordinated_CD_RecsChecklist.pdf
Community of Learning
The National Association of Chronic Disease Directors supports a coordinated chronic
disease learning community to "assist integration, collaboration, and coordination in
addressing chronic disease prevention and control." It is accessible at:
http://www.chronicdisease.org/?CCD
Case Studies
ASTHO has developed ten case studies highlighting how state chronic disease and maternal and
child health programs are working together to deliver chronic disease prevention programs to
maternal and child populations using either preconception health or life course health
perspectives as the theoretical underpinnings.39 The 10 case studies listed below are accessible
at: http://www.astho.org/Collaboration_Between_MCH_and_Chronic_Disease/
Seizing a “Golden Opportunity” to Improve Birth Outcomes in Louisiana
Case study of Louisiana's Birth Outcomes Initiative to engage stakeholders in a process
aimed at improving outcomes for women and children.
Collaborating to Change Arkansas' Health Trajectory
Case study on the Arkansas Department of Health engaging public and private stakeholders
to change the health trajectory for Arkansans.
Colorado's Collaborative Strategies to Improve Health of Women and Children
Case study on Colorado's strategies to address the causes for low birth weight babies.
Partnering to Improve Health Outcomes throughout the Lifespan in Delaware
Case study on Delaware's Healthy Women, Healthy Babies program, aimed to reduce infant
mortality and morbidity across the lifespan.
Missouri Partners to Reduce Chronic Disease Risk Factors for Women and Children
Case study on coordinated approach that the Missouri Department of Health took to
reverse troubling public health trends with a focus on youth, pregnant women, and
systems change.
39 Maternal and Child Health: Collaboration between MCH and Chronic Disease. ASTHO|Association of State and Territorial Health Officials Website. Available at: http://www.astho.org/Collaboration_Between_MCH_and_Chronic_Disease/ Accessed March 8, 2014.

27
Building on Partnerships to Achieve Goals in Massachusetts
Case study on Massachusetts partnerships to reduce the prevalence of gestational diabetes
and to improve health outcomes for women of reproductive age.
Using Data to Drive Diabetes Prevention Efforts in Ohio
Case study on the collaboration of programs and data in Ohio to achieve better results.
Turning Public Health Challenges into Opportunities for Collaboration in Utah
Case study on Utah's collaboration to improve data on gestational diabetes.
Promoting Healthy School-Aged Children in Vermont
Case study on Vermont's Department of Health's partnership with Medicaid, the
Department of Education, the local pediatric community, and local school distric ts to build
capacity among the state's school health nurses and dental health professionals.
Building on Seeds of Change in West Virginia
Case study on West Virginia's network of partners that worked towards promoting provider
awareness about gestational diabetes testing and follow-up care and improving patients'
awareness of gestational diabetes as a major risk factor for Type 2 diabetes.
Summary
This chapter provides concrete, common activities across programs, a system dynamic model to
broaden your view, and an integration checklist. Ask your colleagues to provide examples of
collaboration and integration. Ask if any of the following would be helpful:
Surveillance: Identify common target groups, settings, and risk or protective factors across
populations with different chronic diseases. Identify subpopulations with multiple chronic
conditions.
Communication: Use the list of common activities in the “Recognize Opportun ities for
Program Integration section, the examples from other states and the program integration
checklist by the National Association of Chronic Disease Directors to start the conversation
with other programs about existing integrated activities and opportunities.
Consultation: Ask other programs if any of the common activities is a priority. Identify
mutually beneficial ways to collaborate.
The next two chapters—Chapter 4: System Approaches and the Social Ecological Model and
Chapter 5: Evidence-based Public Health—review concepts that will assist you in thinking about
integration and in taking steps to promote effective, collective public health approaches.

28
Chapter 4: System Approaches and the Social Ecological Model
Upstream Possibilities—A Public Health Parable
A man and woman were fishing downstream
and suddenly a person came down the river struggling for life.
The fisher folk wade into the quickly moving water and pull the person out, saving her life. Then another person comes along and again must be rescued. This
happens all afternoon and the fisher folk get very tired from constantly pulling people from the river.
Eventually they think, “We need to go upstream
and find out why so many people are falling in the water.”
When they go upstream, they find that people are drawn to the edge to look at the river, but there is no
safe way to do this and many of the people keep falling in. The fisher folk go to the community leaders and report the number of people who have fallen into the river. They also report that this is because of the lack of a protective barrier on the cliff. Community
leaders build a wall behind which people may safely view the water. Some still fall, but there are many
fewer people to rescue. —Author unknown
In addition to measuring chronic disease burden, chronic disease epidemiologists have the
opportunity to look upstream and work with program partners to implement prevention and
control strategies with potential to impact the greatest number of residents. Therefore, this
chapter reminds you as the lead chronic disease epidemiologist that different levels of society can
impact individual behavior and that several frameworks describe these levels or interventions at
these levels. This chapter will foster your thinking about how social context and community factors
can drive behaviors affecting chronic diseases. Part of your role as the lead chronic disease
epidemiologist is to measure these contextual factors to better understand the relationships
among the environment, individual behaviors, and population health outcomes. Additionally, this
chapter describes the potential role of these relationships in informing the development of policy,
systems, and environmental changes targeted at the different societal levels to help pr omote
improved population health. While individuals are responsible for initiating and maintaining the
behaviors necessary to reduce risk and improve health, their behavior is influenced to a large
29
extent by the context in which they live (i.e., social determinants of health). The social forces are
life threatening. Researchers from Columbia University estimated deaths attributable to social
factors in the United States in 2000: 245,000 deaths attributed to low education; 176,000 to racial
segregation; 162,000 to low social support; 133,000 to individual-level poverty, 119,000 to income
inequity, and 39,000 deaths to area-level poverty.40 As stated in a 2000 Institute of Medicine
report on health promotion, "It is unreasonable to expect that people will change their behavior
easily when so many forces in the social, cultural, and physical environment conspire against such
change."41 By identifying determinants of health, you as the lead chronic disease epidemiologist
can guide interventions that help communities overcome these barriers and allow for the healthy
choice to become the easy and life-extending choice.
For the senior epidemiologist or professional who supervises or mentors the lead epidemiologist,
you can use this chapter to identify and share previous analyses that informed environmental,
system, or policy changes and their success or failure in preventing chronic diseases or reducing
the impact of diseases on activities of daily living. If your department has its own model for
systems thinking and/or for social determinants of health, provide it to the lead chronic disease
epidemiologist. For the entry-level epidemiologist assess whether or not the surveillance system
that you use or know best includes measures of social or environmental context.
Understand the Levels of Public Health Intervention and Their Influence Public health interventions to prevent and control chronic illness can be implemented at any (or
all) societal level(s), from the individual to the institutional to the entire communi ty or state. More
recently state public health departments have shifted from providing or funding individual direct
services (intervening directly at the individual level) to improving a system of services (intervening
at the organizational and community level).
Social Ecological Model
A useful framework describing a systems approach at various societal levels is the Social Ecological
Model (Figure 4-1).42 This model recognizes and articulates the relationship between the individual
and their environment. The Social Ecological Model can have four or five levels. At the center or
base is the individual level of internal determinants of behavior, such as knowledge, attitudes,
beliefs, and skills. The interpersonal level comprises the external influences of family and friends,
the individual’s physician as well as key opinion leaders. Social norms, social identify and role
definition form and operate at this level and can influence lifestyle and health care choices. The
40 Galea S, Tracy M, Hoggatt KJ, DiMaggio C, and Karpati A. Estimated deaths attributable to social factors in the United States.
Am J Public Health. 2011; 101(8): 1456-1465. 41 Institute of Medicine Committee on Capitalizing on Social Science and Behavioral Research to Improve the Public's Health.
Smedley BD, Syme SL, eds. Promoting Health: Intervention Strategies from Social and Behavioral Research. Washington DC: National Academy Press; 2000:2. 42 Social Ecological Model. Center for Disease Control and Prevention Website. Available at: http://www.cdc.gov/cancer/crccp/sem.htm Updated January 25, 2013. Accessed April 11, 2015.

30
institutional or organizational level considers the rules and policies that guide and support
behavior, including healthy behavior, in the assemblies that aggregate interpersonal associations,
such as the workplace, schools and social organizations. The fourth level, the community, is the
collective network of individuals, businesses, institutions and organizations. These larger social
constructs, which include the media and advocacy groups, can be defined by geography,
membership, heritage or affiliation. The last level, the policy level, describes the authoritative
decisions made by a local, state, or federal governing body that can influence all the other levels.
For example, federal, state, local or tribal government officials can support chronic disease
prevention and control through laws, ordinances, regulations or proclamations.
Figure 4-1. Social Ecological Model
As adapted by: Colorectal Cancer Control Program (CRCCP). Centers for Disease Control and Prevention Website. Available at: http://www.cdc.gov/cancer/crccp/sem.htm Updated January 25, 2013. Accessed April 11, 2015.

31
The Health Impact Pyramid
Dr. Thomas Frieden's five-tier, Health Impact Pyramid, Figure 4-2, can be described as an
adaptation of the Social Ecological Model. In place of the five levels of possible public health
intervention, the pyramid depicts five types of interventions and their relative population reach.43
The five tiers of the pyramid are, from bottom to top, socioeconomic factors (e.g., decreasing the
negative impacts of poverty), changing the context to make individuals’ default decisions healthy
(e.g., eliminating trans fat), long-lasting protective interventions (e.g., colonoscopy, treatment of
tobacco addiction), clinical interventions (treatment of hypertension and hyperlipidemia), and
counseling and education (e.g., dietary counseling). Like the Social Ecological Model, the Health
Impact Pyramid suggests that interventions with greater population reach—and which require
least individual effort—will have the greatest overall public health impact. Moreover, these
population-level interventions are potentially more sustainable as, unlike individual -level focused
activities, they typically do not require considerable ongoing financial support and are not
impacted by limits in scalability.
Figure 4-2. The Health Impact Pyramid
Figure used with permission from AJPH. Frieden TR. A Framework for Public Health Action: The Health Impact Pyramid.
Amer J Pub Health. 2010; 100(4): 590–595.
43 Frieden TR. A framework for public health action: the Health Impact Pyramid. Am J Pub Health. 2010; 100(4): 590–595.
Increasing Individual
Effort Needed
Increasing Population
Impact
Increasing Individual
Effort Needed
Increasing Population
Impact Increasing Individual
Effort Needed
Increasing Population
Impact
32
The Maternal and Child Health Pyramid
The “MCH pyramid” is a conceptual framework for four tiers of services funded by the Title V
Maternal and Child Health Block Grant
(http://www.amchp.org/AboutTitleV/Documents/MCH_Pyramid_Purple.pdf ). Older than the
Health Impact Pyramid, this framework used a pyramid to show the same impact, that the lowest
tier had the largest reach in terms of population impact and the top tier the smallest. Its fo ur tiers
from top to bottom are:
Direct health care services (for gap filling)
Enabling services (transportation, translation, outreach, respite care, health education,
family support services, case management coordination with Medicaid)
Population-based services (newborn screening, lead screening, immunizations, oral health,
injury prevention, nutrition, outreach, public education)
Infrastructure-building services (needs assessment, evaluation, planning, policy
development, quality assurance, standards development, monitoring, applied research,
systems of care, information systems, training)
Changing the Context in Communities
Additional emphasis on implementing population-level, upstream efforts—and especially on
changing the context to make individuals’ default decisions healthy—may be the most promising
strategy to maximize the impact of limited resources. One example is the highly successful
campaign to reduce the number of public spaces where smoking is permitted; this effort has
changed the environment for many smokers and also helped to shift social norms.44,45,46 However,
such interventions can be controversial, especially when there are vested interests opposed to
changing existing societal norms.
As with public smoking, changing the context can mean changing policies, systems, the
environment or some combination thereof. Policy changes occur at the governmental or
organizational level and include laws, ordinances, resolutions, mandates, regulations, or rules
supporting healthy lifestyle choices; for example, a corporate policy to provide paid time off during
work hours for staff to receive health screenings. Systems changes impact the modus operandi in
institutional or community settings, such as schools, hospitals, transportation systems and
recreational systems; for example, introducing electronic health records within a health care
44 Farkas AJ, Gilpin EA, White MM, Pierce JP. Association Between Household and Workplace Smoking Restrictions and Adolescent Smoking, JAMA, 2000;284(6):717-722. Fichtenber CM, Glantz SA. Effect of smoke-free workplaces on smoking behaviour: systematic review. BMJ. 2002;325(7357):188. 45 Hopkins DP, Razi S, Leeks KD, Priya Kalra G, Chattopadhyay SK, Soler RE; Task Force on Community Preventive Services.
Smokefree policies to reduce tobacco use. A systematic review. Am J Prev Med. 2010;38(2 Suppl):S275-89. 46 Moskowitz JM, Lin Z, and Hudes ES, The Impact of Workplace Smoking Ordinances in California on Smoking Cessation. Am J Public Health, 2000;90(5):757-761
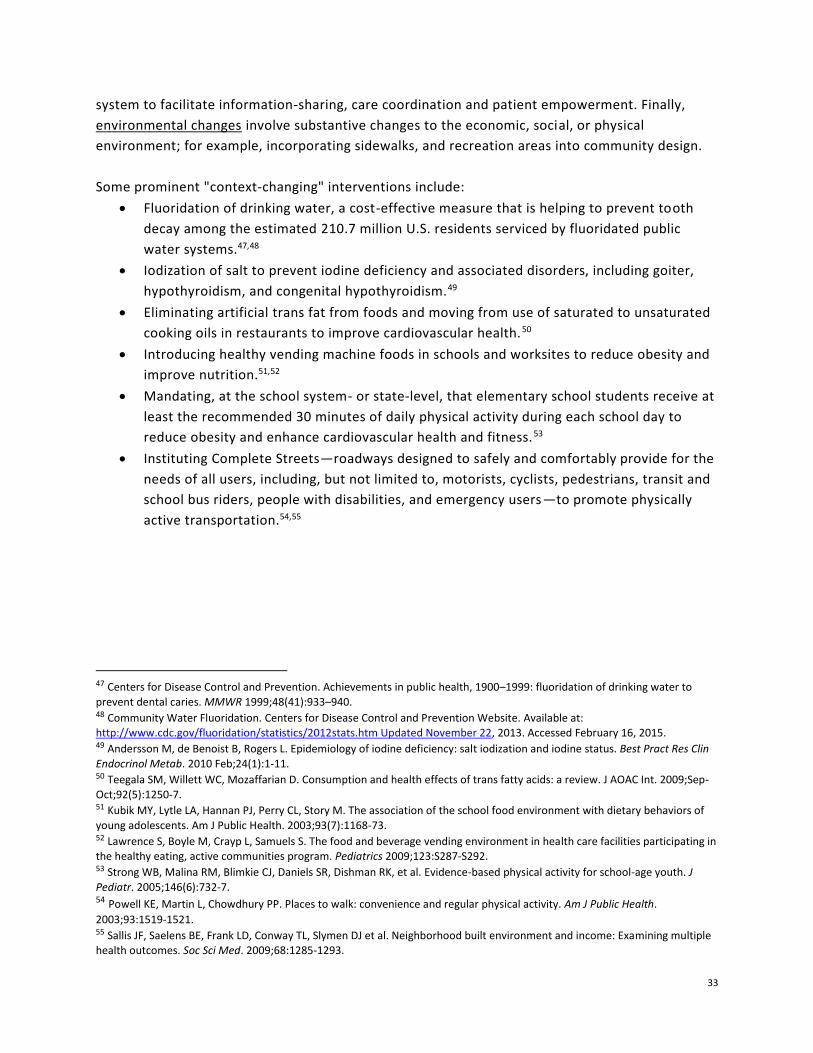
33
system to facilitate information-sharing, care coordination and patient empowerment. Finally,
environmental changes involve substantive changes to the economic, social, or physical
environment; for example, incorporating sidewalks, and recreation areas into community design.
Some prominent "context-changing" interventions include:
Fluoridation of drinking water, a cost-effective measure that is helping to prevent tooth
decay among the estimated 210.7 million U.S. residents serviced by fluoridated public
water systems.47,48
Iodization of salt to prevent iodine deficiency and associated disorders, including goiter,
hypothyroidism, and congenital hypothyroidism.49
Eliminating artificial trans fat from foods and moving from use of saturated to unsaturated
cooking oils in restaurants to improve cardiovascular health.50
Introducing healthy vending machine foods in schools and worksites to reduce obesity and
improve nutrition.51,52
Mandating, at the school system- or state-level, that elementary school students receive at
least the recommended 30 minutes of daily physical activity during each school day to
reduce obesity and enhance cardiovascular health and fitness.53
Instituting Complete Streets—roadways designed to safely and comfortably provide for the
needs of all users, including, but not limited to, motorists, cyclists, pedestrians, transit and
school bus riders, people with disabilities, and emergency users—to promote physically
active transportation.54,55
47 Centers for Disease Control and Prevention. Achievements in public health, 1900–1999: fluoridation of drinking water to
prevent dental caries. MMWR 1999;48(41):933–940. 48 Community Water Fluoridation. Centers for Disease Control and Prevention Website. Available at: http://www.cdc.gov/fluoridation/statistics/2012stats.htm Updated November 22, 2013. Accessed February 16, 2015. 49 Andersson M, de Benoist B, Rogers L. Epidemiology of iodine deficiency: salt iodization and iodine status. Best Pract Res Clin
Endocrinol Metab. 2010 Feb;24(1):1-11. 50 Teegala SM, Willett WC, Mozaffarian D. Consumption and health effects of trans fatty acids: a review. J AOAC Int. 2009;Sep-
Oct;92(5):1250-7. 51 Kubik MY, Lytle LA, Hannan PJ, Perry CL, Story M. The association of the school food environment with dietary behaviors of
young adolescents. Am J Public Health. 2003;93(7):1168-73. 52 Lawrence S, Boyle M, Crayp L, Samuels S. The food and beverage vending environment in health care facilities participating in the healthy eating, active communities program. Pediatrics 2009;123:S287-S292. 53 Strong WB, Malina RM, Blimkie CJ, Daniels SR, Dishman RK, et al. Evidence-based physical activity for school-age youth. J
Pediatr. 2005;146(6):732-7. 54 Powell KE, Martin L, Chowdhury PP. Places to walk: convenience and regular physical activity. Am J Public Health.
2003;93:1519-1521. 55 Sallis JF, Saelens BE, Frank LD, Conway TL, Slymen DJ et al. Neighborhood built environment and income: Examining multiple health outcomes. Soc Sci Med. 2009;68:1285-1293.
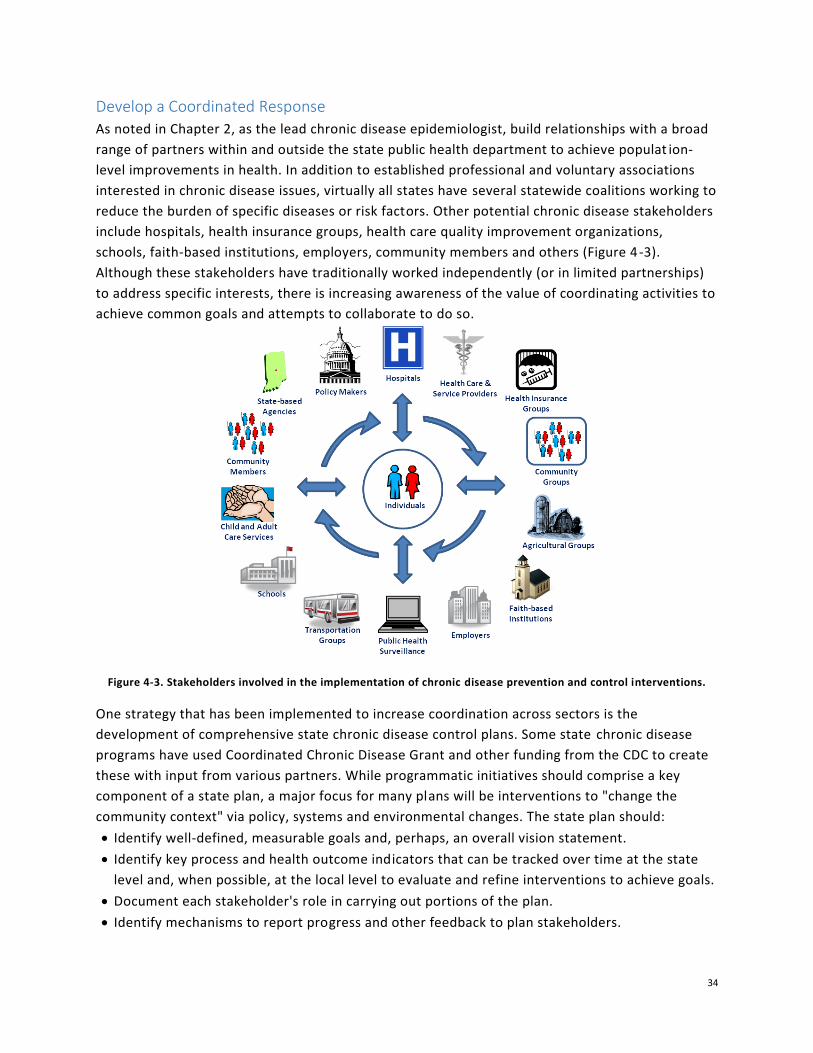
34
Develop a Coordinated Response
As noted in Chapter 2, as the lead chronic disease epidemiologist, build relationships with a broad
range of partners within and outside the state public health department to achieve populat ion-
level improvements in health. In addition to established professional and voluntary associations
interested in chronic disease issues, virtually all states have several statewide coalitions working to
reduce the burden of specific diseases or risk factors. Other potential chronic disease stakeholders
include hospitals, health insurance groups, health care quality improvement organizations,
schools, faith-based institutions, employers, community members and others (Figure 4-3).
Although these stakeholders have traditionally worked independently (or in limited partnerships)
to address specific interests, there is increasing awareness of the value of coordinating activities to
achieve common goals and attempts to collaborate to do so.
Figure 4-3. Stakeholders involved in the implementation of chronic disease prevention and control interventions.
One strategy that has been implemented to increase coordination across sectors is the
development of comprehensive state chronic disease control plans. Some state chronic disease
programs have used Coordinated Chronic Disease Grant and other funding from the CDC to create
these with input from various partners. While programmatic initiatives should comprise a key
component of a state plan, a major focus for many plans will be interventions to "change the
community context" via policy, systems and environmental changes. The state plan should:
Identify well-defined, measurable goals and, perhaps, an overall vision statement.
Identify key process and health outcome indicators that can be tracked over time at the state
level and, when possible, at the local level to evaluate and refine interventions to achieve goals.
Document each stakeholder's role in carrying out portions of the plan.
Identify mechanisms to report progress and other feedback to plan stakeholders.

35
If the plan includes all of the above, it mirrors the five principles of collective impact: a shared
agenda, mutually reinforcing activities, measurable performance objectives, regular
communication, and a backbone organization.
Ultimately, these state plans should be adaptable to individual communities’ unique contexts and
concerns. Chronic disease epidemiologists should encourage communities to conduct or update
their own community assessments, using primary and secondary data to assess current social
conditions. Such assessments are vital to illuminate the “conditions on the ground,” including
readiness for change, so that appropriate interventions that support the overall state plan, but are
specific to the local community, can be selected, implemented, and evaluated. The CDC Healthy
Communities Program's Community Health Assessment and Group Evaluation (CHANGE) tool is
designed to facilitate this assessment process: "It can be used annually to assess current policy,
systems, and environmental change strategies and offer new priorities for future efforts. "56 The
tool is available at www.cdc.gov/healthycommunitiesprogram/tools/change.htm. Overall, the
promise of a coordinated, statewide effort is a synergistic effect, with the total impact being
greater than the sum of each stakeholder's individual efforts.
Other assessments can inform these plans. Every five years the federal Maternal and Child Health
Bureau as part of the Title V block grant require states to conduct a state needs assessment that
includes state and local input and to use this assessment to select priorities for the next five years.
Many states as either part of the public health accreditation process or as part of their public
health improvement process require a needs assessment that can include a public health capacity
assessment and priority setting.
However, no matter what community assessment tool is used or what interventions are prioritized
and implemented, the following are needed to support positive changes at both the state and local
levels:
Effective public-private partnerships.
Targeted policy and environmental changes embedded in broader community initiatives.
Continued engagement and interaction with the broader community.
A meaningful, long-term commitment from partners work towards desired outcomes.
State and local groups need to place greater emphasis on population-level, upstream efforts to
successfully decrease the growing burden of chronic disease and associated risk factors. Many of
these efforts should attempt to change the community context through policy, systems, and
environmental changes. State health departments’ chronic disease programs and their partners
should consider working toward consolidating each of the targeted chronic disease state plans into
one overarching plan, highlighting the important role each disease-specific group can play to
achieve desired health outcomes. With this collaborative framework in place, stakeholders
56 CDC’s Healthy Community Program. Community Health Assessment aNd Group Evaluation (CHANGE) Action Guide: Building a
Foundation of Knowledge to Prioritize Community Needs. Centers for Disease Control Website. Available at: http://www.cdc.gov/healthycommunitiesprogram/tools/change.htm Updated October 25, 2013. Accessed March 1, 2014.
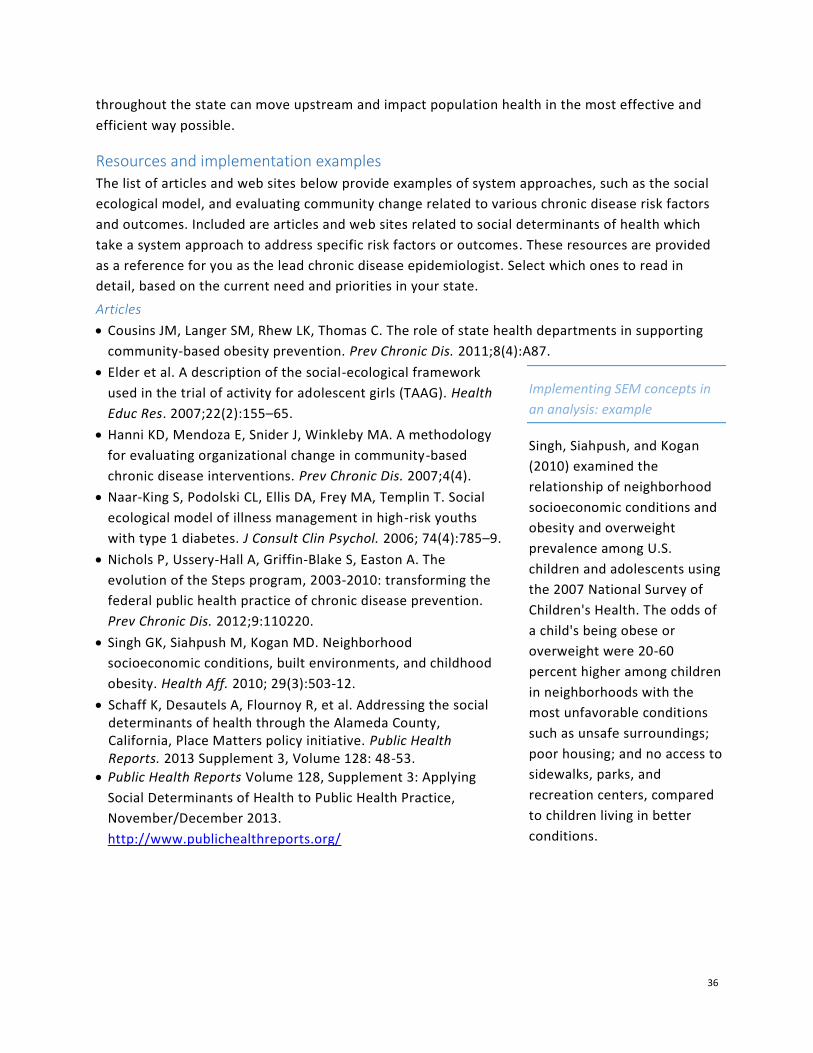
36
throughout the state can move upstream and impact population health in the most effective and
efficient way possible.
Resources and implementation examples
The list of articles and web sites below provide examples of system approaches, such as the social
ecological model, and evaluating community change related to various chronic disease risk factors
and outcomes. Included are articles and web sites related to social determinants of health which
take a system approach to address specific risk factors or outcomes. These resources are provided
as a reference for you as the lead chronic disease epidemiologist. Select which ones to read in
detail, based on the current need and priorities in your state.
Articles
Cousins JM, Langer SM, Rhew LK, Thomas C. The role of state health departments in supporting
community-based obesity prevention. Prev Chronic Dis. 2011;8(4):A87.
Elder et al. A description of the social-ecological framework
used in the trial of activity for adolescent girls (TAAG). Health
Educ Res. 2007;22(2):155–65.
Hanni KD, Mendoza E, Snider J, Winkleby MA. A methodology
for evaluating organizational change in community-based
chronic disease interventions. Prev Chronic Dis. 2007;4(4).
Naar-King S, Podolski CL, Ellis DA, Frey MA, Templin T. Social
ecological model of illness management in high-risk youths
with type 1 diabetes. J Consult Clin Psychol. 2006; 74(4):785–9.
Nichols P, Ussery-Hall A, Griffin-Blake S, Easton A. The
evolution of the Steps program, 2003-2010: transforming the
federal public health practice of chronic disease prevention.
Prev Chronic Dis. 2012;9:110220.
Singh GK, Siahpush M, Kogan MD. Neighborhood
socioeconomic conditions, built environments, and childhood
obesity. Health Aff. 2010; 29(3):503-12.
Schaff K, Desautels A, Flournoy R, et al. Addressing the social determinants of health through the Alameda County, California, Place Matters policy initiative. Public Health Reports. 2013 Supplement 3, Volume 128: 48-53.
Public Health Reports Volume 128, Supplement 3: Applying
Social Determinants of Health to Public Health Practice,
November/December 2013.
http://www.publichealthreports.org/
Implementing SEM concepts in
an analysis: example
Singh, Siahpush, and Kogan
(2010) examined the
relationship of neighborhood
socioeconomic conditions and
obesity and overweight
prevalence among U.S.
children and adolescents using
the 2007 National Survey of
Children's Health. The odds of
a child's being obese or
overweight were 20-60
percent higher among children
in neighborhoods with the
most unfavorable conditions
such as unsafe surroundings;
poor housing; and no access to
sidewalks, parks, and
recreation centers, compared
to children living in better
conditions.

37
Web sites
CDC Colorectal Cancer Control Program— http://www.cdc.gov/cancer/crccp/sem.htm
CDC Injury Prevention and Control Program—
http://www.cdc.gov/violenceprevention/overview/social-ecologicalmodel.html
CDC National Breast and Cervical Cancer Early Detection Program—
http://www.cdc.gov/cancer/nbccedp/sem.htm
CDC Social Determinants of Health— http://www.cdc.gov/socialdeterminants/
Summary
The information in this chapter can inform your competency in the domain of community
dimensions of practice57 in a way that also increases the potential impact of the interventions. It
can enhance your competency in systems thinking,58 which in turn might give you opportunities to
demonstrate leadership as you think across the community levels and partnerships. The main
points related to the three public health essential services that epidemiologists provide are:
Surveillance: Your role is to coordinate and conduct chronic disease surveillance, including
helping to establish new standard indicators related to risk and protective factors at the
individual and system level. You can influence what contextual factors and social
determinants of health are measured and analyzed. Only then can you bring this vital
information to the policy discussion and to program planning. You can assess the impact of
the new policies or interventions.
Communication: Your role is to communicate scientific and technical information in a way
that decision makers can use it. Select one of the frameworks as a way to communicate
varying impact of possible interventions on population health. Building a collaborative,
integrated state chronic disease plan demands good listening skills and the ability to
translate information using language and concepts from multiple disciplines and clinical
fields.
57 Short Summaries—Applied Epidemiology Competencies. CSTE Workforce: Competencies Website. Available at: http://www.cste.org/group/CSTECDCAEC Accessed February 23, 2014. 58 Short Summaries—Applied Epidemiology Competencies. CSTE Workforce: Competencies Website. Available at: http://www.cste.org/group/CSTECDCAEC Accessed February 23, 2014.
Implementing SEM concepts in public health action: example
The work on Schaff et al. (2013) applied the social ecological model to engage,
foster, and train partners across community organizations and across
government institutions, including staff in the local health department.
Collaboratively, these partners addressed public health issues such as lack of
running water through specific policy changes, such as a moratorium on water
shutoff to inhabited but foreclosed rental properties. Specific to chronic
diseases, they worked with the district attorney’s office to create a case
management component of the truancy court where the judge can refer children
and their families with chronic disease issues (that contributed to poor school
attendance) to the county’s chronic disease program for case management.
38
Consultation: Through your consultation, you connect the science and data to the policy
options and policy makers in your state. You have the opportunity to work with family
leaders, advocates, stakeholders, organizations and communities representing different
social ecological levels and understandings of public health need and impact. You can
connect state activities with state health assessments and advocate for evaluating the
interventions that are not evidence based or monitor the fidelity to the evidence -based
program. Read the next chapter for more about evidence-based public health and your role
in it.

39
Chapter 5: Evidence-Based Public Health
The term evidence-based public health entered the professional lingo in the late 1990s. In brief, an
evidence-based public health approach combines the best available research, practitioner expertise,
and community preferences to inform all the stages of program planning, implementation, and
evaluation to improve population health. As a lead chronic disease epidemiologist, using an
evidence-based approach provides you a collaborative yet systematic process for identifying
opportunities for integration that leads to data-driven, effective strategies for implementation. This
approach builds the collaborative team, the common understanding of effective strategies, a
common agenda, mutual reinforcing activities, and shared performance measures (or a full
evaluation plan). In other words, you can use this approach for collective impact, if you add
continuous communication, and “backbone support.”59 For the senior epidemiologist or
professional who supervises or mentors the lead epidemiologist, begin thinking about what issue or
problems in your state could benefit from this approach. Or identify which existing chronic disease
prevention activity needs evaluation. For the entry-level epidemiologist, ask to help with a
literature review or read the literature supporting strategies that CDC recommends for chronic
disease prevention and control.
Public health departments increasingly need to justify public health activities to funders. Indeed,
both the American Recovery and Reinvestment Act of 200960 and the Patient Protection and
Affordable Care Act of 201061 emphasized evidence-based prevention strategies. As more federal
grants require evidence-based programs, evidence-based public health is becoming a default
expectation at all levels of government, because while an evidence-based public health approach
makes public health practice more rigorous, it also makes public health more effective. Though
evidence can be limited on specific interventions for chronic disease prevention and control,
reviewing what, if any evidence, is available provides information for making the best -informed
decision as possible, including deciding to find funding to evaluate a promising intervention that
does not have a strong evidence base.
An evidence-driven approach to public health practice depends upon (1) availability of scientific
evidence to support specific interventions or policies, (2) translation of the science -base for
community-focused public health practice, (3) a well-defined process to apply the evidence to
decision-making, and (4) mechanisms to share the science base for chosen interventions at the
state and local levels.
59 Kania J, Kramer M. Collective impact. Stanford Social Innovation Review. Winter 2011. 60American Recovery and Reinvestment Act of 2009, Pub L No 111-5, 123 Stat 233. 2009.
61 Patient Protection and Affordable Care Act of 2010, Pub L No 111-148, 124 Stat 199. 2010.

40
Although different approaches to evidence-based practice exist, there are several common components:62
Use of the best available scientific evidence
to inform decision-making
Systematic use of data and information
systems
Use of program-planning constructs
Community engagement in assessment and
decision-making
Evaluation at every stage of the process
Dissemination of findings to stakeholders
and program implementers
The underlying skills needed to execute these
components are not new. A popular construct for
applying these skills is Ross Brownson's seven-step
framework (Figure 5-1). Though sometimes depicted
otherwise, this process is nonlinear and may require
multiple iterations before the team develops a
refined strategy for public health practice.
Whether ensuring that program activity is properly informed or delivering technical assistance to
stakeholders, you as the lead chronic disease epidemiologist might have the challenge of insuring
that public health activity is grounded in scientific evidence. Before embarking on your own
evidence review, look for existing reviews. Organizations, like the Institute of Medicine 63 and the
CDC,64,65 have recommended public health interventions for various chronic diseases and risk
factors, based upon expert reviews of the evidence at the time that they were created. If the review
is not recent, then you can consider repeating the review with only the more recently published
literature. Training a team in evidence-based public health combined with the systems thinking
frameworks from the previous chapter is one way for developing capacity to address the challenge
of providing effective public health practice in chronic disease prevention. Mutual understanding
62 Brownson RC, Fielding JE, Maylahn CM. Evidence-based public health: a fundamental concept for public health practice.
Annu Rev Public Health. 2009;30:175-201. 63 Glickman D, Parker L, Sim LJ, Cook HDV, Miller EA, editors. Accelerating progess in obesity prevention: solving the weight of the nation. Washington: National Academies Press (US); 2012. Available from: http://www.iom.edu/Reports/2012/Accelerating-Progress-in-Obesity-Prevention.aspx. Accessed April 11, 2015. 64 Keener D, Goodman K, Lowry A, Zaro S, and Kettel Khan L. Recommended community strategies and measurements to
prevent obesity in the United States: Implementation and measurement guide. Atlanta, GA: U.S. Department of Health and Human Services, Centers for Disease Control and Prevention. 2009. Available at: http://www.cdc.gov/obesity/downloads/community_strategies_guide.pdf. Accessed April 11, 2015. 65 Overweight and Obesity: Recommendations. Centers for Disease Control and Prevention Website. Available at: http://www.cdc.gov/obesity/resources/recommendations.html. Updated February 7, 2014. Accessed April 11, 2015.
Figure 5-1. Training approach for evidence-based public health. Parts of this material were adapted with permission, from the Annual Review of Public Health

41
among epidemiologists, program colleagues and external partners can result as each of you gains
greater insight on how your respective expertise contributes to improving population health.
Resources
These resources are provided for your future reference, if needed, based on your assessment of
your knowledge and skills and on the priorities for your position in the short term and long term.
Background Reading
Brownson RC, Baker EA, Leet TL, et al. Evidence-Based Public Health. 2nd Ed. New York:
Oxford University Press; 2011.
Fielding JE, Teutsch SM. So what? A framework for assessing the potential impact of
intervention research. Prev Chronic Dis. 2013;10:120160. Available at:
http://dx.doi.org/10.5888/pcd10.120160.
Jacobs JA, Jones E, Gabella BA, Spring B, Brownson RC. Tools for Implementing an Evidence-
Based Approach in Public Health Practice. Prev Chronic Dis. 2012;9:110324.
Jenicek M. Epidemiology, evidence-based medicine, and evidence-based public health. J
Epidemiol Commun Health. 1997;7:187–197.
Kohatsu ND, Robinson JG, Torner JC. Evidence-based public health: an evolving concept. Am
J Prev Med. 2004;27(5):417-21.
Brownson RC, Fielding JE, Maylahn CM. Evidence-based public health: a fundamental
concept for public health practice. Annu Rev Public Health. 2009;30:175-201.
Green LW. Public health asks of systems science: to advance evidence-based practice, can
you help us get more practice-based evidence? Am J Public Health. 2006;96(3):406-409.
Briss PA, Brownson RC, Fielding JE, Zaza S. Developing and using the Guide to Community Preventive Services: lessons learned about evidence-based public health. Annu Rev Public Health. 2004;25:281-302.
The last three articles are available from the ASTHO website at:
www.astho.org/Programs/Evidence-Based-Public-Health/Articles-on-Evidence-Based-Public-
Health/?terms=evidence-based+public+health
Online Tutorials and Tools
The Community Toolbox: http://ctb.ku.edu/en/default.aspx.
University of Washington Health Sciences Library:
http://libguides.hsl.washington.edu/ebptools
University of Massachusetts Medical School Library: http://library.umassmed.edu/ebpph/
Public Health Partners: http://phpartners.org/tutorial/04-ebph/index.html
Supercourse: http://www.pitt.edu/~super1/lecture/lec18061/index.htm
University of Michigan School of Public Health: http://www.sph.umich.edu/mi-info/10-
ebph/index.html
Organizations Advancing Evidence-Based Public Health

42
The American Heart Association:
http://my.americanheart.org/professional/StatementsGuidelines/ByTopic/TopicsD-
H/Hypertension_UCM_321621_Article.jsp
The Campbell Collaboration: http://www.campbellcollaboration.org
The Cochrane Collaboration: http://www.cochrane.org
The Guide to Community Preventive Services: http://thecommunityguide.org/index.html
National Association of Local Boards of Health: http://nalboh.org/
National Network of Public Health Institutes: http://nnphi.org/program-areas/evidence-based-
public-health
The Prevention Research Center: http://prcstl.wustl.edu/EBPH/Pages/default.aspx
Since 1997, the Prevention Research Center in St. Louis has offered an evidence-based public health training course to promote the practical application of these concepts. This course is available to chronic disease health officials directly and through a competitive, state-based train-the-trainer program. State health officials who have received this training then train their respective local health departments, health coalitions, and community stakeholders.
Public Health Foundation: http://www.phf.org/programs/communityguide/Pages/default.aspx
The Robert Wood Johnson Foundation: http://www.rwjf.org Search the Research & Publications
section for “evidence base” to see journal articles and program results reports.
Summary
This chapter covered an evidence-based public health approach as a collaborative, systematic
process for connecting data, science, stakeholders, partners, policy makers, and effective strategies
for public health action. The steps of the Brownson model are common in isolation. However, you
as the lead chronic disease epidemiologist have the opportunity to connect these steps in a way
that furthers chronic disease integration.
Surveillance: Your analysis and interpretation of the chronic disease surveillance data, especially
risk and protective factors related to health outcomes, is necessary to quantify the issue, a key
step in evidence-based public health and in focusing the review of the scientific literature (a
subsequent step in evidence-based public health).
Communication: Your ability to summarize, interpret, and communicate information from each
step in an evidence based public health approach makes the next step more focused and relevant
to the overall goal. You ensure that relevant, understandable information inform decisions about
what public health action is warranted and appropriate.
Consultation: Your consultation on each step of evidence-based public health truly connects the
science and data to the policy options and policy makers in your state. Your competency in
searching, reading, synthesizing and interpreting scientific research, regardless of the topic,
ensures that effective strategies are options for public health programming and implementation.
Using your talents to guide your program and department in planning and implementing
43
evidence-based strategies for chronic disease prevention and thereby meeting a CSTE
recommendation is immensely satisfying.66
66 CSTE Chronic Disease Epidemiology Capacity Assessment Workgroup. 2009 National Assessment of Epidemiology Capacity.
Supplemental Report: Chronic Disease Epidemiology Capacity Findings and Recommendations. Atlanta, GA: CSTE; 2009. Available at: http://www.cste2.org/webpdfs/09ECACDECFINAL.pdf

44
Chapter 6: Data Governance
As emphasized throughout this orientation manual, two major points of focus for you as the lead
chronic disease epidemiologist are data and partnerships—the vital means for achieving efficient
and effective chronic disease surveillance and program evaluation to undergird efforts to improve
population health. Data—especially personally identifiable data—is subject to a number of legal
strictures governing its collection, availability and usage, referred to as “data governance”. To
navigate this state and federal terrain, you as the lead chronic disease epidemiologist must be
familiar with state statutes and public health reportable conditions, data user agreements,
institutional review boards (IRB), and the like. These data governance topics are the subject of this
chapter. The aspect of data governance not covered in this chapter is the dec ision making about
what data to collect for what purpose. To address this gap and to bring this chapter alive, ask to
observe an IRB meeting and a Board of Health meeting where the board is considering a new
reportable condition or change in an existing reportable condition.
For the senior epidemiologist or professional who supervises or mentors the lead epidemiologist,
you can use this chapter to highlight which topics are most relevant to your department or state,
to illuminate nuanced differences, to share additional topics not covered, and decide how best for
the lead epidemiologist to learn about the Board of Health and its rulemaking, especially related to
reportable conditions. (For example, in Colorado, cancer is required to be reported by hospitals ,
diagnostic and/or treatment clinics, and pathology laboratories.) Show the lead epidemiologist
where to access state statutes and Board of Health rules related to any and all chronic diseases,
the cancer registry, and/or disability. Ensure that the lead epidemiologist knows the chain of
command and approval process related to contact with a state legislator or with the governor’s
office. For the entry-level epidemiologist assess whether or not the surveillance system that you
use or know best covers all aspects of the framework for public health surveillance. Read the
documentation that forms the basis of the authority to conduct the surveillance system, whether it
is a Board of Health rule or an IRB-determined ruling that this surveillance is deemed public health
practice.
As a simple reminder of the comprehensive data collected in chronic disease surveillance and the
public health actions that data inform, the following framework is presented. The legal
requirement to protect privacy, the detailed and personal nature of these data and the potential
for harmful use drives the protections and security that governs them. It is these very protections,
how they are determined, and how they can be changed that you as the lead chronic disease
epidemiologist must understand.

45
Understand the Basics: A Framework for Visualizing Public Health Surveillance
Surveillance is one of three critical functions of a lead chronic disease epidemiologist. You as the
lead chronic disease epidemiologist must provide critical leadership to assure adequate capacity to
survey chronic diseases and associated risk factors and to assure the relevance, quality and
appropriateness of the collection, analysis, and interpretation of the data. Advances in information
technology have created expectations for surveillance that is real-time, accurate, and automated.
Brookmeyer and Stroup define public health surveillance broadly to include “all types of data
collected from populations that could be useful in guiding public health activities.” 67 They propose
a framework (Figure 6-1) depicting the relationship among a variety of data types, levels of
intervention and prevention opportunities. Inclusion of “social determinants” in this framework —
encompassing everything from health care access to community safety—is a poignant reminder of
the broad context of chronic disease epidemiology and the need to forge a variety of partnerships
to assure access to data and to populations to carry out core public health activities.
Figure 6-1. A Framework for Understanding Public Health Surveillance Data.68
As mentioned in Chapter 2, surveillance is a vital function of a lead chronic disease epidemiologist,
such that CSTE ranked it as one of the top three functions for this position. 69 Though evaluation of
health services was deemed a supportive function of a lead chronic disease epidemiologist,
evaluation—like surveillance--requires data. Therefore, it is useful to repeat the evaluation role of
a lead chronic disease epidemiologist to:
Further the design and implementation of scientifically sound evaluations of the outcomes
of health services and health promotion/disease prevention programs, assessing
effectiveness, accessibility, and quality.
Assist program managers and decision-makers in using evaluation results to enhance
effectiveness of existing programs and to design new programs addressing identified
needs.
Perform evaluation activities, such as analysis and interpretation of data to discern
program impacts using both qualitative and quantitative methods.
67 Adapted from Brookmeyer R, Stroup DF, Eds. Monitoring the Health of Populations. Statistical Principles and Methods for Public Health Surveillance. New York, New York: Oxford University Press; 2004. 68 Brookmeyer R, Stroup DF, Eds. Monitoring the Health of Populations. Statistical Principles and Methods for Public Health
Surveillance. New York, New York: Oxford University Press; 2004. 69 CSTE. Essential Functions of Chronic Disease Epidemiology in State Health Departments. 2004.
46
In addition to performing these essential functions, you as the lead chronic disease epidemiologist
will assist in building and evaluating long-term surveillance capacity, by assuring access to data and
data consultants, maintaining capabilities for data analysis/interpretation, and maintaining
partnerships with a long list of chronic disease stakeholders from community leaders to
academicians.
Know the Statutory Authority to Conduct Public Health Action
Federal and state laws govern public health practice in the United States, including public health
surveillance. They describe in broad terms the powers and duties of a public health entity and also
its limitations. Key is the balance between the Constitutional rights of individuals and the public
health needs of the community as well as the relationship of the federal government to state
government (federalism) in the U.S. Constitution. The sources of law necessary for public health
practice include: constitutions, statutes by legislatures, administrative law by executive branches
of government, and common law (including case law) by judicial court systems. As the lead chronic
disease epidemiologist, you will need to know about relevant state statutes and state
administrative laws (disease reporting regulations, for example).
State constitution and state statutes: Because the U.S. Constitution does not mention “public
health”, the primary responsibility for public health was left to states. States have their own state
constitution as sources of legal authority. State laws must meet U.S. Constitutional protections
(due to the 14th Amendment). The state’s own constitution provides for the establishment of state
and local government branches and powers. It is your state statute that gives power to executive
branch agencies, such as state public health departments. As the new lead chronic disease
epidemiologist, read the portions of the state statutes that apply to public health, the Board of
Health, and chronic diseases. Look for how it defines public health duties and chronic diseases,
including the public health use of data. Understand how it protects confidential data when your
public health department gathers, accesses, stores, and uses them. Usually, it limits data access to
public health professionals involved in the disease control efforts (though for communicable
diseases often persons at risk can be notified), and the data cannot be released to prosecutors and
tort lawyers. In addition to the protections in state statute, there is the federal privacy la w, the
Health Insurance Portability & Accountability Act (HIPAA), which is discussed later in this chapter.
Federal regulation regarding research and human subjects protection is also discussed later.
Finally, related to state statute, ask if there are public health exceptions in your state’s open
records act.
Regulation: Legislatures through state statute can give state agencies the power to make
administrative regulations that have the same force as statutes. Examples include the state board
of health designating notifiable diseases or reportable conditions or setting enforceable
environmental measures. Promulgating and amending regulation can be quicker than passing
statutes, allowing states to address new challenges quickly. So as the statute describes and limits
the general authority for public health, the regulation can address highly technical details in how
that authority is carried out. For example, many state public health departments designate

47
reportable diseases and specify the manner of reporting in an administrative rule by the Board of
Health, rather than in a statute. This administrative rule power gives the department the flexibility
to add diseases or change reporting standards without new legislation. The administrative rule
gives clear guidance to the persons with a duty to report. Both federal and state laws require
agencies to allow for public participation in this rule making. As the new lead chronic disease
epidemiologist, review any Board of Health rules related to chronic diseases and related risk
factors, such as tobacco and obesity. Also learn about state laws and local ordinances related to
physical activity (such as physical activity requirements in schools), nutrition (menu labeling, for
example), or environmental (secondhand smoke exposure). Ask about any excise taxes, such as on
tobacco.
Under the U.S. Constitution, U.S. Congress has enacted statutes creating a federal public health
infrastructure (for example, the U.S. Public Health Service) and federal agencies with public hea lth
powers (CDC, FDA, OSHA, EPA, NHTSA). The federal government can and does influence state
public health through its regulatory duties (federal school lunch program, for example) and
through its funding (and defunding) of public health, including chronic disease prevention funding
and school health funding.
For more information than summarized here, such as due process, police powers, quarantine, the
recent legal concept of personal privacy (1977), and emergencies, go to the source for this
information: http://www.cdc.gov/phlp/publications/phl_101.html
Cancer is a nationally notifiable condition. States must report cancer cases to CDC annually. 70
Understand the Data Use Agreement
A data use agreement is a common means to gain data access or provide it to others. It can reflect
information from federal and state statutes as well as state regulation. This contractual document
is used for the transfer of data that is nonpublic or subject to usage restrictions—the type of data
often required for research. Standard terms of data use agreements protect confidentiality, while
permitting appropriate publication or other sharing of research results in accordance with
applicable laws, policies and regulations. Typically, a state health department will have a
designated signatory authority. State health departments can use data use agreements within its
department to administer a person’s access to data based on their role related to a specific
reportable condition. For example, the cancer registry program might have a data use agreement
with the internal steward of the hospital discharge data owned by an external hospital trade
association.
Sample elements of a data use agreement include:
70 CSTE List of Nationally Notifiable Conditions. Council of State and Territorial Epidemiologists Website.
http://c.ymcdn.com/sites/www.cste.org/resource/resmgr/CSTENotifiableConditionListA.pdf Update August 2013. Accessed March 6, 2014.
48
Brief description of project(s) and intended use of the data, such as clinical research, health services research, or analyses to address public policy issues.
Brief description of the subject area(s) to be investigated, such as health outcomes or service utilization.
Brief description of the potential uses of the final products that may be created using the data, such as reports, quality measurements or performance measures.
Assurances that the requester: o Will use only the dataset, or any part thereof, as permitted by the agreement.
o Will prohibit others from using or disclosing the dataset, or any part thereof, except as
permitted by the agreement; typically for research and aggregate statistical reporting.
o Will keep data in a secure environment, with access limited to authorized users.
o Will not release or disclose, and will prohibit others from releasing or disclosing, any
information that identifies persons, directly or indirectly, except in cases explicitly
permitted under the agreement.
o Will comply with the privacy rule of the Health Insurance Portability and Accountable
Act of 1996 (HIPAA).
o Will not release or disclose information where the number of observations in any given
cell of tabulated data is less than six.
o Will not release or disclose information where the total population in any given
subgroup of tabulated data is less than 50.
o Will not release or disclose—and will prohibit others from releasing or disclosing—the
dataset, or any part thereof, to any person who is not a member, agent, or contractor
of the organization that is a signatory to the agreement.
o Will require all those who will use or have access to the dataset (e.g., employees,
agents or contractors of the signatory organization) to sign a copy of the agreement.
o Will not attempt, and will prohibit others from attempting, to link the records of
persons in the dataset with individually identifiable records from any other source.
o Will not attempt to use, and will prohibit others from using, the dataset to learn the
identity of any person included in the data set.
o Will not contact or permit others to contact facilities or persons in the datasets.
o Will not sell, market, or transfer the data, or cause or allow the transfer of the dataset
or any part thereof.
Determine Whether Your Project is Research, Surveillance, or Evaluation
Research, surveillance, and evaluation share similar designs, data collection methodologies,
analytical methods, and quality measures (e.g., statistical validity). However, there are also
important differences among the three in terms of their purpose and guiding questions; their
intended audience; and the means employed to interpret, report and use findings.

49
Lee, Teutsch and other authors of the text, Principles & Practices of Public Health Surveillance note several specific purposes of surveillance:71
Helping to assure accurate diagnosis and treatment.
Enabling appropriate public health management of persons exposed to disease.
Identifying disease outbreaks (or epidemics).
Guiding population-based public health prevention programs.
Generally, surveillance required by federal or state law or by state or local public health mandate
is not considered research. Voluntary reporting of risk behaviors, chronic disease knowledge, and
chronic disease diagnoses might or might not be considered research. The purpose of research is
to identify generalizable knowledge. “Generalizable knowledge means new information that has
relevance beyond the population or program from which it was collected.” 72 Research attempts to
prove (or disprove) a hypothesis, to inform an audience external to the research organization, to
ask “what is” and explain “how it works,” and to use findings to draw conclusions specific to the
tested hypothesis that contribute to new, generalizable knowledge. Evaluation, on the other hand,
aims to improve public health or public health surveillance, often informs an audience internal to
the organization, asks “what has value” and “what is working,” and uses findings for decision -
making about the specific program evaluated.
Importantly, research, surveillance, and evaluation each have their own standards and ethics for
public health professionals. As the new lead chronic disease epidemiologist, follow your
department’s established process to determine if a project or program is research, surveillance,
and/or evaluation. However, a tipping point does exist: if any portion of a study or project
qualifies as research, the entire enterprise is considered research.
Each governmental jurisdiction will have its own statues and administrative rules or procedures
governing public health surveillance, evaluation, and research. For example, there may be
differences across states in age to consent for research or ability to compensate state employees
for participation in research. The lead chronic disease epidemiologist will need to learn the
applicable policies in his or her state.
Use Institutional Review Boards (IRBs) When Necessary
The IRB is a federally mandated committee, established to assure that the rights and welfare of
human research subjects or participants are protected. Human subjects/participants, in turn, are
defined as living individual(s) about whom a research investigator obtains data through
intervention or interaction (including online interaction) with the individual or through identifiable
private information. The IRB has the authority to approve, disapprove, or require modifications to
proposed or ongoing human subjects research.
71 Lee LM, Teutsch SM, Thacker SB, St. Louis, ME. Principles & Practice of Public Health Surveillance. New York, New York:
Oxford University Press; 2010. 72 CDC’s Policy on Distinguishing Public Health Research and Public Health Nonresearch. Available at: Advancing Excellence &
Integrity of CDC Science: Human Participant Protection in CDC Research. Centers for Disease Control and Prevention Website. http://www.cdc.gov/od/science/integrity/hrpo/ Updated July 7, 2011. Accessed February 16, 2015.

50
IRBs operates under a federal wide assurance with the U.S. Department of Health and Human
Services (HHS), assuring federal funders and the public that the research organization and
researchers comply with Title 45 of the Code of Federal Regulations, Part 46 (45 CFR 46), 73 and
applicable state laws and institutional procedures concerning protection of human subjects in
research. Three fundamental ethical principles underlie this code: (1) respect for personal rights
of self-determination (including informed consent and surrogate consent/assent, as well as
protection of individual autonomy, individuals with reduced autonomy, subjects and
privacy/confidentiality), (2) beneficence to maximize subject benefits while minimizing harms
(including the need for risk-benefit analysis, sound research design and appropriate researcher
qualifications), and (3) justice or equitable distribution of research burden, costs, and benefits
(including subject recruitment and selection protocols and inclusion/exclusion criteria).
Types of IRB Review
Depending on the risk level of research protocol and the partic ipant population, an IRB may
conduct either an expedited review or full board review.
An expedited review is carried out solely by the IRB chairperson or designee (rather than the full
board) and is generally used for one of two purposes:
To approve minor changes to a previously approved research project during the period for
which approval is authorized (one year or less).
To determine whether proposed research meets minimal risk standards and can therefore
be exempted from further review.
Federal code defines minimal risk as “probability of risk or harm . . . no more than an individual
subject would experience and/or ordinarily encounter in their daily life.” 74 Exempted research—
including activities such as anonymous medical record reviews—typically must involve no more
than minimal risk, not involve intentional deception, not involve sensitive topics or populations,
and include appropriate consent procedures.
The term expedited review, however, can be misleading; reviews of this type are not conducted
faster or with less rigor. Researchers engaged in human subjects research qualifying for expedited
review must still complete a full application form and prepare an informed consent statement .
Moreover, investigators cannot assume that research poses minimal risk simply because it involves
only interview or survey data. Sensitive questions may cause distress that exposes participants to
greater than minimal risk. Loss of confidentiality can cause harm to participants, their relatives,
and others. And non-invasive research that poses no physical risk, may nonetheless pose financial
73 U.S. Department of Health and Human Services Website. Code of Federal Regulations. Title 45. Public Welfare.
http://www.hhs.gov/ohrp/humansubjects/guidance/45cfr46.html Updated January 15, 2010. Accessed March 1, 2014. 74 U.S. Department of Health and Human Services Website. Code of Federal Regulations. Title 45. Public Welfare. Part 46.102(i).
Available at: http://www.hhs.gov/ohrp/humansubjects/guidance/45cfr46.html Updated January 15, 2010. Accessed March 1, 2014.

51
risk, employment risk or risk of criminal or civil liability, stigmatization, loss of insurability, and/or
embarrassment. It is important to consider a comprehensive view of risk.
The HHS Office for Human Research Protection has graphic decision-making tools available to
determine whether a research activity is likely to qualify for expedited review or waiver of
informed consent requirements. (See Resources at end of chapter.) All human subjects research
that fails to meet requirements for exemption or expedited review must undergo a full IRB review.
Ongoing reporting to the IRB might include:
Number of subjects accrued.
Unanticipated problems or adverse events.
Withdrawal of subjects.
Complaints about the research.
Summary of preliminary findings, recently published relevant research, or other relevant
information, especially concerning research-related risks.
Copy of the current informed consent document.
Amendments or modifications to the research.
Exempt Research
Some types of research may not require IRB review. An example is research involving publicly
available information. Research involving prisoners, fetuses, pregnant women, or newborns cannot
be exempt from IRB review. However, the researcher does not make this determination of exempt
research. Rather, researchers should check with their department’s guidelines or IRB policies to
identify who will make the determination of whether or not a proposed study is exempt. Even
when the IRB determines that the research is exempt from IRB involvement, researchers still have
ethical responsibilities to protect participants’ rights.75
Understand Your Obligations under the Health Insurance Portability & Accountability Act
(HIPAA) HIPAA addresses three issues pertaining to personal health information: privacy, security, and
electronic data exchange. Specifically, the act provides standards and requirements for electronic
transmission of health information and a framework for the nationwide protection of client
confidentiality and the security of electronic health information systems.76 Because HIPAA
regulations are complex, they should be examined in the context of your own department. The
state governmental organization with the mission to protect public health might be its own state
department in your state or it might exist within the state human services department or the state
75 CDC’s Policy on Distinguishing Public Health Research and Public Health Nonresearch. Available at: Advancing Excellence &
Integrity of CDC Science: Human Participant Protection in CDC Research. Centers for Disease Control and Prevention Website. http://www.cdc.gov/od/science/integrity/hrpo/ Updated July 7, 2011. Accessed February 16, 2015. 76 U.S. Department of Health and Human Services Website. Health Information Privacy. Code of Federal Regulations. Title 45.
Part 106 and 164, Subparts A and E. Available at: http://www.hhs.gov/ocr/privacy/hipaa/administrative/privacyrule/index.html Accessed March 1, 2014.
52
Medicaid department. Ask if your department is designated as solely a public health entity under
HIPAA or as a “covered entity” which provide or pay for health care.
Protected Health Information
HIPAA standards for privacy of individually identifiable health information—commonly known as
the Privacy Rule—define protected health information individual identifiers (including
demographic information) and any personally identifiable information about an individual’s
health/condition or payment for health care.77
HIPAA regulations require the protection of protected health information, including, but not
limited to, protected health information created, stored, or transmitted in/on the following media:
Verbal discussions (i.e., in person, on the phone, via video chat);
Paper (i.e., chart, progress note, encounter form, prescription, x-ray order, referral form,
explanation of benefits, scratch paper, etc.);
Computer applications/systems (i.e., electronic health record, laboratory information
system, X-ray, etc.); and
Computer hardware/equipment (PCs, laptops, pagers, fax machines, servers,
cell/multifunctional phones, removable media, etc.).
Individuals have the right to receive an accounting of disclosures of their protected health
information, including any disclosures made to an inappropriate individual or entity in error and
disclosures made to:
Meet legal requirements.
Support public health activities.
Report abuse, neglect, violence.
Support health oversight activities.
Report to judicial/administrative bodies regarding official proceedings.
Support law enforcement.
Respond to threats to health or safety.
Support specialized government functions.
Report about decedents.
Provide information for worker’s compensation claims.
The use or disclosure of protected health information must be limited to the minimum necessary
to accomplish the intended purpose for which the request was made or limited to the information
a client has given permission to disclose via a client authorization.
77 U.S. Department of Health and Human Services Website. Health Information Privacy. Code of Federal Regulations. Title 45.
Part 106 and 164, Subparts A and E. Available at: http://www.hhs.gov/ocr/privacy/hipaa/administrative/privacyrule/index.html Accessed March 1, 2014.
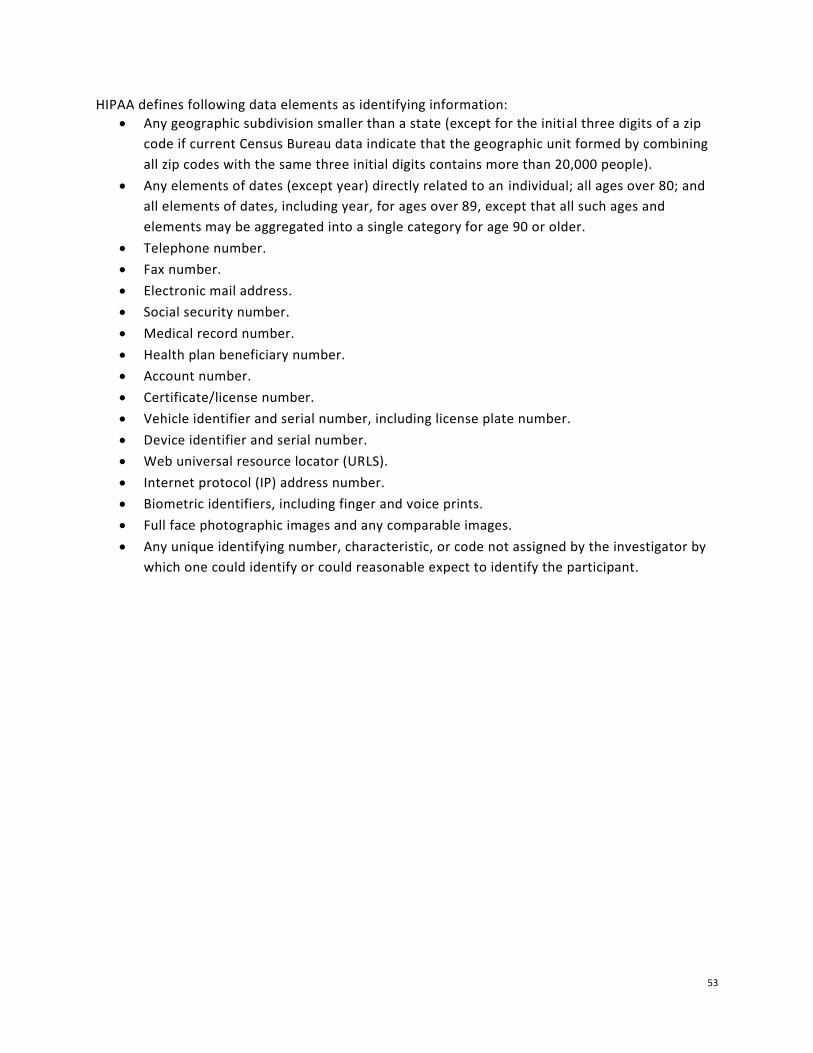
53
HIPAA defines following data elements as identifying information:
Any geographic subdivision smaller than a state (except for the initial three digits of a zip
code if current Census Bureau data indicate that the geographic unit formed by combining
all zip codes with the same three initial digits contains more than 20,000 people).
Any elements of dates (except year) directly related to an individual; all ages over 80; and
all elements of dates, including year, for ages over 89, except that all such ages and
elements may be aggregated into a single category for age 90 or older.
Telephone number.
Fax number.
Electronic mail address.
Social security number.
Medical record number.
Health plan beneficiary number.
Account number.
Certificate/license number.
Vehicle identifier and serial number, including license plate number.
Device identifier and serial number.
Web universal resource locator (URLS).
Internet protocol (IP) address number.
Biometric identifiers, including finger and voice prints.
Full face photographic images and any comparable images.
Any unique identifying number, characteristic, or code not assigned by the investigator by
which one could identify or could reasonable expect to identify the participant.

54
Resources
CDC Public Health Law 101 available at http://www.cdc.gov/phlp/publications/phl_101.html
CDC Surveillance Practice: Legal, Ethics, Policy at
http://www.cdc.gov/surveillancepractice/policy.html
Includes additional resources on data sharing agreements, ethics, HIPAA privacy rule, human
subjections protection, legal and regulatory issues, and meaningful use of interoperable electronic
health records.
Federal Policies on Human Subjects Research
Belmont Report—available at
http://www.hhs.gov/ohrp/humansubjects/guidance/belmont.html).
Federal Common Rule—available at
http://www.hhs.gov/ohrp/policy/checklists/decisioncharts.html.
http://www.hhs.gov/ohrp/humansubjects/commonrule/index.html.
Federal Policy for the Protection of Human Subjects—available at
http://www.hhs.gov/ohrp/humansubjects/guidance/45cfr46.html
Tools and Educational Materials on Human Subjects Research
NIH Office of Extramural Research online training course on “protecting human research
participants” ”—available at http://phrp.nihtraining.com/users/login.php.
NIH Office of Human Research Protection training and educational materials for
investigators, IRB members and research staff—available at
http://www.hhs.gov/ohrp/education/index.html).
U.S. Department of Health and Human Services - Human Subject Regulations Decision
Charts at http://www.hhs.gov/ohrp/policy/checklists/decisioncharts.html
Federal Privacy Policy
HIPAA Privacy Rule—available at
http://www.hhs.gov/ocr/privacy/hipaa/administrative/privacyrule/index.html.
Federal Policy on Research Misconduct
Public Health Service Policies on Research Misconduct—available at
http://ori.hhs.gov/assurance-program.
55
Summary
This chapter provides you with a basic overview of statutes and regulations that govern data
access and use.
Surveillance: State and federal laws govern data access and use, especially state statutes,
state Board of Health regulations, federal Health Insurance Portability and Accountability
Act (HIPAA) and the federal protection of human subjects in research. Understand the
statute and Board of Health regulations that authorize your department to collect and use
data on chronic diseases, especially any limits on the type of data and their use. As a lead
chronic disease epidemiologist, you might need to know more than one reportable
condition or notifiable disease. Compare the characteristics of research and program
evaluation to the uses of chronic disease data, especially for the diseases that are not a
reportable condition. Ask if historically any of the chronic disease surveillance systems
were used in research. In many states, the cancer registry is one of the oldest chronic
disease data systems. Ask its manager about its state statutes, any regulation, and any
research that used registry data. Ask to see the IRB forms for the research that used cancer
registry data, if still available. Ask how the cancer registry is used to improve population
health. Ask how they provide aggregated results and/or censor data to protect
confidentiality. Learn the topics of all reportable conditions as one way to learn about
unique data systems in your department. For example, maternal mortality, though rare,
might be reportable and findings from the maternal mortality review might be of interest.
Communication: Your role is to communicate scientific and technical information in a way
that decision makers can use it. Practice and prepare by writing a brief justification for the
BRFSS being a public health practice under state statute. Then compare your justification
with any actual justification (such as in the funding announcement from CDC or in your
state’s application to CDC for funding).
Consultation: It is often through your consultation that you connect the science and data to
the policy options and policy makers in your state. Ask if there are any proposed changes
to the chronic disease statutes or related Board of Health regulations. Ask if you will need
to provide a scientific justification for the changes. Ask about the process for making
changes, identifying constituent support, and selecting persons to testify.
Having reviewed data governance, you are ready to dive into the details of the data sources and
indicators used in chronic disease surveillance, oral health, and maternal and child health in
Chapter 7.
56
Chapter 7: Surveillance—Data Sources and Indicators
Chronic disease surveillance—the ongoing data collection, analysis, interpretation, and translation
for decision-making is the most important function of a lead chronic disease epidemiologist. Your
essential role as the lead chronic disease epidemiologist is to identify, quantify and monitor
chronic disease risk factors and disorders; to inform program planning and make the case for
public health intervention; and to evaluate program effectiveness and document successes.
Without relevant, reliable data, you and your department could not practice evidence -based public
health.
As a lead chronic disease epidemiologist, become an expert in several data sources used for
chronic disease surveillance and their analyzed results in the form of standard indicators used in
chronic disease epidemiology, oral health, and maternal and child health. Ask colleagues and the
senior epidemiologist (or your supervisor) which data sources and standard indictors are routinely
used for chronic disease surveillance in your state. Familiarize yourself with data sources the
department manages, which data sources need to be overhauled and which ones are going
through major changes, such as the hospitals implementing ICD-10-CM by October 1, 2014. Ask for
examples of an integrated data product from the department that used indicators on chronic
diseases, oral health, and maternal and child health together. For the entry-level epidemiologist,
learn about one data source unfamiliar to you and one set of standard indicators.
This chapter reviews the uses of surveillance and its scope, describes data sources commonly used
for chronic disease epidemiology and state surveillance in terms of the topic and population
covered. This chapter highlights existing standard indicator sets for chronic disease, maternal and
child health, and oral health surveillance and illustrates them with a few example indicators.
Review the Purpose of Surveillance Chronic disease surveillance is relatively new compared with infectious or communicable disease
surveillance and very needed.78 Its overall purpose, however, is the same: to monitor risk factor
and disease trends to inform the development of prevention and control programs, as detailed in
Table 7-1 below.
Table 7-1. Uses for Surveillance79
78 World Health Organization. 2008-2013 Action Plan for the Global Strategy for the Prevention and Control of Non-
Communicable Diseases. Geneva, Switzerland: WHO Press; 2008. 79 The World Bank Website. Public Health Surveillance Toolkit. Available at:
http://web.worldbank.org/WBSITE/EXTERNAL/TOPICS/EXTHEALTHNUTRITIONANDPOPULATION/0,,contentMDK:20740013~pagePK:210058~piPK:210062~theSitePK:282511,00.html Accessed February 16, 2015.
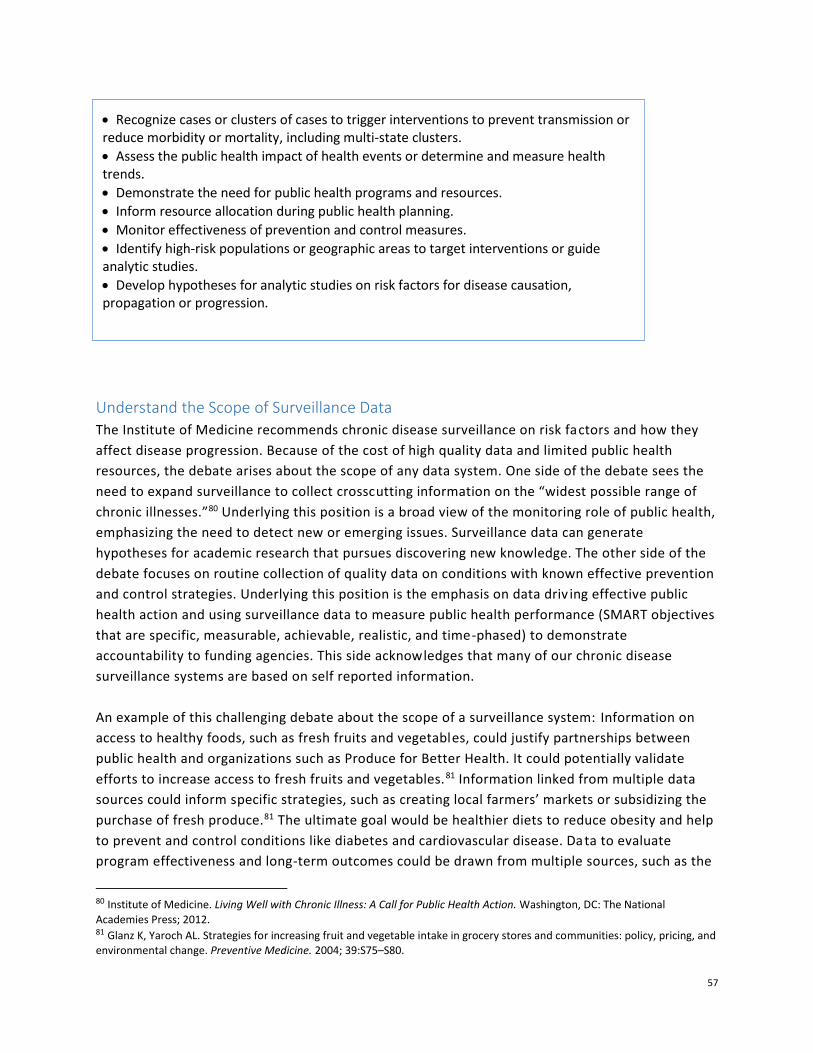
57
Understand the Scope of Surveillance Data
The Institute of Medicine recommends chronic disease surveillance on risk factors and how they
affect disease progression. Because of the cost of high quality data and limited public health
resources, the debate arises about the scope of any data system. One side of the debate sees the
need to expand surveillance to collect crosscutting information on the “widest possible range of
chronic illnesses.”80 Underlying this position is a broad view of the monitoring role of public health,
emphasizing the need to detect new or emerging issues. Surveillance data can generate
hypotheses for academic research that pursues discovering new knowledge. The other side of the
debate focuses on routine collection of quality data on conditions with known effective prevention
and control strategies. Underlying this position is the emphasis on data driv ing effective public
health action and using surveillance data to measure public health performance (SMART objectives
that are specific, measurable, achievable, realistic, and time-phased) to demonstrate
accountability to funding agencies. This side acknowledges that many of our chronic disease
surveillance systems are based on self reported information.
An example of this challenging debate about the scope of a surveillance system: Information on
access to healthy foods, such as fresh fruits and vegetables, could justify partnerships between
public health and organizations such as Produce for Better Health. It could potentially validate
efforts to increase access to fresh fruits and vegetables.81 Information linked from multiple data
sources could inform specific strategies, such as creating local farmers’ markets or subsidizing the
purchase of fresh produce.81 The ultimate goal would be healthier diets to reduce obesity and help
to prevent and control conditions like diabetes and cardiovascular disease. Data to evaluate
program effectiveness and long-term outcomes could be drawn from multiple sources, such as the
80 Institute of Medicine. Living Well with Chronic Illness: A Call for Public Health Action. Washington, DC: The National
Academies Press; 2012. 81 Glanz K, Yaroch AL. Strategies for increasing fruit and vegetable intake in grocery stores and communities: policy, pricing, and environmental change. Preventive Medicine. 2004; 39:S75–S80.
Recognize cases or clusters of cases to trigger interventions to prevent transmission or reduce morbidity or mortality, including multi-state clusters.
Assess the public health impact of health events or determine and measure health trends.
Demonstrate the need for public health programs and resources.
Inform resource allocation during public health planning.
Monitor effectiveness of prevention and control measures.
Identify high-risk populations or geographic areas to target interventions or guide analytic studies.
Develop hypotheses for analytic studies on risk factors for disease causation, propagation or progression.

58
Behavioral Risk Factor Surveillance System and point-of-sale receipts. Does the scientific literature
provide strong evidence that solely access to fresh fruits and vegetables improves dietary
behaviors in individuals and if a large number of individuals in the population make these
improvements that the population prevalence of obesity, diabetes, and cardiovascular disease will
decrease or at least stop increasing? To help answer this question, multiple well-designed
evaluation studies are needed.
A caution to both sides of the debate: do not collect more data than you can analyze and
disseminate effectively.82 This chapter does not resolve this healthy debate. However, you as the
lead chronic disease epidemiologist will face this challenge.
Selecting a Health Problem for Surveillance and Public Health Action
If a disease, injury, or condition affects adversely one of the following criteria, 83 public health
professionals create a surveillance system to track it and control it:
Morbidity as measured by increased incidence and/or prevalence
Mortality as measured by increased death rate
Case fatality rate as measured by decreased recovery rates
Lost productivity and/or decreased functioning and quality of life
Preventability
Medical costs
Premature mortality as measured by years of potential life lost, or
Socio-economic impact (health disparities or inequitable distribution among
subpopulations
As demonstrated at the beginning of this manual, the burden of chronic diseases meets almost all
of these criteria. They are leading causes of morbidity, mortality, disability, and decreased quality
of life in the United States.84 Chronic diseases account for 70% of all deaths, and about 75% of
health spending in the United States.1,85 Additionally, they are responsible for the widest health
disparity gap among racial/ethnic groups in the United States. While chronic diseases are
prevalent, costly, and potentially debilitating or fatal, they and/or their sequelae are, in part,
preventable.
82 Remington PL, Simoes E, Brownson RC, Siegel PZ. The role of epidemiology in chronic disease prevention and health
promotion programs. J Public Health Manag Pract. 2003; 9(4):258-265. 83 Principles of Epidemiology in Public Health Practice, 3rd Edition. Lesson 5: Public Health Surveillance. Self-Study Course
SS1978. Centers for Disease Control and Prevention Website. Available at: http://www.cdc.gov/osels/scientific_edu/SS1978/Lesson5/Section3.html Updated May 18, 2012. Accessed March 1,2014. 84 CSTE. Essential Functions of Chronic Disease Epidemiology in State Health Departments. 2004. 85 Chronic Disease Prevention and Health Promotion. Centers for Disease Control and Prevention Website. Available at: http://www.cdc.gov/chronicdisease/about/ Updated November 14, 2014 and http://www.cdc.gov/chronicdisease/overview/ Updated August 13, 2012 and http://www.cdc.gov/chronicdisease/resources/publications/aag/chronic.htm Updated December 17, 2009. Accessed March 1, 2014.
59
Know Data Sources for Chronic Disease Surveillance
“The current perspective is that public health surveillance involves a wide range of different
systems under a broad conceptual framework, such as an ‘enterprise’ or ‘portfolio,’ rather than a
unified system”86 or a single data system. Chronic disease surveillance, therefore, uses standard
data indicators from many data sources of health behaviors and/or health outcomes in defined
populations. These populations range from mothers who recently gave birth, to children, youth,
and adults. Data collection techniques can vary from:
State mandatory reporting by pathology labs of all new cancer tumors to a central registry
in a state health department,
Telephone interviews of adults identified by a random sample of telephone numbers,
Dental hygienists providing an in-person, oral health screening of students in select grades
from randomly sampled public schools.
Many national data sources, such as the Behavioral Risk Factor Surveillance System, can provide
both national and state estimates. Some sources are truly a census of all events of interest; others
provide population-based estimates using sampling and weighting methodology.
In their list of major CDC Chronic Disease Surveillance Systems,87 CDC includes data sources and
indicators that provide state and national estimates:
The Behavioral Risk Factor Surveillance System of adult-reported behaviors and outcomes
124 Chronic Disease Indicators (from multiple sources)88
Chronic Disease State Policy Tracking System of select nutrition, physical activity, and
obesity policies in states
National Youth Tobacco Survey of public school students in grades 6-12
Pregnancy Risk Assessment Monitoring System of maternal attitudes and experiences
before, during, and shortly after pregnancy
Youth Risk Behavior Surveillance System of students in public high schools
The National Oral Health Surveillance System, which is being expanded from 9 indicators to 3 4
existing, revised, and new indicators and 3 developmental indicators.89 Though not included in
86 Council of State and Territorial Epidemiologists. Special Report: Public Health Surveillance—2011 Public Health Surveillance
Workshop. 2011. Available at: http://www.cste2.org/webpdfs/SurveillanceWorkshopReportFINAL.pdf 87 Chronic Disease Prevention and Health Promotion: Statistics and Tracking – CDC’s Major Chronic Disease Surveillance
Systems. Centers for Disease Control and Prevention Website. Available at: http://www.cdc.gov/chronicdisease/stats/index.htm Updated January 15, 2015. Accessed February 16, 2015. 88 Chronic Disease Indicators. Centers for Disease Control and Prevention Website. Available at: http://apps.nccd.cdc.gov/cdi/.
Updated January 15, 2015. Accessed February 16, 2015. 89 Proposed New and Revised Indicators for the National Oral Health Surveillance System. Council of State and Territorial
Epidemiologists. http://c.ymcdn.com/sites/www.cste.org/resource/resmgr/PS/12-CD-01FINALCORRECTEDOCT201.pdf Updated October 2013. Accessed February 18, 2015.
60
the list of CDC’s major chronic disease surveillance systems referenced above, this surveillance
system is useful to chronic disease epidemiologists at the state and local level, as they pursue
collaboration and integration.
CDC provides disease and risk factor statistics from several sources in a variety of formats for the
following topics and more: cancer, diabetes, reproductive health, smoking, physical activity,
alcohol consumption, tobacco use, and water fluoridation.90
Given the variety and volume of data sources that can inform chronic disease prevention and
control, the following examples highlight data sources for risk factors and outcomes, disease
registries, and health care that states commonly use.
90 Chronic Disease Prevention and Health Promotion: Statistics and Tracking. Centers for Disease Control and Prevention
Website. Available at: http://www.cdc.gov/chronicdisease/stats/index.htm Updated January 15, 2015. Accessed February 16, 2015.

61
Table 7-2. Sources with Data on Risk Factors and Chronic Diseases across the Lifespan
Data Source Examples of Interest Population Overview
Birth Certificates
Mother’s weight pre-pregnancy and at delivery, diabetes, hypertension, tobacco use
Newborns with information about the mother and father
State and national vital records departments collect a census of live births using a standard form, including mother’s information. The standard birth certificate was revised in 2003, though states implemented it in different years. www.cdc.gov/nchs/births.htm or a state web site
National Survey of Children’s Health
Asthma, physical activity, obesity, medical home, parent’s health
Children ages 0 to 17 years old The federal Maternal and Child Health Bureau and CDC collaborate to collect national and state data on child well being, including physical and emotional health, social context of family, school, and neighborhood in 2003-04, 2007-08, and 2011-12. www.childhealthdata.org/ includes a survey of children with special health care needs. Some states have their own child health survey, such as a callback to eligible BRFSS respondents.
Youth Risk Behavior Surveillance System
Asthma, physical activity, obesity, alcohol use, tobacco use, dietary behaviors
Sample of students in grades 9-12 in public high schools
CDC and state, territorial, and tribal governments collect priority health risk behaviors every other year from 1991 to 2013. www.cdc.gov/HealthyYouth/yrbs/index.htm Some states and cities conduct a version for middle school. http://www.cdc.gov/healthyyouth/yrbs/participation_ms.htm http://www.cdc.gov/healthyyouth/yrbs/history-states_ms.htm
Youth Tobacco Survey and National Youth Tobacco Survey
Tobacco use, minors’ access to tobacco, secondhand smoke exposure, media exposure, quit attempts
Sample of students in grades 6-12 in public high schools
The Youth Tobacco Survey began with data collection in 2011. States can conduct the survey to learn about initiation of tobacco use, tobacco products used, media influences, and attempts to quit. The National Youth Tobacco Survey provides similar national data for 8 years during 1999-2012. www.cdc.gov/tobacco/data_statistics/surveys/index.htm
Behavioral Risk Factor Survey
Cholesterol, hypertension, chronic conditions, tobacco use, alcohol use, arthritis, physical activities, fruits and vegetables eaten
Adults 18 and older CDC and states collect health conditions, preventive practices, and risk behaviors via a telephone interview of adults identified by and sampled from telephone numbers, since 1984. Core questions are asked either every year or rotate every other year. The majority of the core questions are related to chronic disease epidemiology, and a few are related to general health. www.cdc.gov/brfss/
National Adult Tobacco Survey
Tobacco use, initiation, quit attempts, media exposure, secondhand smoke exposure
Adults 18 and older CDC via a contractor interviews a stratified sample of adults that provides state and national estimates, including tobacco-related disparities, related to CDC’s goals for tobacco prevention and control. www.cdc.gov/tobacco/data_statistics/surveys/nats/ For a comparison of tobacco surveys, see: www.cdc.gov/tobacco/data_statistics/surveys/pdfs/surveys-brochure.pdf
Pregnancy Risk Assessment Monitoring System
Pre-pregnancy weight, Body Mass Index, gestational diabetes, Breastfeeding, tobacco use
Women of reproductive age who gave birth recently
CDC and 40 states collect maternal attitude and experiences before, during, and shortly after pregnancy by sampling birth certificates. www.cdc.gov/prams/
Death Certificates
Mortality due to chronic diseases, tobacco
All ages State vital records units collect causes and factors (like tobacco) contributing to the death and use these data to estimate life expectancy of people with chronic diseases. www.cdc.gov/nchs/deaths.htm or a state web site

62
Table 7-3. Clinical Registries of Specific Chronic Diseases
Source Disease Overview
National Program of Cancer Registries
cancer CDC administers funding to state registries in 45 states that collect data on the cancer occurrence, type, extent, and location (body organ or system), the type of initial treatment, and outcome. These registry jurisdictions cover 96% of the U.S. population. www.cdc.gov/cancer/npcr/
Surveillance, Epidemiology and End Results (SEER) Program
cancer The National Cancer Institute collects and publishes cancer incidence and survival data from population-based cancer registries covering about 28% of the U.S. population. www.seer.cancer.gov/
Paul Coverdell National Acute Stroke Registry
stroke State registries collect data on adults ages 18 and older who have a clinical diagnosis of acute ischemic stroke, intracerebral hemorrhage, subarachnoid hemorrhage, or transient ischemic attack. The purpose is to improve quality of care and thereby reduce premature disability and death due to stroke. As of July 10, 2013, CDC funds 11 states: Arkansas, California, Georgia, Iowa, Massachusetts, Michigan, Minnesota, New York, North Carolina, Ohio, and Wisconsin. www.cdc.gov/DHDSP/programs/stroke_registry.htm
CDC and the National Cancer Institute provide cancer statistics at http://apps.nccd.cdc.gov/uscs/
and dynamic state profiles at http://statecancerprofiles.cancer.gov/ States have cancer registries
and also provide statistics. These cancer registries might participate in the programs described in
the table below of example clinical registries that provide data on specific chronic diseases.
Health Care Data Sources
An example of health care data is the administrative claims or billing data for health care or health
system records. This can be claims data submitted by hospitals or outpatient providers for
reimbursement for the health care services that they provide or it can be the other side of the
same business transaction. It can be claims data reimbursed by the payers of health care services:
private health plans or health insurance companies or the federal government (the Center for
Medicaid and Medicare Services). Claims or billing data include basic demographics, dates of
service, diagnoses, procedures, and possibly charges (the list price of a service), cost, or
reimbursed costs. The claims or billing data must provide information on the standard Uniform
Billing form, the 2004 version (“UB-04”) required by the Centers for Medicare and Medicaid
Services for reimbursement. Diagnoses are coded using the International Classification of Diseases,
Ninth Version, Clinical Modification (ICD-9-CM). No earlier than October 1, 2015, hospitals must
use the Tenth Version (ICD-10-CM) codes to report required diagnoses when they submit claims
for reimbursement by the federal government. ICD-10-CM is a completely different coding scheme
from the previous version. These administrative billing data exist in different collections or data

63
sets, at the national level. Several national sources do not provide state-specific results, because
they are based on a representative sample of all claims for a specific type or setting of care, such
as care provided in emergency departments. For example, the National Hospital Discharge Survey
was a national probability sample survey of discharges from nonfederal short -stay hospitals or
general hospitals in the United States. It is now combined with the National Hospital Ambulatory
Medical Care Survey to create the National Health Care Survey.91
Many states have electronic sources of hospital discharges, emergency department visits,
observation visits, and outpatient surgeries. The organization responsible for these data sources
can vary from state to state: a state government agency, a private hospital trade association in the
state, or a quasi-governmental agency. These data sets can be useful to describe health care
utilizations rates for specific chronic diseases. Another example of how to use these data sources is
to assess the need for improved chronic disease self-management, based on high rates of
emergency department visits for diabetes. Challenges using these data sets and data limitations
exist. Using these types of data sources takes some training. Some data sources have only charge
data, not cost data, and cost-to-charge ratios can be difficult to get. Some of these claims data
sources lack a single, unique person identifier, making it difficult to change the unit of analysis
from visits or admissions to persons. The primary diagnosis or main reason for treatment can be
difficult to determine. Residents living near state borders might receive treatment out of state. As
the lead chronic disease epidemiologist, you might want to know about co-morbidity indexes that
can be used with administrative data, such as the Charlson Comorbidity Index and the Elixhauser
Comorbidity Measure, to group the detailed ICD codes into meaningful clinical morbidities.
A state’s all-payer claims database (APCD) compiles claims data from private and public health
insurance payers to provide comprehensive data of costs and service use in a state. The APCD
Council website provides information about states’ implementation of an all -payer claims database
and related resources: http://www.apcdcouncil.org/
Through the Affordable Care Act, there are incentives to use electronic health records in health
care. In addition to being used to improve care of individual patients with chronic diseases through
automated reminders to physicians and supportive decision tools, electronic health records might
improve electronic reporting to state and local public health for notifiable conditions or reportable
conditions and/or reporting to state registries for cancer, stroke, or diabetes.92 The caution is that
both the field of public health and health care have limited IT workforce, outdated and/or
customized data systems without interoperability, and many demands on existing sta ff.
Wisconsin’s Division of Public Health has the capability to receive cancer reports through
91 National Health Care Survey. Centers for Disease Control and Prevention Website. Available at:
http://www.cdc.gov/nchs/nhcs.htm Updated January 14, 2015. Accessed on February 16, 2015. 92 Public Health Grand Rounds. Electronic Health Records: What’s In it for Everyone? Centers for Disease Control and
Prevention Website. Available at: http://www.cdc.gov/cdcgrandrounds/archives/2011/july2011.htm or
http://www.cdc.gov/cdcgrandrounds/pdf/grehrallfinal21jul2011.pdf. Updated January 15, 2015. Accessed February 16, 2015.

64
electronic health records.93 Local demonstration projects on meaningful use of electronic health
records provide promise. In Minnesota, they linked pediatric-prescribed asthma action plans to the
appropriate school nurse for students in their schools.94 The use of electronic health records for
public health is still an emerging opportunity and requires you as the lead chronic disease
epidemiologist to keep abreast of changes in this field. For example, look for the future results of
this planned study in New York City to use electronic health records in six outpatient clinics to
improve diabetes screening, follow-up and management.95
Table 7-4. Health Care Data Sources that Provide State Estimates
Source Examples of interest Brief Description
State hospital inpatient discharges
Counts and rates of admissions for specific chronic diseases
Administrative claims of information based on the national Uniform Billing form (UB-04)
State Emergency Department visits
Counts and rates of visits for acute complications of asthma or diabetes
Administrative claims of information based on the national Uniform Billing form (UB-04)
State Emergency Medical Services
Ambulance trip reports for stroke or heart attacks
This data source might match the national standards for emergency medical services
information system. See www.nemsis.org
Medicare, Medicaid, and State Children’s Health Insurance
Enrollment by demographics, number of providers by county, diagnosis of chronic conditions, use of clinical and dental services (e.g., mammography screening)
The federal Centers for Medicare and Medicaid Services has publicly available data on beneficiaries, claims, providers, and clinical care.
HEDIS performance measures on health plans
Blood pressure control, comprehensive diabetes care, beta-blocker treatment after a heart attack, breast cancer screening, weight/BMI assessment, immunization status
Healthcare Effectiveness Data and Information Set (HEDIS): The National Committee on Quality Assurance collects 76 performance measures on health plans through surveys, medical charts, and insurance payments for inpatient and outpatient services.
MEPS Dental and health insurance coverage, use of clinical and dental services and costs by demographics and source of payment
Medical Expenditure Panel Survey (MEPS) describes the cost and use of health care and health insurance coverage.
http://meps.ahrq.gov/mepsweb/
State data available when its sample is large.
HCUP Cost-to-charge ratios, Healthcare Cost and Utilization Project (HCUP) contains state and national data on inpatient
93 Public Health Meaningful Use. Wisconsin Department of Health Services Website. Available at: http://www.dhs.wisconsin.gov/eHealth/PHMU/index.htm. Updated February 10, 2015. Accessed April 11, 2015. 94 Care Beyond the Clinic: Public Health Lessons from Electronic Health Record Data. Robert Wood Johnson Foundation
Website. Available at: http://www.rwjf.org/en/blogs/new-public-health/2013/07/care_beyond_the_clin.html. Updated July 23, 2013. Accessed April 11, 2015. 95 Albu J, Sohler N, Matti-Orozco B, Sill J, Baxter D, Burke G, et al. Expansion of Electronic Health Record-Based Screening, Prevention, and Management of Diabetes in New York City. Prev Chronic Dis 2013;10:120-148.

65
downloadable file to translate ICD-9-CM codes into chronic vs. non-chronic conditions, downloadable software (2 SAS programs) that identify comorbidities using ICD-9-CM codes and the Elixhauser comorbidity scheme
stays, emergency department visits, and ambulatory surgery care.
http://www.hcup-us.ahrq.gov/reports/methods/methods.jsp.
AHRQ quality indicators of hospital care
Rates of admissions, complications, and mortality for select conditions, amputation among persons with diabetes, low birth weight
The Agency for Healthcare Research and Quality provides risk-adjusted indicators of the quality of hospital care.
http://qualityindicators.ahrq.gov/
Use Chronic Disease Indicators for Surveillance or Guidance
The Chronic Disease Indicators reflect the collaboration of CSTE, the National Association of
Chronic Disease Directors, and CDC’s National Center for Chronic Disease Prevention and Health
Promotion.96 They comprise a cross-cutting set of 124 measures developed by consensus and
based on importance to public health practice and data availability. States can use the Chronic
Disease Indicators to develop state- and local-level chronic disease surveillance systems, to plan
programs to target at risk populations, and to improve program evaluation. The indicators also
enable public health jurisdictions to uniformly define, collect, and report data on conditions and
their risk factors that fall into 18 topic groups: alcohol; arthritis; asthma; cancer; cardiovascular
disease; chronic kidney disease; chronic obstructive pulmonary disease; diabetes; immunization;
nutrition, physical activity, and weight status; oral health; tobacco; overarching conditions;
disability; mental health; older adults; reproductive health; and school health.
The data sources for the chronic disease indicators include: the Behavioral Risk Factor Surveillance
System (BRFSS), state cancer registries, the American Community Survey (ACS), birth and death
certificates data in the National Vital Statistics System (NVSS), the State Tobacco Activities Tracking
and Evaluation System, the United States Renal Data System, the Youth Risk Behavior Surveillance
System, the Pregnancy Risk Assessment Monitoring System, the Alcohol Epidemiologic Data
System, the Alcohol Policy Information System, alcohol policy legal research, the National Survey
of Children's Health, State Emergency Department Databases, State Inpatient Databases, the
Centers for Medicare and Medicaid Services Chronic Condition Warehouse and the Medicare
Current Beneficiary Survey, the U.S. Department of Agriculture, the CDC School Health Profiles,
Achieving a State of Healthy Weight, Maternal Practices in Infant Nutrition and Care, the
Breastfeeding Report Card, the Health Resources and Services Administration Uniform Data
System, the National Immunization Survey, and the Water Fluoridation Reporting System.
96 Chronic Disease Indicators. Centers for Disease Control and Prevention Website. Available at: http://www.cdc.gov/cdi/index.html Updated January 15, 2015. Accessed February 16, 2015.
66
Assure Capacity in Mandated Maternal and Child Health Surveillance
Title V of the Social Security Act was signed into law in 1935 to promote maternal and child health
nationwide. In 1981, funding to states under this federal legislation was converted into the Title V
Maternal and Child Health Services Block Grant, a program that provides funding to 59 states and
other U.S. jurisdictions to improve the health and well-being of:
Pregnant women, mothers and infants aged 1.
Children and adolescents.
Children and youth with special health care needs.
Every five years, states receiving this funding must develop a comprehensive statewide needs
assessment with stakeholder input. The results from this assessment are critical for program
planning, targeting services, and identifying state-specific priorities and performance measures.
States and other jurisdictions report annually on their program activities and performance on 18
national performance measures, nine health systems capacity indicators, six national outcome
measures and 12 heath status indicators. Additionally, states develop individual performance and
outcome measures addressing identified priority areas and unique needs based on the state’s five -
year needs assessment.
The Maternal and Child Health programs in states commonly use the following data sources:
birth certificates,
the National Survey of Children’s Health,
the National Survey of Children with Special Health Care Needs,
the Pregnancy Risk Assessment and Monitoring System,
Title X funded family planning clinics’ data,
hospital discharge data,
Medicaid claims data,
Population data sources such as the U.S. Census
A guidance document for performance measurement is at https://mchdata.hrsa.gov/TVISReports/ and a searchable database on the 18 national performance measures is available at https://mchdata.hrsa.gov/TVISReports/MeasurementData/MeasurementDataMenu.aspx Below is an example indicator. National Health Status Indicator Measurement for Maternal and Child Health National Health Status Indicator 1A: Percent of live births weighing less than 2,500 grams. Numerator: Number of resident live births weighing less than 2500 grams. Numerator Data Source: State vital records. Denominator: Number resident live births in the state in the reporting period. Denominator Data Source: State vital records. Statistic: Percent In addition to the indicators above, there are 45 preconception health indicators in 11 domains, including domains of tobacco, alcohol, and substance abuse; chronic conditions (hypertension, asthma, diabetes); nutrition and physical activity (fruits and vegetables, folic acid, overweight,
67
obesity, pre-pregnancy overweight and obesity, recommended physical activity); and mental health.97 The sources are:
Annual Social and Economic Supplement (ASEC) of the Current Population Survey (CPS)
Behavioral Risk Factor Surveillance System (BRFSS)
Pregnancy Risk Assessment Monitoring System (PRAMS)
National Sexually Transmitted Diseases Database (NSTD)
National Vital Statistics System (NVSS)
The Association of Maternal and Child Health Programs, in collaboration with experts in the field (including staff from Health Resources and Services Administration’s (HRSA) Maternal and Child Health Bureau, state health departments, and CDC), developed life course indicators to measure states’ progress as they use a life course framework to guide their programs. The final set of 59 standardized life course indicators encompass 12 categories: childhood experiences, community health policy, community wellbeing, discrimination and segregation, early life services, economic experiences, family wellbeing, health care access and quality, mental health, organizational measurement capacity, reproductive life experiences, and social capital. Explore the set of indicators here: http://www.amchp.org/programsandtopics/data-assessment/Pages/LifeCourseIndicators.aspx
Understanding Oral Health Surveillance
Healthy People 2020 Objective OH-16 calls for all states and the District of Columbia to establish an oral and craniofacial health surveillance system.98 In 2012, CSTE approved revised indicators for the National Oral Health Surveillance System indicators.99 A 2013 report provides a framework for indicators in a state surveillance system, core elements of a state oral health surveillance plan, and an operational definition for measuring that states have an oral health surveillance system.100 A collaborative effort of CDC’s Division of Oral Health, the Association of State and Territorial Dental Directors and CSTE, this surveillance system monitors the burden of oral disease, the use of the oral health care delivery system, and the status of community water fluoridation on the national and state levels. Fundamental revisions in this system align with Healthy People 2020 objectives for oral health and include data that cover population groups from kindergarten through older adults and from general populations to at-risk subgroups such as low-income, pregnant, and diabetic populations. As a result, state oral health programs can monitor state progress towards Healthy People 2020 objectives. This revised, expanded system has 34 indicators grouped within 12 indicator concepts, including dental visits, teeth cleaning, tooth loss, water fluoridation, caries, untreated tooth decay, dental treatment needs, preventive dental visits,
97 Core State Preconception Health Indicators. Council of State and Territorial Epidemiologists Website. Available at:
http://www.cste.org/?PreconIndicators Accessed March 7, 2014. 98 US Department of Health and Human Services. Healthy People 2020. Washington, DC:
http://www.healthypeople.gov/2020/topicsobjectives2020/objectiveslist.aspx?topicId=32. Accessed March 19, 2013. 99 CSTE Chronic Disease Committee. Proposed New and Revised Indicators for the National Oral Health Surveillance System.
Atlanta, GA: www.cste.org/?page=PositionStatements. 100 Association of State & Territorial Dental Directors, Phipps K, Kuthy R, Marianos D, Isman B. State-based Oral Health Surveillance Systems: Conceptual Framework and Operational Definition. Atlanta, GA: CSTE: October 2013. http://c.ymcdn.com/sites/www.cste.org/resource/resmgr/Chronic/StateBasedOralHealthSurveill.pdf Accessed March 22, 2014.

68
dental sealants, dental treatment visits, school-based health center dental services and oral and pharyngeal cancer.
Oral Health Basic Screening Survey
The Basic Screening Survey is a standardized set of surveys on observed oral health of participants.
The Association of State and Territorial Dental Directors with technical assistance from CDC
developed these surveys. They collect self-report or observed information on age, gender, race
and Hispanic ethnicity, and self-report information on access to care for preschool, school-age, and
adult populations. The most common administration of this survey in states is among 3 rd grade
students. The surveys are cross-sectional and descriptive. In the observed oral health survey,
dentists and dental hygienists, (or other appropriate health care workers in accordance with state
law) record gross dental or oral lesions. The examiner records presence of untreated cavities and
urgency of need for treatment for all age groups; caries experience (treated and untreated decay)
for preschool and school-age children; the presence of sealants on permanent molars for school-
age children; and edentulism (no natural teeth) for adults.
States might use one or more of the surveys to obtain oral health status and dental care access
data for monitoring Healthy People 2010 objectives. The surveys come with training materials. The
Association of State and Territorial Dental Directors provides technical assistance on sampling and
analysis using the standard protocol. Some states collect height and weight as part of this observed
survey.
Source: CDC Oral Health Resources website, www.cdc.gov/nohss/DSMain.htm
The data sources for the National Oral Health Surveillance Indicators are:
Basic Screening Survey
Behavioral Risk Factor Surveillance System
Centers for Medicare and Medicaid Services
National Assembly on School-Based Health Care
National Survey of Children’s Health
Pregnancy Risk Assessment Monitoring System
Surveillance, Epidemiology and End Results and National Program of Cancer Registries
Water Fluoridation Reporting System
The full list of indicators and their sources is at www.cdc.gov/nohss/ Below is an example indicator. Example Indicator Measurement Indicator 1A: Percentage of adults 18 years and older with a dental visit in the past year. Numerator: Number adults ≥ 18 years reporting they had a dental visit in the past year. Data Source: BRFSS Denominator: Number adults ≥ 18 years responding to this question on the BRFSS. Data Source: BRFSS Statistic: Percent
69
Using the Healthy People Objectives as Targets
The Healthy People Objectives for 2020 provides a warehouse of national baseline data on the
objectives from a variety of sources.101 Healthy People 2020 provides standard data definitions and
conceptual information about the indicators or objectives. Including national objectives with state
chronic disease data can elevate the importance of a chronic disease problem and give a national
comparison for state results. The Healthy People 2020 goals or targets can become the state goal,
depending upon the state baseline results.
Find Additional Indicators and Interventions at the Health Indicators Warehouse
At the Health Indicators Warehouse, the National Center for Health Statistics provides public
access to community health indicators from initiatives, such as the Healthy People 2020, county
health rankings, and community indicators from the Centers for Medicare and Medicaid
Services.102 The purpose is to improve understanding of a community’s health status and
determinants and links indicators with evidence-based interventions. Search by topic, by
geography, and/or by initiative. Topics include chronic diseases, maternal and infant health, oral
health, health behaviors, and health outcome. For example, if you wanted to know about stroke
mortality in your state and initiatives to prevent it or if you wanted to know the percent of
Medicare beneficiaries with arthritis in a selected state, this warehouse is helpful. The content and
purpose of this warehouse reflect its partners.
Centers for Medicare & Medicaid Services Department of Health and Human Services:
o Office of the Deputy Secretary o Office of Adolescent Health o Office of Disease Prevention and Health Promotion o Office of Minority Health o Office of the Assistant Secretary for Planning and Evaluation
Health Resources and Services Administration
101 HealthyPeople.gov. U.S. Department of Health and Human Services Website. Available at:
http://www.healthypeople.gov/2020/default.aspx Updated August 28, 2013. Accessed March 7, 2014. 102 Health Indicators Warehouse developed by the National Center for Health Statistics. Version 1.11. U.S. Department of
Health and Humans Services Website. Available at: http://www.healthindicators.gov/ Updated February 15, 2014. Accessed March 7, 2014.
70
Summary
Understanding the history, purpose, and indicators used for surveillance of chronic diseases, maternal and child health, and oral health builds your capacity as a lead chronic disease epidemiologist in assessment and analysis and can fuel your systems thinking. Cross -training and collaboration on using multiple data systems can expand capacity without adding s taff.103
Surveillance: In general, you as the lead chronic disease epidemiologist need to become an expert in interpreting results from Behavioral Risk Factor Surveillance System and any chronic disease-specific data system in your state, such as a cancer registry. To further integration efforts in your state, add a working knowledge of relevant health care data, the basic screening survey for oral health, and the Pregnancy Risk Assessment and Monitoring System. Learn about successes in using data to drive action from other states, the data coordinators in your state, and through CDC and CSTE websites. Use these data sources to identify tested questions that might be appropriate to add to the Behavioral Risk Factor Surveillance System in your state.
Communication: Use multiple data systems to communicate a more comprehensive picture of chronic disease issues across the life span and to highlight specific opportunities to prevent and control chronic diseases. Disseminate relevant chronic disease indicators to colleagues addressing oral health and maternal and child health. The relevancy might simply be the same target age group, such as obesity prevalence in school -age children.
Consultation: Meet the state coordinators of the Behavioral Risk Factor Surveillanc e System, the oral health surveillance system, and the maternal and child health measures. Ask them to read this chapter and discuss their work with you. Remember that they might not be located in your part of the department or anywhere in your department. Consult with them to learn and to expand the use of their data systems, which helps them justify the continued investment in their data system. Share ideas with them about potential ways to enhance the system and creatively maintain funding. Identify together ways to leverage resources and cross promote data results.
103 Duffy RE, Siegel PZ. Increasing chronic disease epidemiology capacity without increasing workforce: a success story in Ohio. J Public Health Manag Pract. 2009; 15(2): 123-6.
71
Chapter 8: Data Interpretation and Dissemination
At the heart of chronic disease epidemiology is the quest to understand past disease trends and
their association with potential risk and protective factors so to inform public health decisions and
actions. This mission requires the development of appropriate methods to measure the impact of
disease trends and associated risk factors. This data-driven approach is the foundation of
evidence-based public health (Chapter 5). Data collection is just the first step, followed by analysis
and dissemination of surveillance data that address real-world problems. This chapter covers key
concepts and tips common for analysis and dissemination of chronic disease data, though not
unique to it. As the lead chronic disease epidemiologist, your statistical knowledge, your skill in
assessing bias in observational data, and your understanding of the strengths and limitations of
each surveillance method (Chapter 7) and their impact on the resulting data will be crucial to
appropriately interpreting data results. In other words, you will be able to objectively state what
the results mean and do not mean. In addition to data interpretation, you will synthesize resul ts to
identify what public health actions the results support. You will translate the results into everyday
language that policy makers and other decision makers can readily use.
Review Concepts Critical for Analyzing and Interpreting Data
CDC provides an online, self-study course in the principles of epidemiology in public health
practice.104 Its six lessons and glossary cover descriptive and analytic epidemiology (lesson 1),
disease concepts, surveillance (lesson 5), and applied biostatistics (lesson 3 o n measures of risk).
The website of the National Association for Public Health Statistics and Information Systems
provides statistical measures commonly used with birth and death data. 105 University of California,
Los Angeles shares a good resource for selecting the most appropriate statistical test to use.106 For
convenience, defined below are a few core statistical measures and concepts.
Type of measurement: Quantitative data are information that can be measured (counted) and
therefore can be represented with numbers. Chronic disease epidemiologists often use
quantitative data. In contrast, qualitative data cannot be measured though it can be described
or observed, such as colors or textures. Therefore, qualitative data represents information in
non-numeric form, such as narrative descriptions in the form of text, audio words, or images.
104 Principles of Epidemiology in Public Health Practice, Third Edition: An introduction to applied epidemiology and biostatistics. Self-Study Course SS1978. Centers for Disease Control and Prevention Website. Available at: http://www.cdc.gov/osels/scientific_edu/SS1978/index.html Updated May 18, 2012. Accessed March 7, 2014. 105 Statistical Measures and Definitions. National Association for Public Health Statistics and Information Systems Website. Available at: https://naphsis-web.sharepoint.com/Pages/StatisticalMeasuresandDefinitions.aspx Accessed April 11, 2015. 106 What statistical analysis should I use? Institute for Digital Research and Education, UCLA Website. Available at: http://www.ats.ucla.edu/stat/mult_pkg/whatstat/default.htm. Accessed April 11, 2015.

72
Examples of qualitative data more common in public health are focus group notes or answers
to open-ended interview questions. Qualitative data can provide insight or context that fills a
gap in the quantitative data. However, qualitative findings will not be generalizable beyond the
group who provided the information.
Measuring data quality: Two qualities of measurement necessary for understanding and
interpreting accurately data results are validity and reliability. Validity is the degree to which
the measurement actually measures what it is intended to measure. Reliability refers to the
degree to which a measurement produces the same values when identical measurements are
repeated in the same population. If a measure is not valid, then what is being measured is not
known. If a measure is not reliable, then one cannot measure changes over time.
Measuring magnitude of events or disease occurrence in a population: Incidence rate is the
rate of new cases of a disease or condition among a population over a defined period of time.
Incidence rate is also a proportion, because the persons in the numerator are also in the
denominator. A commonly used incidence rate is a death rate from the state mortality system
of death certificates. Prevalence is the rate of existing cases of a disease, condition or behavior
(e.g., tobacco use) among a population at a point in time or over a defined period of time. The
most commonly used chronic disease prevalence rates come from BRFSS. BRFSS prevalence
estimates can approximate the current (or historical) burden of a disease or risk factor in a
population but not usually the number of new cases. Prevalence is a function of incidence and
duration of a condition. Both can be used as measures of risk. Adjusted rates are rates that
have been standardized in such a way to allow for fair comparisons of rates over time or
among different populations defined by the geography where they reside. The most common
in epidemiology is age-adjusted rates, because the rate of chronic diseases increases with
increasing age. The direct method of age adjustment: Age-specific rates for a population at a
particular time and place are applied to a standard age distribution, such as the U.S. population
in 2000. Age-specific rates for a second population are applied to the same standard age
distribution. In effect, the two resulting artificial or hypothetical rates allow for a fair
comparison, because the resulting rates are independent of the underlying age distribution of
the population they represent.
Measuring change in risk: Relative reduction is the percent change from the baseline period
compared to the next period of interest (e.g., 50% relative decrease from a prevalence of 20%
in 2000 to 10% in 2010). It can also be the percent change among the experimental group
compared to the control group. It is calculated as follows:
(Event Rate among Experimental Group – Event Rate among Controls) Event Rate among
Controls
or
(Baseline Rate – Current Rate) Baseline Rate
Absolute reduction is the difference between the rate during the baseline period or among the
control group and the rate during the current period or among the experimenta l group (e.g.,

73
10% absolute difference from the prevalence of 20% in 2000 to 10% in 2010, sometimes
described as a 10-point change).
Examining trends is a basic analysis of surveillance data by time to detect changes in incidence
or prevalence of risk and protective factors and health outcomes. Assess if the change in risk is
an artifact of an increase in population size, improved diagnostic procedures, and/or enhanced
reporting and other reporting biases.
Measures of association between an exposure or risk factor and a health outcome include risk
ratio (relative risk), rate ratio, odds ratio, and population attributable risk. An association is
any observed relationship or pattern between to measured quantities. An association is not
the same as causation.107 Risk ratio is the ratio of incidence proportions of two groups (the
percentage of persons with a disease in group one divided by the percentage of persons with a
disease in a second group). The rate ratio is the ratio of incidence rates of two groups. Odds
ratios provide a reasonable approximation of a risk ratio when the study design is a case -
control study. In a case-control study, one cannot calculate risk, because the size of the
population from which the cases (the persons with the outcome of interest ) is not known.
Confounding is the distortion of an association between an exposure (risk factor) and a health
outcome by a third variable related to both the exposure and the outcome. Interaction is
modification of the effect of the exposure on the outcome by a third variable. For example, the
risk of mesothelioma from exposure to asbestos greater among smokers than non-smokers.
Population attributable risk measures the public health impact of an association between an
exposure and outcome. Also known as attributable proportion or attributable risk percent, it
represents the expected reduction in disease if the exposure could be removed. The definition
is the difference between risks for the exposed group and unexposed group divided by the risk
for the exposed group times 100%. For example, Colorado analyzed the population attributable
risks of maternal smoking and inadequate weight gain during pregnancy on low birth weight. 108
Statistically significance is a measure of how likely a result could have occurred by chance
alone, and a confidence interval is a range of values for a measure or estimate (e.g., rate or
odds ratio) constructed so that the range has a specified probability of including the true value
of the measure in the population. Often the probability, which is selected in advance of
running the calculations, is 95 percent. For example, if an epidemiologist took 100 random
samples from the population and each time measured obesity in the sample, 95 times out of a
100, the true obesity prevalence in the population would be within the 95% confidence
interval. If the confidence intervals for estimates (in the same population in two time periods
or two populations in the same time period) do not overlap then these two estimates are
statistically significantly different. However, this difference might not be clinically relevant or
107 Health Knowledge. Public Health Action Support Team Website. Available at: http://www.healthknowledge.org.uk/e-
learning/epidemiology/practitioners/causation-epidemiology-association-causation 2011. Accessed February 16, 2015. 108 Colorado Department of Public Health and Environment. Making Progress on Tipping the Scales: Weighing in on Solutions to
the Low Birth Weight Problem in Colorado. Update 2011. Available at: https://docs.google.com/file/d/0B5-zZbWN47gnbjA1RHhhVlprWTA/edit?usp=drive_web&pli=1 . Accessed April 11, 2015.
74
meaningful in practical terms. Also, using confidence intervals to test for statistical significance
is sometimes a conservative approach.
Understand Concepts Critical for Disseminating Data Results
There are circumstances where you as the lead chronic disease epidemiologist cannot or should
not release data results. Not releasing data is referred to as “data suppression”. The two main
reasons to suppress data are: 1) to protect the confidentiality of the person or persons and 2) to
prevent the use of unreliable data or low quality data. To protect confidentiality, follow the
confidentiality guidelines and data use agreements—standards established by the health
department, data source, or surveillance system to protect the identity of the individuals or
jurisdictions represented within the data (Chapter 6). Public health practitioners can be held
personally liable for not following these standards. The exact threshold for suppressio n varies in
confidentiality guidelines and might be based solely on the numerator or both the numerator and
the denominator in an analyzed table of results. For example, a confidentiality guideline could
specify that any count in a table that is less than 5 must be suppressed, meaning deleted from the
table of results, regardless of the total count in the table or the total population the analyzed
results represent. Some guidelines further specify that if the reader can calculate the number
suppressed from the table of results that more information must be suppressed or further
aggregated. To prevent the use of low quality data, there are sample size guidelines—standards
established by the surveillance system to ensure that only representative (and reliable) data is
shared. For example, the Behavioral Risk Factor Surveillance System suppresses data with an
unweighted sample size of the denominator is less than 50 respondents or the relative standard
error is greater than 0.3. In addition, caution is warranted in interpreting estimates based
on cell sizes (numerators) less than 50.
Translate Data for Optimal Messaging to Your Intended Audience
For data to effectively drive action, the data results from surveillance systems must be easy for
staff to use appropriately and easy for the public to understand. Your role is to determine the
audience(s) for the data results and their specific needs, select appropriate formats for sharing the
results, identify the key messages for each audience, and share information accordingly. You are
translating numeric, statistical information into everyday language while also interpreting and
revealing the meaning of the results. Telling the results as a story that frames the issue and uses
social math provides the kind of everyday language that busy professionals (colleagues, policy
makers) immediately grasp and will use.
Frame your information to tell a story
The London-based data-journalist and “information designer” David McCandless advises data
purveyors to “design information so it makes more sense, tells a story, and allows us to focus only
75
on information that is important.”109 Answer these questions before developing your message from
the data, a message that connects the problem, solution, values, and action.
What story do the data tell? What problem and solution, if any, do the data suggest?
What is your end game? What question were you trying to answer with the data analysis?
What is your call to action?
Who is your audience? What do they value? What is their context? What decisions are
they facing?
Numeracy or statistical literacy of the audience? Can they translate percentages and
rates? If not, the data will need to be presented as simply as possible, in a clear language
with compelling context and visual displays of the results that would tell the same story, if
the words were removed. What is your understanding of the concept and meaning, not just
the tool of data analysis and the recipe for calculating a rate? Do you understand the
concept well enough to tell it simply?
Use social math and framing to help tell your story
Social math is “the practice of translating statistics and other data so they become interesting to
the journalist and meaningful to the audience.”110 As outlined in CDC’s Framing Guide for
Communicating about Injury, there are several steps for creating social math and a compelling
story:111
1. Consider the message frame. For example, CDC’s frame for those who work in the field of injury
is “We want a society where people can live to their full potential.” This frame is a value that you
and the audience have in common. When selecting a frame, consider what you want to accomplish
and whether you can make interesting connections, comparisons or metaphors.
2. Make a strong and dramatic statement of the problem.
Select relevant examples appropriate for the target audience.
Make the statistic meaningful to the audience. It can be effective to break data down by
time (e.g., 400,000 deaths per year) and by place to localize the information as much as
possible. However, do not provide a long list of statistics about the problem. People want
to know about the solutions, what they cost, and how they will get done.
Find useful comparison statistics, such as a statistic about a familiar thing. For example,
compare the daily individual cost of a program to the cost of a daily latte coffee. The
comparison can be dramatic or unusual. However, avoid invalid, unfair comparisons.
109 Information is Beautiful. David McCandless Website. Available at: http://www.informationisbeautiful.net/about/ Accessed
March 7, 2014. 110 Dorfman L, Woodruff K, Herbert K, Ervice J. Making the Case for Early Care and Education: A Message Development Guide
for Advocates, pp. 112-114. Berkeley, CA: Berkeley Media Studies Group, 2004. Available at: www.bmsg.org/documents/YellowBookrev.pdf Accessed March 7, 2014. 111 National Center for Injury Prevention and Control. Adding Power to Our Voices. A Framing Guide for Communicating About
Injury. Version 2. Atlanta, GA: US Department of Health and Human Services, Centers for Disease Control and Prevention; 2008 (revised March 2010). At: http://www.cdc.gov/injury/pdfs/CDCFramingGuide-a.pdf Accessed March 7, 2014.
76
3. Get to the solution sooner, and use positive, action-oriented statements about the solution.
Reinforce the science without jargon.
If personal responsibility and/or community action are common values, tie the solution to
them.
Ensure that the message has a call to action and engages the audience to act.
When creating social math, make sure the data results and concepts:112
Are 100% accurate.
Make sense and are related.
Are appropriate for the audience.
Are married to the story.
Are visual, if possible.
Are dramatic.
Engages the audience in fixing the problem.
Do not depict mayhem.
Are used sparingly.
To recap, the steps to arrive at an effective story that connects the problem, solution, values, and
action: Consider the frame, relevant examples, statistics, and comparison; limit what to present;
avoid invalid, unfair comparisons; check facts and visuals.
Present effectively
Known for his engaging presentation, former Apple CEO Steve Jobs used a similar approach as
described above. His ten favorite public speaking tips “to be insanely great in front of any
audience” are:113
1. Plan your presentation with pen and paper.
2. Simplify complex information.
3. Tell a story with a villain and a hero. [This tip might not always work for public health.
Public health professionals and government officials are careful in describing the problem
and the potential solutions. They are careful not to demonize or victimize people and
businesses.]
4. Personalize benefits. The audience needs to know “what’s in it for me?”
5. Stick to the rule of three. It is easier for people to remember three key points. [Three
verbal points are common in U.S. culture. A story has a beginning, middle, and end. Jokes
have three repetitions. Sermons have three points.]
6. Evoke a higher sense of purpose.
7. Create visual slides.
112 National Center for Injury Prevention and Control. Adding Power to Our Voices. A Framing Guide for Communicating About Injury. Version 2. Atlanta, GA: US Department of Health and Human Services, Centers for Disease Control and Prevention; 2008 (revised March 2010). At: http://www.cdc.gov/injury/pdfs/CDCFramingGuide-a.pdf Accessed March 7, 2014. 113 Gallo C. The Presentation Secrets of Steve Jobs: How to Be Insanely Great in Front of Any Audience. New York, NY: McGraw-Hill Books, 2010.
77
8. Make numbers meaningful.
9. Use plain English.
10. Practice before you present.
Consider trying presentation software such as Prezi, which allows a viewer to see a whole visual
representation before the embedded detail slides. The online presentation tool is at
http://prezi.com/ and has tips and examples to help you organize your ideas and present your
information effectively. Look at the examples listed below for ways to summarize and present data
results visually.
Mapping examples
Storytelling with maps: http://storymaps.esri.com//UnemploymentPopulation/
Central Indiana interactive mapping: http://www.savi.org/savi/QuickInformation.aspx
Indiana mapping and social networking: www.communitycommons.org
The Global Burden of Disease study by the Institute for Health Metrics and Evaluation:
http://www.healthmetricsandevaluation.org/gbd/publications/policy-report/state-us-
health-innovations-insights-and-recommendation
U.S. County Profiles with maps of life expectancy, obesity, and sufficient physical activity:
http://www.healthmetricsandevaluation.org/us-health/county-profiles
Data visualization examples
www.indianacancer.org/category/blog/infograph/
www.informationisbeautiful.net/visualizations/
www.gapminder.org/
www.dashboard.imamuseum.org/
http://www.healthmetricsandevaluation.org/tools/data-visualizations
78
Summary
This chapter reviews key concepts in analyzing, interpreting, and disseminating data and suggests
ways to match the data and its message to the intended audience. It focuses on your essential role
in surveillance and communication.
Surveillance: Keep examples of data products and presentation, regardless of the topic, to
help you quickly and meaningfully disseminate results of chronic disease surveillance
regularly and widely in a variety of formats.
Communication: If simply communicating complex or statistical information is not your
strength, consider one of these suggestions. Read science writers who communicate
technical information in everyday language. Review the resources in the chapter as often
as needed. Review CDC’s website.
Consultation: Talk to your health communication specialist in your department.

79
Chapter 9: Technical Assistance and Related Programs
Chronic disease epidemiologists have a strong technical assistance and support network available
to them. Fortunately, whether you are a lead chronic disease epidemiologist, a senior
epidemiologist, or an entry-level epidemiologist who focuses on one disease, there is help, even
with staffing. CSTE, CDC, the National Association of Chronic Disease Directors, the Association of
State and Territorial Dental Directors are among the organizations you will turn to time and time
again.
Summarized below is information on national organizations and their training programs that can
benefit you as the lead chronic disease epidemiologist and/or your organization. This inf ormation
is mostly from the web sites of the key organizations. Listed first are three key national
professional organizations and their fellowship and training programs, then the many CDC -
sponsored ones, and finally jointly-sponsored programs in public health informatics.
Council of State and Territorial Epidemiologists (CSTE)
CSTE is a professional membership organization representing state and territorial public health
epidemiologists. It works to establish more effective relationships among state and o ther health
agencies and provides technical advice and assistance to partner organizations and to federal
public health agencies, such as CDC. CSTE members have surveillance and epidemiology expertise
in a broad range of areas, including chronic disease, maternal and child health, occupational
health, infectious diseases, immunization, environmental health, and injury control. The
association promotes the successful use of epidemiologic data to guide public health practice and
improve health. It accomplishes this mission by supporting the use of effective public health
surveillance strategies and good epidemiologic practice through training, capacity development,
peer consultation, development of practice standards, and advocacy for resources and science -
based policy.
As a lead epidemiologist at a state health department, you can benefit from all that CSTE provides:
free professional development webinars, free referral to experts and state contacts for each of the
specialty areas of epidemiology, position statements, white papers, work groups, and
competencies and capacity assessment tools.
For more information, go to: www.cste.org
80
CDC/CSTE Applied Epidemiology Fellowship
CSTE—in collaboration with CDC, the Association of Schools of Public Health, and the Health
Resources and Services Administration—has established the Applied Epidemiology Fellowship to
train recent master- or doctoral-level graduates with a degree in epidemiology or related field who
are interested in public health practice at the state or local level. This fellowship has three core
goals:
Providing service to the sponsoring agency.
Creating and training a core group of public health workers.
Strengthening capacity in applied epidemiology across public health institutions.
Fellows receive a high quality experience through two years of on-the-job training at a state health
department under the guidance of an experienced mentor. The fellowship provides rigorous,
formal training. Fellows have flexibility in pursuing particular interests and in meeting the needs of
the host organization.
National Association of Chronic Disease Directors
This association for professional members serves state and territorial chronic disease program
directors. It represents more than 3,000 chronic disease practitioners, advocates for preventive
policies and programs, and encourages knowledge-sharing and partnerships for health promotion.
It supports state chronic disease prevention and control by:
Providing educational and training opportunities.
Developing legislative analyses, materials, and policy statements.
Educating policymakers about the importance of funding state chronic disease prevention
and control efforts.
Providing technical assistance and mentoring to state public health practitioners.
Promoting partnerships among public health practitioners, researchers, health care
providers, federal agencies, academia, and private sector entities to pursue common goals.
Advocating for the use of epidemiological approaches in chronic disease service planning
and evaluation.
Its councils address specific chronic diseases, while advancing the professional development of
chronic disease staff with common program interests. Like CSTE, this association provides you, as a
lead chronic disease epidemiologist, professional growth opportunities. For more information, go
to: www.chronicdisease.org
81
NACDD National Mentorship Program in Applied Chronic Disease Epidemiology
In collaboration with CDC, this mentorship program aims to:
Enlarge the pool of trained chronic disease epidemiologists at public health agencies.
Improve the practice of chronic disease epidemiology.
Increase the development and application of epidemiological science in chronic disease
programs and policies.
It pairs experienced mentors with an epidemiologist currently working at a public health agency.
Each mentorship lasts six to 12 months and focuses on targeted competencies and projects that
the mentee chooses.
Evidence Based Public Health Training
With support from the National Association of Chronic Disease Directors and CDC, the Prevention
Research Center in St. Louis offers a four-day course on evidence-based public health, focusing on
many of the core competencies for public health professionals adopted by various accrediting
bodies. The course is taught through lectures, practice exercises, and case studies, and addresses
everything from community assessment to program evaluation.
For more information, go to: http://www.chronicdisease.org/?page=HealthTraining or
http://prcstl.wustl.edu/training/Pages/Evidence-Based-Public-Health-Course.aspx
Association of State and Territorial Dental Directors
This professional membership organization represents oral health program directors and staff in
state and territorial public health agencies. This association advocates for science-based, dental
public health policy and supports members with technical assistance to develop and implement
oral health programs and conferences for the dental public health community.
For more information, go to: http://www.astdd.org/
Centers for Disease Control and Prevention (CDC) Programs
Your organization can apply to be a site host for the following fellows and trainees. Your
organization benefits by gaining an additional staff member prepared to gain hands-on experience.
Alternatively, you can encourage staff to apply to these fellowship and training programs.
State Chronic Disease Epidemiology Assignee Program
The Chronic Disease Epidemiology Assignee Program (formerly the State-Based Epidemiology for
Public Health Program Support (STEPPS)) activity was developed to assist states in building

82
sustainable capacity for chronic disease epidemiology. This program answers the Healthy People
2020 call for an increase in “the proportion of tribal, state, and local public health agencies that
provide or assure comprehensive epidemiology services to support essential public health
services.”
It provides health departments with the direct assistance of a full -time, fully trained chronic
disease epidemiologist for approximately four years. This CDC employee, usually also a doctorate-
level professional trained in applied epidemiology, works in the state public health department.
Currently, states fund the assignee through Direct Assistance (DA) from one or several of their CDC
funded chronic disease grants. Since 1991, this program has provided staff or salary support to
states to build chronic disease epidemiology capacity. .
More information on Direct Assistance can be found at http://www.cdc.gov.
To request more information, contact CDC at: http://www.cdc.gov/cdc-info/requestform.html
Public Health Associate Program
Sponsored by CDC, the Public Health Associate Program is a competitive, two-year, paid training
program for persons with bachelor’s or master’s degree. These associates are assigned to a state,
tribal, local, or territorial public health agency and work on prevention alongside other
professionals across a variety of public health settings.
For more information, go to http://www.cdc.gov/phap/
Epidemic Intelligence Service (EIS)
The EIS is a unique two-year, post-graduate training program of service and on-the-job learning for
health professionals interested in the practice of applied epidemiology.
The EIS is primarily a post-doctoral level program. Most EIS officers hold PhDs or doctoral degrees
in medicine, veterinary science, or dentistry. A small number of non-doctoral applicants with MPHs
(nurses) are also accepted into the program. About 75% of EIS graduates remain in public health at
CDC or in state or local health departments after completing the program. 114 Many become leaders
in public health throughout the world.
The EIS program is modeled after a traditional medical residency program with both classroom
instruction and experiential learning.
114 Epidemic Intelligence Service (EIS): More About the EIS. Centers for Disease Control and Prevention Website. Available at: http://www.cdc.gov/EIS/More.html Updated June 30, 2014. Accessed February 16, 2015.
83
Classroom instruction includes topics such as applied epidemiology, biostatistics, public hea lth
surveillance, scientific writing, working with the media, and emerging public health issues. Each EIS
class begins with a one-month course, starting in July each year in Atlanta.
As part of their on-the-job training, EIS officers are required to complete core activities of learning:
Conduct or participate in a field investigation of a potentially serious public health
problem.
Design, conduct, and interpret an epidemiologic analysis on public health data.
Design, implement, or evaluate a public health surveillance system.
Write and submit a scientific manuscript for a peer-reviewed journal.
Write and submit a report to the Morbidity and Mortality Weekly Report.
Present a paper or poster at the annual EIS Conference.
Give an oral presentation at CDC’s Epidemiology Grand Rounds or at a national or
international scientific meeting.
Respond appropriately to written or oral public health inquiries.
For more information, go to: http://www.cdc.gov/eis/
Epi-Aid
If you have worked in infectious disease epidemiology, you might know about this help. States and
local agencies can request from CDC epidemiological assistance to respond to emergencies,
investigate infectious and environmental disease outbreaks, and quantify impact of diseases. An
EIS officer can provide the Epi-Aid or lead a team that includes. Though Epi-Aids rarely address
chronic disease issues, CDC did respond to the National Parks Service request to assess parks in
terms of the offerings of healthy food and free water within the parks. CDC recruited additional
help from state and local chronic disease epidemiologists and trained them to conduct an on -site,
standardized observational assessment.
To request an Epi-Aid, your state epidemiologist submits a formal, email request to the EIS
Program [email protected]
For more information, go to: http://www.cdc.gov/mmwr/pdf/other/su6004.pdf or
http://www.cdc.gov/nceh/eis/epi_aid.html
Public Health Informatics
The Applied Public Health Informatics Fellowship, Informatics Training in Place Program, and
Health Systems Integration Program are fellowship programs that provide capacity building
84
opportunities at health departments in informatics and epidemiology. They are a collaborative
partnership between the Association of State and Territorial Health Officers, Centers for Disease
Control and Prevention, Council of State and Territorial Epidemiologists, National Association of
County and City Health Officials, and the Public Health Informatics Institute.
Applied Public Health Informatics Fellowship Program provides a fellowship in applied public
health informatics through one year of on-the-job training at a local or state health agency under
the guidance of experienced mentors. For more information, go to http://www.aphif.org/
The Health Systems Integration Program places public health practitioners with a strong
background in epidemiology or informatics at State, Tribal, Local, and Territorial health
departments. Fellows will be involved in activities that address:
1) Community epidemiologic surveillance to support community health needs assessments,
2) The public health interface and use of electronic health records, and
3) Lessons learned from successful public health and primary care professional partnerships.
Informatics Training in Place Program provides one year of on-the-job training program in applied
public health informatics. This program emphasizes meaningful use of electronic health records
and surveillance system improvement. It is for CDC staff as well as state and local health
department staff and the applied training is delivered in the workplace.
For more information, go to: http://www.cdc.gov/ophss/csels/dsepd/strategic-workforce-
activities/
For a central site of CDC fellowship, training resources, and continuing education, bookmark: http://www.cdc.gov/fellowships/CareerInternships.html
CDC has also organized fellowship programs and continuing education for public health
professionals here: http://www.cdc.gov/ophss/csels/dsepd/index.html
Summary
This chapter provides you as a lead epidemiologist the means to be a lifelong learner —whether it
is through a formal or informal mentorship or though mentoring others.

85
Summary
The demands of being the lead chronic disease epidemiologist can be huge but so is the reward.
You will serve as a subject matter expert on multiple topics. You will perform a variety of duties
(especially when short staffed) – as evidenced by the length and broad content of this orientation
manual. Continue to seek a balance between the job challenges and meeting your personal needs.
Focus on the work that only you can do and on capacity building. Reviewing the role of a lead
chronic disease epidemiologist might help you keep that focus.115
Your role is to:
Coordinate and conduct chronic disease surveillance
Disseminate the results regularly and widely in a variety of formats
Provide epidemiology support as reflected in reports, funding applications, and evaluations
Coordinate activities and improve epidemiology capacity across individual chronic disease -
specific programs
Serve as the epidemiology point of contact with CSTE and CDC, if appropriate in your state
Monitor and assess your department’s chronic disease epidemiology capacity and create a
strategic plan to improve the capacity
Review Chapters Listed by Essential Functions of a Chronic Disease Epidemiologist
This manual highlighted the three most common essential public health services that you as a lead
chronic disease epidemiologist will provide.
1. Surveillance
2. Communication
3. Consultation
To help you use this manual as a reference for continuing learning, the fol lowing table shows
which chapters contain information on all the essential public health services (except regulation)
and their related essential function of a chronic disease epidemiologist.
115 CSTE. Chronic Disease Epidemiology Essential Functions – 2004. http://www.cste2.org/webpdfs/Essential%20Functions%20White%20Paper%20Edited%20Final%20092204.pdf Accessed February 7, 2014.

86
Essential Public
Health Services
Chronic Disease Epidemiology Essential Function* Lead chronic disease
epidemiologist
(CSTE Tier 2 mid-level epidemiologist)
Surveillance Evaluate changes in disease, health events, and risk factors associated with public health interventions Ensure surveillance systems meet the key attributes, especially usefulness, data quality, accuracy, and representativeness
Review chapter 4 on systems thinking, chapters 5 on evidence-based public health, chapter 6 on data sources and indicators, chapter 8 on data analysis and dissemination Review chapter 6
Communication Interpret results for action by decision-makers Identify the population at risk and help create appropriate messages for reaching this population Ensure that both decision-makers and the target population have all the relevant information necessary to make decisions and take action
Review chapter 8 on data analysis and dissemination Review chapter 8 Review chapter 3 on integration and collaboration, chapter 4 on the social ecological model and on social determinants of health
Consultation Interpret surveillance and evaluation data for decision making Review, synthesize, and interpret research articles on public health strategies and outcomes Ensure that scientific evidence is appropriately incorporated into program planning and selection of new policies
Review chapter 5 on evidence-based public health and chapter 8 on data analysis and dissemination Review chapter 5 Review chapter 5
Evaluation Design, implement, and coordinate scientifically-sound evaluations of program impacts, including outcomes of health services, health promotion, and disease prevention
Review chapter 5 on evidence-based public health
Investigation Collect and correlated data from disparate sources and collaborate with multiple public health and personal health programs and agencies
Review chapter 4 on social ecological model, chapter 7 on data sources, and chapter 3 on integration
Mobilization Use the data collected through partnerships to inform community members, policy makers and others, enabling them to craft and implement action plans for solving the defined health problems Ensure action plans are based on appropriate interpretation of current data and research-based best practices and include science-based links between interventions and desired outcomes
Review chapter 3 on integration and chapter 5 on evidence-based public health Review chapter 5
*Excerpt from CSTE. Chronic Disease Epidemiology Essential Functions – 2004. http://www.cste2.org/webpdfs/Essential%20Functions%20White%20Paper%20Edited%20Final%20092204.pdf Accessed February 7, 2014.
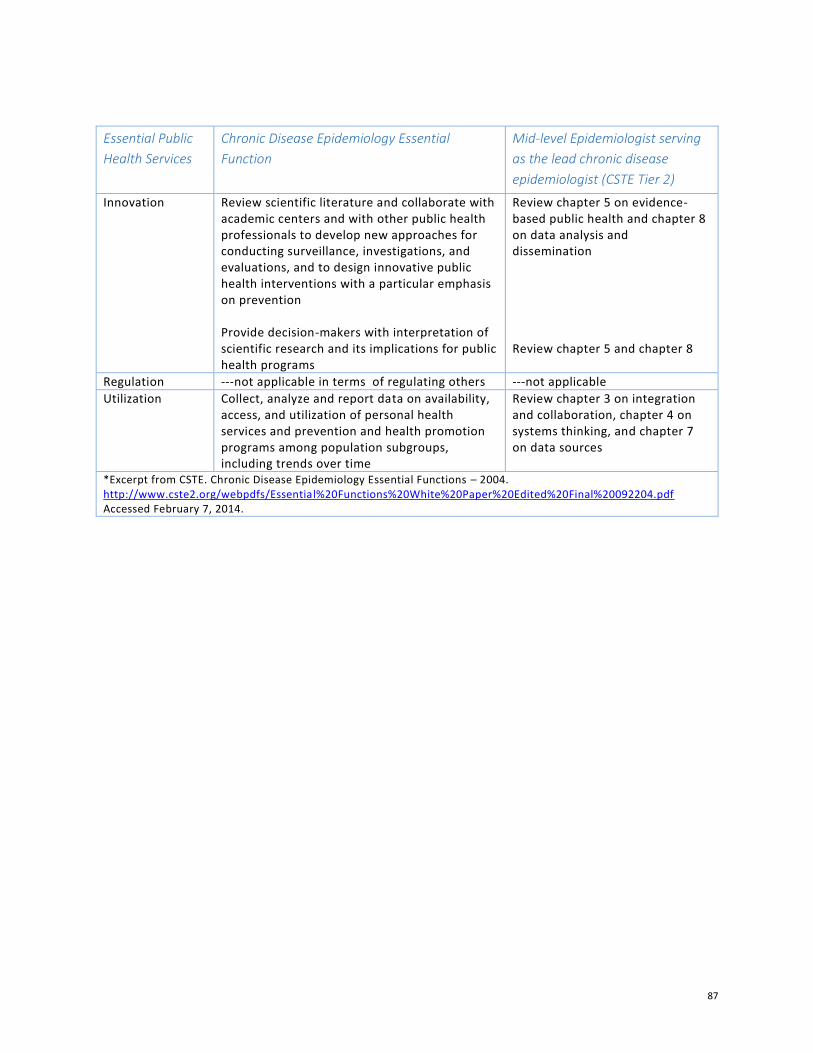
87
Essential Public
Health Services
Chronic Disease Epidemiology Essential
Function
Mid-level Epidemiologist serving
as the lead chronic disease
epidemiologist (CSTE Tier 2)
Innovation Review scientific literature and collaborate with academic centers and with other public health professionals to develop new approaches for conducting surveillance, investigations, and evaluations, and to design innovative public health interventions with a particular emphasis on prevention Provide decision-makers with interpretation of scientific research and its implications for public health programs
Review chapter 5 on evidence-based public health and chapter 8 on data analysis and dissemination Review chapter 5 and chapter 8
Regulation ---not applicable in terms of regulating others ---not applicable
Utilization Collect, analyze and report data on availability, access, and utilization of personal health services and prevention and health promotion programs among population subgroups, including trends over time
Review chapter 3 on integration and collaboration, chapter 4 on systems thinking, and chapter 7 on data sources
*Excerpt from CSTE. Chronic Disease Epidemiology Essential Functions – 2004. http://www.cste2.org/webpdfs/Essential%20Functions%20White%20Paper%20Edited%20Final%20092204.pdf Accessed February 7, 2014.
88
Table of Appendices
Appendix A: Eight Sets of Sample SAS Code to Use with BRFSS Data
Appendix B: More Links to Helpful Resources
Appendix C: Acronyms Commonly Used in Chronic Disease Epidemiology
Appendix D: Position Descriptions and Related Workforce Development Resources

89
Appendix A: Eight Sets of Sample SAS Code to Use with BRFSS Data
The first sample SAS program uses SAS macros and arrays, SAS proc surveyfreq, proc report and
SAS ODS with data from the Behavioral Risk Factor Surveillance Program from 1994-2010 prior to
the change in weighting methodology to raking. It labels and weights the data, then outputs the
crosstab results into a formatted CVS file. It combines answers of “don’t know” and refused into
one missing category. The program selects years 2008-2010 and provides the results as three-year
averages. Because of the use of macros, it is easy to add additional variables to generate crosstabs .
The following SAS program was written by Nisha Kini, Alison Green-Parsons, and
Santosh Nazare. Edits were made by Pratik Pandya and Carrie Daniels.
/*Set libname to reference the folder where you have the dataset*/
Libname BRFSS "M:\2010 Data and Information\";
*Please assign weight variable. Please note that 'weight variable' changes by
your requested
variable. Refer to BRFSS Data Dictionary 'User Information' field to check
'Survey Part/Arm'.
e.g. Part A, Part B or Core etc.;
/*We will be using SAS macros in this program. Specify your byvariable here.
I am trying to look at
prediabetes rates and hence my byvariable is prediabetes. Please use the
appropriate byvariable here*/
%let byvar=NEW_PREdiab;
/*Please use the appropriate
weighting variable here. Please look at your state BRFSS
documentation for defining weighing variables*/
%let weightvar=newfinalwt;
*Please assign strata variable;
%let stratvar=_ststr;
*Please assign cluster variable;
%let clustvar=_psu;
*Please give the path(windows directory) for output files;
%let out=S:\-------\Nisha\Diabetes Surveillance Report\SAS\Prediabetes;
proc format;
/*Use proc format to format your variables. By formatting your variables you
will not have a bunch of 0,1,2s
in your output which can be difficult to read and in this way you will reduce
misinterpretation*/
value _EDUCAGf
1 = "Less than High School"
2 = "High School or GED"
3 = "Some post High School"
4 = "College Graduate"
;
value _INCOMGf
1 = "Less than $15,000"
2 = "$15,000 - $24,999"
3 = "$25,000 - $34,999"
4 = "$35,000 - $49,999"

90
5 = "More than $50,000"
;
value _RACEG2f
1 = "Non-Hispanic White"
2 = "Non-White or Hispanic"
;
value Sexf
1 = "Male"
2 = "Female"
;
value _AGEG_f
1 = "18-24 yrs"
2 = "25-34 yrs"
3 = "35-44 yrs"
4 = "45-54 yrs"
5 = "55-64 yrs"
6 = "65+ yrs"
;
value new_diabetesf
1="yes"
2="no";
value totf
1= "All";
run;
data d;
set BRFSS.mdrive_me9410_s8;
/*The input dataset contains BRFSS data from year 1994-2010. I am only
interested in data from 2008 onwards.
Use the following if in statement to keep only the years that your are
interested in*/
if year in (2008,2009,2010);
*weighting variables*;
/* Please define appropriate weighting variables
In Maine, prediabetes was a core question in 2008 and hence we use the
weighting variable _FINALWT
In 2009 and 2010, however, it was used in only one part of the questionnaire
and hence we use _FINALQ1
So you see, you can analyze years with difference weighting variables for
prediabetes in one program*/
if year = 2008 then new_wt = _FINALWT;
if year = 2009 then new_wt = _FINALQ1;
if year = 2010 then new_wt = _FINALQ1;
/*Since we are combining three years of data, the final weighting variable
needs to be divided by three*/;
newfinalwt=new_wt/3;
newyear = year;
/*creating a dummy variable for total*/
tot=1;
format tot totf.;
run;
***ARRAY HERE*****;
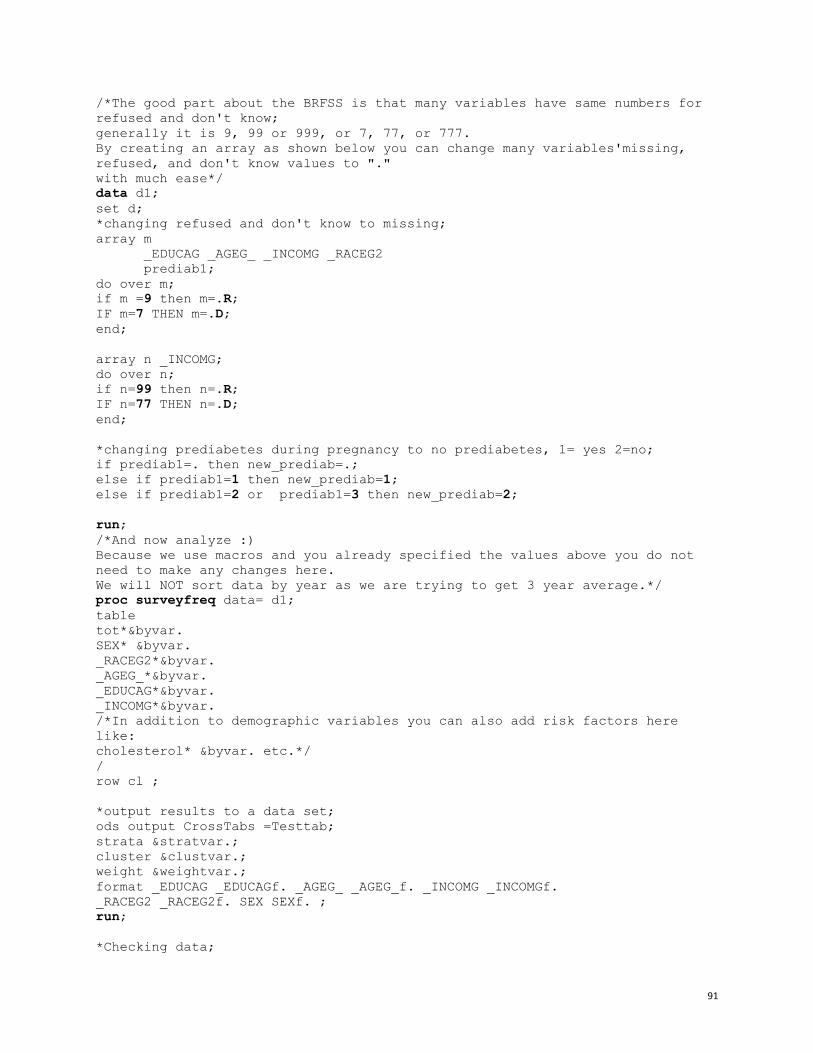
91
/*The good part about the BRFSS is that many variables have same numbers for
refused and don't know;
generally it is 9, 99 or 999, or 7, 77, or 777.
By creating an array as shown below you can change many variables'missing,
refused, and don't know values to "."
with much ease*/
data d1;
set d;
*changing refused and don't know to missing;
array m
_EDUCAG _AGEG_ _INCOMG _RACEG2
prediab1;
do over m;
if m =9 then m=.R;
IF m=7 THEN m=.D;
end;
array n _INCOMG;
do over n;
if n=99 then n=.R;
IF n=77 THEN n=.D;
end;
*changing prediabetes during pregnancy to no prediabetes, 1= yes 2=no;
if prediab1=. then new_prediab=.;
else if prediab1=1 then new_prediab=1;
else if prediab1=2 or prediab1=3 then new_prediab=2;
run;
/*And now analyze :)
Because we use macros and you already specified the values above you do not
need to make any changes here.
We will NOT sort data by year as we are trying to get 3 year average.*/
proc surveyfreq data= d1;
table
tot*&byvar.
SEX* &byvar.
_RACEG2*&byvar.
_AGEG_*&byvar.
_EDUCAG*&byvar.
_INCOMG*&byvar.
/*In addition to demographic variables you can also add risk factors here
like:
cholesterol* &byvar. etc.*/
/
row cl ;
*output results to a data set;
ods output CrossTabs =Testtab;
strata &stratvar.;
cluster &clustvar.;
weight &weightvar.;
format _EDUCAG _EDUCAGf. _AGEG_ _AGEG_f. _INCOMG _INCOMGf.
_RACEG2 _RACEG2f. SEX SEXf. ;
run;
*Checking data;
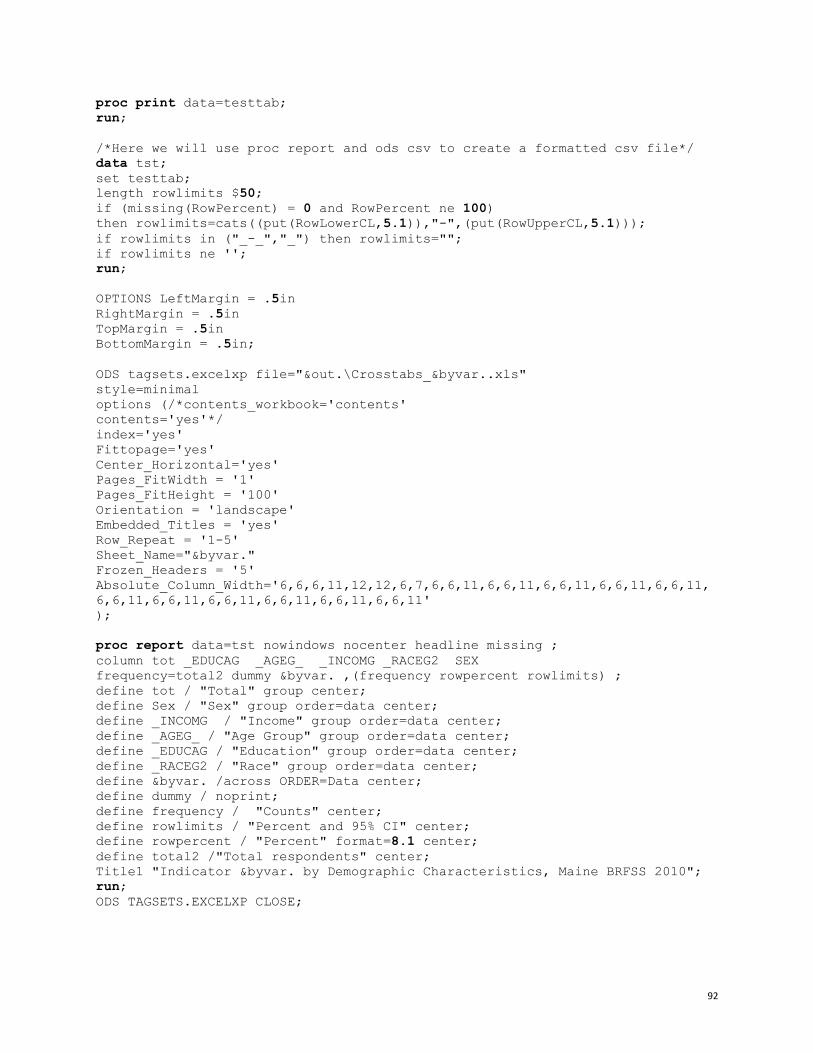
92
proc print data=testtab;
run;
/*Here we will use proc report and ods csv to create a formatted csv file*/
data tst;
set testtab;
length rowlimits $50;
if (missing(RowPercent) = 0 and RowPercent ne 100)
then rowlimits=cats((put(RowLowerCL,5.1)),"-",(put(RowUpperCL,5.1)));
if rowlimits in ("_-_","_") then rowlimits="";
if rowlimits ne '';
run;
OPTIONS LeftMargin = .5in
RightMargin = .5in
TopMargin = .5in
BottomMargin = .5in;
ODS tagsets.excelxp file="&out.\Crosstabs_&byvar..xls"
style=minimal
options (/*contents_workbook='contents'
contents='yes'*/
index='yes'
Fittopage='yes'
Center_Horizontal='yes'
Pages_FitWidth = '1'
Pages_FitHeight = '100'
Orientation = 'landscape'
Embedded_Titles = 'yes'
Row_Repeat = '1-5'
Sheet_Name="&byvar."
Frozen_Headers = '5'
Absolute_Column_Width='6,6,6,11,12,12,6,7,6,6,11,6,6,11,6,6,11,6,6,11,6,6,11,
6,6,11,6,6,11,6,6,11,6,6,11,6,6,11,6,6,11'
);
proc report data=tst nowindows nocenter headline missing ;
column tot _EDUCAG _AGEG_ _INCOMG _RACEG2 SEX
frequency=total2 dummy &byvar. ,(frequency rowpercent rowlimits) ;
define tot / "Total" group center;
define Sex / "Sex" group order=data center;
define _INCOMG / "Income" group order=data center;
define _AGEG_ / "Age Group" group order=data center;
define _EDUCAG / "Education" group order=data center;
define _RACEG2 / "Race" group order=data center;
define &byvar. /across ORDER=Data center;
define dummy / noprint;
define frequency / "Counts" center;
define rowlimits / "Percent and 95% CI" center;
define rowpercent / "Percent" format=8.1 center;
define total2 /"Total respondents" center;
Title1 "Indicator &byvar. by Demographic Characteristics, Maine BRFSS 2010";
run;
ODS TAGSETS.EXCELXP CLOSE;

93
This second example calculates prevalence rates on selected variables by year and sex, using data from the Behavioral Risk Factor Surveillance System (BRFSS) for 1994 through 2010.
The following SAS program was written by Nisha Kini, Alison Green-Parsons, and
Santosh Nazare. Edits were made by Pratik Pandya and Carrie Daniels.
/*Set libname to reference the folder where you have the dataset*/
libname BRFSS "M:\2010 Data and Information\";
/*We will be using SAS macros in this program. Specify your byvariable here.
I am trying to look at
prediabetes rates and hence my byvariable is prediabetes. Please use the
appropriate byvariable here*/
%let byvar=new_prediab;
/*We use survey data and SAS proc survey procedures to calculate rates.
Please use the appropriate
weighing variable here. Weighing variable will depend on whether the question
is a core questions
and whether or not your state uses a split survey sample. Please look at your
state BRFSS
documentation for defining weighing variables*/
%let weightvar=newfinalwt;
*Please assign strata variable (same instructions as weighing variable);
%let stratvar=_ststr;
*Please assign cluster variable (same instructions as weighing variable);
%let clustvar=_psu;
*Please give the path(windows directory) for output files;
%let out=S:\-------\Nisha\Diabetes Surveillance Report\SAS\Prediabetes\;
data MEBRFSS;
set BRFSS.me9410_s8;
/* We are using the multiyear BRFSS dataset here which is huge and take a
long time to process.
Solution: Use "keep" statement to keep only the variables that you are
interested in.
Note: Do not forget to include the year, (part if you have split
sample,)weight,
strata and cluster variables in the keep statement. The prediabetes variable
for all years has been named
PREDIAB in this dataset.*/
keep SEX PREDIAB
year _finalwt _finalq1 newfinalwt _psu _ststr;
/*The input dataset contains BRFSS data from year 1994-2010. I am only
interested in data from 2008 onwards.
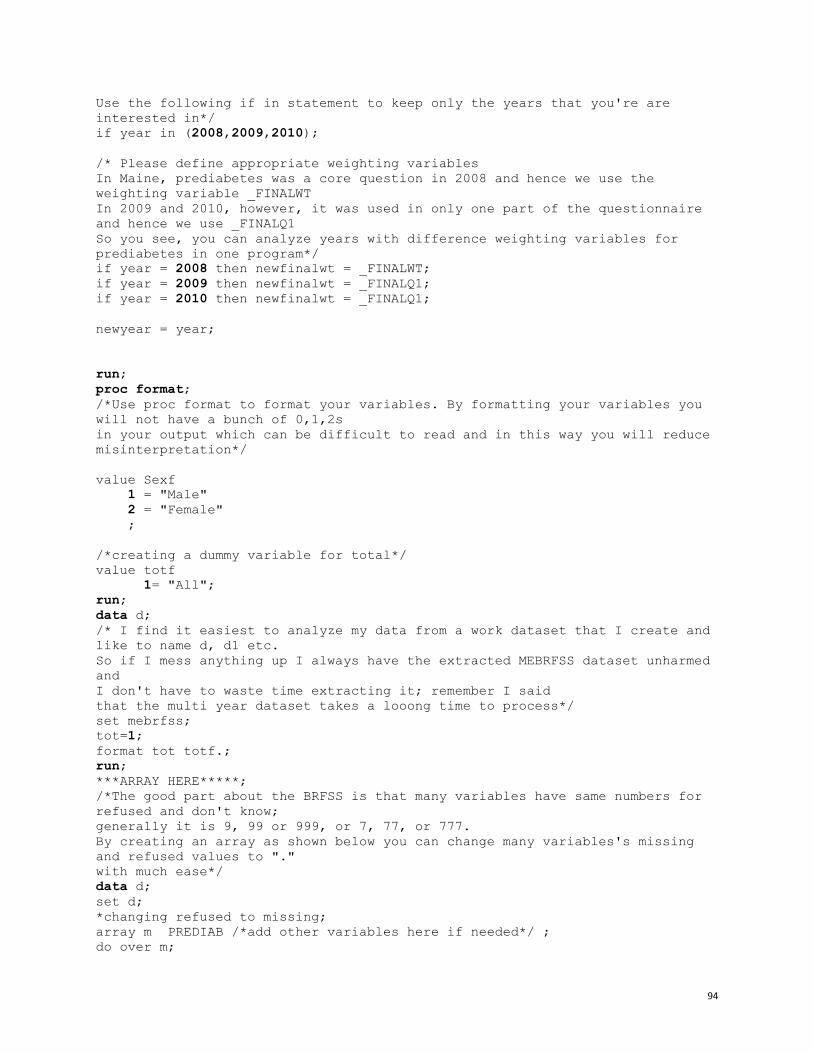
94
Use the following if in statement to keep only the years that you're are
interested in*/
if year in (2008,2009,2010);
/* Please define appropriate weighting variables
In Maine, prediabetes was a core question in 2008 and hence we use the
weighting variable _FINALWT
In 2009 and 2010, however, it was used in only one part of the questionnaire
and hence we use _FINALQ1
So you see, you can analyze years with difference weighting variables for
prediabetes in one program*/
if year = 2008 then newfinalwt = _FINALWT;
if year = 2009 then newfinalwt = _FINALQ1;
if year = 2010 then newfinalwt = _FINALQ1;
newyear = year;
run;
proc format;
/*Use proc format to format your variables. By formatting your variables you
will not have a bunch of 0,1,2s
in your output which can be difficult to read and in this way you will reduce
misinterpretation*/
value Sexf
1 = "Male"
2 = "Female"
;
/*creating a dummy variable for total*/
value totf
1= "All";
run;
data d;
/* I find it easiest to analyze my data from a work dataset that I create and
like to name d, d1 etc.
So if I mess anything up I always have the extracted MEBRFSS dataset unharmed
and
I don't have to waste time extracting it; remember I said
that the multi year dataset takes a looong time to process*/
set mebrfss;
tot=1;
format tot totf.;
run;
***ARRAY HERE*****;
/*The good part about the BRFSS is that many variables have same numbers for
refused and don't know;
generally it is 9, 99 or 999, or 7, 77, or 777.
By creating an array as shown below you can change many variables's missing
and refused values to "."
with much ease*/
data d;
set d;
*changing refused to missing;
array m PREDIAB /*add other variables here if needed*/ ;
do over m;
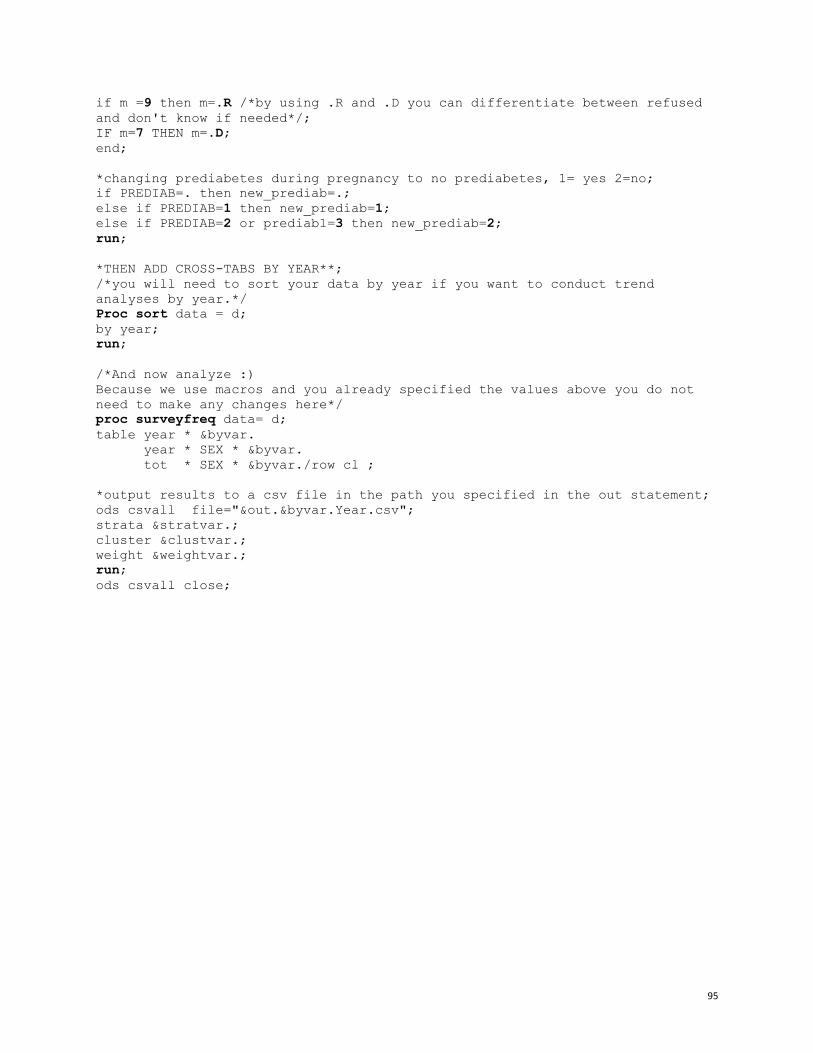
95
if m =9 then m=.R /*by using .R and .D you can differentiate between refused
and don't know if needed*/;
IF m=7 THEN m=.D;
end;
*changing prediabetes during pregnancy to no prediabetes, 1= yes 2=no;
if PREDIAB=. then new_prediab=.;
else if PREDIAB=1 then new_prediab=1;
else if PREDIAB=2 or prediab1=3 then new_prediab=2;
run;
*THEN ADD CROSS-TABS BY YEAR**;
/*you will need to sort your data by year if you want to conduct trend
analyses by year.*/
Proc sort data = d;
by year;
run;
/*And now analyze :)
Because we use macros and you already specified the values above you do not
need to make any changes here*/
proc surveyfreq data= d;
table year * &byvar.
year * SEX * &byvar.
tot * SEX * &byvar./row cl ;
*output results to a csv file in the path you specified in the out statement;
ods csvall file="&out.&byvar.Year.csv";
strata &stratvar.;
cluster &clustvar.;
weight &weightvar.;
run;
ods csvall close;
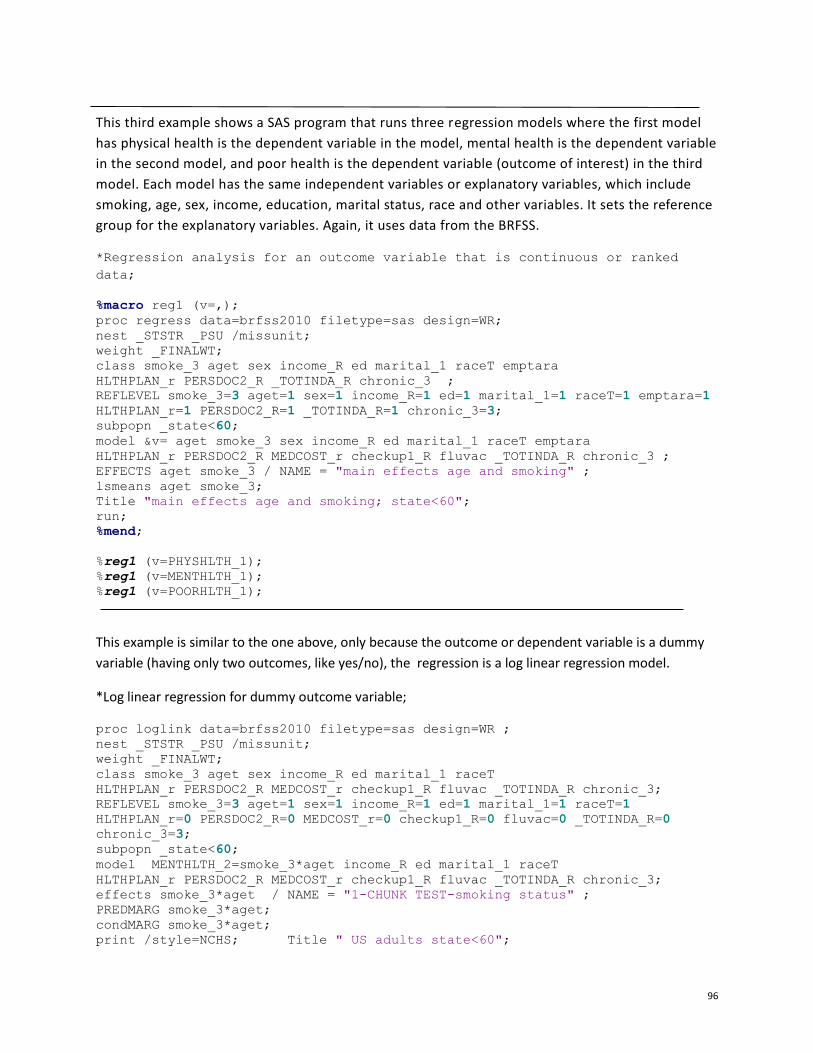
96
This third example shows a SAS program that runs three regression models where the first model
has physical health is the dependent variable in the model, mental health is the dependent variable
in the second model, and poor health is the dependent variable (outcome of interest) in the third
model. Each model has the same independent variables or explanatory variables, which include
smoking, age, sex, income, education, marital status, race and other variables. It sets the reference
group for the explanatory variables. Again, it uses data from the BRFSS.
*Regression analysis for an outcome variable that is continuous or ranked
data;
%macro reg1 (v=,);
proc regress data=brfss2010 filetype=sas design=WR;
nest _STSTR _PSU /missunit;
weight _FINALWT;
class smoke_3 aget sex income_R ed marital_1 raceT emptara
HLTHPLAN_r PERSDOC2_R _TOTINDA_R chronic_3 ;
REFLEVEL smoke_3=3 aget=1 sex=1 income_R=1 ed=1 marital_1=1 raceT=1 emptara=1
HLTHPLAN_r=1 PERSDOC2_R=1 _TOTINDA_R=1 chronic_3=3;
subpopn _state<60;
model &v= aget smoke_3 sex income_R ed marital_1 raceT emptara
HLTHPLAN_r PERSDOC2_R MEDCOST_r checkup1_R fluvac _TOTINDA_R chronic_3 ;
EFFECTS aget smoke_3 / NAME = "main effects age and smoking" ;
lsmeans aget smoke_3;
Title "main effects age and smoking; state<60";
run;
%mend;
%reg1 (v=PHYSHLTH_1);
%reg1 (v=MENTHLTH_1);
%reg1 (v=POORHLTH_1);
This example is similar to the one above, only because the outcome or dependent variable is a dummy
variable (having only two outcomes, like yes/no), the regression is a log linear regression model.
*Log linear regression for dummy outcome variable;
proc loglink data=brfss2010 filetype=sas design=WR ;
nest _STSTR _PSU /missunit;
weight _FINALWT;
class smoke_3 aget sex income_R ed marital_1 raceT
HLTHPLAN_r PERSDOC2_R MEDCOST_r checkup1_R fluvac _TOTINDA_R chronic_3;
REFLEVEL smoke_3=3 aget=1 sex=1 income_R=1 ed=1 marital_1=1 raceT=1
HLTHPLAN_r=0 PERSDOC2_R=0 MEDCOST_r=0 checkup1_R=0 fluvac=0 _TOTINDA_R=0
chronic_3=3;
subpopn _state<60;
model MENTHLTH_2=smoke_3*aget income_R ed marital_1 raceT
HLTHPLAN_r PERSDOC2_R MEDCOST_r checkup1_R fluvac _TOTINDA_R chronic_3;
effects smoke_3*aget / NAME = "1-CHUNK TEST-smoking status" ;
PREDMARG smoke_3*aget;
condMARG smoke_3*aget;
print /style=NCHS; Title " US adults state<60";
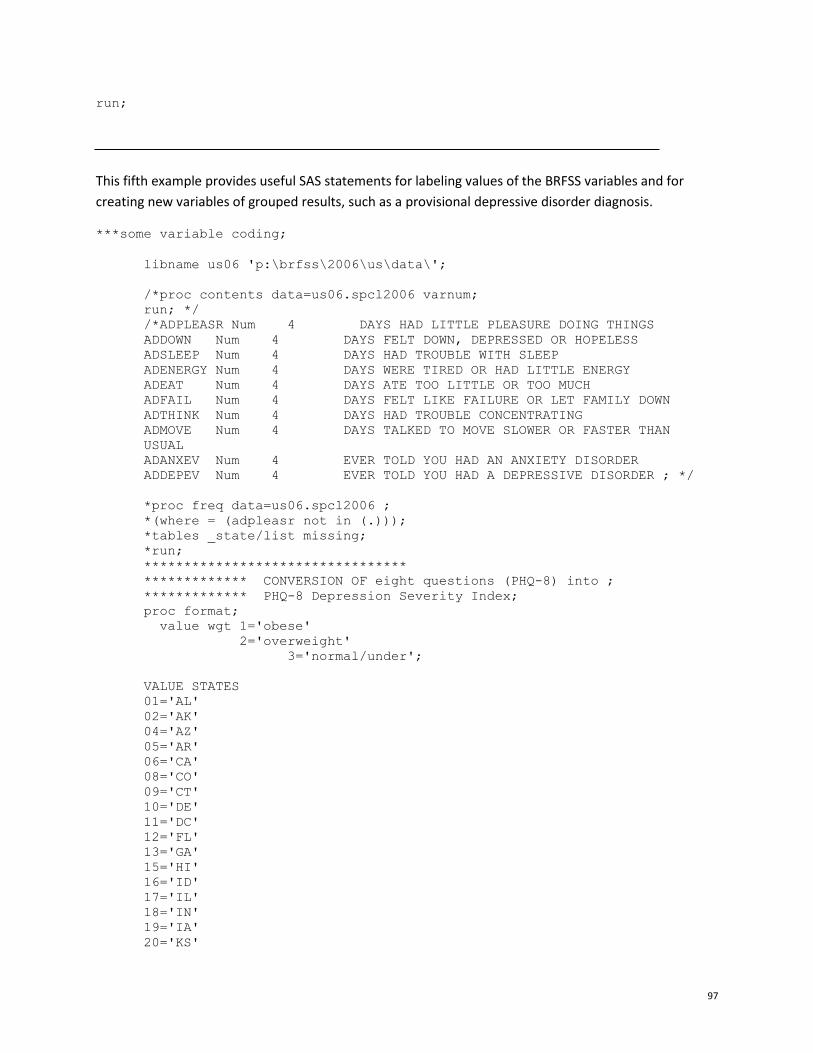
97
run;
This fifth example provides useful SAS statements for labeling values of the BRFSS variables and for
creating new variables of grouped results, such as a provisional depressive disorder diagnosis.
***some variable coding;
libname us06 'p:\brfss\2006\us\data\';
/*proc contents data=us06.spcl2006 varnum;
run; */
/*ADPLEASR Num 4 DAYS HAD LITTLE PLEASURE DOING THINGS
ADDOWN Num 4 DAYS FELT DOWN, DEPRESSED OR HOPELESS
ADSLEEP Num 4 DAYS HAD TROUBLE WITH SLEEP
ADENERGY Num 4 DAYS WERE TIRED OR HAD LITTLE ENERGY
ADEAT Num 4 DAYS ATE TOO LITTLE OR TOO MUCH
ADFAIL Num 4 DAYS FELT LIKE FAILURE OR LET FAMILY DOWN
ADTHINK Num 4 DAYS HAD TROUBLE CONCENTRATING
ADMOVE Num 4 DAYS TALKED TO MOVE SLOWER OR FASTER THAN
USUAL
ADANXEV Num 4 EVER TOLD YOU HAD AN ANXIETY DISORDER
ADDEPEV Num 4 EVER TOLD YOU HAD A DEPRESSIVE DISORDER ; */
*proc freq data=us06.spcl2006 ;
*(where = (adpleasr not in (.)));
*tables _state/list missing;
*run;
*********************************
************* CONVERSION OF eight questions (PHQ-8) into ;
************* PHQ-8 Depression Severity Index;
proc format;
value wgt 1='obese'
2='overweight'
3='normal/under';
VALUE STATES
01='AL'
02='AK'
04='AZ'
05='AR'
06='CA'
08='CO'
09='CT'
10='DE'
11='DC'
12='FL'
13='GA'
15='HI'
16='ID'
17='IL'
18='IN'
19='IA'
20='KS'
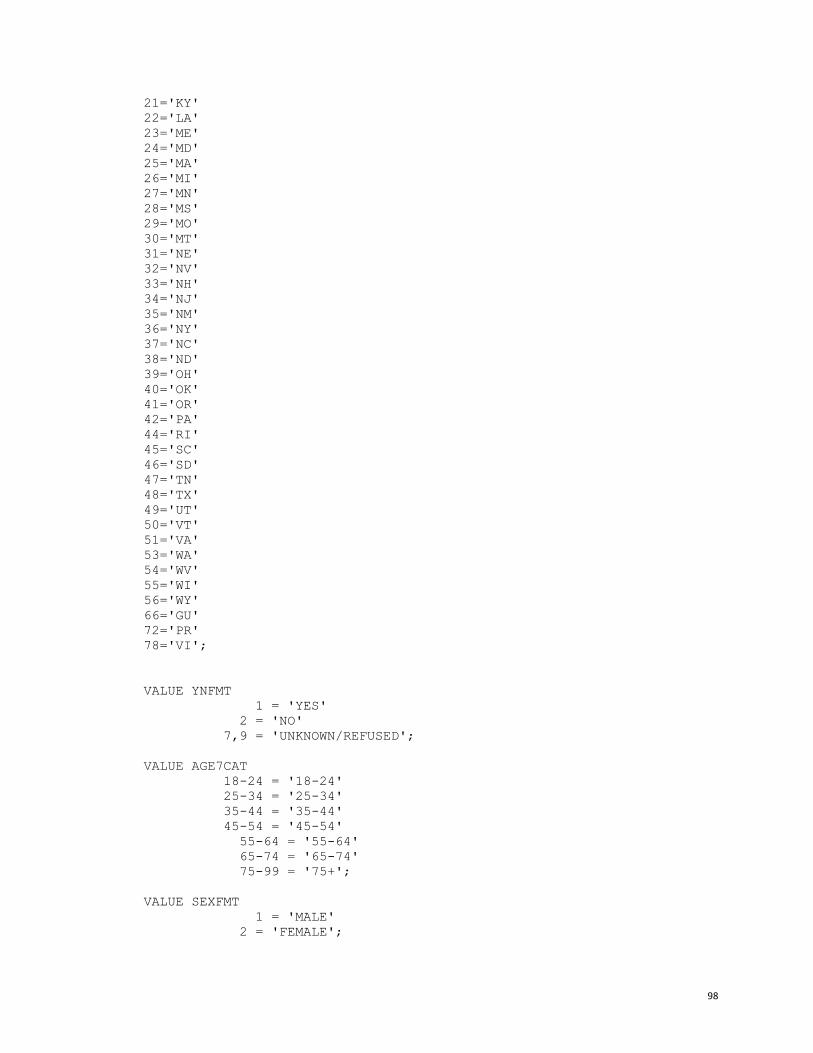
98
21='KY'
22='LA'
23='ME'
24='MD'
25='MA'
26='MI'
27='MN'
28='MS'
29='MO'
30='MT'
31='NE'
32='NV'
33='NH'
34='NJ'
35='NM'
36='NY'
37='NC'
38='ND'
39='OH'
40='OK'
41='OR'
42='PA'
44='RI'
45='SC'
46='SD'
47='TN'
48='TX'
49='UT'
50='VT'
51='VA'
53='WA'
54='WV'
55='WI'
56='WY'
66='GU'
72='PR'
78='VI';
VALUE YNFMT
1 = 'YES'
2 = 'NO'
7,9 = 'UNKNOWN/REFUSED';
VALUE AGE7CAT
18-24 = '18-24'
25-34 = '25-34'
35-44 = '35-44'
45-54 = '45-54'
55-64 = '55-64'
65-74 = '65-74'
75-99 = '75+';
VALUE SEXFMT
1 = 'MALE'
2 = 'FEMALE';
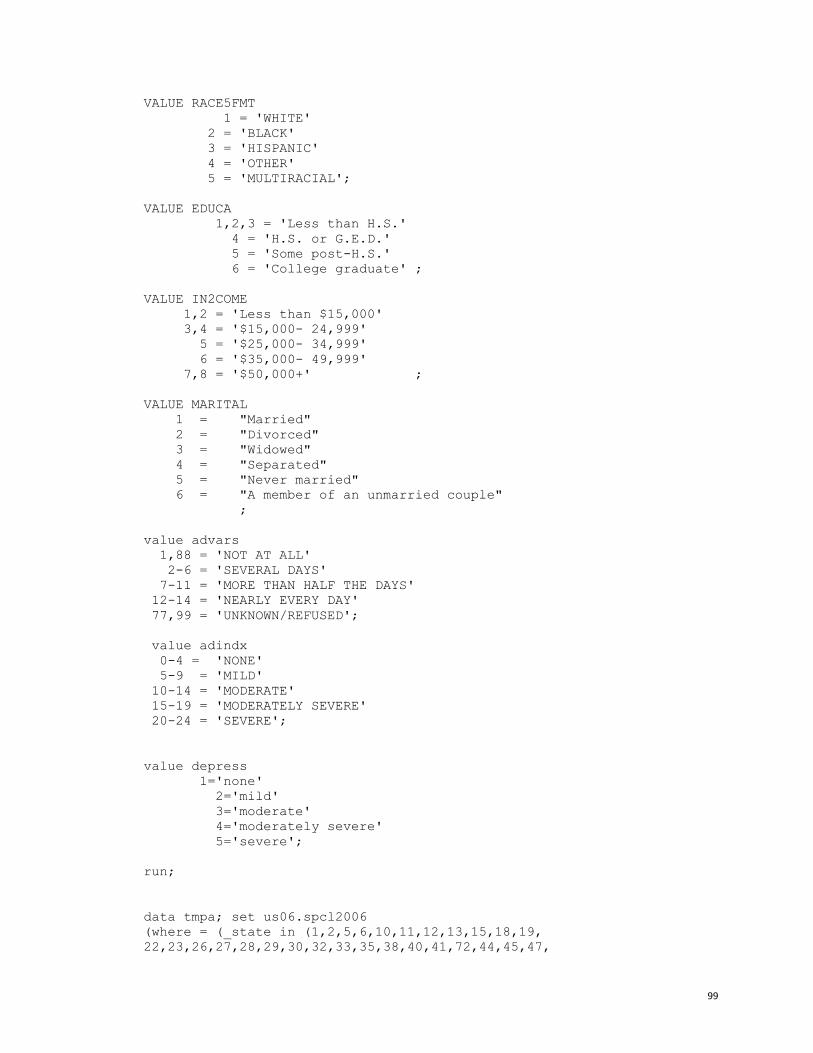
99
VALUE RACE5FMT
1 = 'WHITE'
2 = 'BLACK'
3 = 'HISPANIC'
4 = 'OTHER'
5 = 'MULTIRACIAL';
VALUE EDUCA
1,2,3 = 'Less than H.S.'
4 = 'H.S. or G.E.D.'
5 = 'Some post-H.S.'
6 = 'College graduate' ;
VALUE IN2COME
1,2 = 'Less than $15,000'
3,4 = '$15,000- 24,999'
5 = '$25,000- 34,999'
6 = '$35,000- 49,999'
7,8 = '$50,000+' ;
VALUE MARITAL
1 = "Married"
2 = "Divorced"
3 = "Widowed"
4 = "Separated"
5 = "Never married"
6 = "A member of an unmarried couple"
;
value advars
1,88 = 'NOT AT ALL'
2-6 = 'SEVERAL DAYS'
7-11 = 'MORE THAN HALF THE DAYS'
12-14 = 'NEARLY EVERY DAY'
77,99 = 'UNKNOWN/REFUSED';
value adindx
0-4 = 'NONE'
5-9 = 'MILD'
10-14 = 'MODERATE'
15-19 = 'MODERATELY SEVERE'
20-24 = 'SEVERE';
value depress
1='none'
2='mild'
3='moderate'
4='moderately severe'
5='severe';
run;
data tmpa; set us06.spcl2006
(where = (_state in (1,2,5,6,10,11,12,13,15,18,19,
22,23,26,27,28,29,30,32,33,35,38,40,41,72,44,45,47,

100
48,49,50,78,51,54,55,56)));
finwgt=_finalwt;
run;
data tmpb; set us06.spcl06v1 (where=(_state in (9,24,31,53)));
if qstver=1;
finwgt=_finalq1;
run;
data tmpc; set us06.spcl06v2 (where=(_state=20));
if qstver=2;
finwgt=_finalq2;
run;
data total;
set tmpa tmpb tmpc;
if finwgt ne .;
run;
%include '\\cdc\private\L304\fda9\brfss\phq\format06.sas';
proc format;
value depress
1='none'
2='mild'
3='moderate'
4='moderately severe'
5='severe';
value majdep 1='major depression'
2='minor depression'
3='no depression';
value depsub 1='severity score >=10'
2='severity score <10';
value smoke 1='smoker'
2='non-smoker';
value genhltht 1='fair/poor'
2='excellent, very good, good';
value support 1='usually/always'
2='sometimes'
3='rarely/never';
value yesno 1='yes'
2='no';
value racegrt 1='White non-Hispanic'
2='Black non-Hispanic'
3='Hispanic'
4='other non-hispanic';
value sex 1='male'
2='female';;
data tmp1; set total;
stname=fipnamel(_State);
*%include '\\cdc\private\L304\fda9\brfss\phq\formas06_r.sas';
/*DAYS HAD LITTLE PLEASURE DOING THINGS*/
IF ADPLEASR in (1,88) THEN AD1 = 0;
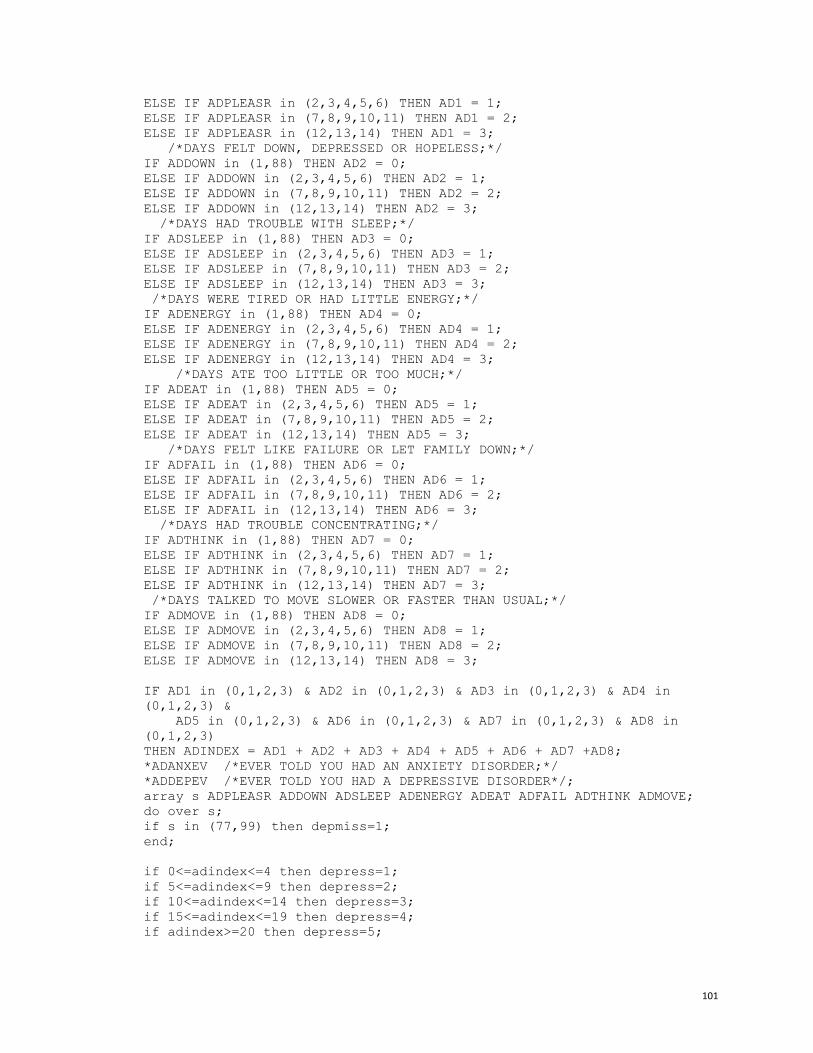
101
ELSE IF ADPLEASR in (2,3,4,5,6) THEN AD1 = 1;
ELSE IF ADPLEASR in (7,8,9,10,11) THEN AD1 = 2;
ELSE IF ADPLEASR in (12,13,14) THEN AD1 = 3;
/*DAYS FELT DOWN, DEPRESSED OR HOPELESS;*/
IF ADDOWN in (1,88) THEN AD2 = 0;
ELSE IF ADDOWN in (2,3,4,5,6) THEN AD2 = 1;
ELSE IF ADDOWN in (7,8,9,10,11) THEN AD2 = 2;
ELSE IF ADDOWN in (12,13,14) THEN AD2 = 3;
/*DAYS HAD TROUBLE WITH SLEEP;*/
IF ADSLEEP in (1,88) THEN AD3 = 0;
ELSE IF ADSLEEP in (2,3,4,5,6) THEN AD3 = 1;
ELSE IF ADSLEEP in (7,8,9,10,11) THEN AD3 = 2;
ELSE IF ADSLEEP in (12,13,14) THEN AD3 = 3;
/*DAYS WERE TIRED OR HAD LITTLE ENERGY;*/
IF ADENERGY in (1,88) THEN AD4 = 0;
ELSE IF ADENERGY in (2,3,4,5,6) THEN AD4 = 1;
ELSE IF ADENERGY in (7,8,9,10,11) THEN AD4 = 2;
ELSE IF ADENERGY in (12,13,14) THEN AD4 = 3;
/*DAYS ATE TOO LITTLE OR TOO MUCH;*/
IF ADEAT in (1,88) THEN AD5 = 0;
ELSE IF ADEAT in (2,3,4,5,6) THEN AD5 = 1;
ELSE IF ADEAT in (7,8,9,10,11) THEN AD5 = 2;
ELSE IF ADEAT in (12,13,14) THEN AD5 = 3;
/*DAYS FELT LIKE FAILURE OR LET FAMILY DOWN;*/
IF ADFAIL in (1,88) THEN AD6 = 0;
ELSE IF ADFAIL in (2,3,4,5,6) THEN AD6 = 1;
ELSE IF ADFAIL in (7,8,9,10,11) THEN AD6 = 2;
ELSE IF ADFAIL in (12,13,14) THEN AD6 = 3;
/*DAYS HAD TROUBLE CONCENTRATING;*/
IF ADTHINK in (1,88) THEN AD7 = 0;
ELSE IF ADTHINK in (2,3,4,5,6) THEN AD7 = 1;
ELSE IF ADTHINK in (7,8,9,10,11) THEN AD7 = 2;
ELSE IF ADTHINK in (12,13,14) THEN AD7 = 3;
/*DAYS TALKED TO MOVE SLOWER OR FASTER THAN USUAL;*/
IF ADMOVE in (1,88) THEN AD8 = 0;
ELSE IF ADMOVE in (2,3,4,5,6) THEN AD8 = 1;
ELSE IF ADMOVE in (7,8,9,10,11) THEN AD8 = 2;
ELSE IF ADMOVE in (12,13,14) THEN AD8 = 3;
IF AD1 in (0,1,2,3) & AD2 in (0,1,2,3) & AD3 in (0,1,2,3) & AD4 in
(0,1,2,3) &
AD5 in (0,1,2,3) & AD6 in (0,1,2,3) & AD7 in (0,1,2,3) & AD8 in
(0,1,2,3)
THEN ADINDEX = AD1 + AD2 + AD3 + AD4 + AD5 + AD6 + AD7 +AD8;
*ADANXEV /*EVER TOLD YOU HAD AN ANXIETY DISORDER;*/
*ADDEPEV /*EVER TOLD YOU HAD A DEPRESSIVE DISORDER*/;
array s ADPLEASR ADDOWN ADSLEEP ADENERGY ADEAT ADFAIL ADTHINK ADMOVE;
do over s;
if s in (77,99) then depmiss=1;
end;
if 0<=adindex<=4 then depress=1;
if 5<=adindex<=9 then depress=2;
if 10<=adindex<=14 then depress=3;
if 15<=adindex<=19 then depress=4;
if adindex>=20 then depress=5;
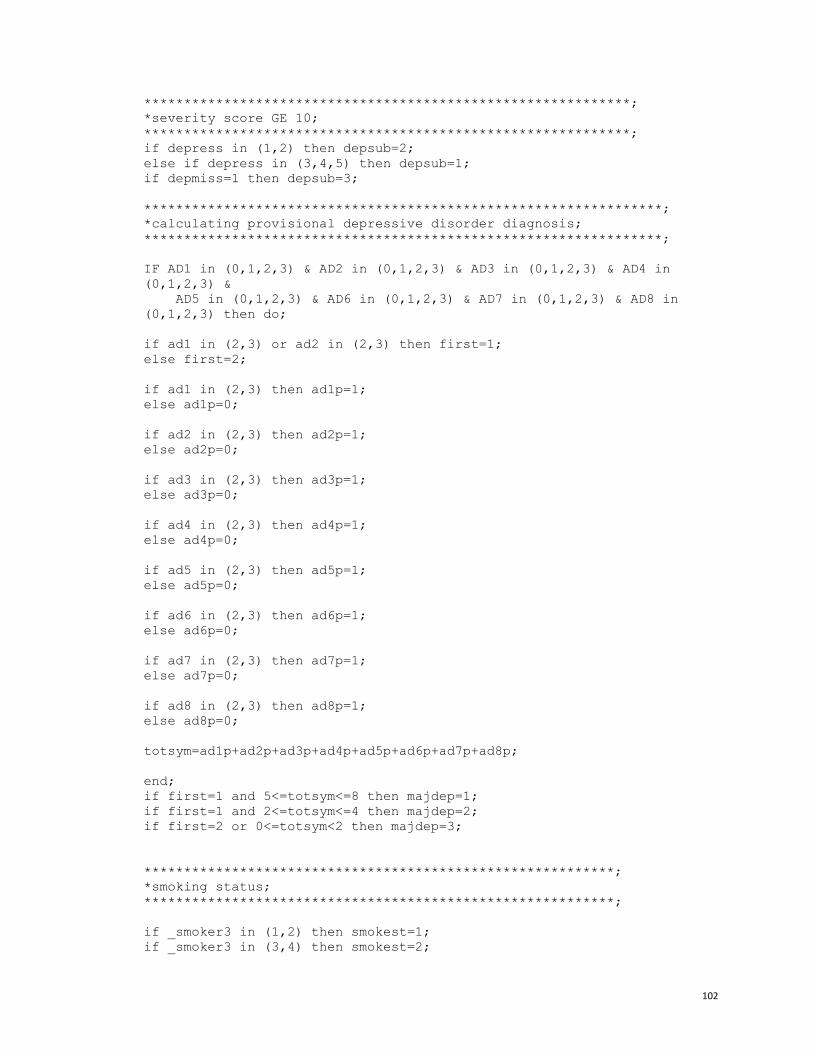
102
*************************************************************;
*severity score GE 10;
*************************************************************;
if depress in (1,2) then depsub=2;
else if depress in (3,4,5) then depsub=1;
if depmiss=1 then depsub=3;
*****************************************************************;
*calculating provisional depressive disorder diagnosis;
*****************************************************************;
IF AD1 in (0,1,2,3) & AD2 in (0,1,2,3) & AD3 in (0,1,2,3) & AD4 in
(0,1,2,3) &
AD5 in (0,1,2,3) & AD6 in (0,1,2,3) & AD7 in (0,1,2,3) & AD8 in
(0,1,2,3) then do;
if ad1 in (2,3) or ad2 in (2,3) then first=1;
else first=2;
if ad1 in (2,3) then ad1p=1;
else ad1p=0;
if ad2 in (2,3) then ad2p=1;
else ad2p=0;
if ad3 in (2,3) then ad3p=1;
else ad3p=0;
if ad4 in (2,3) then ad4p=1;
else ad4p=0;
if ad5 in (2,3) then ad5p=1;
else ad5p=0;
if ad6 in (2,3) then ad6p=1;
else ad6p=0;
if ad7 in (2,3) then ad7p=1;
else ad7p=0;
if ad8 in (2,3) then ad8p=1;
else ad8p=0;
totsym=ad1p+ad2p+ad3p+ad4p+ad5p+ad6p+ad7p+ad8p;
end;
if first=1 and 5<=totsym<=8 then majdep=1;
if first=1 and 2<=totsym<=4 then majdep=2;
if first=2 or 0<=totsym<2 then majdep=3;
***********************************************************;
*smoking status;
***********************************************************;
if _smoker3 in (1,2) then smokest=1;
if _smoker3 in (3,4) then smokest=2;
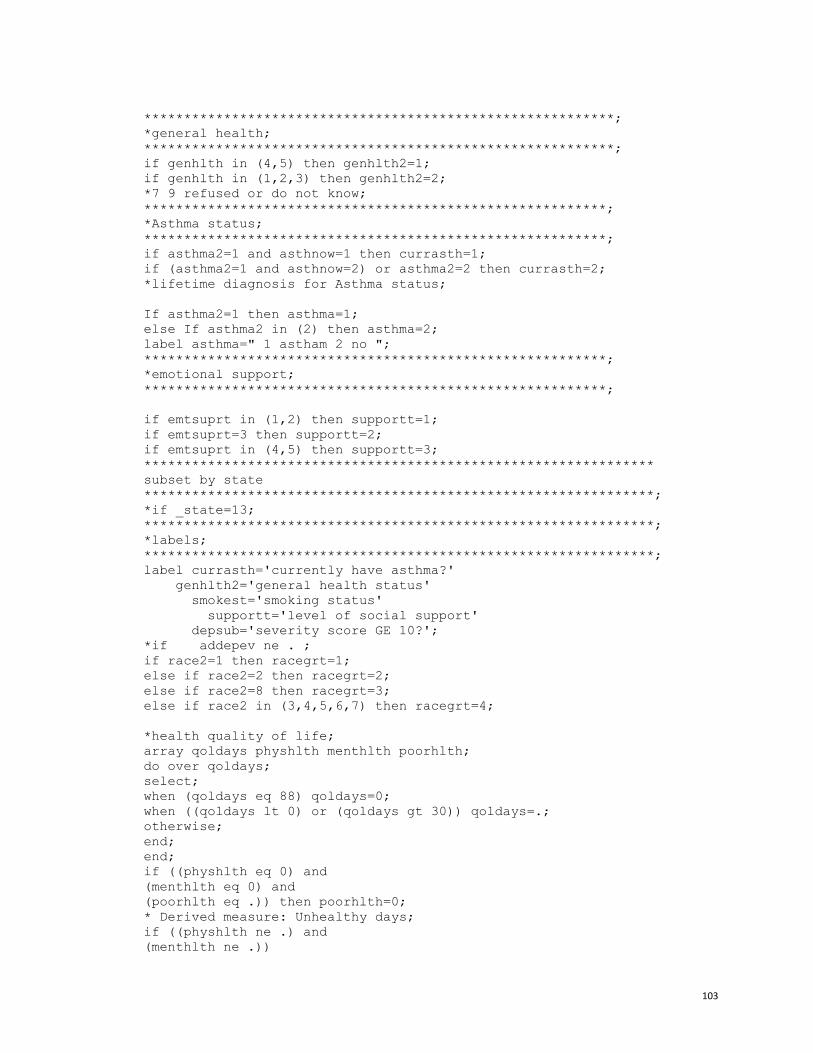
103
***********************************************************;
*general health;
***********************************************************;
if genhlth in (4,5) then genhlth2=1;
if genhlth in (1,2,3) then genhlth2=2;
*7 9 refused or do not know;
**********************************************************;
*Asthma status;
**********************************************************;
if asthma2=1 and asthnow=1 then currasth=1;
if (asthma2=1 and asthnow=2) or asthma2=2 then currasth=2;
*lifetime diagnosis for Asthma status;
If asthma2=1 then asthma=1;
else If asthma2 in (2) then asthma=2;
label asthma=" 1 astham 2 no ";
**********************************************************;
*emotional support;
**********************************************************;
if emtsuprt in (1,2) then supportt=1;
if emtsuprt=3 then supportt=2;
if emtsuprt in (4,5) then supportt=3;
****************************************************************
subset by state
****************************************************************;
*if _state=13;
****************************************************************;
*labels;
****************************************************************;
label currasth='currently have asthma?'
genhlth2='general health status'
smokest='smoking status'
supportt='level of social support'
depsub='severity score GE 10?';
*if addepev ne . ;
if race2=1 then racegrt=1;
else if race2=2 then racegrt=2;
else if race2=8 then racegrt=3;
else if race2 in (3,4,5,6,7) then racegrt=4;
*health quality of life;
array qoldays physhlth menthlth poorhlth;
do over qoldays;
select;
when (qoldays eq 88) qoldays=0;
when ((qoldays lt 0) or (qoldays gt 30)) qoldays=.;
otherwise;
end;
end;
if ((physhlth eq 0) and
(menthlth eq 0) and
(poorhlth eq .)) then poorhlth=0;
* Derived measure: Unhealthy days;
if ((physhlth ne .) and
(menthlth ne .))

104
then unhealth=min(30,sum(physhlth,menthlth));
else unhealth=.;
label unhealth="# Unhealthy days in past 30 days";
* Derived measure: Percent with frequent mental distress;
select;
when (14 <= menthlth <= 30) frqmentd=100;
when ( 0 <= menthlth <= 13) frqmentd=0;
otherwise frqmentd=.;
end;
label frqmentd="Percent with frequent mental distress";
*education;
if educa in (1,2,3) then education=1;
else if educa in (4) then education=2;
else if educa in (5,6) then education=3;
label education='1 <12 yr 2 high school 3 college or higher';
*employment;
if employ in (1,2) then employment=1;
else if employ in (3,4) then employment=2;
else if employ in (7) then employment=3;
else if employ in (8) then employment=4;
else if employ in (5,6) then employment=5;
label employment=' 1 employ 2 unemploy 3 retired 4 unable to work 5
homemake/student';
*marital status;
if marital =1 then maritals=1;
else if marital in (2,3,4) then maritals=2;
else if marital in (5,6) then maritals=3;
* health plan coverage;
if hlthplan=1 then hlthplan2=1;
else if hlthplan=2 then hlthplan2=2;
else hlthplan2=.;
array doc_diag addepev adanxev;
array doc_diag1 dep_diag anx_diag;
do over doc_diag;
if doc_diag=1 then doc_diag1=1;
else if doc_diag=2 then doc_diag1=0;
end;
if depsub=1 then score10=1;
else if depsub=2 then score10=0;
format depress depress. majdep majdep. depsub depsub. smokest smoke.
genhlth2 genhltht. supportt support. addepev adanxev yesno.
currasth yesno.;
*smoking status;
if _smoker3 in (1,2) then smoker=1; *current smoker;
else if _smoker3 in (3) then smoker=2;*former smoker;
else if _smoker3=4 then smoker=3;*never smoker;
*else if _smoker3=9 then smoker=9;
label smoker='1 current 2 former 3 never';
*BMI;

105
IF (WEIGHT2 LT 500) THEN WTKQ=WEIGHT2*0.45359237;
* CODE TO INCLUDE METRIC VALUES FOR WEIGHT2;
IF (9000 LT WEIGHT2 LT 9227) THEN WTKQ=WEIGHT2-9000;
*****************************************************;
IF (300 LE HEIGHT3 LE 399) THEN HTMETER=((HEIGHT3-300)+36)*0.0254;
IF (400 LE HEIGHT3 LE 499) THEN HTMETER=((HEIGHT3-400)+48)*0.0254;
IF (500 LE HEIGHT3 LE 599) THEN HTMETER=((HEIGHT3-500)+60)*0.0254;
IF (600 LE HEIGHT3 LE 699) THEN HTMETER=((HEIGHT3-600)+72)*0.0254;
* CODE TO INCLUDE METRIC VALUES FOR HEIGHT3;
IF (9091 LE HEIGHT3 LE 9213) THEN HTMETER=((HEIGHT3-9000)/100);
*****************************************************;
BMI=WTKQ/(HTMETER*HTMETER);
IF (0 LE BMI LT 18.5) THEN BMICAT=3;
IF (18.5 LE BMI LT 25) THEN BMICAT=3;
IF (25 LE BMI LT 30) THEN BMICAT=2;
IF (30 LE BMI LT 40) THEN BMICAT=1;
IF (40 LE BMI) THEN BMICAT=1;
if bmicat in (1, 2) then overweight=1; *overweight/obese;
else if bmicat in (3) then overweight=2; *not;
label overweight="1 overweight/obese 2 not";
if bmicat=1 then obesity=1; *overweight/obese;
else if bmicat in (2,3) then obesity=2; *not;
label obesity="1 yes 2 not";
*Physical activity;
if exerany2=2 then exercise=1; *physically inactive;
else if exerany2 in (1) then exercise=2; *physically active ;
label exercise="1 no exercise other than job 2 yes ";
*Binge drinker;
if _rfbing4=2 then bing=1; *binge drinker;
else if _rfbing4=1 then bing=2; * not binge drinker;
*Heavy Drinker _RFDRHV3;
if _rfdrhv3=2 then drkhvy=1; *heavy drinker;
else if _rfdrhv3=1 then drkhvy=2; *not heavy drinker;
*Diabetes status;
if diabete2 in (1) then diabt=1; *diabetes
else if diabete2 in (2,3,4) then diabt=2; *not diabetes;
label diabt='1 diabetes 2 no';
*CVD status;
if cvdcrhd3 in (1,2) and cvdinfr3 in (1,2)
and cvdstrk3 in (1,2)
then do;
if cvdcrhd3=1 or cvdinfr3=1 or cvdstrk3=1 then cvd=1;
else cvd=2;
end;
*CHD;
if cvdcrhd3=1 or cvdinfr3=1 then CHD=1;
else if cvdcrhd3 ne . and cvdinfr3 ne . then chd=2;
*stroke;

106
if cvdstrk3=1 then stroke=1 ;
else if cvdstrk3 ne . then stroke=2;
dummy=1;
if physhlth in (77,99) then physical=.;
else if physhlth=88 then physical=0;
else physical=physhlth;
if physical>=3 then poorphy=1;
else if physical<3 and physical ne . then poorphy=2;
if useequip=1 or qlactlm2=1 then disability=1;
else if useequip in (2,7,9) and qlactlm2 in (2,7,9) then disability=2;
array d poorphy disability genhlth2;
array d1 poorphy2 disability2 genhlth2_2;
do over d;
if d=1 then d1=1;
else if d=2 then d1=0;
end;
run;

107
This sixth example provides SAS statement for merging multiple years of BRFSS data and for testing if
there is an age and year interaction or effect modification.
***Merging multiple years’ data;
data SDtrend01;
set DATAV6.dbrfs01 (keep=_state _finalwt _STSTR SEQNO _PSU _QSTVER _racegr2
sex educa age marital employ
DIABETES CVDINFR2 CVDCRHD2 CVDSTRK2 _SMOKER2 STOPSMK2);
cvdinfr4=CVDINFR2;
cvdcrhd4=CVDCRHD2;
cvdstrk3=CVDSTRK2;
_SMOKER3=_SMOKER2;
QSTVER=_QSTVER;
year=2001;
run;
data SDtrend02;
set DATAV7.dbrfs02 (keep=_state _finalwt _STSTR SEQNO _PSU _QSTVER _racegr2
sex educa age marital employ
DIABETES CVDINFR2 CVDCRHD2 CVDSTRK2 _SMOKER2 STOPSMK2);
cvdinfr4=CVDINFR2;
cvdcrhd4=CVDCRHD2;
cvdstrk3=CVDSTRK2;
_SMOKER3=_SMOKER2;
QSTVER=_QSTVER;
year=2002;
run;
data SDtrend03;
set DATAV7.dbrfs03 (keep=_state _finalwt _STSTR SEQNO _PSU QSTVER _racegr2
sex educa age marital employ
DIABETES CVDINFR2 CVDCRHD2 CVDSTRK2 _SMOKER2 STOPSMK2);
cvdinfr4=CVDINFR2;
cvdcrhd4=CVDCRHD2;
cvdstrk3=CVDSTRK2;
_SMOKER3=_SMOKER2;
year=2003;
run;
data SDtrend04;
set DATAV7.dbrfs04 (keep=_state _finalwt _STSTR SEQNO _PSU QSTVER _racegr2
sex educa age marital employ
DIABETE2 CVDINFR2 CVDCRHD2 CVDSTRK2 _SMOKER2 STOPSMK2);
cvdinfr4=CVDINFR2;
cvdcrhd4=CVDCRHD2;
cvdstrk3=CVDSTRK2;
_SMOKER3=_SMOKER2;
year=2004;
run;
data SDtrend05;
set DATAV7.dbrfs05 (keep=_state _finalwt _STSTR SEQNO _PSU QSTVER _racegr2
sex educa age marital employ
DIABETE2 CVDINFR3 CVDCRHD3 CVDSTRK3 _SMOKER3 STOPSMK2);
cvdinfr4=CVDINFR3;
cvdcrhd4=CVDCRHD3;
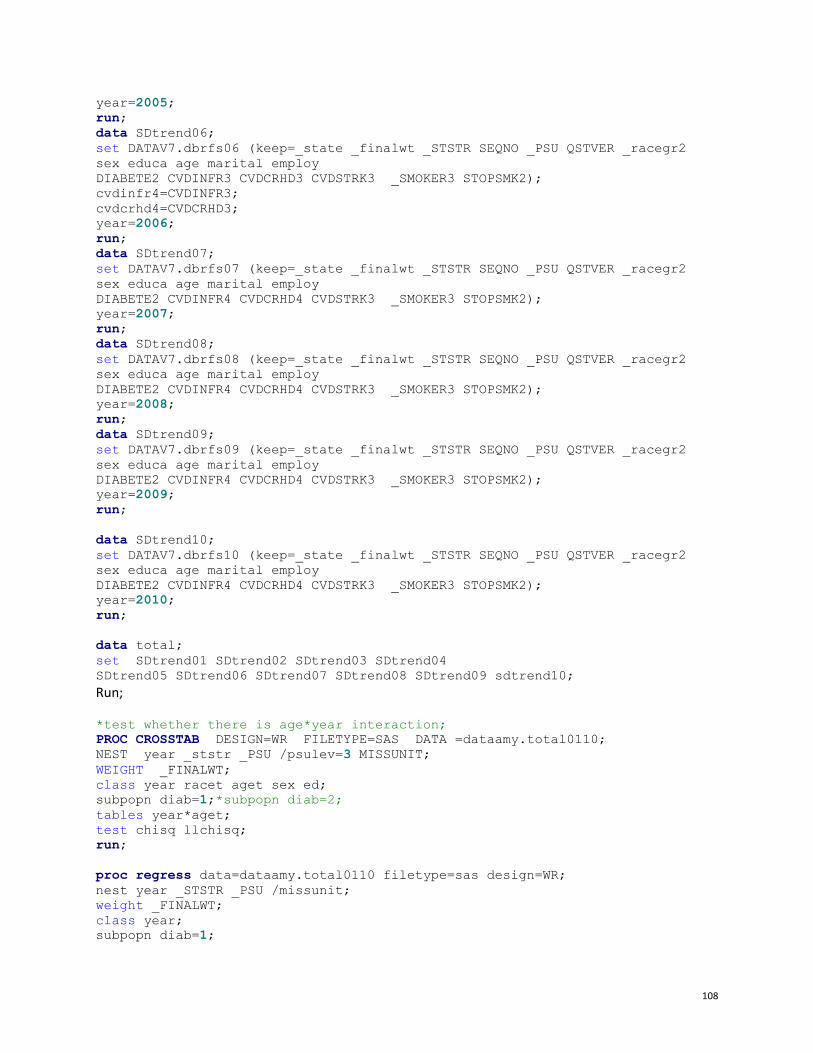
108
year=2005;
run;
data SDtrend06;
set DATAV7.dbrfs06 (keep=_state _finalwt _STSTR SEQNO _PSU QSTVER _racegr2
sex educa age marital employ
DIABETE2 CVDINFR3 CVDCRHD3 CVDSTRK3 _SMOKER3 STOPSMK2);
cvdinfr4=CVDINFR3;
cvdcrhd4=CVDCRHD3;
year=2006;
run;
data SDtrend07;
set DATAV7.dbrfs07 (keep=_state _finalwt _STSTR SEQNO _PSU QSTVER _racegr2
sex educa age marital employ
DIABETE2 CVDINFR4 CVDCRHD4 CVDSTRK3 _SMOKER3 STOPSMK2);
year=2007;
run;
data SDtrend08;
set DATAV7.dbrfs08 (keep=_state _finalwt _STSTR SEQNO _PSU QSTVER _racegr2
sex educa age marital employ
DIABETE2 CVDINFR4 CVDCRHD4 CVDSTRK3 _SMOKER3 STOPSMK2);
year=2008;
run;
data SDtrend09;
set DATAV7.dbrfs09 (keep=_state _finalwt _STSTR SEQNO _PSU QSTVER _racegr2
sex educa age marital employ
DIABETE2 CVDINFR4 CVDCRHD4 CVDSTRK3 _SMOKER3 STOPSMK2);
year=2009;
run;
data SDtrend10;
set DATAV7.dbrfs10 (keep=_state _finalwt _STSTR SEQNO _PSU QSTVER _racegr2
sex educa age marital employ
DIABETE2 CVDINFR4 CVDCRHD4 CVDSTRK3 _SMOKER3 STOPSMK2);
year=2010;
run;
data total;
set SDtrend01 SDtrend02 SDtrend03 SDtrend04
SDtrend05 SDtrend06 SDtrend07 SDtrend08 SDtrend09 sdtrend10;
Run;
*test whether there is age*year interaction;
PROC CROSSTAB DESIGN=WR FILETYPE=SAS DATA =dataamy.total0110;
NEST year _ststr _PSU /psulev=3 MISSUNIT;
WEIGHT _FINALWT;
class year racet aget sex ed;
subpopn diab=1;*subpopn diab=2;
tables year*aget;
test chisq llchisq;
run;
proc regress data=dataamy.total0110 filetype=sas design=WR;
nest year _STSTR _PSU /missunit;
weight _FINALWT;
class year;
subpopn diab=1;
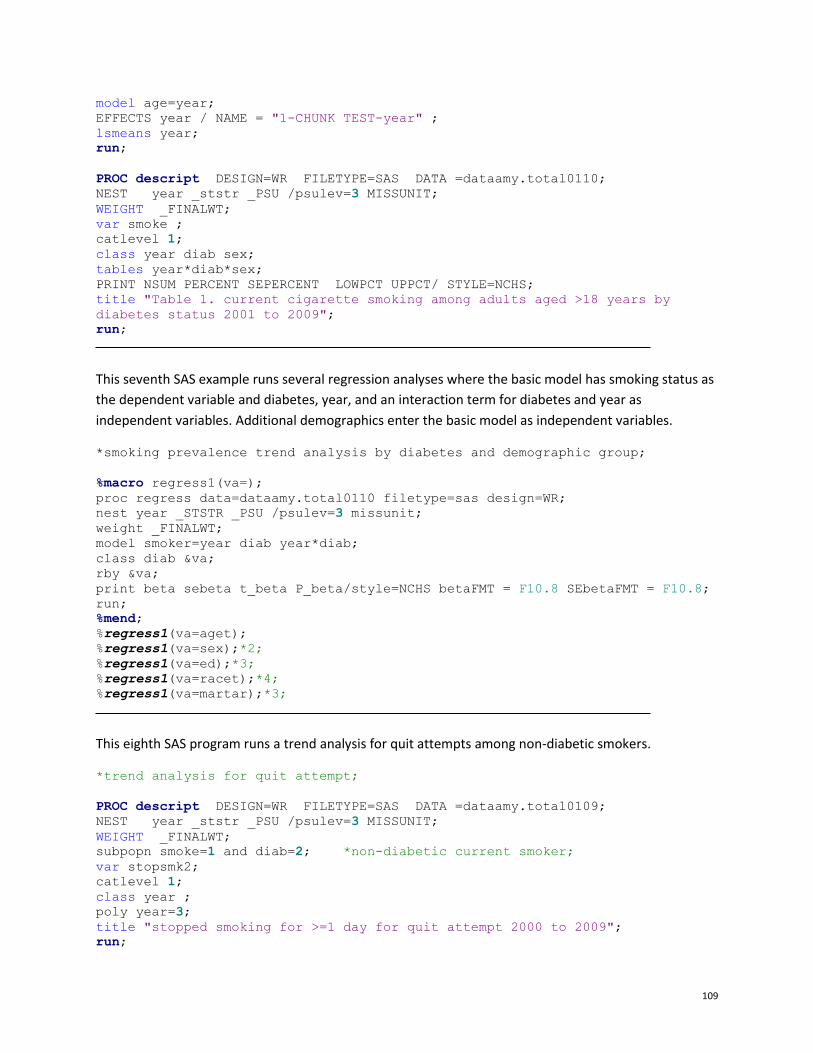
109
model age=year;
EFFECTS year / NAME = "1-CHUNK TEST-year" ;
lsmeans year;
run;
PROC descript DESIGN=WR FILETYPE=SAS DATA =dataamy.total0110;
NEST year _ststr _PSU /psulev=3 MISSUNIT;
WEIGHT _FINALWT;
var smoke ;
catlevel 1;
class year diab sex;
tables year*diab*sex;
PRINT NSUM PERCENT SEPERCENT LOWPCT UPPCT/ STYLE=NCHS;
title "Table 1. current cigarette smoking among adults aged >18 years by
diabetes status 2001 to 2009";
run;
This seventh SAS example runs several regression analyses where the basic model has smoking status as
the dependent variable and diabetes, year, and an interaction term for diabetes and year as
independent variables. Additional demographics enter the basic model as independent variables.
*smoking prevalence trend analysis by diabetes and demographic group;
%macro regress1(va=);
proc regress data=dataamy.total0110 filetype=sas design=WR;
nest year _STSTR _PSU /psulev=3 missunit;
weight _FINALWT;
model smoker=year diab year*diab;
class diab &va;
rby &va;
print beta sebeta t_beta P_beta/style=NCHS betaFMT = F10.8 SEbetaFMT = F10.8;
run;
%mend;
%regress1(va=aget);
%regress1(va=sex);*2;
%regress1(va=ed);*3;
%regress1(va=racet);*4;
%regress1(va=martar);*3;
This eighth SAS program runs a trend analysis for quit attempts among non-diabetic smokers.
*trend analysis for quit attempt;
PROC descript DESIGN=WR FILETYPE=SAS DATA =dataamy.total0109;
NEST year _ststr _PSU /psulev=3 MISSUNIT;
WEIGHT _FINALWT;
subpopn smoke=1 and diab=2; *non-diabetic current smoker;
var stopsmk2;
catlevel 1;
class year ;
poly year=3;
title "stopped smoking for >=1 day for quit attempt 2000 to 2009";
run;

110
Appendix B: More Links to Helpful Resources
Resources and their links are listed by topic in alphabetically order.
Best Practices for Chronic Disease Epidemiology
Essential Functions of Chronic Disease Epidemiology in State Health Departments: A Report of the
Council of State and Territorial Epidemiologists Chronic Disease Epidemiology Capacity Building
Workgroup. September 2004.
http://www.cste2.org/webpdfs/Essential%20Functions%20White%20Paper%20Edited%20Final%20
092204.pdf
CSTE Chronic Disease Epidemiology Capacity Assessment Workgroup. 2009 National Assessment of
Epidemiology Capacity. Supplemental Report: Chronic Disease Epidemiology Capacity Findings and
Recommendations. Atlanta, GA: CSTE; 2009. http://www.cste.org/group/ECA
Capacity Assessment for Epidemiology
As part of workforce development, CSTE provides surveys that can be used to assess the capacity
of epidemiology in chronic disease, maternal and child health, oral health, and environmental
health: http://www.cste.org/group/ECA
Disease and Procedure Codes
Document produced by CDC’s Division of Heart Disease and Stroke Prevention containing codes
the Division uses for surveillance purposes
http://www.chronicdisease.org/resource/resmgr/cvh/cvhc_dhdsp_icd_codes.pdf
ICD-10-CM codes http://www.icd10data.com/ICD10CM/Codes
ICD-10 code manual, 2010: http://apps.who.int/classifications/icd10/browse/2010/en
Epidemiology and Evaluation Resource Guides
NACDD’s Cardiovascular Health Council: http://www.chronicdisease.org/?page=CVHEpiEval
From the Centers for Disease Control and Prevention Web sites. Accessed March 9, 2014.
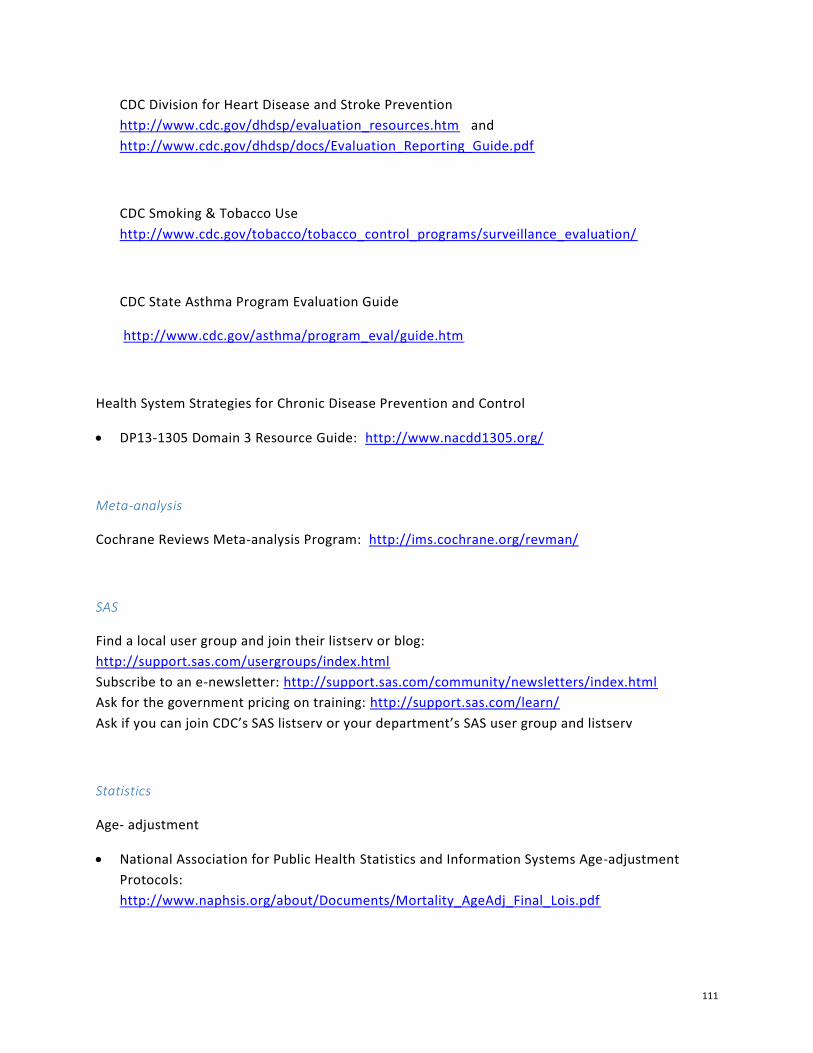
111
CDC Division for Heart Disease and Stroke Prevention
http://www.cdc.gov/dhdsp/evaluation_resources.htm and
http://www.cdc.gov/dhdsp/docs/Evaluation_Reporting_Guide.pdf
CDC Smoking & Tobacco Use
http://www.cdc.gov/tobacco/tobacco_control_programs/surveillance_evaluation/
CDC State Asthma Program Evaluation Guide
http://www.cdc.gov/asthma/program_eval/guide.htm
Health System Strategies for Chronic Disease Prevention and Control
DP13-1305 Domain 3 Resource Guide: http://www.nacdd1305.org/
Meta-analysis
Cochrane Reviews Meta-analysis Program: http://ims.cochrane.org/revman/
SAS
Find a local user group and join their listserv or blog:
http://support.sas.com/usergroups/index.html
Subscribe to an e-newsletter: http://support.sas.com/community/newsletters/index.html
Ask for the government pricing on training: http://support.sas.com/learn/
Ask if you can join CDC’s SAS listserv or your department’s SAS user group and listserv
Statistics
Age- adjustment
National Association for Public Health Statistics and Information Systems Age-adjustment
Protocols:
http://www.naphsis.org/about/Documents/Mortality_AgeAdj_Final_Lois.pdf

112
Life Expectancy
Statehealthfacts.org (by state, 2010):
http://www.statehealthfacts.org/comparemaptable.jsp?ind=784&cat=2
Statehealthfacts.org (by state and gender, 2010)
http://www.statehealthfacts.org/comparemaptable.jsp?ind=967&cat=2
Statehealthfacts.org (by state and race/ethnicity, 2010)
http://www.statehealthfacts.org/comparemaptable.jsp?ind=968&cat=2
Sample Size and Power Calculations
Vanderbilt University Department of Biostatistics Sample Size and Power Calculator:
http://biostat.mc.vanderbilt.edu/wiki/Main/PowerSampleSize#PS_Power_and_Sample_Size_Calcula
Surveillance Resources
CDC Surveillance Resource Center Tools & Templates:
http://www.cdc.gov/surveillancepractice/tools.html
Chronic Disease Cost Calculator: http://www.cdc.gov/chronicdisease/resources/calculator/
GIS
Chronic Disease GIS Exchange: http://www.cdc.gov/dhdsp/maps/gisx/
Geographic Information Systems (GIS) at CDC: http://www.cdc.gov/gis/index.htm
Cartographic Guidelines for Public Health:
http://gis.cdc.gov/grasp/resources/CartographicGuidelinesPH2012508c.pdf
Building GIS Capacity in State Health Departments Project:
http://cehi.snre.umich.edu/projects/building-gis-capacity-state-health-departments
Indicators and Data
CDC Chronic Disease Indicators: http://apps.nccd.cdc.gov/cdi/
Healthy People 2020: http://www.healthypeople.gov/2020/
Maternal and Child Health: https://perf-
data.hrsa.gov/MCHB/TVISReports/MeasurementData/MeasurementDataMenu.aspx
o Life Course Indicators: http://www.amchp.org/programsandtopics/data-
assessment/Pages/LifeCourseIndicators.aspx
o Maternal and Child Health data: http://mchb.hrsa.gov/researchdata/index.html
o Preconception Health Indicators: http://www.cste.org/?PreconIndicators

113
o Reproductive Health data:
http://www.cdc.gov/reproductivehealth/Data_Stats/index.htm
National Oral Health Surveillance System: www.cdc.gov/nohss/
Social Determinants of Health:
CDC Data Set Directory of Social Determinants of Health at the Local Level :
http://www.cdc.gov/dhdsp/docs/data_set_directory.pdf
http://c.ymcdn.com/sites/www.chronicdisease.org/resource/resmgr/diabetes_act_on_data/ao
d_sdoh_guidance_doc_final.pdf
Sample state surveillance plans
Iowa Asthma Surveillance Plan:
https://www.idph.state.ia.us/hpcdp/common/pdf/asthma_plan_2003.pdf
North Carolina’s Physical Activity and Nutrition Surveillance Plan:
http://www.eatsmartmovemorenc.com/ESMMPlan/Texts/Eat%20Smart,%20Move%20More%20NC%20
Surveillance%20Plan%20March%202011.pdf
North Dakota Oral Health Surveillance Plan:
http://www.ndhealth.gov/oralhealth/publications/ND%20Oral%20Health%20Surveillance%20Plan.pdf
Rhode Island Oral Health Surveillance Plan:
http://www.health.ri.gov/publications/plans/2010OralHealthSurveillance.pdf
State Point of Contacts from the CSTE Web site accessed on March 9, 2014:
State Chronic Disease Epidemiology Contacts: http://www.cste.org/?page=ChronicPOC
State Maternal and Child Health Epidemiology Contacts: http://www.cste.org/?page=MCHPOC
Oral Health Epidemiology Contacts:
http://www.cste.org/?page=OralHealthContacts
114
State surveillance coordinators from the CDC Web site accessed on March 9, 2014:
State Behavioral Risk Factor Surveillance System Coordinators:
http://apps.nccd.cdc.gov/BRFSSCoordinators/coordinator.asp
State Pregnancy Risk Assessment Monitory System Contacts:
http://www.cdc.gov/prams/StatesContacts.htm
Training Needs
Report on State Chronic Disease Epidemiologists and Evaluators Training Needs – April 2013
http://www.chronicdisease.org/?page=EECTraining
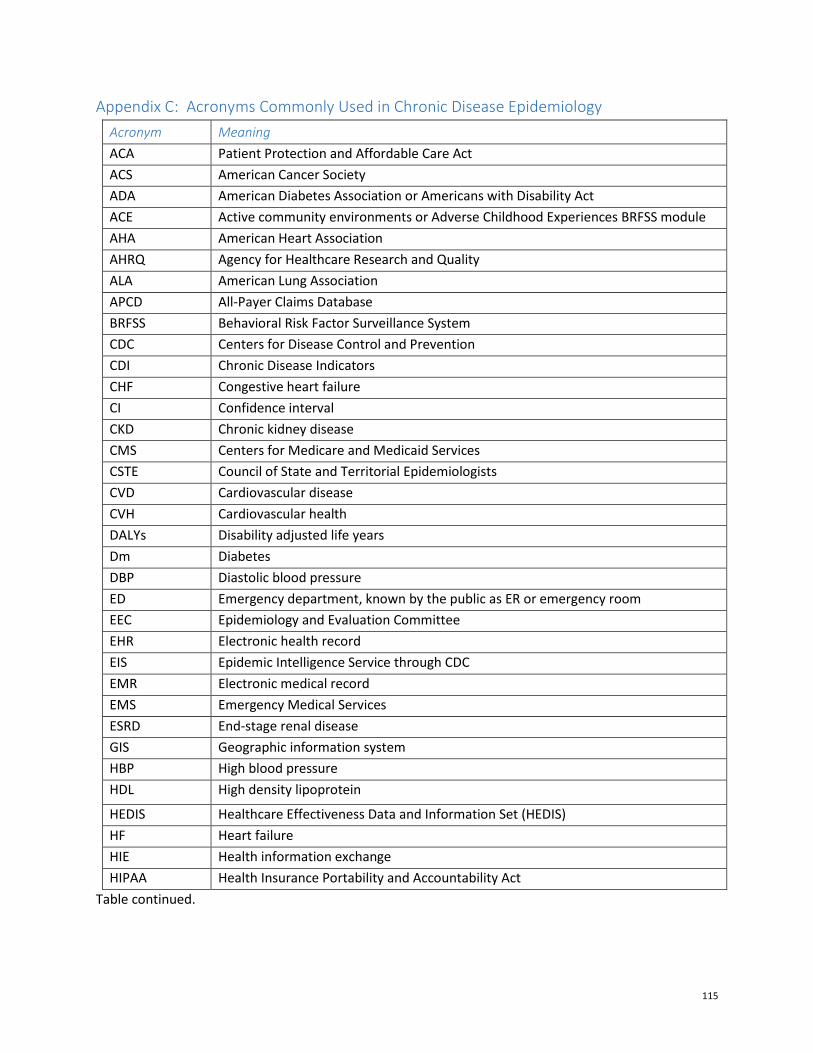
115
Appendix C: Acronyms Commonly Used in Chronic Disease Epidemiology
Acronym Meaning
ACA Patient Protection and Affordable Care Act
ACS American Cancer Society
ADA American Diabetes Association or Americans with Disability Act
ACE Active community environments or Adverse Childhood Experiences BRFSS module
AHA American Heart Association
AHRQ Agency for Healthcare Research and Quality
ALA American Lung Association
APCD All-Payer Claims Database
BRFSS Behavioral Risk Factor Surveillance System
CDC Centers for Disease Control and Prevention
CDI Chronic Disease Indicators
CHF Congestive heart failure
CI Confidence interval
CKD Chronic kidney disease
CMS Centers for Medicare and Medicaid Services
CSTE Council of State and Territorial Epidemiologists
CVD Cardiovascular disease
CVH Cardiovascular health
DALYs Disability adjusted life years
Dm Diabetes
DBP Diastolic blood pressure
ED Emergency department, known by the public as ER or emergency room
EEC Epidemiology and Evaluation Committee
EHR Electronic health record
EIS Epidemic Intelligence Service through CDC
EMR Electronic medical record
EMS Emergency Medical Services
ESRD End-stage renal disease
GIS Geographic information system
HBP High blood pressure
HDL High density lipoprotein
HEDIS Healthcare Effectiveness Data and Information Set (HEDIS)
HF Heart failure
HIE Health information exchange
HIPAA Health Insurance Portability and Accountability Act
Table continued.
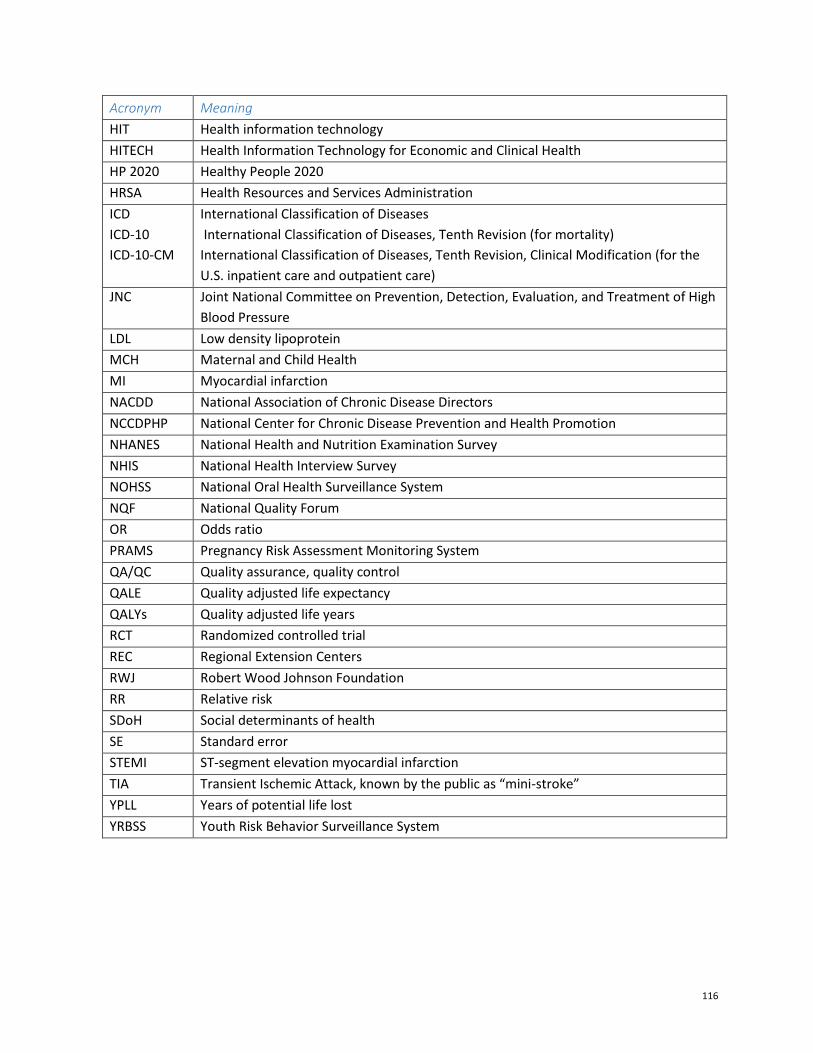
116
Acronym Meaning
HIT Health information technology
HITECH Health Information Technology for Economic and Clinical Health
HP 2020 Healthy People 2020
HRSA Health Resources and Services Administration
ICD
ICD-10
ICD-10-CM
International Classification of Diseases
International Classification of Diseases, Tenth Revision (for mortality)
International Classification of Diseases, Tenth Revision, Clinical Modification (for the
U.S. inpatient care and outpatient care)
JNC Joint National Committee on Prevention, Detection, Evaluation, and Treatment of High
Blood Pressure
LDL Low density lipoprotein
MCH Maternal and Child Health
MI Myocardial infarction
NACDD National Association of Chronic Disease Directors
NCCDPHP National Center for Chronic Disease Prevention and Health Promotion
NHANES National Health and Nutrition Examination Survey
NHIS National Health Interview Survey
NOHSS National Oral Health Surveillance System
NQF National Quality Forum
OR Odds ratio
PRAMS Pregnancy Risk Assessment Monitoring System
QA/QC Quality assurance, quality control
QALE Quality adjusted life expectancy
QALYs Quality adjusted life years
RCT Randomized controlled trial
REC Regional Extension Centers
RWJ Robert Wood Johnson Foundation
RR Relative risk
SDoH Social determinants of health
SE Standard error
STEMI ST-segment elevation myocardial infarction
TIA Transient Ischemic Attack, known by the public as “mini-stroke”
YPLL Years of potential life lost
YRBSS Youth Risk Behavior Surveillance System

117
Appendix D: Position descriptions and Related Workforce Development Resources
From the National Association of Chronic Disease Directors
NACDD job description templates (pages 7 and 8)
http://www.chronicdisease.org/resource/resmgr/workforce_development/jobdescriptiontemp
lates.pdf?hhSearchTerms=position+and+descriptions
Workforce Development. National Association of Chronic Disease Directors.
http://www.chronicdisease.org/?WorkforceDevelope. Accessed March 9, 2014. Provides a link to the
job description templates, competencies assessment tools, and a structured interview guide.
From CDC/CSTE:
CDC/CSTE: Sample position description—Tier 1
http://www.cdc.gov/appliedepicompetencies/downloads/AEC_PositionDescription_Tier1.pdf
CDC/CSTE: Sample position description—Tier 2
http://www.cdc.gov/appliedepicompetencies/downloads/AEC_PositionDescription_Tier2.pdf
CDC/CSTE: Sample position description—Tier 3a
http://www.cdc.gov/appliedepicompetencies/downloads/AEC_PositionDescription_Tier3a.pdf
CDC/CSTE: Sample position description—Tier 3b
http://www.cdc.gov/appliedepicompetencies/downloads/AEC_PositionDescription_Tier3b.pdf
Alternatively, you can access the CDC/CSTE applied competencies, short summaries, sample
position descriptions, and competency assessment forms at:
Competencies for Applied Epidemiologists in Governmental Public Health Agencies (AECs).
Centers for Disease Control and Prevention Web site.
http://www.cdc.gov/appliedepicompetencies/
Updated December 17, 2008. Accessed March 9, 2014.
Related Documents