†Corresponding author : 051-620-6519, [email protected] * 이 논문은 2002학년도 부경대학교 동원학술연구재단의 지원에 의하여 연구되었으며, 2003년 EAFE(European Association of Fisheries Economists) XV Conference에서 발표된 논문을 수정한 것임. Jour. Fish. Mar. Sci. Edu., 18(1), pp.19~30, 2006 水産海洋敎育硏究, 18(1), 2006 - 19 - A Comparative Analysis of Surplus Production Models and a Maximum Entropy Model for Estimating the Anchovy's Stock in Korea Hee-Dong PYO Pukyung National University 우리나라 멸치자원량 추정을 위한 잉여생산모델과 최대엔트로피모델의 비교분석 표 희 동 (부경대학교) (Received March 18, 2006 / Accepted March 31, 2006) Abstract For fishery stock assessment and optimum sustainable yield of anchovy in Korea, surplus production(SP) models and a maximum entropy(ME) model are employed in this paper. For determining appropriate models, five traditional SP models-Schaefer model, Schnute model, Walters and Hilborn model, Fox model, and Clarke, Yoshimoto and Pooley (CYP) model- are tested for effort and catch data of anchovy that occupies 7% in the total fisheries landings of Korea. Only CYP model of five SP models fits statistically significant at the 10% level. Estimated intrinsic growth rates are similar in both CYP and ME models, while environmental carrying capacity of the ME model is quite greater than that of the CYP model. In addition, the estimated maximum sustainable yield(MSY), 213,287 tons in the ME model is slightly higher than that of CYP model (198,364 tons). Biomass for MSY in the ME model, however, is calculated 651,000 tons which is considerably greater than that of the CYP model (322,881 tons). It is meaningful in that two models are compared for noting some implications about any significant difference of stock assessment and their potential strength and weakness. Key words: Fishery stock assessment, Surplus production(SP) models, Maximum entropy(ME) model, anchovy

Welcome message from author
This document is posted to help you gain knowledge. Please leave a comment to let me know what you think about it! Share it to your friends and learn new things together.
Transcript
†Corresponding author : 051-620-6519, [email protected]
* 이 논문은 2002학년도 부경 학교 동원학술연구재단의 지원에 의하여 연구되었으며, 2003년
EAFE(European Association of Fisheries Economists) XV Conference에서 발표된 논문을
수정한 것임.
Jour. Fish. Mar. Sci. Edu., 18(1), pp.19~30, 2006 水産海洋敎育硏究, 18(1), 2006
- 19 -
A Comparative Analysis of Surplus Production Models
and a Maximum Entropy Model for Estimating the
Anchovy's Stock in Korea
Hee-Dong PYO
Pukyung National University
우리나라 멸치자원량 추정을 한 잉여생산모델과
최 엔트로피모델의 비교분석
표 희 동
(부경 학교)
(Received March 18, 2006 / Accepted March 31, 2006)
Abstract
For fishery stock assessment and optimum sustainable yield of anchovy in Korea, surplus
production(SP) models and a maximum entropy(ME) model are employed in this paper. For
determining appropriate models, five traditional SP models-Schaefer model, Schnute model,
Walters and Hilborn model, Fox model, and Clarke, Yoshimoto and Pooley (CYP) model-
are tested for effort and catch data of anchovy that occupies 7% in the total fisheries
landings of Korea. Only CYP model of five SP models fits statistically significant at the 10%
level. Estimated intrinsic growth rates are similar in both CYP and ME models, while
environmental carrying capacity of the ME model is quite greater than that of the CYP
model. In addition, the estimated maximum sustainable yield(MSY), 213,287 tons in the ME
model is slightly higher than that of CYP model (198,364 tons). Biomass for MSY in the ME
model, however, is calculated 651,000 tons which is considerably greater than that of the
CYP model (322,881 tons). It is meaningful in that two models are compared for noting
some implications about any significant difference of stock assessment and their potential
strength and weakness.
Key words: Fishery stock assessment, Surplus production(SP) models, Maximum entropy(ME)
model, anchovy
표 희 동
- 20 -
I. INTRODUCTION
The concept of sustainable yield has long
dominated the analysis of renewable
resources(Schaefer, 1954; Beverton and Holt,
1957). The best known proxy for sustainability
is maximum sustainable yield(MSY), defined as
the largest annual catch that can be taken while
maintaining resource sustainability. With the
rationalization paradigm to overcome the open
access dynamics, the strategy of maximum
economic yield(MEY), which is the sustainable
level of catch that produces the greatest
economic profits, has become popular. MSY and
MEY represent main reference points for
fisheries sustainability and benchmarks for
fishery management.
Without precise information on age and
growth, the most common alternatives to
age-based or length-based fisheries stock
assessment techniques are biomass dynamics
models, commonly referred to as SP models(e.g.
Schaefer, 1954; Schnute, 1977; Walters and
Hilborn, 1976; Fox, 1970; Clarke, Yoshimoto and
Pooley, 1992; Pella and Tomlinson, 1969). A
critical underlying assumption of the SP models
is that catch in any one year is a linear function
of effort and SP models can be represented by
the equilibrium state in which the level of catch
is equal to the level of surplus growth. This
assumption means that SP models cannot
estimate biomass annually.
In order to overcome several limits on SP
model, ME model developed by Golan et
al.(1996a, 1996b) can also be applied to estimate
the yearly fishery stock, MSY, and the
maximum sustainable biomass, using non-linear
programming.
The objective of this paper is to evaluate and
compare a SP model and a ME model, using a
time-series of data for catch and effort of
anchovy, which is one of a major species
occupying 7% in the total fisheries landings of
Korea. Since the recruitment of anchovy is
much more uncertain than the abundance of the
adult stages, the stock assessments are also
more uncertain. Furthermore, no TAC(Total
Allowable Catch) or adaptive management is in
place, so the administrations do not require
monitoring in order to manage the fisheries.
Jacobson et al.(2001) argue that it is difficult to
apply existing age-based or length-based
fisheries stock assessment techniques to stock
assessment of small pelagic fishes such as
anchovy and sardine because several
characteristics - recruitment variability, rapid
somatic growth, and high mortality rates- of
small pelagic fishes make their age-structured
analysis difficult. Even though current biomass
of anchovy can be estimated by using acoustic
surveys and trawl surveys(Choi et al., 2001;
Bailey and Simmonds, 1990), it is impossible to
estimate the yearly fishery stock and
parameters. Such things are the most important
reasons to conduct fisheries stock assessment of
anchovy using indirect methods.
This paper presents SP models and ME
model for anchovy stock assessment after a
brief summary of fishing types of anchovy and
time series data for catch and effort. The
remaining part of the paper summarizes the
results of two models and their implications for
anchovy fisheries.
우리나라 멸치자원량추정을 한 잉여생산모델과 최 엔트로피모델의 비교분석
- 21 -
Ⅱ. DATA FOR ANCHOVY
FISHERIES
1. Fishing activity of anchovy
Anchovies are small silvery fishes with
blue-green backs. They live up to two or three
years, usually never grow larger than 20 cm (8
in), and spawn in the late spring to autumn.
Anchovies prefer warmer waters (optimal water
temperature: 13 ~ 23 Co ) around the world
where they swim in massive schools. In Korea
they are distributed in all coastal seas as a
representative migratory fish species, and
primarily feed on planktonic crustaceans and
fish larvae.
Major fishing gears used in anchovy fishery
in Korea are anchovy dragnet, gillnet and
set-nets fisheries. Anchovy dragnet accounts for
the majority of anchovy harvest in Korea, most
of which is processed into the dried. Its
offshore and coastal gillnet fishery involves
larger anchovies than those of dragnet fishery,
and they are used for the pickled or salted. Its
set-net fishery yields good quality of the
anchovy, catching Spanish mackerel, common
mackerel, horse mackerel, hairtail, squid, and so
on together.
2. Catch and effort data
Fishing effort is a key variable in fisheries
stock assessment. SP models and ME model
assume that the level of catch is a function of
effort and biomass, Ct=qXtE t, where Ct
represents the level of catch at t year, q the
catchability coefficient, Xt the level of biomass
at t year, and Et the level of fishing effort at t
year. Total fishing effort has to be expressed in
standardized units to account for differences in
size and type of vessels and fishing gears. In
many cases, however, complete information on
all the factors that make up 'effort' is non-exist.
For some factors, such as skill, an objective
measure is not readily observable. Unfortunately
most observable measures of effort, such as
days fished, are highly unreliable. As a result,
models that do not standardize effort could
result in erroneous results. Standardizing effort
over time, however, is a complicated task. Most
fisheries models also assume that effort is
randomly distributed across a fishery, and that
catch per unit of effort(CPUE) is proportional to
the biomass(Pascoe, 1998).
Some examples of effort proxies in fisheries
analysis include: days fished; hours trawled;
days*boatsize; days*engine size; day*boat
size*engine size; hours trawled*net headrope
length; days*crew size; total pot lifts; km
nets*hours soaked*lifts, all of which depends on
the type of fisheries. Engine size(horsepower)
for anchovy is used in this analysis.
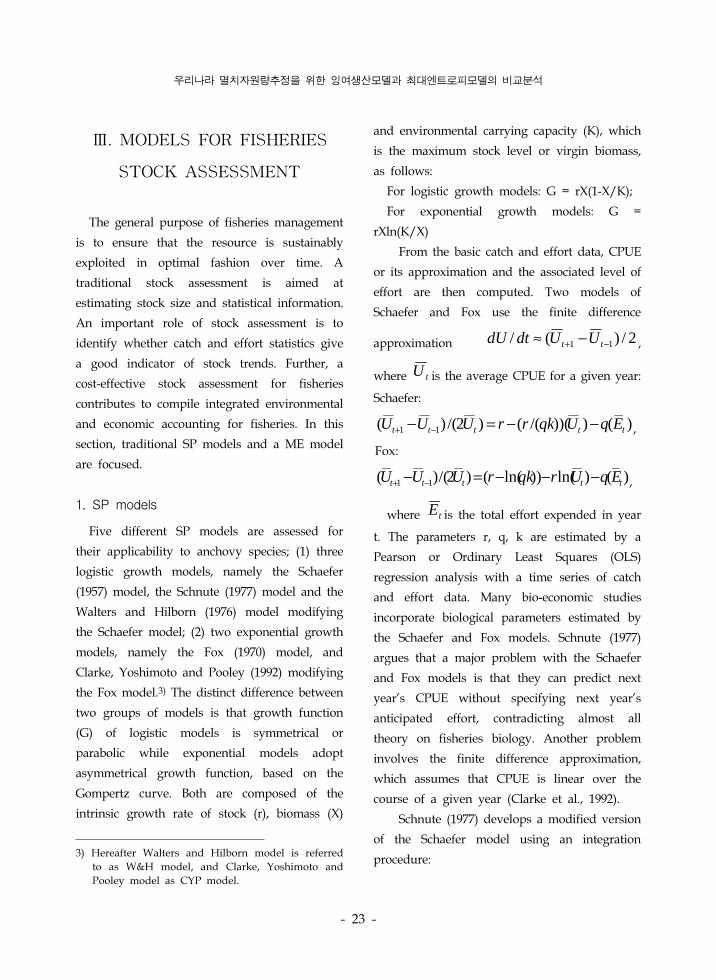
Catch, effort and CPUE data each fishing
gear for 25 years (1977 ~ 2001) are presented in
in Figure 1, 2 and 3, respectively(Pyo and Lee,
2003). Total anchovy catches have been steadily
increasing along with increased effort, showing
the range of 130 thousands tonnes to 270
thousands tonnes. The major fishing gear for
anchovy is dragnet fishery, while the set net
produces the highest CPUE.
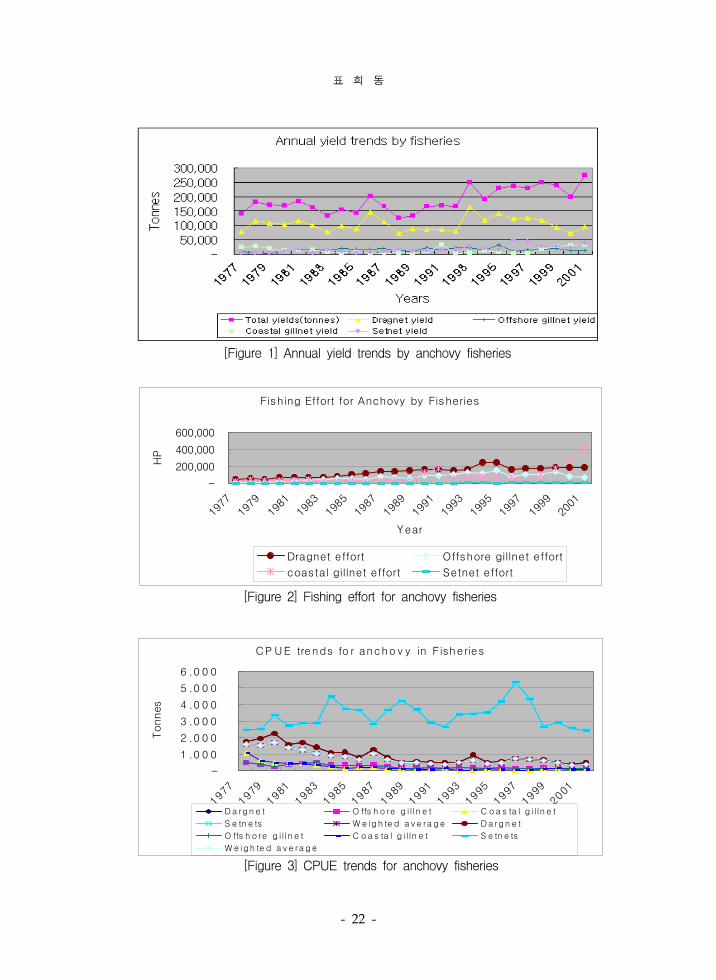
표 희 동
- 22 -
Fishing Effort for Anchovy by Fisheries
-
200,000
400,000
600,000
1977
1979
1981
1983
1985
1987
1989
1991
1993
1995
1997
1999
2001
Year
HP
Dragnet effort Offshore gillnet effort
coastal gillnet effort Setnet effort
[Figure 2] Fishing effort for anchovy fisheries
CP UE trends fo r ancho v y in Fishe ries
-
1 .0 0 0
2 .0 0 0
3 .0 0 0
4 .0 0 0
5 .0 0 0
6 .0 0 0
1977
1979
1981
1983
1985
1987
1989
1991
1993
1995
1997
1999
2001
Y ears
Tonnes
Da rgn e t O ffs h o re g i l ln e t C oa s ta l g i l ln e t
S e tn e ts W e ig h te d a v e ra ge Da rgn e t
O ffs h o re g i l ln e t C oa s ta l g i l ln e t S e tn e ts
W e igh te d a v e ra g e
[Figure 3] CPUE trends for anchovy fisheries
[Figure 1] Annual yield trends by anchovy fisheries
우리나라 멸치자원량추정을 한 잉여생산모델과 최 엔트로피모델의 비교분석
- 23 -
Ⅲ. MODELS FOR FISHERIES
STOCK ASSESSMENT
The general purpose of fisheries management
is to ensure that the resource is sustainably
exploited in optimal fashion over time. A
traditional stock assessment is aimed at
estimating stock size and statistical information.
An important role of stock assessment is to
identify whether catch and effort statistics give
a good indicator of stock trends. Further, a
cost-effective stock assessment for fisheries
contributes to compile integrated environmental
and economic accounting for fisheries. In this
section, traditional SP models and a ME model
are focused.
1. SP models
Five different SP models are assessed for
their applicability to anchovy species; (1) three
logistic growth models, namely the Schaefer
(1957) model, the Schnute (1977) model and the
Walters and Hilborn (1976) model modifying
the Schaefer model; (2) two exponential growth
models, namely the Fox (1970) model, and
Clarke, Yoshimoto and Pooley (1992) modifying
the Fox model.3) The distinct difference between
two groups of models is that growth function
(G) of logistic models is symmetrical or
parabolic while exponential models adopt
asymmetrical growth function, based on the
Gompertz curve. Both are composed of the
intrinsic growth rate of stock (r), biomass (X)
3) Hereafter Walters and Hilborn model is referred
to as W&H model, and Clarke, Yoshimoto and
Pooley model as CYP model.
and environmental carrying capacity (K), which
is the maximum stock level or virgin biomass,
as follows:
For logistic growth models: G = rX(1-X/K);
For exponential growth models: G =
rXln(K/X)
From the basic catch and effort data, CPUE
or its approximation and the associated level of
effort are then computed. Two models of
Schaefer and Fox use the finite difference
approximation 2/)(/ 11 −+ −≈ tt UUdtdU ,
where tU is the average CPUE for a given year:
Schaefer:
)()))(/(()2/()( 11 ttttt EqUqkrrUUU −−=− −+ ,
Fox:
)()ln())ln(()2/()( 11 ttttt EqUrqkrUUU −−−=− −+ ,
where tE is the total effort expended in year
t. The parameters r, q, k are estimated by a
Pearson or Ordinary Least Squares (OLS)
regression analysis with a time series of catch
and effort data. Many bio-economic studies
incorporate biological parameters estimated by
the Schaefer and Fox models. Schnute (1977)
argues that a major problem with the Schaefer
and Fox models is that they can predict next
year's CPUE without specifying next year's
anticipated effort, contradicting almost all
theory on fisheries biology. Another problem
involves the finite difference approximation,
which assumes that CPUE is linear over the
course of a given year (Clarke et al., 1992).
Schnute (1977) develops a modified version
of the Schaefer model using an integration
procedure:
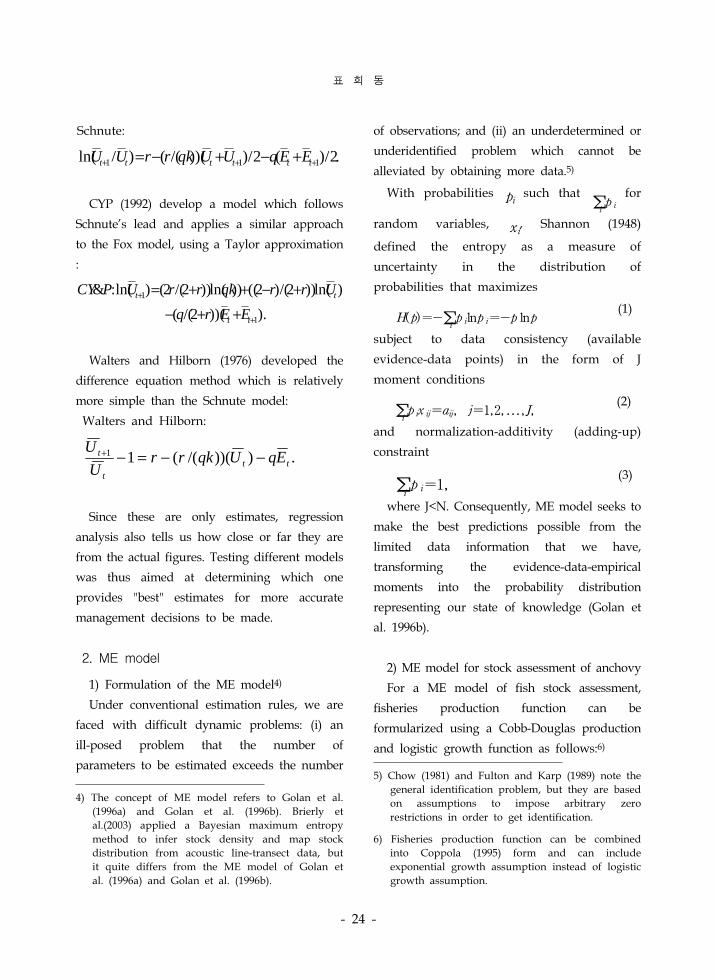
표 희 동
- 24 -
Schnute:
.2/)(2/)))(/(()/ln( 111 +++ +−+−= tttttt EEqUUqkrrUU
CYP (1992) develop a model which follows
Schnute's lead and applies a similar approach
to the Fox model, using a Taylor approximation
:
).))(2/(()ln())2/()2(())ln())2/(2()ln(:&
1
1
+
+
++−
+−++=
tt
tt
EErqUrrqkrrUPCY
Walters and Hilborn (1976) developed the
difference equation method which is relatively
more simple than the Schnute model:
Walters and Hilborn:
.)))(/((11tt
t
t EqUqkrrU
U−−=−+
Since these are only estimates, regression
analysis also tells us how close or far they are
from the actual figures. Testing different models
was thus aimed at determining which one
provides "best" estimates for more accurate
management decisions to be made.
2. ME model
1) Formulation of the ME model4)
Under conventional estimation rules, we are
faced with difficult dynamic problems: (i) an
ill-posed problem that the number of
parameters to be estimated exceeds the number
4) The concept of ME model refers to Golan et al.
(1996a) and Golan et al. (1996b). Brierly et
al.(2003) applied a Bayesian maximum entropy
method to infer stock density and map stock
distribution from acoustic line-transect data, but
it quite differs from the ME model of Golan et
al. (1996a) and Golan et al. (1996b).
of observations; and (ii) an underdetermined or
underidentified problem which cannot be
alleviated by obtaining more data.5)
With probabilities pi such that ∑ip i
for
random variables, xi, Shannon (1948)
defined the entropy as a measure of
uncertainty in the distribution of
probabilities that maximizes
H(p)=-∑
ip ilnp i=-p lnp
(1)
subject to data consistency (available
evidence-data points) in the form of J
moment conditions
∑ip ix ij=aij, j=1,2,...,J,
(2)
and normalization-additivity (adding-up)
constraint
∑ip i=1,
(3)
where J<N. Consequently, ME model seeks to
make the best predictions possible from the
limited data information that we have,
transforming the evidence-data-empirical
moments into the probability distribution
representing our state of knowledge (Golan et
al. 1996b).
2) ME model for stock assessment of anchovy
For a ME model of fish stock assessment,
fisheries production function can be
formularized using a Cobb-Douglas production
and logistic growth function as follows:6)
5) Chow (1981) and Fulton and Karp (1989) note the
general identification problem, but they are based
on assumptions to impose arbitrary zero
restrictions in order to get identification.
6) Fisheries production function can be combined
into Coppola (1995) form and can include
exponential growth assumption instead of logistic
growth assumption.
우리나라 멸치자원량추정을 한 잉여생산모델과 최 엔트로피모델의 비교분석
- 25 -
)exp()(1
ttn
i
iitt XEAC εβα
∏== (4)
(5)
where i is a vector of fishing gear(in the
paper, four methods such as dragnet,
offshore gillnet, coastal gillnet, and set nets),
α and β are parameters representing the
effort and stock elasticity respectively, and
εt and μt are error terms for C and X at
time t, respectively. The above functions can
be converted to log form as follows:
lnC t=lnA+α 1lnE 1t+α 2lnE 2t+.....+α nlnEnt+βlnXt+ε t
(4')
lnX t+1=lnXt+lnSt+μt (5')
where S t=1+r(1-XtK
)-CtXt
.
In this formulation the observable variables
are Ct and E, and the parameters to be
internally derived from the formulation are the
probability distributions of A, αi, β, r, Xt, K, εt
and μt. Therefore, the above formulations are
involved in an ill-posed problem as they have
much more parameters estimated than observed
variables. In addition, there is a method to
impose prior restrictions on the parameter
estimates by spanning the possible parameter
range for each parameter. For example, if A, αi
and β are believed that they range between 0
and 1, they will be specified by a tri-uniform
distribution such as [0, 0.5, 1].
15.00 321 ⋅+⋅+⋅= AAA pppA (6)
15.00 321 ⋅+⋅+⋅= iiii ppp αααα (7)
15.00 321 ⋅+⋅+⋅= ββββ ppp (8)
In such context, limited prior information
for r and K can be imposed by using the
estimates from SP model as follows:
mpmppr rrr ⋅+⋅+⋅= 321 20
(9)
npnppK KKK ⋅+⋅+⋅= 321 20
(10)
hphppX Xt
Xt
Xtt ⋅+⋅+⋅= 321 2
0 (11)
)(0)( 321 eppep tttt +⋅+⋅+−⋅= εεεε (12)
)(0)( 321 eppep tttt +⋅+⋅+−⋅= µµµµ (13)
where m, n and h stand for upper bounds of
r, K and Xt, respectively, and e is specified to
be symmetric around zero for εt and μt.
In conclusion, the generalized stochastic
non-linear ME model for stock assessment of
anchovy in the Korean coastal seas can be
structured in scalar-summation notation, using a
criterion with nonnegative probability factors, as
]lnln[ ltj
l j
ltj
t
gj
g j
gj ppppMax ∑ ∑∑−∑∑−
(14)
subject to the data consistency with (4)', (5)',
(6), (7), (8), (9), (10), (11), (12), (13) in which m,
n, h and e are replaced by 2, 1000000, 500000
and 0.3, respectively, and the adding-up
constraints:
∑3
jpgj=1, ∑
3
jpXtj=1, ∑
3
jp
ε
tj=1, ∑3
jp
μ
tj=1 (15)
where
g=A, α, β, r, K and l=X, ε, μ, and t=1,2,3,...,n-1.
This formulation is a general non-linear
inversion procedure for recovering both
time-invariant and time-variant parameters.
These estimates may be also used as a basis for
defining measures of uncertainty and precision
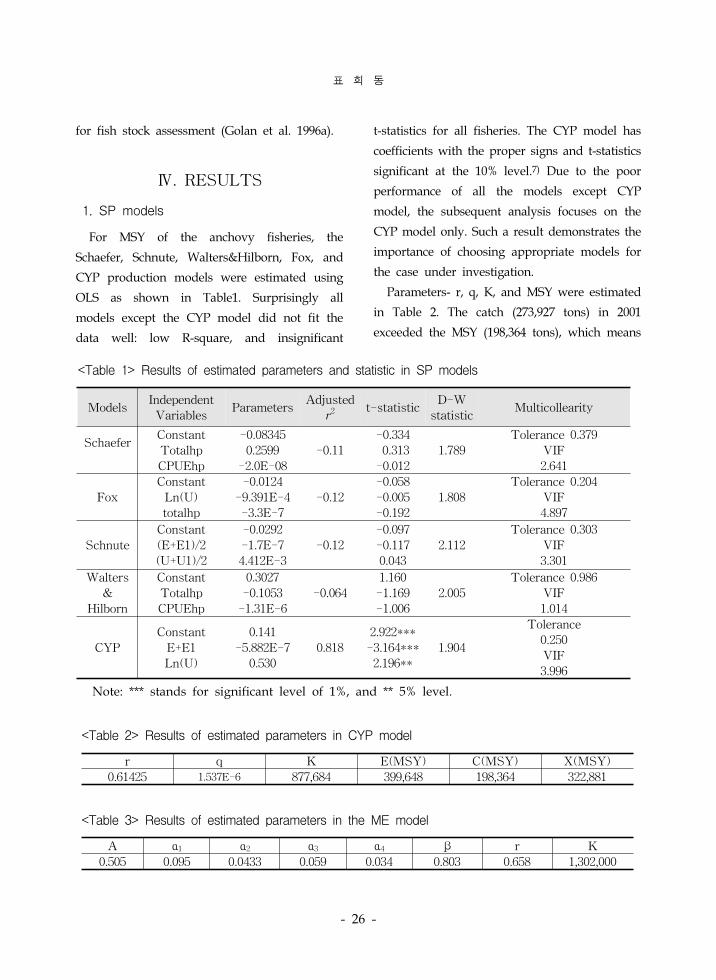
표 희 동
- 26 -
ModelsIndependent
VariablesParameters
Adjusted
r2t-statistic
D-W
statisticMulticollearity
SchaeferConstant
Totalhp
CPUEhp
-0.08345
0.2599
-2.0E-08
-0.11
-0.334
0.313
-0.012
1.789
Tolerance 0.379
VIF
2.641
Fox
Constant
Ln(U)
totalhp
-0.0124
-9.391E-4
-3.3E-7
-0.12
-0.058
-0.005
-0.192
1.808
Tolerance 0.204
VIF
4.897
Schnute
Constant
(E+E1)/2
(U+U1)/2
-0.0292
-1.7E-7
4.412E-3
-0.12
-0.097
-0.117
0.043
2.112
Tolerance 0.303
VIF
3.301
Walters
&
Hilborn
Constant
Totalhp
CPUEhp
0.3027
-0.1053
-1.31E-6
-0.064
1.160
-1.169
-1.006
2.005
Tolerance 0.986
VIF
1.014
CYP
Constant
E+E1
Ln(U)
0.141
-5.882E-7
0.530
0.818
2.922***
-3.164***
2.196**
1.904
Tolerance
0.250
VIF
3.996
Note: *** stands for significant level of 1%, and ** 5% level.
<Table 1> Results of estimated parameters and statistic in SP models
r q K E(MSY) C(MSY) X(MSY)
0.61425 1.537E-6 877,684 399,648 198,364 322,881
<Table 2> Results of estimated parameters in CYP model
A α1 α2 α3 α4 β r K
0.505 0.095 0.0433 0.059 0.034 0.803 0.658 1,302,000
<Table 3> Results of estimated parameters in the ME model
for fish stock assessment (Golan et al. 1996a).
Ⅳ. RESULTS
1. SP models
For MSY of the anchovy fisheries, the
Schaefer, Schnute, Walters&Hilborn, Fox, and
CYP production models were estimated using
OLS as shown in Table1. Surprisingly all
models except the CYP model did not fit the
data well: low R-square, and insignificant
t-statistics for all fisheries. The CYP model has
coefficients with the proper signs and t-statistics
significant at the 10% level.7) Due to the poor
performance of all the models except CYP
model, the subsequent analysis focuses on the
CYP model only. Such a result demonstrates the
importance of choosing appropriate models for
the case under investigation.
Parameters- r, q, K, and MSY were estimated
in Table 2. The catch (273,927 tons) in 2001
exceeded the MSY (198,364 tons), which means
우리나라 멸치자원량추정을 한 잉여생산모델과 최 엔트로피모델의 비교분석
- 27 -
the current level of catch for anchovy are
seriously overexploited. In this case, the actual
level of effort has substantially exceeded that
which produces MSY, so it is possible to
assume that biomass is at a lower level than it
may be in the long run, and that the lower
biomass would result in a lower level of catch.
2. ME model
In this analysis, the GAMS(General Algebraic
Modeling System; Brooke et al., 1998) program
is used to solve the numerical optimization
problems using non-linear programming.
Parameters-A, α, β, r, K -are estimated in
Table 3. Intrinsic growth rate (r) in the ME
model is similar to that of the CYP model,
while environmental carrying capacity (K) in
this model is quite greater than that of the CYP
model. Taking into account anchovy's life span
(1~2 years), the intrinsic growth rates of 0.61
and 0.62 estimated in the CYP model and ME
model are likely to be reasonable.
In terms of using the estimates of
parameters as shown in Table 3, the
estimated equations are constructed as
follows:
803.0034.04
059.03
001.02
095.01505.0 tttttt XEEEEC = (16)
tt
ttt CX
XXX −−=−+ )000,302,1
1(658.01 (17)
From the results in the equation (16), the
anchovy fishery demonstrates decreasing
returns to effort and stock. The effort
elasticity of catch for anchovy dragnet,
7) According to CYP(1992), better regression fits are
expected from the CYP model since its functional
form is more straightforward than those of any
other SP models.
offshore gillnet, coastal gillnet, and set nets
are 0.095, 0.001, 0.059, and 0.034,
respectively. The elasticity for dragnets is
highest, which means that a 10 percent
increase in effort for dragnets would
increase catch of anchovy by only 0.95
percent. On the contrary, a 10 percent
decrease in effort for set nets would only
decrease anchovy catch by 0.95 percent. In
addition, the stock elasticity is about 0.803.
YearsEstimated probabilities Estimated
stockXt=0 Xt=500,000 Xt=1,000,000
1977 0.14 0.33 0.53 695,000
1978 0.164 0.33 0.506 671,000
1979 0.221 0.33 0.449 614,000
1980 0.261 0.33 0.409 574,000
1981 0.132 0.33 0.538 703,000
1982 0.195 0.33 0.475 640,000
1983 0.23 0.33 0.44 605,000
1984 0.234 0.33 0.436 601,000
1985 0.172 0.33 0.498 663,000
1986 0.193 0.33 0.477 642,000
1987 0.33 0.196 0.474 572,000
1988 0.307 0.33 0.363 528000
1989 0.303 0.33 0.367 532,000
1990 0.247 0.33 0.423 588,000
1991 0.282 0.33 0.388 553000
1992 0.158 0.33 0.512 677,000
1993 0.111 0.33 0.559 724,000
1994 0.313 - 0.687 687,000
1995 0.291 - 0.709 709,000
1996 0.308 - 0.692 692,000
1997 0.33 - 0.67 670,000
1998 0.33 0.031 0.639 654,500
1999 0.33 0.099 0.571 620500
2000 0.33 0.147 0.523 596500
2001 0.33 0.122 0.548 609000
<Table 4> Estimated annual stock of anchovy
in coastal seas of Korea
표 희 동
- 28 -
From the logistic growth function of
equation (17) estimated using ME model,
the MSY is calculated to be 213,287 tons,
which is slightly higher than that of CYP
model (198,364 tonnes). The biomass for
MSY is 651,000 tons, which is considerably
greater than that of the CYP model (322,881
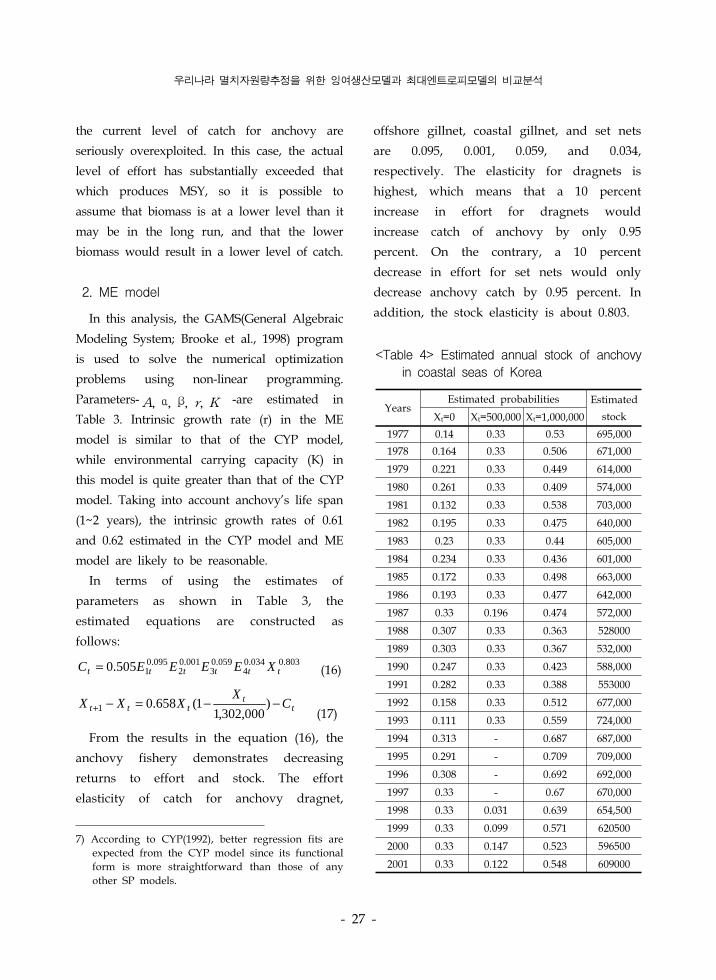
tons). In the annual results of the estimated
stock of Table 4, it is found that the annual
biomass estimated in the ME model had
declined for several years, and then
recovered the year after that, which is
around the level of the maximum
sustainable biomass estimated.
V. SUMMARY AND
CONCLUSIONS
As a contribution to developing fishery
stock assessment method and optimum
sustainable yield, SP model and ME model
are employed for anchovy in this paper.
For selecting the appropriate models of
five traditional surplus models - Schaefer,
Schnute, Walters and Hilborn, Fox, and CYP
models are tested in effort and catch data
of anchovy fisheries. Surprisingly all the
models except CYP model fail to satisfy
statistical standards such as fitness and
significance. Generally, the CYP model holds
good fitness and statistically significant level
for anchovy fisheries.
Taking account of the full range of
uncertainties into non-linear programming,
ME model can also be applied to estimate
the yearly fishery stock, MSY, and the
maximum sustainable biomass. The observed
variables in the model are catch and effort
data while unknown parameters are
probability distribution of constant, intrinsic
growth rate, environmental carrying
capacity, biomass, α and β(a sort of
elasticity for effort and biomass). ME
formulation seeks a solution that maximizes
the distribution of probabilities reflecting
our uncertainty about parameters subject to
data consistency and normalization-additivity
requirements. The ME approach offers a
method of recovering the desired parameters
of stock assessment with a minimal amount
of prior information when the state system
is nonlinear and the state observation is
noisy.
Intrinsic growth rate (r) in ME model is
similar to that of CYP model, while
environmental carrying capacity (K) in this
model is quite greater than that of CYP
model. Taking into account anchovy's life
span (1~2 years), the intrinsic growth rates
of 0.61 and 0.658 estimated in the CYP
model and the ME model are likely to be
reasonable. The MSY in the ME model is
calculated to be 213,287 tons which is
slightly higher than that of the CYP model
(198,364 tons)8), while the biomass for MSY
is 651,000 tons which is considerably greater
than that of CYP model (322,881 tons). The
annual biomass estimated in ME model had
declined for several years, and then
recovered the year after that, which is
8) NFRDI(2004) estimated anchovy's MSY and its
optimal sustainable yield to be 117,417 tons and
224,667 tons, using Fox model and
ABC(Allowable Biological Catch) model,
respectively,
우리나라 멸치자원량추정을 한 잉여생산모델과 최 엔트로피모델의 비교분석
- 29 -
around the level of the maximum
sustainable biomass estimated.
This paper can be extended to estimate
maximum economic yield considering price
and cost, and to employ alternative growth
function and production function. In
addition, economic factors and fishing
efforts such as price, cost, technical change
and a reasonable function of fishing inputs
should simultaneously be considered.
REFERENCES
Bailey, R.S.․Simmonds, E.J. "The use of
acoustic surveys in the assessment of the
North Sea herring stock and comparison
with other methods" Reun. Conns. int
Explor. Mer., 189: 9~17, 1990.
Beverton, R.J.H.․S.J. Holt "On the Dynamics
of Exploited Fish Populations" Fisheries
Investment Series 2, Vol. 19, UK Ministry
of Agriculture and Fisheries, London,
1957.
Brierley, A.S.․Gull, S.F., Wafg, M.H. "A
Baysian maximum entropy reconstruction
of stock distribution and inference of
stock density from line-transect
acoustic-survey data", ICES J. Marine
Science, 60: 446~452, 2003.
Brooke, A.․D. Kendrick․A. Meeraus․R.
Raman "GAMS A User's Guide" GAMS
Development Corporation, 1998.
Choi, S,K․Kim, J.Y.․Kim, S.S.․Choi, Y.
M.․Choi, K.H. "Biomass estimation of
anchovy by acoustic and trawl surveys
during spring season in the southern
Korean waters" J. Korean Soc. Fish. Res.,
4: 20~29, 2001.(in Korean)
Chow, G. "Econometric Analysis by Control
Methods", John, Wiley & Sons, 1981.
Clarke, R.P.․S.S. Yoshimoto․S.G. Pooley
"A Bioeconomic Analysis of the
North-western Hawaiian Islands Lobster
Fishery" Marine Resource Economics 7:
115~140, 1992.
Coppola, G. "A Production Function for
Fisheries: an Analytical Approach" Paper
presented at the 5th Bioeconomic
Modelling Workshop, Edinburgh, pp.24~27
October 1995.
Fox, W.J. "An Exponential Surplus Yield
Model for Optimising Exploited Fish
Populations" Transactions of the American
Fisheries Society 99: 80~88, 1970.
Fulton․Karp, L. "Estimating the Objectives
of a Public Firm in a Natural Resources
Industry" Journal of Environmental
Economics and Management 16: 268~287,
1989.
Golan, A.․G. Judge․L. Karp "A Maximum
Entropy Approach to Estimation and
Inference in Dynamic models or Counting
Fish in the Sea using Maximum Entropy"
Journal of Economic Dynamics and
Control 20: 559~582, 1996a.
Golan, A.․G. Judge․D. Miller "A
Maximum Entropy Econometrics" John
Wiley & Sons, 1996b.
Jacobson, L.D.․De Oliveira, J.A.A.․Barange,
M.․Cisneros-Mata, M.A.․Felix-Uraga,
R.․Kim, J.Y.․Natsuura, Y.․Niquen, M.․
Porteiro, C.․Rothschild, B.․Sanchez, R.
P.․Serra, R.․Uriarte, A.․Wada, T.
"Surplus production, variability, and
climate change in the great sardine and
표 희 동
- 30 -
anchovy fisheries" Can. J. Fish. Aquat.
Sci., 58:1891-1903, 2001.
NFRDI(National Fisheries Research and
Development Institute) "Report on stock
assessment of target species of TAC",
2005.(in Korean)
Pascoe, S. "A Bioeconomic Analysis of the
UK Fisheries of the English Channel" PhD
Thesis, University of Portsmouth, UK,
1998.
Paris, Q.․R.E. Howitt "An Analysis of
Ill-posed Production Problems using ME"
American Journal of Agricultural
Economics 80: 124~138, 1998.
Pella, J.J.․P.K. Tomlinson "A Generalized
Stock Production Model" Bulletin of the
Inter-American Tropical Tuna Commission
13: 419~496, 1969.
Pyo, H.D.․K.N. Lee "A Comparative
Analysis of Surplus Production Model and
Maximum Entropy Model for Estimating
the Anchovy's Stock" Session 12:Fisheries
Dynamics(1), pp.2~8 in: Proceedings of
EAFE(European Association of Fisheries
Economists) XV Conference, IFREMER,
Brest, France, pp.15~16 May 2003.
Schaefer, M.B. "Some Aspects of the
Dynamics of Populations Important to the
Management of Commercial Marine
Fisheries" Bulletin of the Inter-American
Tropical Tuna Commission 1:247~285,
1954.
Schaefer, M.B. "A Study of the Dynamics of
the Fishery for Yellowfin Tuna in the
Eastern Tropical Pacific Ocean" Bulletin of
the Inter-American Tropical Tuna
Commission 2: 247~285, 1957.
Schnute, J. "Improved Estimates from the
Schaefer Production Model: Theoretical
Considerations" J. the Fisheries Research
Board of Canada 34: .583~603, 1977.
Shannon, C.E. "A Mathematical Theory of
Communication" Bell System Technical
Journal 27: 379~423, 1948.
Walters, C.J.․R. Hilborn "Adaptive Control
of Fishing System" J. Fisheries Research
Board of Canada 33: 145~159, 1976.
Related Documents