1 กองทุนเปิด แอสเซทพลัส อสังหาริมทรัพย์และโครงสร้างพื้นฐาน เฟล็กซิเบิล Asset Plus Property and Infrastructure Flexible Fund (ASP-PROPIN) (กองทุนนี้ลงทุนกระจุกตัวในหมวดอุตสาหกรรมอสังหาริมทรัพย์และ/หรือโครงสร้างพื้นฐานจึงมีความเสี่ยงที่ผู้ลงทุนอาจสูญเสียเงินลงทุนจานวนมาก)

Welcome message from author
This document is posted to help you gain knowledge. Please leave a comment to let me know what you think about it! Share it to your friends and learn new things together.
Transcript
1
กองทนเปด แอสเซทพลส อสงหารมทรพยและโครงสรางพนฐาน เฟลกซเบล
Asset Plus Property and Infrastructure Flexible Fund (ASP-PROPIN)
(กองทนนลงทนกระจกตวในหมวดอตสาหกรรมอสงหารมทรพยและ/หรอโครงสรางพนฐานจงมความเสยงทผลงทนอาจสญเสยเงนลงทนจ านวนมาก)
2
ASP-PROPINASP-PROPIN
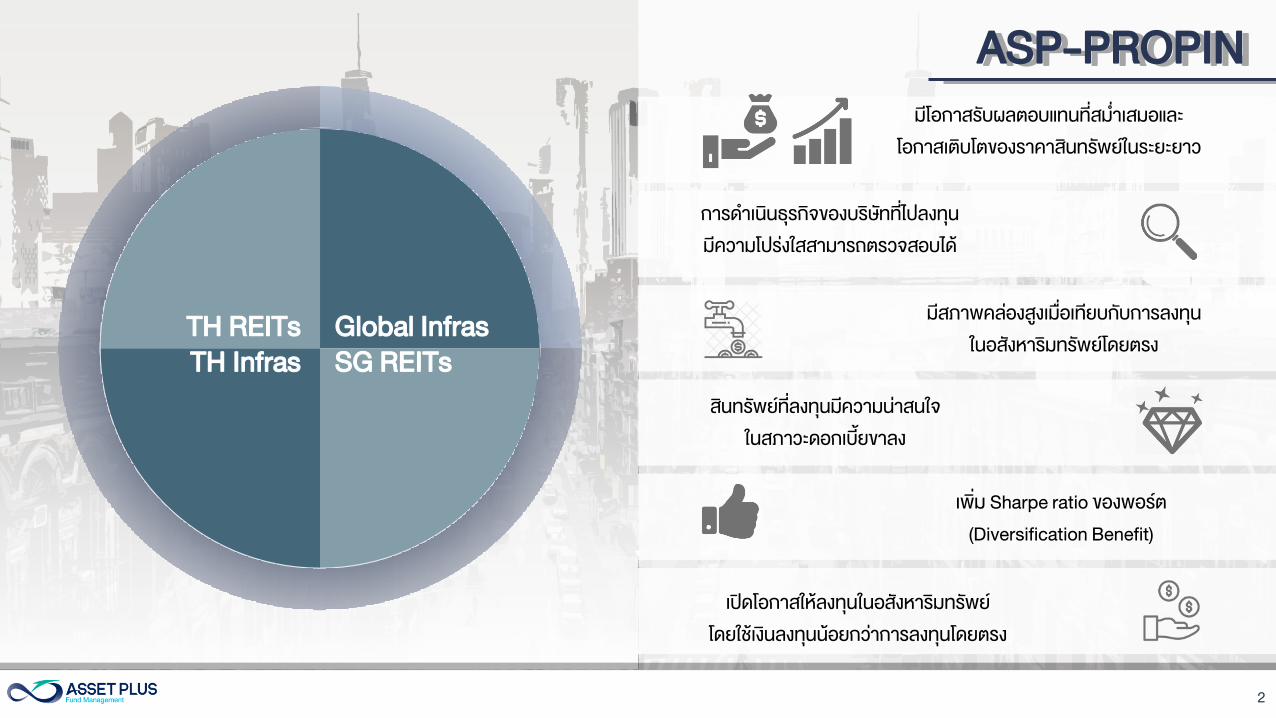
TH REITs
SG REITsTH Infras
Global Infras
สนทรพยทลงทนมความนาสนใจ
ในสภาวะดอกเบยขาลง
เพม Sharpe ratio ของพอรต
(Diversification Benefit)
มสภาพคลองสงเมอเทยบกบการลงทน
ในอสงหารมทรพยโดยตรง
การด าเนนธรกจของบรษททไปลงทน
มความโปรงใสสามารถตรวจสอบได
เปดโอกาสใหลงทนในอสงหารมทรพย
โดยใชเงนลงทนนอยกวาการลงทนโดยตรง
มโอกาสรบผลตอบแทนทสม าเสมอและ
โอกาสเตบโตของราคาสนทรพยในระยะยาว
3
114.21
4.37
5.08
2.36
3.26
1.47
1.92
0.00
2.00
4.00
6.00
8.00
S&P Global
Infrastructure Index
FTSE Straits Times Real
Estate Investment Trust
Index
SETPREIT Index MSCI World Index SET Index 10Y Th Bond Yield 10Y US Bond Yield
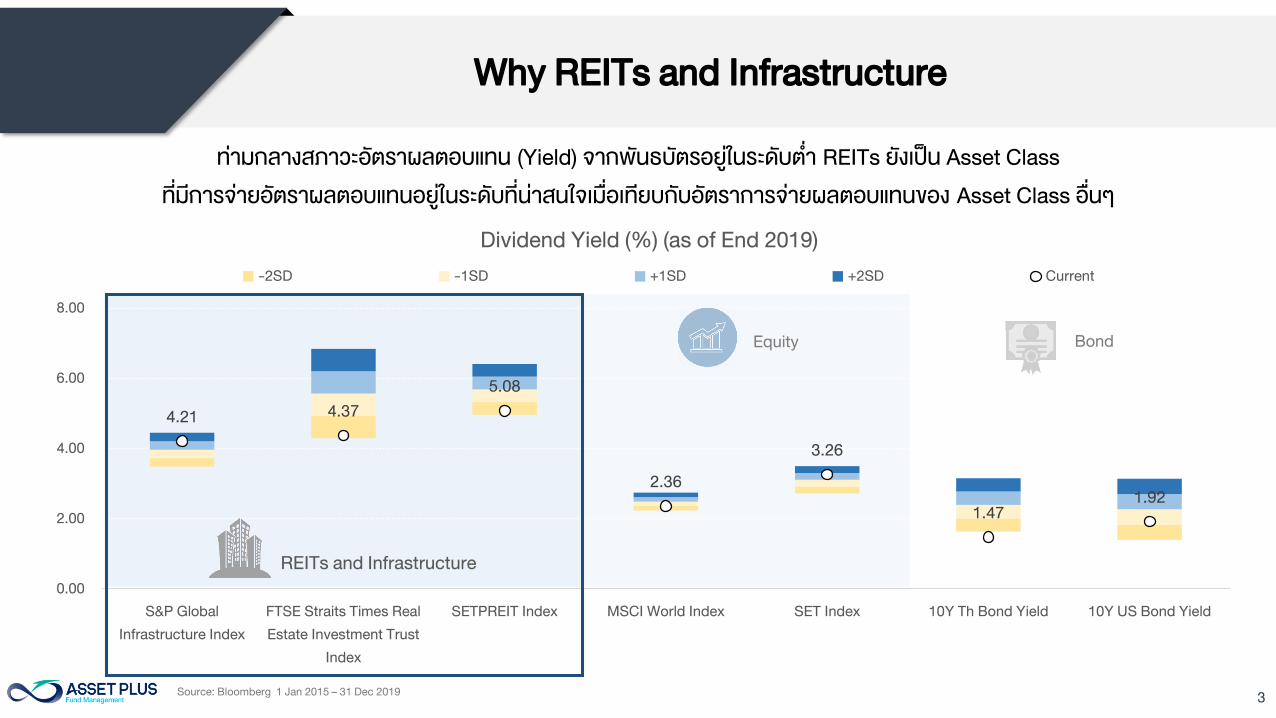
Dividend Yield (%) (as of End 2019)
-2SD -1SD +1SD +2SD Current
Why REITs and Infrastructure
ทามกลางสภาวะอตราผลตอบแทน (Yield) จากพนธบตรอยในระดบต า REITs ยงเปน Asset Class
ทมการจายอตราผลตอบแทนอยในระดบทนาสนใจเมอเทยบกบอตราการจายผลตอบแทนของ Asset Class อนๆ
Source: Bloomberg 1 Jan 2015 – 31 Dec 2019
REITs and Infrastructure
BondEquity
4
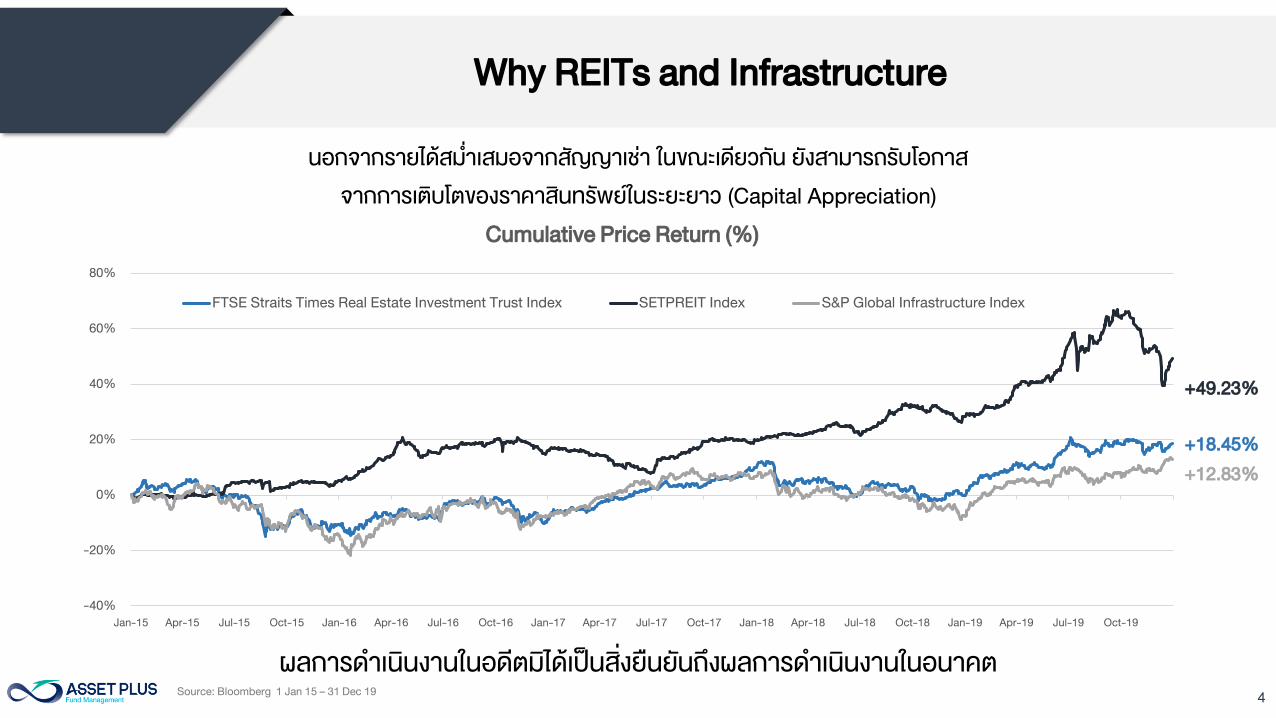
Why REITs and Infrastructure
นอกจากรายไดสม าเสมอจากสญญาเชา ในขณะเดยวกน ยงสามารถรบโอกาส
จากการเตบโตของราคาสนทรพยในระยะยาว (Capital Appreciation)
-40%
-20%
0%
20%
40%
60%
80%
Jan-15 Apr-15 Jul-15 Oct-15 Jan-16 Apr-16 Jul-16 Oct-16 Jan-17 Apr-17 Jul-17 Oct-17 Jan-18 Apr-18 Jul-18 Oct-18 Jan-19 Apr-19 Jul-19 Oct-19
Cumulative Price Return (%)
FTSE Straits Times Real Estate Investment Trust Index SETPREIT Index S&P Global Infrastructure Index
+49.23%
+18.45%
+12.83%
Source: Bloomberg 1 Jan 15 – 31 Dec 19
ผลการด าเนนงานในอดตมไดเปนสงยนยนถงผลการด าเนนงานในอนาคต
5
Why REITs and Infrastructure
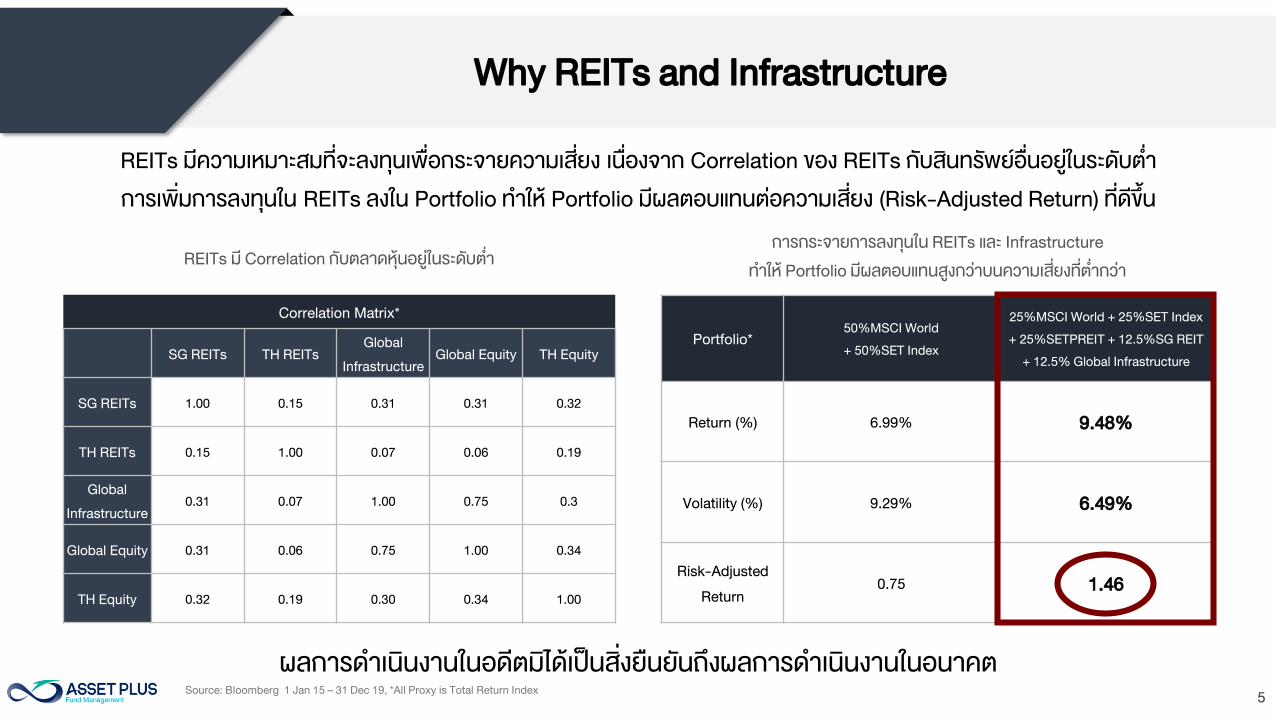
Correlation Matrix*
SG REITs TH REITs
Global
Infrastructure
Global Equity TH Equity
SG REITs 1.00 0.15 0.31 0.31 0.32
TH REITs 0.15 1.00 0.07 0.06 0.19
Global
Infrastructure
0.31 0.07 1.00 0.75 0.3
Global Equity 0.31 0.06 0.75 1.00 0.34
TH Equity 0.32 0.19 0.30 0.34 1.00
Portfolio*
50%MSCI World
+ 50%SET Index
25%MSCI World + 25%SET Index
+ 25%SETPREIT + 12.5%SG REIT
+ 12.5% Global Infrastructure
Return (%) 6.99% 9.48%
Volatility (%) 9.29% 6.49%
Risk-Adjusted
Return
0.75 1.46
Source: Bloomberg 1 Jan 15 – 31 Dec 19, *All Proxy is Total Return Index
REITs มความเหมาะสมทจะลงทนเพอกระจายความเสยง เนองจาก Correlation ของ REITs กบสนทรพยอนอยในระดบต า
การเพมการลงทนใน REITs ลงใน Portfolio ท าให Portfolio มผลตอบแทนตอความเสยง (Risk-Adjusted Return) ทดขน
REITs ม Correlation กบตลาดหนอยในระดบต า
การกระจายการลงทนใน REITs และ Infrastructure
ท าให Portfolio มผลตอบแทนสงกวาบนความเสยงทต ากวา
ผลการด าเนนงานในอดตมไดเปนสงยนยนถงผลการด าเนนงานในอนาคต
6
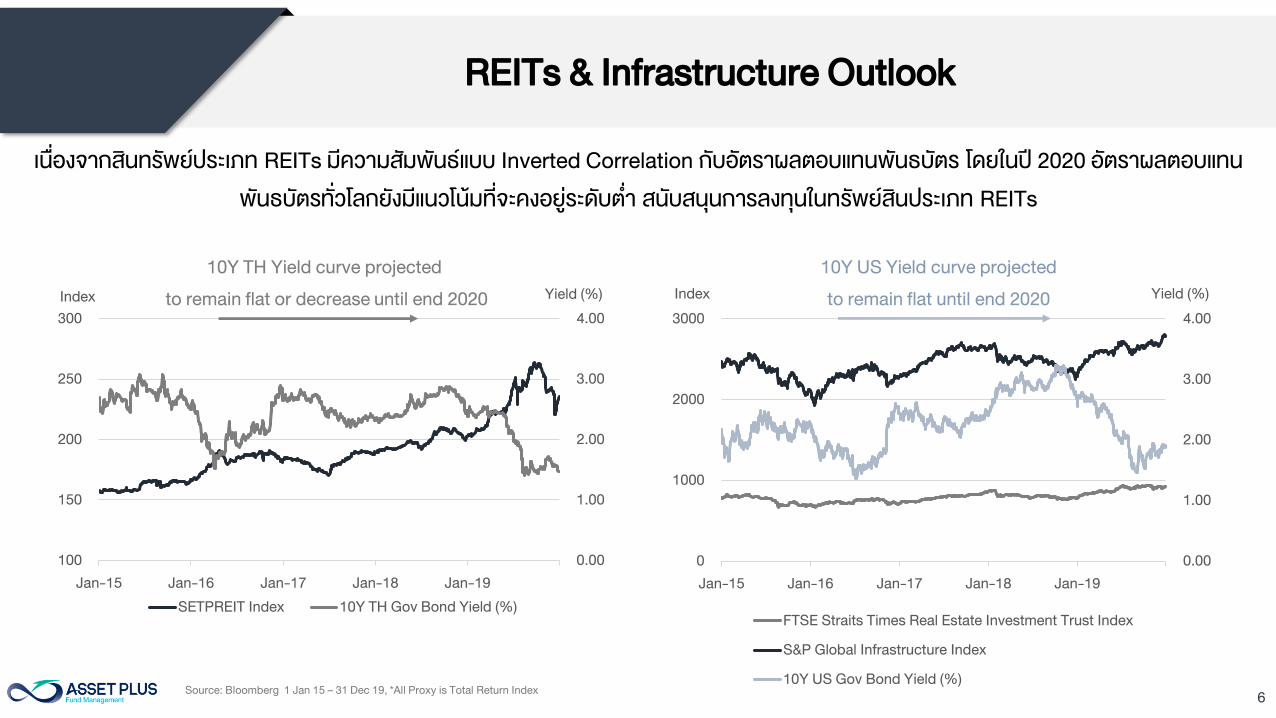
เนองจากสนทรพยประเภท REITs มความสมพนธแบบ Inverted Correlation กบอตราผลตอบแทนพนธบตร โดยในป 2020 อตราผลตอบแทน
พนธบตรทวโลกยงมแนวโนมทจะคงอยระดบต า สนบสนนการลงทนในทรพยสนประเภท REITs
0.00
1.00
2.00
3.00
4.00
100
150
200
250
300
Jan-15 Jan-16 Jan-17 Jan-18 Jan-19
Yield (%)Index
SETPREIT Index 10Y TH Gov Bond Yield (%)
0.00
1.00
2.00
3.00
4.00
0
1000
2000
3000
Jan-15 Jan-16 Jan-17 Jan-18 Jan-19
Yield (%)Index
FTSE Straits Times Real Estate Investment Trust Index
S&P Global Infrastructure Index
10Y US Gov Bond Yield (%)
10Y TH Yield curve projected
to remain flat or decrease until end 2020
10Y US Yield curve projected
to remain flat until end 2020
REITs & Infrastructure Outlook
Source: Bloomberg 1 Jan 15 – 31 Dec 19, *All Proxy is Total Return Index
7
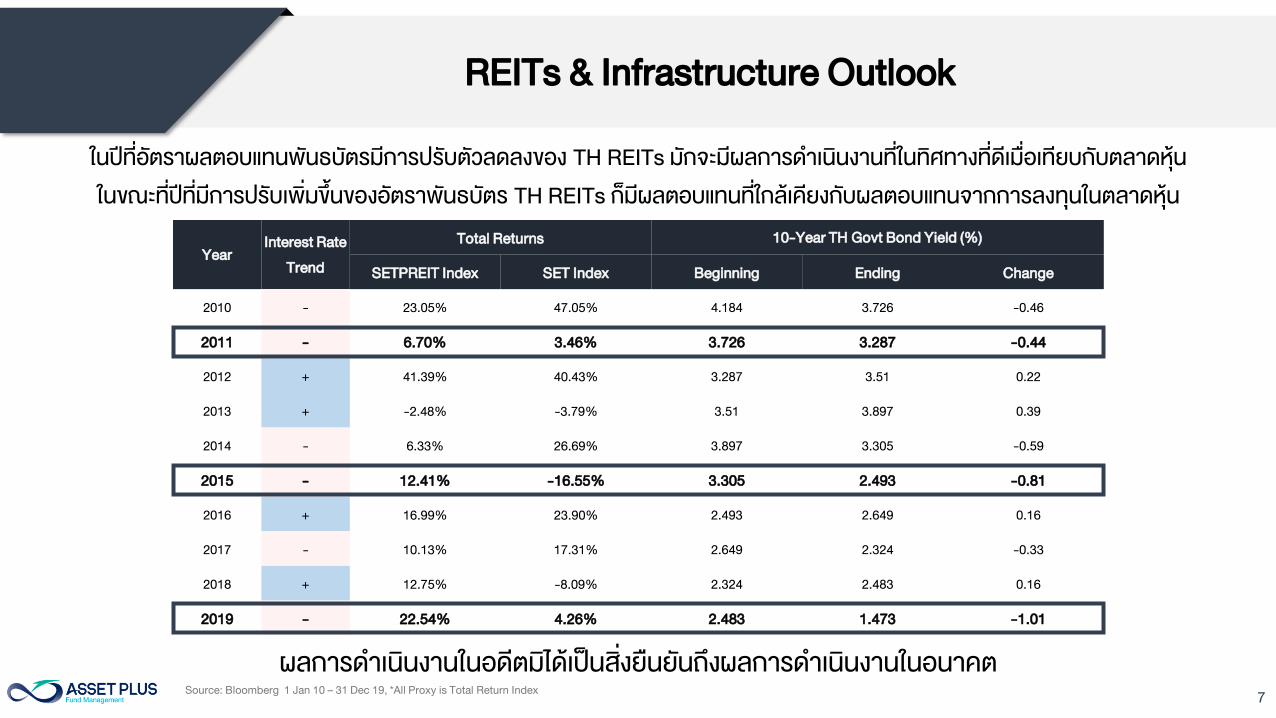
ในปทอตราผลตอบแทนพนธบตรมการปรบตวลดลงของ TH REITs มกจะมผลการด าเนนงานทในทศทางทดเมอเทยบกบตลาดหน
ในขณะทปทมการปรบเพมขนของอตราพนธบตร TH REITs กมผลตอบแทนทใกลเคยงกบผลตอบแทนจากการลงทนในตลาดหน
Year
Interest Rate
Trend
Total Returns 10-Year TH Govt Bond Yield (%)
SETPREIT Index SET Index Beginning Ending Change
2010 - 23.05% 47.05% 4.184 3.726 -0.46
2011 - 6.70% 3.46% 3.726 3.287 -0.44
2012 + 41.39% 40.43% 3.287 3.51 0.22
2013 + -2.48% -3.79% 3.51 3.897 0.39
2014 - 6.33% 26.69% 3.897 3.305 -0.59
2015 - 12.41% -16.55% 3.305 2.493 -0.81
2016 + 16.99% 23.90% 2.493 2.649 0.16
2017 - 10.13% 17.31% 2.649 2.324 -0.33
2018 + 12.75% -8.09% 2.324 2.483 0.16
2019 - 22.54% 4.26% 2.483 1.473 -1.01
REITs & Infrastructure Outlook
Source: Bloomberg 1 Jan 10 – 31 Dec 19, *All Proxy is Total Return Index
ผลการด าเนนงานในอดตมไดเปนสงยนยนถงผลการด าเนนงานในอนาคต
8
Thailand REITs Outlook
9Source: Bloomberg as of 30 December 2019
2.00
3.00
4.00
5.00
Jan-15 Jan-16 Jan-17 Jan-18 Jan-19
TH REITs Yield Spread (%)
Spread (TH REITs Yield - 10Y TH Government Bond Yield)
0.00
2.00
4.00
6.00
8.00
Jan-15 Jan-16 Jan-17 Jan-18 Jan-19
TH REITs Yield vs. Bond Yield
TH REITs Yield(%) 10Y TH Bond Yield(%)
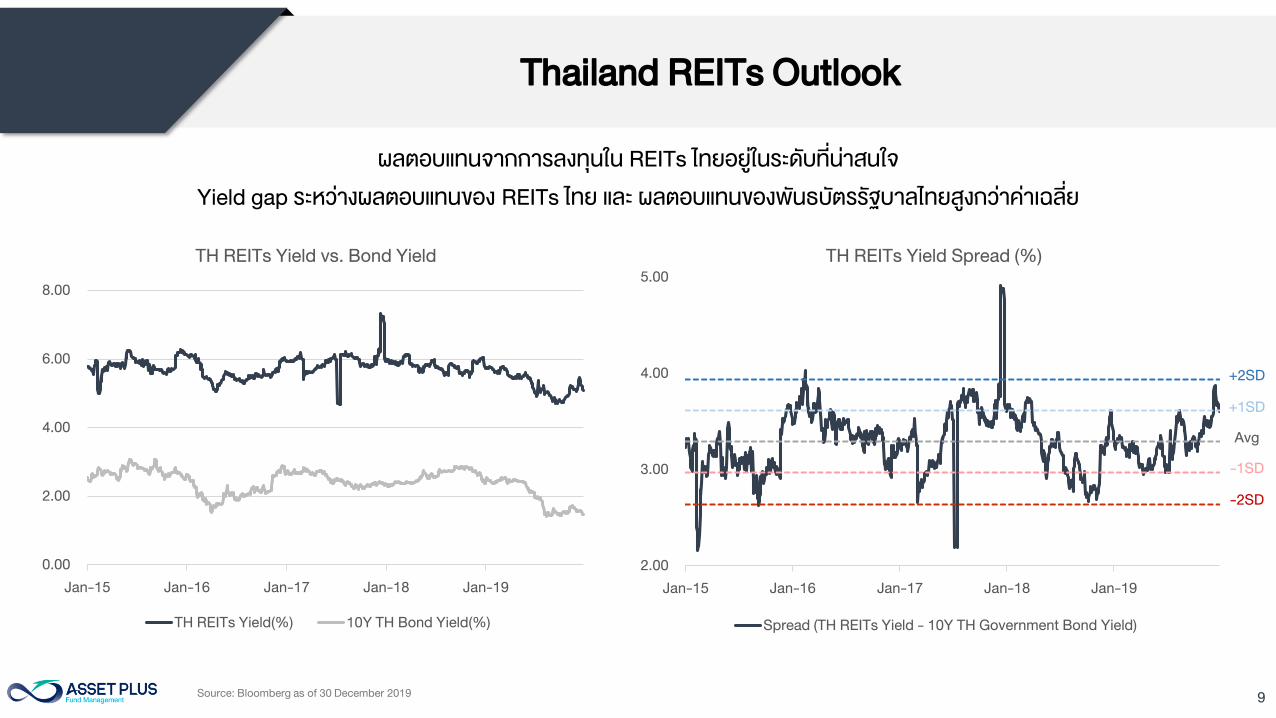
Thailand REITs Outlook
ผลตอบแทนจากการลงทนใน REITs ไทยอยในระดบทนาสนใจ
Yield gap ระหวางผลตอบแทนของ REITs ไทย และ ผลตอบแทนของพนธบตรรฐบาลไทยสงกวาคาเฉลย
Avg
-1SD
-2SD
+2SD
+1SD
10
Thailand REITs Outlook
Source: Companies, DBS Bank as of 4 April 2018.
ชอ เหตผล
มลคาทรพยสน
ทลงทน
รายละเอยด
AIMRT Increase capital 4,300 ถงเกบสารเคมเหลว คลงสนคา คลงหองเยน
AIMCG IPO 2,800
ยดทาวน อดรธาน, โครงการ 72 คอรทยารต ทองหลอ
และ โครงการพอรโต ชโน สมทรสาคร
SUPEREIF IPO 8,500
โรงไฟฟาพลงงานแสงอาทตย
VSPP 19 โครงการ
DREIT Increase capital 2,400 โรงแรมดสตธาน มลดฟส
CRYSTAL Increase capital 7,300 Community Mall 10 โครงการ
CPNREIT Increase capital 33,100
4 โครงการเซนทรล ตออายเชาพระราม2
อาคารยนลเวอรเฮาส และเดอะไนน ทาวเวอร
BOFFICE Increase capital 3,300 อาคารสวนส านกงานภรช ทาวเวอรแอท ไบเทค บางนา
DIF Increase capital 15,800
เสาโทรคมนาคมของ , กรรมสทธในใยแกวน าแสง,
กรรมสทธใน FOC
JASIF Increase capital 38,000
ใยแกวน าแสง (Optical Fiber Cables)
จ านวนไมเกน 700,000 คอร กโลเมตร
FTREIT Increase capital 3,300 กรรมสทธในอาคารคลงสนคา
000
200
400
600
800
1,000
20
03
20
04
20
05
20
06
20
07
20
08
20
09
20
10
20
11
20
12
20
13
20
14
20
15
20
16
20
17
20
18
20
19
Unit : Billion Baht
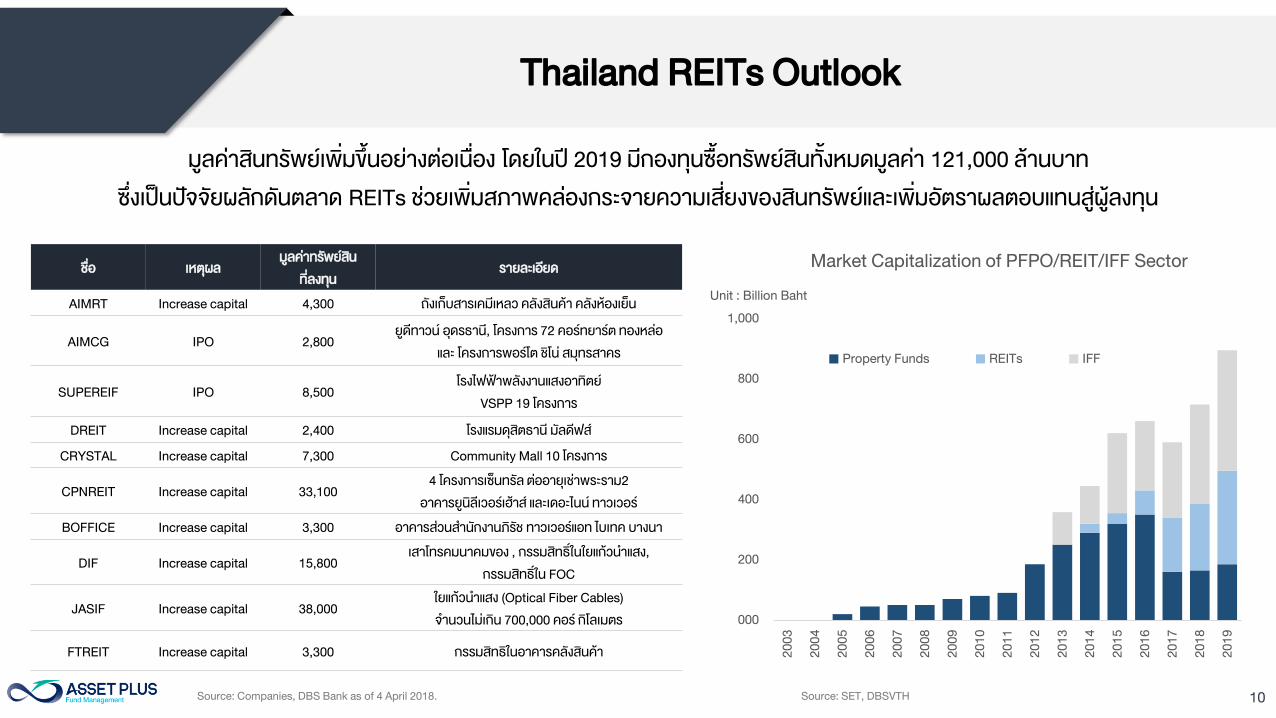
Market Capitalization of PFPO/REIT/IFF Sector
Property Funds REITs IFF
Source: SET, DBSVTH
มลคาสนทรพยเพมขนอยางตอเนอง โดยในป 2019 มกองทนซอทรพยสนทงหมดมลคา 121,000 ลานบาท
ซงเปนปจจยผลกดนตลาด REITs ชวยเพมสภาพคลองกระจายความเสยงของสนทรพยและเพมอตราผลตอบแทนสผลงทน
11
Sector Outlook – TH REITs
INDUSTRIAL OFFICE
RETAIL
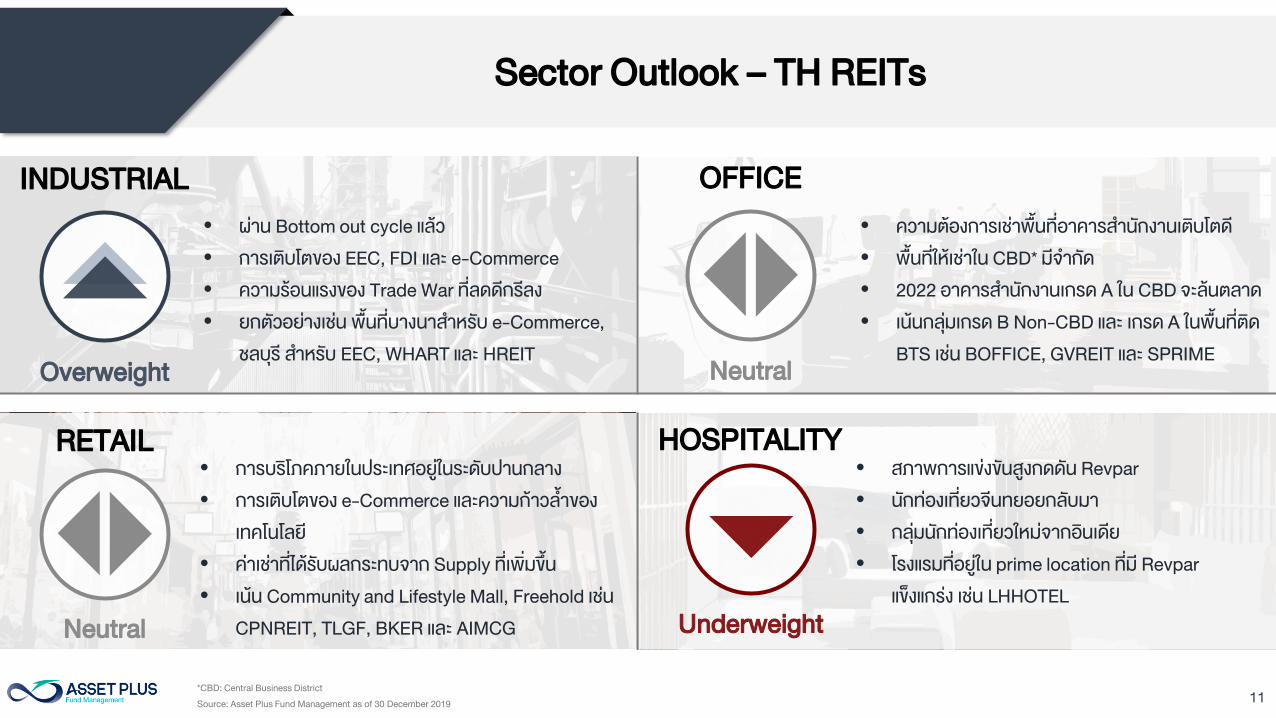
• ความตองการเชาพนทอาคารส านกงานเตบโตด
• พนทใหเชาใน CBD* มจ ากด
• 2022 อาคารส านกงานเกรด A ใน CBD จะลนตลาด
• เนนกลมเกรด B Non-CBD และ เกรด A ในพนทตด
BTS เชน BOFFICE, GVREIT และ SPRIME
• ผาน Bottom out cycle แลว
• การเตบโตของ EEC, FDI และ e-Commerce
• ความรอนแรงของ Trade War ทลดดกรลง
• ยกตวอยางเชน พนทบางนาส าหรบ e-Commerce,
ชลบร ส าหรบ EEC, WHART และ HREIT
• การบรโภคภายในประเทศอยในระดบปานกลาง
• การเตบโตของ e-Commerce และความกาวล าของ
เทคโนโลย
• คาเชาทไดรบผลกระทบจาก Supply ทเพมขน
• เนน Community and Lifestyle Mall, Freehold เชน
CPNREIT, TLGF, BKER และ AIMCG
HOSPITALITY
• สภาพการแขงขนสงกดดน Revpar
• นกทองเทยวจนทยอยกลบมา
• กลมนกทองเทยวใหมจากอนเดย
• โรงแรมทอยใน prime location ทม Revpar
แขงแกรง เชน LHHOTEL
Neutral
Underweight
*CBD: Central Business District
Source: Asset Plus Fund Management as of 30 December 2019
Overweight
Neutral

12
INDUSTRIAL
13
Industrial Outlook
Source: UNCTAD, BOT, Company data, KGI Research
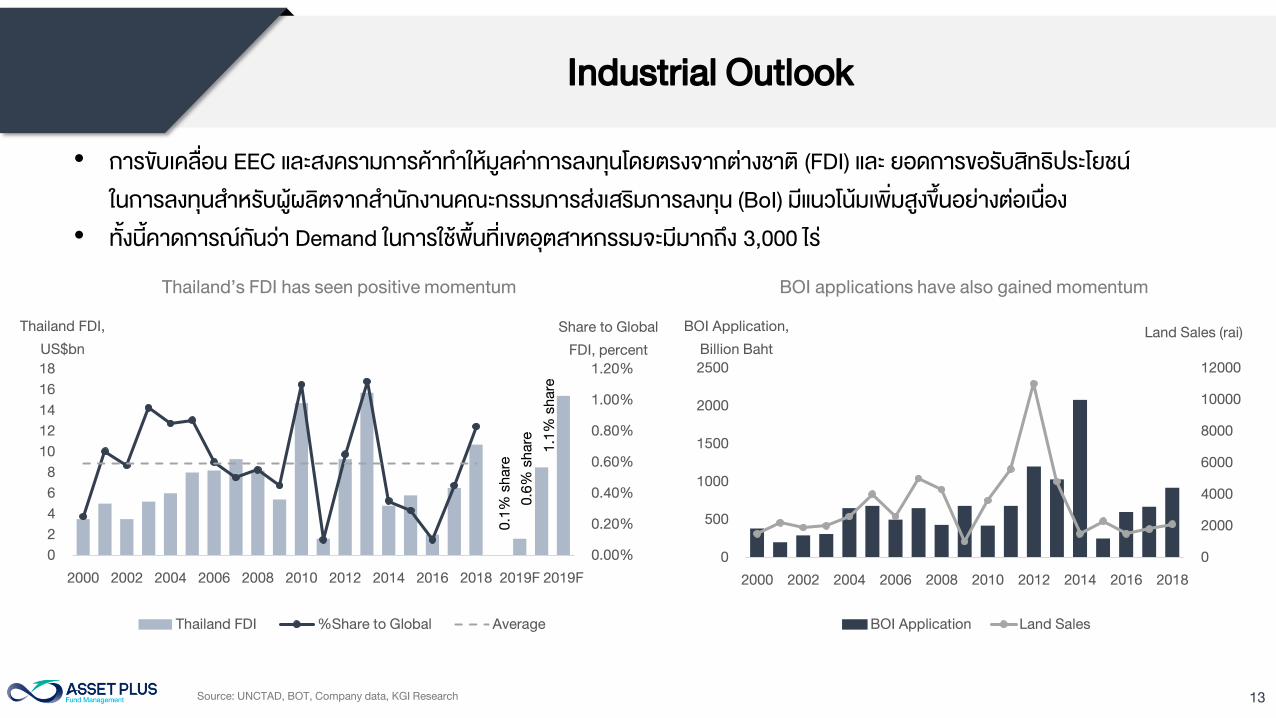
• การขบเคลอน EEC และสงครามการคาท าใหมลคาการลงทนโดยตรงจากตางชาต (FDI) และ ยอดการขอรบสทธประโยชน
ในการลงทนส าหรบผผลตจากส านกงานคณะกรรมการสงเสรมการลงทน (BoI) มแนวโนมเพมสงขนอยางตอเนอง
• ทงนคาดการณกนวา Demand ในการใชพนทเขตอตสาหกรรมจะมมากถง 3,000 ไร
0.00%
0.20%
0.40%
0.60%
0.80%
1.00%
1.20%
0
2
4
6
8
10
12
14
16
18
2000 2002 2004 2006 2008 2010 2012 2014 2016 2018 2019F 2019F
Share to Global
FDI, percent
Thailand FDI,
US$bn
Thailand FDI %Share to Global Average
0.1
% sh
are
0.6
% sh
are
1.1
% sh
are
0
2000
4000
6000
8000
10000
12000
0
500
1000
1500
2000
2500
2000 2002 2004 2006 2008 2010 2012 2014 2016 2018
Land Sales (rai)BOI Application,
Billion Baht
BOI Application Land Sales
Thailand’s FDI has seen positive momentum BOI applications have also gained momentum
14
Industrial Outlook
30%
25% 25%24%
20% 20%
0%
10%
20%
30%
40%
Philippines China Indonesia Malaysia Thailand Vietnam
Corporate Income Tax
Source : CEIC , Trading Economics , KGI Research
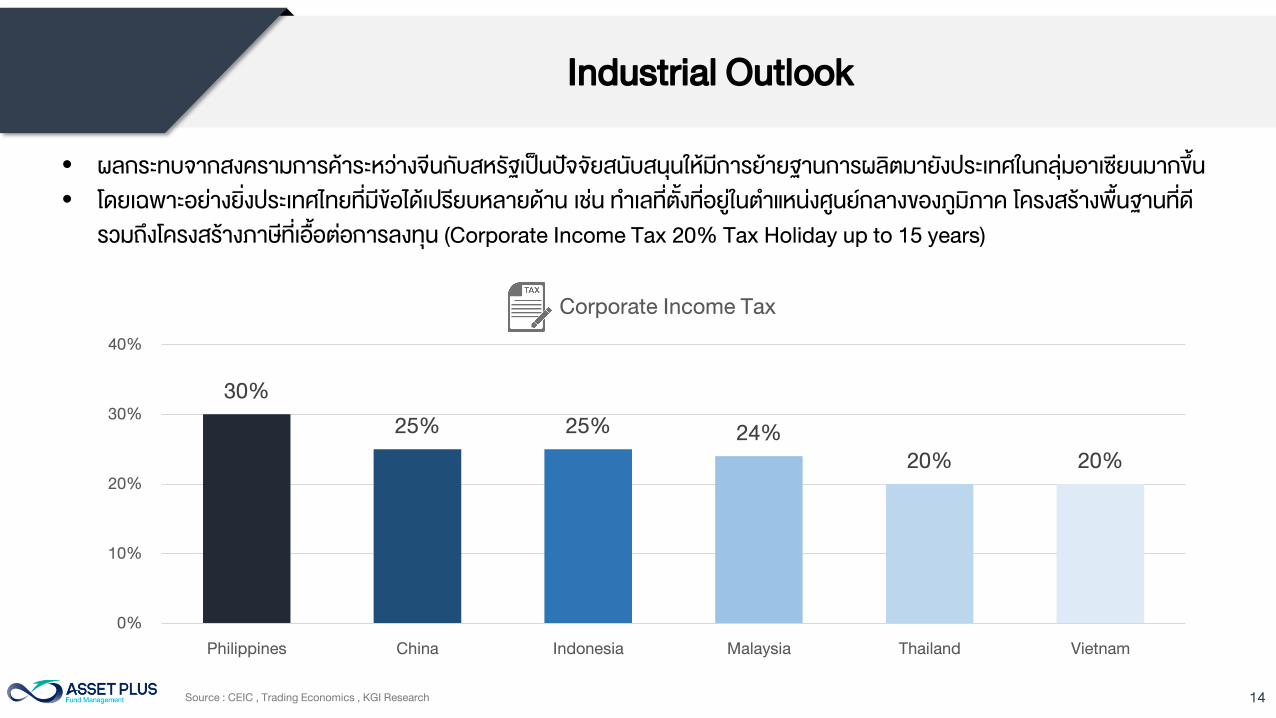
• ผลกระทบจากสงครามการคาระหวางจนกบสหรฐเปนปจจยสนบสนนใหมการยายฐานการผลตมายงประเทศในกลมอาเซยนมากขน
• โดยเฉพาะอยางยงประเทศไทยทมขอไดเปรยบหลายดาน เชน ท าเลทตงทอยในต าแหนงศนยกลางของภมภาค โครงสรางพนฐานทด
รวมถงโครงสรางภาษทเออตอการลงทน (Corporate Income Tax 20% Tax Holiday up to 15 years)
15
Industrial Outlook
Source : Bangkok Post Newspaper, SCBS investment Research
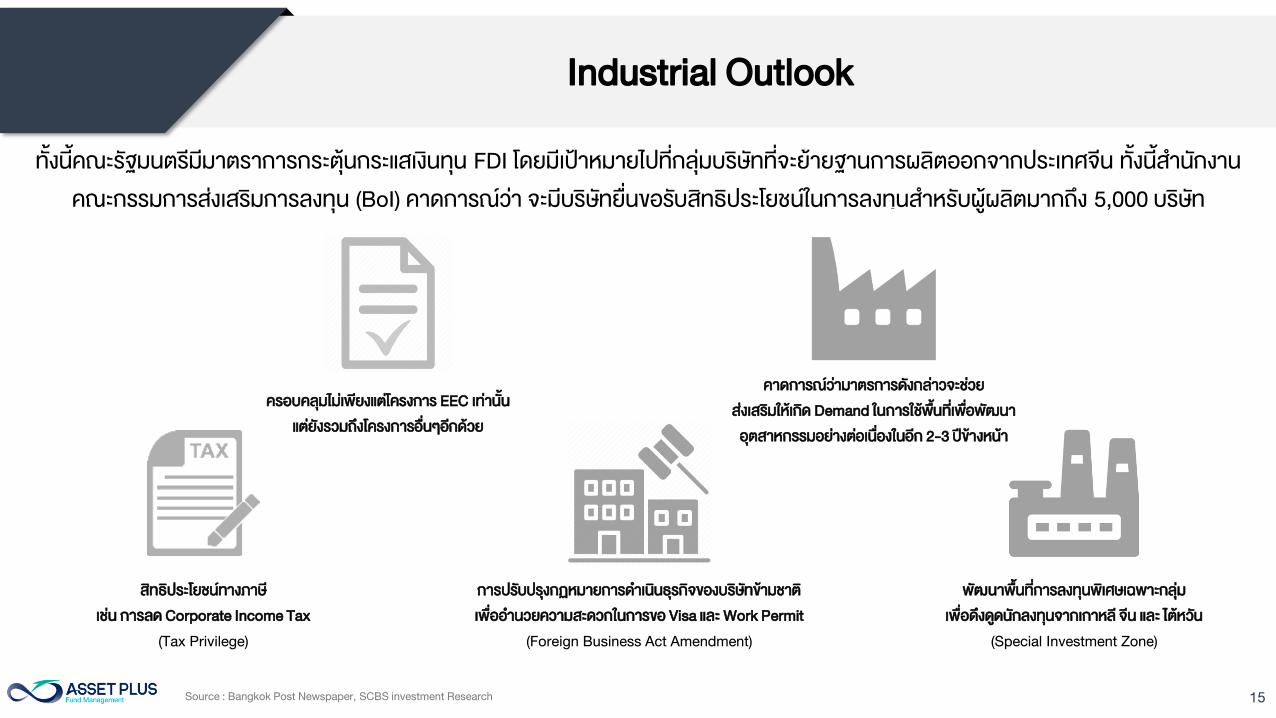
ทงนคณะรฐมนตรมมาตราการกระตนกระแสเงนทน FDI โดยมเปาหมายไปทกลมบรษททจะยายฐานการผลตออกจากประเทศจน ทงนส านกงาน
คณะกรรมการสงเสรมการลงทน (BoI) คาดการณวา จะมบรษทยนขอรบสทธประโยชนในการลงทนส าหรบผผลตมากถง 5,000 บรษท
สทธประโยชนทางภาษ
เชน การลด Corporate Income Tax
(Tax Privilege)
การปรบปรงกฏหมายการด าเนนธรกจของบรษทขามชาต
เพออ านวยความสะดวกในการขอ Visa และ Work Permit
(Foreign Business Act Amendment)
พฒนาพนทการลงทนพเศษเฉพาะกลม
เพอดงดดนกลงทนจากเกาหล จน และ ไตหวน
(Special Investment Zone)
ครอบคลมไมเพยงแตโครงการ EEC เทานน
แตยงรวมถงโครงการอนๆอกดวย
คาดการณวามาตรการดงกลาวจะชวย
สงเสรมใหเกด Demand ในการใชพนทเพอพฒนา
อตสาหกรรมอยางตอเนองในอก 2-3 ปขางหนา
16
Industrial Outlook
Source : Bangkok Post Newspaper, SCBS investment Research
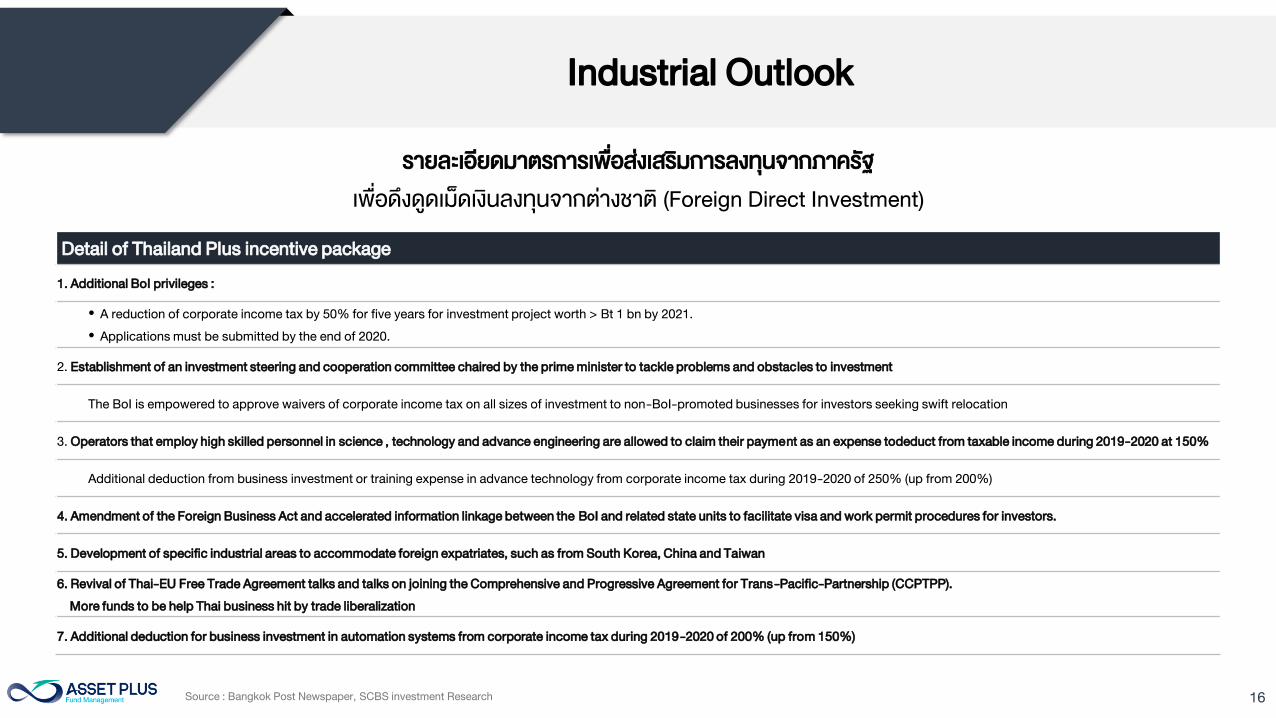
Detail of Thailand Plus incentive package
1. Additional BoI privileges :
• A reduction of corporate income tax by 50% for five years for investment project worth > Bt 1 bn by 2021.
• Applications must be submitted by the end of 2020.
2. Establishment of an investment steering and cooperation committee chaired by the prime minister to tackle problems and obstacles to investment
The BoI is empowered to approve waivers of corporate income tax on all sizes of investment to non-BoI-promoted businesses for investors seeking swift relocation
3. Operators that employ high skilled personnel in science , technology and advance engineering are allowed to claim their payment as an expense todeduct from taxable income during 2019-2020 at 150%
Additional deduction from business investment or training expense in advance technology from corporate income tax during 2019-2020 of 250% (up from 200%)
4. Amendment of the Foreign Business Act and accelerated information linkage between the BoI and related state units to facilitate visa and work permit procedures for investors.
5. Development of specific industrial areas to accommodate foreign expatriates, such as from South Korea, China and Taiwan
6. Revival of Thai-EU Free Trade Agreement talks and talks on joining the Comprehensive and Progressive Agreement for Trans-Pacific-Partnership (CCPTPP).
More funds to be help Thai business hit by trade liberalization
7. Additional deduction for business investment in automation systems from corporate income tax during 2019-2020 of 200% (up from 150%)
รายละเอยดมาตรการเพอสงเสรมการลงทนจากภาครฐ
เพอดงดดเมดเงนลงทนจากตางชาต (Foreign Direct Investment)
17
Industrial Outlook
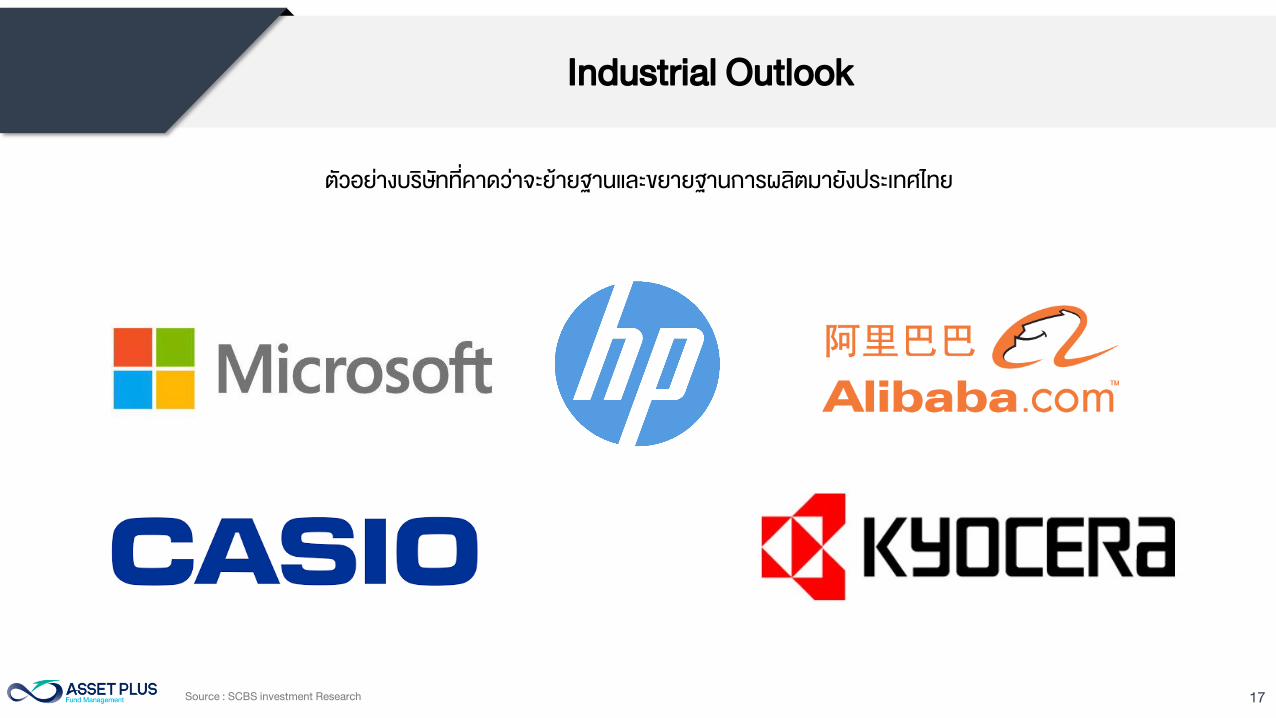
ตวอยางบรษททคาดวาจะยายฐานและขยายฐานการผลตมายงประเทศไทย
Source : SCBS investment Research
18
Industrial Outlook
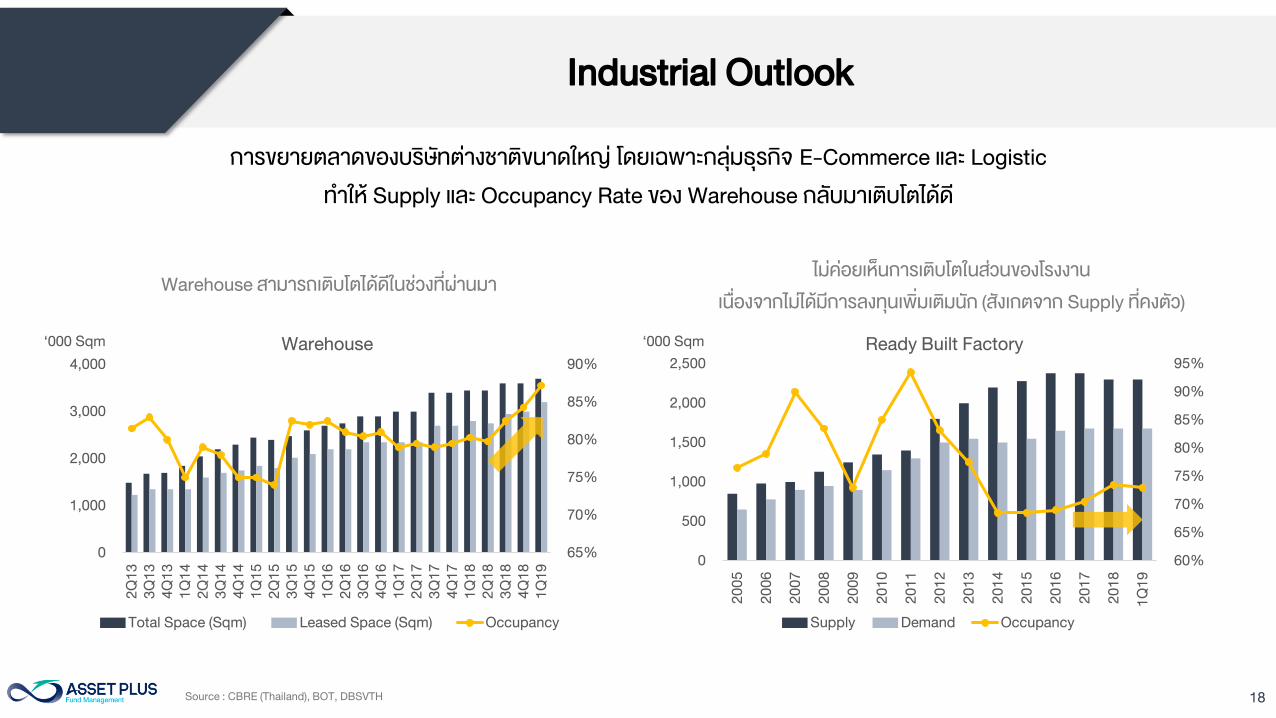
การขยายตลาดของบรษทตางชาตขนาดใหญ โดยเฉพาะกลมธรกจ E-Commerce และ Logistic
ท าให Supply และ Occupancy Rate ของ Warehouse กลบมาเตบโตไดด
Warehouse สามารถเตบโตไดดในชวงทผานมา
ไมคอยเหนการเตบโตในสวนของโรงงาน
เนองจากไมไดมการลงทนเพมเตมนก (สงเกตจาก Supply ทคงตว)
Source : CBRE (Thailand), BOT, DBSVTH
65%
70%
75%
80%
85%
90%
0
1,000
2,000
3,000
4,000
2Q
13
3Q
13
4Q
13
1Q
14
2Q
14
3Q
14
4Q
14
1Q
15
2Q
15
3Q
15
4Q
15
1Q
16
2Q
16
3Q
16
4Q
16
1Q
17
2Q
17
3Q
17
4Q
17
1Q
18
2Q
18
3Q
18
4Q
18
1Q
19
‘000 Sqm Warehouse
Total Space (Sqm) Leased Space (Sqm) Occupancy
60%
65%
70%
75%
80%
85%
90%
95%
0
500
1,000
1,500
2,000
2,500
20
05
20
06
20
07
20
08
20
09
20
10
20
11
20
12
20
13
20
14
20
15
20
16
20
17
20
18
1Q
19
‘000 Sqm Ready Built Factory
Supply Demand Occupancy

19
OFFICE
20
Office Outlook
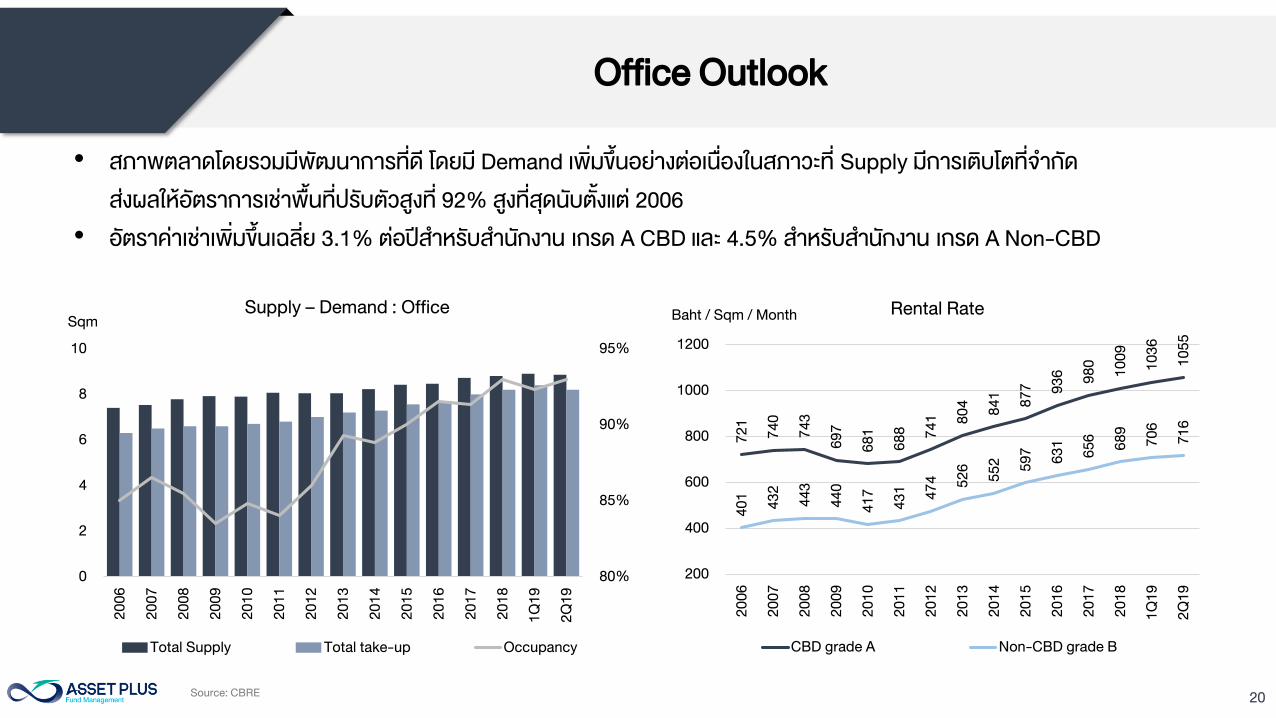
• สภาพตลาดโดยรวมมพฒนาการทด โดยม Demand เพมขนอยางตอเนองในสภาวะท Supply มการเตบโตทจ ากด
สงผลใหอตราการเชาพนทปรบตวสงท 92% สงทสดนบตงแต 2006
• อตราคาเชาเพมขนเฉลย 3.1% ตอปส าหรบส านกงาน เกรด A CBD และ 4.5% ส าหรบส านกงาน เกรด A Non-CBD
Source: CBRE
72
1
74
0
74
3
69
7
68
1
68
8
74
1 80
4
84
1
87
7 93
6
98
0
10
09
10
36
10
55
40
1
43
2
44
3
44
0
41
7
43
1
47
4
52
6
55
2
59
7
63
1
65
6
68
9
70
6
71
6
200
400
600
800
1000
1200
20
06
20
07
20
08
20
09
20
10
20
11
20
12
20
13
20
14
20
15
20
16
20
17
20
18
1Q
19
2Q
19
Baht / Sqm / MonthRental Rate
CBD grade A Non-CBD grade B
80%
85%
90%
95%
0
2
4
6
8
10
20
06
20
07
20
08
20
09
20
10
20
11
20
12
20
13
20
14
20
15
20
16
20
17
20
18
1Q
19
2Q
19
Sqm
Supply – Demand : Office
Total Supply Total take-up Occupancy
21
Office Outlook
Source: CBRE, SCBS
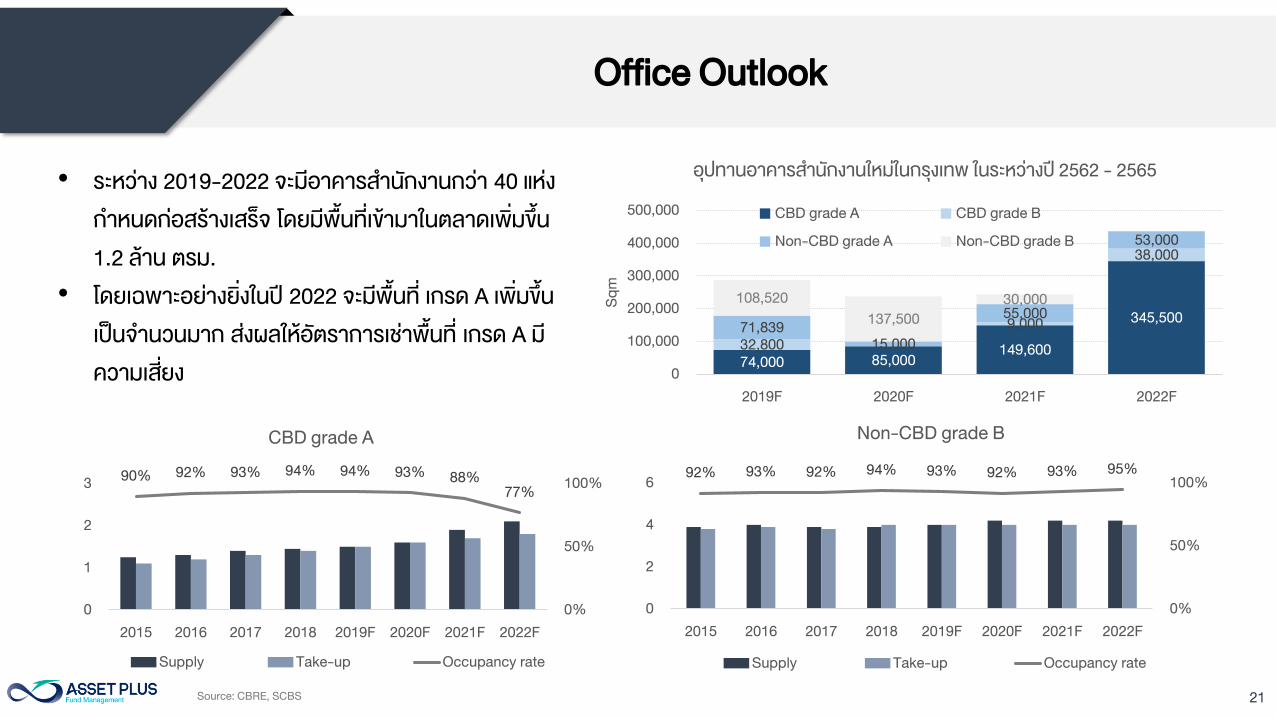
• ระหวาง 2019-2022 จะมอาคารส านกงานกวา 40 แหง
ก าหนดกอสรางเสรจ โดยมพนทเขามาในตลาดเพมขน
1.2 ลาน ตรม.
• โดยเฉพาะอยางยงในป 2022 จะมพนท เกรด A เพมขน
เปนจ านวนมาก สงผลใหอตราการเชาพนท เกรด A ม
ความเสยง
74,000 85,000
149,600
345,500
32,800
9,000
38,000
71,839
15,000
55,000
53,000
108,520
137,500
30,000
0
100,000
200,000
300,000
400,000
500,000
2019F 2020F 2021F 2022F
Sq
m
อปทานอาคารส านกงานใหมในกรงเทพ ในระหวางป 2562 - 2565
CBD grade A CBD grade B
Non-CBD grade A Non-CBD grade B
90%92% 93% 94% 94% 93%
88%
77%
0%
50%
100%
0
1
2
3
2015 2016 2017 2018 2019F 2020F 2021F 2022F
CBD grade A
Supply Take-up Occupancy rate
92% 93% 92% 94% 93% 92% 93% 95%
0%
50%
100%
0
2
4
6
2015 2016 2017 2018 2019F 2020F 2021F 2022F
Non-CBD grade B
Supply Take-up Occupancy rate
22
Office Outlook
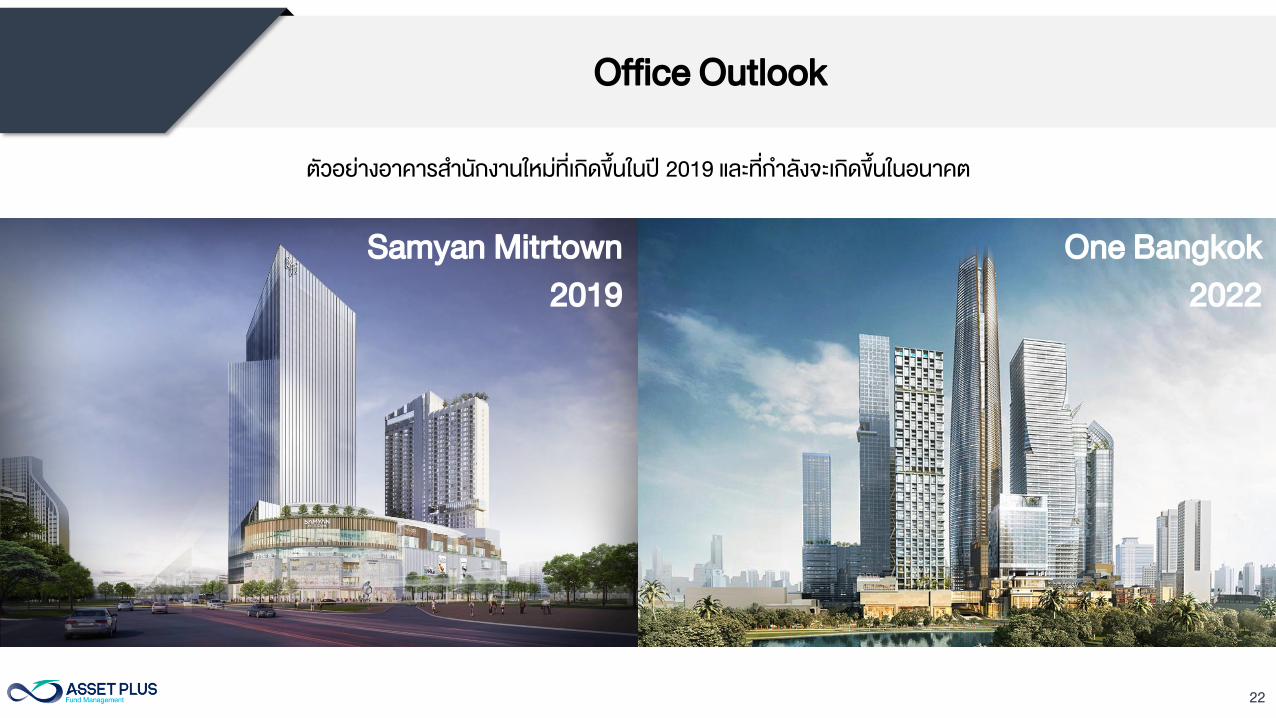
ตวอยางอาคารส านกงานใหมทเกดขนในป 2019 และทก าลงจะเกดขนในอนาคต
Samyan Mitrtown
2019
One Bangkok
2022
23
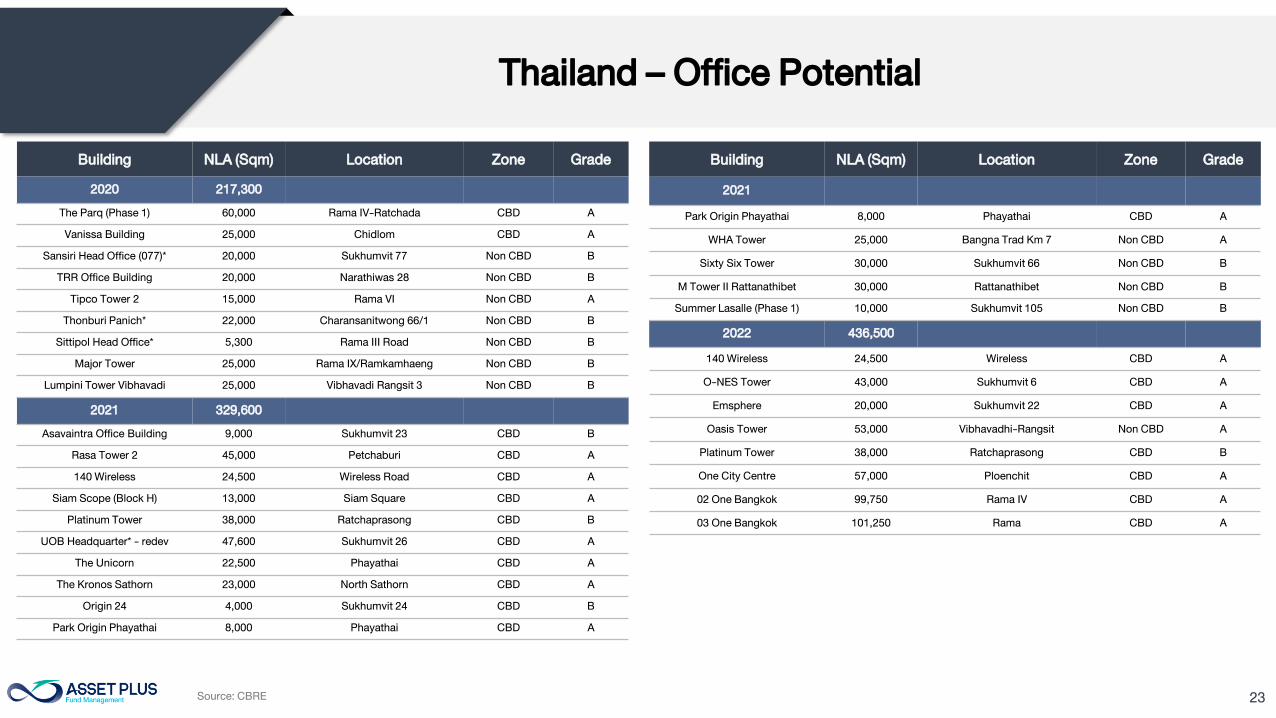
Thailand – Office Potential
Source: CBRE
Building NLA (Sqm) Location Zone Grade
2020 217,300
The Parq (Phase 1) 60,000 Rama IV-Ratchada CBD A
Vanissa Building 25,000 Chidlom CBD A
Sansiri Head Office (077)* 20,000 Sukhumvit 77 Non CBD B
TRR Office Building 20,000 Narathiwas 28 Non CBD B
Tipco Tower 2 15,000 Rama VI Non CBD A
Thonburi Panich* 22,000 Charansanitwong 66/1 Non CBD B
Sittipol Head Office* 5,300 Rama III Road Non CBD B
Major Tower 25,000 Rama IX/Ramkamhaeng Non CBD B
Lumpini Tower Vibhavadi 25,000 Vibhavadi Rangsit 3 Non CBD B
2021 329,600
Asavaintra Office Building 9,000 Sukhumvit 23 CBD B
Rasa Tower 2 45,000 Petchaburi CBD A
140 Wireless 24,500 Wireless Road CBD A
Siam Scope (Block H) 13,000 Siam Square CBD A
Platinum Tower 38,000 Ratchaprasong CBD B
UOB Headquarter* - redev 47,600 Sukhumvit 26 CBD A
The Unicorn 22,500 Phayathai CBD A
The Kronos Sathorn 23,000 North Sathorn CBD A
Origin 24 4,000 Sukhumvit 24 CBD B
Park Origin Phayathai 8,000 Phayathai CBD A
Building NLA (Sqm) Location Zone Grade
2021
Park Origin Phayathai 8,000 Phayathai CBD A
WHA Tower 25,000 Bangna Trad Km 7 Non CBD A
Sixty Six Tower 30,000 Sukhumvit 66 Non CBD B
M Tower II Rattanathibet 30,000 Rattanathibet Non CBD B
Summer Lasalle (Phase 1) 10,000 Sukhumvit 105 Non CBD B
2022 436,500
140 Wireless 24,500 Wireless CBD A
O-NES Tower 43,000 Sukhumvit 6 CBD A
Emsphere 20,000 Sukhumvit 22 CBD A
Oasis Tower 53,000 Vibhavadhi-Rangsit Non CBD A
Platinum Tower 38,000 Ratchaprasong CBD B
One City Centre 57,000 Ploenchit CBD A
02 One Bangkok 99,750 Rama IV CBD A
03 One Bangkok 101,250 Rama CBD A

24
RETAIL
25
Retail Outlook
Source: ส านกงานประกนสงคม
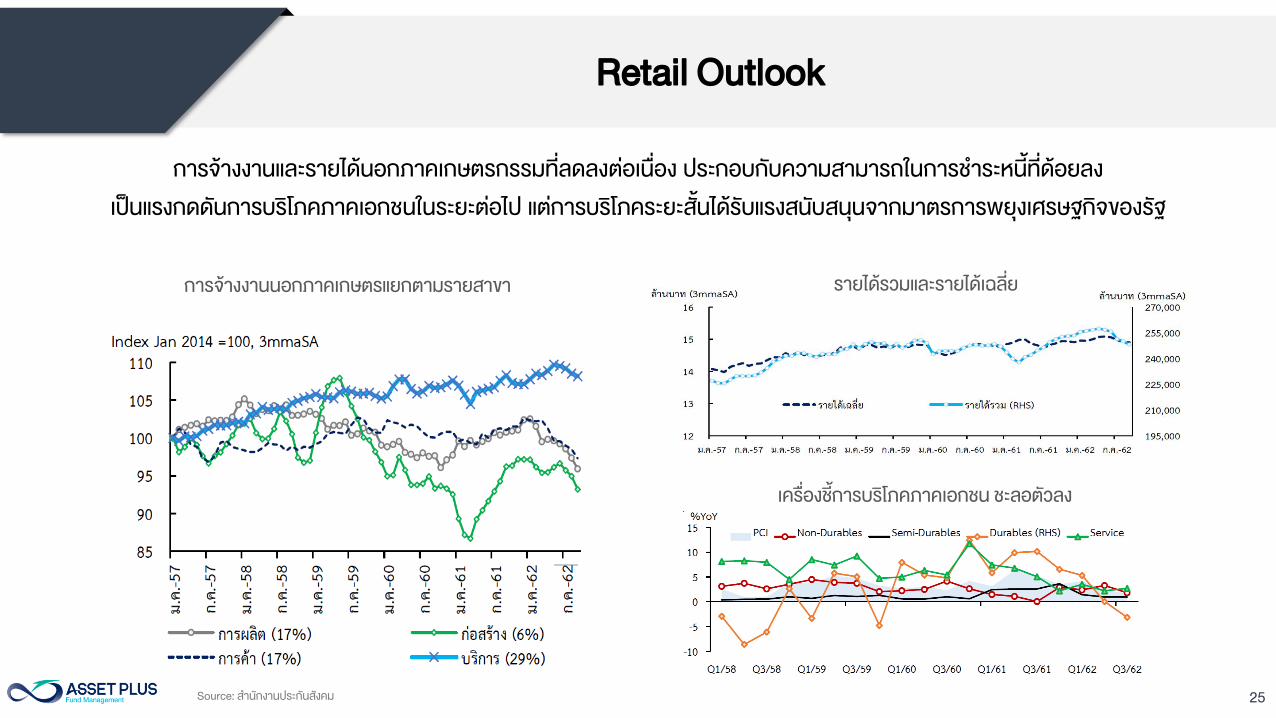
การจางงานและรายไดนอกภาคเกษตรกรรมทลดลงตอเนอง ประกอบกบความสามารถในการช าระหนทดอยลง
เปนแรงกดดนการบรโภคภาคเอกชนในระยะตอไป แตการบรโภคระยะสนไดรบแรงสนบสนนจากมาตรการพยงเศรษฐกจของรฐ
การจางงานนอกภาคเกษตรแยกตามรายสาขา
เครองชการบรโภคภาคเอกชน ชะลอตวลง
รายไดรวมและรายไดเฉลย
26
Retail Outlook
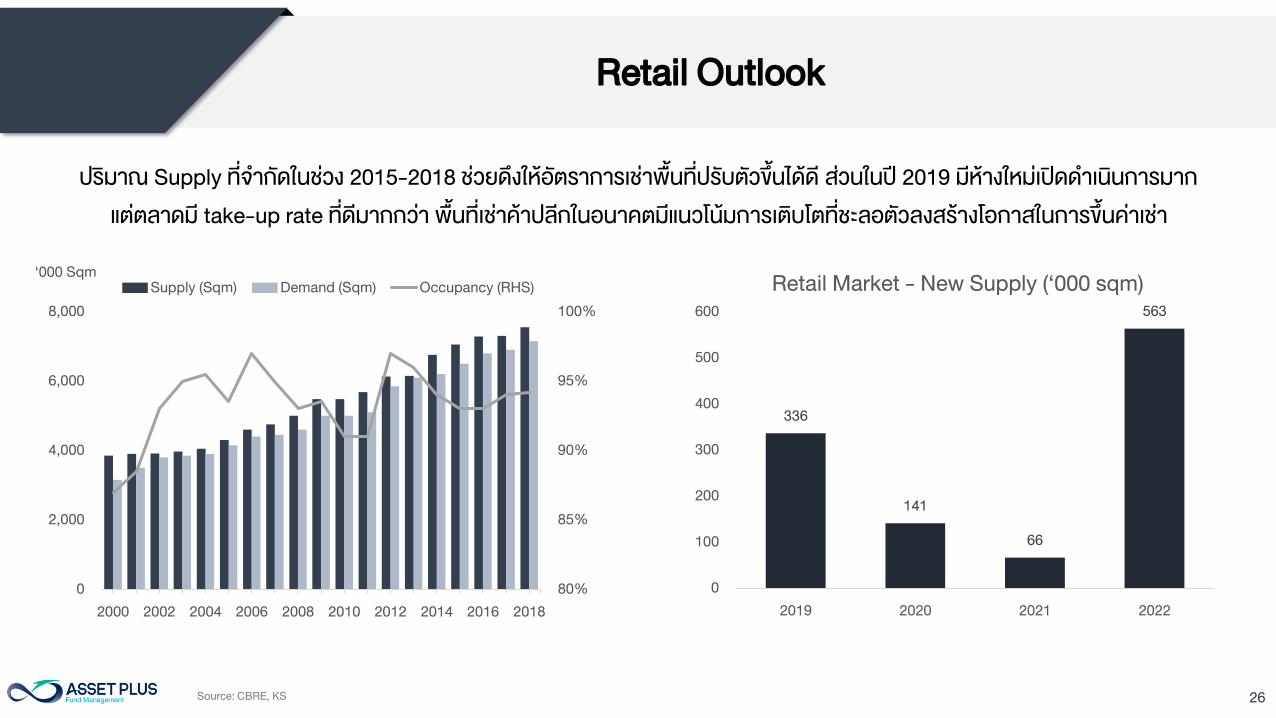
ปรมาณ Supply ทจ ากดในชวง 2015-2018 ชวยดงใหอตราการเชาพนทปรบตวขนไดด สวนในป 2019 มหางใหมเปดด าเนนการมาก
แตตลาดม take-up rate ทดมากกวา พนทเชาคาปลกในอนาคตมแนวโนมการเตบโตทชะลอตวลงสรางโอกาสในการขนคาเชา
80%
85%
90%
95%
100%
0
2,000
4,000
6,000
8,000
2000 2002 2004 2006 2008 2010 2012 2014 2016 2018
‘000 Sqm
Supply (Sqm) Demand (Sqm) Occupancy (RHS)
336
141
66
563
0
100
200
300
400
500
600
2019 2020 2021 2022
Retail Market - New Supply (‘000 sqm)
Source: CBRE, KS
27
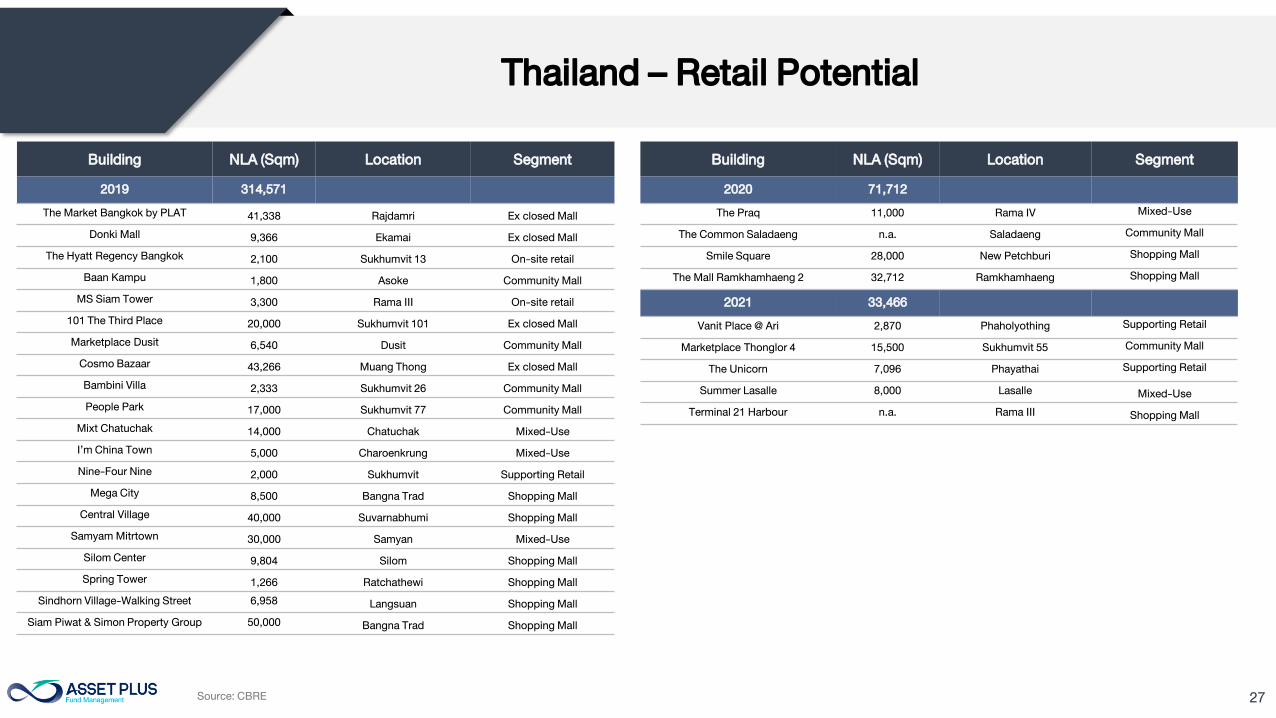
Thailand – Retail Potential
Building NLA (Sqm) Location Segment
2019 314,571
The Market Bangkok by PLAT41,338 Rajdamri Ex closed Mall
Donki Mall9,366 Ekamai Ex closed Mall
The Hyatt Regency Bangkok2,100 Sukhumvit 13 On-site retail
Baan Kampu1,800 Asoke Community Mall
MS Siam Tower3,300 Rama III On-site retail
101 The Third Place20,000 Sukhumvit 101 Ex closed Mall
Marketplace Dusit6,540 Dusit Community Mall
Cosmo Bazaar43,266 Muang Thong Ex closed Mall
Bambini Villa2,333 Sukhumvit 26 Community Mall
People Park17,000 Sukhumvit 77 Community Mall
Mixt Chatuchak14,000 Chatuchak Mixed-Use
I’m China Town5,000 Charoenkrung Mixed-Use
Nine-Four Nine2,000 Sukhumvit Supporting Retail
Mega City8,500 Bangna Trad Shopping Mall
Central Village40,000 Suvarnabhumi Shopping Mall
Samyam Mitrtown30,000 Samyan Mixed-Use
Silom Center9,804 Silom Shopping Mall
Spring Tower1,266 Ratchathewi Shopping Mall
Sindhorn Village-Walking Street 6,958Langsuan Shopping Mall
Siam Piwat & Simon Property Group 50,000Bangna Trad Shopping Mall
Building NLA (Sqm) Location Segment
2020 71,712
The Praq 11,000 Rama IV Mixed-Use
The Common Saladaeng n.a. Saladaeng Community Mall
Smile Square 28,000 New Petchburi Shopping Mall
The Mall Ramkhamhaeng 2 32,712 Ramkhamhaeng Shopping Mall
2021 33,466
Vanit Place @ Ari 2,870 Phaholyothing Supporting Retail
Marketplace Thonglor 4 15,500 Sukhumvit 55 Community Mall
The Unicorn 7,096 Phayathai Supporting Retail
Summer Lasalle 8,000 LasalleMixed-Use
Terminal 21 Harbour n.a. Rama IIIShopping Mall
Source: CBRE

28
HOSPITALITY
29
0%
2%
4%
6%
8%
10%
12%
0
20
40
60
80
100
AOT total passengers
Total Passenger (LHS) Growth
19
22
2725
30
33
36
3840
4244
-10
-5
0
5
10
15
20
25
0
5
10
15
20
25
30
35
40
45
50
million
International tourist arrivals
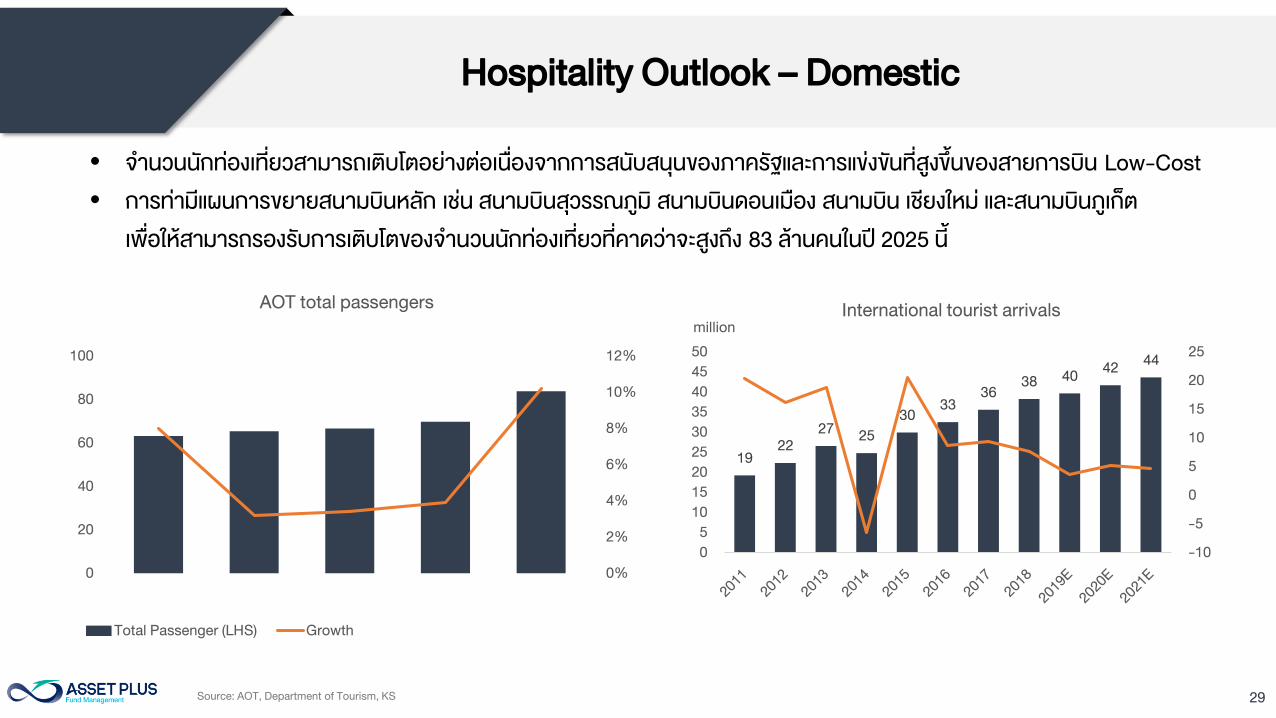
Hospitality Outlook – Domestic
Source: AOT, Department of Tourism, KS
• จ านวนนกทองเทยวสามารถเตบโตอยางตอเนองจากการสนบสนนของภาครฐและการแขงขนทสงขนของสายการบน Low-Cost
• การทามแผนการขยายสนามบนหลก เชน สนามบนสวรรณภม สนามบนดอนเมอง สนามบน เชยงใหม และสนามบนภเกต
เพอใหสามารถรองรบการเตบโตของจ านวนนกทองเทยวทคาดวาจะสงถง 83 ลานคนในป 2025 น
30
650,643
682,824
715,712721,501
600000
650000
700000
750000
2015 2016 2017 2018
Ro
om
s
Number of room
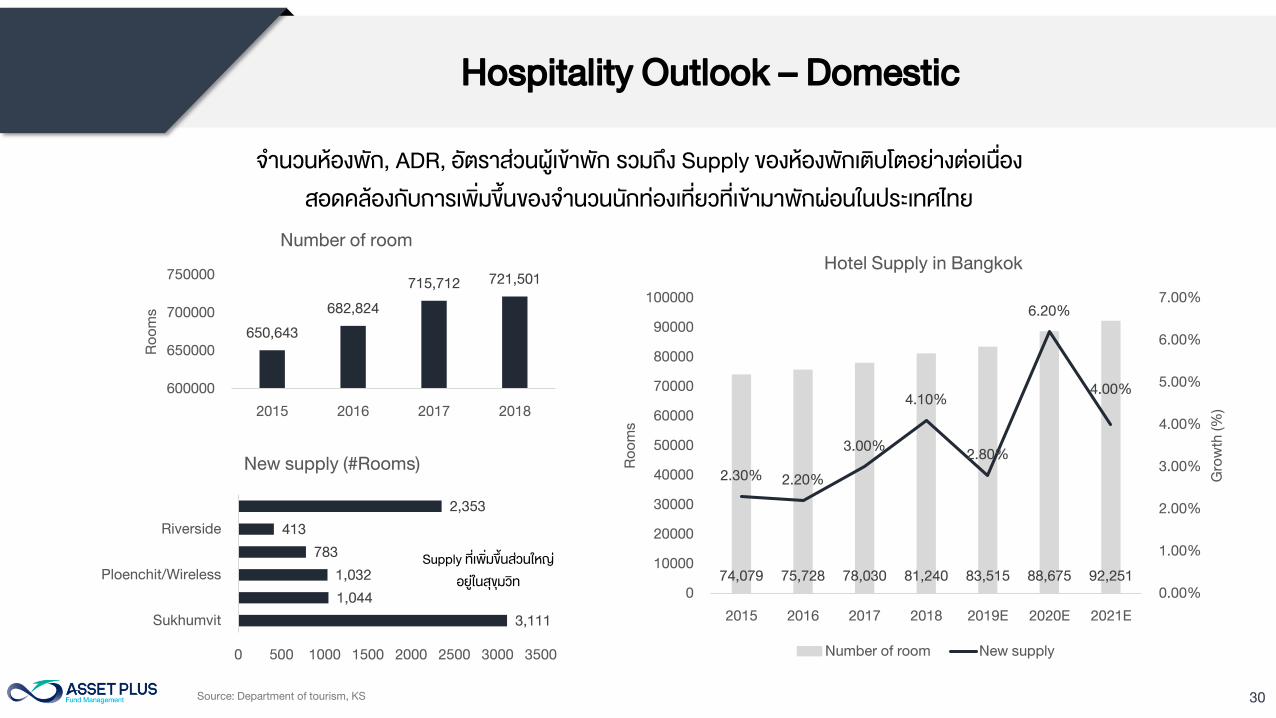
Hospitality Outlook – Domestic
จ านวนหองพก, ADR, อตราสวนผเขาพก รวมถง Supply ของหองพกเตบโตอยางตอเนอง
สอดคลองกบการเพมขนของจ านวนนกทองเทยวทเขามาพกผอนในประเทศไทย
Source: Department of tourism, KS
74,079 75,728 78,030 81,240 83,515 88,675 92,251
2.30%2.20%
3.00%
4.10%
2.80%
6.20%
4.00%
0.00%
1.00%
2.00%
3.00%
4.00%
5.00%
6.00%
7.00%
0
10000
20000
30000
40000
50000
60000
70000
80000
90000
100000
2015 2016 2017 2018 2019E 2020E 2021E
Gro
wth
(%
)
Ro
om
s
Hotel Supply in Bangkok
Number of room New supply
3,111
1,044
1,032
783
413
2,353
0 500 1000 1500 2000 2500 3000 3500
Sukhumvit
Ploenchit/Wireless
Riverside
New supply (#Rooms)
Supply ทเพมขนสวนใหญ
อยในสขมวท
31
Hospitality Outlook – Domestic
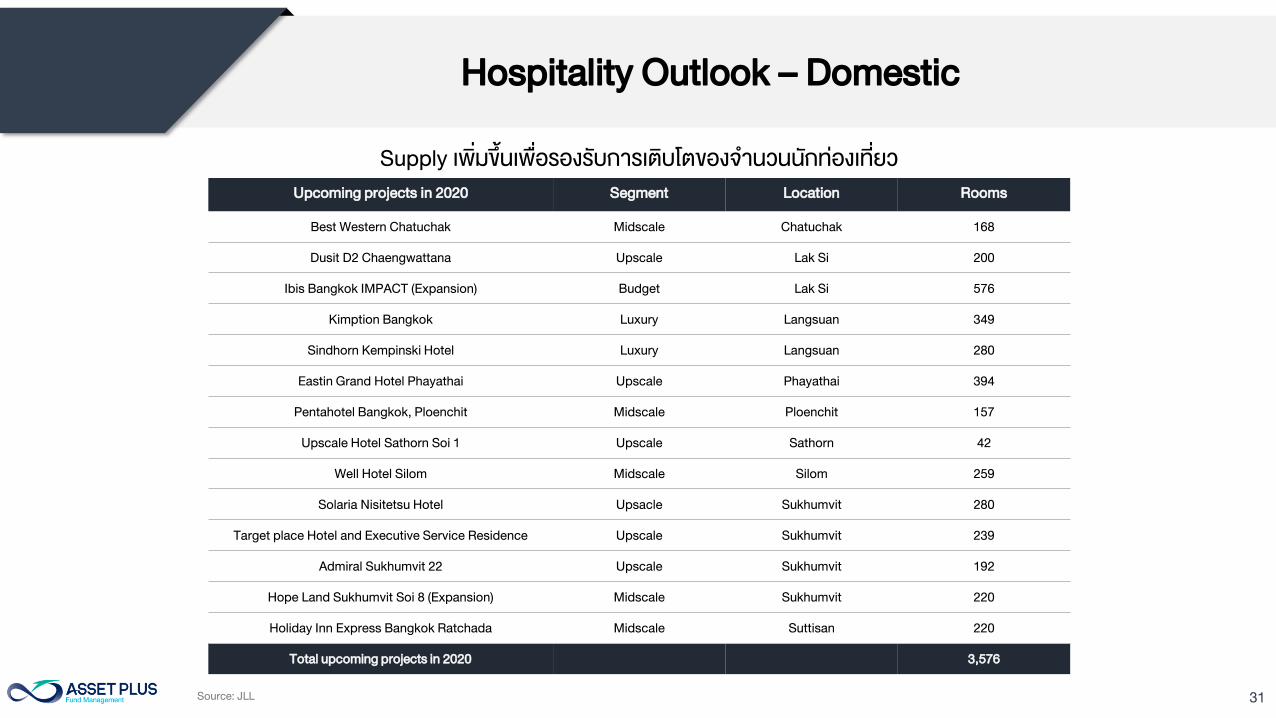
Upcoming projects in 2020 Segment Location Rooms
Best Western Chatuchak Midscale Chatuchak 168
Dusit D2 Chaengwattana Upscale Lak Si 200
Ibis Bangkok IMPACT (Expansion) Budget Lak Si 576
Kimption Bangkok Luxury Langsuan 349
Sindhorn Kempinski Hotel Luxury Langsuan 280
Eastin Grand Hotel Phayathai Upscale Phayathai 394
Pentahotel Bangkok, Ploenchit Midscale Ploenchit 157
Upscale Hotel Sathorn Soi 1 Upscale Sathorn 42
Well Hotel Silom Midscale Silom 259
Solaria Nisitetsu Hotel Upsacle Sukhumvit 280
Target place Hotel and Executive Service Residence Upscale Sukhumvit 239
Admiral Sukhumvit 22 Upscale Sukhumvit 192
Hope Land Sukhumvit Soi 8 (Expansion) Midscale Sukhumvit 220
Holiday Inn Express Bangkok Ratchada Midscale Suttisan 220
Total upcoming projects in 2020 3,576
Source: JLL
Supply เพมขนเพอรองรบการเตบโตของจ านวนนกทองเทยว
32
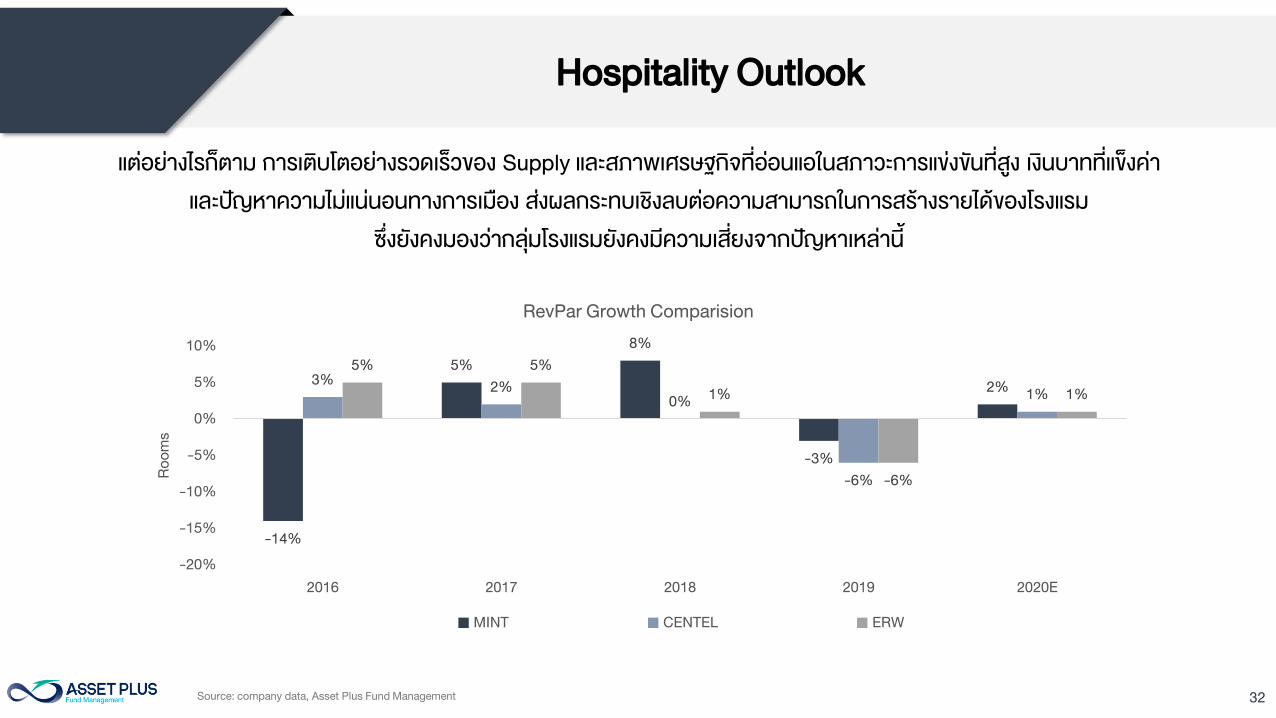
Hospitality Outlook
-14%
5%
8%
-3%
2%3%
2%
0%
-6%
1%
5% 5%
1%
-6%
1%
-20%
-15%
-10%
-5%
0%
5%
10%
2016 2017 2018 2019 2020E
Ro
om
s
RevPar Growth Comparision
MINT CENTEL ERW
Source: company data, Asset Plus Fund Management
แตอยางไรกตาม การเตบโตอยางรวดเรวของ Supply และสภาพเศรษฐกจทออนแอในสภาวะการแขงขนทสง เงนบาททแขงคา
และปญหาความไมแนนอนทางการเมอง สงผลกระทบเชงลบตอความสามารถในการสรางรายไดของโรงแรม
ซงยงคงมองวากลมโรงแรมยงคงมความเสยงจากปญหาเหลาน

33
Singapore REITs Outlook
34
1.50
2.00
2.50
3.00
3.50
4.00
4.50
5.00
Jan-15 Jan-16 Jan-17 Jan-18 Jan-19
SG REITs Dividend Spread (%)
SG Dividend - SG10Y SG Dividend - US 10Y
0.00
1.00
2.00
3.00
4.00
5.00
6.00
7.00
8.00
Jan-15 Jan-16 Jan-17 Jan-18 Jan-19
Singapore REITs Yield vs. Bond Yield
SG REITs Yield (%) 10Y SG Bond Yield(%)
Source: Bloomberg as of 30 December 2019
Singapore REITs Outlook
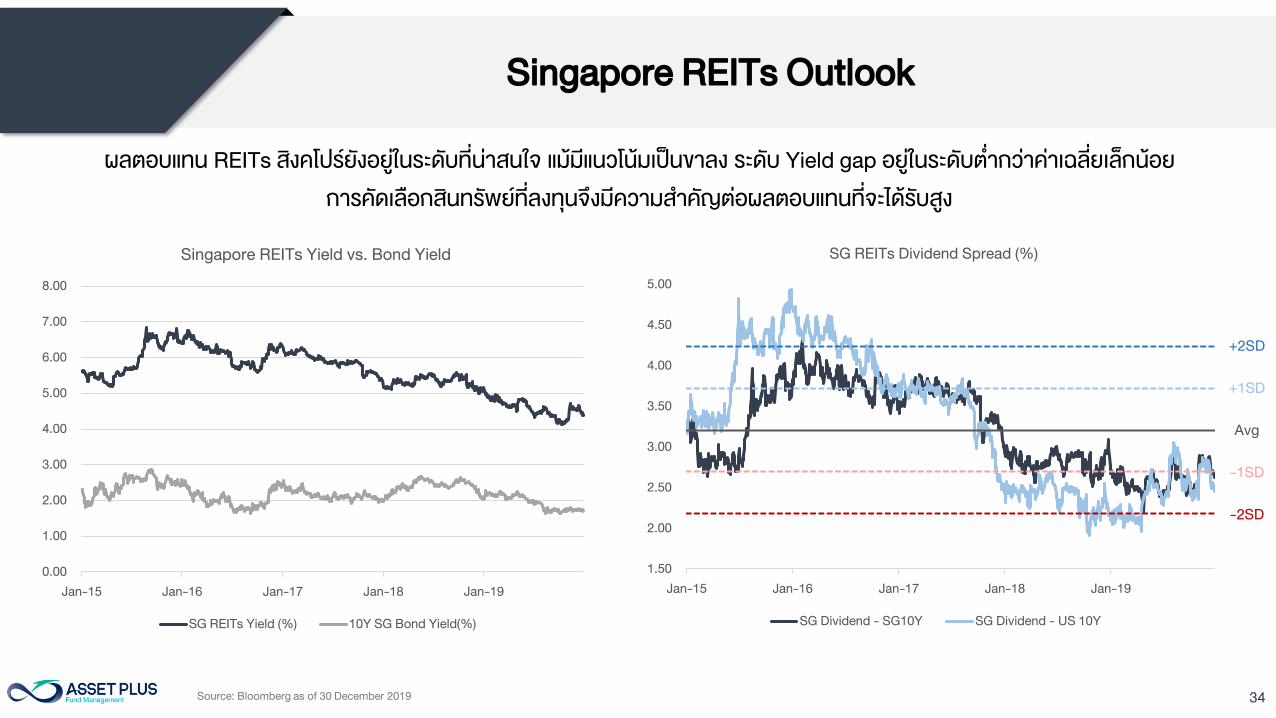
ผลตอบแทน REITs สงคโปรยงอยในระดบทนาสนใจ แมมแนวโนมเปนขาลง ระดบ Yield gap อยในระดบต ากวาคาเฉลยเลกนอย
การคดเลอกสนทรพยทลงทนจงมความส าคญตอผลตอบแทนทจะไดรบสง
Avg
-1SD
-2SD
+2SD
+1SD
35
-100
0
100
200
300
400200
400
600
800
1000
1200
Jan-10 Jan-11 Jan-12 Jan-13 Jan-14 Jan-15 Jan-16 Jan-17 Jan-18 Jan-19
Sp
re
ad
FS
TR
EI In
de
x
FSTREI Index USGG10YR Index - USGG2YR Index (RHS)
A slight steepening of the yield curve in further significant reimprovement in general economic outlook for which have been anchored at multimove up over time. Therefore, the multiflattening of the yield curve (measured as the difference between the approaching its end in our view. While the yield curve is expected to remain flattish heading into
Singapore REITs Outlook
Source: Bloomberg as of 30 December 2019
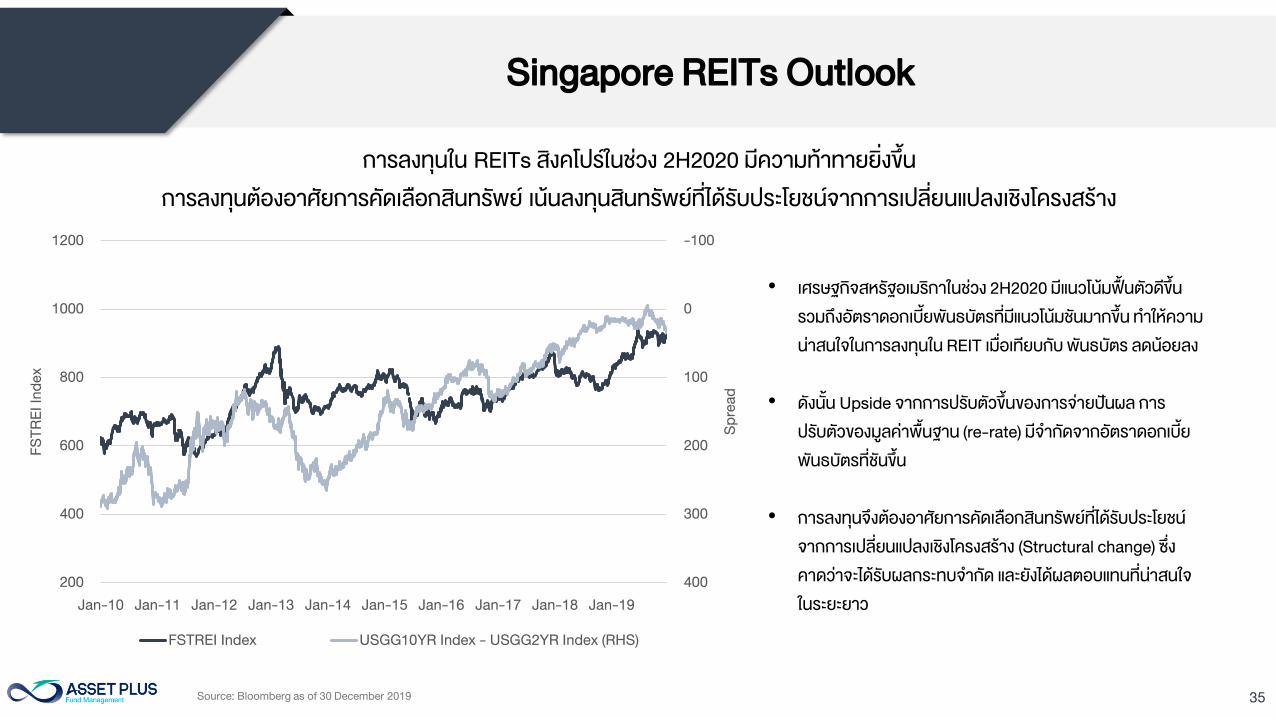
การลงทนใน REITs สงคโปรในชวง 2H2020 มความทาทายยงขน
การลงทนตองอาศยการคดเลอกสนทรพย เนนลงทนสนทรพยทไดรบประโยชนจากการเปลยนแปลงเชงโครงสราง
• เศรษฐกจสหรฐอเมรกาในชวง 2H2020 มแนวโนมฟนตวดขน
รวมถงอตราดอกเบยพนธบตรทมแนวโนมชนมากขน ท าใหความ
นาสนใจในการลงทนใน REIT เมอเทยบกบ พนธบตร ลดนอยลง
• ดงนน Upside จากการปรบตวขนของการจายปนผล การ
ปรบตวของมลคาพนฐาน (re-rate) มจ ากดจากอตราดอกเบย
พนธบตรทชนขน
• การลงทนจงตองอาศยการคดเลอกสนทรพยทไดรบประโยชน
จากการเปลยนแปลงเชงโครงสราง (Structural change) ซง
คาดวาจะไดรบผลกระทบจ ากด และยงไดผลตอบแทนทนาสนใจ
ในระยะยาว
36
Singapore REITs Outlook
SGD
13.5 Bn
4
Transactions
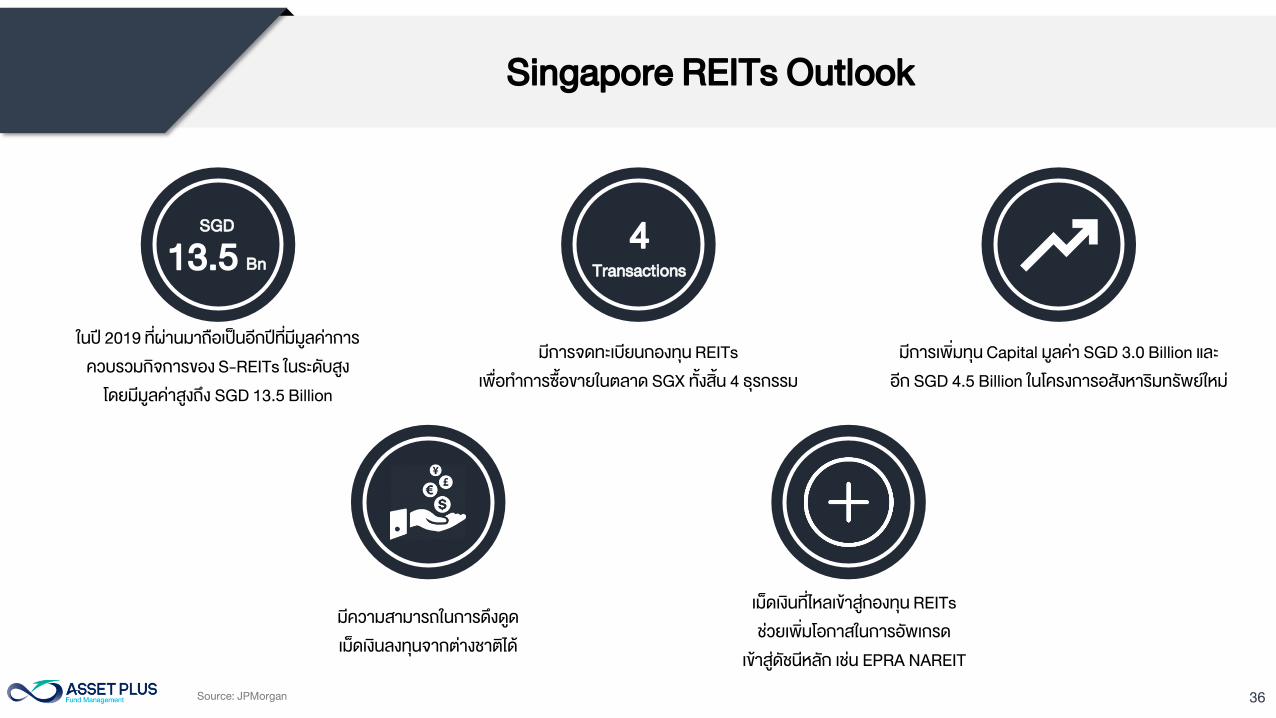
ในป 2019 ทผานมาถอเปนอกปทมมลคาการ
ควบรวมกจการของ S-REITs ในระดบสง
โดยมมลคาสงถง SGD 13.5 Billion
มการจดทะเบยนกองทน REITs
เพอท าการซอขายในตลาด SGX ทงสน 4 ธรกรรม
มการเพมทน Capital มลคา SGD 3.0 Billion และ
อก SGD 4.5 Billion ในโครงการอสงหารมทรพยใหม
มความสามารถในการดงดด
เมดเงนลงทนจากตางชาตได
เมดเงนทไหลเขาสกองทน REITs
ชวยเพมโอกาสในการอพเกรด
เขาสดชนหลก เชน EPRA NAREIT
Source: JPMorgan
37
No Companies Acquired
Acquired
from
Deal size
($$'m)
DBS remarks
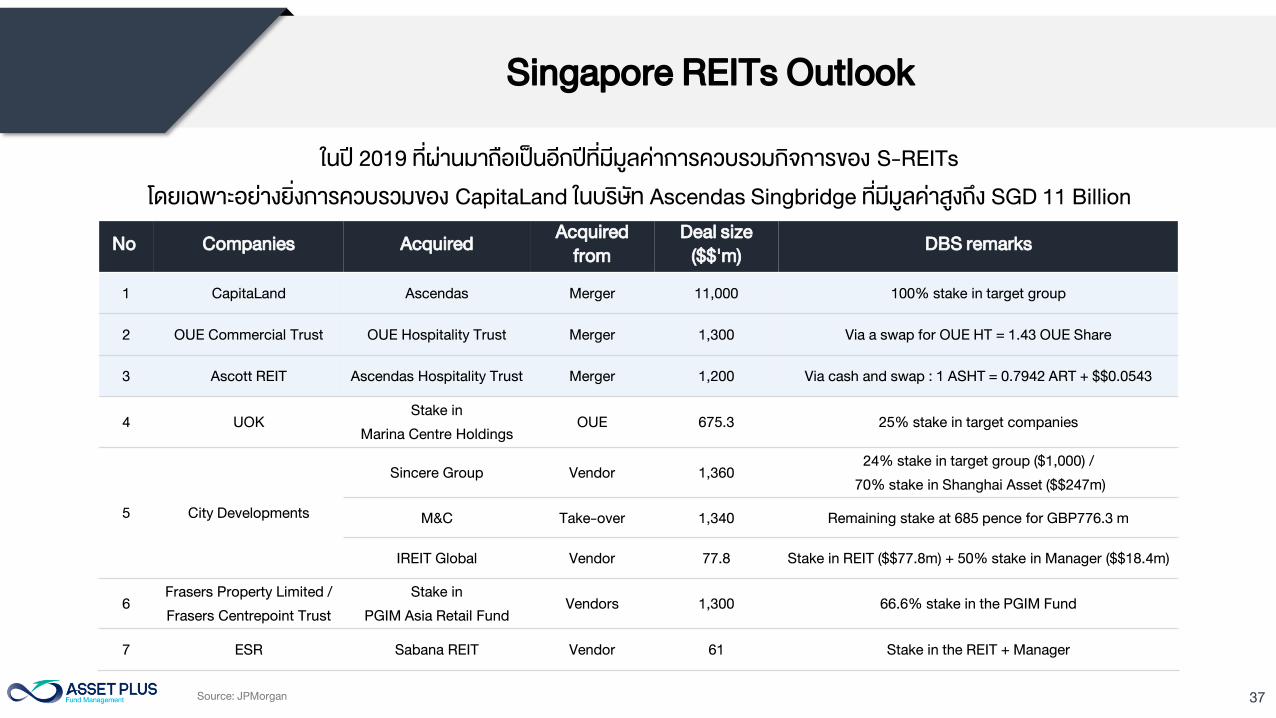
1 CapitaLand Ascendas Merger 11,000 100% stake in target group
2 OUE Commercial Trust OUE Hospitality Trust Merger 1,300 Via a swap for OUE HT = 1.43 OUE Share
3 Ascott REIT Ascendas Hospitality Trust Merger 1,200 Via cash and swap : 1 ASHT = 0.7942 ART + $$0.0543
4 UOK
Stake in
Marina Centre Holdings
OUE 675.3 25% stake in target companies
5 City Developments
Sincere Group Vendor 1,360
24% stake in target group ($1,000) /
70% stake in Shanghai Asset ($$247m)
M&C Take-over 1,340 Remaining stake at 685 pence for GBP776.3 m
IREIT Global Vendor 77.8 Stake in REIT ($$77.8m) + 50% stake in Manager ($$18.4m)
6
Frasers Property Limited /
Frasers Centrepoint Trust
Stake in
PGIM Asia Retail Fund
Vendors 1,300 66.6% stake in the PGIM Fund
7 ESR Sabana REIT Vendor 61 Stake in the REIT + Manager
Singapore REITs Outlook
ในป 2019 ทผานมาถอเปนอกปทมมลคาการควบรวมกจการของ S-REITs
โดยเฉพาะอยางยงการควบรวมของ CapitaLand ในบรษท Ascendas Singbridge ทมมลคาสงถง SGD 11 Billion
Source: JPMorgan
38
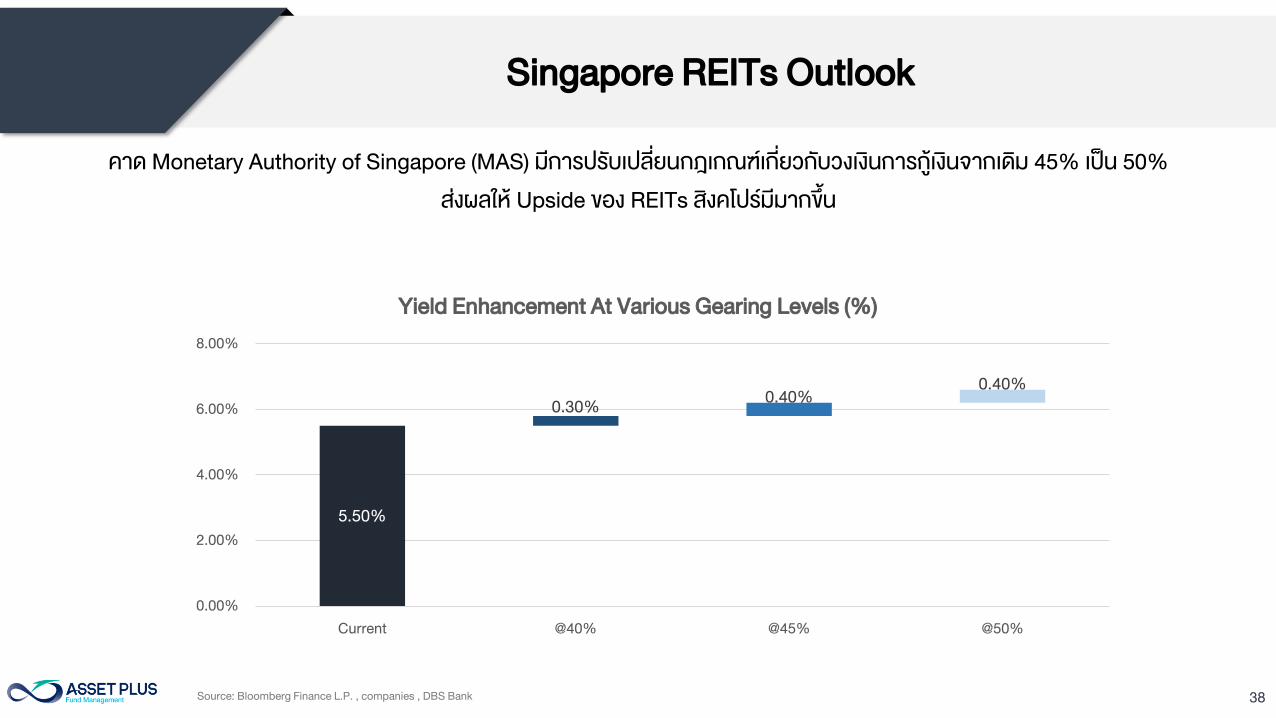
คาด Monetary Authority of Singapore (MAS) มการปรบเปลยนกฎเกณฑเกยวกบวงเงนการกเงนจากเดม 45% เปน 50%
สงผลให Upside ของ REITs สงคโปรมมากขน
Source: Bloomberg Finance L.P. , companies , DBS Bank
5.50%
0.30%
0.40%
0.40%
0.00%
2.00%
4.00%
6.00%
8.00%
Current @40% @45% @50%
Yield Enhancement At Various Gearing Levels (%)
Singapore REITs Outlook
39
Sector Outlook – SG REITs
INDUSTRIAL RETAIL
HOSPITALITY OFFICE
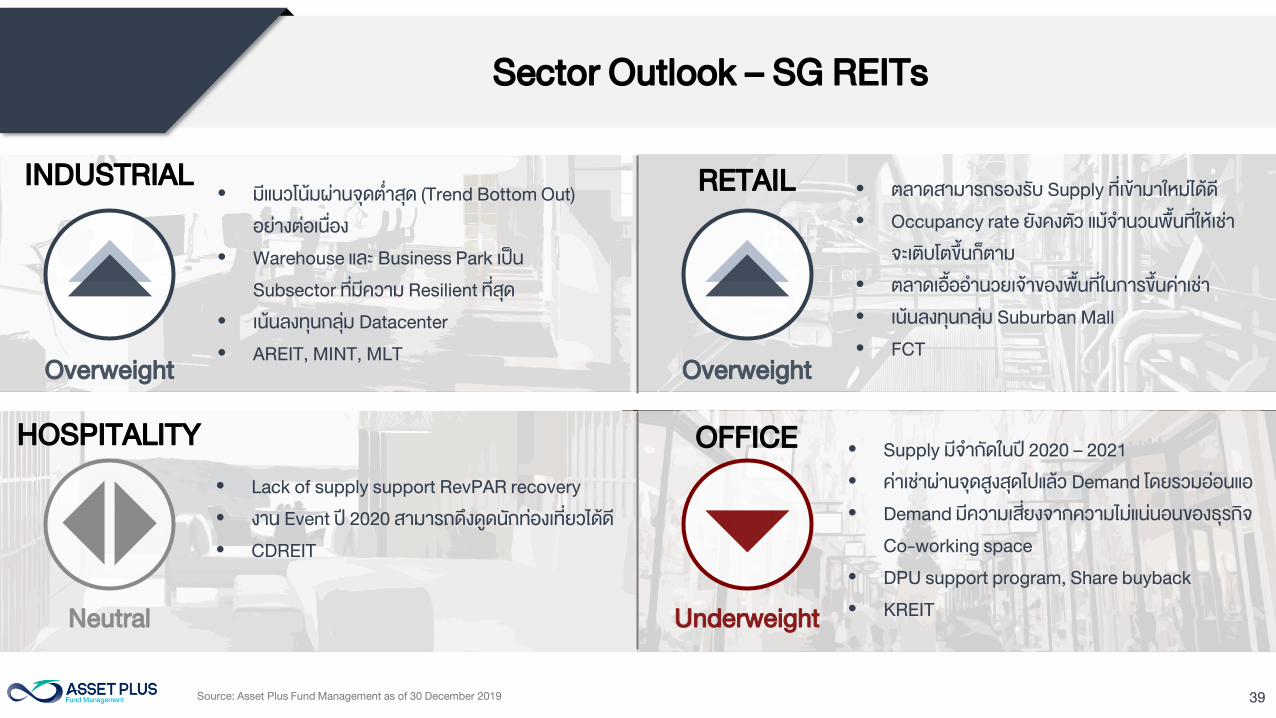
• ตลาดสามารถรองรบ Supply ทเขามาใหมไดด
• Occupancy rate ยงคงตว แมจ านวนพนทใหเชา
จะเตบโตขนกตาม
• ตลาดเอออ านวยเจาของพนทในการขนคาเชา
• เนนลงทนกลม Suburban Mall
• FCT
• มแนวโนมผานจดต าสด (Trend Bottom Out)
อยางตอเนอง
• Warehouse และ Business Park เปน
Subsector ทมความ Resilient ทสด
• เนนลงทนกลม Datacenter
• AREIT, MINT, MLT
• Lack of supply support RevPAR recovery
• งาน Event ป 2020 สามารถดงดดนกทองเทยวไดด
• CDREIT
• Supply มจ ากดในป 2020 – 2021
• คาเชาผานจดสงสดไปแลว Demand โดยรวมออนแอ
• Demand มความเสยงจากความไมแนนอนของธรกจ
Co-working space
• DPU support program, Share buyback
• KREIT
Source: Asset Plus Fund Management as of 30 December 2019
Neutral Underweight
OverweightOverweight
40
INDUSTRIAL
41
Industrial
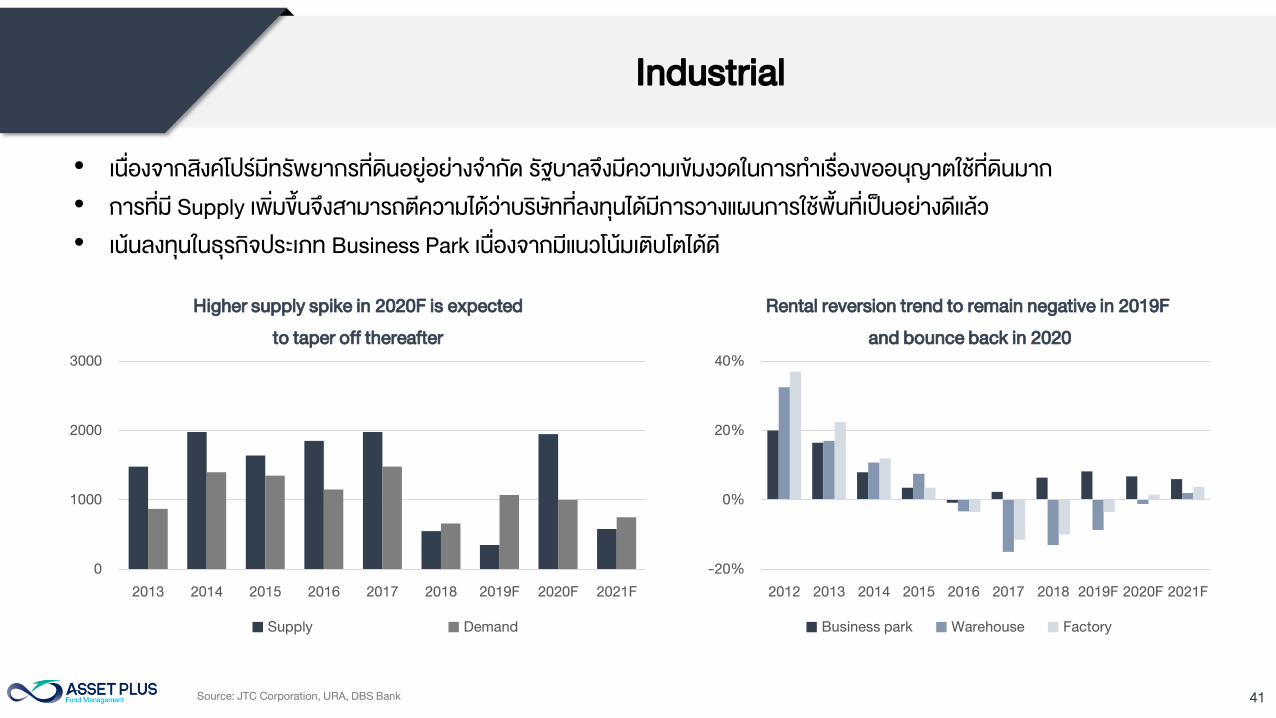
• เนองจากสงคโปรมทรพยากรทดนอยอยางจ ากด รฐบาลจงมความเขมงวดในการท าเรองขออนญาตใชทดนมาก
• การทม Supply เพมขนจงสามารถตความไดวาบรษททลงทนไดมการวางแผนการใชพนทเปนอยางดแลว
• เนนลงทนในธรกจประเภท Business Park เนองจากมแนวโนมเตบโตไดด
Source: JTC Corporation, URA, DBS Bank
0
1000
2000
3000
2013 2014 2015 2016 2017 2018 2019F 2020F 2021F
Supply Demand
Higher supply spike in 2020F is expected
to taper off thereafter
-20%
0%
20%
40%
2012 2013 2014 2015 2016 2017 2018 2019F 2020F 2021F
Business park Warehouse Factory
Rental reversion trend to remain negative in 2019F
and bounce back in 2020

42
RETAIL
43
Retail
Retail sector supply is tapered off after Although there is huge supply in
Investment to rotate to suburban mall as the central retail cap rate is compressedCertain challenges: a reduction lower demand for retail supply translating to softer reversionshigher tenant turnover as rate of growth in rents
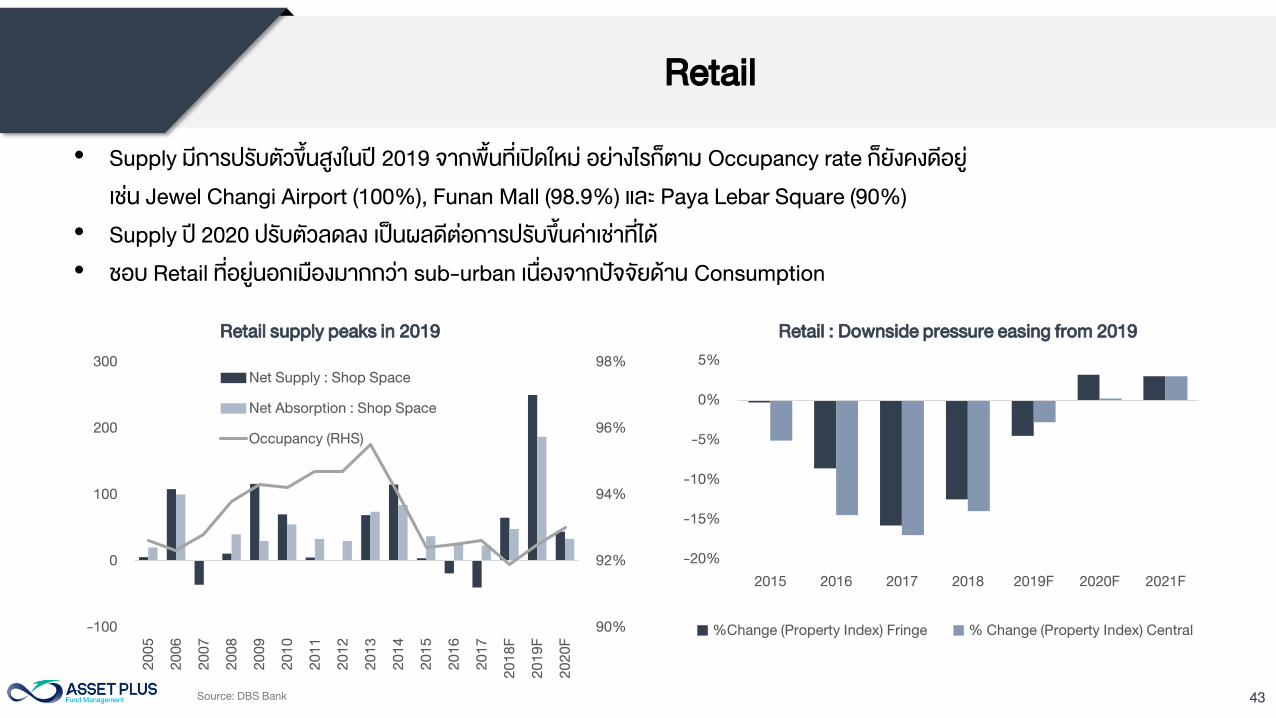
• Supply มการปรบตวขนสงในป 2019 จากพนทเปดใหม อยางไรกตาม Occupancy rate กยงคงดอย
เชน Jewel Changi Airport (100%), Funan Mall (98.9%) และ Paya Lebar Square (90%)
• Supply ป 2020 ปรบตวลดลง เปนผลดตอการปรบขนคาเชาทได
• ชอบ Retail ทอยนอกเมองมากกวา sub-urban เนองจากปจจยดาน Consumption
Source: DBS Bank
90%
92%
94%
96%
98%
-100
0
100
200
300
20
05
20
06
20
07
20
08
20
09
20
10
20
11
20
12
20
13
20
14
20
15
20
16
20
17
20
18
F
20
19
F
20
20
F
Net Supply : Shop Space
Net Absorption : Shop Space
Occupancy (RHS)
Retail supply peaks in 2019
-20%
-15%
-10%
-5%
0%
5%
2015 2016 2017 2018 2019F 2020F 2021F
%Change (Property Index) Fringe % Change (Property Index) Central
Retail : Downside pressure easing from 2019

44
HOSPITALITY
45
Hospitality
Source: URA , DBS Bank
67,084
47
1,703
789
590
64,000
66,000
68,000
70,000
72,000
2017 2018 2019F 2020F 2021F
Ro
om
s
Easing of supply pressures from 2018
Hotel rooms Expected net additions
0.1%
2.5%
1.1%
0.8%
1%
8%
6% 6%
4% 4% 4%
-2%
2%
5% 5%
3% 3% 3%
7%
4%
6%
0%
3%
1% 1%
-5% -5%
-2%
10%
4%
3%
4%
-10%
-5%
0%
5%
10%
15%
2015 2016 2017 2018 2019F 2020F 2021F
Yo
Y G
ro
wth
Multi-year recovery in RevPAR from 2018
Visitor Arrivals Visitor Days Room Supply RevPAR
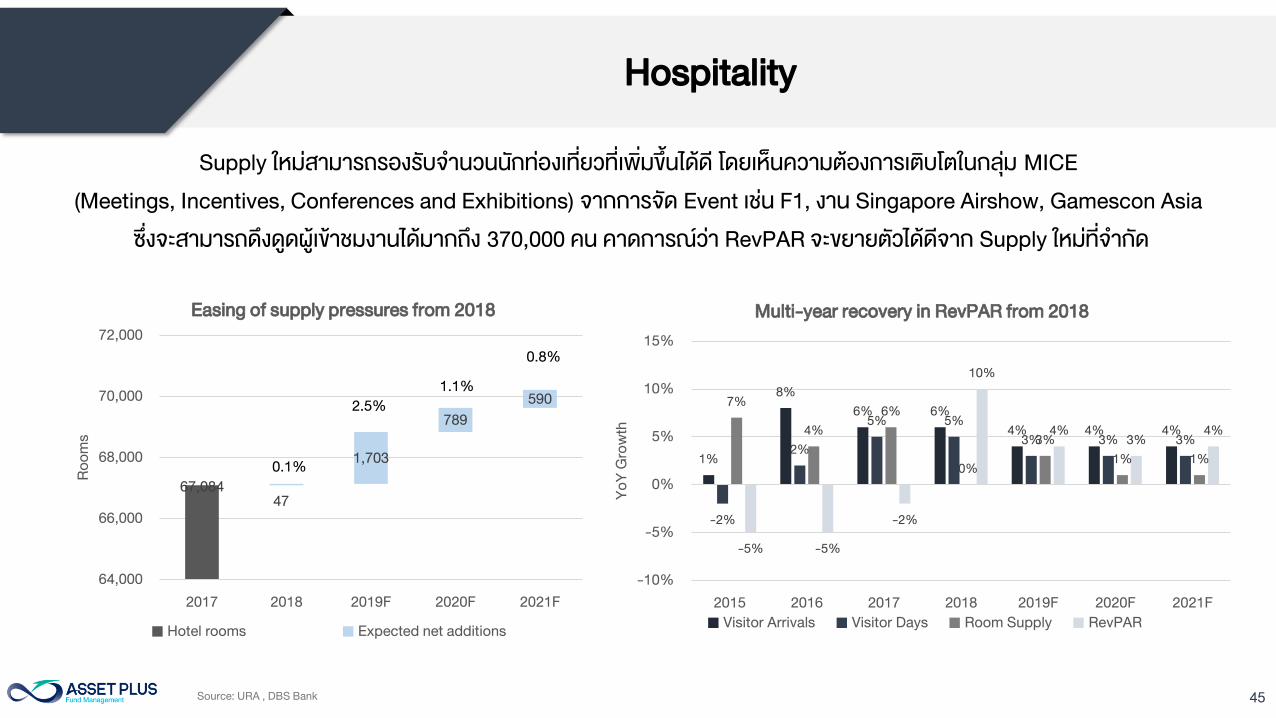
Supply ใหมสามารถรองรบจ านวนนกทองเทยวทเพมขนไดด โดยเหนความตองการเตบโตในกลม MICE
(Meetings, Incentives, Conferences and Exhibitions) จากการจด Event เชน F1, งาน Singapore Airshow, Gamescon Asia
ซงจะสามารถดงดดผเขาชมงานไดมากถง 370,000 คน คาดการณวา RevPAR จะขยายตวไดดจาก Supply ใหมทจ ากด

46
OFFICE
47
Office
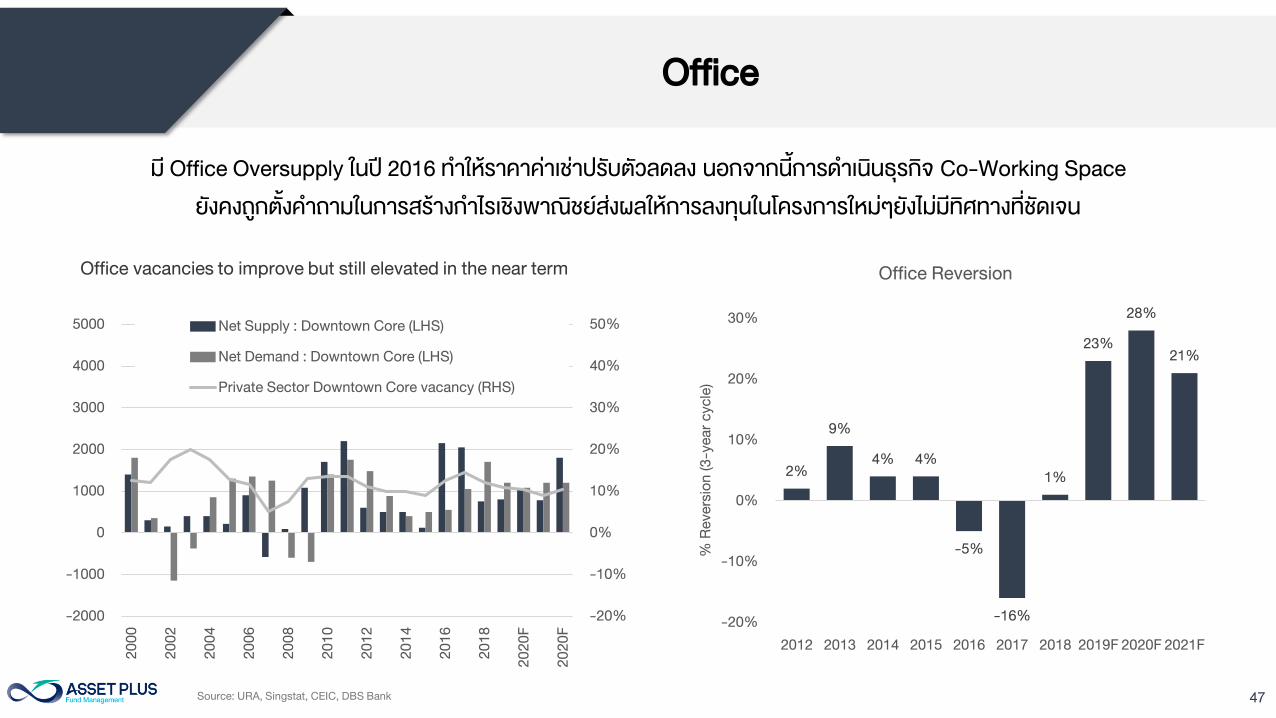
ม Office Oversupply ในป 2016 ท าใหราคาคาเชาปรบตวลดลง นอกจากนการด าเนนธรกจ Co-Working Space
ยงคงถกตงค าถามในการสรางก าไรเชงพาณชยสงผลใหการลงทนในโครงการใหมๆยงไมมทศทางทชดเจน
2%
9%
4% 4%
-5%
-16%
1%
23%
28%
21%
-20%
-10%
0%
10%
20%
30%
2012 2013 2014 2015 2016 2017 2018 2019F 2020F 2021F
% R
eve
rsio
n (3
-ye
ar c
yc
le)
Office Reversion
Source: URA, Singstat, CEIC, DBS Bank
-20%
-10%
0%
10%
20%
30%
40%
50%
-2000
-1000
0
1000
2000
3000
4000
5000
20
00
20
02
20
04
20
06
20
08
20
10
20
12
20
14
20
16
20
18
20
20
F
20
20
F
Net Supply : Downtown Core (LHS)
Net Demand : Downtown Core (LHS)
Private Sector Downtown Core vacancy (RHS)
Office vacancies to improve but still elevated in the near term

48
Infrastructure Outlook
49Source: Bloomberg 1 Jan 15 – 31 Dec 19
0.50
1.00
1.50
2.00
2.50
3.00
2015 2016 2017 2018 2019
Global Infrastructure Yield Spread (%)
Spread (S&P Global Infrastructure Index Dividend Yield - 10Y US Bond Yield)
0.00
1.00
2.00
3.00
4.00
5.00
2015 2016 2017 2018 2019
Global Infrastructure Yield vs. Bond Yield
Global Infrastructure Yield(%) 10Y US Bond Yield (%)
Global Infrastructure Outlook
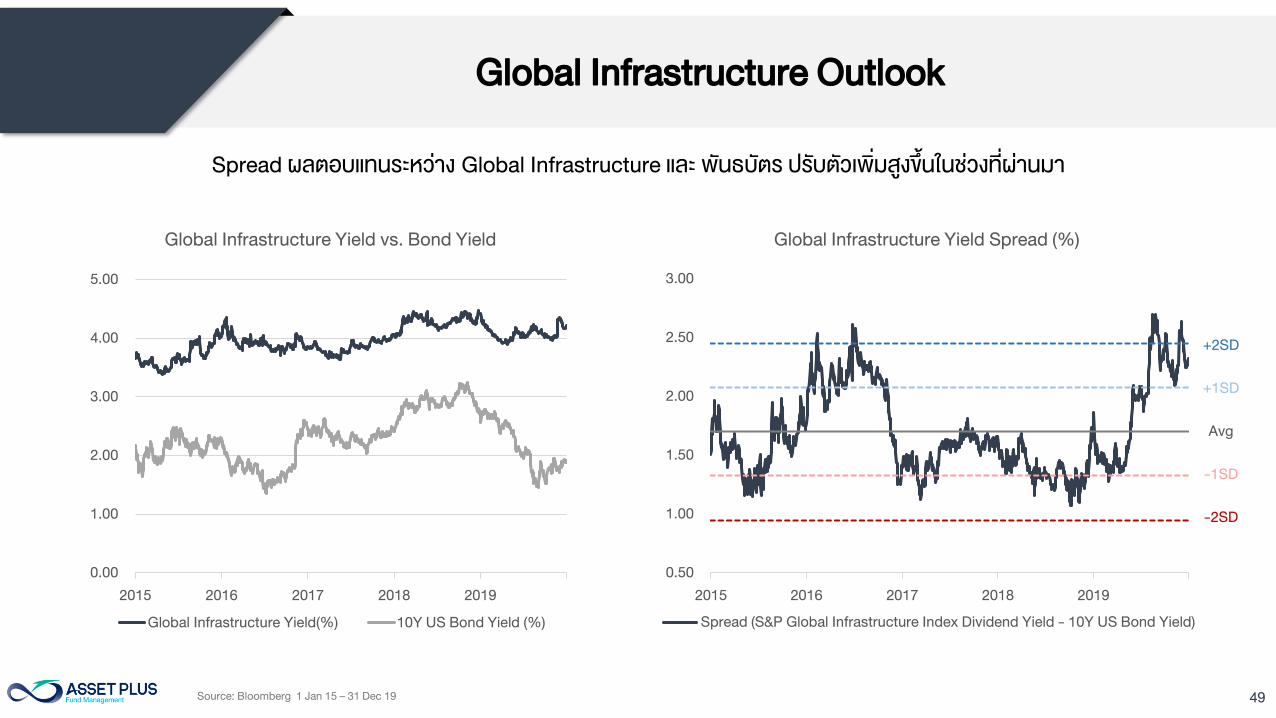
Spread ผลตอบแทนระหวาง Global Infrastructure และ พนธบตร ปรบตวเพมสงขนในชวงทผานมา
Avg
-1SD
-2SD
+2SD
+1SD
50
รายละเอยดขอมลกองทน ASP-PROPIN
51
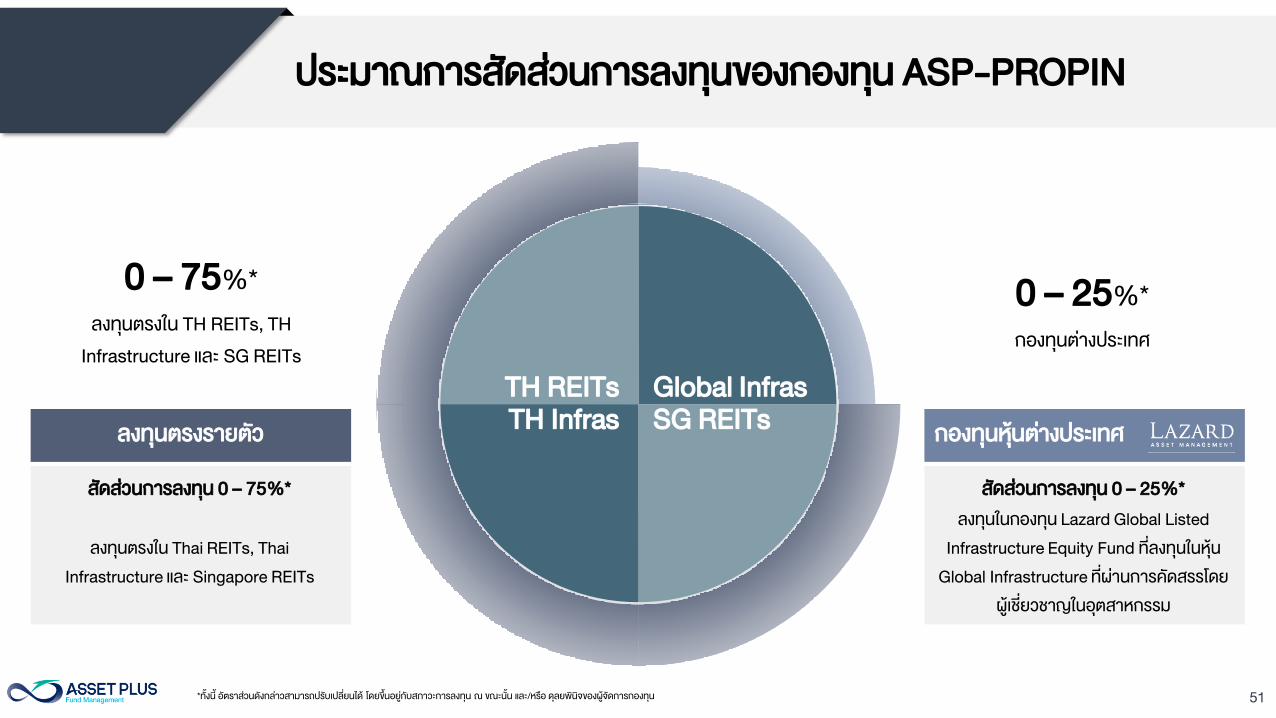
ประมาณการสดสวนการลงทนของกองทน ASP-PROPIN
TH REITs
SG REITsTH Infras
Global Infras
0 – 75%*
ลงทนตรงใน TH REITs, TH
Infrastructure และ SG REITs
0 – 25%*
กองทนตางประเทศ
*ทงน อตราสวนดงกลาวสามารถปรบเปลยนได โดยขนอยกบสภาวะการลงทน ณ ขณะนน และ/หรอ ดลยพนจของผจดการกองทน
ลงทนตรงรายตว
ลงทนตรงใน Thai REITs, Thai
Infrastructure และ Singapore REITs
สดสวนการลงทน 0 – 75%*
กองทนหนตางประเทศ
ลงทนในกองทน Lazard Global Listed
Infrastructure Equity Fund ทลงทนในหน
Global Infrastructure ทผานการคดสรรโดย
ผเชยวชาญในอตสาหกรรม
สดสวนการลงทน 0 – 25%*
52
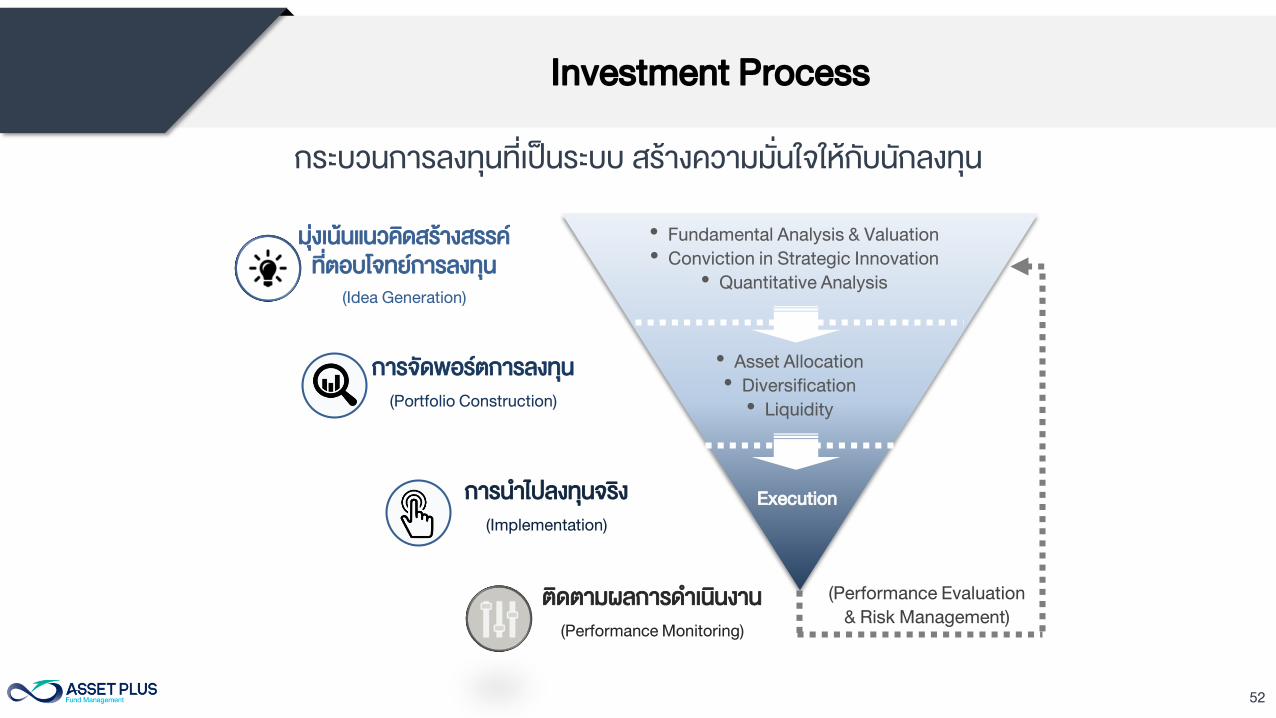
Investment Process
กระบวนการลงทนทเปนระบบ สรางความมนใจใหกบนกลงทน
การจดพอรตการลงทน
(Portfolio Construction)
การน าไปลงทนจรง
(Implementation)
ตดตามผลการด าเนนงาน
(Performance Monitoring)
มงเนนแนวคดสรางสรรค
ทตอบโจทยการลงทน
(Idea Generation)
(Performance Evaluation
& Risk Management)
• Fundamental Analysis & Valuation
• Conviction in Strategic Innovation
• Quantitative Analysis
• Asset Allocation
• Diversification
• Liquidity
Execution
53
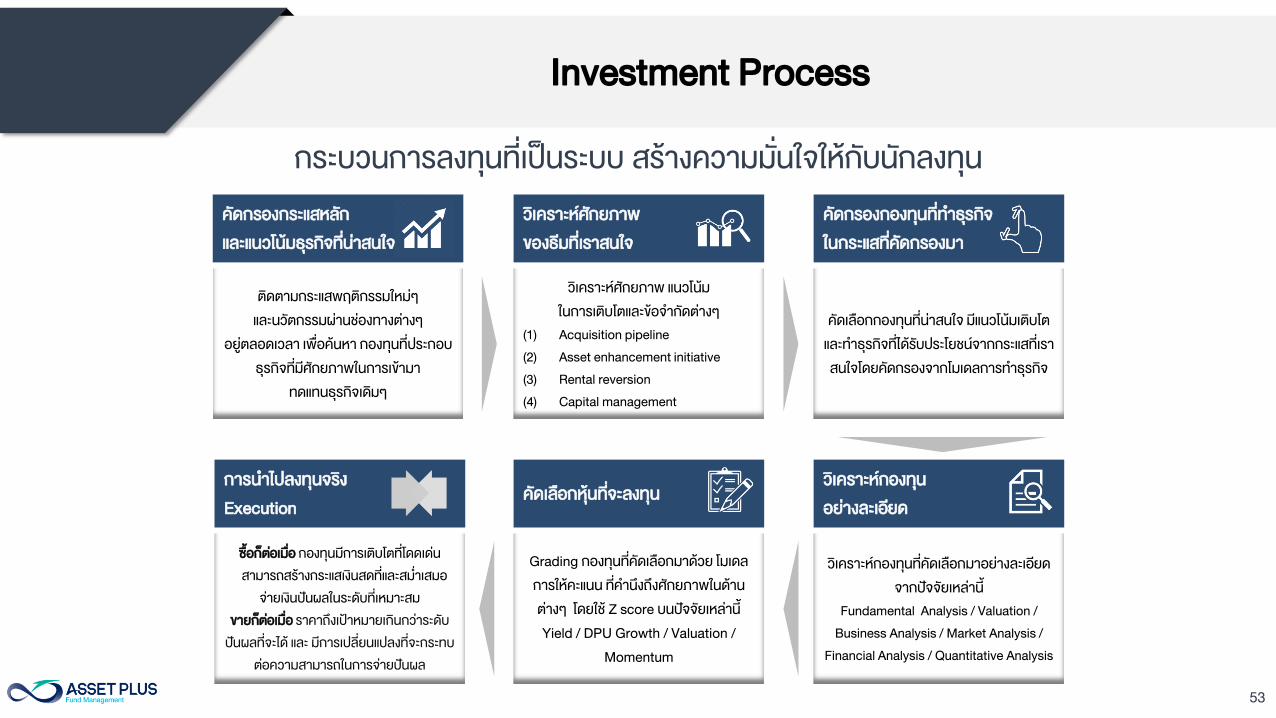
Investment Process
กระบวนการลงทนทเปนระบบ สรางความมนใจใหกบนกลงทน
การน าไปลงทนจรง
Execution
ซอกตอเมอ กองทนมการเตบโตทโดดเดน
สามารถสรางกระแสเงนสดทและสม าเสมอ
จายเงนปนผลในระดบทเหมาะสม
ขายกตอเมอ ราคาถงเปาหมายเกนกวาระดบ
ปนผลทจะได และ มการเปลยนแปลงทจะกระทบ
ตอความสามารถในการจายปนผล
คดกรองกระแสหลก
และแนวโนมธรกจทนาสนใจ
ตดตามกระแสพฤตกรรมใหมๆ
และนวตกรรมผานชองทางตางๆ
อยตลอดเวลา เพอคนหา กองทนทประกอบ
ธรกจทมศกยภาพในการเขามา
ทดแทนธรกจเดมๆ
วเคราะหศกยภาพ
ของธมทเราสนใจ
วเคราะหศกยภาพ แนวโนม
ในการเตบโตและขอจ ากดตางๆ
(1) Acquisition pipeline
(2) Asset enhancement initiative
(3) Rental reversion
(4) Capital management
คดกรองกองทนทท าธรกจ
ในกระแสทคดกรองมา
คดเลอกกองทนทนาสนใจ มแนวโนมเตบโต
และท าธรกจทไดรบประโยชนจากกระแสทเรา
สนใจโดยคดกรองจากโมเดลการท าธรกจ
วเคราะหกองทน
อยางละเอยด
วเคราะหกองทนทคดเลอกมาอยางละเอยด
จากปจจยเหลาน
Fundamental Analysis / Valuation /
Business Analysis / Market Analysis /
Financial Analysis / Quantitative Analysis
คดเลอกหนทจะลงทน
Grading กองทนทคดเลอกมาดวย โมเดล
การใหคะแนน ทค านงถงศกยภาพในดาน
ตางๆ โดยใช Z score บนปจจยเหลาน
Yield / DPU Growth / Valuation /
Momentum
54
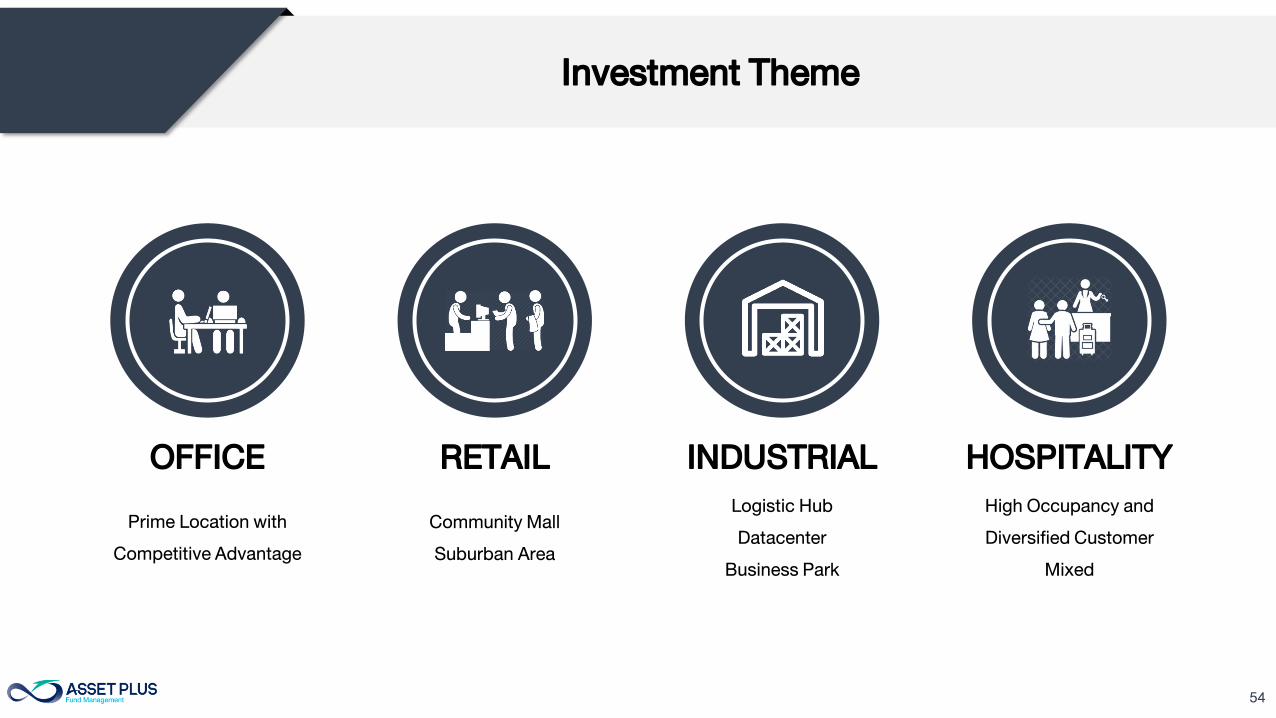
Investment Theme
OFFICE RETAIL INDUSTRIAL HOSPITALITY
Prime Location with
Competitive Advantage
Community Mall
Suburban Area
Logistic Hub
Datacenter
Business Park
High Occupancy and
Diversified Customer
Mixed
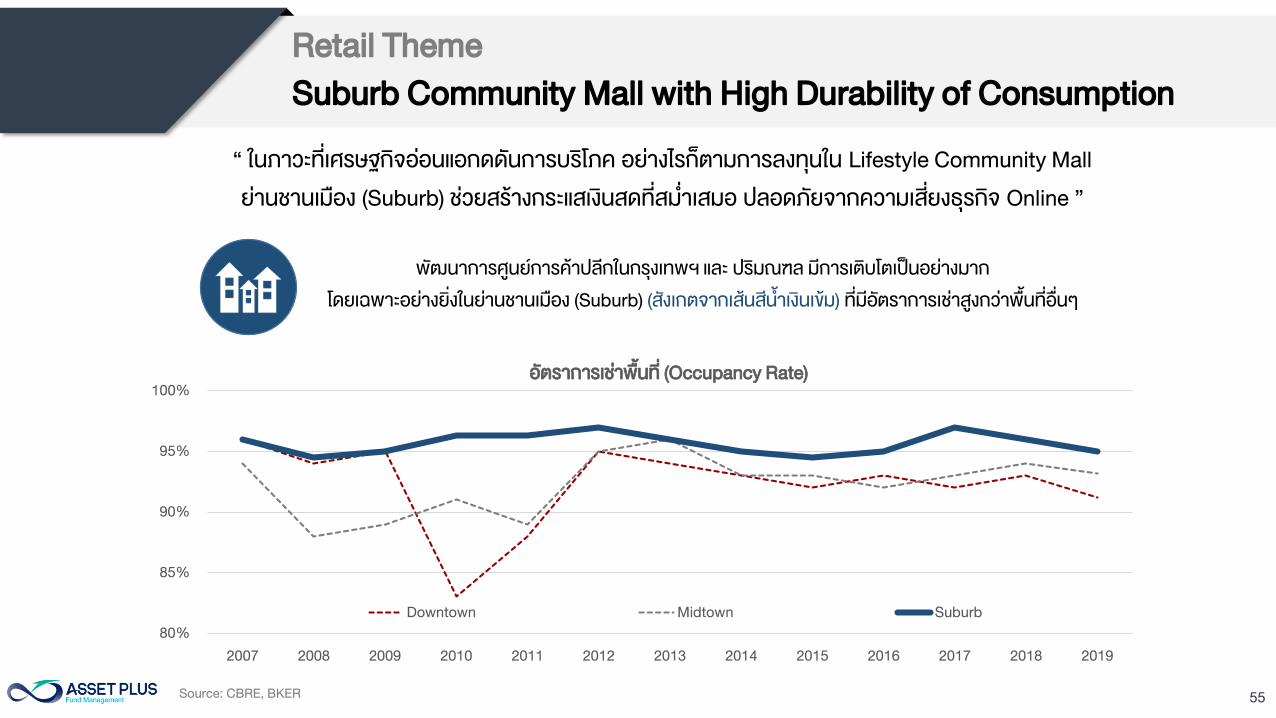
55Source: CBRE, BKER
พฒนาการศนยการคาปลกในกรงเทพฯ และ ปรมณฑล มการเตบโตเปนอยางมาก
โดยเฉพาะอยางยงในยานชานเมอง (Suburb) (สงเกตจากเสนสน าเงนเขม) ทมอตราการเชาสงกวาพนทอนๆ
80%
85%
90%
95%
100%
2007 2008 2009 2010 2011 2012 2013 2014 2015 2016 2017 2018 2019
อตราการเชาพนท (Occupancy Rate)
Downtown Midtown Suburb
“ ในภาวะทเศรษฐกจออนแอกดดนการบรโภค อยางไรกตามการลงทนใน Lifestyle Community Mall
ยานชานเมอง (Suburb) ชวยสรางกระแสเงนสดทสม าเสมอ ปลอดภยจากความเสยงธรกจ Online ”
Retail Theme
Suburb Community Mall with High Durability of Consumption
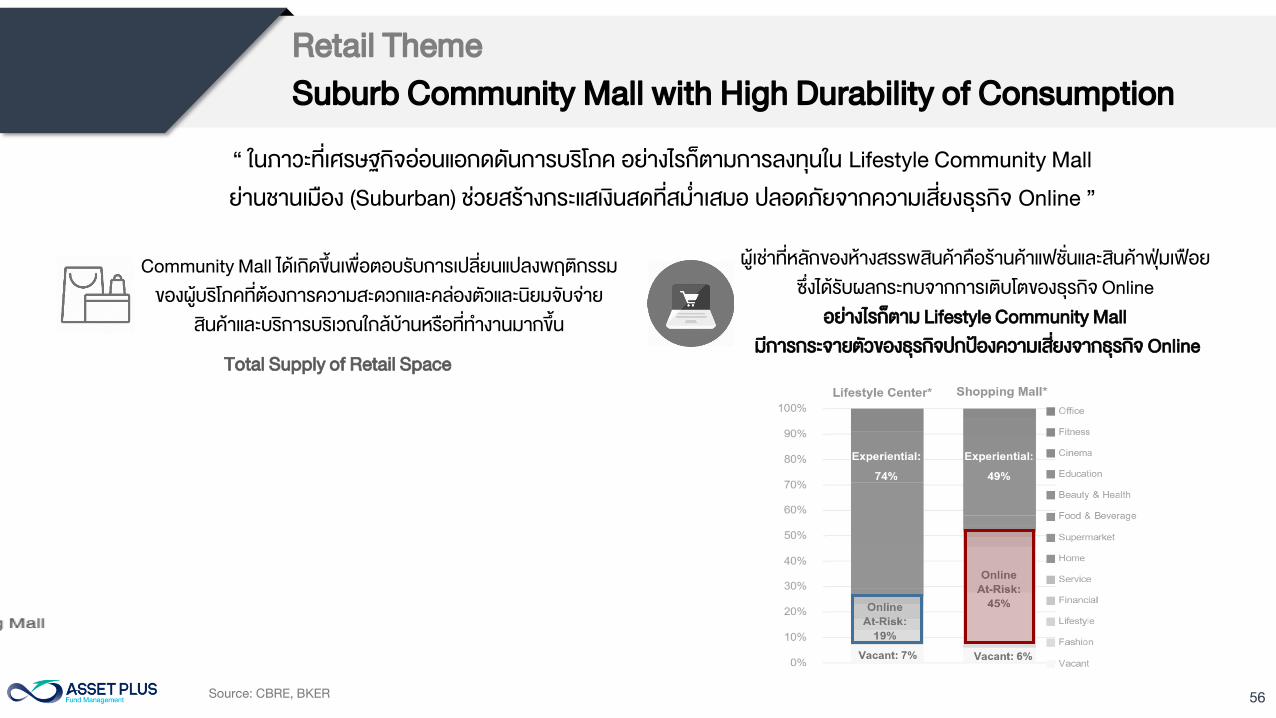
56
“ ในภาวะทเศรษฐกจออนแอกดดนการบรโภค อยางไรกตามการลงทนใน Lifestyle Community Mall
ยานชานเมอง (Suburban) ชวยสรางกระแสเงนสดทสม าเสมอ ปลอดภยจากความเสยงธรกจ Online ”
Source: CBRE, BKER
Total Supply of Retail Space
Community Mall ไดเกดขนเพอตอบรบการเปลยนแปลงพฤตกรรม
ของผบรโภคทตองการความสะดวกและคลองตวและนยมจบจาย
สนคาและบรการบรเวณใกลบานหรอทท างานมากขน
ผเชาทหลกของหางสรรพสนคาคอรานคาแฟชนและสนคาฟมเฟอย
ซงไดรบผลกระทบจากการเตบโตของธรกจ Online
อยางไรกตาม Lifestyle Community Mall
มการกระจายตวของธรกจปกปองความเสยงจากธรกจ Online
Retail Theme
Suburb Community Mall with High Durability of Consumption
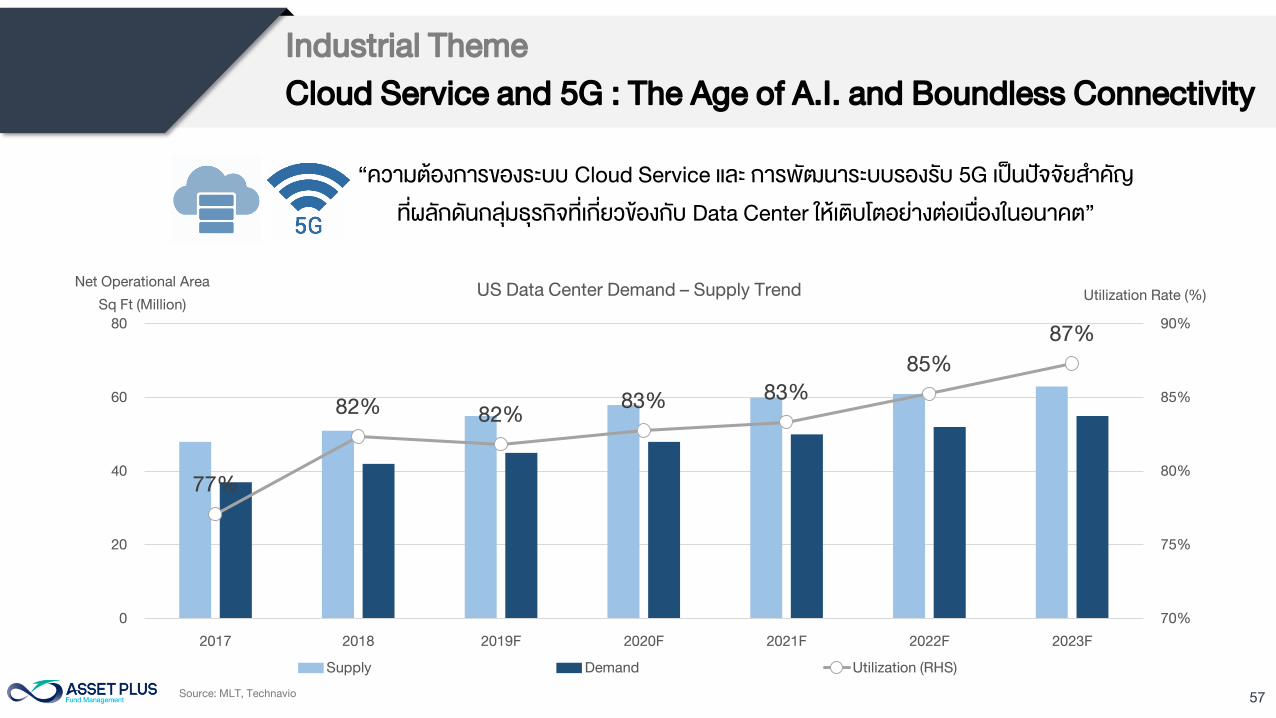
57Source: MLT, Technavio
Industrial Theme
Cloud Service and 5G : The Age of A.I. and Boundless Connectivity
77%
82%82%
83%83%
85%
87%
70%
75%
80%
85%
90%
0
20
40
60
80
2017 2018 2019F 2020F 2021F 2022F 2023F
Utilization Rate (%)
Net Operational Area
Sq Ft (Million)
US Data Center Demand – Supply Trend
Supply Demand Utilization (RHS)
“ความตองการของระบบ Cloud Service และ การพฒนาระบบรองรบ 5G เปนปจจยส าคญ
ทผลกดนกลมธรกจทเกยวของกบ Data Center ใหเตบโตอยางตอเนองในอนาคต”
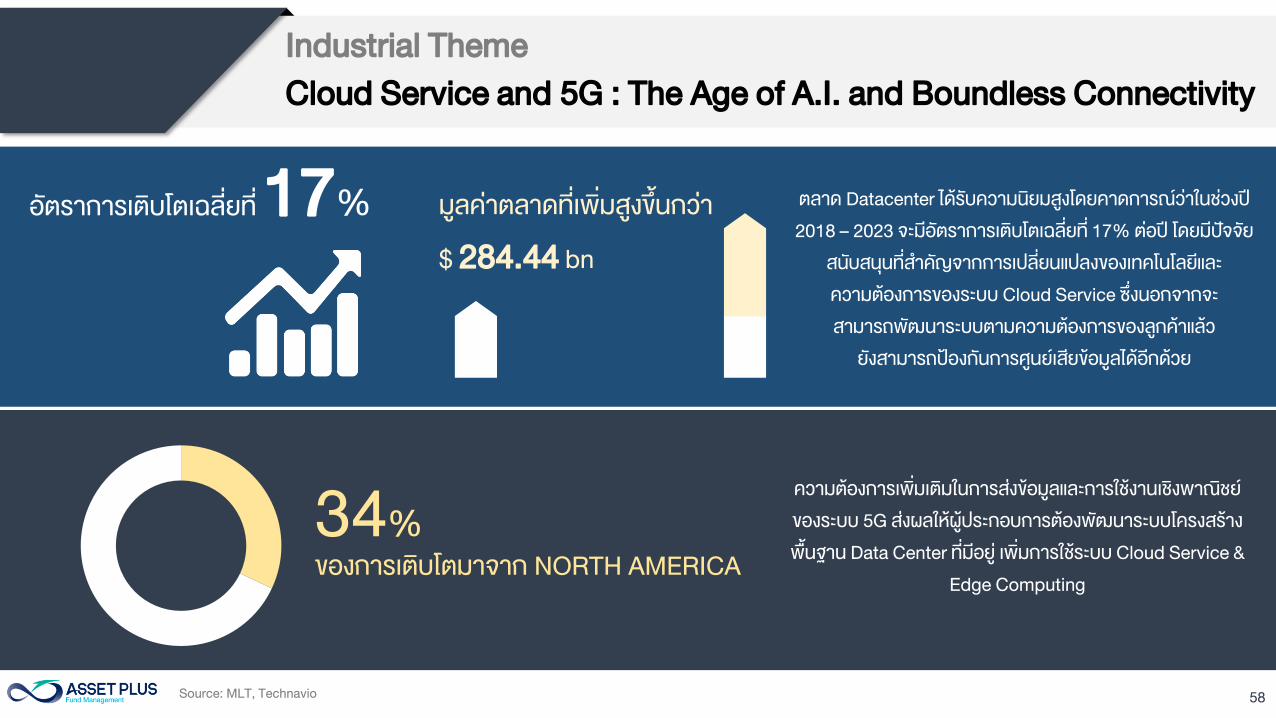
58Source: MLT, Technavio
Industrial Theme
Cloud Service and 5G : The Age of A.I. and Boundless Connectivity
อตราการเตบโตเฉลยท 17%ตลาด Datacenter ไดรบความนยมสงโดยคาดการณวาในชวงป
2018 – 2023 จะมอตราการเตบโตเฉลยท 17% ตอป โดยมปจจย
สนบสนนทส าคญจากการเปลยนแปลงของเทคโนโลยและ
ความตองการของระบบ Cloud Service ซงนอกจากจะ
สามารถพฒนาระบบตามความตองการของลกคาแลว
ยงสามารถปองกนการศนยเสยขอมลไดอกดวย
มลคาตลาดทเพมสงขนกวา
$ 284.44 bn
ความตองการเพมเตมในการสงขอมลและการใชงานเชงพาณชย
ของระบบ 5G สงผลใหผประกอบการตองพฒนาระบบโครงสราง
พนฐาน Data Center ทมอย เพมการใชระบบ Cloud Service &
Edge Computing
34%
ของการเตบโตมาจาก NORTH AMERICA
59
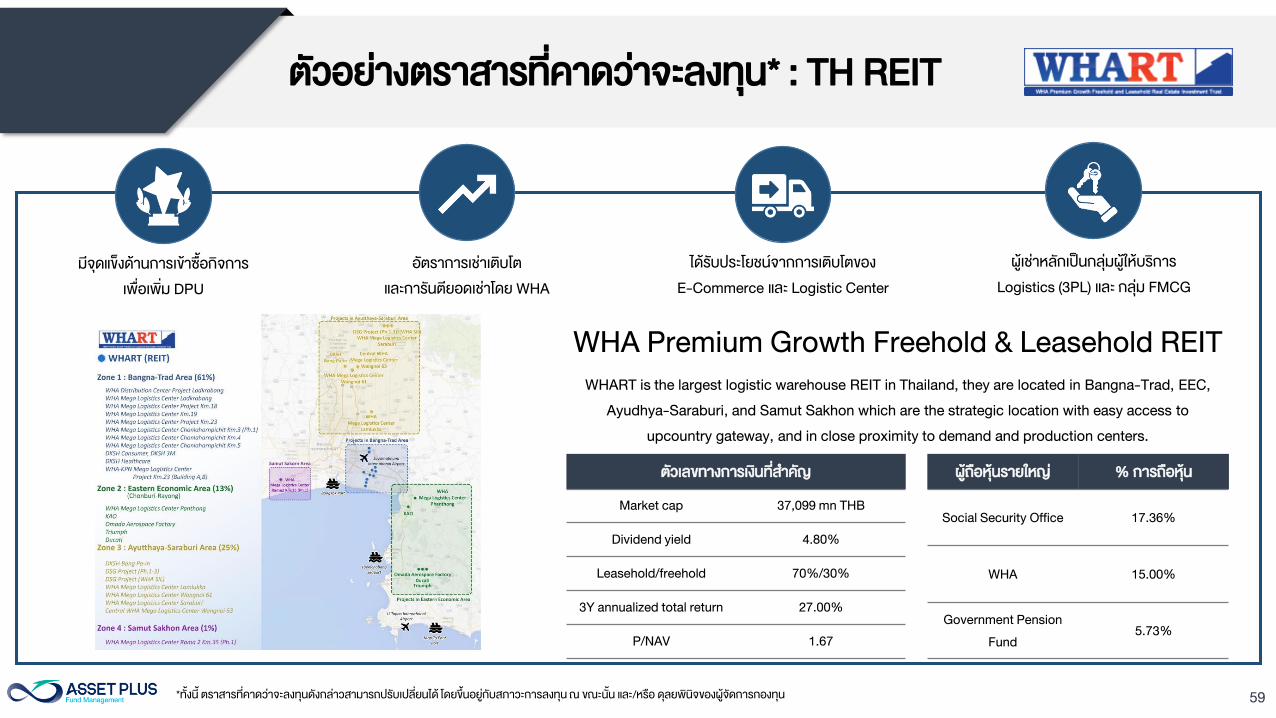
ตวอยางตราสารทคาดวาจะลงทน* : TH REIT
WHART is the largest logistic warehouse REIT in Thailand, they are located in Bangna-Trad, EEC,
Ayudhya-Saraburi, and Samut Sakhon which are the strategic location with easy access to
upcountry gateway, and in close proximity to demand and production centers.
ตวเลขทางการเงนทส าคญ
Market cap 37,099 mn THB
Dividend yield 4.80%
Leasehold/freehold 70%/30%
3Y annualized total return 27.00%
P/NAV 1.67
ผถอหนรายใหญ % การถอหน
Social Security Office 17.36%
WHA 15.00%
Government Pension
Fund
5.73%
WHA Premium Growth Freehold & Leasehold REIT
มจดแขงดานการเขาซอกจการ
เพอเพม DPU
อตราการเชาเตบโต
และการนตยอดเชาโดย WHA
ไดรบประโยชนจากการเตบโตของ
E-Commerce และ Logistic Center
ผเชาหลกเปนกลมผใหบรการ
Logistics (3PL) และ กลม FMCG
*ทงน ตราสารทคาดวาจะลงทนดงกลาวสามารถปรบเปลยนได โดยขนอยกบสภาวะการลงทน ณ ขณะนน และ/หรอ ดลยพนจของผจดการกองทน
60
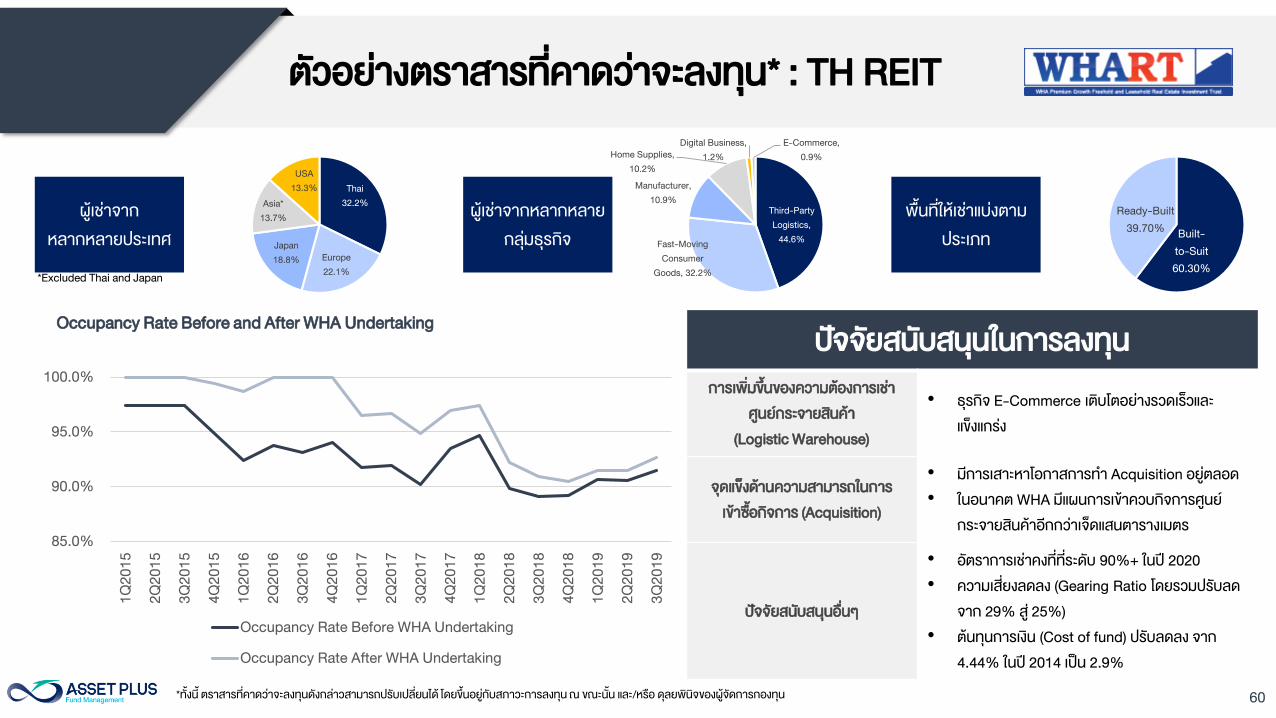
Occupancy Rate Before and After WHA Undertaking
85.0%
90.0%
95.0%
100.0%
1Q
20
15
2Q
20
15
3Q
20
15
4Q
20
15
1Q
20
16
2Q
20
16
3Q
20
16
4Q
20
16
1Q
20
17
2Q
20
17
3Q
20
17
4Q
20
17
1Q
20
18
2Q
20
18
3Q
20
18
4Q
20
18
1Q
20
19
2Q
20
19
3Q
20
19
Occupancy Rate Before WHA Undertaking
Occupancy Rate After WHA Undertaking
ปจจยสนบสนนในการลงทน
การเพมขนของความตองการเชา
ศนยกระจายสนคา
(Logistic Warehouse)
• ธรกจ E-Commerce เตบโตอยางรวดเรวและ
แขงแกรง
จดแขงดานความสามารถในการ
เขาซอกจการ (Acquisition)
• มการเสาะหาโอกาสการท า Acquisition อยตลอด
• ในอนาคต WHA มแผนการเขาควบกจการศนย
กระจายสนคาอกกวาเจดแสนตารางเมตร
ปจจยสนบสนนอนๆ
• อตราการเชาคงททระดบ 90%+ ในป 2020
• ความเสยงลดลง (Gearing Ratio โดยรวมปรบลด
จาก 29% ส 25%)
• ตนทนการเงน (Cost of fund) ปรบลดลง จาก
4.44% ในป 2014 เปน 2.9%
Thai
32.2%
Europe
22.1%
Japan
18.8%
Asia*
13.7%
USA
13.3%
Third-Party
Logistics,
44.6%Fast-Moving
Consumer
Goods, 32.2%
Manufacturer,
10.9%
Home Supplies,
10.2%
Digital Business,
1.2%
E-Commerce,
0.9%
Built-
to-Suit
60.30%
Ready-Built
39.70%
ผเชาจาก
หลากหลายประเทศ
ผเชาจากหลากหลาย
กลมธรกจ
พนทใหเชาแบงตาม
ประเภท
*Excluded Thai and Japan
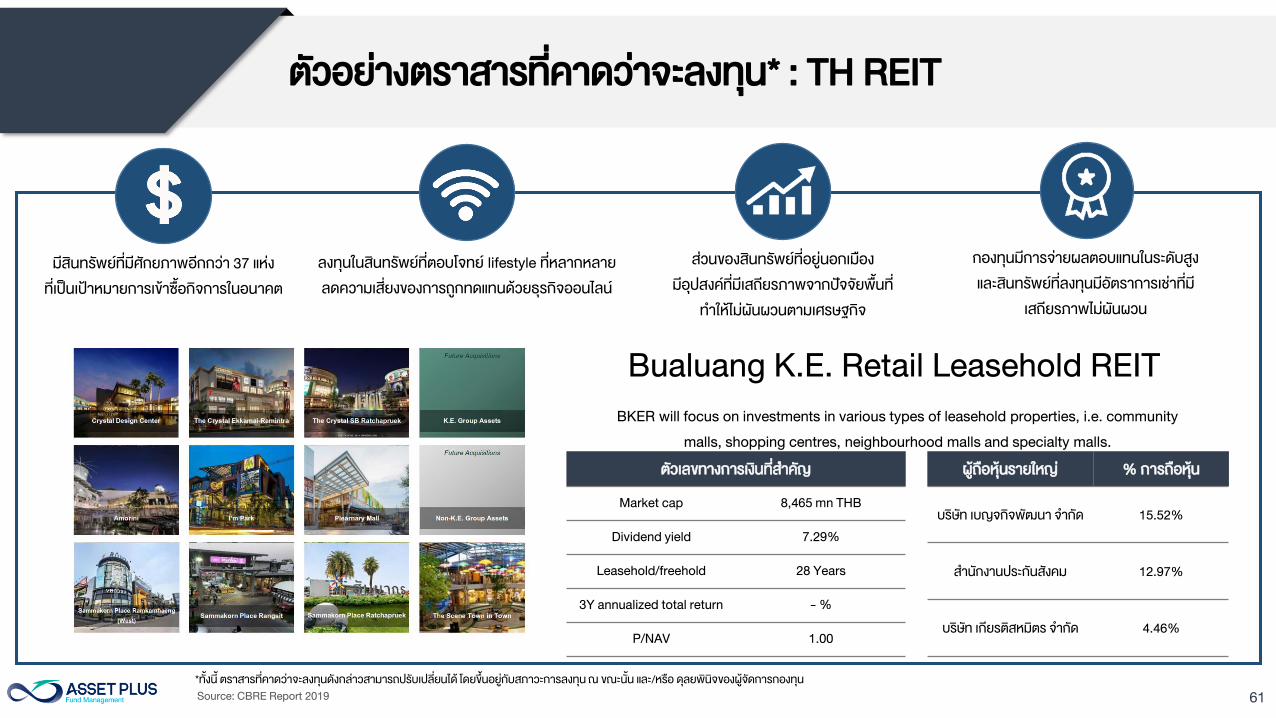
ตวอยางตราสารทคาดวาจะลงทน* : TH REIT
*ทงน ตราสารทคาดวาจะลงทนดงกลาวสามารถปรบเปลยนได โดยขนอยกบสภาวะการลงทน ณ ขณะนน และ/หรอ ดลยพนจของผจดการกองทน
61
ตวเลขทางการเงนทส าคญ
Market cap 8,465 mn THB
Dividend yield 7.29%
Leasehold/freehold 28 Years
3Y annualized total return - %
P/NAV 1.00
ผถอหนรายใหญ % การถอหน
บรษท เบญจกจพฒนา จ ากด 15.52%
ส านกงานประกนสงคม 12.97%
บรษท เกยรตสหมตร จ ากด 4.46%
Bualuang K.E. Retail Leasehold REIT
มสนทรพยทมศกยภาพอกกวา 37 แหง
ทเปนเปาหมายการเขาซอกจการในอนาคต
ลงทนในสนทรพยทตอบโจทย lifestyle ทหลากหลาย
ลดความเสยงของการถกทดแทนดวยธรกจออนไลน
สวนของสนทรพยทอยนอกเมอง
มอปสงคทมเสถยรภาพจากปจจยพนท
ท าใหไมผนผวนตามเศรษฐกจ
กองทนมการจายผลตอบแทนในระดบสง
และสนทรพยทลงทนมอตราการเชาทม
เสถยรภาพไมผนผวน
BKER will focus on investments in various types of leasehold properties, i.e. community
malls, shopping centres, neighbourhood malls and specialty malls.
Source: CBRE Report 2019
ตวอยางตราสารทคาดวาจะลงทน* : TH REIT
*ทงน ตราสารทคาดวาจะลงทนดงกลาวสามารถปรบเปลยนได โดยขนอยกบสภาวะการลงทน ณ ขณะนน และ/หรอ ดลยพนจของผจดการกองทน
62
75%
80%
85%
90%
95%
100%
2007 2008 2009 2010 2011 2012 2013 2014 2015 2016 2017 2018 2019
Occupancy rate
Downtown Midtown Suburb
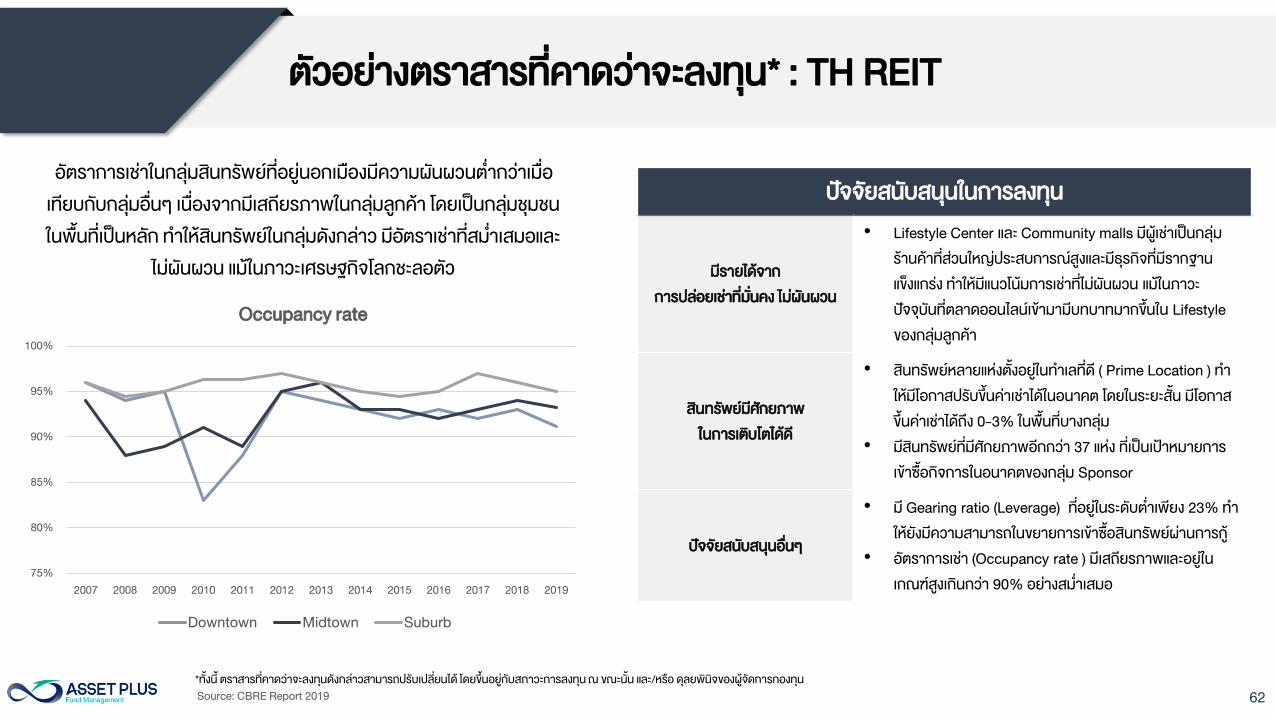
อตราการเชาในกลมสนทรพยทอยนอกเมองมความผนผวนต ากวาเมอ
เทยบกบกลมอนๆ เนองจากมเสถยรภาพในกลมลกคา โดยเปนกลมชมชน
ในพนทเปนหลก ท าใหสนทรพยในกลมดงกลาว มอตราเชาทสม าเสมอและ
ไมผนผวน แมในภาวะเศรษฐกจโลกชะลอตว
ปจจยสนบสนนในการลงทน
มรายไดจาก
การปลอยเชาทมนคง ไมผนผวน
• Lifestyle Center และ Community malls มผเชาเปนกลม
รานคาทสวนใหญประสบการณสงและมธรกจทมรากฐาน
แขงแกรง ท าใหมแนวโนมการเชาทไมผนผวน แมในภาวะ
ปจจบนทตลาดออนไลนเขามามบทบาทมากขนใน Lifestyle
ของกลมลกคา
สนทรพยมศกยภาพ
ในการเตบโตไดด
• สนทรพยหลายแหงตงอยในท าเลทด ( Prime Location ) ท า
ใหมโอกาสปรบขนคาเชาไดในอนาคต โดยในระยะสน มโอกาส
ขนคาเชาไดถง 0-3% ในพนทบางกลม
• มสนทรพยทมศกยภาพอกกวา 37 แหง ทเปนเปาหมายการ
เขาซอกจการในอนาคตของกลม Sponsor
ปจจยสนบสนนอนๆ
• ม Gearing ratio (Leverage) ทอยในระดบต าเพยง 23% ท า
ใหยงมความสามารถในขยายการเขาซอสนทรพยผานการก
• อตราการเชา (Occupancy rate ) มเสถยรภาพและอยใน
เกณฑสงเกนกวา 90% อยางสม าเสมอ
Source: CBRE Report 2019
ตวอยางตราสารทคาดวาจะลงทน* : TH REIT
*ทงน ตราสารทคาดวาจะลงทนดงกลาวสามารถปรบเปลยนได โดยขนอยกบสภาวะการลงทน ณ ขณะนน และ/หรอ ดลยพนจของผจดการกองทน
63
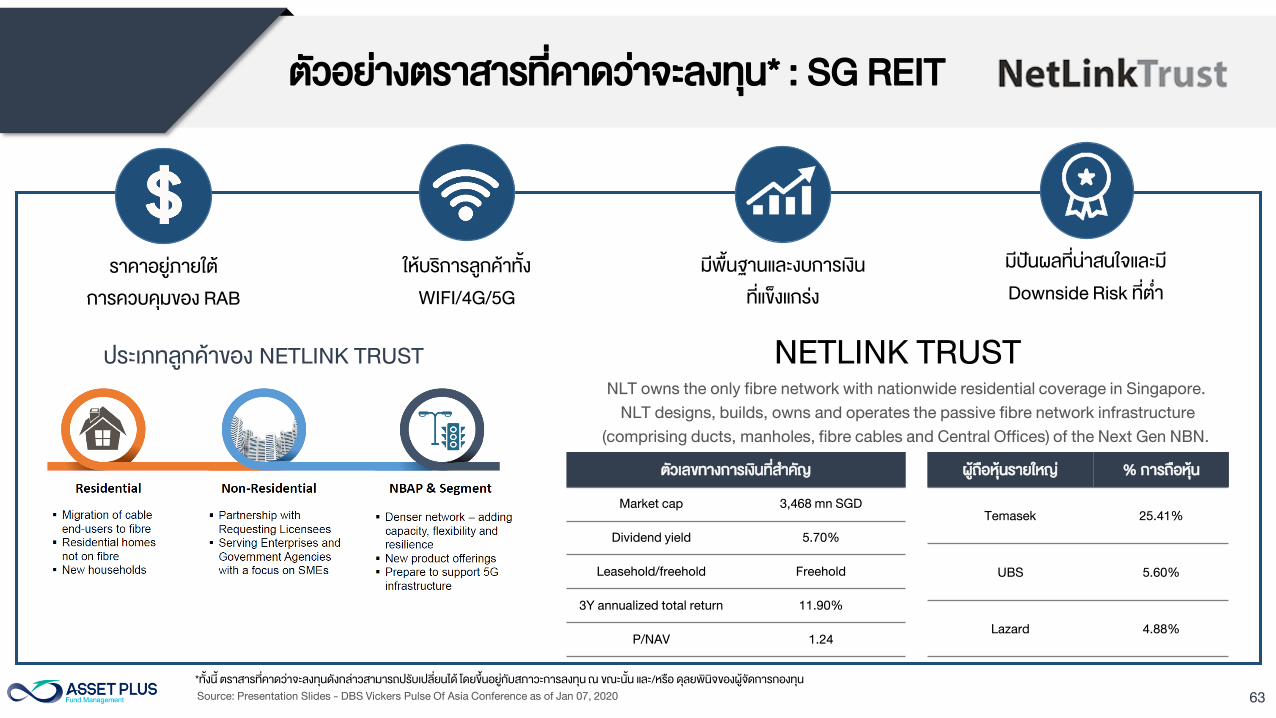
NLT owns the only fibre network with nationwide residential coverage in Singapore.
NLT designs, builds, owns and operates the passive fibre network infrastructure
(comprising ducts, manholes, fibre cables and Central Offices) of the Next Gen NBN.
ตวเลขทางการเงนทส าคญ
Market cap 3,468 mn SGD
Dividend yield 5.70%
Leasehold/freehold Freehold
3Y annualized total return 11.90%
P/NAV 1.24
ผถอหนรายใหญ % การถอหน
Temasek 25.41%
UBS 5.60%
Lazard 4.88%
NETLINK TRUST
ราคาอยภายใต
การควบคมของ RAB
ใหบรการลกคาทง
WIFI/4G/5G
มพนฐานและงบการเงน
ทแขงแกรง
มปนผลทนาสนใจและม
Downside Risk ทต า
ประเภทลกคาของ NETLINK TRUST
Source: Presentation Slides - DBS Vickers Pulse Of Asia Conference as of Jan 07, 2020
ตวอยางตราสารทคาดวาจะลงทน* : SG REIT
*ทงน ตราสารทคาดวาจะลงทนดงกลาวสามารถปรบเปลยนได โดยขนอยกบสภาวะการลงทน ณ ขณะนน และ/หรอ ดลยพนจของผจดการกองทน
64
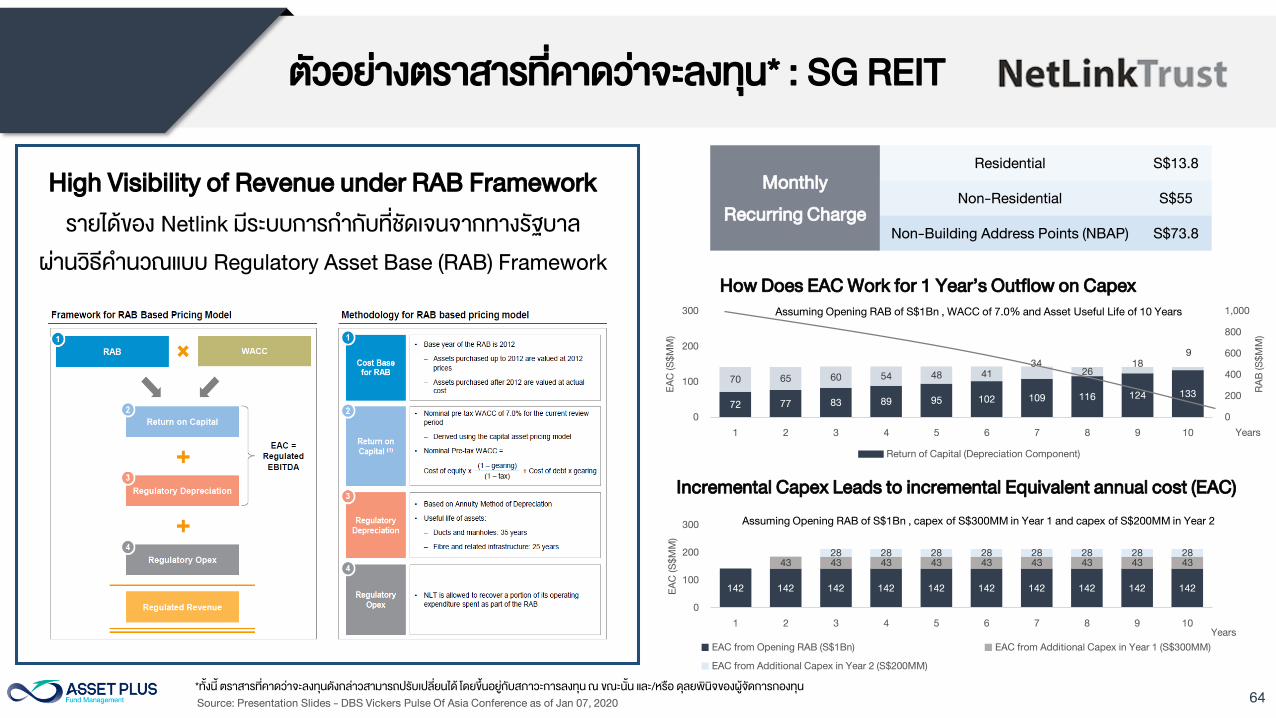
High Visibility of Revenue under RAB Framework
รายไดของ Netlink มระบบการก ากบทชดเจนจากทางรฐบาล
ผานวธค านวณแบบ Regulatory Asset Base (RAB) Framework
72 77 83 89 95 102 109 116 124 133
70 65 60 54 48 41
34
26
18
9
0
200
400
600
800
1,000
0
100
200
300
1 2 3 4 5 6 7 8 9 10
RA
B (S
$M
M)
EA
C (S
$M
M)
Years
Return of Capital (Depreciation Component)
Assuming Opening RAB of S$1Bn , WACC of 7.0% and Asset Useful Life of 10 Years
142 142 142 142 142 142 142 142 142 142
43 43 43 43 43 43 43 43 43
28 28 28 28 28 28 28 28
0
100
200
300
1 2 3 4 5 6 7 8 9 10
EA
C (S
$M
M)
Years
EAC from Opening RAB (S$1Bn) EAC from Additional Capex in Year 1 (S$300MM)
EAC from Additional Capex in Year 2 (S$200MM)
Assuming Opening RAB of S$1Bn , capex of S$300MM in Year 1 and capex of S$200MM in Year 2
How Does EAC Work for 1 Year’s Outflow on Capex
Incremental Capex Leads to incremental Equivalent annual cost (EAC)
Source: Presentation Slides - DBS Vickers Pulse Of Asia Conference as of Jan 07, 2020
Monthly
Recurring Charge
Residential S$13.8
Non-Residential S$55
Non-Building Address Points (NBAP) S$73.8
ตวอยางตราสารทคาดวาจะลงทน* : SG REIT
*ทงน ตราสารทคาดวาจะลงทนดงกลาวสามารถปรบเปลยนได โดยขนอยกบสภาวะการลงทน ณ ขณะนน และ/หรอ ดลยพนจของผจดการกองทน
65
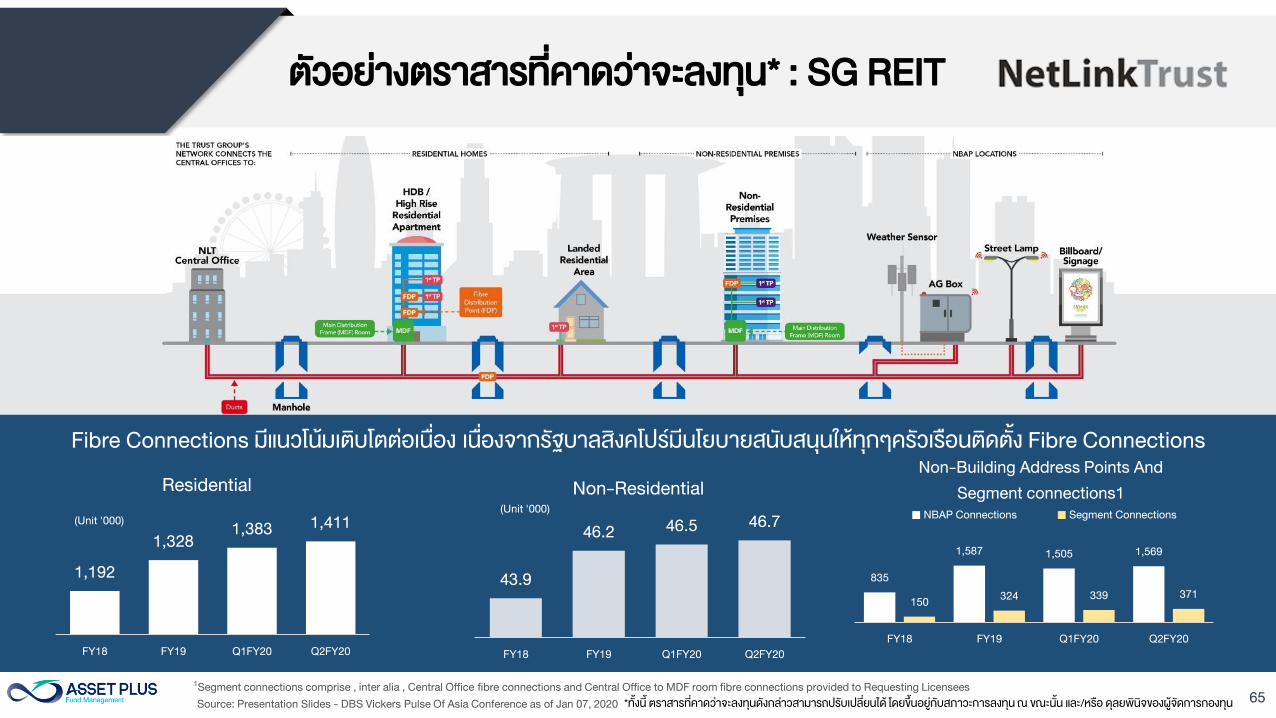
Fibre Connections มแนวโนมเตบโตตอเนอง เนองจากรฐบาลสงคโปรมนโยบายสนบสนนใหทกๆครวเรอนตดตง Fibre Connections
1,192
1,328
1,3831,411
FY18 FY19 Q1FY20 Q2FY20
(Unit '000)
Residential
43.9
46.246.5
46.7
FY18 FY19 Q1FY20 Q2FY20
(Unit '000)
Non-Residential
835
1,5871,505 1,569
150324 339 371
FY18 FY19 Q1FY20 Q2FY20
Non-Building Address Points And
Segment connections1
NBAP Connections Segment Connections
1
Segment connections comprise , inter alia , Central Office fibre connections and Central Office to MDF room fibre connections provided to Requesting Licensees
Source: Presentation Slides - DBS Vickers Pulse Of Asia Conference as of Jan 07, 2020
ตวอยางตราสารทคาดวาจะลงทน* : SG REIT
*ทงน ตราสารทคาดวาจะลงทนดงกลาวสามารถปรบเปลยนได โดยขนอยกบสภาวะการลงทน ณ ขณะนน และ/หรอ ดลยพนจของผจดการกองทน
66
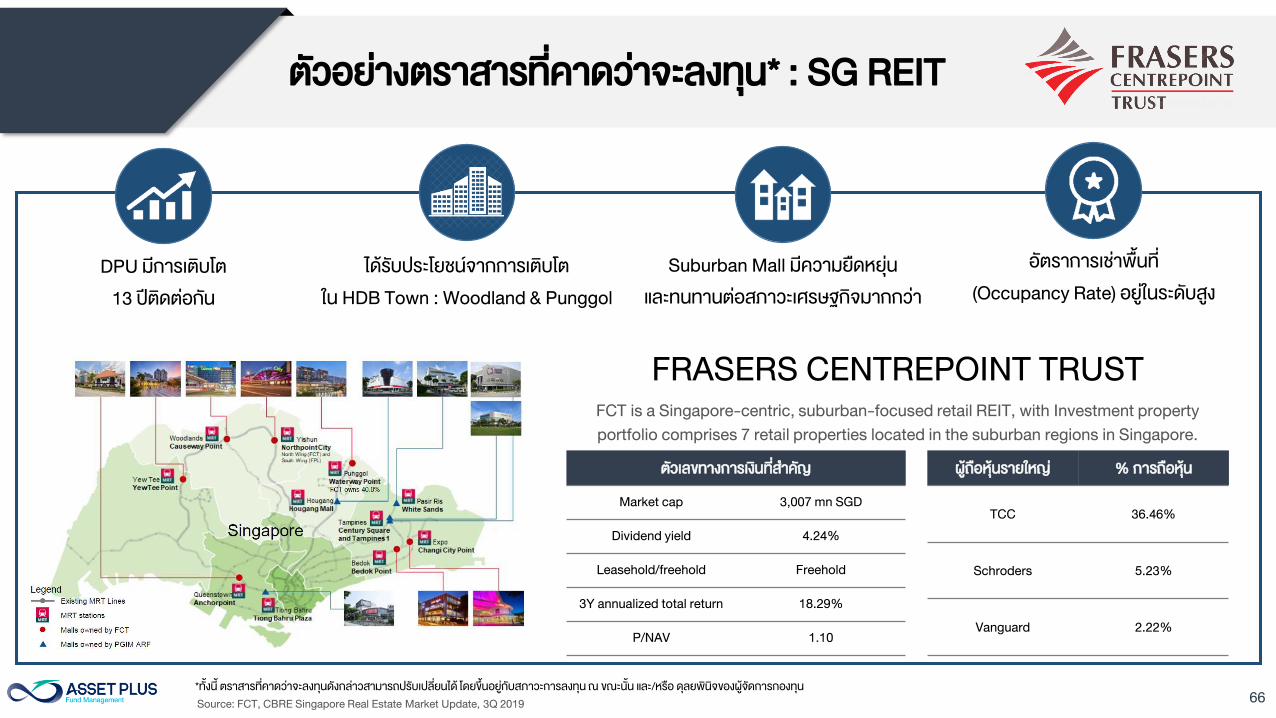
FCT is a Singapore-centric, suburban-focused retail REIT, with Investment property
portfolio comprises 7 retail properties located in the suburban regions in Singapore.
ตวเลขทางการเงนทส าคญ
Market cap 3,007 mn SGD
Dividend yield 4.24%
Leasehold/freehold Freehold
3Y annualized total return 18.29%
P/NAV 1.10
ผถอหนรายใหญ % การถอหน
TCC 36.46%
Schroders 5.23%
Vanguard 2.22%
FRASERS CENTREPOINT TRUST
DPU มการเตบโต
13 ปตดตอกน
ไดรบประโยชนจากการเตบโต
ใน HDB Town : Woodland & Punggol
Suburban Mall มความยดหยน
และทนทานตอสภาวะเศรษฐกจมากกวา
อตราการเชาพนท
(Occupancy Rate) อยในระดบสง
Source: FCT, CBRE Singapore Real Estate Market Update, 3Q 2019
ตวอยางตราสารทคาดวาจะลงทน* : SG REIT
*ทงน ตราสารทคาดวาจะลงทนดงกลาวสามารถปรบเปลยนได โดยขนอยกบสภาวะการลงทน ณ ขณะนน และ/หรอ ดลยพนจของผจดการกองทน
67
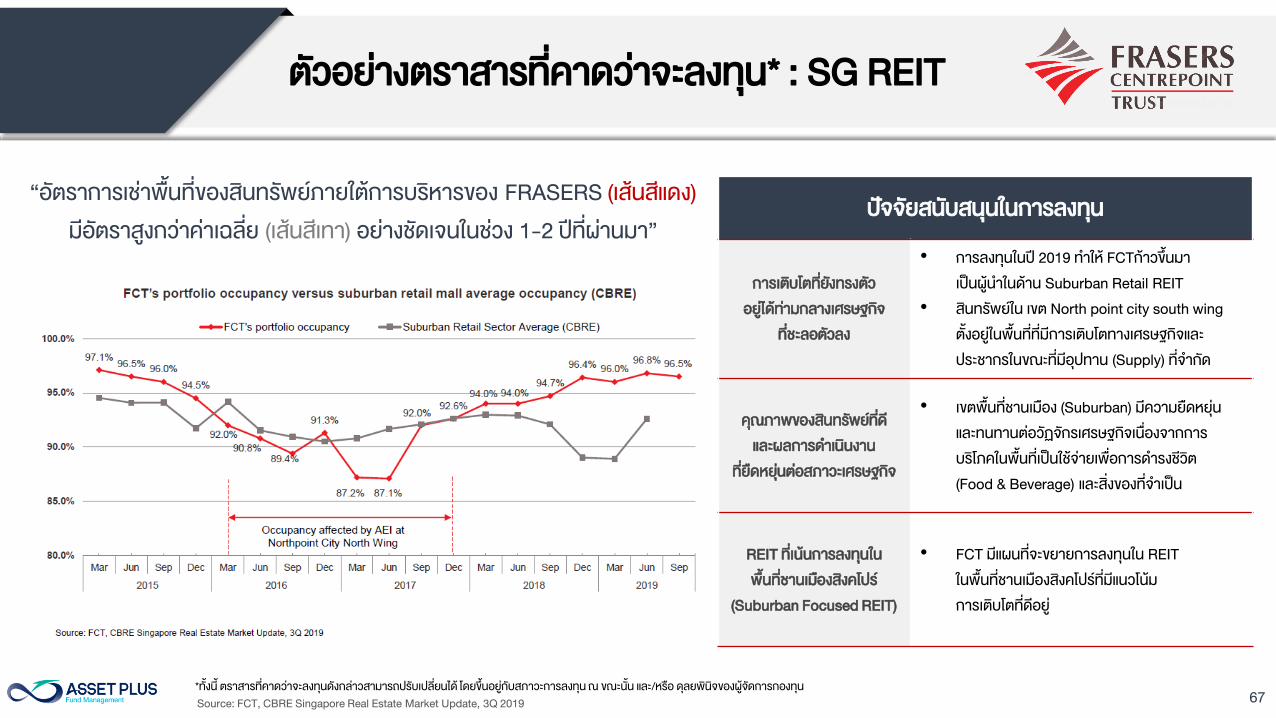
ปจจยสนบสนนในการลงทน
การเตบโตทยงทรงตว
อยไดทามกลางเศรษฐกจ
ทชะลอตวลง
• การลงทนในป 2019 ท าให FCTกาวขนมา
เปนผน าในดาน Suburban Retail REIT
• สนทรพยใน เขต North point city south wing
ตงอยในพนททมการเตบโตทางเศรษฐกจและ
ประชากรในขณะทมอปทาน (Supply) ทจ ากด
คณภาพของสนทรพยทด
และผลการด าเนนงาน
ทยดหยนตอสภาวะเศรษฐกจ
• เขตพนทชานเมอง (Suburban) มความยดหยน
และทนทานตอวฏจกรเศรษฐกจเนองจากการ
บรโภคในพนทเปนใชจายเพอการด ารงชวต
(Food & Beverage) และสงของทจ าเปน
REIT ทเนนการลงทนใน
พนทชานเมองสงคโปร
(Suburban Focused REIT)
• FCT มแผนทจะขยายการลงทนใน REIT
ในพนทชานเมองสงคโปรทมแนวโนม
การเตบโตทดอย
“อตราการเชาพนทของสนทรพยภายใตการบรหารของ FRASERS (เสนสแดง)
มอตราสงกวาคาเฉลย (เสนสเทา) อยางชดเจนในชวง 1-2 ปทผานมา”
Source: FCT, CBRE Singapore Real Estate Market Update, 3Q 2019
*ทงน ตราสารทคาดวาจะลงทนดงกลาวสามารถปรบเปลยนได โดยขนอยกบสภาวะการลงทน ณ ขณะนน และ/หรอ ดลยพนจของผจดการกองทน
ตวอยางตราสารทคาดวาจะลงทน* : SG REIT
68
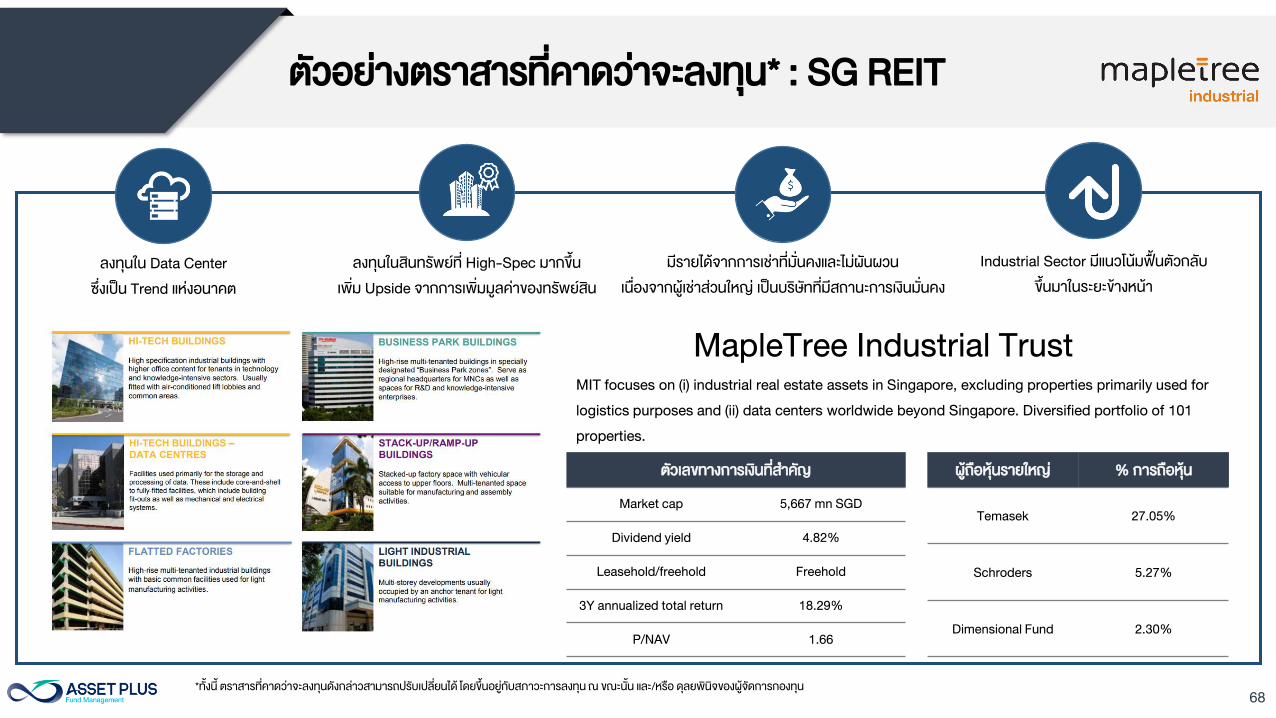
MIT focuses on (i) industrial real estate assets in Singapore, excluding properties primarily used for
logistics purposes and (ii) data centers worldwide beyond Singapore. Diversified portfolio of 101
properties.
ตวเลขทางการเงนทส าคญ
Market cap 5,667 mn SGD
Dividend yield 4.82%
Leasehold/freehold Freehold
3Y annualized total return 18.29%
P/NAV 1.66
ผถอหนรายใหญ % การถอหน
Temasek 27.05%
Schroders 5.27%
Dimensional Fund 2.30%
MapleTree Industrial Trust
ลงทนใน Data Center
ซงเปน Trend แหงอนาคต
ลงทนในสนทรพยท High-Spec มากขน
เพม Upside จากการเพมมลคาของทรพยสน
มรายไดจากการเชาทมนคงและไมผนผวน
เนองจากผเชาสวนใหญ เปนบรษททมสถานะการเงนมนคง
Industrial Sector มแนวโนมฟนตวกลบ
ขนมาในระยะขางหนา
*ทงน ตราสารทคาดวาจะลงทนดงกลาวสามารถปรบเปลยนได โดยขนอยกบสภาวะการลงทน ณ ขณะนน และ/หรอ ดลยพนจของผจดการกองทน
ตวอยางตราสารทคาดวาจะลงทน* : SG REIT
69
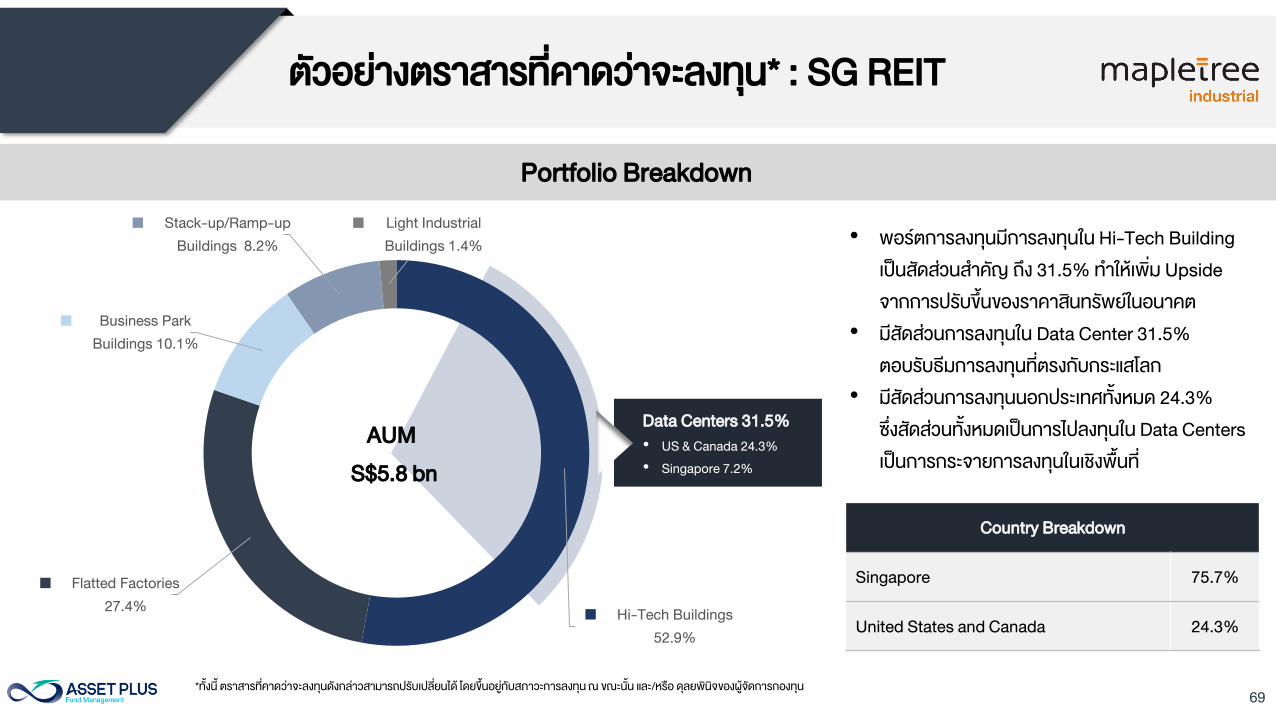
Portfolio Breakdown
Hi-Tech Buildings
52.9%
Flatted Factories
27.4%
Business Park
Buildings 10.1%
Stack-up/Ramp-up
Buildings 8.2%
Light Industrial
Buildings 1.4%
AUM
S$5.8 bn
Data Centers 31.5%
• US & Canada 24.3%
• Singapore 7.2%
Country Breakdown
Singapore 75.7%
United States and Canada 24.3%
• พอรตการลงทนมการลงทนใน Hi-Tech Building
เปนสดสวนส าคญ ถง 31.5% ท าใหเพม Upside
จากการปรบขนของราคาสนทรพยในอนาคต
• มสดสวนการลงทนใน Data Center 31.5%
ตอบรบธมการลงทนทตรงกบกระแสโลก
• มสดสวนการลงทนนอกประเทศทงหมด 24.3%
ซงสดสวนทงหมดเปนการไปลงทนใน Data Centers
เปนการกระจายการลงทนในเชงพนท
*ทงน ตราสารทคาดวาจะลงทนดงกลาวสามารถปรบเปลยนได โดยขนอยกบสภาวะการลงทน ณ ขณะนน และ/หรอ ดลยพนจของผจดการกองทน
ตวอยางตราสารทคาดวาจะลงทน* : SG REIT
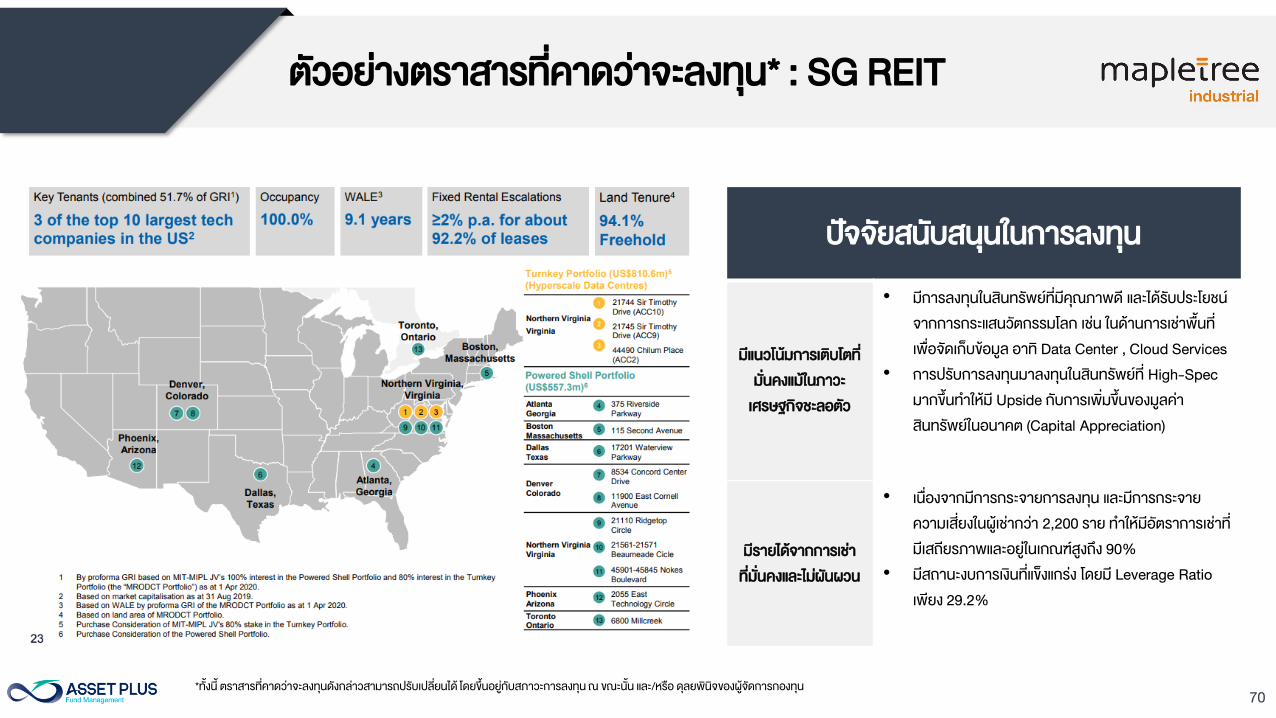
70
ปจจยสนบสนนในการลงทน
มแนวโนมการเตบโตท
มนคงแมในภาวะ
เศรษฐกจชะลอตว
• มการลงทนในสนทรพยทมคณภาพด และไดรบประโยชน
จากการกระแสนวตกรรมโลก เชน ในดานการเชาพนท
เพอจดเกบขอมล อาท Data Center , Cloud Services
• การปรบการลงทนมาลงทนในสนทรพยท High-Spec
มากขนท าใหม Upside กบการเพมขนของมลคา
สนทรพยในอนาคต (Capital Appreciation)
มรายไดจากการเชา
ทมนคงและไมผนผวน
• เนองจากมการกระจายการลงทน และมการกระจาย
ความเสยงในผเชากวา 2,200 ราย ท าใหมอตราการเชาท
มเสถยรภาพและอยในเกณฑสงถง 90%
• มสถานะงบการเงนทแขงแกรง โดยม Leverage Ratio
เพยง 29.2%
*ทงน ตราสารทคาดวาจะลงทนดงกลาวสามารถปรบเปลยนได โดยขนอยกบสภาวะการลงทน ณ ขณะนน และ/หรอ ดลยพนจของผจดการกองทน
ตวอยางตราสารทคาดวาจะลงทน* : SG REIT
71
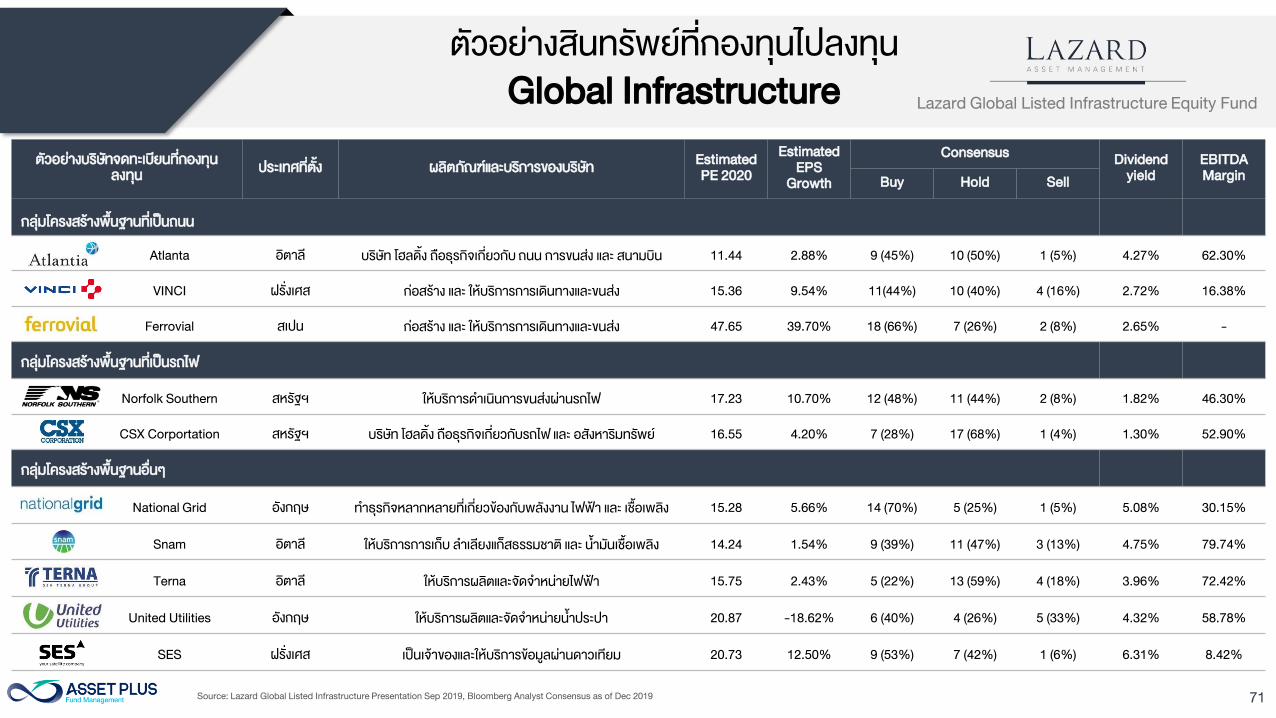
ตวอยางสนทรพยทกองทนไปลงทน
Global Infrastructure
ตวอยางบรษทจดทะเบยนทกองทน
ลงทน
ประเทศทตง ผลตภณฑและบรการของบรษท
Estimated
PE 2020
Estimated
EPS
Growth
ConsensusDividend
yield
EBITDA
Margin Buy Hold Sell
กลมโครงสรางพนฐานทเปนถนน
Atlanta อตาล บรษท โฮลดง ถอธรกจเกยวกบ ถนน การขนสง และ สนามบน 11.44 2.88% 9 (45%) 10 (50%) 1 (5%) 4.27% 62.30%
VINCI ฝรงเศส กอสราง และ ใหบรการการเดนทางและขนสง 15.36 9.54% 11(44%) 10 (40%) 4 (16%) 2.72% 16.38%
Ferrovial สเปน กอสราง และ ใหบรการการเดนทางและขนสง 47.65 39.70% 18 (66%) 7 (26%) 2 (8%) 2.65% -
กลมโครงสรางพนฐานทเปนรถไฟ
Norfolk Southern สหรฐฯ ใหบรการด าเนนการขนสงผานรถไฟ 17.23 10.70% 12 (48%) 11 (44%) 2 (8%) 1.82% 46.30%
CSX Corportation สหรฐฯ บรษท โฮลดง ถอธรกจเกยวกบรถไฟ และ อสงหารมทรพย 16.55 4.20% 7 (28%) 17 (68%) 1 (4%) 1.30% 52.90%
กลมโครงสรางพนฐานอนๆ
National Grid องกฤษ ท าธรกจหลากหลายทเกยวของกบพลงงาน ไฟฟา และ เชอเพลง 15.28 5.66% 14 (70%) 5 (25%) 1 (5%) 5.08% 30.15%
Snam อตาล ใหบรการการเกบ ล าเลยงแกสธรรมชาต และ น ามนเชอเพลง 14.24 1.54% 9 (39%) 11 (47%) 3 (13%) 4.75% 79.74%
Terna อตาล ใหบรการผลตและจดจ าหนายไฟฟา 15.75 2.43% 5 (22%) 13 (59%) 4 (18%) 3.96% 72.42%
United Utilities องกฤษ ใหบรการผลตและจดจ าหนายน าประปา 20.87 -18.62% 6 (40%) 4 (26%) 5 (33%) 4.32% 58.78%
SES ฝรงเศส เปนเจาของและใหบรการขอมลผานดาวเทยม 20.73 12.50% 9 (53%) 7 (42%) 1 (6%) 6.31% 8.42%
Lazard Global Listed Infrastructure Equity Fund
Source: Lazard Global Listed Infrastructure Presentation Sep 2019, Bloomberg Analyst Consensus as of Dec 2019
72
Lazard Global Listed Infrastructure Fund
73
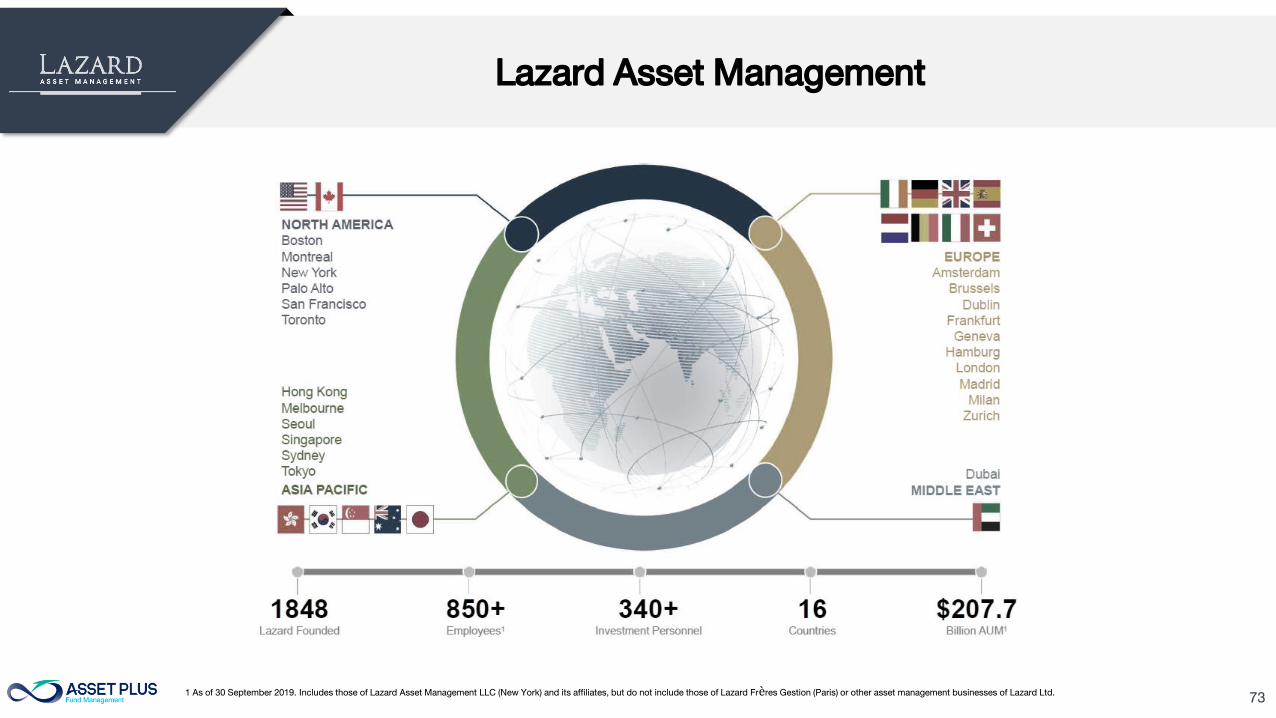
Lazard Asset Management
1 As of 30 September 2019. Includes those of Lazard Asset Management LLC (New York) and its affiliates, but do not include those of Lazard Frères Gestion (Paris) or other asset management businesses of Lazard Ltd.
74
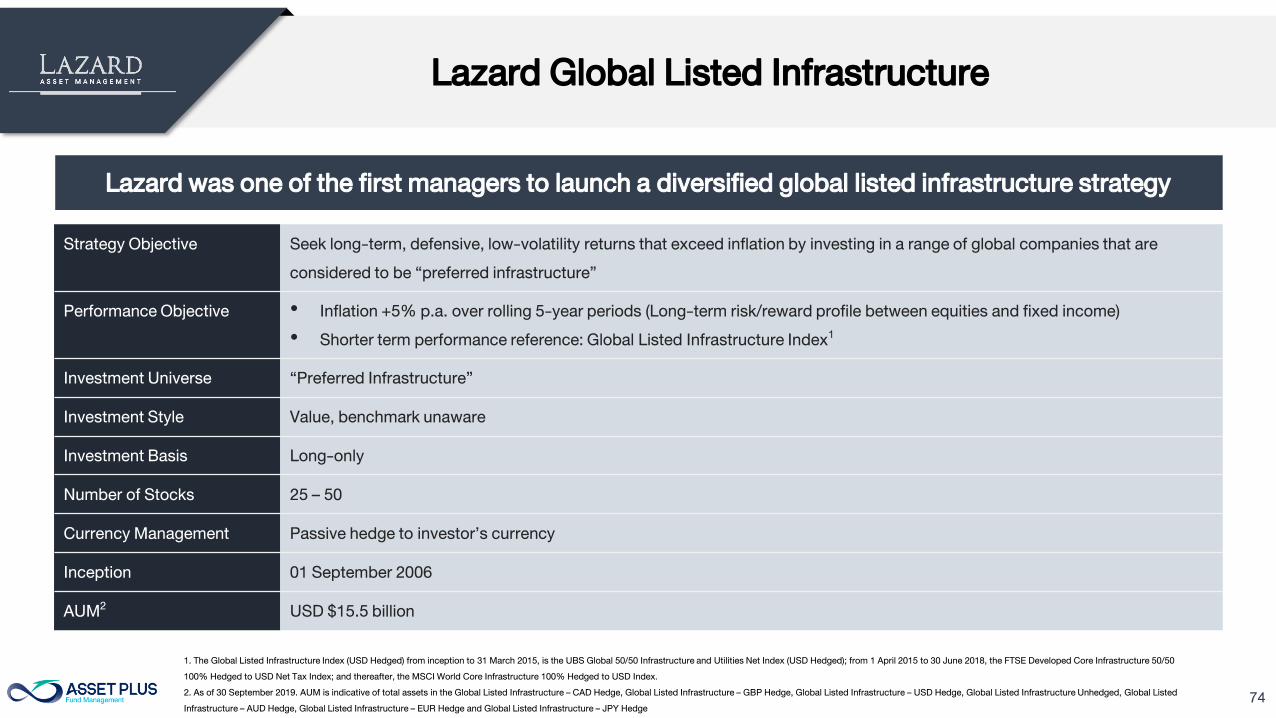
Lazard Global Listed Infrastructure
Strategy Objective Seek long-term, defensive, low-volatility returns that exceed inflation by investing in a range of global companies that are
considered to be “preferred infrastructure”
Performance Objective • Inflation +5% p.a. over rolling 5-year periods (Long-term risk/reward profile between equities and fixed income)
• Shorter term performance reference: Global Listed Infrastructure Index1
Investment Universe “Preferred Infrastructure”
Investment Style Value, benchmark unaware
Investment Basis Long-only
Number of Stocks 25 – 50
Currency Management Passive hedge to investor’s currency
Inception 01 September 2006
AUM2
USD $15.5 billion
Lazard was one of the first managers to launch a diversified global listed infrastructure strategy
1. The Global Listed Infrastructure Index (USD Hedged) from inception to 31 March 2015, is the UBS Global 50/50 Infrastructure and Utilities Net Index (USD Hedged); from 1 April 2015 to 30 June 2018, the FTSE Developed Core Infrastructure 50/50
100% Hedged to USD Net Tax Index; and thereafter, the MSCI World Core Infrastructure 100% Hedged to USD Index.
2. As of 30 September 2019. AUM is indicative of total assets in the Global Listed Infrastructure – CAD Hedge, Global Listed Infrastructure – GBP Hedge, Global Listed Infrastructure – USD Hedge, Global Listed Infrastructure Unhedged, Global Listed
Infrastructure – AUD Hedge, Global Listed Infrastructure – EUR Hedge and Global Listed Infrastructure – JPY Hedge
75
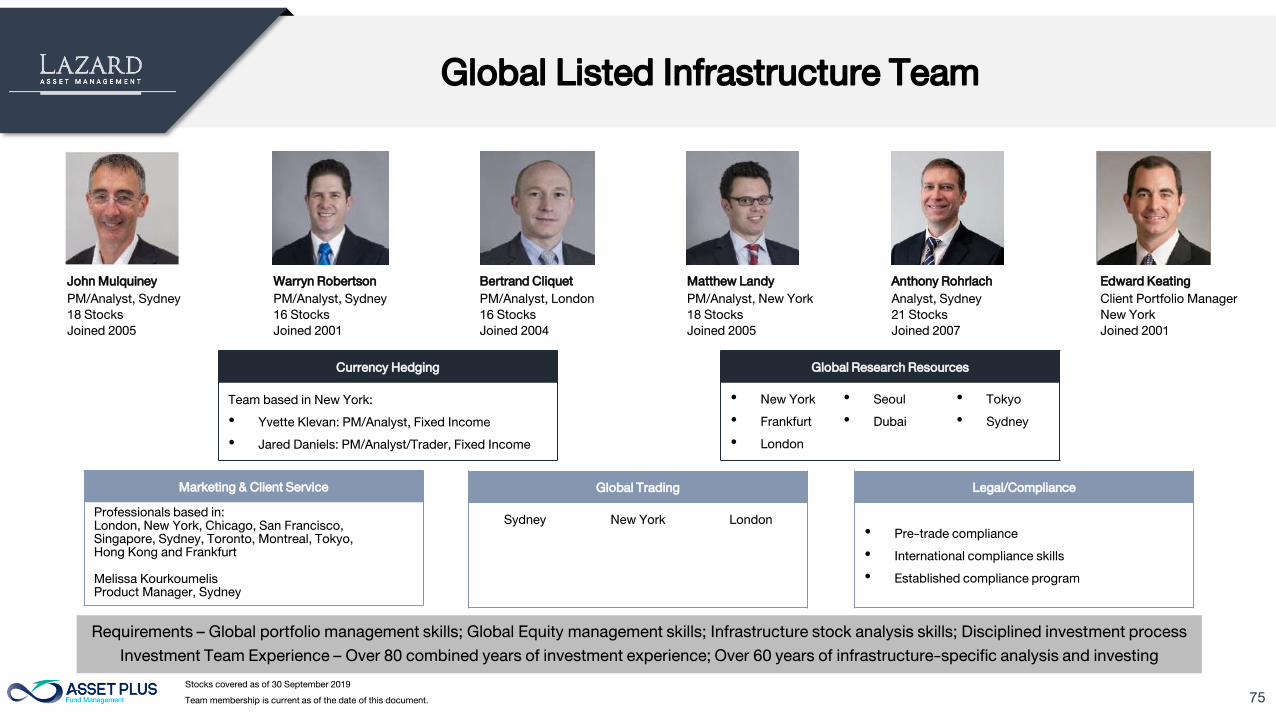
Global Listed Infrastructure Team
John Mulquiney
PM/Analyst, Sydney
18 Stocks
Joined 2005
Warryn Robertson
PM/Analyst, Sydney
16 Stocks
Joined 2001
Bertrand Cliquet
PM/Analyst, London
16 Stocks
Joined 2004
Matthew Landy
PM/Analyst, New York
18 Stocks
Joined 2005
Anthony Rohrlach
Analyst, Sydney
21 Stocks
Joined 2007
Edward Keating
Client Portfolio Manager
New York
Joined 2001
Currency Hedging
Team based in New York:
• Yvette Klevan: PM/Analyst, Fixed Income
• Jared Daniels: PM/Analyst/Trader, Fixed Income
Global Research Resources
• New York
• Frankfurt
• London
• Seoul
• Dubai
• Tokyo
• Sydney
Marketing & Client Service
Professionals based in:
London, New York, Chicago, San Francisco,
Singapore, Sydney, Toronto, Montreal, Tokyo,
Hong Kong and Frankfurt
Melissa Kourkoumelis
Product Manager, Sydney
Global Trading
Sydney New York London
Legal/Compliance
• Pre-trade compliance
• International compliance skills
• Established compliance program
Requirements – Global portfolio management skills; Global Equity management skills; Infrastructure stock analysis skills; Disciplined investment process
Investment Team Experience – Over 80 combined years of investment experience; Over 60 years of infrastructure-specific analysis and investing
Stocks covered as of 30 September 2019
Team membership is current as of the date of this document.
76
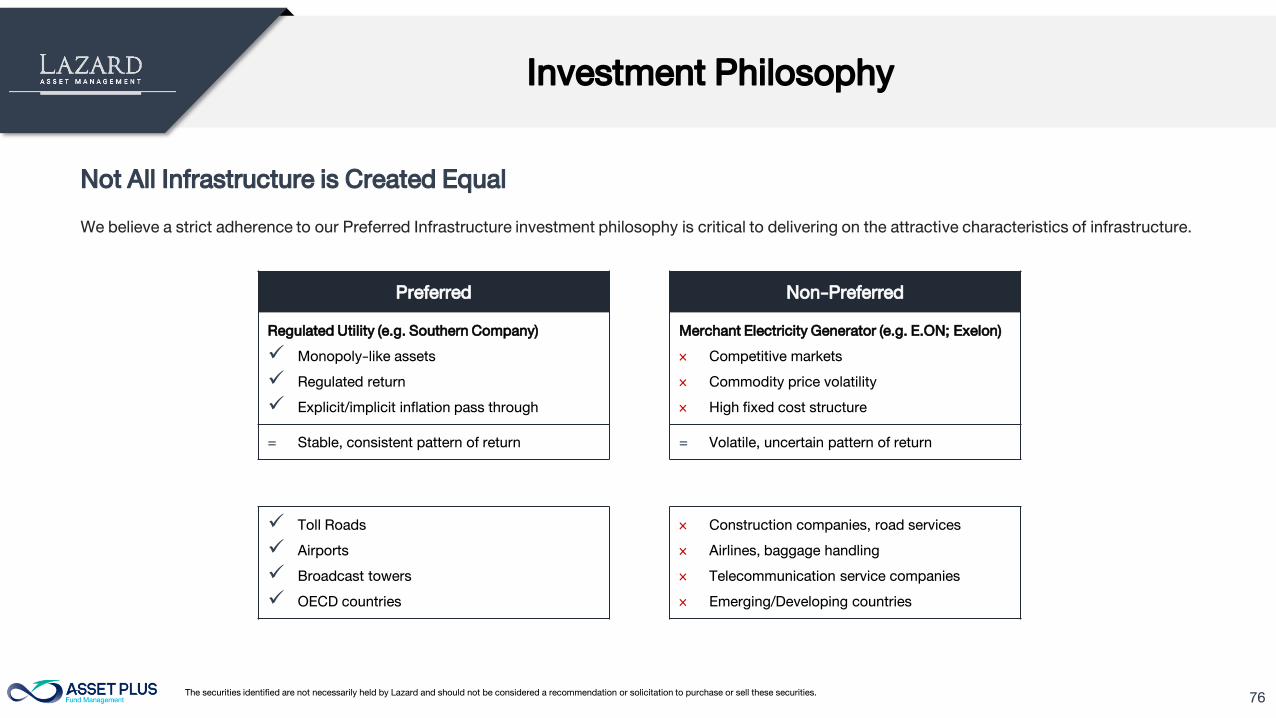
Investment Philosophy
Not All Infrastructure is Created Equal
We believe a strict adherence to our Preferred Infrastructure investment philosophy is critical to delivering on the attractive characteristics of infrastructure.
Preferred
Regulated Utility (e.g. Southern Company)
Monopoly-like assets
Regulated return
Explicit/implicit inflation pass through
= Stable, consistent pattern of return
Non-Preferred
Merchant Electricity Generator (e.g. E.ON; Exelon)
× Competitive markets
× Commodity price volatility
× High fixed cost structure
= Volatile, uncertain pattern of return
Toll Roads
Airports
Broadcast towers
OECD countries
× Construction companies, road services
× Airlines, baggage handling
× Telecommunication service companies
× Emerging/Developing countries
The securities identified are not necessarily held by Lazard and should not be considered a recommendation or solicitation to purchase or sell these securities.
77
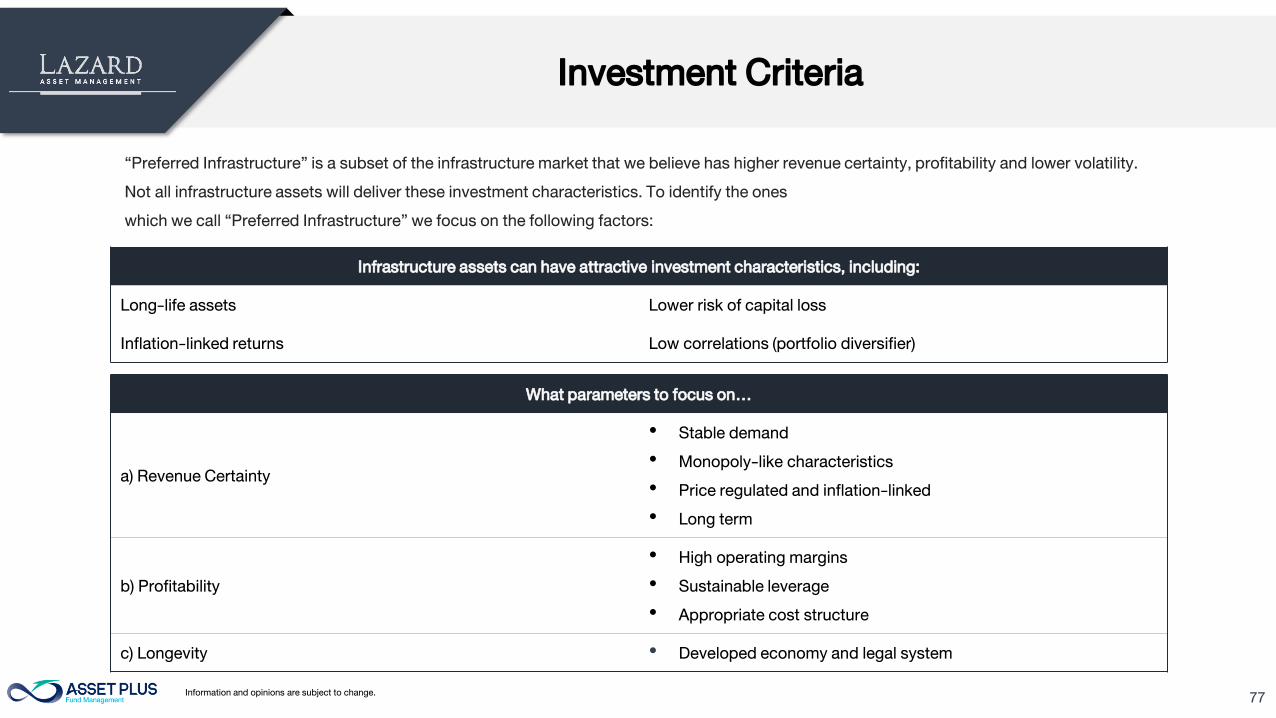
Investment Criteria
“Preferred Infrastructure” is a subset of the infrastructure market that we believe has higher revenue certainty, profitability and lower volatility.
Not all infrastructure assets will deliver these investment characteristics. To identify the ones
which we call “Preferred Infrastructure” we focus on the following factors:
Infrastructure assets can have attractive investment characteristics, including:
Long-life assets Lower risk of capital loss
Inflation-linked returns Low correlations (portfolio diversifier)
What parameters to focus on…
a) Revenue Certainty
• Stable demand
• Monopoly-like characteristics
• Price regulated and inflation-linked
• Long term
b) Profitability
• High operating margins
• Sustainable leverage
• Appropriate cost structure
c) Longevity • Developed economy and legal system
Information and opinions are subject to change.
78
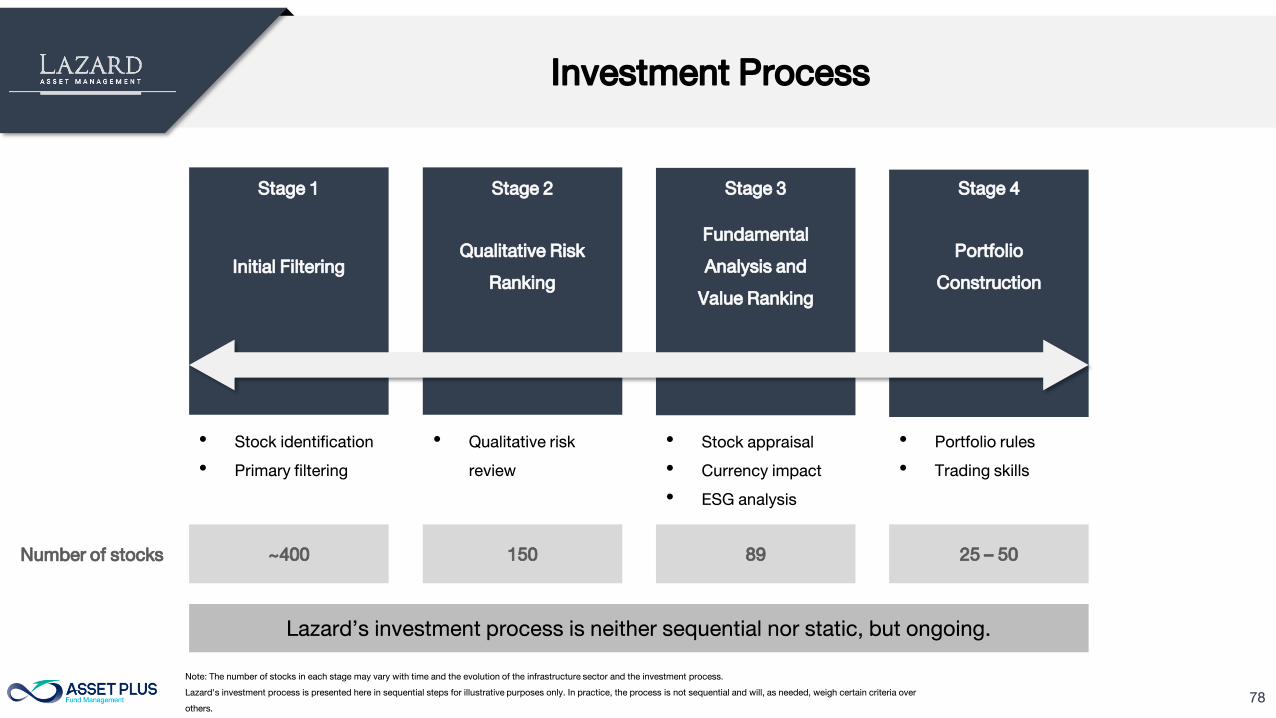
Investment Process
Stage 1 Stage 2 Stage 3 Stage 4
Initial Filtering
Qualitative Risk
Ranking
Fundamental
Analysis and
Value Ranking
Portfolio
Construction
• Stock identification
• Primary filtering
• Qualitative risk
review
• Stock appraisal
• Currency impact
• ESG analysis
• Portfolio rules
• Trading skills
~400 150 89 25 – 50Number of stocks
Lazard’s investment process is neither sequential nor static, but ongoing.
Note: The number of stocks in each stage may vary with time and the evolution of the infrastructure sector and the investment process.
Lazard's investment process is presented here in sequential steps for illustrative purposes only. In practice, the process is not sequential and will, as needed, weigh certain criteria over
others.
79
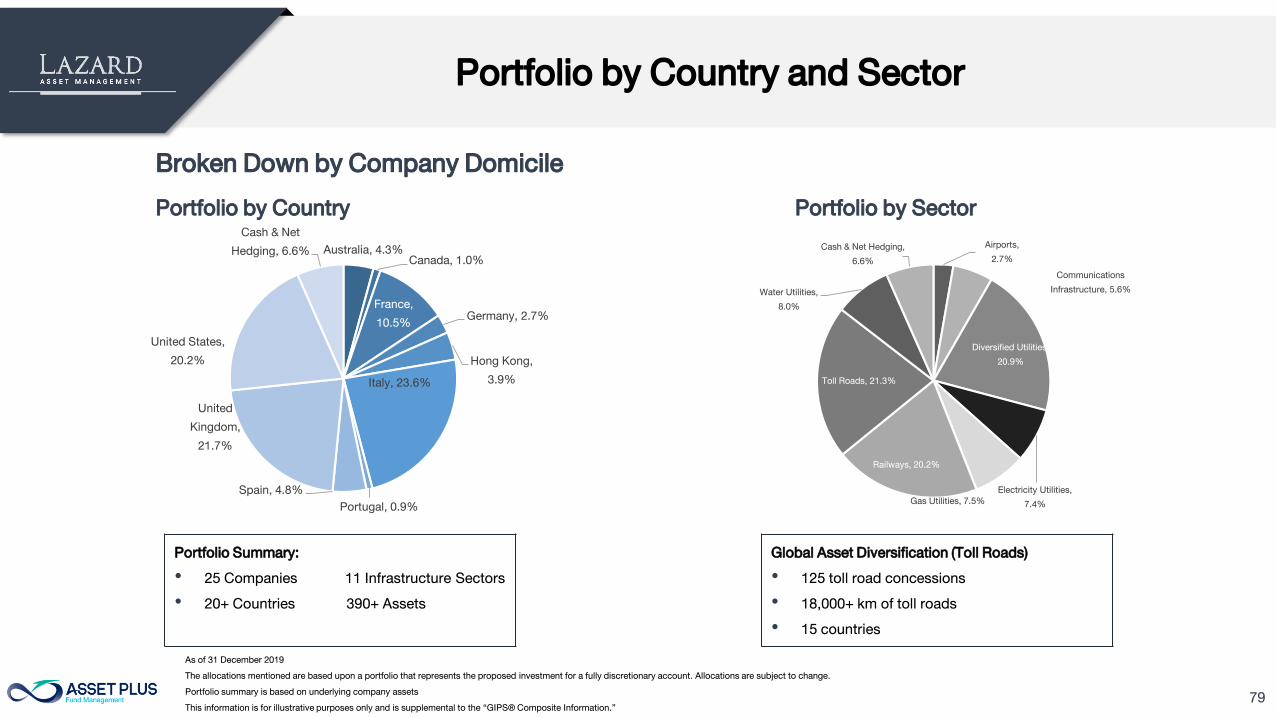
Portfolio by Country and Sector
Broken Down by Company Domicile
Portfolio by Country Portfolio by Sector
Portfolio Summary:
• 25 Companies 11 Infrastructure Sectors
• 20+ Countries 390+ Assets
Global Asset Diversification (Toll Roads)
• 125 toll road concessions
• 18,000+ km of toll roads
• 15 countries
As of 31 December 2019
The allocations mentioned are based upon a portfolio that represents the proposed investment for a fully discretionary account. Allocations are subject to change.
Portfolio summary is based on underlying company assets
This information is for illustrative purposes only and is supplemental to the “GIPS® Composite Information.”
Australia, 4.3%
Canada, 1.0%
France,
10.5%
Germany, 2.7%
Hong Kong,
3.9%Italy, 23.6%
Portugal, 0.9%
Spain, 4.8%
United
Kingdom,
21.7%
United States,
20.2%
Cash & Net
Hedging, 6.6%
Airports,
2.7%
Communications
Infrastructure, 5.6%
Diversified Utilities,
20.9%
Electricity Utilities,
7.4%Gas Utilities, 7.5%
Railways, 20.2%
Toll Roads, 21.3%
Water Utilities,
8.0%
Cash & Net Hedging,
6.6%
80
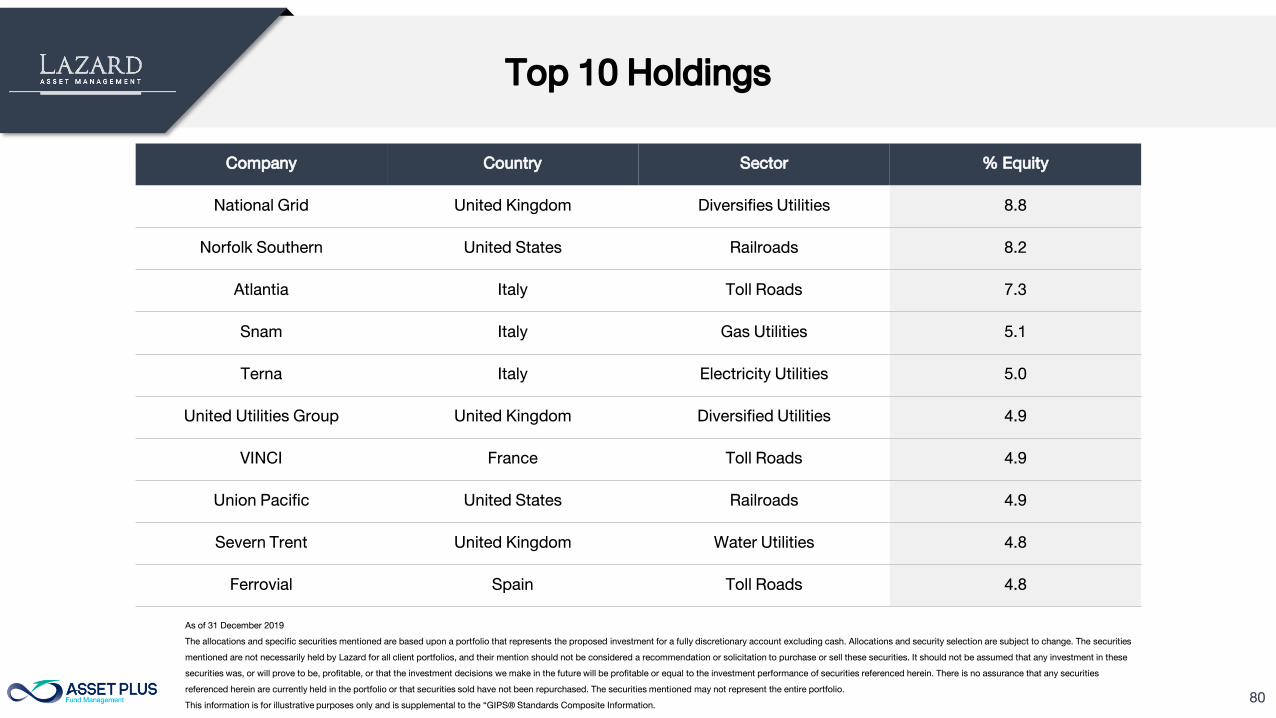
Top 10 Holdings
As of 31 December 2019
The allocations and specific securities mentioned are based upon a portfolio that represents the proposed investment for a fully discretionary account excluding cash. Allocations and security selection are subject to change. The securities
mentioned are not necessarily held by Lazard for all client portfolios, and their mention should not be considered a recommendation or solicitation to purchase or sell these securities. It should not be assumed that any investment in these
securities was, or will prove to be, profitable, or that the investment decisions we make in the future will be profitable or equal to the investment performance of securities referenced herein. There is no assurance that any securities
referenced herein are currently held in the portfolio or that securities sold have not been repurchased. The securities mentioned may not represent the entire portfolio.
This information is for illustrative purposes only and is supplemental to the “GIPS® Standards Composite Information.
Company Country Sector % Equity
National Grid United Kingdom Diversifies Utilities 8.8
Norfolk Southern United States Railroads 8.2
Atlantia Italy Toll Roads 7.3
Snam Italy Gas Utilities 5.1
Terna Italy Electricity Utilities 5.0
United Utilities Group United Kingdom Diversified Utilities 4.9
VINCI France Toll Roads 4.9
Union Pacific United States Railroads 4.9
Severn Trent United Kingdom Water Utilities 4.8
Ferrovial Spain Toll Roads 4.8
81
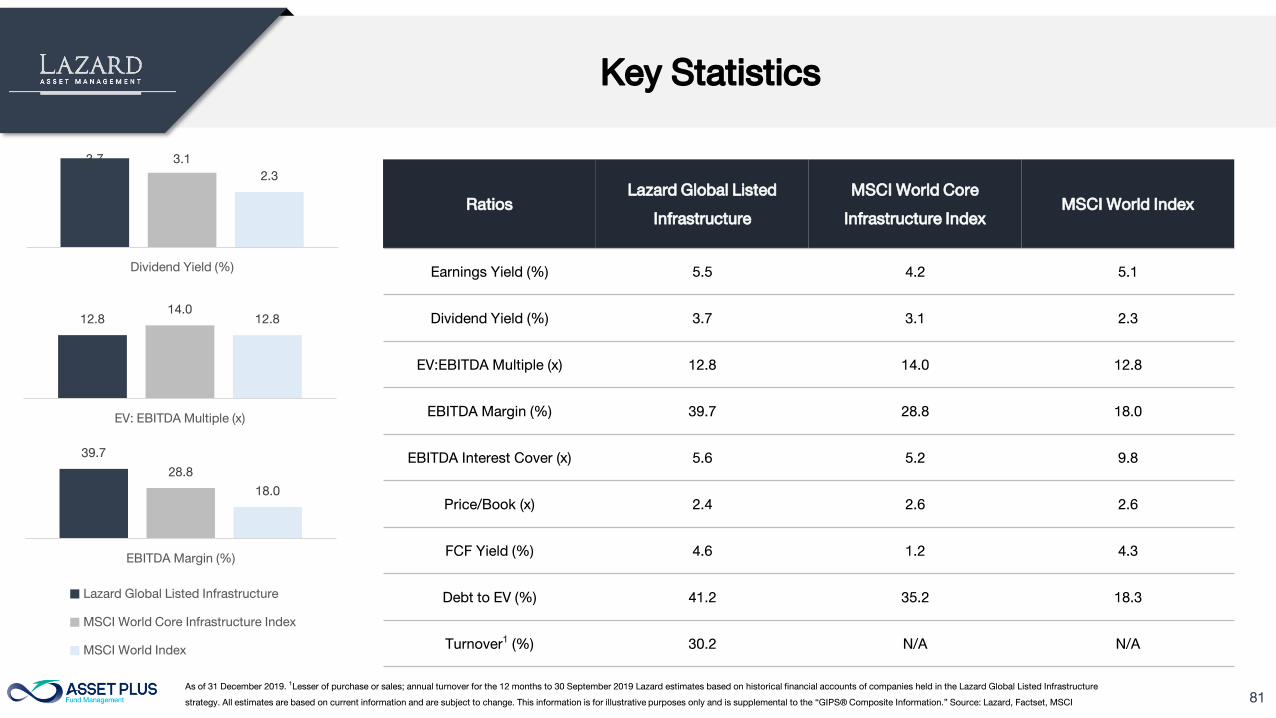
Key Statistics
Ratios
Lazard Global Listed
Infrastructure
MSCI World Core
Infrastructure Index
MSCI World Index
Earnings Yield (%) 5.5 4.2 5.1
Dividend Yield (%) 3.7 3.1 2.3
EV:EBITDA Multiple (x) 12.8 14.0 12.8
EBITDA Margin (%) 39.7 28.8 18.0
EBITDA Interest Cover (x) 5.6 5.2 9.8
Price/Book (x) 2.4 2.6 2.6
FCF Yield (%) 4.6 1.2 4.3
Debt to EV (%) 41.2 35.2 18.3
Turnover1
(%) 30.2 N/A N/A
As of 31 December 2019. 1
Lesser of purchase or sales; annual turnover for the 12 months to 30 September 2019 Lazard estimates based on historical financial accounts of companies held in the Lazard Global Listed Infrastructure
strategy. All estimates are based on current information and are subject to change. This information is for illustrative purposes only and is supplemental to the “GIPS® Composite Information.” Source: Lazard, Factset, MSCI
39.7
28.8
18.0
EBITDA Margin (%)
Lazard Global Listed Infrastructure
MSCI World Core Infrastructure Index
MSCI World Index
3.7 3.1
2.3
Dividend Yield (%)
12.8
14.0
12.8
EV: EBITDA Multiple (x)
82
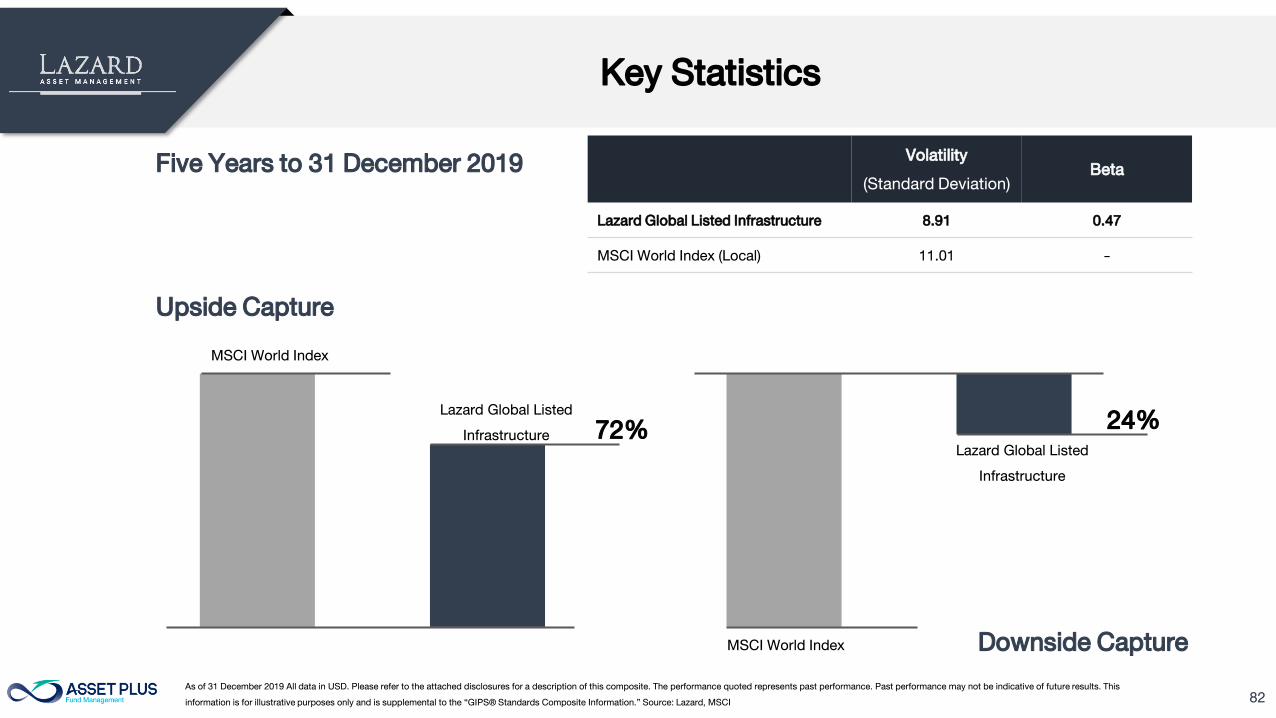
Key Statistics
Five Years to 31 December 2019Volatility
(Standard Deviation)
Beta
Lazard Global Listed Infrastructure 8.91 0.47
MSCI World Index (Local) 11.01 -
Upside Capture
MSCI World Index
Lazard Global Listed
Infrastructure
MSCI World Index
Lazard Global Listed
Infrastructure
Downside Capture
As of 31 December 2019 All data in USD. Please refer to the attached disclosures for a description of this composite. The performance quoted represents past performance. Past performance may not be indicative of future results. This
information is for illustrative purposes only and is supplemental to the “GIPS® Standards Composite Information.” Source: Lazard, MSCI
72%24%
83
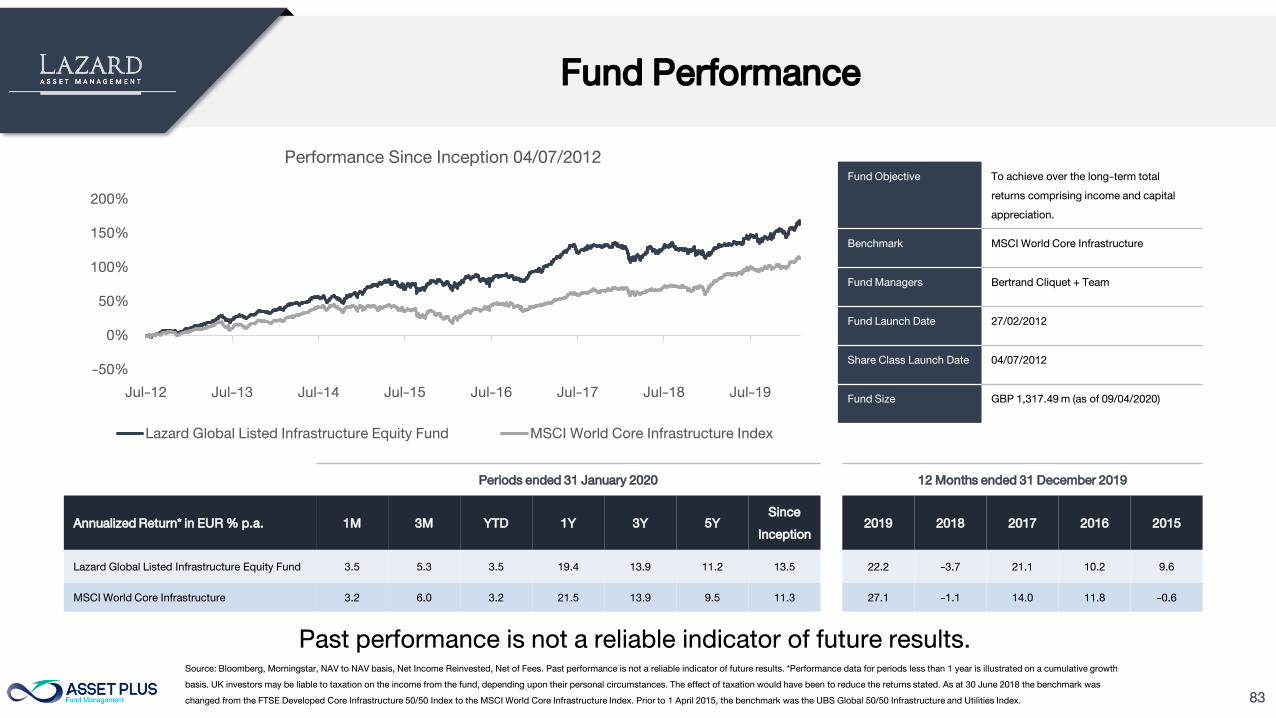
Fund Performance
Periods ended 31 January 2020 12 Months ended 31 December 2019
Annualized Return* in EUR % p.a. 1M 3M YTD 1Y 3Y 5Y
Since
Inception
2019 2018 2017 2016 2015
Lazard Global Listed Infrastructure Equity Fund 3.5 5.3 3.5 19.4 13.9 11.2 13.5 22.2 -3.7 21.1 10.2 9.6
MSCI World Core Infrastructure 3.2 6.0 3.2 21.5 13.9 9.5 11.3 27.1 -1.1 14.0 11.8 -0.6
Source: Bloomberg, Morningstar, NAV to NAV basis, Net Income Reinvested, Net of Fees. Past performance is not a reliable indicator of future results. *Performance data for periods less than 1 year is illustrated on a cumulative growth
basis. UK investors may be liable to taxation on the income from the fund, depending upon their personal circumstances. The effect of taxation would have been to reduce the returns stated. As at 30 June 2018 the benchmark was
changed from the FTSE Developed Core Infrastructure 50/50 Index to the MSCI World Core Infrastructure Index. Prior to 1 April 2015, the benchmark was the UBS Global 50/50 Infrastructure and Utilities Index.
Fund Objective To achieve over the long-term total
returns comprising income and capital
appreciation.
Benchmark MSCI World Core Infrastructure
Fund Managers Bertrand Cliquet + Team
Fund Launch Date 27/02/2012
Share Class Launch Date 04/07/2012
Fund Size GBP 1,317.49 m (as of 09/04/2020)
Past performance is not a reliable indicator of future results.
-50%
0%
50%
100%
150%
200%
Jul-12 Jul-13 Jul-14 Jul-15 Jul-16 Jul-17 Jul-18 Jul-19
Performance Since Inception 04/07/2012
Lazard Global Listed Infrastructure Equity Fund MSCI World Core Infrastructure Index
84
ASP-PROPIN Past Performance
85
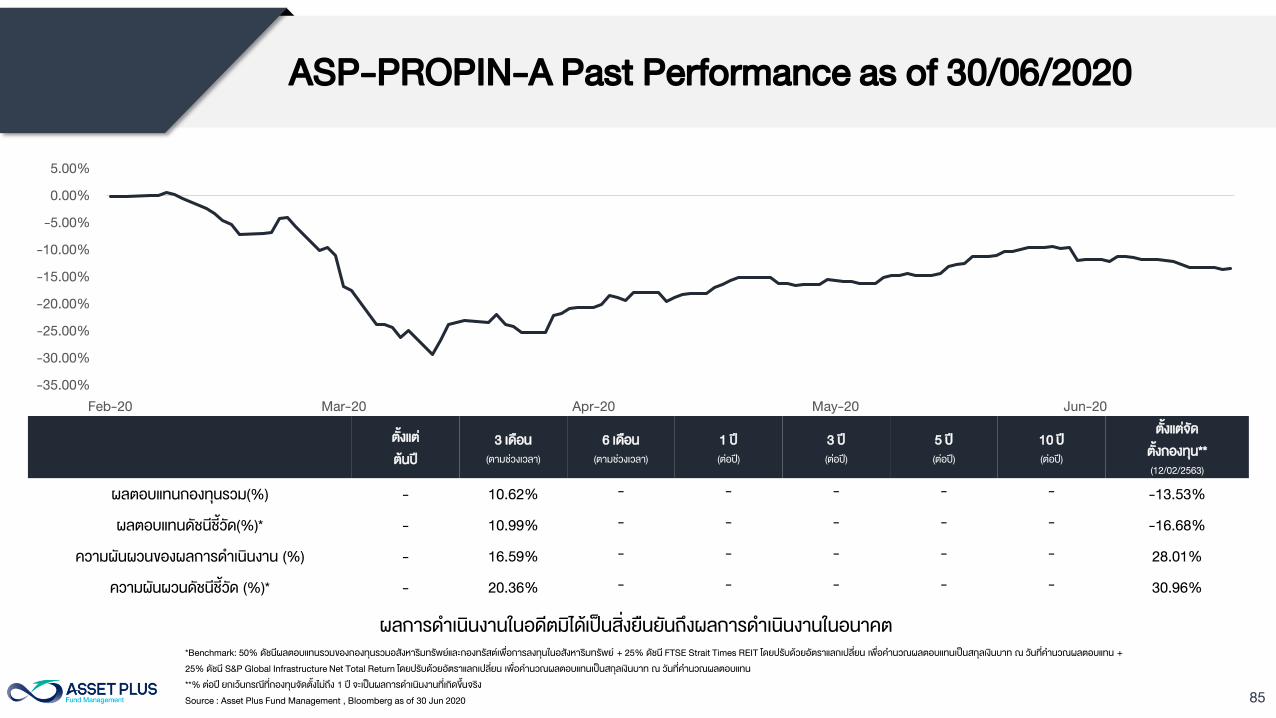
ASP-PROPIN-A Past Performance as of 30/06/2020
ผลการด าเนนงานในอดตมไดเปนสงยนยนถงผลการด าเนนงานในอนาคต
ตงแต
ตนป
3 เดอน
(ตามชวงเวลา)
6 เดอน
(ตามชวงเวลา)
1 ป
(ตอป)
3 ป
(ตอป)
5 ป
(ตอป)
10 ป
(ตอป)
ตงแตจด
ตงกองทน**
(12/02/2563)
ผลตอบแทนกองทนรวม(%) - 10.62%- - - - -
-13.53%
ผลตอบแทนดชนชวด(%)* - 10.99%- - - - -
-16.68%
ความผนผวนของผลการด าเนนงาน (%) - 16.59%- - - - -
28.01%
ความผนผวนดชนชวด (%)* - 20.36%- - - - -
30.96%
-35.00%
-30.00%
-25.00%
-20.00%
-15.00%
-10.00%
-5.00%
0.00%
5.00%
Feb-20 Mar-20 Apr-20 May-20 Jun-20
*Benchmark: 50% ดชนผลตอบแทนรวมของกองทนรวมอสงหารมทรพยและกองทรสตเพอการลงทนในอสงหารมทรพย + 25% ดชน FTSE Strait Times REIT โดยปรบดวยอตราแลกเปลยน เพอค านวณผลตอบแทนเปนสกลเงนบาท ณ วนทค านวณผลตอบแทน +
25% ดชน S&P Global Infrastructure Net Total Return โดยปรบดวยอตราแลกเปลยน เพอค านวณผลตอบแทนเปนสกลเงนบาท ณ วนทค านวณผลตอบแทน
**% ตอป ยกเวนกรณทกองทนจดตงไมถง 1 ป จะเปนผลการด าเนนงานทเกดขนจรง
Source : Asset Plus Fund Management , Bloomberg as of 30 Jun 2020
86
รายละเอยดขอมลกองทน
ASP-PROPIN
87
รายละเอยดกองทน ASP-PROPIN
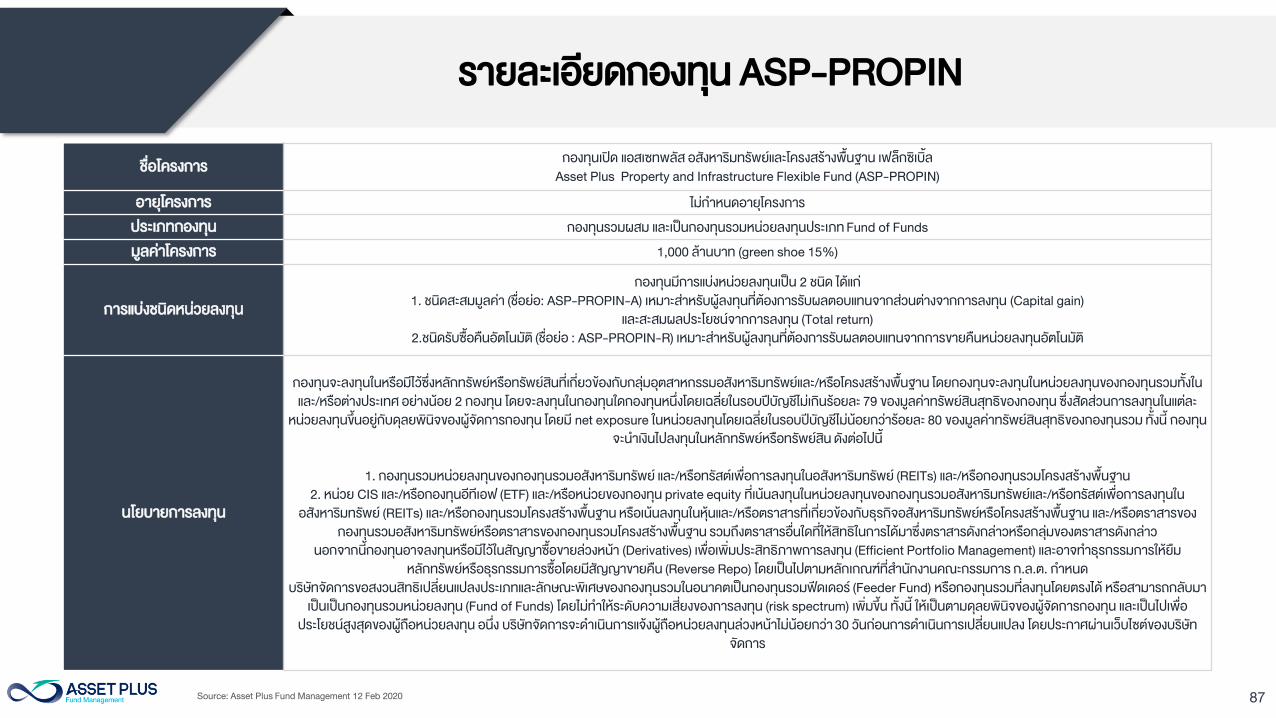
ชอโครงการ
กองทนเปด แอสเซทพลส อสงหารมทรพยและโครงสรางพนฐาน เฟลกซเบล
Asset Plus Property and Infrastructure Flexible Fund (ASP-PROPIN)
อายโครงการ ไมก าหนดอายโครงการ
ประเภทกองทน กองทนรวมผสม และเปนกองทนรวมหนวยลงทนประเภท Fund of Funds
มลคาโครงการ 1,000 ลานบาท (green shoe 15%)
การแบงชนดหนวยลงทน
กองทนมการแบงหนวยลงทนเปน 2 ชนด ไดแก
1. ชนดสะสมมลคา (ชอยอ: ASP-PROPIN-A) เหมาะสาหรบผลงทนทตองการรบผลตอบแทนจากสวนตางจากการลงทน (Capital gain)
และสะสมผลประโยชนจากการลงทน (Total return)
2.ชนดรบซอคนอตโนมต (ชอยอ : ASP-PROPIN-R) เหมาะสาหรบผลงทนทตองการรบผลตอบแทนจากการขายคนหนวยลงทนอตโนมต
นโยบายการลงทน
กองทนจะลงทนในหรอมไวซงหลกทรพยหรอทรพยสนทเกยวของกบกลมอตสาหกรรมอสงหารมทรพยและ/หรอโครงสรางพนฐาน โดยกองทนจะลงทนในหนวยลงทนของกองทนรวมทงใน
และ/หรอตางประเทศ อยางนอย 2 กองทน โดยจะลงทนในกองทนใดกองทนหนงโดยเฉลยในรอบปบญชไมเกนรอยละ 79 ของมลคาทรพยสนสทธของกองทน ซงสดสวนการลงทนในแตละ
หนวยลงทนขนอยกบดลยพนจของผจดการกองทน โดยม net exposure ในหนวยลงทนโดยเฉลยในรอบปบญชไมนอยกวารอยละ 80 ของมลคาทรพยสนสทธของกองทนรวม ทงน กองทน
จะน าเงนไปลงทนในหลกทรพยหรอทรพยสน ดงตอไปน
1. กองทนรวมหนวยลงทนของกองทนรวมอสงหารมทรพย และ/หรอทรสตเพอการลงทนในอสงหารมทรพย (REITs) และ/หรอกองทนรวมโครงสรางพนฐาน
2. หนวย CIS และ/หรอกองทนอทเอฟ (ETF) และ/หรอหนวยของกองทน private equity ทเนนลงทนในหนวยลงทนของกองทนรวมอสงหารมทรพยและ/หรอทรสตเพอการลงทนใน
อสงหารมทรพย (REITs) และ/หรอกองทนรวมโครงสรางพนฐาน หรอเนนลงทนในหนและ/หรอตราสารทเกยวของกบธรกจอสงหารมทรพยหรอโครงสรางพนฐาน และ/หรอตราสารของ
กองทนรวมอสงหารมทรพยหรอตราสารของกองทนรวมโครงสรางพนฐาน รวมถงตราสารอนใดทใหสทธในการไดมาซงตราสารดงกลาวหรอกลมของตราสารดงกลาว
นอกจากนกองทนอาจลงทนหรอมไวในสญญาซอขายลวงหนา (Derivatives) เพอเพมประสทธภาพการลงทน (Efficient Portfolio Management) และอาจท าธรกรรมการใหยม
หลกทรพยหรอธรกรรมการซอโดยมสญญาขายคน (Reverse Repo) โดยเปนไปตามหลกเกณฑทส านกงานคณะกรรมการ ก.ล.ต. ก าหนด
บรษทจดการขอสงวนสทธเปลยนแปลงประเภทและลกษณะพเศษของกองทนรวมในอนาคตเปนกองทนรวมฟดเดอร (Feeder Fund) หรอกองทนรวมทลงทนโดยตรงได หรอสามารถกลบมา
เปนเปนกองทนรวมหนวยลงทน (Fund of Funds) โดยไมท าใหระดบความเสยงของการลงทน (risk spectrum) เพมขน ทงน ใหเปนตามดลยพนจของผจดการกองทน และเปนไปเพอ
ประโยชนสงสดของผถอหนวยลงทน อนง บรษทจดการจะด าเนนการแจงผถอหนวยลงทนลวงหนาไมนอยกวา 30 วนกอนการด าเนนการเปลยนแปลง โดยประกาศผานเวบไซตของบรษท
จดการ
Source: Asset Plus Fund Management 12 Feb 2020
88
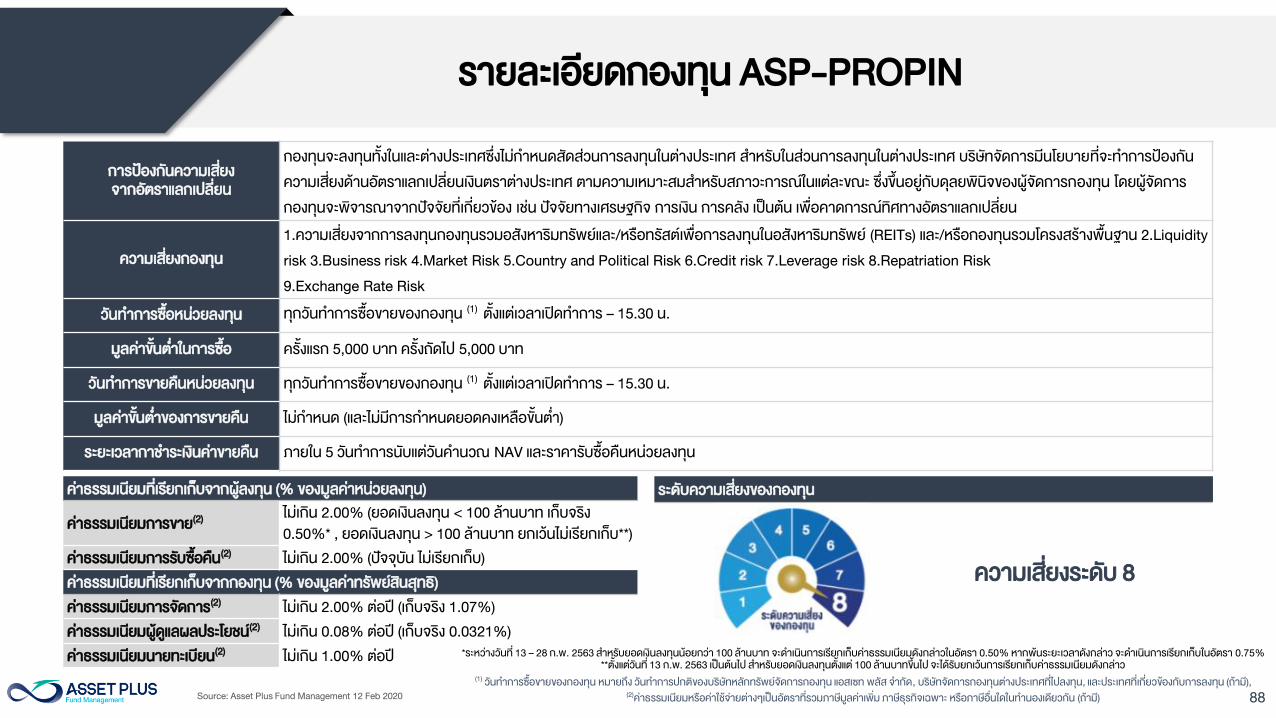
การปองกนความเสยง
จากอตราแลกเปลยน
กองทนจะลงทนทงในและตางประเทศซงไมก าหนดสดสวนการลงทนในตางประเทศ ส าหรบในสวนการลงทนในตางประเทศ บรษทจดการมนโยบายทจะท าการปองกน
ความเสยงดานอตราแลกเปลยนเงนตราตางประเทศ ตามความเหมาะสมส าหรบสภาวะการณในแตละขณะ ซงขนอยกบดลยพนจของผจดการกองทน โดยผจดการ
กองทนจะพจารณาจากปจจยทเกยวของ เชน ปจจยทางเศรษฐกจ การเงน การคลง เปนตน เพอคาดการณทศทางอตราแลกเปลยน
ความเสยงกองทน
1.ความเสยงจากการลงทนกองทนรวมอสงหารมทรพยและ/หรอทรสตเพอการลงทนในอสงหารมทรพย (REITs) และ/หรอกองทนรวมโครงสรางพนฐาน 2.Liquidity
risk 3.Business risk 4.Market Risk 5.Country and Political Risk 6.Credit risk 7.Leverage risk 8.Repatriation Risk
9.Exchange Rate Risk
วนท าการซอหนวยลงทน ทกวนท าการซอขายของกองทน (1)
ตงแตเวลาเปดท าการ – 15.30 น.
มลคาขนต าในการซอ ครงแรก 5,000 บาท ครงถดไป 5,000 บาท
วนท าการขายคนหนวยลงทน ทกวนท าการซอขายของกองทน (1)
ตงแตเวลาเปดท าการ – 15.30 น.
มลคาขนต าของการขายคน ไมก าหนด (และไมมการก าหนดยอดคงเหลอขนต า)
ระยะเวลากาช าระเงนคาขายคน ภายใน 5 วนท าการนบแตวนค านวณ NAV และราคารบซอคนหนวยลงทน
คาธรรมเนยมทเรยกเกบจากผลงทน (% ของมลคาหนวยลงทน)
คาธรรมเนยมการขาย(2)
ไมเกน 2.00% (ยอดเงนลงทน < 100 ลานบาท เกบจรง
0.50%* , ยอดเงนลงทน > 100 ลานบาท ยกเวนไมเรยกเกบ**)
คาธรรมเนยมการรบซอคน(2)
ไมเกน 2.00% (ปจจบน ไมเรยกเกบ)
คาธรรมเนยมทเรยกเกบจากกองทน (% ของมลคาทรพยสนสทธ)
คาธรรมเนยมการจดการ(2)
ไมเกน 2.00% ตอป (เกบจรง 1.07%)
คาธรรมเนยมผดแลผลประโยชน(2)
ไมเกน 0.08% ตอป (เกบจรง 0.0321%)
คาธรรมเนยมนายทะเบยน(2)
ไมเกน 1.00% ตอป
ระดบความเสยงของกองทน
ความเสยงระดบ 8
(1)
วนท าการซอขายของกองทน หมายถง วนท าการปกตของบรษทหลกทรพยจดการกองทน แอสเซท พลส จ ากด, บรษทจดการกองทนตางประเทศทไปลงทน, และประเทศทเกยวของกบการลงทน (ถาม),
(2)
คาธรรมเนยมหรอคาใชจายตางๆเปนอตราทรวมภาษมลคาเพม ภาษธรกจเฉพาะ หรอภาษอนใดในท านองเดยวกน (ถาม)
รายละเอยดกองทน ASP-PROPIN
Source: Asset Plus Fund Management 12 Feb 2020
*ระหวางวนท 13 – 28 ก.พ. 2563 ส าหรบยอดเงนลงทนนอยกวา 100 ลานบาท จะด าเนนการเรยกเกบคาธรรมเนยมดงกลาวในอตรา 0.50% หากพนระยะเวลาดงกลาว จะด าเนนการเรยกเกบในอตรา 0.75%
**ตงแตวนท 13 ก.พ. 2563 เปนตนไป ส าหรบยอดเงนลงทนตงแต 100 ลานบาทขนไป จะไดรบยกเวนการเรยกเกบคาธรรมเนยมดงกลาว

89
Appendix 1: Lazard Team Biographies
90
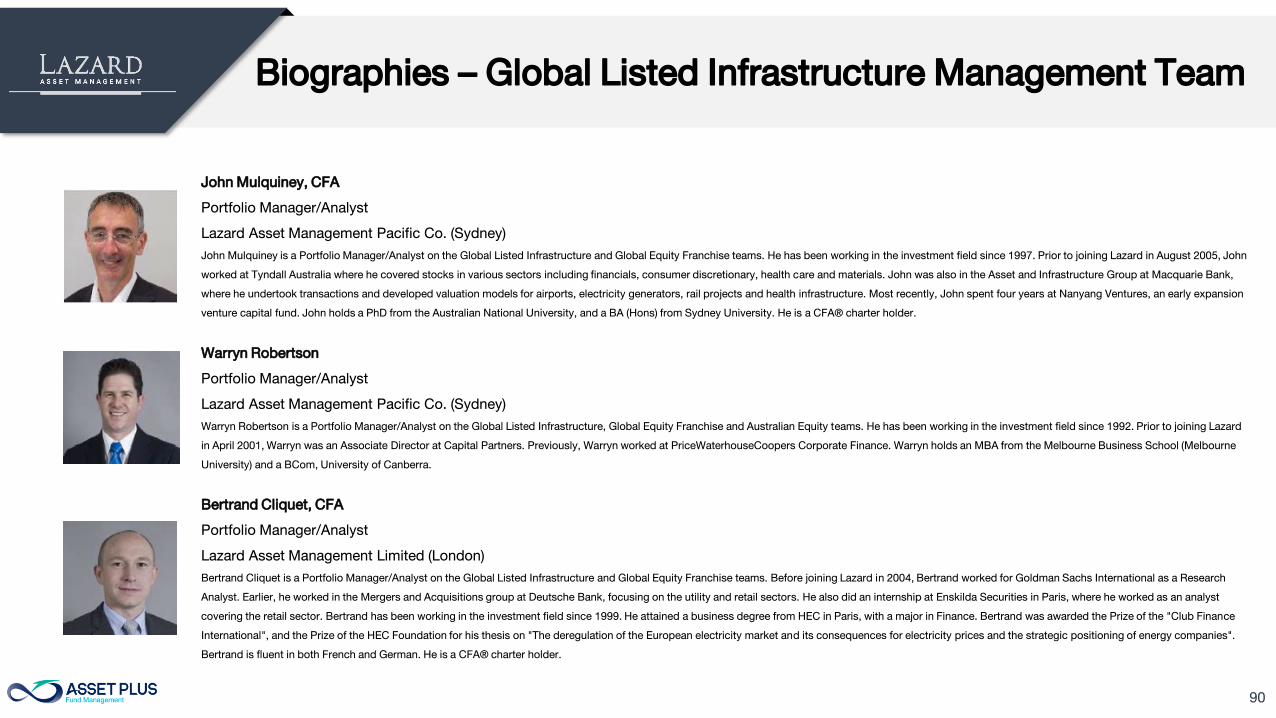
Biographies – Global Listed Infrastructure Management Team
John Mulquiney, CFA
Portfolio Manager/Analyst
Lazard Asset Management Pacific Co. (Sydney)
John Mulquiney is a Portfolio Manager/Analyst on the Global Listed Infrastructure and Global Equity Franchise teams. He has been working in the investment field since 1997. Prior to joining Lazard in August 2005, John
worked at Tyndall Australia where he covered stocks in various sectors including financials, consumer discretionary, health care and materials. John was also in the Asset and Infrastructure Group at Macquarie Bank,
where he undertook transactions and developed valuation models for airports, electricity generators, rail projects and health infrastructure. Most recently, John spent four years at Nanyang Ventures, an early expansion
venture capital fund. John holds a PhD from the Australian National University, and a BA (Hons) from Sydney University. He is a CFA® charter holder.
Warryn Robertson
Portfolio Manager/Analyst
Lazard Asset Management Pacific Co. (Sydney)
Warryn Robertson is a Portfolio Manager/Analyst on the Global Listed Infrastructure, Global Equity Franchise and Australian Equity teams. He has been working in the investment field since 1992. Prior to joining Lazard
in April 2001, Warryn was an Associate Director at Capital Partners. Previously, Warryn worked at PriceWaterhouseCoopers Corporate Finance. Warryn holds an MBA from the Melbourne Business School (Melbourne
University) and a BCom, University of Canberra.
Bertrand Cliquet, CFA
Portfolio Manager/Analyst
Lazard Asset Management Limited (London)
Bertrand Cliquet is a Portfolio Manager/Analyst on the Global Listed Infrastructure and Global Equity Franchise teams. Before joining Lazard in 2004, Bertrand worked for Goldman Sachs International as a Research
Analyst. Earlier, he worked in the Mergers and Acquisitions group at Deutsche Bank, focusing on the utility and retail sectors. He also did an internship at Enskilda Securities in Paris, where he worked as an analyst
covering the retail sector. Bertrand has been working in the investment field since 1999. He attained a business degree from HEC in Paris, with a major in Finance. Bertrand was awarded the Prize of the "Club Finance
International", and the Prize of the HEC Foundation for his thesis on "The deregulation of the European electricity market and its consequences for electricity prices and the strategic positioning of energy companies".
Bertrand is fluent in both French and German. He is a CFA® charter holder.
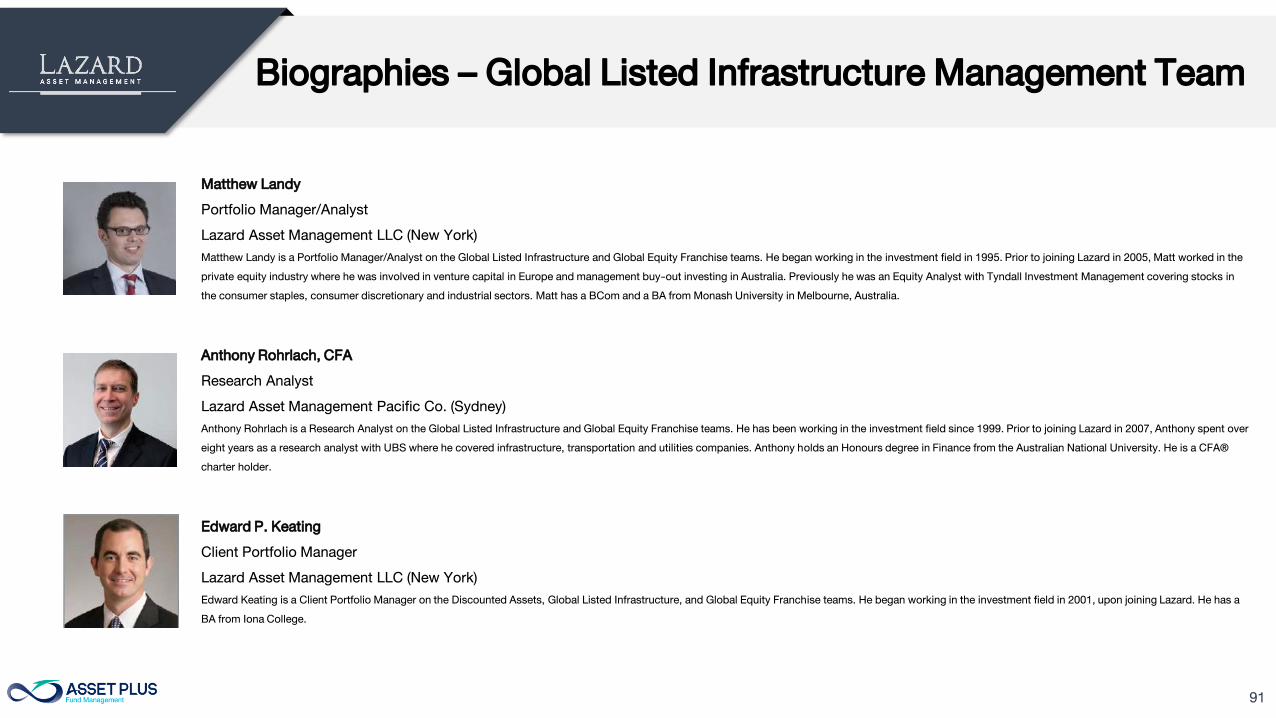
91
Biographies – Global Listed Infrastructure Management Team
Matthew Landy
Portfolio Manager/Analyst
Lazard Asset Management LLC (New York)
Matthew Landy is a Portfolio Manager/Analyst on the Global Listed Infrastructure and Global Equity Franchise teams. He began working in the investment field in 1995. Prior to joining Lazard in 2005, Matt worked in the
private equity industry where he was involved in venture capital in Europe and management buy-out investing in Australia. Previously he was an Equity Analyst with Tyndall Investment Management covering stocks in
the consumer staples, consumer discretionary and industrial sectors. Matt has a BCom and a BA from Monash University in Melbourne, Australia.
Anthony Rohrlach, CFA
Research Analyst
Lazard Asset Management Pacific Co. (Sydney)
Anthony Rohrlach is a Research Analyst on the Global Listed Infrastructure and Global Equity Franchise teams. He has been working in the investment field since 1999. Prior to joining Lazard in 2007, Anthony spent over
eight years as a research analyst with UBS where he covered infrastructure, transportation and utilities companies. Anthony holds an Honours degree in Finance from the Australian National University. He is a CFA®
charter holder.
Edward P. Keating
Client Portfolio Manager
Lazard Asset Management LLC (New York)
Edward Keating is a Client Portfolio Manager on the Discounted Assets, Global Listed Infrastructure, and Global Equity Franchise teams. He began working in the investment field in 2001, upon joining Lazard. He has a
BA from Iona College.
92
Appendix 2: Lazard Investment Process
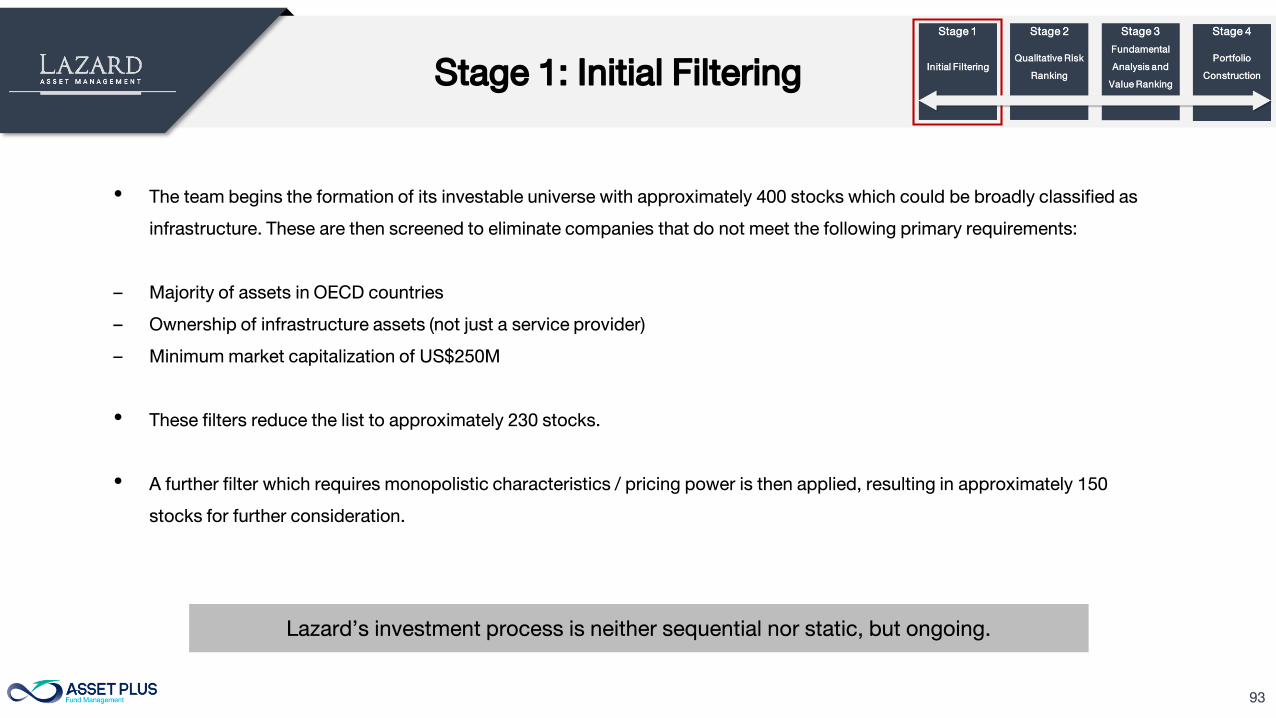
93
Stage 1: Initial Filtering
• The team begins the formation of its investable universe with approximately 400 stocks which could be broadly classified as
infrastructure. These are then screened to eliminate companies that do not meet the following primary requirements:
– Majority of assets in OECD countries
– Ownership of infrastructure assets (not just a service provider)
– Minimum market capitalization of US$250M
• These filters reduce the list to approximately 230 stocks.
• A further filter which requires monopolistic characteristics / pricing power is then applied, resulting in approximately 150
stocks for further consideration.
Lazard’s investment process is neither sequential nor static, but ongoing.
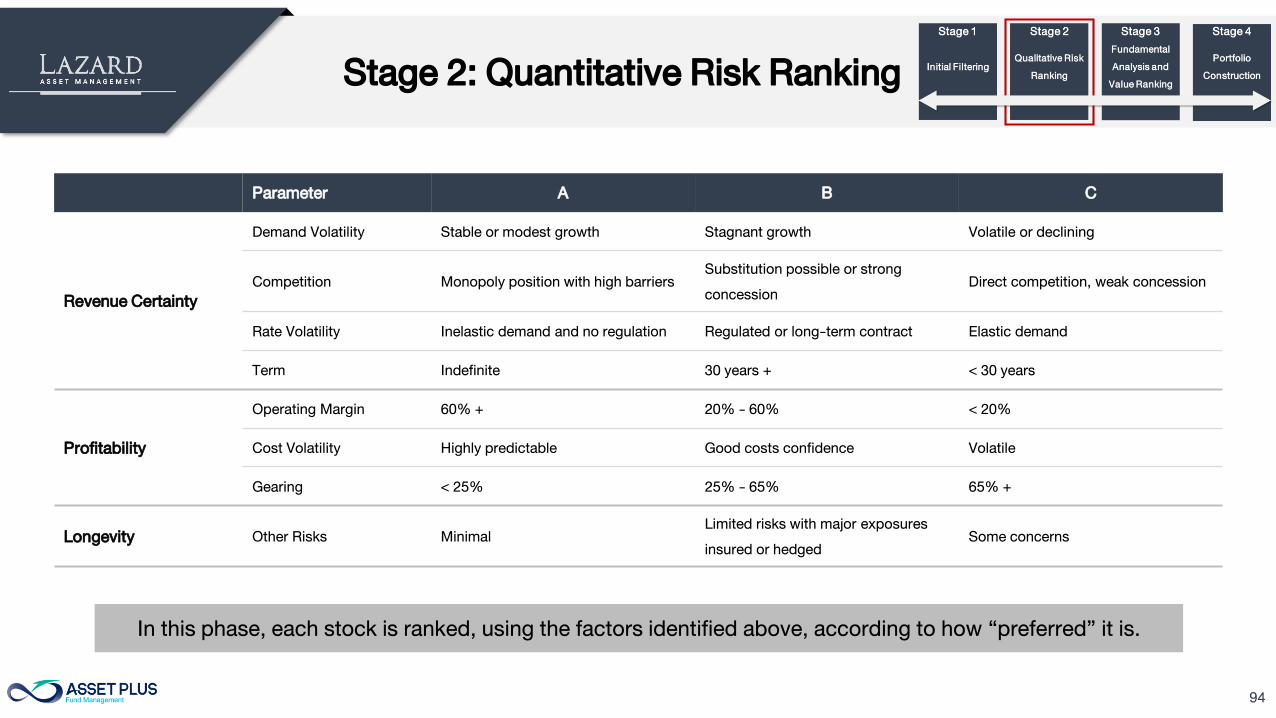
94
Stage 2: Quantitative Risk Ranking
Parameter A B C
Revenue Certainty
Demand Volatility Stable or modest growth Stagnant growth Volatile or declining
Competition Monopoly position with high barriers
Substitution possible or strong
concession
Direct competition, weak concession
Rate Volatility Inelastic demand and no regulation Regulated or long-term contract Elastic demand
Term Indefinite 30 years + < 30 years
Profitability
Operating Margin 60% + 20% - 60% < 20%
Cost Volatility Highly predictable Good costs confidence Volatile
Gearing < 25% 25% - 65% 65% +
Longevity Other Risks Minimal
Limited risks with major exposures
insured or hedged
Some concerns
In this phase, each stock is ranked, using the factors identified above, according to how “preferred” it is.
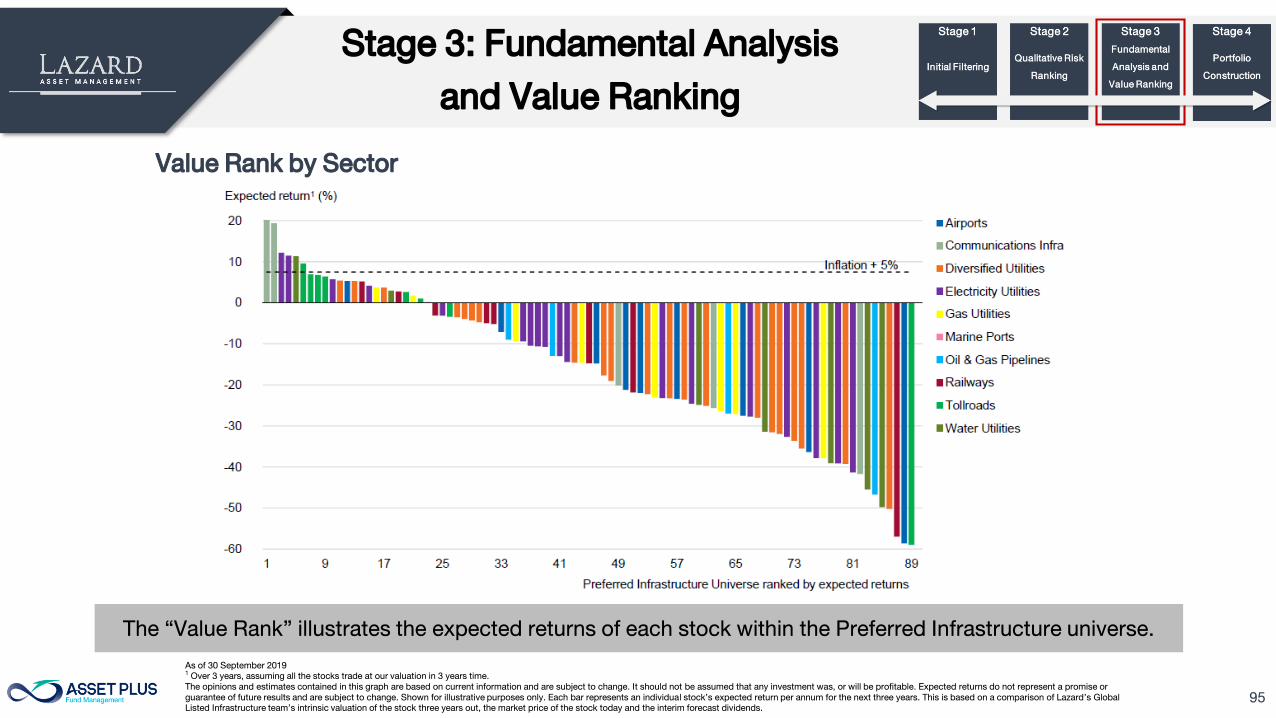
95
Stage 3: Fundamental Analysis
and Value Ranking
Value Rank by Sector
The “Value Rank” illustrates the expected returns of each stock within the Preferred Infrastructure universe.
As of 30 September 2019
1
Over 3 years, assuming all the stocks trade at our valuation in 3 years time.
The opinions and estimates contained in this graph are based on current information and are subject to change. It should not be assumed that any investment was, or will be profitable. Expected returns do not represent a promise or
guarantee of future results and are subject to change. Shown for illustrative purposes only. Each bar represents an individual stock’s expected return per annum for the next three years. This is based on a comparison of Lazard’s Global
Listed Infrastructure team’s intrinsic valuation of the stock three years out, the market price of the stock today and the interim forecast dividends.
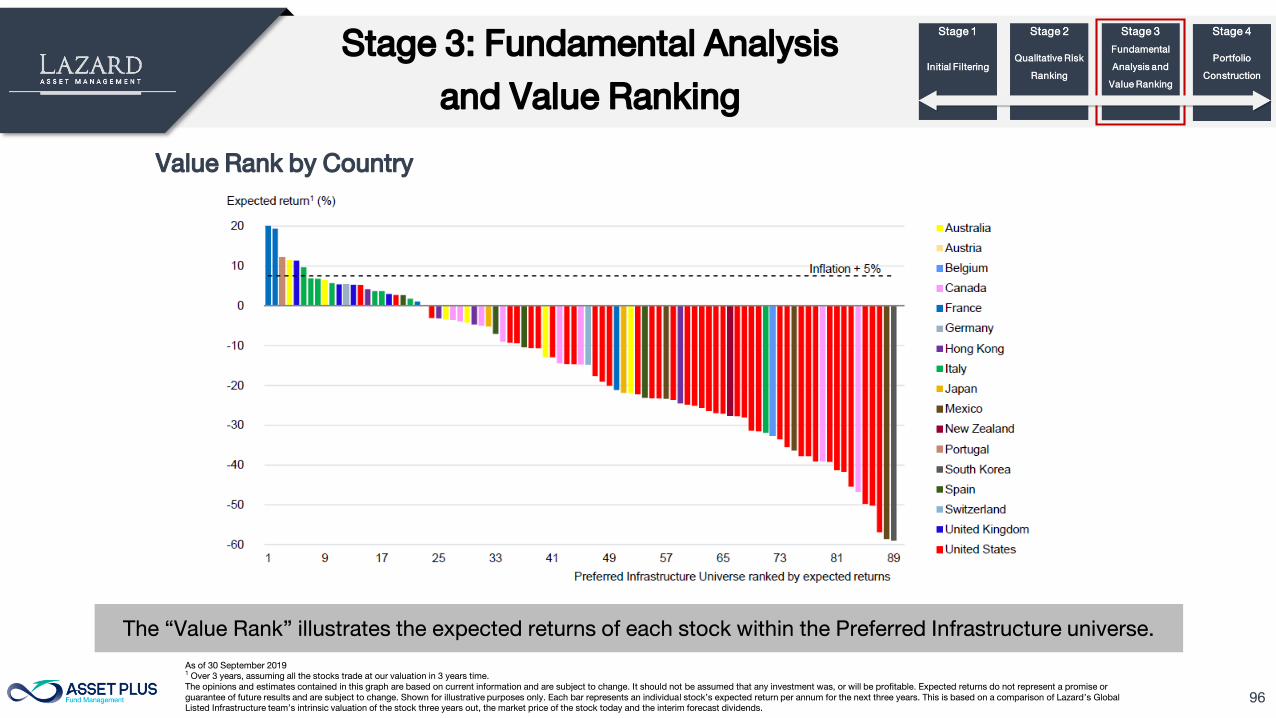
96
The “Value Rank” illustrates the expected returns of each stock within the Preferred Infrastructure universe.
Stage 3: Fundamental Analysis
and Value Ranking
Value Rank by Country
As of 30 September 2019
1
Over 3 years, assuming all the stocks trade at our valuation in 3 years time.
The opinions and estimates contained in this graph are based on current information and are subject to change. It should not be assumed that any investment was, or will be profitable. Expected returns do not represent a promise or
guarantee of future results and are subject to change. Shown for illustrative purposes only. Each bar represents an individual stock’s expected return per annum for the next three years. This is based on a comparison of Lazard’s Global
Listed Infrastructure team’s intrinsic valuation of the stock three years out, the market price of the stock today and the interim forecast dividends.
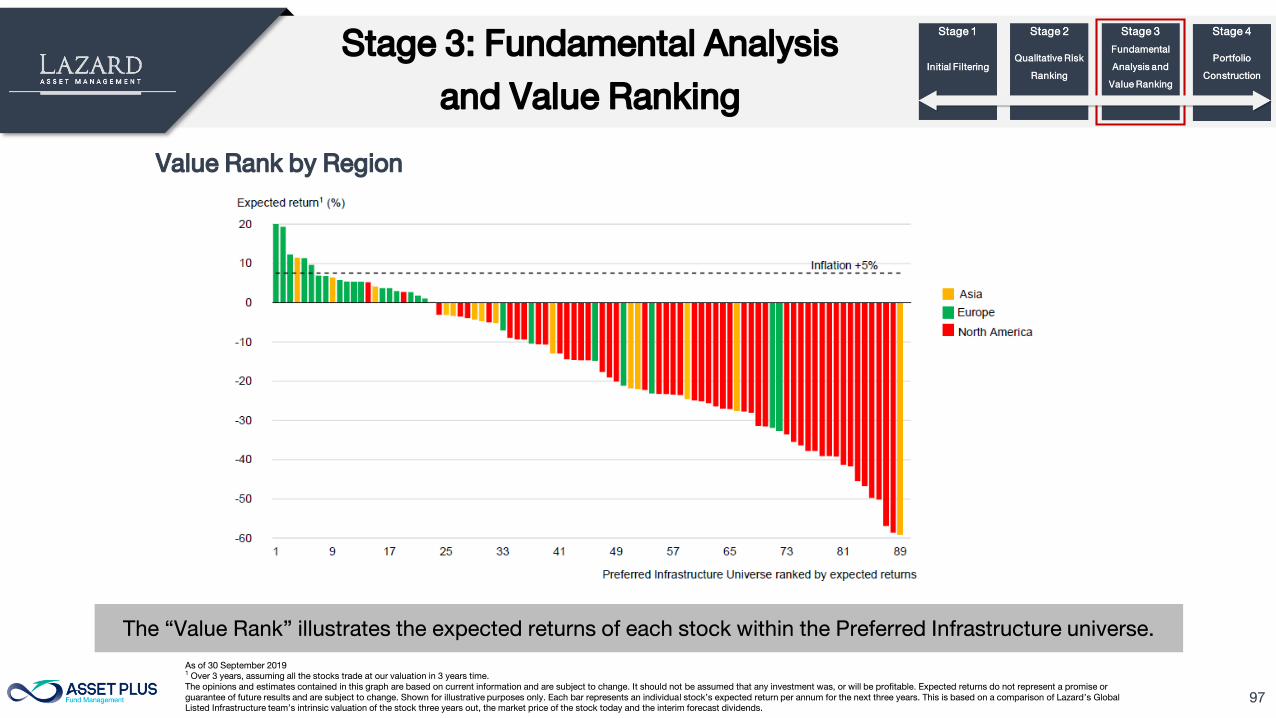
97
Stage 3: Fundamental Analysis
and Value Ranking
The “Value Rank” illustrates the expected returns of each stock within the Preferred Infrastructure universe.
Value Rank by Region
As of 30 September 2019
1
Over 3 years, assuming all the stocks trade at our valuation in 3 years time.
The opinions and estimates contained in this graph are based on current information and are subject to change. It should not be assumed that any investment was, or will be profitable. Expected returns do not represent a promise or
guarantee of future results and are subject to change. Shown for illustrative purposes only. Each bar represents an individual stock’s expected return per annum for the next three years. This is based on a comparison of Lazard’s Global
Listed Infrastructure team’s intrinsic valuation of the stock three years out, the market price of the stock today and the interim forecast dividends.
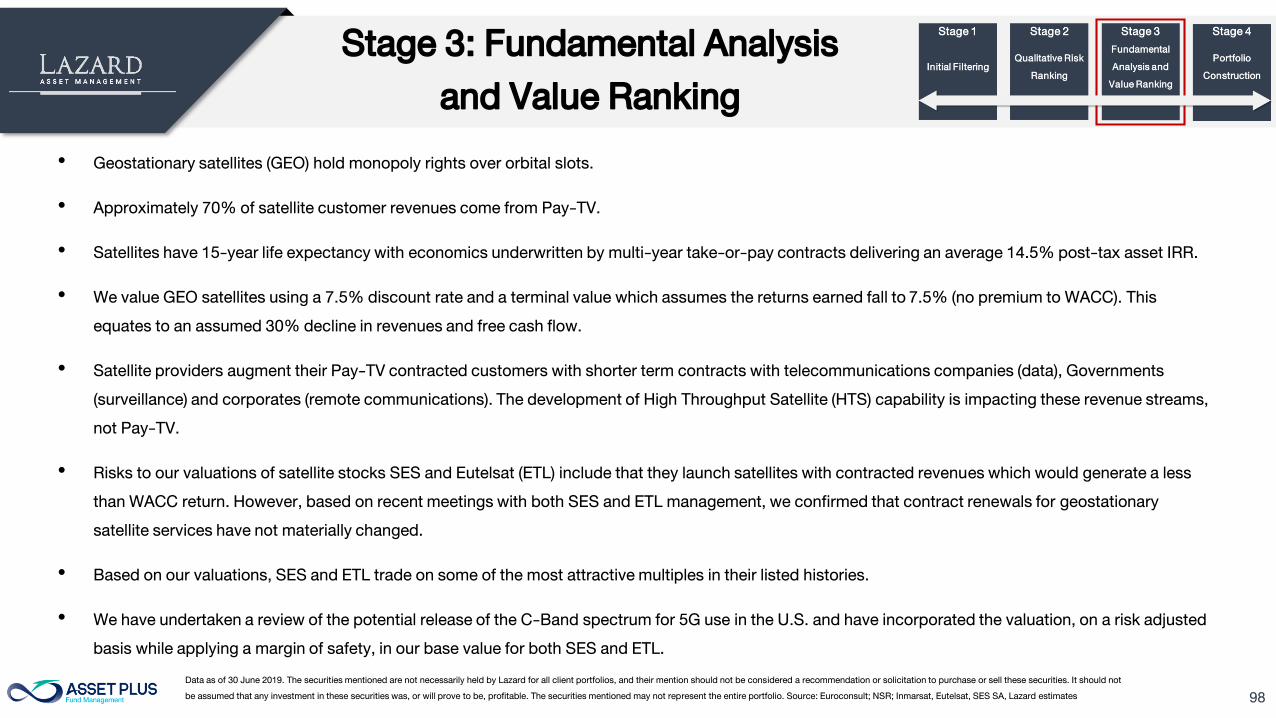
98
Stage 3: Fundamental Analysis
and Value Ranking
• Geostationary satellites (GEO) hold monopoly rights over orbital slots.
• Approximately 70% of satellite customer revenues come from Pay-TV.
• Satellites have 15-year life expectancy with economics underwritten by multi-year take-or-pay contracts delivering an average 14.5% post-tax asset IRR.
• We value GEO satellites using a 7.5% discount rate and a terminal value which assumes the returns earned fall to 7.5% (no premium to WACC). This
equates to an assumed 30% decline in revenues and free cash flow.
• Satellite providers augment their Pay-TV contracted customers with shorter term contracts with telecommunications companies (data), Governments
(surveillance) and corporates (remote communications). The development of High Throughput Satellite (HTS) capability is impacting these revenue streams,
not Pay-TV.
• Risks to our valuations of satellite stocks SES and Eutelsat (ETL) include that they launch satellites with contracted revenues which would generate a less
than WACC return. However, based on recent meetings with both SES and ETL management, we confirmed that contract renewals for geostationary
satellite services have not materially changed.
• Based on our valuations, SES and ETL trade on some of the most attractive multiples in their listed histories.
• We have undertaken a review of the potential release of the C-Band spectrum for 5G use in the U.S. and have incorporated the valuation, on a risk adjusted
basis while applying a margin of safety, in our base value for both SES and ETL.
Data as of 30 June 2019. The securities mentioned are not necessarily held by Lazard for all client portfolios, and their mention should not be considered a recommendation or solicitation to purchase or sell these securities. It should not
be assumed that any investment in these securities was, or will prove to be, profitable. The securities mentioned may not represent the entire portfolio. Source: Euroconsult; NSR; Inmarsat, Eutelsat, SES SA, Lazard estimates
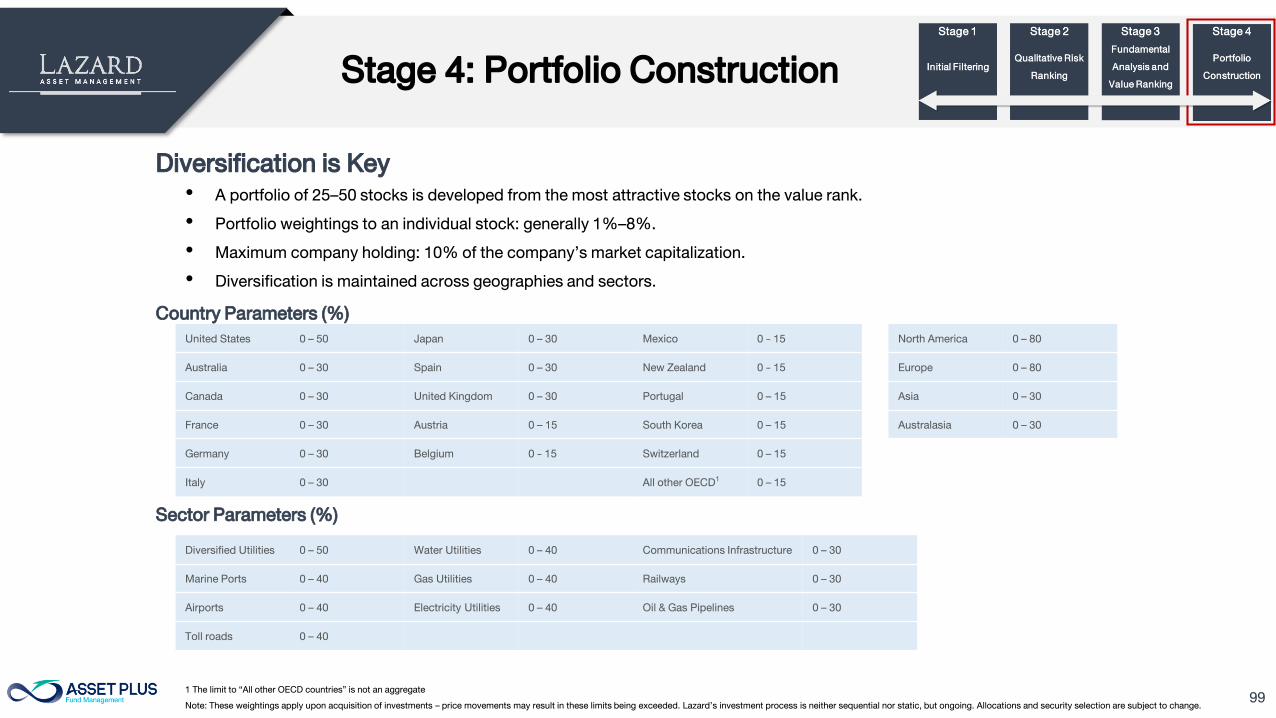
99
Stage 4: Portfolio Construction
Diversification is Key
• A portfolio of 25–50 stocks is developed from the most attractive stocks on the value rank.
• Portfolio weightings to an individual stock: generally 1%–8%.
• Maximum company holding: 10% of the company’s market capitalization.
• Diversification is maintained across geographies and sectors.
1 The limit to “All other OECD countries” is not an aggregate
Note: These weightings apply upon acquisition of investments – price movements may result in these limits being exceeded. Lazard’s investment process is neither sequential nor static, but ongoing. Allocations and security selection are subject to change.
Country Parameters (%)
Sector Parameters (%)
United States 0 – 50 Japan 0 – 30 Mexico 0 - 15
Australia 0 – 30 Spain 0 – 30 New Zealand 0 - 15
Canada 0 – 30 United Kingdom 0 – 30 Portugal 0 – 15
France 0 – 30 Austria 0 – 15 South Korea 0 – 15
Germany 0 – 30 Belgium 0 - 15 Switzerland 0 – 15
Italy 0 – 30 All other OECD1
0 – 15
North America 0 – 80
Europe 0 – 80
Asia 0 – 30
Australasia 0 – 30
Diversified Utilities 0 – 50 Water Utilities 0 – 40 Communications Infrastructure 0 – 30
Marine Ports 0 – 40 Gas Utilities 0 – 40 Railways 0 – 30
Airports 0 – 40 Electricity Utilities 0 – 40 Oil & Gas Pipelines 0 – 30
Toll roads 0 – 40
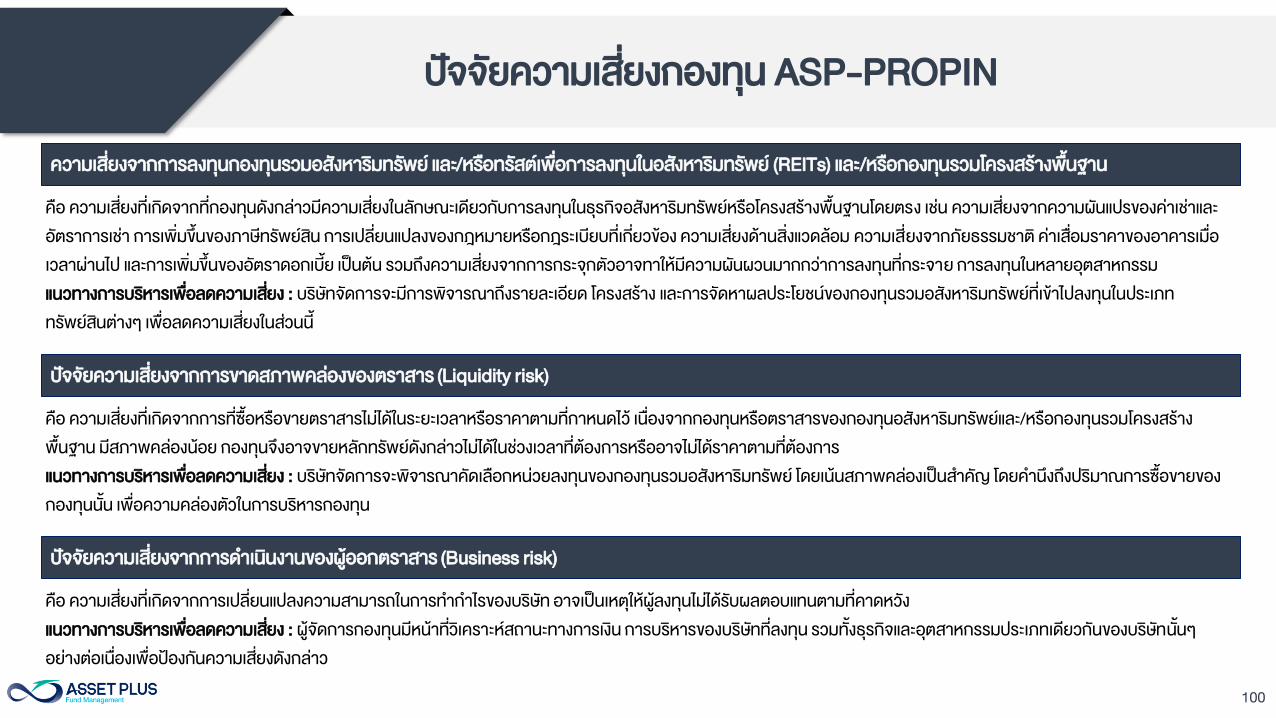
100
ปจจยความเสยงกองทน ASP-PROPIN
คอ ความเสยงทเกดจากทกองทนดงกลาวมความเสยงในลกษณะเดยวกบการลงทนในธรกจอสงหารมทรพยหรอโครงสรางพนฐานโดยตรง เชน ความเสยงจากความผนแปรของคาเชาและ
อตราการเชา การเพมขนของภาษทรพยสน การเปลยนแปลงของกฎหมายหรอกฎระเบยบทเกยวของ ความเสยงดานสงแวดลอม ความเสยงจากภยธรรมชาต คาเสอมราคาของอาคารเมอ
เวลาผานไป และการเพมขนของอตราดอกเบย เปนตน รวมถงความเสยงจากการกระจกตวอาจทาใหมความผนผวนมากกวาการลงทนทกระจาย การลงทนในหลายอตสาหกรรม
แนวทางการบรหารเพอลดความเสยง : บรษทจดการจะมการพจารณาถงรายละเอยด โครงสราง และการจดหาผลประโยชนของกองทนรวมอสงหารมทรพยทเขาไปลงทนในประเภท
ทรพยสนตางๆ เพอลดความเสยงในสวนน
ความเสยงจากการลงทนกองทนรวมอสงหารมทรพย และ/หรอทรสตเพอการลงทนในอสงหารมทรพย (REITs) และ/หรอกองทนรวมโครงสรางพนฐาน
คอ ความเสยงทเกดจากการทซอหรอขายตราสารไมไดในระยะเวลาหรอราคาตามทกาหนดไว เนองจากกองทนหรอตราสารของกองทนอสงหารมทรพยและ/หรอกองทนรวมโครงสราง
พนฐาน มสภาพคลองนอย กองทนจงอาจขายหลกทรพยดงกลาวไมไดในชวงเวลาทตองการหรออาจไมไดราคาตามทตองการ
แนวทางการบรหารเพอลดความเสยง : บรษทจดการจะพจารณาคดเลอกหนวยลงทนของกองทนรวมอสงหารมทรพย โดยเนนสภาพคลองเปนส าคญ โดยค านงถงปรมาณการซอขายของ
กองทนนน เพอความคลองตวในการบรหารกองทน
ปจจยความเสยงจากการขาดสภาพคลองของตราสาร (Liquidity risk)
คอ ความเสยงทเกดจากการเปลยนแปลงความสามารถในการท าก าไรของบรษท อาจเปนเหตใหผลงทนไมไดรบผลตอบแทนตามทคาดหวง
แนวทางการบรหารเพอลดความเสยง : ผจดการกองทนมหนาทวเคราะหสถานะทางการเงน การบรหารของบรษททลงทน รวมทงธรกจและอตสาหกรรมประเภทเดยวกนของบรษทนนๆ
อยางตอเนองเพอปองกนความเสยงดงกลาว
ปจจยความเสยงจากการด าเนนงานของผออกตราสาร (Business risk)
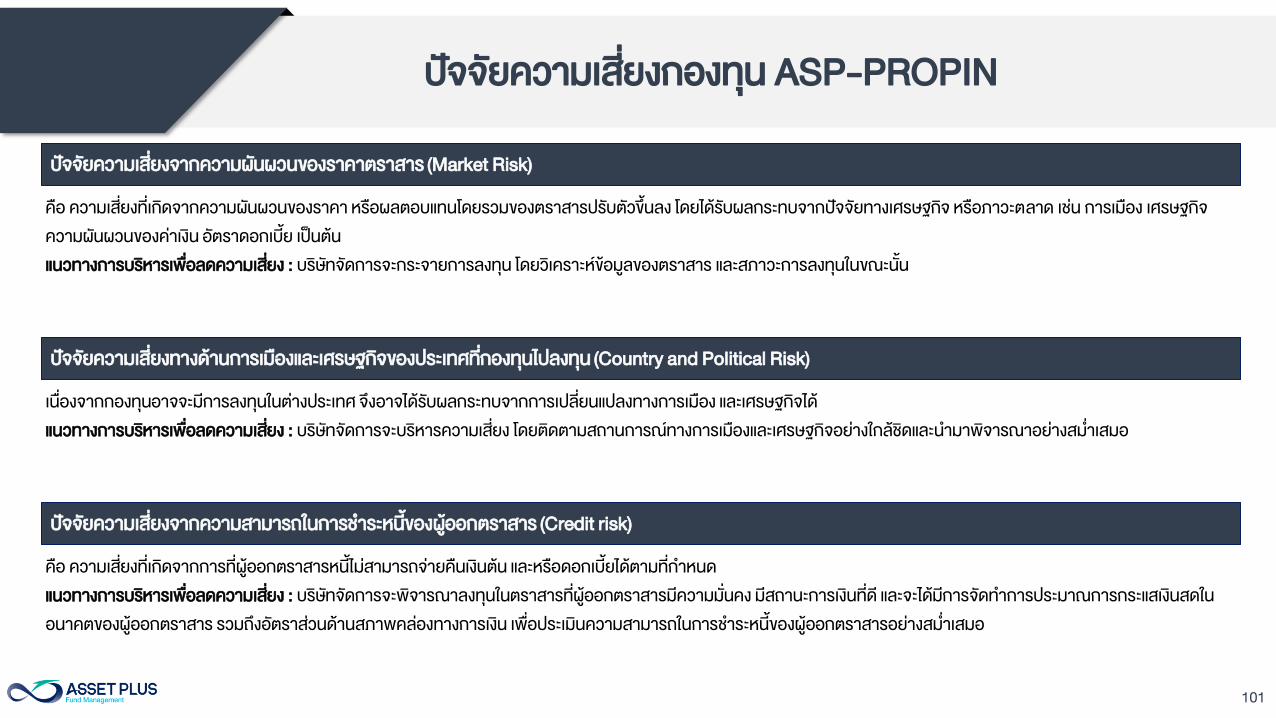
101
ปจจยความเสยงกองทน ASP-PROPIN
คอ ความเสยงทเกดจากความผนผวนของราคา หรอผลตอบแทนโดยรวมของตราสารปรบตวขนลง โดยไดรบผลกระทบจากปจจยทางเศรษฐกจ หรอภาวะตลาด เชน การเมอง เศรษฐกจ
ความผนผวนของคาเงน อตราดอกเบย เปนตน
แนวทางการบรหารเพอลดความเสยง : บรษทจดการจะกระจายการลงทน โดยวเคราะหขอมลของตราสาร และสภาวะการลงทนในขณะนน
ปจจยความเสยงจากความผนผวนของราคาตราสาร (Market Risk)
เนองจากกองทนอาจจะมการลงทนในตางประเทศ จงอาจไดรบผลกระทบจากการเปลยนแปลงทางการเมอง และเศรษฐกจได
แนวทางการบรหารเพอลดความเสยง : บรษทจดการจะบรหารความเสยง โดยตดตามสถานการณทางการเมองและเศรษฐกจอยางใกลชดและน ามาพจารณาอยางสม าเสมอ
ปจจยความเสยงทางดานการเมองและเศรษฐกจของประเทศทกองทนไปลงทน (Country and Political Risk)
คอ ความเสยงทเกดจากการทผออกตราสารหนไมสามารถจายคนเงนตน และหรอดอกเบยไดตามทก าหนด
แนวทางการบรหารเพอลดความเสยง : บรษทจดการจะพจารณาลงทนในตราสารทผออกตราสารมความมนคง มสถานะการเงนทด และจะไดมการจดท าการประมาณการกระแสเงนสดใน
อนาคตของผออกตราสาร รวมถงอตราสวนดานสภาพคลองทางการเงน เพอประเมนความสามารถในการช าระหนของผออกตราสารอยางสม าเสมอ
ปจจยความเสยงจากความสามารถในการช าระหนของผออกตราสาร (Credit risk)
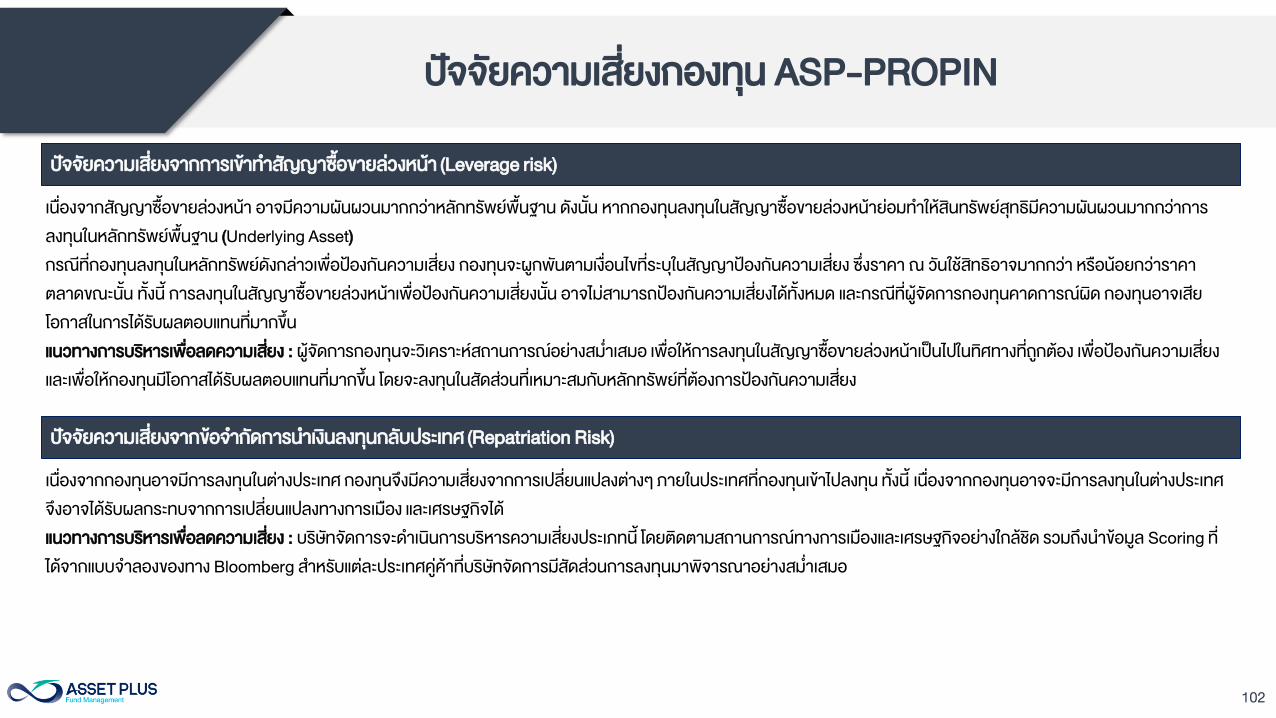
102
ปจจยความเสยงกองทน ASP-PROPIN
เนองจากสญญาซอขายลวงหนา อาจมความผนผวนมากกวาหลกทรพยพนฐาน ดงนน หากกองทนลงทนในสญญาซอขายลวงหนายอมท าใหสนทรพยสทธมความผนผวนมากกวาการ
ลงทนในหลกทรพยพนฐาน (Underlying Asset)
กรณทกองทนลงทนในหลกทรพยดงกลาวเพอปองกนความเสยง กองทนจะผกพนตามเงอนไขทระบในสญญาปองกนความเสยง ซงราคา ณ วนใชสทธอาจมากกวา หรอนอยกวาราคา
ตลาดขณะนน ทงน การลงทนในสญญาซอขายลวงหนาเพอปองกนความเสยงนน อาจไมสามารถปองกนความเสยงไดทงหมด และกรณทผจดการกองทนคาดการณผด กองทนอาจเสย
โอกาสในการไดรบผลตอบแทนทมากขน
แนวทางการบรหารเพอลดความเสยง : ผจดการกองทนจะวเคราะหสถานการณอยางสม าเสมอ เพอใหการลงทนในสญญาซอขายลวงหนาเปนไปในทศทางทถกตอง เพอปองกนความเสยง
และเพอใหกองทนมโอกาสไดรบผลตอบแทนทมากขน โดยจะลงทนในสดสวนทเหมาะสมกบหลกทรพยทตองการปองกนความเสยง
ปจจยความเสยงจากการเขาท าสญญาซอขายลวงหนา (Leverage risk)
เนองจากกองทนอาจมการลงทนในตางประเทศ กองทนจงมความเสยงจากการเปลยนแปลงตางๆ ภายในประเทศทกองทนเขาไปลงทน ทงน เนองจากกองทนอาจจะมการลงทนในตางประเทศ
จงอาจไดรบผลกระทบจากการเปลยนแปลงทางการเมอง และเศรษฐกจได
แนวทางการบรหารเพอลดความเสยง : บรษทจดการจะด าเนนการบรหารความเสยงประเภทน โดยตดตามสถานการณทางการเมองและเศรษฐกจอยางใกลชด รวมถงน าขอมล Scoring ท
ไดจากแบบจ าลองของทาง Bloomberg ส าหรบแตละประเทศคคาทบรษทจดการมสดสวนการลงทนมาพจารณาอยางสม าเสมอ
ปจจยความเสยงจากขอจ ากดการน าเงนลงทนกลบประเทศ (Repatriation Risk)
103
ปจจยความเสยงกองทน ASP-PROPIN
คอ การเปลยนแปลงของอตราแลกเปลยนมผลกระทบตอมลคาของหนวยลงทน เชน กองทนรวมลงทนดวยสกลเงนดอลลารในชวงทเงนบาทออน แตขายท าก าไรในชวงบาทแขง กองทนรวม
จะไดรบเงนบาทกลบมานอยลง ในทางกลบกนหากกองทนรวมลงทนในชวงเงนบาทแขงและขายท าก าไรในชวงบาทออนกอาจไดรบผลตอบแทนมากขนกวาเดมดวยเชนกน ซงจะท าให
ผลตอบแทน ทไดรบมความไมแนนอนเนองจากตองแลกเปลยนสกลเงน ดงนน การปองกนความเสยงจากอตราแลกเปลยนจงเปนเครองมอส าคญในการบรหารความเสยงจากดงกลาว
แนวทางการบรหารเพอลดความเสยง : บรษทจดการจะบรหารความเสยงดานน โดยพจารณาลงทนในหรอมไวซงสญญาซอขายลวงหนา (Derivatives) ทมตวแปรเปนอตราแลกเปลยนเงน
ระหวางคาเงนสกลพนฐานทลงทนกบคาเงนบาท โดยมวตถประสงคเพอปองกนความเสยงตามดลยพนจของผจดการกองทนรวม ดงนน ผลงทนอาจมความเสยงจากอตราแลกเปลยน
ปจจยความเสยงดานอตราแลกเปลยน (Exchange Rate Risk)
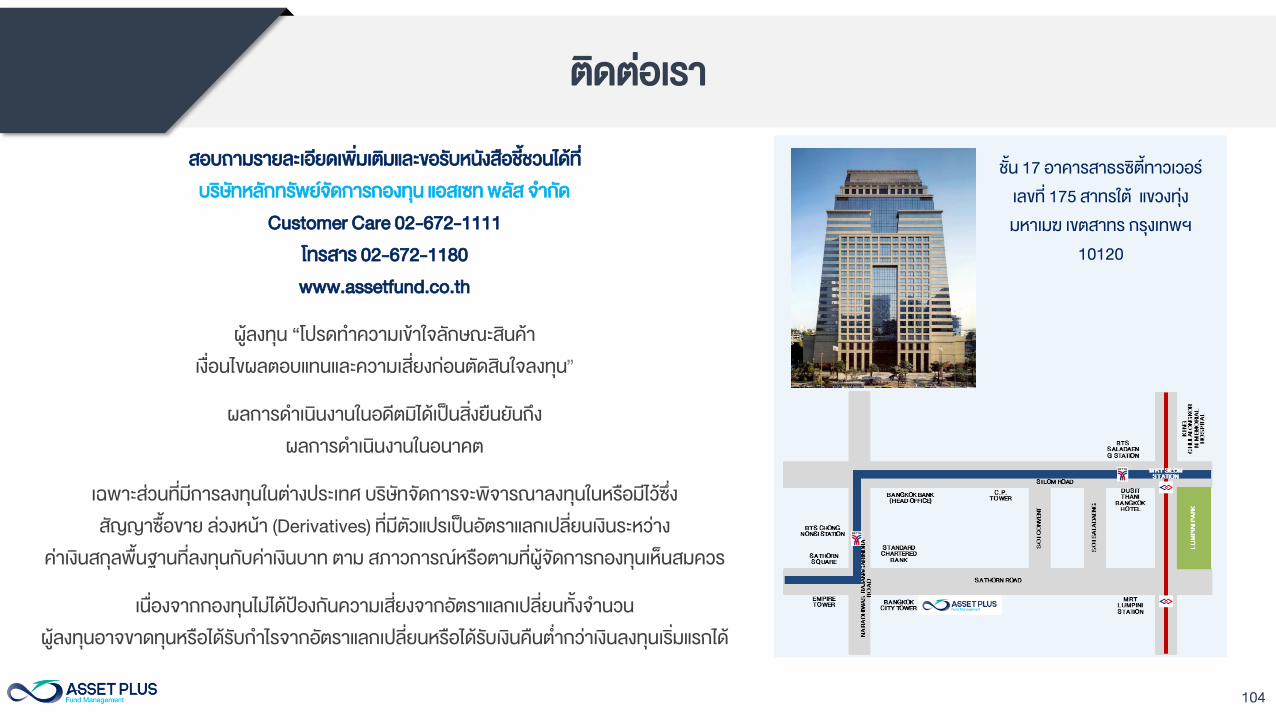
104
ตดตอเรา
สอบถามรายละเอยดเพมเตมและขอรบหนงสอชชวนไดท
บรษทหลกทรพยจดการกองทน แอสเซท พลส จ ากด
Customer Care 02-672-1111
โทรสาร 02-672-1180
www.assetfund.co.th
ผลงทน “โปรดท าความเขาใจลกษณะสนคา
เงอนไขผลตอบแทนและความเสยงกอนตดสนใจลงทน”
ผลการด าเนนงานในอดตมไดเปนสงยนยนถง
ผลการด าเนนงานในอนาคต
เฉพาะสวนทมการลงทนในตางประเทศ บรษทจดการจะพจารณาลงทนในหรอมไวซง
สญญาซอขาย ลวงหนา (Derivatives) ทมตวแปรเปนอตราแลกเปลยนเงนระหวาง
คาเงนสกลพนฐานทลงทนกบคาเงนบาท ตาม สภาวการณหรอตามทผจดการกองทนเหนสมควร
เนองจากกองทนไมไดปองกนความเสยงจากอตราแลกเปลยนทงจ านวน
ผลงทนอาจขาดทนหรอไดรบก าไรจากอตราแลกเปลยนหรอไดรบเงนคนต ากวาเงนลงทนเรมแรกได
ชน 17 อาคารสาธรซตทาวเวอร
เลขท 175 สาทรใต แขวงทง
มหาเมฆ เขตสาทร กรงเทพฯ
10120

105
Related Documents