Zurich Open Repository and Archive University of Zurich Main Library Strickhofstrasse 39 CH-8057 Zurich www.zora.uzh.ch Year: 2009 Synthesis and analysis of amino-functionalised mesoporous silica Ritter, H T K Abstract: The regularly ordered pore arrangement and the narrow pore size distribution of mesoporous silica offer possibilities for several applications such as drug delivery and controlled release. A success- ful implementation requires methods that allow the selective functionalisation of external and internal surfaces. A convenient and scale-up friendly procedure for synthesising high quality mesoporous silica MCM-41 at room temperature was developed. Amino-functionalised samples were analysed using several methods to understand the grafting behaviour of aminopropylalkoxysilanes. The distribution of amino groups on mesoporous silica surfaces was evaluated by analysing textural properties and amino group loadings, as well as by labelling the amino groups with fluorescein isothiocyanate (FITC) for photolumi- nescence spectroscopy. A reliable method to determine the amount of grafted amino groups over a wide range of loadings was developed. The functionalisation of mesoporous silica by vapour phase deposition was studied as an alternative to the common solvent based techniques. The accessibility of amino groups anchored on selected mesoporous silicas was investigated by FITC coupling. Onedimensional channel systems with small pores (3.1 nm and 3.9 nm) and large pores (7.6 nm) as well as three-dimensional channel systems were compared to non-porous silica. Several methods for the selective functionalisation of the external surface of mesoporous silica were critically evaluated. Posted at the Zurich Open Repository and Archive, University of Zurich ZORA URL: https://doi.org/10.5167/uzh-32850 Dissertation Originally published at: Ritter, H T K. Synthesis and analysis of amino-functionalised mesoporous silica. 2009, University of Zurich, Faculty of Science.

Welcome message from author
This document is posted to help you gain knowledge. Please leave a comment to let me know what you think about it! Share it to your friends and learn new things together.
Transcript

Zurich Open Repository andArchiveUniversity of ZurichMain LibraryStrickhofstrasse 39CH-8057 Zurichwww.zora.uzh.ch
Year: 2009
Synthesis and analysis of amino-functionalised mesoporous silica
Ritter, H T K
Abstract: The regularly ordered pore arrangement and the narrow pore size distribution of mesoporoussilica offer possibilities for several applications such as drug delivery and controlled release. A success-ful implementation requires methods that allow the selective functionalisation of external and internalsurfaces. A convenient and scale-up friendly procedure for synthesising high quality mesoporous silicaMCM-41 at room temperature was developed. Amino-functionalised samples were analysed using severalmethods to understand the grafting behaviour of aminopropylalkoxysilanes. The distribution of aminogroups on mesoporous silica surfaces was evaluated by analysing textural properties and amino grouploadings, as well as by labelling the amino groups with fluorescein isothiocyanate (FITC) for photolumi-nescence spectroscopy. A reliable method to determine the amount of grafted amino groups over a widerange of loadings was developed. The functionalisation of mesoporous silica by vapour phase depositionwas studied as an alternative to the common solvent based techniques. The accessibility of amino groupsanchored on selected mesoporous silicas was investigated by FITC coupling. Onedimensional channelsystems with small pores (3.1 nm and 3.9 nm) and large pores (7.6 nm) as well as three-dimensionalchannel systems were compared to non-porous silica. Several methods for the selective functionalisationof the external surface of mesoporous silica were critically evaluated.
Posted at the Zurich Open Repository and Archive, University of ZurichZORA URL: https://doi.org/10.5167/uzh-32850Dissertation
Originally published at:Ritter, H T K. Synthesis and analysis of amino-functionalised mesoporous silica. 2009, University ofZurich, Faculty of Science.

Synthesis and Analysis of Amino-Functionalised
Mesoporous Silica
Dissertation
zur
Erlangung der naturwissenschaftlichen Doktorwürde (Dr. sc. nat.)
vorgelegt der
Mathematisch-naturwissenschaftlichen Fakultät
der
Universität Zürich
von
Hanna Taina Katariina Ritter
aus Finnland
Promotionskomitee
Prof. Dr. Heinz Berke (Vorsitz)
Dr. Dominik Brühwiler (Leitung der Dissertation)
Zürich, 2009


i
Abstract
The regularly ordered pore arrangement and the narrow pore size distribution of
mesoporous silica offer possibilities for several applications such as drug delivery and
controlled release. A successful implementation requires methods that allow the
selective functionalisation of external and internal surfaces. A convenient and scale-up
friendly procedure for synthesising high quality mesoporous silica MCM-41 at room
temperature was developed. Amino-functionalised samples were analysed using
several methods to understand the grafting behaviour of aminopropylalkoxysilanes.
The distribution of amino groups on mesoporous silica surfaces was evaluated by
analysing textural properties and amino group loadings, as well as by labelling the
amino groups with fluorescein isothiocyanate (FITC) for photoluminescence
spectroscopy. A reliable method to determine the amount of grafted amino groups
over a wide range of loadings was developed. The functionalisation of mesoporous
silica by vapour phase deposition was studied as an alternative to the common solvent
based techniques. The accessibility of amino groups anchored on selected mesoporous
silicas was investigated by FITC coupling. One-dimensional channel systems with small
pores (3.1 nm and 3.9 nm) and large pores (7.6 nm) as well as three-dimensional
channel systems were compared to non-porous silica. Several methods for the
selective functionalisation of the external surface of mesoporous silica were critically
evaluated.

ii
Kurzfassung
Die regelmässige Anordnung der Poren und die schmale Verteilung der Porengrössen
von mesoporösem Silica bieten eine Vielzahl von Anwendungsmöglichkeiten, wie
Wirkstofftransport und kontrollierte Abgabe. Eine erfolgreiche Umsetzung verlangt
nach Methoden, die die selektive Funktionalisierung von äusseren und inneren
Oberflächen ermöglichen. Es wurde eine einfache und in grossem Ansatz
durchführbare Raumtemperatur-Synthese für qualitativ hochstehendes mesoporöses
Silica MCM-41 entwickelt. Aminofunktionalisierte Proben wurden mit verschiedenen
Methoden analysiert, um das Reaktionsverhalten von Aminopropylalkoxysilanen zu
verstehen. Die Verteilung von Aminogruppen auf der Oberfläche des mesoporösen
Silicas wurde durch Analyse von strukturellen Eigenschaften und Aminobeladungen
evaluiert. Aminogruppen wurden mit Fluoresceinisothiocyanat (FITC) gekoppelt und
mittels Lumineszenzspektroskopie analysiert. Ein verlässliches Verfahren zur
Bestimmung der Aminogruppenbeladung wurde entwickelt. Als alternative Methode
zur Lösungsmittel-basierten Synthese wurde die Funktionalisierung von mesoporösem
Silica durch Abscheidung aus der Gasphase untersucht. Die Zugänglichkeit von
oberflächengebundenen Aminogruppen, wurde durch FITC Kopplung bestimmt.
Eindimensionale Porensysteme mit kleinen (3.1 nm und 3.9 nm) und grossen Poren
(7.6 nm), sowie dreidimensionale Porensysteme (MCM-48) wurden mit nicht-porösem
Silica verglichen. Mehrere Methoden für die selektive Funktionalisierung der äusseren
Oberfläche von mesoporösem Silica wurden kritisch evaluiert.
iii
Tiivistelmä
Mesohuokoisen silikan säännöllisesti järjestäytyneet huokoset sekä niiden suppea
huokoskoon jakauma mahdollistavat useita käytännän sovelluksia kuten lääkeaineiden
kuljetuksen ja kontrolloidun vapauttamisen. Menestyksekäs toteutus vaatii
menetelmän, joka sallii silikan ulko- ja sisäpintojen funktionalisoinnin erikseen. Tässä
työssä kehitettiin käyttäjäystävällinen ja silikamäärän säätelemisen mahdollistava
menetelmä, jolla voidaan syntetisoida huoneenlämmössä erittäin laadukasta
mesohuokoista silikaa MCM-41. Aminoryhmillä muokattuja silikanäytteitä analysoitiin
useilla eri menetelmillä, jotta ymmärrettäisiin aminopropyylialkoksisilaanien
käyttäytymistä reaktio-olosuhteissa. Aminoryhmien jakautumista mesohuokoisen
silikan pinnalla tutkittiin analysoimalla rakennetta, aminoryhmien määrää sekä
merkitsemällä aminot fluoresiini-isotiosyanaatilla (FITC) fotoluminesenssi-
spektroskopiaa varten. Työssä kehitettiin luotettava menetelmä aminoryhmien
määrän analysoimiseksi. Kaasufaasireaktioiden soveltumista mesohuokoisen silikan
pinnoittamiseksi tutkittiin korvaamaan perinteisiä liuotinmenetelmiä. Animoryhmien
saavutettavuutta valikoiduissa huokoisissa silikoissa tutkittiin FITC reaktioiden avulla.
Erilaisia silikoita, joilla on yksidimensionaalinen huokosrakenne pienin huokosin (3.1
nm ja 3.9 nm), isoin huokosin (7.6 nm) tai kolmiuloitteinen huokossysteemi, verrattiin
ei-huokoisen silikaan. Tutkimuksessa kokeiltiin useita menetelmiä selektiivisesti
ulkopinnan muokkaamiseksi aminoryhmillä.

iv
Acknowledgement
Experimental work of this thesis was carried out during the years 2005 - 2008 at the
Institute of Inorganic Chemistry, University of Zürich.
I am very grateful to my supervisor, Dr. Dominik Brühwiler, for his continuous support
and encouragement. His genuine interest and advice have been a big contribution to
my work.
Prof. Dr. Heinz Berke is acknowledged for chairing my defence and for financial
support. Swiss National Science Foundation and the European Commission through
the Human Potential Program (Marie-Curie RTN Nanomatch) provided financial
support.
I am thankful to Dr. Minna Nieminen and Prof. Dr. Maarit Karppinen (Laboratory of
Inorganic Chemistry, Helsinki University of Technology, Finland) for giving me the
possibility to do the vapour phase experiments in the spring 2007. It was a pleasure to
enjoy “the old times” for a while.
I want to thank sincerely all of the group members, Le-Quyenh Dieu, Jan Hinrich
Ramm, Dr. Christophe Bauer, Dr. Igor Dolamic and Nando Gartmann, for help and
discussions as well as the good atmosphere in the lab. Also the former group members
are thanked. The entire personnel of ACI are thanked for pleasant working
environment and for their practical advices whenever needed.
My parents are warmly acknowledged for their loving encouragement during my
studies. My brother, Jussi, and his family, Jessica and Ukko, are thanked for helping me
to look things from another view.
Loving thank you is dedicated to my husband, Stefan, for his continuous support and
understanding. Now it is time to start our adventure.
Zürich, January 2009
Hanna Ritter

v
List of Abbreviations and Acronyms
ALD Atomic layer deposition
APAS Aminopropylalkoxysilane
APDIPES 3-Aminopropyldiisopropylethoxysilane
APDMMS 3-Aminopropyldimethylmethoxysilane
APTES 3-Aminopropyltriethoxysilane
APTMEES 3-Aminopropyltrimethoxyethoxyethoxysilane
APTMS 3-Aminopropyltrimethoxysilane
BET Brunauer-Emmett-Teller
BJH Barrett-Joyner-Halenda
BTESPA Bis(triethoxysilyl)propylamine
BTMSPA Bis(trimethoxysilyl)propylamine
CTAB Cetyltrimethylammonium bromide
DFT Density functional theory
DRIFTS Diffuse reflectance infrared fourier transform spectroscopy
FITC Fluoresceinisothiocyanate
FMOC* 2,7-di-tert-butyl-9-fluorenylmethylchloroformate
HT-MCM-41 High temperature MCM-41
MAPMDMS [3-(Methylamino)propyl]methyldimethoxysilane
MAPTMS [3-(Methylamino)propyl]trimethoxysilane
LCT Liquid crystal templating
PL Photoluminescence
PSD Pore size distribution
RT-MCM-41 Room temperature MCM-41
SDA Structure directing agent
SEM Scanning electron microscopy
TEOS Tetraethoxysilane
XRD Powder X-ray diffraction

vi
Table of Contents
Abstract .............................................................................................................................. i
Kurzfassung ....................................................................................................................... ii
Tiivistelmä ........................................................................................................................ iii
Acknowledgement ........................................................................................................... iv
List of Abbreviations and Acronyms ................................................................................. v
Table of Contents ............................................................................................................. vi
1. Introduction ............................................................................................................... 1
2. General Background to Materials and Experiments ................................................. 4
2.1 Materials ............................................................................................................ 4
2.1.1 MCM-41 ...................................................................................................... 4
2.1.2 Other Mesoporous Silica Types .................................................................. 6
2.1.3 Aminopropylalkoxysilanes .......................................................................... 9
2.2 Surface Modification ........................................................................................ 10
2.2.1 Reactions in Solution ................................................................................ 11
2.2.2 Vapour Phase Reactions ........................................................................... 11
2.2.3 Fluorescein Labelling ................................................................................. 11
2.3 Characterisation Techniques ............................................................................ 13
2.3.1 N2 sorption ................................................................................................ 13
2.3.2 Analysis of Amino Groups on Mesoporous Silica ..................................... 17
3. Silane Distribution on MCM-41 ............................................................................... 18
3.1 Main Results ..................................................................................................... 18
3.2 Additional Experiments .................................................................................... 21
3.2.1 Quenching of Coupled FITC by Methylviologen and Tb3+ ......................... 21
3.2.2 Cross-linking of Aminosilanes ................................................................... 22
vii
4. Comparison of Vapour Phase and Liquid Phase Deposition Techniques ................ 24
4.1 Main Results ..................................................................................................... 24
4.2 Additional Experiments in the Vapour Phase .................................................. 26
4.2.1 Pretreatment of MCM-41 at Different Temperatures ............................. 26
4.2.2 Reaction Temperature .............................................................................. 27
4.2.3 Variation of Precursor Amount ................................................................. 28
4.3 Additional Experiments in Solvent ................................................................... 29
4.3.1 Reactions in Other Solvents (THF) ............................................................ 29
4.3.2 APDMMS vs. APTMS ................................................................................. 30
4.3.3 Effects of Water Addition ......................................................................... 31
5. Pore Blocking in Postsynthetic Functionalisation ................................................... 32
5.1 Comparison of Mesoporous Silicas .................................................................. 32
5.2 Microporosity of SBA-15 .................................................................................. 35
6. Studies on the Effect of Water ................................................................................ 38
6.1 Grafting in Toluene in Presence of Water ........................................................ 38
6.1.1 APTES vs. APDIPES .................................................................................... 39
6.1.2 Silica Framework Hydrolysis ..................................................................... 40
6.1.3 Effects of Grafting vs. Time ....................................................................... 41
6.2 Other Solvents .................................................................................................. 43
6.2.1 Deposition from Ethanol ........................................................................... 43
6.2.2 Deposition from Water ............................................................................. 45
7. Modification of the External Surface of MCM-41 ................................................... 47
7.1 Preliminary Experiments .................................................................................. 48
7.2 Experiments using FMOC* ............................................................................... 50
7.2.1 Experimental Details ................................................................................. 51
7.2.2 Results ....................................................................................................... 51
7.3 Discussion ......................................................................................................... 52

viii
8. Summary and Outlook ............................................................................................. 53
9. References ............................................................................................................... 55
Appendix ......................................................................................................................... 59
Distribution of amino groups on a mesoporous silica surface after submonolayer
deposition of aminopropylsilanes from an anhydrous liquid phase .......................... 60
A comparative study of the functionalization of mesoporous silica MCM-41 by
deposition of 3-aminopropyltrimethoxysilane from toluene and from the vapor
phase ........................................................................................................................... 74
Accessibility of grafting sites in postsynthetically modified mesoporous silica ......... 85
Curriculum Vitae ........................................................................................................... 103
List of Publications and Conference Contributions ...................................................... 104
Publications ............................................................................................................... 104
Posters ....................................................................................................................... 104

The discovery of the M41S
possibilities in the fiel
these highly ordered mesoporous materials are manifold, including photonics
delivery
IUPAC divides porous m
1.1)
Figure 1.
MCM
of hexagonal arrays of non
distribution. High surface area (900 m
additional properties of MCM
as MCM
prepared with larger pore diameter than MCM
accomplished
The method (Figure 1
directing agent (SDA). Addition of a silica source to the solution leads to the
condensation of silica around the rods which arrange in a hexagonal pattern. The
pores become accessible after
Figure 1.
1. Introduction
The discovery of the M41S
possibilities in the fiel
these highly ordered mesoporous materials are manifold, including photonics
delivery3 and nanotechnology
IUPAC divides porous m
1.1)7.
Figure 1.1. Definition of micro
MCM-41 (Mobil Composition of Matter) is a member of the M41S family and consi
of hexagonal arrays of non
distribution. High surface area (900 m
additional properties of MCM
as MCM-48 with cubic structure and SBA
prepared with larger pore diameter than MCM
accomplished
The method (Figure 1
directing agent (SDA). Addition of a silica source to the solution leads to the
condensation of silica around the rods which arrange in a hexagonal pattern. The
pores become accessible after
Figure 1.2. Liquid crystal templating method for synthesising MCM
Introduction
The discovery of the M41S
possibilities in the field of silicate
these highly ordered mesoporous materials are manifold, including photonics
and nanotechnology
IUPAC divides porous m
Definition of micro
41 (Mobil Composition of Matter) is a member of the M41S family and consi
of hexagonal arrays of non
distribution. High surface area (900 m
additional properties of MCM
8 with cubic structure and SBA
prepared with larger pore diameter than MCM
accomplished by liquid crystal templating (LCT
The method (Figure 1.2) is based on the formation of micellar rods from the structure
directing agent (SDA). Addition of a silica source to the solution leads to the
condensation of silica around the rods which arrange in a hexagonal pattern. The
pores become accessible after
Liquid crystal templating method for synthesising MCM
Introduction
The discovery of the M41S1 family of materials in the early 1990s offered new
d of silicate
these highly ordered mesoporous materials are manifold, including photonics
and nanotechnology4 as well as catalysis
IUPAC divides porous materials in three classes according to their pore size (Figure
Definition of micro-, meso-
41 (Mobil Composition of Matter) is a member of the M41S family and consi
of hexagonal arrays of non-intersecting, uniform channels of narrow pore size
distribution. High surface area (900 m
additional properties of MCM-41. The mesoporous class includes other materials such
8 with cubic structure and SBA
prepared with larger pore diameter than MCM
by liquid crystal templating (LCT
.2) is based on the formation of micellar rods from the structure
directing agent (SDA). Addition of a silica source to the solution leads to the
condensation of silica around the rods which arrange in a hexagonal pattern. The
pores become accessible after the SDA is removed by calcination or extraction.
Liquid crystal templating method for synthesising MCM
1
family of materials in the early 1990s offered new
d of silicate-based molecular sieves. Potential applications of
these highly ordered mesoporous materials are manifold, including photonics
as well as catalysis
aterials in three classes according to their pore size (Figure
- and macroporous materials with examples.
41 (Mobil Composition of Matter) is a member of the M41S family and consi
intersecting, uniform channels of narrow pore size
distribution. High surface area (900 m2/g) and large pore volume (0.75 cm
41. The mesoporous class includes other materials such
8 with cubic structure and SBA-15 with a
prepared with larger pore diameter than MCM
by liquid crystal templating (LCT
.2) is based on the formation of micellar rods from the structure
directing agent (SDA). Addition of a silica source to the solution leads to the
condensation of silica around the rods which arrange in a hexagonal pattern. The
the SDA is removed by calcination or extraction.
Liquid crystal templating method for synthesising MCM
family of materials in the early 1990s offered new
based molecular sieves. Potential applications of
these highly ordered mesoporous materials are manifold, including photonics
as well as catalysis5 and adsorption
aterials in three classes according to their pore size (Figure
and macroporous materials with examples.
41 (Mobil Composition of Matter) is a member of the M41S family and consi
intersecting, uniform channels of narrow pore size
/g) and large pore volume (0.75 cm
41. The mesoporous class includes other materials such
with a hexagonal
prepared with larger pore diameter than MCM-41. The synthesis of MCM
by liquid crystal templating (LCT)8, also referred to a soft
.2) is based on the formation of micellar rods from the structure
directing agent (SDA). Addition of a silica source to the solution leads to the
condensation of silica around the rods which arrange in a hexagonal pattern. The
the SDA is removed by calcination or extraction.
Liquid crystal templating method for synthesising MCM
family of materials in the early 1990s offered new
based molecular sieves. Potential applications of
these highly ordered mesoporous materials are manifold, including photonics
and adsorption6
aterials in three classes according to their pore size (Figure
and macroporous materials with examples.
41 (Mobil Composition of Matter) is a member of the M41S family and consi
intersecting, uniform channels of narrow pore size
/g) and large pore volume (0.75 cm
41. The mesoporous class includes other materials such
hexagonal structure
41. The synthesis of MCM
also referred to a soft
.2) is based on the formation of micellar rods from the structure
directing agent (SDA). Addition of a silica source to the solution leads to the
condensation of silica around the rods which arrange in a hexagonal pattern. The
the SDA is removed by calcination or extraction.
Liquid crystal templating method for synthesising MCM-41.
family of materials in the early 1990s offered new
based molecular sieves. Potential applications of
these highly ordered mesoporous materials are manifold, including photonics6. The definition of
aterials in three classes according to their pore size (Figure
and macroporous materials with examples.
41 (Mobil Composition of Matter) is a member of the M41S family and consi
intersecting, uniform channels of narrow pore size
/g) and large pore volume (0.75 cm
41. The mesoporous class includes other materials such
structure which can be
41. The synthesis of MCM
also referred to a soft-templating
.2) is based on the formation of micellar rods from the structure
directing agent (SDA). Addition of a silica source to the solution leads to the
condensation of silica around the rods which arrange in a hexagonal pattern. The
the SDA is removed by calcination or extraction.
family of materials in the early 1990s offered new
based molecular sieves. Potential applications of
these highly ordered mesoporous materials are manifold, including photonics2, drug
. The definition of
aterials in three classes according to their pore size (Figure
41 (Mobil Composition of Matter) is a member of the M41S family and consists
intersecting, uniform channels of narrow pore size
/g) and large pore volume (0.75 cm3/g) are
41. The mesoporous class includes other materials such
which can be
41. The synthesis of MCM-41 is
templating9.
.2) is based on the formation of micellar rods from the structure
directing agent (SDA). Addition of a silica source to the solution leads to the
condensation of silica around the rods which arrange in a hexagonal pattern. The

2
The properties of the mesoporous silica can be changed by binding functional groups
to the surface silanols. Amine modified mesoporous silicas are of interest in the fields
of analytical chemistry10, materials chemistry11, biochemistry12, catalyst technology13
and chromatography14. Functionlisation of the surface is possible via two different
methods (Figure 1.3). In the postsynthetic modification method (also known as
grafting), the silica surface is functionalised after the complete formation of the
mesoporous structure. Grafting yields and functional group distributions are affected
by the reactivity of the molecule containing the functional group as well as steric
factors and diffusion limitations. The most readily accessible sites on the outer surface
and close to the pore entrances are modified preferentially, while internal sites may
remain unreacted15. The co-condensation method is a one-pot procedure where
molecules containing the desired functional groups are added during the synthesis of
the mesoporous silica. These molecules must contain a group which enables
condensation with the silica source. This single step modification method is believed
to result in an even distribution of the functional groups. However, silane inclusion
into the pore walls can occur. Co-condensation synthesis yields thicker walls but the
hydrothermal stability is often not as good as for the postsynthetically modified
mesoporous silica16.
Figure 1.3. Two different modification methods, grafting and co-condensation.

3
The motivation for this work is the potential application of non-toxic and
biocompatible mesoporous silica as a drug delivery device. The size of particles
injected into the human circulatory system has to be less than 300 nm17 and this can
be achieved with mesoporous silica18. The large surface area enables efficient drug
adsorption. Controlled drug loading and release can be achieved by appropriate
functionalisation. 3
Although non-modified mesopores are also adequate for drug release, amino-
functionalised MCM-41 and SBA-15 have shown an even more effective controlled
release of ibuprofen19,20. For ideal drug delivery, mesoporous particles need to have
differently modified outer and inner surface. The pore surface adsorbs the drug
molecules whereas the pore entrance is modified with gate molecules for accurate
release. The outer surface has to be appropriately modified for compatibility with
blood and for directing the drug carriers to the target cells.3
Controlled grafting on outer and inner surfaces was one goal of this work. The
research further focused on the analysis of the functional group distribution on the
mesoporous silica surface, which is also important for developing and evaluating new
functionalisation methods. The amino group distribution, influence of water, pore
blocking and deposition from the vapour phase have been studied in detail.

4
2. General Background to Materials and Experiments
The main features of materials, surface modification methods and some of the applied
characterization methods are introduced in the following. Synthesis methods of
different mesoporous silicas are described and compared.
2.1 Materials
2.1.1 MCM-41
MCM-41 used in this work has been synthesised according to literature21. The
synthesis started with dissolving 2.2 g of hexacetyltrimethylammonium bromide
(CTAB) in a mixture of 52 ml of distilled water and 24 ml of 25 % NH3 under slight
heating. Tetraethoxysilane (TEOS, 10 ml) was added dropwise to the clear solution at
room temperature. The obtained white gel was further stirred for 3 h and afterwards
transferred to an autoclave for aging at 110 °C for 48 h. After cooling, the gel was
filtered and the product was washed with at least 800 ml of distilled water. Removal of
the SDA was performed at 550 °C for 12 h. The heating rate was 2 °C/min and the
temperature was held at 300 °C for 2 h. The maximum yield was 2.6 g of calcined
MCM-41.
SDA removal can be followed by infrared spectroscopy (IR). Figure 2.1 shows the IR
spectra of MCM-41 before and after calcination. The absence of bands at 2925 cm-1
and 2850 cm-1 (ν(CH2)) as well as 1460-1475 cm-1 (δs(CH2)) confirms the removal of the
SDA. The hexagonal structure can be detected by powder X-ray diffraction (XRD).
Figure 2.1. IR spectra of MCM-41 in a KBr pellet before and after SDA removal.

5
It is possible to synthesise high quality MCM-41 without using an autoclave. Two
slightly different methods were developed. Room temperature MCM-41 (RT-MCM-41)
was synthesised following the procedure for high temperature MCM-41 (HT-MCM-41)
aged at high temperature with the difference that the white gel was aged at room
temperature for 24 h. An even faster method, which included filtering the white gel
immediately after TEOS addition was also evaluated (Fast RT-MCM-41). Calcination
was performed as described above. Pore size distributions (PSDs) of these three
samples are shown in Figure 2.2. XRD patterns (Figure 2.3) are similar for both MCM-
41 syntheses. The shift to smaller angles is due to the slightly smaller pores of RT-
MCM-41. The relative changes in total pore volume upon stirring in water for 24 h
reveal the excellent stability of RT-MCM-41 and indicate the importance of aging
(comparison with Fast RT-MCM-41). Table 2.1 compares textural and stability data of
the HT- and RT-MCM-41 samples.
Figure 2.2. PSDs of HT-, RT- and Fast RT-MCM-41 analysed by DFT (adsorption).
The advantage of the RT-MCM-41 synthesis is that there is no need for an autoclave
and therefore scaling up the synthesis is straightforward. Scale up to ten times the
standard procedure was performed, resulting in high quality RT-MCM-41.

6
Figure 2.3. XRD of HT-MCM-41 and RT-MCM-41.
Table 2.1. Textural and stability data of HT- and RT-MCM-41 samples.
HT-MCM-41 RT-MCM-41 Fast RT-MCM-41
Pore size (DFT) (nm) 4.1 3.7 3.3
BET (m2/g) 896 957 976
External Surface (m2/g) 67 93 104
Total Pore Volume (cm3/g) 0.76 0.78 0.69
Primary Mesopore Volume (cm3/g)
0.69 0.66 0.54
Stability in H2O after 24 h (Total Pore Volume) %
88 84 70
2.1.2 Other Mesoporous Silica Types
Apart from MCM-41, mesoporous silica MCM-48 and SBA-15 were used in this work.
MCM-48 has (for a given SDA) a pore diameter similar to MCM-41, but the pores are
connected to each other three-dimensionally (Figure 2.4). Like MCM-41, SBA-1522
features a hexagonal pore structure, but with thicker walls and typically larger pores.
Intrawall porosity, which can be as high as 30 % of the total porosity23, is often
observed for SBA-15, depending to a certain extent on the synthesis temperature24.
Intrawall pores include micropores25, which provide connectivity between the primary
mesopores.26

7
Figure 2.4. Different pore structures, (a) MCM-41 and (b) MCM-4827
As an example of pore diameter tuning, MCM-41(12) was synthesised with a SDA
featuring a C12-chain instead of the standard C16. We have also investigated nano-
MCM, which has a hexagonal mesoporous structure, even though the particle size is
only 50 nm28. Fumed silica was used as a non-porous reference. Figure 2.5 shows the
corresponding PSDs. Powder XRD measurements of MCM-48 and
MCM-41(12) are given in Figure 2.6.
Figure 2.5. Typical DFT pore size distributions of mesoporous silicas used in this work. Calculations are based on the adsorption isotherms.
Table 2.2 compares the textural properties of the different silica types. The rather
large total pore volume of nano-MCM is due to the interparticle spaces28. As a
consequence of the small particle size, the external surface is significantly larger
compared to the other silicas. The primary mesopore volume corresponds to the
uniform mesopore volume, whereas the total pore volume additionally includes
disordered secondary mesopores and interparticle spaces.

8
Figure 2.6. XRD of MCM-48 (left) and MCM-41(12) (right).
Table 2.2. Comparison of different silica types.
MCM-41 MCM-41(12) MCM-48 SBA-15 Nano-MCM
Fumed Silica
Particle size (µm) 1-2 1-2 1-2 1-2 0.02-0.05
0.014
DFT Pore size (nm) 3.93 3.06 3.66 7.59 3.18 -
BET (m2/g) 900 1000 1100 860 600 200
External surface (m2/g)
67 35 173 55 340 200
Primary Mesopore Volume (cm3/g)
0.69 0.44 0.81 1.07 0.17 -
Total Pore Volume (cm3/g)
0.76 0.48 0.98 1.15 0.81 -
MCM-48 was synthesised according to the literature29, dissolving CTAB (8.8 g) in 80 ml
of water under slight heating. After the solution was cooled to room temperature, 10
ml of 2 M aqueous solution of NaOH was added followed by dropwise addition of 10
ml of TEOS. The mixture was stirred for 30 min before aging in an autoclave at 100 °C
for 72 h. The product was filtrated, washed with 2 l of H2O and left to dry under
ambient conditions. Calcination was carried out as reported for MCM-412. 2.0 g of
calcined MCM-48 was obtained.
SBA-15 was synthesised as follows22; 2.2 g of Pluronic P123 EO20PO70EO20, 49 ml of H2O
and 31 ml of 4 M aqueous HCl was stirred with slight heating until a clear solution was
obtained. 5 ml of TEOS was added slowly and the mixture was stirred for 20 h at room
temperature. After aging in an autoclave at 100 °C for 24 h, the product was obtained
by filtration and washed with 1 l of H2O. After drying under ambient conditions, the
material was calcined at 500 °C (with a heating rate of 1.2 °C/min) for 16 h, yielding 2.8
g of product.

9
Nano-MCM28 synthesis starts with dissolving 7.8 g of cetyltrimethylammonium
chloride and 6.0 g of Pluronic F127 EO106PO60EO106 into 90 ml of 0.8 M aqueous HCl
under stirring. TEOS (11.1 ml) was added dropwise to the clear solution and stirred for
20 h at room temperature. 11.1 ml of 25 % NH3 was slowly added and the mixture was
aged at room temperature for 44 h. The product was dried at 70 °C for 72 h and the
surfactants were removed by calcination at 600 °C (heating rate of 2 °C/min) for 3 h.
2.8 g of nano-MCM was obtained.
MCM-41(12) is synthesised according to the method reported for MCM-41 but using
1.86 g dodecyltrimethylammonium bromide as SDA. The yield was 2.0 g of calcined
material.
2.1.3 Aminopropylalkoxysilanes
Different aminopropylalkoxysilanes (APASs) were used for surface modification.
Several types of APASs with interesting properties are commercially available (Figure
2.7). The purpose of the first part of this work was to compare the grafting behaviour
of these silanes.
(3-Aminopropyl)dimethylmethoxysilane (APDMMS, Acros), (3-aminopropyl)di-
isopropylethoxysilane (APDIPES, Gelest), (3-aminopropyl)trimethoxysilane (APTMS,
Fluka), [3-(methylamino)propyl]trimethoxysilane (MAPTMS, Gelest), (3-amino-
propyl)triethoxysilane (APTES, Fluka), bis(trimethoxysilyl)propylamine (BTMSPA,
Fluka), bis(triethoxysilyl)propylamine (BTESPA, Gelest), and [3-(methylamino)
propyl]methyldimethoxysilane (MAPMDMS, Gelest) were used as received and stored
under dry conditions.

10
Figure 2.7. APASs for the functionalisation of mesoporous silica.
2.2 Surface Modification
Postsynthetic modification is a common method to prepare functionalised
mesoporous silica using the silanol groups on the surface. Approximately 3 silanol
groups per nm2 are found on the surface of mesoporous silica, depending to a certain
extent on the silica type and the calcination or extraction method.30 Figure 2.8 shows
the grafting mechanism of APTMS with self-catalysis 31.
Figure 2.8. Postsynthetic surface modification with APTMS.

11
2.2.1 Reactions in Solution
Reactions are generally conducted in an organic solvent. In a typical grafting
experiment, 500 mg of oven-dried (80 °C, 1 h) silica was dispersed in 30 ml of solvent.
After APAS addition, the suspension was refluxed for 3 h including 15 min for the
suspension to warm up to the required temperature. The suspension was allowed to
cool to room temperature for 30 min. The product was recovered by filtration, washed
with 100 ml of ethanol and oven-dried at 80 °C for 1 h.
2.2.2 Vapour Phase Reactions
In order to eliminate the effect of trace water, we have also investigated vapour phase
reactions. Vapour phase reactions were made using an atomic layer deposition (ALD)
reactor (F-120 ASM Microchemistry Ltd., Espoo, Finland). ALD was developed for
surface coating and is based on cycles of vapour phase reactions. The surface of the
substrate controls the growth of the film32. It is known that vaporised precursor
molecules are deposited in a highly reproducible and homogeneous manner on open
surface33.
Reactions were carried out at pressure of 35-50 mbar. MCM-41 (2.1 g) was preheated
at 180 °C for 2 h to remove physisorbed water. APTMS (2.5 ml) was vaporised at 100
°C and deposited onto the MCM-41 bed at a reaction temperature of 150 °C.
Physisorbed APTMS molecules were then purged from the surface with nitrogen gas. A
0.5 cm thick layer (ca. 0.3 g) from the top of the silica bed was removed and the
remaining sample was analysed.
2.2.3 Fluorescein Labelling
FITC (fluorescein 5-isothiocyanate, isomer I from Fluka, purity > 97.5 % or from Sigma-
Aldrich, purity > 90%) is a common labelling reagent for biomolecules. It has further
been used to prepare mesoporous thin films with pH-sensing abilities34. FITC forms a
thiourea linkage in the reaction with a primary or secondary amine, as shown in Figure
2.9.

Figure 2.9.
FITC coupling amplifies the PSD d
mesoporous silicas with different amino group distributi
intermolecular distance, fluorescein undergoes self
energy transfer. The Förster radius of fluorescein is 42 Å
investigate the amino group distribution on the silica surface by
(PL) spectroscopy for samples with identical FITC loadings. High intensity indicates a
uniform distribution, while low intensity suggests clustering of amine sites.
Fluorescein is a dark red brownish solid, whereas FITC is dark orange. FI
samples with low FITC loadings are bright and pale yellow. Upon increasing the
loading, the colour becomes more intense and comparable to solid FITC. High
luminescence intensity increases the brilliance of the colours. Figure 2.10 shows
examples
loadings.
Figure 2.10.
to the respective FITC loading in nmol/mg.
FITC coupling was achieved as follows
loading) of FITC dissolved in ethanol was mixed with either 100 mg or 250 mg of silica
and stirred for 24 h in the dark. The product was obtained by filtration and washed
with 50 ml of ethanol. For complete re
dispersed in 50 ml of ethanol, stirred for 20 min and washed with 50 ml of ethanol
Figure 2.9. Reaction of FITC with a surface
FITC coupling amplifies the PSD d
mesoporous silicas with different amino group distributi
intermolecular distance, fluorescein undergoes self
energy transfer. The Förster radius of fluorescein is 42 Å
investigate the amino group distribution on the silica surface by
(PL) spectroscopy for samples with identical FITC loadings. High intensity indicates a
uniform distribution, while low intensity suggests clustering of amine sites.
Fluorescein is a dark red brownish solid, whereas FITC is dark orange. FI
samples with low FITC loadings are bright and pale yellow. Upon increasing the
loading, the colour becomes more intense and comparable to solid FITC. High
luminescence intensity increases the brilliance of the colours. Figure 2.10 shows
examples of FITC coupled amino
loadings.
Figure 2.10. Different shades of yellows of FITC coupled MCMto the respective FITC loading in nmol/mg.
FITC coupling was achieved as follows
loading) of FITC dissolved in ethanol was mixed with either 100 mg or 250 mg of silica
and stirred for 24 h in the dark. The product was obtained by filtration and washed
with 50 ml of ethanol. For complete re
dispersed in 50 ml of ethanol, stirred for 20 min and washed with 50 ml of ethanol
Reaction of FITC with a surface
FITC coupling amplifies the PSD d
mesoporous silicas with different amino group distributi
intermolecular distance, fluorescein undergoes self
energy transfer. The Förster radius of fluorescein is 42 Å
investigate the amino group distribution on the silica surface by
(PL) spectroscopy for samples with identical FITC loadings. High intensity indicates a
uniform distribution, while low intensity suggests clustering of amine sites.
Fluorescein is a dark red brownish solid, whereas FITC is dark orange. FI
samples with low FITC loadings are bright and pale yellow. Upon increasing the
loading, the colour becomes more intense and comparable to solid FITC. High
luminescence intensity increases the brilliance of the colours. Figure 2.10 shows
of FITC coupled amino
Different shades of yellows of FITC coupled MCMto the respective FITC loading in nmol/mg.
FITC coupling was achieved as follows
loading) of FITC dissolved in ethanol was mixed with either 100 mg or 250 mg of silica
and stirred for 24 h in the dark. The product was obtained by filtration and washed
with 50 ml of ethanol. For complete re
dispersed in 50 ml of ethanol, stirred for 20 min and washed with 50 ml of ethanol
Reaction of FITC with a surface-grafted amino group.
FITC coupling amplifies the PSD d
mesoporous silicas with different amino group distributi
intermolecular distance, fluorescein undergoes self
energy transfer. The Förster radius of fluorescein is 42 Å
investigate the amino group distribution on the silica surface by
(PL) spectroscopy for samples with identical FITC loadings. High intensity indicates a
uniform distribution, while low intensity suggests clustering of amine sites.
Fluorescein is a dark red brownish solid, whereas FITC is dark orange. FI
samples with low FITC loadings are bright and pale yellow. Upon increasing the
loading, the colour becomes more intense and comparable to solid FITC. High
luminescence intensity increases the brilliance of the colours. Figure 2.10 shows
of FITC coupled amino-functionalised MCM
Different shades of yellows of FITC coupled MCMto the respective FITC loading in nmol/mg.
FITC coupling was achieved as follows; a 1.5
loading) of FITC dissolved in ethanol was mixed with either 100 mg or 250 mg of silica
and stirred for 24 h in the dark. The product was obtained by filtration and washed
with 50 ml of ethanol. For complete re
dispersed in 50 ml of ethanol, stirred for 20 min and washed with 50 ml of ethanol
12
grafted amino group.
FITC coupling amplifies the PSD differences between amino
mesoporous silicas with different amino group distributi
intermolecular distance, fluorescein undergoes self
energy transfer. The Förster radius of fluorescein is 42 Å
investigate the amino group distribution on the silica surface by
(PL) spectroscopy for samples with identical FITC loadings. High intensity indicates a
uniform distribution, while low intensity suggests clustering of amine sites.
Fluorescein is a dark red brownish solid, whereas FITC is dark orange. FI
samples with low FITC loadings are bright and pale yellow. Upon increasing the
loading, the colour becomes more intense and comparable to solid FITC. High
luminescence intensity increases the brilliance of the colours. Figure 2.10 shows
functionalised MCM
Different shades of yellows of FITC coupled MCM
; a 1.5-fold excess (calculated from the amino
loading) of FITC dissolved in ethanol was mixed with either 100 mg or 250 mg of silica
and stirred for 24 h in the dark. The product was obtained by filtration and washed
with 50 ml of ethanol. For complete removal of unreacted FITC, the product was
dispersed in 50 ml of ethanol, stirred for 20 min and washed with 50 ml of ethanol
grafted amino group.
ifferences between amino
mesoporous silicas with different amino group distributions.
intermolecular distance, fluorescein undergoes self-quenching due to resonance
energy transfer. The Förster radius of fluorescein is 42 Å35. This opens possibilities to
investigate the amino group distribution on the silica surface by
(PL) spectroscopy for samples with identical FITC loadings. High intensity indicates a
uniform distribution, while low intensity suggests clustering of amine sites.
Fluorescein is a dark red brownish solid, whereas FITC is dark orange. FI
samples with low FITC loadings are bright and pale yellow. Upon increasing the
loading, the colour becomes more intense and comparable to solid FITC. High
luminescence intensity increases the brilliance of the colours. Figure 2.10 shows
functionalised MCM-41 samples with different FITC
Different shades of yellows of FITC coupled MCM-41 samples. The numbers refer
fold excess (calculated from the amino
loading) of FITC dissolved in ethanol was mixed with either 100 mg or 250 mg of silica
and stirred for 24 h in the dark. The product was obtained by filtration and washed
moval of unreacted FITC, the product was
dispersed in 50 ml of ethanol, stirred for 20 min and washed with 50 ml of ethanol
ifferences between amino-functionalised
ons. Depending on the
quenching due to resonance
. This opens possibilities to
investigate the amino group distribution on the silica surface by photoluminescence
(PL) spectroscopy for samples with identical FITC loadings. High intensity indicates a
uniform distribution, while low intensity suggests clustering of amine sites.
Fluorescein is a dark red brownish solid, whereas FITC is dark orange. FI
samples with low FITC loadings are bright and pale yellow. Upon increasing the
loading, the colour becomes more intense and comparable to solid FITC. High
luminescence intensity increases the brilliance of the colours. Figure 2.10 shows
41 samples with different FITC
41 samples. The numbers refer
fold excess (calculated from the amino
loading) of FITC dissolved in ethanol was mixed with either 100 mg or 250 mg of silica
and stirred for 24 h in the dark. The product was obtained by filtration and washed
moval of unreacted FITC, the product was
dispersed in 50 ml of ethanol, stirred for 20 min and washed with 50 ml of ethanol
functionalised
Depending on the
quenching due to resonance
. This opens possibilities to
photoluminescence
(PL) spectroscopy for samples with identical FITC loadings. High intensity indicates a
uniform distribution, while low intensity suggests clustering of amine sites.
Fluorescein is a dark red brownish solid, whereas FITC is dark orange. FITC coupled
samples with low FITC loadings are bright and pale yellow. Upon increasing the
loading, the colour becomes more intense and comparable to solid FITC. High
luminescence intensity increases the brilliance of the colours. Figure 2.10 shows
41 samples with different FITC
41 samples. The numbers refer
fold excess (calculated from the amino
loading) of FITC dissolved in ethanol was mixed with either 100 mg or 250 mg of silica
and stirred for 24 h in the dark. The product was obtained by filtration and washed
moval of unreacted FITC, the product was
dispersed in 50 ml of ethanol, stirred for 20 min and washed with 50 ml of ethanol
functionalised
Depending on the
quenching due to resonance
. This opens possibilities to
photoluminescence
(PL) spectroscopy for samples with identical FITC loadings. High intensity indicates a
TC coupled
samples with low FITC loadings are bright and pale yellow. Upon increasing the
loading, the colour becomes more intense and comparable to solid FITC. High
luminescence intensity increases the brilliance of the colours. Figure 2.10 shows
41 samples with different FITC
41 samples. The numbers refer
fold excess (calculated from the amino
loading) of FITC dissolved in ethanol was mixed with either 100 mg or 250 mg of silica
and stirred for 24 h in the dark. The product was obtained by filtration and washed
moval of unreacted FITC, the product was
dispersed in 50 ml of ethanol, stirred for 20 min and washed with 50 ml of ethanol

13
after filtration. The product was oven-dried at 80 °C for 1 h. The amount of FITC used
in the reaction was calculated from the theoretical amino loading (in the case of low
functionalisation degree) or from the analysed NH2 content (for highly functionalised
samples).
The FITC loading was analysed by dissolving 15 mg of amino-grafted silica in 25 ml of a
0.2 M aqueous solution of NaOH. A clear solution was typically obtained after 3 h. The
concentration was determined by UV-vis at 490 nm. Water was employed as a
reference. An extinction coefficient of 88000 M-1/cm36 or 75000 M-1/cm was used. The
latter value was determined based on a stock solution prepared as follows: FITC was
coupled to APTMS in a 1:1 molar ratio by stirring in ethanol for 15 h at room
temperature. After removal of the ethanol by evaporation, a weighed amount of the
dry residue was dissolved in 50 ml of 0.2 M aqueous NaOH containing 50 mg of
dissolved silica.
2.3 Characterisation Techniques
Textural properties such as pore diameter, surface area and pore volume were
analysed by nitrogen sorption at 77 K. The periodic arrangement of the pores was
determined by XRD. Particle size and morphology were investigated by scanning
electron microscopy (SEM).
UV-vis was used for analysing FITC loadings after dissolving the samples in NaOH
solution. Photoluminescence (PL) spectroscopy was used for solid, dispersion and
solution samples to evaluate the amino distribution on the silica surface as well as the
amount of grafted amino groups. Infrared (IR) spectroscopy was used to analyse SDA
removal and binding modes. Qualitative analyses of surface species on silica were
made by diffuse reflectance infrared fourier transform spectroscopy (DRIFTS).
A Quantachrome Nova 2200 was used for all N2 sorption measurements. Samples
were vacuum-degassed at 80 °C for 3 or 5 h. Nitrogen sorption as well as the amino
group analysis for mesoporous silica based samples, which was specifically developed
for this work, are discussed in more detail in the next chapters.
2.3.1 N2 sorption
N2 sorption was used to determine the textural properties of the mesoporous
materials i.e. the surface area and pore size distribution. The sample has to be
degassed and weighed precisely for N
77 K. Nitrogen is adsorbed or desorbed until a predetermined relative pressure p/p
achieved. Isotherms are obtained by plotting the relati
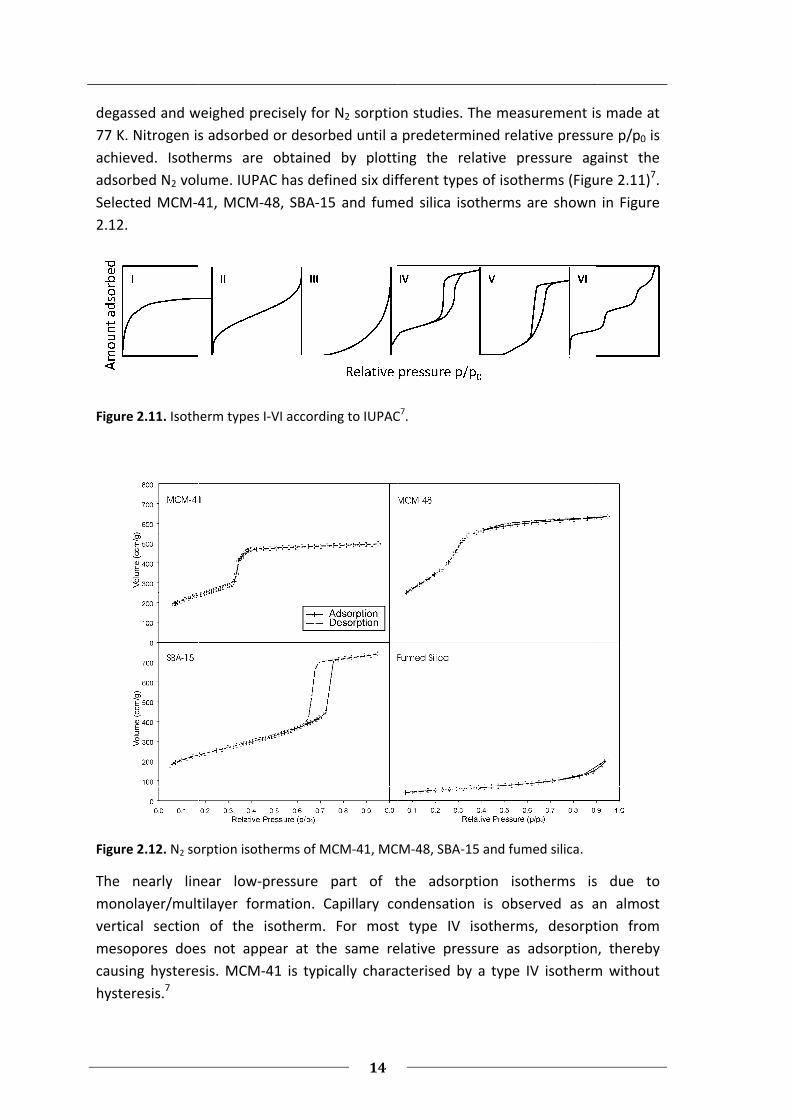
adsorbed N2 volume. IUPAC has defined six different types of isotherms (Figure 2.11)
Selected MCM-41, MCM
2.12.
Figure 2.11. Isotherm types I
Figure 2.12. N2 sorption isotherms of MCM
The nearly linear low
monolayer/multilayer formation. Capillary condensation is observed as an almost
vertical section of the isotherm. For most type IV isotherms, desorption from
mesopores does not appear at the same relative pressure as adsorption, thereby
causing hysteresis. MCM
hysteresis.7
14
degassed and weighed precisely for N2 sorption studies. The measurement is made at
77 K. Nitrogen is adsorbed or desorbed until a predetermined relative pressure p/p
achieved. Isotherms are obtained by plotting the relati
volume. IUPAC has defined six different types of isotherms (Figure 2.11)
41, MCM-48, SBA-15 and fumed silica isotherms are shown in Figure
Isotherm types I-VI according to IUPAC
sorption isotherms of MCM-41, MCM
The nearly linear low-pressure part of the adsorption isotherms is due to
ltilayer formation. Capillary condensation is observed as an almost
vertical section of the isotherm. For most type IV isotherms, desorption from
mesopores does not appear at the same relative pressure as adsorption, thereby
causing hysteresis. MCM-41 is typically characterised by a type IV isotherm without
sorption studies. The measurement is made at
77 K. Nitrogen is adsorbed or desorbed until a predetermined relative pressure p/p
achieved. Isotherms are obtained by plotting the relative pressure against the
volume. IUPAC has defined six different types of isotherms (Figure 2.11)
15 and fumed silica isotherms are shown in Figure
VI according to IUPAC7.
41, MCM-48, SBA-15 and fumed silica.
pressure part of the adsorption isotherms is due to
ltilayer formation. Capillary condensation is observed as an almost
vertical section of the isotherm. For most type IV isotherms, desorption from
mesopores does not appear at the same relative pressure as adsorption, thereby
ypically characterised by a type IV isotherm without
sorption studies. The measurement is made at
77 K. Nitrogen is adsorbed or desorbed until a predetermined relative pressure p/p0 is
ve pressure against the
volume. IUPAC has defined six different types of isotherms (Figure 2.11)7.
15 and fumed silica isotherms are shown in Figure
pressure part of the adsorption isotherms is due to
ltilayer formation. Capillary condensation is observed as an almost
vertical section of the isotherm. For most type IV isotherms, desorption from
mesopores does not appear at the same relative pressure as adsorption, thereby
ypically characterised by a type IV isotherm without
15
There are several methods to analyse the isotherms. The Brunauer-Emmett-Teller
(BET) method is the standard procedure to determine the surface area37. The method
is based on a simplified model of monolayer-multilayer adsorption. BET uses the low-
pressure part of the adsorption isotherm.
�
�������� � �� � � �����
�� ��� , (1)
where na is the amount adsorbed at the relative pressure p/p0, nam is the monolayer
capacity and C is related exponentially to the enthalpy of adsorption in the first
adsorbed layer. To calculate the BET surface area, the average molecular area (am)
occupied by a single N2 molecule (am(N2)=0.162 nm2) in the complete monolayer needs
to be known
������ � ��� ·�·��� , (2)
where L is the Avogadro constant and m is the mass of the sample. BET should not be
applied to materials containing micropores7.
Barrett, Joyner and Halenda developed a method38 (BJH) for evaluating the pore size
distribution by modifying the Kelvin equation. It is common practice to calculate the
PSD using the data from the desorption isotherm although use of adsorption data is
possible as well.
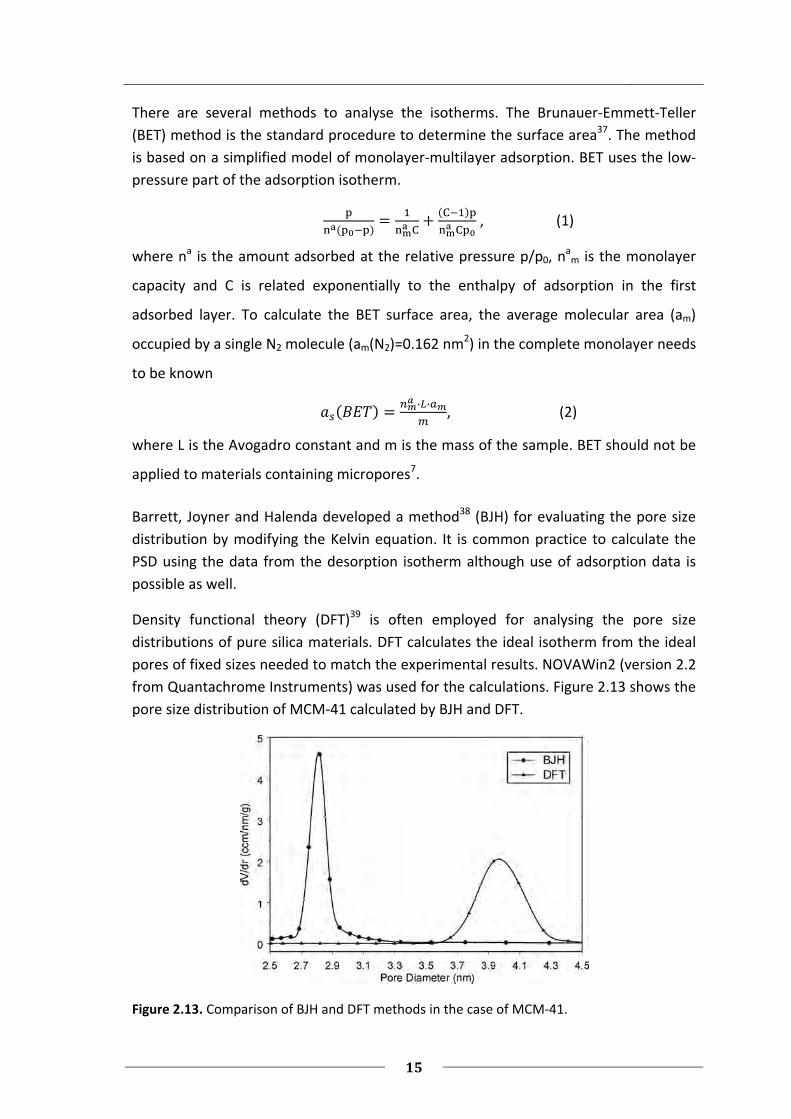
Density functional theory (DFT)39 is often employed for analysing the pore size
distributions of pure silica materials. DFT calculates the ideal isotherm from the ideal
pores of fixed sizes needed to match the experimental results. NOVAWin2 (version 2.2
from Quantachrome Instruments) was used for the calculations. Figure 2.13 shows the
pore size distribution of MCM-41 calculated by BJH and DFT.
Figure 2.13. Comparison of BJH and DFT methods in the case of MCM-41.

16
Whereas BJH underestimates the pore size39,40, DFT probably overestimates it slightly.
There is a further method to determine the average pore size, taking into account data
from XRD. This method was proposed by Kruk et al.41 and is referred to as the
“geometrical method”.
� � 1.2125��� !"#$!"#
% (3)
where d100 is the lattice spacing from the XRD data, ρ is the density of the pore walls
(=2.2 g/cm3) and Vp is the primary mesopore volume. Table 2.3 compares the different
methods used to analyse the pore size of MCM-41.
Table 2.3. Comparison of different pore size estimation methods.
Average pore size
(nm) Wall thickness
(nm)
BJH 2.8 1.7
DFT 3.9 0.6
Geom. Method 3.6 0.9
The total pore volume was calculated from the amount of nitrogen adsorbed at a
relative pressure of 0.95. The external surface area and the primary mesopore volume
(the volume of the uniform mesopores) can be determined using the αs-plot method42,
4342. This method makes the assumption that the course of adsorption in mesopores
and macropores of the sample is the same as the adsorption for a nonporous
reference material with similar surface properties. Therefore, a direct proportionality
is expected between the adsorption on both the sample and the reference material
when αs >1
& � &' � ()*�, (4)
where η2 is the slope, νp is the intercept of the linear part of the plot in the high
pressure region and
*� � +,-.���+/01,�.3
. (5)
The external surface can be calculated as follows
456 � 7%89:;,/01< /01,�.3
, (6)
where SBET,ref is the BET surface area for the reference and νref,0.4 is the adsorbed
amount for the reference at p/p0=0.442,44.
17
We have used the t-plot method to analyse the microporosity of the samples. The
experimental volume of adsorbed N2 is plotted as a function of the statistical thickness
of the adsorbed N2 layer. When a multilayer is formed unhindered on a solid surface,
the t-curve is a straight line passing through the origin. Micropores are present if the t-
curve intercepts the y-axis at a positive value.24,45
2.3.2 Analysis of Amino Groups on Mesoporous Silica
For analysing the amino group content, experiments were made with ninhydrin (Kaiser
test46), but the obtained data was unsatisfactory and difficult to reproduce. Samples
with identical amounts of amino groups but different distributions of grafting sites
(external surface vs. pore surface) produced different results in terms of the actual
amount of detected amino groups. The reason for this could be the diminished
accessibility of the sites deep inside the mesopores. This kind of problem is often
encountered when functionalised mesoporous silicas are analysed. We have
developed a method based on the fluorometric quantitation of primary amines with
fluorescamine47,48. To eliminate the effect of the grafting site distribution, the
mesoporous framework is decomposed before the addition of fluorescamine. Reaction
of the non-fluorescent fluorescamine with the now fully accessible primary amines
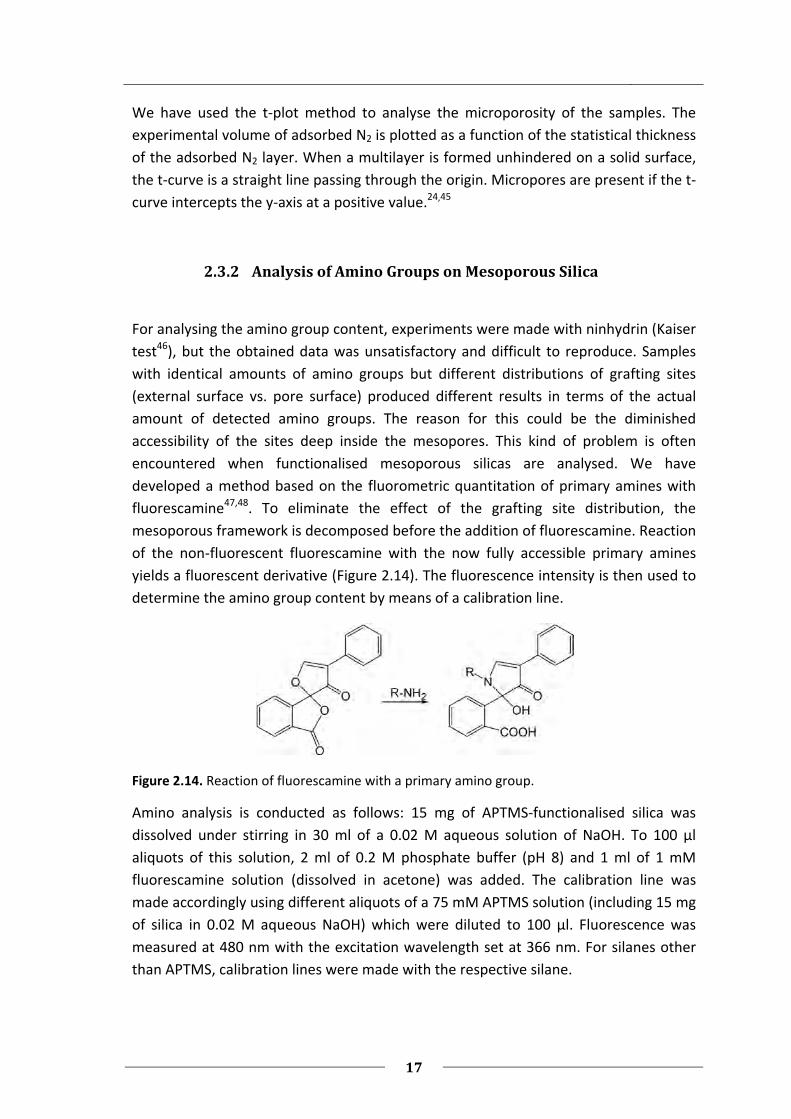
yields a fluorescent derivative (Figure 2.14). The fluorescence intensity is then used to
determine the amino group content by means of a calibration line.
Figure 2.14. Reaction of fluorescamine with a primary amino group.
Amino analysis is conducted as follows: 15 mg of APTMS-functionalised silica was
dissolved under stirring in 30 ml of a 0.02 M aqueous solution of NaOH. To 100 µl
aliquots of this solution, 2 ml of 0.2 M phosphate buffer (pH 8) and 1 ml of 1 mM
fluorescamine solution (dissolved in acetone) was added. The calibration line was
made accordingly using different aliquots of a 75 mM APTMS solution (including 15 mg
of silica in 0.02 M aqueous NaOH) which were diluted to 100 µl. Fluorescence was
measured at 480 nm with the excitation wavelength set at 366 nm. For silanes other
than APTMS, calibration lines were made with the respective silane.
18
3. Silane Distribution on MCM-41
The distribution of grafted amino groups after submonolayer deposition of APASs was
investigated. Different silanes were used and the effect of the polarity of the solvent
was studied. A summary of the results of the publication “Distribution of amino groups
on a mesoporous silica surface after submonolayer deposition of APASs from an
anhydrous liquid phase” is reported in chapter 3.1, whereas the published paper is
attached in the Appendix. Further results on the topic are presented in chapter 3.2.
3.1 Main Results
The different grafting properties of silanes were studied using APDMMS, APTMS and
BTMSPA (see Figure 2.7). Grafting the same molar amount of mono-, tris- and bis-tris-
alkoxysilanes on MCM-41 and subsequently coupling FITC yielded different FITC
loadings, generally increasing with the number of alkoxy groups per silane molecule.
Comparison of samples with the same FITC loading (20 nmol/mg) revealed clear
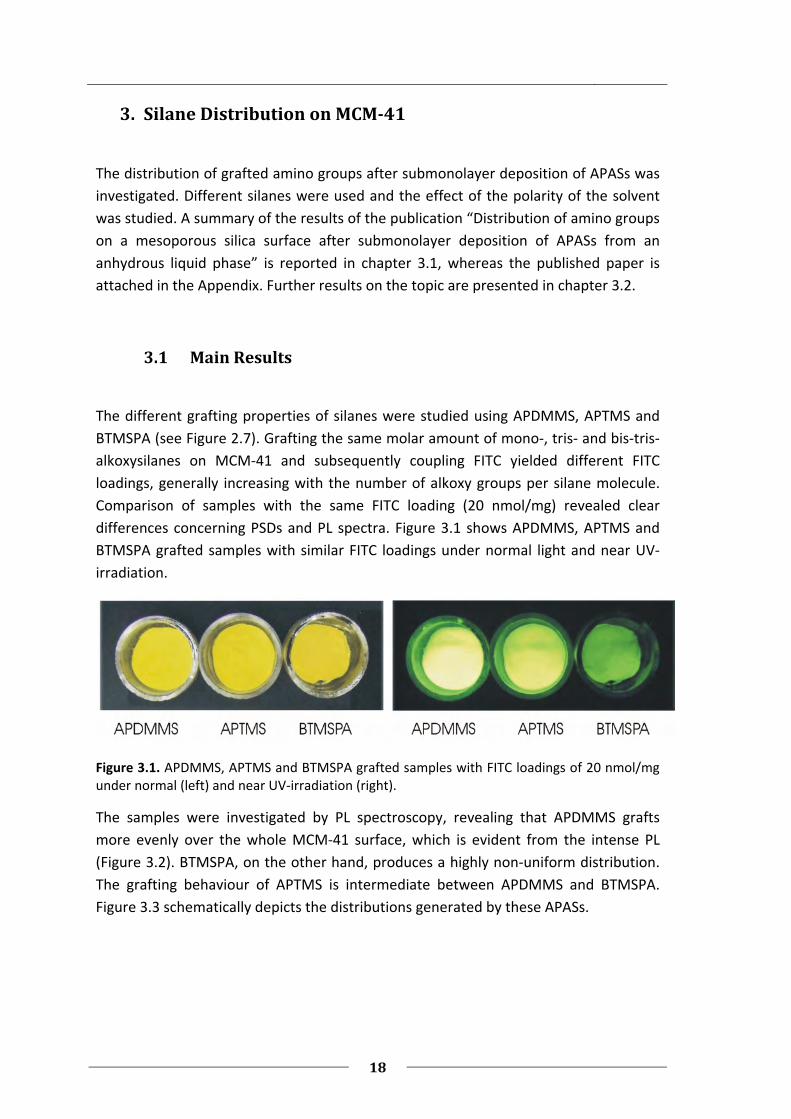
differences concerning PSDs and PL spectra. Figure 3.1 shows APDMMS, APTMS and
BTMSPA grafted samples with similar FITC loadings under normal light and near UV-
irradiation.
Figure 3.1. APDMMS, APTMS and BTMSPA grafted samples with FITC loadings of 20 nmol/mg under normal (left) and near UV-irradiation (right).
The samples were investigated by PL spectroscopy, revealing that APDMMS grafts
more evenly over the whole MCM-41 surface, which is evident from the intense PL
(Figure 3.2). BTMSPA, on the other hand, produces a highly non-uniform distribution.
The grafting behaviour of APTMS is intermediate between APDMMS and BTMSPA.
Figure 3.3 schematically depicts the distributions generated by these APASs.

19
Figure 3.2. PL spectra of APDMMS, APTMS and BTMSPA grafted MCM-41 after FITC coupling (loading 20 nmol/mg) measured as a dry powder and in toluene suspension containing triethylamine. The excitation wavelength was set at 470 nm.
Figure 3.3. Distribution of different alkoxysilanes on mesoporous silica.
Methoxysilanes are generally more reactive than the corresponding ethoxysilanes49.
The comparison of APTMS/APTES and BTMSPA/BTESPA pairs showed only minor
differences in PSD. Ethoxysilanes had a slightly higher tendency to graft into the pores
and the FITC coupled samples showed slightly stronger luminescence.
Monoalkoxysilane APDMMS was found to be the most efficient in terms of grafting to
sites deep inside the pores. However, stability tests in 0.2 M sodium phosphate buffer
(pH 7.5) showed relatively high fluorescein leaching (53 % after 24 h). Protecting the
surface siloxane bond improves the stability. Fluorescein leaching of a corresponding
APDIPES grafted sample indeed was only 18 % after 24 h.
A higher FITC coupling yield was observed for BTMSPA samples when compared to the
respective APTMS and APDMMS samples. Reaction of the secondary amine MAPTMS
was compared to BTMSPA and APTMS. PSDs are shown in Figure 3.4. Due to the strong
hydrogen-bonding interaction with the surface silanol groups, the mobility of

20
secondary amines is lower, which is why they preferentially graft to the more
accessible outer surface. As a consequence, the grafted amino groups are highly
accessible, resulting in high FITC coupling yield. Table 3.1 summarises the results.
Figure 3.4. PSDs of MCM-41 grafted with APTMS, MAPTMS and BTMSPA with FITC loadings of 20 nmol/mg.
Table 3.1. Comparison of the grafting behaviour of different APASs. Samples were refluxed in toluene containing 100 µmol of silane per g of MCM-41.
Silane Methoxy # Amino group
FITC coupling yield
Cross-linking Distribution
BTMSPA 6 Sec. 55 % High Non-uniform
(external)
MAPTMS 3 Sec. 55 % Medium Intermediate
APTMS 3 Prim. 35 % Medium Intermediate
APDMMS 1 Prim. 25 % Low Uniform
Anhydrous toluene is the most frequently used solvent in mesoporous silica
modification reactions. We have also tested THF, where the distribution was more
uniform because of the increased mobility of the silanes. FITC loadings of BTMSPA
grafted samples were similar in toluene and THF. However, a shift to smaller pore sizes
was observed when using THF.

21
3.2 Additional Experiments
3.2.1 Quenching of Coupled FITC by Methylviologen and Tb3+
Quenching is a process of non-radiative deactivation of a fluorescent species by
another species. Concentration quenching causes the remarkable difference in terms
of PL of BTMSPA and APDMMS grafted samples. Quenching by methylviologen is due
to electron transfer and quenching by Tb3+ is due to the heavy atom effect50.
In fluorescein/methylviologen electron transfer quenching, the electron donor
(fluorescein) and acceptor (methylviologen) form a complex where the excited state of
the donor is deactivated due to an electron transfer from the donor to the acceptor.
No photon emission will be detected when the complex returns to the ground state.
For estimating the amount of coupled FITC on the outer surface of MCM-41,
methylviologen (Figure 3.5) and terbium quenchers were used. Terbium is small and
fits into the pores of mesoporous MCM-41 whereas bulkier methylviologen should be
able to quench only fluorescein moieties on the outer surface.
Figure 3.5. Methylviologen.
Figure 3.6 shows the time-dependent quenching of a FITC coupled sample (6 nmol/mg
of coupled FITC) using methylviologen and terbium in n-butanol. The sample (2.5 ml)
contained 10 nmol/ml of fluorescein moieties. 400 µl of a 6 mM methylviologen
solution and a 3 mM terbium solution in n-butanol were used. Both quenchers were
very efficient.

22
Figure 3.6. Time-dependent quenching of an APDIPES grafted and FITC coupled sample in n-butanol using methylviologen and terbium. Emission was set at 520 nm and excitation at 470 nm. The quencher was added after 450 s.
According to the results of Gartmann51, the quencher has to be attached to a larger
molecule for achieving selective outer surface quenching. The best results were
obtained using the amine terminated dendrimer PAMAM-G3 in combination with
surface grafted pyrene groups.
3.2.2 Cross-linking of Aminosilanes
Cross-linking occurs in the presence of water with silanes that have more than one
alkoxy group. Mesoporous silica is hydrophilic and therefore it is difficult to exclude
trace water effects. Figure 3.7 shows the mechanism of cross-linking of surface bound
APTMS.
Figure 3.7. Cross-linking of APTMS on the surface of silica in the presence of trace water.
To obtain a uniform distribution of grafted functional groups, cross-linking is not
desirable as this can lead to pore blocking. When amino groups are too close to each
other, they are not accessible for further modification with bulky molecules such as

23
FITC. Site isolation (no cross-linking) is also required for the modification with
luminophores34, because otherwise self-quenching can occur. Luminescent
mesoporous materials are of interest for applications in the field of biological labelling
and imaging52. Islands of surface grafted functional groups are ideal for binding
biomolecules with more than one binding site per molecule53.
The effect of water in reactions between surface silanol groups and APASs is discussed
in more detail in chapters 4 and 6.

24
4. Comparison of Vapour Phase and Liquid Phase Deposition
Techniques
Postsynthetic functionalisation of MCM-41 is usually made via deposition of an
organoalkoxysilane from a solvent. Trace water is relevant even when using dry
solvents as the mesoporous silica surface adsorbs water efficiently, leading to a higher
probability of cross-linking and hydrolysis of the organoalkoxysilanes54,55.
Reactions in the vapour phase were investigated for their ability to eliminate trace
water and produce a more uniform distribution of grafted amino groups. Reactions
were made using an ALD reactor. Vapour phase experiments for comparative studies
require large batches of silica. MCM-41 synthesised at room temperature was
therefore used for all experiments in this chapter. A short summary and additional
details of the publication “A comparative study of the functionalisation of mesoporous
silica MCM-41 with 3-aminopropyltrimethoxysilane by deposition from toluene and
from the vapour phase” are reported in the following. The corresponding publication
can be found in the Appendix.
4.1 Main Results
The reaction temperature (see chapter 4.2.2 for more details) for vapour phase
deposition has to be kept at 150 °C or lower. At higher temperatures, Si-NH-C bonds
form. 2.5 ml (14 mmol) of APTMS deposited on 2.1 g of MCM-41 yielded 0.73 NH2 per
nm2 (analysed by fluorescamine reaction assuming uniform distribution). Comparing
samples deposited from the vapour phase and from solvent requires similar
functionalisation degrees, which in this case was 1.2 mmol/g. Samples were either
grafted at 150 °C (vapour phase) or under reflux (solvent).
The vapour phase deposited sample has a narrower PSD than the toluene deposited
sample. To exclude possible APTMS oligomers, freshly distilled APTMS was deposited
from toluene. The resulting PSD was slightly more uniform and narrower compared to
the sample without distillation, but not as narrow as the vapour phase sample. Figure
4.1 shows the PSDs of samples with amino loadings of 1.2 mmol/g after APTMS
deposition from the vapour phase and toluene (with and without distillation).

25
Figure 4.1. PSD of samples after deposition of APTMS from the vapour phase and from toluene. The pore diameter is given relative to the corresponding blind sample.
What is the influence of water on the reaction? To investigate this in more detail,
samples were prepared as described in chapter 2.2.1 with H2O addition and stirring for
15 min prior to APTMS grafting. There was no effect on the FITC loadings but
broadening and a shift of the PSD to large pore diameters was noticed (Figure 4.2). We
attribute this effect to cross-linking of APTMS and partial hydrolysis of the MCM-41
framework.
Figure 4.2. PSD of MCM-41 after APTMS grafting from dry toluene compared to PSDs of samples after grafting APTMS with additional water (400 ppm and 800 ppm).
The benefits of grafting from the vapour phase are considerable especially for large
scale synthesis. The possibility to functionalise without solvents is an advantage in
terms of environmental aspects.

26
4.2 Additional Experiments in the Vapour Phase
The influence of several reaction parameters was studied i.e. deposition temperature,
precursor amount, evaporation temperature, reaction time. Similar experiments have
already been conducted for silica gel56.
4.2.1 Pretreatment of MCM-41 at Different Temperatures
Modification of the surface of MCM-41 is based on reactions with the surface silanol
groups. Silica has different surface silanol species, shown in Figure 4.3. It is possible to
control these surface sites by heat treatment. At high temperatures, the relative
amount of isolated silanols increases.
Figure 4.3. Surface groups of silica57.
MCM-41 is calcined at 550 °C for complete removal of the SDA. For many silica types,
higher temperatures are applicable and pretreatment temperatures at 1000 °C have
been used. The framework of MCM-41 is, however, not stable at temperatures above
ca. 600 °C (Figure 4.4)58. Kim et al.59 have reported that, according to XRD studies,
MCM-41 is stable up to 710 °C in dry air whereas Chen et al.60 observed sufficient
stability up to 850 °C in dry conditions.
In spite of the partial decomposition of the MCM-41 framework at higher
temperatures, some experiments were made using batches treated at temperatures of
850, 700 and 550 °C. FITC loadings varied strongly depending on the pretreatment
temperature. FITC coupling produced loadings of 40, 80 and 120 nmol/mg of FITC,
respectively. This shows that at higher temperatures the amount of silanol groups is
reduced. The sample treated at 850 °C also featured the smallest pore diameter which
causes increased pore blocking upon FITC coupling.

27
Figure 4.4. PSD of MCM-41 samples treated at the indicated temperature for 16 h in air.
4.2.2 Reaction Temperature
Grafting APTMS at higher temperatures increases the tendency of a reaction between
surface silanol groups and amino groups, leading to Si-NH-C moieties, which can be
detected by DRIFTS at 3437 and 3470 cm-1 (secondary amino groups). Stretching
frequencies of the primary amino groups are observed at 3305 and 3373 cm-1. 61 Figure
4.5 shows DRIFTS measurements of samples deposited at different temperatures as
well as the corresponding FITC loadings.
Figure 4.5. DRIFTS measurements (left) and FITC loadings (right) at different reaction temperatures.

28
At high temperatures, less FITC can be coupled to the modified MCM-41 surface. Large
amounts of coupled FITC are found on samples deposited at 250 °C, despite the
decreased primary amino stretching vibrations in the corresponding DRIFT spectrum. It
is apparently possible to couple FITC to the secondary amine, although it might be
sterically hindered. Figure 4.6 shows the different reactions at low and high
temperatures. It is not possible to analyse amino loadings from these samples by
means of the fluorescamine analysis, because primary and secondary amino groups
need different references.
Figure 4.6. APTMS can react in the vapour phase at high temperatures by forming a Si-NH-C or a Si-O-Si bond61.
4.2.3 Variation of Precursor Amount
The precursor amount was varied at a reaction temperature of 150 °C. Table 4.1 shows
that the FITC loading increases slightly when 4 ml of APTMS is deposited whereas the
use of 5.5 ml leads to a decrease. The differences in the FITC loadings are considered
not significant. It is interesting to note that the amino loading stays at the same level
in all samples.

29
Table 4.1. Effect of APTMS amount on FITC and NH2 loadings.
V (APTMS)
ml
c (APTMS)
mmol/g MCM-41
FITC
nmol/mg
NH2
nmol/mg
2.5 6.7 123 1200
4.0 10.8 163 1229
5.5 14.8 146 1222
The amino loading of 1200 nmol/mg corresponds to a surface coverage of 0.73 NH2
per nm2. We can assume that maximum coverage with amino groups was obtained.
Interestingly, it is possible to achieve loadings of up to one amino group per nm2 (see
chapter 5) in solvent grafting. This is most likely due to cross-linking of the silane
precursor.
4.3 Additional Experiments in Solvent
This chapter includes experiments made in solvent for a more detailed study of water
effects as well as a comparison of mono- and trialkoxysilanes.
4.3.1 Reactions in Other Solvents (THF)
In a previous experiment (Chapter 3.1) it was noticed that grafting from THF has an
effect on the distribution of APASs over the silica surface. To achieve identical FITC
loading as in the samples deposited from toluene, 10 % more APTMS is needed. This is
due to the increased grafting into the pores when depositing from THF, leading to
partially hindered FITC coupling. At high amino functionalisation degrees (>1000
nmol/mg), even a larger excess (50 %) is required when depositing from THF.
Comparing samples with similar FITC loadings is not conclusive, as they typically
feature different amino loadings. It is important to compare samples with similar
amino loadings. Figure 4.7 compares two amino-functionalised samples with a loading
of 1650 nmol/mg, deposited from toluene and THF. The difference in primary
mesopore volume is significant. For the THF sample, the pore volume is 0.26 cm3/g,
whereas 0.32 cm3/g was measured for the toluene sample.

30
Figure 4.7. PSDs of samples deposited from toluene and THF. Each sample contains 1650 nmol/mg of grafted amino groups.
4.3.2 APDMMS vs. APTMS
Kallury et al.62 have reported that APASs with one alkoxy group form exclusively
monolayers or submonolayers. Comparing the grafting of APDMMS and freshly
distilled APTMS reveals the clearly different behaviour of these two silanes (Figure
4.8). Results are in agreement with our observations concerning samples with low
amino contents (Appendix).
Figure 4.8. Relative PSDs of RT-MCM-41 after deposition of APDMMS and freshly distilled APTMS from toluene. Amino group contents are 1200 nmol/mg.

31
4.3.3 Effects of Water Addition
Water addition to the grafting suspension has an effect on the resulting PSD. It was
investigated whether the difference is due to cross-linking of the silane or hydrolysis of
the silica framework. Samples were grafted with 1.8 mmol of APTMS per 1 g of MCM-
41 in toluene in the presence of <50 or 400 ppm of water. PSDs of samples were
measured after modification as well as after calcination at 550 °C for 16 h (Figure 4.9).
Figure 4.9. Effect of calcination on the PSDs after APTMS grafting from toluene in presence and absence of water.
After calcination of the amino modified samples, the organic species are removed,
leaving an inorganic layer on the original pore surface. Samples show a slight
difference in PSDs. As already shown in paragraph 4.1, water addition leads to a
broader PSD and larger pore diameters. Full width at half maximum after calcination
for the sample deposited without water is 0.32 nm compared to 0.34 nm for the
sample prepared with water, leading to the conclusion that hydrolysis of the silica
framework is unlikely in this case.
32
5. Pore Blocking in Postsynthetic Functionalisation
Accessibility of the pore surface binding sites is an important parameter of
postsynthetic functionalisation of mesoporous silica. Combining amino grafting and
FITC coupling, one-dimensional and three-dimensional pore systems of various pore
sizes were compared to non-porous silica.
In the following paragraph, the results of the publication “Accessibility of grafting sites
in postsynthetically modified mesoporous silica” (Appendix) are briefly discussed.
5.1 Comparison of Mesoporous Silicas
Three samples per silica type were functionalised with amounts of APTMS between
0.05 and 1.20 mmol per 1 g of silica. The samples are denoted A-x for low amino
content, whereby x identifies the silica type. B-x and C-x represent intermediate and
high amino loading, respectively. Samples were compared by how much FITC was
coupled relative to the amount of grafted amino groups, taking into account the
different surface areas of the silicas. Each data point corresponds to the average of
three independent syntheses. MCM-41(16) was compared to MCM-41(12), nano-MCM
(nanoparticles of MCM-41) and SBA-15 (one-dimensional pore system), as well as to
MCM-48 (three-dimensional pore system) and non-porous fumed silica.
Figure 5.1 shows the FITC coupling yield as a function of the amino content for each
silica type. Fumed silica exhibits rather constant FITC coupling yield, whereas MCM-
41(16) features a strong dependence on the amino content. The FITC coupling yield of
MCM-48 with similar pore diameter is slightly less dependent on the amino loading.
SBA-15, nano-MCM and MCM-41(12) have rather constant FITC coupling yields. Nano-
MCM surprises with its high overall yield, while MCM-41(12) with similar PSD produces
comparatively low yields. The reason for this is the much larger external surface area
of nano-MCM, providing abundant binding sites with high accessibility.

33
Figure 5.1. FITC coupling yield as a function of the amino group content.
Analysis of the nitrogen sorption isotherms reveals that some samples feature non-
closing isotherms at low relative pressure (Figure 5.2). This is interpreted as
bottlenecking (grafting to the pore surface close to the entrance and leaving the rest
of the pore free)63,64. Table 5.1 summarises the course of the isotherms for all
mesoporous silicas. It can be concluded that significant bottlenecking occurs in the
case of MCM-41(16) and MCM-41(12).
Figure 5.2. Isotherms of amino-functionalised MCM-41(16) before and after FITC coupling (B-MCM-41(16)). The amino content is 1930 nmol/mg and the FITC content is 450 nmol/mg.

34
Table 5.1. Course of the N2 sorption isotherms, c indicates closed, o indicates open adsorption/desorption isotherms.
A-x B-x C-x
NH2 FITC NH2 FITC NH2 FITC
MCM-41(16) c c c o c o
MCM-41(12) c c o o o o
SBA-15 c c c c c c
MCM-48 c c c c c c
Nano-MCM c c c c c c
Figure 5.3 shows the possible amino group and FITC distribution for three different
hexagonal mesoporous materials with high amino content. Trace water in the grafting
suspension increases the cross-linking tendency of APTMS and leads to increased pore
blocking in the case of silicas with small pore diameters.
Figure 5.3. Schematic NH2 and FITC distribution on MCM-41(12), MCM-41(16) and SBA-15.
A test of confinement was performed by physisorption of fluorescein on the amino
modified samples. Due to the low pKa values of neutral fluorescein (4.4) and
fluorescein monoanion (6.7), it is expected that the surface amino groups are
protonated with subsequent electrostatic interaction with fluorescein mono- and
dianions. The fluorescein loading analysed after washing (Table 5.2) showed a trend
similar to the one observed for the FITC coupled samples.
Table 5.2. Loadings (nmol/mg) of fluorescein in amino modified mesoporous silica samples.
A-x B-x C-x
MCM-41(12) 1.6 2.0 2.0
MCM-41(16) 8.3 91 184
MCM-48 4.1 48 175
SBA-15 1.2 46 82
Nano-MCM 1.5 23 40
Fumed silica 0.9 9.0 46
35
MCM-41(16) features the highest confinement, as the fluorescein molecules are
efficiently adsorbed in the channels and protected during washing. In silicas with
smaller pore diameters, the fluorescein molecules are located close to the pore
entrances or on the external surface. In the case of SBA-15 and MCM-48, removal of
fluorescein is efficient due to the large pores and three-dimensional channel system,
respectively. Interestingly, fumed silica samples achieve far higher fluorescein loadings
than MCM-41(12). In the case of MCM-41(12), fluorescein cannot enter the pores due
to pore blocking and is thus adsorbed predominantly on the outer surface. A large
fraction of the amino groups is unavailable for fluorescein adsorption as the pore
surface grafted amino groups are not accessible.
The larger pores of SBA-15 are functionalised in a more uniform fashion because of the
unhindered diffusion into the pores, whereas sterical hindrance is more evident in
MCM-41(16), especially when larger silanes are used. This problem can be overcome
by using a three-dimensional pore structure such as MCM-48.
5.2 Microporosity of SBA-15
SBA-15 contains intrawall pores, which may constitute up to 30 % of the total
porosity23. The amount and sizes of micropores depend on the synthesis conditions of
the parent SBA-15. It was mentioned above that the FITC coupling yield is rather
constant at 20-30 % for high amino loadings. Grafting a small amount (100 μmol per 1
g of SBA-15) of APTMS led to a FITC coupling yield of only 15 %. From this we can
conclude that APTMS to some extent prefers to graft into the micropores.
The amount of free micropores can be analysed by the t-plot method25. Figure 5.4
compares SBA-15 samples of different amino contents. When the linear fit of the low
pressure isotherm crosses the y-axis at zero, micropores are absent. It can be seen
that the microporosity decreases to zero at an amino content of 400 µmol/g. At an
amino content of 100 µmol/g, free micropores are still detected.

36
Figure 5.4. t-plots of samples containing 0 (open circles), 100 (black circles) and 400 µmol (black squares) of grafted amino groups per 1 g of SBA-15.
It is obvious that APTMS can fill the micropores. The question remains whether it is
possible to find bulky silanes which would not fit into these micropores. This was
investigated by grafting APTMS, APTMEES and BTESPA using a silane concentration of
400 µmol/g. Figure 5.5 shows the corresponding t-plots. APTMS is the smallest of
these silanes, therefore leading to extensive micropore filling. APTMEES reacts rather
well with the pore surface silanol groups, whereas BTESPA reacts to a larger extent
with the outer surface silanols. For this reason, the BTESPA sample has a larger pore
volume after grafting than the APTMEES sample. The formation of less than 3 surface
bonds in the absence of hydrolysis leads to bulky surface anchored species in the case
of APTMEES which ultimately results in to an unusually small pore volume.
Figure 5.5. t-plots measured from samples grafted with 400 µmol/g APTMS, APTMEES and BTESPA in toluene.
It was further studied how water affects micropore grafting. The amount of water
corresponding to one theoretical monolayer on SBA-15 was added to the suspension

37
before APTMS addition (400 µmol/g). As can be seen in Figure 5.6, some of the
micropore volume is still available.
Figure 5.6. t-plots measured from a sample synthesised with addition of water before APTMS grafting. The corresponding t-plot of the parent SBA-15 is shown for comparison.
It is reasonable to assume that the micropores stay free of grafted amino groups in
case of larger amounts of preadsorbed water, although this might lead to an
uncontrolled cross-linking of APTMS. Further experiments are required to fully
understand the relationship between micropore and mesopore grafting in SBA-15.

38
6. Studies on the Effect of Water
As shown in chapters 4 and 5, trace water can have a considerable effect on the
grafting of aminopropylalkoxysilane65,66. The grafting behaviour of APTES was
investigated in toluene, ethanol and water. All experiments were made at 80 °C and
3 h, if not indicated otherwise.
6.1 Grafting in Toluene in Presence of Water
In these experiments, water was added to the grafting suspensions in quantities
corresponding to ½ or one theoretical monolayer with respect to the BET surface area.
These samples were compared to samples which were grafted without water addition.
0.4 mmol of APTES was grafted per 1 g of MCM-41. Figure 6.1 shows that water affects
the PSDs by shifting them to slightly larger diameters. This effect might be due to the
partial hydrolysis of the MCM-41 silica framework, cross-linked silanes which do not fit
into the mesopores and/or non-uniform grafting of the silanes.
Figure 6.1. PSDs of APTES-grafted samples prepared by deposition from toluene containing various amounts of water.
The BET surface area increased with additional water (Table 6.1). Similarly, the total
pore volume and the primary mesopore volume increased. While the FITC coupling
yield decreased with increasing water content, the amino loading remained constant
(Table 6.2). A decreasing FITC coupling yield, similar pore volume and large pore sizes
with broad distribution indicates pore blocking.

39
Table 6.1. Effect of water on the BET surface area, total pore volume and primary mesopore volume when APTES was grafted from toluene.
Water
(monolayer)
SBET
(m2/g)
Vtot
(cm3/g)
Vp
(cm3/g)
0 796 0.68 0.57
½ 779 0.67 0.56
1 768 0.67 0.55
A possible reaction mechanism for APTES in toluene with trace water might be that
APTES cross-links and the resulting clusters do not fit into the pores. This mechanism
is, however, very unlikely, as the APTES cross-linking reaction does not take place in
solution, but rather on the silica surface. However, grafting to the pore entrances may
slow down the diffusion of other precursor molecules leading to an inhomogeneous
distribution of amino groups16.
6.1.1 APTES vs. APDIPES
Figure 6.2 shows the effect (which is rather minimal) of water addition on APDIPES
grafting. Contrary to APTES, PSDs of APDIPES grafted samples tend to shift to smaller
values in presence of water.
Figure 6.2. PSDs of APDIPES-grafted samples prepared by deposition from toluene containing various amounts of water.
With higher water concentrations, the FITC coupling yield is decreasing for APTES and
APDIPES (Table 6.2). Water addition does not have an influence on the amino group
loading, whereas a clear decrease of the FITC coupling yield is observed for APTES

40
grafted samples. This is a result of silane cross-linking leading to pore blocking. Due to
the single ethoxy group in APDIPES, cross-linking is not possible. In presence of water
it seems that APDIPES grafts more effectively to the pore surface leading to lower FITC
coupling yields due to sterical reasons. Water screens the interaction of amino and
surface silanol groups which ultimately leads to less hydrogen bonding between
APDIPES and the silica surface. As a consequence APDIPES has a higher mobility which
enables grafting to sites deep inside the pores. FITC loadings of APDIPES modified
samples are slightly lower compared APTES samples, which is in agreement with our
previous results (Chapter 3.1).
Table 6.2. Comparison of FITC and amino loadings (nmol/mg) of grafted (400 µmol/g MCM-41) APTES and APDIPES in toluene.
Water (monolayer)
APTES APDIPES
NH2 FITC Yield % NH2 FITC Yield %
0 357 134 37.5 380 112 29.5
½ 354 112 31.6 376 107 28.5
1 352 106 30.1 362 94 26.0
6.1.2 Silica Framework Hydrolysis
APTES was replaced with propylamine to probe the effect of the amino group in terms
of promoting the hydrolysis of the silica framework. Figure 6.3 shows the PSD of a
sample reacted with propylamine and water. The divided peak could be due to a
partial hydrolysis of the mesoporous silica framework. No amino groups were
detected by the fluorescamine analysis. Unlike APTES, propylamine does not react
with the surface silanol groups forming covalent bonds and therefore has a higher
mobility which might promote the framework hydrolysis.

41
Figure 6.3. PSDs after deposition of propylamine (400 nmol/mg) in toluene in presence of a theoretical monolayer of H2O. The blind sample was prepared according to the propylamine sample without propylamine addition.
6.1.3 Effects of Grafting vs. Time
APTES grafting in toluene at room temperature was studied as a function of time. A
reaction conducted at 80 °C instantly produces covalent surface bonds. The amino
group loading was constant after 20 minutes. Deposition at room temperature,
washing with ethanol and drying (80 °C, 1 h) yielded the same result. It has already
been reported that APASs instantly adsorb on the silica surface by forming hydrogen
bonds and electrostatically bound species67. To remove these species, the sample is
washed by stirring in 0.04 M HCl solution in ethanol for 5 min. Afterwards, the sample
was washed with ethanol and oven-dried at 80 °C for one hour.
Figures 6.4 and 6.5 show the primary mesopore volume changes and amino loading
changes vs. time with and without water addition. In absence of water, the maximum
amino loading is achieved after two hours, whereas in presence of one theoretical
monolayer of water, the maximum is achieved after 20 min. The decreasing amino
loading in the presence of water is most likely due to the slow leaching of the grafted
silanes. Table 6.3 shows the pore volume in percentage of the original value for both
experiments. After three hours, the primary mesopore volume has decreased in both
cases to 70 % of the original value.

42
Figure 6.4. Development of the primary mesopore volume (circles) and amino loading (squares) upon deposition of APTES from dry toluene.
Figure 6.5. Development of the primary mesopore volume (circles) and amino loading (squares) upon deposition of APTES from toluene in presence of one theoretical monolayer of water.
Table 6.3. Primary mesopore volume in % of the initial volume.
Time
Sample 1 min 10 min 20 min 30 min 60 min 120 min 180 min
APTES +H2O 80.8 71.7 69.2 69.9 71.0 70.4 70.4
APTES 91.3 81.4 77.8 73.4 72.9 70.0 71.3

43
6.2 Other Solvents
Depending on the solvent, the amino groups are either aggregated or distributed in a
more isolated fashion over the surface. The polarity and the dielectric constant of the
solvent have an influence on the outcome of the grafting reaction.68
Figure 6.6 shows the PSDs after APTES grafting in ethanol and in n-butanol. In the
more polar solvent, the silane is grafted more uniformly over the mesoporous silica
surface, which leads to a narrow PSD at small pore diameter. This is in agreement with
the results of a recent publication by Sharma et al.68.
Figure 6.6. Comparison of relative PSDs of APTES (400 µmol/g MCM-41) grafted in toluene, n-butanol and ethanol at 80 °C for 3 h.
6.2.1 Deposition from Ethanol
Water addition to the reaction suspension was also performed with ethanol. Contrary
to toluene, the FITC coupling yield increases with increasing water content (Table 6.4).
This is most likely due to increased grafting to the outer surface. In contrast to Sharma
et al.69, these experiments did not reveal significant differences in the amino content.

44
Table 6.4. Amino and FITC loadings (nmol/mg) of APTES grafted samples prepared in ethanol containing different amounts of water.
H2O (monolayer)
Ethanol
NH2 FITC Yield %
0 379 131 34.6
½ 366 128 35.0
1 336 126 37.5
Figure 6.7 shows the PSDs grafted in ethanol. The PSD shift from “no water” to “½
monolayer” water is much more pronounced than in toluene (see Figure 6.1). The BET
surface area as well as pore volume increase with additional water (Table 6.5), this
concludes to pore blocking as in grafting from toluene in presence of water.
Figure 6.7. PSDs of APTES-grafted samples prepared by deposition from ethanol containing various amounts of water.
Table 6.5. Effect of water on the BET surface area, total pore volume and primary mesopore volume when APTES was grafted from ethanol.
Water
(monolayer)
SBET
(m2/g)
Vtot
(cm3/g)
Vp
(cm3/g)
0 697 0.55 0.48
½ 750 0.60 0.53
1 732 0.59 0.53

45
6.2.2 Deposition from Water
Grafting was also performed in water. The amino loading (400 nmol/mg) was
comparable to the values achieved in toluene. However, the FITC loading (74
nmol/mg) was far lower than for the sample prepared in toluene (130 nmol/mg). The
difference of the PSDs was considerable when compared to the blind sample (Figure
6.8). The PSD of the blind sample was practically identical to the parent MCM-41. The
basicity of APTES might be the reason for the loss of well-defined mesoporosity.
Figure 6.8. PSD after grafting APTES (amino loading 400 nmol/mg) in water compared to the PSD of a corresponding blind sample.
To investigate potential effects of the amino group in terms of silica hydrolysis, APTES
was replaced with propylamine (Figure 6.9).
Figure 6.9. PSD after stirring in water containing 400 µmol of propylamine (per 1 g of MCM-41) and PSD of a corresponding blind sample.

46
Mesoporous silica is stable in water but the stability decreases at high pH70. The PSD of
the blind samples are similar to those of the parent MCM-41, whereas addition of a
base to the grafting suspension decomposes the mesoporous structure.
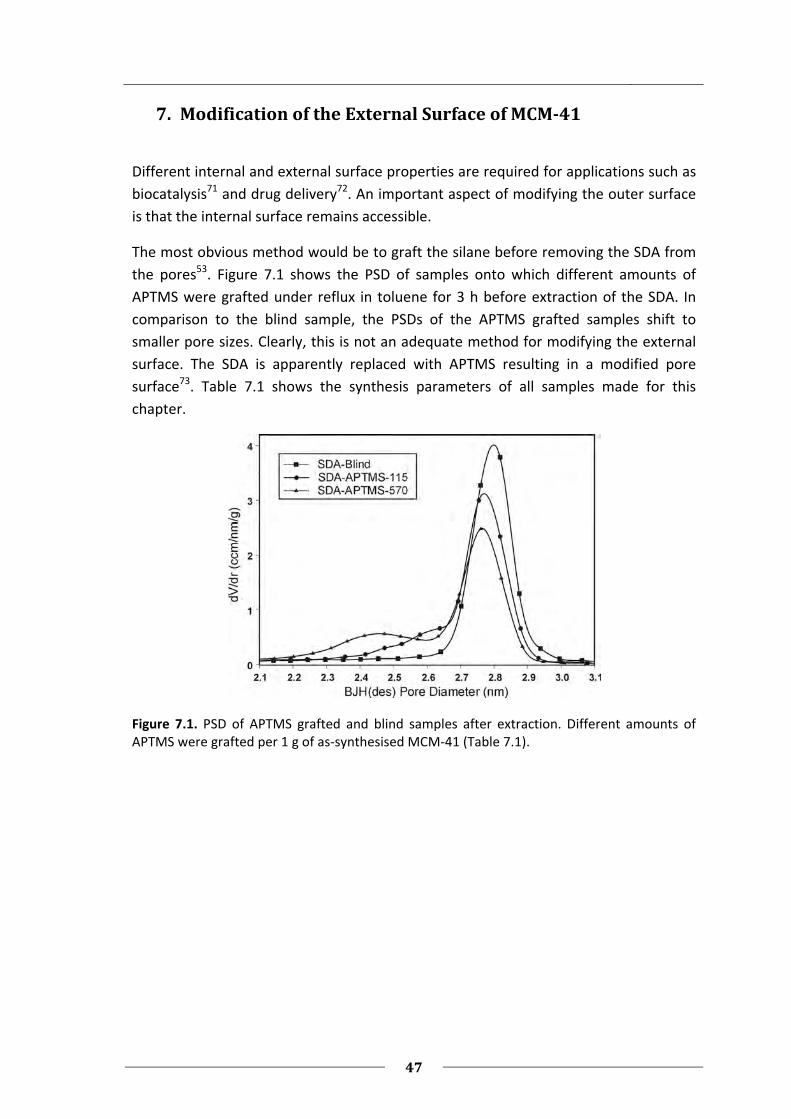
47
7. Modification of the External Surface of MCM-41
Different internal and external surface properties are required for applications such as
biocatalysis71 and drug delivery72. An important aspect of modifying the outer surface
is that the internal surface remains accessible.
The most obvious method would be to graft the silane before removing the SDA from
the pores53. Figure 7.1 shows the PSD of samples onto which different amounts of
APTMS were grafted under reflux in toluene for 3 h before extraction of the SDA. In
comparison to the blind sample, the PSDs of the APTMS grafted samples shift to
smaller pore sizes. Clearly, this is not an adequate method for modifying the external
surface. The SDA is apparently replaced with APTMS resulting in a modified pore
surface73. Table 7.1 shows the synthesis parameters of all samples made for this
chapter.
Figure 7.1. PSD of APTMS grafted and blind samples after extraction. Different amounts of APTMS were grafted per 1 g of as-synthesised MCM-41 (Table 7.1).

48
Table 7.1. Synthesis parameters of functionalised samples. Modification before (+) or after (-) SDA removal. FITC coupling to silane was made before or after MCM-41 surface modification. Pyridine was used in a concentration of 1 mmol per g of MCM-41.
Sample SDA Silane
precursor
Silane (µmol / g silica)
Reaction temperature
FITC coupling
Base
SDA-blind + - - 125 °C - -
SDA-APTMS-115 + APTMS 115 125 °C After -
SDA-APTMS-570 + APTMS 570 125 °C After -
SDA-APTMEES-212-RT + APTMEES 212 RT After -
SDA-APTMEES-212 + APTMEES 212 125 °C After -
SDA-Fi*APTMS-320-RT + APTMS 320 RT Before Pyridine
SDA-Fi*APTMS-200-RT + APTMS 200 RT Before -
MCM-Fi*APTMEES-525 - APTMEES 525 125 °C Before Pyridine
MCM-Fi*APTMEES-36 - APTMEES 36 125 °C Before Pyridine
7.1 Preliminary Experiments
APTMS seems to be too small for the method described above. Therefore, bulkier
APTMEES was grafted onto MCM-41 at room temperature and FITC was coupled after
extraction, yielding a FITC content of 14 nmol/mg for sample SDA-APTMEES-212-RT.
Figure 7.2 shows a minor difference of the PSDs before and after FITC coupling. This
would imply that FITC is coupled predominantly on the outer surface of MCM-41. We
found that there is always a small shift in PSDs when MCM-41 is stirred in ethanol
(blind “FITC coupling” reaction).
Figure 7.2. PSDs before and after FITC coupling to SDA-APTMEES-212-RT.

49
When comparing the SDA-APTMEES-212-RT sample to a corresponding blind (Figure
7.3), a shift of almost 0.1 nm is observed. Figure 7.3 also shows the PSD of sample
SDA-APTMEES-212 which was grafted at 125 °C. The FITC content of this sample is
slightly higher (20 nmol/mg).
Figure 7.3. PSDs of the FITC coupled samples SDA-APTMEES-212-RT and SDA-APTMEES-212 compared to a blind sample.
Apparently bulkier molecules than APTMEES are required. One possibility we have
investigated includes coupling of FITC to the silane before grafting. Experiments
started with coupling FITC to APTMS over night at room temperature in THF and
pyridine. Grafting was performed at room temperature onto as-synthesised MCM-41.
A FITC loading of 22 nmol/mg was obtained for SDA-Fi*APTMS-320. Reactions without
additional base and less APTMS (SDA-Fi*APTMS-200) surprisingly resulted in a slightly
higher FITC content of 25 nmol/mg. Unfortunately, the PSDs were not satisfactory due
to significant pore surface grafting. These samples did not fluoresce under UV-light
probably due to cross-linking of APTMS or dense grafting at the pore entrances.
In a further experiment, APTMS was replaced with APTMEES, which was grafted
directly to calcined MCM-41 after coupling to FITC. The FITC content for sample MCM-
Fi*APTMEES-525 was 100 nmol/mg yielding a fluorescent material. The PSD of MCM-
Fi*APTMEES-36 with a FITC content of 20 nmol/mg is shown in Figure 7.4 and
compared to the parent MCM-41. This is a promising result that forms the basis for the
experiments with protecting groups described in the following chapter.

50
Figure 7.4. MCM-Fi*APTMEES-36 compared to the respective parent MCM-41.
7.2 Experiments using FMOC*
FMOC* (2,7-di-tert-butyl-9-fluorenylmethylchloroformate) is a modification of the
widely used protecting group FMOC. Figures 7.5 and 7.6 show the reaction of FMOC*
with a primary amino group and the corresponding deprotection steps.74
Figure 7.5. Reaction of FMOC* with a primary amino group.
Figure 7.6. Deprotection of the FMOC*-protected amino group.

51
7.2.1 Experimental Details
In a first step, FMOC* (Aldrich) was dissolved in toluene or THF (containing pyridine)
and a calculated amount of silane was added. For complete coupling, the mixture was
stirred over night at room temperature or refluxed. The solution was added to the
oven-dried (1 h at 80 °C) MCM-41 and the resulting suspension was stirred at room
temperature or refluxed for 3 h. After filtering and washing with of 100 ml ethanol, the
product was oven-dried at 80 °C for one hour. Experiments were performed with as-
synthesised and calcined MCM-41.
Deprotection was conducted by using a 2 % piperidine solution in DMF and stirring at
40 °C for 4 h. The mixture was filtered and washed with 25 ml of DMF and 50 ml of
ethanol. The sample was oven-dried (80 °C, 1 h). 75
In the case of as-synthesised MCM-41, the SDA was removed in a final step by stirring
in a solution of NH4NO3 (1.0 g) in 100 ml of ethanol at 60 °C for 20 min. After filtration
and washing with ethanol, the procedure was repeated one more time for complete
extraction. 76
The degree of deprotection was analysed by dissolving 50 mg of the sample in 15 ml of
a 0.33 M aqueous NaOH solution. The FMOC* loading was calculated from a UV-vis
measurement at 270 nm (10 000 M-1/cm)77. Water was used as reference.
7.2.2 Results
It is essential to work with a certain concentration of piperidine in the deprotection
reaction. After finding a report by Cheng and Landry75, progress was made towards
more efficient deprotection.
We have found that it is advantageous to deprotect before removing the SDA,
otherwise incomplete extraction is obtained. Samples which were extracted before
deprotection were indeed found to have smaller pores.
The most promising results were obtained as follows: APTMS (570 µmol/g MCM-41)
was coupled to FMOC* (400 µmol) in toluene over night at room temperature.
Grafting to as-synthesised MCM-41 was performed at under reflux in toluene for 3 h.
The sample was first deprotected, then extracted followed by FITC coupling resulting
in a loading of 40 nmol/mg. Figure 7.7 shows the PSD of the sample before and after
FITC coupling.

52
Figure 7.7. APTMS was protected with FMOC* and grafted to as-synthtesised MCM-41. The SDA was extracted after deprotection. Amino groups were subsequently labelled with FITC (40 nmol/mg of coupled FITC). A corresponding blind sample is shown for comparison.
It is worth mentioning that FMOC* can directly react with the MCM-41 surface in
toluene and THF suspension under reflux as well as at room temperature. FMOC* and
silane therefore have to be coupled in a 1:1 molar ratio.
7.3 Discussion
Selective external surface functionalisation is a challenging task. Our best results were
obtained with APTMEES which was coupled to FITC before grafting.
FMOC* is apparently not bulky enough to avoid penetration into the 3.5 nm pores of
MCM-41. One possibility might be to use BTESPA instead of APTMEES to increase the
reactivity of the precursor.

53
8. Summary and Outlook
The main goal of this work was the investigation of postsynthetic methods for the
functionalisation of mesoporous silicas with amino groups. A convenient method for
the synthesis of MCM-41 including scaling possibility to large batches and aging at
room temperature was developed. Furthermore, the devised mesoporous silica
synthesis procedure comparable to the conventional MCM-41 procedures allows the
reduction of the resulting pore diameter (MCM-41(12), 3.1 nm).
The outcome of grafting reactions of different aminopropylalkoxysilanes depends on
the nature of the amino group (primary or secondary) and the number of alkoxy
substituents. Monoalkoxysilanes graft uniformly over the surface, whereas dipodal
trialkoxysilanes react preferably with sites on the external surface and at the pore
entrances. Secondary amines have a higher tendency to graft to the external surface
as compared to their primary analogues. The modification of silica surfaces is usually
made in a solvent. An important aspect in grafting reactions is the solvent polarity.
Increasing the polarity minimises clustering and the distribution becomes more
uniform as the APAS molecules are able to reach less accessible sites on the internal
surface. FITC coupling to the anchored amino groups was used for analysis, as it
amplifies the pore size changes of differently modified samples.
A new method for analysing amino groups grafted on the surface of mesoporous silica
was developed. It can be applied to a wide range of grafting densities in the case of
samples prepared by postsynthetic modification, as well as to co-condensed samples.
The advantage of this method is that all amino groups, including those in the pore
walls, are analysed. The method is based on the reaction of fluorescamine with the
dissolved amino-functionalised samples.
Trace water has an effect on the outcome of grafting reactions. Aminopropyl-
monoalkoxysilanes have an increasing tendency to graft into the pores, whereas
aminopropyltrialkoxysilanes cause significant pore blocking as a consequence of cross-
linking.
Functionalisation of the silica surface via deposition from the vapour phase was
compared to the conventional solvent based techniques. The use of vapour phase
deposition eliminates trace water-induced silane cross-linking and subsequent pore
blocking. The vapour phase deposition method is of interest due to both economical
and ecological reasons, especially when large scale synthesis is concerned, as it avoids
the use of dry solvents.
One-dimensional channel systems with large pore diameter (SBA-15) or small (MCM-
41, MCM-41(12)) pore diameters and three-dimensional channel systems (MCM-48)

54
behave differently in the grafting reactions with APASs and subsequent FITC labelling.
The non-uniform distribution of amino groups obtained after postsynthetic
functionalisation with APTMS promotes pore blocking upon FITC coupling. In terms of
providing accessible pore surface sites, a three-dimensional channel system is superior
to a one-dimensional channel system with similar pore diameter. High amino contents
increase the probability of bottleneck formation by coupling of FITC to densely grafted
amino groups located at the pore entrances. Micropore grafting of APTMS was
observed in SBA-15.
Selective external surface functionalisation is a challenging task. It was found that
coupling a protecting group (FITC or FMOC*) to the APAS before grafting results in a
higher selectivity for the outer surface. Deprotection of the anchored amines is,
however, not straightforward. The best results were obtained with APTMEES which
were coupled to FITC before grafting. FMOC*, on the other hand, is apparently not
bulky enough to avoid penetration into the pores of MCM-41. One possibility might be
to use BTESPA to increase the reactivity of the protected precursor.

55
9. References
1 Kresge, C. T., Leonowicz, M. E., Roth, W. J., Vartuli, J. C., Beck, J. S., Nature 359
(1992) 710.
2 Galarneau, A., Iapichella, J., Bonhomme, K., Di Renzo, F., Kooyman, P., Terasaki, O., Fajula, F., Adv. Funct. Mater. 16 (2006) 1657.
3 Vallet-Regi, M., Balas, F., Arcos, D., Angew. Chem. Int. Ed. 46 (2007) 7548.
4 Wang, Q., Shantz, D. F., J. Solid State Chem. 181 (2008) 1659.
5 Gabaldon, J. P., Bore, M., Datye, A. K., Top. Catal. 44 (2007) 253.
6 Fryxell, G. F., Mattigod, S. V., Lin, Y., Wu, H., Fiskum, S., Parker, K., Zheng, F., Yantasee, W., Zemanian, T. S., Addleman, R. S., Liu, J., Kemner, K., Kelly, S., Feng, X., J. Mater. Chem 17 (2007) 2863.
7 Sing, K. S. W., Everett, D. H., Haul, R. H. W., Moscou, L., Pierotti, R. A., Rouquérol, J., Siemieniewska, T., Pure Appl. Chem. 57 (1985) 603.
8 Beck, J. S., Vartuli, J. C., Roth, W. J., Leonowicz, M. E., Kresge, C. T., Schmitt, K. D., Chu, C. T.-W., Olson, D. H., Sheppard, E. W., McCullen, S. B., Higgins, J. B., Schlenker, J. L., J. Am. Chem. Soc. 114 (1992) 10834.
9 Wan. Y., Zhao, D., Chem. Rev. 107 (2007) 2821.
10 Bois, L., Bonhomme, A., Ribes. A., Pais, B., Raffin, G., Tessier, F., Colloids Surf. A 221 (2003) 221.
11 French, S. A., Sokol, A. A., Catlow, C. R. A., Kornherr, A., Zifferer G., Chem.
Commun. (2004) 20.
12 Yates, E. A., Jones, M. O., Clarke, C. E., Powell, A. K., Johnson, S. R., Porch, A., Edwards, P. P., Turnbull, J. E., J. Mater. Chem. 13 (2003) 2061.
13 Jaroniec, C. P., Kruk, M., Jaroniec, M., Sayari, A., J. Phys. Chem. B 102 (1998) 5503.
14 O`Gara, J. E., Walsh, D. P., Phoebe Jr., C. H., Alden, B. A., Bouvier, S. P., Iraneta, P. C., Capparella, M., Walter, T. H., LC-GC 19 (2001) 632.
15 Yokoi, T., Yoshitake, H., Tatsumi, T., J. Mater. Chem. 14 (2004) 951.
16 Lim. M. H., Stein, A., Chem. Mater. 11 (1999) 3285.
17 Barbe, C., Barlett, J., Kong, L., Finnie, K., Lin, H. Q., Larkin, M., Calleja, S., Bush, A., Calleja, G., Adv. Mater. 16 (2004) 1959.

56
18 Lelong, G., Bhattacharyya, S., Kline, S., Cacciaguerra, T., Conzalez, M. A., Saboungi, M.-L., J. Phys. Chem. C 112 (208) 10674.
19 Muñoz, B., Rámila, A., Pérez-Pariente, J., Díaz, I., Vallet-Regí, M., Chem. Mater. 15 (2003) 500.
20 Song, S. W., Hidajat, K., Kawi, S., Langmuir 21 (2005) 9568.
21 Brühwiler, D., Frei, H., J. Phys. Chem. B 107 (2003) 8547.
22 Zhao, D., Huo, Q., Feng, J., Chmelka, B. F., Stucky, G. D., J. Am. Chem. Soc. 120 (1998) 6024.
23 Ravikovitch, P. I., Neimark, A. V., J. Phys. Chem. B 105 (2001) 6817.
24 Galarneau, A., Cambon, H., Di Renzo, F., Fajula, F., Langmuir 17 (2001) 8328.
25 Galarneau, A., Cambon, H., Di Renzo, F., Ryoo, R., Choi, M., Fajula, F. New J.
Chem. 27 (2003) 73.
26 Jun, S., Joo, S. H., Ryoo, R,; Kruk, M., Jaroniec, M., Liu, Z., Ohsuna, T., Terasaki, O., J. Am. Chem. Soc. 122 (2000) 10712.
27 Ying, J. Y., Mehnert, C. P., Wong, M. S., Angew. Chem. Int. Ed. 38 (1999) 56.
28 Suzuki, K., Ikari, K., Imai, H., J. Am. Chem. Soc. 126 (2004) 462.
29 Xu, J., Luan, Z., He, H., Zhou, W., Kevan, L., Chem. Mater. 10 (1998) 3690.
30 Shenderovich, I. G., Buntkowsky, G., Schreiber, A., Gedat, E., Sharif, S., Albrecht, J., Golubev, N. S., Findenegg, G. H., Limbach, H.-H., J. Phys. Chem. B 107 (2003) 11924.
31 Vrancken, K. C., Possemiers, K., Van Der Voort, P., Vansant, E. F., Colloids. Surf.
A 98 (1995) 235.
32 Suntola, T., Antson, J., U.S. Patent No 4 058 430 (1977).
33 Ek, S., Iiskola, E. I., Niinistö, L., Langmuir 19 (2003) 3461.
34 Wirnsberger, G., Scott, B. J., Stucky, G. D., Chem. Commun. (2001) 119.
35 Kawski, A., Photochem. Photobiol. 38 (1983) 487.
36 Martin, M. M., Lindquist, L., J. Lumin. 10 (1975) 381.
37 Brunauer, S., Emmett, P. H., Teller, E., J. Am. Chem. Soc. 60 (1938) 309.
38 Barrett, E. P., Joyner, L. G., Halenda, P. P., J. Am. Chem. Soc. 73 (1951) 373.
39 Ravikovitch, P. I., Dommhanaill, S. C. O., Neimark, A. V., Schüth, F., Unger, K. K., Langmuir, 11 (1995) 4765.
57
40 Lastoskie, C., Gubbins, K. E., Quirke, N., J. Phys. Chem. 97 (1993) 4786.
41 Kruk, M., Jaroniec, M., Sayari, A., J. Phys. Chem. B 101 (1997) 583.
42 Kruk, M., Jaroniec, M., Ryoo, R., Kim, J. M., Microporous Mater. 12 (1997) 93.
43 Sayari, A., Liu, P., Kruk, M., Jaroniec, M., Chem. Mater. 9 (1997) 2499.
44 Rouquerol, F., Rouquerol, J., Sing, K. S. W., Adsorption by Powders & Porous solids, Academic Press, London 1999.
45 Lippens, B., de Boer, J. H., J. Catal 4 (1965) 319.
46 Kaiser, E., Colescott, R. L., Bossinger, C. D., Cook, P. I., Anal. Biochem. 34 (1970) 595.
47 Weigele, M., DeBernando, S. L., Tengi, J. P., Leimgruber, W., J. Am. Chem. Soc. 94 (1972) 5927.
48 Udenfriend, S., Stein, S., Böhlen, P., Dairman, W., Leimgruber, W., Weigele, M., Science 178 (1972) 871.
49 Brand, M., Frings, A., Jenkner, P., Lehnert, R., Metternich, H. J., Monkiewicz, J., Schram, J. Z., Naturforsch. B: Chem Sci. 54 (1999) 155.
50 Suppan, P., Chemistry and Light, the Royal Society of Chemistry, Cambridge 1994.
51 Gartmann, N., Master thesis, Mesoporous Hybrid Materials: Tools for the Analysis of Functional Group Distributions, Zürich 2008.
52 Liu, H.-M., Wu, S.-H., Lu, C.-W., Yao, M., Hsiao, J.-K., Hung, Y., Lin, Y.-S., Mou, C.-Y., Yang, C.-S., Huang, D.-M., Chen, Y.-C., Small 4 (2008) 619.
53 Mal, N. K., Fujiwara, M., Tanaka, Y., Nature 421 (2003) 350.
54 Kanan, S. M., Tze, W. T. Y, Tripp, C. P., Langmuir 18 (2002) 6623.
55 Tripp, C. P., Hair, M. L., Langmuir 11 (1995) 1215.
56 Ek, S., Iiskola, E. I., Niinistö, L., Vaittinen, J., Pakkanen, T., Root, A., J. Phys.
Chem. B 108 (2004) 11454.
57 Zhuravlev, L. T., Colloids Surf. A 173 (2000) 1.
58 Cassiers, K., Linssen, T., Mathieu, M., Benjelloun, M., Schrijnemakers, K., Van Der Voort, P., Cool, P., Vansant, E. F., Chem. Mater. 14 (2002) 2317.
59 Kim, J. M., Kwak, J. H., Jun, S., Ryoo, R., J. Phys. Chem. 99 (1995) 16742.
60 Chen, C.-Y., Li, H.-X., Davis, M. E., Microporous Mater. 2 (1993) 17.

58
61 Ek, S., Iiskola, E. I., Niinistö, L., Vaittinen, J., Pakkanen, T. T., Keränen, J., Auroux, A., Langmuir 19 (2003) 10601.
62 Kallury, K. M. R., Macdonald, P. M., Thompson, M., Langmuir 10 (1994) 492.
63 Burleigh, M. C., Markowitz, M. A., Spector, M. S., Gaber, B. P., J. Phys. Chem. B 105 (2001) 9935.
64 Li, C., Yang, J., Shi, X., Liu, J., Yang, Q., Microporous Mesoporous Mater. 98 (2007) 220.
65 Melde, B. J., Schroden, R. C., Stein, A., Adv. Mater. 12 (2000) 1403.
66 Bellocq, N., Abramson, S., Lasperas, M., Brunel, D., Moreau, P., Tetrahedron:
Asymmetry 10 (1999) 3229.
67 Engelhardt, H., Orth, P., J. Liq. Chromatogr. 10 (1987) 1999.
68 Sharma, K. K., Anan, A., Buckley, R. P., Ouellette, W., Asefa, T., J. Am. Chem.
Soc. 130 (2008) 218.
69 Sharma, K. K., Asefa, T., Angew. Chem. Int. Ed. 46 (2007) 2879.
70 Corma, A., Chem. Rev. 97 (1999) 2373.
71 Bornscheuer, U. T., Angew. Chem. Int. Ed. 42 (2003) 3336.
72 Lai., C.-Y., Trewyn, B. G., Jeftinija, D. M., Jeftinija, K., Xu, S., Jeftinija, S., Lin, V. S.-Y., J. Am. Chem. Soc. 125 (2003) 4451.
73 Antochshuk, V., Jaroniec, M., Chem. Mater. 12 (2000) 2496.
74 Stigers, K. D., Koutroulis, M. R., Chung, D. M., Nowick, J. S., J. Org. Chem. 65 (2000) 3858.
75 Cheng, K., Landry, C. C., J. Am. Chem. Soc. 129 (2007) 9674.
76 Lang, N., Tuel, A., Chem. Mater. 16 (2004) 1961.
77 Neuenschwander, M., Vögeli, R., Fahrni, H.-P., Lehmann, H., Ruder, J.-P., Helv.
Chim. Acta 60 (1977) 1073.

59
Appendix
• Distribution of Amino Groups on a Mesoporous Silica Surface after
Submonolayer Deposition of Aminopropylsilanes from an Anhydous Liquid
Phase
H. Salmio, D. Brühwiler, J. Phys. Chem. C 111 (2007) 923-929.
• A Comparative Study of the Functionalization of Mesoporous Silica MCM-41 by
Deposition of 3-Aminopropyltrimethoxysilane from Toluene and from the
Vapor Phase
H. Ritter, M. Nieminen, M. Karppinen, D. Brühwiler, Microporous Mesoporous
Mater., in press.
• Accessibility of Grafting Sites in Postsynthetically Modified Mesoporous Silica
H. Ritter, D. Brühwiler, submitted.

60
Distribution of amino groups on a mesoporous silica
surface after submonolayer deposition of
aminopropylsilanes from an anhydrous liquid phase
Hanna Salmio and Dominik Brühwiler*
Institute of Inorganic Chemistry, University of Zurich, Winterthurerstrasse 190,
8057 Zurich, Switzerland
Abstract. The reaction of mesoporous silica MCM-41 with various aminopropylsilanes
was investigated. The distribution of grafted amino groups after submonolayer
deposition from anhydrous toluene was probed by fluorescein labeling in conjunction
with photoluminescence spectroscopy and pore size analysis. Monoalkoxysilanes
generally distributed more uniformly than monopodal and dipodal trialkoxysilanes.
The outcome of the grafting reaction additionally depended on the nature of the
amino group. Secondary amines grafted more efficiently than their primary analogues.
Further, it could be shown that the polarity of the solvent considerably affects the
distribution of the amino groups in the case of strongly interacting aminopropylsilanes.
Keywords. MCM-41, grafting, silane, site isolation, clustering, cross-linking
*Corresponding Author. E-mail: [email protected]
Introduction
Since the discovery of the remarkable
features of the M41S mesoporous silica
family,1 considerable effort has been
directed towards functionalization of
these materials. Catalysis2, optical
sensing3, photonics4, adsorption5, and
drug delivery6 are fields in which
functionalized mesoporous silica opens
new prospects. For many potential
applications based on mesoporous silica
a homogeneous distribution of site
isolated functional groups is desired. In
this perspective, co-condensation would
be the method of choice, as
postsynthetic modification often leads
to preferential functionalization of the
most readily accessible sites (external
surface and pore entrances).7 However,
postsynthetic grafting provides various
advantages: Through passivation of the
external surface, the internal surface can
be selectively functionalized (and vice
versa).8 High densities of functional
groups are achievable without
unfavorable effects on the stability and
the periodic ordering of the mesoporous
silica framework. Site isolation can be
obtained even for dense grafting by a
molecular spacer approach.9 Control of
the pore size and particle morphology is

61
straightforward, and hierarchic
structures can be produced by post-
synthetic molecular imprinting.10
Aminopropylsilanes are among the
most widely used precursors for the
modification of silica surfaces. In
anhydrous medium, reaction with
surface hydroxyl groups proceeds via
exchange of the silane alkoxy group
(usually methoxy or ethoxy) for the
silanol oxygen with concurrent loss of
the corresponding alcohol. It is shown in
this study, that the choice of the
aminopropylsilane precursor is essential
for controlling the amount, the
distribution, and the stability of the
grafted aminopropyl moieties on the
mesoporous silica surface.
Experimental Section
Synthesis of MCM-41. Purely
siliceous mesoporous silica MCM-41 was
synthesized as follows:11 An amount of
2.20 g of CTAB (hexadecyltrimethyl-
ammonium bromide, Fluka) was
dissolved under slight warming in a
mixture of 52 mL of distilled H2O and 24
mL of aqueous ammonia (28 %, Fluka).
After cooling to room temperature, 10
mL of TEOS (tetraethoxysilane, Fluka)
was slowly added under stirring to the
clear solution and the resulting gel was
further stirred for 3 h at room
temperature. The mixture was then
transferred to a Teflon lined autoclave
and heated at 110 °C for 48 h. The
product was obtained by filtration,
washed with copious amounts of
distilled H2O (at least 800 mL) and dried
in air at room temperature. The
template was removed by first heating
at 300 °C for 2 h and subsequent
calcination in air at 550 °C for 16 h.
Heating rates of approximately 2 °C/min
were applied.
Grafting of Aminopropyl-
silanes. (3-aminopropyl)dimethyl-
methoxysilane (APDMMS, Acros), (3-
aminopropyl)di-isopropylethoxysilane
(APDIPES, Gelest), (3-aminopropyl)-
trimethoxysilane (APTMS, Fluka), [3-
(methylamino)-propyl]trimethoxysilane
(MAPTMS, Gelest), (3-aminopropyl)-
triethoxysilane (APTES, Fluka),
bis(trimethoxysilyl)propylamine
(BTMSPA, Fluka), bis(tri-ethoxysilyl)-
propylamine (BTESPA, Gelest), and [3-
(methylamino)propyl]methyldimethoxy-
silane (MAPMDMS, Gelest) were used as
received. Polymerization of the liquid
amino-propylsilanes is initiated by the
presence of water, leading to hydrolysis
and cross-linking. All aminopropylsilanes
were therefore kept under inert
atmosphere. Experiments with freshly
vacuum distilled aminopropylsilanes
showed that polymerization was not a
concern under our storage conditions. In
a typical grafting experiment, an amount
of 500 mg of calcined MCM-41 was
oven-dried at 80 °C for 1 h and dispersed
in 30 mL of dry toluene (puriss., H2O <
0.005 %). After the addition of a
calculated amount of a specific
aminopropylsilane, the suspension was
heated to 125 °C over a period of 15
min, refluxed for 3 h and subsequently
allowed to cool for 30 min. The
functionalized product was recovered by

62
filtration, washed with 100 mL of
ethanol, and oven-dried at 80 °C for 1 h.
Fluorescein Labeling. An amount
of 250 mg of amino-functionalized
mesoporous silica was dispersed in 25
mL of absolute ethanol containing an at
least 1.5-fold excess of FITC (fluorescein
5-isothiocyanate, isomer I, Fluka). The
amount of FITC was calculated assuming
quantitative grafting of the respective
aminopropylsilane (15 mg of FITC for a
batch prepared with a theoretical
aminopropylsilane loading of 100 µmol
per gram of MCM-41). After stirring the
suspension in the dark at room
temperature for 24 h, the colored
product was recovered by filtration and
washed with 50 mL of ethanol.
Prolongation of the FITC coupling time
did not lead to further fluorescein
binding, indicating that complete
labeling of amino groups is obtained
after 24 h. To ensure removal of
unreacted FITC, the product was
redispersed in 50 mL of ethanol and
stirred for 15 min at room temperature.
After filtration and washing with 50 mL
of ethanol, the product was finally oven-
dried at 80 °C for 1 h. To determine the
amount of coupled fluorescein, a
weighed quantity (typically 15 to 30 mg)
of the product was dispersed in 25 mL of
a 0.2 M aqueous solution of NaOH and
stirred for 3 h at room temperature.
After dissolution of the silica, the clear
solution was diluted with water and the
fluorescein concentration was
determined by measuring the UV-Vis
absorption spectrum (λmax = 490 nm,
εmax = 88'000 Lmol-1cm-1).
Characterization. Powder X-ray
diffraction (XRD) measurements were
performed on a Siemens D-500
diffractometer with CuKα radiation, a 2θ
step size of 0.05°, and a counting time of
3 s per step. Photoluminescence (PL)
spectra were recorded with a Perkin
Elmer LS50B spectrofluorometer
equipped with a front surface accessory
for the measurement of powdered
samples. Nitrogen sorption isotherms
were collected at 77 K using a
Quantachrome NOVA2200 surface area
and pore size analyzer. Samples were
vacuum-degassed at 353 K for 5 h. The
total surface area was obtained using
the standard BET method for adsorption
data in a relative pressure range from
0.05 to 0.20.12 The total pore volume
was estimated from the amount of
nitrogen adsorbed at a relative pressure
of 0.95. The primary mesopore volume
Vp (the volume of the uniform
mesopores) was determined by the αS-
plot method.13 Mesopore size
distributions were evaluated from the
desorption branches of the nitrogen
isotherms using the BJH method and are
plotted relative to the maximum pore
diameter of the corresponding parent
MCM-41.14 All samples exhibited type IV
isotherms and condensation in primary
mesopores was not accompanied by
hysteresis. It should be noted that the
standard BJH method underestimates
the absolute pore size. In order to obtain
a more reliable estimate, the method
proposed by Kruk et al. was applied:15
1/ 2
1001.2125
1
p
p
Vw d
V
ρρ
= ⋅ +
(1)

from XRD data. The density of the pore
walls
density of amorphous silica (2.2 g/cm
Results and Discussion
submonolayer coverages requires the
evaluation of subtle variations in the
pore size distribution (PSD). It is
therefore cr
changes under the applied reaction
conditions without the addition of an
aminopropylsilane. We observed a
minor shift of the PSD to smaller pore
size up to the point of FITC coupling
(refluxing in toluene, washing, drying),
and a similar shift under FITC coupling
conditions (stirring for 24 h in an
ethanolic solution of FITC, washing,
drying). No fluorescein was detected in
the samples at this stage, indicating that
binding of FITC only occurs on
aminopropylsilane modified MCM
The total shift of the PSD of the blank
samples was typically 0.04 nm
(diameter), with the distribution
retaining its width and symmetrical
shape. This minor change is attributed to
a slight esterification of the surface
during the washing treatments
ethanol and subsequent drying.
investigated the reaction of various
commercial aminopropylsilanes with
calcined MCM
and abbreviations are given in Figure 1.
The pore diameter of our parent MCM
41 w
The lattice spacing d
from XRD data. The density of the pore
walls ρ was set to be equal to the
density of amorphous silica (2.2 g/cm
Results and Discussion
Blank Test.
submonolayer coverages requires the
evaluation of subtle variations in the
pore size distribution (PSD). It is
therefore crucial to analyze the pore size
changes under the applied reaction
conditions without the addition of an
aminopropylsilane. We observed a
minor shift of the PSD to smaller pore
size up to the point of FITC coupling
(refluxing in toluene, washing, drying),
nd a similar shift under FITC coupling
conditions (stirring for 24 h in an
ethanolic solution of FITC, washing,
drying). No fluorescein was detected in
the samples at this stage, indicating that
binding of FITC only occurs on
aminopropylsilane modified MCM
The total shift of the PSD of the blank
samples was typically 0.04 nm
(diameter), with the distribution
retaining its width and symmetrical
shape. This minor change is attributed to
a slight esterification of the surface
during the washing treatments
ethanol and subsequent drying.
General Tendencies
investigated the reaction of various
commercial aminopropylsilanes with
calcined MCM
and abbreviations are given in Figure 1.
The pore diameter of our parent MCM
41 was calculated to be 3.6 nm using eq
The lattice spacing d100
from XRD data. The density of the pore
was set to be equal to the
density of amorphous silica (2.2 g/cm
Results and Discussion
Blank Test. The investigation of
submonolayer coverages requires the
evaluation of subtle variations in the
pore size distribution (PSD). It is
ucial to analyze the pore size
changes under the applied reaction
conditions without the addition of an
aminopropylsilane. We observed a
minor shift of the PSD to smaller pore
size up to the point of FITC coupling
(refluxing in toluene, washing, drying),
nd a similar shift under FITC coupling
conditions (stirring for 24 h in an
ethanolic solution of FITC, washing,
drying). No fluorescein was detected in
the samples at this stage, indicating that
binding of FITC only occurs on
aminopropylsilane modified MCM
The total shift of the PSD of the blank
samples was typically 0.04 nm
(diameter), with the distribution
retaining its width and symmetrical
shape. This minor change is attributed to
a slight esterification of the surface
during the washing treatments
ethanol and subsequent drying.
General Tendencies
investigated the reaction of various
commercial aminopropylsilanes with
calcined MCM-41 in toluene. Structures
and abbreviations are given in Figure 1.
The pore diameter of our parent MCM
as calculated to be 3.6 nm using eq
100 was obtained
from XRD data. The density of the pore
was set to be equal to the
density of amorphous silica (2.2 g/cm
Results and Discussion
The investigation of
submonolayer coverages requires the
evaluation of subtle variations in the
pore size distribution (PSD). It is
ucial to analyze the pore size
changes under the applied reaction
conditions without the addition of an
aminopropylsilane. We observed a
minor shift of the PSD to smaller pore
size up to the point of FITC coupling
(refluxing in toluene, washing, drying),
nd a similar shift under FITC coupling
conditions (stirring for 24 h in an
ethanolic solution of FITC, washing,
drying). No fluorescein was detected in
the samples at this stage, indicating that
binding of FITC only occurs on
aminopropylsilane modified MCM
The total shift of the PSD of the blank
samples was typically 0.04 nm
(diameter), with the distribution
retaining its width and symmetrical
shape. This minor change is attributed to
a slight esterification of the surface
during the washing treatments
ethanol and subsequent drying.16
General Tendencies. We have
investigated the reaction of various
commercial aminopropylsilanes with
41 in toluene. Structures
and abbreviations are given in Figure 1.
The pore diameter of our parent MCM
as calculated to be 3.6 nm using eq
63
was obtained
from XRD data. The density of the pore
was set to be equal to the
density of amorphous silica (2.2 g/cm3).
The investigation of
submonolayer coverages requires the
evaluation of subtle variations in the
pore size distribution (PSD). It is
ucial to analyze the pore size
changes under the applied reaction
conditions without the addition of an
aminopropylsilane. We observed a
minor shift of the PSD to smaller pore
size up to the point of FITC coupling
(refluxing in toluene, washing, drying),
nd a similar shift under FITC coupling
conditions (stirring for 24 h in an
ethanolic solution of FITC, washing,
drying). No fluorescein was detected in
the samples at this stage, indicating that
binding of FITC only occurs on
aminopropylsilane modified MCM-41.
The total shift of the PSD of the blank
samples was typically 0.04 nm
(diameter), with the distribution
retaining its width and symmetrical
shape. This minor change is attributed to
a slight esterification of the surface
during the washing treatments in
We have
investigated the reaction of various
commercial aminopropylsilanes with
41 in toluene. Structures
and abbreviations are given in Figure 1.
The pore diameter of our parent MCM-
as calculated to be 3.6 nm using eq
(1), resulting in a pore wall thickness of
0.8 nm. BET surface areas varied slightly
from batch to batch in the range of 810
to 890 m2
(secondary mesopores and macropores)
of approximately 65
from the high pressure part of the
plots. Although the preparation of MCM
41 proved to be well reproducible in
terms of the PSD, comparative studies
were only conducted on samples
synthesized from the same batch of
parent MCM
Figure 1. Structures and abbreviations of
aminopropylsi
It is instructive to investigate the
grafting behavior of a monomethoxy
silane, trimethoxysilane, and a dipodal
silane featuring two trimethoxysilyl
groups. Taking into account a surface
silanol concentration of approximately 3
mmol/g,17
aminopropylsilane per gram of MCM
(1), resulting in a pore wall thickness of
0.8 nm. BET surface areas varied slightly
from batch to batch in the range of 810 2/g. An external surface area
(secondary mesopores and macropores)
of approximately 65 m
from the high pressure part of the
plots. Although the preparation of MCM
41 proved to be well reproducible in
terms of the PSD, comparative studies
were only conducted on samples
synthesized from the same batch of
parent MCM-41.
Structures and abbreviations of
aminopropylsilanes.
It is instructive to investigate the
grafting behavior of a monomethoxy
silane, trimethoxysilane, and a dipodal
silane featuring two trimethoxysilyl
groups. Taking into account a surface
silanol concentration of approximately 3
a charge o
aminopropylsilane per gram of MCM
(1), resulting in a pore wall thickness of
0.8 nm. BET surface areas varied slightly
from batch to batch in the range of 810
/g. An external surface area
(secondary mesopores and macropores)
m2/g was estimated
from the high pressure part of the
plots. Although the preparation of MCM
41 proved to be well reproducible in
terms of the PSD, comparative studies
were only conducted on samples
synthesized from the same batch of
Structures and abbreviations of
It is instructive to investigate the
grafting behavior of a monomethoxy
silane, trimethoxysilane, and a dipodal
silane featuring two trimethoxysilyl
groups. Taking into account a surface
silanol concentration of approximately 3
a charge of 100 µmol
aminopropylsilane per gram of MCM
(1), resulting in a pore wall thickness of
0.8 nm. BET surface areas varied slightly
from batch to batch in the range of 810
/g. An external surface area
(secondary mesopores and macropores)
/g was estimated
from the high pressure part of the αS-
plots. Although the preparation of MCM-
41 proved to be well reproducible in
terms of the PSD, comparative studies
were only conducted on samples
synthesized from the same batch of
Structures and abbreviations of
It is instructive to investigate the
grafting behavior of a monomethoxy-
silane, trimethoxysilane, and a dipodal
silane featuring two trimethoxysilyl
groups. Taking into account a surface
silanol concentration of approximately 3
f 100 µmol
aminopropylsilane per gram of MCM-41

ensures an excess of silanol groups.
Figure 2 shows the PSDs of MCM
after reaction with 100 µmol/g
APDMMS, APTMS, or BTMSPA. A shift
towards smaller pore size is observed for
all samples. However, the exte
shift strongly depends on the type of
silane. For the dipodal silane BTMSPA,
the PSD maximum is only slightly shifted
relative to the parent MCM
similar magnitude were observed for the
blank samples. The distinctive tail
extending
suggests a nonuniform distribution of
the amine sites. The
monomethoxysilane APDMMS, on the
other hand, grafts more uniformly to the
mesoporous silica surface, resulting in a
larger shift and a symmetrical PSD. The
APTMS grafted s
properties lying
extremes.
Figure 2.
with 100 µmol/g of APDMMS, APTMS, or
BTMSPA.
FITC is one of the most popular
labeling reagents, forming a thiourea
upon reaction with an amine (see Figure
3). Apart from being used to modify
proteins,
ensures an excess of silanol groups.
Figure 2 shows the PSDs of MCM
after reaction with 100 µmol/g
APDMMS, APTMS, or BTMSPA. A shift
towards smaller pore size is observed for
all samples. However, the exte
shift strongly depends on the type of
silane. For the dipodal silane BTMSPA,
the PSD maximum is only slightly shifted
relative to the parent MCM
similar magnitude were observed for the
blank samples. The distinctive tail
extending towards smaller pore size
suggests a nonuniform distribution of
the amine sites. The
monomethoxysilane APDMMS, on the
other hand, grafts more uniformly to the
mesoporous silica surface, resulting in a
larger shift and a symmetrical PSD. The
APTMS grafted s
properties lying
extremes.
Figure 2. PSDs of MCM
with 100 µmol/g of APDMMS, APTMS, or
BTMSPA.
FITC is one of the most popular
labeling reagents, forming a thiourea
upon reaction with an amine (see Figure
3). Apart from being used to modify
proteins, peptides, synthetic
ensures an excess of silanol groups.
Figure 2 shows the PSDs of MCM
after reaction with 100 µmol/g
APDMMS, APTMS, or BTMSPA. A shift
towards smaller pore size is observed for
all samples. However, the exte
shift strongly depends on the type of
silane. For the dipodal silane BTMSPA,
the PSD maximum is only slightly shifted
relative to the parent MCM-41. Shifts of
similar magnitude were observed for the
blank samples. The distinctive tail
towards smaller pore size
suggests a nonuniform distribution of
the amine sites. The
monomethoxysilane APDMMS, on the
other hand, grafts more uniformly to the
mesoporous silica surface, resulting in a
larger shift and a symmetrical PSD. The
APTMS grafted sample features
properties lying between those two
PSDs of MCM-41 after reaction
with 100 µmol/g of APDMMS, APTMS, or
FITC is one of the most popular
labeling reagents, forming a thiourea
upon reaction with an amine (see Figure
3). Apart from being used to modify
peptides, synthetic
ensures an excess of silanol groups.
Figure 2 shows the PSDs of MCM-41
after reaction with 100 µmol/g
APDMMS, APTMS, or BTMSPA. A shift
towards smaller pore size is observed for
all samples. However, the extent of this
shift strongly depends on the type of
silane. For the dipodal silane BTMSPA,
the PSD maximum is only slightly shifted
41. Shifts of
similar magnitude were observed for the
blank samples. The distinctive tail
towards smaller pore size
suggests a nonuniform distribution of
the amine sites. The
monomethoxysilane APDMMS, on the
other hand, grafts more uniformly to the
mesoporous silica surface, resulting in a
larger shift and a symmetrical PSD. The
ample features
between those two
41 after reaction
with 100 µmol/g of APDMMS, APTMS, or
FITC is one of the most popular
labeling reagents, forming a thiourea
upon reaction with an amine (see Figure
3). Apart from being used to modify
64
ensures an excess of silanol groups.
41
after reaction with 100 µmol/g
APDMMS, APTMS, or BTMSPA. A shift
towards smaller pore size is observed for
nt of this
shift strongly depends on the type of
silane. For the dipodal silane BTMSPA,
the PSD maximum is only slightly shifted
41. Shifts of
similar magnitude were observed for the
blank samples. The distinctive tail
towards smaller pore size
suggests a nonuniform distribution of
the amine sites. The
monomethoxysilane APDMMS, on the
other hand, grafts more uniformly to the
mesoporous silica surface, resulting in a
larger shift and a symmetrical PSD. The
ample features
between those two
FITC is one of the most popular
labeling reagents, forming a thiourea
upon reaction with an amine (see Figure
3). Apart from being used to modify
Figure 3.
primary (R=H) and secondary
aminopropylsilanes. The number of possible
siloxane bonds depends on the type of
silane.
oligonucleotide
biomolecules, FITC has recently
applied in the preparation of
mesoporous thin films with pH sensing
ability.
amplify the differences between the
APDMMS, APTMS, and BTMSPA grafted
samples. The reaction of FITC wi
amino groups located on the internal
surface changes the PSD, while the
coupling of FITC to amino groups
anchored to the external surface has no
effect in this regard. In the case of the
APDMMS grafted sample, the PSD is
further shifted to smaller pore
is in contrast to the BTMSPA grafted
sample, for which a significantly smaller
shift of the maximum pore diameter is
observed (see Figure 4). Shifts of this
magnitude also occurred for blank
samples. The PSD of the BTMSPA grafted
material remain
uneven contributions of smaller pore
sizes. Again, intermediate behavior is
Figure 3. Coupling of FITC to surface bound
primary (R=H) and secondary
aminopropylsilanes. The number of possible
siloxane bonds depends on the type of
silane.
oligonucleotides and
biomolecules, FITC has recently
applied in the preparation of
mesoporous thin films with pH sensing
ability.18 Coupling of FITC is expected to
amplify the differences between the
APDMMS, APTMS, and BTMSPA grafted
samples. The reaction of FITC wi
amino groups located on the internal
surface changes the PSD, while the
coupling of FITC to amino groups
anchored to the external surface has no
effect in this regard. In the case of the
APDMMS grafted sample, the PSD is
further shifted to smaller pore
is in contrast to the BTMSPA grafted
sample, for which a significantly smaller
shift of the maximum pore diameter is
observed (see Figure 4). Shifts of this
magnitude also occurred for blank
samples. The PSD of the BTMSPA grafted
material remain
uneven contributions of smaller pore
sizes. Again, intermediate behavior is
Coupling of FITC to surface bound
primary (R=H) and secondary
aminopropylsilanes. The number of possible
siloxane bonds depends on the type of
s and
biomolecules, FITC has recently
applied in the preparation of
mesoporous thin films with pH sensing
Coupling of FITC is expected to
amplify the differences between the
APDMMS, APTMS, and BTMSPA grafted
samples. The reaction of FITC wi
amino groups located on the internal
surface changes the PSD, while the
coupling of FITC to amino groups
anchored to the external surface has no
effect in this regard. In the case of the
APDMMS grafted sample, the PSD is
further shifted to smaller pore
is in contrast to the BTMSPA grafted
sample, for which a significantly smaller
shift of the maximum pore diameter is
observed (see Figure 4). Shifts of this
magnitude also occurred for blank
samples. The PSD of the BTMSPA grafted
material remains unsymmetrical, with
uneven contributions of smaller pore
sizes. Again, intermediate behavior is
Coupling of FITC to surface bound
primary (R=H) and secondary
aminopropylsilanes. The number of possible
siloxane bonds depends on the type of
s and other
biomolecules, FITC has recently been
applied in the preparation of
mesoporous thin films with pH sensing
Coupling of FITC is expected to
amplify the differences between the
APDMMS, APTMS, and BTMSPA grafted
samples. The reaction of FITC wi
amino groups located on the internal
surface changes the PSD, while the
coupling of FITC to amino groups
anchored to the external surface has no
effect in this regard. In the case of the
APDMMS grafted sample, the PSD is
further shifted to smaller pore size. This
is in contrast to the BTMSPA grafted
sample, for which a significantly smaller
shift of the maximum pore diameter is
observed (see Figure 4). Shifts of this
magnitude also occurred for blank
samples. The PSD of the BTMSPA grafted
s unsymmetrical, with
uneven contributions of smaller pore
sizes. Again, intermediate behavior is
Coupling of FITC to surface bound
primary (R=H) and secondary
aminopropylsilanes. The number of possible
siloxane bonds depends on the type of
other
been
applied in the preparation of
mesoporous thin films with pH sensing
Coupling of FITC is expected to
amplify the differences between the
APDMMS, APTMS, and BTMSPA grafted
samples. The reaction of FITC with
amino groups located on the internal
surface changes the PSD, while the
coupling of FITC to amino groups
anchored to the external surface has no
effect in this regard. In the case of the
APDMMS grafted sample, the PSD is
size. This
is in contrast to the BTMSPA grafted
sample, for which a significantly smaller
shift of the maximum pore diameter is
observed (see Figure 4). Shifts of this
magnitude also occurred for blank
samples. The PSD of the BTMSPA grafted
s unsymmetrical, with
uneven contributions of smaller pore

Figure 4.
BTMSPA grafted samples before (open
circles) and after (filled circles) FITC
coupling. Fluorescein contents are 20
µmol/g
52 µmol/g (BTMSPA). The samples were
prepared from the same batch of MCM
by reaction with 100 µmol/g of the
corresponding aminopropylsilane.
found for APTMS. The relatively large
pore size shift of the APDMMS grafted
sample is surprising considering the
fluorescein contents, which amounted
Figure 4. PSDs of APDMMS, APTMS, and
BTMSPA grafted samples before (open
circles) and after (filled circles) FITC
coupling. Fluorescein contents are 20
µmol/g (APDMMS), 36 µmol/g (APTMS), and
52 µmol/g (BTMSPA). The samples were
prepared from the same batch of MCM
by reaction with 100 µmol/g of the
corresponding aminopropylsilane.
found for APTMS. The relatively large
pore size shift of the APDMMS grafted
sample is surprising considering the
fluorescein contents, which amounted
PSDs of APDMMS, APTMS, and
BTMSPA grafted samples before (open
circles) and after (filled circles) FITC
coupling. Fluorescein contents are 20
(APDMMS), 36 µmol/g (APTMS), and
52 µmol/g (BTMSPA). The samples were
prepared from the same batch of MCM
by reaction with 100 µmol/g of the
corresponding aminopropylsilane.
found for APTMS. The relatively large
pore size shift of the APDMMS grafted
sample is surprising considering the
fluorescein contents, which amounted
65
PSDs of APDMMS, APTMS, and
BTMSPA grafted samples before (open
circles) and after (filled circles) FITC
coupling. Fluorescein contents are 20
(APDMMS), 36 µmol/g (APTMS), and
52 µmol/g (BTMSPA). The samples were
prepared from the same batch of MCM-41
by reaction with 100 µmol/g of the
found for APTMS. The relatively large
pore size shift of the APDMMS grafted
sample is surprising considering the
fluorescein contents, which amounted
to 20 µmol/g for APDMMS, 36 µmol/g
for APTMS, and 52 µmol/g for BTMSPA.
These results clearly indicate that
BTMSPA preferably binds to sites on or
close to the external surface. The
distinct tail of the PSD suggests
clustering of BTMSPA at pore entrance
sites. For
increased grafting in the pores is
observed, with APDMMS yielding the
most homogeneous distribution of
grafting sites. The amount of coupled
fluorescein can be taken as a measure of
the grafting efficiency of the respective
aminopropylsi
Further information on the distribution
of the amine sites is obtained by
examining the photoluminescence of the
FITC coupled samples. In order to allow
for comparison of the luminescence
intensities, samples containing equal
amounts of fluoresce
by adjusting the aminopropylsilane
concentration in the reaction mixtures.
The resulting luminescence spectra and
PSDs are shown in Figure 5. Additional
nitrogen adsorption analysis data is
compiled in Table 1. At this point it is
helpful to briefly discuss the pH
dependence of the fluorescein
luminescence in solution.
different fluorescence spectra are
typically observed in H
varied. The cation emission (
nm) appears only in strongly acidic
solution. with prominent shoulders
around 555 and 595 nm. The
fluorescence spectrum of the dianion
ol/g for APDMMS, 36 µmol/g
for APTMS, and 52 µmol/g for BTMSPA.
These results clearly indicate that
BTMSPA preferably binds to sites on or
close to the external surface. The
distinct tail of the PSD suggests
clustering of BTMSPA at pore entrance
sites. For APTMS and APDMMS,
increased grafting in the pores is
observed, with APDMMS yielding the
most homogeneous distribution of
grafting sites. The amount of coupled
fluorescein can be taken as a measure of
the grafting efficiency of the respective
aminopropylsilane.
Further information on the distribution
of the amine sites is obtained by
examining the photoluminescence of the
FITC coupled samples. In order to allow
for comparison of the luminescence
intensities, samples containing equal
amounts of fluorescein were synthesized
by adjusting the aminopropylsilane
concentration in the reaction mixtures.
The resulting luminescence spectra and
PSDs are shown in Figure 5. Additional
nitrogen adsorption analysis data is
compiled in Table 1. At this point it is
helpful to briefly discuss the pH
dependence of the fluorescein
luminescence in solution.
different fluorescence spectra are
typically observed in H
ried. The cation emission (
nm) appears only in strongly acidic
solution. with prominent shoulders
around 555 and 595 nm. The
fluorescence spectrum of the dianion
ol/g for APDMMS, 36 µmol/g
for APTMS, and 52 µmol/g for BTMSPA.
These results clearly indicate that
BTMSPA preferably binds to sites on or
close to the external surface. The
distinct tail of the PSD suggests
clustering of BTMSPA at pore entrance
APTMS and APDMMS,
increased grafting in the pores is
observed, with APDMMS yielding the
most homogeneous distribution of
grafting sites. The amount of coupled
fluorescein can be taken as a measure of
the grafting efficiency of the respective
Further information on the distribution
of the amine sites is obtained by
examining the photoluminescence of the
FITC coupled samples. In order to allow
for comparison of the luminescence
intensities, samples containing equal
in were synthesized
by adjusting the aminopropylsilane
concentration in the reaction mixtures.
The resulting luminescence spectra and
PSDs are shown in Figure 5. Additional
nitrogen adsorption analysis data is
compiled in Table 1. At this point it is
helpful to briefly discuss the pH
dependence of the fluorescein
luminescence in solution.19
different fluorescence spectra are
typically observed in H2O when the pH is
ried. The cation emission (λmax
nm) appears only in strongly acidic
solution. with prominent shoulders
around 555 and 595 nm. The
fluorescence spectrum of the dianion
ol/g for APDMMS, 36 µmol/g
for APTMS, and 52 µmol/g for BTMSPA.
These results clearly indicate that
BTMSPA preferably binds to sites on or
close to the external surface. The
distinct tail of the PSD suggests
clustering of BTMSPA at pore entrance
APTMS and APDMMS,
increased grafting in the pores is
observed, with APDMMS yielding the
most homogeneous distribution of
grafting sites. The amount of coupled
fluorescein can be taken as a measure of
the grafting efficiency of the respective
Further information on the distribution
of the amine sites is obtained by
examining the photoluminescence of the
FITC coupled samples. In order to allow
for comparison of the luminescence
intensities, samples containing equal
in were synthesized
by adjusting the aminopropylsilane
concentration in the reaction mixtures.
The resulting luminescence spectra and
PSDs are shown in Figure 5. Additional
nitrogen adsorption analysis data is
compiled in Table 1. At this point it is
helpful to briefly discuss the pH
dependence of the fluorescein
Three
different fluorescence spectra are
O when the pH is
max = 475
nm) appears only in strongly acidic
solution. with prominent shoulders
around 555 and 595 nm. The
fluorescence spectrum of the dianion

Figure 5.
samples grafted with different
aminopropylsilane precursors (excitation at
450 nm). The spectra in the left panel were
measured
shows the corresponding spectra measured
on equally concentrated suspensions in
toluene/triethylamine. Bottom: PSDs of the
same samples. Fluorescein contents are
(20.0 ± 1.0) µmol/g.
features the same maximum, but is
narrowed compared to the spectrum of
the monoanio
Furthermore, the dianion exhibits a
higher fluorescence yield (0.93)
the neutral/monoanionic species (0.20
0.35)19. Inspecting the luminescence
spectra in Figure 5, we can immediately
rule out the presence of cationic
fluorescein species. To assure that the
Figure 5. Top: PL spectra of FITC coupled
samples grafted with different
aminopropylsilane precursors (excitation at
450 nm). The spectra in the left panel were
measured on dry samples. The right panel
shows the corresponding spectra measured
on equally concentrated suspensions in
toluene/triethylamine. Bottom: PSDs of the
same samples. Fluorescein contents are
(20.0 ± 1.0) µmol/g.
features the same maximum, but is
narrowed compared to the spectrum of
the monoanionic and neutral species.
Furthermore, the dianion exhibits a
higher fluorescence yield (0.93)
the neutral/monoanionic species (0.20
. Inspecting the luminescence
spectra in Figure 5, we can immediately
rule out the presence of cationic
rescein species. To assure that the
Top: PL spectra of FITC coupled
samples grafted with different
aminopropylsilane precursors (excitation at
450 nm). The spectra in the left panel were
on dry samples. The right panel
shows the corresponding spectra measured
on equally concentrated suspensions in
toluene/triethylamine. Bottom: PSDs of the
same samples. Fluorescein contents are
features the same maximum, but is
narrowed compared to the spectrum of
nic and neutral species.
Furthermore, the dianion exhibits a
higher fluorescence yield (0.93)20 than
the neutral/monoanionic species (0.20 –
. Inspecting the luminescence
spectra in Figure 5, we can immediately
rule out the presence of cationic
rescein species. To assure that the
66
Top: PL spectra of FITC coupled
samples grafted with different
aminopropylsilane precursors (excitation at
450 nm). The spectra in the left panel were
on dry samples. The right panel
shows the corresponding spectra measured
on equally concentrated suspensions in
toluene/triethylamine. Bottom: PSDs of the
same samples. Fluorescein contents are
features the same maximum, but is
narrowed compared to the spectrum of
nic and neutral species.
Furthermore, the dianion exhibits a
than
–
. Inspecting the luminescence
spectra in Figure 5, we can immediately
rule out the presence of cationic
rescein species. To assure that the
intensity differences of the samples are
not due to varying ratios of neutral,
monoanionic, and dianionic fluorescein,
PL measurements were performed on
toluene suspensions which were titrated
with triethylamine until ma
luminescence intensity was observed.
Addition of triethylamine leads to
narrowing of the luminescence bands,
yielding samples exclusively containing
dianionic fluorescein. For both dry
samples and toluene/triethylamine
suspensions, the luminescence i
increases in the series BTMSPA < APTMS
< APDMMS. These remarkably different
luminescence intensities are attributed
to various degrees of self
The self
to resonance energy transfer between
fluorescein molecules, with a Förster
distance of 42 Å.
quenching
distances between the grafted am
sites. Since the investigated coverages
lie well within the submonolayer regime,
a diminished luminescence intensity
suggests clustering of amine sites.
Table 1.
coupling.
silane
BTMSPA
APTMS
APDMMS
a Vtot
mesopore volume; Sb fluorescein content = (20.0 ± 1.0) µmol/g
intensity differences of the samples are
not due to varying ratios of neutral,
monoanionic, and dianionic fluorescein,
PL measurements were performed on
toluene suspensions which were titrated
with triethylamine until ma
luminescence intensity was observed.
Addition of triethylamine leads to
narrowing of the luminescence bands,
yielding samples exclusively containing
dianionic fluorescein. For both dry
samples and toluene/triethylamine
suspensions, the luminescence i
increases in the series BTMSPA < APTMS
< APDMMS. These remarkably different
luminescence intensities are attributed
to various degrees of self
The self-quenching of fluorescein is due
to resonance energy transfer between
fluorescein molecules, with a Förster
distance of 42 Å.
quenching therefore implies short
distances between the grafted am
sites. Since the investigated coverages
lie well within the submonolayer regime,
a diminished luminescence intensity
suggests clustering of amine sites.
Table 1. Nitrogen adsorption data after FITC
coupling.a,b
silane Vtot
(cm3/g)
BTMSPA 0.635
APTMS 0.625
APDMMS 0.601
= total pore volume; V
mesopore volume; S
fluorescein content = (20.0 ± 1.0) µmol/g
intensity differences of the samples are
not due to varying ratios of neutral,
monoanionic, and dianionic fluorescein,
PL measurements were performed on
toluene suspensions which were titrated
with triethylamine until ma
luminescence intensity was observed.
Addition of triethylamine leads to
narrowing of the luminescence bands,
yielding samples exclusively containing
dianionic fluorescein. For both dry
samples and toluene/triethylamine
suspensions, the luminescence i
increases in the series BTMSPA < APTMS
< APDMMS. These remarkably different
luminescence intensities are attributed
to various degrees of self
quenching of fluorescein is due
to resonance energy transfer between
fluorescein molecules, with a Förster
distance of 42 Å.21 Efficient self
therefore implies short
distances between the grafted am
sites. Since the investigated coverages
lie well within the submonolayer regime,
a diminished luminescence intensity
suggests clustering of amine sites.
Nitrogen adsorption data after FITC
/g)
Vp
(cm3/g)
0.635 0.567
0.625 0.557
0.601 0.536
= total pore volume; V
mesopore volume; SBET = BET surface
fluorescein content = (20.0 ± 1.0) µmol/g
intensity differences of the samples are
not due to varying ratios of neutral,
monoanionic, and dianionic fluorescein,
PL measurements were performed on
toluene suspensions which were titrated
with triethylamine until maximum
luminescence intensity was observed.
Addition of triethylamine leads to
narrowing of the luminescence bands,
yielding samples exclusively containing
dianionic fluorescein. For both dry
samples and toluene/triethylamine
suspensions, the luminescence intensity
increases in the series BTMSPA < APTMS
< APDMMS. These remarkably different
luminescence intensities are attributed
to various degrees of self-quenching.
quenching of fluorescein is due
to resonance energy transfer between
fluorescein molecules, with a Förster
Efficient self
therefore implies short
distances between the grafted amine
sites. Since the investigated coverages
lie well within the submonolayer regime,
a diminished luminescence intensity
suggests clustering of amine sites.
Nitrogen adsorption data after FITC
/g)
SBET
(m2/g)
0.567 780
0.557 770
0.536 746
= total pore volume; Vp = primary
= BET surface
fluorescein content = (20.0 ± 1.0) µmol/g
intensity differences of the samples are
not due to varying ratios of neutral,
monoanionic, and dianionic fluorescein,
PL measurements were performed on
toluene suspensions which were titrated
ximum
luminescence intensity was observed.
Addition of triethylamine leads to
narrowing of the luminescence bands,
yielding samples exclusively containing
dianionic fluorescein. For both dry
samples and toluene/triethylamine
ntensity
increases in the series BTMSPA < APTMS
< APDMMS. These remarkably different
luminescence intensities are attributed
quenching.
quenching of fluorescein is due
to resonance energy transfer between
fluorescein molecules, with a Förster
Efficient self-
therefore implies short
ine
sites. Since the investigated coverages
lie well within the submonolayer regime,
a diminished luminescence intensity
Nitrogen adsorption data after FITC
/g)
= primary
fluorescein content = (20.0 ± 1.0) µmol/g

Methoxysilanes are generally more
rea
other hand, ethoxysilanes are more
bulky than the corresponding
methoxysilanes. The comparison of the
grafting behavior of BTMSPA/BTESPA
and APTMS/APTES revealed only minor
differences. The yield of FITC coupling
was simi
APTMS/APTES pairs. However, the
tendency to graft to the internal surface
was slightly more pronounced in the
case of the ethoxysilanes. This
difference, while reproducible, is
admittedly subtle and much smaller
than what we o
APDMMS, APTMS, and BTMSPA. After
FITC coupling, the materials grafted with
APTES and BTESPA also showed slightly
stronger luminescence compared to the
materials grafted with the
corresponding methoxysilanes,
suggesting a lower degree
so far indicate that in terms of obtaining
a homogeneous distribution of grafting
sites, APDMMS is superior to APTMS and
BTMSPA. On the minus side, APDMMS
grafted samples suffer from reduced
stability against
APDMMS grafted sample (30 mg, 20
µmol/g of coupled fluorescein) in 0.2 M
sodium phosphate buffer (20 mL, pH
7.5) for 24 h at room temperature
resulted in a loss of (53 ± 3) % of
fluorescein. This problem is solved by
replacing APD
APDIPES grafted samples feature pore
sizes resembling those of the
corresponding APDMMS grafted
Methoxy vs. Ethoxy.
Methoxysilanes are generally more
reactive than ethoxysilanes.
other hand, ethoxysilanes are more
bulky than the corresponding
methoxysilanes. The comparison of the
grafting behavior of BTMSPA/BTESPA
and APTMS/APTES revealed only minor
differences. The yield of FITC coupling
was similar for the BTMSPA/BTESPA and
APTMS/APTES pairs. However, the
tendency to graft to the internal surface
was slightly more pronounced in the
case of the ethoxysilanes. This
difference, while reproducible, is
admittedly subtle and much smaller
than what we o
APDMMS, APTMS, and BTMSPA. After
FITC coupling, the materials grafted with
APTES and BTESPA also showed slightly
stronger luminescence compared to the
materials grafted with the
corresponding methoxysilanes,
suggesting a lower degree
APDMMS vs. APDIPES.
so far indicate that in terms of obtaining
a homogeneous distribution of grafting
sites, APDMMS is superior to APTMS and
BTMSPA. On the minus side, APDMMS
grafted samples suffer from reduced
stability against
APDMMS grafted sample (30 mg, 20
µmol/g of coupled fluorescein) in 0.2 M
sodium phosphate buffer (20 mL, pH
7.5) for 24 h at room temperature
resulted in a loss of (53 ± 3) % of
fluorescein. This problem is solved by
replacing APD
APDIPES grafted samples feature pore
sizes resembling those of the
corresponding APDMMS grafted
Methoxy vs. Ethoxy.
Methoxysilanes are generally more
ctive than ethoxysilanes.
other hand, ethoxysilanes are more
bulky than the corresponding
methoxysilanes. The comparison of the
grafting behavior of BTMSPA/BTESPA
and APTMS/APTES revealed only minor
differences. The yield of FITC coupling
lar for the BTMSPA/BTESPA and
APTMS/APTES pairs. However, the
tendency to graft to the internal surface
was slightly more pronounced in the
case of the ethoxysilanes. This
difference, while reproducible, is
admittedly subtle and much smaller
than what we observed when comparing
APDMMS, APTMS, and BTMSPA. After
FITC coupling, the materials grafted with
APTES and BTESPA also showed slightly
stronger luminescence compared to the
materials grafted with the
corresponding methoxysilanes,
suggesting a lower degree
APDMMS vs. APDIPES.
so far indicate that in terms of obtaining
a homogeneous distribution of grafting
sites, APDMMS is superior to APTMS and
BTMSPA. On the minus side, APDMMS
grafted samples suffer from reduced
stability against solvolysis.
APDMMS grafted sample (30 mg, 20
µmol/g of coupled fluorescein) in 0.2 M
sodium phosphate buffer (20 mL, pH
7.5) for 24 h at room temperature
resulted in a loss of (53 ± 3) % of
fluorescein. This problem is solved by
replacing APDMMS with APDIPES.
APDIPES grafted samples feature pore
sizes resembling those of the
corresponding APDMMS grafted
Methoxy vs. Ethoxy.
Methoxysilanes are generally more
ctive than ethoxysilanes.22 On the
other hand, ethoxysilanes are more
bulky than the corresponding
methoxysilanes. The comparison of the
grafting behavior of BTMSPA/BTESPA
and APTMS/APTES revealed only minor
differences. The yield of FITC coupling
lar for the BTMSPA/BTESPA and
APTMS/APTES pairs. However, the
tendency to graft to the internal surface
was slightly more pronounced in the
case of the ethoxysilanes. This
difference, while reproducible, is
admittedly subtle and much smaller
bserved when comparing
APDMMS, APTMS, and BTMSPA. After
FITC coupling, the materials grafted with
APTES and BTESPA also showed slightly
stronger luminescence compared to the
materials grafted with the
corresponding methoxysilanes,
suggesting a lower degree of clustering.
APDMMS vs. APDIPES. Our results
so far indicate that in terms of obtaining
a homogeneous distribution of grafting
sites, APDMMS is superior to APTMS and
BTMSPA. On the minus side, APDMMS
grafted samples suffer from reduced
solvolysis.23 Stirring a
APDMMS grafted sample (30 mg, 20
µmol/g of coupled fluorescein) in 0.2 M
sodium phosphate buffer (20 mL, pH
7.5) for 24 h at room temperature
resulted in a loss of (53 ± 3) % of
fluorescein. This problem is solved by
MMS with APDIPES.
APDIPES grafted samples feature pore
sizes resembling those of the
corresponding APDMMS grafted
67
Methoxy vs. Ethoxy.
Methoxysilanes are generally more
On the
other hand, ethoxysilanes are more
bulky than the corresponding
methoxysilanes. The comparison of the
grafting behavior of BTMSPA/BTESPA
and APTMS/APTES revealed only minor
differences. The yield of FITC coupling
lar for the BTMSPA/BTESPA and
APTMS/APTES pairs. However, the
tendency to graft to the internal surface
was slightly more pronounced in the
case of the ethoxysilanes. This
difference, while reproducible, is
admittedly subtle and much smaller
bserved when comparing
APDMMS, APTMS, and BTMSPA. After
FITC coupling, the materials grafted with
APTES and BTESPA also showed slightly
stronger luminescence compared to the
materials grafted with the
corresponding methoxysilanes,
of clustering.
Our results
so far indicate that in terms of obtaining
a homogeneous distribution of grafting
sites, APDMMS is superior to APTMS and
BTMSPA. On the minus side, APDMMS
grafted samples suffer from reduced
Stirring a
APDMMS grafted sample (30 mg, 20
µmol/g of coupled fluorescein) in 0.2 M
sodium phosphate buffer (20 mL, pH
7.5) for 24 h at room temperature
resulted in a loss of (53 ± 3) % of
fluorescein. This problem is solved by
MMS with APDIPES.
APDIPES grafted samples feature pore
sizes resembling those of the
corresponding APDMMS grafted
samples (see Figure 6). Taking into
account
properties of FITC coupled APDMMS and
APDIPES samples, we can conclude th
an equally homogeneous distribution of
amine sites is obtained. Moreover,
APDIPES grafted samples are as stable as
their APTMS counterparts. Under the
hydrolysis conditions described above,
leaching of only (18 ± 3) % of fluorescein
was observed. Appare
isopropyl groups protect the single
siloxane link. This is in agreement with
the improved low pH hydrolytic stability
of common bonded
with monofunctional silanes containing
bulky groups at the silicon atom.
interesting to note that despite being
more bulky than APTMS, APDIPES is able
to bind to less accessible sites on the
internal surface and thus produces a
more uniform distribution of grafted
amino groups.
Figure 6. PSDs of APDMMS and APDIPES
grafted sam
Fluorescein contents are (20.0 ± 1.0)
µmol/g.
samples (see Figure 6). Taking into
the similar luminescence
properties of FITC coupled APDMMS and
APDIPES samples, we can conclude th
an equally homogeneous distribution of
amine sites is obtained. Moreover,
APDIPES grafted samples are as stable as
their APTMS counterparts. Under the
hydrolysis conditions described above,
leaching of only (18 ± 3) % of fluorescein
was observed. Appare
isopropyl groups protect the single
siloxane link. This is in agreement with
the improved low pH hydrolytic stability
of common bonded-phase silicas treated
with monofunctional silanes containing
bulky groups at the silicon atom.
teresting to note that despite being
more bulky than APTMS, APDIPES is able
to bind to less accessible sites on the
internal surface and thus produces a
uniform distribution of grafted
amino groups.
PSDs of APDMMS and APDIPES
grafted samples after FITC coupling.
Fluorescein contents are (20.0 ± 1.0)
samples (see Figure 6). Taking into
similar luminescence
properties of FITC coupled APDMMS and
APDIPES samples, we can conclude th
an equally homogeneous distribution of
amine sites is obtained. Moreover,
APDIPES grafted samples are as stable as
their APTMS counterparts. Under the
hydrolysis conditions described above,
leaching of only (18 ± 3) % of fluorescein
was observed. Apparently, the bulky
isopropyl groups protect the single
siloxane link. This is in agreement with
the improved low pH hydrolytic stability
phase silicas treated
with monofunctional silanes containing
bulky groups at the silicon atom.
teresting to note that despite being
more bulky than APTMS, APDIPES is able
to bind to less accessible sites on the
internal surface and thus produces a
uniform distribution of grafted
PSDs of APDMMS and APDIPES
ples after FITC coupling.
Fluorescein contents are (20.0 ± 1.0)
samples (see Figure 6). Taking into
similar luminescence
properties of FITC coupled APDMMS and
APDIPES samples, we can conclude that
an equally homogeneous distribution of
amine sites is obtained. Moreover,
APDIPES grafted samples are as stable as
their APTMS counterparts. Under the
hydrolysis conditions described above,
leaching of only (18 ± 3) % of fluorescein
ntly, the bulky
isopropyl groups protect the single
siloxane link. This is in agreement with
the improved low pH hydrolytic stability
phase silicas treated
with monofunctional silanes containing
bulky groups at the silicon atom.24 It is
teresting to note that despite being
more bulky than APTMS, APDIPES is able
to bind to less accessible sites on the
internal surface and thus produces a
uniform distribution of grafted
PSDs of APDMMS and APDIPES
ples after FITC coupling.
Fluorescein contents are (20.0 ± 1.0)

Primary vs. Secondary Amines.
To study the role of the amino
functionality in the grafting process, it is
instructive to compare the reactivity of
APTMS and MAPTMS. Despite the fact
that both molecules are
trimethoxysilanes, the grafting of
MAPTMS was found to be considerably
more efficient. The reaction of 50 µmol
of the respective silane with 500 mg of
MCM-41 and subsequent FITC coupling
resulted in fluorescein contents of 52
µmol/g
APTMS. In terms of grafting efficiency,
MAPTMS apparently resembles
BTMSPA, emphasizing the important
role of the amino functionality in the
self-catalyzed grafting process.
However, when compared to BTMSPA,
MAPTMS showed a h
graft to the internal surface, although
not surpassing APTMS grafted samples
of the same loading (see Figure 7). The
luminescence properties of MAPTMS
grafted samples after FITC coupling are
comparable to APTMS grafted samples
of the same
identical reaction conditions, the degree
of clustering therefore seems to be
determined mainly by the number of
methoxy groups per molecule.
Grafting Mechanism.
there is a correlation between the
tendency to yield a homogeneous
distribution of grafting sites and the
number of alkoxy groups (methoxy or
ethoxy) per aminopropylsilane molecule.
Furthermore, secondary amines give
higher grafting yields (estimated from
Primary vs. Secondary Amines.
To study the role of the amino
functionality in the grafting process, it is
instructive to compare the reactivity of
APTMS and MAPTMS. Despite the fact
hat both molecules are
trimethoxysilanes, the grafting of
MAPTMS was found to be considerably
more efficient. The reaction of 50 µmol
of the respective silane with 500 mg of
41 and subsequent FITC coupling
resulted in fluorescein contents of 52
µmol/g for MAPTMS and 36 µmol/g for
APTMS. In terms of grafting efficiency,
MAPTMS apparently resembles
BTMSPA, emphasizing the important
role of the amino functionality in the
catalyzed grafting process.
However, when compared to BTMSPA,
MAPTMS showed a h
graft to the internal surface, although
not surpassing APTMS grafted samples
of the same loading (see Figure 7). The
luminescence properties of MAPTMS
grafted samples after FITC coupling are
comparable to APTMS grafted samples
of the same fluorescein content. Under
identical reaction conditions, the degree
of clustering therefore seems to be
determined mainly by the number of
methoxy groups per molecule.
Grafting Mechanism.
there is a correlation between the
tendency to yield a homogeneous
distribution of grafting sites and the
number of alkoxy groups (methoxy or
ethoxy) per aminopropylsilane molecule.
Furthermore, secondary amines give
higher grafting yields (estimated from
Primary vs. Secondary Amines.
To study the role of the amino
functionality in the grafting process, it is
instructive to compare the reactivity of
APTMS and MAPTMS. Despite the fact
hat both molecules are
trimethoxysilanes, the grafting of
MAPTMS was found to be considerably
more efficient. The reaction of 50 µmol
of the respective silane with 500 mg of
41 and subsequent FITC coupling
resulted in fluorescein contents of 52
for MAPTMS and 36 µmol/g for
APTMS. In terms of grafting efficiency,
MAPTMS apparently resembles
BTMSPA, emphasizing the important
role of the amino functionality in the
catalyzed grafting process.
However, when compared to BTMSPA,
MAPTMS showed a higher tendency to
graft to the internal surface, although
not surpassing APTMS grafted samples
of the same loading (see Figure 7). The
luminescence properties of MAPTMS
grafted samples after FITC coupling are
comparable to APTMS grafted samples
fluorescein content. Under
identical reaction conditions, the degree
of clustering therefore seems to be
determined mainly by the number of
methoxy groups per molecule.
Grafting Mechanism.
there is a correlation between the
tendency to yield a homogeneous
distribution of grafting sites and the
number of alkoxy groups (methoxy or
ethoxy) per aminopropylsilane molecule.
Furthermore, secondary amines give
higher grafting yields (estimated from
Primary vs. Secondary Amines.
To study the role of the amino
functionality in the grafting process, it is
instructive to compare the reactivity of
APTMS and MAPTMS. Despite the fact
hat both molecules are
trimethoxysilanes, the grafting of
MAPTMS was found to be considerably
more efficient. The reaction of 50 µmol
of the respective silane with 500 mg of
41 and subsequent FITC coupling
resulted in fluorescein contents of 52
for MAPTMS and 36 µmol/g for
APTMS. In terms of grafting efficiency,
MAPTMS apparently resembles
BTMSPA, emphasizing the important
role of the amino functionality in the
catalyzed grafting process.25
However, when compared to BTMSPA,
igher tendency to
graft to the internal surface, although
not surpassing APTMS grafted samples
of the same loading (see Figure 7). The
luminescence properties of MAPTMS
grafted samples after FITC coupling are
comparable to APTMS grafted samples
fluorescein content. Under
identical reaction conditions, the degree
of clustering therefore seems to be
determined mainly by the number of
methoxy groups per molecule.
Apparently
there is a correlation between the
tendency to yield a homogeneous
distribution of grafting sites and the
number of alkoxy groups (methoxy or
ethoxy) per aminopropylsilane molecule.
Furthermore, secondary amines give
higher grafting yields (estimated from
68
Primary vs. Secondary Amines.
To study the role of the amino
functionality in the grafting process, it is
instructive to compare the reactivity of
APTMS and MAPTMS. Despite the fact
hat both molecules are
trimethoxysilanes, the grafting of
MAPTMS was found to be considerably
more efficient. The reaction of 50 µmol
of the respective silane with 500 mg of
41 and subsequent FITC coupling
resulted in fluorescein contents of 52
for MAPTMS and 36 µmol/g for
APTMS. In terms of grafting efficiency,
MAPTMS apparently resembles
BTMSPA, emphasizing the important
role of the amino functionality in the 25
However, when compared to BTMSPA,
igher tendency to
graft to the internal surface, although
not surpassing APTMS grafted samples
of the same loading (see Figure 7). The
luminescence properties of MAPTMS
grafted samples after FITC coupling are
comparable to APTMS grafted samples
fluorescein content. Under
identical reaction conditions, the degree
of clustering therefore seems to be
determined mainly by the number of
Apparently
there is a correlation between the
tendency to yield a homogeneous
distribution of grafting sites and the
number of alkoxy groups (methoxy or
ethoxy) per aminopropylsilane molecule.
Furthermore, secondary amines give
Figure 7.
BTMSPA grafted samples after FITC
coupling. Flu
1.0) µmol/g.
the amount of coupled fluorescein) than
primary amines. In view of these results,
the following mechanism for the
reaction of aminopropylsilanes with
mesoporous silica is proposed.
step, the aminopropylsilane is adsorbed
on the mesoporous silica surface
forming hydrogen bonds with surface
silanol groups. The amino groups
thereby function as hydrogen bond
acceptors. There is evidence in the case
of APTES that this first ste
equilibrium within one minute.
initial adsorption concerns accessible
silanols, that is, sites on the external
surface and sites close to the pore
entrances. Note that we have used
maximum aminopropylsilane amounts of
100 µmol per gram
Adsorption of a submonolayer is
therefore possible even without access
to the entire MCM
and BTESPA exhibit the strongest
interaction with the surface, since their
secondary amines are better acceptors
Figure 7. PSDs of APTMS, MAPTMS, and
BTMSPA grafted samples after FITC
coupling. Fluorescein contents are (20.0 ±
1.0) µmol/g.
the amount of coupled fluorescein) than
primary amines. In view of these results,
the following mechanism for the
reaction of aminopropylsilanes with
mesoporous silica is proposed.
step, the aminopropylsilane is adsorbed
on the mesoporous silica surface
forming hydrogen bonds with surface
silanol groups. The amino groups
thereby function as hydrogen bond
acceptors. There is evidence in the case
of APTES that this first ste
equilibrium within one minute.
initial adsorption concerns accessible
silanols, that is, sites on the external
surface and sites close to the pore
entrances. Note that we have used
maximum aminopropylsilane amounts of
100 µmol per gram
Adsorption of a submonolayer is
therefore possible even without access
to the entire MCM
and BTESPA exhibit the strongest
interaction with the surface, since their
secondary amines are better acceptors
PSDs of APTMS, MAPTMS, and
BTMSPA grafted samples after FITC
orescein contents are (20.0 ±
the amount of coupled fluorescein) than
primary amines. In view of these results,
the following mechanism for the
reaction of aminopropylsilanes with
mesoporous silica is proposed.
step, the aminopropylsilane is adsorbed
on the mesoporous silica surface
forming hydrogen bonds with surface
silanol groups. The amino groups
thereby function as hydrogen bond
acceptors. There is evidence in the case
of APTES that this first ste
equilibrium within one minute.
initial adsorption concerns accessible
silanols, that is, sites on the external
surface and sites close to the pore
entrances. Note that we have used
maximum aminopropylsilane amounts of
100 µmol per gram of MCM
Adsorption of a submonolayer is
therefore possible even without access
to the entire MCM-41 surface. BTMSPA
and BTESPA exhibit the strongest
interaction with the surface, since their
secondary amines are better acceptors
PSDs of APTMS, MAPTMS, and
BTMSPA grafted samples after FITC
orescein contents are (20.0 ±
the amount of coupled fluorescein) than
primary amines. In view of these results,
the following mechanism for the
reaction of aminopropylsilanes with
mesoporous silica is proposed. In a first
step, the aminopropylsilane is adsorbed
on the mesoporous silica surface
forming hydrogen bonds with surface
silanol groups. The amino groups
thereby function as hydrogen bond
acceptors. There is evidence in the case
of APTES that this first step reaches an
equilibrium within one minute.25 This
initial adsorption concerns accessible
silanols, that is, sites on the external
surface and sites close to the pore
entrances. Note that we have used
maximum aminopropylsilane amounts of
of MCM-41.
Adsorption of a submonolayer is
therefore possible even without access
41 surface. BTMSPA
and BTESPA exhibit the strongest
interaction with the surface, since their
secondary amines are better acceptors
PSDs of APTMS, MAPTMS, and
BTMSPA grafted samples after FITC
orescein contents are (20.0 ±
the amount of coupled fluorescein) than
primary amines. In view of these results,
the following mechanism for the
reaction of aminopropylsilanes with
In a first
step, the aminopropylsilane is adsorbed
on the mesoporous silica surface
forming hydrogen bonds with surface
silanol groups. The amino groups
thereby function as hydrogen bond
acceptors. There is evidence in the case
p reaches an
This
initial adsorption concerns accessible
silanols, that is, sites on the external
surface and sites close to the pore
entrances. Note that we have used
maximum aminopropylsilane amounts of
41.
Adsorption of a submonolayer is
therefore possible even without access
41 surface. BTMSPA
and BTESPA exhibit the strongest
interaction with the surface, since their
secondary amines are better acceptors

69
for hydrogen bonds than the primary
amines of APTMS, APTES, APDMMS, and
APDIPES. Additionally, six alkoxy groups
per molecule are available for siloxane
bond formation. On the other hand, the
monoalkoxysilanes (APDMMS and
APDIPES) are more mobile due to a
weaker interaction with the surface and
are thus able to reach less accessible
sites located in the pores. Furthermore,
silanes with more than one alkoxy group
per molecule have the tendency to form
aminopropylsilane islands. This
contributes to a nonuniform distribution
of the grafting sites, manifesting itself in
low luminescence intensities after FITC
coupling.
The mechanism leading to the
formation of aminopropylsilane islands
is subject to speculation. The activation
of surface silanols by hydrogen-bonded
aminopropylsilanes might advance the
formation of islands,25 especially in
regions of high silanol density on the
rough MCM-41 surface.26 Cross-linking
between aminopropylsilane molecules is
also expected to promote clustering.
However, this process requires the
presence of water for the preceding
hydrolysis step. The actual amount of
water on a silica surface depends on the
thermal pretreatment.27 In order to
provide reproducible conditions, all our
calcined MCM-41 materials were treated
at 80 °C before use. This temperature
was chosen because of its compatibility
with organic modifications introduced by
postsynthetic grafting or co-
condensation. Total release of
physisorbed water usually requires
temperatures above 100 °C.27 The
solvent is another potential source of
trace water, regardless of careful
dehydration treatments. This problem is
associated with the fact that silica
behaves as a drying agent, adsorbing
even minute quantities of water.28 We
can therefore conclude that traces of
water are present and that cross-linking
most likely contributes to the clustering
of the dipodal and (to a smaller extent)
the monopodal trialkoxysilanes. Previous
studies on the reaction of APTES with
silica gel have shown that hydrolysis and
cross-linking take place on the silica
surface, that is, after the initial
adsorption of the silane monomers.29
Small amounts of water thereby not only
promote cross-linking of adsorbed
aminopropylsilanes, but also enhance
the reactivity of the silanes towards
surface silylation.30 In order to minimize
cross-linking, complete dehydration of
MCM-41 would be necessary. This
requires temperatures where
dehydroxylation occurs simultaneously27
and decomposition of organic
functionalities introduced into the MCM-
41 framework becomes an issue. As will
be shown below, clustering of
aminopropylsilanes on the MCM-41
surface can be conveniently minimized
by increasing the polarity of the solvent
used for the grafting reaction.
The relatively large size of the BTMSPA
and BTESPA molecules might contribute
to a nonuniform distribution by partial
pore blocking. Considering the initial
pore diameter of 3.6 nm and the low
aminopropylsilane loadings, we expect
that such effects are of minor
importance under our conditions. This is

supported by the observation that
APDIPES dis
the less bulky APTMS. Further evidence
that the grafting reactions are not
governed by pore blocking was obtained
by substituting MCM
silica, which is essentially non
while still featuring a large surface a
(200 m2
and APDMMS to fumed silica and
subsequent FITC coupling resulted in
fluorescein contents comparable to
analogous samples based on MCM
More importantly, the luminescence
properties of the FITC coupled fumed
silica samples resembled those of the
corresponding MCM
Prediction of Grafting Behavior.
Our interpretation of the results can be
put to a test by attempting to predict
the grafting behavior of MAPMDMS (see
Figure 1). Being a secondary amine, we
anticipate a high grafting yield. In
accordance with our expectation,
fluorescein contents similar to MAPTMS
grafted samples were observed. The
presence of only two methoxy groups
should lead to an increased mobility of
MAPMDMS when compared to
MAPTMS. Th
samples indeed support this hypothesis
(see Figure 8). However, when
compared to APTMS, the ability of
MAPMDMS to graft to internal surface
sites is less pronounced, emphasizing
the strong interaction of the secondary
amino group
Clustering of MAPMDMS molecules is
less likely than clustering of the
trimethoxysilanes APTMS and MAPTMS.
The strong luminescence of FITC coupled
supported by the observation that
APDIPES distributes more uniformly than
the less bulky APTMS. Further evidence
that the grafting reactions are not
governed by pore blocking was obtained
by substituting MCM
silica, which is essentially non
while still featuring a large surface a2/g). Grafting of BTMSPA, APTMS,
and APDMMS to fumed silica and
subsequent FITC coupling resulted in
fluorescein contents comparable to
analogous samples based on MCM
More importantly, the luminescence
properties of the FITC coupled fumed
ica samples resembled those of the
corresponding MCM
Prediction of Grafting Behavior.
Our interpretation of the results can be
put to a test by attempting to predict
the grafting behavior of MAPMDMS (see
Figure 1). Being a secondary amine, we
anticipate a high grafting yield. In
accordance with our expectation,
fluorescein contents similar to MAPTMS
grafted samples were observed. The
presence of only two methoxy groups
should lead to an increased mobility of
MAPMDMS when compared to
MAPTMS. The PSDs of the FITC coupled
samples indeed support this hypothesis
(see Figure 8). However, when
compared to APTMS, the ability of
MAPMDMS to graft to internal surface
sites is less pronounced, emphasizing
the strong interaction of the secondary
amino group with the silica surface.
Clustering of MAPMDMS molecules is
less likely than clustering of the
trimethoxysilanes APTMS and MAPTMS.
The strong luminescence of FITC coupled
supported by the observation that
tributes more uniformly than
the less bulky APTMS. Further evidence
that the grafting reactions are not
governed by pore blocking was obtained
by substituting MCM-41 with fumed
silica, which is essentially non
while still featuring a large surface a
/g). Grafting of BTMSPA, APTMS,
and APDMMS to fumed silica and
subsequent FITC coupling resulted in
fluorescein contents comparable to
analogous samples based on MCM
More importantly, the luminescence
properties of the FITC coupled fumed
ica samples resembled those of the
corresponding MCM-41 materials.
Prediction of Grafting Behavior.
Our interpretation of the results can be
put to a test by attempting to predict
the grafting behavior of MAPMDMS (see
Figure 1). Being a secondary amine, we
anticipate a high grafting yield. In
accordance with our expectation,
fluorescein contents similar to MAPTMS
grafted samples were observed. The
presence of only two methoxy groups
should lead to an increased mobility of
MAPMDMS when compared to
e PSDs of the FITC coupled
samples indeed support this hypothesis
(see Figure 8). However, when
compared to APTMS, the ability of
MAPMDMS to graft to internal surface
sites is less pronounced, emphasizing
the strong interaction of the secondary
with the silica surface.
Clustering of MAPMDMS molecules is
less likely than clustering of the
trimethoxysilanes APTMS and MAPTMS.
The strong luminescence of FITC coupled
supported by the observation that
tributes more uniformly than
the less bulky APTMS. Further evidence
that the grafting reactions are not
governed by pore blocking was obtained
41 with fumed
silica, which is essentially non-porous
while still featuring a large surface area
/g). Grafting of BTMSPA, APTMS,
and APDMMS to fumed silica and
subsequent FITC coupling resulted in
fluorescein contents comparable to
analogous samples based on MCM-41.
More importantly, the luminescence
properties of the FITC coupled fumed
ica samples resembled those of the
41 materials.
Prediction of Grafting Behavior.
Our interpretation of the results can be
put to a test by attempting to predict
the grafting behavior of MAPMDMS (see
Figure 1). Being a secondary amine, we
anticipate a high grafting yield. In
accordance with our expectation,
fluorescein contents similar to MAPTMS
grafted samples were observed. The
presence of only two methoxy groups
should lead to an increased mobility of
MAPMDMS when compared to
e PSDs of the FITC coupled
samples indeed support this hypothesis
(see Figure 8). However, when
compared to APTMS, the ability of
MAPMDMS to graft to internal surface
sites is less pronounced, emphasizing
the strong interaction of the secondary
with the silica surface.
Clustering of MAPMDMS molecules is
less likely than clustering of the
trimethoxysilanes APTMS and MAPTMS.
The strong luminescence of FITC coupled
70
supported by the observation that
tributes more uniformly than
the less bulky APTMS. Further evidence
that the grafting reactions are not
governed by pore blocking was obtained
41 with fumed
porous
rea
/g). Grafting of BTMSPA, APTMS,
and APDMMS to fumed silica and
subsequent FITC coupling resulted in
fluorescein contents comparable to
41.
More importantly, the luminescence
properties of the FITC coupled fumed
ica samples resembled those of the
Prediction of Grafting Behavior.
Our interpretation of the results can be
put to a test by attempting to predict
the grafting behavior of MAPMDMS (see
Figure 1). Being a secondary amine, we
anticipate a high grafting yield. In
accordance with our expectation,
fluorescein contents similar to MAPTMS
grafted samples were observed. The
presence of only two methoxy groups
should lead to an increased mobility of
MAPMDMS when compared to
e PSDs of the FITC coupled
samples indeed support this hypothesis
(see Figure 8). However, when
compared to APTMS, the ability of
MAPMDMS to graft to internal surface
sites is less pronounced, emphasizing
the strong interaction of the secondary
with the silica surface.
Clustering of MAPMDMS molecules is
less likely than clustering of the
trimethoxysilanes APTMS and MAPTMS.
The strong luminescence of FITC coupled
samples grafted with MAPMDMS
effectively provides evidence for a low
tendency to for
Comparison of the relative luminescence
intensities in Figures 5 and 8 indicates
similarities between MAPMDMS and
APDMMS grafted samples. We can
therefore conclude that clustering in
MAPMDMS grafted samples is virtually
absent.
Figure 8.
samples grafted with APTMS and
MAPMDMS (excitation at 450 nm). The
spectra in the left panel were measured on
dry samples. The right panel shows the
corresponding spectra measured on equally
concentrated suspensi
toluene/triethylamine. PSDs are given in the
right panel. Fluorescein contents are (20.0 ±
1.0) µmol/g.
samples grafted with MAPMDMS
effectively provides evidence for a low
tendency to form islands (see Figure 8).
Comparison of the relative luminescence
intensities in Figures 5 and 8 indicates
similarities between MAPMDMS and
APDMMS grafted samples. We can
therefore conclude that clustering in
MAPMDMS grafted samples is virtually
absent.
Figure 8. Left: PL spectra of FITC coupled
samples grafted with APTMS and
MAPMDMS (excitation at 450 nm). The
spectra in the left panel were measured on
dry samples. The right panel shows the
corresponding spectra measured on equally
concentrated suspensi
toluene/triethylamine. PSDs are given in the
panel. Fluorescein contents are (20.0 ±
1.0) µmol/g.
samples grafted with MAPMDMS
effectively provides evidence for a low
m islands (see Figure 8).
Comparison of the relative luminescence
intensities in Figures 5 and 8 indicates
similarities between MAPMDMS and
APDMMS grafted samples. We can
therefore conclude that clustering in
MAPMDMS grafted samples is virtually
: PL spectra of FITC coupled
samples grafted with APTMS and
MAPMDMS (excitation at 450 nm). The
spectra in the left panel were measured on
dry samples. The right panel shows the
corresponding spectra measured on equally
concentrated suspensi
toluene/triethylamine. PSDs are given in the
panel. Fluorescein contents are (20.0 ±
samples grafted with MAPMDMS
effectively provides evidence for a low
m islands (see Figure 8).
Comparison of the relative luminescence
intensities in Figures 5 and 8 indicates
similarities between MAPMDMS and
APDMMS grafted samples. We can
therefore conclude that clustering in
MAPMDMS grafted samples is virtually
: PL spectra of FITC coupled
samples grafted with APTMS and
MAPMDMS (excitation at 450 nm). The
spectra in the left panel were measured on
dry samples. The right panel shows the
corresponding spectra measured on equally
concentrated suspensions in
toluene/triethylamine. PSDs are given in the
panel. Fluorescein contents are (20.0 ±
samples grafted with MAPMDMS
effectively provides evidence for a low
m islands (see Figure 8).
Comparison of the relative luminescence
intensities in Figures 5 and 8 indicates
similarities between MAPMDMS and
APDMMS grafted samples. We can
therefore conclude that clustering in
MAPMDMS grafted samples is virtually
: PL spectra of FITC coupled
samples grafted with APTMS and
MAPMDMS (excitation at 450 nm). The
spectra in the left panel were measured on
dry samples. The right panel shows the
corresponding spectra measured on equally
ons in
toluene/triethylamine. PSDs are given in the
panel. Fluorescein contents are (20.0 ±

implication of the proposed grafting
mechanism, it is to be expected that the
use of a more polar solvent than tol
will generate a more uniform
distribution of grafting sites by
increasing the mobility of the
aminopropylsilane molecules. We have
tested this hypothesis by comparing the
grafting behavior of BTMSPA in toluene
and THF. The results are shown in Figure
9. While the grafting yield remains
essentially unchanged when THF is used
as a solvent, the strong luminescence of
the FITC coupled BTMSPA/THF sample
suggests decreased clustering.
Furthermore, the PSD of the
BTMSPA/THF sample is shifted to
smaller pore s
amount, comparable to APTMS/toluene
samples.
solvents bears important consequences.
Site isolated grafting is favored and the
formation of multilayer coverages
becomes less likely in the case of e
silane. The latter was observed for the
room temperature functionalization of
an external zeolite surface with APTES.
For a given aminopropylsilane it is
therefore possible to tune the
distribution of the grafting sites and the
degree of silane clu
an appropriate solvent. Such solvent
effects are less distinct in the case of
weakly interacting aminopropylsilanes,
that is, primary aminopropylsilanes with
small numbers of alkoxy groups.
Solvent Effects.
implication of the proposed grafting
mechanism, it is to be expected that the
use of a more polar solvent than tol
will generate a more uniform
distribution of grafting sites by
increasing the mobility of the
aminopropylsilane molecules. We have
tested this hypothesis by comparing the
grafting behavior of BTMSPA in toluene
and THF. The results are shown in Figure
9. While the grafting yield remains
essentially unchanged when THF is used
as a solvent, the strong luminescence of
the FITC coupled BTMSPA/THF sample
suggests decreased clustering.
Furthermore, the PSD of the
BTMSPA/THF sample is shifted to
smaller pore s
amount, comparable to APTMS/toluene
samples.
The inhibition of clustering in polar
solvents bears important consequences.
Site isolated grafting is favored and the
formation of multilayer coverages
becomes less likely in the case of e
silane. The latter was observed for the
room temperature functionalization of
an external zeolite surface with APTES.
For a given aminopropylsilane it is
therefore possible to tune the
distribution of the grafting sites and the
degree of silane clu
an appropriate solvent. Such solvent
effects are less distinct in the case of
weakly interacting aminopropylsilanes,
that is, primary aminopropylsilanes with
small numbers of alkoxy groups.
Solvent Effects.
implication of the proposed grafting
mechanism, it is to be expected that the
use of a more polar solvent than tol
will generate a more uniform
distribution of grafting sites by
increasing the mobility of the
aminopropylsilane molecules. We have
tested this hypothesis by comparing the
grafting behavior of BTMSPA in toluene
and THF. The results are shown in Figure
9. While the grafting yield remains
essentially unchanged when THF is used
as a solvent, the strong luminescence of
the FITC coupled BTMSPA/THF sample
suggests decreased clustering.
Furthermore, the PSD of the
BTMSPA/THF sample is shifted to
smaller pore size by a considerable
amount, comparable to APTMS/toluene
The inhibition of clustering in polar
solvents bears important consequences.
Site isolated grafting is favored and the
formation of multilayer coverages
becomes less likely in the case of e
silane. The latter was observed for the
room temperature functionalization of
an external zeolite surface with APTES.
For a given aminopropylsilane it is
therefore possible to tune the
distribution of the grafting sites and the
degree of silane clustering by choosing
an appropriate solvent. Such solvent
effects are less distinct in the case of
weakly interacting aminopropylsilanes,
that is, primary aminopropylsilanes with
small numbers of alkoxy groups.
As a further
implication of the proposed grafting
mechanism, it is to be expected that the
use of a more polar solvent than tol
will generate a more uniform
distribution of grafting sites by
increasing the mobility of the
aminopropylsilane molecules. We have
tested this hypothesis by comparing the
grafting behavior of BTMSPA in toluene
and THF. The results are shown in Figure
9. While the grafting yield remains
essentially unchanged when THF is used
as a solvent, the strong luminescence of
the FITC coupled BTMSPA/THF sample
suggests decreased clustering.
Furthermore, the PSD of the
BTMSPA/THF sample is shifted to
ize by a considerable
amount, comparable to APTMS/toluene
The inhibition of clustering in polar
solvents bears important consequences.
Site isolated grafting is favored and the
formation of multilayer coverages
becomes less likely in the case of e
silane. The latter was observed for the
room temperature functionalization of
an external zeolite surface with APTES.
For a given aminopropylsilane it is
therefore possible to tune the
distribution of the grafting sites and the
stering by choosing
an appropriate solvent. Such solvent
effects are less distinct in the case of
weakly interacting aminopropylsilanes,
that is, primary aminopropylsilanes with
small numbers of alkoxy groups.
71
As a further
implication of the proposed grafting
mechanism, it is to be expected that the
use of a more polar solvent than toluene
will generate a more uniform
distribution of grafting sites by
increasing the mobility of the
aminopropylsilane molecules. We have
tested this hypothesis by comparing the
grafting behavior of BTMSPA in toluene
and THF. The results are shown in Figure
9. While the grafting yield remains
essentially unchanged when THF is used
as a solvent, the strong luminescence of
the FITC coupled BTMSPA/THF sample
suggests decreased clustering.
Furthermore, the PSD of the
BTMSPA/THF sample is shifted to
ize by a considerable
amount, comparable to APTMS/toluene
The inhibition of clustering in polar
solvents bears important consequences.
Site isolated grafting is favored and the
formation of multilayer coverages
becomes less likely in the case of excess
silane. The latter was observed for the
room temperature functionalization of
an external zeolite surface with APTES.31
For a given aminopropylsilane it is
therefore possible to tune the
distribution of the grafting sites and the
stering by choosing
an appropriate solvent. Such solvent
effects are less distinct in the case of
weakly interacting aminopropylsilanes,
that is, primary aminopropylsilanes with
Figure 9. Top: PL spectra of FITC couple
samples grafted with BTMSPA in THF and
toluene, respectively (excitation at 450 nm).
The spectra in the left panel were measured
on dry samples. The right panel shows the
corresponding spectra measured on equally
concentrated suspensions in
toluene/triet
bottom panel. Fluorescein contents are
(20.0 ± 1.0) µmol/g.
Conclusions
The structure of an aminopropylsilane
determines its grafting behavior.
Grafting yields strongly depend on the
type of amine, while the uniformity of
the amine site distribution on the
mesoporous silica surface is mainly
determined by the number of alkoxy
groups. Consequently, the brightness of
Top: PL spectra of FITC couple
samples grafted with BTMSPA in THF and
toluene, respectively (excitation at 450 nm).
The spectra in the left panel were measured
on dry samples. The right panel shows the
corresponding spectra measured on equally
concentrated suspensions in
toluene/triethylamine. PSDs are given in the
bottom panel. Fluorescein contents are
(20.0 ± 1.0) µmol/g.
Conclusions
The structure of an aminopropylsilane
determines its grafting behavior.
Grafting yields strongly depend on the
type of amine, while the uniformity of
he amine site distribution on the
mesoporous silica surface is mainly
determined by the number of alkoxy
groups. Consequently, the brightness of
Top: PL spectra of FITC couple
samples grafted with BTMSPA in THF and
toluene, respectively (excitation at 450 nm).
The spectra in the left panel were measured
on dry samples. The right panel shows the
corresponding spectra measured on equally
concentrated suspensions in
hylamine. PSDs are given in the
bottom panel. Fluorescein contents are
The structure of an aminopropylsilane
determines its grafting behavior.
Grafting yields strongly depend on the
type of amine, while the uniformity of
he amine site distribution on the
mesoporous silica surface is mainly
determined by the number of alkoxy
groups. Consequently, the brightness of
Top: PL spectra of FITC coupled
samples grafted with BTMSPA in THF and
toluene, respectively (excitation at 450 nm).
The spectra in the left panel were measured
on dry samples. The right panel shows the
corresponding spectra measured on equally
concentrated suspensions in
hylamine. PSDs are given in the
bottom panel. Fluorescein contents are
The structure of an aminopropylsilane
determines its grafting behavior.
Grafting yields strongly depend on the
type of amine, while the uniformity of
he amine site distribution on the
mesoporous silica surface is mainly
determined by the number of alkoxy
groups. Consequently, the brightness of

72
FITC coupled samples can be maximized
by employing monoalkoxysilanes instead
of the widely used trialkoxysilanes as
postsynthetically applied surface
anchors. Dipodal trialkoxysilanes react
preferably with sites on the external
surface and at the pore entrances and
are therefore candidates for selective
external surface modification. Finally,
the polarity of the solvent is essential for
controlling the grafting site distribution
and the degree of clustering. Clustering
is minimized with increasing polarity,
while the distribution becomes more
uniform as the aminopropylsilane
molecules are able to reach less
accessible sites on the internal surface.
Means to control the distribution of
grafting sites on mesoporous silica are
essential for a variety of potential
applications. Optical sensing and cell
marking applications rely on a high
brightness of the luminescent silica
particles, thus requiring site isolated
chromophores.18,32 On the other hand,
the accumulation of grafted molecules
on the external surface and at the pore
entrances is of interest for the design of
advanced drug delivery systems.6c
Acknowledgments.
Financial support was provided by the
Swiss National Science Foundation
(project 200021-109185).
References
(1) Beck, J. S.; Vartuli, J. C.; Roth, W. J.; Leonowicz, M. E.; Kresge, C. T.; Schmitt, K. D.;
Chu, C. T. W.; Olson, D. H.; Sheppard, E. W.; McCullen, S. B.; Higgins, J. B.; Schlenker,
J. L. J. Am. Chem. Soc. 1992, 114, 10834.
(2) (a) Taguchi, A.; Schüth, F. Microporous Mesoporous Mater. 2005, 77, 1. (b) De
Vos, D. E.; Dams, M.; Sels, B. F.; Jacobs, P. A. Chem. Rev. 2002, 102, 3615.
(3) Wark, M.; Rohlfing, Y.; Altindag, Y.; Wellmann, H. Phys. Chem. Chem. Phys. 2003,
5, 5188.
(4) Scott, B. J.; Wirnsberger, G.; Stucky, G. D. Chem. Mater. 2001, 13, 3140.
(5) (a) Yoshitake, H.; Yokoi, T.; Tatsumi, T. Chem. Mater. 2002, 14, 4603. (b) Liu, J.;
Feng, X.; Fryxell, G. E.; Wang, L.-Q.; Kim, A. Y.; Gong, M. Adv. Mater. 1998, 10, 161.
(6) (a) Lai, C.-Y.; Trewyn, B. G.; Jeftinija, D. M.; Jeftinija, K.; Xu, S.; Jeftinija, S.; Lin, V.
S.-Y. J. Am. Chem. Soc. 2003, 125, 4451. (b) Muñoz, B.; Rámila, A.; Pérez-Pariente, J.;
Diaz, I.; Vallet-Regi, M. Chem. Mater. 2003, 15, 500. (c) Mal, N. K.; Fujiwara, M.;
Tanaka, Y. Nature 2003, 421, 350.
(7) (a) Yokoi, T.; Yoshitake, H.; Tatsumi, T. J. Mater. Chem. 2004, 14, 951. (b) Lim, M.
H.; Stein, A. Chem. Mater. 1999, 11, 3285. (c) Singh, U. G.; Williams, R. T.; Hallam, K.
R.; Allen, G. C. J. Solid State Sci. 2005, 178, 3405.
73
(8) Shephard, D. S.; Zhou, W.; Maschmeyer, T.; Matters, J. M.; Roper, C. L.; Parsons,
S.; Johnson, B. F. G.; Duer, M. J. Angew. Chem. Int. Ed. 1998, 37, 2719.
(9) Hicks, J. C.; Jones, C. W. Langmuir 2006, 22, 2676.
(10) Shin, Y.; Liu, J.; Wang, L.-Q.; Nie, Z.; Samuels, W. D.; Fryxell, G. E.; Exarhos, G. J.
Angew. Chem. Int. Ed. 2000, 39, 2702.
(11) Brühwiler, D.; Frei, H. J. Phys. Chem. B 2003, 107, 8547.
(12) Brunauer, S.; Emmett, P. H.; Teller, E. J. Am. Chem. Soc. 1938, 60, 309.
(13) Kruk, M.; Jaroniec, M.; Ryoo, R.; Kim, J. M. Microporous Mater. 1997, 12, 93.
(14) Barrett, E. P.; Joyner, L. G.; Halenda, P. P. J. Am. Chem. Soc. 1951, 73, 373.
(15) Kruk, M.; Jaroniec, M.; Sayari, A. J. Phys. Chem. B 1997, 101, 583.
(16) Kimura, T.; Kuroda, K.; Sugahara, Y.; Kuroda, K. J. Porous Mater. 1998, 5, 127.
(17) Zhao, X. S.; Lu, G. Q.; Whittaker, A. K.; Millar, G. J.; Zhu, H. Y. J. Phys. Chem. B
1997, 101, 6525.
(18) Wirnsberger, G.; Scott, B. J.; Stucky, G. D. Chem. Commun. 2001, 119.
(19) Martin, M. M.; Lindqvist, L. J. Lumin. 1975, 10, 381.
(20) Weber, G.; Teale, F. W. J. Trans. Faraday Soc. 1958, 54, 640.
(21) Kawski, A. Photochem. Photobiol. 1983, 38, 487.
(22) Brand, M.; Frings, A.; Jenkner, P.; Lehnert, R.; Metternich, H. J.; Monkiewicz, J.;
Schram, J. Z. Naturforsch., B: Chem. Sci. 1999, 54, 155.
(23) Waddell, T. G.; Leyden, D. E.; DeBello, M. T. J. Am. Chem. Soc. 1981, 103, 5303.
(24) Kirkland, J. J.; Glajch, J. L.; Farlee, R. D. Anal. Chem. 1989, 61, 2.
(25) Vrancken, K. C.; Possemiers, K.; Van Der Voort, P.; Vansant, E. F. Colloids Surf. A
1995, 98, 235.
(26) Sonwane, C. G.; Jones, C. W.; Ludovice, P. J. J. Phys. Chem. B 2005, 109, 23395.
(27) Ek, S.; Root, A.; Peussa, M.; Niinistö, L. Thermochim. Acta 2001, 379, 201.
(28) Kanan, S. M.; Tze, W. T. Y.; Tripp, C. P. Langmuir 2002, 18, 6623.
(29) Vrancken, K. C.; Van Der Voort, P.; Gillis-D'Hamers, I.; Vansant, E. F.; Grobet, P. J.
Chem. Soc. Faraday Trans. 1992, 88, 3197.
(30) Caravajal, G. S.; Leyden, D. E.; Quinting, G. R.; Maciel, G. E. Anal. Chem. 1988,
60, 1776.
(31) Brühwiler, D.; Calzaferri, G. Comptes Rendus Chimie 2005, 8, 391.
(32) Lin, Y.-S.; Tsai, C.-P.; Huang, H.-Y.; Kuo, C.-T.; Hung, Y.; Huang, D.-M.; Chen, Y.-C.;
Mou, C.-Y. Chem. Mater. 2005, 17, 4570.
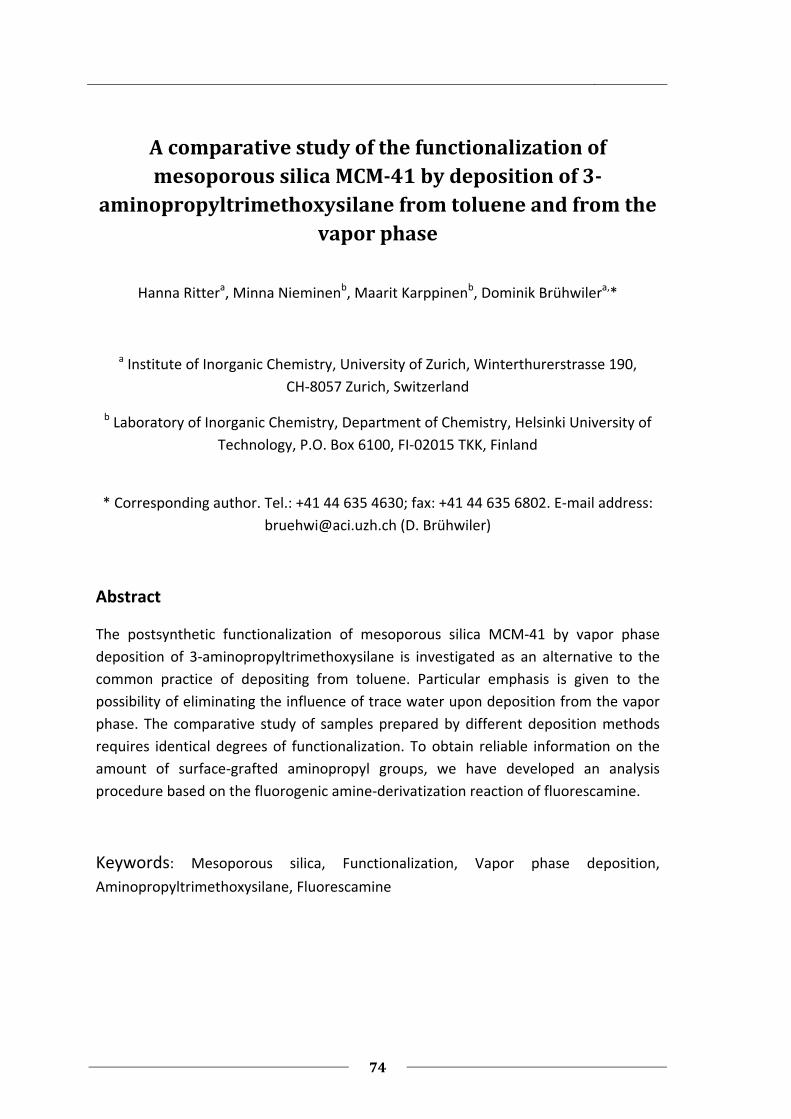
74
A comparative study of the functionalization of
mesoporous silica MCM-41 by deposition of 3-
aminopropyltrimethoxysilane from toluene and from the
vapor phase
Hanna Rittera, Minna Nieminenb, Maarit Karppinenb, Dominik Brühwilera,*
a Institute of Inorganic Chemistry, University of Zurich, Winterthurerstrasse 190,
CH-8057 Zurich, Switzerland
b Laboratory of Inorganic Chemistry, Department of Chemistry, Helsinki University of
Technology, P.O. Box 6100, FI-02015 TKK, Finland
* Corresponding author. Tel.: +41 44 635 4630; fax: +41 44 635 6802. E-mail address:
[email protected] (D. Brühwiler)
Abstract
The postsynthetic functionalization of mesoporous silica MCM-41 by vapor phase
deposition of 3-aminopropyltrimethoxysilane is investigated as an alternative to the
common practice of depositing from toluene. Particular emphasis is given to the
possibility of eliminating the influence of trace water upon deposition from the vapor
phase. The comparative study of samples prepared by different deposition methods
requires identical degrees of functionalization. To obtain reliable information on the
amount of surface-grafted aminopropyl groups, we have developed an analysis
procedure based on the fluorogenic amine-derivatization reaction of fluorescamine.
Keywords: Mesoporous silica, Functionalization, Vapor phase deposition,
Aminopropyltrimethoxysilane, Fluorescamine

75
1. Introduction
Aminopropyltrialkoxysilanes are among
the most frequently used precursors for
the modification of mesoporous silica
surfaces, allowing subsequent coupling
to a variety of functional groups, such as
isothiocyanate or sulfonyl chloride [1].
Amino-functionalized mesoporous silica
furthermore plays an important role in
the development of materials for a wide
range of potential applications, including
adsorption of metal ions [2], protein
sequestration and release [3], enzyme
immobilization [4], drug delivery [5], and
catalysis [6]. Despite considerable
progress in the development of
advanced methods for the one-pot
synthesis of functionalized mesoporous
silica [7], approaches based on
postsynthetic functionalization remain
popular due to the fact that the
separation of the silica synthesis and
functionalization steps allows an
independent and more straightforward
control of pore size, periodicity, particle
size, and particle morphology.
The reaction of surface silanol groups
with aminopropylalkoxysilanes is usually
conducted by refluxing in toluene. Due
to the high accessibility of the sites on
the external particle surface and on the
pore surface close to the channel
entrances, the distribution of anchored
amino groups in the final product is
typically inhomogeneous [8]. We have
recently shown that aminopropyl-
monoalkoxysilanes produce a more
homogeneous distribution than the
corresponding trialkoxysilanes [9]. The
presence of only one reactive group
increases the mobility of the silane on
the silica surface, while excluding the
possibility of cross-linking.
It is difficult to avoid hydrolysis and
cross-linking when depositing trialkoxy-
or trichlorosilanes from a solvent. Even
when working in dry solvents, trace
water is efficiently adsorbed on the silica
surface such that hydrolysis becomes
possible [10]. It has been proposed that
the employment of vapor phase
deposition techniques might facilitate
the elimination of silane cross-linking,
thus minimizing clustering and
multilayer formation [11]. In the case of
mesoporous silica, this should ultimately
lead to a more uniform distribution of
the grafted moieties, resulting in a well-
defined pore size of the functionalized
material. In order to assess the validity
of this hypothesis, we have in the
present contribution investigated the
postsynthetic functionalization of
mesoporous silica MCM-41 with 3-
aminopropyltrimethoxysilane (APTMS)
by deposition from toluene and from the
vapor phase. In the latter case, the
atomic layer deposition (ALD) technique
based on self-limiting surface reactions
was employed, which is known to enable
the deposition of vaporized precursor
molecules in a highly reproducible and
homogeneous manner [11].

76
2. Experimental
2.1. Synthesis of MCM-41
As large batch sizes are required for
comparative studies, we have used a
scale-up friendly room temperature
procedure based on the synthesis
reported in reference 12. Briefly, 17.6 g
of the structure directing agent CTAB
(hexadecyltrimethylammonium
bromide, Fluka, purum, ≥ 96 %) was
dissolved under slight warming in a
mixture of 416 mL of distilled H2O and
192 mL of aqueous ammonia (25 % NH3,
Fluka). To this clear solution, 80 mL of
TEOS (tetraethoxysilane, Fluka, puriss., ≥
99 %) was slowly added under stirring.
After further stirring for 3 h, the gel was
aged at room temperature for 24 h in a
closed container. The product was
obtained by filtration, washed with
copious amounts of distilled H2O, and
dried in air at room temperature. The
structure directing agent was removed
by first heating at 300 °C for 2 h and
then calcining in air at 550 °C for 16 h.
Heating rates of approximately 2 °C/min
were used. The procedure yielded 19.3 g
of calcined MCM-41.
2.2. Vapor phase deposition
Reactions were performed in an ALD
reactor (F-120 ASM Microchemistry Ltd.)
at a pressure of 35 to 50 mbar. A 2.0 g
sample of calcined MCM-41 was
pretreated in the ALD reactor in nitrogen
atmosphere at 180 °C for 3 h to remove
physisorbed water [13]. An amount of
2.5 mL (14.2 mmol) of APTMS (Fluka,
purum, ≥ 97 %) was subsequently
vaporized at 100 °C and deposited onto
the MCM-41 bed during 3 h at a selected
reaction temperature in the range of
110 to 300 °C. Finally, physisorbed
APTMS molecules were purged from the
surface by flowing nitrogen for 2 h.
Amino group analysis (see below)
yielded a final amino loading of 1.2
mmol per gram of parent MCM-41. A
further increase of the amount of
vaporized APTMS did not lead to an
increase in the final amino group
content, indicating that the value of 1.2
mmol/g corresponds to the maximum
loading which could be achieved by this
deposition method.
2.3. Deposition from toluene
In a typical experiment, 0.5 g of calcined
MCM-41 was pretreated at 180 °C for 2
h and dispersed in 30 mL of dry toluene
(Fluka, puriss., H2O ≤ 50 ppm). After the
addition of a calculated amount of
APTMS (160 µL for the targeted
functionalization degree of 1.2 mmol per
gram of parent MCM-41), the
suspension was refluxed for 3 h. The
functionalized product was recovered by
filtration, washed with 100 mL of
ethanol, and oven-dried at 80 °C for 1 h.
2.4. Amino group analysis
15 mg of amino-functionalized MCM-41
was stirred in 30 mL of a 0.02 M
aqueous solution of NaOH until
completely dissolved. 100 µL of this

77
solution was transferred into a quartz
cuvette and 2 mL of phosphate buffer
(0.2 M, pH 8.0) was added. After the
addition of 1 mL of fluorescamine
(Sigma, > 97 %) solution (1 mM in
acetone), the fluorescence spectrum
was measured with a Perkin-Elmer
LS50B spectrofluorometer by excitation
at 366 nm. The emission intensity at 480
nm was taken as the datum point. A
calibration line was prepared
accordingly by using 100 µL aliquots of
differently concentrated solutions of
APTMS in 30 mL of 0.02 M aqueous
NaOH (containing 15 mg of dissolved
parent MCM-41).
2.5. Characterization
Nitrogen sorption isotherms were
collected at 77 K using a Quantachrome
NOVA 2200 surface area and pore size
analyzer. Samples were vacuum-
degassed at 80 °C for 5 h. The total
surface area was calculated by the BET
method [14], whereas the external
surface area and the primary mesopore
volume (the volume of the uniform
mesopores) were determined from the
linear part of the αS-plot (αS > 1) [15].
Mesopore size distributions were
evaluated from the desorption branches
of the nitrogen isotherms by means of
the BJH method [16]. In order to obtain
a more reliable estimate of the pore size
of the parent MCM-41, the NLDFT
method developed for silica exhibiting
cylindrical pore geometry was also
applied (NOVAWin2 software, Version
2.2, Quantachrome Instruments) [17]. In
this case, the adsorption branch was
used for the calculations [18]. The total
pore volume was calculated from the
amount of nitrogen adsorbed at a
relative pressure of 0.95. All samples
exhibited type IV isotherms [19] and
condensation in the primary mesopores
was not accompanied by hysteresis.
Diffuse reflectance infrared Fourier
transform spectroscopy (DRIFTS) was
performed using a Nicolet Magna IR 750
spectrometer equipped with a Spectra
Tech diffuse reflectance accessory.
Spectra were collected in the 400-4000
cm-1 range at a 2 cm-1 resolution over 64
scans. The spectrum obtained from a
steel mirror was used as a background.
Powder X-ray diffraction (XRD)
measurements were performed on a
STOE STADI P with CuKα1 radiation, a 2θ
step size of 0.1°, and a counting time of
30 s per step.
3. Results and Discussion
3.1. Parent MCM-41
Fig. 1 shows the nitrogen sorption
isotherms, pore size distribution (PSD),
and XRD pattern of a typical mesoporous
silica MCM-41 synthesized at room
temperature. The four XRD peaks, which
can be indexed on a hexagonal lattice
(hk0 reflections only), are indicative of
well ordered MCM-41 type materials
[20]. Due to its narrow PSD and the fact
that the material can be made available
in relatively large batches without
necessitating costly lab equipment, we
have found this material to be ideal for

comparative studies such as the present
one.
The standard BJH analysis is known to
underestimate the absolute pore size
[18]. A more reliable estimate is
obtained by the DFT method [17]
(dDFT = 3.54 nm vs. d
or by using the geometrical approach
proposed by Kruk et al. [
the latter formalism, our parent MCM
41 is characterized by an average pore
diameter of 3.41 nm and an average wall
thickness of 0.93 nm. Typical values for
BET surface area and total pore volume
are 910 m
primary me
cm3/g), respectively. The external
surface area accounts for approximately
12 % of the total surface area. The
particle size ranges from 0.5 to 2 µm
with irregular morphology.
3.2. Amino group analysis
In order to compare different d
techniques, it is essential to work under
conditions which yield a defined degree
of functionalization. This calls for a
method that is capable of providing
accurate information on the amount of
grafted amino groups. Analytical data
obtained with
[22]) were found to be unsatisfactory
and difficult to reproduce. Samples with
identical amounts of amino groups but
different distributions of grafting sites
(external surface vs. pore surface)
produced different results in terms o
the actual amount of detected amino
comparative studies such as the present
The standard BJH analysis is known to
underestimate the absolute pore size
[18]. A more reliable estimate is
obtained by the DFT method [17]
= 3.54 nm vs. d
or by using the geometrical approach
proposed by Kruk et al. [
the latter formalism, our parent MCM
41 is characterized by an average pore
diameter of 3.41 nm and an average wall
thickness of 0.93 nm. Typical values for
BET surface area and total pore volume
are 910 m2/g and 0.71 cm
primary mesopore volume of 0.58
/g), respectively. The external
surface area accounts for approximately
12 % of the total surface area. The
particle size ranges from 0.5 to 2 µm
with irregular morphology.
3.2. Amino group analysis
In order to compare different d
techniques, it is essential to work under
conditions which yield a defined degree
of functionalization. This calls for a
method that is capable of providing
accurate information on the amount of
grafted amino groups. Analytical data
obtained with ninhydrin (Kaiser test
[22]) were found to be unsatisfactory
and difficult to reproduce. Samples with
identical amounts of amino groups but
different distributions of grafting sites
(external surface vs. pore surface)
produced different results in terms o
the actual amount of detected amino
comparative studies such as the present
The standard BJH analysis is known to
underestimate the absolute pore size
[18]. A more reliable estimate is
obtained by the DFT method [17]
= 3.54 nm vs. dBJH = 2.47 nm, Fig. 1)
or by using the geometrical approach
proposed by Kruk et al. [21]. Based on
the latter formalism, our parent MCM
41 is characterized by an average pore
diameter of 3.41 nm and an average wall
thickness of 0.93 nm. Typical values for
BET surface area and total pore volume
/g and 0.71 cm3
sopore volume of 0.58
/g), respectively. The external
surface area accounts for approximately
12 % of the total surface area. The
particle size ranges from 0.5 to 2 µm
with irregular morphology.
3.2. Amino group analysis
In order to compare different d
techniques, it is essential to work under
conditions which yield a defined degree
of functionalization. This calls for a
method that is capable of providing
accurate information on the amount of
grafted amino groups. Analytical data
ninhydrin (Kaiser test
[22]) were found to be unsatisfactory
and difficult to reproduce. Samples with
identical amounts of amino groups but
different distributions of grafting sites
(external surface vs. pore surface)
produced different results in terms o
the actual amount of detected amino
comparative studies such as the present
The standard BJH analysis is known to
underestimate the absolute pore size
[18]. A more reliable estimate is
obtained by the DFT method [17]
= 2.47 nm, Fig. 1)
or by using the geometrical approach
21]. Based on
the latter formalism, our parent MCM-
41 is characterized by an average pore
diameter of 3.41 nm and an average wall
thickness of 0.93 nm. Typical values for
BET surface area and total pore volume 3/g (with a
sopore volume of 0.58
/g), respectively. The external
surface area accounts for approximately
12 % of the total surface area. The
particle size ranges from 0.5 to 2 µm
In order to compare different deposition
techniques, it is essential to work under
conditions which yield a defined degree
of functionalization. This calls for a
method that is capable of providing
accurate information on the amount of
grafted amino groups. Analytical data
ninhydrin (Kaiser test
[22]) were found to be unsatisfactory
and difficult to reproduce. Samples with
identical amounts of amino groups but
different distributions of grafting sites
(external surface vs. pore surface)
produced different results in terms of
the actual amount of detected amino
78
comparative studies such as the present
The standard BJH analysis is known to
underestimate the absolute pore size
[18]. A more reliable estimate is
obtained by the DFT method [17]
= 2.47 nm, Fig. 1)
or by using the geometrical approach
21]. Based on
-
41 is characterized by an average pore
diameter of 3.41 nm and an average wall
thickness of 0.93 nm. Typical values for
BET surface area and total pore volume
/g (with a
sopore volume of 0.58
/g), respectively. The external
surface area accounts for approximately
12 % of the total surface area. The
particle size ranges from 0.5 to 2 µm
eposition
techniques, it is essential to work under
conditions which yield a defined degree
of functionalization. This calls for a
method that is capable of providing
accurate information on the amount of
grafted amino groups. Analytical data
ninhydrin (Kaiser test
[22]) were found to be unsatisfactory
and difficult to reproduce. Samples with
identical amounts of amino groups but
different distributions of grafting sites
(external surface vs. pore surface)
f
the actual amount of detected amino
Fig. 1.
mesoporous silica MCM
room temperature. Top: Nitrogen
adsorption (solid circles) and desorption
(empty circles) isotherm. The high pressure
hysteresis loop is due to secondary
mesoporosity. Middle: Pore size
distributions calculated by BJH and DFT
methods. Bottom: XRD pat
groups. We believe that the reason for
this discrepancy is the diminished
accessibility of the sites deep inside the
pores. Problems of this kind are
Fig. 1. Characterization data of calcined
mesoporous silica MCM
room temperature. Top: Nitrogen
adsorption (solid circles) and desorption
(empty circles) isotherm. The high pressure
hysteresis loop is due to secondary
mesoporosity. Middle: Pore size
distributions calculated by BJH and DFT
methods. Bottom: XRD pat
groups. We believe that the reason for
this discrepancy is the diminished
accessibility of the sites deep inside the
pores. Problems of this kind are
Characterization data of calcined
mesoporous silica MCM-41 synthesiz
room temperature. Top: Nitrogen
adsorption (solid circles) and desorption
(empty circles) isotherm. The high pressure
hysteresis loop is due to secondary
mesoporosity. Middle: Pore size
distributions calculated by BJH and DFT
methods. Bottom: XRD pattern.
groups. We believe that the reason for
this discrepancy is the diminished
accessibility of the sites deep inside the
pores. Problems of this kind are
Characterization data of calcined
41 synthesized at
room temperature. Top: Nitrogen
adsorption (solid circles) and desorption
(empty circles) isotherm. The high pressure
hysteresis loop is due to secondary
mesoporosity. Middle: Pore size
distributions calculated by BJH and DFT
tern.
groups. We believe that the reason for
this discrepancy is the diminished
accessibility of the sites deep inside the
pores. Problems of this kind are
Characterization data of calcined
ed at
room temperature. Top: Nitrogen
adsorption (solid circles) and desorption
(empty circles) isotherm. The high pressure
hysteresis loop is due to secondary
mesoporosity. Middle: Pore size
distributions calculated by BJH and DFT
groups. We believe that the reason for
this discrepancy is the diminished
accessibility of the sites deep inside the
pores. Problems of this kind are

common for analytical methods
employing mesoporous silica with intac
pore structure. Methods based on the
elemental analysis of amino groups
obviously do not suffer from this
drawback, however, sufficient precision
can only be expected for samples
featuring high grafting densities [23]. We
have therefore developed a metho
affords a reliable determination of the
amount of grafted amino groups
independent of the pore size and
grafting site distribution, while covering
a wide range of functionalization
degrees. The key reaction of this method
is based on the fluorometri
quantitation of primary amines with
fluorescamine [24]. To eliminate the
effect of the grafting site distribution,
the mesoporous framework is
decomposed prior to the addition of
fluorescamine. Reaction of the
intrinsically non
fluorescamine
accessible primary amines yields a
fluorescent derivative. The fluorescence
intensity is then used to determine the
initial amino group content by means of
a calibration line (Fig. 2).
3.3. Deposition temperature
Previous studies on t
deposition of 3
silane (APTES) on silica have shown that
the deposition
important parameter
determining the binding mode of the
silane to the silica surface, revealing that
unwanted secondar
common for analytical methods
employing mesoporous silica with intac
pore structure. Methods based on the
elemental analysis of amino groups
obviously do not suffer from this
drawback, however, sufficient precision
can only be expected for samples
featuring high grafting densities [23]. We
have therefore developed a metho
affords a reliable determination of the
amount of grafted amino groups
independent of the pore size and
grafting site distribution, while covering
a wide range of functionalization
degrees. The key reaction of this method
is based on the fluorometri
quantitation of primary amines with
fluorescamine [24]. To eliminate the
effect of the grafting site distribution,
the mesoporous framework is
decomposed prior to the addition of
fluorescamine. Reaction of the
intrinsically non
fluorescamine with the now fully
accessible primary amines yields a
fluorescent derivative. The fluorescence
intensity is then used to determine the
initial amino group content by means of
a calibration line (Fig. 2).
3.3. Deposition temperature
Previous studies on t
deposition of 3-aminopropyltriethoxy
silane (APTES) on silica have shown that
the deposition temperature is an
important parameter
determining the binding mode of the
silane to the silica surface, revealing that
unwanted secondary reactions involving
common for analytical methods
employing mesoporous silica with intac
pore structure. Methods based on the
elemental analysis of amino groups
obviously do not suffer from this
drawback, however, sufficient precision
can only be expected for samples
featuring high grafting densities [23]. We
have therefore developed a metho
affords a reliable determination of the
amount of grafted amino groups
independent of the pore size and
grafting site distribution, while covering
a wide range of functionalization
degrees. The key reaction of this method
is based on the fluorometri
quantitation of primary amines with
fluorescamine [24]. To eliminate the
effect of the grafting site distribution,
the mesoporous framework is
decomposed prior to the addition of
fluorescamine. Reaction of the
intrinsically non-fluorescent
with the now fully
accessible primary amines yields a
fluorescent derivative. The fluorescence
intensity is then used to determine the
initial amino group content by means of
a calibration line (Fig. 2).
3.3. Deposition temperature
Previous studies on the vapor phase
aminopropyltriethoxy
silane (APTES) on silica have shown that
temperature is an
important parameter in terms of
determining the binding mode of the
silane to the silica surface, revealing that
y reactions involving
79
common for analytical methods
employing mesoporous silica with intact
pore structure. Methods based on the
elemental analysis of amino groups
obviously do not suffer from this
drawback, however, sufficient precision
can only be expected for samples
featuring high grafting densities [23]. We
have therefore developed a method that
affords a reliable determination of the
amount of grafted amino groups
independent of the pore size and
grafting site distribution, while covering
a wide range of functionalization
degrees. The key reaction of this method
is based on the fluorometric
quantitation of primary amines with
fluorescamine [24]. To eliminate the
effect of the grafting site distribution,
the mesoporous framework is
decomposed prior to the addition of
fluorescamine. Reaction of the
fluorescent
with the now fully
accessible primary amines yields a
fluorescent derivative. The fluorescence
intensity is then used to determine the
initial amino group content by means of
he vapor phase
aminopropyltriethoxy-
silane (APTES) on silica have shown that
temperature is an
in terms of
determining the binding mode of the
silane to the silica surface, revealing that
y reactions involving
Fig. 2. Fluorogenic amine
reaction of fluorescamine and a
corresponding calibration line prepared with
APTMS.
the formation of Si
temperatures higher than 150 °C [25].
We observed a similar effect i
preliminary vapor phase depositions of
APTMS on MCM
selected temperatures (see Fig. 3 for the
DRIFT spectra of these samples).
Stretching frequencies of the primary
amino groups are observed at 3305 and
3373 cm-1. Additional bands a
3470 cm-1 assigned to Si
develop at deposition temperatures
higher than 150 °C. The contribution of
Si–NH–C binding modes is significant
already at 250 °C. In order to avoid the
reaction of amino groups with surface
silanol groups
bridges, as well as with the methoxysilyl
groups of other APTMS molecules, the
deposition temperature was fixed at 150
°C for the final experiments. Under these
conditions, the reaction of methanol,
Fluorogenic amine
reaction of fluorescamine and a
corresponding calibration line prepared with
the formation of Si–
temperatures higher than 150 °C [25].
We observed a similar effect i
preliminary vapor phase depositions of
APTMS on MCM-41 carried out at
selected temperatures (see Fig. 3 for the
DRIFT spectra of these samples).
Stretching frequencies of the primary
amino groups are observed at 3305 and
. Additional bands a
assigned to Si
develop at deposition temperatures
higher than 150 °C. The contribution of
C binding modes is significant
already at 250 °C. In order to avoid the
reaction of amino groups with surface
silanol groups or strained siloxane
bridges, as well as with the methoxysilyl
groups of other APTMS molecules, the
deposition temperature was fixed at 150
°C for the final experiments. Under these
conditions, the reaction of methanol,
Fluorogenic amine-derivatization
reaction of fluorescamine and a
corresponding calibration line prepared with
–N bonds occur at
temperatures higher than 150 °C [25].
We observed a similar effect i
preliminary vapor phase depositions of
41 carried out at
selected temperatures (see Fig. 3 for the
DRIFT spectra of these samples).
Stretching frequencies of the primary
amino groups are observed at 3305 and
. Additional bands at 3437 and
assigned to Si–NH–C moieties
develop at deposition temperatures
higher than 150 °C. The contribution of
C binding modes is significant
already at 250 °C. In order to avoid the
reaction of amino groups with surface
or strained siloxane
bridges, as well as with the methoxysilyl
groups of other APTMS molecules, the
deposition temperature was fixed at 150
°C for the final experiments. Under these
conditions, the reaction of methanol,
derivatization
reaction of fluorescamine and a
corresponding calibration line prepared with
N bonds occur at
temperatures higher than 150 °C [25].
We observed a similar effect in our
preliminary vapor phase depositions of
41 carried out at
selected temperatures (see Fig. 3 for the
DRIFT spectra of these samples).
Stretching frequencies of the primary
amino groups are observed at 3305 and
t 3437 and
C moieties
develop at deposition temperatures
higher than 150 °C. The contribution of
C binding modes is significant
already at 250 °C. In order to avoid the
reaction of amino groups with surface
or strained siloxane
bridges, as well as with the methoxysilyl
groups of other APTMS molecules, the
deposition temperature was fixed at 150
°C for the final experiments. Under these
conditions, the reaction of methanol,

which is formed upon grafting of APT
with surface silanol groups is unlikely
[11,26]. No secondary reactions
involving the formation of Si
occurred upon deposition of APTMS
from toluene under reflux.
Fig. 3. DRIFT spectra of MCM
phase deposition of APTMS a
150 °C (B), 250 °C (C), and 300 °C (D). The
dashed curve represents the spectrum of
calcined MCM
3.4. Comparison of the deposition
methods
It is worth mentioning at this point that
the investigated samples, assumi
homogeneous distribution and an initial
BET surface area of 910 m
synthesized with a surface coverage of
0.79 –NH
functionalization degree of 1.2 mmol/g).
Fig. 4A compares the PSDs of MCM
after deposition of AP
vapor phase (sample Vap
from toluene (sample Tol
former producing a material with a
which is formed upon grafting of APT
with surface silanol groups is unlikely
[11,26]. No secondary reactions
involving the formation of Si
occurred upon deposition of APTMS
from toluene under reflux.
DRIFT spectra of MCM
phase deposition of APTMS a
150 °C (B), 250 °C (C), and 300 °C (D). The
dashed curve represents the spectrum of
calcined MCM-41 before APTMS deposition.
3.4. Comparison of the deposition
methods
It is worth mentioning at this point that
the investigated samples, assumi
homogeneous distribution and an initial
BET surface area of 910 m
synthesized with a surface coverage of
NH2 per nm
functionalization degree of 1.2 mmol/g).
Fig. 4A compares the PSDs of MCM
after deposition of AP
vapor phase (sample Vap
from toluene (sample Tol
former producing a material with a
which is formed upon grafting of APT
with surface silanol groups is unlikely
[11,26]. No secondary reactions
involving the formation of Si
occurred upon deposition of APTMS
from toluene under reflux.
DRIFT spectra of MCM-41 after vapor
phase deposition of APTMS at 110 °C (A),
150 °C (B), 250 °C (C), and 300 °C (D). The
dashed curve represents the spectrum of
41 before APTMS deposition.
3.4. Comparison of the deposition
It is worth mentioning at this point that
the investigated samples, assumi
homogeneous distribution and an initial
BET surface area of 910 m
synthesized with a surface coverage of
per nm2 (corresponding to a
functionalization degree of 1.2 mmol/g).
Fig. 4A compares the PSDs of MCM
after deposition of APTMS from the
vapor phase (sample Vap-APTMS) and
from toluene (sample Tol-APTMS), the
former producing a material with a
which is formed upon grafting of APTMS,
with surface silanol groups is unlikely
[11,26]. No secondary reactions
involving the formation of Si–N bonds
occurred upon deposition of APTMS
41 after vapor
t 110 °C (A),
150 °C (B), 250 °C (C), and 300 °C (D). The
dashed curve represents the spectrum of
41 before APTMS deposition.
3.4. Comparison of the deposition
It is worth mentioning at this point that
the investigated samples, assuming a
homogeneous distribution and an initial
BET surface area of 910 m2/g, were
synthesized with a surface coverage of
(corresponding to a
functionalization degree of 1.2 mmol/g).
Fig. 4A compares the PSDs of MCM-41
TMS from the
APTMS) and
APTMS), the
former producing a material with a
80
MS,
with surface silanol groups is unlikely
[11,26]. No secondary reactions
N bonds
occurred upon deposition of APTMS
41 after vapor
t 110 °C (A),
150 °C (B), 250 °C (C), and 300 °C (D). The
dashed curve represents the spectrum of
41 before APTMS deposition.
3.4. Comparison of the deposition
It is worth mentioning at this point that
ng a
homogeneous distribution and an initial
/g, were
synthesized with a surface coverage of
(corresponding to a
functionalization degree of 1.2 mmol/g).
41
TMS from the
APTMS) and
APTMS), the
former producing a material with a
Fig. 4.
APTMS fro
crosses) compared to the PSD of MCM
after deposition of APTMS from toluene
(Tol-APTMS, empty circles).
41 after deposition of APTMS from toluene
without (Tol
prior vacuum distill
APTMS
given relative to the average pore diameter
of the parent MCM
contents are 1.2 mmol/g for each sample.
narrower PSD (full width at half
maximum FWHM = 0.30 nm, compared
to FWHM = 0.42 nm for Tol
remove potential APTMS oligomers,
have repeated the deposition from
toluene using freshly vacuum distilled
APTMS (sample Tol
seen from Fig. 4B, the PSD of the
resulting functionalized MCM
slightly more uniform and narrower
Fig. 4. A: PSD of MCM
APTMS from the vapor phase (Vap
crosses) compared to the PSD of MCM
after deposition of APTMS from toluene
APTMS, empty circles).
41 after deposition of APTMS from toluene
without (Tol-APTMS, empty circles) and with
prior vacuum distill
APTMS-d, solid circles). Pore diameters are
given relative to the average pore diameter
of the parent MCM
contents are 1.2 mmol/g for each sample.
narrower PSD (full width at half
maximum FWHM = 0.30 nm, compared
to FWHM = 0.42 nm for Tol
remove potential APTMS oligomers,
have repeated the deposition from
toluene using freshly vacuum distilled
APTMS (sample Tol
seen from Fig. 4B, the PSD of the
resulting functionalized MCM
slightly more uniform and narrower
: PSD of MCM-41 after deposition of
m the vapor phase (Vap
crosses) compared to the PSD of MCM
after deposition of APTMS from toluene
APTMS, empty circles). B: PSD of MCM
41 after deposition of APTMS from toluene
APTMS, empty circles) and with
prior vacuum distillation of APTMS (Tol
d, solid circles). Pore diameters are
given relative to the average pore diameter
of the parent MCM-41. Amino group
contents are 1.2 mmol/g for each sample.
narrower PSD (full width at half
maximum FWHM = 0.30 nm, compared
to FWHM = 0.42 nm for Tol
remove potential APTMS oligomers,
have repeated the deposition from
toluene using freshly vacuum distilled
APTMS (sample Tol-APTMS-
seen from Fig. 4B, the PSD of the
resulting functionalized MCM
slightly more uniform and narrower
41 after deposition of
m the vapor phase (Vap-APTMS,
crosses) compared to the PSD of MCM-
after deposition of APTMS from toluene
: PSD of MCM
41 after deposition of APTMS from toluene
APTMS, empty circles) and with
ation of APTMS (Tol
d, solid circles). Pore diameters are
given relative to the average pore diameter
41. Amino group
contents are 1.2 mmol/g for each sample.
narrower PSD (full width at half
maximum FWHM = 0.30 nm, compared
to FWHM = 0.42 nm for Tol-APTMS). To
remove potential APTMS oligomers, we
have repeated the deposition from
toluene using freshly vacuum distilled
-d). As can be
seen from Fig. 4B, the PSD of the
resulting functionalized MCM-41 is
slightly more uniform and narrower
41 after deposition of
APTMS,
-41
after deposition of APTMS from toluene
: PSD of MCM-
41 after deposition of APTMS from toluene
APTMS, empty circles) and with
ation of APTMS (Tol-
d, solid circles). Pore diameters are
given relative to the average pore diameter
41. Amino group
narrower PSD (full width at half
maximum FWHM = 0.30 nm, compared
APTMS). To
we
have repeated the deposition from
toluene using freshly vacuum distilled
d). As can be
seen from Fig. 4B, the PSD of the
41 is
slightly more uniform and narrower

81
(FWHM = 0.37 nm) compared to the
sample prepared without distillation.
The differences between the PSD of Vap-
APTMS and Tol-APTMS seem minor at
first sight. However, it should be noted
that the samples contain the same
amount of surface-grafted amino groups.
The differences can therefore be
attributed to different surface
distributions of the functional groups, as
we have recently shown for amino-
functionalized samples prepared with
various aminosilane precursors [9].
Interestingly, there is a considerable
contribution of relatively large pores to
the PSD of the samples grafted in
toluene. This is most likely a
consequence of pore blocking due to
cross-linking of APTMS. If clustering of
APTMS occurs close to the entrance of a
given pore, diffusion of additional
APTMS molecules into this pore is
hindered, leaving part of the pore
surface unmodified. In the PSD derived
from nitrogen sorption, such a partially
blocked pore is consequently recorded
with a comparatively large pore
diameter.
Upon deposition from the vapor phase,
the primary mesopore volume
decreased by 0.31 cm3/g, whereas a less
pronounced reduction of 0.25 cm3/g was
observed after deposition from toluene
(1.2 mmol/g of grafted amino groups for
each sample). The accompanying
changes of the BET surface area (–419
m2/g for Vap-APTMS, –306 m2/g for Tol-
APTMS, and –287 m2/g for Tol-APTMS-d)
support the conclusion that different
distributions of grafted amino groups
were obtained. A recent study by Asefa
and co-workers [6b] has shown that the
deposition of APTMS from toluene
produced aggregated grafted groups,
while Tatsumi and co-workers [8a] found
that the surface-bound amino groups
were concentrated near the pore
entrances and on the external surface.
Our results indicate that the tendency
towards aggregation and external
surface grafting is less pronounced in
the vapor phase deposition method. In
this context, it is worth mentioning that
toluene is not an ideal solvent for
producing site isolation of grafted amino
groups. Less aggregation and increased
site isolation has for example been
obtained upon deposition from alcohols
[6b] or THF [9].
3.5. Influence of trace water
To investigate the influence of water on
the degree of pore blocking, we
conducted the following experiment: A
0.5 g sample of calcined MCM-41 was
dispersed in 30 mL of toluene containing
different amounts of H2O. After short
ultrasonication and additional stirring
for 15 min, 160 µL of APTMS was added.
Reaction, recovery, and analysis were
performed as described above. The
resulting PSDs of two representative
samples are shown in Fig. 5. While the
water content seems to have no effect
on the yield of grafted amino groups,
the PSDs are clearly different. Pore
blocking is obviously strongly promoted
by the presence of trace water. This is in
agreement with an earlier study by

Walcarius
proton and metal uptake of
aminopropyl
by postsynthetic functionalization with
APTES (deposited from toluene) in the
presence of trace water. The effect
shown in Fig. 5 occurs already at
relatively low w
experimental conditions, a water
content of 400 ppm results in a
H2O/APTMS ratio of approximately 0.6.
Assuming complete surface adsorption
of H2O with an area of 0.1 nm
molecule, a water content of 400 ppm
corresponds to only
monolayer. We can therefore conclude
that the presence of small quantities of
water in toluene considerably affects the
grafting behavior of APTMS by
promoting cross
molecules. To obtain a narrow PSD and a
high fraction o
is therefore crucial to work with dry
toluene.
4. Conclusions
Functionalization of mesoporous silica
by vapor phase deposition of APTMS is a
viable alternative to reactions carried
out in solvents. The use of vapor phase
deposition eliminates trace water
induced silane cross
subsequent pore blocking. As the
separation of APTMS monomers from
potential oligomers present in liquid
APTMS is an inherent property of the
vapor phase deposition method,
Walcarius et al. [27] observing slower
proton and metal uptake of
aminopropyl-grafted MCM
by postsynthetic functionalization with
APTES (deposited from toluene) in the
presence of trace water. The effect
shown in Fig. 5 occurs already at
relatively low water contents. Under our
experimental conditions, a water
content of 400 ppm results in a
O/APTMS ratio of approximately 0.6.
Assuming complete surface adsorption
O with an area of 0.1 nm
molecule, a water content of 400 ppm
corresponds to only
monolayer. We can therefore conclude
that the presence of small quantities of
water in toluene considerably affects the
grafting behavior of APTMS by
promoting cross
molecules. To obtain a narrow PSD and a
high fraction of pore surface grafting, it
is therefore crucial to work with dry
toluene.
4. Conclusions
Functionalization of mesoporous silica
by vapor phase deposition of APTMS is a
viable alternative to reactions carried
out in solvents. The use of vapor phase
sition eliminates trace water
induced silane cross
subsequent pore blocking. As the
separation of APTMS monomers from
potential oligomers present in liquid
APTMS is an inherent property of the
vapor phase deposition method,
et al. [27] observing slower
proton and metal uptake of
grafted MCM-41 prepared
by postsynthetic functionalization with
APTES (deposited from toluene) in the
presence of trace water. The effect
shown in Fig. 5 occurs already at
ater contents. Under our
experimental conditions, a water
content of 400 ppm results in a
O/APTMS ratio of approximately 0.6.
Assuming complete surface adsorption
O with an area of 0.1 nm
molecule, a water content of 400 ppm
corresponds to only about 1/13 of a
monolayer. We can therefore conclude
that the presence of small quantities of
water in toluene considerably affects the
grafting behavior of APTMS by
promoting cross-linking of silane
molecules. To obtain a narrow PSD and a
f pore surface grafting, it
is therefore crucial to work with dry
Functionalization of mesoporous silica
by vapor phase deposition of APTMS is a
viable alternative to reactions carried
out in solvents. The use of vapor phase
sition eliminates trace water
induced silane cross-linking and
subsequent pore blocking. As the
separation of APTMS monomers from
potential oligomers present in liquid
APTMS is an inherent property of the
vapor phase deposition method,
et al. [27] observing slower
proton and metal uptake of
41 prepared
by postsynthetic functionalization with
APTES (deposited from toluene) in the
presence of trace water. The effect
shown in Fig. 5 occurs already at
ater contents. Under our
experimental conditions, a water
content of 400 ppm results in a
O/APTMS ratio of approximately 0.6.
Assuming complete surface adsorption
O with an area of 0.1 nm2 per
molecule, a water content of 400 ppm
about 1/13 of a
monolayer. We can therefore conclude
that the presence of small quantities of
water in toluene considerably affects the
grafting behavior of APTMS by
linking of silane
molecules. To obtain a narrow PSD and a
f pore surface grafting, it
is therefore crucial to work with dry
Functionalization of mesoporous silica
by vapor phase deposition of APTMS is a
viable alternative to reactions carried
out in solvents. The use of vapor phase
sition eliminates trace water-
linking and
subsequent pore blocking. As the
separation of APTMS monomers from
potential oligomers present in liquid
APTMS is an inherent property of the
vapor phase deposition method,
82
et al. [27] observing slower
proton and metal uptake of
41 prepared
by postsynthetic functionalization with
APTES (deposited from toluene) in the
presence of trace water. The effect
shown in Fig. 5 occurs already at
ater contents. Under our
experimental conditions, a water
content of 400 ppm results in a
O/APTMS ratio of approximately 0.6.
Assuming complete surface adsorption
per
molecule, a water content of 400 ppm
about 1/13 of a
monolayer. We can therefore conclude
that the presence of small quantities of
water in toluene considerably affects the
grafting behavior of APTMS by
linking of silane
molecules. To obtain a narrow PSD and a
f pore surface grafting, it
is therefore crucial to work with dry
Functionalization of mesoporous silica
by vapor phase deposition of APTMS is a
viable alternative to reactions carried
out in solvents. The use of vapor phase
-
linking and
subsequent pore blocking. As the
separation of APTMS monomers from
potential oligomers present in liquid
APTMS is an inherent property of the
vapor phase deposition method,
Fig. 5.
APTMS from toluene containing
approximately 400 ppm of H
circles) and less than 50 ppm of H
circles). Pore diameters are given relative to
the average pore diameter of the parent
MCM-
mmol/g.
distillation of APTMS prior to
grafting reaction is not necessary.
Furthermore, the
deposition method is of interest for
economical and ecological reasons,
especially concerning large scale
syntheses, as it avoids the use of (d
solvents. In future work, the vapor
phase deposition of APTMS needs to be
examined in terms of its potential to
provide site isolation, specifically in
relation to optimized solvent based
deposition techniques [28]. Such
comparative studies are particu
meaningful when samples of similar
functionalization degree are examined.
This requires an analysis method which
yields accurate and reproducible results
for a wide range of grafting densities
independent of the distribution of the
functional groups
silica surface. The determination of the
Fig. 5. PSD of MC
APTMS from toluene containing
approximately 400 ppm of H
circles) and less than 50 ppm of H
circles). Pore diameters are given relative to
the average pore diameter of the parent
-41. Amino group contents are 1
mmol/g.
distillation of APTMS prior to
grafting reaction is not necessary.
Furthermore, the
deposition method is of interest for
economical and ecological reasons,
especially concerning large scale
syntheses, as it avoids the use of (d
solvents. In future work, the vapor
phase deposition of APTMS needs to be
examined in terms of its potential to
provide site isolation, specifically in
relation to optimized solvent based
deposition techniques [28]. Such
comparative studies are particu
meaningful when samples of similar
functionalization degree are examined.
This requires an analysis method which
yields accurate and reproducible results
for a wide range of grafting densities
independent of the distribution of the
functional groups
silica surface. The determination of the
PSD of MCM-41 after deposition of
APTMS from toluene containing
approximately 400 ppm of H
circles) and less than 50 ppm of H
circles). Pore diameters are given relative to
the average pore diameter of the parent
41. Amino group contents are 1
distillation of APTMS prior to
grafting reaction is not necessary.
Furthermore, the vapour phase
deposition method is of interest for
economical and ecological reasons,
especially concerning large scale
syntheses, as it avoids the use of (d
solvents. In future work, the vapor
phase deposition of APTMS needs to be
examined in terms of its potential to
provide site isolation, specifically in
relation to optimized solvent based
deposition techniques [28]. Such
comparative studies are particu
meaningful when samples of similar
functionalization degree are examined.
This requires an analysis method which
yields accurate and reproducible results
for a wide range of grafting densities
independent of the distribution of the
functional groups on the mesoporous
silica surface. The determination of the
41 after deposition of
APTMS from toluene containing
approximately 400 ppm of H2O (empty
circles) and less than 50 ppm of H2O (solid
circles). Pore diameters are given relative to
the average pore diameter of the parent
41. Amino group contents are 1
distillation of APTMS prior to the
grafting reaction is not necessary.
vapour phase
deposition method is of interest for
economical and ecological reasons,
especially concerning large scale
syntheses, as it avoids the use of (dry)
solvents. In future work, the vapor
phase deposition of APTMS needs to be
examined in terms of its potential to
provide site isolation, specifically in
relation to optimized solvent based
deposition techniques [28]. Such
comparative studies are particularly
meaningful when samples of similar
functionalization degree are examined.
This requires an analysis method which
yields accurate and reproducible results
for a wide range of grafting densities
independent of the distribution of the
on the mesoporous
silica surface. The determination of the
41 after deposition of
APTMS from toluene containing
O (empty
O (solid
circles). Pore diameters are given relative to
the average pore diameter of the parent
41. Amino group contents are 1.2
the
grafting reaction is not necessary.
vapour phase
deposition method is of interest for
economical and ecological reasons,
especially concerning large scale
ry)
solvents. In future work, the vapor
phase deposition of APTMS needs to be
examined in terms of its potential to
provide site isolation, specifically in
relation to optimized solvent based
deposition techniques [28]. Such
larly
meaningful when samples of similar
functionalization degree are examined.
This requires an analysis method which
yields accurate and reproducible results
for a wide range of grafting densities
independent of the distribution of the
on the mesoporous
silica surface. The determination of the
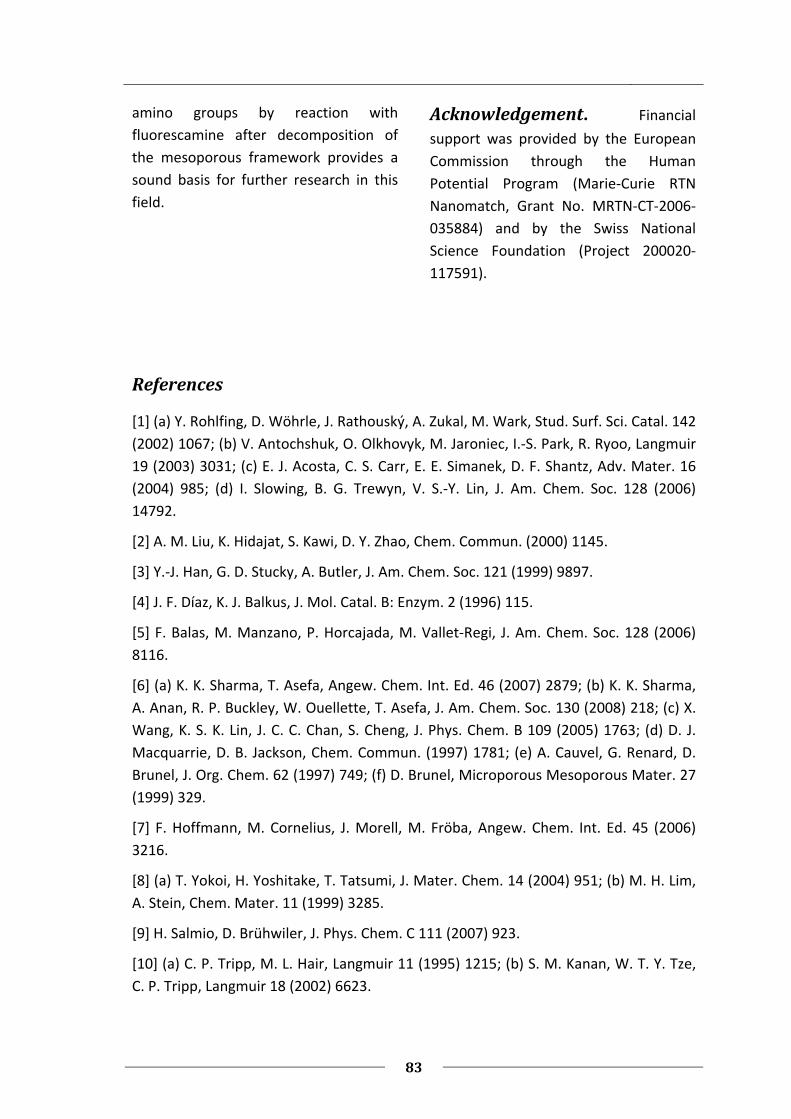
83
amino groups by reaction with
fluorescamine after decomposition of
the mesoporous framework provides a
sound basis for further research in this
field.
Acknowledgement. Financial
support was provided by the European
Commission through the Human
Potential Program (Marie-Curie RTN
Nanomatch, Grant No. MRTN-CT-2006-
035884) and by the Swiss National
Science Foundation (Project 200020-
117591).
References
[1] (a) Y. Rohlfing, D. Wöhrle, J. Rathouský, A. Zukal, M. Wark, Stud. Surf. Sci. Catal. 142
(2002) 1067; (b) V. Antochshuk, O. Olkhovyk, M. Jaroniec, I.-S. Park, R. Ryoo, Langmuir
19 (2003) 3031; (c) E. J. Acosta, C. S. Carr, E. E. Simanek, D. F. Shantz, Adv. Mater. 16
(2004) 985; (d) I. Slowing, B. G. Trewyn, V. S.-Y. Lin, J. Am. Chem. Soc. 128 (2006)
14792.
[2] A. M. Liu, K. Hidajat, S. Kawi, D. Y. Zhao, Chem. Commun. (2000) 1145.
[3] Y.-J. Han, G. D. Stucky, A. Butler, J. Am. Chem. Soc. 121 (1999) 9897.
[4] J. F. Díaz, K. J. Balkus, J. Mol. Catal. B: Enzym. 2 (1996) 115.
[5] F. Balas, M. Manzano, P. Horcajada, M. Vallet-Regi, J. Am. Chem. Soc. 128 (2006)
8116.
[6] (a) K. K. Sharma, T. Asefa, Angew. Chem. Int. Ed. 46 (2007) 2879; (b) K. K. Sharma,
A. Anan, R. P. Buckley, W. Ouellette, T. Asefa, J. Am. Chem. Soc. 130 (2008) 218; (c) X.
Wang, K. S. K. Lin, J. C. C. Chan, S. Cheng, J. Phys. Chem. B 109 (2005) 1763; (d) D. J.
Macquarrie, D. B. Jackson, Chem. Commun. (1997) 1781; (e) A. Cauvel, G. Renard, D.
Brunel, J. Org. Chem. 62 (1997) 749; (f) D. Brunel, Microporous Mesoporous Mater. 27
(1999) 329.
[7] F. Hoffmann, M. Cornelius, J. Morell, M. Fröba, Angew. Chem. Int. Ed. 45 (2006)
3216.
[8] (a) T. Yokoi, H. Yoshitake, T. Tatsumi, J. Mater. Chem. 14 (2004) 951; (b) M. H. Lim,
A. Stein, Chem. Mater. 11 (1999) 3285.
[9] H. Salmio, D. Brühwiler, J. Phys. Chem. C 111 (2007) 923.
[10] (a) C. P. Tripp, M. L. Hair, Langmuir 11 (1995) 1215; (b) S. M. Kanan, W. T. Y. Tze,
C. P. Tripp, Langmuir 18 (2002) 6623.

84
[11] S. Ek, E. I. Iiskola, L. Niinistö, Langmuir 19 (2003) 3461.
[12] D. Brühwiler, H. Frei, J. Phys. Chem. B 107 (2003) 8547.
[13] S. Ek, A. Root, M. Peussa, L. Niinistö, Thermochim. Acta 379 (2001) 201.
[14] S. Brunauer, P. H. Emmett, E. Teller, J. Am. Chem. Soc. 60 (1938) 309.
[15] M. Kruk, M. Jaroniec, R. Ryoo, J. M. Kim, Microporous Mater. 12 (1997) 93.
[16] E. P. Barrett, L. G. Joyner, P. P. Halenda, J. Am. Chem. Soc. 73 (1951) 373.
[17] P. I. Ravikovitch, S. C. O. Domhnaill, A. V. Neimark, F. Schüth, K. K. Unger,
Langmuir 11 (1995) 4765.
[18] P. I. Ravikovitch, A. V. Neimark, Colloid Surf. A: Physicochem. Eng. Aspect 187-188
(2001) 11.
[19] K. S. W. Sing, D. H. Everett, R. A. W. Haul, L. Moscou, R. A. Pierotti, J. Rouquerol, T.
Siemieniewska, Pure Appl. Chem. 57 (1985) 603.
[20] (a) C. T. Kresge, M. E. Leonowicz, W. J. Roth, J. C. Vartuli, J. S. Beck, Nature 359
(1992) 710; (b) J. S. Beck, J. C. Vartuli, W. J. Roth, M. E. Leonowicz, C. T. Kresge, K. D.
Schmitt, C. T.-W. Chu, D. H. Olson, E. W. Sheppard, S. B. McCullen, J. B. Higgins, J. L.
Schlenker, J. Am. Chem. Soc. 114 (1992) 10834.
[21] M. Kruk, M. Jaroniec, A. Sayari, J. Phys. Chem. B 101 (1997) 583.
[22] E. Kaiser, R. L. Colescott, C. D. Bossinger, P. I. Cook, Anal. Biochem. 34 (1970) 595.
[23] S. Ek, E. I. Iiskola, L. Niinistö, J. Vaittinen, T. P. Pakkanen, J. Keränen, A. Auroux,
Langmuir 19 (2003) 10601.
[24] (a) M. Weigele, S. L. DeBernardo, J. P. Tengi, W. Leimgruber, J. Am. Chem. Soc. 94
(1972) 5927; (b) S. Udenfriend, S. Stein, P. Böhlen, W. Dairman, W. Leimgruber, M.
Weigele, Science 178 (1972) 871.
[25] S. Ek, E. I. Iiskola, L. Niinistö, T. T. Pakkanen, A. Root, Chem. Commun. (2003)
2032.
[26] E. A. Wovchko, J. C. Camp, J. A. Glass, J. T. Yates, Langmuir 11 (1995) 2592.
[27] A. Walcarius, M. Etienne, B. Lebeau, Chem. Mater. 15 (2003) 2161.
[28] (a) K. K. Sharma, R. P. Buckley, T. Asefa, Langmuir 24 (2008) 14306; (b) J. C. Hicks,
R. Dabestani, A. C. Buchanan III, C. W. Jones, Chem. Mater. 18 (2006) 5022; (c) J. C.
Hicks, C. W. Jones, Langmuir 22 (2006) 2676; (d) M. W. McKittrick, C. W. Jones, Chem.
Mater. 15 (2003) 1132.

85
Accessibility of grafting sites in postsynthetically
modified mesoporous silica
Hanna Ritter and Dominik Brühwiler*
Institute of Inorganic Chemistry, University of Zurich,
Winterthurerstrasse 190, 8057 Zurich, Switzerland
E-Mail: [email protected] (D. Brühwiler)
Abstract. The accessibility of amino groups in postsynthetically functionalized
mesoporous silica MCM-41, MCM-48, and SBA-15 is investigated by reaction with
fluorescein isothiocyanate (FITC). The quantitative analysis of the surface-grafted
amino groups in relation to the amount of coupled FITC over a wide range of loadings
affords information about potential pore blocking. In the pore diameter domain of 3 to
4 nm, the actual pore size of materials with a one-dimensional channel system (MCM-
41) strongly affects the FITC coupling yield and the distribution of the anchored
fluorescein moieties. In the case of SBA-15 (7.6 nm pore diameter), the accessibility of
the grafted amino groups is similar to what is expected for a material with a
completely open surface. However, grafting in the intrawall micropores of SBA-15
leads to a substantial fraction of inaccessible amino groups. As a direct consequence of
short channel lengths and large external surface, excellent accessibility is also
observed for nanometer-sized MCM-41 (3.2 nm pore diameter).
1. Introduction
Grafting of a functional group and
subsequent coupling of an organic
moiety exhibiting the desired property
(such as luminescence, sensing, metal
coordination) is a popular method for
the modification of mesoporous silicas. 1-4 Postsynthetic functionalization
techniques are preferably employed
when the molecule to be introduced is
not sufficiently stable under the
conditions of the mesoporous silica
synthesis, therefore excluding
approaches based on co-condensation,
or when a narrow pore size distribution
is required. The latter is typically more
difficult to obtain by means of co-
condensation, especially when high
functionalization degrees are desired. A
recent study by Rosenholm and Lindén
compares the accessibility of amino
groups in functionalized SBA-15
prepared by co-condensation, post-
synthetic grafting with various amino-
silanes, and surface polymerization of a
polyethyleneimine, with the important
result that the postsynthetic
functionalization techniques are
superior to co-condensation in terms of

86
producing a large amount of accessible
amino groups.5
The accessibility of the binding sites is
the key to uniform postsynthetic surface
functionalization. Depending on the
relation between the pore diameter of
the mesoporous material and the size of
the moiety to be grafted, sterical
hindrance can limit the access to sites
deep inside the pores. To evaluate to
what extent such pore blocking effects
depend on the pore diameter and the
dimensionality of the channel system,
we have investigated the reaction of
fluorescein isothiocyanate (FITC) with
amino-functionalized mesoporous silica
MCM-41 (one-dimensional channel
system),6,7 MCM-48 (three-dimensional
channel system),6,7 and SBA-15 (one-
dimensional channel system, larger pore
size than MCM-41, microporous channel
walls).8,9 FITC coupling yields, which are
obtained as a result of the combination
of a fluorometric quantitation of the
grafted amino groups10 and a UV-Vis
spectroscopic detection of the coupled
FITC11, afford information about the
accessibility of the surface-grafted
amino groups. The accessibility of
functional groups on the surface of
mesoporous silicas is not only essential
for further functionalization by coupling
reactions, but also for potential
applications such as catalysis12,13 and
adsorption-based separation14-19.
2. Experimental Section
2.1. Synthesis of Mesoporous
Silicas
MCM-41(16) was prepared according
to ref. 20. Briefly, 2.20 g of
hexadecyltrimethylammonium bromide
(CTAB, Fluka) was dissolved under slight
warming in a mixture of 52 mL of H2O
and 24 mL of aqueous ammonia (28 %,
Fluka). 10 mL of tetraethoxysilane (TEOS,
Fluka) was slowly added under stirring
and the resulting gel was further stirred
for 3 h at room temperature. The
mixture was transferred to a Teflon-
lined autoclave and heated at 110 °C for
48 h. The product was obtained by
filtration, washed with at least 800 mL of
H2O and dried overnight in air at room
temperature. The structure directing
agent (SDA) was removed by first
heating at 300 °C for 2 h and subsequent
calcination in air at 550 °C for 16 h.
Heating rates of 2 °C/min were applied.
The X-ray diffraction (XRD) pattern was
in agreement with the pattern reported
in ref. 20. MCM-41(12) was prepared
accordingly, using 1.86 g of
dodecyltrimethylammonium bromide
(Fluka) instead of CTAB. The use of a SDA
with a shorter alkyl chain reduces the
pore size (see Table 1) and shifts the
XRD pattern towards larger angles.
MCM-48 was synthesized following a
previously reported procedure.21 An
amount of 8.80 g of CTAB was dissolved
under slight warming in 80 mL of H2O.
After the addition of 10 mL of 2 M
aqueous NaOH, 10 mL of TEOS was
added dropwise under stirring. After

87
further stirring for 30 min, the mixture
was transferred to a Teflon-lined
autoclave and heated at 100 °C for 72 h.
The product was recovered by filtration,
washed with at least 1 L of H2O and
oven-dried overnight at 80 °C. The SDA
was removed by first heating at 300 °C
for 2 h and subsequent calcination in air
at 550 °C for 8 h. Heating rates of 2
°C/min were applied.
SBA-15 was prepared according to ref.
9. Briefly, 2.20 g of Pluronic P123
(EO20PO70EO20, Mav = 5800, Aldrich) was
dissolved in a mixture of 49 mL of H2O
and 31 mL of 4 M aqueous HCl. To this
clear solution, 5 mL of TEOS was slowly
added under stirring. After further
stirring for 20 h at approximately 35 °C,
the mixture was transferred to a Teflon-
lined autoclave and heated at 100 °C for
24 h. The product was obtained by
filtration and washed with at least 1 L of
H2O. After drying the material overnight
in air at room temperature, the SDA was
removed by heating in air at 500 °C for
16 h. A heating rate of 1 °C/min was
applied.
Nanoparticles of MCM-41 (nano-
MCM-41) were synthesized as follows:22
First, a clear solution of 2.60 g of
hexadecyltrimethylammonium chloride
(Fluka) and 2.00 g of Pluronic F-127
(Sigma) in 30 mL of 0.25 M aqueous HCl
was prepared. After the dropwise
addition of 3.7 mL of TEOS, the mixture
was stirred for 20 h at room
temperature. Finally, 3.7 mL of aqueous
ammonia (28 %, Fluka) was added and
the resulting gel was aged without
stirring for 24 h. The product was oven-
dried at 70 °C for 72 h and subsequently
calcined at 600 °C for 3 h with a heating
rate of 3 °C/min.
Fumed silica (Sigma, 14 nm primary
particle size) was used as received.
2.2. Reaction with APTMS
To ensure reproducible and
comparable conditions all of our
calcined mesoporous silica materials as
well as fumed silica were treated for 1 h
at 80 °C before use. This temperature
was chosen because of its compatibility
with potential organic modifications. It
should be noted that the total release of
physisorbed water usually requires
temperatures above 100 °C. Such
temperatures are, however, often not
applicable when systems with multiple
functional groups are desired, as this
typically requires consecutive
modification steps, such as co-
condensation and subsequent
postsynthetic grafting. Experiments
conducted with MCM-41(16) dried at
180 °C produced results which were
consistent with those obtained for
samples dried at 80 °C.
For the functionalization with 3-
aminopropyltrimethoxysilane (APTMS,
Fluka), 500 mg of fumed silica or
calcined mesoporous silica was
dispersed in 30 mL of dry toluene (Fluka,
puriss., H2O < 0.005 %). After the
addition of a calculated amount
(between 0.05 and 1.20 mmol) of
APTMS, the suspension was refluxed for
3 h. The functionalized product was
recovered by filtration, washed with 100

88
mL of ethanol, and cured at 80 °C for 1
h. Amino group analysis (Chapter 2.4.)
showed that within the error margin of
the method, grafting of APTMS was
quantitative in the above mentioned
range. Samples with low amino content
are denoted by A-x, where x identifies
the type of silica. Samples with
intermediate and high amino content
are identified by B-x and C-x,
respectively. Three independent
syntheses were carried out for each data
point.
2.3. FITC Coupling
Labeling with fluorescein 5-
isothiocyanate (FITC, Fluka) was carried
out according to ref. 11. Briefly, a
calculated amount of FITC (1.5-fold
excess relative to the amount of grafted
amino groups) was dissolved in 25 mL of
absolute ethanol. After the addition of
250 mg of amino-functionalized silica,
the suspension was stirred for 24 h at
room temperature. The yellow product
was recovered by filtration and washed
with 50 mL of ethanol. After
redispersion in 50 mL of fresh ethanol
and stirring for 15 min, the final product
was recovered by filtration, washed with
50 mL of ethanol and oven-dried at 80 °C
for 1 h. The amount of coupled
fluorescein was determined by
dissolving the sample (typically 15 – 30
mg) in 25 mL of 0.2 M aqueous NaOH
and measuring the UV-Vis absorption
spectrum of the resulting clear solution
after appropriate dilution. Repeated
analysis of the same sample gave an
average relative error of 3 % (for FITC
contents in the range of 0.01 to 0.4
mmol/g). The extinction coefficient
which was used in the calculations (ε=
75'000 M–1cm–1 at λmax = 490 nm) was
determined based on a stock solution
prepared as follows: FITC was coupled to
APTMS in a 1:1 molar ratio by stirring in
ethanol for 15 h at room temperature.
After removal of the ethanol by
evaporation, a weighed amount of the
dry residue was dissolved in 50 mL of 0.2
M aqueous NaOH containing 50 mg of
dissolved silica.
Adsorption of fluorescein (free acid,
Riedel-de Haën) was conducted
according to the FITC coupling
procedure, using fluorescein instead of
FITC.
2.4. Amino Group Analysis
15 mg of amino-functionalized silica
was stirred in 30 mL of 0.02 M aqueous
NaOH until completely dissolved. 100 µL
of this solution was transferred into a
cuvette (d = 1 cm) and 2 mL of
phosphate buffer (0.2 M, pH 8.0) was
added. After the addition of 1 mL of
fluorescamine (Sigma) solution (1 mM in
acetone), the fluorescence spectrum
was measured by excitation at 366 nm.
The emission intensity at 480 nm was
taken as the data point. A calibration
line was prepared accordingly by using
100 µL aliquots of differently
concentrated solutions of APTMS in 30
mL of 0.02 M aqueous NaOH (containing
15 mg of the respective dissolved parent
silica).10a Repeated analysis of the same

89
sample gave an average relative error of
8 % (for amino contents in the range of
0.09 to 2.4 mmol/g). To allow
comparison between materials with
different surface area, the amino
content was further calculated in units
of µmol/m2 assuming a homogeneous
distribution over the entire BET surface
area of the parent matieral. Curves
depicting the FITC coupling yield as a
function of the amino content were
additionally verified with at least three
control samples per curve.
2.5. Physical Measurements
Nitrogen sorption isotherms were
collected at 77 K using a Quantachrome
NOVA 2200 surface area and pore size
analyzer. Samples were vacuum-
degassed at 80 °C for 3 h. The total
surface area SBET was calculated by the
BET method23 whereas the external
surface area SExt was determined from
the high-pressure linear part of the αS-
plot.24,25 Pore size distributions were
calculated by means of a NLDFT model
developed for silica exhibiting cylindrical
pore geometry26 (NOVAWin2 software,
Version 2.2, Quantachrome
Instruments). Adsorption branches were
used for the calculations.27 Pore size
distributions of the functionalized
materials are used for comparative
purposes only, as the employed NLDFT
kernel is not strictly valid for non-
siliceous materials. The total pore
volume Vtot was estimated from the
amount of nitrogen adsorbed at a
relative pressure of 0.95. The primary
mesopore volume Vp (volume of the
uniform mesopores) was determined by
the αS-plot method.24 The de Boer
equation was employed for calculating
the statistical film thickness t.28 A Perkin-
Elmer LS50B spectrofluorometer was
used for the fluorescamine assays and
UV-Vis spectra were measured with a
Cary 1E spectrophotometer. Powder
diffraction patterns were collected on a
STOE StadiP diffractometer operating
with monochromatized CuKα1 radiation.
Scanning electron microscopy (SEM) was
performed with a LEO 440.
3. Results and Discussion
3.1. Properties of the Starting
Materials
Figure 1 shows the pore size
distributions of the investigated
mesoporous silicas. Further properties
of the unmodified materials are
summarized in Table 1.
3.2. FITC Coupling Yields and
Accessibility
There are several reasons why FITC is
an ideal molecule to probe the
accessibility of surface-grafted amino
groups: Isothiocyanates are moderately
reactive and form robust thioureas with
amines, whereas no reaction occurs with
surface silanol groups under mild
conditions.11 As the fluorescein moiety is
rather bulky (Figure 2), coupled FITC
molecules can, depending on the pore

Table 1.
fumed silica
nano-
MCM
MCM
MCM
SBAa average pore diameter determined by the NLDFT methodb estimated by SEM unless noted otherwisec average size of primary particles, which form branched, chainof a micron long (information provided by the supplier)d ref. 22e micropore volume V
Figure 1.
unmodified mesoporous silicas.
Table 1. Properties of the investigated silica materials.
fumed silica
-MCM-41
MCM-41(12)
MCM-41(16)
MCM-48
SBA-15
average pore diameter determined by the NLDFT methodestimated by SEM unless noted otherwiseaverage size of primary particles, which form branched, chain
of a micron long (information provided by the supplier)ref. 22 micropore volume V
Figure 1. Pore size distributions of the
unmodified mesoporous silicas.
Properties of the investigated silica materials.
dDFTa
[nm]
–
3.18
3.06
3.93
3.67
7.59
average pore diameter determined by the NLDFT methodestimated by SEM unless noted otherwiseaverage size of primary particles, which form branched, chain
of a micron long (information provided by the supplier)
micropore volume Vµ = 0.09 cm
Pore size distributions of the
unmodified mesoporous silicas.
Properties of the investigated silica materials.
Particle Size
14 nmc
20 – 50 nm
1 – 2 µm
1 – 2 µm
1 – 2 µm
1 – 2 µm
average pore diameter determined by the NLDFT methodestimated by SEM unless noted otherwiseaverage size of primary particles, which form branched, chain
of a micron long (information provided by the supplier)
= 0.09 cm3/g
Pore size distributions of the
90
Properties of the investigated silica materials.
Particle Sizeb SBET
[m2
c 200
50 nmd 590
2 µm 820
2 µm 870
2 µm 1100
2 µm 860
average pore diameter determined by the NLDFT methodestimated by SEM unless noted otherwise average size of primary particles, which form branched, chain
of a micron long (information provided by the supplier)
Pore size distributions of the
Figure 2.
group. The curvature
corresponds to a circular pore with a
diameter of 3.5 nm. The anchored
fluorescein moieties are most likely present
in various protonation states (neutral,
monoanion, dianion).
size and pore system dimensionality,
induce pore blocking, thereby rendering
amino groups anchored in areas deep
inside the pores inaccess
dissolution of the silica framework in 0.2
BET 2/g] [m
200
590
820
870
1100
860
average pore diameter determined by the NLDFT method
average size of primary particles, which form branched, chain-like aggregates aof a micron long (information provided by the supplier)
Figure 2. A FITC
group. The curvature
corresponds to a circular pore with a
diameter of 3.5 nm. The anchored
fluorescein moieties are most likely present
in various protonation states (neutral,
monoanion, dianion).
size and pore system dimensionality,
induce pore blocking, thereby rendering
amino groups anchored in areas deep
inside the pores inaccess
dissolution of the silica framework in 0.2
SExt
[m2/g]
200
380 0.81 (0.17)
40 0.48 (0.44)
70 0.74 (0.67)
160 0.86 (0.75)
50 1.21 (1.09
like aggregates a
A FITC-labeled grafted amino
group. The curvature of the surface
corresponds to a circular pore with a
diameter of 3.5 nm. The anchored
fluorescein moieties are most likely present
in various protonation states (neutral,
monoanion, dianion).11
size and pore system dimensionality,
induce pore blocking, thereby rendering
amino groups anchored in areas deep
inside the pores inaccess
dissolution of the silica framework in 0.2
Vtot (Vp)
[cm3/g]
– (–)
0.81 (0.17)
0.48 (0.44)
0.74 (0.67)
0.86 (0.75)
1.21 (1.09e)
like aggregates a few tenths
labeled grafted amino
of the surface
corresponds to a circular pore with a
diameter of 3.5 nm. The anchored
fluorescein moieties are most likely present
in various protonation states (neutral,
size and pore system dimensionality,
induce pore blocking, thereby rendering
amino groups anchored in areas deep
inside the pores inaccessible. Upon
dissolution of the silica framework in 0.2
few tenths
labeled grafted amino
of the surface
corresponds to a circular pore with a
diameter of 3.5 nm. The anchored
fluorescein moieties are most likely present
in various protonation states (neutral,
size and pore system dimensionality,
induce pore blocking, thereby rendering
amino groups anchored in areas deep
ible. Upon
dissolution of the silica framework in 0.2

M aqueous NaOH, the fluorescein
moiety is stable and forms the strongly
colored dianion,
and convenient determination of the
FITC coupling yield by UV
spectroscopy. The FITC
which we define as the amount of
coupled FITC divided by the amount of
grafted amino groups, is a direct
measure for the overall accessibility.
pore size on the accessibility, it is
important to keep in
also occur on the external surface of the
particles. Analysis of the high
linear parts of the α
investigated mesoporous silicas reveals
that the external surface area typically
accounts for less than 15 % of the
BET surface area (Table 1). The
nanometer
(nano
Due to the small particle size, the
external surface is dominant.
FITC coupling yields of a non
ex
fumed silica. As can be seen in Figure 3,
the FITC coupling yield remains relatively
constant with increasing amino content.
The slight overall decrease of the yield
can be explained based on the simple
model of two adjac
amino groups. As the distance between
the amino groups decreases, the
probability increases that, for sterical
reasons, only one of the two groups can
be labeled with FITC. Note that an amino
content of 1.7 µmol/m
roughl
M aqueous NaOH, the fluorescein
moiety is stable and forms the strongly
colored dianion,
and convenient determination of the
FITC coupling yield by UV
spectroscopy. The FITC
which we define as the amount of
coupled FITC divided by the amount of
grafted amino groups, is a direct
measure for the overall accessibility.
When investigating the effect of the
pore size on the accessibility, it is
important to keep in
also occur on the external surface of the
particles. Analysis of the high
linear parts of the α
investigated mesoporous silicas reveals
that the external surface area typically
accounts for less than 15 % of the
BET surface area (Table 1). The
nanometer-sized MCM
(nano-MCM-
Due to the small particle size, the
external surface is dominant.
It is instructive to first examine the
FITC coupling yields of a non
external surface area sample such as
fumed silica. As can be seen in Figure 3,
the FITC coupling yield remains relatively
constant with increasing amino content.
The slight overall decrease of the yield
can be explained based on the simple
model of two adjac
amino groups. As the distance between
the amino groups decreases, the
probability increases that, for sterical
reasons, only one of the two groups can
be labeled with FITC. Note that an amino
content of 1.7 µmol/m
roughly one amino group per nm
M aqueous NaOH, the fluorescein
moiety is stable and forms the strongly
colored dianion,29 affording an accurate
and convenient determination of the
FITC coupling yield by UV
spectroscopy. The FITC
which we define as the amount of
coupled FITC divided by the amount of
grafted amino groups, is a direct
measure for the overall accessibility.
When investigating the effect of the
pore size on the accessibility, it is
important to keep in mind that reactions
also occur on the external surface of the
particles. Analysis of the high
linear parts of the α
investigated mesoporous silicas reveals
that the external surface area typically
accounts for less than 15 % of the
BET surface area (Table 1). The
sized MCM
-41) is an obvious exception.
Due to the small particle size, the
external surface is dominant.
It is instructive to first examine the
FITC coupling yields of a non
ternal surface area sample such as
fumed silica. As can be seen in Figure 3,
the FITC coupling yield remains relatively
constant with increasing amino content.
The slight overall decrease of the yield
can be explained based on the simple
model of two adjacent surface
amino groups. As the distance between
the amino groups decreases, the
probability increases that, for sterical
reasons, only one of the two groups can
be labeled with FITC. Note that an amino
content of 1.7 µmol/m
y one amino group per nm
M aqueous NaOH, the fluorescein
moiety is stable and forms the strongly
affording an accurate
and convenient determination of the
FITC coupling yield by UV
spectroscopy. The FITC coupling yield,
which we define as the amount of
coupled FITC divided by the amount of
grafted amino groups, is a direct
measure for the overall accessibility.
When investigating the effect of the
pore size on the accessibility, it is
mind that reactions
also occur on the external surface of the
particles. Analysis of the high-pressure
linear parts of the αS-plots of the
investigated mesoporous silicas reveals
that the external surface area typically
accounts for less than 15 % of the
BET surface area (Table 1). The
sized MCM-41 sample
41) is an obvious exception.
Due to the small particle size, the
external surface is dominant.
It is instructive to first examine the
FITC coupling yields of a non-porous high
ternal surface area sample such as
fumed silica. As can be seen in Figure 3,
the FITC coupling yield remains relatively
constant with increasing amino content.
The slight overall decrease of the yield
can be explained based on the simple
ent surface-grafted
amino groups. As the distance between
the amino groups decreases, the
probability increases that, for sterical
reasons, only one of the two groups can
be labeled with FITC. Note that an amino
content of 1.7 µmol/m2 corresponds to
y one amino group per nm
91
M aqueous NaOH, the fluorescein
moiety is stable and forms the strongly
affording an accurate
and convenient determination of the
FITC coupling yield by UV-Vis
coupling yield,
which we define as the amount of
coupled FITC divided by the amount of
grafted amino groups, is a direct
measure for the overall accessibility.
When investigating the effect of the
pore size on the accessibility, it is
mind that reactions
also occur on the external surface of the
pressure
plots of the
investigated mesoporous silicas reveals
that the external surface area typically
accounts for less than 15 % of the total
BET surface area (Table 1). The
41 sample
41) is an obvious exception.
Due to the small particle size, the
It is instructive to first examine the
porous high
ternal surface area sample such as
fumed silica. As can be seen in Figure 3,
the FITC coupling yield remains relatively
constant with increasing amino content.
The slight overall decrease of the yield
can be explained based on the simple
grafted
amino groups. As the distance between
the amino groups decreases, the
probability increases that, for sterical
reasons, only one of the two groups can
be labeled with FITC. Note that an amino
corresponds to
y one amino group per nm2,
assuming uniform distribution.
Compared to the almost constant FITC
coupling yield of the fumed silica
samples, the values for MCM
strongly depend on the amount of
grafted amino groups. As MCM
features one
coupling of FITC to amino groups located
close to the pore entrances can render
large portions of the pore surface
inaccessible. MCM
size exhibits a less pronounced decrease
of the FITC coupling yield with increasing
amino conte
channel system obviously offers access
to a large fraction of the pore surface
despite potential pore blocking. MCM
48 and MCM
accessibility for amino loadings below
0.5 µmol/m
Figure 3. FITC coupling yi
the amino content for fumed silica (FS),
MCM-48, and MCM
corresponds to the average of three
independent syntheses.
Apart from the dimensionality of the
pore system, the pore size plays an
assuming uniform distribution.
Compared to the almost constant FITC
coupling yield of the fumed silica
samples, the values for MCM
strongly depend on the amount of
grafted amino groups. As MCM
features one-dimensional c
coupling of FITC to amino groups located
close to the pore entrances can render
large portions of the pore surface
inaccessible. MCM-48 of similar pore
size exhibits a less pronounced decrease
of the FITC coupling yield with increasing
amino content. The three
channel system obviously offers access
to a large fraction of the pore surface
despite potential pore blocking. MCM
48 and MCM-41(16) feature similar
accessibility for amino loadings below
0.5 µmol/m2.
FITC coupling yi
the amino content for fumed silica (FS),
48, and MCM-41(16). Each data point
corresponds to the average of three
independent syntheses.
Apart from the dimensionality of the
pore system, the pore size plays an
assuming uniform distribution.
Compared to the almost constant FITC
coupling yield of the fumed silica
samples, the values for MCM
strongly depend on the amount of
grafted amino groups. As MCM
dimensional channels,
coupling of FITC to amino groups located
close to the pore entrances can render
large portions of the pore surface
48 of similar pore
size exhibits a less pronounced decrease
of the FITC coupling yield with increasing
nt. The three-dimensional
channel system obviously offers access
to a large fraction of the pore surface
despite potential pore blocking. MCM
41(16) feature similar
accessibility for amino loadings below
FITC coupling yield as a function of
the amino content for fumed silica (FS),
41(16). Each data point
corresponds to the average of three
Apart from the dimensionality of the
pore system, the pore size plays an
assuming uniform distribution.
Compared to the almost constant FITC
coupling yield of the fumed silica
samples, the values for MCM-41(16)
strongly depend on the amount of
grafted amino groups. As MCM-41
hannels,
coupling of FITC to amino groups located
close to the pore entrances can render
large portions of the pore surface
48 of similar pore
size exhibits a less pronounced decrease
of the FITC coupling yield with increasing
dimensional
channel system obviously offers access
to a large fraction of the pore surface
despite potential pore blocking. MCM-
41(16) feature similar
accessibility for amino loadings below
eld as a function of
the amino content for fumed silica (FS),
41(16). Each data point
corresponds to the average of three
Apart from the dimensionality of the
pore system, the pore size plays an
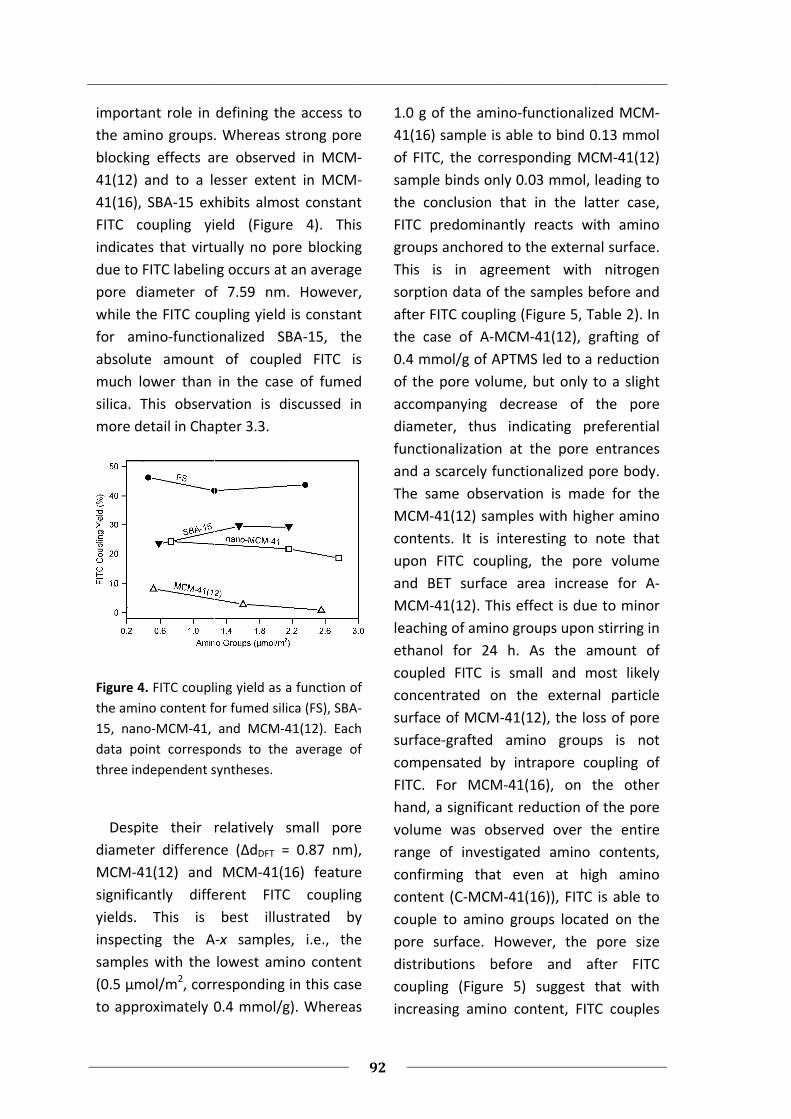
important role in def
the amino groups. Whereas strong pore
blocking effects are observed in MCM
41(12) and to a lesser extent in MCM
41(16), SBA
FITC coupling yield (Figure 4). This
indicates that virtually no pore blocking
due to FITC labeling occurs at an average
pore diameter of 7.59 nm. However,
while the FITC
for amino
absolute amount of coupled FITC is
much lower than in the case of fumed
silica. This observation is discu
more detail in Chapter 3.3.
Figure 4.
the amino content for fumed silica (FS), SBA
15, nano
data point corresponds to the average of
three independent syntheses.
Despite their rel
diameter difference (Δd
MCM-41(12) and MCM
significantly different FITC coupling
yields. This is best illustrated by
inspecting the A
samples with the lowest amino content
(0.5 µmol/m
to approximately 0.4 mmol/g). Whereas
important role in def
the amino groups. Whereas strong pore
blocking effects are observed in MCM
41(12) and to a lesser extent in MCM
41(16), SBA-15 exhibits almost constant
FITC coupling yield (Figure 4). This
indicates that virtually no pore blocking
o FITC labeling occurs at an average
pore diameter of 7.59 nm. However,
while the FITC coupling yield is constant
for amino-functionalized SBA
absolute amount of coupled FITC is
much lower than in the case of fumed
silica. This observation is discu
more detail in Chapter 3.3.
Figure 4. FITC coupling yield as a function of
the amino content for fumed silica (FS), SBA
15, nano-MCM-41, and MCM
data point corresponds to the average of
three independent syntheses.
Despite their rel
diameter difference (Δd
41(12) and MCM
significantly different FITC coupling
yields. This is best illustrated by
inspecting the A
samples with the lowest amino content
(0.5 µmol/m2, corresponding in this case
to approximately 0.4 mmol/g). Whereas
important role in defining the access to
the amino groups. Whereas strong pore
blocking effects are observed in MCM
41(12) and to a lesser extent in MCM
15 exhibits almost constant
FITC coupling yield (Figure 4). This
indicates that virtually no pore blocking
o FITC labeling occurs at an average
pore diameter of 7.59 nm. However,
coupling yield is constant
functionalized SBA
absolute amount of coupled FITC is
much lower than in the case of fumed
silica. This observation is discu
more detail in Chapter 3.3.
FITC coupling yield as a function of
the amino content for fumed silica (FS), SBA
41, and MCM-41(12). Each
data point corresponds to the average of
three independent syntheses.
Despite their relatively small pore
diameter difference (ΔdDFT = 0.87 nm),
41(12) and MCM-41(16) feature
significantly different FITC coupling
yields. This is best illustrated by
inspecting the A-x samples, i.e., the
samples with the lowest amino content
corresponding in this case
to approximately 0.4 mmol/g). Whereas
ining the access to
the amino groups. Whereas strong pore
blocking effects are observed in MCM-
41(12) and to a lesser extent in MCM-
15 exhibits almost constant
FITC coupling yield (Figure 4). This
indicates that virtually no pore blocking
o FITC labeling occurs at an average
pore diameter of 7.59 nm. However,
coupling yield is constant
functionalized SBA-15, the
absolute amount of coupled FITC is
much lower than in the case of fumed
silica. This observation is discussed in
FITC coupling yield as a function of
the amino content for fumed silica (FS), SBA
41(12). Each
data point corresponds to the average of
atively small pore
= 0.87 nm),
41(16) feature
significantly different FITC coupling
yields. This is best illustrated by
samples, i.e., the
samples with the lowest amino content
corresponding in this case
to approximately 0.4 mmol/g). Whereas
92
ining the access to
the amino groups. Whereas strong pore
-
-
15 exhibits almost constant
FITC coupling yield (Figure 4). This
indicates that virtually no pore blocking
o FITC labeling occurs at an average
pore diameter of 7.59 nm. However,
coupling yield is constant
15, the
absolute amount of coupled FITC is
much lower than in the case of fumed
ssed in
FITC coupling yield as a function of
-
41(12). Each
data point corresponds to the average of
atively small pore
= 0.87 nm),
41(16) feature
significantly different FITC coupling
yields. This is best illustrated by
samples, i.e., the
samples with the lowest amino content
corresponding in this case
to approximately 0.4 mmol/g). Whereas
1.0 g of the amino
41(16) sample is able to bind 0.13 mmol
of FITC, the corresponding MCM
sample binds only 0.03 mmol, leading to
the conclusion that in the latter c
FITC predominantly reacts with amino
groups anchored to the external surface.
This is in agreement with nitrogen
sorption data of the samples before and
after FITC coupling (Figure 5, Table 2). In
the case of A
0.4 mmol/g of AP
of the pore volume, but only to a slight
accompanying decrease of the pore
diameter, thus indicating preferential
functionalization at the pore entrances
and a scarcely functionalized pore body.
The same observation is made for the
MCM
contents. It is interesting to note that
upon FITC coupling, the pore volume
and BET surface area increase for A
MCM
leaching of amino groups upon stirring in
ethanol for 24 h. As the
coupled FITC is small and most likely
concentrated on the external particle
surface of MCM
surface
compensated by intrapore coupling of
FITC. For MCM
hand, a significant re
volume was observed over the entire
range of investigated amino contents,
confirming that even at high amino
content (C
couple to amino groups located on the
pore surface. However, the pore size
distribution
coupling (Figure 5) suggest that with
increasing amino content, FITC couples
1.0 g of the amino
41(16) sample is able to bind 0.13 mmol
of FITC, the corresponding MCM
sample binds only 0.03 mmol, leading to
the conclusion that in the latter c
FITC predominantly reacts with amino
groups anchored to the external surface.
This is in agreement with nitrogen
sorption data of the samples before and
after FITC coupling (Figure 5, Table 2). In
the case of A-MCM
0.4 mmol/g of AP
of the pore volume, but only to a slight
accompanying decrease of the pore
diameter, thus indicating preferential
functionalization at the pore entrances
and a scarcely functionalized pore body.
The same observation is made for the
CM-41(12) samples with higher amino
contents. It is interesting to note that
upon FITC coupling, the pore volume
and BET surface area increase for A
MCM-41(12). This effect is due to minor
leaching of amino groups upon stirring in
ethanol for 24 h. As the
coupled FITC is small and most likely
concentrated on the external particle
surface of MCM-
surface-grafted amino groups is not
compensated by intrapore coupling of
FITC. For MCM
hand, a significant re
volume was observed over the entire
range of investigated amino contents,
confirming that even at high amino
content (C-MCM
couple to amino groups located on the
pore surface. However, the pore size
distributions before and after FITC
coupling (Figure 5) suggest that with
increasing amino content, FITC couples
1.0 g of the amino-functionalized MCM
41(16) sample is able to bind 0.13 mmol
of FITC, the corresponding MCM
sample binds only 0.03 mmol, leading to
the conclusion that in the latter c
FITC predominantly reacts with amino
groups anchored to the external surface.
This is in agreement with nitrogen
sorption data of the samples before and
after FITC coupling (Figure 5, Table 2). In
MCM-41(12), grafting of
0.4 mmol/g of APTMS led to a reduction
of the pore volume, but only to a slight
accompanying decrease of the pore
diameter, thus indicating preferential
functionalization at the pore entrances
and a scarcely functionalized pore body.
The same observation is made for the
41(12) samples with higher amino
contents. It is interesting to note that
upon FITC coupling, the pore volume
and BET surface area increase for A
41(12). This effect is due to minor
leaching of amino groups upon stirring in
ethanol for 24 h. As the
coupled FITC is small and most likely
concentrated on the external particle
-41(12), the loss of pore
grafted amino groups is not
compensated by intrapore coupling of
FITC. For MCM-41(16), on the other
hand, a significant reduction of the pore
volume was observed over the entire
range of investigated amino contents,
confirming that even at high amino
MCM-41(16)), FITC is able to
couple to amino groups located on the
pore surface. However, the pore size
s before and after FITC
coupling (Figure 5) suggest that with
increasing amino content, FITC couples
functionalized MCM
41(16) sample is able to bind 0.13 mmol
of FITC, the corresponding MCM-41(12)
sample binds only 0.03 mmol, leading to
the conclusion that in the latter case,
FITC predominantly reacts with amino
groups anchored to the external surface.
This is in agreement with nitrogen
sorption data of the samples before and
after FITC coupling (Figure 5, Table 2). In
41(12), grafting of
TMS led to a reduction
of the pore volume, but only to a slight
accompanying decrease of the pore
diameter, thus indicating preferential
functionalization at the pore entrances
and a scarcely functionalized pore body.
The same observation is made for the
41(12) samples with higher amino
contents. It is interesting to note that
upon FITC coupling, the pore volume
and BET surface area increase for A
41(12). This effect is due to minor
leaching of amino groups upon stirring in
ethanol for 24 h. As the amount of
coupled FITC is small and most likely
concentrated on the external particle
41(12), the loss of pore
grafted amino groups is not
compensated by intrapore coupling of
41(16), on the other
duction of the pore
volume was observed over the entire
range of investigated amino contents,
confirming that even at high amino
41(16)), FITC is able to
couple to amino groups located on the
pore surface. However, the pore size
s before and after FITC
coupling (Figure 5) suggest that with
increasing amino content, FITC couples
functionalized MCM-
41(16) sample is able to bind 0.13 mmol
41(12)
sample binds only 0.03 mmol, leading to
ase,
FITC predominantly reacts with amino
groups anchored to the external surface.
This is in agreement with nitrogen
sorption data of the samples before and
after FITC coupling (Figure 5, Table 2). In
41(12), grafting of
TMS led to a reduction
of the pore volume, but only to a slight
accompanying decrease of the pore
diameter, thus indicating preferential
functionalization at the pore entrances
and a scarcely functionalized pore body.
The same observation is made for the
41(12) samples with higher amino
contents. It is interesting to note that
upon FITC coupling, the pore volume
and BET surface area increase for A-
41(12). This effect is due to minor
leaching of amino groups upon stirring in
amount of
coupled FITC is small and most likely
concentrated on the external particle
41(12), the loss of pore
grafted amino groups is not
compensated by intrapore coupling of
41(16), on the other
duction of the pore
volume was observed over the entire
range of investigated amino contents,
confirming that even at high amino
41(16)), FITC is able to
couple to amino groups located on the
pore surface. However, the pore size
s before and after FITC
coupling (Figure 5) suggest that with
increasing amino content, FITC couples

Figure 5.
and SBA
lines represent the pore size distributions of the respective unmodified parent materials. The
amino conten
compiled in Table 2.
predominantly to pore entrance sites of
MCM
the pore volume while retaining a
relatively large pore diameter. The
pronounced binding of FITC to pore
entrance sites of amino
MCM
increasi
decreasing the FITC coupling yield
(Figure 3). Figure 5 also shows the pore
size distributions of the corresponding
SBA
Figure 5. Pore size distributions of
and SBA-15 samples before (filled circles) and after (empty circles) FITC coupling. The dashed
lines represent the pore size distributions of the respective unmodified parent materials. The
amino conten
compiled in Table 2.
predominantly to pore entrance sites of
MCM-41(16), leading to a reduction of
the pore volume while retaining a
relatively large pore diameter. The
pronounced binding of FITC to pore
entrance sites of amino
MCM-41(16) causes pore blocking with
increasing amino content, thereby
decreasing the FITC coupling yield
(Figure 3). Figure 5 also shows the pore
size distributions of the corresponding
SBA-15 samples, which illustrate the
Pore size distributions of
15 samples before (filled circles) and after (empty circles) FITC coupling. The dashed
lines represent the pore size distributions of the respective unmodified parent materials. The
amino content increases from the A
compiled in Table 2.
predominantly to pore entrance sites of
41(16), leading to a reduction of
the pore volume while retaining a
relatively large pore diameter. The
pronounced binding of FITC to pore
entrance sites of amino
41(16) causes pore blocking with
ng amino content, thereby
decreasing the FITC coupling yield
(Figure 3). Figure 5 also shows the pore
size distributions of the corresponding
15 samples, which illustrate the
Pore size distributions of selected amino
15 samples before (filled circles) and after (empty circles) FITC coupling. The dashed
lines represent the pore size distributions of the respective unmodified parent materials. The
t increases from the A
predominantly to pore entrance sites of
41(16), leading to a reduction of
the pore volume while retaining a
relatively large pore diameter. The
pronounced binding of FITC to pore
entrance sites of amino-functionalized
41(16) causes pore blocking with
ng amino content, thereby
decreasing the FITC coupling yield
(Figure 3). Figure 5 also shows the pore
size distributions of the corresponding
15 samples, which illustrate the
93
selected amino
15 samples before (filled circles) and after (empty circles) FITC coupling. The dashed
lines represent the pore size distributions of the respective unmodified parent materials. The
t increases from the A- to the C-samples. Additional characterization data is
predominantly to pore entrance sites of
41(16), leading to a reduction of
the pore volume while retaining a
relatively large pore diameter. The
pronounced binding of FITC to pore
functionalized
41(16) causes pore blocking with
ng amino content, thereby
decreasing the FITC coupling yield
(Figure 3). Figure 5 also shows the pore
size distributions of the corresponding
15 samples, which illustrate the
selected amino-functionalized MCM
15 samples before (filled circles) and after (empty circles) FITC coupling. The dashed
lines represent the pore size distributions of the respective unmodified parent materials. The
samples. Additional characterization data is
expected outcome of a comparatively
more uniform distribution of amino
groups and coupled FITC.
Inspection of the nitrogen sorption
isotherms before and after FITC coupling
reveals that in some specific cases, the
desorption isotherm does not close at
lower relative pressure. Such broad
hysteresis has been reported for
mesoporous o
interpreted as a consequence of
bottlenecking of pore openings,
functionalized MCM-41(12), MCM
15 samples before (filled circles) and after (empty circles) FITC coupling. The dashed
lines represent the pore size distributions of the respective unmodified parent materials. The
samples. Additional characterization data is
expected outcome of a comparatively
more uniform distribution of amino
and coupled FITC.
Inspection of the nitrogen sorption
isotherms before and after FITC coupling
reveals that in some specific cases, the
desorption isotherm does not close at
lower relative pressure. Such broad
hysteresis has been reported for
mesoporous organosilicas and has been
interpreted as a consequence of
bottlenecking of pore openings,
41(12), MCM
15 samples before (filled circles) and after (empty circles) FITC coupling. The dashed
lines represent the pore size distributions of the respective unmodified parent materials. The
samples. Additional characterization data is
expected outcome of a comparatively
more uniform distribution of amino
and coupled FITC.
Inspection of the nitrogen sorption
isotherms before and after FITC coupling
reveals that in some specific cases, the
desorption isotherm does not close at
lower relative pressure. Such broad
hysteresis has been reported for
rganosilicas and has been
interpreted as a consequence of
bottlenecking of pore openings, clearly
41(12), MCM-41(16),
15 samples before (filled circles) and after (empty circles) FITC coupling. The dashed
lines represent the pore size distributions of the respective unmodified parent materials. The
samples. Additional characterization data is
expected outcome of a comparatively
more uniform distribution of amino
Inspection of the nitrogen sorption
isotherms before and after FITC coupling
reveals that in some specific cases, the
desorption isotherm does not close at
lower relative pressure. Such broad
hysteresis has been reported for
rganosilicas and has been
interpreted as a consequence of
clearly
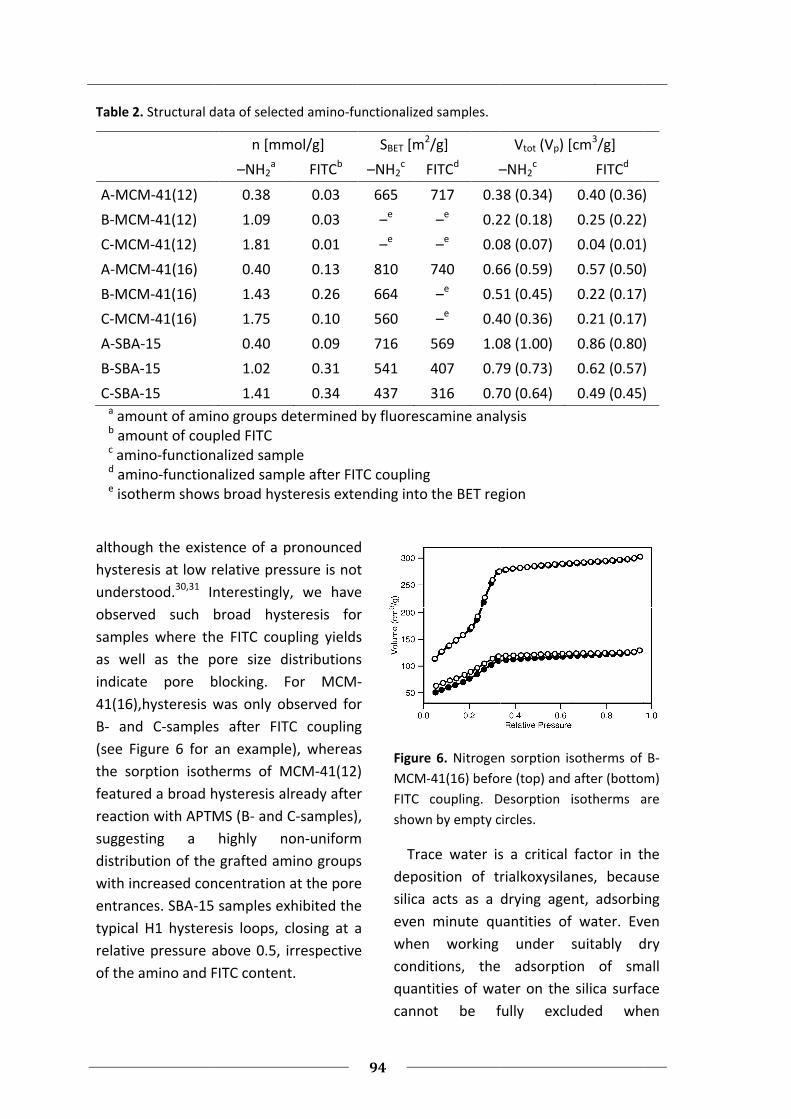
Table 2.
A-MCM
B-MCM
C-MCM
A-MCM
B-MCM
C-MCM
A-SBA-
B-SBA-
C-SBA-a amount of amino groups determined by fluorescamine analysisb amount of coupled FITCc aminod aminoe isotherm shows broad hysteresis extending into the BET region
although the existence of a pronounced
hysteresis at low relative pressure is not
understood.
observed such broad hysteresis for
samples where the FITC coupling yields
as well as the pore size distributions
indicate pore blocking. For MCM
41(16),hysteresis was only observed for
B- and C
(see Figure 6 for an example), whereas
the sorption isotherms of MCM
featured a broad hysteresis already after
reaction with APTMS (B
suggesting a highly non
distribution of the grafted amino
with increased concentration at the pore
entrances. SBA
typical H1 hysteresis loops, closing at a
relative p
of the amino and FITC content.
2. Structural data of selected amino
MCM-41(12)
MCM-41(12)
MCM-41(12)
MCM-41(16)
MCM-41(16)
MCM-41(16)
-15
-15
-15
amount of amino groups determined by fluorescamine analysisamount of coupled FITCamino-functionalized sampleamino-functionisotherm shows broad hysteresis extending into the BET region
although the existence of a pronounced
hysteresis at low relative pressure is not
understood.30,31 Interestingly, we have
observed such broad hysteresis for
samples where the FITC coupling yields
as well as the pore size distributions
indicate pore blocking. For MCM
hysteresis was only observed for
d C-samples after FITC coupling
(see Figure 6 for an example), whereas
the sorption isotherms of MCM
featured a broad hysteresis already after
reaction with APTMS (B
suggesting a highly non
distribution of the grafted amino
with increased concentration at the pore
entrances. SBA-15 samples exhibited the
typical H1 hysteresis loops, closing at a
relative pressure above 0.5, irrespective
of the amino and FITC content.
Structural data of selected amino
n [mmol/g]
–NH2a
0.38
1.09
1.81
0.40
1.43
1.75
0.40
1.02
1.41
amount of amino groups determined by fluorescamine analysisamount of coupled FITC
functionalized samplefunctionalized sample after FITC coupling
isotherm shows broad hysteresis extending into the BET region
although the existence of a pronounced
hysteresis at low relative pressure is not
Interestingly, we have
observed such broad hysteresis for
samples where the FITC coupling yields
as well as the pore size distributions
indicate pore blocking. For MCM
hysteresis was only observed for
samples after FITC coupling
(see Figure 6 for an example), whereas
the sorption isotherms of MCM
featured a broad hysteresis already after
reaction with APTMS (B- and C
suggesting a highly non
distribution of the grafted amino
with increased concentration at the pore
15 samples exhibited the
typical H1 hysteresis loops, closing at a
ressure above 0.5, irrespective
of the amino and FITC content.
Structural data of selected amino-functionalized samples.
n [mmol/g]
FITCb
0.03
0.03
0.01
0.13
0.26
0.10
0.09
0.31
0.34
amount of amino groups determined by fluorescamine analysis
functionalized sample alized sample after FITC coupling
isotherm shows broad hysteresis extending into the BET region
although the existence of a pronounced
hysteresis at low relative pressure is not
Interestingly, we have
observed such broad hysteresis for
samples where the FITC coupling yields
as well as the pore size distributions
indicate pore blocking. For MCM-
hysteresis was only observed for
samples after FITC coupling
(see Figure 6 for an example), whereas
the sorption isotherms of MCM-41(12)
featured a broad hysteresis already after
and C-samples),
suggesting a highly non-uniform
distribution of the grafted amino groups
with increased concentration at the pore
15 samples exhibited the
typical H1 hysteresis loops, closing at a
ressure above 0.5, irrespective
of the amino and FITC content.
94
functionalized samples.
SBET [m2
–NH2c FITC
665
–e
–e
810
664
560
716
541
437
amount of amino groups determined by fluorescamine analysis
alized sample after FITC couplingisotherm shows broad hysteresis extending into the BET region
although the existence of a pronounced
hysteresis at low relative pressure is not
Interestingly, we have
observed such broad hysteresis for
samples where the FITC coupling yields
as well as the pore size distributions
-
hysteresis was only observed for
samples after FITC coupling
(see Figure 6 for an example), whereas
41(12)
featured a broad hysteresis already after
samples),
uniform
groups
with increased concentration at the pore
15 samples exhibited the
typical H1 hysteresis loops, closing at a
ressure above 0.5, irrespective
Figure 6.
MCM-
FITC coupling. Desorption isotherms are
shown by empty circl
Trace water is a critical factor in the
deposition o
silica acts as a drying agent, adsorbing
even minute quantities of water. Even
when working under suitably dry
conditions, the adsorption of small
quantities of water on the silica surface
cannot be fully excluded when
functionalized samples.
2/g]
FITCd –
717 0.38 (0.34)
–e 0.22 (0.18)
–e 0.08 (0.07)
740 0.66 (0.59)
–e 0.51 (0.45)
–e 0.40 (0.36)
569 1.08 (
407 0.79 (0.73)
316 0.70 (0.64)
amount of amino groups determined by fluorescamine analysis
alized sample after FITC coupling isotherm shows broad hysteresis extending into the BET region
Figure 6. Nitrogen sorption isotherms of B
-41(16) before (top) and after (bottom)
FITC coupling. Desorption isotherms are
shown by empty circl
Trace water is a critical factor in the
deposition of trialkoxysilanes, because
silica acts as a drying agent, adsorbing
even minute quantities of water. Even
when working under suitably dry
conditions, the adsorption of small
quantities of water on the silica surface
annot be fully excluded when
Vtot (Vp) [cm
–NH2c
0.38 (0.34)
0.22 (0.18)
0.08 (0.07)
0.66 (0.59)
0.51 (0.45)
0.40 (0.36)
1.08 (1.00)
0.79 (0.73)
0.70 (0.64)
amount of amino groups determined by fluorescamine analysis
isotherm shows broad hysteresis extending into the BET region
Nitrogen sorption isotherms of B
41(16) before (top) and after (bottom)
FITC coupling. Desorption isotherms are
shown by empty circles.
Trace water is a critical factor in the
f trialkoxysilanes, because
silica acts as a drying agent, adsorbing
even minute quantities of water. Even
when working under suitably dry
conditions, the adsorption of small
quantities of water on the silica surface
annot be fully excluded when
) [cm3/g]
FITCd
0.40 (0.36)
0.25 (0.22)
0.04 (0.01)
0.57 (0.50)
0.22 (0.17)
0.21 (0.17)
0.86 (0.80)
0.62 (0.57)
0.49 (0.45)
Nitrogen sorption isotherms of B
41(16) before (top) and after (bottom)
FITC coupling. Desorption isotherms are
Trace water is a critical factor in the
f trialkoxysilanes, because
silica acts as a drying agent, adsorbing
even minute quantities of water. Even
when working under suitably dry
conditions, the adsorption of small
quantities of water on the silica surface
annot be fully excluded when
0.40 (0.36)
)
0.04 (0.01)
0.57 (0.50)
0.22 (0.17)
0.21 (0.17)
0.86 (0.80)
0.62 (0.57)
0.49 (0.45)
Nitrogen sorption isotherms of B-
41(16) before (top) and after (bottom)
FITC coupling. Desorption isotherms are
Trace water is a critical factor in the
f trialkoxysilanes, because
silica acts as a drying agent, adsorbing
even minute quantities of water. Even
when working under suitably dry
conditions, the adsorption of small
quantities of water on the silica surface
annot be fully excluded when

95
depositing silanes from a solvent.32 As a
result, silane cross-linking is to be
expected to some degree. The formation
of silane clusters can lead to narrow
pore sections and promote pore
blocking. The degree of silane clustering
can therefore be crucial in determining
the accessibility of the grafted functional
groups, especially when working with
small one-dimensional mesopores.
3.3. The Role of Microporosity
It is well known that SBA-15 contains
intrawall pores, which may constitute up
to 30 % of the total porosity.33 These
intrawall pores include micropores34-36
which provide connectivity between the
primary mesopores.37 It is reasonable to
assume that grafting of APTMS also
occurs in these smaller pores. Along the
same line of reasoning, one can expect
that a high degree of surface roughness
leads to a larger fraction of inaccessible
amino groups. It has recently been
proposed that SBA-15 features a higher
degree of pore surface roughness and a
larger amount of surface defects than
MCM-41.38-40 Grafting of APTMS in the
intrawall pores of SBA-15 is one possible
explanation for the comparatively low
overall FITC coupling yields. It is worth
mentioning that at very low amino
content (0.1 µmol/m2) the FITC coupling
yield dropped to 15 % (compared to
close to 40 % for a corresponding MCM-
41(16) sample). This is most likely a
consequence of preferential intrawall
micropore adsorption of APTMS.
The presence of micropores in SBA-15
leads to various problems in the
determination of textural properties. A
large micropore volume renders the
standard BET analysis unreliable.
Galarneau et al. proposed that in such
cases the actual surface areas are much
lower than what is obtained by BET
analysis.41 Regarding the results shown
in Figure 4, this would imply a higher
grafting density for the SBA-15 samples.
However, we obtained a CBET value of
120, which is well within the normal
range of values expected for silica
adsorbents and confirms that the system
is in the field of application of the BET
equation.41,42
Comparison of the t-curves of the
unmodified SBA-15 and a corresponding
amino-functionalized sample (A-SBA-15)
reveals that the positive intercept of the
t-curve of the parent SBA-15, which is an
indication of microporosity, is no longer
observed after APTMS grafting (Figure 7,
top left). A distinct deviation from
linearity at low t-values provides
additional evidence for the presence of
micropores in the parent SBA-15.
Improved t-curve linearity is obtained
after APTMS grafting. This effect can
already be observed for a relatively low
amino content of 0.1 µmol/m2 (Figure 7,
bottom left). In the case of analogous
MCM-41(16) samples, the initial linear
parts of the t-curves approach the origin
independent of amino-functionalization,
showing only a minor deviation from
linearity (Figure 7, right). This is the
expected behavior of a purely
mesoporous material.
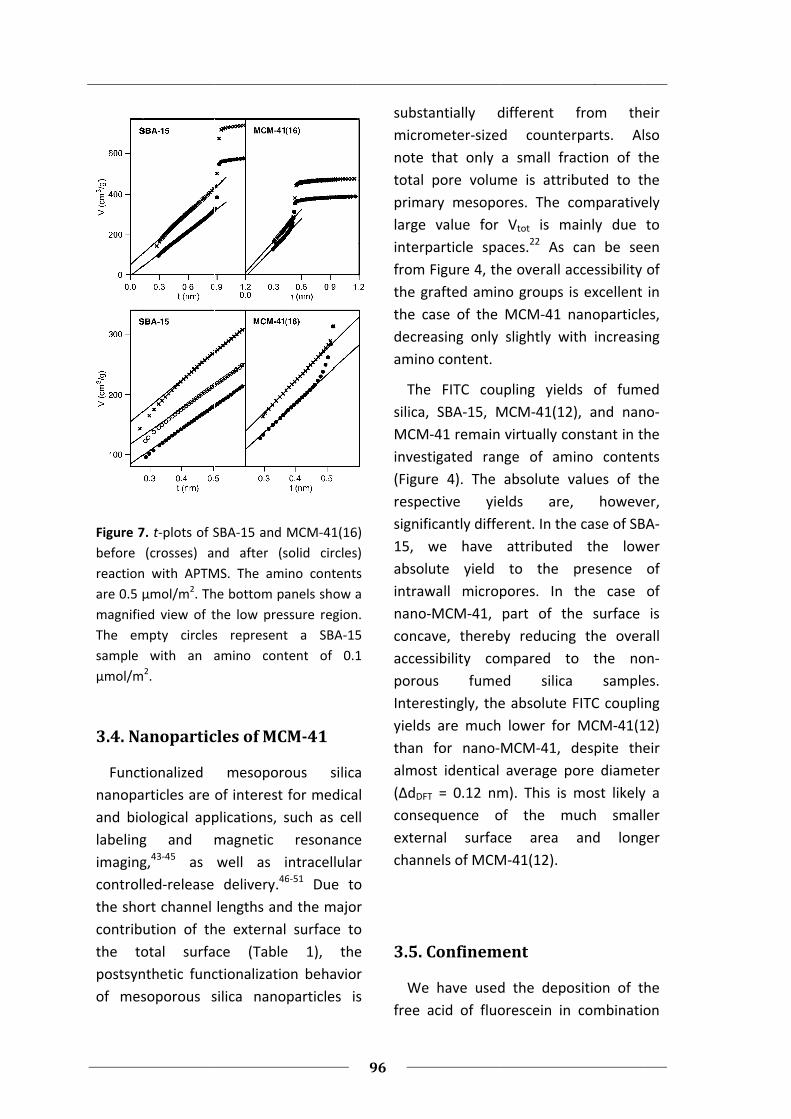
Figure 7.
before (crosses) and after (solid circles)
reaction with APTMS. The amino co
are 0.5 µmol/m
magnified view of the low pressure region.
The empty circles represent a SBA
sample with an amino content of 0.1
µmol/m
3.4. Nanoparticles of MCM
Functionalized mesoporous silica
nanoparticles are of interest for medical
and biological applications, such as cell
labeling and magnetic resonance
imaging,
controlled
the short channel lengths and the major
contribution of the external surface to
the total surface (Table 1), the
postsynthetic functionalization behavior
of mesoporous silica nanoparticles is
Figure 7. t-plots of SBA
before (crosses) and after (solid circles)
reaction with APTMS. The amino co
are 0.5 µmol/m2. The bottom panels show a
magnified view of the low pressure region.
The empty circles represent a SBA
sample with an amino content of 0.1
µmol/m2.
3.4. Nanoparticles of MCM
Functionalized mesoporous silica
nanoparticles are of interest for medical
and biological applications, such as cell
labeling and magnetic resonance
imaging,43-45 as well as intracellular
controlled-release
the short channel lengths and the major
contribution of the external surface to
the total surface (Table 1), the
postsynthetic functionalization behavior
of mesoporous silica nanoparticles is
plots of SBA-15 and MCM
before (crosses) and after (solid circles)
reaction with APTMS. The amino co
. The bottom panels show a
magnified view of the low pressure region.
The empty circles represent a SBA
sample with an amino content of 0.1
3.4. Nanoparticles of MCM
Functionalized mesoporous silica
nanoparticles are of interest for medical
and biological applications, such as cell
labeling and magnetic resonance
as well as intracellular
release delivery.46
the short channel lengths and the major
contribution of the external surface to
the total surface (Table 1), the
postsynthetic functionalization behavior
of mesoporous silica nanoparticles is
15 and MCM-41(16)
before (crosses) and after (solid circles)
reaction with APTMS. The amino contents
. The bottom panels show a
magnified view of the low pressure region.
The empty circles represent a SBA-15
sample with an amino content of 0.1
3.4. Nanoparticles of MCM-41
Functionalized mesoporous silica
nanoparticles are of interest for medical
and biological applications, such as cell
labeling and magnetic resonance
as well as intracellular 46-51 Due to
the short channel lengths and the major
contribution of the external surface to
the total surface (Table 1), the
postsynthetic functionalization behavior
of mesoporous silica nanoparticles is
96
41(16)
before (crosses) and after (solid circles)
ntents
. The bottom panels show a
magnified view of the low pressure region.
15
sample with an amino content of 0.1
Functionalized mesoporous silica
nanoparticles are of interest for medical
and biological applications, such as cell
labeling and magnetic resonance
as well as intracellular
Due to
the short channel lengths and the major
contribution of the external surface to
the total surface (Table 1), the
postsynthetic functionalization behavior
of mesoporous silica nanoparticles is
substantially different from their
microme
note that only a small fraction of the
total pore volume is attributed to the
primary mesopores. The comparatively
large value for V
interparticle spaces.
from Figure 4, the overall accessib
the grafted amino groups is excellent in
the case of the MCM
decreasing only slightly with increasing
amino content.
The FITC coupling yields of fumed
silica, SBA
MCM
investigated range of amino contents
(Figure 4). The absolute values of the
respective yields are, however,
significantly different. In the case of SBA
15, we have attributed the lower
absolute yield to the presence of
intrawall micropores. In the case of
nano-
concave, thereby reducing the overall
accessibility compared to the non
porous fumed silica samples.
Interestingly, the absolute FITC coupling
yields are much lower for MCM
than for nano
almos
(ΔdDFT
consequence of the much smaller
external surface area and longer
channels of MCM
3.5. Confinement
We have used the deposition of the
free acid of fluorescein in combination
substantially different from their
micrometer-sized counterparts. Also
note that only a small fraction of the
total pore volume is attributed to the
primary mesopores. The comparatively
large value for V
interparticle spaces.
from Figure 4, the overall accessib
the grafted amino groups is excellent in
the case of the MCM
decreasing only slightly with increasing
amino content.
The FITC coupling yields of fumed
silica, SBA-15, MCM
MCM-41 remain virtually constant in the
nvestigated range of amino contents
(Figure 4). The absolute values of the
respective yields are, however,
significantly different. In the case of SBA
15, we have attributed the lower
absolute yield to the presence of
intrawall micropores. In the case of
-MCM-41, part of the surface is
concave, thereby reducing the overall
accessibility compared to the non
porous fumed silica samples.
Interestingly, the absolute FITC coupling
yields are much lower for MCM
than for nano-MCM
almost identical average pore diameter
DFT = 0.12 nm). This is most likely a
consequence of the much smaller
external surface area and longer
channels of MCM
3.5. Confinement
We have used the deposition of the
free acid of fluorescein in combination
substantially different from their
sized counterparts. Also
note that only a small fraction of the
total pore volume is attributed to the
primary mesopores. The comparatively
large value for Vtot is mainly due to
interparticle spaces.22 As can be seen
from Figure 4, the overall accessib
the grafted amino groups is excellent in
the case of the MCM-41 nanoparticles,
decreasing only slightly with increasing
The FITC coupling yields of fumed
15, MCM-41(12), and nano
41 remain virtually constant in the
nvestigated range of amino contents
(Figure 4). The absolute values of the
respective yields are, however,
significantly different. In the case of SBA
15, we have attributed the lower
absolute yield to the presence of
intrawall micropores. In the case of
41, part of the surface is
concave, thereby reducing the overall
accessibility compared to the non
porous fumed silica samples.
Interestingly, the absolute FITC coupling
yields are much lower for MCM
MCM-41, despite their
t identical average pore diameter
= 0.12 nm). This is most likely a
consequence of the much smaller
external surface area and longer
channels of MCM-41(12).
3.5. Confinement
We have used the deposition of the
free acid of fluorescein in combination
substantially different from their
sized counterparts. Also
note that only a small fraction of the
total pore volume is attributed to the
primary mesopores. The comparatively
is mainly due to
As can be seen
from Figure 4, the overall accessibility of
the grafted amino groups is excellent in
41 nanoparticles,
decreasing only slightly with increasing
The FITC coupling yields of fumed
41(12), and nano
41 remain virtually constant in the
nvestigated range of amino contents
(Figure 4). The absolute values of the
respective yields are, however,
significantly different. In the case of SBA
15, we have attributed the lower
absolute yield to the presence of
intrawall micropores. In the case of
41, part of the surface is
concave, thereby reducing the overall
accessibility compared to the non
porous fumed silica samples.
Interestingly, the absolute FITC coupling
yields are much lower for MCM-41(12)
41, despite their
t identical average pore diameter
= 0.12 nm). This is most likely a
consequence of the much smaller
external surface area and longer
We have used the deposition of the
free acid of fluorescein in combination
substantially different from their
sized counterparts. Also
note that only a small fraction of the
total pore volume is attributed to the
primary mesopores. The comparatively
is mainly due to
As can be seen
ility of
the grafted amino groups is excellent in
41 nanoparticles,
decreasing only slightly with increasing
The FITC coupling yields of fumed
41(12), and nano-
41 remain virtually constant in the
nvestigated range of amino contents
(Figure 4). The absolute values of the
respective yields are, however,
significantly different. In the case of SBA-
15, we have attributed the lower
absolute yield to the presence of
intrawall micropores. In the case of
41, part of the surface is
concave, thereby reducing the overall
accessibility compared to the non-
porous fumed silica samples.
Interestingly, the absolute FITC coupling
41(12)
41, despite their
t identical average pore diameter
= 0.12 nm). This is most likely a
consequence of the much smaller
external surface area and longer
We have used the deposition of the
free acid of fluorescein in combination

with a defined washing treatment to
probe the confinement experienced by
the adsorbed molecules. With pK
of 4.4 (neutral fluorescein) and 6.7
(fluorescein monoanion),
expect protonation of surface
amino groups and subsequent
elect
mono
retained fluorescein after the washing
procedure is a measure for the
confinement. The results of experiments
conducted with B
in Figure 8. The samples are arranged
according to their FITC coupling yield
(white bars). The amount of adsorbed
fluorescein (black bars) follows basically
the same trend. This is not surprising, as
a high accessibility, indicated by a large
FITC coupling yield, results in a large
number of
adsorption sites for fluorescein. The
MCM
notable exception, retaining an
uncharacteristically large amount of
fluorescein after washing. In this case, it
is particularly illustrative to compare the
respe
a value of 0.32, the MCM
clearly stands out. This can be explained
on the basis that fluorescein molecules
adsorbed in the channels are well
protected against washing with ethanol,
whereas in the case of MC
nano
molecules are located on or close to the
exposed external surface. Similarly, a
large pore diameter (SBA
less confinement, rendering the
with a defined washing treatment to
probe the confinement experienced by
the adsorbed molecules. With pK
of 4.4 (neutral fluorescein) and 6.7
(fluorescein monoanion),
expect protonation of surface
amino groups and subsequent
electrostatic
mono- and dianions. The amount of
retained fluorescein after the washing
procedure is a measure for the
confinement. The results of experiments
conducted with B
in Figure 8. The samples are arranged
according to their FITC coupling yield
(white bars). The amount of adsorbed
fluorescein (black bars) follows basically
the same trend. This is not surprising, as
a high accessibility, indicated by a large
FITC coupling yield, results in a large
number of
adsorption sites for fluorescein. The
MCM-41(16) sample is, however, a
notable exception, retaining an
uncharacteristically large amount of
fluorescein after washing. In this case, it
is particularly illustrative to compare the
respective fluorescein/FITC ratios. With
a value of 0.32, the MCM
clearly stands out. This can be explained
on the basis that fluorescein molecules
adsorbed in the channels are well
protected against washing with ethanol,
whereas in the case of MC
nano-MCM-41 most of the fluorescein
molecules are located on or close to the
exposed external surface. Similarly, a
large pore diameter (SBA
less confinement, rendering the
with a defined washing treatment to
probe the confinement experienced by
the adsorbed molecules. With pK
of 4.4 (neutral fluorescein) and 6.7
(fluorescein monoanion),
expect protonation of surface
amino groups and subsequent
rostatic interaction with fluorescein
and dianions. The amount of
retained fluorescein after the washing
procedure is a measure for the
confinement. The results of experiments
conducted with B-x samples are shown
in Figure 8. The samples are arranged
according to their FITC coupling yield
(white bars). The amount of adsorbed
fluorescein (black bars) follows basically
the same trend. This is not surprising, as
a high accessibility, indicated by a large
FITC coupling yield, results in a large
number of immediately available
adsorption sites for fluorescein. The
41(16) sample is, however, a
notable exception, retaining an
uncharacteristically large amount of
fluorescein after washing. In this case, it
is particularly illustrative to compare the
ctive fluorescein/FITC ratios. With
a value of 0.32, the MCM
clearly stands out. This can be explained
on the basis that fluorescein molecules
adsorbed in the channels are well
protected against washing with ethanol,
whereas in the case of MC
41 most of the fluorescein
molecules are located on or close to the
exposed external surface. Similarly, a
large pore diameter (SBA
less confinement, rendering the
with a defined washing treatment to
probe the confinement experienced by
the adsorbed molecules. With pKa values
of 4.4 (neutral fluorescein) and 6.7
(fluorescein monoanion),29 we can
expect protonation of surface-grafted
amino groups and subsequent
interaction with fluorescein
and dianions. The amount of
retained fluorescein after the washing
procedure is a measure for the
confinement. The results of experiments
samples are shown
in Figure 8. The samples are arranged
according to their FITC coupling yield
(white bars). The amount of adsorbed
fluorescein (black bars) follows basically
the same trend. This is not surprising, as
a high accessibility, indicated by a large
FITC coupling yield, results in a large
immediately available
adsorption sites for fluorescein. The
41(16) sample is, however, a
notable exception, retaining an
uncharacteristically large amount of
fluorescein after washing. In this case, it
is particularly illustrative to compare the
ctive fluorescein/FITC ratios. With
a value of 0.32, the MCM-14(16) sample
clearly stands out. This can be explained
on the basis that fluorescein molecules
adsorbed in the channels are well
protected against washing with ethanol,
whereas in the case of MCM-41(12) or
41 most of the fluorescein
molecules are located on or close to the
exposed external surface. Similarly, a
large pore diameter (SBA-15) leads to
less confinement, rendering the
97
with a defined washing treatment to
probe the confinement experienced by
values
of 4.4 (neutral fluorescein) and 6.7
we can
grafted
amino groups and subsequent
interaction with fluorescein
and dianions. The amount of
retained fluorescein after the washing
procedure is a measure for the
confinement. The results of experiments
samples are shown
in Figure 8. The samples are arranged
according to their FITC coupling yield
(white bars). The amount of adsorbed
fluorescein (black bars) follows basically
the same trend. This is not surprising, as
a high accessibility, indicated by a large
FITC coupling yield, results in a large
immediately available
adsorption sites for fluorescein. The
41(16) sample is, however, a
notable exception, retaining an
uncharacteristically large amount of
fluorescein after washing. In this case, it
is particularly illustrative to compare the
ctive fluorescein/FITC ratios. With
14(16) sample
clearly stands out. This can be explained
on the basis that fluorescein molecules
adsorbed in the channels are well
protected against washing with ethanol,
41(12) or
41 most of the fluorescein
molecules are located on or close to the
exposed external surface. Similarly, a
15) leads to
Figure 8. Relative amount of coupled FITC
and adsorbed fluorescein for selected B
samples. The respective fluorescein/FITC
ratios are given by the values next to the
black bars.
adsorbed
susceptible to removal by w
Based on the amount of retained
fluorescein, adsorption in the intrawall
micropores of SBA
provide strong confinement, is unlikely.
Again it is interesting to note the
differences between MCM
MCM-48. The three
channel system apparently facilitates the
removal of adsorbed fluorescein
molecules.
A-x samples exhibited the same
tendency, but featured smaller absolute
amounts of adsorbed fluorescein (due to
the smaller amount of grafted amino
groups), hence renderin
less reliable. Compared to the respective
B-x samples, the C
larger amounts of fluorescein after the
Relative amount of coupled FITC
and adsorbed fluorescein for selected B
samples. The respective fluorescein/FITC
ratios are given by the values next to the
adsorbed fluorescein molecules
susceptible to removal by w
Based on the amount of retained
fluorescein, adsorption in the intrawall
micropores of SBA-15, which would
provide strong confinement, is unlikely.
Again it is interesting to note the
differences between MCM
48. The three
channel system apparently facilitates the
removal of adsorbed fluorescein
samples exhibited the same
tendency, but featured smaller absolute
amounts of adsorbed fluorescein (due to
the smaller amount of grafted amino
groups), hence renderin
less reliable. Compared to the respective
samples, the C-x
larger amounts of fluorescein after the
Relative amount of coupled FITC
and adsorbed fluorescein for selected B
samples. The respective fluorescein/FITC
ratios are given by the values next to the
fluorescein molecules
susceptible to removal by w
Based on the amount of retained
fluorescein, adsorption in the intrawall
15, which would
provide strong confinement, is unlikely.
Again it is interesting to note the
differences between MCM-41(16) and
48. The three-dimensional
channel system apparently facilitates the
removal of adsorbed fluorescein
samples exhibited the same
tendency, but featured smaller absolute
amounts of adsorbed fluorescein (due to
the smaller amount of grafted amino
groups), hence rendering the analysis
less reliable. Compared to the respective
samples contained
larger amounts of fluorescein after the
Relative amount of coupled FITC
and adsorbed fluorescein for selected B-x
samples. The respective fluorescein/FITC
ratios are given by the values next to the
fluorescein molecules
susceptible to removal by washing.
Based on the amount of retained
fluorescein, adsorption in the intrawall
15, which would
provide strong confinement, is unlikely.
Again it is interesting to note the
41(16) and
dimensional
channel system apparently facilitates the
removal of adsorbed fluorescein
samples exhibited the same
tendency, but featured smaller absolute
amounts of adsorbed fluorescein (due to
the smaller amount of grafted amino
g the analysis
less reliable. Compared to the respective
samples contained
larger amounts of fluorescein after the

washing treatment. In agreement with
the results shown in Figure 8, C
41(16) featured the highest
fluorescein/FITC r
4. Conclusions
Our conclusions concerning the
accessibility of am
dimensional channel systems of MCM
41(12), MCM
illustrated by the schematic snapshots
shown in Figure 9. The small pore
diameter of MCM
formation of blocked pores upon
coupling of FITC to
at the pore entrances. The non
distribution of the amino groups
obtained after postsynthetic
functionalization with APTMS further
promotes pore blocking upon FITC
coupling.
A slightly larger pore diameter (MCM
41(16)) provides
yields, which are, however, extremely
sensitive to the total amount of grafted
amino groups. High amino contents
increase the probability of bottleneck
formation by coupling of FITC to densely
grafted amino groups at the pore
entrances
The accessibility of the amino groups
grafted to the mesopore walls of SBA
is comparable to the accessibility on an
open surface. The large pore diameter
provides access to sites deep inside the
pores irrespective of the total amino
content. However,
washing treatment. In agreement with
the results shown in Figure 8, C
41(16) featured the highest
fluorescein/FITC ratio.
4. Conclusions
Our conclusions concerning the
accessibility of am
dimensional channel systems of MCM
41(12), MCM-41(16), and SBA
illustrated by the schematic snapshots
shown in Figure 9. The small pore
diameter of MCM
formation of blocked pores upon
coupling of FITC to
at the pore entrances. The non
distribution of the amino groups
obtained after postsynthetic
functionalization with APTMS further
promotes pore blocking upon FITC
coupling.
A slightly larger pore diameter (MCM
41(16)) provides
yields, which are, however, extremely
sensitive to the total amount of grafted
amino groups. High amino contents
increase the probability of bottleneck
formation by coupling of FITC to densely
grafted amino groups at the pore
entrances.
The accessibility of the amino groups
grafted to the mesopore walls of SBA
is comparable to the accessibility on an
open surface. The large pore diameter
provides access to sites deep inside the
pores irrespective of the total amino
content. However,
washing treatment. In agreement with
the results shown in Figure 8, C
41(16) featured the highest
atio.
Our conclusions concerning the
accessibility of amino groups in the one
dimensional channel systems of MCM
41(16), and SBA
illustrated by the schematic snapshots
shown in Figure 9. The small pore
diameter of MCM-41(12) facilitates the
formation of blocked pores upon
coupling of FITC to amino groups located
at the pore entrances. The non
distribution of the amino groups
obtained after postsynthetic
functionalization with APTMS further
promotes pore blocking upon FITC
A slightly larger pore diameter (MCM
41(16)) provides higher FITC coupling
yields, which are, however, extremely
sensitive to the total amount of grafted
amino groups. High amino contents
increase the probability of bottleneck
formation by coupling of FITC to densely
grafted amino groups at the pore
The accessibility of the amino groups
grafted to the mesopore walls of SBA
is comparable to the accessibility on an
open surface. The large pore diameter
provides access to sites deep inside the
pores irrespective of the total amino
content. However, the microporosity
washing treatment. In agreement with
the results shown in Figure 8, C-MCM-
41(16) featured the highest
Our conclusions concerning the
ino groups in the one-
dimensional channel systems of MCM-
41(16), and SBA-15 are
illustrated by the schematic snapshots
shown in Figure 9. The small pore
41(12) facilitates the
formation of blocked pores upon
amino groups located
at the pore entrances. The non-uniform
distribution of the amino groups
obtained after postsynthetic
functionalization with APTMS further
promotes pore blocking upon FITC
A slightly larger pore diameter (MCM-
higher FITC coupling
yields, which are, however, extremely
sensitive to the total amount of grafted
amino groups. High amino contents
increase the probability of bottleneck
formation by coupling of FITC to densely
grafted amino groups at the pore
The accessibility of the amino groups
grafted to the mesopore walls of SBA-15
is comparable to the accessibility on an
open surface. The large pore diameter
provides access to sites deep inside the
pores irrespective of the total amino
the microporosity
98
washing treatment. In agreement with
-
41(16) featured the highest
Our conclusions concerning the
-
-
15 are
illustrated by the schematic snapshots
shown in Figure 9. The small pore
41(12) facilitates the
formation of blocked pores upon
amino groups located
uniform
distribution of the amino groups
obtained after postsynthetic
functionalization with APTMS further
promotes pore blocking upon FITC
-
higher FITC coupling
yields, which are, however, extremely
sensitive to the total amount of grafted
amino groups. High amino contents
increase the probability of bottleneck
formation by coupling of FITC to densely
grafted amino groups at the pore
The accessibility of the amino groups
15
is comparable to the accessibility on an
open surface. The large pore diameter
provides access to sites deep inside the
pores irrespective of the total amino
Figure 9.
the labeling of functional groups grafted to
MCM-
and surface roughness of SBA
renders a considerable fraction of amino
groups inaccessible.
When carrying out multistep
functionalization reactions, such as
grafting a precursor and subsequent
coupling of a further functional moiety,
the relationship between the amount of
grafted precursor and the accessibility
has to be taken into account. This is
especially critical when the size of the
Figure 9. Schematic snapshots i
the labeling of functional groups grafted to
-41(12), MCM
and surface roughness of SBA
renders a considerable fraction of amino
groups inaccessible.
When carrying out multistep
functionalization reactions, such as
grafting a precursor and subsequent
coupling of a further functional moiety,
he relationship between the amount of
grafted precursor and the accessibility
has to be taken into account. This is
especially critical when the size of the
Schematic snapshots i
the labeling of functional groups grafted to
41(12), MCM-41(16), and SBA
and surface roughness of SBA
renders a considerable fraction of amino
groups inaccessible.
When carrying out multistep
functionalization reactions, such as
grafting a precursor and subsequent
coupling of a further functional moiety,
he relationship between the amount of
grafted precursor and the accessibility
has to be taken into account. This is
especially critical when the size of the
Schematic snapshots illustrating
the labeling of functional groups grafted to
41(16), and SBA-15.
and surface roughness of SBA-
renders a considerable fraction of amino
When carrying out multistep
functionalization reactions, such as
grafting a precursor and subsequent
coupling of a further functional moiety,
he relationship between the amount of
grafted precursor and the accessibility
has to be taken into account. This is
especially critical when the size of the
llustrating
the labeling of functional groups grafted to
15
renders a considerable fraction of amino
When carrying out multistep
functionalization reactions, such as
grafting a precursor and subsequent
coupling of a further functional moiety,
he relationship between the amount of
grafted precursor and the accessibility
has to be taken into account. This is
especially critical when the size of the

99
moiety to be coupled is similar to or
larger than the pore radius.
In terms of providing accessible pore
surface sites, a three-dimensional
channel system is superior to a one-
dimensional channel system of similar
pore diameter. Contrary to MCM-48,
MCM-41 suffers from a lack of
alternative paths to a given pore surface
site. However, if selective
functionalization of the external surface
and/or the pore entrances is required, as
for example in the design of mesoporous
silica based drug delivery devices,46-56
one-dimensional channel systems are
advantageous provided that the initial
pore diameter is carefully adapted to
obtain the desired functional group
distribution. By providing excellent
accessibility, short channels, as for
example present in nanoparticles of
MCM-41, complicate the independent
functionalization of external and internal
surfaces.
Finding a balance between the
accessibility of the adsorption sites and
confinement is crucial for the synthesis
of mesoporous silica based host-guest
systems. A high accessibility facilitates
the inclusion of guest species, but the
subsequent lack of confinement causes
high leaching rates. Low accessibility can
similarly lead to high leaching rates, as
guest molecules are preferentially
adsorbed at sites on the external surface
and on the pore surface close to the
pore entrances.
Acknowledgement
Financial support was provided by the
European Commission through the
Human Potential Program (Marie-Curie
RTN Nanomatch, Grant No. MRTN-CT-
2006-035884) and by the Swiss National
Science Foundation (Project 200020-
117591). We would like to thank Stefan
Ritter (Paul Scherrer Institut) for SEM
measurements and Nando Gartmann for
the determination of extinction
coefficients.
References
(1) Rohlfing, Y.; Wöhrle, D.; Rathouský, J.; Zukal, A.; Wark, M. Stud. Surf. Sci. Catal.
2002, 142, 1067.
(2) Antochshuk, V.; Olkhovyk, O.; Jaroniec, M.; Park, I.-S.; Ryoo, R. Langmuir 2003,
19, 3031.
(3) Acosta, E. J.; Carr, C. S.; Simanek, E. E.; Shantz, D. F. Adv. Mater. 2004, 16, 985.
(4) Descalzo, A. B.; Jimenez, D.; Marcos, M. D.; Martínez-Máñez, R.; Soto, J.; El
Haskouri, J.; Guillém, C.; Beltrán, D.; Amorós, P.; Borrachero, M. V. Adv. Mater. 2002,
14, 966.
(5) Rosenholm, J. M.; Lindén, M. Chem. Mater. 2007, 19, 5023.

100
(6) Beck, J. S.; Vartuli, J. C.; Roth, W. J.; Leonowicz, M. E.; Kresge, C. T.; Schmitt, K.
D.; Chu, C. T.-W.; Olson, D. H.; Sheppard, E. W.; McCullen, S. B.; Higgins, J. B.;
Schlenker, J. L. J. Am. Chem. Soc. 1992, 114, 10834.
(7) Kresge, C. T.; Leonowicz, M. E.; Roth, W. J.; Vartuli, J. C.; Beck, J. S. Nature
1992, 359, 710.
(8) Zhao, D.; Feng, J.; Huo, Q.; Melosh, N.; Fredrickson, G. H.; Chmelka, B. F.;
Stucky, G. D. Science 1998, 279, 548.
(9) Zhao, D.; Huo, Q.; Feng, J.; Chmelka, B. F.; Stucky, G. D. J. Am. Chem. Soc. 1998,
120, 6024.
(10) (a) Ritter, H.; Nieminen, M.; Karppinen, M.; Brühwiler, D.Microporous
Mesoporous Mater. in press. (b) Udenfriend, S.; Stein, S.; Böhlen, P.; Dairman, W.;
Leimgruber, W.; Weigele, M. Science 1972, 178, 871.
(11) Salmio, H.; Brühwiler, D. J. Phys. Chem. C 2007, 111, 923.
(12) Taguchi, A.; Schüth, F. Microporous Mesoporous Mater. 2005, 77, 1.
(13) Clark, J. H.; Macquarrie, D. J.; Tavener, S. J. Dalton Trans. 2006, 4297.
(14) Cides da Silva, L. C.; dos Santos, L. B. O.; Abate, G.; Cosentino, I. C.; Fantini, M.
C. A.; Masini, J. C.; Matos, J. R. Microporous Mesoporous Mater. 2008, 110, 250.
(15) Fryxell, G. E.; Mattigod, S. V.; Lin, Y.; Wu, H.; Fiskum, S.; Parker, K.; Zheng, F.;
Yantasee, W.; Zemanian, T. S.; Addleman, R. S.; Liu, J.; Kemner, K.; Kelly, S.; Feng, X.
J. Mater. Chem. 2007, 17, 2863.
(16) Yoshitake, H. New J. Chem. 2005, 29, 1107.
(17) Ho, K. Y.; McKay, G.; Yeung, K. L. Langmuir 2003, 19, 3019.
(18) Nooney, R. I.; Kalyanaraman, M.; Kennedy, G.; Maginn, E. J. Langmuir 2001, 17,
528.
(19) Liu, A. M.; Hidajat, K.; Kawi, S.; Zhao, D. Y. Chem. Commun. 2000, 1145.
(20) Brühwiler, D.; Frei, H. J. Phys. Chem. B 2003, 107, 8547.
(21) Xu, J.; Luan, Z.; He, H.; Zhou, W.; Kevan, L. Chem. Mater. 1998, 10, 3690.
(22) Suzuki, K.; Ikari, K.; Imai, H. J. Am. Chem. Soc. 2004, 126, 462.
(23) Brunauer, S.; Emmett, P. H.; Teller, E. J. Am. Chem. Soc. 1938, 60, 309.
(24) Kruk, M.; Jaroniec, M.; Ryoo, R.; Kim, J. M. Microporous Mater. 1997, 12, 93.
(25) Sayari, A.; Liu, P.; Kruk, M.; Jaroniec, M. Chem. Mater. 1997, 9, 2499.
(26) Ravikovitch, P. I.; Domhnaill, S. C. O.; Neimark, A. V.; Schüth, F.; Unger, K. K.
Langmuir 1995, 11, 4765.
(27) Ravikovitch, P. I.; Neimark, A. V. Colloid Surf. A: Physicochem. Eng. Aspect 2001,
187-188, 11.
(28) Lippens, B. C.; de Boer, J. H. J. Catal. 1965, 4, 319.
(29) Martin, M. M.; Lindqvist, L. J. Lumin. 1975, 10, 381.
(30) Burleigh, M. C.; Markowitz, M. A.; Spector, M. S.; Gaber, B. P. J. Phys. Chem. B
2001, 105, 9935.
(31) Li, C.; Yang, J.; Shi, X.; Liu, J.; Yang, Q. Microporous Mesoporous Mater. 2007,
98, 220.
101
(32) Kanan, S. M.; Tze, W. T. Y.; Tripp, C. P. Langmuir 2002, 18, 6623.
(33) Ravikovitch, P. I.; Neimark, A. V. J. Phys. Chem. B 2001, 105, 6817.
(34) Ryoo, R.; Ko, C. H.; Kruk, M.; Antochshuk, V.; Jaroniec, M. J. Phys. Chem. B
2000, 104, 11465.
(35) Impéror-Clerc, M.; Davidson, P.; Davidson, A. J. Am. Chem. Soc. 2000, 122,
11925.
(36) Galarneau, A.; Cambon, H.; Di Renzo, F.; Ryoo, R.; Choi, M.; Fajula, F. New J.
Chem. 2003, 27, 73.
(37) Jun, S.; Joo, S. H.; Ryoo, R.; Kruk, M.; Jaroniec, M.; Liu, Z.; Ohsuna, T.; Terasaki,
O. J. Am. Chem. Soc. 2000, 122, 10712.
(38) Ravikovitch, P. I.; Neimark, A. V. Langmuir 2006, 22, 11171.
(39) Shenderovich, I. G.; Buntkowsky, G.; Schreiber, A.; Gedat, E.; Sharif, S.;
Albrecht, J.; Golubev, N. S.; Findenegg, G. H.; Limbach, H.-H. J. Phys. Chem. B 2003,
107, 11924.
(40) Fenelonov, V. B.; Derevyankin, A. Y.; Kirik, S. D.; Solovyov, L. A.; Shmakov, A. N.;
Bonardet, J.-L.; Gedeon, A.; Romannikov, V. N. Microporous Mesoporous Mater.
2001, 44-45, 33.
(41) Galarneau, A.; Cambon, H.; Di Renzo, F.; Fajula, F. Langmuir 2001, 17, 8328.
(42) Rouquerol, F.; Rouquerol, J.; Sing, K. Adsorption by powders & porous solids;
Academic Press, San Diego, CA, 1999.
(43) Wu, S.-H.; Lin, Y.-S.; Hung, Y.; Chou, Y.-H.; Hsu, Y.-H.; Chang, C.; Mou, C.-Y.
ChemBioChem 2008, 9, 53.
(44) Taylor, K. M. L.; Kim, J. S.; Rieter, W. J.; An, H.; Lin, W.; Lin, W. J. Am. Chem. Soc.
2008, 130, 2154.
(45) Lin, Y.-S.; Tsai, C.-P.; Huang, H.-Y.; Kuo, C.-T.; Hung, Y.; Huang, D.-M.; Chen, Y.-
C.; Mou, C.-Y. Chem. Mater. 2005, 17, 4570.
(46) Lu, J.; Liong, M.; Zink, J. I.; Tamanoi, F. Small 2007, 3, 1341.
(47) Torney, F.; Trewyn, B. G.; Lin, V. S.-Y.; Wang, K. Nature Nanotechnol. 2007, 2,
295.
(48) Slowing, I.; Trewyn, B. G.; Lin, V. S.-Y. J. Am. Chem. Soc. 2007, 129, 8845.
(49) Slowing, I.; Trewyn, B. G.; Giri, S.; Lin, V. S.-Y. Adv. Funct. Mater. 2007, 17,
1225.
(50) Lu, J.; Liong, M.; Sherman, S.; Xia, T.; Kovochich, M.; Nel, A. E.; Zink, J. I.;
Tamanoi, F. Nanobiotechnol. 2007, 3, 89.
(51) Slowing, I.; Trewyn, B. G.; Lin, V. S.-Y. J. Am. Chem. Soc. 2006, 128, 14792.
(52) Mal, N. K.; Fujiwara, M.; Tanaka, Y.; Taguchi, T.; Matsukata, M. Chem. Mater.
2003, 15, 3385.
(53) Mal, N. K.; Fujiwara, M.; Tanaka, Y. Nature 2003, 421, 350.
(54) Yang, Q.; Wang, S.; Fan, P.; Wang, L.; Di, Y.; Lin, K.; Xiao, F.-S. Chem. Mater.
2005, 17, 5999.

(55)
Soc. 2004
(56) Lai, C.
Y. J. Am. Chem. Soc.
TOC Graphic and Summary:
The accessibility of amino groups in postsynthetically functionalized mesoporous silica
(MCM-41, MCM
isothiocyanate coupling yields, which are found to depend on the pore diameter,
particle size, channel system dimensionality, and channel wall porosity.
Hernandez, R.; Tseng, H.
2004, 126, 3370.
Lai, C.-Y.; Trewyn, B
J. Am. Chem. Soc.
TOC Graphic and Summary:
The accessibility of amino groups in postsynthetically functionalized mesoporous silica
41, MCM-
isothiocyanate coupling yields, which are found to depend on the pore diameter,
particle size, channel system dimensionality, and channel wall porosity.
Hernandez, R.; Tseng, H.
, 3370.
Y.; Trewyn, B. G.; Jeftinija, D. M.; Jeftinija, K.; Xu, S.; Jeftinija, S.; Lin, V. S.
J. Am. Chem. Soc. 2003, 125
TOC Graphic and Summary:
The accessibility of amino groups in postsynthetically functionalized mesoporous silica
-48, SBA-15) i
isothiocyanate coupling yields, which are found to depend on the pore diameter,
particle size, channel system dimensionality, and channel wall porosity.
Hernandez, R.; Tseng, H.-R.; Wong, J. W.; Stoddart, J. F.; Zink, J. I.
. G.; Jeftinija, D. M.; Jeftinija, K.; Xu, S.; Jeftinija, S.; Lin, V. S.
125, 4451.
TOC Graphic and Summary:
The accessibility of amino groups in postsynthetically functionalized mesoporous silica
15) is investigated by determining the fluorescein
isothiocyanate coupling yields, which are found to depend on the pore diameter,
particle size, channel system dimensionality, and channel wall porosity.
102
R.; Wong, J. W.; Stoddart, J. F.; Zink, J. I.
. G.; Jeftinija, D. M.; Jeftinija, K.; Xu, S.; Jeftinija, S.; Lin, V. S.
The accessibility of amino groups in postsynthetically functionalized mesoporous silica
s investigated by determining the fluorescein
isothiocyanate coupling yields, which are found to depend on the pore diameter,
particle size, channel system dimensionality, and channel wall porosity.
R.; Wong, J. W.; Stoddart, J. F.; Zink, J. I. J. Am. Chem.
. G.; Jeftinija, D. M.; Jeftinija, K.; Xu, S.; Jeftinija, S.; Lin, V. S.
The accessibility of amino groups in postsynthetically functionalized mesoporous silica
s investigated by determining the fluorescein
isothiocyanate coupling yields, which are found to depend on the pore diameter,
particle size, channel system dimensionality, and channel wall porosity.
J. Am. Chem.
. G.; Jeftinija, D. M.; Jeftinija, K.; Xu, S.; Jeftinija, S.; Lin, V. S.
The accessibility of amino groups in postsynthetically functionalized mesoporous silica
s investigated by determining the fluorescein
isothiocyanate coupling yields, which are found to depend on the pore diameter,
J. Am. Chem.
. G.; Jeftinija, D. M.; Jeftinija, K.; Xu, S.; Jeftinija, S.; Lin, V. S.-
The accessibility of amino groups in postsynthetically functionalized mesoporous silica
s investigated by determining the fluorescein
isothiocyanate coupling yields, which are found to depend on the pore diameter,
103
Curriculum Vitae
Family name: Ritter (née Salmio)
First names: Hanna Taina Katariina
Born: 28.11.1979 in Espoo, Finland
Nationality: Finnish
Education:
• Tapiolan lukio (High School), Espoo, Finland, 08/1995-05/1998 • Helsinki University of Technology, Espoo, Finland, Department of Chemical
Technology, Inorganic Chemistry 09/1998-02/2004 • Master thesis: “Atomic Layer Deposition as Coating Method for Plastic and
Metal Parts“ • PhD student at the University of Zürich since 07/2005
104
List of Publications and Conference Contributions
Publications
Distribution of Amino Groups on a Mesoporous Silica Surface after Submonolayer
Deposition of Aminopropylsilanes from an Anhydous Liquid Phase
H. Salmio, D. Brühwiler, J. Phys. Chem. C 111 (2007) 923-929.
A Comparative Study of the Functionalization of Mesoporous Silica MCM-41 by
Deposition of 3-Aminopropyltrimethoxysilane from Toluene and from the Vapor Phase
H. Ritter, M. Nieminen, M. Karppinen, D. Brühwiler, Microporous Mesoporous
Mater., in press.
Accessibility of Grafting Sites in Postsynthetically Modified Mesoporous Silica
H. Ritter, D. Brühwiler, submitted.
Functionalized Silicate Nanochannels: Towards Applications in Drug Delivery and Solar
Energy Conversion
D. Brühwiler, H. Ritter, J. H. Ramm, L.-Q. Dieu, C. Bauer, I. Dolamic, N.
Gartmann, Chimia, in press.
Posters
Swiss Chemical Society Fall Meeting, Zürich 13.10.2006:
Distribution of Grafted Aminopropylalkoxysilanes on the Surface of
Mesoporous Silica MCM-41
H. Salmio, D. Brühwiler
Swiss Chemical Society Fall Meeting, Lausanne 12.9.2007:
Positioning of Functional Groups on Mesoporous Silica Surfaces
H. Ritter, D. Brühwiler

105
Convenient Room Temperature Synthesis of High Quality Mesoporous Silica
MCM-41
H. Ritter, D. Brühwiler
Swiss Chemical Society Fall Meeting, Zürich 11.9.2008:
Postsynthetic Modification of Mesoporous Silica: Methods, Tools, and
Perspectives,
H. Ritter, J. H. Ramm, N. Gartmann, D. Brühwiler
Related Documents