1 ZUMM Research Report December 2015 What is the language environment of young babies in Tanzania, and can it, if necessary, be enriched? Research Report December 2015

Welcome message from author
This document is posted to help you gain knowledge. Please leave a comment to let me know what you think about it! Share it to your friends and learn new things together.
Transcript

1
ZUMM Research Report December 2015
What is the language environment of young babies in Tanzania,
and can it, if necessary, be enriched?
Research Report
December 2015

2
ZUMM Research Report December 2015
Contents
Contents .............................................................................................................................................................. 2
ABSTRACT ............................................................................................................................................................ 4
OVERVIEW & BACKGROUND ............................................................................................................................... 5
Literature review ............................................................................................................................................. 5
The challenges of carrying out research in a less developed country............................................................. 7
RESEARCH DESIGN AND PROCEDURE .................................................................................................................. 8
RESULTS ......................................................................................................................................................... 11
Table 1: Overview of main findings ........................................................................................................... 18
Figure 1 ...................................................................................................................................................... 19
Table 2: General background data on the babies and their families ........................................................ 19
Table 3: The educational achievements of the mother of the baby ......................................................... 20
Table 4: Data from baseline word count visits .......................................................................................... 20
Table 5: Main sources of the carer’s (usually mother) knowledge about caring for babies ..................... 21
Figure 2 ...................................................................................................................................................... 21
Table 6: Results for KAP1 Questions 2 and 3 compared with KAP2 Questions 1 and 2 ............................ 22
Table 7: Results for KAP1 Questions 4 and 5 compared with KAP2 Questions 3 and 4 ............................ 23
Table 8: Results for KAP1 Question 6 compared with KAP2 Question 5 ................................................... 24
Table 9: Results for KAP1 Questions 7A and 7B compared with KAP2 Questions 6A and 6B ................... 25
Table 10: Results for KAP1 Questions 7C and 7D compared with KAP2 Questions 6C and 6D ................. 26
Table 11: Results for KAP1 Questions 7E and 7F compared with KAP2 Questions 6E and 6F .................. 27
Table 12: Results for KAP1 Question 7G compared with KAP2 Question 6G ............................................ 28
Table 13: Results for KAP1 Question 8 compared with KAP2 Question 7 ................................................. 29
Table 14: Results for KAP1 Questions 9A, 9B & 9C compared with KAP2 Questions 8A, 8B & 8C............ 30
Table 15: Results for KAP1 Questions 9D, 9E & 9F compared with KAP2 Questions 8D, 8E & 8F ............ 31
Table 16: Results for KAP1 Questions 9G & 9H compared with KAP2 Questions 8G & 8H....................... 32
Table 17: KAP1 Questions 10A, 10B & 10C compared with KAP2 Questions 9A, 9B & 9C........................ 33
Table 18: KAP1 Questions 10D, 10E & 10F compared with KAP2 Questions 9D, 9E & 9F ........................ 34
Table 19: KAP1 Questions 10G, 10H & 10I compared with KAP2 Questions 9G, 9H & 9I ......................... 35
Table 20: Results for KAP1 Questions 10J & 10K compared with KAP2 Questions 9J & 9K ...................... 36
Table 21: Results for KAP 2 Questions 10A and 10B ................................................................................. 37
Table 22: Results for KAP 2 Questions 10C and 10D ................................................................................. 37
Table 23: Results for KAP 2 Questions 10E and 10F .................................................................................. 38
Table 24: Results for KAP 2 Questions 10G and 10H ................................................................................. 38
Table 25: Results for KAP 2 Question 10I .................................................................................................. 39

3
ZUMM Research Report December 2015
Table 26: Data from progress word count visits ....................................................................................... 39
Table 27: Language Comprehension Screening Test ages and scores ...................................................... 40
DISCUSSION ....................................................................................................................................................... 41
Conclusions .................................................................................................................................................... 41
Unanswered questions .................................................................................................................................. 42
Recommendations ......................................................................................................................................... 44
APPENDIX 1: Knowledge, Attitudes & Practice Surveys 1 & 2 .......................................................................... 45
APPENDIX 2: Intervention Programme Content................................................................................................ 48
APPENDIX 3: Language Comprehension Screening Test ................................................................................... 50
ACKNOWLEDGEMENTS ..................................................................................................................................... 53
BIOGRAPHICAL NOTE......................................................................................................................................... 53
REFERENCES ...................................................................................................................................................... 54

4
ZUMM Research Report December 2015
What is the language environment of young babies in Tanzania,
and can it, if necessary, be enriched?
Janet Townend and David Townend
ABSTRACT
There is strong international evidence for the importance of a rich language environment in the first year of life. Anecdotal and observational evidence suggests that the language environment of Tanzanian babies is relatively impoverished. This study of 1,035 families was designed to quantify the language environment of these infants, using word-counts and by interviewing mothers, and to ascertain whether a short capacity-building programme for families could enrich it, when compared with a control group. Outcome measures included the assessment of the infants at 21 months on a screening test of language comprehension. The major findings were that the language environment was very poor among both groups; the number of words spoken to babies increased over time in both groups, but those who attended the training programme increased significantly more than the controls; the language comprehension of the babies whose parents had been trained was significantly better than that of the control group babies. These findings show the current poverty of the language environment of infants and that intervention can change behaviour. They strengthen the case for a national ‘Talk to Your Baby’ campaign, to include sustainable ways to disseminate the key messages.
Key Words
Tanzania; language development; ‘Talk to Your Baby’ (ZUMM); literacy levels; word-counts; language comprehension.

5
ZUMM Research Report December 2015
OVERVIEW & BACKGROUND
Evidence gathered by the authors since 2008, from observation and anecdote, in urban and rural areas of Tanzania, indicates strongly that mothers are not, in general, talking to their babies enough from birth. Many Tanzanian people have confirmed that, usually, infants are not talked to much until they begin to speak. When it is stressed that the term ‘babies’ is being used to refer to infants in the first year of life, people become more sure that there is not very much verbal interaction between these babies and their parents and carers, although some mothers do sing to their infants. The few words that are used can sometimes be harsh and negative.
International evidence is unequivocal: a rich language environment in the first year of life is essential if an infant is to make optimum progress in language development. Equally, future language, cognitive, and social development is built upon these early foundations.
The authors, both UK education professionals, and one also a speech and language therapist, while resident in Tanzania for four years, were encouraged to undertake this research by Tanzanian colleagues from education, health, the development community, civil society organisations and leading universities, to ascertain whether research findings in developed countries about the importance of a rich language environment in the early months of life could be replicated in Africa. The project, comprising research and, depending on the outcome, a multi-level, national ‘Talk to Your Baby’ campaign, was given the name ‘Zungumza na Mtoto Mchanga’, (Kiswahili for ‘Talk to Your Baby’), abbreviated to ZUMM. The study was designed to quantify the language environment of infants, in order to ascertain whether there was a need for an intervention campaign for parents; to discover whether a short training programme could be effective; and to identify any potential cultural barriers to behaviour change.
An informal, no-cost pre-pilot was undertaken first, followed by a pilot study, with 360 families, in two regions of Tanzania. In the light of the experience gained, the training of the research assistants, the research procedures and the supporting paperwork, including instructions and proformas, were modified. In particular, the Language Comprehension Screening Test was found to be too difficult, many infants failing to score at all, and was substantially reworked to include many more test items at the lower end.
As far as can be ascertained, no comparable study has been carried out in sub-Saharan Africa.
Literature review
What emerges very clearly from international research findings, across many disciplines, is the centrality of language skills (and, in particular, the early acquisition of language skills) to an individual’s chances of success in life, from the earliest years to adulthood. According to The Harvard University Centre on the Developing Child (2007), the neural connections for language are laid down mainly in the first year of life; complex and higher language skills build on simple skills, and crucially, brain development depends on the interaction of genetic and environmental influences.
“....early experiences create a foundation for lifelong learning” (Harvard 2007).
Schulz et al (2014) made the observation that babies at three months old attend selectively to speech, over other biological, but non-speech sounds. Evidence from MRI scans showed activity in the areas of the brain associated with spoken language when the babies heard real words.
There is strong evidence for the importance of reading to babies (National Literacy Trust, 2011) and for playing with them at eye-to-eye level (Zuckerman, 2010). Both of these activities, but especially reading, along with talking to babies, have been shown to make the biggest contribution to good language development in the early years. In summary, a rich language environment in the first year of life is essential if the infant is to achieve his or her potential in language.
According to Stock (2002), in a study of parent-child interaction and infant responsiveness, appropriate interaction has been shown to lead to better language comprehension at 12 months, and better

6
ZUMM Research Report December 2015
comprehension, pronunciation and vocabulary at 2 and 3 years, compared with a control group. Long term studies have shown that such children have increased vocabulary comprehension at 12 years. The educational benefits are clear.
Many studies have published data on the number of words spoken to infants and young children; the figures are remarkably similar: infants in poor, or less well-educated homes, in the US and Europe hear around 600 – 800 words per hour, while those in well-off or well-educated homes hear upwards of 2,000 words per hour. Hart and Risley (2003) estimate a word-count gap of about three million words between the children of poorer homes and those of better-off homes by the time those children reach three years of age.
The number of words spoken to young infants is not the only determining factor in language development; the quality of the interaction between the main caregiver and the baby is of critical importance. Hart and Risley (2003), and others, such as the Joseph Rowntree Foundation (2010) have shown that there are significant qualitative differences in the language used to infants in different socio-economic groups. Mothers in lower socio-economic groups (Sylva et al, 2008), and also adolescent mothers (McGowan et al, 2008), talk less to their babies, spend much less time reading to them, use much less praise and more negative and directive language, than their more affluent, and older counterparts. The children of adolescent mothers were found to have significantly poorer spoken language skills on entering school than the children of adult mothers.
The study of adolescent mothers is of particular relevance to Tanzania, which has a high incidence of schoolgirl pregnancy and very early marriage. Human Rights Watch (Bleasedale 2014) estimated that 40% of girls in Tanzania are married before their 18th birthday, and they discovered some cases of girls as young as seven being married. The Tanzania Demographic and Health Survey (2010) reported that 44% of Tanzanian women are mothers, or pregnant, by 19 years old.
Roulstone et al (2011) show that there is a very strong correlation between a child’s spoken language skills at age 2 and that child’s performance, across all subjects, on entering primary school (at age 5). Further, several studies have shown that the number of words a child knows at age 5 is the single best predictor of academic success throughout life (Blanden, 2006). Hart and Risley’s (2003) longitudinal study of a sample of their subjects showed that the differences in early language environment had on-going effects: the children’s language skills at three years predicted their performance in vocabulary and other language measures, and in reading comprehension, at nine to ten years old.
There is research evidence that reading comprehension depends crucially on spoken language skills, including vocabulary and the skill of decoding utterances (many studies cited in Cain & Oakhill, 2007). The academic community appears to agree that if babies are not spoken to, indeed if they are not spoken to a great deal, from birth, and in the right way, they will fail to achieve their potential in spoken language, with very detrimental effects on their educational attainment.
In a large-scale longitudinal twin study, Ritchie et al (2014) found that children who did better at reading at age 7, consistently did better academically than those with poorer reading skills. The comparison was being made between sets of identical twins, which have the same genetic make-up and can be presumed to be equally innately intelligent. This is a completely new finding, and the implications have yet to be worked out, but the lead author says that the evidence suggests that ‘being a better reader makes a child more intelligent later’.
This body of work is highly relevant to Tanzania, which has relatively low levels of literacy. In a list of 214 countries arranged according to the percentage of 15 year olds who are literate, Tanzania comes about 20 from the bottom. While it is unlikely that these figures were all obtained in a reliable way, the comparison table at least suggests a very poor standard of attainment in literacy. Uwezo, more reliably, measures levels of literacy, numeracy and English in Tanzania, Kenya and Uganda, and publishes its findings annually. The 2012 issue (“Are our children learning?’ Uwezo, 2012) reports that after three years at primary school, only 58% of Tanzania’s children had mastered even basic literacy. They found high regional differences, with the regions generally recognised as less well-developed doing less well. Also doing less well were the children of poor families, and those living in rural areas (between 70% and 80% of the population lives in rural areas).

7
ZUMM Research Report December 2015
A short series published on-line by The Lancet (The Lancet: Engle et al, 2011) surveyed a vast number of studies across many low-income and middle-income countries, including some in Africa. They found that early childhood is the most cost-effective, as well as the most efficient time to intervene to ensure that children reach their potential. The returns on investment at this stage are substantial; one reason for this is that the inequalities between children tend to increase over time, and become more difficult to change. It is particularly interesting that the effects of appropriate intervention are larger in more disadvantaged communities.
The study reported below looked at the effectiveness of training parents in order to bring about behaviour change. According to the (UK) Government Communication Network (2009), in seeking to influence behaviour it is generally accepted that the most effective approach addresses factors influencing behaviour at three levels: personal; family and community / social; environmental, which encompasses availability of services, and technology among other things. There is a need for the target behaviour to be seen as achievable, and there are recurring references to the importance of information coming from trusted sources.
The challenges of carrying out research in a less developed country
The challenges of working in one of the poorest countries in the world are many: structures and systems cannot be relied upon; the general level of education is relatively poor, which impacts work at all levels, and cultural beliefs and prejudices are strongly held. A fundamental difficulty is the general absence of advanced organisational skills; for example, deadlines are rarely taken to be absolute. Similarly, the need for precision is sometimes not well understood; for example, the failure to provide complete attendance data resulted from the facilitators not paying attention to the detail in the instructions. We were fortunate that the data collectors, in general, followed their instructions; they were less well-educated (secondary school leavers as against teachers) and perhaps did not have the confidence to depart from the script.
One major challenge occurred at the outset, in the identification of suitable families for the study. The partners were instructed to collect details of all eligible families in the ward, from whom the number in the sample would be randomly selected; in the event, each partner submitted exactly the right number of names in each ward, on the advice of local leaders. Clearly, the families had been chosen. The work had to begin again. Next time, the partners were instructed to obtain, from the health facility, lists of women who had recently given birth, and to go to the villages to find them. Unfortunately, the lists were of the mothers’ given names, while in the community they are known by the name of their firstborn child, (Mama Juma, for example), so the names on the list were not always recognised. The sample was finally made up of as many of these women as could be found, plus any others in the community with babies of the right age; in some wards, every eligible family was recruited. The allocation of each ward to be the intervention or the control group was random.
This delayed the start of the study, and more time was lost at every stage. The original timeline was carefully planned to avoid home visits or intervention during the rainy season, when travelling is difficult, so once the start was delayed, the benefits of careful planning were lost. The late start and delays meant that the babies were nine months old at the first word count instead of four months, one year at intervention instead of six months, and 19 months at the second word count instead of 12 months. The Language Comprehension Test happened on time (age 21 months), but only by compressing the whole study into 12 months instead of the 18 months that was originally planned. In view of the evidence from Harvard (2007) that most of the neural connections for language are laid down in the first year of life, these delays certainly undermined the potential impact of the study.
Some of the difficulties encountered by the research assistants in the field might have been mitigated had the communications worked as agreed: in the case of a problem, each research assistant was instructed to inform the local project coordinator, who could contact the project manager in Dar es Salaam, who could seek advice from the research leaders. It was often the case that problems only came to light too late for solutions to be found; for example, in one region, the families were reluctant to attend the intervention programme because it was too far from their homes and the allowance they were given did not cover the cost of transport. There were many ways in which this could have been solved, had it been reported. In

8
ZUMM Research Report December 2015
contrast, in another region, the local project coordinator travelled to the villages to discover why families were failing to attend, and solved the problem on the spot.
The latter example illustrates another challenge, that of cultural beliefs and superstition. The village elders had forbidden the families to attend training because they believed the project was organised by Freemasons, who are greatly feared and mistrusted. Upon being reassured that this was not so, and informed of the true nature of the training, the most influential elder led the families in through the door at the next agreed date.
A concern, particularly in a poor country, is that some potential partner organisations, as well as individuals, may be chiefly interested in the work because they are receiving money, and that commitment to any project may be slight. However, having done due diligence, the partner organisations which were selected were committed and professional. The attrition rate for research assistants (data collectors and facilitators) was so small as to be insignificant, and in most cases the gaps were filled by other members of the team. This meant that all the research assistants were those who had been personally trained by the lead researchers.
RESEARCH DESIGN AND PROCEDURE
This cluster randomised control trial involved 1,035 families, living in four regions of Tanzania. When the study ended, 14 months later, 883 families remained. 95% of the families understood Kiswahili, the national language, and all had an infant born within an approximate four month window; twins were excluded. Each regional cohort was drawn from two geographically separate, locally administered areas, known as wards; one large, culturally distinct region had two cohorts, in different Districts. In each of the five cohorts, the families living in one ward were randomly designated the ‘intervention’ group; the families in the other ward formed the control group. The two wards were chosen to be as culturally similar as possible, but were far enough apart to reduce the likelihood of communication between the two. Experience in the pilot studies showed that even where the geographical separation was considerable, the ZUMM messages tended to be spread at family events such as weddings and funerals.
The question this study set out to address was:
‘What is the language environment of babies in the first year of life, in Tanzania, and how, if necessary, might it be developed, in such a way that the educational potential of infants and children will be enhanced?’ To answer this, the following questions needed to be addressed:
i. How many words per hour are typically spoken to babies in the first year of life? ii. What are the attitudes, knowledge, beliefs and practices of parents and carers concerning
language development in babies in the first year of life? iii. What are the barriers to parents and carers speaking more to young babies? iv. How can these barriers be overcome? v. How effective is improving the awareness and skills in early language stimulation among parents
and carers? vi. What behaviour and attitude changes can be brought about in parents and carers with respect
to early language development? vii. Can the language comprehension ability of infants in the second year of life be enhanced by
capacity-building among parents and carers?
The study was divided into four phases, and an additional pre-study phase, called ‘Phase 0’; the data collected included quantitative and qualitative material. Quantitative data included demographic information, including the educational level attained by the mother, and the number of children in the family, (neither of which have been analysed in this study, though the raw data has been retained for future analysis). The main quantitative data consisted of three counts of words addressed to the baby during thirty

9
ZUMM Research Report December 2015
minutes in Phase 1 to establish a baseline average number of words per hour and a further three in Phase 3, to measure change, after the intervention group had received the capacity-building programme,. As the pilot studies with 360 families had demonstrated, there is naturally a significant increase in the number of words spoken to infants as they get older, so the difference in this increase between the intervention and control groups was seen to be critical. The final, very important quantitative data was the score attained on a language comprehension screening test, specially designed for the age-group, and for the environment in which the families live. Administered to the infants between 21 and 24 months, this was considered to be the ‘purest’ measure of the effectiveness of the intervention programme, because there was no danger that the babies would change behaviour to please the data collector, whereas the data collectors could not be sure that the mothers in the intervention group, in the second round of word-count visits, were not making a special effort because they were present.
Quantitative data should have included detailed records of attendance at the intervention programme, so that families who did not attend could be eliminated from the intervention group for Phases 3 and 4, the progress measurement and language comprehension tests. By this means it was anticipated that a truer picture of the effectiveness of intervention could be obtained. Unfortunately, despite the provision of the necessary forms, and training in their use, no feedback reports on the intervention sessions were received, and the attendance data submitted was sparse and unreliable. This means that the difference between the intervention and control groups is reduced by the inclusion of a number of families in the intervention group who received only partial training or no training at all.
The qualitative items were contained in two Knowledge, Attitudes and Practice (KAP) Surveys, administered by interviewing the mother or main carer in each household, and the responses recorded by the data collector. One was administered at the third word count visit, at the end of the Phase 1, the baseline measurement; the second was administered at the sixth word count visit, at the end of Phase 3, the progress measurement phase. The questions were designed so that the data collectors were not required to make judgments. The two KAP Surveys are included in the appendices.
Phase 0: Before the study (Intervention group and control group)
Identification of eligible families
Visit to explain the procedure and obtain written consent from parents
Collection of essential demographic information for sampled households
Phase 1: Baseline measurement (Intervention group and control group)
Count words addressed to the baby (3 visits each for 30 minutes, visits done at different times of day to obtain a more reliable average number of words per hour)
Conduct KAP Survey for mothers or main carers, in their homes, about very early child language needs and acquisition.
Phase 2: Intervention (Intervention group only)
Conduct group capacity-building for parents and carers: three sessions, each about 2½ hours, over a period of about two months. Mothers and their babies, and two other members from each family were invited to attend. Ten families were organized to form each group of 30 learners. A detailed programme was devised; each of the three sessions was broken into several short activities, including many that were interactive, to encourage maximum participation by the learners. A range of teaching and learning strategies was employed, including: whole group discussion; discussion in pairs and feedback; very short presentations; practical demonstrations; hands-on experience; viewing a 5 minute DVD, with questions and discussion; making no-cost toys from rubbish; role-play; and recap of the key messages. Specially designed materials, written in English and translated into Kiswahili, were used, including the DVD, two leaflets for distribution, and a variety of teaching & learning aids. It was considered important for fathers to be encouraged to attend, at least for the first session.

10
ZUMM Research Report December 2015
Phase 3: Progress measurement (Intervention group and control group)
Repeat counting of words addressed to the baby (average of 3 visits each for 30 minutes, visits done at different times of day)
Conduct second KAP Survey for mothers or carers in their homes, about very early child language needs and acquisition, to identify any changes.
Compare findings of the two groups
Phase 4: Outcome measurement (Intervention and control group, 1 year after Phase 1)
Administration of a simple language comprehension screening test to the infants, now in the second year of life
Phase 2b: Intervention (Control group only)
After Phase 4, group capacity-building was offered for parents and carers in control group, for ethical reasons. The structure and content was adapted to take into account the older ages of the infants by this time.
For a number of reasons, including the language barrier, the collection of data in the homes, and the training of families, were carried out by Tanzanian research assistants, and the work was locally managed by NGOs already working in the field of early childhood development. The project was managed overall by Children in Crossfire, an UK registered NGO based in Dar es Salaam. The authors designed the study, produced all materials, worked closely with the translator, and visited all the partners on several occasions to deliver training to the teams of data collectors and the teams of intervention facilitators. Each research assistant received a folder containing copies of the training documents and all the resources they would need to carry out their part of the study. All research assistants were completely fluent in the local language and Kiswahili, so they were able to translate in the small number of homes where Kiswahili was not spoken.
In each region, a slightly larger number of research assistants than was needed was recruited and trained. The potential data collectors had be adults who had completed four years of secondary education. They received a full day of training, in English, with translation into Kiswahili, to ensure full understanding. The programme included an introduction to the theory behind the ZUMM project, the structure of the study, the principles of being a research assistant, and a great deal of demonstration and practice at collecting the data. Each data collector was assessed for competence at the end of the day, and those who were unsuitable were not selected. Successful candidates were provided with a training manual, which included the material they had been taught during the day, and copies of all the proformas they would need to use in the field.
Similarly, more potential facilitators were recruited than would be needed to run the training programme for families in the Intervention Group, and later for those in the Control Group. Facilitators were required to be qualified teachers; however, it proved impossible to find enough retired or not-working teachers, so a small number of non-teachers was permitted. There were two facilitators at each family training session, at least one of whom was a qualified teacher. The facilitators’ training included an introduction to the theory behind ZUMM, the structure of the study, and a review of the teaching and learning techniques they would be using. Then the content of the family training programme was covered in detail, and each trainee was assessed on delivery of a short presentation. Those who were unsuitable were not selected. The successful ones received a training manual, which included the material they had been taught, and all the timetables, lesson plans, and teaching and learning resources they would need to deliver the family training programme. The locally-based project coordinators attended the training sessions for both groups of research assistants
It was important to ensure that the families were told only that the study was ‘about child development’; they were not informed that the data collectors were studying language stimulation, or that they were counting words. Clearly, by the time the Intervention families had been trained, they were very aware of what was being studied, and this may have influenced the amount of language used to the babies in the
11
ZUMM Research Report December 2015
second round of word-count visits. However, some questions in the KAP Survey were designed to ensure that mothers were not able to give only the answers they thought were wanted, which is a charming, if frustrating, national characteristic. The babies themselves could not pretend, so the Language Comprehension Screening Test (LCT), to be administered between 21 and 24 months, was designed to establish whether there was a real difference in outcome between the intervention and control groups.
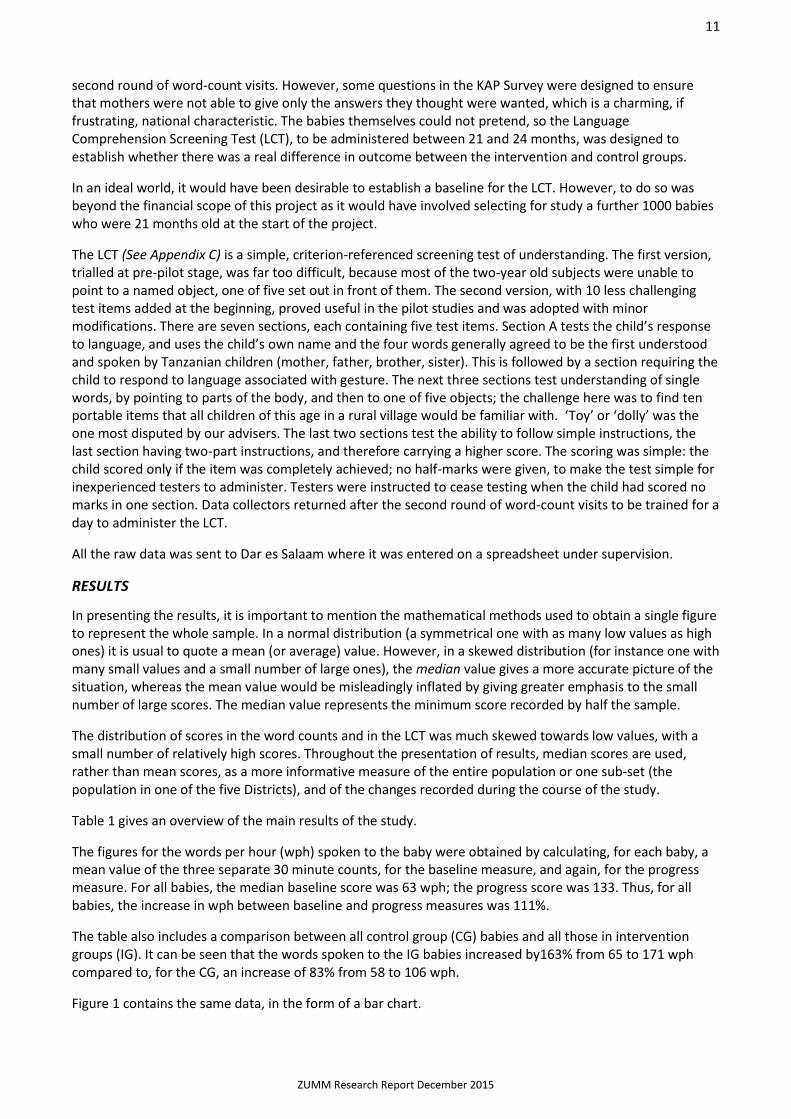
In an ideal world, it would have been desirable to establish a baseline for the LCT. However, to do so was beyond the financial scope of this project as it would have involved selecting for study a further 1000 babies who were 21 months old at the start of the project.
The LCT (See Appendix C) is a simple, criterion-referenced screening test of understanding. The first version, trialled at pre-pilot stage, was far too difficult, because most of the two-year old subjects were unable to point to a named object, one of five set out in front of them. The second version, with 10 less challenging test items added at the beginning, proved useful in the pilot studies and was adopted with minor modifications. There are seven sections, each containing five test items. Section A tests the child’s response to language, and uses the child’s own name and the four words generally agreed to be the first understood and spoken by Tanzanian children (mother, father, brother, sister). This is followed by a section requiring the child to respond to language associated with gesture. The next three sections test understanding of single words, by pointing to parts of the body, and then to one of five objects; the challenge here was to find ten portable items that all children of this age in a rural village would be familiar with. ‘Toy’ or ‘dolly’ was the one most disputed by our advisers. The last two sections test the ability to follow simple instructions, the last section having two-part instructions, and therefore carrying a higher score. The scoring was simple: the child scored only if the item was completely achieved; no half-marks were given, to make the test simple for inexperienced testers to administer. Testers were instructed to cease testing when the child had scored no marks in one section. Data collectors returned after the second round of word-count visits to be trained for a day to administer the LCT.
All the raw data was sent to Dar es Salaam where it was entered on a spreadsheet under supervision.
RESULTS
In presenting the results, it is important to mention the mathematical methods used to obtain a single figure to represent the whole sample. In a normal distribution (a symmetrical one with as many low values as high ones) it is usual to quote a mean (or average) value. However, in a skewed distribution (for instance one with many small values and a small number of large ones), the median value gives a more accurate picture of the situation, whereas the mean value would be misleadingly inflated by giving greater emphasis to the small number of large scores. The median value represents the minimum score recorded by half the sample.
The distribution of scores in the word counts and in the LCT was much skewed towards low values, with a small number of relatively high scores. Throughout the presentation of results, median scores are used, rather than mean scores, as a more informative measure of the entire population or one sub-set (the population in one of the five Districts), and of the changes recorded during the course of the study.
Table 1 gives an overview of the main results of the study.
The figures for the words per hour (wph) spoken to the baby were obtained by calculating, for each baby, a mean value of the three separate 30 minute counts, for the baseline measure, and again, for the progress measure. For all babies, the median baseline score was 63 wph; the progress score was 133. Thus, for all babies, the increase in wph between baseline and progress measures was 111%.
The table also includes a comparison between all control group (CG) babies and all those in intervention groups (IG). It can be seen that the words spoken to the IG babies increased by163% from 65 to 171 wph compared to, for the CG, an increase of 83% from 58 to 106 wph.
Figure 1 contains the same data, in the form of a bar chart.

12
ZUMM Research Report December 2015
The Language Comprehension Screening Test (LCT), carried out when the babies were 21 months old, produced a raw score for each baby (maximum score 80). For all babies the median score was 18. The comparison of LCT scores between the CG and IG babies showed a median score 1.8 times higher in the IG than in the CG (CG 13; IG 23). Another way of putting this is that the IG babies scored 77% higher than those in the CG.
Table 1 also contains, in the lower part, the same data separated by District (the study was conducted in five Districts). It reveals considerable variation between the Districts, with the intervention in Morogoro appearing to have been the most successful both in terms of the increase in words spoken to the baby between the baseline and progress measurements and in the performance of the babies on the LCT. The results from Dodoma seemed to suggest that the intervention had been counter-productive and required further investigation. The inquiry revealed that the CG and IG were not comparable culturally, most obviously because the CG was in an urban area and the IG in a rural one. This made proper comparisons between these two groups invalid. Although including these results in the overall study had the effect of reducing the apparent effectiveness of the research intervention, best research practice does not permit excluding them.
Table 2 contains a summary of background data relevant to the study. At the outset it was difficult to be certain what information would prove of particular value, so the decision was taken to collect anything that might influence the language environment and experience of the babies. Relatively few babies were ‘lost’ during the study; the retention rate was 85%. The language employed in the survey materials and in the intervention programme was Kiswahili. In 95% of the homes Kiswahili was used at least some of the time. (Interpretation was used into local languages in the very small number of homes where no Kiswahili was used). In 70% of the homes the father always lived at home; in 26% the father did so only occasionally, or never. The more detailed analysis by CG and IG shows no significant differences between the two sets.
Table 3 captures a picture of the educational background of the mother of the baby, including whether she was able to read. This information was collected at the first visit to the home by the data collector. In designing the question, it was expected that validity would be demonstrated by an observed connection between whether the mother could read and the level of education she had received. This seemed to be the case, as 84% of all mothers were reported as being able to read and 18% of the mothers had not completed primary school education. Only 7% of all mothers had completed their education at secondary school to Form 4 (O-level). The more detailed analysis by CG and IG shows no significant differences between the two sets.
In Table 4 the data obtained about the language environment of the babies at the baseline word counts is displayed. It records not only the median words per hour (wph) spoken to the baby, but also an assessment by the data collector of how much harsh language was used and of the relationship between the mother/carer and the baby. 20% of all babies were exposed to harsh language more than occasionally. In Tanzania the authors of the research had observed, over a number of years of living in different communities, that mothers did not seem to bond closely with their babies. This was described as ‘usual’ in describing the relationship. In comparison with that, only 37% of all mothers were described as having a loving relationship and 7% were said to be ‘communicating’. The more detailed analysis by CG and IG shows no significant differences between the two sets.
Table 5 summarises the findings of the first question of KAP1. This question sought to discover the mother’s or main carer’s main sources of information about caring for babies. For 95% of the babies studied, their mother was their carer on the day the KAP survey was carried out. As intended, most mothers made multiple responses and consequently the percentage scores sum to more than 100.This question was not repeated in KAP2. For 81% of all mothers, their own mother had been one of the main sources of their information. Other significant sources recorded by more than 30% of mothers were: health workers in the clinic (74%), grandmother (48%), hospital midwife (45%), other female relatives (38%), radio (34%) and father (32%). The more detailed analysis by CG and IG shows no significant differences between the two sets.
Figure 2 shows the same data as Table 5, but in the form of a bar chart.

13
ZUMM Research Report December 2015
In Table 6 the responses to KAP1 questions 2 and 3 are shown. These questions ask about the carer’s knowledge of when babies begin to hear sounds and about the age at which mothers should start talking to their baby, using many words and sentences. In question 2, at the baseline, KAP1 showed that 20% of all mothers thought that babies could hear at (or before) birth, 35% at or before the age of one month. 27% of all mothers thought that the development of hearing was delayed until age 5-6 months. At the progress measurement in KAP2, 39% of all mothers thought that babies could hear at (or before) birth, 60% at the age of one month. Comparisons between the CG and the IG show that both had learned during the study, but the IG had learnt a little more. For the CG those choosing at or before birth rose from 19% to 34% whereas in the IG the increase was from 19% to 40%.
In question 3, at the baseline, KAP1 showed that 11% of all mothers thought they should talk to their babies from birth using many words and sentences; 35% thought that they should be doing so by the age of six months. At the progress measurement in KAP2, these figures became 23% and 51%. Comparisons between the CG and the IG reveal a mixed picture. More mothers in the IG had learnt that talking from birth is important (CG rose from 10% to 19%; IG rose from 12% to 25%) but there was less reduction in those thinking that talking should start from one year or later (CG 29% to 19%; IG 28% to 29%).
Similarly, Table 7 records the responses to KAP1 questions 4 and 5 and compares them with those for KAP2 questions 3 and 4. These questions focus on the expectations of the mother regarding the most basic level of a baby’s language development.
In question 4, at the baseline, 34% of all mothers did not expect a baby to say single words with meaning until at least 18 months old, and 19% until after 2 years. This expectation changed little during the period of the intervention; the equivalent figures from KAP2 were 27% and 15%. Comparisons between the CG and the IG show that both groups had learnt a little; those opting for at least 18 months old reduced slightly in both groups (CG 34% to 28%; IG 34% to 27%).
In question 5 KAP1 showed that 27% of all mothers expected a baby to say no more than 10 different words by the age of 2, and 51%, no more than 20 words. By KAP2, expectations had risen a little as these figures became 20% and 44% respectively. Comparisons between the CG and the IG show that both groups learnt but the IG learnt more overall. Both showed a reduction in the number of mothers opting for small numbers of words and an increase in those choosing a larger number. Thus the reduction in figures for no more than 10 words and no more than 20 words were, respectively CG 28% to 22%; IG 25% to 19% and CG 55% to 47%; IG 47 % to 43%. The most significant difference was in the rise in those choosing more than 40 words (CG 25% to 31%; IG 29% to 42%).
Table 8 (KAP1 question 6 and KAP2 question 5) continues the theme, examining the mother’s expectations of the next stage of language acquisition. In KAP1, 65% of all mothers did not expect a baby to begin to put two words together to make a meaningful phrase or sentence until after reaching the age of 2 (13% after 30 months). By KAP2 these figures had become 51% and 15% respectively, suggesting a little learning. Comparisons between the CG and the IG show a similar rise in the expectation of both sets of mothers. For instance, those expecting this stage of development after the age of 2 decreased in both sub-sets (CG 60% to 49%; IG 68% to 54%).
KAP1 question 7 and KAP2 question 6 record the mother’s responses when asked about how much she talks to her baby in seven common situations. The answers are recorded in Tables 9 to 12.
In KAP1 question 7A (Table 9), 48% of all mothers spoke no more than a few words to their baby when he cried.. At KAP 2 the equivalent figure was 52%.. Comparisons between the CG and the IG show little difference between the groups and no change in behaviour during the study.
In KAP1 question 7B, 47% of all mothers spoke no more than a few words to their baby while feeding him At KAP 2 the equivalent figure was 51%. Comparisons between the CG and the IG show little difference between the groups and no change in behaviour during the study.

14
ZUMM Research Report December 2015
In KAP1 question 7C (Table 10), 51% of all mothers spoke no more than a few words to their baby while dressing him. At KAP 2 the equivalent figure was 45%, suggesting that some behaviour change had taken place. Comparisons between the CG and the IG show that all this change had taken place in the IG (CG 50% to 50%; IG 50% to 42%).
In KAP1 question 7D, 46% of all mothers spoke no more than a few words to their baby while doing their daily activities at home. At KAP 2 the equivalent figure was 40%, suggesting that some behaviour change had taken place. Comparisons between the CG and the IG show that almost all this change had taken place in the IG (CG 46% to 45%; IG 46% to 35%).
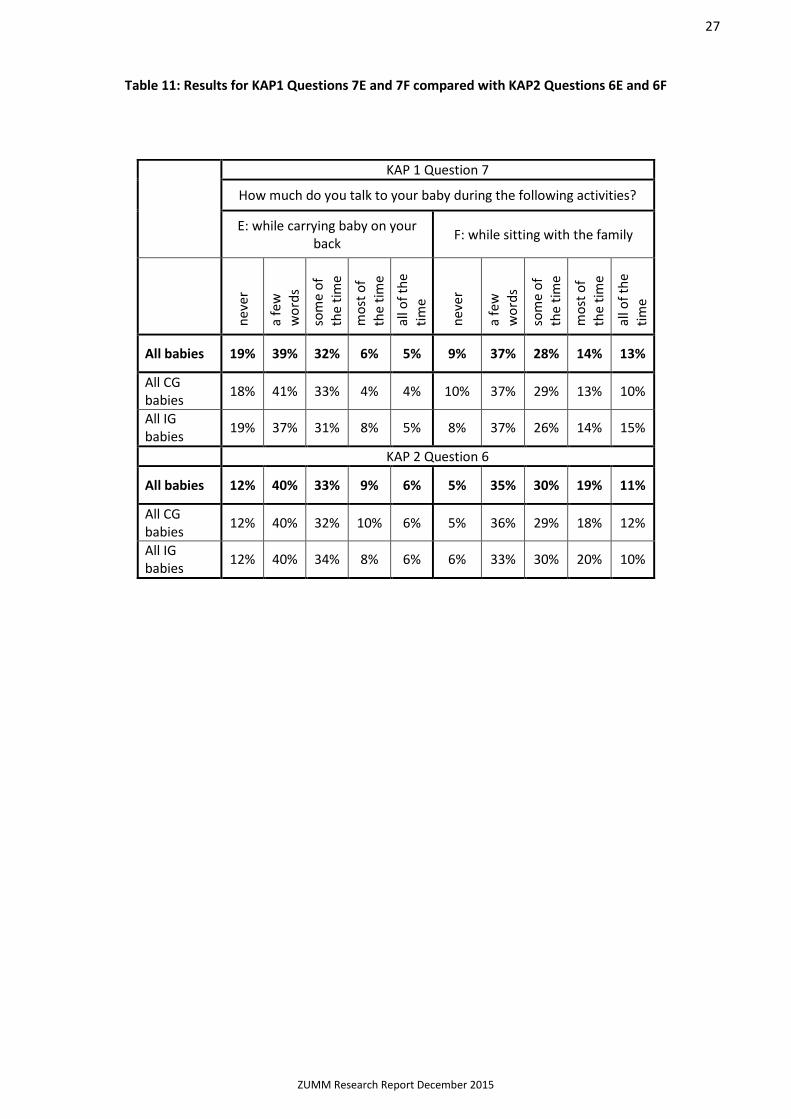
In KAP1 question 7E (Table 11), 58% of all mothers spoke no more than a few words to their baby while carrying him on her back. At KAP 2 the equivalent figure was 52%, suggesting that a little behaviour change had taken place. Comparisons between the CG and the IG show that a similar level of change had taken place in both groups (CG 59% to 52%; IG 56% to 52%).
In KAP1 question 7F, 46% of all mothers spoke no more than a few words to their baby while sitting with the family. At KAP 2 the equivalent figure was 40%, suggesting that a little behaviour change had taken place. Comparisons between the CG and the IG show that this change had taken place in both (CG 47% to 41%; IG 45% to 39%).
In KAP1 question 7G (Table 12), 52% of all mothers spoke no more than a few words to their baby while talking to friends and neighbours. At KAP 2 the equivalent figure was 54%, suggesting that no behaviour change had taken place. However, comparisons between the CG and the IG show that a small amount of behaviour change had occurred in both groups; in the CG, practice had improved slightly while in the IG the opposite had happened (CG 56% to 52%; IG 49% to 55%).
Table 13 shows the responses to KAP1 Question 8, a direct question relating to the importance of talking much to very young babies. Given the centrality of this to the research question, it was considered important to revisit the issue in another way from that employed in KAP1 question 3. In KAP1, 59% thought that it was important for parents/carers to talk to babies who are less than 3 months old, using many words and sentences. At KAP 2 the equivalent figure was 72%, suggesting that learning had taken place. Comparisons between the CG and the IG show that this change had taken place in both the CG and the IG (CG 60% to 72%; IG 57% to 71%).
KAP1 question 9 (and KAP2 question 8) ask the mother to agree or disagree with various statements. Whether the mother was asked sub-questions E and F, or G and H, depended upon her response to sub-question D. The data is found in Tables 14 to 16.
Tables 17 to 20 compare the responses to the sub-questions found in KAP1 question 10 and KAP2 question 9; in these questions, the mother was expected to answer all the sub-questions.
In KAP1 question 9A, 60% of all mothers agreed that it was possible to encourage a baby to walk early. At KAP 2 the equivalent figure was 71%, suggesting that some learning had taken place. Comparisons between the CG and the IG show that both groups had learnt but that the IG had learnt a little more (CG 62% to 69%; IG 58% to 73%). Of course this point was not part of the ZUMM teaching, but it was mentioned as an example in the intervention training.
In KAP1 question 9B, 48% of all mothers agreed that it was possible to encourage a baby to talk early. At KAP 2 the equivalent figure was 62%, suggesting that some learning had taken place. Comparisons between the CG and the IG show that both groups had learnt but that the IG had learnt more (CG 53% to 59%; IG 45% to 65%).
In KAP1 question 9C, 54% of all mothers agreed that ‘my baby will talk when he/she is ready; there is no need for me to help him/her’. At KAP 2 the equivalent figure was 48%, suggesting that a little learning had taken place. Comparisons between the CG and the IG show that all the learning had taken place in the IG, while the CG had moved a little in the incorrect direction (CG 51% to 55%; IG 57% to 41%).

15
ZUMM Research Report December 2015
In KAP1 question 9D, 52% of all mothers agreed that it is more important to encourage a baby to walk early than to talk early. At KAP 2 the equivalent figure was 56%, suggesting that there had been a slight rise in the proportion of mothers who favoured walking early over talking early. A relevant factor here might be that at KAP 2 the babies were 19 months old, rather than 9 months at KAP1 and mothers would have experienced some of the advantages of having a mobile child. Comparisons between the CG and the IG show that almost all the change was in the CG (CG 54% to 60%; IG 50% to 51%).
In KAP1 question 9E, 89% of the mothers who agreed with 9D also agreed they preferred their baby to walk early because then he did not need to be carried. At KAP 2 the equivalent figure was 86%.
In KAP1 question 9F, 93% of the mothers who agreed with 9D also agreed they preferred their baby to walk early because then he could play with other children. In KAP2 the figure was 94%.
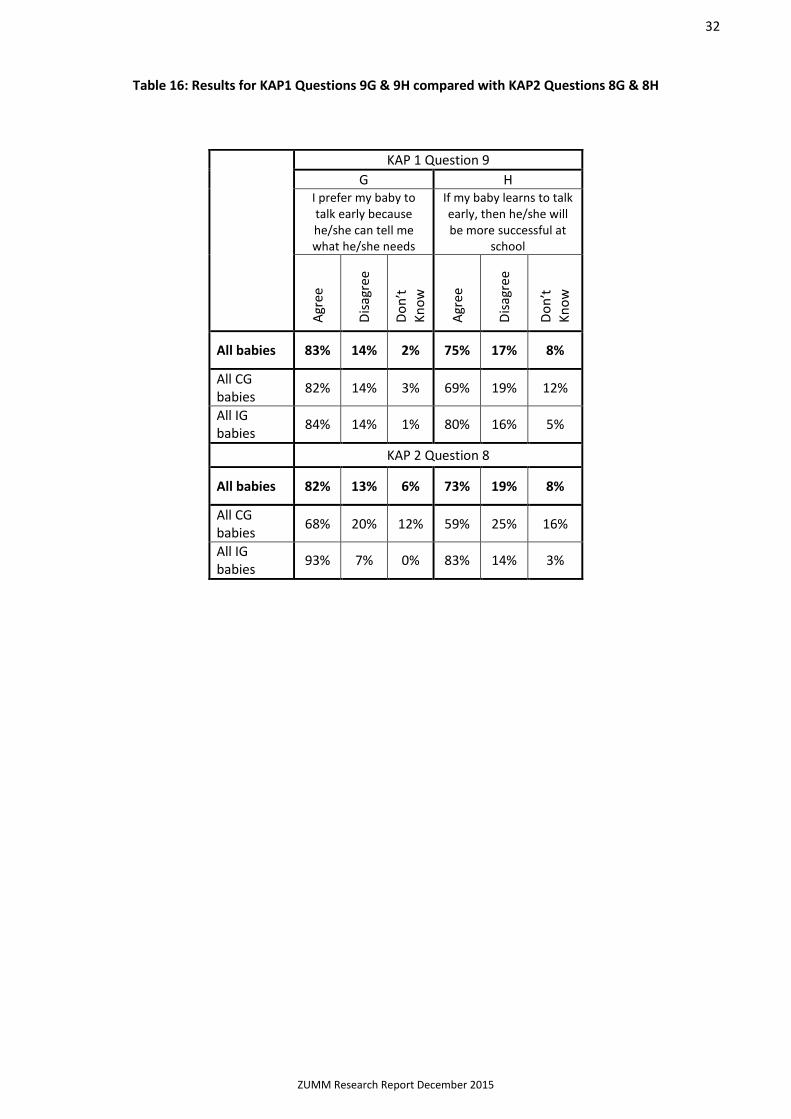
In KAP1 question 9G, 83% of the mothers who disagreed with 9D agreed that they preferred their baby to talk early because then he could tell his mother what he needed. In KAP2 the figure was 82%.
In KAP1 question 9H, 75% of the mothers who disagreed with 9D agreed that they preferred their baby to talk early because he would then be more successful at school. In KAP2 the figure was 73%, showing that, overall, no learning had taken place.
In KAP1 question 10A, 45% of the mothers agreed with the erroneous statement that it is crazy to talk to a baby before he can answer. At KAP 2 the equivalent figure was 39%, suggesting that a little learning had taken place. Comparisons between the CG and the IG show that all the learning had been in the IG and that the CG had moved a little in the ‘wrong’ direction (CG 44% to 46%; IG 45% to 33%).
In KAP1 question 10B, 48% of the mothers agreed with the erroneous statement that there is no benefit in talking much to a baby until he can understand what is said. At KAP 2 the equivalent figure was 44%, suggesting that some learning had taken place. Comparisons between the CG and the IG show that all the learning had been in the IG and that the CG had moved a little in the ‘wrong’ direction (CG 45% to 53%; IG 51% to 34%).
In KAP1 question 10C, 83% of the mothers agreed with the erroneous statement that the best way for a baby to learn to talk was mainly by playing with other children. At KAP 2 the equivalent figure was 78%, suggesting that some learning had taken place. Comparisons between the CG and the IG show that most of the learning had been in the IG (CG 80% to 77%; IG 86% to 78%).
In KAP1 question 10D, 67% of the mothers agreed that when a baby starts to make sounds, it is important to copy them back to the baby. At KAP 2 the equivalent figure was 69%, suggesting that an insignificant amount of learning had taken place. Comparisons between the CG and the IG show little significant difference (CG 67% to 67%; IG 67% to 70%).
In KAP1 question 10E, 74% of the mothers agreed with the erroneous statement that ‘I can help my baby to speak well if I correct the mistakes he makes’. At KAP 2 the equivalent figure was 79%, suggesting that some change had taken place. Comparisons between the CG and the IG show that all the change had been in the IG (CG 71% to 72%; IG 76% to 86%). The intervention tried, unsuccessfully it seems, to teach that correcting the baby in this way, although a common wrong belief (as the data shows), actually discourages the baby from trying to speak.
In KAP1 question 10F, 75% of the mothers agreed with the erroneous statement that ‘it is important to make a baby repeat the correct word if he makes a mistake’. At KAP 2 the equivalent figure was 77%, suggesting that some increase had taken place. Comparisons between the CG and the IG show that all the increase had been in the IG and that the CG had decreased a little (CG 74% to 71%; IG 75% to 83%). The intervention group had here also learnt the opposite of what was taught in the training programme.
In KAP1 question 10G, 41% of the mothers agreed that ‘if I read or tell stories to my baby, it will help my baby to understand many words’. At KAP 2 the equivalent figure was 55%, suggesting that learning had

16
ZUMM Research Report December 2015
taken place. Comparisons between the CG and the IG show that, while both groups had learnt, most of the learning had been in the IG (CG 42% to 49%; IG 40% to 60%).
In KAP1 question 10H, 45% of the mothers agreed that ‘it is important to talk to a baby from birth using many words and sentences’. At KAP 2 the equivalent figure was 58%, suggesting that learning had taken place. Comparisons between the CG and the IG show that, while both groups had learnt, most of the learning had been in the IG (CG 45% to 51%; IG 45% to 63%).
In KAP1 question 10I, 42% of the mothers agreed that ‘a baby’s brain needs to store many words before the baby learns to speak ‘. 28% of mothers did not know whether this was true or not. In KAP2 the figure was 51% for agreement and 19% did not know, suggesting that considerable learning had taken place. Comparisons between the CG and the IG show that, while both groups had learnt, the IG had learned more (for agree: CG 42% to 47%; IG 42% to 56%. For don’t know: CG 28% to 22%; IG 27% to 16%).
In KAP1 question 10J, 53% of the mothers agreed that ‘the amount of language a child uses, and understands, by age 2 years is the best indicator of whether he/she will learn to read and write easily at school ‘. 25% of mothers admitted that they did not know whether it was true or not. In KAP2 the figure was 62% agreed and 14% don’t know, suggesting that considerable learning had taken place. Comparisons between the CG and the IG show that, while both groups had learnt, more of the learning had been in the IG (For agree: CG 51% to 58%; IG 55% to 66%. For don’t know: CG 26% to 18%; IG 24% to 10%).
In KAP1 question 10K, 59% of the mothers agreed that it helps a baby to develop, if his parents use complete sentences when talking to him and 27% did not know. In KAP2 the figures were 63% agreed and 19% don’t know, suggesting that considerable change had taken place. However those disagreeing increased from 14% to 18%, suggesting that those who had made up their mind since KAP1 were, overall, divided quite evenly between those who agreed and those who disagreed. Comparisons between the CG and the IG show that the ‘correct’ learning had been in the IG where ‘don’t knows’ had reduced from 26% to 13% whereas those agreeing had increased from 59% to 71%. In the CG the opposite effect was seen; the ‘don’t knows’ also reduced (from 29% to 25%) at the same time as those agreeing also reduced (58% to 54%) along with a compensating significant increase in those disagreeing (13% to 21%).
KAP2 question 10 was an attempt to find out the mothers’ perception of the degree of change in various aspects of family relationships during the previous six month period, as perceived by the mother. It would have been better to include a question in KAP1 to obtain a baseline for these items but the idea was suggested later, only when KAP2 was being designed. It seemed better to try to capture this information rather than miss the opportunity because of the earlier oversight. The results are found in Tables 21 to 25.
In KAP2 question 10A, 54% of mothers reported that their enjoyment of their baby had much or very much increased during the previous six months. Enjoyment had increased more in the IG families than in the CG families (CG 48%; IG 61%).
In KAP2 question 10B, 63% of mothers reported that their love for their baby had much or very much increased during the previous six months. It had increased more in the IG families than in the CG families (CG 57%; IG70%).
In KAP2 question 10C, 43% of mothers reported that the ability of their baby to understand words had much or very much increased during the previous six months. The increases had been evenly spread between CG and IG families (CG 44%; IG 43%).
In KAP2 question 10D, 48% of mothers reported that the ability of their baby to communicate with the mother had much or very much increased during the previous six months. The increases had been evenly spread between CG and IG families (CG 48%; IG 47%).
In KAP2 question 10E, 54% of mothers reported that their ability to communicate with their baby had much or very much increased during the previous six months. The increases had been higher for IG families than for CG families (CG 50%; IG 58%).
17
ZUMM Research Report December 2015
In KAP2 question 10F, 49% of mothers reported that their understanding of their baby had much or very much increased during the previous six months. The increases had been higher for IG families than for CG families (CG 44%; IG 53%).
In KAP2 question 10G, 37% of mothers reported that the intelligence of their baby had much or very much increased during the previous six months. The increases had been evenly spread between CG and IG families (CG38%; IG 36%).
In KAP2 question 10H, 43% of mothers reported that their baby’s involvement as a member of the family had much or very much increased during the previous six months. The increases had been evenly spread between CG and IG families (CG 42%; IG 42%).
In KAP2 question 10I, 51% of mothers reported that involvement of their baby’s father in his care had much or very much increased during the previous six months. The increases had been evenly spread between CG and IG families (CG 49%; IG 52%).
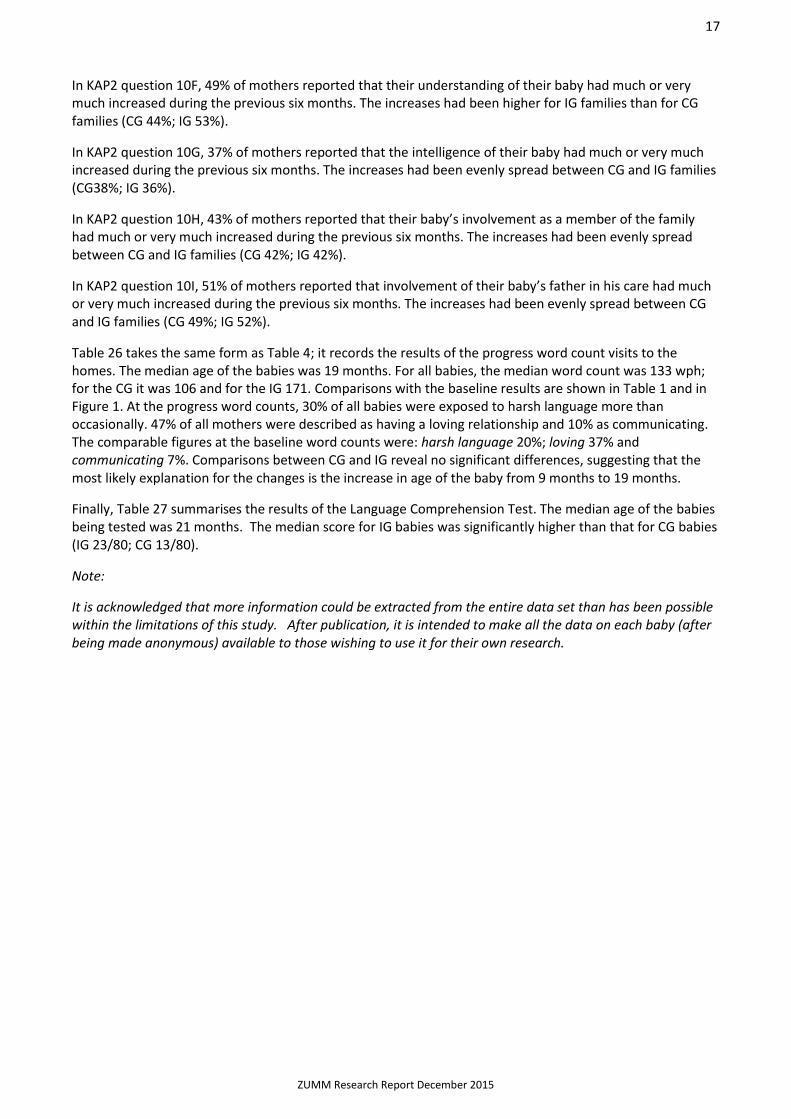
Table 26 takes the same form as Table 4; it records the results of the progress word count visits to the homes. The median age of the babies was 19 months. For all babies, the median word count was 133 wph; for the CG it was 106 and for the IG 171. Comparisons with the baseline results are shown in Table 1 and in Figure 1. At the progress word counts, 30% of all babies were exposed to harsh language more than occasionally. 47% of all mothers were described as having a loving relationship and 10% as communicating. The comparable figures at the baseline word counts were: harsh language 20%; loving 37% and communicating 7%. Comparisons between CG and IG reveal no significant differences, suggesting that the most likely explanation for the changes is the increase in age of the baby from 9 months to 19 months.
Finally, Table 27 summarises the results of the Language Comprehension Test. The median age of the babies being tested was 21 months. The median score for IG babies was significantly higher than that for CG babies (IG 23/80; CG 13/80).
Note:
It is acknowledged that more information could be extracted from the entire data set than has been possible within the limitations of this study. After publication, it is intended to make all the data on each baby (after being made anonymous) available to those wishing to use it for their own research.

18
ZUMM Research Report December 2015
Table 1: Overview of main findings
Words per Hour spoken to the baby
Language Comprehension
Test
Bas
elin
e
Pro
gres
s
%
Incr
ease
Sco
re/8
0
Rat
io
IG/C
G
All babies median 63 133 111 18
All babies CG/IG
comparison
CG median 58 106 83 13 1.8
IG median 65 171 163 23
Misungwi CG median 20 35 75 10
2.0 IG median 22 62 182 20
Ilemela CG median 87 154 77 11
1.3 IG median 73 162 122 14
Dodoma
CG median 79 190 141 13
0.9
IG median 73 138 89 12
Morogoro CG median 27 35 30 10
3.2 IG median 54 242 348 32
Moshi CG median 97 226 133 44
1.0 IG median 116 198 71 42

19
ZUMM Research Report December 2015
Figure 1
Table 2: General background data on the babies and their families
63 58 65
133
106
171
0
50
100
150
200
250
All Babies Control Group Intervention Group
Wo
rds
spo
ken
to
th
e b
aby
pe
r h
ou
r (w
ph
) Word Count Data
Progress
Baseline
General Background Data
Number of babies Gender of
babies
Number of
children in family
Kiswahili How much time does
the father live at home
Beg
inn
ing
of
stu
dy
End
of
stu
dy
Ret
enti
on
Rat
e (
%)
% m
ale
% f
emal
e
med
ian
% M
ain
lan
guag
e at
ho
me
% O
ccas
ion
al la
ngu
age
at h
om
e
% N
ot
use
d a
t h
om
e
% A
lway
s
% M
ost
of
the
tim
e
% O
ccas
ion
ally
% N
ever
All babies 1035 883 85 48 52 3 45 50 5 70 4 15 11
Control Group babies (CG)
510 437 86 47 53 3 45 50 5 72 5 12 10
Intervention Group babies (IG)
525 446 85 50 50 3 45 49 6 68 2 18 12

20
ZUMM Research Report December 2015
Table 3: The educational achievements of the mother of the baby
Table 4: Data from baseline word count visits
Percentage of mothers achieving each level of education
Can the mother read?
No education recorded
Primary (Standard
7)
O Level (Form
4)
A Level (Form
6)
Certificate Diploma
First degree
Higher degree
Yes No
All Babies 84 16 18 74 7 0 0 0 0
Control Group
Babies (CG) 82 18 20 73 7 0 0 0 0
Intervention Group
Babies (IG) 86 14 16 76 8 0 0 0 0
Baseline Word Count Visits
Age
of
bab
y in
mo
nth
s
% M
oth
er w
ith
bab
y
Med
ian
Wo
rds
per
ho
ur Relationship between carer
and baby (%) Frequency of use of harsh
language (%)
Har
sh
Dis
tan
t
Usu
al
Lovi
ng
Co
mm
un
icat
ing
No
ne
of
the
tim
e
Occ
asio
nal
ly
Som
e o
f th
e ti
me
Mo
st o
f th
e ti
me
All
the
tim
e
All babies 9 90 63 1 7 48 37 7 78 1 17 2 1
Control Group babies (CG)
9 91 58 2 7 47 37 7 75 2 20 2 1
Intervention Group babies (IG)
8 90 65 0 8 48 37 7 82 1 15 2 0

21
ZUMM Research Report December 2015
Table 5: Main sources of the carer’s (usually mother) knowledge about caring for babies
% m
oth
er is
inte
rvie
wee
KAP 1 Question 1
Which have been the main sources of your knowledge about caring for your baby? %
Mo
ther
%
Gra
nd
mo
ther
%
Oth
er f
emal
e re
lati
ves
% F
ath
er
% G
ran
dfa
ther
% O
ther
mal
e re
lati
ves
% H
ealt
h w
ork
ers
in t
he
clin
ic
% H
osp
ital
Mid
wif
e %
Lo
cal B
irth
ing
Att
end
ant
% T
rad
itio
nal
hea
lers
%
Sch
oo
l te
ach
ers
% P
asto
rs o
r im
ams
% B
oo
ks
% In
tern
et
% R
adio
% T
ele
visi
on
%
Oth
er
All babies 95 81 48 38 32 15 16 74 45 15 12 27 22 30 3 34 12 11
All CG 95 80 48 38 34 17 15 74 42 15 12 30 24 29 3 31 13 12
All IG 93 80 47 37 29 14 16 72 48 15 13 24 20 32 4 36 11 10
Figure 2
0
10
20
30
40
50
60
70
80
90
Main Sources of Mothers' Information about Childcare by Percentage

22
ZUMM Research Report December 2015
Table 6: Results for KAP1 Questions 2 and 3 compared with KAP2 Questions 1 and 2
KAP 1 Question 2 KAP 1 Question 3
At what age do you think that a baby begins to hear sounds?
What age should a baby reach before a mother starts talking to him/her using many words and sentences?
bef
ore
bir
th
at b
irth
1 m
on
th
2-4
mo
nth
s
5-6
mo
nth
s
bef
ore
bir
th
at b
irth
1-5
mo
nth
s
6-1
1 m
on
ths
1 y
ear
or
late
r
All babies 3% 17% 15% 38% 27% 1% 10% 24% 36% 29%
All CG babies
3% 16% 17% 39% 25% 1% 9% 26% 35% 29%
All IG babies
2% 17% 13% 37% 30% 1% 11% 22% 37% 28%
KAP 2 Question 1 KAP 2 Question 2
All babies 12% 27% 21% 25% 17% 3% 20% 28% 27% 23%
All CG babies
7% 27% 23% 26% 16% 2% 17% 34% 29% 18%
All IG babies
16% 26% 18% 23% 17% 3% 22% 22% 25% 29%

23
ZUMM Research Report December 2015
Table 7: Results for KAP1 Questions 4 and 5 compared with KAP2 Questions 3 and 4
KAP 1 Question 4 KAP 1 Question 5
At what age do you expect a child to start saying single words
with meaning?
How many different words would you expect a child to say when
he/she becomes two years old?
0—
6
mo
nth
s
7—
12
mo
nth
s
13
—1
8
mo
nth
s
19
—2
4
mo
nth
s
2 y
ears
or
late
r
0—
10
11
—2
0
21
—4
0
41
—6
0
mo
re
than
60
All babies 7% 37% 21% 15% 19% 27% 24% 22% 9% 18%
All CG babies
7% 38% 20% 15% 19% 28% 27% 20% 10% 15%
All IG babies
7% 37% 22% 16% 18% 25% 22% 23% 8% 21%
KAP 2 Question 3 KAP 2 Question 4
All babies 8% 35% 29% 12% 15% 20% 24% 19% 12% 24%
All CG babies
10% 34% 28% 14% 14% 22% 25% 22% 14% 17%
All IG babies
6% 37% 30% 10% 17% 19% 24% 16% 11% 31%

24
ZUMM Research Report December 2015
Table 8: Results for KAP1 Question 6 compared with KAP2 Question 5
KAP 1 Question 6
At what age do you expect a child to start putting 2 or more words together to make a meaningful phrase or sentence?
6—
12
m
on
ths
13
—1
8
mo
nth
s
19
—2
3
mo
nth
s
2 -
2½
year
s
ove
r 2
½
year
s
All babies 4% 17% 14% 52% 13%
All CG babies
3% 22% 16% 47% 13%
All IG babies
4% 13% 14% 56% 12%
KAP 2 Question 5
All babies 5% 22% 21% 36% 15%
All CG babies
7% 21% 23% 36% 13%
All IG babies
4% 23% 19% 37% 17%

25
ZUMM Research Report December 2015
Table 9: Results for KAP1 Questions 7A and 7B compared with KAP2 Questions 6A and 6B
KAP 1 Question 7
How much do you talk to your baby during the following activities?
A: when he cries
B: while feeding
nev
er
a fe
w
wo
rds
som
e o
f th
e ti
me
mo
st o
f
the
tim
e
all o
f th
e
tim
e
nev
er
a fe
w
wo
rds
som
e o
f th
e ti
me
mo
st o
f th
e ti
me
all o
f th
e ti
me
All babies 6% 42% 19% 16% 16% 12% 35% 34% 10% 9%
All CG babies
7% 44% 19% 16% 14% 11% 35% 37% 10% 7%
All IG babies
5% 40% 19% 17% 19% 12% 35% 31% 10% 11%
KAP 2 Question 6
All babies 9% 43% 18% 13% 17% 9% 42% 29% 11% 10%
All CG babies
12% 44% 19% 11% 14% 11% 42% 28% 11% 8%
All IG babies
6% 41% 17% 15% 21% 6% 42% 29% 11% 12%

26
ZUMM Research Report December 2015
Table 10: Results for KAP1 Questions 7C and 7D compared with KAP2 Questions 6C and 6D
KAP 1 Question 7
How much do you talk to your baby during the following activities?
C: while washing/dressing baby D: while doing your daily activities
at home
nev
er
a fe
w
wo
rds
som
e o
f th
e ti
me
mo
st o
f
the
tim
e
all o
f th
e
tim
e
nev
er
a fe
w
wo
rds
som
e o
f th
e ti
me
mo
st o
f th
e ti
me
all o
f th
e ti
me
All babies 7% 44% 28% 13% 9% 15% 31% 31% 9% 9%
All CG babies
6% 44% 27% 13% 9% 16% 30% 30% 6% 6%
All IG babies
7% 43% 28% 12% 9% 14% 32% 32% 11% 12%
KAP 2 Question 6
All babies 4% 41% 30% 16% 8% 6% 34% 36% 15% 9%
All CG babies
7% 43% 28% 14% 7% 8% 37% 35% 13% 7%
All IG babies
2% 40% 31% 18% 9% 4% 31% 36% 18% 11%
27
ZUMM Research Report December 2015
Table 11: Results for KAP1 Questions 7E and 7F compared with KAP2 Questions 6E and 6F
KAP 1 Question 7
How much do you talk to your baby during the following activities?
E: while carrying baby on your back
F: while sitting with the family
nev
er
a fe
w
wo
rds
som
e o
f th
e ti
me
mo
st o
f
the
tim
e
all o
f th
e
tim
e
nev
er
a fe
w
wo
rds
som
e o
f th
e ti
me
mo
st o
f th
e ti
me
all o
f th
e ti
me
All babies 19% 39% 32% 6% 5% 9% 37% 28% 14% 13%
All CG babies
18% 41% 33% 4% 4% 10% 37% 29% 13% 10%
All IG babies
19% 37% 31% 8% 5% 8% 37% 26% 14% 15%
KAP 2 Question 6
All babies 12% 40% 33% 9% 6% 5% 35% 30% 19% 11%
All CG babies
12% 40% 32% 10% 6% 5% 36% 29% 18% 12%
All IG babies
12% 40% 34% 8% 6% 6% 33% 30% 20% 10%

28
ZUMM Research Report December 2015
Table 12: Results for KAP1 Question 7G compared with KAP2 Question 6G
KAP 1 Question 7
How much do you talk to your baby during the following
activities?
G: while talking to friends/neighbours
nev
er
a fe
w
wo
rds
som
e o
f th
e ti
me
mo
st o
f th
e ti
me
all o
f th
e ti
me
All babies 18% 34% 37% 5% 6%
All CG babies
20% 36% 36% 4% 4%
All IG babies
17% 32% 37% 6% 7%
KAP 2 Question 6
All babies 14% 40% 32% 9% 6%
All CG babies
16% 36% 31% 10% 6%
All IG babies
12% 43% 33% 8% 5%

29
ZUMM Research Report December 2015
Table 13: Results for KAP1 Question 8 compared with KAP2 Question 7
KAP 1 Question 8
Do you think it is important for parents/carers to talk to babies who are less than 3 months old, using many words and sentences?
Yes No
All babies 59% 41%
All CG babies
60% 40%
All IG babies
57% 43%
KAP 2 Question 7
All babies 72% 28%
All CG babies
72% 28%
All IG babies
71% 29%

30
ZUMM Research Report December 2015
Table 14: Results for KAP1 Questions 9A, 9B & 9C compared with KAP2 Questions 8A, 8B & 8C
KAP 1 Question 9
A B C
It is possible to encourage a baby to
walk early
It is possible to encourage a baby to
talk early
My baby will talk when he/she is
ready; there is no need for me to help him/her
Agr
ee
Dis
agre
e
Do
n’t
K
no
w
Agr
ee
Dis
agre
e
Do
n’t
K
no
w
Agr
ee
Dis
agre
e
Do
n’t
K
no
w
All babies 60% 35% 5% 48% 47% 4% 54% 42% 4%
All CG babies
62% 31% 6% 53% 42% 6% 51% 45% 4%
All IG babies
58% 39% 3% 45% 53% 3% 57% 38% 5%
KAP 2 Question 8
All babies 71% 24% 5% 62% 33% 5% 48% 47% 5%
All CG babies
69% 23% 8% 59% 33% 8% 55% 37% 8%
All IG babies
73% 26% 2% 65% 34% 2% 41% 57% 2%

31
ZUMM Research Report December 2015
Table 15: Results for KAP1 Questions 9D, 9E & 9F compared with KAP2 Questions 8D, 8E & 8F
KAP 1 Question 9
D E F
It is more important to encourage a baby to walk early than to
talk early
I prefer my baby to walk early because then I do not
need to carry him/her all the time
I prefer my baby to walk early so that
he/she can play with other children
Agr
ee
Dis
agre
e
Do
n’t
Kn
ow
Agr
ee
Dis
agre
e
Do
n’t
K
no
w
Agr
ee
Dis
agre
e
Do
n’t
Kn
ow
All babies 52% 43% 5% 89% 10% 1% 93% 7% 0%
All CG babies
54% 41% 5% 87% 11% 1% 92% 8% 0%
All IG babies
50% 45% 5% 91% 9% 0% 94% 5% 0%
KAP 2 Question 8
All babies 56% 39% 6% 86% 13% 1% 94% 5% 1%
All CG babies
60% 32% 8% 87% 11% 2% 92% 5% 2%
All IG babies
51% 46% 3% 84% 16% 0% 95% 5% 0%
32
ZUMM Research Report December 2015
Table 16: Results for KAP1 Questions 9G & 9H compared with KAP2 Questions 8G & 8H
KAP 1 Question 9
G H I prefer my baby to talk early because he/she can tell me what he/she needs
If my baby learns to talk early, then he/she will be more successful at
school
Agr
ee
Dis
agre
e
Do
n’t
Kn
ow
Agr
ee
Dis
agre
e
Do
n’t
Kn
ow
All babies 83% 14% 2% 75% 17% 8%
All CG babies
82% 14% 3% 69% 19% 12%
All IG babies
84% 14% 1% 80% 16% 5%
KAP 2 Question 8
All babies 82% 13% 6% 73% 19% 8%
All CG babies
68% 20% 12% 59% 25% 16%
All IG babies
93% 7% 0% 83% 14% 3%
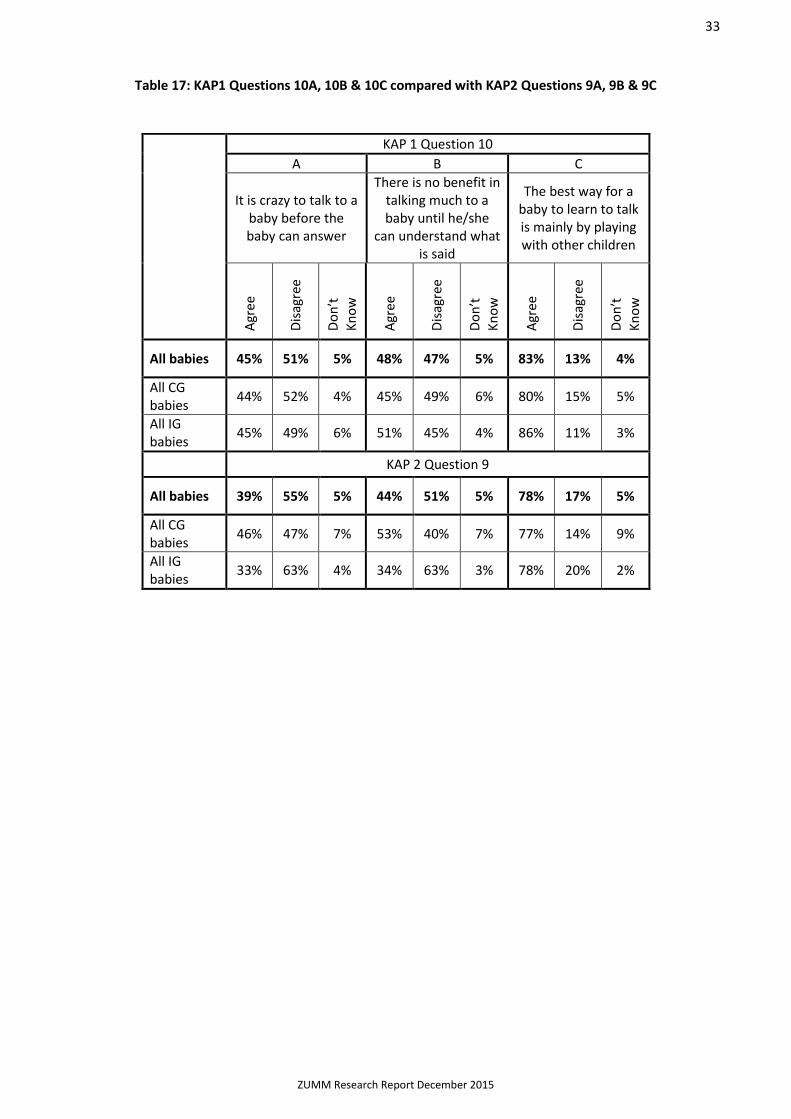
33
ZUMM Research Report December 2015
Table 17: KAP1 Questions 10A, 10B & 10C compared with KAP2 Questions 9A, 9B & 9C
KAP 1 Question 10
A B C
It is crazy to talk to a baby before the baby can answer
There is no benefit in talking much to a baby until he/she
can understand what is said
The best way for a baby to learn to talk is mainly by playing with other children
Agr
ee
Dis
agre
e
Do
n’t
K
no
w
Agr
ee
Dis
agre
e
Do
n’t
K
no
w
Agr
ee
Dis
agre
e
Do
n’t
K
no
w
All babies 45% 51% 5% 48% 47% 5% 83% 13% 4%
All CG babies
44% 52% 4% 45% 49% 6% 80% 15% 5%
All IG babies
45% 49% 6% 51% 45% 4% 86% 11% 3%
KAP 2 Question 9
All babies 39% 55% 5% 44% 51% 5% 78% 17% 5%
All CG babies
46% 47% 7% 53% 40% 7% 77% 14% 9%
All IG babies
33% 63% 4% 34% 63% 3% 78% 20% 2%
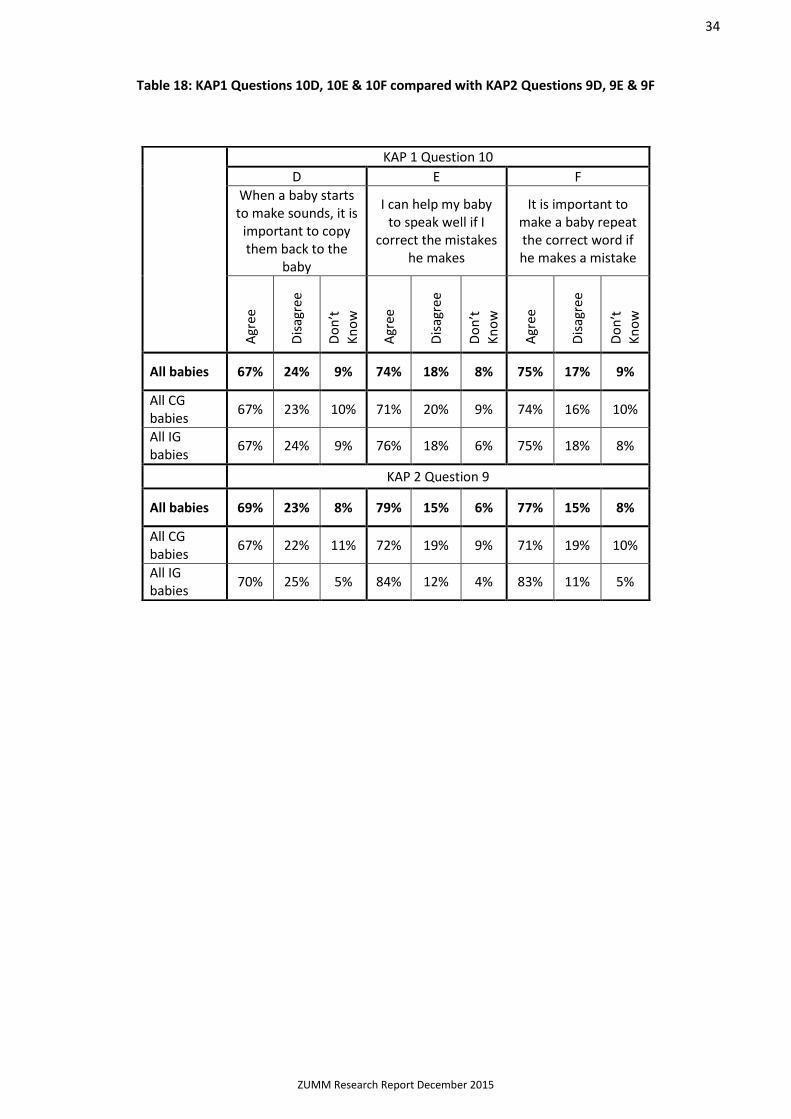
34
ZUMM Research Report December 2015
Table 18: KAP1 Questions 10D, 10E & 10F compared with KAP2 Questions 9D, 9E & 9F
KAP 1 Question 10
D E F
When a baby starts to make sounds, it is
important to copy them back to the
baby
I can help my baby to speak well if I
correct the mistakes he makes
It is important to make a baby repeat the correct word if he makes a mistake
Agr
ee
Dis
agre
e
Do
n’t
K
no
w
Agr
ee
Dis
agre
e
Do
n’t
K
no
w
Agr
ee
Dis
agre
e
Do
n’t
K
no
w
All babies 67% 24% 9% 74% 18% 8% 75% 17% 9%
All CG babies
67% 23% 10% 71% 20% 9% 74% 16% 10%
All IG babies
67% 24% 9% 76% 18% 6% 75% 18% 8%
KAP 2 Question 9
All babies 69% 23% 8% 79% 15% 6% 77% 15% 8%
All CG babies
67% 22% 11% 72% 19% 9% 71% 19% 10%
All IG babies
70% 25% 5% 84% 12% 4% 83% 11% 5%

35
ZUMM Research Report December 2015
Table 19: KAP1 Questions 10G, 10H & 10I compared with KAP2 Questions 9G, 9H & 9I
KAP 1 Question 10
G H I
If I read or tell stories to my baby, it will help my baby to
understand many words
It is important to talk to a baby from its birth using many
words and sentences
A baby’s brain needs to store many words
before the baby learns to speak
Agr
ee
Dis
agre
e
Do
n’t
Kn
ow
Agr
ee
Dis
agre
e
Do
n’t
K
no
w
Agr
ee
Dis
agre
e
Do
n’t
K
no
w
All babies 41% 40% 19% 45% 39% 16% 42% 30% 28%
All CG babies
42% 37% 20% 45% 39% 15% 42% 30% 28%
All IG babies
40% 42% 18% 45% 39% 16% 42% 31% 27%
KAP 2 Question 9
All babies 55% 32% 13% 58% 33% 10% 51% 30% 19%
All CG babies
49% 33% 18% 51% 36% 12% 47% 31% 22%
All IG babies
60% 32% 8% 63% 30% 7% 56% 28% 16%
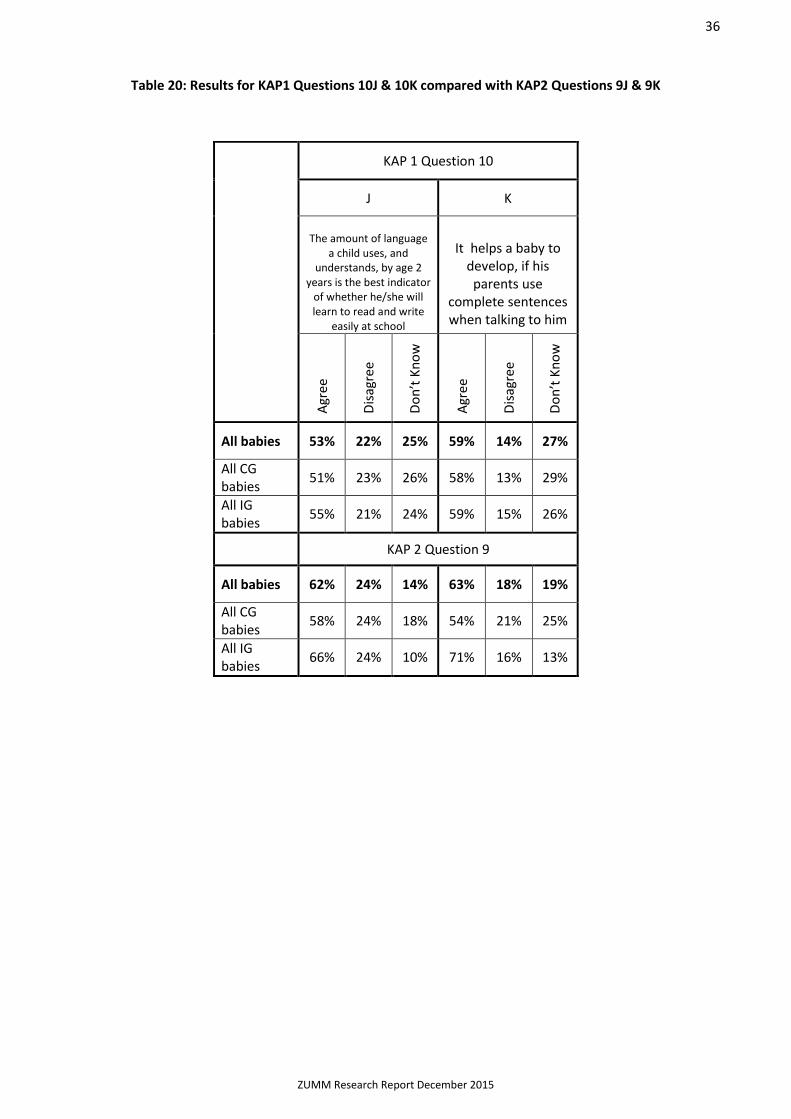
36
ZUMM Research Report December 2015
Table 20: Results for KAP1 Questions 10J & 10K compared with KAP2 Questions 9J & 9K
KAP 1 Question 10
J K
The amount of language
a child uses, and understands, by age 2
years is the best indicator of whether he/she will learn to read and write
easily at school
It helps a baby to
develop, if his parents use
complete sentences when talking to him
Agr
ee
Dis
agre
e
Do
n’t
Kn
ow
Agr
ee
Dis
agre
e
Do
n’t
Kn
ow
All babies 53% 22% 25% 59% 14% 27%
All CG babies
51% 23% 26% 58% 13% 29%
All IG babies
55% 21% 24% 59% 15% 26%
KAP 2 Question 9
All babies 62% 24% 14% 63% 18% 19%
All CG babies
58% 24% 18% 54% 21% 25%
All IG babies
66% 24% 10% 71% 16% 13%
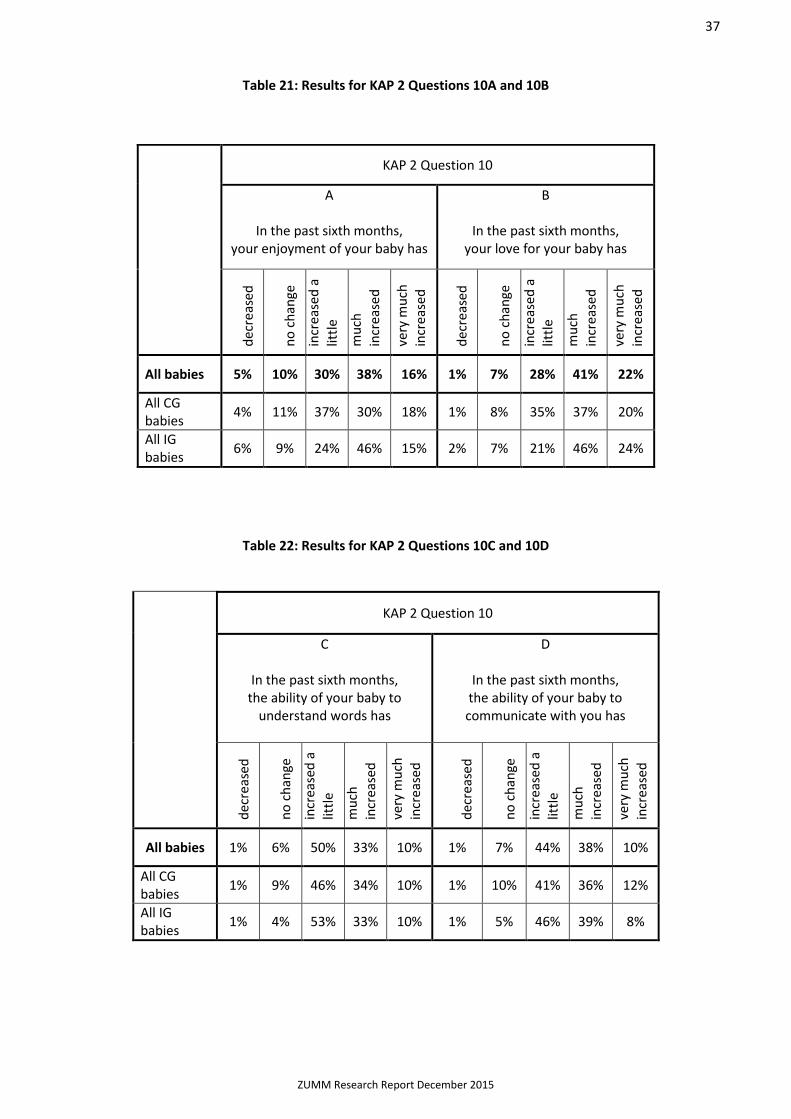
37
ZUMM Research Report December 2015
Table 21: Results for KAP 2 Questions 10A and 10B
Table 22: Results for KAP 2 Questions 10C and 10D
KAP 2 Question 10
C
In the past sixth months, the ability of your baby to
understand words has
D
In the past sixth months, the ability of your baby to communicate with you has
dec
reas
ed
no
ch
ange
incr
ease
d a
lit
tle
mu
ch
incr
ease
d
very
mu
ch
incr
ease
d
dec
reas
ed
no
ch
ange
incr
ease
d a
lit
tle
mu
ch
incr
ease
d
very
mu
ch
incr
ease
d
All babies 1% 6% 50% 33% 10% 1% 7% 44% 38% 10%
All CG babies
1% 9% 46% 34% 10% 1% 10% 41% 36% 12%
All IG babies
1% 4% 53% 33% 10% 1% 5% 46% 39% 8%
KAP 2 Question 10
A
In the past sixth months, your enjoyment of your baby has
B
In the past sixth months, your love for your baby has
dec
reas
ed
no
ch
ange
incr
ease
d a
lit
tle
mu
ch
incr
ease
d
very
mu
ch
incr
ease
d
dec
reas
ed
no
ch
ange
incr
ease
d a
lit
tle
mu
ch
incr
ease
d
very
mu
ch
incr
ease
d
All babies 5% 10% 30% 38% 16% 1% 7% 28% 41% 22%
All CG babies
4% 11% 37% 30% 18% 1% 8% 35% 37% 20%
All IG babies
6% 9% 24% 46% 15% 2% 7% 21% 46% 24%
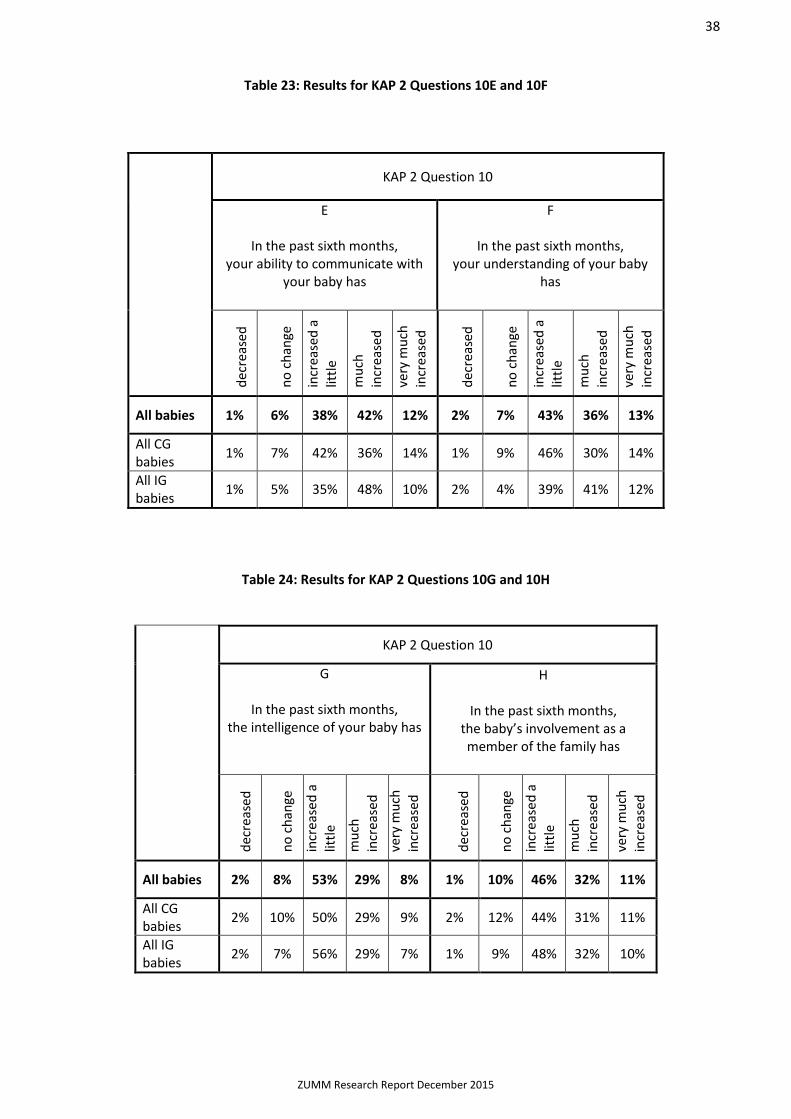
38
ZUMM Research Report December 2015
Table 23: Results for KAP 2 Questions 10E and 10F
Table 24: Results for KAP 2 Questions 10G and 10H
KAP 2 Question 10
G
In the past sixth months, the intelligence of your baby has
H
In the past sixth months, the baby’s involvement as a member of the family has
dec
reas
ed
no
ch
ange
incr
ease
d a
lit
tle
mu
ch
incr
ease
d
very
mu
ch
incr
ease
d
dec
reas
ed
no
ch
ange
incr
ease
d a
lit
tle
mu
ch
incr
ease
d
very
mu
ch
incr
ease
d
All babies 2% 8% 53% 29% 8% 1% 10% 46% 32% 11%
All CG babies
2% 10% 50% 29% 9% 2% 12% 44% 31% 11%
All IG babies
2% 7% 56% 29% 7% 1% 9% 48% 32% 10%
KAP 2 Question 10
E
In the past sixth months, your ability to communicate with
your baby has
F
In the past sixth months, your understanding of your baby
has
dec
reas
ed
no
ch
ange
incr
ease
d a
littl
e
mu
ch
incr
ease
d
very
mu
ch
incr
ease
d
dec
reas
ed
no
ch
ange
incr
ease
d a
lit
tle
mu
ch
incr
ease
d
very
mu
ch
incr
ease
d
All babies 1% 6% 38% 42% 12% 2% 7% 43% 36% 13%
All CG babies
1% 7% 42% 36% 14% 1% 9% 46% 30% 14%
All IG babies
1% 5% 35% 48% 10% 2% 4% 39% 41% 12%

39
ZUMM Research Report December 2015
Table 25: Results for KAP 2 Question 10I
KAP 2 Question 10
I
In the past sixth months, the involvement of the baby’s
father in the care of the baby has
dec
reas
ed
no
ch
ange
incr
ease
d a
lit
tle
mu
ch
incr
ease
d
very
mu
ch
incr
ease
d
All babies 4% 16% 29% 32% 19%
All CG babies
4% 17% 30% 30% 19%
All IG babies
4% 16% 27% 34% 18%
Table 26: Data from progress word count visits
Progress Word Count Visits
Age
of
bab
y in
mo
nth
s
% M
oth
er w
ith
bab
y
Med
ian
Wo
rds
per
ho
ur Relationship between carer
and baby (%) Frequency of use of harsh
language (%)
Har
sh
Dis
tan
t
Usu
al
Lovi
ng
Co
mm
un
icat
ing
No
ne
of
the
tim
e
Occ
asio
nal
ly
Som
e o
f th
e ti
me
Mo
st o
f th
e ti
me
All
the
tim
e
All babies 19 98 133 2 5 36 47 10 67 3 23 3 4
Control Group babies (CG)
19 98 106 3 5 32 49 11 66 4 23 4 3
Intervention Group babies (IG)
19 96 171 0 4 41 45 9 68 3 22 2 5

40
ZUMM Research Report December 2015
Table 27: Language Comprehension Screening Test ages and scores
Median Age of baby in months
Total
(Max Score 80)
All babies 21 18
All CG babies 21 13
All IG babies 21 23

41
ZUMM Research Report December 2015
DISCUSSION
Conclusions
This study was designed to answer two main questions: what is the language environment of young babies in Tanzania, and if it is poor, can it be improved? The results set out above (Tables 1 & 4 and Fig 1) indicate very clearly the impoverished language environment of the babies; the median number of words per hour for all babies, at the beginning of the study, was 63. To put that number into context, a native speaker of English typically speaks at between 120 and 150 words per minute when speaking without interruption. Word structure in Kiswahili is different from English, so that Kiswahili uses slightly more words to say the same, which means that if the words spoken to the baby were translated, the score would be even lower. The ones who made most progress, those in the Intervention Group, increased from a median score of 65 to 171 words per hour, following intervention (Table 27). Very marked progress was made, but even this word count falls far short of the lowest counts, 6-800 words per hour, found in studies in the UK and North America (for example, Hart & Risley, 2003) At best, it was a significant step in the right direction.
A study of the responses to the first KAP Survey (Tables 5 - 20) suggests why this is so: there is very little knowledge about the importance of talking to babies, and indeed many erroneous beliefs about what newborns and young babies can and cannot do. For example, (Table 6) 65% of mothers think that babies cannot hear before two months old, which includes 27% who believe a baby does not hear until 5-6 months. If a baby cannot hear, why would anyone talk to him? Similarly, 65% of mothers do not think they should start talking to their baby, using many words and sentences, before 6 months, and nearly half of those would not start until after the first birthday. In view of the evidence that most neural connections for language are made before the first birthday, this is an alarming finding. However, it is significant that no cultural barriers to behaviour change were found during the study.
It is therefore unsurprising that expectations around language development are low (Tables 7 & 8). 55%of mothers did not expect children to start saying single words until 13 months or over, including 19% who did not expect it before 2 years; 73% of mothers expected their child to have no more than 40 words by two years old, including 51 % who expected no more than 20 words at two; similarly, 65% of mothers expect infants to start putting 2 words together meaningfully after two years of age. This level of parental expectation is very low, when viewed against an accepted international definition of delayed language development: having fewer than 50 words and not putting two or more words together at two years old.
A few minor points emerge from the data collectors’ comments on the word-count visits (Tables 4 and 27): first, that across all families, only 7% of the mothers are described as ‘communicating’ with the baby during the baseline visits, a figure which rises only to 10% at the second word count, when the babies are older and half of the mothers have been trained. On the second round of visits, the number of mothers speaking ‘harshly’ to the babies, at least some of the time, has increased from 20% to 30%. While both figures are undesirably high, the increase may be explained by the fact that the babies are 19 months old, and therefore mobile, by the second word-count, and mothers will be using words to summon them, warn them and discipline them.
Having established that the need for intervention is great, is there evidence that the language environment could be enhanced? Two measures are relevant to this question: the comparison between the Intervention and Control Groups on the increase in words per hour at the progress word counts, and on the Language Comprehension Test scores. All the mothers, including those in the Control Group, had increased the number of words spoken to their babies between the first and second word counts, at 9 months and 19 months respectively. This is to be expected; as the infants get older and become more responsive, and of course more mobile, the mothers speak more to them. The interesting question is whether the increase was significantly greater among mothers in the Intervention Group.
Table 1 suggests that the answer to this question is an emphatic ‘yes’. While the median word count for the Control Group babies rose from 58 to 106 wpm (by 83%), that for the Intervention Group rose significantly more, from 65 to 171 wpm (by 163%). If the increase in the Intervention Group had just been caused by the

42
ZUMM Research Report December 2015
fact that they were older, the Control Group figure suggests that the increase would also have been of the order of 83%. An 83% increase for the Intervention Group would have resulted in a median word count of 119 wpm and so the additional gain of 52 wpm to 171 wpm (by 44%) can reasonably be said to result from the intervention programme.
The Language Comprehension Test, administered when the babies were 21 months old, revealed a similarly positive picture. The median score (maximum 80) was 13 for the Control Group and 23 for the Intervention Group (77% better).
While the results are encouraging, because they show a positive effect for the intervention, the earlier discussion reveals that a much larger impact would be needed before babies in Tanzania would benefit from the richness of language environment experienced by babies in many countries.
A number of factors conspired to reduce the apparent effectiveness overall of the intervention.
Many of the results from KAP2 showed that the Control Group mothers had also learnt some of the facts and practice being taught in the intervention. Experience in the pilot research projects had shown just how easily the attractive ZUMM message spreads within and between communities. In one of the pilot cohorts, news spread as parents and grandparents were so impressed by the changes they had observed in the intervention group babies. While this is a considerable advantage when the message is being broadcast more widely, it made it impossible to ensure that no ‘leakage’ occurred between the Intervention Group and the Control Group during the study. It seems likely that some of the increase in mean word count for the Control Group could also have resulted from the training of the Intervention Group.
In some villages, the intervention facilitators reported that it was difficult to get the family members to attend the training sessions. In this analysis of the results, 100% attendance at the training sessions was assumed, as a lack of data prevented allowance for absences from being made.
As mentioned when commenting on Table 1, the intervention seemed to have been counter-productive in Dodoma. Closer examination revealed that the Control Group and Intervention Group locations had been chosen inappropriately, as they were very different culturally, one being urban (CG) and the other (IG) rural. The strange results could be explained if the normal rise in words spoken to babies in an urban environment was much greater than that normally found in a rural one. Whether this is so or not, it is interesting to note that in the two very different communities, at age 9 months, the babies heard an equally small number of words per hour. There is evidence that both the urban and the rural communities were missing the unique opportunity provided in the first twelve months of life to enrich the language environment of their babies.
The outcomes in the Intervention Group clearly demonstrate that it is possible to bring about some behaviour change among the families, and that this change has a beneficial effect upon the language comprehension of those babies. Their chances of success in literacy learning must have been, to an extent, improved. It is interesting to note that families raised no cultural barriers that might prevent the desired behaviour change. It seems that the only real barrier was, and is lack of knowledge. If a small intervention programme, six hours delivered by facilitators with one day of training themselves, can bring about moderate gains, even though that programme was implemented when the babies were much older than ideal, how much more could be achieved with a broadly-based national campaign, emphasising the need for a rich language environment from birth!
Unanswered questions
It is puzzling that, in general, comparison between the first and second KAP Surveys shows that there was only a little more learning among the Intervention Group mothers than among the Control Group ones. Why did the Control Group mothers learn at all, as there was no intervention in their communities? Early Childhood Development is a big issue in Tanzania at present, and there are many NGOs and other agencies working in the field, so it is possible that mothers received some information from another source. However, as no other current intervention places its emphasis on the importance of a rich language environment for babies during the first year of life, it seems unlikely that this would have been a large factor. It is perhaps

43
ZUMM Research Report December 2015
more likely that, despite the Control and Intervention communities being geographically apart, there was some communication between them, as mentioned earlier. Of course, had the study included an additional 1000 babies to obtain a baseline figure for the LCT, it would have been possible to quantify this leakage effect.
A bigger question is why the Intervention Group mothers appear to have acquired less knowledge than might have been expected, despite their attendance at the capacity-building programme, and extraordinarily, despite their behaviour change and the enhanced language comprehension of their children. The authors can only speculate, based on their own experience of several years living in Tanzania, and an intimate knowledge of the education system and its challenges. The intervention programme (see Appendix 2) used a wide range of teaching and learning strategies, including a great deal of demonstration, role-play, hands-on experience, DVD viewing, discussion and only a small amount of ‘lecturing’. It seems that the more active aspects of the programme have been well absorbed, while the talking has not. There often seems to be a disconnect between knowledge and action, which seems strange, but appears to be a consequence of an education system and a culture that, until recently, has not encouraged questioning, drawing inference, and challenging. There is relatively little in the education system that promotes the application of learning from one situation to others; this is evident in a range of environments. It appears that in informal situations, people learn by copying and by doing; in school they undoubtedly often still learn by rote, despite several years of the Government’s trying to implement a paradigm shift to student-centred, interactive teaching and learning. It seems that the mothers who made progress did so by experiential learning. If this is so, it should influence the design of any national campaign.
Many of the questions asked in the KAP Surveys concerned newborn and very young babies. These would not be seen by the mothers as relevant by the time of the second round of visits, because the children were by now over 18 months old, no longer young babies. The mothers had had no opportunity to try out talking to a newborn since learning that it was desirable to do so. The learning had not been reinforced by action, and perhaps that is one reason why it was not retained.
In KAP 1 q.7C (KAP 2 q.6C), (Table 10) “How much do you talk to your baby while washing/dressing him?” there is a significant shift up the scale, but only in the Intervention Group. This means that the mothers report they are talking more to their babies during this activity. It is interesting to note that washing and dressing a baby is one of the activities demonstrated in some detail, and practised in role play, during the intervention sessions. A similar improvement in practice by the IG was seen in the next question “How much do you talk to your baby while doing your daily activities?” Again, this had been modelled during role play in the training.
It is instructive to note that KAP1 q.9H the intervention produced no significant change in the proportion of mothers who believed that “If my baby learns to talk early, then he/she will be more successful at school”. This had been a major focus of the training, in the belief that it would motivate behaviour change. The results suggest that most mothers already believe this, but apparently with a different view of what is meant by ‘baby’ and ‘early’, as demonstrated by the very small number of words spoken to young babies. Those who do not believe it require more than information, if they are to be convinced.
It can be seen from KAP1 qs. 10E and 10F (Table 18) that in both there has been an increase in the proportion of Intervention Group mothers who agree, erroneously, with the statements: “I can help my baby to speak well if I correct the mistakes he makes” and “It is important to make a baby repeat the correct word if he makes a mistake”. Research has shown that such behaviour is counter-productive, as it seems to discourage the baby from trying to speak. It is difficult to explain the KAP results; maybe the mothers, having grasped the general principles of the importance of early language development, failed to remember that they had been told that this was not the way to help the child. Equally, it is possible that they failed to understand the question clearly, or that the point was not put across well at the intervention sessions. This does emphasise the need for key messages to be clearly explained, and demonstrated, several times.
It is likely that the progress of all the Intervention Group mothers, and therefore of the infants, would have been more marked if the study had proceeded on time, when the babies would have been at the optimum age to benefit from an enriched language environment. This can only be surmised; it has been discussed in

44
ZUMM Research Report December 2015
the section entitled ‘Challenges’ above. It is also possible that the messages were not reiterated often enough. Time constraints meant that most points could be made only once, apart from the key messages, although facilitators were asked to recap at the beginning of sessions two and three.
Recommendations
The overarching recommendation is that the key messages of the importance of talking to babies very much, and in the right way, from birth, should be disseminated as widely as possible. Talking to babies is completely free, and rewarding to the parents, because the babies respond to being talked to by smiles, gestures and sounds. The challenge is how to reach them, especially the rural poor, who number between 70% and 80% of the population, but whose communication media are not as well developed as those of the urban population. The most obvious starting place would be a mass media campaign, especially using radio, which is accessed by most of the population (34% of the mothers reported that radio had been one of their main sources of information about caring for their baby). Of course, the evidence of the practical, experiential nature of the learning of the mothers in the study, indicates the importance of any media campaign being practically based, not information based. The effectiveness of such a media campaign would be much enhanced if it were to be combined with the further initiatives recommended below.
Next, and more importantly, there is an urgent need for training programmes and materials to be developed and published in order to train health and education professionals, local leaders and faith leaders, all of whom are well-respected and listened to in the community. Nurses are an important target group, in view of the fact that 74% of mothers identified clinic staff as one of their main sources of childcare information. These materials should include short teaching and learning films, and the focus should be on experiential learning, which has been shown to be more effective than words. Provided with appropriate resources, these professional people and local leaders would be equipped to cascade knowledge, and especially skills, to the families in their communities. It has been observed that a significant number of families are so impressed by the effects of such intervention that the ‘news’ is quickly spread at local level; this would ensure sustainability. Tanzania is a low income country and so it is important that materials should be made available free of charge. Therefore the establishment of a website, carrying information and all the available resources, is strongly recommended.
Finally, a strenuous programme of advocacy among Government, both national and local, the international development community, Civil Society Organisations and faith groups is recommended, to promote the key messages and to encourage uptake and use of training resources. This should include advocating the introduction of a short programme (of, say, three lessons) for upper primary school children, (12-14 years) who spend much of their time looking after younger siblings, who can take the message home to their parents, and who will soon become the next generation of parents themselves. Many Tanzanian young people do not have any education beyond primary school, and according to the Tanzanian Demographic Survey (2010) 44% of young women are pregnant or have already given birth by the time they are 19 years old. There are about 49,000 live births in Tanzania each year.
At every stage, putting the key messages of ZUMM into practice in families and in communities sets up a ‘virtuous circle’: first, the babies reward the parents by responding to being talked to; the babies become happier, fathers become proud of their babies and more involved, increasing the happiness of the family; then people begin to notice now ‘intelligent’ and alert the babies are; then the babies begin to talk early. Some years later, these same babies, who have enjoyed a rich language environment from birth, will go to school and enjoy success in literacy learning. All of these steps will reinforce the importance of talking to babies, convince new parents, and spread the message. The longest-term benefits will be for the adult future of these children and for the economy of the nation.
Urgent action is strongly advocated to spread this behaviour change. It costs parents nothing to give this precious gift to their children, but they do need to hear the information and to be encouraged to put it into practice. At the national level this recommendation, if accepted, would be an extremely cost-effective way of improving the educational achievement of Tanzania’s children and enabling them to achieve more of their human potential.

45
ZUMM Research Report December 2015
APPENDIX 1: Knowledge, Attitudes & Practice Surveys 1 & 2
(KAP Surveys 1 & 2 are identical, except for the omission of question 1 from KAP 2, which means that the numbers in KAP 2 are one lower than in KAP 1. An extra question (10) was added to KAP 2. Both surveys were administered, by interview, in Kiswahili.)
ZUMM Research and Intervention Project: KAP Survey 2
Researcher: ___________________ Ward: ______________ Village: _______________
Please ask the mother or main carer the questions below and record the answers in the spaces provided. It is most important that she knows that she should ask you to explain if she is not sure what the question means, and that you should make it clear to her. Read out only the words in bold. Do not suggest answers to the mother.
1. At what age do you think that a baby begins to hear sounds? (in the box below the answer given)
before birth at birth 1 month 2-4 months 5-6 months
2. What age should a baby reach before a mother starts talking to him/her using many words and sentences? (in the box below the answer given)
before birth at birth 1-5 months 6-11 months 1 year or later
3. At what age do you expect a child to start saying single words with meaning? (in the box below the answer given)
0—6 months 7—12 months 13—18 months 19—24 months 2 years or later
4. How many different words would you expect a child to say when he/she becomes two years old? (in the box below the answer given)
0—10 11—20 21—40 41—60 more than 60
5. At what age do you expect a child to start putting 2 or more words together to make a meaningful phrase or sentence? (eg. ‘Juma maji’ meaning ‘Ninataka maji’) (in the box below the answer given)
6—12 months 13—18 months 19—23 months 2 - 2½ years over 2½ years
Family Number Family Name Who did you ask these questions to? e.g. mother

46
ZUMM Research Report December 2015
6. How much do you talk to the baby during the following activities? (in the box for the answer given)
ACTIVITY never a few words some of the time
most of the time
all of the time
a when he cries
b while feeding
c while washing/dressing baby
d while doing your daily activities at home
e while carrying baby on your back
f while sitting with the family
g while talking to friends/neighbours
7. Do you think it is important for parents/carers to talk to babies who are less than 3 months old, using many words and sentences? (in the box for the answer given)
Yes No
8. Please read each of the following statements to the mother/carer and ask her whether she agrees, or disagrees with the statement or is not sure or doesn’t know (in the column for the answer given)
STATEMENT Agree Disagree
Don’t Know
a It is possible to encourage a baby to walk early
b It is possible to encourage a baby to talk early
c My baby will talk when he/she is ready; there is no need for me to help him/her
d It is more important to encourage a baby to walk early than to talk early
If the mother/carer agrees with d then please get answers to e and f
e I prefer my baby to walk early because then I do not need to carry him/her all the time
f I prefer my baby to walk early so that he/she can play with other children
If the mother/carer disagrees with d then please get answers to g and h
g I prefer my baby to talk early because he/she can tell me what he/she needs
h If my baby learns to talk early, then he/she will be more successful at school
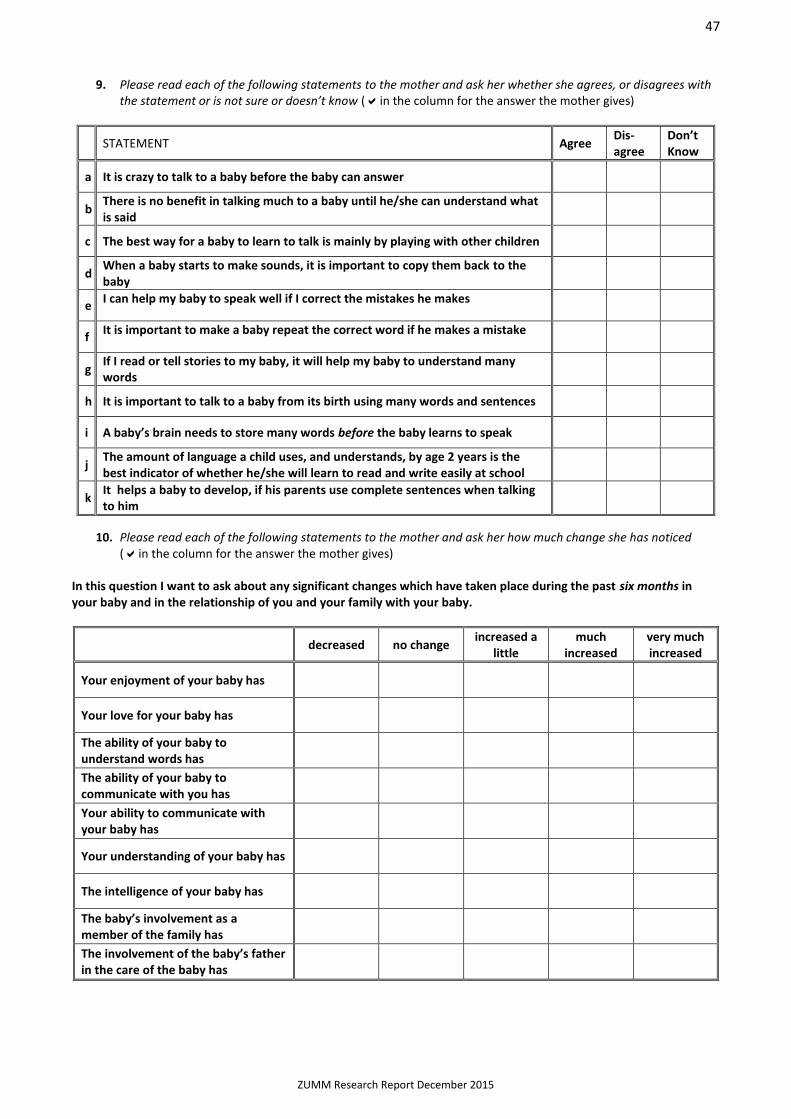
47
ZUMM Research Report December 2015
9. Please read each of the following statements to the mother and ask her whether she agrees, or disagrees with the statement or is not sure or doesn’t know (in the column for the answer the mother gives)
STATEMENT Agree
Dis-agree
Don’t Know
a It is crazy to talk to a baby before the baby can answer
b There is no benefit in talking much to a baby until he/she can understand what is said
c The best way for a baby to learn to talk is mainly by playing with other children
d When a baby starts to make sounds, it is important to copy them back to the baby
e I can help my baby to speak well if I correct the mistakes he makes
f It is important to make a baby repeat the correct word if he makes a mistake
g If I read or tell stories to my baby, it will help my baby to understand many words
h It is important to talk to a baby from its birth using many words and sentences
i A baby’s brain needs to store many words before the baby learns to speak
j The amount of language a child uses, and understands, by age 2 years is the best indicator of whether he/she will learn to read and write easily at school
k It helps a baby to develop, if his parents use complete sentences when talking to him
10. Please read each of the following statements to the mother and ask her how much change she has noticed (in the column for the answer the mother gives)
In this question I want to ask about any significant changes which have taken place during the past six months in your baby and in the relationship of you and your family with your baby.
decreased no change increased a
little much
increased very much increased
Your enjoyment of your baby has
Your love for your baby has
The ability of your baby to understand words has
The ability of your baby to communicate with you has
Your ability to communicate with your baby has
Your understanding of your baby has
The intelligence of your baby has
The baby’s involvement as a member of the family has
The involvement of the baby’s father in the care of the baby has

48
ZUMM Research Report December 2015
APPENDIX 2: Intervention Programme Content
ZUNGUMZA NA MTOTO MCHANGA
Intervention Programme for Intervention Group
Overview
There are 3 sessions, each lasting about 2 hours (maybe slightly longer if many people want to contribute to discussion). They are spaced out over about 6 weeks from the first to the third session.
The group has up to 30 people (up to 3 from each of 10 families), and 2 facilitators working together.
All the content of the sessions, and most of the necessary teaching and learning materials are provided, but facilitators will be expected to collect some items (mostly waste materials) for practical sessions.
Mothers are given 1,000/= for each adult family member who attends (up to a maximum of 3), at the end of each session.
Facilitators must prepare the room and all necessary materials before the group members arrive.
All group members must write their name and sign the attendance sheet when they arrive.
It is important to keep to time, but if some people want to stay and continue the discussion, facilitators should stay so they can help to advise or answer questions.
Each team of 2 facilitators must complete a report form after each session. Session 1 (2 -2 ½ hours)
Activity Topic / Content Time (mins)
1.
Introductions
Facilitators, mothers, babies, others. 15
2. Discussion in small groups Feedback in whole group
What are the important things parents and carers should do for babies?
5
10
3. Whole group discussion
Do parents & carers talk to small babies? When? How much? Why not more?
15
4. Presentation by facilitator Questions
Show the leaflet and give out 1 copy per family. The importance of talking to babies. Why it is important.
10
10
5. Presentation by facilitator Introduction to how we can talk to babies. 5
6. Demonstration by facilitator How to talk to a baby (show by using one of the babies present).
10
7. Question the group members Discussion
What do the group members notice about how to talk to the baby?
10
8. Practical activity Discussion
Group members try talking to their babies. How did it feel?
15
9. Show DVD Ask group members to watch the DVD care-fully and think about what they have learned.
5
10. Summary by facilitator
Challenge group members: ‘Now that you know about talking to your baby, what will you do differently?’
10
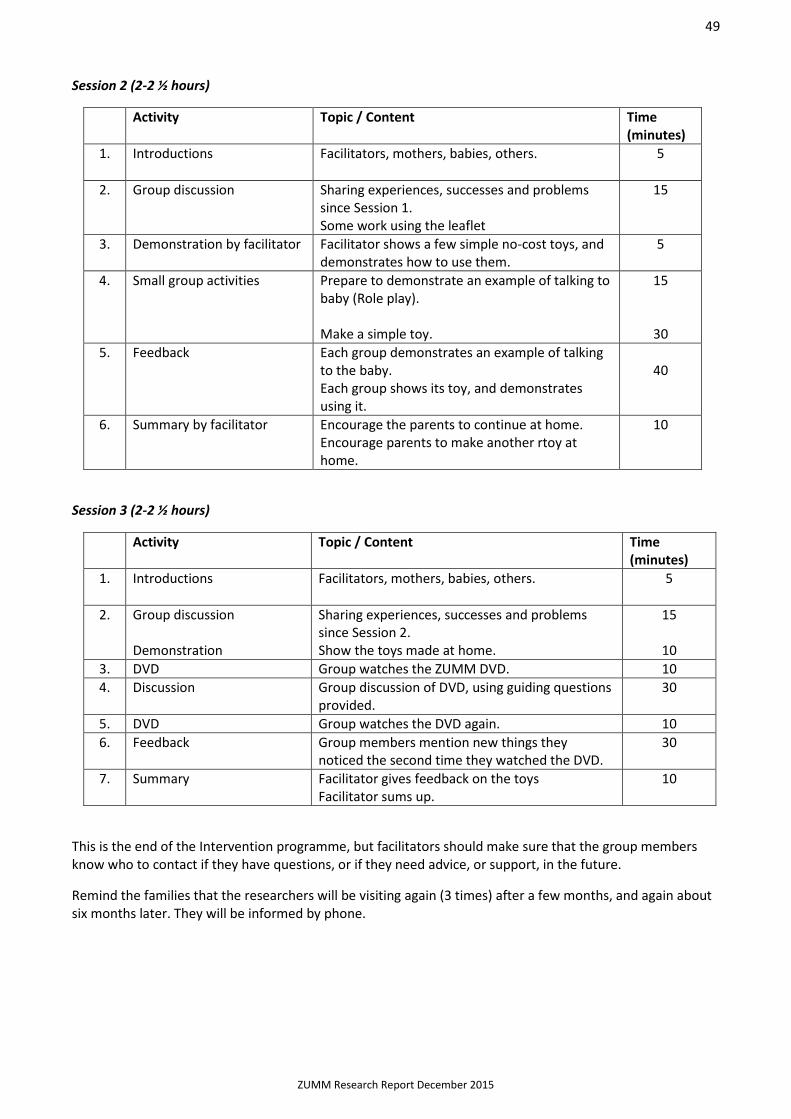
49
ZUMM Research Report December 2015
Session 2 (2-2 ½ hours)
Activity
Topic / Content Time (minutes)
1.
Introductions Facilitators, mothers, babies, others. 5
2. Group discussion Sharing experiences, successes and problems since Session 1. Some work using the leaflet
15
3. Demonstration by facilitator Facilitator shows a few simple no-cost toys, and demonstrates how to use them.
5
4. Small group activities Prepare to demonstrate an example of talking to baby (Role play). Make a simple toy.
15
30
5. Feedback Each group demonstrates an example of talking to the baby. Each group shows its toy, and demonstrates using it.
40
6. Summary by facilitator
Encourage the parents to continue at home. Encourage parents to make another rtoy at home.
10
Session 3 (2-2 ½ hours)
Activity
Topic / Content Time (minutes)
1.
Introductions Facilitators, mothers, babies, others. 5
2. Group discussion Demonstration
Sharing experiences, successes and problems since Session 2. Show the toys made at home.
15
10
3. DVD Group watches the ZUMM DVD. 10
4. Discussion Group discussion of DVD, using guiding questions provided.
30
5. DVD Group watches the DVD again. 10
6. Feedback Group members mention new things they noticed the second time they watched the DVD.
30
7. Summary Facilitator gives feedback on the toys Facilitator sums up.
10
This is the end of the Intervention programme, but facilitators should make sure that the group members know who to contact if they have questions, or if they need advice, or support, in the future.
Remind the families that the researchers will be visiting again (3 times) after a few months, and again about six months later. They will be informed by phone.

50
ZUMM Research Report December 2015
APPENDIX 3: Language Comprehension Screening Test
(This test was administered in Kiswahili)
In all sections except Section A, the response required is to point or touch, or follow the instruction. The child does not need to say anything.
All objects must be put away at the end of each section.
Each question can be said up to five times, then go on to the next one. Write 2 in the box if the child responds correctly the first time you ask. If he responds correctly on the 2nd to the 5th time, write 1 in the box. If he fails to respond, or responds incorrectly, write 0. Note that the scores are different in Section G (the last section).
If the child fails to respond correctly, or fails to respond at all, to every question in a section, stop testing. Note the number of the last question you asked, in the box at the end of the form.
Name of child ____________________________________Date of birth _____________
Boy/Girl _________ Family Number __________________ Total score _______ / 80
Name of tester_________________________________
Signature of tester_____________________________ Date of test______________
(for office use only)
Total score:
________ / 80
Date of test
____ / ____ / 20____
Age in years and
completed months
_______y_______m
ZUNGUMZA NA MTOTO MCHANGA
Language Comprehension Test for Infants
SCORING FORM

51
ZUMM Research Report December 2015
SECTION A (Responding to spoken language & imitating first 4 commonly used words) [10]
A
Tester instructs mother or carer to say:
Correct 1st
time [2], 2
nd – 5
th [1]
wrong or no response [0]
1. the child’s name (does he respond to his name, eg. turn, look at you, speak?)
2. Say ‘mama’ (score any attempt to imitate, eg. ma)
3. Say ‘baba’
4. Say ‘kaka’
5. Say ‘dada’
Section A Total
SECTION B (Responding to spoken language by imitating gestures) [10]
B Get out the dolly and the phone but keep hidden until questions 8 & 9 Tester instructs mother or carer to say:
If correct 1st
time [2], 2
nd – 5
th [1]
wrong or no response [0]
6. Clap hands (you clap your hands)
7. Wave bye-bye (you wave to the child)
(Hold the dolly in one hand and the phone in the other hand for 8 and 9)
8. Here is the dolly. (Hold the dolly up) Where is the dolly?
9. Here is the phone. (Hold the phone up) Where is the phone?
10 Here is your nose. (Touch child’s nose, then stop) Where is your nose?
Section B Total
SECTION C (Understanding names of body parts) [10]
C Tester instructs mother or carer to say:
Correct 1st
time [2], 2
nd – 5
th [1]
wrong or no response [0]
11. Where is your hair?
12. Where is your hand?
13. Where is your ear?
14. Where is your mouth?
15. Where is your foot?
Section C Total
SECTION D (Understanding names of familiar objects [a]) [10]
D Put objects on the floor, where the child can reach to touch or pick them up, in the following order: banana, spoon, water bottle, plate, cup Tester instructs mother or carer to say:
If correct 1st
time [2], 2
nd – 5
th [1]
wrong or no response [0]
16. Where is the cup?
17. Where is the spoon?
18. Where is the plate?
19. Where is the banana?
20. Where is the water?
Section D Total
SECTION E (Understanding names of familiar objects [b]) [10]
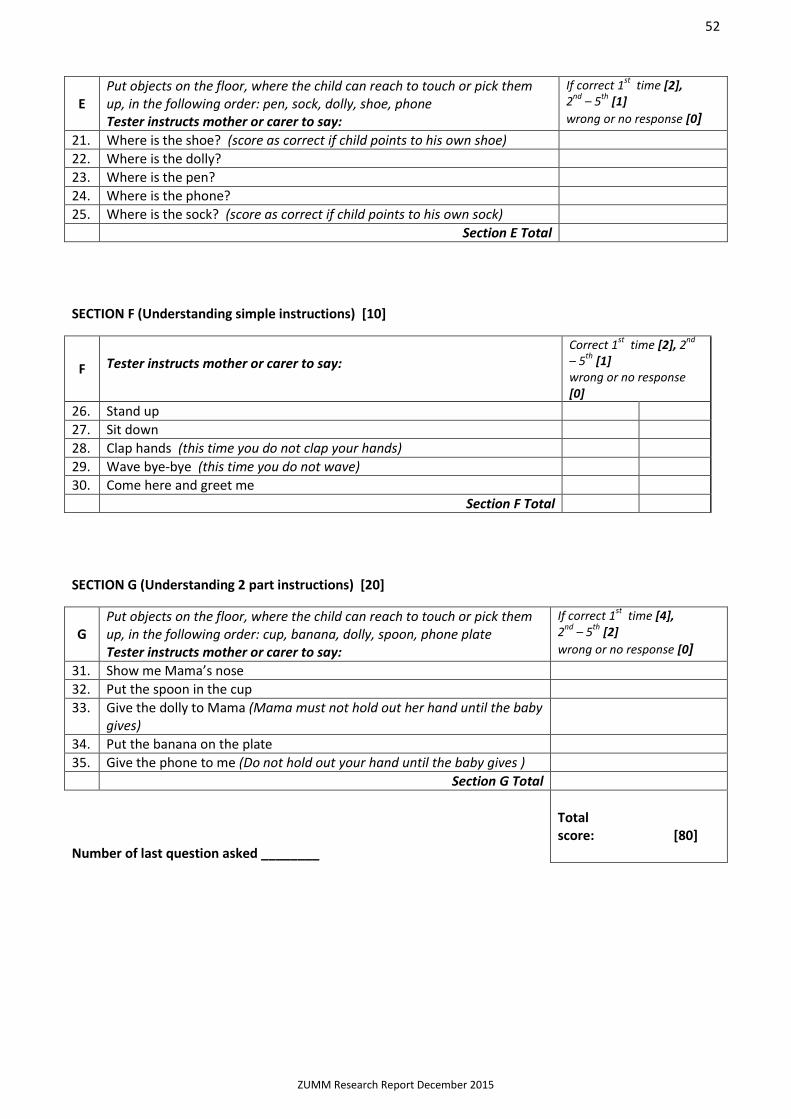
52
ZUMM Research Report December 2015
E Put objects on the floor, where the child can reach to touch or pick them up, in the following order: pen, sock, dolly, shoe, phone Tester instructs mother or carer to say:
If correct 1st
time [2], 2
nd – 5
th [1]
wrong or no response [0]
21. Where is the shoe? (score as correct if child points to his own shoe)
22. Where is the dolly?
23. Where is the pen?
24. Where is the phone?
25. Where is the sock? (score as correct if child points to his own sock)
Section E Total
SECTION F (Understanding simple instructions) [10]
F
Tester instructs mother or carer to say:
Correct 1st
time [2], 2nd
– 5
th [1]
wrong or no response [0]
26. Stand up
27. Sit down
28. Clap hands (this time you do not clap your hands)
29. Wave bye-bye (this time you do not wave)
30. Come here and greet me
Section F Total
SECTION G (Understanding 2 part instructions) [20]
G Put objects on the floor, where the child can reach to touch or pick them up, in the following order: cup, banana, dolly, spoon, phone plate Tester instructs mother or carer to say:
If correct 1st
time [4], 2
nd – 5
th [2]
wrong or no response [0]
31. Show me Mama’s nose
32. Put the spoon in the cup
33. Give the dolly to Mama (Mama must not hold out her hand until the baby gives)
34. Put the banana on the plate
35. Give the phone to me (Do not hold out your hand until the baby gives )
Section G Total
Number of last question asked ________
Total score: [80]

53
ZUMM Research Report December 2015
ACKNOWLEDGEMENTS
The authors are grateful to the following individuals and organisations, without whose support and willing involvement this study, and the Zungumza na Mtoto Mchanga initiative, would never have come into being:
Children in Crossfire International (Matthew Banks), Derry/Londonderry; Children in Crossfire, Tanzania (Alpha Mukama); Salum Mnjagila and colleagues at the Directorate of Adult and Non-formal Education, Ministry of Education and Vocational Training, Tanzania; members of the ZUMM Project Coordination Team, Dar es Salaam; local partner organisations: Childhood Development Trust Fund Network (CDTFN), Mvomero; Sharing Worlds Tanzania (SWT), Dodoma; Tanzania Home Economics Association (TAHEA), Mwanza; Tanzania Women’s Research Foundation (TAWREF), Moshi.
They also wish to thank Professor Margaret Snowling, President of St John’s College, Oxford, and Professor Charles Hulme, University College, London, for their advice and encouragement.
This study was kindly funded by UBS Optimus Foundation, Zurich, Switzerland.
BIOGRAPHICAL NOTE
Janet Townend is a speech and language therapist, specialist teacher in literacy and dyslexia, teacher trainer and author. David Townend taught chemistry at Eton College for 38 years, and was involved in many aspects of school life. Since retiring in 2006, they have worked as professional volunteer tutors and tutor mentors at a large Government Teacher Training College in Tanzania, and established the ‘Zungumza na Mtoto Mchanga’ (ZUMM) or ‘Talk to Your Baby’ initiative.

54
ZUMM Research Report December 2015
REFERENCES
Bleasedale, M. ‘No Way Out: Child marriage and human rights abuses in Tanzania’. Human Rights Watch. 2014 Blanden, J. ‘Bucking the trend – what enables those who are disadvantaged in childhood to succeed later in life?’. 2006. Cited in DfE/DoH ‘Supporting families in the foundation years’. London, UK: HMSO, 2011. Cain, K. and Oakhill, J. ‘Children’s comprehension problems in oral and written language’. Guilford Press, 2007. Hart, B. and Risley, T.R. ‘The early catastrophe: The 30 million word gap by age 3.’ American Educator, Spring 2003, pp. 4-9. Harvard University Centre on the Developing Child. ‘In Brief: the science of early childhood development’. www.developingchild.harvard.edu . 2007. Joseph Rowntree Foundation, ‘The importance of attitudes and behaviour for poorer children’s educational attainment’. London, UK: Joseph Rowntree Foundation, 2010. McGowan, M., Smith, L., Noria, C., Culpepper, C., Langhinrischen-Rohling, J., Borkowski, J. and Turner, L. ‘Intervening with at-risk mothers: supporting infant language development’. Child and Adolescent Social Work Journal, vo. 25, pp. 245-254. 2008. National Literacy Trust. www.literacytrust.org.uk Ritchie, SJ., Bates, TC. and Plomin, R. ‘Does learning to read improve intelligence? A longitudinal multivariate analysis in identical twins from age 7-14.’ onlinelibrary.wiley.com/doi.10.1111/cdev.12272 (accessed 12 09 2014) Roulstone, S.et al. ‘The role of language in children’s early educational outcomes’. London, UK: DfE, 2011. Shulz, S., Vouloumanos, A., Bennett, RH. and Pelphrey, K. ‘Neural specialisation for speech in the first months of life’. Journal of Developmental Science, Vol. 17, No. 5, pp. 766 – 774, September 2014. Stock CD. ‘The effects of responsive caregiver communication on the language development of at-risk pre-schoolers’. Oregon, USA: Eugene, University of Oregon, 2002. Sylva, K. et al. ‘Effective pre-school and primary education 3-11 project: pre-school, school and family influences on children’s development during Key Stage 2 (age 7-11)’. 2008. Cited in DfE/DoH ‘Supporting families in the foundation years’. London, UK: HMSO, 2011. The Lancet, Engle et al. Child Development 2. ‘Strategies for reducing inequalities and improving developmental outcomes for young children in low-income and middle-income countries’ www.thelancet.com September 23, 2011 UK Government Communication Network. ‘Communications and behaviour change.’ www.coi.gov.uk 2009 United Republic of Tanzania National Bureau of Statistics and IFC Macro. ‘Tanzania Demographic and Health Survey 2010, page 36. Dar es Salaam. 2010 Uwezo Tanzania. ‘Are Our Children Learning? Annual Learning Assessment Report 2011. www.uwezo.net . 2012 Zuckerman, B. ‘Reach out and read: evidence based approach to promoting early childhood development’. 2010.
Related Documents


