Zuari Agro Chemicals Limited Investors Presentation- Dec’17

Welcome message from author
This document is posted to help you gain knowledge. Please leave a comment to let me know what you think about it! Share it to your friends and learn new things together.
Transcript

Zuari Agro Chemicals Limited
Investors Presentation- Dec’17

Table of Contents
2
1. Company overview
2. Industry overview
3. Key investment highlights
4. Growth strategies
5. Financial and operational performance
6. Appendix

Zuari: Overview
One of India’s largest Phosphatic Fertilizer Company
Strategically located plant to cater all India
demands
One Stop Solution for Agri Inputs with Retail
Stores
One of India’s Major Player in Water Soluble Fertilizers
New /proposed States
3Source: Company, ICRA

1967 1973 1994 1995 2002 2007 2011 2012 2014 2015 2017
Commissioning of the Urea Plant
at Goa
Set up Zuari Seeds Ltd.
Acquired Paradeep
Phosphates Ltd.
Set-up Zuari Rotem Specialty Fertilizer Limited
Acquired stake in phosphate mine in Peru
Demerger of the Fertiliser undertaking
of Zuari Industries into Zuari Holdings Limited
Commencement of Agri-Sciences &
Retail Business
Open offer for MCFL; ZACL is a
part of promoter group
Promoted Zuari Agro Chemicals
Pre-Demerger Period
Post-Demerger Period
First Plant of Chambal Fertilizers
commissioned
MCFL becomes subsidiary of
ZFCL
Merger approved for three 100% subsidiaries
4
Evolution of the Company

5
Zuari Agro Chemicals Limited (ZACL)
Zuari Maroc Phosphates
Limited (ZMPL)
MCFL
OCP Group
Paradeep Phosphates
Limited (PPL)
53.03%
50% 50%
80.45%
MCA Phosphates Pte Limited
Mitsubishi Corp.70%30%
30% equity stake in Fosfatos del Pacifico (Fospac), for developing a rock phosphate mine in Peru
Corporate Structure
5

Table of Contents
6
1. Company overview
2. Industry overview
3. Key investment highlights
4. Growth strategies
5. Financial and operational performance
6. Appendix

India Agri Overview
Agri has a significant share in Indian economy; India is a global producer in a large number of agri products
Agriculture account for 15% of GVA
7
Crop India’s Position
Rice 2nd largest producer; largest exporter in 2014
Wheat 2nd largest producer
Cotton 2nd largest producer
Fruits 2nd largest producer
Pulses Largest producer and importer of pulses
Vegetables 2nd largest producer
Spices World's largest producer and exporter
-3.6%
6.7% 6.8%
1.6%0.3%
6.5%7.2%
2.1%1.8%
6.3%7.5%
2.2%
Brazil China India United States
2016 2017E 2018E
Agriculture15%
Industry31%
Services54%
India is one of the fastest growing economies in the world
India has a leading position in most agri products
Source: ICRA

Indian Agri Industry Suffers From Low Productivity
Significant market opportunity, as productivity gap narrows over time
Low consumption of fertilizers, coupled with low mechanization leads to low crop yields
Pressure to improve crop yields, as share of rural population decreases, along with availability of per capita arable land
0.34
0.15
0.0
0.1
0.2
0.3
0.4
1995 2001
Per capita arable land (ha)
25% 28% 32% 33%
75% 72% 68% 67%
0%
20%
40%
60%
80%
100%
1999 2001 2011 2014
Population Split
Urban Rural
144
421
162 139
0
100
200
300
400
500
India China Brazil USA
India China Brazil USA
Yield (Kg) per hectare
Paddy Wheat Maize
India 3,622 3,030 2,752
China 6,749 5,048 5,998
Brazil 5,201 2,209 5,176
USA 8,487 2,944 10,733
Source: ICRA; Note: *Fertiliser Consumption/ hectare of arable land & land under permanent crops (Kg)
8

Multiple Reforms and Policies Which Provide Impetus to Agri Sector
GoI targeting to double farmer income by 2022
Higher rural incomes would be positive for agri-inputs
Direct Benefit TransferWould lead to reduced working capital, increase in
digitization ,and better customer targeting
Soil Health CardBalanced use of fertilizers
Financial Inclusion (Pradhan Mantri Jan Dhan Yojna)
Farmers entering mainstream economy
Irrigation CoverageReduces monsoon related risk
DigitizationMore informed farmers, Innovation in farming
Pricing Decontrol / Nutrient Based subsidyMarket linked pricing for NPK fertilizers
9Source: ICRA

GoI Targeting to double farmer Income by 2022
GoI Targeting to
double farmer
Income by 2022
High value cropsHVC’s provide for farmers to grow their farm incomes
Significant differential in productivity for staple crops and HVCs
Improving productivityTechnology to improve
area cover under irrigation
Biotechnology (seeds)Integrated water use
policy
Higher crop intensityImprovement in irrigation facilities
3 crops in a year
Improving resource use efficiency
Promotion of balanced use of fertilisers • Soil Health Cards• DBT
10Source: ICRA
Price discovery for farmers
Integration of mandis across states to one electronic platform i.e. National Agricultural Market (e-NAM) network, via revision of the APMC Act

DBT – Overview and Key Benefits
Manufacturer Retailer PoS Transaction Farmer
Dept of Fertilizers
Purchase info Triggered
Subsidy disbursement to manufacturer
DBT – Overview
• Subsidy to manufacturer would be paid on a weekly basis
• More informed farmers is expected to result in improve nutrient usage and will promote balanced application of
fertilizers
• Promotes digitization
• Working capital of manufacturers to reduce in phase 2 of DBT (subsidy directly to farmer)
DBT – Key Benefits
11Source: ICRA,Company

Other Reforms and Policies
• Balanced use of fertilizerso GOI has issued ~98 mn soil health cards till Nov 2017
Soil Health Card
Financial Inclusion (Pradhan
Mantri Jan Dhan Yojna)
• Farmers entering mainstream economy• Key initiatives/target of the policy includeso Bank Account for each householdo Crop Insurance & Access to credit
• Reduces monsoon related risk• GOI has set up long term Irrigation Fund (LITF) o As per GOI estimates Rs 29,000 Cr may be required through LTIFo GOI has already approved raising Extra Budgetary Resources of ~Rs 9,000 cr during FY18
Irrigation Coverage
• Digitization leads to higher information amongst farmers, which is expected to lead to higher efficiencies in the agri sector & Innovation in Farming
Digitization
12Source: ICRA, GoI , Company

Subsidy Reform in NPK/DAP Fertilizers
50%62% 66% 66% 68% 71%
50%38% 34% 34% 32% 29%
FY 2012 FY 2013 FY 2014 FY 2015 FY 2016 FY 2017
% share of Avg. MRP of Mfg Complex Fertilizers % of Avg. Subsidy of Mfg. Complex Fertilizers
Share of subsidy in realization has declined over the last 5 years on account of decontrol in NPK/DAP in ZACL
• We believe shift towards Nutrient based subsidy in NPK/DAP has led to:
o Reduction in working capital as the quantum of subsidy receivables has declined
o Producers have higher flexibility to fix farm gate prices
o Shift from subsidy based pricing to market driven pricing
13

Declining Imports in FertilizersP
ho
sph
ate
Ure
a
10.66.1 3.7 4.1 6.2 4.9 3.1
11.8
9.810.5 11.3
12.2 12.2
6.5
22.4
15.914.2 15.4
18.4 17.1
9.6
FY 2012 FY 2013 FY 2014 FY 2015 FY 2016 FY 2017 H1 FY18
Imports Production
7.8 8.0 7.1 8.7 8.5 5.5 3.2
22.0 22.6 22.7 22.6 24.524.2
11.5
29.8 30.6 29.8 31.3 33.0 29.7
14.7
FY 2012 FY 2013 FY 2014 FY 2015 FY 2016 FY 2017 H1 FY18
Imports Production
14Source: ICRA
Fertilizer imports have been declining in both Urea and NPK
(Mn Tons)
(Mn Tons)

Table of Contents
15
1. Company overview
2. Industry overview
3. Key investment highlights
4. Growth strategies
5. Financial and operational performance
6. Appendix

Key Investment Highlights
16
• Strategically located manufacturing facilities, with long standing tie-ups for raw material sourcingo Strategically located manufacturing facilities o OCP is a strategic partner in PPLo Tie-ups for key raw materials from likes of OCP, Arab Potash Company, Muntajat and Canpotex
• Diversified product portfolio with focus on DAP/NPK Complex fertilizerso Zuari product portfolio consists of diverse nutrientso Higher pricing flexibility in DAP/NPK compared to Urea
1
• Strong marketing & distribution networko Pan-India distribution network of ~8,000 dealers and ~75,000 sub-dealers with access to ~23 mn farmerso Well established brand (Jai Kisaan)o Over 110 stores already operational under the Jai Kisaan Junction format
2
3
• Strong parentage coupled with a highly experienced leadership team
5
• Zuari to benefit from structural reforms like DBT, Soil Cards, Gas Pooling
4

Diversified Product Portfolio With a Focus on DAP/NPK Complex Fertilizers
1
Particulars DAP/NPK Urea SSP SNFWater
SolublesABC
1Zypmite Total
ZACL 860 399 200 24 1,483
Paradeep 1,300 60 1,360
MCFL 260 380 21 12 18 691
Total 2,420 779 200 21 36 18 60 3,534
Key capacities (ktpa)
Sales volume by products (FY17)
• The group has a diversified product portfolio which
includes Urea, DAP/NPK, Plant Nutrition, Zypmite and
other products
• Zuari focuses on Complexes (DAP/NPK) compared to
Urea, as there is higher pricing flexibility in DAP/NPK
compared to Urea
• As a strategy, we supplement our production by trading,
which account for ~25% of total sales
DAP/NPK73%
Urea24%
Plant Nutrition Products
2%
Others1%
17Source: Company; Note: 1Ammonium Bi-Carbonate
Zuari product portfolio consists of diverse nutrients

Strategically Located Manufacturing Facilities, With Strong Tie-ups For Raw Material Sourcing
2
Goa • Urea: 399 ktpa• DAP/NPK: 860 ktpa
Paradip• DAP/NPK: 1,300 ktpa• Phosphoric Acid: 300 ktpa• Zypmite: 60 ktpa
Mangalore• Urea: 380 ktpa• DAP/NPK: 260 ktpa• SNF: 21 ktpa• ABC: 18 ktpa
Mahad and Baramati• SSP: 200 ktpa• Water Soluble: 24 ktpa
Key agreements raw material sourcing
Material Key Suppliers
Rock PhosphateLong term agreement with OCP S.A. Morocco, which is also a shareholder in PPL
Phosphoric Acid Long term agreement with IMACID
Rock Phosphate mine in Peru
Off-take agreements for up to 75% of output
Ammonia Muntajat , SABIC
Potash Arab Potash Company, Canpotex, Uralkali
Strategically located manufacturing facilities
18Source: Company

Strong Marketing & Distribution Network (1/3)3
Jai Kisaan & Navratna
Jai Kisaan & Mangala
Key brands of Zuari and geographic reach Pan-India distribution network with strong farmer connect
• Strong pan India network, which provides access to key
growth markets
o Over ~8,000 dealers and ~75,000 sub-dealers,
providing access to ~23 mn farmers across India
• Strong brand recall and relationship with farmers on the
back of multiple initiatives
o Key farmer initiatives include soil testing labs, farm
demonstration, Mobile App, GAIN (Goa Agricultural
Initiative), etc
• Jai Kisaan brand is owned by Zuari
Key Brands
Brand Company Key Markets
Jai Kisaan ZACLGoa, Maharashtra,AP, Karnataka and TN
Jai Kisaan–Navratna PPLOrissa, West Bengal, Chattisgarh, Bihar, UP, AP, North East
Jai Kisaan-Mangala MCFLKarnataka, TN, AP, Telangana, Kerala
19Source: Company

Strong Marketing & Distribution Network (2/3)3
• Direct relationship with farmers• One stop solution to farm needs• Large Agri-input basket• Parallel marketing network• Platform for new product/ services launch such as Bio-fertilizers and • Customer retention and product availability
Concept
Jai Kisaan Junction
Positioning
• Key value proposition: convenience, reliability and experience • Assurance of right quality/ quantity• High level of service and knowledge• Enhanced buying experience due to better interiors and good
ambience at the stores• Also provide add on service like information on soil health
Business Model
• Located at high potential area or Taluka palace• Typical showroom space of 500-750 sq.ft.• Audio-visual and internet supported aids• Each retail store is supported by an agronomist
Synergies• Synergies with existing channel partners• Extension of knowledge of scientific farming to the farmers which will
help in strengthening the brand
Over 110 stores already operational in Karnataka and Maharashtra
Store format
20Source: Company
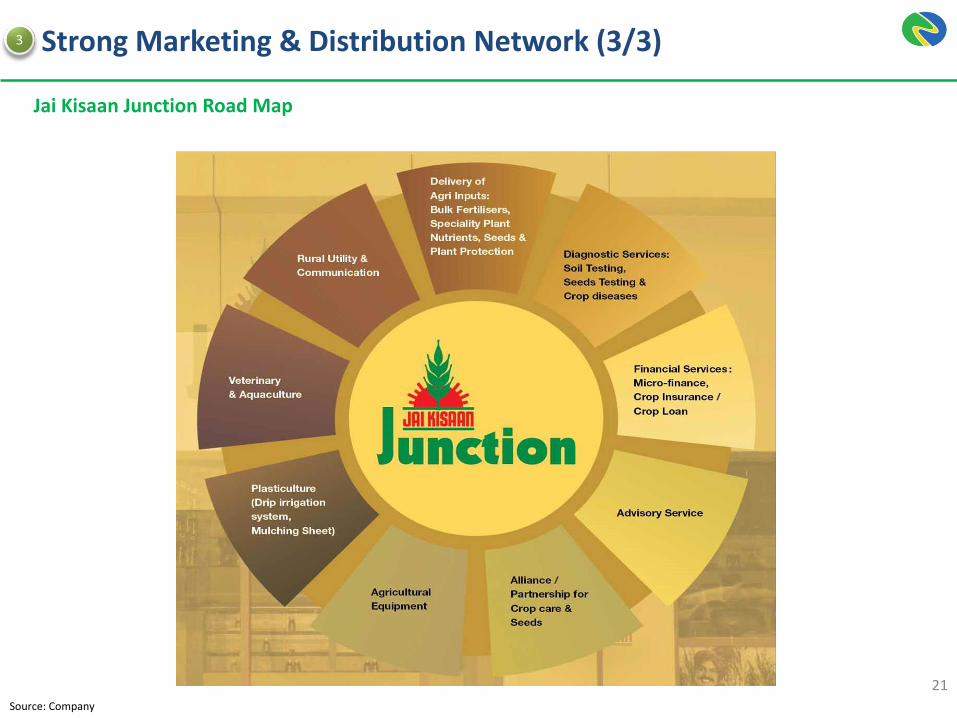
Strong Marketing & Distribution Network (3/3)3
21Source: Company
Jai Kisaan Junction Road Map

Zuari To Benefit From Structural Reforms in the Sector4
22
GoI targeting to double farmer income by 2022Higher rural incomes would be positive for agri-inputs
Direct Benefit TransferWould lead to reduced working capital, increase digitization ,and better customer targeting
Soil Health CardBalanced use of fertilizers
Financial Inclusion (Pradhan Mantri Jan Dhan Yojna)Farmers entering mainstream economy
Irrigation CoverageReduces monsoon related risk
DigitizationMore informed farmers, Innovation in farming
Pricing Decontrol / Nutrient Based subsidyMarket linked pricing for NPK fertilizers
1
2
3
4
5
6
7
Key Policies
and Reforms
in the sector
Source: Company

Strong Parentage Coupled With Experienced Leadership Team (1/2) 5
Promoter group
• The Adventz Group is headed by Mr S K Poddar. Mr. Poddar was also instrumental in promoting Gillette India Ltd., a venture with the renowned ‘The Gillette Company,’ USA and was its Founder Chairman since 1984, before relinquishing the position in Dec.2013
Saroj PoddarChairman
23
Key Management
• Mr. Akshay Poddar, Director of Zuari Agro Chemicals Ltd. Mr Akshay Poddar is an alumnus of the London School of Economics & Political Science, University of London and graduated with Honours in Accounting & Finance
• Mr. Sethy is a Chartered Accountant having 40 Years of experience. He is a professional with strategic and operational experience in managing and building businesses which includes start-ups, expansion and development in existing entities
• Mr. Krishnan is an alumnus of BITS Pilani and has 25 years of corporate experience in fertiliser, energy and cement sectors. He has been associated with the Adventz Group for over two decades
• Mr. Sandeep Agrawal is a qualified Chartered Accountant, Cost Accountant and Company Secretary with a corporate career spanning over 22 years in various capacities across finance and allied functions. Before joining Adventz, he worked with the Vedanta Group for 15 years
Akshay PoddarDirector
Sunil Sethy,MD-ZACL & PPL
Suresh KrishnanMD- MCFL
Sandeep AgrawalGroup CFO-Agri Business
Source: Company

• Mr. Gandhi post-graduated in Personnel Management from Xavier Institute of Social Service,
Ranchi in 1977.He has worked for organizations such as Tata Steel, Bechtel and Punj Lloyd Ltd.
before joining the Adventz Group.
P.K. Gandhi,
Group President,
Human Resources
• With over 35 years experience in Agri business, Mr. Kapoor has worked in companies like Indian
Potash Limited, Chambal Fertilizers and other companies in the seeds business .Mr Kapoor's
professional experience includes diverse functional responsibilities in finance, sales and
marketing, supply chain and international trade.
Naveen Kapoor,
President- Agri
Business
Nitin M Kantak ,
Chief Technical
Officer
• Mr. Kantak is a Chemical Engineer from the University Department of Chemical Technology
(UDCT), Mumbai. He has more than 33 years of experience in Nitrogenous and Phosphatic
fertilizer industry in Plant Operations, Project Management & Commissioning and Technical
Services
V Seshadri
Vice President
Strategy• Mr Seshadri is a qualified Chartered Accountant, Cost Accountant and Company Secretary.He has
previously worked at J.K. Singhania Group, RPG, Max India, Chambal Fertilisers and DCM
Shriram before joining Zuari
24
5 Strong Parentage Coupled With Experienced Leadership Team (2/2)
Source: Company

Table of Contents
25
1. Company overview
2. Industry overview
3. Key investment highlights
4. Growth strategies
5. Financial and operational performance
6. Appendix

Growth Strategies
Modernization and capacity increase of Urea plant of ZACL
1
Increase footprint of “Jai Kisaan Junction”
stores
2
• Zuari is looking to increase the footprint of Jai Kisaan
Junction, by expanding the number of stores
• ~110 stores are currently operational which the
company is looking to increase to over 1,000 in the
next 2-3 years
• Zuari is undertaking a ~Rs 1,350 Cr project to increase the
energy efficiency of its Ammonia/Urea plant in Goa
• As part of the project, Urea capacity of the plant will also
increase by 220ktpa
New granulation lines and phos acid
capacities
6
Increase focus on NPK products
3
Increase farmer connect
5
Improve share of non regulated products
4
26
• Introduction of new NPK grades to suit specific
crops
• Developing an integrated nutrient structure
resulting in a balanced use of fertilisers
• Pan India market expansion for SPN and augmenting
portfolio of SPN and Crop Protection chemicals
• Exploration & identification of new products through
tie ups with global players
• Increased focus on farmers
• Key Initiatives such as soil testing labs, farm
demonstration, Mobile App, GAIN
• Support farmers through Agronomist, who can help
farmers make data based timely decisions
• Brownfield expansions at MCFL and PPL
Increasing operational efficiencies
7
• AT Kearny is helping the company with a multi-year
business transformation exercise , to increase
operational efficiency and marketing

Table of Contents
27
1. Company overview
2. Industry overview
3. Key investment highlights
4. Growth strategies
5. Financial & Operational Performance
6. Appendix

Financial Overview FY15 - H1 FY 18
28
1.5 1.5 1.5 0.8
1.3 1.5 1.3
0.7
0.8 1.1 1.1
0.5
3.54.1
3.9
2.0
0.0
1.0
2.0
3.0
4.0
5.0
FY 2015 FY 2016 FY 2017 H1 FY 2018
ZACL PPL MCFL
Sales Volume (mn tons) Revenue from Operations (Rs Cr)
5,508 5,280 3,932 2,021
4,159 4,798 3,697
1,944
2,577 2,982
2,502
1,399
12,243 13,061
10,131
5,364
0
5,000
10,000
15,000
FY 2015 FY 2016 FY 2017 H1 FY 2018
ZACL PPL MCFL
12
-9
205443 65 87 71
38
-240
19 17
-24
-99 -114-60
-300
-200
-100
0
100
200
FY 2015 FY 2016 FY 2017 H1 FY 2018
ZACL PPL MCFL ZFCL
PAT (Rs Cr)
Source: Company; Note: 100% numbers of PPL and MCFL have been used for comparison purpose only. FY 2015 numbers are based on IGAAP & FY 2016 ,FY 2017 & H1 FY 2018 are based on IND ASZFCL Net Debt includes the ICD from ZACL ( FY 2015-INR 218 Crs, FY 2016- 545 Crs, FY 2017-655 Crs, HI FY 2018-692 Crs)
Net Debt
2,381
3,351
2,768 2,690
1,921
2,9372,545
1,910
1,0761,374 1,135
1,020
256
789 890 916
0
1,000
2,000
3,000
4,000
FY 2015 FY 2016 FY 2017 H1 FY 2018ZACL PPL MCFL ZFCL

Zuari Agro Chemicals Limited- Consolidated Profit and Loss
For the year
ended
31 March 2017
For the year
ended
31 March 2016
REVENUE
Revenue From Operations 6,415 7,641
Other Income 76 62
Total Revenue 6,492 7,703
EXPENSES
Cost of Raw Materials Consumed 2,911 3,491
Purchases of Stock in trade 1,591 2,312
Changes in inventories of finished goods, stock-in-
trade and work in progress
12 72
Excise duty on goods 30 29
Employee Benefits Expense 161 152
Finance Costs 454 419
Depreciation and amortization expense 78 66
Other Expenses 1,246 1,312
Total Expenses 6,481 7,852
Profit/(loss) before share of profit/(loss) of
joint ventures, exceptional items and tax
10 (149)
Share of profit of joint ventures (net of tax) 33 18
Profit/(loss) before exceptional items and tax 43 (131)
Exceptional Items 64 26
Profit/(loss) before tax (22) (157)
Profit/(loss) for the year (44) (123)
Particulars
Audited Consolidated
INR Crores

Zuari Agro Chemicals Limited- Consolidated Balance Sheet
Mar'17 Mar'16
Non Current Assets
Property, Plant and Equipment 1,663.0 1,679.9
Capital work-in-progress 142.8 102.0
Other Intangible Assets 149.1 152.7
Financials Assets 890.1 904.9
Other Non Current Assets 164.1 107.4
Sub Total 3,009.0 2,946.9
Current Assets
Inventories 708.5 727.8
Receivables 3,462.7 4,100.4
Other Current Assets 358.8 247.4
Sub Total 4,530.0 5,075.7
Total Assets 7,539.0 8,022.5
Equity Share Capital 42.1 42.1
Other Equity 1,628.9 1,660.5
Total Equity 1,670.9 1,702.6
Non Current Liabilities
Borrowings 493.0 540.8
Other Non Current Liabilities 50.2 42.0
Sub Total 543.2 582.8
Current Liablities
Borrowings 3,627.9 4,380.7
Trade Payables 1,087.0 873.5
Other Current Liabilities 610.0 482.9
Total Liabilities 7,539.0 8,022.5
Particulars
Audited Consolidated Balance Sheet
INR Crores

Table of Contents
31
1. Company overview
2. Industry overview
3. Key investment highlights
4. Growth strategies
5. Financial and operational performance
6. Appendix

Zuari Agro Chemicals Limited- Standalone Profit & Loss
32
INR Crores
Particulars H1 FY 2018 FY 2017 FY 2016 FY 2015
REVENUE
Revenue From Operations 2020.8 3,932.5 5,280.1 5,523.7
Other Income 68.2 130.2 130.4 48.7
Total Revenue 2,089.0 4,062.7 5,410.5 5,572.4
EXPENSES
Cost of Raw Materials Consumed 956.9 1758.6 2451.1 2740.0
Purchases of Stock in trade 808.2 1037.3 1659.0 1505.2
Changes in inventories of finished goods, stock-in-
trade and work in progress
(312.1) 36.6 74.4 36.6
Excise duty on goods 2.2 14.7 16.6 16.1
Employee Benefits Expense 42.8 80.9 87.5 82.5
Finance Costs 128.4 291.5 300.7 232.8
Depreciation and amortization expense 18.1 34.6 32.0 17.9
Other Expenses 362.1 713.9 799.7 920.6
Total Expenses 2,006.6 3,967.9 5,421.0 5,551.7
Profit/(loss) before exceptional items and tax 82.5 94.7 (10.6) 20.7
Exceptional Items - (64.3) (26.1) -
Profit/(loss) before tax 82.5 30.4 (36.7) 20.7
Profit/(loss) for the year 53.8 19.6 (9.0) 12.4
Source: FY 2015 numbers are based on IGAAP & FY 2016 ,FY 2017 & H1 FY 2018 are based on IND AS

Zuari Agro Chemicals Limited- Standalone Balance Sheet
33
INR Crores
Particulars H1 FY 2018 FY 2017 FY 2016 FY 2015
Non Current Assets
Property, Plant and Equipment 403.4 372.6 367.5 264.7
Capital work-in-progress 106.9 129.2 88.8 97.8
Intangible Assets 1.9 1.7 2.1 1.3
Financials Assets 971.2 764.0 865.9 702.2
Other Non Current Assets 91.6 119.5 63.6 4.9
Sub Total 1,574.9 1,387.1 1,387.9 1,071.0
Current Assets
Inventories 716.4 374.7 424.4 557.9
Receivables 1,907.1 2,133.1 2,706.7 2,651.6
Other Current Assets 568.2 572.4 387.5 149.4
Sub Total 3,191.7 3,080.1 3,518.6 3,358.9
Total Assets 4,766.6 4,467.2 4,906.5 4,429.9
Equity Share Capital 42.1 42.1 42.1 42.1
Other Equity 815.1 780.7 747.2 761.3
Total Equity 857.1 822.8 789.3 803.4
Non Current Liablities
Borrowings 178.8 214.0 226.3 -
Other Non Current Liabilities 3.4 1.8 3.1 96.9
Sub Total 182.2 215.8 229.4 96.9
Current Liablities
Borrowings 2,463.2 2,468.3 3,105.6 2,382.0
Trade Payables 887.1 552.1 510.9 939.8
Other Current Liabilities 377.0 408.2 271.3 207.8
Total Liabilities 4,766.6 4,467.2 4,906.5 4,429.9
Source: FY 2015 numbers are based on IGAAP & FY 2016 ,FY 2017 & H1 FY 2018 are based on IND AS

Paradeep Phosphates Limited-Standalone Profit & Loss
34
INR Crores
Particulars H1 FY 2018 FY 2017 FY 2016 FY 2015
REVENUE
Revenue From Operations 1943.8 3696.7 4798.4 4,185.2
Other Income 11.4 52.6 39.2 87.2
Total Revenue 1955.2 3749.4 4837.5 4,272.3
EXPENSES
Cost of Raw Materials Consumed 1116.3 2219.6 3143.7 2,625.2
Purchases of Stock in trade 152.7 280.9 618.4 567.3
Changes in inventories of finished goods, stock-in-
trade and work in progress
76.2 (7.6) (79.0) 38.0
Excise duty on goods 8.6 29.2 32.1 26.4
Employee Benefits Expense 64.0 113.1 123.2 107.8
Finance Costs 82.7 242.0 192.6 164.0
Depreciation and amortization expense 28.9 58.3 29.0 33.7
Other Expenses 304.6 621.7 712.0 669.9
Total Expenses 1833.9 3557.3 4772.0 4,232.4
Profit/(loss) before exceptional items and tax 121.3 192.1 65.5 39.9
Exceptional Items (11.4) (60.9) (5.8) -
Profit/(loss) before tax 109.8 131.2 59.8 39.9
Profit/(loss) for the year 70.6 86.9 65.1 43.3
Source: FY 2015 numbers are based on IGAAP & FY 2016 ,FY 2017 & H1 FY 2018 are based on IND AS

Paradeep Phosphates Limited-Standalone Balance Sheet
35
INR Crores
Particulars H1 FY 2018 FY 2017 FY 2016 FY 2015
Non Current Assets
Property, Plant and Equipment 906.2 931.4 954.0 362.7
Capital work-in-progress 297.4 243.2 150.4 524.3
Intangible Assets 1.3 1.1 1.0 1.6
Financials Assets 7.8 7.8 13.0 53.6
Other Non Current Assets 65.8 78.7 96.9 -
Sub Total 1,278.6 1,262.2 1,215.3 942.2
Current Assets
Inventories 626.0 724.5 708.9 768.7
Receivables 1,967.3 2,274.1 2,333.1 1,286.2
Other Current Assets 275.0 365.7 623.9 583.8
Sub Total 2,868.3 3,364.3 3,665.9 2,638.7
Total Assets 4,146.9 4,626.5 4,881.2 3,580.9
Equity Share Capital 575.5 575.5 575.5 575.5
Other Equity 745.6 670.8 581.6 483.7
Total Equity 1,321.0 1,246.3 1,157.1 1,059.2
Non Current Liablities
Borrowings 322.1 346.6 381.8 398.4
Other Non Current Liabilities 14.5 14.7 14.6 10.8
Sub Total 336.6 361.2 396.4 409.2
Current Liablities
Borrowings 1,551.9 2,164.6 2,468.8 1,502.0
Trade Payables 676.0 571.8 466.2 330.0
Other Current Liabilities 261.5 282.6 392.6 280.4
Total Liabilities 4,146.9 4,626.5 4,881.2 3,580.9
Source: FY 2015 numbers are based on IGAAP & FY 2016 ,FY 2017 & H1 FY 2018 are based on IND AS

Mangalore Chemicals & Fertilizers Limited- Standalone Profit & Loss
36
INR Crores
Particulars H1 FY 2018 FY 2017 FY 2016 FY 2015
REVENUE
Revenue From Operations 1399.1 2,502.1 2,982.1 2,588.0
Other Income 1.9 9.7 6.3 11.5
Total Revenue 1401.0 2,511.9 2,988.4 2,599.5
EXPENSES
Cost of Raw Materials Consumed 595.9 1,087.8 1,180.1 1,119.9
Purchases of Stock in trade 438.0 686.4 934.9 886.5
Changes in inventories of finished goods, stock-in-
trade and work in progress
(18.4) (7.2) 104.7 (141.4)
Excise duty on goods 4.0 14.7 13.0 11.2
Employee Benefits Expense 35.3 68.7 68.0 63.3
Finance Costs 45.0 118.2 114.7 126.4
Depreciation and amortization expense 17.9 35.3 32.3 28.7
Other Expenses 256.2 477.8 572.1 486.7
Total Expenses 1374.0 2,481.7 3,019.8 2,581.2
Profit/(loss) before exceptional items and tax 27.0 30.1 (31.4) 18.3
Exceptional Items 0.0 - (216.7)
Profit/(loss) before tax 27.0 30.1 (248.1) 18.3
Profit/(loss) for the year 17.3 19.4 (240.1) 37.5
Source: FY 2015 numbers are based on IGAAP & FY 2016 ,FY 2017 & H1 FY 2018 are based on IND AS

Mangalore Chemicals & Fertilizers Limited-Standalone Balance Sheet
37
INR Crores
Particulars H1 FY 2018 FY 2017 FY 2016 FY 2015
Non Current Assets
Property, Plant and Equipment 617.4 624.7 642.5 619.4
Capital work-in-progress 10.9 13.6 13.2 9.3
Intangible Assets 0.7 0.3 0.4 0.2
Financials Assets 6.2 6.3 6.6 251.2
Other Non Current Assets 8.4 3.4 3.3 17.1
Sub Total 643.6 648.3 666.0 897.2
Current Assets
Inventories 264.5 259.8 233.1 334.2
Receivables 654.2 587.9 485.9 235.6
Other Current Assets 610.2 764.6 1,068.5 970.8
Sub Total 1,529.0 1,612.3 1,787.4 1,540.6
Total Assets 2,172.5 2,260.6 2,453.5 2,437.8
Equity Share Capital 118.5 118.5 118.5 118.5
Other Equity 315.3 305.5 286.0 541.4
Total Equity 433.8 424.0 404.5 660.0
Non Current Liablities
Borrowings 139.6 99.6 124.3 209.3
Other Non Current Liabilities 41.8 55.3 43.7 109.1
Sub Total 181.4 154.9 168.0 318.3
Current Liablities
Borrowings 865.6 1,059.9 1,196.4 856.5
Trade Payables 538.5 448.3 523.0 502.7
Other Current Liabilities 153.2 173.4 161.5 100.3
Total Liabilities 2,172.5 2,260.6 2,453.5 2,437.8
Source: FY 2015 numbers are based on IGAAP & FY 2016 ,FY 2017 & H1 FY 2018 are based on IND AS

Zuari Fertilisers & Chemicals Limited- Standalone Profit & Loss
38
INR Crores
Particulars H1 FY 2018 FY 2017 FY 2016 FY 2015
REVENUE
Revenue From Operations 27.7 45.3 45.0
Other Income 1.9 3.8 7.7 6.3
Total Revenue 29.6 49.1 52.7 6.3
EXPENSES
Cost of Raw Materials Consumed 19.5 28.9 22.3
Purchases of Stock in trade
Changes in inventories of finished goods, stock-in-
trade and work in progress
(1.2) 0.9 13.9
Excise duty on goods 0.1 0.3 0.3
Employee Benefits Expense 1.0 2.7 2.7 3.4
Finance Costs 57.9 104.3 92.9 18.6
Depreciation and amortization expense 1.5 3.1 2.4 0.0
Other Expenses 11.3 22.5 17.2 8.1
Total Expenses 90.1 162.7 151.8 30.1
Profit/(loss) before exceptional items and tax (60.5) (113.6) (99.1) (23.8)
Exceptional Items 0.0 -
Profit/(loss) before tax (60.5) (113.6) (99.1) (23.8)
Profit/(loss) for the year (60.5) (113.6) (99.1) (23.8)
Source: FY 2015 numbers are based on IGAAP & FY 2016 ,FY 2017 & H1 FY 2018 are based on IND AS

Zuari Fertilisers & Chemicals Limited- Standalone Balance Sheet
39
INR Crores
Particulars H1 FY 2018 FY 2017 FY 2016 FY 2015
Non Current Assets
Property, Plant and Equipment 77.3 78.8 81.7 7.5
Capital work-in-progress - - - 68.2
Intangible Assets - - - -
Financials Assets 535.3 535.3 535.3 147.6
Other Non Current Assets 39.0 39.0 37.9 -
Sub Total 651.5 653.0 654.9 223.4
Current Assets
Inventories 16.0 11.8 18.0 18.3
Receivables 31.9 24.2 28.0 2.7
Other Current Assets 28.3 28.0 27.1 26.6
Sub Total 76.2 64.0 73.1 47.6
Total Assets 727.7 717.0 728.1 271.0
Equity Share Capital 15.4 15.4 15.4 15.4
Other Equity (281.7) (221.3) (107.7) (36.3)
Total Equity (266.4) (205.9) (92.3) (20.9)
Non Current Liablities
Borrowings 831.1 490.1 574.0 217.2
Other Non Current Liabilities 0.1 0.1 0.1 -
Sub Total 831.2 490.2 574.1 217.2
Current Liablities
Borrowings 20.1 32.0 17.0 17.1
Trade Payables 32.3 20.1 20.7 23.8
Other Current Liabilities 110.4 380.7 208.5 33.8
Total Liabilities 727.7 717.0 728.1 271.0
Source: FY 2015 numbers are based on IGAAP & FY 2016 ,FY 2017 & H1 FY 2018 are based on IND AS

Shareholding Pattern
Promoters66.1%
Institutions10.5%
Retail11.1%
Bodies Corporate11.1%
Others1.2%
Source: BSE; Shareholding as of 30 Sep 2017
Disclaimer
41
The information contained in this presentation has been prepared by Zuari Agro Chemicals Limited (the “Company”) solely for your reference and may not be distributed, copied, reproduced, or redistributed or passed on directly or indirectly to any other person, whether within or outside your organization or firm, or published in whole or in part, for any purpose by recipients directly or indirectly to any other person. By accessing this presentation, you agree to be bound by the following restrictions and to maintain absolute confidentiality regarding the information disclosed in these materials. The Company may alter, modify or otherwise change in any manner the contents of this presentation, without obligation to notify any persons of such change or changes. This presentation and its contents are confidential and may not be copied, published, reproduced or disseminated in any manner.
This presentation may contain certain forward looking statements based on the currently held beliefs and assumptions of the management of the Company which are expressed in good faith and in their opinion, reasonable. These statements include descriptions regarding the intent, belief or current expectations of the Company or its directors and officers with respect to the results of operations and financial condition of the Company. Such forward-looking statements are not guarantees of future performance and involve risks and uncertainties, and actual results may differ from those in such forward-looking statements as a result of various factors and assumptions which the Company believes to be reasonable in light of its operating experience in recent years. Many factors could cause the actual results, performances, or achievements of the Company to be materially different from any future results, performances, or achievements. Significant factors that could make a difference to the Company’s operations include, but are not restricted to, domestic and international economic conditions, changes in government regulations, tax regime and other statutes. The Company does not undertake to revise any forward-looking statement that may be made from time to time by or on behalf of the Company.
This presentation contains certain supplemental measures of performance and liquidity that are not required by or presented in accordance with Indian Accounting Standards or Indian GAAP, and should not be considered an alternative to profit, operating revenue or any other performance measures derived in accordance with Indian Accounting Standards or Indian GAAP or an alternative to cash flow from operations as a measure of liquidity of the Company.
In no event shall the Company or its directors be responsible to any person or entity for any loss or damage, whether direct, indirect, incidental, consequential or otherwise, arising out of access or use or dissemination of information contained in this presentation, including, but not limited to, loss of profits. No representation, warranty, guarantee or undertaking (express or implied) is made as to, and no reliance should be placed on, the accuracy, completeness or correctness of any information, including any estimates, targets and opinions, contained herein, and no liability whatsoever is accepted as to any errors, omissions or misstatements contained herein and, accordingly, none of the Company, its advisors and representative and any of its or their affiliates, officers, directors, employees or agents, and anyone acting on behalf of such persons accepts any responsibility or liability whatsoever, in negligence or otherwise, arising directly or indirectly from this presentation or its contents or otherwise arising in connection therewith.
You must make your own assessment of the relevance, accuracy and adequacy of the information contained in this presentation and must make such independent analysis as you may consider necessary or appropriate for such purpose. Any opinions expressed in this presentation are subject to change without notice and past performance is not indicative of future results. By attending this presentation you acknowledge that you will be solely responsible for your own assessment of the market and the market position of the Company and that you will conduct your own analysis and be solely responsible for forming your own view of the potential future performance of the Company’s business.
This presentation and its contents are not and should not be construed as a prospectus or an offer document, including as defined under the Companies Act, 2013, to the extent notified and in force) or an offer document under the Securities and Exchange Board of India (Issue of Capital and Disclosure Requirements) Regulations, 2009, as amended. This presentation is not for publication or distribution or release in any country where such distribution may lead to a breach of any law or regulatory requirement. The information contained herein does not constitute or form part of an offer, or solicitation of an offer to purchase or subscribe, for securities for sale. The distribution of this presentation in certain jurisdictions may be restricted by law and persons into whose possession this presentation comes should inform themselves about and observe any such restrictions. None of the Company’s securities may be offered or sold in the United States without registration under the U.S. Securities Act of 1933, as amended, except pursuant to an exemption from registration there from.
By accessing this presentation, you accept that this disclaimer and any claims arising out of the use of the information from this presentation shall be governed by the laws of India and only the courts in Goa, and no other courts, shall have jurisdiction over the same.

Thank You
Related Documents