Zooplankton trends in Massachusetts Bay, USA: 1998–2008 JEFFERSON T.TURNER 1 *, DAVID G.BORKMAN 2 AND P.SCOTT LIBBY 3 1 BIOLOGY DEPARTMENTAND SCHOOL FOR MARINE SCIENCE AND TECHNOLOGY , UNIVERSITY OF MASSACHUSETTS DARTMOUTH, NORTH DARTMOUTH, MA 02747, USA, 2 GRADUATE SCHOOL OF OCEANOGRAPHY , UNIVERSITY OF RHODE ISLAND, NARRAGANSETT , RI 02882, USA AND 3 BATTELLE, 153B PARK ROW , BRUNSWICK, ME 04011, USA *CORRESPONDING AUTHOR: [email protected] Received October 21, 2010; accepted in principle December 14, 2010; accepted for publication December 22, 2010 Corresponding editor: Mark J. Gibbons Zooplankton community analyses in Massachusetts Bay (Gulf of Maine, USA) from 1998 to 2008 with 102 mm mesh nets revealed seasonal and interannual variability in zooplankton abundance, with maxima in summer and minima in winter. Zooplankton was dominated by copepod nauplii, copepodites and adults, mostly of the small cyclopoid copepod Oithona similis. Time-series analyses revealed a multi-year decline in total zooplankton abundance from 2000 to 2008, especially due to declines in Oithona similis and Pseudocalanus spp. This decline was not exhib- ited by barnacle nauplii and Calanus finmarchicus. There were no significant relation- ships between surface or mean water column temperature and salinity for any zooplankton group except for significantly higher abundances of C. finmarchicus at higher surface salinity. There was a significant positive correlation between total zooplankton abundance and integrated chlorophyll. The decline in zooplankton abundance since 2000 was not obviously related to diversion of sewage effluent from the Boston Harbor outfall to Massachusetts Bay, or to natural hydrographic variability. The zooplankton decline in Massachusetts Bay highlights the impor- tance of multi-year sampling to characterize interannual variability. Comparisons of our results with those of other programs in the Gulf of Maine are complicated by differences in sampling net meshes, but our results shared some similarities with other studies during years when these studies overlapped with ours. In par- ticular, small copepods declined in abundance beginning around 2000–2001, Calanus finmarchicus was abundant and salinities were high during 2002 through 2004, and zooplankton and chlorophyll levels declined from 2000 through 2004. KEYWORDS: zooplankton; Massachusetts Bay; Gulf of Maine; Oithona similis INTRODUCTION Coastal marine waters throughout the world are under increasing anthropogenic stress (Halpern et al., 2008). Various combinations of pollution, eutrophica- tion, overfishing and increasing effects of anthropo- genic climate change are challenging our abilities to properly utilize and manage coastal ecosystems. Understanding and managing such systems requires sustained monitoring. Superimposed over anthropogenic changes in coastal ecosystems are natural climatic and oceanographic vari- ations, which may occur over time scales that exceed decades. Such variability may relate to long-term climate change (Greene and Pershing, 2007; Greene et al., 2008), and may impact human concerns such as industrialized fishing and conservation of endangered species (Greene and Pershing, 2004; Frank et al., 2005; Greene et al., 2009a,b). doi:10.1093/plankt/fbq168, available online at www.plankt.oxfordjournals.org. Advance Access publication January 18, 2011 # The Author 2011. Published by Oxford University Press. All rights reserved. For permissions, please email: [email protected] JOURNAL OF PLANKTON RESEARCH j VOLUME 33 j NUMBER 7 j PAGES 1066 – 1080 j 2011 at University of Massachusetts Dartmouth on June 17, 2011 plankt.oxfordjournals.org Downloaded from

Welcome message from author
This document is posted to help you gain knowledge. Please leave a comment to let me know what you think about it! Share it to your friends and learn new things together.
Transcript

Zooplankton trends in MassachusettsBay, USA: 1998–2008
JEFFERSON T. TURNER 1*, DAVID G. BORKMAN 2 AND P. SCOTT LIBBY 3
1BIOLOGY DEPARTMENT AND SCHOOL FOR MARINE SCIENCE AND TECHNOLOGY, UNIVERSITY OF MASSACHUSETTS DARTMOUTH, NORTH DARTMOUTH, MA
02747, USA, 2GRADUATE SCHOOL OF OCEANOGRAPHY, UNIVERSITY OF RHODE ISLAND, NARRAGANSETT, RI 02882, USA AND
3BATTELLE, 153B PARK ROW,
BRUNSWICK, ME 04011, USA
*CORRESPONDING AUTHOR: [email protected]
Received October 21, 2010; accepted in principle December 14, 2010; accepted for publication December 22, 2010
Corresponding editor: Mark J. Gibbons
Zooplankton community analyses in Massachusetts Bay (Gulf of Maine, USA)from 1998 to 2008 with 102 mm mesh nets revealed seasonal and interannualvariability in zooplankton abundance, with maxima in summer and minima inwinter. Zooplankton was dominated by copepod nauplii, copepodites and adults,mostly of the small cyclopoid copepod Oithona similis. Time-series analyses revealeda multi-year decline in total zooplankton abundance from 2000 to 2008, especiallydue to declines in Oithona similis and Pseudocalanus spp. This decline was not exhib-ited by barnacle nauplii and Calanus finmarchicus. There were no significant relation-ships between surface or mean water column temperature and salinity for anyzooplankton group except for significantly higher abundances of C. finmarchicus athigher surface salinity. There was a significant positive correlation between totalzooplankton abundance and integrated chlorophyll. The decline in zooplanktonabundance since 2000 was not obviously related to diversion of sewage effluentfrom the Boston Harbor outfall to Massachusetts Bay, or to natural hydrographicvariability. The zooplankton decline in Massachusetts Bay highlights the impor-tance of multi-year sampling to characterize interannual variability. Comparisonsof our results with those of other programs in the Gulf of Maine are complicatedby differences in sampling net meshes, but our results shared some similaritieswith other studies during years when these studies overlapped with ours. In par-ticular, small copepods declined in abundance beginning around 2000–2001,Calanus finmarchicus was abundant and salinities were high during 2002 through2004, and zooplankton and chlorophyll levels declined from 2000 through 2004.
KEYWORDS: zooplankton; Massachusetts Bay; Gulf of Maine; Oithona similis
I N T RO D U C T I O N
Coastal marine waters throughout the world areunder increasing anthropogenic stress (Halpern et al.,2008). Various combinations of pollution, eutrophica-tion, overfishing and increasing effects of anthropo-genic climate change are challenging our abilities toproperly utilize and manage coastal ecosystems.Understanding and managing such systems requiressustained monitoring.
Superimposed over anthropogenic changes in coastalecosystems are natural climatic and oceanographic vari-ations, which may occur over time scales that exceeddecades. Such variability may relate to long-termclimate change (Greene and Pershing, 2007; Greeneet al., 2008), and may impact human concerns such asindustrialized fishing and conservation of endangeredspecies (Greene and Pershing, 2004; Frank et al., 2005;Greene et al., 2009a,b).
doi:10.1093/plankt/fbq168, available online at www.plankt.oxfordjournals.org. Advance Access publication January 18, 2011
# The Author 2011. Published by Oxford University Press. All rights reserved. For permissions, please email: [email protected]
JOURNAL OF PLANKTON RESEARCH j VOLUME 33 j NUMBER 7 j PAGES 1066–1080 j 2011 at U
niversity of Massachusetts D
artmouth on June 17, 2011
plankt.oxfordjournals.orgD
ownloaded from
Although the coastal and continental shelf waters offthe heavily populated northeastern USA, including theGulf of Maine, have been studied extensively since earlyin the 20th century (Bigelow, 1926), most historicalstudies in offshore non-estuarine waters have been donefor periods of only one to a few years. However, inrecent decades, there has been increasing multi-yearstudy of the offshore coastal waters of the continentalshelf, including the Gulf of Maine and Georges Bank(reviewed by Sherman et al., 1996; Mountain and Kane,2010; and references therein).
Much of the recent effort in the Gulf of Maine andGeorges Bank areas has focused on community struc-ture, abundance and seasonality of zooplankton. This ispartly because zooplankton are major prey for variousspecies and stages of commercially important fish(Turner, 1984; Lough and Mountain, 1996). Further,zooplankton may respond to phytoplankton variationsin relation to eutrophication (Uye, 1994). Zooplanktonmay also be sentinels of long-term climate change,responding with changing biogeographic ranges orphenology (Pershing et al., 2004; Ji et al., 2010; andreferences therein).
Recent multi-year zooplankton studies in the offshoreGulf of Maine and Georges Bank region have revealedconsiderable interannual variability in hydrographicand zooplankton patterns (Pershing et al., 2005; Wiebeet al., 2006; Kane, 2007; and references therein).Mountain and Kane (Mountain and Kane, 2010)reviewed major changes in near-surface salinity andzooplankton patterns over Georges Bank between the1980s and 1990s. There was a large decrease in salinityof surface-layer waters of the continental shelf from theGulf of Maine to Cape Hatteras due to the inflow oflow-salinity waters from the Scotian Shelf. The freshen-ing of the 1990s originated from at least as far north asthe Labrador Sea, and may have originated in theArctic (Greene and Pershing, 2007). There were signifi-cant changes in zooplankton abundance and commu-nity structure on Georges Bank during the same period,and the shift in the zooplankton appeared related to thefreshening of surface waters in the 1990s. The 1990shad an approximate order-of-magnitude increase inzooplankton abundance relative to the 1980s and mostof this increase was in small copepod species such asOithona spp., Metridia lucens, Temora longicornis andCentropages typicus. After 2001, the zooplankton commu-nity returned to a dominance of larger copepods suchas Calanus finmarchicus (Kane, 2007). Pershing et al.(Pershing et al., 2005) also noted similar shifts in zoo-plankton abundance and community composition inthe Gulf of Maine during the 1990s. Pershing et al.(Pershing et al., 2005) suggested that low surface salinity
increased stratification, thereby increasing phytoplank-ton food for zooplankton in winter. Durbin et al.(Durbin et al., 2003) concluded that winter stratificationdue to reduced surface salinity from Scotian Shelfinflow enhanced phytoplankton blooms in the Gulf ofMaine in February of 1999, compared to the samemonth in 2000, promoting increased zooplankton abun-dance and improved nutritional state in 1999.
Although natural hydrographic and phytoplanktonvariations in the Gulf of Maine/Georges Bank regionappear to prompt zooplankton shifts in abundance andcommunity composition, there may also be phytoplank-ton and zooplankton responses to anthropogenicchanges such as wastewater diversion. This has been ofparticular concern for waters of Massachusetts Baybecause of the recent relocation of Boston’s sewageoutfall from inside the heavily urbanized estuary ofBoston Harbor offshore to Massachusetts Bay (Fig. 1),an open coastal portion of the Gulf of Maine, immedi-ately east of Boston Harbor (Kelly, 1997, 1998; Kellyand Doering, 1997; Signell et al., 2000). In particular, ifincreases in nitrogen loading to Massachusetts Baymodify phytoplankton abundance and/or communitycomposition, this could conceivably contribute tochanges in the zooplankton which are primary food ofendangered right whales (Eubalaena glacialis). Because theMaine Coastal Current flows southward along the coastof the Gulf of Maine, water flow is from MassachusettsBay to Cape Cod Bay during most of the year exceptfor during the summer stratified period. Thus, changesdue to the outfall in Massachusetts Bay might becomereflected in downstream waters of Cape Cod Bay. Sinceright whales congregate in Cape Cod Bay to feed uponabundant copepods (Calanus finmarchicus, Pseudocalanus sp.and Centropages spp.) during late winter and early spring(Mayo and Marx, 1990; DeLorenzo Costa et al., 2006;Pendleton et al., 2010), outfall-induced changes in thephytoplankton and zooplankton communities ofMassachusetts and Cape Cod Bays could adverselyaffect the habitat of right whales during a criticalportion of their annual migratory cycle. Thus, monitor-ing the zooplankton is an important component of theoverall monitoring effort to detect anthropogenicchanges due to the outfall relocation offshore.
The Boston Harbor project is one of the largestsewage abatement projects in history. Because it poten-tially affects everything in these waters from nutrients towhales, changes due to this project have implicationsfor urbanized coastal waters far beyond the local area.The greater Boston metropolitan area dischargessewage from over two million people into adjacentcoastal waters (380 million gallons per day,16.6 m3 s21). Prior to the twenty-first century, sewage
J. T. TURNER ET AL. j ZOOPLANKTON IN MASSACHUSETTS BAY
1067
at University of M
assachusetts Dartm
outh on June 17, 2011plankt.oxfordjournals.org
Dow
nloaded from

effluent (mainly primary-treated) was dischargeddirectly into Boston Harbor, which was one of the mostpolluted harbors in the USA (Taylor, 2010). However,beginning in the early 1990s, there was a major effortto improve sewage treatment (secondary treatment), andto build a sewage outfall tunnel under the seabed to dis-charge effluent outside the harbor into MassachusettsBay, where tidal and prevailing currents would diluteand disperse the effluent. Since September 2000, efflu-ent that has undergone full secondary treatment hasbeen discharged into Massachusetts Bay 15 km offshorefrom the mouth of the harbor. This has dramaticallyimproved water quality in Boston Harbor, and hasresulted in no obvious adverse effects offshore inMassachusetts Bay (Hunt et al., 2010; Taylor, 2010).
Monitoring of the coastal marine waters of BostonHarbor, Massachusetts Bay and Cape Cod Bay inrelation to the Boston Harbor clean-up began in 1992,and has continued to the present (see Hunt et al., 2010;for an overview). During the early years of the monitor-ing (1992–1994), samples were collected six times ayear in all areas that might be affected by relocation ofthe discharge (Turner, 1994). There were subsequentadjustments (1995–1997) in the frequency of sampling,locations of some stations and personnel performing themonitoring. However, from 1998 to 2008, additionalsampling has increased the sampling schedule in thearea of Massachusetts Bay near the outfall, to a
frequency of monthly or more frequently betweenFebruary and November at the same two stations, N04and N18 (Fig. 1). The outfall is on the sea bottom at42.398N, 70.798W, �2.5 km northwest of Station N18.All zooplankton samples from these two stations werecollected using the same protocols, and were taxonomi-cally analyzed by the same person (JTT). Also, unlikeprevious zooplankton surveys in the Gulf of Maineregion, samples were collected using 102 mm mesh nets.This is important because most previous studies (sum-marized by Sherman et al., 1996) used coarser-meshnets (270–333 mm-mesh), which severely under-sampled the small juvenile and adult copepods, whichare now known to be far more abundant than thelarger taxa that dominated the assemblages of previousstudies (Turner, 2004).
The present study represents one of the few multi-year zooplankton monitoring programs that haveused small-mesh nets, sampled year-round over entireseasonal cycles and continued for more than adecade. This study has demonstrated considerableseasonal and interannual variability, not only interms of zooplankton abundance and composition,but numerous other parameters (Hunt et al., 2010).In order to examine multi-year trends in zooplanktondynamics, we employed time-series analyses to clarifyfluctuations of abundance of various components ofthe zooplankton.
Fig. 1. Location of Stations N18 and N04 offshore from Boston Harbor. The subsurface outfall is located �2.5 km northwest of Station N18.
JOURNAL OF PLANKTON RESEARCH j VOLUME 33 j NUMBER 7 j PAGES 1066–1080 j 2011
1068
at University of M
assachusetts Dartm
outh on June 17, 2011plankt.oxfordjournals.org
Dow
nloaded from

M E T H O D
The monitoring program of the Massachusetts WaterResources Authority (MWRA) has performed frequentsampling in Massachusetts Bay near the site of the newoutfall since 1998. From 1998 to 2003, there were 17surveys per year (February–December) and from 2004to 2008 there were 12 surveys per year (February–November) at Station N18 (42.378N, 70.788W) andStation N04 (42.448N, 70.748W). A total of 323 zoo-plankton samples were collected (there was no samplefrom Station N18 on 13 May 2005).
Water samples for temperature, salinity, nutrient,chlorophyll and phytoplankton community analyseswere collected with a conductivity–temperature–depth/Go-Flo/Niskin bottle rosette sampler from fivedepths over the water column at each station (see Huntet al., 2010 for detailed phytoplankton, chlorophyll,nutrient, temperature and salinity results).
Zooplankton samples were collected with verticaltows over the upper 25 m with 0.5 m diameter 102 mmmesh nets equipped with flowmeters (General OceanicsModel 2030). Care was taken to ensure that flowmeterpropellers were still turning upon retrieval of nets, indi-cating that there had been no net clogging with phyto-plankton, ctenophores or other particulates. Ifflowmeters were not turning at the end of a tow, thetow was repeated for shorter time intervals over areduced depth range until a tow with no net cloggingwas obtained. The vertical range of 25 m for most ofthe net tows covered almost the entire water columnwhich was �30 m deep at the shallowest station, N18.Although somewhat deeper (slightly . 40 m, dependingon tide), Station N04 was also sampled for zooplanktonover the upper 25 m in order to maintain consistencywith the other station. Samples were preserved at sea in5% formalin:seawater solutions, and ashore were trans-ferred to 70% ethanol solutions for counting. Sampleswere reduced with a Folsom plankton splitter to aliquotsof at least 250 animals.
Zooplankton were identified to the lowest practicaltaxon. Copepods were identified in most cases tospecies, with adults further identified to sex. All copepo-dites of a genus were combined, and not further separ-ated to species or stage. The genus Pseudocalanus isrepresented in Massachusetts Bay and throughout theGulf of Maine by two species, P. newmani and P. moultoni
(Frost, 1989). Distinguishing these congeners is difficultfor adults and impossible for copepodites, so ourseparate records for adults of these two species andcopepodites of this genus were combined here as“Pseudocalanus spp.”. Copepod nauplii were combinedand not identified further to genus, species or stage.
Other non-copepod zooplankters such as chaetognaths,fish larvae, pteropods, etc. were usually not identifiedbeyond major group. Meroplankters such as barnaclenauplii, bivalve and gastropod veligers, polychaetelarvae, etc. were also identified only to major group.
Time-series data (monthly survey means for the twostations) were decomposed into multi-year trend andseasonal components, using a method similar to thatused in analyzing a 34-year time series of North Seazooplankton abundance (Broekhuizen and McKenzie,1995). A multiplicative model was used in which thetime series of original observation (Xt) was assumed tobe composed of trend (Tt), seasonal (St) and irregular (It)components [equation (1)].
Xt ¼ Tt � St � It ð1Þ
Only the trend components are presented here. Trendwas estimated by first calculating a monthly index, usedas an estimate of seasonality (St) for each month. Themonthly index was the ratio of each monthly valuedivided by the annual mean of the value and then cal-culating the mean ratio of all corresponding months inthe time series (i.e. mean of all January ratios, mean ofall February ratios, etc.). The original monthly timeseries (Xt) was divided by the corresponding monthlyindex (St) to yield a de-seasonalized trend (Tt) timeseries [equation (2)].
Tt ¼Xt
Stð2Þ
This de-seasonalized time series (Tt) was smoothed by aLOWESS smoother (with a window equivalent to 15% oftime-series length) to yield the estimates of long-termde-seasonalized trend presented here. Correlationsbetween trends were corrected for first-order autocorrela-tion in the trend using the method of Quenouille(Quenouille, 1952), which accounts for the reducedsample size imposed by autocorrelation in the time series.
R E S U LT S
Due to the use of 102 mm mesh nets, we found thatzooplankton communities of Massachusetts Bay werenumerically dominated by small taxa, mostly copepods.Included were copepod nauplii and copepodites andadults of small taxa such as the cyclopoid copepodOithona similis and copepodites of the calanoid genusPseudocalanus. Other copepod taxa were subdominantbut were much less abundant than O. similis andPseudocalanus spp. at most times of the year.
J. T. TURNER ET AL. j ZOOPLANKTON IN MASSACHUSETTS BAY
1069
at University of M
assachusetts Dartm
outh on June 17, 2011plankt.oxfordjournals.org
Dow
nloaded from
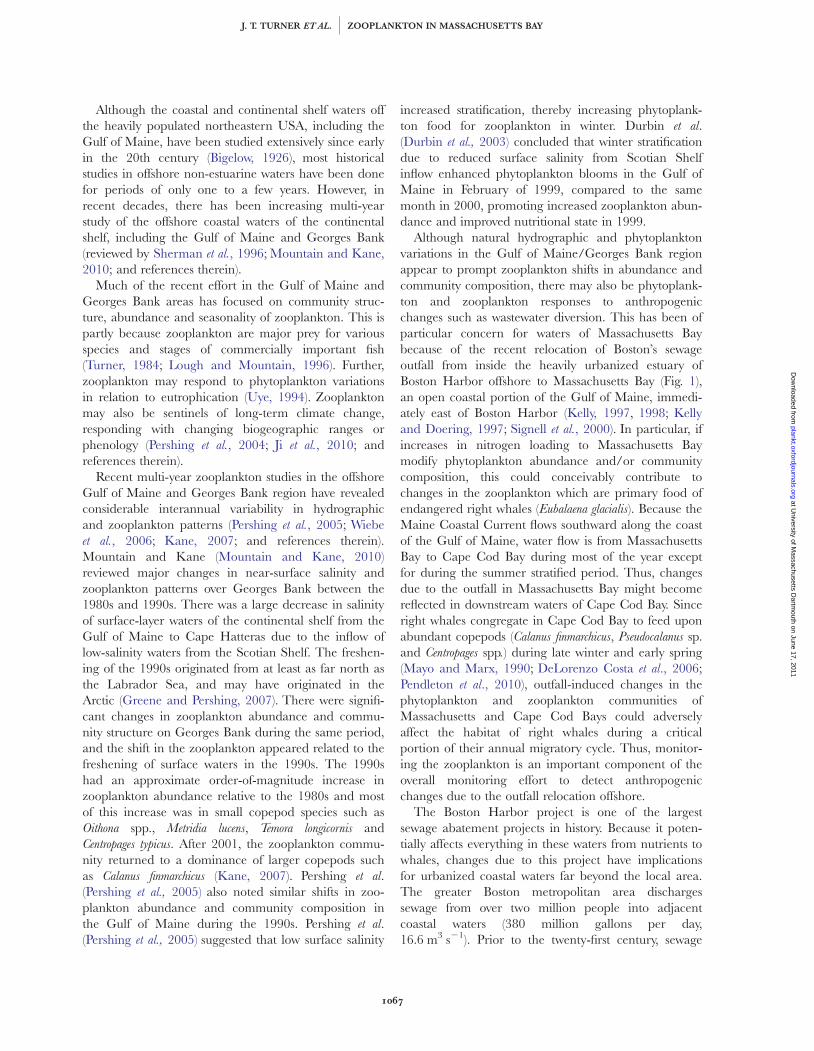
Results presented here for dominant taxa are surveymeans for Stations N04 and N18 on the same day.Comparisons of individual station data for these twostations with Student’s t-tests (Table I) revealed thatthere were no significant differences (P , 0.05) betweenthe stations for abundance of total zooplankton and
most other zooplankton taxonomic groups on a givenday. Calanus finmarchicus had significantly higher abun-dances at the deeper offshore Station N04 than at themore inshore Station N18, but the significance level forthis relationship (P ¼ 0.047) was close to the P , 0.05threshold for significance.
Subdominant holoplankton taxa (Table II) inMassachusetts Bay include the calanoids Calanus
finmarchicus, Centropages hamatus, C. typicus, Metridia lucens,Paracalanus parvus, Temora longicornis, the cyclopoid Oithona
atlantica and the pelagic harpacticoid Microsetella norvegica
(Turner, 2003). Estuarine copepod taxa that canbecome abundant in Boston Harbor, but are rarelyencountered in Massachusetts Bay, and then only in lowabundance, include Acartia hudsonica, A. tonsa, Eurytemora
herdmani and Tortanus discaudatus (Kropp et al., 2003).Non-copepod taxa that can become sporadically abun-dant in Massachusetts Bay, but rarely are as abundantas O. similis and Pseudocalanus spp., include the marinecladocerans Evadne nordmani and Podon polyphemoides, tuni-cates such as Oikopleura dioica and various meroplankterssuch as polychaete larvae, bivalve and gastropod veli-gers, barnacle nauplii and ctenophores (Turner, 2003).
Several patterns are apparent from data in Table II.First, Oithona similis and Pseudocalanus spp. were not onlythe most abundant holoplankton taxa in terms of bothmean (10920 and 4368 animals m23, respectively) and
Table I: Station means for 1998–2008(individuals m23) for Stations N04 andN18, and t-test P-values for differencesbetween mean values and individual stationvalues for Stations N04 and N18 on eachsampling day for various zooplanktoncategories shown in Figs 5–12 (* ¼significant difference)
Zooplankton category N04 mean N18 mean PP-value Figure
Total zooplankton 39011 36999 0.286 5Total copepods 32756 31322 0.370 6Copepod
adults þ copepodites21303 20017 0.278 7
Copepod nauplii 11454 11305 0.828 8Oithona spp.a 11076 10725 0.577 9Pseudocalanus spp.b 4590 3606 0.060 10Barnacle larvae 303 336 0.811 11Calanus finmarchicus 1247 901 0.047* 12
aIncludes adults þ copepodites of Oithona similis þ Oithona atlantica.bIncludes adults þ copepodites of Pseudocalanus moultoni þPseudocalanus newmani.
Table II: Ranges and mean abundances, numbers and months of occurrences (non-zero values) fordominant holoplankton taxa recorded for the sampling area (Stations N04 and N18 combined) in 323tows between February 1998 and November 2008
Taxon Range (no. m23) Mean (no. m23) nn Months of occurrence
CopepodsAcartia hudsonicaa 1–1674 236 60 2, 3, 4, 5, 6, 7, 8, 9, 12Acartia tonsaa 5–2381 268 53 7, 8, 9, 10, 11Acartia spp.b 4–15524 788 186 2, 3, 4, 5, 6, 7, 8, 9, 10, 11Calanus finmarchicusc 4–30822 1488 257 2, 3, 4, 5, 6, 7, 8, 9, 10, 11, 12Centropages hamatusa 6–7995 326 93 2, 3, 4, 5, 6, 7, 8, 9, 10, 11, 12Centropages typicusa 2–5964 449 184 2, 3, 4, 5, 6, 7, 8, 9, 10, 11, 12Centropages spp.b 4–10054 1228 250 2, 3, 4, 5, 6, 7, 8, 9, 10, 11, 12Eurytemora herdmanic 2–11917 650 50 2, 4, 5, 6, 7, 8, 9, 10, 12Metridia lucensc 1–1789 171 74 2, 3, 5, 6, 7, 8, 9, 10, 11, 12Microsetella norvegicac 7–4692 801 264 2, 3, 4, 5, 6, 7, 8, 9, 10, 11, 12Oithona atlanticac 6–1233 244 107 2, 3, 4, 5, 6, 7, 8, 9, 10, 11, 12Oithona similisc 33–71442 10920 321 2, 3, 4, 5, 6, 7, 8, 9, 10, 11, 12Paracalanus parvusc 14–5757 917 122 2, 3, 5, 6, 7, 8, 9, 10, 11, 12Pseudocalanus spp.c,p 8–70680 4368 304 2, 3, 4, 5, 6, 7, 8, 9, 10, 11, 12Temora longicornisc 2–32205 2002 248 2, 3, 4, 5, 6, 7, 8, 9, 10, 11, 12Tortanus discaudatusc 6–777 121 83 2, 3, 4, 5, 6, 7, 8, 9, 10, 11, 12
Non-copepodsEvadne nordmanid 2–22207 1007 109 4, 5, 6, 7, 8, 9, 10, 11, 12Podon polyphemoidesd 12–2582 391 48 5, 6, 7, 8, 9, 10, 11Oikopleura dioicad 4–22637 1205 171 2, 3, 4, 5, 6, 7, 8, 9, 10, 11, 12
aAdults (females þmales combined), bcopepodites (may include two or more species within a genus), cadults þ copepodites of a species, dadults þlarvae of a non-copepod taxon, pcombined records for Pseudocalanus moultoni þ Pseudocalanus newmani, and n the number of net tows in which ataxon was recorded (total n ¼ 323, since there was no sample from Station N18 on 13 May 2005). Months of occurrence (by number, for example“2” refers to February) indicate that a taxon was recorded at least once during a given month, but not necessarily during that month every year.
JOURNAL OF PLANKTON RESEARCH j VOLUME 33 j NUMBER 7 j PAGES 1066–1080 j 2011
1070
at University of M
assachusetts Dartm
outh on June 17, 2011plankt.oxfordjournals.org
Dow
nloaded from
maximum values (71442 and 70680 animals m23,respectively), but they were also the most frequentlyencountered, being recorded for 321 and 304 samples,respectively, of a total of 323 samples. Other copepodtaxa exhibited lower mean (102–low 103 animals m23)and maximum (103–low 104 animals m23) values, andwere less frequently encountered (all ,264, and most,100 samples). Non-copepod taxa such as the marinecladocerans Evadne nordmani and Podon polyphemoides, andthe appendicularian Oikopleura dioica were recorded inlower abundances and less frequently than the domi-nant copepods. However, most taxa listed in Table IIwere recorded, at least once, for most if not all monthsof sampling between February and December. Themajor exception was the copepod Acartia tonsa whichwas recorded as adults only for July–November.
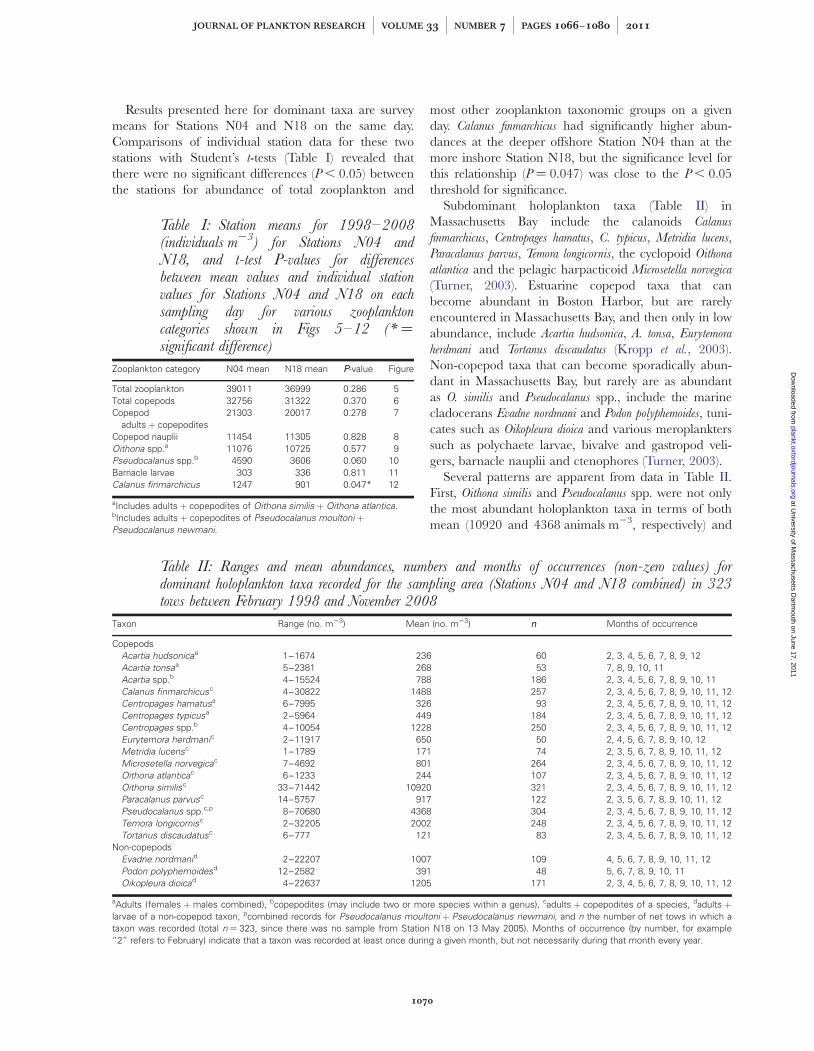
Throughout the 1998–2008 time series inMassachusetts Bay, several other patterns were apparent(Fig. 2). There was considerable seasonal and interann-ual variability in abundance of total zooplankton, withmaxima in the summer and minima in the winter.Abundances of dominant taxa presented together onthe same scale (Fig. 2) revealed that most of the totalzooplankton were copepods (nauplii, copepodites andadults combined under the category “Total Copepod”in Fig. 2). Nauplii were generally the most abundantcomponent of total copepods, and the most abundantcopepodites and adult copepods were cyclopoids of thespecies Oithona similis, which comprised up to 71%(mean ¼ 28%) of total zooplankton abundance. The
most abundant calanoid copepods were copepodites,and to a much lesser extent, adults of the genusPseudocalanus.
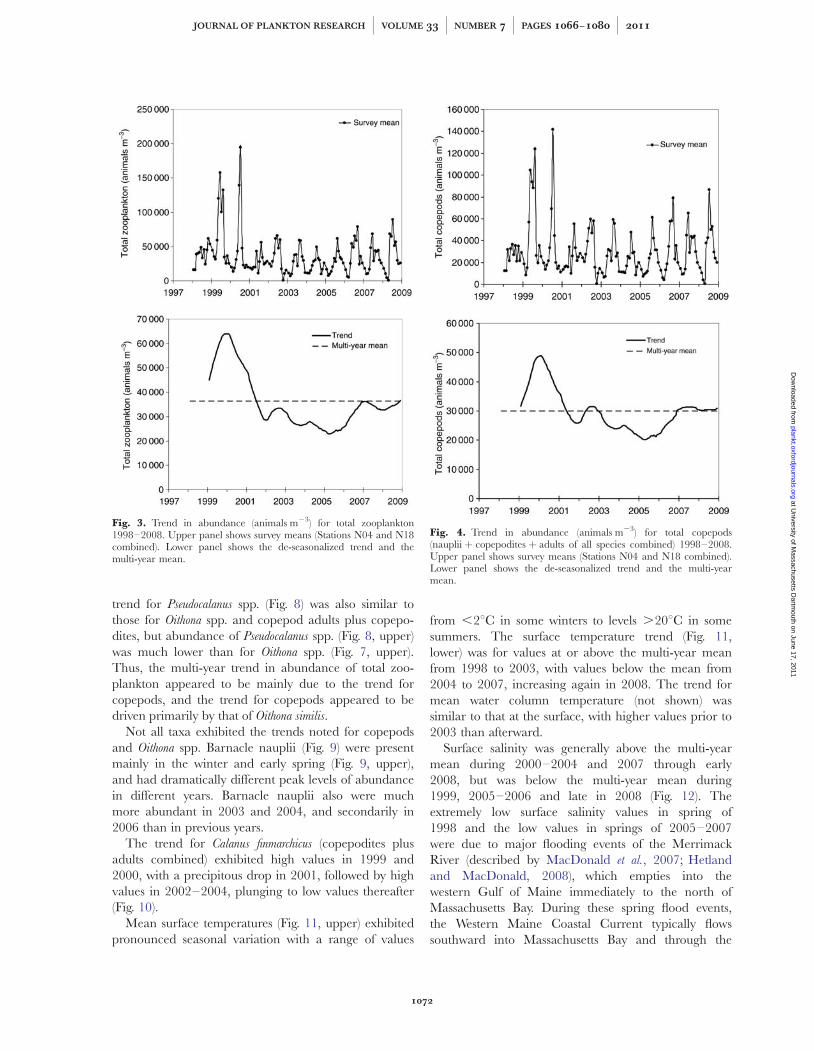
Time-series analyses of major taxa (Figs 3–10)revealed different trends for different taxa. The moststriking trend was the multi-year decline in mean totalzooplankton abundance since 2000 (Fig. 3).
Total zooplankton exhibited peak abundances(�150 000–200 000 animals m23) during the warmermonths of 1999 and 2000. Otherwise, peak abundancesof total zooplankton were .50 000 to,100 000 animals m23. The overall trend for abun-dance of total zooplankton (Fig. 3) was a decline frompeak abundances in 1999 and 2000 to values below themulti-year mean from 2001 through 2008.
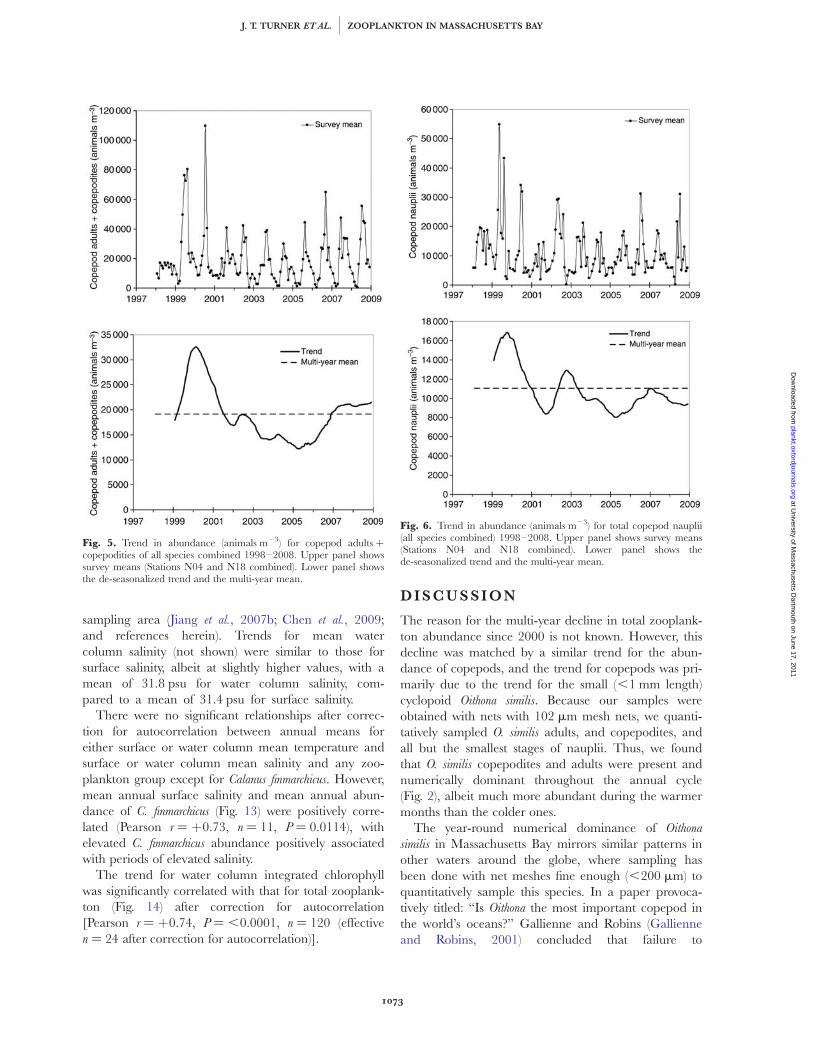
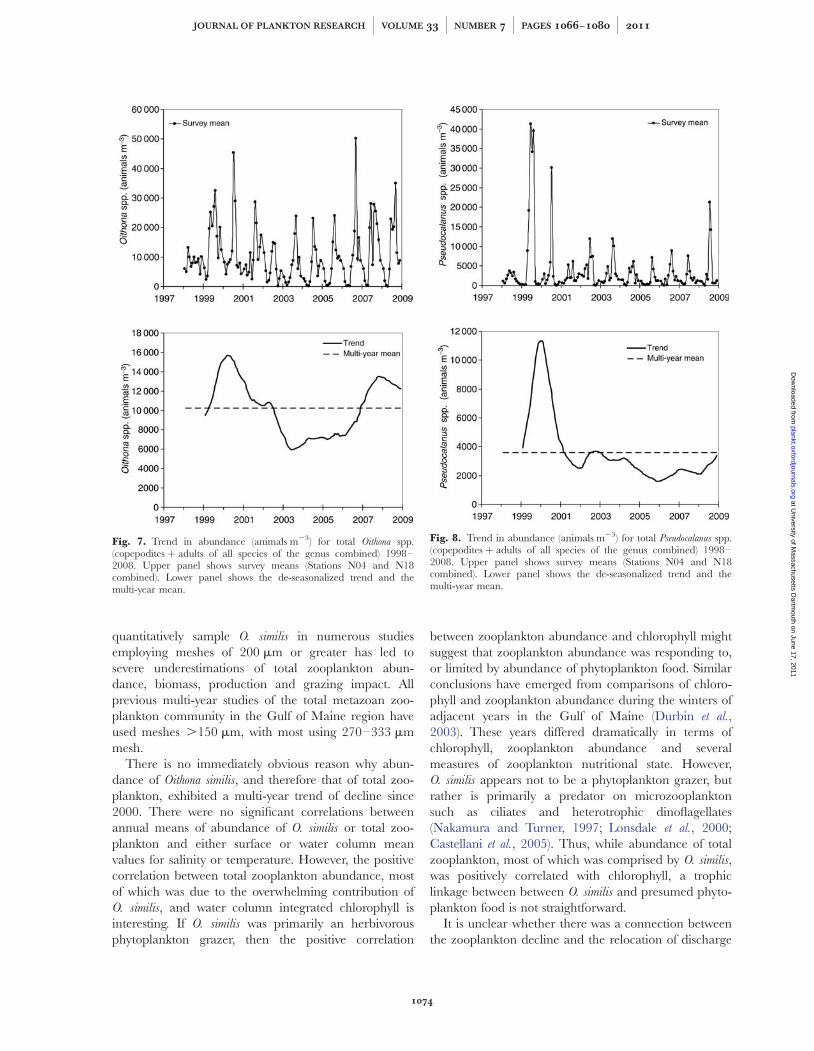
The trend for total zooplankton (Fig. 3) was similar tothe trend for total copepods (Fig. 4), with a significantcorrelation (Pearson r ¼ þ0.98, P ¼ 0.0017) betweenthe total zooplankton and total copepod trends. Thetrend in total copepods covaried with the trend (Fig. 5) incopepod adults plus copepodites (Pearson r ¼ þ0.99,P ¼ 0.0014), but not copepod nauplii (Fig. 6). The trendin copepod adults plus copepodites was similar to thetrend (Fig. 7) in adults plus copepodites of Oithona spp.(Pearson r ¼ þ0.93, P ¼ 0.0221). The vast majority ofthe Oithona spp. specimens counted were copepodites ofO. similis. However, adults and copepodites of O. atlantica
were occasionally encountered. Although Oithona spp.were present year-round, they were most abundantduring the middle to late summer (Fig. 7, upper). The
Fig. 2. Survey means (animals m23) for Total Zooplankton, Total Copepods (nauplii þ copepodites þ adults) and Total Oithona similis(copepodites þ adults) for 1998–2008.
J. T. TURNER ET AL. j ZOOPLANKTON IN MASSACHUSETTS BAY
1071
at University of M
assachusetts Dartm
outh on June 17, 2011plankt.oxfordjournals.org
Dow
nloaded from
trend for Pseudocalanus spp. (Fig. 8) was also similar tothose for Oithona spp. and copepod adults plus copepo-dites, but abundance of Pseudocalanus spp. (Fig. 8, upper)was much lower than for Oithona spp. (Fig. 7, upper).Thus, the multi-year trend in abundance of total zoo-plankton appeared to be mainly due to the trend forcopepods, and the trend for copepods appeared to bedriven primarily by that of Oithona similis.
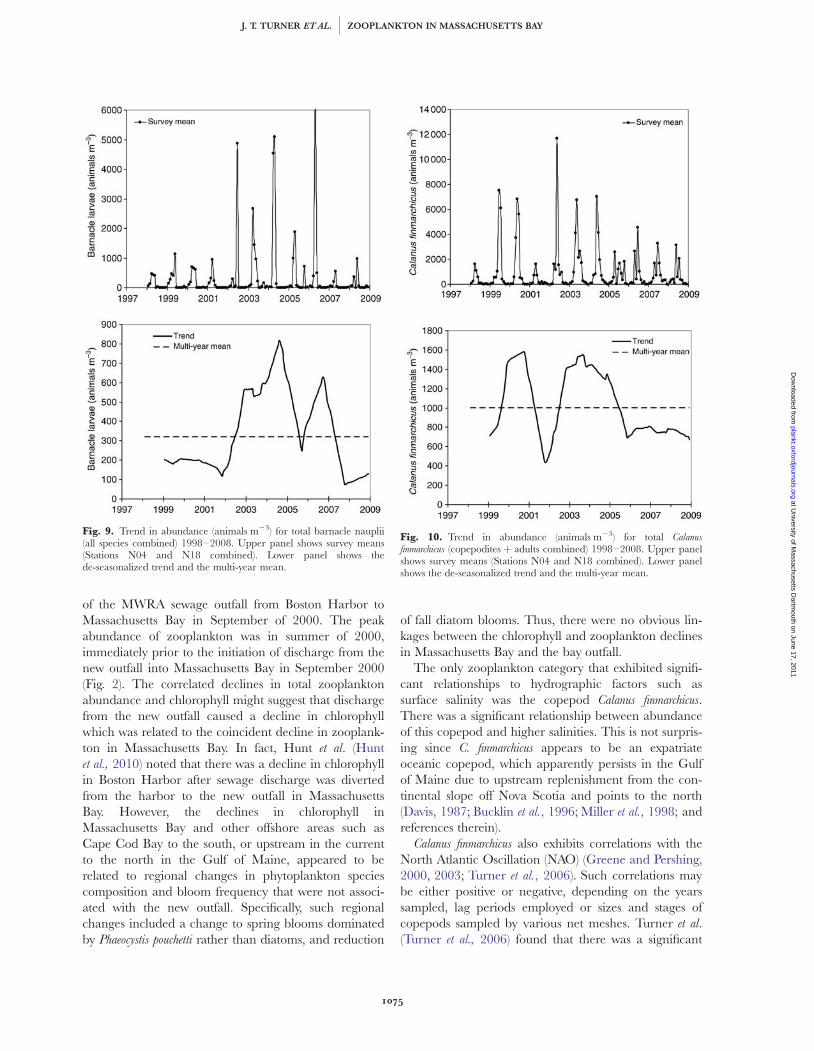
Not all taxa exhibited the trends noted for copepodsand Oithona spp. Barnacle nauplii (Fig. 9) were presentmainly in the winter and early spring (Fig. 9, upper),and had dramatically different peak levels of abundancein different years. Barnacle nauplii also were muchmore abundant in 2003 and 2004, and secondarily in2006 than in previous years.
The trend for Calanus finmarchicus (copepodites plusadults combined) exhibited high values in 1999 and2000, with a precipitous drop in 2001, followed by highvalues in 2002–2004, plunging to low values thereafter(Fig. 10).
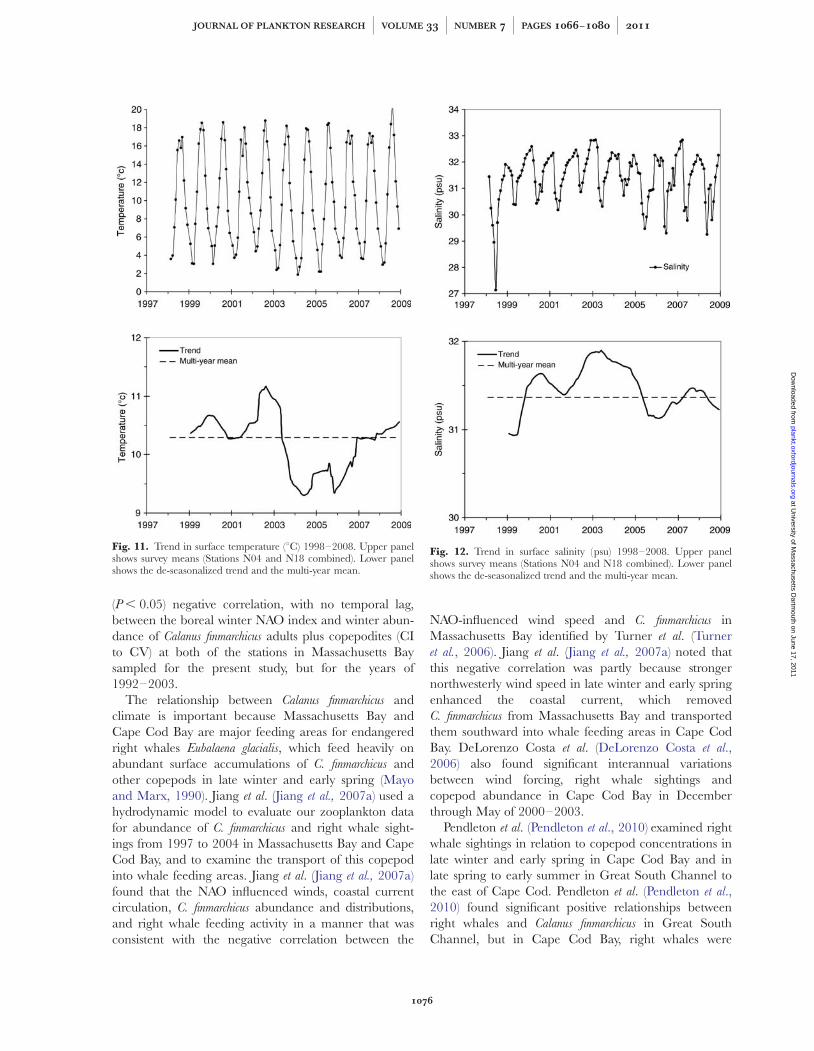
Mean surface temperatures (Fig. 11, upper) exhibitedpronounced seasonal variation with a range of values
from ,28C in some winters to levels .208C in somesummers. The surface temperature trend (Fig. 11,lower) was for values at or above the multi-year meanfrom 1998 to 2003, with values below the mean from2004 to 2007, increasing again in 2008. The trend formean water column temperature (not shown) wassimilar to that at the surface, with higher values prior to2003 than afterward.
Surface salinity was generally above the multi-yearmean during 2000–2004 and 2007 through early2008, but was below the multi-year mean during1999, 2005–2006 and late in 2008 (Fig. 12). Theextremely low surface salinity values in spring of1998 and the low values in springs of 2005–2007were due to major flooding events of the MerrimackRiver (described by MacDonald et al., 2007; Hetlandand MacDonald, 2008), which empties into thewestern Gulf of Maine immediately to the north ofMassachusetts Bay. During these spring flood events,the Western Maine Coastal Current typically flowssouthward into Massachusetts Bay and through the
Fig. 3. Trend in abundance (animals m23) for total zooplankton1998–2008. Upper panel shows survey means (Stations N04 and N18combined). Lower panel shows the de-seasonalized trend and themulti-year mean.
Fig. 4. Trend in abundance (animals m23) for total copepods(nauplii þ copepodites þ adults of all species combined) 1998–2008.Upper panel shows survey means (Stations N04 and N18 combined).Lower panel shows the de-seasonalized trend and the multi-yearmean.
JOURNAL OF PLANKTON RESEARCH j VOLUME 33 j NUMBER 7 j PAGES 1066–1080 j 2011
1072
at University of M
assachusetts Dartm
outh on June 17, 2011plankt.oxfordjournals.org
Dow
nloaded from
sampling area (Jiang et al., 2007b; Chen et al., 2009;and references herein). Trends for mean watercolumn salinity (not shown) were similar to those forsurface salinity, albeit at slightly higher values, with amean of 31.8 psu for water column salinity, com-pared to a mean of 31.4 psu for surface salinity.
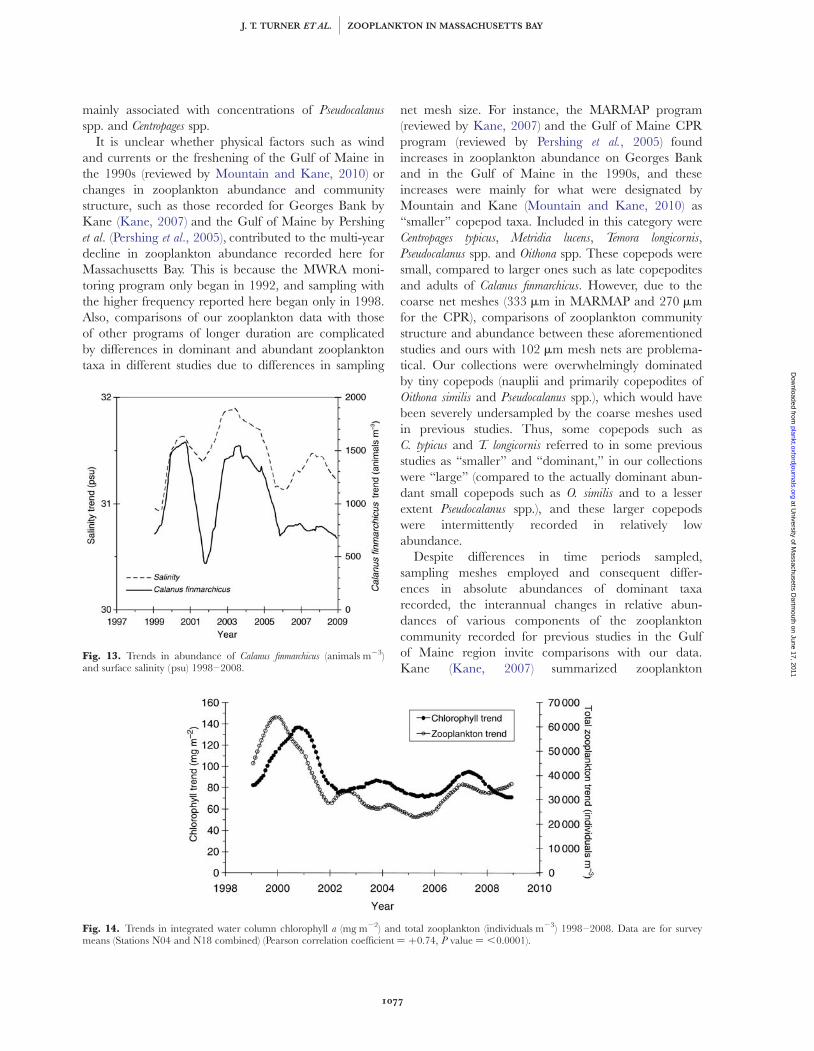
There were no significant relationships after correc-tion for autocorrelation between annual means foreither surface or water column mean temperature andsurface or water column mean salinity and any zoo-plankton group except for Calanus finmarchicus. However,mean annual surface salinity and mean annual abun-dance of C. finmarchicus (Fig. 13) were positively corre-lated (Pearson r ¼ þ0.73, n ¼ 11, P ¼ 0.0114), withelevated C. finmarchicus abundance positively associatedwith periods of elevated salinity.
The trend for water column integrated chlorophyllwas significantly correlated with that for total zooplank-ton (Fig. 14) after correction for autocorrelation[Pearson r ¼ þ0.74, P ¼ ,0.0001, n ¼ 120 (effectiven ¼ 24 after correction for autocorrelation)].
D I S C U S S I O N
The reason for the multi-year decline in total zooplank-ton abundance since 2000 is not known. However, thisdecline was matched by a similar trend for the abun-dance of copepods, and the trend for copepods was pri-marily due to the trend for the small (,1 mm length)cyclopoid Oithona similis. Because our samples wereobtained with nets with 102 mm mesh nets, we quanti-tatively sampled O. similis adults, and copepodites, andall but the smallest stages of nauplii. Thus, we foundthat O. similis copepodites and adults were present andnumerically dominant throughout the annual cycle(Fig. 2), albeit much more abundant during the warmermonths than the colder ones.
The year-round numerical dominance of Oithona
similis in Massachusetts Bay mirrors similar patterns inother waters around the globe, where sampling hasbeen done with net meshes fine enough (,200 mm) toquantitatively sample this species. In a paper provoca-tively titled: “Is Oithona the most important copepod inthe world’s oceans?” Gallienne and Robins (Gallienneand Robins, 2001) concluded that failure to
Fig. 5. Trend in abundance (animals m23) for copepod adults þcopepodities of all species combined 1998–2008. Upper panel showssurvey means (Stations N04 and N18 combined). Lower panel showsthe de-seasonalized trend and the multi-year mean.
Fig. 6. Trend in abundance (animals m23) for total copepod nauplii(all species combined) 1998–2008. Upper panel shows survey means(Stations N04 and N18 combined). Lower panel shows thede-seasonalized trend and the multi-year mean.
J. T. TURNER ET AL. j ZOOPLANKTON IN MASSACHUSETTS BAY
1073
at University of M
assachusetts Dartm
outh on June 17, 2011plankt.oxfordjournals.org
Dow
nloaded from
quantitatively sample O. similis in numerous studiesemploying meshes of 200 mm or greater has led tosevere underestimations of total zooplankton abun-dance, biomass, production and grazing impact. Allprevious multi-year studies of the total metazoan zoo-plankton community in the Gulf of Maine region haveused meshes .150 mm, with most using 270–333 mmmesh.
There is no immediately obvious reason why abun-dance of Oithona similis, and therefore that of total zoo-plankton, exhibited a multi-year trend of decline since2000. There were no significant correlations betweenannual means of abundance of O. similis or total zoo-plankton and either surface or water column meanvalues for salinity or temperature. However, the positivecorrelation between total zooplankton abundance, mostof which was due to the overwhelming contribution ofO. similis, and water column integrated chlorophyll isinteresting. If O. similis was primarily an herbivorousphytoplankton grazer, then the positive correlation
between zooplankton abundance and chlorophyll mightsuggest that zooplankton abundance was responding to,or limited by abundance of phytoplankton food. Similarconclusions have emerged from comparisons of chloro-phyll and zooplankton abundance during the winters ofadjacent years in the Gulf of Maine (Durbin et al.,2003). These years differed dramatically in terms ofchlorophyll, zooplankton abundance and severalmeasures of zooplankton nutritional state. However,O. similis appears not to be a phytoplankton grazer, butrather is primarily a predator on microzooplanktonsuch as ciliates and heterotrophic dinoflagellates(Nakamura and Turner, 1997; Lonsdale et al., 2000;Castellani et al., 2005). Thus, while abundance of totalzooplankton, most of which was comprised by O. similis,was positively correlated with chlorophyll, a trophiclinkage between between O. similis and presumed phyto-plankton food is not straightforward.
It is unclear whether there was a connection betweenthe zooplankton decline and the relocation of discharge
Fig. 7. Trend in abundance (animals m23) for total Oithona spp.(copepodites þ adults of all species of the genus combined) 1998–2008. Upper panel shows survey means (Stations N04 and N18combined). Lower panel shows the de-seasonalized trend and themulti-year mean.
Fig. 8. Trend in abundance (animals m23) for total Pseudocalanus spp.(copepodites þ adults of all species of the genus combined) 1998–2008. Upper panel shows survey means (Stations N04 and N18combined). Lower panel shows the de-seasonalized trend and themulti-year mean.
JOURNAL OF PLANKTON RESEARCH j VOLUME 33 j NUMBER 7 j PAGES 1066–1080 j 2011
1074
at University of M
assachusetts Dartm
outh on June 17, 2011plankt.oxfordjournals.org
Dow
nloaded from
of the MWRA sewage outfall from Boston Harbor toMassachusetts Bay in September of 2000. The peakabundance of zooplankton was in summer of 2000,immediately prior to the initiation of discharge from thenew outfall into Massachusetts Bay in September 2000(Fig. 2). The correlated declines in total zooplanktonabundance and chlorophyll might suggest that dischargefrom the new outfall caused a decline in chlorophyllwhich was related to the coincident decline in zooplank-ton in Massachusetts Bay. In fact, Hunt et al. (Huntet al., 2010) noted that there was a decline in chlorophyllin Boston Harbor after sewage discharge was divertedfrom the harbor to the new outfall in MassachusettsBay. However, the declines in chlorophyll inMassachusetts Bay and other offshore areas such asCape Cod Bay to the south, or upstream in the currentto the north in the Gulf of Maine, appeared to berelated to regional changes in phytoplankton speciescomposition and bloom frequency that were not associ-ated with the new outfall. Specifically, such regionalchanges included a change to spring blooms dominatedby Phaeocystis pouchetti rather than diatoms, and reduction
of fall diatom blooms. Thus, there were no obvious lin-kages between the chlorophyll and zooplankton declinesin Massachusetts Bay and the bay outfall.
The only zooplankton category that exhibited signifi-cant relationships to hydrographic factors such assurface salinity was the copepod Calanus finmarchicus.There was a significant relationship between abundanceof this copepod and higher salinities. This is not surpris-ing since C. finmarchicus appears to be an expatriateoceanic copepod, which apparently persists in the Gulfof Maine due to upstream replenishment from the con-tinental slope off Nova Scotia and points to the north(Davis, 1987; Bucklin et al., 1996; Miller et al., 1998; andreferences therein).
Calanus finmarchicus also exhibits correlations with theNorth Atlantic Oscillation (NAO) (Greene and Pershing,2000, 2003; Turner et al., 2006). Such correlations maybe either positive or negative, depending on the yearssampled, lag periods employed or sizes and stages ofcopepods sampled by various net meshes. Turner et al.(Turner et al., 2006) found that there was a significant
Fig. 9. Trend in abundance (animals m23) for total barnacle nauplii(all species combined) 1998–2008. Upper panel shows survey means(Stations N04 and N18 combined). Lower panel shows thede-seasonalized trend and the multi-year mean.
Fig. 10. Trend in abundance (animals m23) for total Calanusfinmarchicus (copepodites þ adults combined) 1998–2008. Upper panelshows survey means (Stations N04 and N18 combined). Lower panelshows the de-seasonalized trend and the multi-year mean.
J. T. TURNER ET AL. j ZOOPLANKTON IN MASSACHUSETTS BAY
1075
at University of M
assachusetts Dartm
outh on June 17, 2011plankt.oxfordjournals.org
Dow
nloaded from
(P , 0.05) negative correlation, with no temporal lag,between the boreal winter NAO index and winter abun-dance of Calanus finmarchicus adults plus copepodites (CIto CV) at both of the stations in Massachusetts Baysampled for the present study, but for the years of1992–2003.
The relationship between Calanus finmarchicus andclimate is important because Massachusetts Bay andCape Cod Bay are major feeding areas for endangeredright whales Eubalaena glacialis, which feed heavily onabundant surface accumulations of C. finmarchicus andother copepods in late winter and early spring (Mayoand Marx, 1990). Jiang et al. (Jiang et al., 2007a) used ahydrodynamic model to evaluate our zooplankton datafor abundance of C. finmarchicus and right whale sight-ings from 1997 to 2004 in Massachusetts Bay and CapeCod Bay, and to examine the transport of this copepodinto whale feeding areas. Jiang et al. (Jiang et al., 2007a)found that the NAO influenced winds, coastal currentcirculation, C. finmarchicus abundance and distributions,and right whale feeding activity in a manner that wasconsistent with the negative correlation between the
NAO-influenced wind speed and C. finmarchicus inMassachusetts Bay identified by Turner et al. (Turneret al., 2006). Jiang et al. (Jiang et al., 2007a) noted thatthis negative correlation was partly because strongernorthwesterly wind speed in late winter and early springenhanced the coastal current, which removedC. finmarchicus from Massachusetts Bay and transportedthem southward into whale feeding areas in Cape CodBay. DeLorenzo Costa et al. (DeLorenzo Costa et al.,2006) also found significant interannual variationsbetween wind forcing, right whale sightings andcopepod abundance in Cape Cod Bay in Decemberthrough May of 2000–2003.
Pendleton et al. (Pendleton et al., 2010) examined rightwhale sightings in relation to copepod concentrations inlate winter and early spring in Cape Cod Bay and inlate spring to early summer in Great South Channel tothe east of Cape Cod. Pendleton et al. (Pendleton et al.,2010) found significant positive relationships betweenright whales and Calanus finmarchicus in Great SouthChannel, but in Cape Cod Bay, right whales were
Fig. 11. Trend in surface temperature (8C) 1998–2008. Upper panelshows survey means (Stations N04 and N18 combined). Lower panelshows the de-seasonalized trend and the multi-year mean.
Fig. 12. Trend in surface salinity (psu) 1998–2008. Upper panelshows survey means (Stations N04 and N18 combined). Lower panelshows the de-seasonalized trend and the multi-year mean.
JOURNAL OF PLANKTON RESEARCH j VOLUME 33 j NUMBER 7 j PAGES 1066–1080 j 2011
1076
at University of M
assachusetts Dartm
outh on June 17, 2011plankt.oxfordjournals.org
Dow
nloaded from
mainly associated with concentrations of Pseudocalanus
spp. and Centropages spp.It is unclear whether physical factors such as wind
and currents or the freshening of the Gulf of Maine inthe 1990s (reviewed by Mountain and Kane, 2010) orchanges in zooplankton abundance and communitystructure, such as those recorded for Georges Bank byKane (Kane, 2007) and the Gulf of Maine by Pershinget al. (Pershing et al., 2005), contributed to the multi-yeardecline in zooplankton abundance recorded here forMassachusetts Bay. This is because the MWRA moni-toring program only began in 1992, and sampling withthe higher frequency reported here began only in 1998.Also, comparisons of our zooplankton data with thoseof other programs of longer duration are complicatedby differences in dominant and abundant zooplanktontaxa in different studies due to differences in sampling
net mesh size. For instance, the MARMAP program(reviewed by Kane, 2007) and the Gulf of Maine CPRprogram (reviewed by Pershing et al., 2005) foundincreases in zooplankton abundance on Georges Bankand in the Gulf of Maine in the 1990s, and theseincreases were mainly for what were designated byMountain and Kane (Mountain and Kane, 2010) as“smaller” copepod taxa. Included in this category wereCentropages typicus, Metridia lucens, Temora longicornis,Pseudocalanus spp. and Oithona spp. These copepods weresmall, compared to larger ones such as late copepoditesand adults of Calanus finmarchicus. However, due to thecoarse net meshes (333 mm in MARMAP and 270 mmfor the CPR), comparisons of zooplankton communitystructure and abundance between these aforementionedstudies and ours with 102 mm mesh nets are problema-tical. Our collections were overwhelmingly dominatedby tiny copepods (nauplii and primarily copepodites ofOithona similis and Pseudocalanus spp.), which would havebeen severely undersampled by the coarse meshes usedin previous studies. Thus, some copepods such asC. typicus and T. longicornis referred to in some previousstudies as “smaller” and “dominant,” in our collectionswere “large” (compared to the actually dominant abun-dant small copepods such as O. similis and to a lesserextent Pseudocalanus spp.), and these larger copepodswere intermittently recorded in relatively lowabundance.
Despite differences in time periods sampled,sampling meshes employed and consequent differ-ences in absolute abundances of dominant taxarecorded, the interannual changes in relative abun-dances of various components of the zooplanktoncommunity recorded for previous studies in the Gulfof Maine region invite comparisons with our data.Kane (Kane, 2007) summarized zooplankton
Fig. 14. Trends in integrated water column chlorophyll a (mg m22) and total zooplankton (individuals m23) 1998–2008. Data are for surveymeans (Stations N04 and N18 combined) (Pearson correlation coefficient ¼ þ0.74, P value ¼ ,0.0001).
Fig. 13. Trends in abundance of Calanus finmarchicus (animals m23)and surface salinity (psu) 1998–2008.
J. T. TURNER ET AL. j ZOOPLANKTON IN MASSACHUSETTS BAY
1077
at University of M
assachusetts Dartm
outh on June 17, 2011plankt.oxfordjournals.org
Dow
nloaded from
abundance trends from the MARMAP program onGeorges Bank for 1977–2004. Three species ofcopepods (Centropages typicus, Metridia lucens and Temora
longicornis) had similar interannual abundance pat-terns. These species increased over previous levels inthe early 1990s, remained high through 2001 anddeclined sharply in 2002–2004. Conversely, Calanus
finmarchicus increased above previous levels sharply in2003 and 2004. Kane (Kane, 2007) found that sal-inity was lower than previously throughout most ofthe 1990s. Further, salinity and an index of phyto-plankton color related to chlorophyll were negativelycorrelated throughout most of the 1990s. Kane(Kane, 2007) noted that the increases in abundanceof the aforementioned trio of copepod species in the1990s coincided with freshening of the Gulf ofMaine, due to increased inflow of lower salinitywater from the Scotian Shelf, and that these threespecies sharply declined in abundance in 2002 aftersalinity increased from a decade of lower levels.
Pershing et al. (Pershing et al., 2005) summarizedinterannual changes in zooplankton from the Gulf ofMaine CPR program over most of the period from1961 to 2003. This program also recorded increases inthe 1990s through 2001 of the copepods Centropages
typicus, Metridia lucens, Pseudocalanus spp. and Oithona spp.,followed by rapid declines in 2002 and 2003. Pershinget al. (Pershing et al., 2005) suggested that the reducedsalinities of the 1990s may have contributed to theincreases in these copepod species. The proposed mech-anism was lower salinity promoting increased stratifica-tion with enhanced primary productivity and increasedzooplankton production.
How do the patterns recorded for the MARMAPand Gulf of Maine CPR programs compare withours? Although these programs overlap in time withours only for 1998 through 2004, all three studiesnoted declines in “small” copepods beginning around2000–2001. Further, all three programs noted eitherincreases or continued high abundance of Calanus
finmarchicus coinciding with higher salinities for mostof the period of 2002 through 2004. Finally, our cor-related trends for declines in zooplankton and chloro-phyll levels from 2000 to 2004 are similar to thoserecorded by Kane (Kane, 2007) for the MARMAPprogram.
While small copepods were the most consistentlyabundant and dominant components of the plankton inour study, there were intermittent and sporadicallyabundant peaks of meroplankters, such as barnaclenauplii. The different levels of abundance of barnaclenauplii likely reflect the sampling schedule capturingephemeral late-winter to early-spring peaks in
abundance of these larvae in the plankton (Pineda et al.,2002). Such peaks likely occurred during the first fewdays after spawning when larvae numerically dominatedthe zooplankton, before settling into a permanentbenthic existence.
In summary, the metazoan zooplankton ofMassachusetts Bay exhibited substantial seasonal andinterannual variability in abundance, but not in compo-sition. The zooplankton was numerically dominated bydevelopmental stages and adults of a few taxa of smallcopepods, primarily the cyclopoid copepod Oithona
similis, and secondarily calanoid copepods of the genusPseudocalanus. Over the sampling period from 1998 to2008, there was a decline in abundance of total zoo-plankton abundance since 2000, and this trend appearsto have been driven primarily by the trend for cope-pods, especially the trend in O. similis abundance. Thereasons for this zooplankton decline remain unclear, butthere was no significant correlation with either surfacetemperature or surface salinity. There was, however, asignificant positive correlation between total zooplank-ton abundance and water column integrated chloro-phyll. The zooplankton decline was not obviouslyrelated to the conversion of Boston’s sewage effluentfrom primary to secondary treatment and relocation ofthe discharge site from Boston Harbor to MassachusettsBay. Also, the decline was not clearly related to naturalhydrographic or climatic parameters such as the fresh-ening of the Gulf of Maine in the earlier 1990s(Mountain and Kane, 2010). Comparisons of ourresults with previous zooplankton studies in the Gulf ofMaine are complicated by different patterns of zoo-plankton abundance and community structure partlyaffected by differences in sampling net meshes. Ourresults, and those of previous studies, highlight theimportance of multi-year sampling in order to under-stand fluctuating trends in seasonally variable coastalwaters.
AC K N OW L E D G E M E N T S
We thank the numerous people at Battelle who partici-pated in sample collection, data management andanalysis.
F U N D I N G
This work was supported by the Massachusetts WaterResources Authority (MWRA). One of us (D.G.B.)acknowledges the support of EPA Science to AchieveResults (STAR) grant #RD 83244301.
JOURNAL OF PLANKTON RESEARCH j VOLUME 33 j NUMBER 7 j PAGES 1066–1080 j 2011
1078
at University of M
assachusetts Dartm
outh on June 17, 2011plankt.oxfordjournals.org
Dow
nloaded from
R E F E R E N C E S
Bigelow, H. B. (1926) Plankton of the offshore waters of the Gulf ofMaine. Bull. US Bur. Fish., 40, 1–509.
Broekhuizen, N. and McKenzie, E. (1995) Patterns of abundance forCalanus and smaller copepods in the North Sea: time seriesdecomposition of two CPR data sets. Mar. Ecol. Prog. Ser., 118,103–120.
Bucklin, A., Sundt, R. C. and Dahle, G. (1996) The population gen-etics of Calanus finmarchicus in the North Atlantic. Ophelia, 44,29–45.
Castellani, C., Irigoien, X., Harris, R. P. et al. (2005) Feeding and eggproduction of Oithona similis in the North Atlantic. Mar. Ecol. Prog.
Ser., 288, 173–182.
Chen, F., MacDonald, D. G. and Hetland, R. D. (2009) Lateralspreading of a near-field river plume: observations and numericalsimulations. J. Geophys. Res., 114, C07013, doi:10.1029/2008JC004893.
Davis, C. S. (1987) Zooplankton life cycles. In Backus, R. H. (ed.),Georges Bank. MIT Press, Cambridge, MA, pp. 256–267.
DeLorenzo Costa, A., Durbin, E. G., Mayo, C. A. et al. (2006)Environmental factors affecting zooplankton in Cape Cod Bay:implications for right whale dynamics. Mar. Ecol. Prog. Ser., 323,281–298.
Durbin, E. G., Campbell, R. G., Casas. et al. (2003) Interannualvariation in phytoplankton blooms and zooplankton productivityand abundance in the Gulf of Maine during winter. Mar. Ecol. Prog.
Ser., 254, 81–100.
Frank, K. T., Petrie, B., Choi, J. S. et al. (2005) Trophic cascadesin a formerly cod-dominated ecosystem. Science, 308,1621–1623.
Frost, B. W. (1989) A taxonomy of the marine calanoid copepod genusPseudocalanus. Can. J. Zool., 67, 525–551.
Gallienne, C. P. and Robins, D. B. (2001) Is Oithona the most impor-tant copepod in the world’s oceans? J. Plankton Res., 23,1421–1432.
Greene, C. H., Block, B. A., Welch, D. et al. (2009b) Advances in con-servation oceanography. Oceanography, 22, 210–223.
Greene, C. H., Monger, B. C. and McGarry, L. P. (2009a) Some likeit cold. Science, 324, 733–734.
Greene, C. H. and Pershing, A. J. (2000) The response of Calanus fin-
marchicus populations to climate variability in the NorthwestAtlantic: basin-scale forcing associated with the North AtlanticOscillation. ICES J. Mar. Sci., 57, 1536–1544.
Greene, C. H. and Pershing, A. J. (2003) The flip-side of the NorthAtlantic Oscillation and modal shifts in slope-water circulation pat-terns. Limnol. Oceanogr., 48, 319–322.
Greene, C. H. and Pershing, A. J. (2004) Climate and the conserva-tion biology of North Atlantic right whales: the right whale at thewrong time? Front. Ecol. Environ., 2, 29–34.
Greene, C. H. and Pershing, A. J. (2007) Climate drives sea change.Science, 315, 1084–1085.
Greene, C. H., Pershing, A. J., Cronin, T. M. et al. (2008) Arcticclimate change and its impacts on the ecology of the NorthAtlantic. Ecology, 89(suppl.), S24–S38.
Halpern, B. S., Walbridge, S., Selkoe, K. A. et al. (2008) A global mapof human impact on marine ecosystems. Science, 319, 948–952.
Hetland, R. D. and MacDonald, D. G. (2008) Spreading in the near-field Merrimack River plume. Ocean. Model., 21, 12–21.
Hunt, C. D., Borkman, D. G., Turner, J. T. et al. (2010) Phytoplanktonpatterns in Massachusetts Bay—1992–2007. Estuarine Coasts, 33,448–470.
Ji, R., Edwards, M., Mackas, D. L. et al. (2010) Marine planktonphenology and life history in a changing climate: current researchand future directions. J. Plankton Res., 32, 1355–1368.
Jiang, M., Brown, M. W., Turner, J. T. et al. (2007a) Springtime trans-port and retention of Calanus finmarchicus in Massachusetts and CapeCod Bays, USA, and implications for right whale foraging. Mar.
Ecol. Prog. Ser., 349, 183–197.
Jiang, M., Zhou, M., Libby, P. S. et al. (2007b) Influences of the Gulfof Maine intrusion on the Massachusetts Bay spring bloom: a com-parison between 1998 and 2000. Cont. Shelf Res., 27, 2465–2485.
Kane, J. (2007) Zooplankton abundance trends on Georges Bank,1977–2004. ICES J. Mar. Sci., 64, 909–919.
Kelly, J. R. (1997) Nitrogen flow and the interaction of Boston Harborwith Massachusetts Bay. Estuaries, 20, 365–380.
Kelly, J. R. (1998) Quantification and potential role of ocean nutrientloading to Boston Harbor, Massachusetts, USA. Mar. Ecol. Prog. Ser.,173, 53–65.
Kelly, J. R. and Doering, P. H. (1997) Monitoring and modelingprimary production in coastal waters: studies in Massachusetts Bay1992–1994. Mar. Ecol. Prog. Ser., 148, 155–168.
Kropp, R. K., Turner, J. T., Borkman, D. et al. (2003) A Review of
Zooplankton Communities in the Massachusetts Bay/Cape Cod Bay system.Massachusetts Water Resources Authority, Boston. ReportENQUAD 2003–06. 39 pp. plus appendices.
Lonsdale, D. J., Caron, D. A., Dennet, M. R. et al. (2000) Predationby Oithona spp. on protozooplankton in the Ross Sea, Antarctica.Deep-Sea Res. II, 47, 3273–3283.
Lough, R. G. and Mountain, D. G. (1996) Effect of small-scale turbu-lence on feeding rates of larval cod and haddock in stratified wateron Georges Bank. Deep-Sea Res. II, 43, 1745–1772.
MacDonald, D. G., Goodman, L. and Hetland, R. D. (2007)Turbulent dissipation in a near-field river plume: a comparison ofcontrol volume and microstructure observations with a numericalmodel. J. Geophys. Res., 112, C07026, doi:10.1029/2006JC004075.
Mayo, C. A. and Marx, M. K. (1990) Surface foraging behavior ofthe North Atlantic right whale, Eubalaena glacialis, and associatedzooplankton characteristics. Can. J. Zool., 68, 2214–2220.
Miller, C. B., Lynch, D. R., Carlotti, F. et al. (1998) Coupling of anindividual based population dynamic model of Calanus finmarchicus
to a circulation model for the Georges Bank region. Fish. Oceanogr.,7, 219–234.
Mountain, D. G. and Kane, J. (2010) Major changes in the GeorgesBank ecosystem, 1980s to the 1990s. Mar. Ecol. Prog. Ser., 398,81–91.
Nakamura, Y. and Turner, J. T. (1997) Predation and respiration bythe small cyclopoid copepod Oithona similis: how important isfeeding on ciliates and heterotrophic dinoflagellates? J. Plankton Res.,19, 1275–1288.
Pendleton, D. E., Pershing, A. J., Brown, M. W. et al. (2010)Regional-scale mean copepod concentration indicates relative abun-dance of North Atlantic right whales. Mar. Ecol. Prog. Ser., 378,211–225.
J. T. TURNER ET AL. j ZOOPLANKTON IN MASSACHUSETTS BAY
1079
at University of M
assachusetts Dartm
outh on June 17, 2011plankt.oxfordjournals.org
Dow
nloaded from
Pershing, A. J., Greene, C. H., Jossi, J. W. et al. (2005) Interdecadalvariability in the Gulf of Maine zooplankton community, withpotential impacts on fish recruitment. ICES J. Mar. Sci., 62,1511–1523.
Pershing, A. J., Greene, C. H., Planque, B. et al. (2004) The influencesof climate variability on North Atlantic zooplankton populations. InStenseth, N. C., Ottersen, G., Hurrell, J. W. et al. (eds), Marine
Ecosystems and Climate Variation. The North Atlantic. A Comparative
Perspective. Oxford University Press, Oxford, UK, pp. 59–69.
Pineda, J., Riebensahm, D. and Medeiros-Bergen, D. (2002)Semibalanus balanoides in winter and spring: larval concentration,settlement, and substrate occupancy. Mar. Biol., 140, 789–800.
Quenouille, M. H. (1952) Associated Measurements. Butterworths,London, 241 pp.
Sherman, K., Jaworski, N. A. and Smayda, T. J. (eds) (1996) The
Northeast Shelf Ecosystem. Assessment, Sustainability, and Management.Blackwell Science, Cambridge, MA, 564 pp.
Signell, R. P., Jenter, H. L. and Blumberg, A. F. (2000) Predicting thephysical effects of relocating Boston’s sewage outfall. Estuarine Coastal
Shelf Sci., 50, 59–72.
Taylor, D. I. (2010) The Boston Harbor Project, and large decreasesin loadings of eutrophication-related materials to Boston Harbor.Mar. Pollut. Bull., 60, 609–619.
Turner, J. T. (1984) The feeding ecology of some zooplankters thatare important prey items of larval fish. NOAA Tech. Rep. NMFS,7, 1–28.
Turner, J. T. (1994) Planktonic copepods of Boston Harbor,Massachusetts Bay and Cape Cod Bay, 1992. In Ferrari, F. D. andBradley, B. P. (eds.), Ecology and morphology of copepods. Hydrobiologia,292/293, 405–413.
Turner, J. T. (2003) Appendix I of Kropp et al. 2003, 62 pp.
Turner, J. T. (2004) The importance of small planktonic copepodsand their roles in pelagic marine food webs. Zool. Stud., 43,255–266.
Turner, J. T., Borkman, D. G. and Hunt, C. D. (2006) Zooplankton ofMassachusetts Bay, USA, 1992–2003: relationships between thecopepod Calanus finmarchicus and the North Atlantic Oscillation. Mar.
Ecol. Prog. Ser., 311, 115–124.
Uye, S. (1994) Replacement of large copepods by small ones witheutrophication of embayments: cause and consequence. In Ferrari,F.D. and Bradley, B.P. (eds.) Ecology and morphology of copepods.Hydrobiologia, 292/293, 513–519.
Wiebe, P. H., Beardsley, R. C., Mountain, D. et al. (2006)Dynamics of plankton and larval fish populations on GeorgesBank, the North Atlantic U.S. GLOBEC study site. Deep-Sea Res.
II, 53, 2455–2832.
JOURNAL OF PLANKTON RESEARCH j VOLUME 33 j NUMBER 7 j PAGES 1066–1080 j 2011
1080
at University of M
assachusetts Dartm
outh on June 17, 2011plankt.oxfordjournals.org
Dow
nloaded from
Related Documents