Welcome message from author
This document is posted to help you gain knowledge. Please leave a comment to let me know what you think about it! Share it to your friends and learn new things together.
Transcript
Zoomed Ranking: Selection of Classi�cationAlgorithms Based on Relevant PerformanceInformationCarlos Soares and Pavel B. BrazdilLIACC/FEP, University of Porto, R. Campo Alegre 823, 4150-180 Porto, Portugalfcsoares,[email protected]. Given the wide variety of available classi�cation algorithmsand the volume of data today's organizations need to analyze, the selec-tion of the right algorithm to use on a new problem is an important issue.In this paper we present a combination of techniques to address this prob-lem. The �rst one, zooming, analyzes a given dataset and selects relevant(similar) datasets that were processed by the candidate algoritms in thepast. This process is based on the concept of \distance", calculated onthe basis of several dataset characteristics. The information about theperformance of the candidate algorithms on the selected datasets is thenprocessed by a second technique, a ranking method. Such a method usesperformance information to generate advice in the form of a ranking,indicating which algorithms should be applied in which order. Here wepropose the adjusted ratio of ratios ranking method. This method takesinto account not only accuracy but also the time performance of the can-didate algorithms. The generalization power of this ranking method isanalyzed. For this purpose, an appropriate methodology is de�ned. Theexperimental results indicate that on average better results are obtainedwith zooming than without it.1 IntroductionThe need for methods which would assist the user in selecting classi�cationalgorithms for a new problem has frequently been recognized as an importantissue in the �elds of Machine Learning (ML) [13, 5] and Knowledge Discovery inDatabases (KDD) [3].Previous meta-learning approaches to algorithm selection consist of suggest-ing one algorithm or a small group of algorithms that are expected to performwell on the given problem [4, 21, 10]. We believe that a more informative and exible solution is to provide rankings of the candidate algorithms [15, 19, 5]. Aranking can be used to select just one algorithm, i.e. the one for which the bestresults are expected. However, if enough resources are available, more than onealgorithms may be applied on the given problem.The problem of constructing rankings can be seen as an alternative to otherML methods, such as classi�cation and regression. Therefore, we must develop
methods to generate rankings and also methodologies to evaluate and comparesuch methods [5].Recently, several methods that generate rankings of algorithms based on theirpast performance have been developed with promising results. Some are basedonly on accuracy [5], others on accuracy and time [19]. So far, these methodswere used without taking the dataset which the ranking was intended for intoaccount. That is, given a new dataset, a ranking was generated by processingall available performance information. However, considering the NFL theoremwe cannot expect that all that information is relevant for the problem at hand.Therefore, we do not expect that rankings generated this way accurately repre-sent the relative performance of the algorithms on the new problem.We, therefore, address the problem of algorithm selection by dividing it intotwo distinct phases. In the �rst one we identify a subset of relevant datasets. Forthat purpose we present a technique called zooming. It employs the k-NearestNeighbor algorithm with a distance function based on a set of statistical, infor-mation theoretic and other dataset characterizationmeasures to identify datasetsthat are similar to the one at hand. More details concerning this are in Section 2.In the second phase we proceed to construct a ranking on the basis of theperformance information of the candidate algorithms on the selected datasets. InSection 3 we present the adjusted ratio of ratios ranking method. This methodprocesses performance information on accuracy and time. In Section 4 we eval-uate this approach by assessing the gains that can be attributed to zooming. Inthis analysis we assess the e�ect of varying the number of neighbors and adopt-ing di�erent compromises between the importance of accuracy and time. Finally,we describe some related work (Section 6) and present conclusions (Section 7).2 Selection of Relevant DatasetsAs explained earlier, the ranking of the candidate algorithms is preceded byselecting, from a set of previously processed datasets, those whose performanceinformation is expected to be relevant for the dataset at hand. The ranking isbased on that information. We refer to the selection process as zooming, because,given the space of all previously processed datasets, it enables us to focus on the\neighborhood" of the new one.The relevance of a processed dataset to the one at hand is de�ned in terms ofsimilarity between them, according to a set of measures (meta-attributes). It isgiven by function dist(di; dj) =Px �(vx;di ; vx;dj ) where di and dj are datasets,vx;di is the value of meta-attribute x for dataset di, and �(vx;di ; vx;dj ) is thedistance between the values of meta-attribute x for datasets di and dj . In or-der to give all meta-attributes the same weight, they are normalized in thefollowing way: �(vx;di ; vx;dj ) = jvx;di�vx;dj jmaxk 6=i(vx;dk )�mink 6=i(vx;dk ) , where maxk 6=i(vx;dk)calculates the maximum value of meta-attribute x for all datasets except di andmink 6=i(vx;dk) calculates the corresponding minimum. Note that, it may be thecase that a meta-attribute is not applicable on a dataset. For instance, if datasetdi has no numerical attributes then it makes no sense to calculate mean skew,
which is a statistical meta-attribute. It seems reasonable to say that, with re-spect to this attribute, dataset di is very close to dataset dj if dj does not haveany numerical attributes either. We have, thus, determined that � is 0 in thiscase. Furthermore, we can say that dataset di is quite di�erent from dataset dk ifthe latter has some numerical attributes. In this case � is assigned the maximumdistance, 1.The meta-attributes used were obtained with the Data Characterization Tool(DCT) [11]. They can be grouped into three categories: general, statistical andinformation theoretic measures. Examples of general measures used are numberof attributes and number of cases. As for the statistical measures, we includedmean skew and number of attributes with outliers, among others. Finally, someof the information theoretic measures are class entropy and noise-signal ratio. Afull listing of the measures used is given in the appendix.The meta-attributes used were chosen simply because they are provided byDCT and because they were used before for the same purpose [11]. We do notinvestigate whether they are appropriate or not, and if di�erent weights shouldbe assigned to them in the distance function, although these are questions thatwe plan to address in the future.The distance function de�ned is used as part of the k-Nearest Neighbor (kNN)algorithm to identify the datasets that are most similar to the one at hand. ThekNN algorithm is a simple instance-based learner [13]. Given a case, this algo-rithm simply selects k cases which are nearest to it according to some distancefunction.Performance information for the given candidate algorithms on the selecteddatasets is then used to construct a ranking. Several methods can be used forthat purpose [19, 5]. Details of one of them are given in the next section.3 Ranking Based on Accuracy and TimeIn the previous section we have explained how to select performance informationthat is relevant to the problem at hand. Here we explain how that informationcan be used to generate a ranking of the corresponding algorithms. Since thedatasets selected are similar to the one at hand, it is expected that algorithmsperform similarly. In other words, the method should provide us with a goodadvice for the selection of algorithms to apply on the dataset at hand.The ranking method presented here is referred to as the adjusted ratio ofratios (ARR) ranking method [19]. This method uses information about accuracyand total execution time to rank the given classi�cation algorithms. We start byde�ning the measure underlying the method and the parameter that determinesthe relative importance of time and accuracy. Next we describe how the methodworks. Finally we describe the experimental setup and give an example.Weighing Success Rates and Time: The ARR method is based on the ratio ofsuccess rate ratio and an adjusted time ratio:
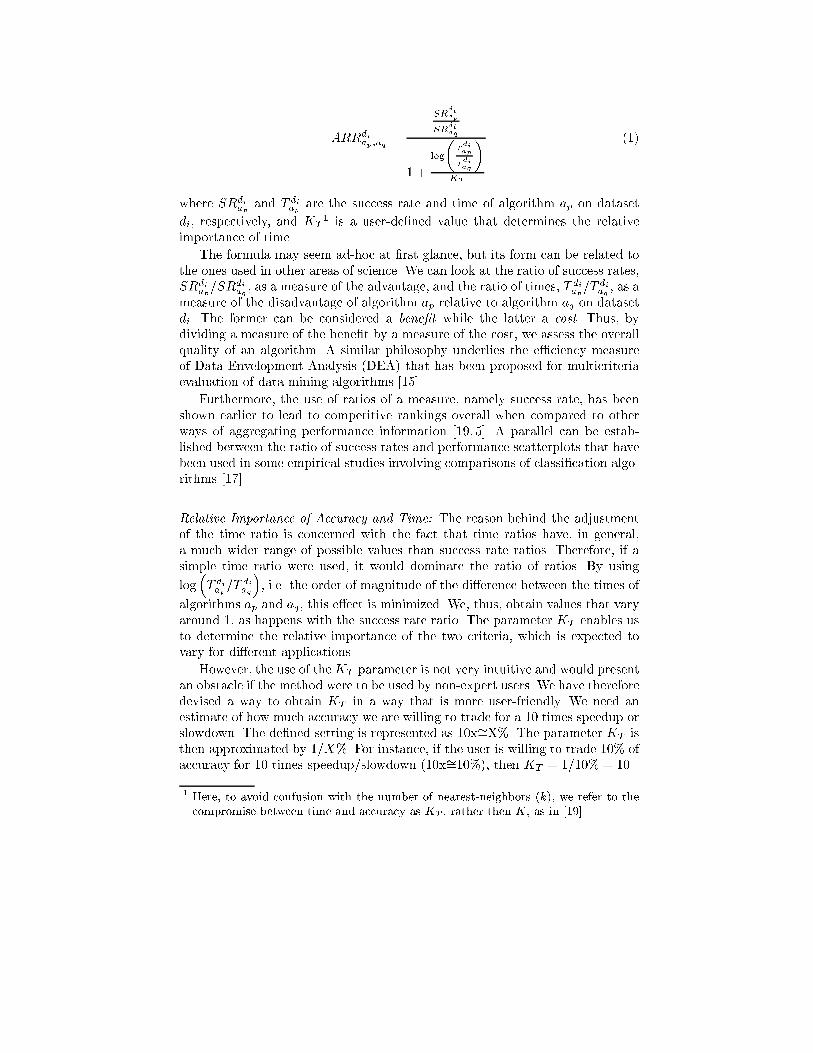
ARRdiap;aq = SRdiapSRdiaq1 + log�TdiapTdiaq �KT (1)where SRdiap and T diap are the success rate and time of algorithm ap on datasetdi, respectively, and KT 1 is a user-de�ned value that determines the relativeimportance of time.The formula may seem ad-hoc at �rst glance, but its form can be related tothe ones used in other areas of science. We can look at the ratio of success rates,SRdiap=SRdiaq , as a measure of the advantage, and the ratio of times, T diap=T diaq , as ameasure of the disadvantage of algorithm ap relative to algorithm aq on datasetdi. The former can be considered a bene�t while the latter a cost. Thus, bydividing a measure of the bene�t by a measure of the cost, we assess the overallquality of an algorithm. A similar philosophy underlies the e�ciency measureof Data Envelopment Analysis (DEA) that has been proposed for multicriteriaevaluation of data mining algorithms [15].Furthermore, the use of ratios of a measure, namely success rate, has beenshown earlier to lead to competitive rankings overall when compared to otherways of aggregating performance information [19, 5]. A parallel can be estab-lished between the ratio of success rates and performance scatterplots that havebeen used in some empirical studies involving comparisons of classi�cation algo-rithms [17].Relative Importance of Accuracy and Time: The reason behind the adjustmentof the time ratio is concerned with the fact that time ratios have, in general,a much wider range of possible values than success rate ratios. Therefore, if asimple time ratio were used, it would dominate the ratio of ratios. By usinglog�T diap=T diaq�, i.e. the order of magnitude of the di�erence between the times ofalgorithms ap and aq, this e�ect is minimized. We, thus, obtain values that varyaround 1, as happens with the success rate ratio. The parameter KT enables usto determine the relative importance of the two criteria, which is expected tovary for di�erent applications.However, the use of theKT parameter is not very intuitive and would presentan obstacle if the method were to be used by non-expert users. We have thereforedevised a way to obtain KT in a way that is more user-friendly. We need anestimate of how much accuracy we are willing to trade for a 10 times speedup orslowdown. The de�ned setting is represented as 10x�=X%. The parameter KT isthen approximated by 1=X%. For instance, if the user is willing to trade 10% ofaccuracy for 10 times speedup/slowdown (10x�=10%), then KT = 1=10% = 10.1 Here, to avoid confusion with the number of nearest-neighbors (k), we refer to thecompromise between time and accuracy as KT , rather then K, as in [19].
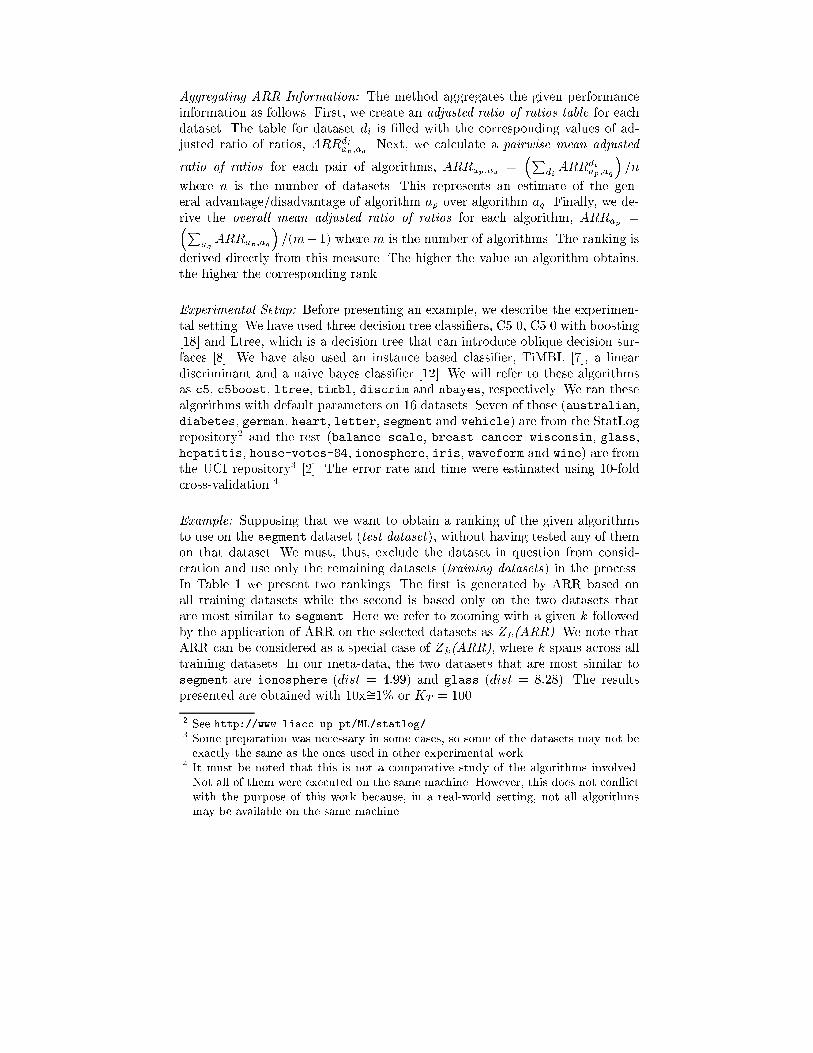
Aggregating ARR Information: The method aggregates the given performanceinformation as follows. First, we create an adjusted ratio of ratios table for eachdataset. The table for dataset di is �lled with the corresponding values of ad-justed ratio of ratios, ARRdiap;aq . Next, we calculate a pairwise mean adjustedratio of ratios for each pair of algorithms, ARRap;aq = �Pdi ARRdiap;aq� =nwhere n is the number of datasets. This represents an estimate of the gen-eral advantage/disadvantage of algorithm ap over algorithm aq. Finally, we de-rive the overall mean adjusted ratio of ratios for each algorithm, ARRap =�Paq ARRap;aq� =(m� 1) where m is the number of algorithms. The ranking isderived directly from this measure. The higher the value an algorithm obtains,the higher the corresponding rank.Experimental Setup: Before presenting an example, we describe the experimen-tal setting. We have used three decision tree classi�ers, C5.0, C5.0 with boosting[18] and Ltree, which is a decision tree that can introduce oblique decision sur-faces [8]. We have also used an instance based classi�er, TiMBL [7], a lineardiscriminant and a naive bayes classi�er [12]. We will refer to these algorithmsas c5, c5boost, ltree, timbl, discrim and nbayes, respectively. We ran thesealgorithms with default parameters on 16 datasets. Seven of those (australian,diabetes, german, heart, letter, segment and vehicle) are from the StatLogrepository2 and the rest (balance-scale, breast-cancer-wisconsin, glass,hepatitis, house-votes-84, ionosphere, iris, waveform and wine) are fromthe UCI repository3 [2]. The error rate and time were estimated using 10-foldcross-validation.4Example: Supposing that we want to obtain a ranking of the given algorithmsto use on the segment dataset (test dataset), without having tested any of themon that dataset. We must, thus, exclude the dataset in question from consid-eration and use only the remaining datasets (training datasets) in the process.In Table 1 we present two rankings. The �rst is generated by ARR based onall training datasets while the second is based only on the two datasets thatare most similar to segment. Here we refer to zooming with a given k followedby the application of ARR on the selected datasets as Z k(ARR). We note thatARR can be considered as a special case of Z k(ARR), where k spans across alltraining datasets. In our meta-data, the two datasets that are most similar tosegment are ionosphere (dist = 4:99) and glass (dist = 8:28). The resultspresented are obtained with 10x�=1% or KT = 100.2 See http://www.liacc.up.pt/ML/statlog/.3 Some preparation was necessary in some cases, so some of the datasets may not beexactly the same as the ones used in other experimental work.4 It must be noted that this is not a comparative study of the algorithms involved.Not all of them were executed on the same machine. However, this does not con ictwith the purpose of this work because, in a real-world setting, not all algorithmsmay be available on the same machine.
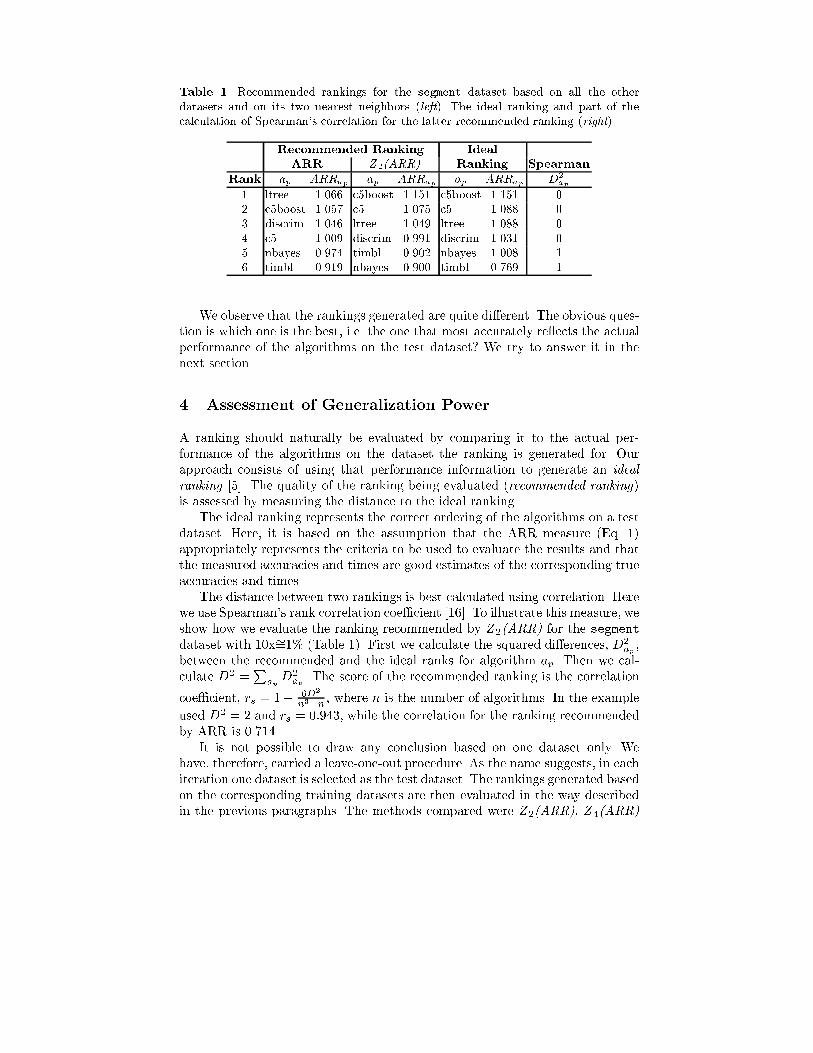
Table 1. Recommended rankings for the segment dataset based on all the otherdatasets and on its two nearest neighbors (left). The ideal ranking and part of thecalculation of Spearman's correlation for the latter recommended ranking (right)Recommended Ranking IdealARR Z 2(ARR) Ranking SpearmanRank ap ARRap ap ARRap ap ARRap D2ap1 ltree 1.066 c5boost 1.151 c5boost 1.151 02 c5boost 1.057 c5 1.075 c5 1.088 03 discrim 1.046 ltree 1.049 ltree 1.088 04 c5 1.009 discrim 0.991 discrim 1.031 05 nbayes 0.974 timbl 0.902 nbayes 1.008 16 timbl 0.919 nbayes 0.900 timbl 0.769 1We observe that the rankings generated are quite di�erent. The obvious ques-tion is which one is the best, i.e. the one that most accurately re ects the actualperformance of the algorithms on the test dataset? We try to answer it in thenext section.4 Assessment of Generalization PowerA ranking should naturally be evaluated by comparing it to the actual per-formance of the algorithms on the dataset the ranking is generated for. Ourapproach consists of using that performance information to generate an idealranking [5]. The quality of the ranking being evaluated (recommended ranking)is assessed by measuring the distance to the ideal ranking.The ideal ranking represents the correct ordering of the algorithms on a testdataset. Here, it is based on the assumption that the ARR measure (Eq. 1)appropriately represents the criteria to be used to evaluate the results and thatthe measured accuracies and times are good estimates of the corresponding trueaccuracies and times.The distance between two rankings is best calculated using correlation. Herewe use Spearman's rank correlation coe�cient [16]. To illustrate this measure, weshow how we evaluate the ranking recommended by Z 2(ARR) for the segmentdataset with 10x�=1% (Table 1). First we calculate the squared di�erences, D2ap ,between the recommended and the ideal ranks for algorithm ap. Then we cal-culate D2 =Pap D2ap . The score of the recommended ranking is the correlationcoe�cient, rs = 1� 6D2n3�n , where n is the number of algorithms. In the exampleused D2 = 2 and rs = 0:943, while the correlation for the ranking recommendedby ARR is 0.714.It is not possible to draw any conclusion based on one dataset only. Wehave, therefore, carried a leave-one-out procedure. As the name suggests, in eachiteration one dataset is selected as the test dataset. The rankings generated basedon the corresponding training datasets are then evaluated in the way describedin the previous paragraphs. The methods compared were Z 2(ARR), Z 4(ARR)
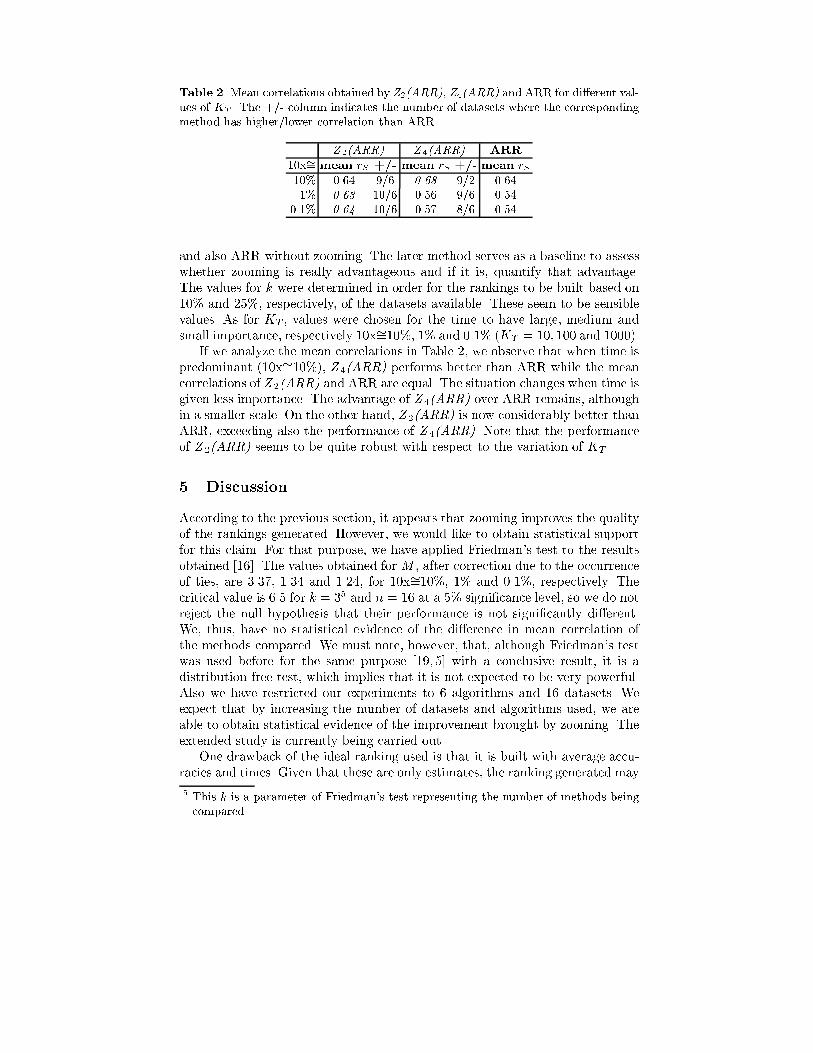
Table 2.Mean correlations obtained by Z2(ARR), Z4(ARR) and ARR for di�erent val-ues of KT . The +/- column indicates the number of datasets where the correspondingmethod has higher/lower correlation than ARRZ 2(ARR) Z 4(ARR) ARR10x�= mean rS +/- mean rS +/- mean rS10% 0.64 9/6 0.68 9/2 0.641% 0.63 10/6 0.56 9/6 0.540.1% 0.64 10/6 0.57 8/6 0.54and also ARR without zooming. The later method serves as a baseline to assesswhether zooming is really advantageous and if it is, quantify that advantage.The values for k were determined in order for the rankings to be built based on10% and 25%, respectively, of the datasets available. These seem to be sensiblevalues. As for KT , values were chosen for the time to have large, medium andsmall importance, respectively 10x�=10%, 1% and 0.1% (KT = 10; 100 and 1000).If we analyze the mean correlations in Table 2, we observe that when time ispredominant (10x�=10%), Z 4(ARR) performs better than ARR while the meancorrelations of Z 2(ARR) and ARR are equal. The situation changes when time isgiven less importance. The advantage of Z 4(ARR) over ARR remains, althoughin a smaller scale. On the other hand, Z 2(ARR) is now considerably better thanARR, exceeding also the performance of Z 4(ARR). Note that the performanceof Z 2(ARR) seems to be quite robust with respect to the variation of KT .5 DiscussionAccording to the previous section, it appears that zooming improves the qualityof the rankings generated. However, we would like to obtain statistical supportfor this claim. For that purpose, we have applied Friedman's test to the resultsobtained [16]. The values obtained for M , after correction due to the occurrenceof ties, are 3.37, 1.34 and 1.24, for 10x�=10%, 1% and 0.1%, respectively. Thecritical value is 6.5 for k = 35 and n = 16 at a 5% signi�cance level, so we do notreject the null hypothesis that their performance is not signi�cantly di�erent.We, thus, have no statistical evidence of the di�erence in mean correlation ofthe methods compared. We must note, however, that, although Friedman's testwas used before for the same purpose [19, 5] with a conclusive result, it is adistribution-free test, which implies that it is not expected to be very powerful.Also we have restricted our experiments to 6 algorithms and 16 datasets. Weexpect that by increasing the number of datasets and algorithms used, we areable to obtain statistical evidence of the improvement brought by zooming. Theextended study is currently being carried out.One drawback of the ideal ranking used is that it is built with average accu-racies and times. Given that these are only estimates, the ranking generated may5 This k is a parameter of Friedman's test representing the number of methods beingcompared.
not be reliable. To minimize this problem, the ideal ranking can be generated asa set of n orderings, one for the results in each fold of the cross-validation pro-cedure used to estimate the performance of the algorithms. A similar procedureas been used before with satisfactory results [20, 5].As for the measure of distance between rankings used here, it has been shownthat correlation is appropriate for that purpose [20]. One drawback is, though,the lack of distinction between rank importance. For instance, it is obvious thatthe switch made between the 5th and 6th algorithm by the Z 2(ARR) on thesegment dataset (Table 1) is less important than if it would involve the 1st andthe 2nd (c5boost and c5). We have previously developed a measure to solvethis problem, weighted correlation [20]. However, it has not yet been thoroughlyanalyzed, and, thus was not used here. An alternative to Spearman's correlationcoe�cient that could be tried is Kendall's tau [16].6 Related WorkMeta-knowledge as been used before for the purpose of algorithm selection. Thisknowledge can be either of theoretical or of experimental origin, or a mixture ofboth. The rules described by Brodley [6] for instance, captured the knowledgeof experts concerning the applicability of certain classi�cation algorithms. Themeta-knowledge of [1], [4] and [9] was of experimental origin and was obtained bymeta-learning on past performance information of the algorithms. Its objectiveis to capture certain relationships between the measured dataset characteristicsand the relative performance of the algorithms. As was demonstrated, meta-knowledge can be used to predict the errors of individual algorithms or constructa ranking with a certain degree of success.Not much work exists in the areas of Machine Learning or KDD concerningmulticriteria ranking and evaluation. A noteworthy exception is the work ofNakhaeizadeh et al. [15, 14], who have applied a technique that originated in thearea of Operations Research, Data Envelopment Analysis (DEA). It remains tobe seen how this approach compares with the method described here.7 ConclusionsWe have presented a combination of techniques that uses past performance in-formation to assist the user in the selection of a classi�cation algorithm for agiven problem. The �rst technique, zooming, works by selecting datasets andassociated performance information that is relevant to the problem at hand.This process is based on the distance between datasets, according to a set ofstatistical, information theoretic and other measures. Here, it is performed us-ing the k-Nearest Neighbor algorithm. We have selected dataset measures thatwere previously used for the same purpose. Work is under way to select the mostpredictive subset of those measures.The ranking method used here is the Adjusted Ratio of Ratios (ARR) method.This is a multicriteria method that takes into account both accuracy and total
execution time information. It has a parameter that enables us to determine therelative importance of each criteria. One of the main advantages is its intuitive-ness, which is essential to enable its use by non-experts.We have reported experiments varying the number of neighbors and therelative importance of accuracy and time. The results obtained are compared toresults obtained by ARR without zooming. It appears that zooming improvesthe quality of the generated rankings, although the results obtained are notsigni�cantly di�erent according to the Friedman's test.In summary, our contributions are (1) exploiting rankings rather then classi�-cation or regression, (2) providing a general evaluation methodology for ranking,(3) providing a way of combining success rate and time and (4) exploiting datasetcharacteristics to select relevant performance information prior to ranking.Acknowledgments We would like to thank the METAL partners for useful dis-cussions. Also thanks to Jo~ao Gama for providing his implementations of LinearDiscriminant and Naive Bayes and to Rui Pereira for implementing an impor-tant part of the methods. The �nancial support from ESPRIT project METAL,project ECO under PRAXIS XXI, FEDER, Programa de Financiamento Pluri-anual de Unidades de I&D and Faculty of Economics is gratefully acknowledged.References1. D.W. Aha. Generalizing from case studies: A case study. In D. Sleeman andP. Edwards, editors, Proceedings of the Ninth International Workshop on MachineLearning (ML92), pages 1{10. Morgan Kaufmann, 1992.2. C. Blake, E. Keogh, and C.J. Merz. Repository of machine learning databases,1998. http:/www.ics.uci.edu/�mlearn/MLRepository.html.3. R.J. Brachman and T. Anand. The process of knowledge discovery in databases.In U.M. Fayyad, G. Piatetsky-Shapiro, P. Smyth, and R. Uthurusamy, editors,Advances in Knowledge Discovery and Data Mining, chapter 2, pages 37{57. AAAIPress/The MIT Press, 1996.4. P. Brazdil, J. Gama, and B. Henery. Characterizing the applicability of classi-�cation algorithms using meta-level learning. In F. Bergadano and L. de Raedt,editors, Proceedings of the European Conference on Machine Learning (ECML-94),pages 83{102. Springer-Verlag, 1994.5. P. Brazdil and C. Soares. A comparison of ranking methods for classi�cationalgorithm selection. In R.L. de M�antaras and E. Plaza, editors, Machine Learning:Proceedings of the 11th European Conference on Machine Learning ECML2000,pages 63{74. Springer, 2000.6. C.E. Brodley. Addressing the selective superiority problem: Automatic Algo-rithm/Model class selection. In P. Utgo�, editor, Proceedings of the 10th Interna-tional Conference on Machine Learning, pages 17{24. Morgan Kaufmann, 1993.7. W. Daelemans, J. Zavrel, K. Van der Sloot, and A. Van Den Bosch. TiMBL:Tilburg memory based learner v2.0 guide. Technical Report 99-01, ILK, 1999.8. J. Gama. Probabilistic linear tree. In D. Fisher, editor, Proceedings of the 14thInternational Machine Learning Conference (ICML97), pages 134{142. MorganKaufmann, 1997.
9. J. Gama and P. Brazdil. Characterization of classi�cation algorithms. In C. Pinto-Ferreira and N.J. Mamede, editors, Progress in Arti�cial Intelligence, pages 189{200. Springer-Verlag, 1995.10. A. Kalousis and T. Theoharis. NOEMON: Design, implementation and perfor-mance results of an intelligent assistant for classi�er selection. Intelligent DataAnalysis, 3(5):319{337, November 1999.11. G. Lindner and R. Studer. AST: Support for algorithm selection with a CBRapproach. In C. Giraud-Carrier and B. Pfahringer, editors, Recent Advances inMeta-Learning and Future Work, pages 38{47. J. Stefan Institute, 1999.12. D. Michie, D.J. Spiegelhalter, and C.C. Taylor. Machine Learning, Neural andStatistical Classi�cation. Ellis Horwood, 1994.13. T.M. Mitchell. Machine Learning. McGraw-Hill, 1997.14. G. Nakhaeizadeh and A. Schnabl. Towards the personalization of algorithms eval-uation in data mining. In R. Agrawal and P. Stolorz, editors, Proceedings of theThird International Conference on Knowledge Discovery & Data Mining, pages289{293. AAAI Press, 1997.15. G. Nakhaeizadeh and A. Schnabl. Development of multi-criteria metrics for eval-uation of data mining algorithms. In D. Heckerman, H. Mannila, D. Pregibon,and R. Uthurusamy, editors, Proceedings of the Fourth International Conferenceon Knowledge Discovery in Databases & Data Mining, pages 37{42. AAAI Press,1998.16. H.R. Neave and P.L. Worthington. Distribution-Free Tests. Routledge, 1992.17. F. Provost and D. Jensen. Evaluating knowledge discovery and data mining. Tu-torial Notes, Fourth International Conference on Knowledge Discovery and DataMining, 1998.18. R. Quinlan. C5.0: An Informal Tutorial. RuleQuest, 1998.http://www.rulequest.com/see5-unix.html.19. C. Soares. Ranking classi�cation algorithms on past performance. Master's thesis,Faculty of Economics, University of Porto, 1999.http://www.ncc.up.pt/�csoares/miac/thesis revised.zip.20. C. Soares, P. Brazdil, and J. Costa. Measures to compare rankings of classi�-cation algorithms. In Proceedings of the Seventh Conference of the InternationalFederation of Classi�cation Societies IFCS (to Be Published), 2000.21. L. Todorovski and S. Dzeroski. Experiments in meta-level learning with ILP.In Proceedings of the Third European Conference on Principles and Practice ofKnowledge Discovery in Databases (PKDD99), pages 98{106, 1999.Appendix The dataset characterization measures used in this study were ob-tained with the DCT program. They consist of simple (number of attributes,number of symbolic and numerical attributes, number of cases and classes, de-fault accuracy, standard-deviation of classes, number of missing values and caseswith missing values), statistical (mean skew and kurtosis, number of attributeswith outliers, M statistic, degrees of freedom of the M statistic, chi-square Mstatistic, SD ratio, relative importance of the most important eigenvalue, canon-ical correlation for the most discriminant function, Wilks Lambda and Bartlett'sV statistics, chi square V statistic and number of discriminant functions) andinformation theoretic measures (minimum, maximum and average symbolic at-tributes, class entropy, attributes entropy, average mutual information, joint en-tropy, equivalent number of attributes and noise signal ratio). More details canbe found in [11, 12].
Related Documents