ZnS:Mn nanoparticles functionalized by PAMAM-OH dendrimer based fluorescence ratiometric probe for cadmium Bruno B. Campos a , Manuel Algarra b,n , Ksenija Radotić c , Dragosav Mutavdžić c , Enrique Rodríguez-Castellón b , José Jiménez-Jiménez b , Beatriz Alonso d , Carmen M. Casado d , Joaquim C.G. Esteves da Silva a a Centro de Investigação em Química, Departamento de Química e Bioquímica, Faculdade de Ciências da Universidade do Porto, Porto, Portugal b Departamento de Química Inorgánica, Facultad de Ciencias, Universidad de Málaga, Campus de Teatinos s/n, 29071 Málaga, Spain c Institute for Multidisciplinary Research, University of Belgrade, KnezaVišeslava 1, 11000 Beograd, Serbia d Departamento de Química Inorgánica, Universidad Autónoma de Madrid, Cantoblanco, 28049 Madrid, Spain article info Article history: Received 8 July 2014 Received in revised form 3 October 2014 Accepted 8 October 2014 Available online 24 November 2014 Keywords: Dendrimer Quantum dots ZnS:Mn 2 þ Ratiometric sensor Cadmium abstract We report a nanocomposite of ZnS:Mn quantum dots and a third generation PAMAM-OH dendrimer (ZnS:Mn@PAMAM-OH G ¼3 ) which was rationalized to be used as ratiometric nanosensor for Cd 2 þ in aqueous solution. The nanoparticles exhibited a bright yellow-orange emission with peaks at 448 and 595 nm. The structure of ZnS:Mn was not changed after coupling with PAMAM-OH, which was evidenced by the analysis of the emission spectra of the compounds. The results confirm that the prepared fluorescence nanoparticles could selectively detect Cd 2 þ in aqueous solution with a limit of detection of 24.34 μM and RSD 4.07%, obtained by using the ratio I 448 /I 595 . The method was applied to different water samples. & 2014 Elsevier B.V. All rights reserved. 1. Introduction The synthesis of doped quantum dots (QDs) allows the devel- opment of nanomaterials with different and improved properties, when compared with the raw QDs, and is receiving much atten- tion [1–6]. A favorable system to be doped is zinc sulfide fluorescent nanoparticles (ZnS QDs) by Mn 2 þ ions, which confers characteristic emission independent of the size of the nanoparti- cle, due to the lower lying states of Mn 2 þ ions ( 4 T 1 - -6 A 1 ) [7], permitting larger Stokes shift to avoid self-absorption, longer excited state lifetime, enhanced thermal and chemical stabilities, and minimized toxicity [8–15]. ZnS nanocrystals doped with manganese ions (ZnS:Mn) have attracted great interest on account of their high quantum effi- ciency and thermal stability, essential properties for chemical applications such as chemical and biosensor, molecular imaging, monitoring drug delivery, etc. [16–20].These properties can be improved substantially by modifying their surfaces with increas- ing quantum efficiency and stability; therefore ZnS:Mn has been conjugated with different ligand exchange coating agents such as glucose oxidase, for glucose biosensor in biological fluids [21], polyethyleneimine, for heparin assay [22], thioglycerol, for bioi- maging [23], chitosan and PEG, for bio-labelling [24,25]. Besides all these nanocomposites materials, dendrimer deri- vates have been recently exploited for coatings of nanoparticles surfaces which can alter the charge, functionality and reactivity. Simultaneously, the coupling of QDs with dendrimers enhances the stability and dispersion of the nanoparticles as demonstrated by previous results showing that, the dendrimers functionalized CdSe and ZnSe QDs, enhanced their behavior in aqueous solution for quantification of heavy metals and C-Reactive Protein, respec- tively by means the quenching effect caused to the emission of QDs [26,27]. In the literature, just a few works are found involving fluorescent semiconductors and the terminated OH-poly(amidoa- mine) dendrimer (PAMAM-OH). As example, CdS QDs were synthesized by using hydroxyl-terminated PAMAM dendrimers as templates and investigated the effects of Cd 2 þ ion/dendrimer ratio, dendrimer generations, and temperatures on the resultant CdS QDs [28]. Due to the harmful cumulative effect of cadmium- containing QDs in the human body [29], arouse a major interest in less toxic fluorescent nanoparticles. In this work a novel ratiometric chemical nanosensor for Cd 2 þ ions based on terminated OH-poly(amidoamine) dendrimer (PAMAM-OH) of third generation was developed. This nanosensor Contents lists available at ScienceDirect journal homepage: www.elsevier.com/locate/talanta Talanta http://dx.doi.org/10.1016/j.talanta.2014.10.010 0039-9140/& 2014 Elsevier B.V. All rights reserved. n Corresponding author. Tel.: þ34 952 131873; fax: þ34 952 132000. E-mail address: [email protected] (M. Algarra). Talanta 134 (2015) 317–324

Welcome message from author
This document is posted to help you gain knowledge. Please leave a comment to let me know what you think about it! Share it to your friends and learn new things together.
Transcript
ZnS:Mn nanoparticles functionalized by PAMAM-OH dendrimer basedfluorescence ratiometric probe for cadmium
Bruno B. Campos a, Manuel Algarra b,n, Ksenija Radotić c, Dragosav Mutavdžić c,Enrique Rodríguez-Castellón b, José Jiménez-Jiménez b, Beatriz Alonso d,Carmen M. Casado d, Joaquim C.G. Esteves da Silva a
a Centro de Investigação em Química, Departamento de Química e Bioquímica, Faculdade de Ciências da Universidade do Porto, Porto, Portugalb Departamento de Química Inorgánica, Facultad de Ciencias, Universidad de Málaga, Campus de Teatinos s/n, 29071 Málaga, Spainc Institute for Multidisciplinary Research, University of Belgrade, KnezaVišeslava 1, 11000 Beograd, Serbiad Departamento de Química Inorgánica, Universidad Autónoma de Madrid, Cantoblanco, 28049 Madrid, Spain
a r t i c l e i n f o
Article history:Received 8 July 2014Received in revised form3 October 2014Accepted 8 October 2014Available online 24 November 2014
Keywords:DendrimerQuantum dotsZnS:Mn2þ
Ratiometric sensorCadmium
a b s t r a c t
We report a nanocomposite of ZnS:Mn quantum dots and a third generation PAMAM-OH dendrimer(ZnS:Mn@PAMAM-OHG¼3) which was rationalized to be used as ratiometric nanosensor for Cd2þ inaqueous solution. The nanoparticles exhibited a bright yellow-orange emission with peaks at 448 and595 nm. The structure of ZnS:Mn was not changed after coupling with PAMAM-OH, which wasevidenced by the analysis of the emission spectra of the compounds. The results confirm that theprepared fluorescence nanoparticles could selectively detect Cd2þ in aqueous solution with a limit ofdetection of 24.34 μM and RSD 4.07%, obtained by using the ratio I448/I595. The method was applied todifferent water samples.
& 2014 Elsevier B.V. All rights reserved.
1. Introduction
The synthesis of doped quantum dots (QDs) allows the devel-opment of nanomaterials with different and improved properties,when compared with the raw QDs, and is receiving much atten-tion [1–6]. A favorable system to be doped is zinc sulfidefluorescent nanoparticles (ZnS QDs) by Mn2þ ions, which conferscharacteristic emission independent of the size of the nanoparti-cle, due to the lower lying states of Mn2þ ions (4T1--6A1) [7],permitting larger Stokes shift to avoid self-absorption, longerexcited state lifetime, enhanced thermal and chemical stabilities,and minimized toxicity [8–15].
ZnS nanocrystals doped with manganese ions (ZnS:Mn) haveattracted great interest on account of their high quantum effi-ciency and thermal stability, essential properties for chemicalapplications such as chemical and biosensor, molecular imaging,monitoring drug delivery, etc. [16–20].These properties can beimproved substantially by modifying their surfaces with increas-ing quantum efficiency and stability; therefore ZnS:Mn has beenconjugated with different ligand exchange coating agents such as
glucose oxidase, for glucose biosensor in biological fluids [21],polyethyleneimine, for heparin assay [22], thioglycerol, for bioi-maging [23], chitosan and PEG, for bio-labelling [24,25].
Besides all these nanocomposites materials, dendrimer deri-vates have been recently exploited for coatings of nanoparticlessurfaces which can alter the charge, functionality and reactivity.Simultaneously, the coupling of QDs with dendrimers enhancesthe stability and dispersion of the nanoparticles as demonstratedby previous results showing that, the dendrimers functionalizedCdSe and ZnSe QDs, enhanced their behavior in aqueous solutionfor quantification of heavy metals and C-Reactive Protein, respec-tively by means the quenching effect caused to the emission ofQDs [26,27]. In the literature, just a few works are found involvingfluorescent semiconductors and the terminated OH-poly(amidoa-mine) dendrimer (PAMAM-OH). As example, CdS QDs weresynthesized by using hydroxyl-terminated PAMAM dendrimersas templates and investigated the effects of Cd2þ ion/dendrimerratio, dendrimer generations, and temperatures on the resultantCdS QDs [28]. Due to the harmful cumulative effect of cadmium-containing QDs in the human body [29], arouse a major interest inless toxic fluorescent nanoparticles.
In this work a novel ratiometric chemical nanosensor for Cd2þ
ions based on terminated OH-poly(amidoamine) dendrimer(PAMAM-OH) of third generation was developed. This nanosensor
Contents lists available at ScienceDirect
journal homepage: www.elsevier.com/locate/talanta
Talanta
http://dx.doi.org/10.1016/j.talanta.2014.10.0100039-9140/& 2014 Elsevier B.V. All rights reserved.
n Corresponding author. Tel.: þ34 952 131873; fax: þ34 952 132000.E-mail address: [email protected] (M. Algarra).
Talanta 134 (2015) 317–324
resulted from the research of two different families of dendrimers,functionalized ZnS:Mn QDs, (ZnS:Mn@PAMAM-OHG¼3). The pre-sence of this ion in the environment raises human health con-cerns. This Cd2þ nanosensor shows minimal interference ofenvironmental conditions when competing with other species,and in the presence of Cd2þ an enhancement of the fluorescentintensity is observed. This ratiometric nanosensor, based on QDsfunctionalized dendrimer, is the first attempt with this of nano-material [30,31].
2. Experimental
2.1. Chemicals
Zinc(II) acetate (ZnAc2, %), sodium sulfide (Na2S�9H2O, 99.99%),manganese(II) chloride (MnCl2�4H2O, 99.99%), L-cysteine (Cys,497%), mercaptoacetic acid (499.0%, MAA), mercaptosuccinic acid(MSA, 497%) and hydroxyl-terminated poly(amidoamine) dendrimerin methanol of third generation (PAMAM-OHG¼3) were purchasedfrom Sigma-Aldrich Química S.A. (Spain). In all experiments deionizedwater was used.
2.2. Synthesis of ZnS:Mn coated with PAMAM-OH dendrimer
To obtain ZnS:Mn QDs, 2.5 mL of ZnAc2 0.1 M were mixed with25 mL of Cys and MAA 0.02 M, used as ligand agent; and leftstirred for 15 min, when were added 4 mL of MnCl2 0.01 M withcontinue stirring for 1 h. After this, previous addition of NaOH 1 Mto adjust the pH at 11, was added 3.5 mL of Na2S 0.1 M to be gentlymixed. The crude reaction mixture was heated for 30 min at 90 1Cand controlled by its fluorescence at 545 nm. After 48 h, thepurification process was followed by the dialyzing of ZnS:MnQDs for 6 h, precipitated with HCl 0.1 M, centrifuged, filtered anddissolved at pH 8.5, affording a fluorescent a colorless dissolutionwith at 595 nm.All experiments carried out were prepared withanalytical grade reagents supplied from Sigma-Aldrich QuímicaS.A. (Spain).
2.3. Characterization of ZnS:Mn coated with PAMAM-OH dendrimer
Fluorescence measurements were performed using a Jovin YvonFluoromax 4 TCSPC (Horiba), and measured between 400 and 700 nmusing an integration time of 0.1 s and 5 nm slits for excitation andemission. Fluorescence lifetime analysis was done using an EdinburghInstruments FLS920, equipped with a Xe lamp (450W) as excitationsource for steady state fluorescence measurements and monocro-matics LEDs (PicoQuant PLS), controlled by a PDL 880-B system.Fluorescence decays were interpreted in terms of a multi-exponential:I(t)¼AþΣBiexp�t/τi, where A and Bi are the pre-exponential factorsand τi the decay times. Quantum yields (QY) of ZnS:Mn and ZnS:Mn@PAMAM-OHG¼3 were obtained using Rhodamine 6 G (Φ¼0.93in methanol, n¼1.329 and λex¼535 nm) as reference; ZnS:Mn andZnS:Mn@PAMAM-OHG¼3 were dissolved in deionized water (n¼1.33)and by 1, leads to obtain the QY of both nanoparticles (UV spectra isshowed as Supporting Information Fig. SI1):
QYCDs ¼QYstðdI=dAÞCDsðdI=dAÞst
� �n2CDs
n2st
� �ð1Þ
where I is the area under the fluorescence curves and A is thecorresponding absorbance [32,33].
Transmission Electron Microscopy (TEM) and Energy Disper-sive spectroscopy (EDAX) analysis were carried out with a PhilipsCM-200. X-ray photoelectron spectroscopic (XPS) studies wereperformed on a Physical Electronic PHI 5700 spectrometer usingnon-monochromatic MgKα radiation (300 W, 15 kV, 1253.6 eV) for
analyzing the core-level signals of the elements of interest with ahemispherical multichannel detector. The spectra of powderedsamples were recorded with a constant pass energy value at29.35 eV, using a 720 μm diameter circular analysis area. TheX-ray photoelectron spectra obtained were analyzed using PHIACESS ESCA-V6.0 F software and processed using Multipak 8.2Bpackage. The binding energy values were referenced to adventi-tious carbon C 1 s signal (284.8 eV). Shirley-type background andGauss-Lorentz curves were used to determine the binding energy.The size and zeta potential (ζ) of CDs were determined using aZetasizer Nano ZS (Malvern Instruments, U.K.) equipped with a4 mWHeNe laser operating at λ¼633 nm. Size measurementswere recorded with dynamic light scattering (DLS), at 25 1C in apolystyrene cell (ZEN0040) at a scattering angle of 1731 and wereaverage of three tests. The ζ measurements were also performed at25 1C in polycarbonate folded capillary cells, incorporated withgold plated electrodes (DTS1061) and deionized H2O was thedispersion medium. Both, size and ζ were automatically obtainedby the software, using the Stokes-Einstein and the Henry equation,with the Smoluchowski approximation.
2.4. Fluorescence data analysis
For fluorescence data analysis of the different nanoparticlessystem which conform the ZnS:Mn coated by PAMAM-OH den-drimer, a series of emission spectra was collected, by excitation atdifferent wavelengths, in the range 300–400 nm with 5 nm step.The emission spectra were measured in the range 400–670 nm,with 3 nm increment. In the analysis we used 4 matrices, corre-sponding to the pure ZnS, pure PAMAM-OHG¼3 dendrimer, ZnS:Mn and ZnS:Mn@PAMAM-OHG¼3. The artificial Raman bandswere removed from the raw spectra by using the a|e – UV–vis-IRSpectral Software 1.2, FluorTools, www.fluortools.com software.Each matrix was analyzed by using Multivariate Curve Resolution-Alternating Least Squares (MCR-ALS) method [34], whichextracted the number of components, as well as their emissionprofiles. All analyses were performed using The Unscramblersoftware package (Camo ASA).
2.5. Atomic absorption spectroscopy
All the water samples were analyzed by AAS with a Cadmium(Cd) Lumina Hollow Cathode Lap. In 6 mL of water samples wereacidified with 185 μL of 65% HNO3 and the cadmium stocksolutions were prepared by diluting different aliquots of a1000 μg/mL cadmium standard stock solution. The measurementswere done in a concentration range of 0.5–5 mg/L for the calibra-tion curve with a linear regression of 0.9978.
2.6. Metal study
Previous the study of the enhancement effect of cadmium(Cd2þ), the metals As3þ , Ba2þ , Cd2þ , Co2þ , Cr3þ , Cu2þ , Fe3þ ,Hg2þ , Mg2þ , Ni2þ , Pb2þ , Sb3þ , Tlþ and anions CN� , CO3
2� , SO42�
were studied by addition of 100 μL of the different metals stocksolution (5�10–3 M) to 500 μL of ZnS:Mn@PAMAM-OHG¼3 to thedesired concentrations levels in 1 mL of volume, filled up by H2O.The solution mixture was then equilibrated at room temperaturefor 5 min before the spectral measurements at 448 and 595 nm. Tocheck the selectivity of this sensor, the experiments were carriedout with other metals ions including: Cu2þ , Fe3þ , Hg2þ , Pb2þ , Tlþ
and Zn2þ , maintaining the same Cd2þ concentration (2.25�10–4 M) and ranging the metal ratio concentrations (1:1; 1:5; 5:1).The operation was exactly similar conditions that were used forthe detection of Cd2þ; Data were obtained by the following
B.B. Campos et al. / Talanta 134 (2015) 317–324318

relationship (2):
Ratio¼I448=I595� �
ZnS:Mn@PAMAM�OH:Cd�Metal
I448=I595� �
ZnS:Mn@PAMAM�OH:Cd
ð2Þ
where ZnS:Mn@PAMAM-OH:Cd2þ-Metal is the ratio obtainedwhen in dissolution are presented the proposed sensor withCd2þ and the studied metal used as interference, and ZnS:Mn@PAMAM-OH:Cd2þ without metal assayed.
3. Discussion of the results
3.1. Synthesis and analysis of ZnS:Mn nanoparticles
Different parameters were studied to obtain the higher fluor-escence intensity, the stabilizing agent, the pH and the concentra-tion of the Mn2þ dopant. The planning experiments were drawnin the Unscrambler programme. The stabilizing agents studiedwere the Cys, MSA and MAA, all three had 0.02 M. The reactionswere performed at different pH, at 7 and 11, and the concentrationof Mn2þ was comprised between 0.179 and 0.833 mM, (Fig. SI2A)excited at 405 nm. Cys was selected at pH 11, the optimal value forZnS nanoparticles. The heating time due to is well known factor toobtain larger size of nanoparticles was studied, and after theresults obtained (Fig. SI2B) was observed that a time of 30 minwas selected to obtain the best emission intensity. To obtain ZnS:Mn nanoparticles, a range of concentration for Mn2þ comprisedbetween 0.179 and 0.833 mM was analyzed, being 0.179 mM themost intense signal under this proposal synthesis (Fig. SI2C).
After the dialyzing purification process, a red shift to 595 nmwas observed in the emission spectra, excited at 345 nm (Fig. 1).For ZnS:Mn nanoparticles, two different emission bands arepresented in the fluorescence spectra: the first emission band, atabout 450 nm, also existed in the emission spectrum of the un-doped ZnS nanocrystals. This emission band is due to the host ZnSbut not from Mn2þ ions. Upon Mn2þ doping, a second character-istic emission band centered at around 595 nm is developed forthe well-known 4T1--6A1 d–d transition of Mn2þ ions on Zn2þ
sites, where Mn2þ is tetrahedrally coordinated by S2� . This can beexplained as Mn2þ incorporated into the ZnS lattice led to theMn2þ based orange emission while ZnS with surface bound Mn2þ
yielded the ultraviolet emission. Thus, it could be concluded thatthe Mn2þ ions in our samples were incorporated into the host ZnSnanocrystals [35,36].
3.2. Characterization of ZnS:Mn nanoparticles
The size and morphology of ZnS:Mn nanoparticles were char-acterized by TEM (Fig. 2), where nearly monodispersed cores wereobtained with an average diameter of 4 nm and revealed packs ofparallel willing with a high regular disposition, inset in Fig. 2 isshowed the inter-planar distance 0.30 nm which agreed well withobtained previously [37]. The average hydrodynamic size was17.3374.97 nm from DLS data (Fig. SI3), thus suggesting that thenanoparticles dispersed well in water. The hydrodynamic dia-meters were larger than those of the cores due to the solvationlayer around the QDs in aqueous solution. Later analysis wasobtained the size from DLS data for ZnS:Mn@PAMAM-OHG¼3,which provided a value of 19.5074.24 nm. The nanoparticleswere subjected to EDAX analysis (Fig. SI4) which shows thegeneral composition of ZnSMn studied, thus clearly shows thepresence of Mn2þ (0.62%), Zn (19.04%) and S (80.34%), supportingthat Mn2þ ion was incorporated by substitution into the ZnS hostlattice and confirmed by XPS analysis. The negative ζ of ZnS:Mnnanoparticles (�19.9070.50 mV) is due to the presence of depro-tonated cysteine groups on the nanoparticles surface (pKa(α–NH3
þ)¼10.78 and pKa (–CH2-SH)¼8.33, consistent with the pHof the synthesis procedure. The ATR spectra analysis showed(Fig. SI5) three main broad bands which are assigned at 1629 cm�1
(–COO�), the band with a shoulder comprised between 3000–3500 cm�1 (–OH and N–H) and the weak broad band at2130 cm�1 is assigned at the stretching band of the S-H, whichis indication of the low vibration of the covalent bond formed withthe ZnS QDs. In the same figure, the spectra of the coatednanoparticles with PAMAM-OHG¼3 are overlapped, where theonly difference is the presence of two bands at 2365 and2344 cm�1.
3.3. XPS analysis
The XPS study of the ZnS:Mn nanoparticles stabilized withcysteine gives relevant information concerning the surface of thenanoparticles. The C 1s core level spectrum (Fig. SI6A) can bedecomposed into three contributions at 284.8 eV (75%), 286.1 eV(15%) and 288.1 eV (10%). This spectrum is more or less similar tothat of L-cysteine reported in the literature [38] were threecontributions at 285.2, 286.7 and 288.5 eV was reported. The firstcontribution at low binding energy (284.8 eV) is assigned, inaddition of adventitious carbon, to C-S- groups. The second at286.1 eV is mainly due to C-NH2 and present an area slightlyhigher than that of the third contribution at 288.1 eV due to thecarboxylate group. The S 2p core level spectrum (Fig. SI6B) shows asingle peak with the doublet S 2p3/2 and S 2p1/2 at 161.1 and162.3 eV, respectively. This signal is assigned to sulfur as thiolated[38], and free thiol groups were not observed in the S 2p core levelspectrum (signal at about 164 eV). The N 1s spectrum (not shownhere) shows a maximum at about 400.0 eV and is assigned, asexpected, to the amino group of cysteine. The Zn 2p3/2 core levelspectrum shows a single symmetric maximum centered at1021.2 eV (Fig. SI6C). This peak is not very informative concerningthe chemical state of Zn, for this reason the ZnL3M4,5M4,5 Augerspectrum was also registered (Fig. SI6D). In this way is possible tocalculate the modified Auger parameter (α0) according 3. ThisAuger signal is sensitive to the chemical state of zinc, and twocontribution were observed at 260.9 eV (26%) and 263.7 eV (74%).
α0 ¼ 1253:6þKE ZnLMMð Þ�KE Zn 2p3=2�
ð3Þ
where KE(ZnLMM) is the kinetic energy of the Auger electron ofZnLMM and KE(Zn 2p3/2) the kinetic energy of the photoelectronZn 2p3/2, and 1253.6 eV is the energy of the excitation source.
Fig. 1. Fluorescence spectra of dialyzed ZnS:Mn2þ with [Mn2þ]¼0.179 M at pH 11and coated with Cys (0.02 M) after 30 min of heat. Excitation at 345 nm.
B.B. Campos et al. / Talanta 134 (2015) 317–324 319

The calculated α0 values were 2013.9 and 2011.1 eV, respectively.And using the correspondent Wagner's diagram [39], the presenceof a core of ZnS (α0 ¼2011.2 eV) in the nanoparticles with Znbonded to surface cysteine through the thiol group (α0 ¼2013.9 eV)is suggested. The Mn 2p signal (not shown) is very weak, showinga photoemission Mn 2p3/2 at 640.3 eV. This value is similar to thatreported at 640.4 eV for MnS [39] C: 46.42%, O: 16.31%, N: 3.60, S:18.15%, Cl 1.49%, Mn: 0.13% and Zn 13.90%. This composition alsoindicates that part of sulfur is forming part of the metallic sulfideand the excess corresponds to the thiolated groups. The coex-istence of metallic Zn and ZnO was confirmed, although it was notpossible to distinguish between the single metallic Zn0 and thealloyed Zn0.
3.4. Functionalization with PAMAM-OHG¼3
Two families and generations of dendrimers, PAMAM withhydroxyl terminal groups (PAMAM-OHG¼2, 3, 5) and thiol-terminated DAB dendrimers (DASG¼2–5) have been assayed, toanalyze the influence of the addition to ZnS nanoparticles(Fig. SI7). As observed, all dendrimers conferred a protectiveenvironment to ZnS nanoparticles, as observed in the fluorescenceintensity, which is most increased in the presence of PAMAM-OHG¼2,3. It was observed that the hydroxyl dendrimer derivates(PAMAM-OHG¼3,5) showed fluorescence emission by theirselves,explained by their synthesis procedure (Fig. SI8) [40], beingselected PAMAM-OHG¼3 which showed for a hand a higherfluorescence intensity (Fig. SI9) and low influence on the emissionband at 595 nm when added at different concentration to ZnS:Mnnanoparticles (Fig. 3).
The conjugation of PAMAM-OHG¼3 with ZnS:Mn is not atypically fluorescence resonance energy transfer (FRET) becauseboth raw and coupled bands remained practically immutable, asproof the quantum yield (Φ) for ZnS:Mn and ZnS:Mn@PAMAM-OHG¼3 are 0.1470 and 0.1509, respectively, in methanol solution.The fluorescence mechanism could not be supported by the donor-acceptor excitons transfer because PAMAM-OHG¼3 itself presentsfluorescence at 448 nm and the doped QD at 595 nm, when thedendrimer is added to the doped QD, the zinc can form stablecomplexes with dendrimer trough its interior amino groups rather
than exterior hydroxyl groups [41]. Probably, due to the bindingnature between PAMAM-OHG¼3 and ZnS:Mn, the chemical rela-tion which they have is mainly about donor-acceptor electrons andat quantum level a reduced donor-acceptor excitons effect, main-taining the fluorescent signals of raw and coupled bands almostequal. The effect of ionic strength on fluorescence was analyzed, byusing increasing concentration of NaCl (between 0 and 2 M),showing a decreasing about 57% in the intensity when NaClconcentration does increase, even though at small concentration,indicating the moderate tolerance of ZnS:Mn@PAMAM-OHG¼3
(Fig. SI10).The effect of pH (4-11) on the fluorescence intensity was
studied, and was compared with ZnS:Mn, showing the similarbehavior. With increasing the pH from 6.04 to 6.90 a drasticdecreasing of the intensity (60%) is observed, for ZnSMn, but whenis analyzed ZnS:Mn@PAMAM-OHG¼3, this drastic decrease wasobserved at 8.72 (Fig. SI11). Similar behavior at different values is
Fig. 2. TEM image of ZnS:Mn 4 nm of average diameter (Inset a magnification of the inter-planar distance of 0.30 nm).
Fig. 3. Influence of the concentration of PAMAM-OHG¼3 on the fluorescenceintensity of ZnS:Mn2þ: (a) 0 M; (b) 4.07�10–8 M; (c) 2.04�10–7 M;(d) 4.07�10–7 M; (e) 8.14�10–7 M; (f) 1.22�10–6 M; (g) 2.44�10–6 M and(h) 4.07�10–6 M. Excitation at 345 nm.
B.B. Campos et al. / Talanta 134 (2015) 317–324320
found when coated by the dendrimer but, the decrease occurs atslightly high pH, explained that dendrimer coating process protectfrom the environment.
3.5. Component analysis of ZnS:Mn@PAMAM-OHG¼3 by MCR-ALS
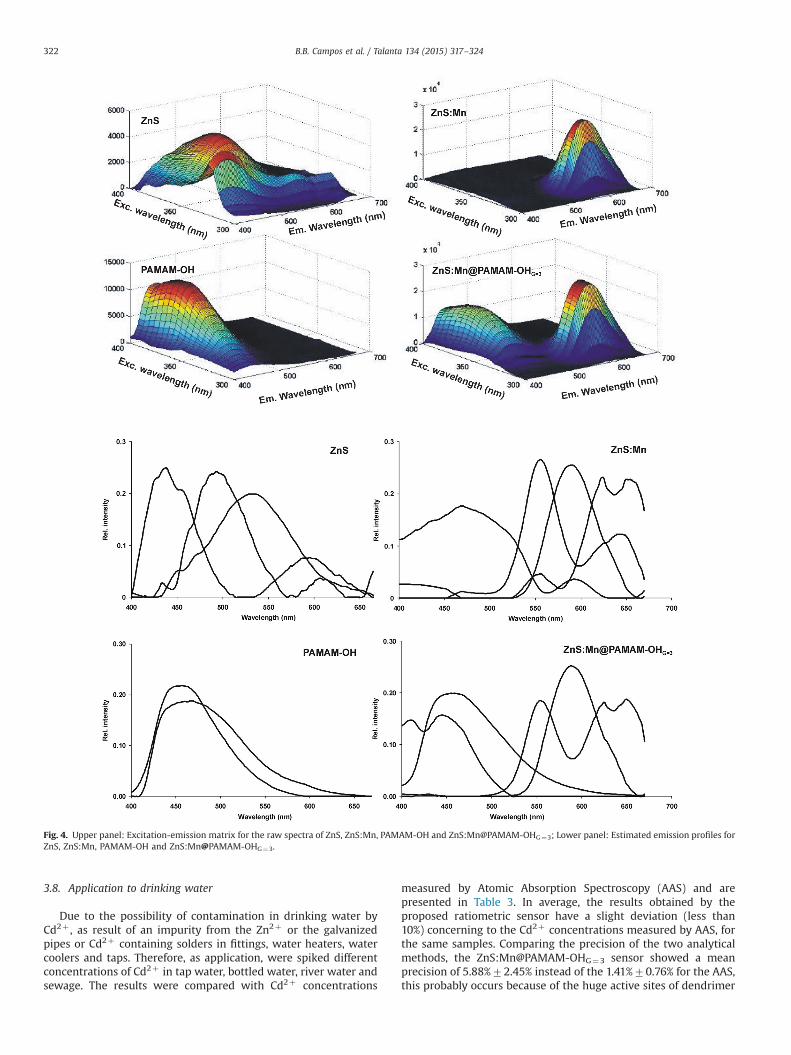
The results of MCR-ALS analysis of the emission profiles forpure ZnS, pure PAMAM-OHG=3 dendrimer, ZnS:Mn and ZnS:Mn@PAMAM-OHG=3 are included in Fig. 4. The emission spectrumof ZnS contains four components with the maxima at 439, 493,535 and 595 nm. After complexation with Mn2þ , the first threecomponents of ZnS disappear due to the formation of a newcompound, and the new components are formed at 472, 556, 589and 643 nm. The fourth ZnS component stays unchanged. ThePAMAM-OH spectrum contains two contributions at 454 and465 nm. In the spectrum of ZnS:Mn@PAMAM-OHG¼3 five compo-nents can be observed. The one PAMAM-OH component, at454 nm, stays unchanged, while its second component is blueshifted for 20 nm, at position 445 nm. The other three compo-nents, at 556, 589 and 643 nm come from ZnSMn and areunchanged in the complex with PAMAM-OH. This shows thatPAMAM-OH does not change structure of ZnSMn, and change ofthe one PAMAM-OH component is due to binding to ZnSMn. Thisis evidence that the formed complex is stable.
3.6. Fluorescence enhancement with Cd2þ ions. Ratiometric sensorof Cd2þ
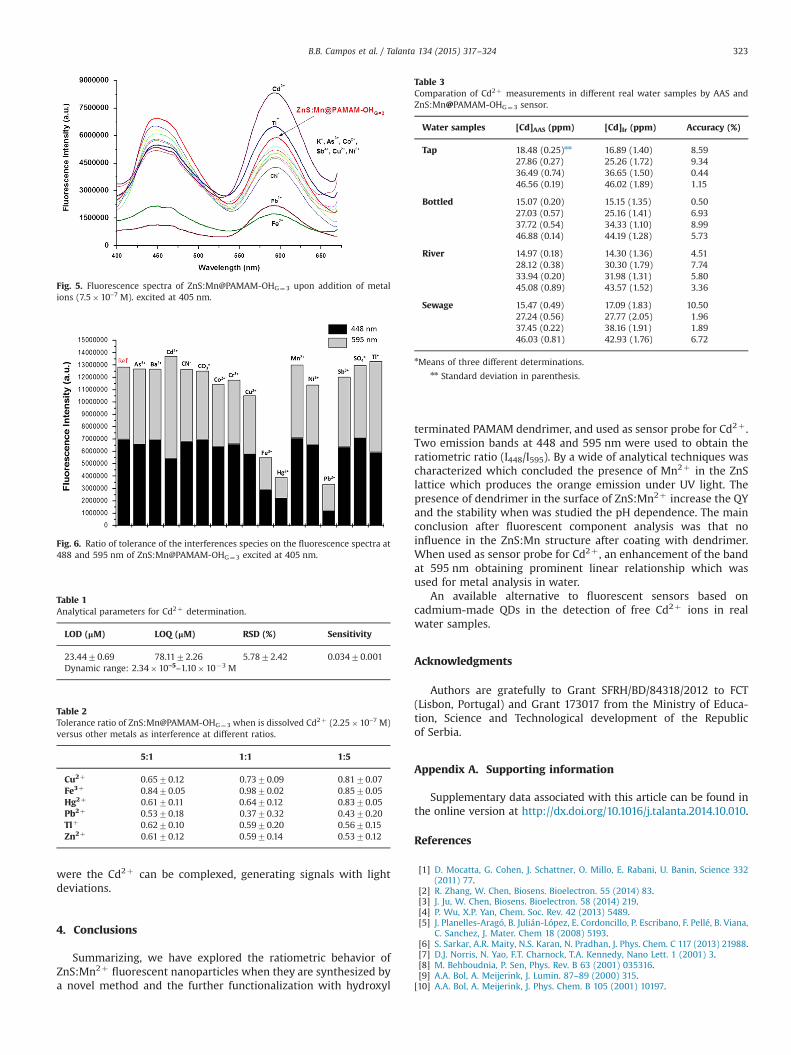
Previous the study of the enhancement effect of cadmium(Cd2þ), a screening of metals were performed, to analyse theresponse of the proposed ZnS:Mn@PAMAM-OHG¼3, used as metalsensor. When no metal ion was added to the solution, the emissionprofile could be summarized at 448 and 592 nm, being this bandwhere the most interesting results are obtained when added themetals to the solution (Fig. 5).
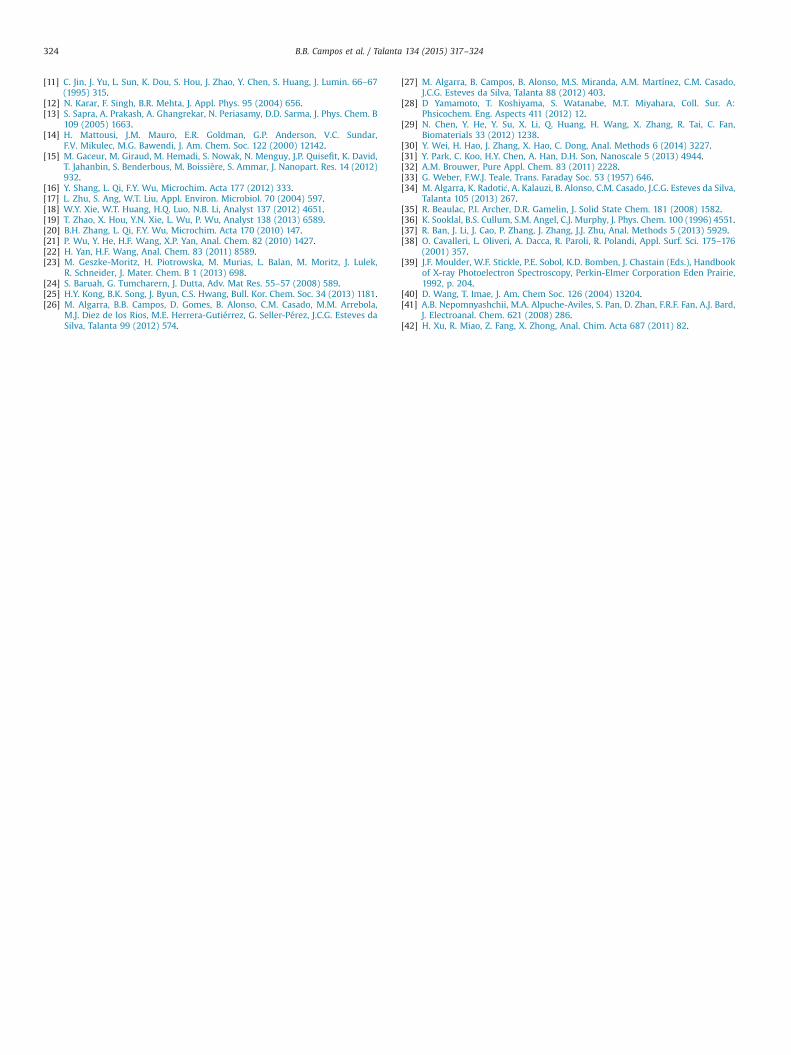
The effect found are the enhancement due to Tlþ (20.2) andCd2þ (32.1), being this metal which offered a significant enhance-ment of the signal at 595 nm (2 folds), when compared with theothers metals added in separated experiments. No significancechanges in the intensity was found when added As3þ (4.9), Ba2þ
(1.4), CN� (1.6), CO32� (2.8), Mg2þ (1.2) and SO4
2� (1.0), moderatedfor Co2þ (11.1), Cr3þ (8.6), Ni2þ (11.8) and Sb3þ (6.2). Metal ionssuch as Cu2þ (18.3), Fe3þ (56.9), Hg2þ (69.7) and Pb2þ (73.1)could cause a larger quenching effect (the values presented inparenthesis represents the mean variation of fluorescence inten-sity, in percentage, (Fig. 6). Due to the enhancement on thefluorescence intensity effect found and the concern of the Cd2þ
in the environment was considered the most interesting metal ionto be studied. In Section 2.5 the relationship to obtain the dataobtained is detailed.
The concentration effect of Cd2þ was studied in the rangecomprised between 5�10–5 and 2.5�10–3 M (Fig. SI12A). Underthe optimum conditions, the change in the fluorescence intensityat 595 had a prominent linear relationship (r40.999) with theconcentration of Cd2þ over the range 1.225�10–5–6.75�10–4 M.The inset in Fig. SI12A indicates the correlation of the intensityratios of emission at 448 nm to 595 nm (I448/I595). When wasobserved the effect in the two bands studied, is possible to justifythat the functionalization of ZnSMn by PAMAM-OHG¼3 dendrimeris a good approach, (Fig. SI12B and C), where are represented theinfluence on the fluorescence intensity of ZnS:Mn@PAMAM-OHG¼3 at different Cd2þ concentrations, observed at 595 nm(Fig. SI12B) when compared with raw ZnSMn nanoparticles, and450 nm (Fig. SI12C) respectively when is compared with rawPAMAM-OHG¼3, which demonstrated the effective functionaliza-tion of ZnSMn and its potential use as ratiometric sensor of Cd2þ ,
always the presence of the dendrimer in the system improve theanalytical signal. In both cases, the fluorescence intensity of ZnS:Mn@PAMAM-OHG¼3 increased at 448 nm and 595 nm comparingwith raw PAMAM-OHG¼3 and raw ZnS:Mn bands. At 448 nm, thefluorescence intensity of ZnS:Mn@PAMAM-OHG¼3 is higher thanraw PAMAM-OHG¼3, even at low concentrations of Cd2þ . At595 nm, the fluorescence intensity of ZnS:Mn@PAMAM-OHG¼3 ishigher than doped QDs from 110 mM of Cd2þ , giving the samefluorescent response below. This probably demonstrates the pre-ferential binding of Cd2þ for the thiol group of Cys rather thanamino groups of PAMAM-OHG¼3 dendrimer. When the Cd2þ ionscomplexed with thiol groups, the signal of ZnS:Mn and PAMAM-OHG¼3 is enhanced due to a charge transfer between a Cd2þ@ZnS:Mn and the ZnS:Mn@PAMAM-OHG¼3, until a point where thethiol groups are fully complexed and the remaining Cd2þ starts tocomplex with amino groups of the dendrimer, quenching thesignal of PAMAM- OHG¼3 and saturating the signal of ZnS:Mn. Theproposed sensor was optimized to obtain the best sensitivity. Thelimit of detection (LOD) and quantification (LOQ¼3� LOD) were24.334 and 81.114 μM, respectively, with an accuracy as relativestandard deviation (RSD, n¼ 10)¼4.07%, as analytical Figuresof merit.
Previously to this work, our group did a similar study involvingnanocomposites of QDs and dendrimers for the detection of Cd2þ
ions by using CdSe QDs functionalized with thiolated DAB den-drimer of generation 5. The same fluorescent response behavior ofenhancement was obtained and the S-DAB-G5-CdSe sensoremitted a single band at 535 mm (λex¼408 nm) and a LOD of10.08 μM [26]. Another analytical example for the detection ofCd2þ involved the use of MPA-capped CdTe QDs and the sensingwas obtained by enhancing the fluorescent signal with free Cd2þ
ions at 615 nm (λex¼350 nm), the LOD founded was 0.5 μM [42].Beside of the ZnS:Mn@PAMAM-OHG¼3 sensor has a superior LODthan the S-DAB-G5-CdSe nanocomposites and the MPA-cappedCdTe QDs, the proposed sensor for Cd2þ detection has a hugeadvantage of being free of cadmium, avoiding the toxicologicalproblems associated to the cadmium-based QDs (Table 1).
3.7. Tolerance to interferences metal ions
To assess the possibility of analytical application of the presentnanosensor, the effects of different concentration ratios of severalcations, that may be presented in real samples, on the fluorescenceintensity of ZnS:Mn@PAMAM-OHG¼3 with Cd2þ (2.25�10–7 M),was studied – Cu2þ , Fe3þ , Hg2þ , Pb2þ , Tlþ and Zn2þ . Thefluorescence intensities of ZnS:Mn@PAMAM-OHG¼3, at differentconcentration ratios versus Mnþ , (5:1; 1:1 and 1:5) were mea-sured in separate sets of experiments and summarized in Table 2.Where ZnS:Mn@PAMAM-OH:Cdis the ratio obtained when indissolution are presented the proposed sensor with Cd2þ andthe studied metal used as interference, and ZnS:Mn@PAMAM-OH:Cd2þ without metal assayed. In all the cases analyzed, it wasfound a quenching effect on the signal of ZnS:Mn@PAMAM-OH:Cd2þ , obtaining a moderate behavior. The most pronounced effectwas for Pb2þ with a signal decreased over 50–70%.
Fig. SI13A and B shows the results of MCR-ALS analysis of theemission profiles for ZnS:Mn@PAMAM-OHG¼3 complex in pre-sence of Cd2þ ions. The emission spectrum contains three com-ponents. The components at 454 and 589 nm have the sameposition as in the complex in absence of Cd. The components at454, 556 and 643 nm of the complex disappeared in the presenceof Cd, while a new component appeared at 583 nm (Figs. 4 andSI13). This indicates that Cd induced certain structural changes ofthe complex. A conformation change may be proposed, having inmind a branched structure of the complex due to the PAMAM-OHdendrimer.
B.B. Campos et al. / Talanta 134 (2015) 317–324 321
3.8. Application to drinking water
Due to the possibility of contamination in drinking water byCd2þ , as result of an impurity from the Zn2þ or the galvanizedpipes or Cd2þ containing solders in fittings, water heaters, watercoolers and taps. Therefore, as application, were spiked differentconcentrations of Cd2þ in tap water, bottled water, river water andsewage. The results were compared with Cd2þ concentrations
measured by Atomic Absorption Spectroscopy (AAS) and arepresented in Table 3. In average, the results obtained by theproposed ratiometric sensor have a slight deviation (less than10%) concerning to the Cd2þ concentrations measured by AAS, forthe same samples. Comparing the precision of the two analyticalmethods, the ZnS:Mn@PAMAM-OHG¼3 sensor showed a meanprecision of 5.88%72.45% instead of the 1.41%70.76% for the AAS,this probably occurs because of the huge active sites of dendrimer
Fig. 4. Upper panel: Excitation-emission matrix for the raw spectra of ZnS, ZnS:Mn, PAMAM-OH and ZnS:Mn@PAMAM-OHG¼3; Lower panel: Estimated emission profiles forZnS, ZnS:Mn, PAMAM-OH and ZnS:Mn@PAMAM-OHG¼3.
B.B. Campos et al. / Talanta 134 (2015) 317–324322
were the Cd2þ can be complexed, generating signals with lightdeviations.
4. Conclusions
Summarizing, we have explored the ratiometric behavior ofZnS:Mn2þ
fluorescent nanoparticles when they are synthesized bya novel method and the further functionalization with hydroxyl
terminated PAMAM dendrimer, and used as sensor probe for Cd2þ .Two emission bands at 448 and 595 nm were used to obtain theratiometric ratio (I448/I595). By a wide of analytical techniques wascharacterized which concluded the presence of Mn2þ in the ZnSlattice which produces the orange emission under UV light. Thepresence of dendrimer in the surface of ZnS:Mn2þ increase the QYand the stability when was studied the pH dependence. The mainconclusion after fluorescent component analysis was that noinfluence in the ZnS:Mn structure after coating with dendrimer.When used as sensor probe for Cd2þ , an enhancement of the bandat 595 nm obtaining prominent linear relationship which wasused for metal analysis in water.
An available alternative to fluorescent sensors based oncadmium-made QDs in the detection of free Cd2þ ions in realwater samples.
Acknowledgments
Authors are gratefully to Grant SFRH/BD/84318/2012 to FCT(Lisbon, Portugal) and Grant 173017 from the Ministry of Educa-tion, Science and Technological development of the Republicof Serbia.
Appendix A. Supporting information
Supplementary data associated with this article can be found inthe online version at http://dx.doi.org/10.1016/j.talanta.2014.10.010.
References
[1] D. Mocatta, G. Cohen, J. Schattner, O. Millo, E. Rabani, U. Banin, Science 332(2011) 77.
[2] R. Zhang, W. Chen, Biosens. Bioelectron. 55 (2014) 83.[3] J. Ju, W. Chen, Biosens. Bioelectron. 58 (2014) 219.[4] P. Wu, X.P. Yan, Chem. Soc. Rev. 42 (2013) 5489.[5] J. Planelles-Aragó, B. Julián-López, E. Cordoncillo, P. Escribano, F. Pellé, B. Viana,
C. Sanchez, J. Mater. Chem 18 (2008) 5193.[6] S. Sarkar, A.R. Maity, N.S. Karan, N. Pradhan, J. Phys. Chem. C 117 (2013) 21988.[7] D.J. Norris, N. Yao, F.T. Charnock, T.A. Kennedy, Nano Lett. 1 (2001) 3.[8] M. Behboudnia, P. Sen, Phys. Rev. B 63 (2001) 035316.[9] A.A. Bol, A. Meijerink, J. Lumin. 87–89 (2000) 315.[10] A.A. Bol, A. Meijerink, J. Phys. Chem. B 105 (2001) 10197.
Table 1Analytical parameters for Cd2þ determination.
LOD (μM) LOQ (μM) RSD (%) Sensitivity
23.4470.69 78.1172.26 5.7872.42 0.03470.001Dynamic range: 2.34�10–5–1.10�10�3 M
Table 2Tolerance ratio of ZnS:Mn@PAMAM-OHG¼3 when is dissolved Cd2þ (2.25�10–7 M)versus other metals as interference at different ratios.
5:1 1:1 1:5
Cu2þ 0.6570.12 0.7370.09 0.8170.07Fe3þ 0.8470.05 0.9870.02 0.8570.05Hg2þ 0.6170.11 0.6470.12 0.8370.05Pb2þ 0.5370.18 0.3770.32 0.4370.20Tlþ 0.6270.10 0.5970.20 0.5670.15Zn2þ 0.6170.12 0.5970.14 0.5370.12
Table 3Comparation of Cd2þ measurements in different real water samples by AAS andZnS:Mn@PAMAM-OHG¼3 sensor.
Water samples [Cd]AAS (ppm) [Cd]Ir (ppm) Accuracy (%)
Tap 18.48 (0.25)nn 16.89 (1.40) 8.5927.86 (0.27) 25.26 (1.72) 9.3436.49 (0.74) 36.65 (1.50) 0.4446.56 (0.19) 46.02 (1.89) 1.15
Bottled 15.07 (0.20) 15.15 (1.35) 0.5027.03 (0.57) 25.16 (1.41) 6.9337.72 (0.54) 34.33 (1.10) 8.9946.88 (0.14) 44.19 (1.28) 5.73
River 14.97 (0.18) 14.30 (1.36) 4.5128.12 (0.38) 30.30 (1.79) 7.7433.94 (0.20) 31.98 (1.31) 5.8045.08 (0.89) 43.57 (1.52) 3.36
Sewage 15.47 (0.49) 17.09 (1.83) 10.5027.24 (0.56) 27.77 (2.05) 1.9637.45 (0.22) 38.16 (1.91) 1.8946.03 (0.81) 42.93 (1.76) 6.72
nMeans of three different determinations.nn Standard deviation in parenthesis.
Fig. 6. Ratio of tolerance of the interferences species on the fluorescence spectra at488 and 595 nm of ZnS:Mn@PAMAM-OHG¼3 excited at 405 nm.
Fig. 5. Fluorescence spectra of ZnS:Mn@PAMAM-OHG¼3 upon addition of metalions (7.5�10–7 M). excited at 405 nm.
B.B. Campos et al. / Talanta 134 (2015) 317–324 323
[11] C. Jin, J. Yu, L. Sun, K. Dou, S. Hou, J. Zhao, Y. Chen, S. Huang, J. Lumin. 66–67(1995) 315.
[12] N. Karar, F. Singh, B.R. Mehta, J. Appl. Phys. 95 (2004) 656.[13] S. Sapra, A. Prakash, A. Ghangrekar, N. Periasamy, D.D. Sarma, J. Phys. Chem. B
109 (2005) 1663.[14] H. Mattousi, J.M. Mauro, E.R. Goldman, G.P. Anderson, V.C. Sundar,
F.V. Mikulec, M.G. Bawendi, J. Am. Chem. Soc. 122 (2000) 12142.[15] M. Gaceur, M. Giraud, M. Hemadi, S. Nowak, N. Menguy, J.P. Quisefit, K. David,
T. Jahanbin, S. Benderbous, M. Boissière, S. Ammar, J. Nanopart. Res. 14 (2012)932.
[16] Y. Shang, L. Qi, F.Y. Wu, Microchim. Acta 177 (2012) 333.[17] L. Zhu, S. Ang, W.T. Liu, Appl. Environ. Microbiol. 70 (2004) 597.[18] W.Y. Xie, W.T. Huang, H.Q. Luo, N.B. Li, Analyst 137 (2012) 4651.[19] T. Zhao, X. Hou, Y.N. Xie, L. Wu, P. Wu, Analyst 138 (2013) 6589.[20] B.H. Zhang, L. Qi, F.Y. Wu, Microchim. Acta 170 (2010) 147.[21] P. Wu, Y. He, H.F. Wang, X.P. Yan, Anal. Chem. 82 (2010) 1427.[22] H. Yan, H.F. Wang, Anal. Chem. 83 (2011) 8589.[23] M. Geszke-Moritz, H. Piotrowska, M. Murias, L. Balan, M. Moritz, J. Lulek,
R. Schneider, J. Mater. Chem. B 1 (2013) 698.[24] S. Baruah, G. Tumcharern, J. Dutta, Adv. Mat Res. 55–57 (2008) 589.[25] H.Y. Kong, B.K. Song, J. Byun, C.S. Hwang, Bull. Kor. Chem. Soc. 34 (2013) 1181.[26] M. Algarra, B.B. Campos, D. Gomes, B. Alonso, C.M. Casado, M.M. Arrebola,
M.J. Diez de los Rios, M.E. Herrera-Gutiérrez, G. Seller-Pérez, J.C.G. Esteves daSilva, Talanta 99 (2012) 574.
[27] M. Algarra, B. Campos, B. Alonso, M.S. Miranda, A.M. Martínez, C.M. Casado,J.C.G. Esteves da Silva, Talanta 88 (2012) 403.
[28] D Yamamoto, T. Koshiyama, S. Watanabe, M.T. Miyahara, Coll. Sur. A:Phsicochem. Eng. Aspects 411 (2012) 12.
[29] N. Chen, Y. He, Y. Su, X. Li, Q. Huang, H. Wang, X. Zhang, R. Tai, C. Fan,Biomaterials 33 (2012) 1238.
[30] Y. Wei, H. Hao, J. Zhang, X. Hao, C. Dong, Anal. Methods 6 (2014) 3227.[31] Y. Park, C. Koo, H.Y. Chen, A. Han, D.H. Son, Nanoscale 5 (2013) 4944.[32] A.M. Brouwer, Pure Appl. Chem. 83 (2011) 2228.[33] G. Weber, F.W.J. Teale, Trans. Faraday Soc. 53 (1957) 646.[34] M. Algarra, K. Radotić, A. Kalauzi, B. Alonso, C.M. Casado, J.C.G. Esteves da Silva,
Talanta 105 (2013) 267.[35] R. Beaulac, P.I. Archer, D.R. Gamelin, J. Solid State Chem. 181 (2008) 1582.[36] K. Sooklal, B.S. Cullum, S.M. Angel, C.J. Murphy, J. Phys. Chem. 100 (1996) 4551.[37] R. Ban, J. Li, J. Cao, P. Zhang, J. Zhang, J.J. Zhu, Anal. Methods 5 (2013) 5929.[38] O. Cavalleri, L. Oliveri, A. Dacca, R. Paroli, R. Polandi, Appl. Surf. Sci. 175–176
(2001) 357.[39] J.F. Moulder, W.F. Stickle, P.E. Sobol, K.D. Bomben, J. Chastain (Eds.), Handbook
of X-ray Photoelectron Spectroscopy, Perkin-Elmer Corporation Eden Prairie,1992, p. 204.
[40] D. Wang, T. Imae, J. Am. Chem Soc. 126 (2004) 13204.[41] A.B. Nepomnyashchii, M.A. Alpuche-Aviles, S. Pan, D. Zhan, F.R.F. Fan, A.J. Bard,
J. Electroanal. Chem. 621 (2008) 286.[42] H. Xu, R. Miao, Z. Fang, X. Zhong, Anal. Chim. Acta 687 (2011) 82.
B.B. Campos et al. / Talanta 134 (2015) 317–324324
Related Documents