6 / 2020 W P ORKING APER ISBN 978-9934-578-31-1 ANDREJS ZLOBINS ZLB AND BEYOND: REAL AND FINANCIAL EFFECTS OF LOW AND NEGATIVE INTEREST RATES IN THE EURO AREA © Latvijas Banka, 2020 This source is to be indicated when reproduced. Latvijas Banka K. Valdemāra iela 2A, Riga, LV-1050 Tel.: +371 67022300 [email protected] http://www.bank.lv https://www.macroeconomics.lv

Welcome message from author
This document is posted to help you gain knowledge. Please leave a comment to let me know what you think about it! Share it to your friends and learn new things together.
Transcript
6 / 2020
W PORKING APER
ISBN 978-9934-578-31-1
ANDREJS ZLOBINS
ZLB AND BEYOND: REAL AND FINANCIAL EFFECTS OF LOW
AND NEGATIVE INTEREST RATES IN THE EURO AREA
© Latvijas Banka, 2020
This source is to be indicated when reproduced.
Latvijas BankaK. Valdemāra iela 2A, Riga, LV-1050Tel.: +371 67022300 [email protected]
http://www.bank.lv https://www.macroeconomics.lv

ZLB AND BEYOND: REAL AND FINANCIAL EFFECTS OF LOW AND NEGATIVE INTEREST RATES IN THE EURO AREA 6/2020
2
CONTENT
ABSTRACT 3 1. INTRODUCTION 4 2. ECONOMETRIC FRAMEWORK 6
2.1 Time-varying parameter structural vector autoregression with stochasticvolatility 6 2.2 Non-linear local projections 8
3. RESULTS 11 3.1. Transmission mechanism of negative interest rates 15
4. SIDE EFFECTS 20 5. ROBUSTNESS 25 6. CONCLUSIONS 30 APPENDIX 32
A.1 Dataset description and transformations 32 A.2 External financing structure 33 A.3 House price cycle 33 A.4 Deposit rates 34
BIBLIOGRAPHY 35
ABBREVIATIONS 3M – 3-month AR – autoregressive BIC – Bayesian information criterion BIS – Bank for International Settlements bps – basis points BSI – Balance Sheet Items DSGE – dynamic stochastic general equilibrium EA-MPD – Euro Area Monetary Policy Event-Study Database ECB – European Central Bank EONIA – Euro Overnight Index Average EUR – euro GDP – gross domestic product HFI – high frequency identification HICP – Harmonised Index of Consumer Prices MFI – monetary financial institution MP – monetary policy NIRP – negative interest rate policy NL-LP – non-linear local projections OIS – overnight indexed swap OLS – ordinary least squares QSA – Quarterly Sector Accounts ROA – return on assets SVAR – structural vector autoregression TVP-SVAR-SV – time-varying parameter structural vector autoregression with stochastic volatility US – United States of America USD – US dollar VAR – vector autoregression ZLB – zero lower bound

ZLB AND BEYOND: REAL AND FINANCIAL EFFECTS OF LOW AND NEGATIVE INTEREST RATES IN THE EURO AREA 6/2020
3
ABSTRACT
This paper studies the effects of low and negative interest rates in the euro area on a wide range of macroeconomic and financial variables and documents the changes in the monetary transmission mechanism once the policy rate reaches the zero lower bound (ZLB). To that end, we employ a set of non-linear time series frameworks, namely a time-varying parameter structural vector autoregression with stochastic volatility and non-linear local projections and perform identification via both sign restrictions and high frequency information approaches. Our findings suggest that the policy rate has continued to support the aggregate demand in the euro area even in sub-zero territory. Despite that, we find that the reaction of inflation and its expectations has significantly deteriorated in the post-ZLB period. Regarding the transmission mechanism, we show that policy rate cuts below zero have a more persistent impact on the term structure and interest rate expectations. In addition to that, our results suggest that negative interest rates do not cause a contraction in lending despite the disconnect of lending rates from the policy rate. In general, our findings contribute to the growing list of literature which questions the empirical relevance of the ZLB.
Key words: NIRP, ZLB, monetary policy, euro area, non-linearities.
JEL code: C54, E43, E52, E58
The author would like to thank the participants of an internal seminar held at Latvijas Banka, the 23rd Central Bank Macroeconomic Modelling Workshop and the World Banking & Finance Symposium for useful suggestions. I am also grateful to Irena Vodenska (Boston University) and the anonymous reviewer for valuable comments and Gunārs Bērziņš and Erlands Krongorns (both Latvijas Banka) for providing some of the time series used in the analysis. The views expressed in this paper are those of the author and do not necessarily reflect the views of Latvijas Banka. E-mail address: [email protected].

ZLB AND BEYOND: REAL AND FINANCIAL EFFECTS OF LOW AND NEGATIVE INTEREST RATES IN THE EURO AREA 6/2020
4
1. INTRODUCTION
Conventional wisdom suggests that standard monetary policy measures, i.e. policy rates become ineffective once they reach the zero lower bound (see e.g. Keynes (1936), Hicks (1937), Krugman (1998) and Eggertsson and Woodford (2006)), as banks would be unwilling to charge negative interest rates on deposits to avoid their outflow because agents would switch to cash. In addition, Brunnermeier and Koby (2018) theorize that negative policy rates might even be contractionary due to erosion in bank profitability via narrower net interest margins which subsequently cause a contraction in lending. This view is also echoed in Eggertsson et al. (2017), arguing that two important channels of monetary policy break down when the policy rates hit the ZLB: intertemporal substitution (because deposit rates are sticky at zero) and bank lending (due to a significant decline in pass-through of policy rates to lending rates). The notion of liquidity trap also plays an important role in standard New Keynesian DSGE models as the economy loses its main adjustment mechanism. Thus, the evidence emanating from this class of models suggests that the capability of monetary policy is significantly affected when nominal interest rates approach the ZLB (see e.g. Evans et al. (2015) and Gust et al. (2017)). Despite these arguments, central banks in the euro area, Japan, Sweden, Denmark and Switzerland have employed negative interest rate policies in the past decade for the first time in central banking history. In this paper, we focus on the effects of sub-zero policy rates in the euro area where the ECB first cut the deposit facility rate to zero in July 2012 and then moved it into negative territory in June 2014 to combat the disinflationary pressures.
The existing empirical evidence from the euro area suggests that the relevance of the ZLB is questionable as standard monetary policy tools remain effective in negative territory, although with some differences in the transmission mechanism. For instance, Altavilla et al. (2019b), using the euro area bank- and firm-level microdata, show that the transmission mechanism is not impaired once the ZLB is binding, because healthy banks are able to pass negative rates on to corporate deposits without the outflow of deposits. As there is no contraction in funding, those banks are also able to increase lending. However, the authors emphasise that the real effects of negative interest rates mainly emerge from firms rebalancing liquid assets towards tangible and intangible assets to avoid paying interest on their deposits, thus increasing investment. While they do confirm the findings of Eggertsson et al. (2017) that policy rate cuts below the ZLB do not translate into lower borrowing costs, Altavilla et al. (2019b) argue that bank lending channel remains active due to lower provisions for non-performing loans, which in turn increases the supply of credit. Similar findings are also reported in Klein (2020), suggesting that the NIRP has squeezed net interest margins of the euro banks, but they have reduced the adverse effects by increasing lending. Thus, it seems that negative interest rates are mainly transmitted through credit quantities rather than lending rates.
Moreover, Rostagno et al. (2019) show that negative policy rates lower interest rate expectations, as the central bank thereby removes the non-negativity restriction and signals that future policy rate cuts are possible. Adding to the evidence on changes in post-ZLB monetary transmission mechanism, Altavilla et al. (2019a) empirically show that policy rate cuts in negative territory have a much more persistent impact on the term structure compared to a rate cut in a positive interest rate environment.
ZLB AND BEYOND: REAL AND FINANCIAL EFFECTS OF LOW AND NEGATIVE INTEREST RATES IN THE EURO AREA 6/2020
5
At the same time, empirical literature regarding the aggregate effects of sub-zero policy rates in the euro area is notably scantier. Some evidence can be found in Rostagno et al. (2019), showing that the NIRP has exerted a considerable impact on the euro area output and inflation and has played an important role in the overall policy package, reinforcing the effects of both asset purchases and forward guidance. However, a potential downside of their approach is that they employ a linear VAR framework, but the evidence from Klein (2020) suggests that non-linearities come into play when policy rates enter negative territory; therefore, the findings of Rostagno et al. (2019) could be subject to the Lucas critique. Lhuissier et al. (2020) also empirically question the relevance of the ZLB, but they do not discriminate between policy rates and other non-standard monetary measures used since interest rates reached the zero bound. In our paper, we follow a similar approach, i.e. we compare the impulse responses to monetary policy shock before and after the zero bound, but we do so in a non-linear framework and focus particularly on the impact of sub-zero policy rates.
Hence, our study expands the literature on low and negative policy rates in the euro area as follows: first, we assess their impact using a set of non-linear time series frameworks, namely a time-varying parameter structural vector autoregression with stochastic volatility (TVP-SVAR-SV) and non-linear local projections (NL-LP), and perform identification via both sign restrictions and high frequency information approaches. This ensures that our findings are robust regarding both the method of generating non-linear impulse responses and the choice of identification strategy. Second, we study their effects on a wide range of macroeconomic and financial variables to analyse the changes in monetary policy transmission mechanism once the policy rate enters negative territory. Finally, we devote significant attention to the analysis of potential side effects which are often associated with a prolonged period of low and negative interest rates. Specifically, we study whether they trigger adverse effects on bank profitability, property prices or bank deposits.
Our findings show that the policy rate has continued to support the aggregate demand in the euro area even in sub-zero territory; however, the price pressures have significantly tailed off due to lower inflation expectations. Regarding the changes in the transmission mechanism, we confirm the findings from existing literature that policy rate cuts below zero have a more pronounced effects on the term structure via lower interest rate expectations, as the central bank thereby removes the non-negativity restriction and signals that future policy rate cuts are possible. However, our results indicate that the more powerful propagation through the term structure has not led to lower borrowing costs, as lending rates are no longer responsive when policy rates are below the zero bound. Despite the disconnect of lending rates from the policy rate, our findings suggest that negative interest rates do not cause a contraction in lending. Concerning the side effects, we find limited empirical evidence to suggest that they have adversely affected bank profitability, property prices or bank deposits.
The paper is further structured as follows. Section 2 describes the econometric models, data and identification strategy used to pin down the effects of negative policy rates. Section 3 presents the results and discusses the alterations in the transmission mechanism, while Section 4 examines the potential side effects of sub-zero policy rates. Section 5 is devoted to robustness checks of our findings. Finally, Section 6 concludes.

ZLB AND BEYOND: REAL AND FINANCIAL EFFECTS OF LOW AND NEGATIVE INTEREST RATES IN THE EURO AREA 6/2020
6
2. ECONOMETRIC FRAMEWORK
To analyse the propagation of policy rate shocks below zero and the respective changes in the monetary transmission mechanism, we compare the impulse responses to monetary policy shock in periods when they are in positive and negative territory, i.e. pre- and post-ZLB. To that end, we employ two different non-linear econometricframeworks: TVP-SVAR-SV and NL-LP. First, we consider the TVP-SVAR-SV. Theadvantage of this framework over other non-linear VARs, e.g. Markov-switching orthreshold VARs, lies in agnosticism towards possible structural changes in the sampleconsidered, as it does not require to set a specific number of regimes ex ante. Thisproperty is particularly appealing for our application, as the move of policy rates intonegative territory can potentially lead to significant but uncertain structural changesin the economy and policy rules. Also, given that we focus on the euro area, timevariation in both the parameter space and the error variance-covariance matrix is veryuseful due to its exposure to large shocks (the Great Recession and sovereign debtcrisis) and the change in the monetary policy regime, as sub-zero policy rates havebeen used alongside asset purchases and forward guidance. Additional advantage oftime-varying setup over discrete break models is that it allows to track the responseof economy when the policy rate transitions from positive territory to zero and toincreasingly more negative rates.
Second, we simultaneously cross-check the estimates of the TVP-SVAR-SV with the NL-LP along the lines of Jordà (2005) which provides a flexible approach for modelling non-linearities and has been frequently used in recent literature to study the state-dependent effects of monetary policy (Tenreyro and Thwaites (2016), Alpanda et al. (2019)). Regarding the identification strategy, we utilise both the sign and zero restrictions of Arias et al. (2018) as well as their fusion with high frequency information approach à la Jarociński and Karadi (2020). The use of alternative frameworks for deriving non-linear impulse response functions and identification strategies helps to ensure that our results regarding the efficacy of negative interest rates and the relevance of the ZLB are neither model- nor identification strategy-specific.
2.1 Time-varying parameter structural vector autoregression with stochastic volatility
We start our analysis by considering a SVAR model with time-varying coefficients and the error covariance matrix along the lines of Primiceri (2005) and Gambetti and Musso (2017). For t = 1, …, T let 𝑦 denote a vector of endogenous variables which evolve according to: 𝑦 = 𝐶 + 𝐴 , 𝑦 + . . . + 𝐴 , 𝑦 + 𝜀 (1)
where 𝐶 is an n × 1 vector of constants, 𝐴 (j =1, …, p) is an n × n array of coefficients related to the j-th lag and 𝜀 is an n × 1 structural error vector with zero mean and diagonal time-varying variance-covariance matrix Σ . For convenience, suppose that we stack matrices of SVAR coefficients from equation 1 into vector 𝜃 =𝐶 , 𝑣𝑒𝑐 A , , . . . , 𝑣𝑒𝑐 A , . The time variation of coefficients is then modelledas random walk process: 𝜃 = 𝜃 + 𝜐 𝜐 ~𝑁 0,𝛺) (2)
where 𝜐 is white noise vector with covariance matrix 𝛺.
ZLB AND BEYOND: REAL AND FINANCIAL EFFECTS OF LOW AND NEGATIVE INTEREST RATES IN THE EURO AREA 6/2020
7
Additionally, given the potential changes in the propagation of monetary policy shock when the policy rates hit the ZLB, thus making the residuals not identically distributed across time, we also allow the error covariance matrix to be period-specific. Stochastic volatility is modelled as follows: Σ = 𝐹 𝛬 𝐹 (3)
where 𝐹 is a lower triangular matrix with a unit diagonal and 𝛬 is a diagonal matrix with elements denoted by exp(𝜆 , ) and the log-volatilities 𝜆 , following the AR(1) process: 𝜆 , = 𝛾𝜆 , + 𝜈 , 𝜈 , ~𝑁 0,ϕ ) (4)
where 𝛾 is a persistence parameter set to 0.85 for every variable included in the model and 𝜈 , is a white noise error with covariance matrix ϕ . Contrary to adopting the random walk assumption of Cogley and Sargent (2005) and setting 𝛾 = 1, we choose a slightly lower value for 𝛾, since random walk assumption implies that shifts in volatility become permanent and it doesn't revert to its long-run value. Key macroeconomic variables like the real GDP and inflation will typically have higher volatility during recessions but will return to their long-run values once the economic turbulence calms down. However, Primiceri (2005) demonstrates that the choice of 𝛾 has a negligible impact on the results.
We make the following assumptions about the prior distribution in our TVP-SVAR-SV: 𝜋 𝜃|𝛺) ~ 𝑁 0,𝛺 ) 𝑓 ~ 𝑁 𝑓 ,Υ ) 𝜋 𝜆 |𝜙 ) ~ 𝑁 0,𝜙 ) 𝜋 𝜔 ) ~ 𝐼𝐺 𝜒2 ,𝜓2 𝜋 𝜙 ) ~ 𝐼𝐺 , (5)
where 𝑓 denotes the vector in the 𝐹 matrix containing the non-zero and non-one elements with mean 𝑓 and covariance Υ for i = 2, …, n, 𝜔 are diagonal entries in the 𝛺 matrix with the 𝜒 and 𝜓 denoting the hyperparameters governing the shape and scale of variance. In order to make the prior non-informative, we set 𝜒 = 𝜓 = 0.001. Similarly, 𝛼 and 𝛿 are hyperparameters related to the variance of volatility which are set to 𝛼 = 𝛿 = 0.001. Parameters 𝛺 , 𝑓 , Υ and 𝜙 are set equal to their OLS estimates from a time-invariant SVAR.
In the benchmark specification, the model includes five quarterly variables: output, inflation, the exchange rate, equity prices and the short-term interest rate. The model is estimated with the data sample covering the period from the first quarter of 2000 to the second quarter of 2019, and all variables enter the model in form of first differences of their log-levels, with the exception of the interest rates which enter as first differences of levels. The lag order is set to 2.
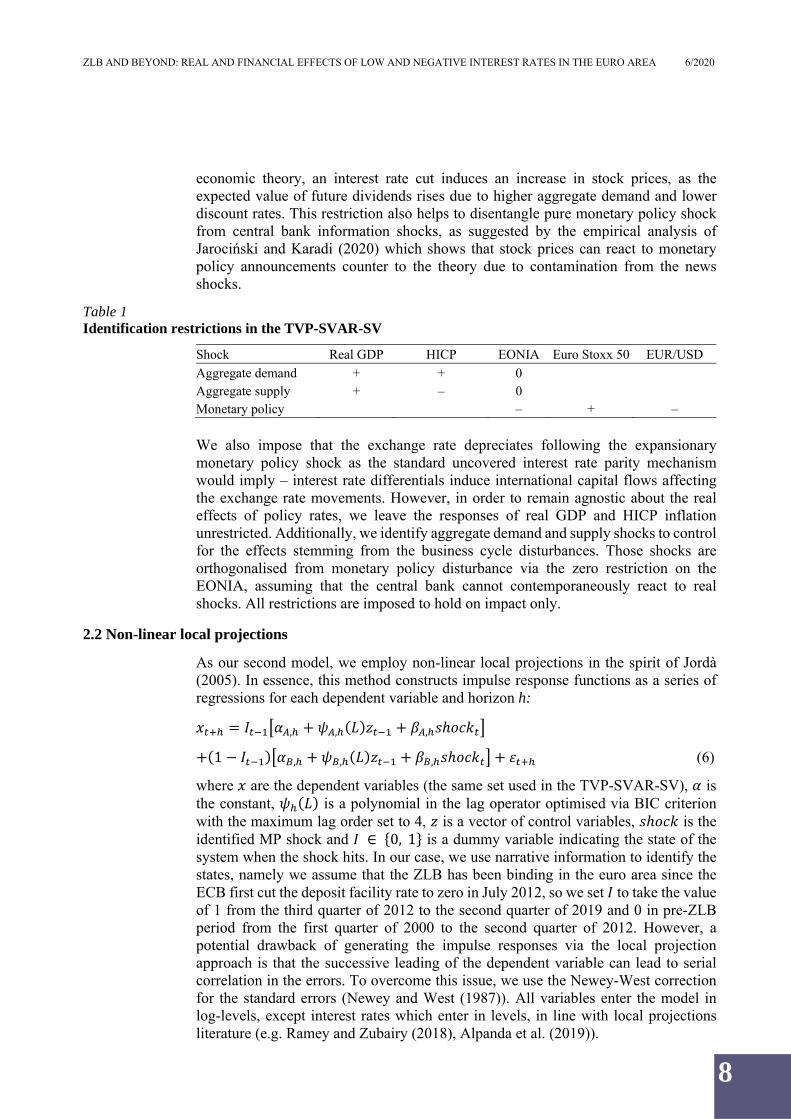
For identification, we employ the sign and zero restrictions of Arias et al. (2018), with a summary of our identifying restrictions provided in Table 1. We use a rather standard set of restrictions to identify the impact of a policy rate cut. Following
ZLB AND BEYOND: REAL AND FINANCIAL EFFECTS OF LOW AND NEGATIVE INTEREST RATES IN THE EURO AREA 6/2020
8
economic theory, an interest rate cut induces an increase in stock prices, as the expected value of future dividends rises due to higher aggregate demand and lower discount rates. This restriction also helps to disentangle pure monetary policy shock from central bank information shocks, as suggested by the empirical analysis of Jarociński and Karadi (2020) which shows that stock prices can react to monetary policy announcements counter to the theory due to contamination from the news shocks.
Table 1 Identification restrictions in the TVP-SVAR-SV
Shock Real GDP HICP EONIA Euro Stoxx 50 EUR/USD Aggregate demand + + 0 Aggregate supply + – 0 Monetary policy – + –
We also impose that the exchange rate depreciates following the expansionary monetary policy shock as the standard uncovered interest rate parity mechanism would imply – interest rate differentials induce international capital flows affecting the exchange rate movements. However, in order to remain agnostic about the real effects of policy rates, we leave the responses of real GDP and HICP inflation unrestricted. Additionally, we identify aggregate demand and supply shocks to control for the effects stemming from the business cycle disturbances. Those shocks are orthogonalised from monetary policy disturbance via the zero restriction on the EONIA, assuming that the central bank cannot contemporaneously react to real shocks. All restrictions are imposed to hold on impact only.
2.2 Non-linear local projections
As our second model, we employ non-linear local projections in the spirit of Jordà (2005). In essence, this method constructs impulse response functions as a series of regressions for each dependent variable and horizon h: 𝑥 = 𝐼 𝛼 , + 𝜓 , 𝐿)𝑧 + 𝛽 , 𝑠ℎ𝑜𝑐𝑘 + 1 − 𝐼 ) 𝛼 , + 𝜓 , 𝐿)𝑧 + 𝛽 , 𝑠ℎ𝑜𝑐𝑘 + 𝜀 (6)
where 𝑥 are the dependent variables (the same set used in the TVP-SVAR-SV), 𝛼 is the constant, 𝜓 𝐿) is a polynomial in the lag operator optimised via BIC criterion with the maximum lag order set to 4, 𝑧 is a vector of control variables, 𝑠ℎ𝑜𝑐𝑘 is the identified MP shock and 𝐼 ∈ 0, 1 is a dummy variable indicating the state of the system when the shock hits. In our case, we use narrative information to identify the states, namely we assume that the ZLB has been binding in the euro area since the ECB first cut the deposit facility rate to zero in July 2012, so we set 𝐼 to take the value of 1 from the third quarter of 2012 to the second quarter of 2019 and 0 in pre-ZLB period from the first quarter of 2000 to the second quarter of 2012. However, a potential drawback of generating the impulse responses via the local projection approach is that the successive leading of the dependent variable can lead to serial correlation in the errors. To overcome this issue, we use the Newey-West correction for the standard errors (Newey and West (1987)). All variables enter the model in log-levels, except interest rates which enter in levels, in line with local projections literature (e.g. Ramey and Zubairy (2018), Alpanda et al. (2019)).

ZLB AND BEYOND: REAL AND FINANCIAL EFFECTS OF LOW AND NEGATIVE INTEREST RATES IN THE EURO AREA 6/2020
9
The monetary policy shock series is obtained via high frequency identification approach, using the high frequency co-movement of interest rates, stock prices and exchange rate around the ECB policy announcements. This approach has been widely used to study the effects of the US monetary policy for nearly two decades (see Kuttner (2001), Cochrane and Piazzesi (2002), Gürkaynak et al. (2005), Gertler and Karadi (2015) and Nakamura and Steinsson (2018)), while the literature focusing on the ECB monetary policy has been more limited due to the lack of easily available, high quality database containing high frequency surprises around policy announcements. Still, this identification strategy has become increasingly more widespread for studying the effects of monetary policy in the euro area as well (see Andrade and Ferroni (2020), Altavilla et al. (2019a), Jarociński and Karadi (2020) and Holm-Hadulla and Thürwächter (2020)).
In this paper, we obtain high frequency surprises from the Euro Area Monetary Policy Event-Study Database (EA-MPD), a high quality database containing the responses of a broad set of financial variables to the ECB policy announcements created and made publicly available by Altavilla et al. (2019a). We use the Press Release Window where the surprises are measured as a change in the median quote from the window 13.25–13.35 before the press release to the median quote in the window 14.00–14.10 after it. The short time period ensures that the identified monetary policy shock series is orthogonal to other non-monetary shocks hitting the economy. However, Andrade and Ferroni (2020), Kerssenfischer (2019) and Jarociński and Karadi (2020) have empirically showed that high frequency surprises around policy announcements are contaminated with the central bank information shocks because central banks provide news not only about monetary policy but also about the state of the economy during announcements. To control for the information effect, we follow their approach and isolate it from pure monetary policy shock via sign restrictions. In the first step, following Jarociński and Karadi (2020), we include high frequency surprises into the VAR and ensure that they do not depend on their own lags:
𝑚 = 𝑎 + 0 𝑚 + 𝜀where 𝑚 are the high frequency reactions of the 3-month OIS rate, Eurostoxx 50 and EUR/USD exchange rate to policy announcements. Our choice of the 3-month OIS rate as a monetary policy instrument is identical to Jarociński and Karadi (2020) and is motivated by the evidence from Altavilla et al. (2019a) that policy rate cuts have larger impact on the short-end of the term structure. This allows us to distinguish standard monetary policy actions from non-standard measures like forward guidance and asset purchases which have a larger impact on medium- and long-term maturities. The VAR is estimated on a quarterly basis from the first quarter of 1999 to the second quarter of 2019 with standard Bayesian techniques by specifying an independent Normal-Wishart prior.1 Given the fact that several announcements take place during quarter 𝑡, the daily surprises are summed up which is a standard approach in the high frequency identification literature (see e.g. Andrade and Ferroni (2020),
1 We set the AR coefficient of the prior to 0, overall tightness 𝜆 = 0.1, cross-variable weighting 𝜆 = 0.5, lag decay 𝜆 = 1 and block exogeneity shrinkage 𝜆 = 0.001.
(7)

ZLB AND BEYOND: REAL AND FINANCIAL EFFECTS OF LOW AND NEGATIVE INTEREST RATES IN THE EURO AREA 6/2020
10
Kerssenfischer (2019), Hachula et al. (2020)).2 In the second step, we apply the sign restrictions algorithm of Arias et al. (2018) with the following identifying restrictions.
Table 2 Identification restrictions used in high frequency information approach
Shock 3-month OIS Euro Stoxx 50 EUR/USD Monetary policy – + – Central bank information – –
Pure monetary policy shock is disentangled from the central bank information shock following the logic of Jarociński and Karadi (2020). Pure monetary easing is assumed to boost stock prices as it inflates the expected value of future dividends, while a negative information shock entails a fall in stock prices because a policy rate cut signals that the business cycle is weaker than expected, depressing dividend expectations. Thus, those two shocks embedded in central bank announcements are mainly told apart via opposite sign restrictions on the Euro Stoxx 50. Additionally, we also impose a sign restriction on the exchange rate due to a counterintuitive response to policy announcements in a significant number of cases.3 Figure 1 shows that in roughly half of the cases EUR/USD exchange rate reacts opposite to what is expected according to economic theory (quadrants II and IV).4
Figure 1 Exchange rate response to policy announcements
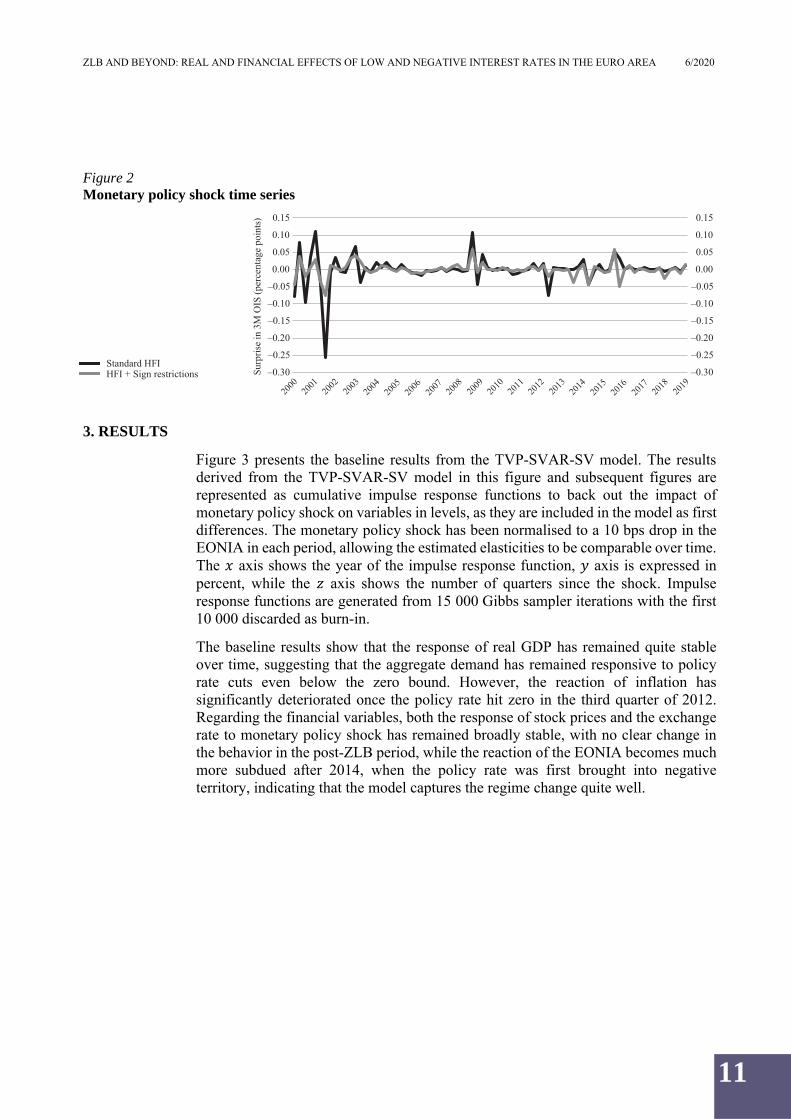
Figure 2 below shows the obtained shock series using our approach which augments the high frequency information with sign restrictions and compares it to the monetary policy shock obtained via standard HFI approach (measured simply as surprises in the 3-month OIS rate).
2 We estimate the VAR with high frequency surprises on a quarterly basis to match the frequency of data used in the local projections. However, estimating the VAR with monthly surprises yields a very similar quarterly monetary policy shock series after aggregating the monthly shock series. 3 "–" indicates depreciation of the euro against the US dollar. 4 Excluding those observations which include 0 – in total 55 cases.
–1.5
–1.0
–0.5
0
0.5
1.0
1.5
–0.3 –0.2 –0.1 0 0.1 0.2 0.3
Su
rpri
sein
EU
R/U
SD
(per
cen
tag
ep
oin
ts)
Surprise in 3M OIS (percentage points)
I:53II:46
III:49 IV:61
ZLB AND BEYOND: REAL AND FINANCIAL EFFECTS OF LOW AND NEGATIVE INTEREST RATES IN THE EURO AREA 6/2020
11
Figure 2 Monetary policy shock time series
3. RESULTS
Figure 3 presents the baseline results from the TVP-SVAR-SV model. The results derived from the TVP-SVAR-SV model in this figure and subsequent figures are represented as cumulative impulse response functions to back out the impact of monetary policy shock on variables in levels, as they are included in the model as first differences. The monetary policy shock has been normalised to a 10 bps drop in the EONIA in each period, allowing the estimated elasticities to be comparable over time. The 𝑥 axis shows the year of the impulse response function, 𝑦 axis is expressed in percent, while the 𝑧 axis shows the number of quarters since the shock. Impulse response functions are generated from 15 000 Gibbs sampler iterations with the first 10 000 discarded as burn-in.
The baseline results show that the response of real GDP has remained quite stable over time, suggesting that the aggregate demand has remained responsive to policy rate cuts even below the zero bound. However, the reaction of inflation has significantly deteriorated once the policy rate hit zero in the third quarter of 2012. Regarding the financial variables, both the response of stock prices and the exchange rate to monetary policy shock has remained broadly stable, with no clear change in the behavior in the post-ZLB period, while the reaction of the EONIA becomes much more subdued after 2014, when the policy rate was first brought into negative territory, indicating that the model captures the regime change quite well.
–0.30
–0.25
–0.20
–0.15
–0.10
–0.05
0.00
0.05
0.10
0.15
Su
rpri
sein
3M
OIS
(per
cen
tag
ep
oin
ts)
Standard HFIHFI + Sign restrictions –0.30
–0.25
–0.20
–0.15
–0.10
–0.05
0.00
0.05
0.10
0.15

ZLB AND BEYOND: REAL AND FINANCIAL EFFECTS OF LOW AND NEGATIVE INTEREST RATES IN THE EURO AREA 6/2020
12
Figure 3 Baseline results from the TVP-SVAR-SV
Note. Figure shows cumulative impulse response functions to monetary policy shock which has been normalised to a 10 bps drop in the EONIA in each period.
The findings from the TVP-SVAR-SV model are confirmed by the results from the non-linear local projections reported in Figure 4. Similarly, Figure 4 shows impulse response functions to the monetary policy shock which has been normalised to a 10 bps drop in the EONIA in both states and vertical axis is expressed in percent, while the horizontal axis shows the number of quarters since the shock. Despite using an alternative method for generating the non-linear impulse responses and identification strategy, the same key findings emerge from the NL-LP model – the reaction of real GDP has remained unchanged in times of sub-zero policy rates, while the price
0.25
0.15
0.20
0.10
0
0.05
2002 2006 2008 2010 2012 2014 2016 20182004
2010
0
Real GDP HICP
0.15
0.10
0
0.05
20
10
02002 2006 2008 2010 2012 2014 2016 20182004
EONIA Dow Jones Euro Stoxx 50
0
–0.05
–0.15
–0.10
2002 2006 2008 2010 2012 2014 2016 20182004
20
10
0 2002 2006 2008 2010 2012 2014 2016 20182004
2.2
1.8
2.0
1.2
0.8
1.0
1.4
1.6
2010
0
EUR/USD
20022006200820102012201420162018
–0.6
–0.8
–0.7
–1.1
–1.2
–1.0
–0.9
20
100
2004

ZLB AND BEYOND: REAL AND FINANCIAL EFFECTS OF LOW AND NEGATIVE INTEREST RATES IN THE EURO AREA 6/2020
13
pressures have tailed off, as the response of HICP inflation is erratic and insignificant for most of the horizon in the post-ZLB period.5
Figure 4 Baseline results from the NL-LP
Note. Figure shows impulse response functions to monetary policy shock which has been normalised to a 10 bps drop in the EONIA in both states.
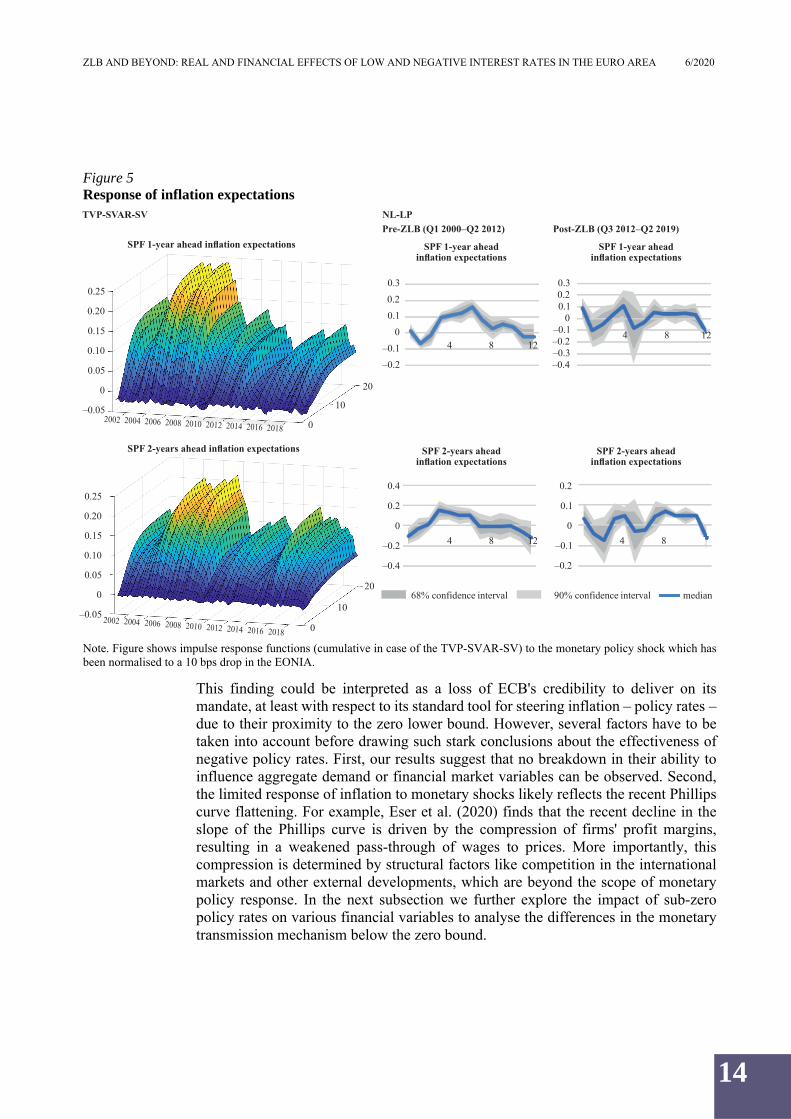
Furthermore, Figure 5 documents that both short- and medium-term inflation expectations have also considerably declined since the policy rate approached the zero bound. This helps to explain why the policy rate has been less successful in generating inflationary pressures in the economy in the latter period despite having a similar ability to reduce slack as in normal times. Similar findings are reported in Moretti et al. (2019) who argue that expectations are the key driver of core inflation in the euro area and explains the bulk of low inflation since 2014.
5 Nonetheless, we note the difference in the magnitude of the monetary policy impact between both models – NL-LP produces substantially higher impact estimates of a policy rate cut on the economy. This can likely be explained by two factors. First, since the variables enter the NL-LP model as levels, this allows to capture the cointegrating relationships between them, which are bypassed in the case of the TVP-SVAR-SV model, as the data are included as first-differences. The second factor are the differences in identification – high frequency information approach used in the NL-LP allows to take announcements effects into the account, which can potentially be larger than the effects from the actual implementation (Andrade et al. (2016)). For example, Holm-Hadulla and Thürwächter (2020) also employ local projections and take high frequency surprises from the EA-MPD database to study the effects of monetary policy in the euro area and report similar elasticities for a policy rate cut.
Real GDP HICP inflation Real GDP HICP inflation
EONIA Eurostoxx 50 EONIA Eurostoxx 50
EUR/USD EUR/USD
68% confidence interval
Pre-ZLB (Q1 2000–Q2 2012) Post-ZLB (Q3 2012–Q2 2019)
1.5
0.5
1.0
0
–0.54 8 12
0.6
0.2
0.4
0
–0.4–0.2 84 12
1.5
0.5
1.0
0
–0.54 8 12
1.0
0.5
0
–1.0
–0.5 4 8 12
0.6
0.2
0.4
0
–0.4–0.2 84 12
10
5
0
–10
–54 8 12
0.4
0.2
0
–0.24 8 12
10
5
0
–10
–584 12
6
2
4
0
–4–2 4 8 12
5
0
–5
–10
4 8 12
90% confidence interval median
ZLB AND BEYOND: REAL AND FINANCIAL EFFECTS OF LOW AND NEGATIVE INTEREST RATES IN THE EURO AREA 6/2020
14
Figure 5 Response of inflation expectations
Note. Figure shows impulse response functions (cumulative in case of the TVP-SVAR-SV) to the monetary policy shock which has been normalised to a 10 bps drop in the EONIA.
This finding could be interpreted as a loss of ECB's credibility to deliver on its mandate, at least with respect to its standard tool for steering inflation – policy rates – due to their proximity to the zero lower bound. However, several factors have to be taken into account before drawing such stark conclusions about the effectiveness of negative policy rates. First, our results suggest that no breakdown in their ability to influence aggregate demand or financial market variables can be observed. Second, the limited response of inflation to monetary shocks likely reflects the recent Phillips curve flattening. For example, Eser et al. (2020) finds that the recent decline in the slope of the Phillips curve is driven by the compression of firms' profit margins, resulting in a weakened pass-through of wages to prices. More importantly, this compression is determined by structural factors like competition in the international markets and other external developments, which are beyond the scope of monetary policy response. In the next subsection we further explore the impact of sub-zero policy rates on various financial variables to analyse the differences in the monetary transmission mechanism below the zero bound.
0.25
0.15
0.20
0.10
–0.05
0.05
2002 2006 2008 2010 2012 2014 2016 20182004
20
10
0
SPF 1-year ahead inflation expectations
SPF 2-years ahead inflation expectations
0
NL-LP
Pre-ZLB (Q1 2000–Q2 2012) Post-ZLB (Q3 2012–Q2 2019)
0.25
0.15
0.20
0.10
–0.05
0.05
0
2002 2006 2008 2010 2012 2014 2016 20182004
20
10
0
68% confidence interval 90% confidence interval median
SPF 1-year aheadinflation expectations
SPF 1-year aheadinflation expectations
0.3
0.10.2
0
–0.2
4 8 120.1–4 8 12
0.3
0.10.2
0
–0.4
–0.1
–0.30.2–
SPF 2-years aheadinflation expectations
SPF 2-years aheadinflation expectations
0.4
0.2
0
–0.4
4 8 12–0.2 4 8 1122
0.2
0.1
0
–0.2
–0.14 8 12 4 8
TVP-SVAR-SV

ZLB AND BEYOND: REAL AND FINANCIAL EFFECTS OF LOW AND NEGATIVE INTEREST RATES IN THE EURO AREA 6/2020
15
3.1. Transmission mechanism of negative interest rates
To pin down the changes in transmission mechanism beyond the ZLB, we expand the baseline specification of both models with additional variables, one-by-one.
Figure 6 Impact on the term structure
Note. Figure shows impulse response functions (cumulative in case of the TVP-SVAR-SV) to the monetary policy shock which has been normalised to a 10 bps drop in the EONIA.
We start by looking at the propagation of negative policy rates through the term structure which is deemed to be more powerful compared to policy rate cuts in positive territory (Altavilla et al. (2019a), Lane (2020)). Our results in Figure 6 confirm their findings as both the impulse responses from the TVP-SVAR-SV and NL-LP point to a considerable compression in the yield curve when policy rates are pushed into negative territory, especially at longer maturities, theoretically resulting in lower borrowing costs.
–0.10
–0.14
–0.12
–0.16
–0.18
2002 2006 2008 2010 2012 2014 2016 20182004
20
10
0
2-year bond yields
3-year bond yields
–0.20
NL-LP
Pre-ZLB (Q1 2000–Q2 2012) Post-ZLB (Q3 2012–Q2 2019)
0.1
0
–0.1
–0.4
–0.2
–0.3
2002 2006 2008 2010 2012 2014 2016 20182004
20
10
0
68% confidence interval 90% confidence interval median
2-year bond yields 2-year bond yields
0.8
0.40.6
0
–0.44 8 12–0.2
4 8 12
0.4
0.2
0
–0.6
–0.4
–0.2
3-year bond yields 3-year bond yields
0.6
0.20
–0.6
–0.284 12
0.4
0.2
0
–0 6.
–0.44 8 12
5-year bond yields
0.4
0
0.2
–0.2
–0.6
–0.4
2002 2006 2008 2010 2012 2014 2016 20182004
20
10
0
5-year bond yields 5-year bond yields
84 124 8 12
0.8
0.20
–0.4–0.2
0.2
–0.6
0.8
0.4
–0.4
–0.2
–0.6
0.60.4
0.4
0.2
0
–0 6.
–0.4
–0.2
TVP-SVAR-SV

ZLB AND BEYOND: REAL AND FINANCIAL EFFECTS OF LOW AND NEGATIVE INTEREST RATES IN THE EURO AREA 6/2020
16
Figure 7 Impact on the interest rate expectations
Note. Figure shows impulse response functions (cumulative in case of the TVP-SVAR-SV) to the monetary policy shock which has been normalised to a 10 bps drop in the EONIA.
This effect on the term structure is mainly obtained via lower interest rate expectations as suggested in Rostagno et al. (2019). The intuition is rather simple – by going negative, central bank removes self- or economic theory-imposed non-negativity restriction, thus signaling to the market participants that future rate cuts are possible, putting downward pressure on future policy rate expectations which are then passed onto the yield curve. Results from our models, illustrated in Figure 7, confirm their findings as both 1- and 2-year forward rates remain at lower levels after the zero bound, suggesting that negative interest rates have indeed succeeded in lowering rate expectations in the euro area. However, our results in Figure 8 show that the more powerful propagation of policy rate cuts below the zero through the term structure has not led to lower borrowing costs. While the median responses from both the TVP-SVAR-SV and the NL-LP model suggest that the pass-through to lending rates has remained intact and even increased in the post-ZLB period, impulse responses from the NL-LP are surrounded with wide confidence bands, rendering them statistically insignficant.
This breakdown in pass-through of sub-zero policy rates to lending rates is also documented in Eggertsson et al. (2017) and Altavilla et al. (2019b). Eggertsson et al. (2017) explains this change in the monetary transmission mechanism as follows: with deposit rates being sticky at zero, banks are reluctant to lower interest rates on their loans to protect profit margins. We tend to agree to this explanation, given our results regarding bank profitability which are more thoroughly discussed in the next section
0.15
0.05
0.10
0
–0.05
2002 2006 2008 2010 2012 2014 2016 20182004
2010
0
3-month EURIBOR 1-year forward rate
3-month EURIBOR 2-year forward rate
–0.10
NL-LP
Pre-ZLB (Q1 2000–Q2 2012) Post-ZLB (Q3 2012–Q2 2019)
0.10
0.06
0.04
–0.04
0.02
0
2010
068% confidence interval 90% confidence interval median
3-month EURIBOR1-year forward rate
3-month EURIBOR1-year forward rate
0.8
0.40.6
0
–0.44 8 12–0.2
84 12
0.4
0.2
0
–0.2
3-month EURIBOR2-year forward rate
3-month EURIBOR2-year forward rate
0.6
0.2
0
–0.24 8 12
0.4
0.2
0
–0.4
4 8 12
0.2
–0.6
0.4
–0.4
–0.2
2002 2006 2008 2010 2012 2014 2016 20182004
–0.02
0.08
TVP-SVAR-SV

ZLB AND BEYOND: REAL AND FINANCIAL EFFECTS OF LOW AND NEGATIVE INTEREST RATES IN THE EURO AREA 6/2020
17
of the paper. More importantly, Eggertsson et al. (2017) argue that lower bank profitability leads to an increase in cost of financial intermediation which in turn dampens credit supply, making the bank lending channel irrelevant beyond the zero bound. On the other hand, Altavilla et al. (2019b) maintain that the bank lending channel remains active also in negative territory since the positive effects on the real activity lower provisions for non-performing loans which helps to offset the adverse effects on the credit supply stemming from the lower bank profitability.
Figure 8 Pass-through to lending rates
Note. Figure shows impulse response functions (cumulative in case of the TVP-SVAR-SV) to the monetary policy shock which has been normalised to a 10 bps drop in the EONIA.
Our findings in Figure 9 suggest that the effects on bank lending have been rather heterogenous with respect to the type of borrower. Lending to households seems to have remained largely unaffected by the observed decline in pass-through of policy rates to lending rates in a negative interest rate environment as the magnitude of response, to a large extent, is identical to normal times. Nonetheless, lending to non-financial firms has declined markedly since the introduction of negative interest rates in the euro area, possibly indicating that the adverse effects of bank profitability outweigh the gains from lower impairment provisioning on the credit supply.
While these supply-side constraints emerging below the zero bound cannot be completely ruled out, it is possible that firms switched to alternative financing sources as banks were reluctant to pass policy rate cuts onto borrowing costs. Given that firms have more options to finance their needs in comparison to households, this proposition motivates us to further explore the decline in corporate lending from the perspective of
–0.10
–0.15
–0.20
2002
20
10
Lending rate to non-financial firms
2004 2006 2008 2010 2012 2014 2016 2018 0
Lending rate to households for house purchase
–0.25
NL-LP
Pre-ZLB (Q1 2000–Q2 2012) Post-ZLB (Q3 2012–Q2 2019)
2010
068% confidence interval 90% confidence interval median
Lending rateto non-financial firms
Lending rateto non-financial firms
0
4 8 12–0.184 12
0.4
0.2
0
–0.4
Lending rate to householdsfor house purchase
Lending rate to householdsfor house purchase
0.2
0
–0.2 84 12
0.4
0.2
0
–0.4
4 8 12
0.2
–0.2
–0.4
–0.2
2002 2006 2008 2010 2012 2014 2016 20182004
–0.10
–0.15
–0.20
–0.25
0.1
–0.2
TVP-SVAR-SV

ZLB AND BEYOND: REAL AND FINANCIAL EFFECTS OF LOW AND NEGATIVE INTEREST RATES IN THE EURO AREA 6/2020
18
demand-side factors. A simple look at the dynamics of corporate financing sources in Appendix A2 shows that the role of bank lending has indeed continuously diminished since the onset of the Great Recession, while the shares of equity and non-bank lending have progressively increased over the same period, suggesting that the shift in the financing structure of firms was well under way even before the ZLB (see also Adrian et al. (2013), De Fiore and Uhlig (2015), Holm-Hadulla and Thürwächter (2020)).
Figure 9 Impact on bank lending
Note. Figure shows impulse response functions (cumulative in case of the TVP-SVAR-SV) to the monetary policy shock which has been normalised to a 10 bps drop in the EONIA.
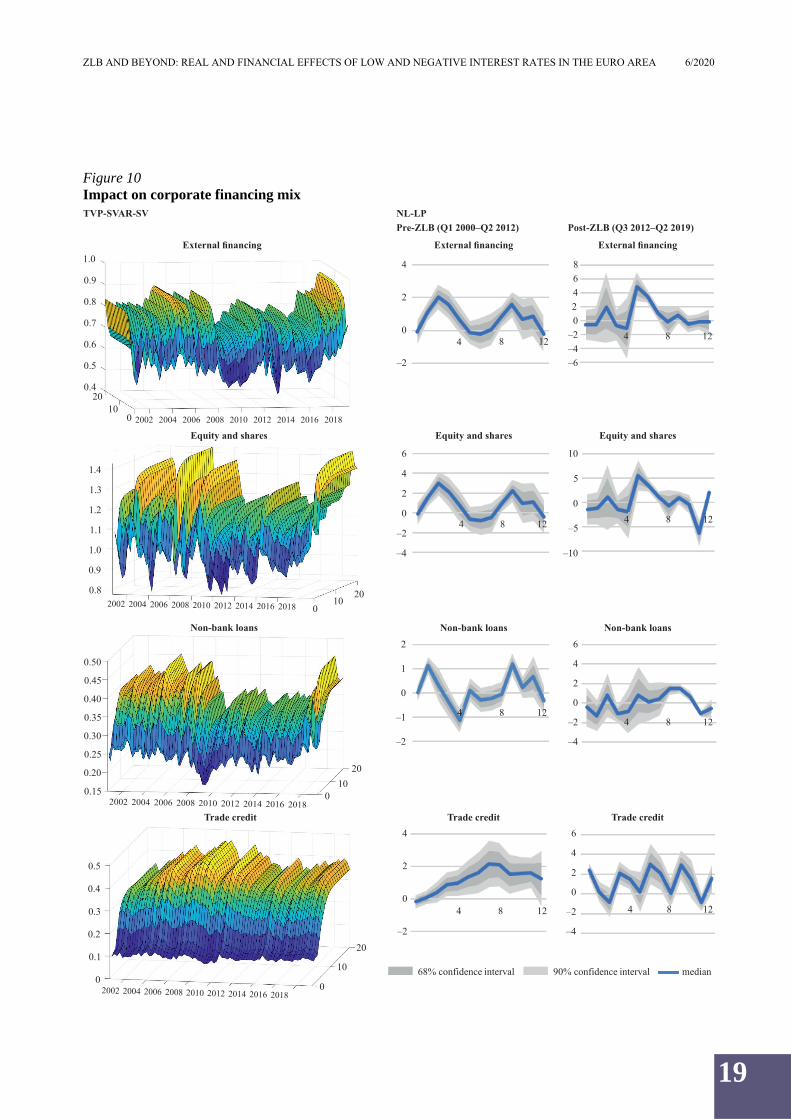
However, the response of non-bank external financing variable which we construct as a sum of sum of equity, non-bank loans, trade credit and debt securities in Figure 10 reveals that firms have relied increasingly more on alternative sources of credit other than bank lending since policy rates went negative. We believe that this shift away from bank credit was motivated by the limited pass-through of policy rates to bank lending rates, thus other sources of external financing became more attractive to firms. In particular, our results show that firms financed their operations more by raising equity, turning to non-bank lenders and issuing corporate bonds. Regarding the latter, our results in Figure 11 document that corporate credit spreads have persistently declined in the post-ZLB period, rendering the issuance of bonds more attractive to firms. With respect to the response of trade credit, the results show no change in behaviour after the ZLB has been reached. However, this is not surprising as Mandler and Scharnagl (2019) argue that trade credit complements bank lending rather than substitutes it.
0.6
2002
2010
0
Lending to non-financial firms
2004 2006 2008 2010 2012 2014 2016 2018
Lending to households for house purchase
–0.1
NL-LP
Pre-ZLB (Q1 2000–Q2 2012) Post-ZLB (Q3 2012–Q2 2019)
2010
068% confidence interval 90% confidence interval median
Lendingto non-financial firms
Lendingto non-financial firms
1
4 8 120
84 12
Lending to householdsfor house purchase
Lending to householdsfor house purchase
2
1
04 8 12
4
2
0
–2
4 8 12
4
–1
–1
2002 20062008201020122014201620182004
1.2
–0.2
30.5
0.4
0.3
0.2
0.1
0
1.0
0.8
0.6
0.4
0.2
0
20
4
–4
2
–2
TVP-SVAR-SV
ZLB AND BEYOND: REAL AND FINANCIAL EFFECTS OF LOW AND NEGATIVE INTEREST RATES IN THE EURO AREA 6/2020
19
Figure 10 Impact on corporate financing mix
1.0
20
External financing
Non-bank loans
NL-LP
Pre-ZLB (Q1 2000–Q2 2012) Post-ZLB (Q3 2012–Q2 2019)
0.50
0.45
0.35
0.15
0.30
0.25
2002 2004
2010
0
External financing External financing
4
0
2
4 8 12 4 8 12
864
–6
02
Non-bank loans Non-bank loans
4 8 12
6
2
0
–4
4 8 12
2006 2008 2010 2012 2014 2016 2018Trade credit
0.5
02002 2006 2008 2010 2012 2014 2016 20182004
20
10
0
Trade credit Trade credit
84 124 8 12
4
0
–2
–2
–2
2
6
4
2
–4
–2
0
100 2002 2004 2006 2008 2010 2012 2014 2016 2018
0.9
0.8
0.7
0.5
0.4
0.6
0.20
0.4
0.3
0.2
0.1
–4–2
TVP-SVAR-SV
Equity and shares
1.4
1.3
1.2
0.8
1.1
1.0
2002 2006 2008 2010 2012 2014 2016 2018200420
100
Equity and shares Equity and shares
4
0
–4
–284 12
10
5
0
–10
84 12
6
2
–5
0.9
4
2
0
–2
1
–1
0.40
68% confidence interval 90% confidence interval median

ZLB AND BEYOND: REAL AND FINANCIAL EFFECTS OF LOW AND NEGATIVE INTEREST RATES IN THE EURO AREA 6/2020
20
Note. Figure shows impulse response functions (cumulative in case of the TVP-SVAR-SV) to the monetary policy shock which has been normalised to a 10 bps drop in the EONIA.
Overall, our evidence gives the impression that both supply- and demand-side factors have driven the decline in bank lending to corporates. The observed breakdown in pass-through of policy rates to lending rates has motivated firms to switch to other financing sources as they became more attractive below the ZLB.
Figure 11 Impact on corporate credit spreads
Note. Figure shows impulse response functions (cumulative in case of the TVP-SVAR-SV) to the monetary policy shock which has been normalised to a 10 bps drop in the EONIA.
However, while banks were indeed reluctant to lower interest rates on their loans, we think that banks did not cut the credit supply as a consequence of negative policy rate policy because, if that were the case, we would most likely also observe the same pattern in lending to households. In the next section, we argue that the decline in pass-through to lending rates was driven by the need of banks to protect their profitability in light of squeezing net interest rate margins.
4. SIDE EFFECTS
We now turn our attention to the side effects often associated with a prolonged period of low and negative interest rates. Specifically, we look at three potential side effects of sub-zero policy rates: – they have adverse effect on bank profitability (Eggertsson et al. (2017);Brunnermeier and Koby (2018));
68% confidence interval 90% confidence interval median
Corporate debt securities
0.4
0
0.2
–0.2
–0.6
–0.4
2002 2006 2008 2010 2012 2014 2016 20182004
2010
0
Corporate debt securities Corporate debt securities
4 8 12
4 8 12
2
–4
–2
–6
0
4
2
0
–4
–2
NL-LP
Pre-ZLB (Q1 2000–Q2 2012) Post-ZLB (Q3 2012–Q2 2019)
Corporate credit spreads Corporate credit spreads
4 8 124 8 12
68% confidence interval 90% confidence interval median
0
–0.1
–0.2
2002 2006 2008 2010 2012 2014 2016 20182004
20
10
0
Corporate credit spreads
–0.4
–0.3
0.4
0
0.2
–0.2
–0.4
–0.6
0.6
0.2
0.4
0
–0.2
–0.4
TVP-SVAR-SV
ZLB AND BEYOND: REAL AND FINANCIAL EFFECTS OF LOW AND NEGATIVE INTEREST RATES IN THE EURO AREA 6/2020
21
– they generate asset price bubbles, especially in the real estate market (Schnabel(2020));– they lead agents to hoard cash (ECB (2020)).
Probably the most widely expressed concern regarding the counterproductive effects of negative policy rates is about the downward pressure they exert on bank profitability. Alessandri and Nelson (2015), Borio et al. (2017) and Brunnermeier and Koby (2018) argue that they reduce banks' net interest income as lending rates decline while deposit rates remain sticky at zero. However, as discussed in the previous section, negative policy rates do not necessarily translate into lower lending rates, while Altavilla et al. (2019b) shows that sound banks were actually able to impose negative rates on corporate deposits. Moreover, Altavilla et al. (2018), Altavilla et al. (2019b) and Klein (2020) find that the beneficial effects of sub-zero policy rates on macroeconomic conditions and outlook drive down the loss provisions for non-performing loans, thus counteracting the adverse effects on bank profitability.
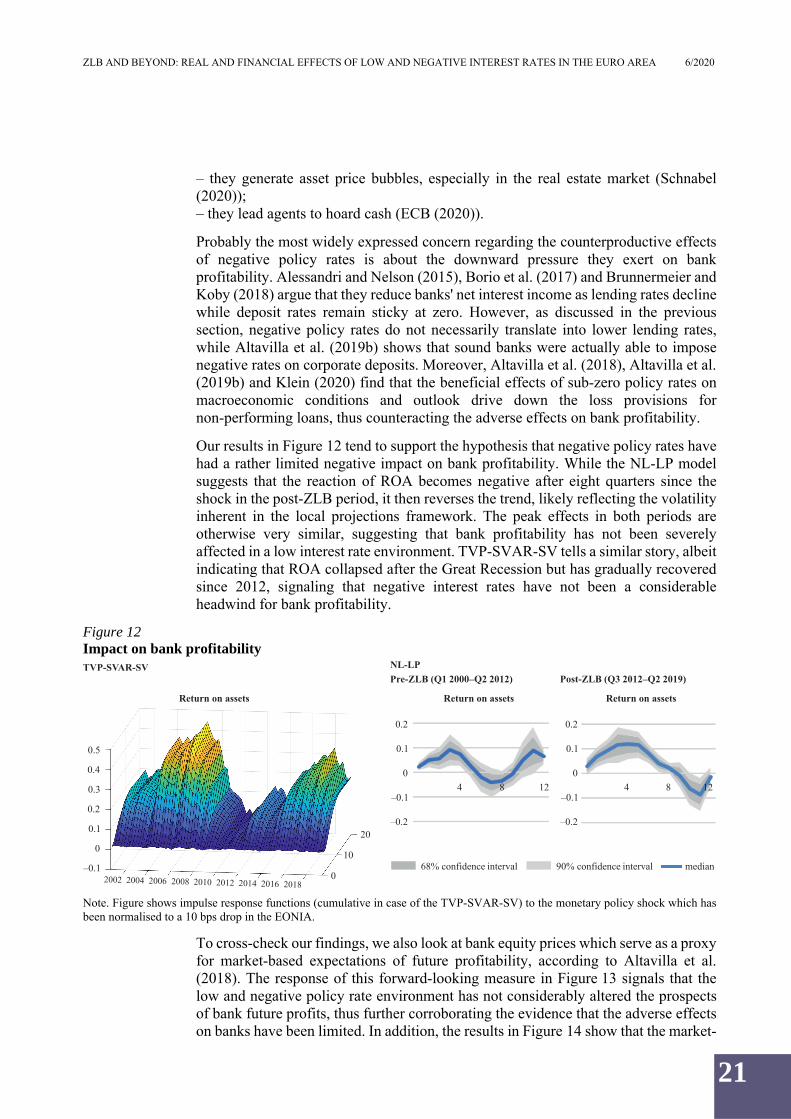
Our results in Figure 12 tend to support the hypothesis that negative policy rates have had a rather limited negative impact on bank profitability. While the NL-LP model suggests that the reaction of ROA becomes negative after eight quarters since the shock in the post-ZLB period, it then reverses the trend, likely reflecting the volatility inherent in the local projections framework. The peak effects in both periods are otherwise very similar, suggesting that bank profitability has not been severely affected in a low interest rate environment. TVP-SVAR-SV tells a similar story, albeit indicating that ROA collapsed after the Great Recession but has gradually recovered since 2012, signaling that negative interest rates have not been a considerable headwind for bank profitability.
Figure 12 Impact on bank profitability
Note. Figure shows impulse response functions (cumulative in case of the TVP-SVAR-SV) to the monetary policy shock which has been normalised to a 10 bps drop in the EONIA.
To cross-check our findings, we also look at bank equity prices which serve as a proxy for market-based expectations of future profitability, according to Altavilla et al. (2018). The response of this forward-looking measure in Figure 13 signals that the low and negative policy rate environment has not considerably altered the prospects of bank future profits, thus further corroborating the evidence that the adverse effects on banks have been limited. In addition, the results in Figure 14 show that the market-
NL-LP
Pre-ZLB (Q1 2000–Q2 2012) Post-ZLB (Q3 2012–Q2 2019)
Return on assets Return on assets
4 8 12 4 8 12
68% confidence interval 90% confidence interval median
0.5
2002 2006 2008 2010 2012 2014 2016 20182004
20
10
0
Return on assets
–0.1
0.2
0
0.1
–0.1
–0.2
0.4
0.3
0.2
0.1
0
0.2
0
0.1
–0.1
–0.2
TVP-SVAR-SV

ZLB AND BEYOND: REAL AND FINANCIAL EFFECTS OF LOW AND NEGATIVE INTEREST RATES IN THE EURO AREA 6/2020
22
based perception of bank credit risk has persistently declined following the introduction of sub-zero policy rates, lowering the cost of market funding for banks and supporting their profitability.
Figure 13 Impact on bank profitability expectations
Note. Figure shows impulse response functions (cumulative in case of the TVP-SVAR-SV) to the monetary policy shock which has been normalised to a 10 bps drop in the EONIA.
Figure 14 Impact on bank credit risk6
Note. Figure shows impulse response functions (cumulative in case of the TVP-SVAR-SV) to the monetary policy shock which has been normalised to a 10 bps drop in the EONIA.
To sum up, there is very little evidence to suggest that low and negative policy rates have adversely affected the profitability of euro area banks. These findings also support the conclusions from the previous section that banks did not cut the credit supply below the ZLB, ensuring that the monetary transmission remains intact.
Another side effect often atributed to low interest rate environment concerns the financial stability, as excessive liquidity can lead to credit-driven asset price bubbles, especially in the real estate market. Also our results regarding household mortgages
6 We use Gilchrist and Mojon (2018) euro area bank credit spreads against the German Bund as a measure of market-based perception of credit risk.
NL-LP
Pre-ZLB (Q1 2000–Q2 2012) Post-ZLB (Q3 2012–Q2 2019)
Euro Stoxx Banks Euro Stoxx Banks
84 1284 12
68% confidence interval 90% confidence interval median
2.5
2002 2006 2008 2010 2012 2014 2016 20182004
20
10
0
Euro Stoxx Banks
20
0
10
–10
–20
2.0
1.5
1.0
0.5
30
0
10
–10
–20
20
TVP-SVAR-SV
NL-LP
Pre-ZLB (Q1 2000–Q2 2012) Post-ZLB (Q3 2012–Q2 2019)
Bank credit spreads Bank credit spreads
84 1284 12
68% confidence interval 90% confidence interval median
Bank credit spreads
0.4
0
0.2
–0.2
–0.4
0.02
2010
–0.080
2018 2014 2012 2010 2008 2006 2004 20022016
0
–0.02
–0.04
–0.06
0.4
0
0.2
–0.2
–0.4
–0.6
TVP-SVAR-SV
ZLB AND BEYOND: REAL AND FINANCIAL EFFECTS OF LOW AND NEGATIVE INTEREST RATES IN THE EURO AREA 6/2020
23
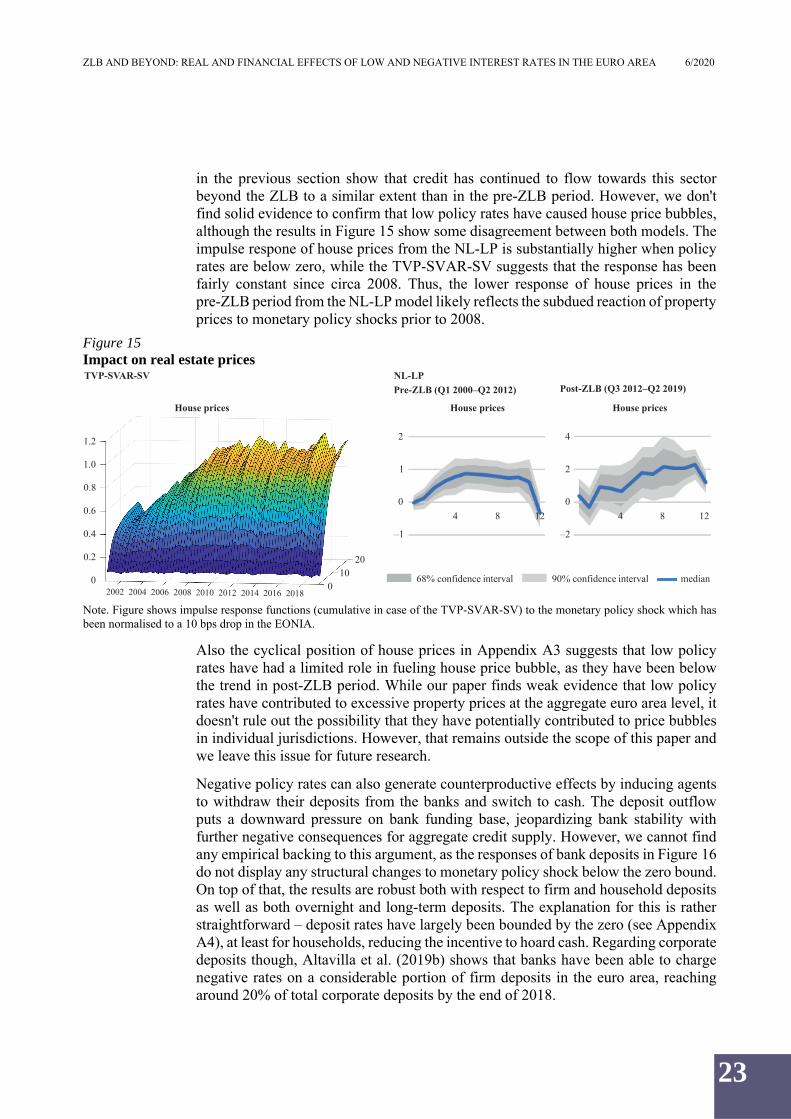
in the previous section show that credit has continued to flow towards this sector beyond the ZLB to a similar extent than in the pre-ZLB period. However, we don't find solid evidence to confirm that low policy rates have caused house price bubbles, although the results in Figure 15 show some disagreement between both models. The impulse respone of house prices from the NL-LP is substantially higher when policy rates are below zero, while the TVP-SVAR-SV suggests that the response has been fairly constant since circa 2008. Thus, the lower response of house prices in the pre-ZLB period from the NL-LP model likely reflects the subdued reaction of property prices to monetary policy shocks prior to 2008.
Figure 15 Impact on real estate prices
Note. Figure shows impulse response functions (cumulative in case of the TVP-SVAR-SV) to the monetary policy shock which has been normalised to a 10 bps drop in the EONIA.
Also the cyclical position of house prices in Appendix A3 suggests that low policy rates have had a limited role in fueling house price bubble, as they have been below the trend in post-ZLB period. While our paper finds weak evidence that low policy rates have contributed to excessive property prices at the aggregate euro area level, it doesn't rule out the possibility that they have potentially contributed to price bubbles in individual jurisdictions. However, that remains outside the scope of this paper and we leave this issue for future research.
Negative policy rates can also generate counterproductive effects by inducing agents to withdraw their deposits from the banks and switch to cash. The deposit outflow puts a downward pressure on bank funding base, jeopardizing bank stability with further negative consequences for aggregate credit supply. However, we cannot find any empirical backing to this argument, as the responses of bank deposits in Figure 16 do not display any structural changes to monetary policy shock below the zero bound. On top of that, the results are robust both with respect to firm and household deposits as well as both overnight and long-term deposits. The explanation for this is rather straightforward – deposit rates have largely been bounded by the zero (see Appendix A4), at least for households, reducing the incentive to hoard cash. Regarding corporate deposits though, Altavilla et al. (2019b) shows that banks have been able to charge negative rates on a considerable portion of firm deposits in the euro area, reaching around 20% of total corporate deposits by the end of 2018.
NL-LP
Pre-ZLB (Q1 2000–Q2 2012) Post-ZLB (Q3 2012–Q2 2019)
House prices House prices
4 8 12 4 8 12
TVP-SVAR-SV
68% confidence interval 90% confidence interval median
House prices
2
0
1
–1
1.2
2002 2006 2008 2010 2012 2014 2016 20182004
2010
0
1.0
0.8
0.2
0
0.4
0.6
4
0
2
–2

ZLB AND BEYOND: REAL AND FINANCIAL EFFECTS OF LOW AND NEGATIVE INTEREST RATES IN THE EURO AREA 6/2020
24
Figure 16 Impact on bank deposits
Note. Figure shows impulse response functions (cumulative in case of the TVP-SVAR-SV) to the monetary policy shock which has been normalised to a 10 bps drop in the EONIA.
NL-LP
Pre-ZLB (Q1 2000–Q2 2012) Post-ZLB (Q3 2012–Q2 2019)
Overnight depositsof non-financial firms
4 8 12
TVP-SVAR-SV
68% confidence interval 90% confidence interval median
Overnight deposits of non-financial firms
4
0
2
–2
–4
0.4
2010
0.3
0.2
0.1
0
Deposits ofnon-financial firms with
over 2 years maturity
84 1284 12
Deposits of non-financial firms with over 2 years maturity
5
0
–5
–10
0.1
10
–0.30
20 2014 2012 2010 2008 2006 2004 2002
0
–0.1
–0.2
84 12 4 8 12
2018 2016
Deposits of households with over 2 years maturity
2
–2
0
–4
–6
0
2010
0
2018 2014 2012 2010 2008 2006 2004 20022016
–0.1
–0.2
–0.3
–0.5
–0.4
0 2004 2006 2008 2010 2012 2014 2016 2018
Overnight depositsof non-financial firms
Deposits ofnon-financial firms with
over 2 years maturity
Deposits of householdswith over 2 years maturity
Deposits of householdswith over 2 years maturity
4
0
2
–2
–4
84 12
5
0
–5
5
–5
0
–10
20
10
0 2002 2006 2008 2010 2012 2014 2016 20182004
0.7
0.6
0.5
0.4
0.3
Overnight deposits ofhouseholds
2002
Overnight deposits of households Overnight deposits ofhouseholds
4
0
2
–2
–4
4 8 1284 12
6
0
2
–2
–4
4

ZLB AND BEYOND: REAL AND FINANCIAL EFFECTS OF LOW AND NEGATIVE INTEREST RATES IN THE EURO AREA 6/2020
25
However, firms, contrary to households, cannot easily switch to cash and ensure smooth operation without bank deposits. Altavilla et al. (2019b) also find that those firms which have been exposed to negative deposit rates have rebalanced their funds towards investment to avoid paying interest to banks and improve their profitability.
Overall, the empirical evidence presented in this section suggests that the negative interest rate policy pursued by the ECB has had a rather limited adverse impact on bank profitability, property prices or bank deposits. However, while our study documents the experience with low and negative policy rates over a relatively long sample, there is no guarantee that these side effects will not emerge if the ECB ventures further into negative territory. Also, our paper has not explored other potential side effects of negative policy rates such as resource misallocation due to increased lending to zombie firms or excessive risk-taking by banks to counteract the adverse effects on their profitability. An adequate study of these side effects is beyond the scope of the frameworks employed in this paper, as that would require the use of microdata-based methods augmented with information from credit registers. We leave this avenue for future research.
5. ROBUSTNESS
Despite the use of alternative frameworks for deriving non-linear impulse response functions and identification strategies, we undertake a number of additional robustness checks which are presented in this section. First, given the somewhat erratic response of HICP from the NL-LP model, we consider an alternative measure of inflation to ensure that our finding about the policy rate cuts below zero having been less successful in generating inflationary pressures regardless of having similar ability to reduce slack as in normal times remains robust. The results in Figure 17 confirm this finding as robust because a similar response emerges also when using GDP deflator as a measure of inflation.
Figure 17 Using GDP deflator as a measure of inflation
Note. Figure shows impulse response functions (cumulative in case of the TVP-SVAR-SV) to the monetary policy shock which has been normalised to a 10 bps drop in the EONIA.
Next, we consider using an alternative monetary policy indicator and monetary policy instrument from which we purge high frequency surprises around policy announcements. Namely, we replace the EONIA with the 1-month OIS rate in both
NL-LP
Pre-ZLB (Q1 2000–Q2 2012) Post-ZLB (Q3 2012–Q2 2019)
GDP deflator inflation
84 12
TVP-SVAR-SV
GDP deflator inflation
0.6
0
0.2
–0.2
–0.4
0.08
2010
0
0.06
0.04
0.02
0
2002 2006 2008 2010 2012 2014 2016 20182004
GDP deflator inflation
84 12
–0.02
0.4
0.6
0
0.2
–0.2
–0.4
0.4
68% confidence interval 90% confidence interval median

ZLB AND BEYOND: REAL AND FINANCIAL EFFECTS OF LOW AND NEGATIVE INTEREST RATES IN THE EURO AREA 6/2020
26
models as a proxy for monetary policy and use 1-month OIS rate surprises in the HFI setup, so that the variable from which we obtain the monetary policy shock directly corresponds to the policy indicator.7 Figure 18 shows that this exercise yields very similar impulse responses from both models to the baseline results with respect to both real and financial variables.
Figure 18 Alternative monetary policy indicator and instrument
7 The procedure to control for the information shocks via sign restrictions remains the same as in the baseline case.
0.25
2002 2006 2008 2010 2012 2014 2016 20182004
2010
0
Real GDP
HICP
–0.05
NL-LP
Pre-ZLB (Q1 2000–Q2 2012) Post-ZLB (Q3 2012–Q2 2019)
2010
0
4 8 120
84 12
0.8
0.20
84 124 8 12
TVP-SVAR-SV
1.5
–0.5
–0.6
2002 2006 2008 2010 2012 2014 2016 20182004
–0.05
1.00.20
0.15
0.10
0.05
0
0.10
0.05
0
0.5
Real GDP Real GDP
HICP HICP
–0.5
1.0
–1.0
0.5
0
–0.2
0.40.6
–0.4
0.8
0.20
–0.6
–0.2
0.40.6
–0.4
1-month OIS
2004–0.15
0
–0.05
–0.10
0.6
0.2
04 8 12
4 8 12
–0.4
1-month OIS 1-month OIS
–0.2
0.4
0.2
0
–0.4
–0.2
0.1
–0.3
–0.1
2010
02002 2006 2008 2010 2012 2014 2016 2018
68% confidence interval 90% confidence interval median

ZLB AND BEYOND: REAL AND FINANCIAL EFFECTS OF LOW AND NEGATIVE INTEREST RATES IN THE EURO AREA 6/2020
27
Note. Figure shows impulse response functions (cumulative in case of the TVP-SVAR-SV) to the monetary policy shock which has been normalised to a 10 bps drop in the EONIA.
Continuing with the robustness of our identification strategy, we consider an alternative set of sign restrictions used in the TVP-SVAR-SV. Specifically, the zero restriction on the EONIA in response to aggregate demand and supply shocks can be controversial since that implies that monetary authority responds to those shocks with a one quarter lag. To corroborate our findings, we borrow identification scheme from Corsetti et al. (2014) and Bobeica and Jarociński (2019), but still leave output and inflation unrestricted in response to monetary policy shock, as in the baseline scheme.
In this scheme, real shocks are distinguished from monetary policy disturbance via opposite restrictions on the EONIA and the exchange rate (see Table 3).
Table 3 Alternative identification restrictions in the TVP-SVAR-SV
Shock Real GDP HICP EONIA Euro Stoxx 50 EUR/USD Aggregate demand + + +Aggregate supply + – + Monetary policy – + –
Figure 19 demonstrates that the zero restrictions on the EONIA in response to business cycle disturbances, employed in the baseline scheme, do not drive our results, as the impulse responses tell a similar story when an alternative set of identification restrictions are used.
84 12 84 12
Dow Jones Euro Stoxx 50
10
–5
5
–10
Euro Stoxx 50 Euro Stoxx 50
2.5
2.0
1.5
1.0 2010
02002
68% confidence interval 90% confidence interval median
84 12
4 8 12
EUR/USD
6
2
4
–2
–4
–0.8
2010
–1.50
2018 2014 2012 2010 2008 2006 2004 20022016
5
–5
0
–10
EUR/USD EUR/USD
–0.9
–1.0
–1.1
–1.2
–1.3
–1.4
0
0
15
–5
5
–15
10
–10
0
2004 2006 2008 2010 2012 2014 2016 2018

ZLB AND BEYOND: REAL AND FINANCIAL EFFECTS OF LOW AND NEGATIVE INTEREST RATES IN THE EURO AREA 6/2020
28
Figure 19 Alternative identification scheme in the TVP-SVAR-SV
Note. Figure shows cumulative impulse response functions to monetary policy shock which has been normalised to a 10 bps drop in the EONIA in each period.
As our final robustness check, we augment the baseline specification of both models with the Eurosystem's asset holdings and identify an asset purchase shock in case of the TVP-SVAR-SV to make sure that the effects of negative policy rates are distinguished from the impact of balance sheet policies employed by the Eurosystem in conjunction with negative interest rate policy. Identifying restrictions employed in the TVP-SVAR-SV to pin down the impact of central bank asset purchases are depicted in Table 4.
0.5
0.3
0.4
0.2
0
0.1
2002 2006 2008 2010 2012 2014 2016 20182004
20
100
Real GDP HICP
0.25
0.10
0
0.0520
1002002 2006 2008 2010 2012 2014 2016 2018
2004
EONIA Dow Jones Euro Stoxx 50
0.10
0
–0.15
–0.10
2002 2006 2008 2010 2012 2014 2016 2018200420
100
2002 2006 2008 2010 2012 2014 2016 20182004
3.0
2.0
1.5
1.0
2010
0
EUR/USD
20022006200820102012201420162018
–0.8
–1.4
–1.5
–1.0
–0.9
2010
0
2004
0.05
–0.05
–0.7
–1.3
–1.2
–1.1
0.15
0.20
2.5

ZLB AND BEYOND: REAL AND FINANCIAL EFFECTS OF LOW AND NEGATIVE INTEREST RATES IN THE EURO AREA 6/2020
29
The impact of two monetary policy shocks is mainly told apart via the zero restrictions on the EONIA and the Eurosystem's asset holdings to obtain the orthogonality between policy rate cuts and asset purchases.
Table 4 Identifying the impact of asset purchases in the TVP-SVAR-SV
Shock Real GDP HICP EONIA Euro Stoxx 50
EUR/USD Securities held by the Eurosystem
Aggregate demand + + 0 Aggregate supply + + 0 Monetary policy – + – 0Asset purchase 0 + – +
Findings in Figure 20 indeed show that the reaction of the Eurosystem's balance sheet to a standard policy shock changed once the interest rates reached the zero bound. However, we think that the effects of negative interest rates are not confused with unconventional balance sheet instruments used alongside these rates because asset holdings only display significant response with a considerable lag of roughly 10 quarters8.
Figure 20 Controlling for the impact of central bank asset purchases
8 Also note that in the case of the NL-LP asset holdings do not react on impact to policy rate cuts in the post-ZLB period, although their reaction is not restricted ex-ante in comparison with the identification strategy used in the TVP-SVAR-SV, indicating that our HFI setup effectively isolates policy rate shocks from balance sheet shocks.
0.25
0.15
0.20
0.10
0.05
2002 2004
20
10
0
Real GDP
2006 20082010 201220142016 2018HICP
0
NL-LP
Pre-ZLB (Q1 2000–Q2 2012) Post-ZLB (Q3 2012–Q2 2019)
0.15
0.10
–0.05
0.05
0 20
10
0
Real GDP Real GDP
1.5
0.5
1.0
04 8 12
84 12
1.0
0.5
0
–1.0
–0.5
HICP HICP
0.2
0
–0.2
4 8 12
1.5
1.0
0.5
–1.0
12 –0.54 8
TVP-SVAR-SV
–0.5
0.4
0
–0.05
2002 2004 2006 2008 2010 2012 2014 2016 2018
68% confidence interval 90% confidence interval median

ZLB AND BEYOND: REAL AND FINANCIAL EFFECTS OF LOW AND NEGATIVE INTEREST RATES IN THE EURO AREA 6/2020
30
Note. Figure shows impulse response functions (cumulative in case of the TVP-SVAR-SV) to the monetary policy shock which has been normalised to a 10 bps drop in the EONIA.
The response of asset holdings likely reflects the fact that asset purchases have been extensively used in conjunction with negative rates to stave off deflationary pressures and help steer inflation towards the target.
Overall, the robustness checks performed in this section complement the tough test of stability inherent in our baseline setup consisting of alternative methods for generating non-linear impulse responses and identification strategies. In addition to our results being neither model- nor identification strategy- specific, we show that they remain robust after using an alternative measure of inflation, monetary policy indicator and instrument as well as different identification restrictions. Our findings also remain robust once we control for the effects of central bank asset purchases which have been used in conjunction with negative policy rates.
6. CONCLUSIONS
We have empirically studied real and financial effects of low and negative interest rate policy pursued by the ECB using a set of non-linear time series frameworks, namely a structural vector autoregression with time-varying parameters and stochastic volatility as well as non-linear local projections.
Our findings suggest that the policy rate has continued to support the aggregate demand in the euro area even in sub-zero territory; however, the price pressures have significantly tailed off due to lower inflation expectations. The limited response of inflation to policy rate shocks likely reflects the decline in the slope of the Phillips curve, as suggested by recent literature. Regarding the changes in the transmission mechanism, we confirm the findings from existing literature that policy rate cuts below zero have a more pronounced effect on the term structure via lower interest rate expectations, as the central bank thereby removes the non-negativity restriction and signals that future policy rate cuts are possible. However, our results show that the more powerful propagation through the term structure has not led to lower borrowing costs, as lending rates are no longer responsive when policy rates are below the zero bound. As a result, corporate lending has markedly declined because firms have switched to alternative financing sources as banks were reluctant to pass policy rate cuts onto borrowing costs. Nonetheless, we still argue that the bank lending channel remains active as lending to households has remained largely unchanged and the effect on corporate lending can still be regarded as expansionary, despite being smaller compared to normal times. Concerning the side effects often associated with a
68% confidence interval 90% confidence interval median
Securities held by the Eurosystem
0.4
0
0.2
–0.2
–0.42002 2006 2008 2010 2012 2014 2016 20182004
2010
0
Securities held bythe Eurosystem
4 8 124 8 12
0.4
0.2
0
–0.2
–0.4
1.51.0
0
–2.0
–1.0–0.5
0.6
Securities held bythe Eurosystem
0.5
–1.5

ZLB AND BEYOND: REAL AND FINANCIAL EFFECTS OF LOW AND NEGATIVE INTEREST RATES IN THE EURO AREA 6/2020
31
prolonged period of low and negative interest rates, we find limited empirical evidence to suggest that they have adversely affected bank profitability, property prices or bank deposits.
Overall, our paper expands the growing pool of literature questioning a tenet of modern macroeconomics – the existence of the ZLB – with clear policy relevance. Given the secular trend in interest rates, the low interest rate environment is likely to persist in the future. Our findings imply that sub-zero policy rates have their place in the central bank toolkit, at least as an element of the overall policy package.

ZLB AND BEYOND: REAL AND FINANCIAL EFFECTS OF LOW AND NEGATIVE INTEREST RATES IN THE EURO AREA 6/2020
32
APPENDIX A1. Dataset description and transformations Table A1
Block Variable Description Data sourceBaseline models
Real GDP HICP
Seasonally adjusted real GDP index. 2015 = 100. Seasonally adjusted all-items HICP. 2015 = 100.
Eurostat data ECB Eurostat ECB Eurostat
EONIA Euro Stoxx 50
Money market interest rate. Dow Jones Euro Stoxx 50 price index.
EUR/USD Monthly average value of the euro per US dollar. Transmission mechanism
Inflation expectations Interest rate expectations Yield curve Lending rate to non-financial firms Lending rate to households
Lending to non-financial firms
Lending to households
Non-bank external financing
Equity and shares
Non-bank loans Trade credit Corporate debt securities
Corporate credit spreads
SPF 1- and 2-years ahead inflation expectations. 3-month EURIBOR 1- and 2-year forward rate.2-, 3- and 5-year government benchmark bond yields.Rate for loans to non-financial corporations of up to EUR1M with an IRF period of over five years (new business).Rate for loans to households for house purchase with an IRF period of over five and up to ten years (new business). Loans to non-financial corporations. Outstanding amounts at the end of the period (stocks), total maturity. Loans to households and NPISHs. Outstanding amounts at the end of the period (stocks), total maturity. See Appendix A2 for details.
Equity and investment fund shares/units issued by non-financial corporations. See Appendix A2 for details. Trade credits and advances of non-financial corporations. Variable rate long-term debt securities issued by euro area non-financial corporations. Spread of non-financial corporations with respect to German Bund.
ECB Bloomberg ECB ECB
ECB
ECB
ECB
Author's calculations based on the ECB data ECB
ECB ECB ECB
Gilchrist and Mojon (2018)
Side effects Return on assets
Euro Stoxx Banks Bank credit spreads
House prices Overnight deposits of non-financial firms Overnight deposits of households Deposits of non-financial firms with over 2 years maturity
Deposits of households with over 2 years maturity
Annual bank's return on assets. Quarterly series are obtained by performing Litterman temporal disaggregation procedure using real GDP index as indicator series. Since the annual series from the FRED database end in 2018, data for Q1 and Q2 2019 are extrapolated using annual growth rates from the ECB CBD2 database ROA series. Dow Jones Euro Stoxx Banks price index. Spread of banks with respect to German Bund.
Real residential property prices. 2015 = 100. Overnight deposits vis-à-vis euro area NFC reported by MFI excluding ESCB in the euro area (stock). Overnight deposits vis-à-vis euro area households reported by MFI excluding ESCB in the euro area (stock) Deposits with agreed maturity over 2 years vis-à-vis euro area NFC reported by MFI excluding ESCB in the euro area (stock). Deposits with agreed maturity over 2 years vis-à-vis euro area households reported by MFI excluding ESCB in the euro area (stock).
Author's calculations based on the FRED and ECB data
Bloomberg Gilchrist and Mojon (2018) BIS ECB
ECB
ECB
ECB
Robustness checks
GDP deflator 1-month OISSecurities held by theEurosystem
Seasonally adjusted implicit deflator. 2015 = 100. 1-month OIS rate.Securities of euro area residents denominated in euro heldby the Eurosystem scaled by 2015 nominal GDP.
Eurostat Bloomberg Author's calculations using the ECB and Eurostat data

ZLB AND BEYOND: REAL AND FINANCIAL EFFECTS OF LOW AND NEGATIVE INTEREST RATES IN THE EURO AREA 6/2020
33
A2. External financing structure
Figure A1 Types of corporate external financing sources in the euro area
Data source: author's calculations based on the ECB data. Non-bank loans are calculated as in Mandler and Scharnagl (2019), i.e. we subtract the loans granted by MFIs to non-financial corporations as reported in the BSI database from the loans of non-financial corporations reported in the QSA statistics, constructed from the balance sheet data of the firms. Other sources of financing are taken directly from the QSA database.
A3. House price cycle
Figure A2 House price gap (%)
Figure shows the house price cycle which is pinned down by applying the Hodrick–Prescott filter to real house prices with the same smoothing parameter as used by the BIS for credit-to-GDP series (λ = 400 000). Borio (2012) suggests using 15%–25% as a threshold value to indicate financial instability risk.
Equity and sharesBank loansNon-bank loansTrade creditDebt securities 0
0.1
0.2
0.3
0.4
0.5
0.6
0.7
0
0.1
0.2
0.3
0.4
0.5
0.6
0.7
–10.0
–5.0
0.0
5.0
10.0
15.0
–10.0
–5.0
0.0
5.0
10.0
15.0
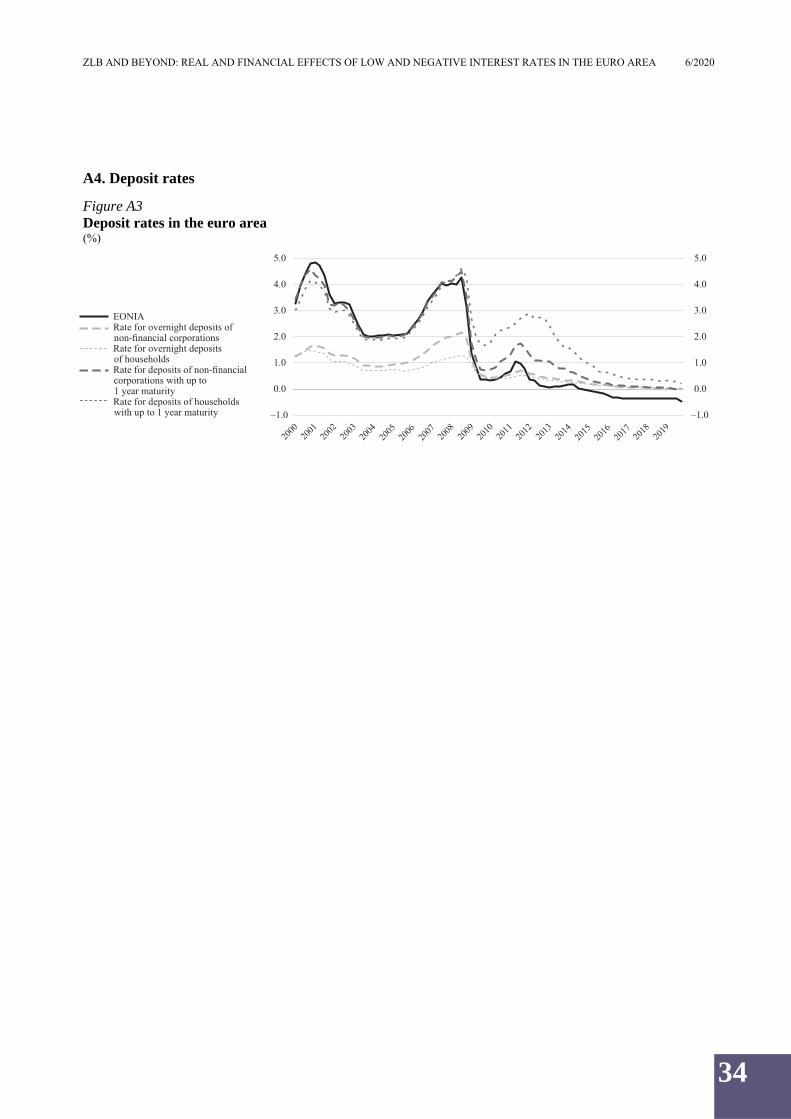
ZLB AND BEYOND: REAL AND FINANCIAL EFFECTS OF LOW AND NEGATIVE INTEREST RATES IN THE EURO AREA 6/2020
34
A4. Deposit rates
Figure A3 Deposit rates in the euro area (%)
EONIARate for overnight deposits ofnon-financial corporationsRate for overnight depositsof householdsRate for deposits of non-financialcorporations with up to1 year maturityRate for deposits of householdswith up to 1 year maturity –1.0
0.0
1.0
2.0
3.0
4.0
5.0
–1.0
0.0
1.0
2.0
3.0
4.0
5.0
ZLB AND BEYOND: REAL AND FINANCIAL EFFECTS OF LOW AND NEGATIVE INTEREST RATES IN THE EURO AREA 6/2020
35
BIBLIOGRAPHY
ADRIAN, Tobias, COLLA, Paolo, SHIN, Hyun Song (2013). Which Financial Frictions? Parsing the Evidence from the Financial Crisis of 2007 to 2009. NBER Macroeconomics Annual, vol. 27, issue 1, pp. 159–214.
ALESSANDRI, Piergiorgio, NELSON, Benjamin D. (2015). Simple Banking: Profitability and the Yield Curve. Journal of Money, Credit and Banking, vol. 47, issue 1, February 2015, pp. 143–175.
ALPANDA, Sami, GRANZIERA, Eleonora, ZUBAIRY, Sarah (2019). State Dependence of Monetary Policy Across Business, Credit and Interest Rate Cycles. Norges Bank Working Paper, No. 21/2019, November 2019. 56 p.
ALTAVILLA, Carlo, BOUCINHA, Miguel, PEYDRÓ, José-Luis (2018). Monetary Policy and Bank Profitability in a Low Interest Rate Environment. Economic Policy, vol. 33, issue 96, October 2018, pp. 531–586.
ALTAVILLA, Carlo, BRUGNOLINI, Luca, GÜRKAYNAK, Refet S., MOTTO, Roberto, RAGUSA, Giuseppe (2019a). Measuring Euro Area Monetary Policy. ECB Working Paper, No. 2281, May 2019. 56 p.
ALTAVILLA, Carlo, BURLON, Lorenzo, GIANNETTI, Mariassunta, HOLTON, Sarah (2019b). Is There a Zero Lower Bound? The Effects of Negative Policy Rates on Banks and Firms. ECB Working Paper, No. 2289, June 2019 (revised June 2020). 54 p.
ANDRADE, Philippe, BRECKENFELDER, Johannes, DE FIORE, Fiorella, KARADI, Peter, TRISTANI, Oreste (2016). The ECB's Asset Purchase Programme: An Early Assessment. ECB Discussion Paper, No. 1956, September 2016. 62 p.
ANDRADE, Philippe, FERRONI, Filippo (2020). Delphic and Odyssean Monetary Policy Shocks: Evidence from the Euro Area. Journal of Monetary Economics (in press).
ARIAS, Jonas E., RUBIO-RAMÍREZ, Juan Francisco, WAGGONER, Daniel F. (2018). Inference Based on Structural Vector Autoregressions Identified with Sign and Zero Restrictions: Theory and Applications. Econometrica, vol. 86, issue 2, March 2018, pp. 685–720.
BOBEICA, Elena, JAROCIŃSKI, Marek (2019). Missing Disinflation and Missing Inflation: A VAR Perspective. International Journal of Central Banking, vol. 15, No.1, March 2019, pp. 199–232.
BORIO, Claudio (2012). The Financial Cycle and Macroeconomics: What Have We Learnt? BIS Working Paper, No. 395, December 2012. 38 p.
BORIO, Claudio, GAMBACORTA, Leonardo, HOFMANN, Boris (2017). The Influence of Monetary Policy on Bank Profitability. International Finance, vol. 20, issue 1, May 2017, pp. 48–63.
BRUNNERMEIER, Markus K., KOBY, Yann (2018). The Reversal Interest Rate. NBER Working Paper, No. 25406, December 2018. 40 p.

ZLB AND BEYOND: REAL AND FINANCIAL EFFECTS OF LOW AND NEGATIVE INTEREST RATES IN THE EURO AREA 6/2020
36
COCHRANE, John H., PIAZZESI, Monika (2002). The Fed and Interest Rates – A High-Frequency Identification. American Economic Review, vol. 92, No. 2, May 2002, pp. 90–95.
COGLEY, Timothy, SARGENT, Thomas J. (2005). Drift and Volatilities: Monetary Policies and Outcomes in the Post WWII U.S. Review of Economic Dynamics, vol. 8, issue 2, April 2005, pp. 262–302.
CORSETTI, Giancarlo, DEDOLA, Luca, LEDUC, Sylvain (2014). The International Dimension of Productivity and Demand Shocks in the US Economy. Journal of the European Economic Association, vol. 12, issue 1, February 2014, pp. 153–176.
DE FIORE, Fiorella, UHLIG, Harald (2015). Corporate Debt Structure and the Financial Crisis. Journal of Money, Credit and Banking, vol. 47, issue 8, December 2015, pp. 1571–1598.
ECB (2020). Negative Rates and the Transmission of Monetary Policy. ECB Economic Bulletin, issue 3/2020, May 2020, pp. 61–85.
EGGERTSSON, Gauti B., JUELSRUD, Ragnar E., GETZ WOLD, Ella (2017). Are Negative Nominal Interest Rates 0Expansionary? NBER Working Paper, No. 24039, November 2017. 51 p.
EGGERTSSON, Gauti B., WOODFORD, Michael (2006). Optimal Monetary and Fiscal Policy in a Liquidity Trap. In: NBER International Seminar on Macroeconomics 2004, pp. 75–144.
ESER, Fabian, KARADI, Peter, LANE, Philip R., MORETTI, Laura, OSBAT, Chiara (2020). The Phillips Curve at the ECB. ECB Working Paper, No. 2400, May 2020. 50 p.
EVANS, Charles, FISHER, Jonas, GOURIO, Francois, KRANE, Spencer (2015). Risk Management for Monetary Policy Near the Zero Lower Bound. Brookings Papers on Economic Activity, vol. 46, issue 1, pp. 141–219.
GAMBETTI, Luca, MUSSO, Alberto (2017). The Macroeconomic Impact of the ECB's Expanded Asset Purchase Programme (APP). ECB Working Paper, No. 2075, June 2017. 42 p.
GERTLER, Mark, KARADI, Peter (2015). Monetary Policy Surprises, Credit Costs, and Economic Activity. American Economic Journal: Macroeconomics, vol. 7, issue 1, January 2015, pp. 44–76.
GILCHRIST, Simon, MOJON, Benoît (2018). Credit Risk in the Euro Area. The Economic Journal, vol. 128, issue 608, February 2018, pp. 118–158.
GÜRKAYNAK, Refet S., SACK, Brian, SWANSON, Eric (2005). Do Actions Speak Louder Than Words? The Response of Asset Prices to Monetary Policy Actions and Statements. International Journal of Central Banking, vol. 1, No. 1, May 2005, pp. 55–93.
GUST, Christopher, HERBST, Edward, LÓPEZ-SALIDO, David, SMITH, Matthew E. (2017). The Empirical Implications of the Interest-Rate Lower Bound. AmericanEconomic Review, vol. 107, issue 7, pp. 1971–2006.

ZLB AND BEYOND: REAL AND FINANCIAL EFFECTS OF LOW AND NEGATIVE INTEREST RATES IN THE EURO AREA 6/2020
37
HACHULA, Michael, PIFFER, Michele, RIETH, Malte (2020). Unconventional Monetary Policy, Fiscal Side Effects, and Euro Area (Im)balances. Journal of the European Economic Association, vol. 18, No. 1, February 2020, pp. 202–231.
HICKS, John R. (1937). Mr. Keynes and the "Classics"; A Suggested Interpretation. Econometrica, vol. 5, No. 2, April 1937, pp. 147–159.
HOLM-HADULLA, Fédéric, THÜRWÄCHTER, Claire (2020). Heterogeneity in Corporate Debt Structures and the Transmission of Monetary Policy. ECB Working Paper, No. 2402, May 2020. 41 p.
JAROCIŃSKI, Marek, KARADI, Peter (2020). Deconstructing Monetary Policy Surprises – The Role of Information Shocks. American Economic Journal: Macroeconomics, vol. 12, issue 2, April 2020, pp. 1–43.
JORDÀ, Òscar (2005). Estimation and Inference of Impulse Responses by Local Projections. American Economic Review, vol. 95, No. 1, March 2005, pp. 161–182.
KERSSENFISCHER, Mark (2019). Information Effects of Euro Area Monetary Policy: New Evidence from High-Frequency Futures Data. Deutsche Bundesbank Discussion Paper, No. 07/2019, January 2019. 25 p.
KEYNES, John Maynard (1936). The General Theory of Employment, Interest, and Money. London: Macmillan, February 1936; 472 p. (2007 edition).
KLEIN, Melanie (2020). Implications of Negative Interest Rates for the Net Interest Margin and Lending of Euro Area Banks. BIS Working Paper, No. 848, March 2020. 34 p.
KRUGMAN, Paul R. (1998). It's Baaack: Japan's Slump and the Return of the Liquidity Trap. Brookings Papers on Economic Activity, vol. 29, issue 2, pp. 137–206.
KUTTNER, Kenneth N. (2001). Monetary Policy Surprises and Interest Rates: Evidence from the Fed Funds Futures Market. Journal of Monetary Economics, vol. 47, issue 3, June 2001, pp. 523–544.
LANE, Philip R. (2020). The Monetary Policy Toolbox: Evidence from the Euro Area. Keynote speech at the 2020 US Monetary Policy Forum, 21 February 2020, New York. Available at: https://www.ecb.europa.eu/press/key/date/2020/html/ecb.sp200221~d147a71a37.en.html.
LHUISSIER, Stéphane, MOJON, Benoît, RUBIO-RAMÍREZ, Juan Francisco (2020). Does the Liquidity Trap Exist? BIS Working Paper, No. 855, April 2020. 40 p.
MANDLER, Martin, SCHARNAGL, Michael (2019). Bank Loan Supply Shocks and Alternative Financing of Non-Financial Corporations in the Euro Area. Deutsche Bundesbank Discussion Paper, No. 23, July 2019. 86 p.
MORETTI, Laura, ONORANTE, Luca, ZAKIPOUR SABER, Shayan (2019). Phillips Curves in the Euro Area. ECB Working Paper, No. 2295, July 2019. 31 p.

ZLB AND BEYOND: REAL AND FINANCIAL EFFECTS OF LOW AND NEGATIVE INTEREST RATES IN THE EURO AREA 6/2020
38
NAKAMURA, Emi, STEINSSON, Jón (2018). High-Frequency Identification of Monetary Non-Neutrality: The Information Effect. The Quarterly Journal of Economics, vol. 133, issue 3, August 2018, pp. 1283–1330.
NEWEY, Whitney K., WEST, Kenneth D. (1987). A Simple, Positive Semi-definite, Heteroskedasticity and Autocorrelation Consistent Covariance Matrix. Econometrica, vol. 55, No. 3, May 1987, pp. 703–708.
PRIMICERI, Giorgio E. (2005). Time Varying Structural Vector Autoregressions and Monetary Policy. The Review of Economic Studies, vol. 72, issue 3, July 2005, pp. 821–852.
RAMEY, Valerie Ann, ZUBAIRY, Sarah (2018). Government Spending Multipliers in Good Times and in Bad: Evidence from US Historical Data. Journal of Political Economy, vol. 126, No. 2, pp. 850–901.
ROSTAGNO, Massimo, ALTAVILLA, Carlo, CARBONI, Giacomo, LEMKE, Wolfgang, MOTTO, Roberto, SAINT GUILHEM, Arthur, YIANGOU, Jonathan (2019). A Tale of Two Decades: The ECB's Monetary Policy at 20. ECB Working Paper, No. 2346, December 2019. 338 p.
SCHNABEL, Isabel (2020). Narratives about the ECB's Monetary Policy – Reality or Fiction? Speech at the Juristische Studiengesellschaft, 11 February 2020, Karlsruhe. Available at: https://www.ecb.europa.eu/press/key/date/2020/html/ecb.sp200211_1~b439a2f4a0.en.html.
TENREYRO, Silvana, THWAITES, Gregory (2016). Pushing on a String: US Monetary Policy Is Less Powerful in Recessions. American Economic Journal: Macroeconomics, vol. 8, No. 4, October 2016, pp. 43–74.
Related Documents