1 | Page 1. OVERVIEW The Government of Zimbabwe (GOZ) released the 2019 budget on 22nd November 2018, meant to buttress the initiatives in the Transitional Stabilization Programme (October 2018 – December 2020). The key highlights of the budget were: Growth: The minister acknowledged that the prevailing weak macro-economic fundamentals will subdue growth in 2018, which has been downgraded to 4.0%. Growth is expected to reach 3.1% in 2019 and 7.5% in 2020, mainly driven by agricultural, tourism and mining activities. In terms of Fiscal policy, the government acknowledged the high fiscal deficit over the last couple of years and noted that the 2018 deficit will reach 11.7% of the GDP. However, plans are being put to reduce the deficit to 5% in 2019 and 4.1% in 2020. Measures proposed include 5% salary cuts for senior civil servants; retrenchment of public servants above 65 years and 3000 Youth officers, among other austerity measures. Revenue mobilization will also be enhanced by ensuring that all revenue are centrally collected by the Zimbabwe Revenue Authority (ZIMRA), remittance of all revenue collected by government ministries and departments into the Consolidated Revenue Fund, and some additional taxes on income and purchase of goods and services as well as sale of some State Owned Enterprises. In terms of monetary policy, currency reforms to wait a little longer as the minister reiterated the retention of the multi-currency regime with the US dollar as the currency of reference. The minister however acknowledged the challenges of the three tier pricing system which has distortionary effects. Year on year inflation has been on the rise and is expected to hit an average of 8.3% by end of 2018, and further projected to increase to an average of 22.4% in 2019 on account of fiscal measures (e.g. 7% raise of excise on fuel); expected food shortages, and high parallel exchange rates, among other factors. The country’s year on year inflation rate was highest in the Southern African Development Community (SADC) region for the month of October 2018 where it reached 20.8%, having gained 15.5 percentage points from 5.4 percent recorded in September 2018. The Current Account deficit is expected to continue to widen on account of subdued exports and increased importation of capital equipment, fuel and other groceries. In terms of Debt and Arrears Clearance, Public debt stood at USD 17.28 billion in September HIGHLIGHTS 2018 growth has been downgraded to 4.0%. Growth is expected to reach 3.1% in 2019 and 7% in 2020, mainly driven by agricultural and mining activities. ZIMBABWE ECONOMIC BRIEF November 2018 Building a New Zimbabwe Targeted Policies for Growth and Job Creation [Cite your source here.]

Welcome message from author
This document is posted to help you gain knowledge. Please leave a comment to let me know what you think about it! Share it to your friends and learn new things together.
Transcript
1 | P a g e
1. OVERVIEW
The Government of Zimbabwe (GOZ) released the 2019 budget on 22nd November 2018,
meant to buttress the initiatives in the Transitional Stabilization Programme (October
2018 – December 2020). The key highlights of the budget were: Growth: The minister
acknowledged that the prevailing weak macro-economic fundamentals will subdue
growth in 2018, which has been downgraded to 4.0%. Growth is expected to reach 3.1%
in 2019 and 7.5% in 2020, mainly driven by agricultural, tourism and mining activities. In
terms of Fiscal policy, the government acknowledged the high fiscal deficit over the last
couple of years and noted that the 2018 deficit will reach 11.7% of the GDP. However,
plans are being put to reduce the deficit to 5% in 2019 and 4.1% in 2020. Measures
proposed include 5% salary cuts for senior civil servants; retrenchment of public servants
above 65 years and 3000 Youth officers, among other austerity measures. Revenue
mobilization will also be enhanced by ensuring that all revenue are centrally collected by
the Zimbabwe Revenue Authority (ZIMRA), remittance of all revenue collected by
government ministries and departments into the Consolidated Revenue Fund, and some
additional taxes on income and purchase of goods and services as well as sale of some
State Owned Enterprises.
In terms of monetary policy, currency reforms to wait a little longer as the minister
reiterated the retention of the multi-currency regime with the US dollar as the currency
of reference. The minister however acknowledged the challenges of the three tier pricing
system which has distortionary effects. Year on year inflation has been on the rise and is
expected to hit an average of 8.3% by end of 2018, and further projected to increase to
an average of 22.4% in 2019 on account of fiscal measures (e.g. 7% raise of excise on
fuel); expected food shortages, and high parallel exchange rates, among other factors.
The country’s year on year inflation rate was highest in the Southern African
Development Community (SADC) region for the month of October 2018 where it
reached 20.8%, having gained 15.5 percentage points from 5.4 percent recorded in
September 2018.
The Current Account deficit is expected to continue to widen on account of subdued
exports and increased importation of capital equipment, fuel and other groceries. In terms
of Debt and Arrears Clearance, Public debt stood at USD 17.28 billion in September
HIGHLIGHTS
2018 growth has
been downgraded
to 4.0%. Growth
is expected to
reach 3.1% in
2019 and 7% in
2020, mainly
driven by
agricultural and
mining activities.
ZIMBABWE ECONOMIC BRIEF
November 2018
Building a New Zimbabwe
Targeted Policies for Growth
and Job Creation
[Cite your source here.]
2 | P a g e
2018, breaching the statutory target of 70% to GDP, and is projected to reach USD 18.1
billion by this year end. External debt expected to end the year at USD 8.5 billion and
domestic debt at USD 9.6 billion. The Minister continued to express commitment to
clearing of debt Arrears over the next 12 months.
Premised on a nominal GDP of USD 31.6 billion, the total budget for 2019 is USD 8.2
billion. Recurrent expenditure is expected to reach USD 6 billion with the rest going to
capital expenditure. Out of recurrent expenditure, USD 1.3 billion will be set aside for
social sectors including health and education. The Government also released alongside
the budget, a 2019 Infrastructure Investment Plan aimed at revamping the dilapidated
infrastructure. It is expected to cost USD 2.6 billion in 2019, USD 1.1 billion will be
mobilized through the budget with USD 1.5 billion as off budget financing.
Trade statistics for the period February to September 2018 show that exports increased
by about 22 percent compared to the same period in 2017, to register a record 10 month
level of USD2.76 billion since dollarization in 2009. Since imports, which are higher,
increased by a higher rate than exports, the trade deficit worsened over the period,
underlining the continued net trade outflow of the scarce foreign currency resources. This
implies that expediting export promotion measures should be accompanied by import
containing measures to manage foreign currency availability. Despite Zimbabwe ratifying
the Interim Economic Partnership Agreement (EPA) in 2012, the country remains
marginally integrated in the regional and global economy with exporters facing stringent
standards requirements which are expensive to meet when they want to export, for
example, to the European Union (EU). Generally, there is a perception that the EU market
is difficult to penetrate.
For the real sector, tobacco registered a marginal increase of 0.66 percent to 15,978 ha
put under tobacco as at 19 October 2018 compared to 15,874 ha same period in the
previous season. The bulk of the crop (92 percent) is under irrigation. The mining sector
is projected to grow by 26 percent in 2018, 16.1 percent in 2019 and a further 15.3 percent
in 2020, benefiting from strong performances mainly in gold, diamonds, chrome and coal.
The problem however, is that most minerals are exported in raw form hence the move by
Government to scale up investments in beneficiation and value addition of minerals is
critical. Currently there are some companies already involved in partial beneficiation of
minerals such as chrome, platinum group metals (PGMs), nickel and diamonds, although
not at full scale.
The manufacturing sector showed signs of recovery due to the protectionist policies
implemented over the last five years. However, statutory Instrument 237A of 2018
gazetted on 29 October 2018 allowed 29 products which previously required import
license to be imported into the country subject to the payment of the appropriate customs
duty. Between February and September 2018, the importation of plant and machinery
used in the manufacturing industry increased by about 39 percent to USD28.8 million
compared to 2017, a sign which could be ascribed to retooling. However, the
manufacturing sector’s high dependence on imports is not sustainable given that the
economy is susceptible to shocks which require adjustments.
HIGHLIGHTS
Despite Zimbabwe ratifying the Interim Economic Partnership Agreement (EPA) in 2012, the country remains marginally integrated in the regional and global economy with exporters facing stringent standards requirements which are expensive to meet when they want to export to the European Union (EU).
3 | P a g e
The influx of imported products following the removal of protection is likely to have a
negative impact on the manufacturing sector firms that have not used the protection window
to upgrade their plants and fine-tuned their business and pricing models in preparation for
increased competition from abroad. The opening up of the economy therefore is a litmus test
on the preparedness of Zimbabwean manufacturing firms to withstand competition.
Protection regimes are generally temporary and five years is a long time for firms to have
invested in both soft and hard infrastructure to enhance their competitiveness.
Commercial bank lending rates for corporates declined from 7.05 percent in July 2017 to
6.97 percent in July 2018 whereas lending rates for individuals increased from 8.94 percent
to 9.75 percent over the same period. Despite the decline in lending rates to corporates,
lending to the private sector started declining while lending to government and individuals
increased. Increase in lending to Government and individuals at the expense of private sector
firms reflect some crowding out effect to the private sector’s borrowing for productive
purposes. Loans to individuals are generally salary based and therefore relatively less risky
for lending financial institutions. Similarly, increasing holdings of government securities is
relatively less risky. Worse still most of the lending to the private sector has been deployed
for short-term uses such as recurrent, inventory stock-ups and durables which may affect
retooling of firms.
Zimbabwe still has opportunities for growth in areas such as tourism. Lonely Planet, a large
travel guide book publisher ranked Zimbabwe the 3rd safest destination to visit in 2019 after
Sri Lanka and Germany. Some of the positives in the tourism sector include the Big Five-
filled national parks, World Heritage-listed archaeological ruins, forested mountains and the
mighty Victoria Falls (one of the seven natural wonders of the world).
Zimbabwe is undertaking “Ease of Doing Business Reforms” which have resulted in
improved rankings for the country. The ranking improved to 155 out of 190 surveyed for
2019 Ease of Doing Business Reforms. The ease of doing business reforms coupled with the
austerity measures being adopted by government to reign in excessive public expenditure are
expected to spur increased investment inflows into the country at a time when Zimbabwe is
opening up to do business with the rest of the world.
The Bank Group launched the 2018 Zimbabwe Economic Report – Building a new
Zimbabwe, targeted policies for growth and job creation. The report, which is part of Bank
Group analytical work provides the government with alternative growth scenarios to the year
2030. It identifies key sectors for potential investment to achieve sustainable and inclusive
growth, namely agriculture, ecotourism and development of special economic zones. It is
premised on the assumption that the arrears clearance will be expedited for economic
restoration to commence. The report is important for several reasons. First, it provides the
government, the donor community, and the private sector with a detailed assessment of
investment opportunities in Zimbabwe. Second, it proposes options to develop these
opportunities and, in so doing, helps fill the gap created by the absence of sectoral investment
priorities. Third, it can be used to inform and support the government’s dialogue with donors
and the business community about further development of these sectors. Increased
coordination and partnership will improve the alignment of investments with the national
objectives, as set out in Zimbabwe’s Transitional Stabilization Programme (2018–20) and
subsequent medium-term plans. The report is available at:
HIGHLIGHTS
The Bank Group launched the 2018 Zimbabwe Economic Report – Building a new Zimbabwe, targeted policies for growth and job creation.
4 | P a g e
https://www.afdb.org/fileadmin/uploads/afdb/Documents/GenericDocuments/Zimbabwe_
Economic_Report_-
_Building_a_new_Zimbabwe_Targeted_policies_for_growth_and_job_creation.pdf.
Made of eleven easy-to-read chapters, the report results from a one-year extensive research
work of country, sector and thematic studies to offer economic analyses and policy
recommendations that can help spark Zimbabwe’s transformation. It provides the current
government, the donor community, and the private sector with a detailed assessment of
investment opportunities in Zimbabwe. As an analytical work, it also provides alternative
scenarios for infrastructure investment to the year 2030 and identifies sectors for potential
investment to achieve sustainable and inclusive growth. While contributing to the overall
efficiency of the development process, the report also proposes options to develop a variety of
opportunities and, in so doing, helps fill a knowledge gap on sectoral investment priorities.
2. REGIONAL ECONOMIC DEVELOPMENTS
2.1 Regional inflation Developments
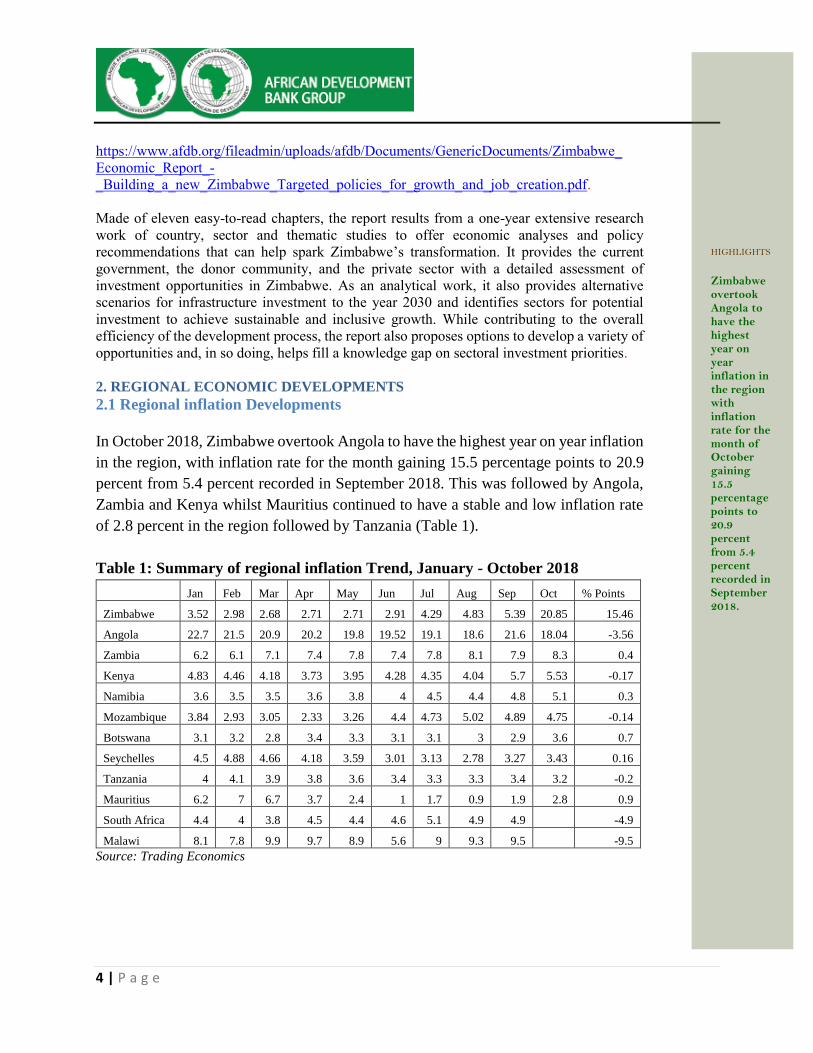
In October 2018, Zimbabwe overtook Angola to have the highest year on year inflation
in the region, with inflation rate for the month gaining 15.5 percentage points to 20.9
percent from 5.4 percent recorded in September 2018. This was followed by Angola,
Zambia and Kenya whilst Mauritius continued to have a stable and low inflation rate
of 2.8 percent in the region followed by Tanzania (Table 1).
Table 1: Summary of regional inflation Trend, January - October 2018
Jan Feb Mar Apr May Jun Jul Aug Sep Oct % Points
Zimbabwe 3.52 2.98 2.68 2.71 2.71 2.91 4.29 4.83 5.39 20.85 15.46
Angola 22.7 21.5 20.9 20.2 19.8 19.52 19.1 18.6 21.6 18.04 -3.56
Zambia 6.2 6.1 7.1 7.4 7.8 7.4 7.8 8.1 7.9 8.3 0.4
Kenya 4.83 4.46 4.18 3.73 3.95 4.28 4.35 4.04 5.7 5.53 -0.17
Namibia 3.6 3.5 3.5 3.6 3.8 4 4.5 4.4 4.8 5.1 0.3
Mozambique 3.84 2.93 3.05 2.33 3.26 4.4 4.73 5.02 4.89 4.75 -0.14
Botswana 3.1 3.2 2.8 3.4 3.3 3.1 3.1 3 2.9 3.6 0.7
Seychelles 4.5 4.88 4.66 4.18 3.59 3.01 3.13 2.78 3.27 3.43 0.16
Tanzania 4 4.1 3.9 3.8 3.6 3.4 3.3 3.3 3.4 3.2 -0.2
Mauritius 6.2 7 6.7 3.7 2.4 1 1.7 0.9 1.9 2.8 0.9
South Africa 4.4 4 3.8 4.5 4.4 4.6 5.1 4.9 4.9 -4.9
Malawi 8.1 7.8 9.9 9.7 8.9 5.6 9 9.3 9.5 -9.5
Source: Trading Economics
HIGHLIGHTS
Zimbabwe overtook Angola to have the highest year on year inflation in the region with inflation rate for the month of October gaining 15.5 percentage points to 20.9 percent from 5.4 percent recorded in September 2018.
5 | P a g e
2.2 Regional integration and trade negotiations
Zimbabwe signed an Interim Economic Partnership Agreement (EPA) with the EU
in 2009 and ratified it in 2012. The agreement spans between 2013 and 2022. The
country is receiving technical assistance from the EU to the tune of EUR 10 million
under the 11th European Development Fund National Indicative Programme to
support EPA implementation. The programme started in October 2018 and is
expected to end in June 2022. Its main objective is to enhance Zimbabwe’s
integration into the regional and international trading systems. The programme’s
objectives are three-fold: To reform and stream line policy, regulatory and institutional framework to
incentivize production and trade in selected value chains;
To reduce trading costs and expedite movement, release and clearance of
goods’ and
To improve trade competitiveness and export capacities of small and medium
enterprises.
Zimbabwe’s trade preparedness
Zimbabwe is marginally integrated in the global economy. Its export basket to the
EU market is largely undiversified, dominated by a few primary commodities that
have been dwindling over the years. The country has been recording a negative trade
balance with the EU. Zimbabwe is further suffering from low export
competitiveness owing to very high costs of production among other reasons.
Implementation of the EPA is lagging behind and the business community is
generally not prepared to compete with European products. The business
community’s major challenges include low capacity utilisation, use of antiquated
equipment, and lack of affordable capital for retooling and high costs of doing
business. In fact the country’s manufacturing sector has been shrinking rapidly over
the years, necessitating Government’s intervention through protectionist policies.
Further, the business perception is that the EU market is difficult to penetrate. In
addition, exporters face stringent standards requirements which are expensive to
meet.
Currently Zimbabwe faces numerous institutional and human capacity challenges
coupled with regulatory gaps militating against the country’s ability to participate
meaningfully in international trade. The EPA technical support programme has
therefore come at an opportune time when the country is implementing Ease of
HIGHLIGHTS
Zimbabwe is marginally integrated in the regional and global economy. Its export basket to the EU market is largely undiversified, dominated by a few primary commodities that have been dwindling over the years.
6 | P a g e
Doing Business Reforms as well as finalising key economic policies such as the
trade policy, industrial development policy and the national export strategy. The
programme should therefore support these ongoing efforts in order to increase
export competitiveness and export development in the country.
It is expected that the programme should build capacity of the business
community to match key industries in upper middle-income economies by 2030.
Zimbabwean exporters have to send competitive goods to the European and
other markets. This therefore calls for more robust export development
initiatives and reducing transaction costs of penetrating export markets. Zim-
Trade’s capacity building model in horticulture, where horticultural players
receive two weeks onsite technical support from experts from Netherlands and
Germany, can be replicated and rolled out to other export sectors.
3. COMMODITIES PRICES IMPACTING ZIMBABWE
Precious metals
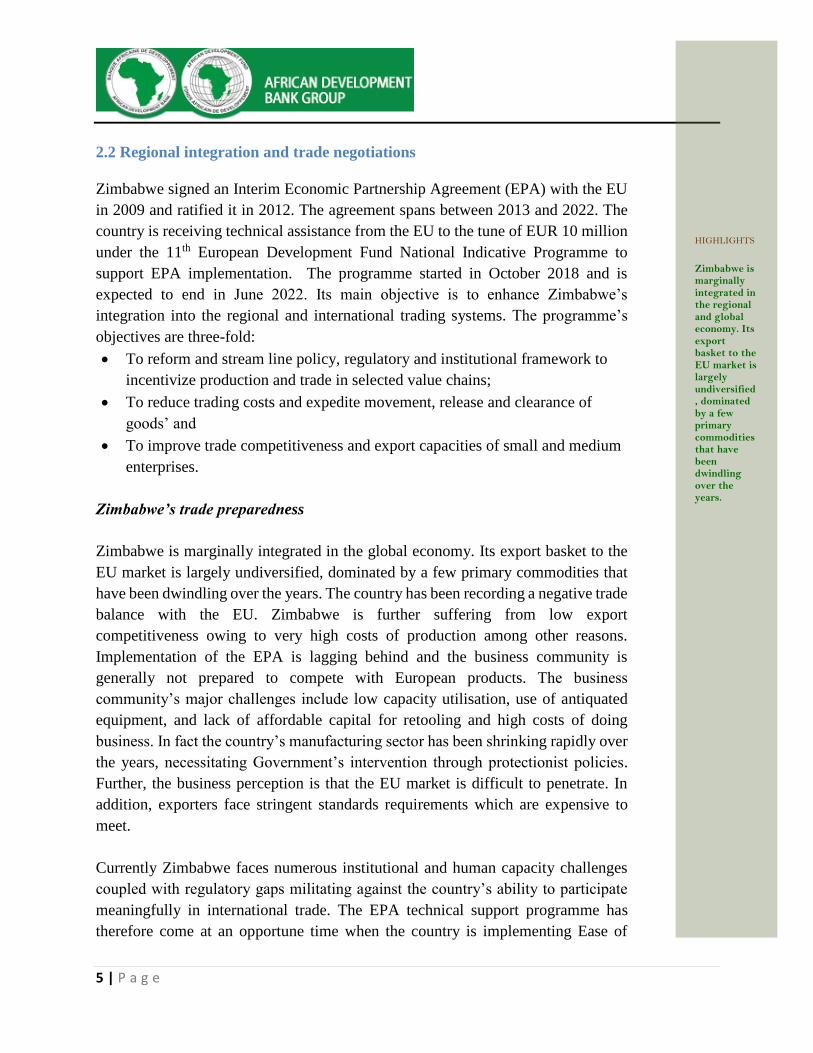
Platinum prices for October 2018 declined by 9.9 percent to USD829.87 per troy
ounce from USD921.00 per troy ounce in the same period in 2017 (Figure 1).
Persistent excess supply over demand and the strengthening of US dollar
continue to weigh down platinum prices. However, on a month on month basis,
the price increased by 3.1 percent from USD804.79 in September 2018.
Figure 1: Gold and Platinum prices in October 2018
Source: World Bank, November 2018
0
200
400
600
800
1000
1200
1400
1600
1800
201
3 A J O
201
4 A J O
201
5 A J O
201
6 A J O
201
7 A J O
201
8 A J O
US
D/t
roy o
unce
Gold ($/troy oz) Platinum ($troy oz
HIGHLIGHTS
Prices of precious metals largely declined over the reporting period compared to 2017.
7 | P a g e
Gold price declined by 5 percent to USD1215.39 per troy ounce from
USD1279.51 in October 2018, on the back of declining demand for gold and
strengthening US dollar. According to the World Gold Council the demand for
gold has declined from 1079.9 tonnes in the first quarter of 2017 to about 964.3
tonnes in the third quarter of 2018, mainly underpinned by the decline in gold
demand for investment purposes. However, gold price firmed on a month on
month basis by 1.4 percent in October 2018 from USD1198.39 in September
2018 owing partly to concerns over the US-China trade disputes, US-Saudi
Arabia tensions, and Italy’s resistance over changing its budget. These concerns
have reignited the safe haven lustre of gold in the month of October 2018.
Crude oil
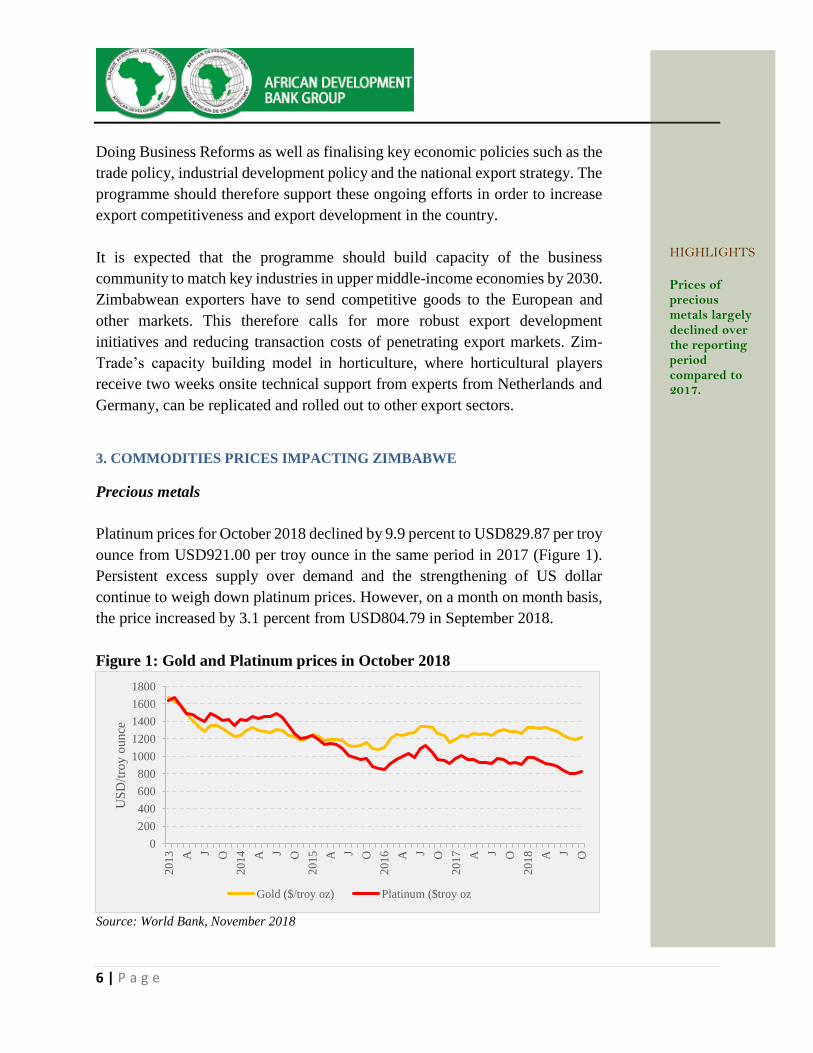
Average crude oil price increased by 39.7 percent in October 2018 to USD76.73
per barrel from USD54.92 in October 2017 (Figure 2). On a month on month
basis, the crude oil price also increased by 1.8 percent from USD75.36 in
September 2018. The upward trend in crude oil price was underpinned by
constricted crude oil supplies due to the crisis in Venezuela, Organization of the
Petroleum Exporting Countries (OPEC) oil production caps, and expectations of
reduced oil exports from Iran following the impending re-imposition of sanctions
by the United States of America. This rising trend in crude oil prices does not
bode well for Zimbabwe which is an importer of petroleum products.
Figure 2: Average crude oil price in October 2018
Source: World Bank, November 2018
Wheat and maize
0
20
40
60
80
100
120
201
3 A J O
201
4 A J O
201
5 A J O
201
6 A J O
201
7 A J O
201
8 A J O
US
D/b
arre
l
HIGHLIGHTS
Average crude oil price increased by 39.7 percent in October 2018 to USD76.73 per barrel from USD54.92 in October 2017.
8 | P a g e
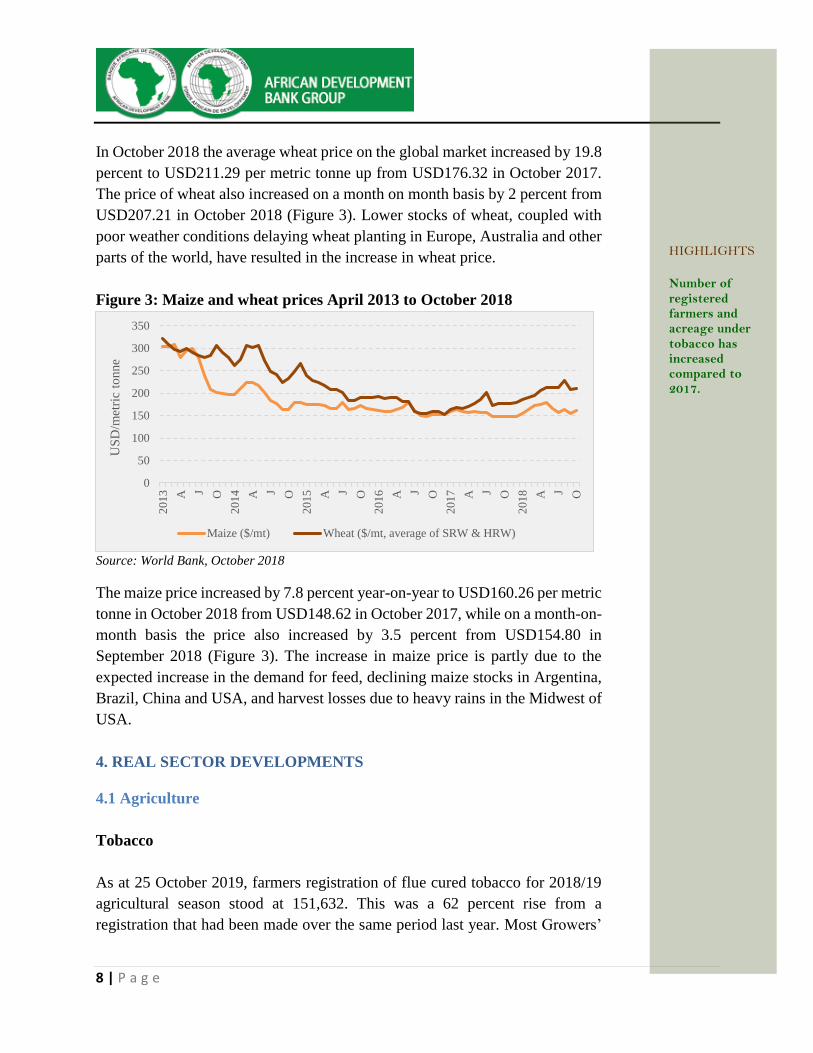
In October 2018 the average wheat price on the global market increased by 19.8
percent to USD211.29 per metric tonne up from USD176.32 in October 2017.
The price of wheat also increased on a month on month basis by 2 percent from
USD207.21 in October 2018 (Figure 3). Lower stocks of wheat, coupled with
poor weather conditions delaying wheat planting in Europe, Australia and other
parts of the world, have resulted in the increase in wheat price.
Figure 3: Maize and wheat prices April 2013 to October 2018
Source: World Bank, October 2018
The maize price increased by 7.8 percent year-on-year to USD160.26 per metric
tonne in October 2018 from USD148.62 in October 2017, while on a month-on-
month basis the price also increased by 3.5 percent from USD154.80 in
September 2018 (Figure 3). The increase in maize price is partly due to the
expected increase in the demand for feed, declining maize stocks in Argentina,
Brazil, China and USA, and harvest losses due to heavy rains in the Midwest of
USA.
4. REAL SECTOR DEVELOPMENTS
4.1 Agriculture
Tobacco
As at 25 October 2019, farmers registration of flue cured tobacco for 2018/19
agricultural season stood at 151,632. This was a 62 percent rise from a
registration that had been made over the same period last year. Most Growers’
0
50
100
150
200
250
300
350
201
3 A J O
201
4 A J O
201
5 A J O
201
6 A J O
201
7 A J O
201
8 A J O
US
D/m
etri
c to
nne
Maize ($/mt) Wheat ($/mt, average of SRW & HRW)
HIGHLIGHTS
Number of registered farmers and acreage under tobacco has increased compared to 2017.
9 | P a g e
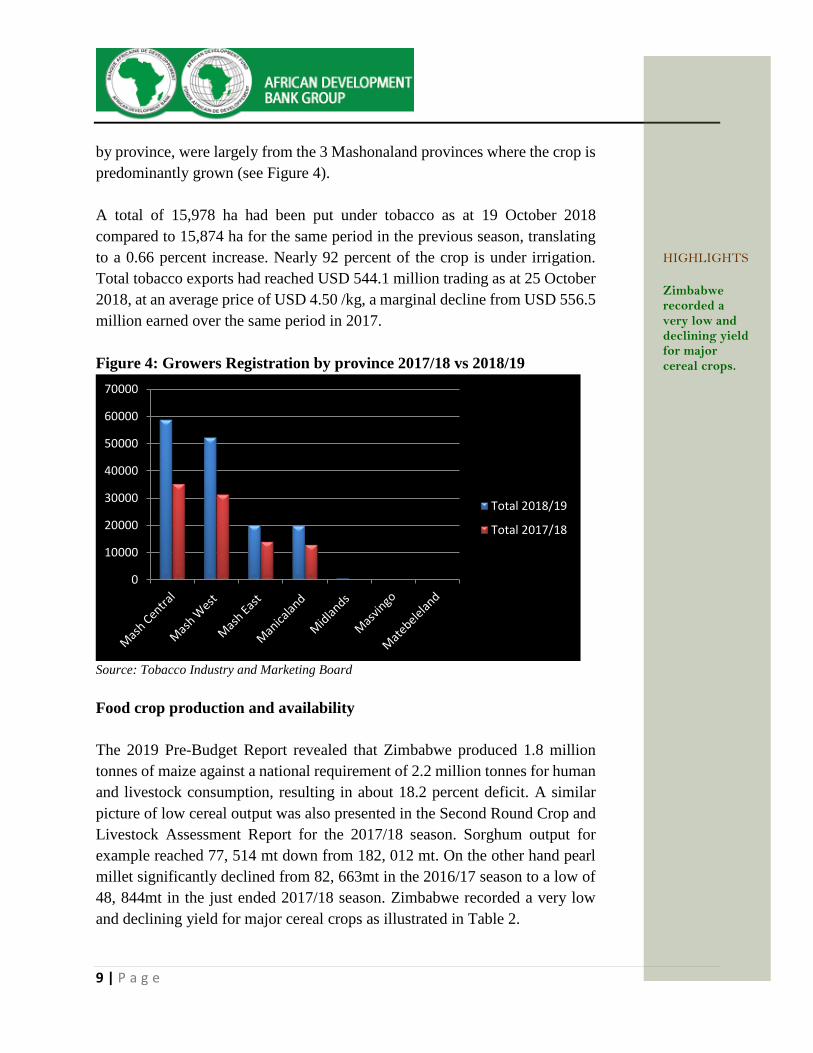
by province, were largely from the 3 Mashonaland provinces where the crop is
predominantly grown (see Figure 4).
A total of 15,978 ha had been put under tobacco as at 19 October 2018
compared to 15,874 ha for the same period in the previous season, translating
to a 0.66 percent increase. Nearly 92 percent of the crop is under irrigation.
Total tobacco exports had reached USD 544.1 million trading as at 25 October
2018, at an average price of USD 4.50 /kg, a marginal decline from USD 556.5
million earned over the same period in 2017.
Figure 4: Growers Registration by province 2017/18 vs 2018/19
Source: Tobacco Industry and Marketing Board
Food crop production and availability
The 2019 Pre-Budget Report revealed that Zimbabwe produced 1.8 million
tonnes of maize against a national requirement of 2.2 million tonnes for human
and livestock consumption, resulting in about 18.2 percent deficit. A similar
picture of low cereal output was also presented in the Second Round Crop and
Livestock Assessment Report for the 2017/18 season. Sorghum output for
example reached 77, 514 mt down from 182, 012 mt. On the other hand pearl
millet significantly declined from 82, 663mt in the 2016/17 season to a low of
48, 844mt in the just ended 2017/18 season. Zimbabwe recorded a very low
and declining yield for major cereal crops as illustrated in Table 2.
0
10000
20000
30000
40000
50000
60000
70000
Total 2018/19
Total 2017/18
HIGHLIGHTS
Zimbabwe recorded a very low and declining yield for major cereal crops.
10 | P a g e
Table 2: Cereal yield for 2017/18 vs 2016/17
2017/18 (mt/ha) 2016/17 (mt/ha)
Maize 0.99 1.15
Sorghum 0.43 0.57
Pearl Millet 0.31 0.40
Finger Millet 0.35 0.46 Source: Second Round Crop and Livestock Assessment Report for the 2017/18 season
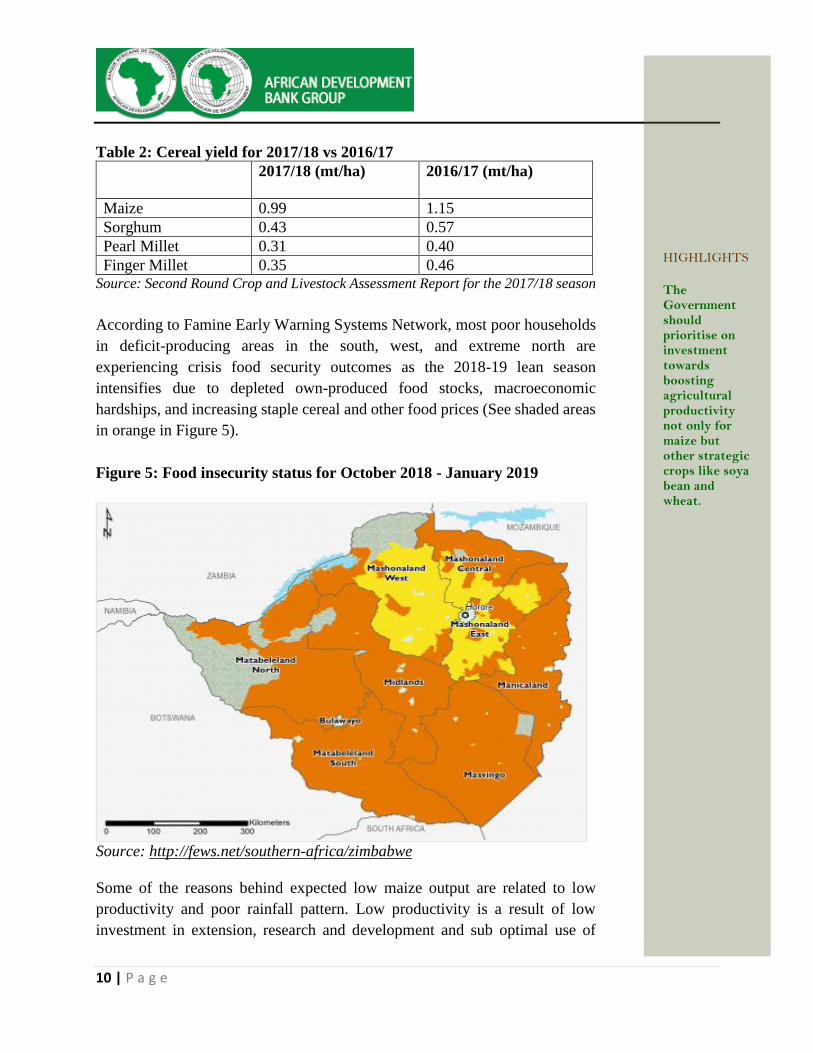
According to Famine Early Warning Systems Network, most poor households
in deficit-producing areas in the south, west, and extreme north are
experiencing crisis food security outcomes as the 2018-19 lean season
intensifies due to depleted own-produced food stocks, macroeconomic
hardships, and increasing staple cereal and other food prices (See shaded areas
in orange in Figure 5).
Figure 5: Food insecurity status for October 2018 - January 2019
Source: http://fews.net/southern-africa/zimbabwe
Some of the reasons behind expected low maize output are related to low
productivity and poor rainfall pattern. Low productivity is a result of low
investment in extension, research and development and sub optimal use of
HIGHLIGHTS
The Government should prioritise on investment towards boosting agricultural productivity not only for maize but other strategic crops like soya bean and wheat.
11 | P a g e
irrigation systems in Zimbabwe. This ultimately negatively impacts on agro-
processed goods when compared to regional and international producers. This
calls for Government to prioritise on investment towards boosting agricultural
productivity not only for maize but other strategic crops like soya bean and
wheat. This can be achieved through intensifying farmers to extension contact,
irrigation as well as research and development towards climate change resistant
varieties particularly small grain suitable for drier areas of the country.
4.2 Mining
Beneficiation and value addition of Minerals in Zimbabwe
The mining sector is projected to grow by 26 percent in 2018 mainly driven by
strong performance of gold, coal, chrome and diamond. Zimbabwe’s Vision
2030 entails transforming the country to an upper middle income status by
2030. This requires transforming the economy from an export dependent
economy to production of value added products which are not prone to
fluctuation of prices on the international market.
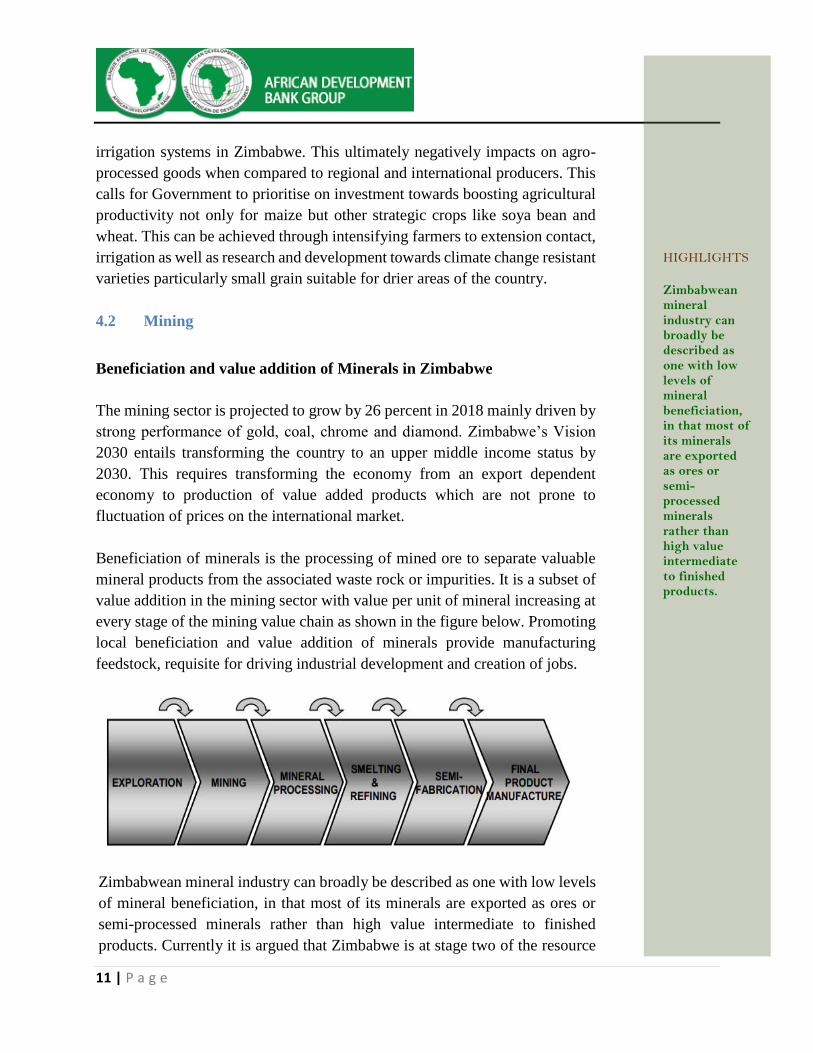
Beneficiation of minerals is the processing of mined ore to separate valuable
mineral products from the associated waste rock or impurities. It is a subset of
value addition in the mining sector with value per unit of mineral increasing at
every stage of the mining value chain as shown in the figure below. Promoting
local beneficiation and value addition of minerals provide manufacturing
feedstock, requisite for driving industrial development and creation of jobs.
Zimbabwean mineral industry can broadly be described as one with low levels
of mineral beneficiation, in that most of its minerals are exported as ores or
semi-processed minerals rather than high value intermediate to finished
products. Currently it is argued that Zimbabwe is at stage two of the resource
HIGHLIGHTS
Zimbabwean mineral industry can broadly be described as one with low levels of mineral beneficiation, in that most of its minerals are exported as ores or semi-processed minerals rather than high value intermediate to finished products.
12 | P a g e
based industrialisation phasing, which displays the decreasing importance of
resource exploitation as the resource linkages are developed. Stage two is
mainly entrenched in resource exploitation with limited beneficiation of
minerals and value addition to finished products. Resource beneficiation and
value addition is mainly undertaken at stages three and four, respectively. The
African Union’s Africa Mining Vision of 2009 and the SADC Industrialisation
Policy Framework adopted in 2015 highlight the need for natural resource rich
countries to leverage on this comparative advantage and undertake
beneficiation and value addition of minerals given that the mineral resources
are finite.
Zimbabwe has limited capacity to value add minerals into manufactured
products. There is need to invest in the beneficiation and value addition plants
and tap into the local capacity that had been developed to beneficiate and value
add some mineral commodities particularly base metals like nickel, chrome,
copper, platinum group metals (PGMs), and iron ore. There is scope for
upscaling the beneficiation and value addition of both base metals and precious
minerals like gold and diamonds. The status and applicability of beneficiation
and value addition of different minerals is presented in Table 3.
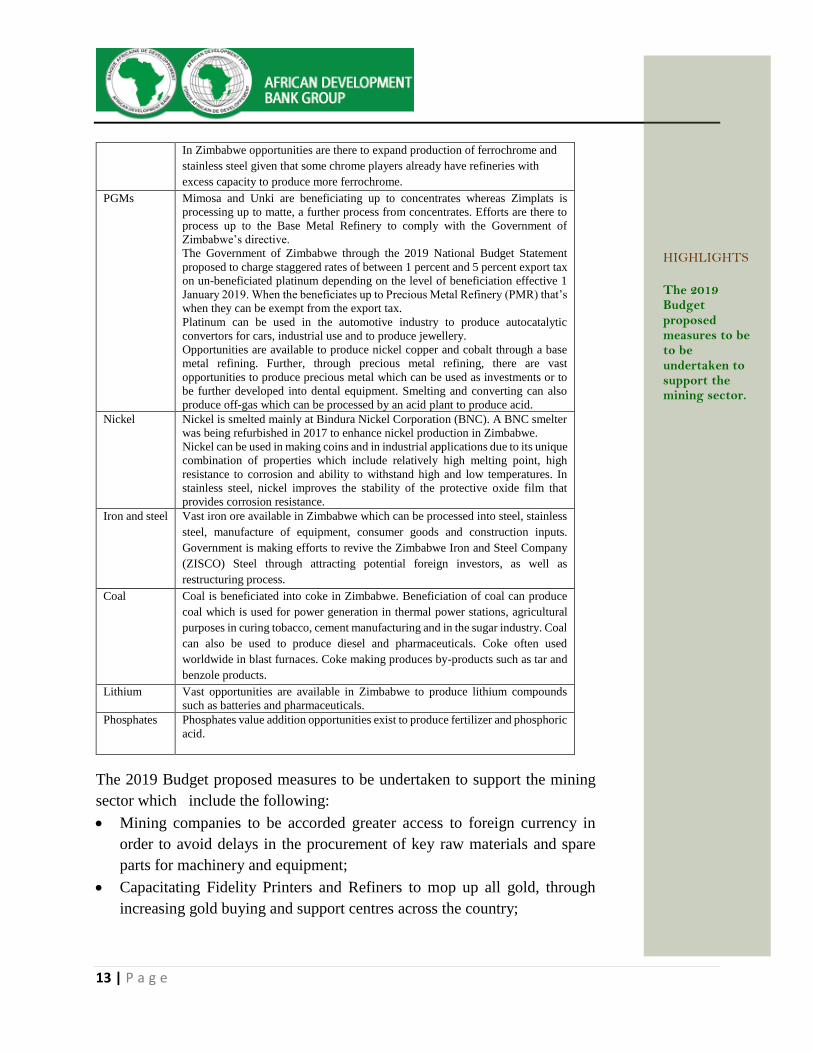
Table 3: Current and Potential Beneficiations and Value Addition Efforts in
Zimbabwe
Gold Fidelity Printers and Refinery, a subsidiary of the Reserve Bank of Zimbabwe is
currently refining gold ore to 99.5 percent purity before exporting it to the Rand
Refinery. However, the volumes exported make Zimbabwe eligible to be
readmitted to trade on the London Bullion market.
Currently there are limited players producing jewellery with gold and silver e.g.
Aurex Jewellery.
Other uses of gold include manufacture of electronic products, gold coins, use of
gold as money to store value, or as investment bars to hedge against inflation.
Zimbabwe can use precious metals such as gold, PGMS and diamond to
develop an integrated jewellery hub. This will add on jewellery which is
currently produced from gold and diamond but on a smaller scale.
Diamond Basic processing of diamond is taking place but is limited due to inadequate
diamond allocation from the mining houses, given the requisite legislative
allocation of 10 percent of total local production.
Diamonds can be value added through cutting and polishing to produce more
jewellery and tools.
Chrome Chrome beneficiation is currently taking place through processing of chrome ore
into ferrochrome, a raw material used in the production of stainless steel. It is also
used in the chemical and foundry industry and as for refractory bricks for furnace
lining.
HIGHLIGHTS
Zimbabwe has limited capacity to value add minerals into manufactured products.
13 | P a g e
In Zimbabwe opportunities are there to expand production of ferrochrome and
stainless steel given that some chrome players already have refineries with
excess capacity to produce more ferrochrome.
PGMs
Mimosa and Unki are beneficiating up to concentrates whereas Zimplats is
processing up to matte, a further process from concentrates. Efforts are there to
process up to the Base Metal Refinery to comply with the Government of
Zimbabwe’s directive.
The Government of Zimbabwe through the 2019 National Budget Statement
proposed to charge staggered rates of between 1 percent and 5 percent export tax
on un-beneficiated platinum depending on the level of beneficiation effective 1
January 2019. When the beneficiates up to Precious Metal Refinery (PMR) that’s
when they can be exempt from the export tax.
Platinum can be used in the automotive industry to produce autocatalytic
convertors for cars, industrial use and to produce jewellery.
Opportunities are available to produce nickel copper and cobalt through a base
metal refining. Further, through precious metal refining, there are vast
opportunities to produce precious metal which can be used as investments or to
be further developed into dental equipment. Smelting and converting can also
produce off-gas which can be processed by an acid plant to produce acid.
Nickel Nickel is smelted mainly at Bindura Nickel Corporation (BNC). A BNC smelter
was being refurbished in 2017 to enhance nickel production in Zimbabwe.
Nickel can be used in making coins and in industrial applications due to its unique
combination of properties which include relatively high melting point, high
resistance to corrosion and ability to withstand high and low temperatures. In
stainless steel, nickel improves the stability of the protective oxide film that
provides corrosion resistance.
Iron and steel Vast iron ore available in Zimbabwe which can be processed into steel, stainless
steel, manufacture of equipment, consumer goods and construction inputs.
Government is making efforts to revive the Zimbabwe Iron and Steel Company
(ZISCO) Steel through attracting potential foreign investors, as well as
restructuring process.
Coal Coal is beneficiated into coke in Zimbabwe. Beneficiation of coal can produce
coal which is used for power generation in thermal power stations, agricultural
purposes in curing tobacco, cement manufacturing and in the sugar industry. Coal
can also be used to produce diesel and pharmaceuticals. Coke often used
worldwide in blast furnaces. Coke making produces by-products such as tar and
benzole products.
Lithium Vast opportunities are available in Zimbabwe to produce lithium compounds
such as batteries and pharmaceuticals.
Phosphates Phosphates value addition opportunities exist to produce fertilizer and phosphoric
acid.
The 2019 Budget proposed measures to be undertaken to support the mining
sector which include the following: Mining companies to be accorded greater access to foreign currency in
order to avoid delays in the procurement of key raw materials and spare
parts for machinery and equipment;
Capacitating Fidelity Printers and Refiners to mop up all gold, through
increasing gold buying and support centres across the country;
HIGHLIGHTS
The 2019 Budget proposed measures to be to be undertaken to support the mining sector.
14 | P a g e
Capacitating small scale miners, through access to equipment for hire and
affordable credit lines and technical skills; Embracing interventions to
reduce environmental, social and health impact challenges that arise in
artisanal and small scale mining operations;
Finalising amendments to the Mines and Minerals Amendment Act, which
seeks to promote exploration and mining by revoking unutilised claims
being held for speculative purposes;
Harmonising mining taxation laws to ensure viability of the sector;
Capacitating Hwange Colliery to fully embark on underground coal
mining; and
Resuscitation of idle and distressed mines under Zimbabwe Mining
Development Corporation (ZMDC).
Pursuant to this, the mining output is projected to grow by 16.1 percent in 2019
and a further 15.3 percent in 2020, benefiting from strong performances mainly
in gold, diamonds, chrome and coal.
4.3 Manufacturing
Following policy pronouncement which resulted in a lot of speculative
activities, the country was characterised by shortages, as producers could not
match demand for products. The shortages, which are mainly attributed to panic
buying as consumers felt that the currency reforms would see their savings
being eroded, saw government reconsidering the earlier protectionist regime
where the importation of several basic products had been subject to the granting
of an import licence.
Statutory Instrument 64 of 2016, which had now been replaced by Statutory
Instrument 122 of 2017 which consolidated all regulations affecting imports,
was repealed to allow consumers, retailers and producers with free funds to
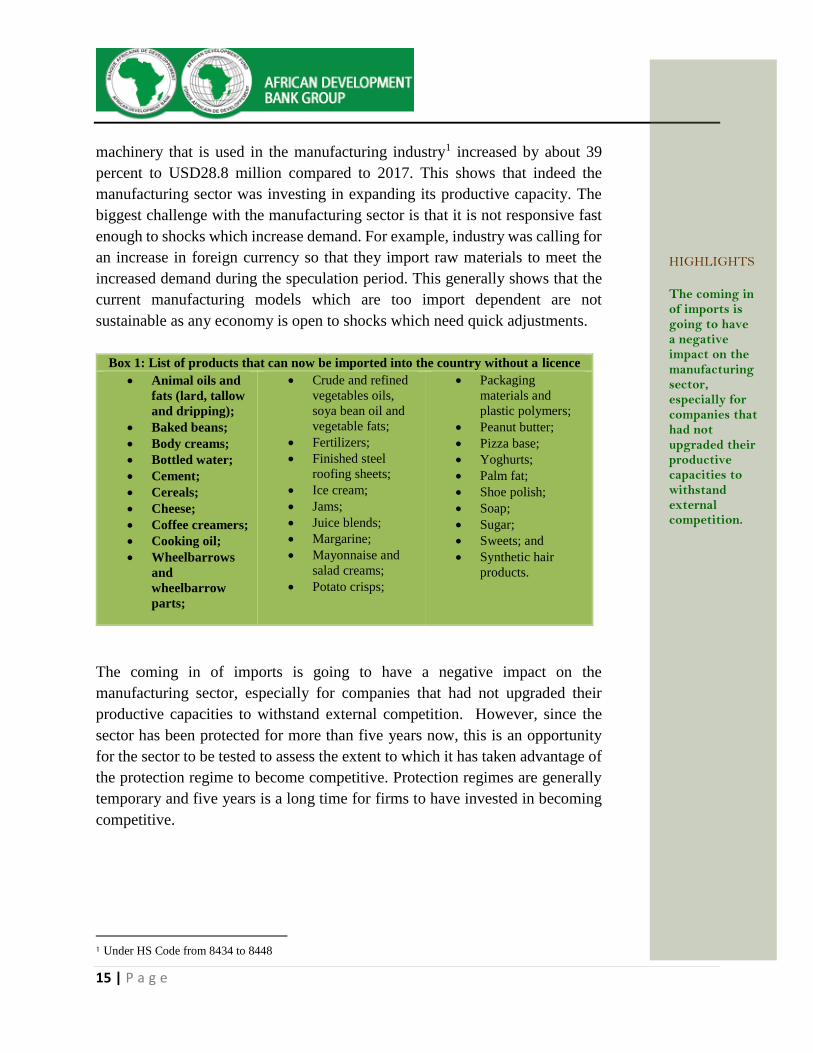
import products that were in shortage. On 29 October 2018, Statutory
Instrument 237A of 2018 was, therefore, officially gazetted. A list of 29
products (Box 1) that were initially subjected to import licences can now be
imported into the country, subject to the payment of the appropriate customs
duty, mainly in forex as per latter provisions of 2019 Budget statement.
The entry of the goods into the country is expected to impose pressure on the
manufacturing sector, which had been recovering, though sluggishly. For
example, between February and September 2018, the importation of plant and
HIGHLIGHTS
On 29 October 2018, Statutory Instrument 237A of 2018 was officially gazetted. It provided a list of 29 products that were initially subjected to import licences can now be imported into the country, subject to the payment of the appropriate customs duty.
15 | P a g e
machinery that is used in the manufacturing industry1 increased by about 39
percent to USD28.8 million compared to 2017. This shows that indeed the
manufacturing sector was investing in expanding its productive capacity. The
biggest challenge with the manufacturing sector is that it is not responsive fast
enough to shocks which increase demand. For example, industry was calling for
an increase in foreign currency so that they import raw materials to meet the
increased demand during the speculation period. This generally shows that the
current manufacturing models which are too import dependent are not
sustainable as any economy is open to shocks which need quick adjustments.
Box 1: List of products that can now be imported into the country without a licence
Animal oils and
fats (lard, tallow
and dripping);
Baked beans;
Body creams;
Bottled water;
Cement;
Cereals;
Cheese;
Coffee creamers;
Cooking oil;
Wheelbarrows
and
wheelbarrow
parts;
Crude and refined
vegetables oils,
soya bean oil and
vegetable fats;
Fertilizers;
Finished steel
roofing sheets;
Ice cream;
Jams;
Juice blends;
Margarine;
Mayonnaise and
salad creams;
Potato crisps;
Packaging
materials and
plastic polymers;
Peanut butter;
Pizza base;
Yoghurts;
Palm fat;
Shoe polish;
Soap;
Sugar;
Sweets; and
Synthetic hair
products.
The coming in of imports is going to have a negative impact on the
manufacturing sector, especially for companies that had not upgraded their
productive capacities to withstand external competition. However, since the
sector has been protected for more than five years now, this is an opportunity
for the sector to be tested to assess the extent to which it has taken advantage of
the protection regime to become competitive. Protection regimes are generally
temporary and five years is a long time for firms to have invested in becoming
competitive.
1 Under HS Code from 8434 to 8448
HIGHLIGHTS
The coming in of imports is going to have a negative impact on the manufacturing sector, especially for companies that had not upgraded their productive capacities to withstand external competition.
16 | P a g e
4.4 Tourism
The Government has indicated that it will target the following for the tourism
industry in 2019:
Promoting Zimbabwe as an international destination of choice;
Addressing cost centres for tourism to increase tourism product
competitiveness;
Tourism product development to appeal and meet the needs of both the
international and domestic market whilst increasing downstream
expenditure; and
Expediting the Tourism Special Economic Zones.
The Government is cognizant that implementing measures to improve
perception of the country as a safe destination will be key as the country is
gearing towards being an upper-middle income economy. Its efforts on this
front have been spurred by Lonely Planet, a large travel guide book publisher
which is guided by global travel experts. This publisher ranked Zimbabwe the
3rd safest destinations to visit in 2019 after Sri Lanka and Germany. The report
further highlighted Zimbabwe’s key tourism strengths including the fact that it
is one of Africa’s safest destinations, blessed with ultra-friendly locals, Big
Five-filled national parks, World Heritage-listed archaeological ruins, forested
mountains and the mighty Victoria Falls. The other strength that the country
can ride on includes the ability by most Zimbabweans to speak English much
needed for communication with foreign tourists. The Government is further
aware of the need to maintain political and economic stability as well as
preventing communicable disease scares such as Ebola, Cholera and Typhoid,
among others all having a potential of damaging the country’s image.
As also recognised by the Bank Group’s, Zimbabwe Economic Report released
in November 2018, the country’s tourism sector potential remains hugely
untapped in comparison to other countries such as Egypt that to a great extent
rely on this sector for economic growth. According to World Travel and
Tourism Council, the travel and tourism sector contributed USD 1.1 billion or
8.1 percent to Zimbabwe’s GDP in 2016 with a share of total employment
being 5.2 percent or 393,000 jobs. This is by far lower than the performance of
the sector to the Egyptian economy where it contributed a total of USD 21.1bn
or 11 percent to GDP with a share of employment being 8.5 percent or 2,425,
500 jobs in 2017.
HIGHLIGHTS
As also recognised by the Bank Group’s, Zimbabwe Economic Report released in November 2018, the country’s tourism sector potential remains hugely untapped in comparison to other countries such as Egypt that to a great extent rely on this sector for economic growth.
17 | P a g e
An upper middle economy which Zimbabwe aspires to become implies
increased disposable income of the local population hence the need to enhance
investment to lift the face of the destinations and create more products for the
new Zimbabwe in line with Vision 2030.
5. FISCAL POLICY
Revenue performance
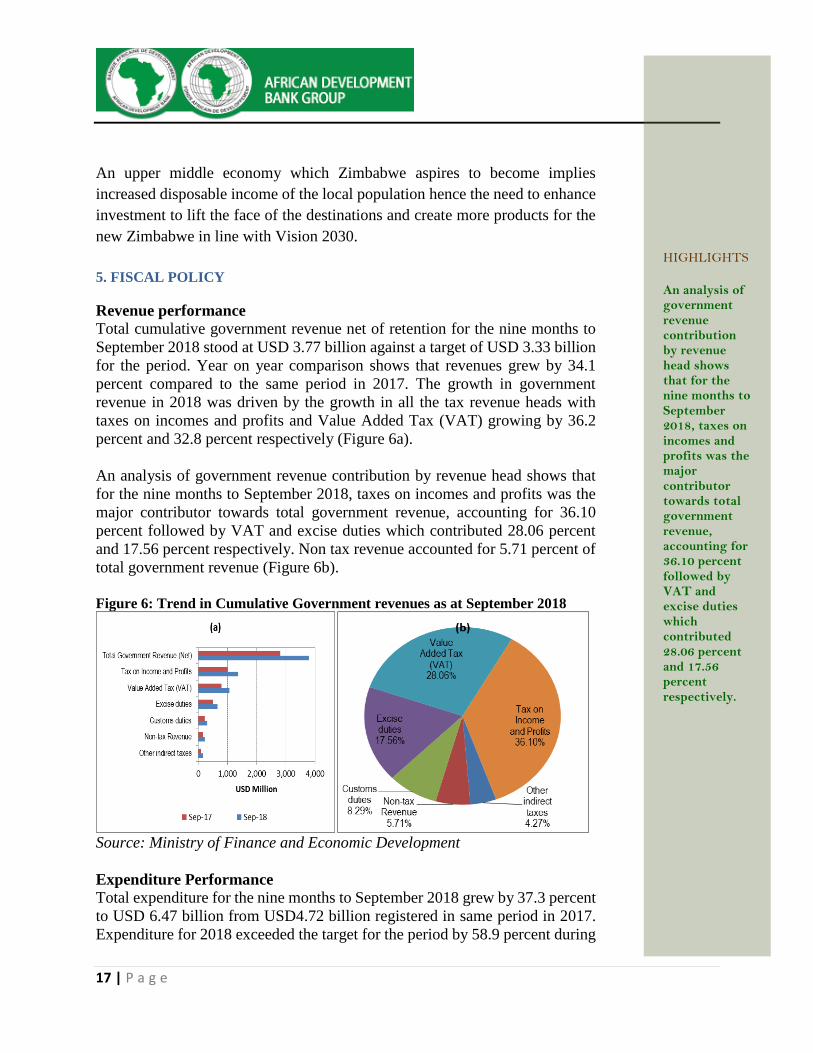
Total cumulative government revenue net of retention for the nine months to
September 2018 stood at USD 3.77 billion against a target of USD 3.33 billion
for the period. Year on year comparison shows that revenues grew by 34.1
percent compared to the same period in 2017. The growth in government
revenue in 2018 was driven by the growth in all the tax revenue heads with
taxes on incomes and profits and Value Added Tax (VAT) growing by 36.2
percent and 32.8 percent respectively (Figure 6a).
An analysis of government revenue contribution by revenue head shows that
for the nine months to September 2018, taxes on incomes and profits was the
major contributor towards total government revenue, accounting for 36.10
percent followed by VAT and excise duties which contributed 28.06 percent
and 17.56 percent respectively. Non tax revenue accounted for 5.71 percent of
total government revenue (Figure 6b).
Figure 6: Trend in Cumulative Government revenues as at September 2018
Source: Ministry of Finance and Economic Development
Expenditure Performance
Total expenditure for the nine months to September 2018 grew by 37.3 percent
to USD 6.47 billion from USD4.72 billion registered in same period in 2017.
Expenditure for 2018 exceeded the target for the period by 58.9 percent during
HIGHLIGHTS
An analysis of government revenue contribution by revenue head shows that for the nine months to September 2018, taxes on incomes and profits was the major contributor towards total government revenue, accounting for 36.10 percent followed by VAT and excise duties which contributed 28.06 percent and 17.56 percent respectively.
18 | P a g e
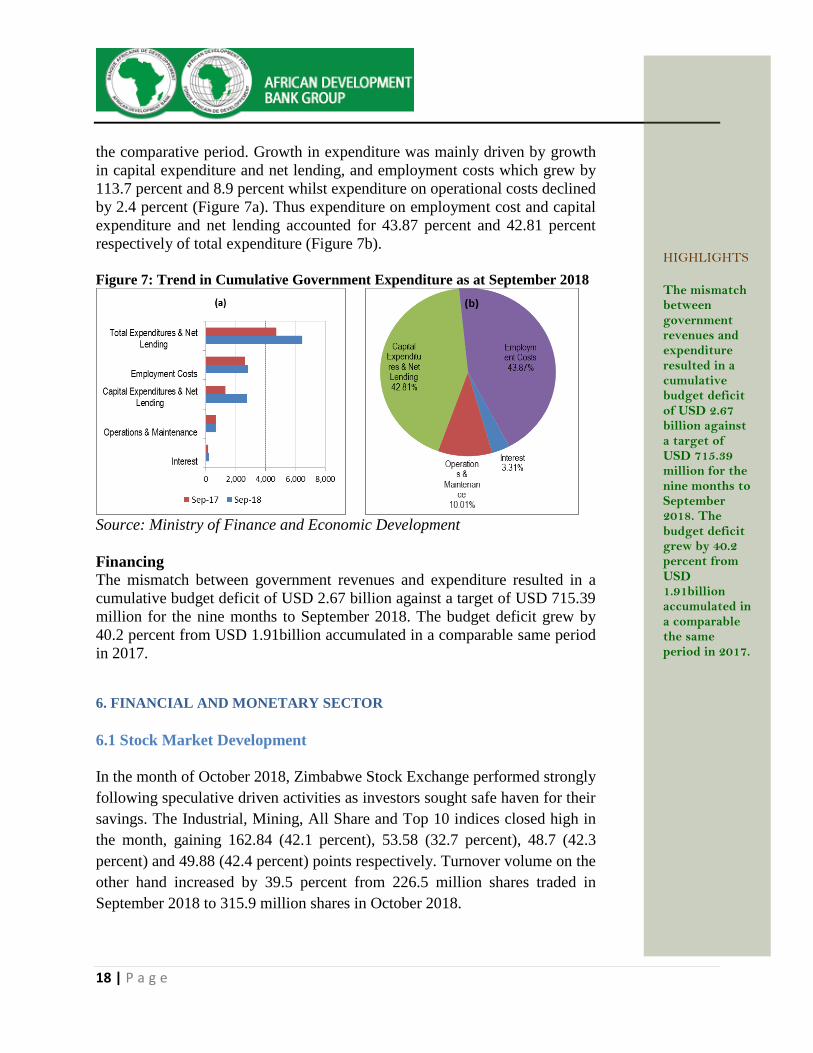
the comparative period. Growth in expenditure was mainly driven by growth
in capital expenditure and net lending, and employment costs which grew by
113.7 percent and 8.9 percent whilst expenditure on operational costs declined
by 2.4 percent (Figure 7a). Thus expenditure on employment cost and capital
expenditure and net lending accounted for 43.87 percent and 42.81 percent
respectively of total expenditure (Figure 7b).
Figure 7: Trend in Cumulative Government Expenditure as at September 2018
Source: Ministry of Finance and Economic Development
Financing
The mismatch between government revenues and expenditure resulted in a
cumulative budget deficit of USD 2.67 billion against a target of USD 715.39
million for the nine months to September 2018. The budget deficit grew by
40.2 percent from USD 1.91billion accumulated in a comparable same period
in 2017.
6. FINANCIAL AND MONETARY SECTOR
6.1 Stock Market Development
In the month of October 2018, Zimbabwe Stock Exchange performed strongly
following speculative driven activities as investors sought safe haven for their
savings. The Industrial, Mining, All Share and Top 10 indices closed high in
the month, gaining 162.84 (42.1 percent), 53.58 (32.7 percent), 48.7 (42.3
percent) and 49.88 (42.4 percent) points respectively. Turnover volume on the
other hand increased by 39.5 percent from 226.5 million shares traded in
September 2018 to 315.9 million shares in October 2018.
HIGHLIGHTS
The mismatch between government revenues and expenditure resulted in a cumulative budget deficit of USD 2.67 billion against a target of USD 715.39 million for the nine months to September 2018. The budget deficit grew by 40.2 percent from USD 1.91billion accumulated in a comparable the same period in 2017.
19 | P a g e
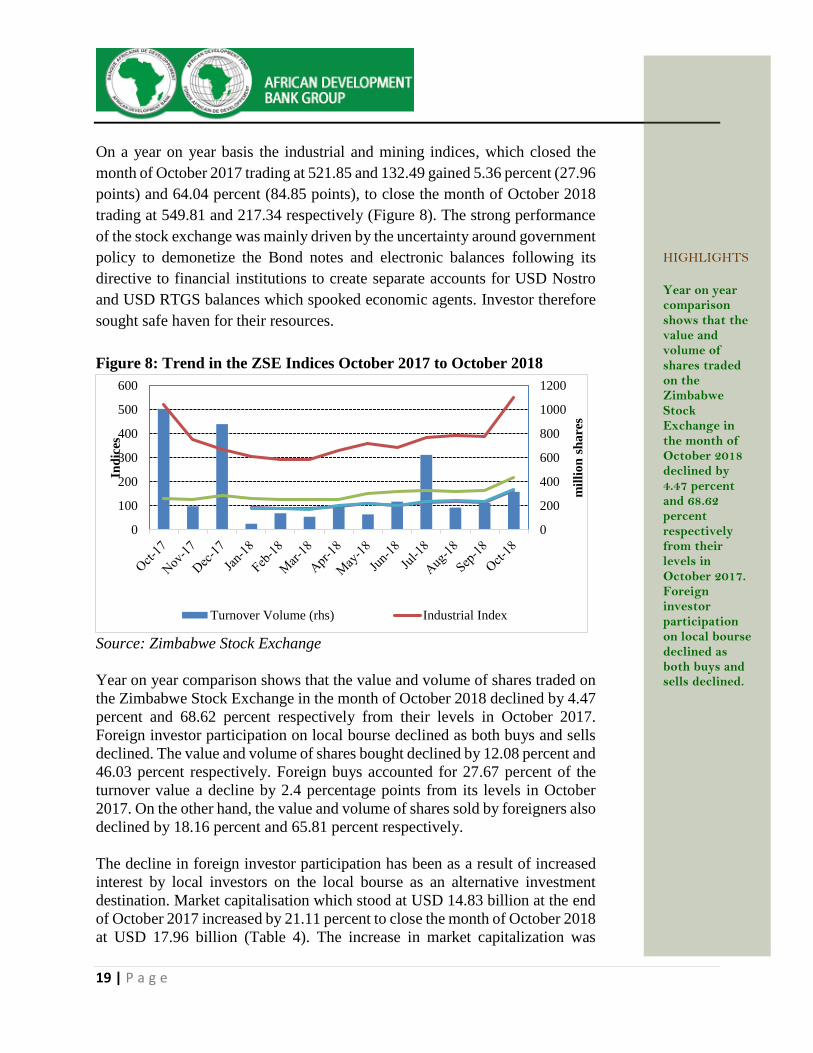
On a year on year basis the industrial and mining indices, which closed the
month of October 2017 trading at 521.85 and 132.49 gained 5.36 percent (27.96
points) and 64.04 percent (84.85 points), to close the month of October 2018
trading at 549.81 and 217.34 respectively (Figure 8). The strong performance
of the stock exchange was mainly driven by the uncertainty around government
policy to demonetize the Bond notes and electronic balances following its
directive to financial institutions to create separate accounts for USD Nostro
and USD RTGS balances which spooked economic agents. Investor therefore
sought safe haven for their resources.
Figure 8: Trend in the ZSE Indices October 2017 to October 2018
Source: Zimbabwe Stock Exchange
Year on year comparison shows that the value and volume of shares traded on
the Zimbabwe Stock Exchange in the month of October 2018 declined by 4.47
percent and 68.62 percent respectively from their levels in October 2017.
Foreign investor participation on local bourse declined as both buys and sells
declined. The value and volume of shares bought declined by 12.08 percent and
46.03 percent respectively. Foreign buys accounted for 27.67 percent of the
turnover value a decline by 2.4 percentage points from its levels in October
2017. On the other hand, the value and volume of shares sold by foreigners also
declined by 18.16 percent and 65.81 percent respectively.
The decline in foreign investor participation has been as a result of increased
interest by local investors on the local bourse as an alternative investment
destination. Market capitalisation which stood at USD 14.83 billion at the end
of October 2017 increased by 21.11 percent to close the month of October 2018
at USD 17.96 billion (Table 4). The increase in market capitalization was
0
200
400
600
800
1000
1200
0
100
200
300
400
500
600
mil
lio
n s
ha
res
Ind
ices
Turnover Volume (rhs) Industrial Index
HIGHLIGHTS
Year on year comparison shows that the value and volume of shares traded on the Zimbabwe Stock Exchange in the month of October 2018 declined by 4.47 percent and 68.62 percent respectively from their levels in October 2017. Foreign investor participation on local bourse declined as both buys and sells declined.
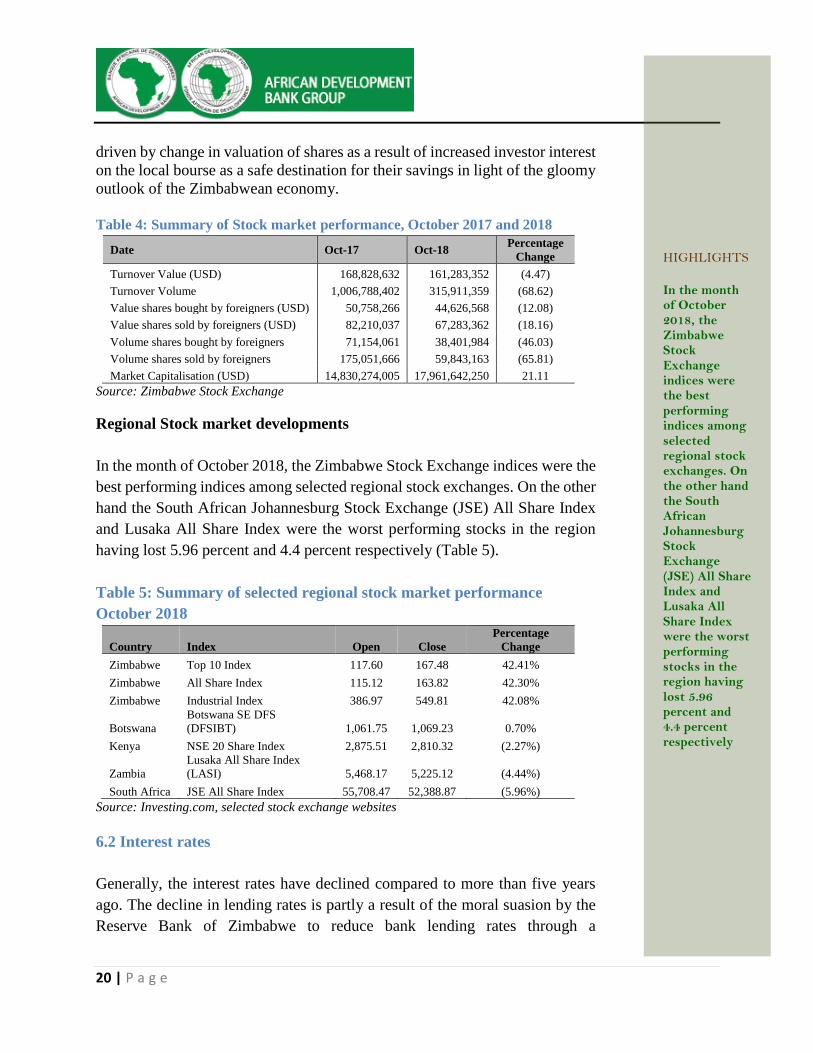
20 | P a g e
driven by change in valuation of shares as a result of increased investor interest
on the local bourse as a safe destination for their savings in light of the gloomy
outlook of the Zimbabwean economy.
Table 4: Summary of Stock market performance, October 2017 and 2018
Date Oct-17 Oct-18 Percentage
Change
Turnover Value (USD) 168,828,632 161,283,352 (4.47)
Turnover Volume 1,006,788,402 315,911,359 (68.62)
Value shares bought by foreigners (USD) 50,758,266 44,626,568 (12.08)
Value shares sold by foreigners (USD) 82,210,037 67,283,362 (18.16)
Volume shares bought by foreigners 71,154,061 38,401,984 (46.03)
Volume shares sold by foreigners 175,051,666 59,843,163 (65.81)
Market Capitalisation (USD) 14,830,274,005 17,961,642,250 21.11
Source: Zimbabwe Stock Exchange
Regional Stock market developments
In the month of October 2018, the Zimbabwe Stock Exchange indices were the
best performing indices among selected regional stock exchanges. On the other
hand the South African Johannesburg Stock Exchange (JSE) All Share Index
and Lusaka All Share Index were the worst performing stocks in the region
having lost 5.96 percent and 4.4 percent respectively (Table 5).
Table 5: Summary of selected regional stock market performance
October 2018
Country Index Open Close
Percentage
Change
Zimbabwe Top 10 Index 117.60 167.48 42.41%
Zimbabwe All Share Index 115.12 163.82 42.30%
Zimbabwe Industrial Index 386.97 549.81 42.08%
Botswana
Botswana SE DFS
(DFSIBT) 1,061.75 1,069.23 0.70%
Kenya NSE 20 Share Index 2,875.51 2,810.32 (2.27%)
Zambia
Lusaka All Share Index
(LASI) 5,468.17 5,225.12 (4.44%)
South Africa JSE All Share Index 55,708.47 52,388.87 (5.96%)
Source: Investing.com, selected stock exchange websites
6.2 Interest rates
Generally, the interest rates have declined compared to more than five years
ago. The decline in lending rates is partly a result of the moral suasion by the
Reserve Bank of Zimbabwe to reduce bank lending rates through a
HIGHLIGHTS
In the month of October 2018, the Zimbabwe Stock Exchange indices were the best performing indices among selected regional stock exchanges. On the other hand the South African Johannesburg Stock Exchange (JSE) All Share Index and Lusaka All Share Index were the worst performing stocks in the region having lost 5.96 percent and 4.4 percent respectively
21 | P a g e
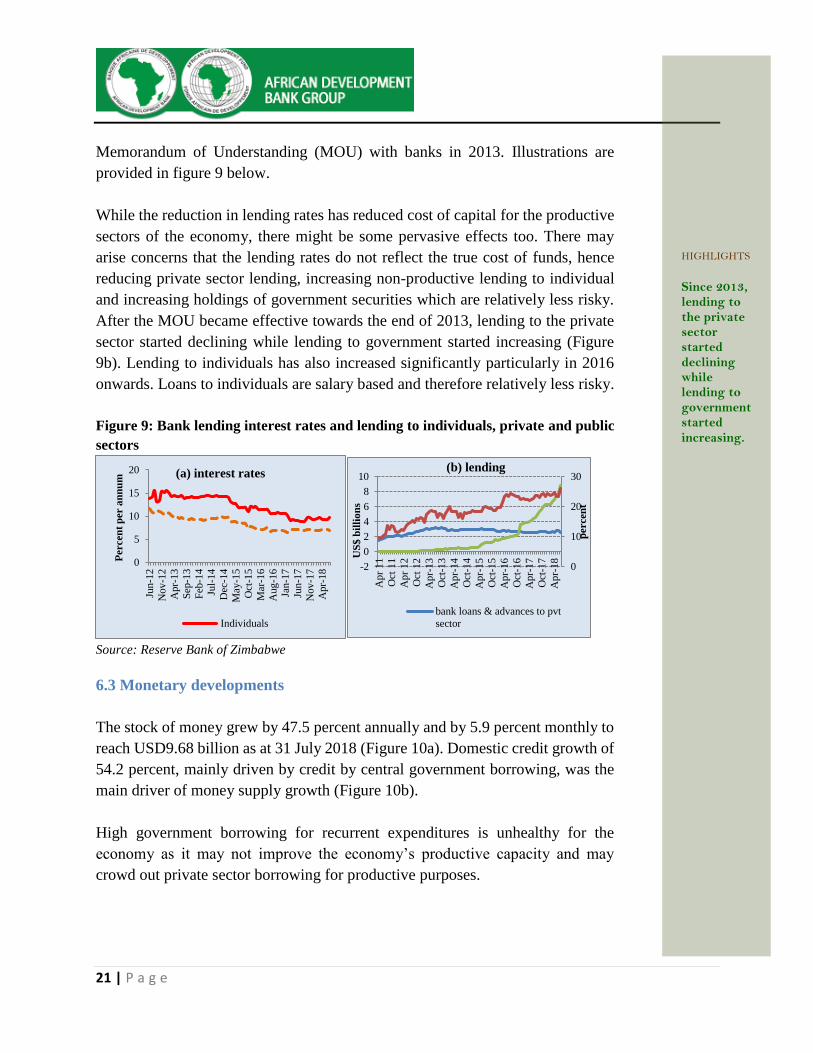
Memorandum of Understanding (MOU) with banks in 2013. Illustrations are
provided in figure 9 below.
While the reduction in lending rates has reduced cost of capital for the productive
sectors of the economy, there might be some pervasive effects too. There may
arise concerns that the lending rates do not reflect the true cost of funds, hence
reducing private sector lending, increasing non-productive lending to individual
and increasing holdings of government securities which are relatively less risky.
After the MOU became effective towards the end of 2013, lending to the private
sector started declining while lending to government started increasing (Figure
9b). Lending to individuals has also increased significantly particularly in 2016
onwards. Loans to individuals are salary based and therefore relatively less risky.
Figure 9: Bank lending interest rates and lending to individuals, private and public
sectors
Source: Reserve Bank of Zimbabwe
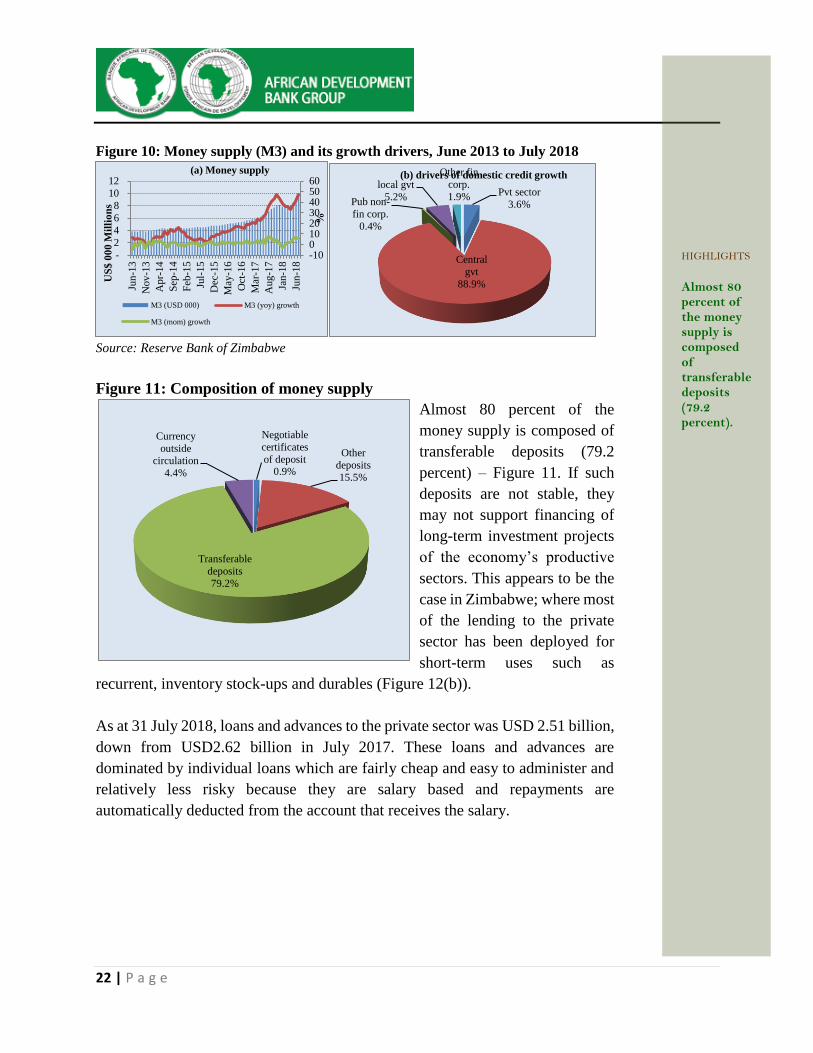
6.3 Monetary developments
The stock of money grew by 47.5 percent annually and by 5.9 percent monthly to
reach USD9.68 billion as at 31 July 2018 (Figure 10a). Domestic credit growth of
54.2 percent, mainly driven by credit by central government borrowing, was the
main driver of money supply growth (Figure 10b).
High government borrowing for recurrent expenditures is unhealthy for the
economy as it may not improve the economy’s productive capacity and may
crowd out private sector borrowing for productive purposes.
0
5
10
15
20
Jun
-12
Nov
-12
Apr-
13
Sep
-13
Feb
-14
Jul-
14
Dec
-14
May
-15
Oct
-15
Mar
-16
Aug
-16
Jan-1
7
Jun
-17
Nov
-17
Apr-
18
Percen
t p
er a
nn
um
(a) interest rates
Individuals
0
10
20
30
-2
0
2
4
6
8
10
Apr
11
Oct
11
Apr
12
Oct
12
Apr-
13
Oct
-13
Apr-
14
Oct
-14
Apr-
15
Oct
-15
Apr-
16
Oct
-16
Apr-
17
Oct
-17
Apr-
18
percen
t
US
$ b
illi
on
s
(b) lending
bank loans & advances to pvt
sector
HIGHLIGHTS
Since 2013, lending to the private sector started declining while lending to government started increasing.
22 | P a g e
Figure 10: Money supply (M3) and its growth drivers, June 2013 to July 2018
Source: Reserve Bank of Zimbabwe
Figure 11: Composition of money supply
Almost 80 percent of the
money supply is composed of
transferable deposits (79.2
percent) – Figure 11. If such
deposits are not stable, they
may not support financing of
long-term investment projects
of the economy’s productive
sectors. This appears to be the
case in Zimbabwe; where most
of the lending to the private
sector has been deployed for
short-term uses such as
recurrent, inventory stock-ups and durables (Figure 12(b)).
As at 31 July 2018, loans and advances to the private sector was USD 2.51 billion,
down from USD2.62 billion in July 2017. These loans and advances are
dominated by individual loans which are fairly cheap and easy to administer and
relatively less risky because they are salary based and repayments are
automatically deducted from the account that receives the salary.
-100102030405060
-
2
4
6
8
10
12
Jun
-13
Nov
-13
Apr-
14
Sep
-14
Feb
-15
Jul-
15
Dec
-15
May
-16
Oct
-16
Mar
-17
Aug
-17
Jan-1
8
Jun
-18
%
US
$ 0
00
Mil
lio
ns
(a) Money supply
M3 (USD 000) M3 (yoy) growth
M3 (mom) growth
Pvt sector
3.6%
Central
gvt
88.9%
Pub non-
fin corp.
0.4%
local gvt
5.2%
Other fin
corp.
1.9%
(b) drivers of domestic credit growth
Negotiable
certificates
of deposit0.9%
Other
deposits
15.5%
Transferable
deposits
79.2%
Currency
outside
circulation4.4%
HIGHLIGHTS
Almost 80 percent of the money supply is composed of transferable deposits (79.2 percent).
23 | P a g e
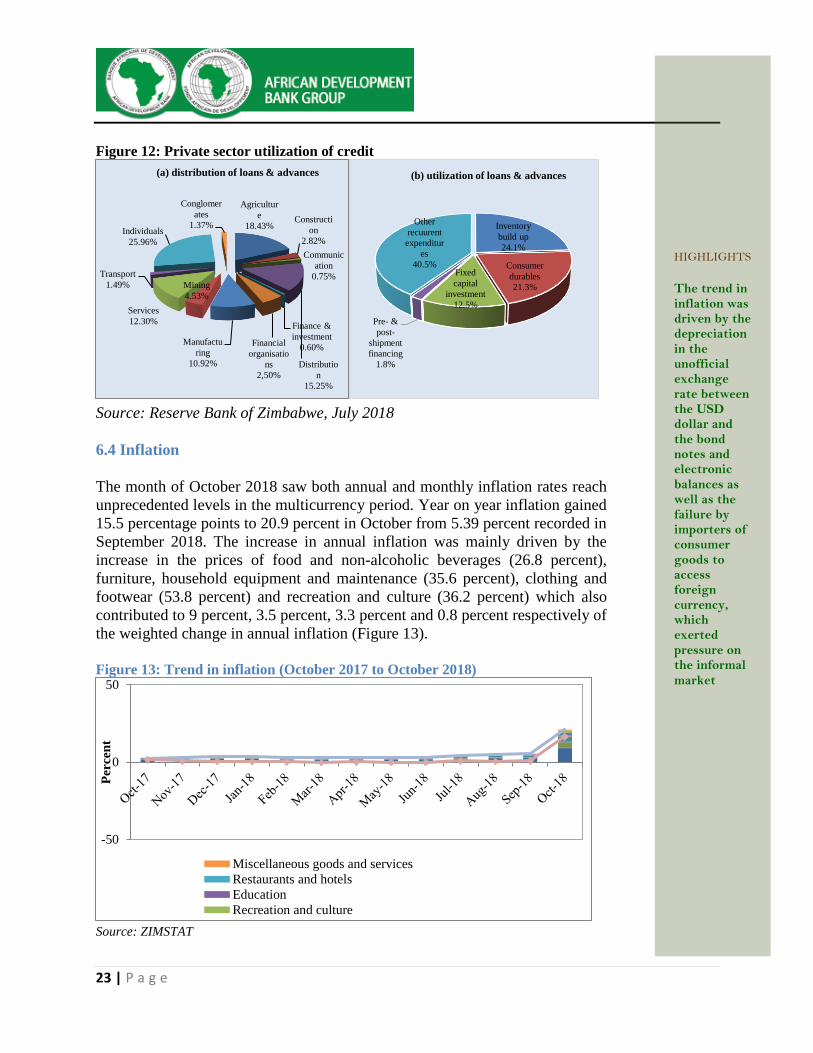
Figure 12: Private sector utilization of credit
Source: Reserve Bank of Zimbabwe, July 2018
6.4 Inflation
The month of October 2018 saw both annual and monthly inflation rates reach
unprecedented levels in the multicurrency period. Year on year inflation gained
15.5 percentage points to 20.9 percent in October from 5.39 percent recorded in
September 2018. The increase in annual inflation was mainly driven by the
increase in the prices of food and non-alcoholic beverages (26.8 percent),
furniture, household equipment and maintenance (35.6 percent), clothing and
footwear (53.8 percent) and recreation and culture (36.2 percent) which also
contributed to 9 percent, 3.5 percent, 3.3 percent and 0.8 percent respectively of
the weighted change in annual inflation (Figure 13).
Figure 13: Trend in inflation (October 2017 to October 2018)
Source: ZIMSTAT
Agricultur
e
18.43%Constructi
on
2.82%
Communic
ation
0.75%
Distributio
n
15.25%
Finance &
investment
0.60%Financial
organisatio
ns
2,50%
Manufactu
ring
10.92%
Mining
4.53%
Services
12.30%
Transport
1.49%
Individuals
25.96%
Conglomer
ates
1.37%
(a) distribution of loans & advances
Inventory
build up
24.1%
Consumer
durables
21.3%
Fixed
capital
investment
12.5%
Pre- &
post-
shipment
financing
1.8%
Other
recuurent
expenditur
es
40.5%
(b) utilization of loans & advances
-50
0
50
Per
cen
t
Miscellaneous goods and services
Restaurants and hotels
Education
Recreation and culture
HIGHLIGHTS
The trend in inflation was driven by the depreciation in the unofficial exchange rate between the USD dollar and the bond notes and electronic balances as well as the failure by importers of consumer goods to access foreign currency, which exerted pressure on the informal market
24 | P a g e
On a month on month basis, the Consumer Price Index rose by 15.5 percentage
points from 0.9 percent in the month of September 2018 to 16.4 percent in the
month of October 2018 spurred by the increases in the prices of clothing and
footwear (45.9 percent); recreation and culture (27.7 percent); furniture,
household equipment and maintenance (26.9 percent); and food and non-
alcoholic beverages (20.1 percent).
The trend in inflation was also driven by the depreciation in the unofficial
exchange rate between the USD dollar and the bond notes and electronic balances
as well as the failure by importers of consumer goods to access foreign currency,
which exerted pressure on the informal market hence the perceived exchange
rates tumble resulting in prices shooting upwards. Thus, the inflation outlook
remains negative as annual inflation rate is increasing at a faster pace than
previously anticipated. The 2019 budget projects an inflation rate of 22.4 percent
in 2019.
7. EXTERNAL SECTOR AND DEBT
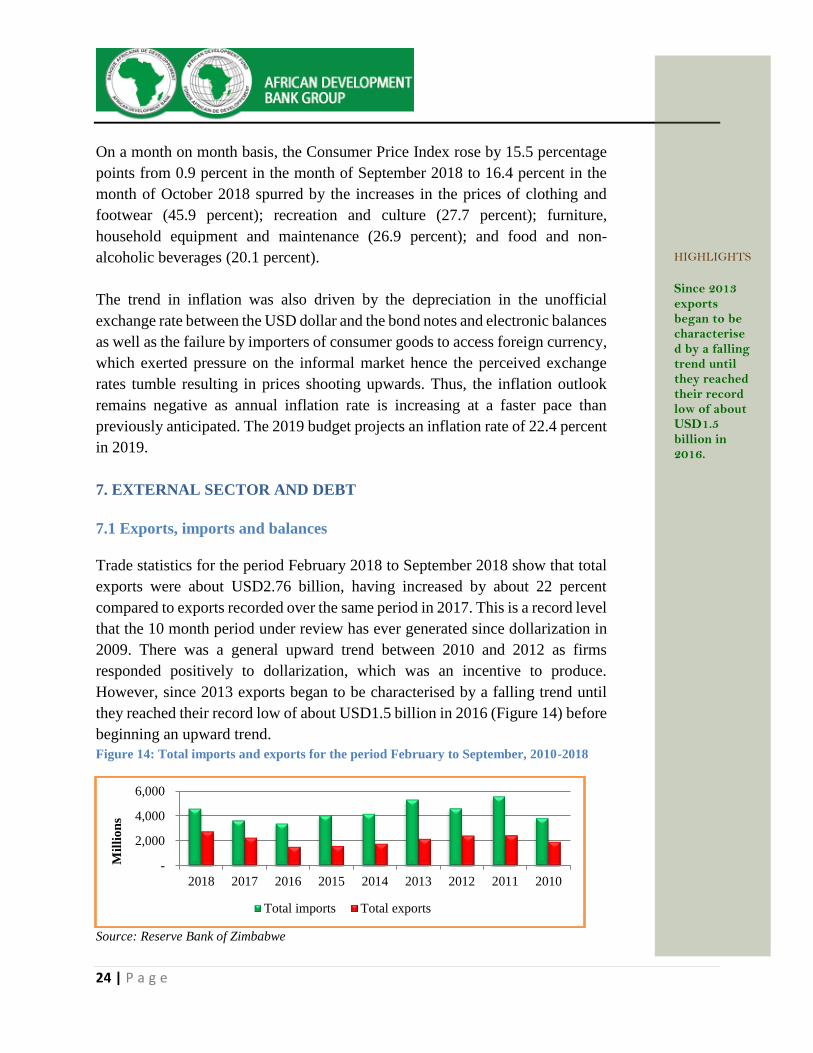
7.1 Exports, imports and balances
Trade statistics for the period February 2018 to September 2018 show that total
exports were about USD2.76 billion, having increased by about 22 percent
compared to exports recorded over the same period in 2017. This is a record level
that the 10 month period under review has ever generated since dollarization in
2009. There was a general upward trend between 2010 and 2012 as firms
responded positively to dollarization, which was an incentive to produce.
However, since 2013 exports began to be characterised by a falling trend until
they reached their record low of about USD1.5 billion in 2016 (Figure 14) before
beginning an upward trend.
Figure 14: Total imports and exports for the period February to September, 2010-2018
Source: Reserve Bank of Zimbabwe
-
2,000
4,000
6,000
2018 2017 2016 2015 2014 2013 2012 2011 2010
Mil
lio
ns
Total imports Total exports
HIGHLIGHTS
Since 2013 exports began to be characterised by a falling trend until they reached their record low of about USD1.5 billion in 2016.
25 | P a g e
Total goods worth about USD4.59 billion were imported into the country
during the period February to September 2018, which is a significant increase
of about 27 percent compared to the levels that were recorded over the same
period in 2017. Over the 10 month period, although imports have been
increasing steadily since 2016, the imported values are still below the record
level of about USD5.6 billion recorded in 2011. However, the worrying
scenario is that the recovery of exports in 2016 and 2017 was also happening
at a time when imports were also recovering, which has a negative impact on
the net availability of foreign currency resources.
Since imports, which are higher, increased by a higher rate than exports, the
trade deficit worsened over the period, underlining the continued net trade
outflow of the scarce foreign currency resources. The trade deficit increased
significantly by about 33.8 percent to about USD1.8 billion over the period
compared to the same period in 2017. Export promotion measures thus need
to also be accompanied by import containing measures to manage foreign
currency availability.
7.2 Debt developments
The total public debt amounted to USD16.9 billion, of which domestic debt
constitutes USD9.5 billion in October 2018. Between December 2017 and
October 2018, domestic debt grew by about 33.8 percent from USD7.1 billion
to about USD9.5 billion. Over the years domestic debt sharply increased from
about USD275.8 million in 2012 to current unsustainable levels contributing
56.2 percent to total debt, overtaking external debt which contributed about
51 percent in December 2017.
The 2019 Budget reiterates fiscal anchors and targets, and further proposes
penalties for noncompliance with the commitment to the Public Finance
Management Act (PFMA) fiscal management provisions in line with the
Transitional Stabilization Program (TSP) October 2018 – December 2020.
The requirement builds upon the 2018 Budget which emphasised on macro
and financial risks emanating from non-compliance with some borrowing
legal requirements such as ceiling of debt to GDP ratio and central bank
lending to the State, which are critical to curb ballooning of domestic and
external debt.
HIGHLIGHTS
The total public debt amounted to USD16.9 billion, of which domestic debt constitutes USD9.5 billion in October 2018. Between December 2017 and October 2018, domestic debt grew by about 33.8 percent from USD7.1 billion to about USD9.5 billion.
26 | P a g e
In line with Section 11(2) of the Public Debt Management Act (Chapter 22:21)
requiring that total outstanding Public and Publicly Guaranteed Debt as a ratio
of GDP not to exceed 70 percent at the end of any fiscal year, the 2019 Budget
anticipates a decline in the total public debt due to the fiscal consolidation
which is expected to reduce domestic borrowing and also the positive results
anticipated from the re-engagement efforts.
8. TOPICAL/THEMATIC ISSUES
8.1 Building a New Zimbabwe: Targeted Policies for Growth and
Job Creation
Over the last decade or so, Zimbabwe’s economy has faced a number of
headwinds resulting in a collapse in growth. Following the political transition
in November 2017, the new Government requested the African Development
Bank to urgently prepare an economic report on the country to support renewal
and transformation. The Government also approached the Bank to assist and
advice on re-engagement with the international community. The Bank
responded positively to this request, as Zimbabwe is an important regional
member country, strategically located in Southern Africa, with enormous
potential given its generous endowments of natural resources, its stock of
public infrastructure, and its comparatively skilled human resources.
The Bank therefore undertook economic and sector work in areas deemed
critical for enhancing the country’s competitiveness and public sector
effectiveness. The resulting report, entitled “Building a New Zimbabwe:
Targeted Policies for Growth and Job Creation,” is part of the analytical work
in Zimbabwe. It provides the Government with alternative growth scenarios to
the year 2030. It also identifies sectors for potential investment to achieve
sustainable and inclusive growth. It is premised on the assumption that the
arrears clearance will be expedited for economic restoration to commence.
The report is important for several reasons. First, it provides the Government,
the donor community, and the private sector with a detailed assessment of
investment opportunities in Zimbabwe. Second, it proposes options to develop
these opportunities and, in so doing, helps fill the gap created by the absence
of sectoral investment priorities. Third, it can be used to inform and support
the government’s dialogue with donors and the business community about
further development of these sectors. Increased coordination and partnership
will improve the alignment of investments with the national objectives, as set
out in Zimbabwe’s Transitional Stabilization Programme (2018–20) and
subsequent medium-term plans.
HIGHLIGHTS
The Bank launched a report, entitled “Building a New Zimbabwe: Targeted Policies for Growth and Job Creation,” as part of the analytical work in Zimbabwe.
27 | P a g e
The report concretely suggests a three-pronged recovery and growth strategy
anchored on: Eco-tourism, which is a low-hanging fruit towards a green
economy; Special economic zones, which is a pillar of the whole recovery
strategy; and Agriculture, which is “the foundation”. On the strength of these
three, and on the back of greater macro-economic stability, the report forecasts
an annual growth rate of above four percent between 2019 and 2030.
On the question of financing the above three-pronged economic strategy, the
report suggests a model which is driven by trade aid and investment capital, as
opposed to official development assistance, which is harder to come by
anyway. This recommendation falls within Zimbabwe’s investment (both
domestic and FDI) and export promotion thrust. The report treats investing in
the development of infrastructure as a high priority, and suggests Zimbabwe
needs to mobilize “patient capital” for that. By “patient capital”, the report
figuratively refers to long-term infrastructural investment with a maturity of
10 years or more, much of which has tended to come from countries like China
and India. Already, these two countries are Zimbabwe’s development and
trading partners, and have been active in financing infrastructural projects,
including in the energy sector.
8.2 Zimbabwe’s Doing Business score and rankings improves slightly
According to the 2019 Doing Business report, about one-third (107 reforms)
of all business regulatory reforms were in the economies of Sub-Saharan
Africa, hence a record for the region. The Doing Business index measures
reforms in 11 areas which comprise of starting a business, dealing with
construction permits, getting electricity, registering property, getting credit,
protecting minority investors, paying taxes, trading across borders, enforcing
contracts, resolving insolvency, and labour market regulation.
Zimbabwe made a number of reforms which ended up improving the score
and the ranking in the last three reports (see Figure below). Zimbabwe is rated
among the 46 countries that implemented regulatory reforms that made it
easier to do business in three or more of the 10 topics included in the 2019
report’s aggregate ease of doing business score.
New Zealand tops the Doing Business rankings followed by Singapore,
Denmark, Hong Kong SAR, China, and Korea republic in the top five. From
the Sub-Saharan Africa region, Rwanda (ranking 29th) was the top reformer in
HIGHLIGHTS
Zimbabwe is rated among the 46 countries that implemented regulatory reforms that made it easier to do business in three or more of the 10 topics included in the 2019 report’s aggregate ease of doing business score.
28 | P a g e
the history of Doing Business and again a top reformer for 2019 Doing
Business edition, ahead of South Africa (ranked 82).
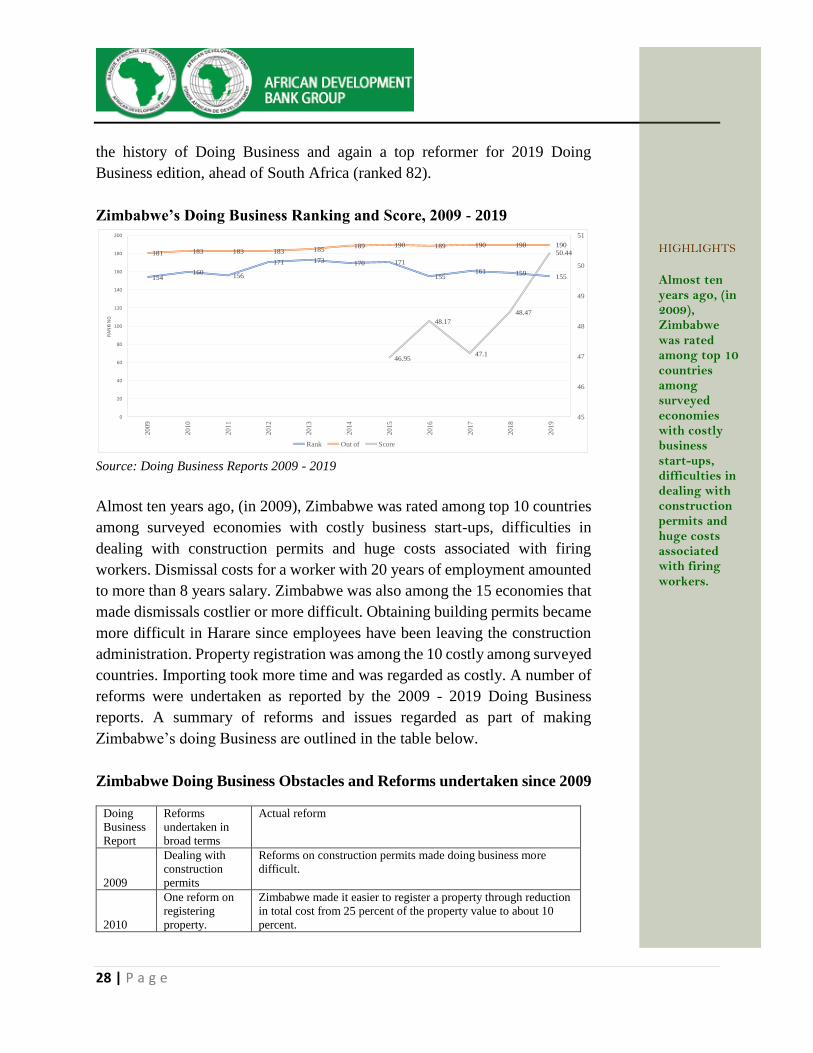
Zimbabwe’s Doing Business Ranking and Score, 2009 - 2019
154160
156
171 173 170 171
155161 159
155
181 183 183 183 185189 190 189 190 190 190
46.95
48.17
47.1
48.47
50.44
45
46
47
48
49
50
51
0
20
40
60
80
100
120
140
160
180
200
20
09
20
10
20
11
20
12
20
13
20
14
20
15
20
16
20
17
20
18
20
19
RA
NKI
NG
Rank Out of Score
Source: Doing Business Reports 2009 - 2019
Almost ten years ago, (in 2009), Zimbabwe was rated among top 10 countries
among surveyed economies with costly business start-ups, difficulties in
dealing with construction permits and huge costs associated with firing
workers. Dismissal costs for a worker with 20 years of employment amounted
to more than 8 years salary. Zimbabwe was also among the 15 economies that
made dismissals costlier or more difficult. Obtaining building permits became
more difficult in Harare since employees have been leaving the construction
administration. Property registration was among the 10 costly among surveyed
countries. Importing took more time and was regarded as costly. A number of
reforms were undertaken as reported by the 2009 - 2019 Doing Business
reports. A summary of reforms and issues regarded as part of making
Zimbabwe’s doing Business are outlined in the table below.
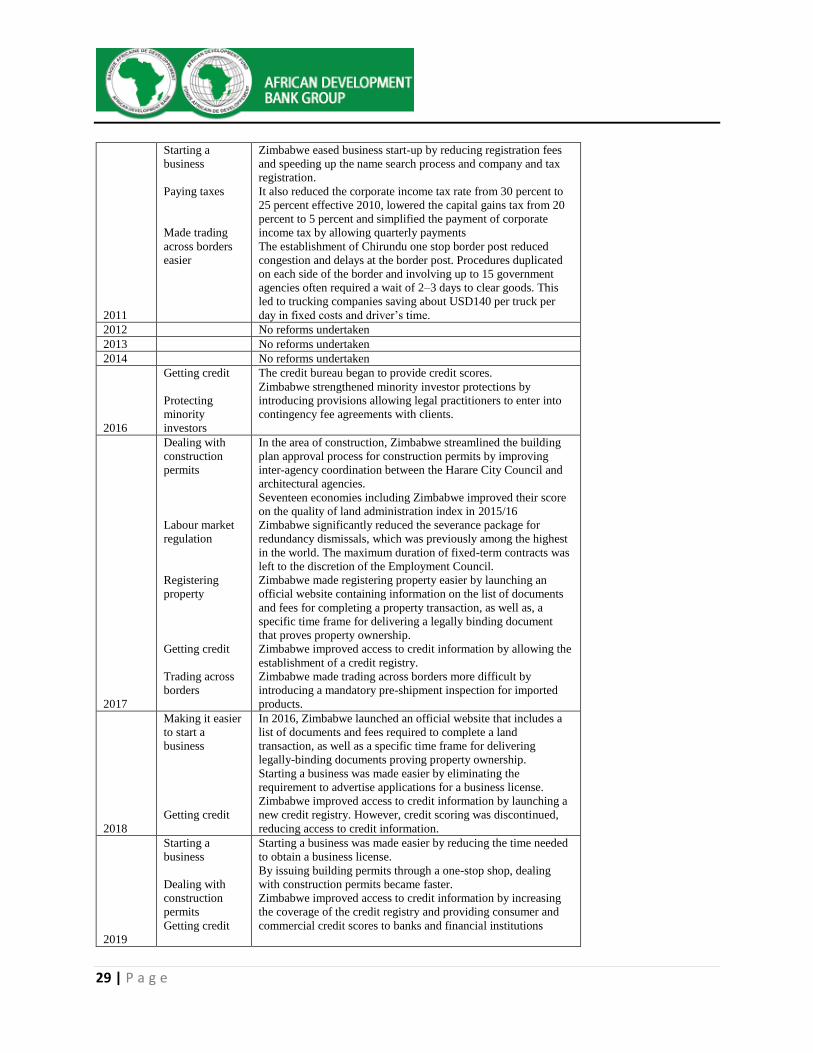
Zimbabwe Doing Business Obstacles and Reforms undertaken since 2009
Doing
Business
Report
Reforms
undertaken in
broad terms
Actual reform
2009
Dealing with
construction
permits
Reforms on construction permits made doing business more
difficult.
2010
One reform on
registering
property.
Zimbabwe made it easier to register a property through reduction
in total cost from 25 percent of the property value to about 10
percent.
HIGHLIGHTS
Almost ten years ago, (in 2009), Zimbabwe was rated among top 10 countries among surveyed economies with costly business start-ups, difficulties in dealing with construction permits and huge costs associated with firing workers.
29 | P a g e
2011
Starting a
business
Paying taxes
Made trading
across borders
easier
Zimbabwe eased business start-up by reducing registration fees
and speeding up the name search process and company and tax
registration.
It also reduced the corporate income tax rate from 30 percent to
25 percent effective 2010, lowered the capital gains tax from 20
percent to 5 percent and simplified the payment of corporate
income tax by allowing quarterly payments
The establishment of Chirundu one stop border post reduced
congestion and delays at the border post. Procedures duplicated
on each side of the border and involving up to 15 government
agencies often required a wait of 2–3 days to clear goods. This
led to trucking companies saving about USD140 per truck per
day in fixed costs and driver’s time.
2012 No reforms undertaken
2013 No reforms undertaken
2014 No reforms undertaken
2016
Getting credit
Protecting
minority
investors
The credit bureau began to provide credit scores.
Zimbabwe strengthened minority investor protections by
introducing provisions allowing legal practitioners to enter into
contingency fee agreements with clients.
2017
Dealing with
construction
permits
Labour market
regulation
Registering
property
Getting credit
Trading across
borders
In the area of construction, Zimbabwe streamlined the building
plan approval process for construction permits by improving
inter-agency coordination between the Harare City Council and
architectural agencies.
Seventeen economies including Zimbabwe improved their score
on the quality of land administration index in 2015/16
Zimbabwe significantly reduced the severance package for
redundancy dismissals, which was previously among the highest
in the world. The maximum duration of fixed-term contracts was
left to the discretion of the Employment Council.
Zimbabwe made registering property easier by launching an
official website containing information on the list of documents
and fees for completing a property transaction, as well as, a
specific time frame for delivering a legally binding document
that proves property ownership.
Zimbabwe improved access to credit information by allowing the
establishment of a credit registry.
Zimbabwe made trading across borders more difficult by
introducing a mandatory pre-shipment inspection for imported
products.
2018
Making it easier
to start a
business
Getting credit
In 2016, Zimbabwe launched an official website that includes a
list of documents and fees required to complete a land
transaction, as well as a specific time frame for delivering
legally-binding documents proving property ownership.
Starting a business was made easier by eliminating the
requirement to advertise applications for a business license.
Zimbabwe improved access to credit information by launching a
new credit registry. However, credit scoring was discontinued,
reducing access to credit information.
2019
Starting a
business
Dealing with
construction
permits
Getting credit
Starting a business was made easier by reducing the time needed
to obtain a business license.
By issuing building permits through a one-stop shop, dealing
with construction permits became faster.
Zimbabwe improved access to credit information by increasing
the coverage of the credit registry and providing consumer and
commercial credit scores to banks and financial institutions
30 | P a g e
Enforcing
contracts
Enforcing contracts were made easier by making judgments
rendered at the appellate and supreme court level in commercial
cases available to the general public online.
Source: Doing Business reports 2009 - 2019
8.3 Zimbabwe’s 2019 Budget Highlights
The 2019 National Budget Statement was presented to Parliament on 22
November 2018. Key highlights of the budget are presented as follows:
Economic outlook
The primary objective of the 2019 Budget is to stabilise the economy by
targeting the fiscal and current account twin deficits which have become
major sources of overall economic vulnerabilities including rising inflation,
sharp rise in indebtedness, accumulation of arrears and foreign currency
shortages.
Revision of economic growth projection for 2018 to 4 percent from 6.3
percent due to noticeable growth slowdown in the second half of the year
associated with foreign currency supply and allocation challenges, exchange
rate misalignment, inflationary pressures, and the rebasing of the economy.
Strong rebound in growth expected to reach above 7 percent from 2020.
Growth of the mining sector, one of the key drivers of the economy which
had an original growth projection of 6.1 percent for 2018, was revised to 25.8
percent in August 2018, and was revised further to about half of the August
projection (13 percent) in November 2018.
The recent re-basing of the economy resulted in a 40 percent jump in its size.
The 2019 Budget prioritises infrastructure rehabilitation and development
which ordinarily supports productive sectors. The target is to allocate 18.7
percent of the total budget to infrastructure development programmes
(excluding agriculture), up from 16.5 percent of the previous year. Given that
infrastructure is a key enabler to the economy, the 2019 priority projects have
been selected through further engagements with line Ministries, Public
Entities and stakeholders. The list also includes projects in the water and
sanitation, housing and energy sectors.
Some projects earmarked for development in 2019 include upgrading of
border posts. This entails adopting the latest technology in border
management, including e-enabled Integrated Border Efficiency Management
Systems (IBEMS) together with One Stop Border Post expansion
programmes. Priority is given to Beitbridge before cascading to the other
HIGHLIGHTS
The 2019 Budget is largely an economic stabilization and recovery policy masterpiece.
31 | P a g e
entry points such as Plumtree, Chirundu, Forbes, Nyamapanda, Victoria Falls
and Kazungula Border Posts. The upgrading and modernisation of Beitbridge
is underway, following the award of the contract to Zimborders Consortium.
Fiscal policy measures
The target is to collect total revenues amounting to USD6.6 billion for the 2019
fiscal year and this is expected to be driven by tax revenue amounting to
USD6.04 billion; non-tax revenues of USD162 million and other retentions
amounting to USD400 million. Revenue enhancing measures to be undertaken
include: revision of excise duty on cigarettes and fuel, payment of customs duty
and all other taxes on imported motor vehicles in foreign currency with effect
from 23 November 2018, save for imports of commercial motor vehicles and
vehicles for use by the physically challenged, and payment of taxes in the
currency of trade. Additional measures include liability for payment of tax debts
of voluntarily wound up companies and revision of deemed income provision on
satellite broadcasting services. The Minister also brought relief to tax payers
through revision of Personal Income tax brackets, exemptions on Intermediated
Money Transfer Tax, deferment of export tax on un-beneficiated platinum and
customs duty on sanitary wear and the taxing of third party insurance towards a
Road Accident Levy. The increase in tax free threshold from USD300 to
USD350 and further widening of tax bands which saw the highest marginal rate
being revised to 45 percent from 50 percent effective1 January 2019.This is a
positive development since it increases disposable income for income tax payers.
Total expenditure for the 2019 fiscal year is estimated at USD8.16 billion
resulting in a budget deficit of USD1.57 billion or 5 percent of GDP, down from
around 11.7 percent of GDP in 2018. Subsequently the budget deficit will be
reduced to 4.1 and 2.9 percent of GDP percent in 2020 and 2021 and below 1
percent by 2025, making the budget compliant with the SADC threshold of
below 3 percent of GDP. Furthermore, in order to contain costs the budget
outlines other cost cutting measures such as the discontinuation of quasi fiscal
operations; retrenchment of 3,188 youth officers by December 2018 and
retirement of civil servants above the age of 65 years as well as a 5 percent cut
on wages of senior government employees. Other measures include reviewing of
the 13th Cheque payment criteria from 2018 by limiting payment to basic salary,
rationalisation of Foreign Service Missions, by reducing them to 38 from 46
Embassies and Consulates by July 2019. The Minister also provided indications
of Government intentions to centralize public funds and execute penalties for
HIGHLIGHTS
The target is to collect total revenues amounting to USD6.6 billion for the 2019 fiscal year and this is expected to be driven by tax revenue amounting to USD6.04 billion; non-tax revenues of USD162 million and other retentions amounting to USD400 million.
32 | P a g e
financial misconduct by public officers in line with the Public Finance
Management Act. The Minister further restricted the issuance of Treasury bills
only for budget deficit financing and thus targeted to eliminate dependent on
overdraft facility with the Central bank to 5 percent.
Domestic and External Debt
Domestic and external debt stood at USD9.6 billion and USD7.7 billion,
respectively which translates to USD17.3 billion in total debt as at end of
September 2018, as per the Budget statement. Of the external debt, interest
arrears and penalties constituted about USD5.9 billion, which translates to about
76.6 percent of external debt. External debt is owed to bilateral and multilateral
creditors. Bilateral creditors constitute about 61.8 percent of external debt,
followed by multilateral creditors (World Bank, African Development Bank,
European Investment Bank and others) at 33.5 percent with the remainder as
Reserve Bank of Zimbabwe assumed debt. The bulk of the bilateral creditors’
debt (69 percent) is owed to the Paris club whereas the balance is for the non-
Paris club. Of the multilateral debt, the African Development Bank is owed about
USD687 million, whereas the European Investment Bank, the World Bank and
others are owed USD322 million, USD1.48 billion and USD72 million,
respectively. The bulk of domestic debt is in Treasury bills, issued for
recapitalization of public enterprises, settling Government obligations, Reserve
Bank of Zimbabwe debt assumption and Government overdraft with the Reserve
bank. The overdraft increased by 78.6 percent to USD2.5 billion by September
2018 from USD1.4 billion in December 2017. The implementation of reforms
under the Transitional Stabilisation Programme is expected to focus on arrears
clearance strategy and unlocking new concessionary financing.
Agriculture highlights
The Government allocated USD668.5 million towards the agricultural sector,
representing 8.1 percent of the national budget. Whilst this is marginally lower
than the Government’s commitment of 10 percent in the Malabo Declaration, it
is quite reasonable in view of the current fiscal position and the quest to contain
the fiscal deficit.
The focus of government efforts towards this sector are to increase productivity;
reduce fiscal expenditure on input and market support initiatives that it formally
implemented in the sector; and provide social security to vulnerable households.
This is in line with the provisions of the Transitional Stablisation Programme
HIGHLIGHTS
The Government allocated USD668.5 million towards the agricultural sector, representing 8.1 percent of the national budget. Whilst this is marginally lower than the Government’s commitment of 10 percent in the Malabo Declaration, it is quite reasonable in view of the current fiscal position and the quest to contain the fiscal deficit.
.
33 | P a g e
(October 2018 – December 2020). The decision to target its efforts was driven by
high default rates by beneficiaries to the various government programmes and the
high fiscal deficit caused by agricultural support thereby triggering
macroeconomic instability. Agricultural support for example more than doubled
from a planned annual target of USD404 million to USD1.1 billion as at August
2018. Agricultural productivity is low in most of the crops produced in Zimbabwe.
Seed for major crops such as maize, soya and wheat is adequately available to
meet national requirements while provisions have been made in the budget to close
the fertilizer gap through importations.
The budget further highlights Government’s commitment to compensate former
farm owners who lost their farms through the land reform programme. As much
as USD53 million has been allocated for this while more sustainable measures are
being explored. This is a welcome development which has potential to enhance
the country’s rating on the ease of doing business and convincing potential
investors that Zimbabwe is a potential destination for investment.
Government also proposed establishment of agricultural commodity exchange to
correct market distortions caused by its price support to farmers on maize, soya
bean and wheat among others.
Mining sector
Foreign currency earnings from mining was USD2.3 billion in the first nine
months of 2018, and are expected to reach USD2.9 billion by year end. In the same
vein, the Reserve Bank has reviewed upwards the retention thresholds of foreign
currency to 55 percent from the 30 percent, a positive development meant to boost
their productivity. The Government is finalising the mineral value addition and
beneficiation policy which is meant to improve smelting and refining of minerals
in Zimbabwe. The Government has once again postponed the tax on
unbeneficiated platinum with effect from 1 January 2019 and pushed it further to
January 2022 (see Table below). Under the new terms mining companies are
expected to set up a base metal refinery by December 2021 and a precious metal
refinery by December 2024. This is because Vision 2030 is anchored on
beneficiation and value addition of minerals.
The 2018 gold projection has been raised to 33 tonnes for 2018, against a previous
gold deliveries target of 30,000. The projection for 2019 is 35.31 tonnes, a 7
percent increase from the 2018 gold projection figure. On state enterprises and
HIGHLIGHTS
The Government is finalizing the mineral value addition and beneficiation policy which is meant to improve smelting and refining of minerals in Zimbabwe.
34 | P a g e
parastatals reform, 17 ZMDC subsidiary mines are targeted for partial
privatisation, joint Ventures,Partnerships and listings.
Proposed Taxes on unbeneficiated PGMs
Level of Beneficiation Export Tax (%)
PGM Concentrate 5
White Matte 2.5
PGM and Base Metal 1
Precious Metal Refinery 0
Zimplats, has shelved its USD131 million refurbishment of Selous Base Metals
Refinery to pave way for a national refinery which will have concentration,
smelting and base metal and precious metal refining capabilities, which will be
used by all miners. The Government offers support to this activity through fiscal
incentives to ensure that the refinery is set up within the proposed time frame.
African Chrome Fields invested over USD50 million in the alumino-thermic
chrome processing plant in Kwekwe, with capacity to produce high grade chrome
without using electricity. This is in response to the redistribution of claims
surrendered by ZIMASCO to Government.
It is expected that the national diamond policy will be launched before year end
to pave way for more investments into the sector. Government intends to
unbundle the Zimbabwe Consolidated Diamond Company (ZCDC) which started
operation in February 2016 following a move by Government to merge all the
diamond companies in Chidzwa; setup a Diamond Industrial Park in Mutare and
promote establishment of diamond cutting and polishing firms. This intended to
increase beneficiation and value addition of diamonds locally as opposed to the
current situation where only 10 percent is reserved for local cutting and polishing.
The amendments to the Mines and Minerals Act are being reviewed following
Cabinet’s recommendations. The amendments are meant to promote exploration
and mining by revoking unutilized claims being held for speculative purposes
and harmonise mining taxation laws, with the objective of guaranteeing viability
of mining companies. Automation of the Mining Cadastre Information System is
expected to continue in 2019.
HIGHLIGHTS
The amendments to the Mines and Minerals Act are being reviewed following Cabinet’s recommendations. The amendments are meant to promote exploration and mining by revoking unutilized claims being held for speculative purposes and harmonise mining taxation laws, with the objective of guaranteeing viability of mining companies.
35 | P a g e
Targeted mines for resuscitation in 2019 include Shabanie and Mashaba Mines
where preliminary report indicates that at least USD20 million is needed to restart
the two mines. Government, through the ZMDC has, therefore, started
reprocessing of asbestos ore dump with the objective of raising funds to reopen
Shabanie and Mashaba Mines. Other mines being resuscitated include the
Elvington Gold Mine, Chegutu, Jena Gold Mine and other ZMDC mines.
In order to address the issue of multiplicity of mining taxes, the Government
intends to develop a new mining fiscal regime, to determine the optimal taxation
for the sector. This is done in line with the Ease of Doing Business Reforms, since
the issue had been pending for over a decade. To enhance transparency in
management of natural resources, the Government is considering joining the
Extractive Industries Transparency Initiative (EITI). Zimbabwe’s neighboring
countries, Mozambique, Zambia and Malawi are already members. The initiative
is meant to enhance extractive industry value chain information disclosure, from
the point of extraction to revenue realisation. The Zimbabwe Mineral Revenue
Transparency Initiative (ZMRTI), local version of EITI which was set up in 2011
failed to take off.
Despite artisanal and small scale miners contributing more to gold deliveries to
Fidelity Printers and Refineries, the country’s gold buying agent, these miners
cause environmental degradation. Government intends to compel recipients of
loans from Mining Loan Fund availed through Fidelity Printers and Refineries to
rehabilitate the environment in 2019.
Financial sector
The financial sector is projected to grow by 0.9 percent down from the initial
projection of 1.3 percent made in the mid-term fiscal policy review due to lower
expected growth in 2019. However, the budget statement has proposed a number
of initiatives that will boost confidence in the sector and therefore promote the
growth in the sector. These initiatives include:
Financial sector regulatory authorities will strengthen macro-prudential and
risk based supervision in line with international practices.
The government will enact legislation that will enforce and guide the
compensation of policy holders who were prejudiced in the conversion from
the Zimbabwe dollar era into the multi-currency era.
Introduction of prudential supervision of medical aid societies and legal aid
societies by IPEC to protect the investing public.
HIGHLIGHTS
The financial sector is projected to grow by 0.9 percent down from the initial projection of 1.3 percent made in the mid-term fiscal policy review due to lower expected growth in 2019.
36 | P a g e
Introduction of the Policy Holder Protection Fund to protect clients in the
insurance and pension industry.
Introduction of reforms that will reduce the administration costs of parastatal-
related self-administered occupational pension funds.
Improving efficiency in the administration of industrial or sector specific
pension funds established through collective bargaining by introducing
competition in the administration of such pension funds.
The budget statement has also proposed to increase the prescribed asset thresholds
for insurance companies and this will boost revenue mobilisation for crucial
national projects. The review of licensing regime of credit-only micro-finance
institutions from one year to five years would promote investment into the sector
as it reduces costs and eases doing business in the subsector.
Other measures
Other measures announced in the 2019 Budget Statement include the following:
USD30 million allocated as seed money for the Industrial Development Fund as
Venture Capital to enable Industrial Development Corporation to undertake its
mandate; Exemption of export tax on raw hides with effect from 1 January 2019;
Introduction of additional routes for electronic cargo tracking; and penalty for
failure to pre-clear goods at the border.
9. CONCLUSION
The key issues that the GOZ should aim at addressing include:
o Restoration of macroeconomic stability;
o Addressing the debt arrears situation, particularly the scheduled clearance of arrears to
multilateral creditors;
o Measures to improve the investment climate, including restoration of property rights
through scaling up of the ease of doing business reforms.
The Bank Group is continuing its engagement with the Government and development
partners aimed at reaching a solution on Zimbabwe’s debt arrears clearance.
The opinions expressed and arguments employed herein do not necessarily reflect the offcial
views of the African Development Bank, its Boards of Directors, or the countries they represent.
This document, as well as any data and maps included, are without prejudice to the status of or
sovereignty over any territory, to the delimitation of international frontiers and boundaries, and
to the name of any territory, city, or area.
Questions on this publication should be addressed to Walter O. Odero, Principal Country
Economist for Zimbabwe – [email protected].
HIGHLIGHTS
The Bank Group is continuing its engagement with the Government and development partners aimed at reaching a solution on Zimbabwe’s debt arrears clearance.
Related Documents