Water Research 39 (2005) 5241–5249 Zero net growth in a membrane bioreactor with complete sludge retention G. Laera, A. Pollice , D. Saturno, C. Giordano, A. Lopez CNR IRSA, Via F. De Blasio 5, 70123 Bari, Italy Received 9 February 2005; received in revised form 10 October 2005; accepted 10 October 2005 Abstract A bench-scale membrane bioreactor was operated with complete sludge retention in order to evaluate biological processes and biomass characteristics over the long term. The investigation was carried out by feeding a bench-scale plant with real sewage under constant volumetric loading rate (VLR ¼ 1.2 gCOD L react 1 h 1 ). Biological processes were monitored by measuring substrate removal efficiencies and biomass-related parameters. The latter included bacterial activity as determined through respirometric tests specifically aimed at investigating long term heterotrophic and nitrifying activity. After about 180 days under the imposed operating conditions, the system reached equilibrium conditions with constant VSS concentration of 16–18 g L 1 , organic loading rate (OLR) below 0.1 gCOD gVSS 1 d 1 and specific respiration rates of 2–3 mgO 2 gVSS 1 h 1 . These conditions were maintained for more than 150 days, confirming that an equilibrium had been achieved between biomass growth, endogenous metabolism, and solubilization of inorganic materials. r 2005 Elsevier Ltd. All rights reserved. Keywords: Membrane bioreactors; Biomass activity; Complete sludge retention; Municipal wastewater 1. Introduction The main advantages of membrane bioreactors (MBR) with respect to traditional activated sludge systems were summarized as (i) longer sludge retention times (SRT) independent of the hydraulic retention time (HRT), (ii) smaller footprint, (iii) complete removal of solids and nearly complete removal of effluent micro- organisms, (iv) high removal ratios for most contami- nants, (v) reduced sludge production, and (vi) rapid start-up of biological processes (Stephenson et al., 2000; Visvanathan et al., 2000). All these aspects are currently under investigation, and a debate is still open on the most appropriate operating procedures to maximize treatment performance with respect to opera- tional costs. The latter mainly relate to membrane cleaning, sludge wastage, and aeration, and these are all affected by the operational concentration and features of the sludge within MBR. A possible strategy for operational cost limitation is reduction of sludge with- drawal, despite increased aeration costs (Yoon et al., 2004). Theoretical investigations have evidenced that bio- mass production can be limited in MBR by appropriate operational strategies (Lu et al., 2001; Xing et al., 2003). Some authors suggested that these systems could be operated at high sludge concentrations (15–25 gSS/L) by limiting biomass withdrawal, thus minimizing bacterial growth. The main drawbacks of this operating proce- dure were indicated as oxygen transfer limitations and ARTICLE IN PRESS www.elsevier.com/locate/watres 0043-1354/$ - see front matter r 2005 Elsevier Ltd. All rights reserved. doi:10.1016/j.watres.2005.10.010 Corresponding author. Tel.: +39 080 5020511; fax: +39 080 5313365. E-mail address: alfi[email protected] (A. Pollice).

Welcome message from author
This document is posted to help you gain knowledge. Please leave a comment to let me know what you think about it! Share it to your friends and learn new things together.
Transcript

ARTICLE IN PRESS
0043-1354/$ - se
doi:10.1016/j.w
�Correspondfax: +39080 53
E-mail addr
Water Research 39 (2005) 5241–5249
www.elsevier.com/locate/watres
Zero net growth in a membrane bioreactor withcomplete sludge retention
G. Laera, A. Pollice�, D. Saturno, C. Giordano, A. Lopez
CNR IRSA, Via F. De Blasio 5, 70123 Bari, Italy
Received 9 February 2005; received in revised form 10 October 2005; accepted 10 October 2005
Abstract
A bench-scale membrane bioreactor was operated with complete sludge retention in order to evaluate biological
processes and biomass characteristics over the long term. The investigation was carried out by feeding a bench-scale
plant with real sewage under constant volumetric loading rate (VLR ¼ 1.2 gCODLreact�1 h�1). Biological processes were
monitored by measuring substrate removal efficiencies and biomass-related parameters. The latter included bacterial
activity as determined through respirometric tests specifically aimed at investigating long term heterotrophic and
nitrifying activity. After about 180 days under the imposed operating conditions, the system reached equilibrium
conditions with constant VSS concentration of 16–18 gL�1, organic loading rate (OLR) below 0.1 gCODgVSS�1 d�1
and specific respiration rates of 2–3mgO2 gVSS�1 h�1. These conditions were maintained for more than 150 days,
confirming that an equilibrium had been achieved between biomass growth, endogenous metabolism, and solubilization
of inorganic materials.
r 2005 Elsevier Ltd. All rights reserved.
Keywords: Membrane bioreactors; Biomass activity; Complete sludge retention; Municipal wastewater
1. Introduction
The main advantages of membrane bioreactors
(MBR) with respect to traditional activated sludge
systems were summarized as (i) longer sludge retention
times (SRT) independent of the hydraulic retention time
(HRT), (ii) smaller footprint, (iii) complete removal of
solids and nearly complete removal of effluent micro-
organisms, (iv) high removal ratios for most contami-
nants, (v) reduced sludge production, and (vi)
rapid start-up of biological processes (Stephenson
et al., 2000; Visvanathan et al., 2000). All these aspects
are currently under investigation, and a debate is still
e front matter r 2005 Elsevier Ltd. All rights reserve
atres.2005.10.010
ing author. Tel.: +39080 5020511;
13365.
ess: [email protected] (A. Pollice).
open on the most appropriate operating procedures to
maximize treatment performance with respect to opera-
tional costs. The latter mainly relate to membrane
cleaning, sludge wastage, and aeration, and these are all
affected by the operational concentration and features
of the sludge within MBR. A possible strategy for
operational cost limitation is reduction of sludge with-
drawal, despite increased aeration costs (Yoon et al.,
2004).
Theoretical investigations have evidenced that bio-
mass production can be limited in MBR by appropriate
operational strategies (Lu et al., 2001; Xing et al., 2003).
Some authors suggested that these systems could be
operated at high sludge concentrations (15–25 gSS/L) by
limiting biomass withdrawal, thus minimizing bacterial
growth. The main drawbacks of this operating proce-
dure were indicated as oxygen transfer limitations and
d.

ARTICLE IN PRESSG. Laera et al. / Water Research 39 (2005) 5241–52495242
increased membrane fouling tendency (Muller et al.,
1995; Lubbeke et al., 1995; Cote et al., 1998; Rosenber-
ger et al., 2000).
Besides operational effects, long SRT were also
investigated for their effects on the biomass, both in
terms of accumulation rates and activity. Lower enzy-
matic activity, and smaller yield and decay coefficients
were reported for the higher sludge ages, suggesting
lower flexibility to xenobiotic compounds due to slower
biomass renovation (Chaize and Huyard, 1991; Huang
et al., 2001).
The possibility of operating MBR without
sludge withdrawal was explored by several researchers,
some of whom worked on relatively short timeframes
(Yamamoto et al., 1989; Benıtez et al., 1995;
Pollice et al., 2004). Others provided results of long-
term experimental tests mainly focused on removal
efficiencies and operational aspects (Chiemchaisri et al.,
1992; Muller et al., 1995; Wagner and Rosenwinkel,
2000; Rosenberger et al., 2002). All these authors
stated the biological applicability of complete sludge
retention, reporting high and stable degradation
rates and very limited sludge production or zero net
growth. However, equilibrium conditions are experi-
mentally difficult to reach in systems having high
or indefinite SRT, and most of these findings were
obtained under non-steady state conditions, with vari-
able loads and sometimes with synthetic wastewater.
Only few works were focused on biomass-related
aspects such as microbiology and bacterial activities,
and maintenance metabolism was often related to
complete sludge retention (Witzig et al., 2002; Wagner
and Rosenwinkel, 2000). Furthermore, starvation
was recently addressed as a means to maintain
the biomass in a state not allowing cell division, but
still able to participate in the degradation processes
to satisfy maintenance energy requirements (Lobos
et al., 2005). Finally, reported results are not always
consistent with respect to the accumulation of
organic inerts and inorganic material within the biomass
under complete sludge retention (Muller et al., 1995;
Lu et al., 2001; Rosenberger et al., 2002; Pollice
et al., 2004). These last two aspects of sludge biology
and fate of inorganics under equilibrium conditions are
especially relevant for long-term MBR practical applica-
tion and modelling.
Purpose of this experimental work was to verify that
in a MBR with complete sludge retention fed on real
municipal wastewater:
�
Long-term operation is achievable without decreaseof treatment performance,
�
processes can reach equilibrium conditions,�
accumulation of inorganics does not occur,�
biomass viability is maintained.2. Materials and methods
The bench-scale submerged MBR had 6L operating
volume, and a Zenon hollow fiber membrane module
having a surface of 0.047m2 was sunk in the reactor and
operated out-in. A scheme of the bench-scale experi-
mental plant was reported elsewhere (Pollice et al.,
2004).
The permeate was extracted by imposing on the
membrane a negative pressure that never exceeded
0.5 bar. Operational cycles lasted 6min and included
extraction of the permeate (5.5min) and backwash
(0.5min). An air pump provided a constant air flow
through the membrane module to limit fouling and cake
formation. A second air pump was regulated to
maintain residual dissolved oxygen (DO) concentrations
between 1 and 3mgL�1 to favour COD removal and
nitrification. The experimental plant was continuously
monitored for DO, temperature, pH, and transmem-
brane pressure (TMP).
Biological processes were operated by maintaining a
constant volumetric loading rate (VLR), defined as the
amount of COD daily fed per liter of reactor’s volume.
This was obtained by keeping a constant permeate flux
and influent concentration. The system was continu-
ously fed on pre-settled municipal wastewater screened
at 1mm, stored at 4 1C and stirred. The feed concentra-
tion was maintained within a constant range by diluting
the real sewage with tap water when needed.
The plant was started up without any biomass
inoculum, and during the whole experimental period
no sludge was intentionally removed from the reactor
except for measurements of suspended solids. Biomass
samples were withdrawn from the reactor once or twice
per week and analysed for total suspended solids (TSS)
and volatile suspended solids (VSS) according to
standard methods (Standard Methods, 1995). Very
limited amounts of sludge were lost during on-site
membrane cleaning and these were accounted for in the
evaluation of biomass growth and the other sludge-
related parameters. As a general rule of this investiga-
tion, biomass samples were always returned to the
reactor after non-destructive determinations. The lim-
ited amount of biomass that tended to stick to those
parts of the reactor close to the surface level was daily
removed and returned to the sludge bulk. Sludge
management practices during the experiment are sum-
marized in Table 1.
The volume of sludge removed and not returned to
the reactor was estimated to be about 35mL/week on
average, corresponding to 0.83 gTSS/week.
Average values of the biomass yield were calculated
over periods of 3 weeks by taking into account the
sludge losses. In these periods the yield was obtained by
adding the amount of biomass lost to the discrete
integration of the area below the growth curve, and

ARTICLE IN PRESS
Table 2
Operational parameters of the bench-scale complete retention
MBR
Parameter Unit Average Std.
Dev.
Min Max
Flux Lm�2 h�1 16.4 1.2 9.4 17.6
TMP mbar 154 106 15 500
DO mgO2L�1 2.4 1.1 0.4 7.5
Temperature 1C 20.9 4.5 12.1 29.6
pH 6.8 0.3 5.4 7.7
Table 1
Sludge extracted from the reactor during the experiment
Event Unit Amount Frequency Returned
to plant
TSS+VSS determination mL 20 Weekly No
Sludge characterizationa mL 250 Weekly Yes
Membrane cleaning g 1.8 —b No
Respirometry mL 300 Weekly Yes
aNon-destructive viscosity and filterability tests were regularly performed on sludge samples.bOn-site module rinsing was performed 7 times during the whole experimental period, with a frequency that depended on the
patterns of pressure growth (see following paragraph).
G. Laera et al. / Water Research 39 (2005) 5241–5249 5243
dividing by the cumulative COD removed in the same
period.
Respirometry was performed after aerating the sludge
samples overnight to obtain endogenous respiration
conditions. The respirometer adopted was a ‘‘static
gas–static liquid’’ system operated by measurement of
the liquid phase DO concentrations, and its description
was provided elsewhere (Spanjers et al., 1998; Pollice
et al., 2004).
The influent municipal wastewater was sampled three
times per week and analysed for TSS and VSS, total
COD, N-NH4, TKN, N-NO2, and N-NO3. The perme-
ate was sampled daily and analysed for the same
parameters. All analyses were performed according to
standard methods (Standard Methods, 1995). The ion
chromatographic method for the determination of
nitrate and nitrite was modified adopting an UV
detector (at 220 nm) instead of the conductivity detector.
3. Results
3.1. Plant performance
The bench-scale MBR was operated for 336 days with
a constant volumetric loading rate of 1.2 gCODLreact�1 d�1
and process performance, sludge accumulation, and
biomass features were monitored over time. The main
operational parameters are provided in Table 2, and the
average characteristics of the influent wastewater and the
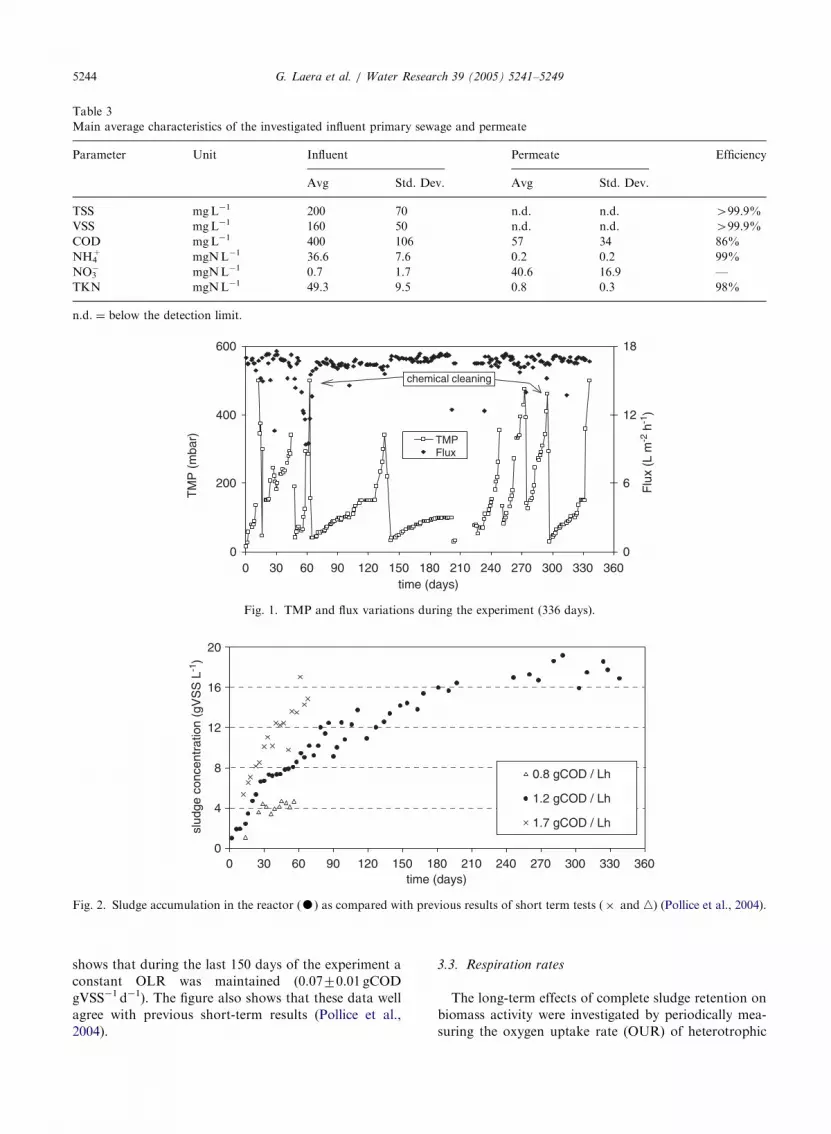
permeate are reported in Table 3.
The filtration performance of the membrane module is
described in Fig. 1, where the evolution over time of flux
and TMP are reported. The normal cleaning procedure
of the module was on-site jet rinsing of the fibers with
moderately pressurized tap water and was performed
when the TMP approached 500mbar. This procedure
was effective in restoring good permeability, and the
membrane was chemically cleaned only when the
positive effect of rinsing tended to last too short. This
happened just twice in 1 year of operation (days 63 and
296, Fig. 1), and a good efficiency of chemical cleaning
in restoring the membrane’s permeability was observed.
A sub-critical flux behaviour is also evidenced, with a
critical TMP value of 150mbar for this system that was
independent of the sludge concentration, and above
which the fouling rate rapidly increased. Similar patterns
were observed in other research works, although their
interpretation with respect to flux sustainability is still
debated (Ognier et al., 2001; Cho and Fane, 2002;
Guglielmi, 2002; Le Clech et al., 2003; Pollice et al.,
2005).
3.2. Biomass accumulation
Fig. 2 shows biomass accumulation in the reactor
under constant VLR, and compares these data with
previous results obtained in short-term tests (Pollice
et al., 2004). This comparison evidenced similar sludge
accumulation patterns for three different VLRs, with
higher initial growth rates for higher VLR. Moreover,
sludge accumulation was very limited during the last 150
days of operation and the system reached an equilibrium
sludge concentration of 17.371.1 gVSSL�1. The VSS/
TSS ratio was rather stable over the whole experimental
period, and an average value of 7572% was maintained
after the initial 50 days.
Further evidence that the equilibrium was reached in
the long-term was provided by the calculation of the
organic loading rate (OLR, gCODgVSS�1 d�1). Fig. 3
ARTICLE IN PRESS
0
200
400
600
0 30 60 90 120 150 180 210 240 270 300 330 360time (days)
TM
P (
mba
r)
0
6
12
18
Flu
x (L
m-2
h-1
)
TMPFlux
chemical cleaning
Fig. 1. TMP and flux variations during the experiment (336 days).
0
4
8
12
16
20
0 30 60 90 120 150 180 210 240 270 300 330 360time (days)
slud
ge c
once
ntra
tion
(gV
SS
L-1
)
0.8 gCOD / Lh
1.2 gCOD / Lh
1.7 gCOD / Lh
Fig. 2. Sludge accumulation in the reactor (K) as compared with previous results of short term tests (� and n) (Pollice et al., 2004).
Table 3
Main average characteristics of the investigated influent primary sewage and permeate
Parameter Unit Influent Permeate Efficiency
Avg Std. Dev. Avg Std. Dev.
TSS mgL�1 200 70 n.d. n.d. 499.9%
VSS mgL�1 160 50 n.d. n.d. 499.9%
COD mgL�1 400 106 57 34 86%
NH4+ mgNL�1 36.6 7.6 0.2 0.2 99%
NO3� mgNL�1 0.7 1.7 40.6 16.9 —
TKN mgNL�1 49.3 9.5 0.8 0.3 98%
n.d. ¼ below the detection limit.
G. Laera et al. / Water Research 39 (2005) 5241–52495244
shows that during the last 150 days of the experiment a
constant OLR was maintained (0.0770.01 gCOD
gVSS�1 d�1). The figure also shows that these data well
agree with previous short-term results (Pollice et al.,
2004).
3.3. Respiration rates
The long-term effects of complete sludge retention on
biomass activity were investigated by periodically mea-
suring the oxygen uptake rate (OUR) of heterotrophic

ARTICLE IN PRESS
0.0
0.1
0.2
0.3
0.4
0.5
0.6
0.7
0.8
0 30 60 90 120 150 180 210 240 270 300 330 360time (days)
OLR
(gC
OD
gV
SS
-1 d
-1)
0.8 gCOD / Lh
1.2 gCOD / Lh
1.7 gCOD / Lh
Fig. 3. Organic loading rate over time as compared with previous data from short-term tests (Pollice et al., 2004).
0
4
8
12
16
20
24
spec
ific
OU
R(m
g O
2 gV
SS
-1 h
-1)
Acetate
Endogenous
0
4
8
12
16
20
24
0 30 60 90 120 150 180 210 240 270 300 330 360time (days)
spec
ific
OU
R(m
g O
2 gV
SS
-1 h
-1)
AmmoniumNitrite
(a)
(b)
Fig. 4. Maximum specific respiration rates of heterotrophic (a) and autotrophic (b) populations.
G. Laera et al. / Water Research 39 (2005) 5241–5249 5245
and autotrophic populations with respirometric tests.
The two bacterial groups were examined by adopting
sodium acetate, sodium nitrite, and ammonium chloride
as synthetic substrates, and measuring the respiration
rates after dosing concentrations of these substrates in
excess with respect to the metabolic needs.
The specific maximum respiration rates with respect
to the VSS (i.e. specific OUR, mgO2 gVSS�1 h�1) are
reported in Fig. 4, where well known differences can be
observed in the behaviour of the two bacterial groups.
Autotrophic nitrifiers are slower than the heterotrophs
in reaching their maximum specific activity. However,
after about 100 days of operation the specific respiration
rates were not very different and both tended to decrease
in the longer term. Stability was reached after about 180
days of operation.
This tendency of the specific activity to decrease
towards a constant value was counterbalanced by the
corresponding increase of the microrganism concentra-
tion towards a constant value over the long term. The
combination of these two effects resulted in the
maintenance of the overall biomass activity, with
consequent constancy of the respiration rates (i.e.
OUR, mgO2 h�1) over the long term.
Endogenous and maximum OUR of both microbial
populations showed similar trends, i.e. after having
reached a maximum between 30 and 90 days of
operation they slowly declined towards an equilibrium
value between 20% and 50% of the maximum. During
the last 150 days of operation, the average endogenous
OUR was 1373mgO2 h�1, and the average maximum
respiration rates recorded for acetate, ammonium and

ARTICLE IN PRESSG. Laera et al. / Water Research 39 (2005) 5241–52495246
nitrite were 2279, 46717 and 673mgO2 h�1, respec-
tively.
An occasional drop of the autotrophic activity was
observed around day 260, when a higher effluent
ammonium concentration was also observed (4.0mgN-
NH4+L�1 against an average 0.2mgN-NH4
+L�1), sug-
gesting the occurrence of an inhibitor in the influent
wastewater. After this, the biomass promptly recovered
its previous activity.
4. Discussion
The experimental results reported above show that the
system had reached an equilibrium after about 180 days
of operation with negligible sludge withdrawal. This
equilibrium was maintained over the long term. Opera-
tion of the plant with complete sludge retention does not
allow for the definition of the system’s sludge age.
However, if the limited volumes of sludge sampled and
not returned to the reactor are taken into account, a
sludge age of about 1200 days can be estimated.
Sludge accumulation in the reactor showed the same
pattern observed in short-term tests (Pollice et al., 2004),
i.e. the initially high sludge growth rate strongly
decreased after about 30 days, and then slowly declined
resulting in stabilization of the average biomass
concentration during the last 150 days (Fig. 2). Also
other relevant process parameters such as the VSS/TSS
ratio, the OLR and the specific biomass activities
reached constant values in the same period (Figs. 3
and 4). This tendency of the OLR and the specific
activities towards constant (minimized) values and the
stabilization of the VSS and the VSS/TSS ratio suggest
that the system had reached and maintained equilibrium
conditions.
Fig. 3 also shows that in MBRs operated under
complete sludge retention the OLR evolves towards a
minimized value that is independent of the VLR. This
suggests that under equilibrium conditions the biomass
concentration is proportional to the volumetric loading
rate.
The absence of biomass net growth observed during
the final 150 days can be explained with the occurrence
of maintenance metabolism. Moreover, the stabilization
of the VSS and the specific activities means that no
accumulation of ‘‘inert’’ material occurred. This is
consistent with a recently proposed interpretation
stating that accumulation of inerts inversely depends
on the system’s SRT, and that they can be degraded by
slow growing bacteria (van Loosdrecht and Henze,
1999).
The MBR showed good removal efficiencies of
suspended solids, COD, ammonia and total nitrogen
(Table 3). These performances suggested that the
biomass viability was maintained over a long period.
Respirometric tests also confirmed the persistence of
biomass viability and no tendency towards the miner-
alization of biosolids, even over long timeframes.
During the last 150 days of operation the OUR values
were below their maximum values, but respiration rates
ranging between 20% and 50% of the maximum were
maintained until the end of the experiment. Moreover,
an occasional drop of the autotrophic activity was
promptly recovered and the OUR values measured
before the inhibition were immediately restored, show-
ing good flexibility of the biomass towards possible
changes occurring in the influent.
In order to estimate biomass growth and decay rates
over the long term, the active fraction needs to be
quantified. Available literature data on this ‘‘classical’’
issue of biological wastewater treatments are extremely
limited and case-specific, and mostly refer to conven-
tional-activated sludge. MBRs were reported to have an
active fraction between 4% and 7% with respect to the
VSS in systems with SRT around 35–50 days (Guglielmi,
2002). This fraction refers to steady state conditions, and
its application to complete retention MBR has to take
into account the evolution over time of the biomass (and
of the active fraction). In the present study, constant
OLR, VSS, and endogenous respiration rate after 180
days of operation suggested that the concentration of
active biomass was approximately constant. Exact
determination of this fraction would have required
sludge sampling that, at the experimental scale adopted,
was not compatible with the assumption of complete
sludge retention.
However, some indications on the growth and decay
of the biomass can also be obtained without information
on the active fraction. Biomass build-up in biological
systems is commonly represented by the Monod model
where a decay term is introduced (Henze et al., 1987):
dX
dt¼ mX � bX ¼ mmax
S
kS þ SX � bX ,
where X is the active fraction of the biomass, m is the
growth rate, b the decay rate, S the substrate concentra-
tion, kS the half-saturation constant.
According to this model, absence of biomass growth
can be expresses as follows:
dX
dt¼ 0) m ¼ b3
mb¼ 1.
Oxygen consumption during biological processes
depends on the utilization external substrate and the
endogenous biomass decay. The OUR can be defined
accordingly, by separately considering these two con-
tributions
OUR ¼ OURext þOURend ¼ m1� Y 0
Y 0
� �X þ bX ,

ARTICLE IN PRESSG. Laera et al. / Water Research 39 (2005) 5241–5249 5247
where Y 0 is the yield of substrate utilization for biomass
production.
The maximum OUR is obtained for maximum growth
rate (i.e. when SbkS) and can be expressed as follows:
OURmax ¼ mmax
1� Y 0
Y 0
� �X þ bX .
When all the available external substrate has been
consumed, the OUR is represented by the decay term bX
(i.e. the oxygen requirement for endogenous respiration)
OURend ¼ bX .
The ratio between OURmax and OURend leads to the
following expression:
OURmax
OURend� 1
� �Y 0
1� Y 0
� �¼
mmax
b
According to this expression, the ratio between mmax and
b is independent of the active fraction X . Therefore,
when OURmax and OURend have comparable values, the
maximum growth is similar to the biomass decay.
The experimental ratio OURmax/OURend at the
equilibrium was calculated to be 1.770.3. The adoption
of a standard yield value of 0.67mgCODbiommgCODsub�1
(Henze et al., 1987) resulted in mmax/b ¼ 1.570.6. Since
the actual growth rate m is smaller than the mmax, it could
be assumed that the ratio m=b approaches one. The
above considerations explain the absence of net biomass
growth experimentally observed and confirm previous
model predictions (Wintgens et al., 2003).
The plot of the observed sludge yield as a function of
the OLR over the whole experimental period evidenced
a tendency of the yield to decrease for decreasing OLRs
(Fig. 5). The experimental data showed that minimized
OLR resulted in extremely limited yields, and that zero
biomass yield could be reached, as previously observed
under non-steady state conditions (van Houten and
Eikelboom, 1997; Rosenberger et al., 2002). Although
extremely low values of OLR are likely to take very long
0.00
0.01
0.02
0.03
0.04
0.05
0.06
0.07
0.08
0.00 0.02 0.04 0.06 0
OLR (gCOD
slud
ge y
ield
(gV
SS
gC
OD
-1)
Fig. 5. Observed sludge yield
time to be reached, negligible yield can already be
assumed for the operational loading rates around
0.07 gCODgVSS�1 d�1 experimentally maintained, also
taking into account the limited sludge losses occurred
during the experiment.
Absence of sludge accumulation means zero net
biomass growth and also no accumulation of inorganic
material. The amount of inorganics accumulated in the
reactor, determined as the difference between the TSS
and the VSS in the sludge, was compared with the
cumulative inorganic material in the influent wastewater
(Fig. 6). The ratio between these two non-volatile
fractions was found to be rather constant (about 30%)
for the initial 100 days, in accordance with previous
findings on conventional activated sludge and non-
steady state MBR (Wentzel et al., 2002; Wagner and
Rosenwinkel, 2000). Then the accumulation rate was
observed to decrease, and finally resulted in a constant
concentration of inorganics in the reactor over the long
term. Also in this case, as for the other process
parameters, the accumulation of inorganic material
ceased after about 180 days, confirming that the studied
system had reached equilibrium conditions.
Constancy of the VSS/TSS ratio together with zero
net growth provides an experimental evidence of
previously proposed theories predicting the absence of
excess sludge production under sufficiently long sludge
retention times (Xing et al., 2003). No discernible
accumulation of inorganics was already suggested only
based on the observation of constant VSS/TSS ratio,
although never experimentally demonstrated under
steady state conditions (Muller et al., 1995).
At the end of the experiment, the reactor was emptied
to check for possible localized accumulation of solids
due to mixing problems. None of such deposits was
observed, confirming that the system was completely
stirred and that the constant concentration of inorganics
was not caused by ‘‘hidden’’ materials as in previous
experiments (Rosenberger et al., 2002). Therefore, when
.08 0.10 0.12 0.14 0.16
gVSS-1 d-1)
vs. organic loading rate.

ARTICLE IN PRESS
0
30
60
90
120
150
180
210
240
270
0 30 60 90 120 150 180 210 240 270 300 330 360time (days)
influ
ent i
norg
anic
s (g
)
0
9
18
27
36
45
54
63
72
81
slud
ge in
orga
nics
(g)
cumulative influent inorganics
sludge inorganics
Fig. 6. Inorganic fractions in the influent wastewater and accumulated in the reactor.
G. Laera et al. / Water Research 39 (2005) 5241–52495248
high sludge concentrations were maintained, the results
showed a limit value above which no accumulation of
inorganic materials occurred in the reactor. This
observation can be explained by considering that at
sludge concentrations above 15 gVSSL�1 the influent
wastewater contributes for about 5–10% to the total
amount of inorganics in the reactor, and this fraction
could be involved in processes leading to solubilization.
5. Conclusions
Long-term experiments with a complete retention
MBR fed on real sewage at constant volumeric loading
rate showed that equilibrium conditions were reached
after about 180 days of operation and maintained
for more than 150 days. Equilibrium was characterized
by constancy of three key process parameters, i.e.
biomass (VSS) and inorganic material concentrations
and the specific bacterial activity. As a consequence,
the organic loading rate reached values around
0.07 gCODgVSS�1 d�1 in the long term, resulting in
sludge yield values close to zero. This was confirmed by
the results of the activity tests, that showed comparable
values for growth and decay rates (mmax/b ¼ 1.570.6).
No accumulation of inorganic material within the
reactor was observed once the equilibrium was reached.
Complete nitrification and good COD removal
efficiencies were maintained over the whole experimental
period. Moreover, adopting a typical flux and a simple
membrane-cleaning procedure, the initial biomass
growth and long-term operations at high sludge
concentrations caused no significant variations of
membrane permeability and cleaning needs.
The experimental work showed the feasibility of
operating MBR with complete sludge retention (or with
SRT41000 d) from the standpoint of biological pro-
cesses. Moreover, the reported data show that the
biomass evolves towards a minimized maintenance
OLR, resulting in proportionality between the VLR
and the equilibrium biomass concentration. When
designing new plants, this feature allows for defining
the biomass concentration based on the VLR.
Larger scale studies are needed to evaluate all cost-
related issues, including aeration, membrane cleaning
and sludge treatability.
References
Benıtez, J., Rodrıguez, A., Malaver, R., 1995. Stabilization and
dewatering of wastewater using hollow fiber membranes.
Water Res. 29 (10), 2281–2286.
Chaize, S., Huyard, A., 1991. Membrane bioreactor on domestic
wastewater treatment. Sludge production and modeling
approach. Water Sci. Technol. 23 (Kyoto), 1591–1600.
Chiemchaisri, C., Wong, Y.K., Urase, T., Yamamoto, K., 1992.
Organic stabilization and nitrogen removal in membrane
separation bioreactor for domestic wastewater treatment.
Water Sci. Technol. 25 (10), 231–240.
Cho, B.D., Fane, A.G., 2002. Fouling transients in nominally
sub-critical flux operation of a membrane bioreactor.
J. Membr. Sci. 209, 391–403.
Cote, P., Buisson, H., Praderie, M., 1998. Immersed mem-
branes activated sludge process applied to the treatment of
municipal wastewater. Water Sci. Technol. 38 (4–5),
437–442.
Guglielmi, G., 2002. Membrane bioreactors for municipal
wastewater treatment. Ph.D. Thesis, Universita’ di Trento,
Italy.
Henze, M., Grady Jr., C.P.L., Gujer, W., Marais, G.V.R.,
Matsuo, T., 1987. Activated sludge model no. 1. IAWPRC
Task Group on Mathematical Modelling for Design and
Operation of Biological Wastewater Treatment. IAWPRC
scientific and technical reports no. 1. IAWQ, London UK.
Huang, X., Gui, P., Qian, Y., 2001. Effect of sludge retention
time on microbial behaviour in a submerged membrane
bioreactor. Proc. Biochem. 36 (10), 1001–1006.

ARTICLE IN PRESSG. Laera et al. / Water Research 39 (2005) 5241–5249 5249
Le Clech, P., Jefferson, B., Chang, I.S., Judd, S., 2003. Critical
flux determination by the flux-step method in a submerged
membrane bioreactor. J. Membr. Sci. 227, 81–93.
Lobos, J., Wisniewski, C., Heran, M., Gramsick, A., 2005.
Effects of starvation conditions on biomass behaviour for
minimization of sludge production in membrane bioreac-
tors. Water Sci. Technol. 51 (6–7), 35–44.
Lu, S.G., Imai, T., Ukita, M., Sekine, M., Higuchi, T.,
Fugakawa, M., 2001. A model for membrane bioreactor
process based on the concept of formation and degradation
of soluble microbial products. Water Res. 35 (8),
2038–2048.
Lubbeke, S., Vogelpohl, A., Dewjanin, W., 1995. Wastewater
treatment in a biological high-performance system with high
biomass concentration. Water Res. 29 (3), 793–802.
Muller, E.B., Stouthamer, A.H., van Verseveld, H.W., Eikel-
boom, D.H., 1995. Aerobic domestic waste water treatment
in a pilot plant with complete sludge retention by cross-flow
filtration. Water Res. 29 (4), 1179–1189.
Ognier, S., Wisniewski, C., Grasmick, A., 2001. Biofouling in
MBRs: phenomenon analysis and modeling. Proceedings of
MBR3 Third International Meeting on Membrane Bior-
eactors for Wastewater Treatment, Cranfield University,
16th May 2001, Cranfield, UK.
Pollice, A., Laera, G., Blonda, M., 2004. Biomass growth and
activity in a membrane bioreactor with complete sludge
retention. Water Res. 38 (7), 1799–1808.
Pollice, A., Brookes, A., Jefferson, B., Judd, S., 2005. Sub-
critical flux fouling in membrane bioreactors—a review of
recent literature. Desalination 174 (3), 221–230.
Rosenberger, S., Witzig, R., Manz, W., Szewzyk, U., Kraume,
M., 2000. Operation of different membrane bioreactors:
experimental results and physiological state of the micro-
organisms. Water Sci. Technol. 41 (10–11), 269–277.
Rosenberger, S., Kruger, U., Witzig, R., Manz, W., Szewzyk,
U., Kraume, M., 2002. Performance of a bioreactor with
submerged membranes for aerobic treatment of municipal
waste water. Water Res. 36 (2), 413–420.
Spanjers, H., Vanrolleghem, P.A., Olsson, G., Dold, P.L., 1998.
Respirometry in control of the activated sludge process:
principles. IAWQ Scientific and Technical Report no. 7,
IAWQ Publishing, London, UK.
Standard Methods, 1995. Standard Methods for the Examina-
tion of Water and Wastewater, 19th ed. American Public
Health Association/American Water Works Association/
Water Environment Federation, Washington DC.
Stephenson, T., Judd, S., Jefferson, B., Brindle, K., 2000.
Membrane Bioreactors for Wastewater Treatment. IWA
Publishing, London, UK.
van Houten, R.T., Eikelboom, D.H., 1997. High performance
membrane bioreactors: a physiological approach. Proceed-
ings of MBR1–First International Meeting on Membrane
Bioreactors for Wastewater Treatment. Cranfield Univer-
sity, 5th March 1997, Cranfield, UK.
van Loosdrecht, M., Henze, M., 1999. Maintenance, endogen-
ous respiration, lysis, decay and predation. Water Sci.
Technol. 39 (1), 107–117.
Visvanathan, C., Ben Aim, R., Parmeshwaran, K., 2000.
Membrane separation bioreactors for wastewater treatment.
Crit. Rev. Environ. Sci. Technol. 30 (1), 1–48.
Wagner, J., Rosenwinkel, K.-H., 2000. Sludge production in
membrane bioreactors under different conditions. Water
Sci. Technol. 41 (10–11), 251–258.
Wentzel, M.C., Ubisi, M.F., Lakay, M.T., Ekama, G.A., 2002.
Incorporation of inorganic material in anoxic/aerobic
activated sludge system mixed liquor. Water Res. 36 (20),
5074–5082.
Wintgens, T., Rosen, J., Melin, T., Brepols, C., Drensla, K.,
Engelhardt, N., 2003. Modelling of a membrane bioreactor
for municipal wastewater treatment. J. Membr. Sci. 216,
55–65.
Witzig, R., Manz, W., Rosenberger, S., Kruger, U., Kraume,
M., Szewzyk, U., 2002. Microbiological aspects of a
bioreactor with submerged membranes for aerobic treat-
ment of municipal wastewater. Water Res. 36 (2), 394–402.
Xing, C.-H., Wu, W.-Z., Quian, Y., Tardieu, E., 2003. Excess
sludge production in membrane bioreactors: a theoretical
investigation. J. Environ. Eng. ASCE 129 (4), 291–297.
Yamamoto, K., Hiasa, M., Mahmood, T., Matsuo, T., 1989.
Direct solid–liquid separation using hollow fiber membrane
in an activated sludge aeration tank. Water Sci. Technol. 21
(Brighton), 43–54.
Yoon, T.I., Lee, H.S., Kim, C.G., 2004. Comparison of
pilot scale performances between membrane bioreactor
and hybrid conventional wastewater treatment system.
J. Membr. Sci. 242, 5–12.
Related Documents


