Zero-budget Network Dimensioning Wenli Liu, Youssef Iraqi and Raouf Boutaba School of Computer Science University of Waterloo 200 University Ave. W. Waterloo, ON, Canada {w7liu, iraqi, rboutaba}@bbcr.uwaterloo.ca Abstract Traffic engineering has been widely used to improve network performance while keeping the resource utilization balanced. The existing traffic engineering approaches, however, lead to network upgrades from time to time. While these upgrades might be successfully financed during economic prosperities, it poses a problem when the economic situation deteriorates. We propose in this paper a novel approach that is able to reveal whether a traffic re-engineering is necessary. In case budget is not available for upgrades, this approach can optimally decide which demand to satisfy so as to maximize network op- erators’ revenue. We demonstrate the usefulness and the effectiveness of the approach by conducting traffic engineering on an example network and by describing some of its added values as well. Keywords Traffic Engineering, Performance Optimization, Resource Allocation, Metrics, Metrics Tree 1. Introduction While the Internet evolves into a pervasive global network, mission-critical applications are increasingly deployed on it. How to ensure the Internet’s reliability and improve its performance has been the focus of the industry and research community ever since. Traf- fic engineering, as one of the most commonly used and the most effective methodologies employed by ISPs to increase the reliability and the performance of their networks, han- dles the routing of traffic through a network in such a manner that over-utilization of some network elements is minimized when some elements is under-utilized. In essence, traffic engineering focuses on satisfying all the demand and network upgrades have to be car- ried out occasionally. These upgrades, when required during the economic prosperities, like the late 1990’s and the year 2000, are feasible since the telecommunications service providers once spent billions of dollars in upgrading their networks during the period. For example, about 55 billions were spent in US alone as telecommunications related ven- ture capital in 1999 and more than 100 billion in 2000 [4]. However, the ”bubble” has truly burst. While 2002 saw the decline of 47% in venture capital investment, a slightly over 18 billion was invested in 2003. So far in 2004, only 10 billion was invested in the telecommunication industry. In addition, more than 600,000 productive and rewarding 0-7803-9087-3/05/$20.00 ©2005 IEEE

Welcome message from author
This document is posted to help you gain knowledge. Please leave a comment to let me know what you think about it! Share it to your friends and learn new things together.
Transcript

Zero-budget Network Dimensioning
Wenli Liu, Youssef Iraqi and Raouf BoutabaSchool of Computer ScienceUniversity of Waterloo200 University Ave. W.Waterloo, ON, Canada{w7liu, iraqi, rboutaba}@bbcr.uwaterloo.ca
AbstractTraffic engineering has been widely used to improve network performance while keepingthe resource utilization balanced. The existing traffic engineering approaches, however,lead to network upgrades from time to time. While these upgrades might be successfullyfinanced during economic prosperities, it poses a problem when the economic situationdeteriorates. We propose in this paper a novel approach that is able to reveal whethera traffic re-engineering is necessary. In case budget is not available for upgrades, thisapproach can optimally decide which demand to satisfy so as to maximize network op-erators’ revenue. We demonstrate the usefulness and the effectiveness of the approachby conducting traffic engineering on an example network and by describing some of itsadded values as well.
KeywordsTraffic Engineering, Performance Optimization, Resource Allocation, Metrics, MetricsTree
1. Introduction
While the Internet evolves into a pervasive global network, mission-critical applicationsare increasingly deployed on it. How to ensure the Internet’s reliability and improve itsperformance has been the focus of the industry and research community ever since. Traf-fic engineering, as one of the most commonly used and the most effective methodologiesemployed by ISPs to increase the reliability and the performance of their networks, han-dles the routing of traffic through a network in such a manner that over-utilization of somenetwork elements is minimized when some elements is under-utilized. In essence, trafficengineering focuses on satisfying all the demand and network upgrades have to be car-ried out occasionally. These upgrades, when required during the economic prosperities,like the late 1990’s and the year 2000, are feasible since the telecommunications serviceproviders once spent billions of dollars in upgrading their networks during the period. Forexample, about 55 billions were spent in US alone as telecommunications related ven-ture capital in 1999 and more than 100 billion in 2000 [4]. However, the ”bubble” hastruly burst. While 2002 saw the decline of 47% in venture capital investment, a slightlyover 18 billion was invested in 2003. So far in 2004, only 10 billion was invested in thetelecommunication industry. In addition, more than 600,000 productive and rewarding
0-7803-9087-3/05/$20.00 ©2005 IEEE

jobs from the telecommunications sector were cut in the last few years and the trends arestill persisting [5]. Facing such severe economical situations, the telecommunications ser-vice providers are unable to resort any congestion problems to simply network upgrades.In this respect, existing traffic engineering approaches appear rather limited.
We propose in this paper a novel approach that differentiates demands for the sup-ported services and weights customers according to their profitability. When the networkperformance degrades and no budget is available for upgrade, this approach is able to op-timally decide what percentage of a demand to satisfy to maximize revenue and how togenerate an optimal path for each of the satisfied demands at the same time. Due to thefact that portions of demands are dropped out, networks become less congested and thecustomer perceived performance can be improved consequently. In addition, the proposedapproach incorporates for the first time the metrics tree model [11] into traffic engineer-ing. The metrics tree model correlates measures from the network level, service level,customer level and business level into a coherent system that can effectively reveal thetime for a traffic re-engineering and the effects of the traffic re-engineering.
The rest of the paper is organized as follows: section 2 presents some common ap-proaches taken in traffic engineering and briefly describes the metrics tree model. Theapproach proposed in this paper is illustrated in section 3. We address the scalability issueassociated with the approach in section 4. Some added values of the proposed approachare illustrated subsequently in section 5. We conclude this paper with a brief summariza-tion in section 6.
2. Related Works
As one of the most effective and commonly used methodologies, traffic engineering hasdrawn much attention ever since. Approaches such as OSPF [3], equal cost multi path[2], constraint-based routing [1], DORA [8], etc., are brought up one by one. The over-lay model [1] [9], however, is the most related approach to this paper. Within the over-lay model, explicit paths between edge nodes are established, either through off-line oron-line procedures, for demands between these nodes, i.e., the traffic matrix. By care-fully mapping these explicit paths to the underlying physical links, the network serviceproviders can balance traffic distribution throughout the network, thus minimizing thepossibilities for hot spots. In [9], a network is abstracted as a graph G = (V,E) whereinV represents the set of nodes and E the set of links. For each link (i, j) ∈ E, cij indicatesthe link’s capacity. [9] models the demands between edge nodes as a set K and for eachdemand k = (dk, sk, tk) ∈ K, dk, sk and tk represent the required bandwidth, the sourcenode and the destination node respectively. In addition, Xk
ij represents the percentage ofk’s bandwidth demand that can be provided by link (i, j) and α is the maximum linkutilization in the network. The establishment of the explicit paths and the mapping ofthese paths to the physical links are then formulated as a linear programming problem asfollows.
324 Session Seven Dimensioning and Provisioning

min(α) (1)
s.t.∑j:(i,j)∈E
Xkij −
∑m:(m,i)∈E
Xkmi = 0 ∀k ∈ K, i �= sk, tk (2)
∑j:(i,j)∈E
Xkij −
∑m:(m,i)∈E
Xkmi = 1 ∀k ∈ K, i = sk (3)
∑k∈K
dkXkij ≤ cijα ∀(i, j) ∈ E (4)
0 ≤ Xkij ≤ 1, α ≥ 0 (5)
While the objective function (1) intends to minimize the maximum link utilizationover the entire network, equation (2) requires that traffic flowing into and out of anyintermediate node has to equal to each other for any demand and equation (3) specifiesthat traffic flowing out of a source node has to equal to 1 for any demand that originatesfrom the source node. The fact that all the traffic passing through a link should not exceedsthe link’s maximum utilization is captured in equation (4). The range of Xk
ij and α arespecified in equation (5). The optimization result, namely α and Xk
ij , will reveal whetherupgrades are necessary and the mapping of demands to the physical links. If α has a valuethat exceeds a pre-specified utilization threshold, some upgrades are either mandatory inorder to satisfy all the demands or necessary to bring the utilization level lower than thethreshold. As mentioned before, the overlay approach, as well as its variants ([12], [7],[10]), does not tell how to optimally sacrifice some demands when α has a high value andthere is no budget available for network upgrades.
Another related work is the metrics tree model [11], which correlates technology andnetwork layer metrics all the way up through service layer and customer layer metricswith business layer metrics. As metrics are organized and aggregated layer by layer in abottom-up fashion, a pyramid of metrics is created. The model, once being instantiatedupon a network, can generate a metrics tree for the network. Figure 1 depicts the model onthe left and a tree on the right. The value of the root metric of the tree, which is located inthe business layer such as estimated churn rate in this paper, can then be computed fromthe tree leaves once the values of the leaf metrics are available. The leaf metrics are mostlylocated at the technology layer and the network layer, such as ATM cell loss ratio, Ethernetframe rate, IP one-way delay, and end-to-end error ratio, etc., and the values of these leafmetrics can be measured using the off-the-shelf tools such as Surveyor and Pinger, or canbe retrieved from the MIBs that are already present in the network. Due to the space limit,readers are referred to [11] for more detailed information on how metrics from differentlayers are correlated with each other and how the values of a tree is computed.
325Zero-budget Network Dimensioning

u1 Satisfaction u2 Satisfaction
s3 s2 s1 s1 s3
f3 f20
f1
f52 f4T DA
Ethernet ATM ATM Ethernet
IP IP IP
…………
Estimated Churn Rate
Technology Layer
Network Layer
Service Layer
Customer Layer
BusinessLayer
u1: User 1
u2: User 2
s1: Service 1
s2: Service 2
s3: Service 3
f1: Demand 1
f20: Demand 20
f3: Demand 3
f4: Demand 4
f52: Demand 52
T: Throughput
A: Availability
D: Delay
Figure 1: The Metrics Tree Model
3. The Approach
3.1 Overview
Figure 2 depicts an overview of the proposed approach. Lying at the center is the metricstree model, which accepts inputs from the statistics acquisition component and decideswhether a network dimensioning is necessary. Another vital component is the the net-work dimensioning component, which is named according to [7] and is responsible forcomputing the optimal mapping of end-to-end connections to the physical links based onthe traffic matrix and the capacity of each physical link. The optimal mapping will be sub-sequently validated in a simulated environment and necessary statistics will be acquiredaccordingly. These will be taken care of by the the network simulation component. Thecontrol component dynamically manages the resources and the routes inside the networkin a way that the accepted optimal mapping can be enforced onto the network automat-ically, such as in a MPLS enabled network. The last but not the least is the statisticsacquisition component, which deploys necessary monitoring facilities in the network, ef-ficiently and economically gleaning performance data in the format of the well-definedmetrics.
The detailed data flow chart of the proposed approach is illustrated in Figure 3. Af-ter the performance data are acquired from the network, along with the topology of thenetwork, the metrics tree model is instantiated and a metrics tree is created. The tree iscomputed subsequently using the acquired data. From the values of the metrics tree, therevenue expected by the network operator can then be estimated base on the customerperceived performance. When the expected revenue is acceptable, a network dimension-ing is not necessary. Then no control is taken and the data flow can return to the begin-ning. When the expected revenue is not acceptable, an optimal mapping will be computedthrough network dimensioning and the mapping is then validated in a simulated envi-ronment. The simulation results are subsequently plugged into the metrics tree and theexpected revenue is re-computed. If the expected revenue is still not acceptable, the al-lowed maximum link utilization can be lowered and the network is dimensioned again.
326 Session Seven Dimensioning and Provisioning

This cyclic process is repeated until an acceptable revenue is computed. Afterwards, themapping from the last network dimensioning is enforced via the control component. Theoverall data flow then returns to the beginning and marks the beginning of the next itera-tion.
This paper will concentrate on the network dimensioning component, which will beillustrated in detail in the next sub-section.
Network
MetricsTree
StatisticsAcquisition Control
NetworkDimensioning
NetworkSimulation
Figure 2: The approach
Network DataAcquisition
Metrics Tree Creationand Computation
NetworkDimensioning
EstimatedRevenue
Acceptable?
NetworkSimulation
NetworkControl
Yes
No
Figure 3: The data flow
3.2 Network Dimensioning
As mentioned before, network dimensioning is responsible for computing the mappingbetween the logical connections and the physical links. Figure 4 describes the overallprocess involved in network dimensioning.
Depending on whether sufficient budgets are available for network upgrades, two al-ternatives are available for dimensioning the network. When budget is available for up-grades, it can be done exactly the same as in [9], which has been described in the relatedworks in this paper. While Xk
ij indicates the percentage of traffic from demand k that canbe provided by link (i, j),
∑k∈K dkXk
ij indicates the total amount of traffic that link (i, j)needs to support. When
∑k∈K dkXk
ij > cij , link (i, j) has to be upgraded to accommo-date the traffic and otherwise, cij −
∑k∈K dkXk
ij indicates the unused bandwidth on link
ConventionalDimensioning
Over Utilized ?
No
Yes
No
Zero BudgetDimensioning
Networkupgrade
Yes
StatisticsAcquisition
NetworkSimulation
Upgradebudget?
NetworkDimensioning
Figure 4: Network Dimensioning
327Zero-budget Network Dimensioning
(i, j). The zero-budget network dimensioning alternative has to be employed in case nobudget is available for network upgrades.
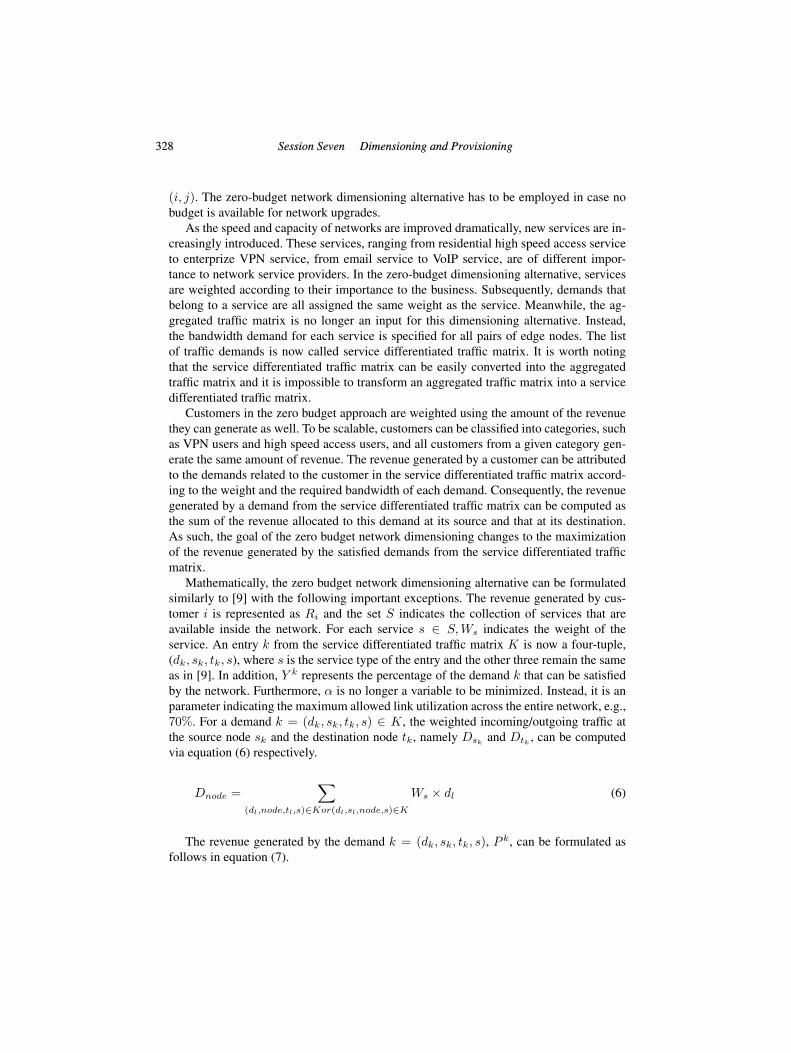
As the speed and capacity of networks are improved dramatically, new services are in-creasingly introduced. These services, ranging from residential high speed access serviceto enterprize VPN service, from email service to VoIP service, are of different impor-tance to network service providers. In the zero-budget dimensioning alternative, servicesare weighted according to their importance to the business. Subsequently, demands thatbelong to a service are all assigned the same weight as the service. Meanwhile, the ag-gregated traffic matrix is no longer an input for this dimensioning alternative. Instead,the bandwidth demand for each service is specified for all pairs of edge nodes. The listof traffic demands is now called service differentiated traffic matrix. It is worth notingthat the service differentiated traffic matrix can be easily converted into the aggregatedtraffic matrix and it is impossible to transform an aggregated traffic matrix into a servicedifferentiated traffic matrix.
Customers in the zero budget approach are weighted using the amount of the revenuethey can generate as well. To be scalable, customers can be classified into categories, suchas VPN users and high speed access users, and all customers from a given category gen-erate the same amount of revenue. The revenue generated by a customer can be attributedto the demands related to the customer in the service differentiated traffic matrix accord-ing to the weight and the required bandwidth of each demand. Consequently, the revenuegenerated by a demand from the service differentiated traffic matrix can be computed asthe sum of the revenue allocated to this demand at its source and that at its destination.As such, the goal of the zero budget network dimensioning changes to the maximizationof the revenue generated by the satisfied demands from the service differentiated trafficmatrix.
Mathematically, the zero budget network dimensioning alternative can be formulatedsimilarly to [9] with the following important exceptions. The revenue generated by cus-tomer i is represented as Ri and the set S indicates the collection of services that areavailable inside the network. For each service s ∈ S, Ws indicates the weight of theservice. An entry k from the service differentiated traffic matrix K is now a four-tuple,(dk, sk, tk, s), where s is the service type of the entry and the other three remain the sameas in [9]. In addition, Y k represents the percentage of the demand k that can be satisfiedby the network. Furthermore, α is no longer a variable to be minimized. Instead, it is anparameter indicating the maximum allowed link utilization across the entire network, e.g.,70%. For a demand k = (dk, sk, tk, s) ∈ K, the weighted incoming/outgoing traffic atthe source node sk and the destination node tk, namely Dsk
and Dtk, can be computed
via equation (6) respectively.
Dnode =∑
(dl,node,tl,s)∈Kor(dl,sl,node,s)∈K
Ws × dl (6)
The revenue generated by the demand k = (dk, sk, tk, s), P k, can be formulated asfollows in equation (7).
328 Session Seven Dimensioning and Provisioning

P k = Rsk× Ws × dk
Dsk
+ Rtk× Ws × dk
Dtk
(7)
All together, equations from (8) to (12) describe the zero budget network dimension-ing.
max(∑k∈K
Y k × P k) (8)
s.t.∑j:(i,j)∈E
Xkij −
∑m:(m,i)∈E
Xkmi = 0 ∀k ∈ K, i �= sk, tk (9)
∑j:(i,j)∈E
Xkij −
∑m:(m,i)∈E
Xkmi = Y k ∀k ∈ K, i = sk (10)
∑k∈K
dkXkij ≤ cijα ∀(i, j) ∈ E (11)
0 ≤ Xkij ≤ 1, 0 ≤ Y k ≤ 1 (12)
Unlike [9], the objective function (8) maximizes the revenue generated by the satisfiedportion of the demands. Another major difference exists in equation (10), where the nettraffic flowing out of source node sk is now Y k instead of the original 1 for any givendemand k = (dk, sk, tk, s). Similarly, this problem can be solved by any of the off-the-shelf linear programming tools, e.g., linprog from MATLAB. As the optimization results,Xk
ij indicates the mapping as usual while Y k reveals the percentage of the demand k thatcan be satisfied by the network under a given link utilization scheme α. It worth notingthat it might be impractical to satisfy any portion of a demand in real world networks.This can be adjusted by allowing Y k to have values of 0 or 1 only, thus either satisfyingall of a demand or none of it.
3.3 An Example
To have a concrete idea on how zero budget network dimensioning approach works, thissection illustrates it further using an example. Figure 5 depicts a network with each linkhaving a capacity of 3 units. For simplicity, physical links are assumed to carry traffics inone direction only. Table 1 describes the service differentiated traffic matrix, with each en-try bearing a service type and a weight for the service. The second row of table 2 describesthe revenue generated by each node and the third row of the table sums the weighted in-coming and outing traffic at each node according to equation (6). By instantiating equation(7), the revenue generated by each demand is computed as in table 3.
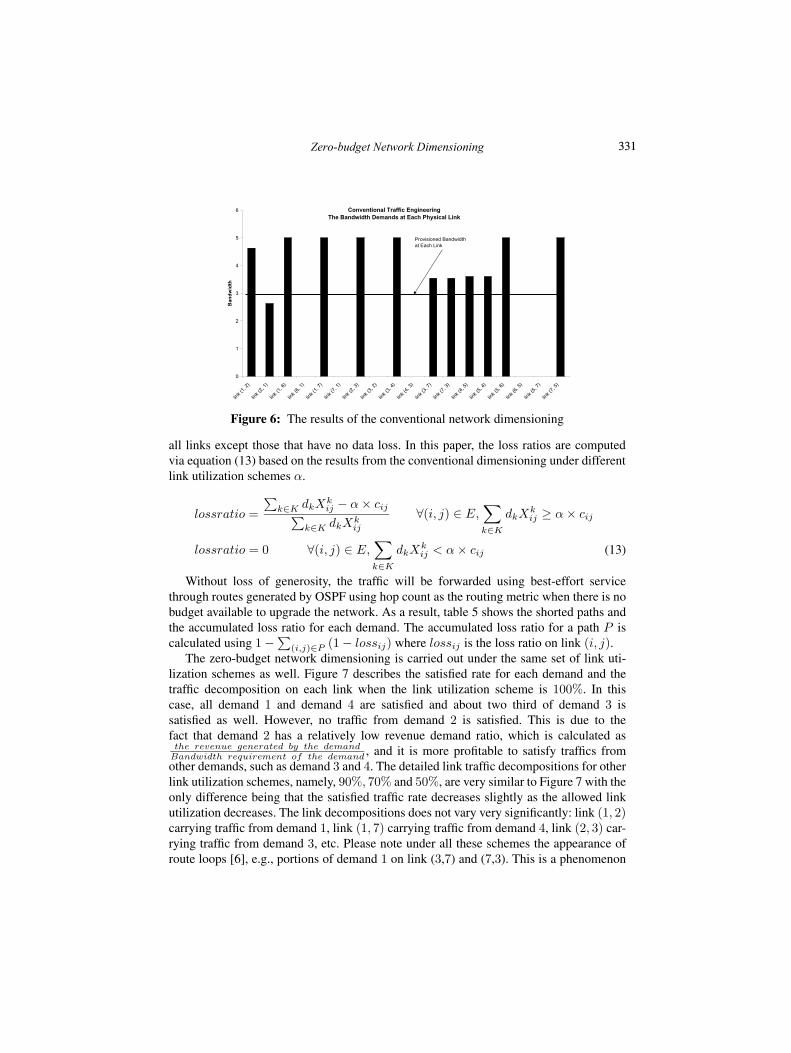
Both the conventional traffic dimensioning approach [9] and the zero budget dimen-sioning approach are conducted on this example network with the above setting. Theresults from the conventional dimensioning is depicted in Figure 6, which indicates thatabout 2 extra units of bandwidth are needed on about 7 links to satisfy all the demands.The traffic, unfortunately, has to compete for stringent resources until the budget becomesavailable and the corresponding links are upgraded. Until then losses of data on some linkswill be inevitable. Table 4 lists the loss ratios under different link utilization schemes on
329Zero-budget Network Dimensioning

1
6 2
7
5
4
3
Figure 5: An Example Network
Table 1 The service differentiated traffic matrix
DemandID Src Dst Required Bandwidth Service Type Service Weight
1 1 2 3 1 52 1 6 4 2 103 2 6 6 3 154 1 4 5 3 15
Table 2 The revenue and weighted total traffic of each node
Node 1 2 3 4 5 6 7
Revenue 5 10 15 10 5 5 5Weighted Total Traffic 130 105 0 75 0 130 0
Table 3 The revenue generated by each demand
DemandID Src Dst Revenue($)
1 1 2 P 1 = 5 × 3×5130 + 10 × 3×5
105 ≈ 2.0052 1 6 P 2 = 5 × 4×10
130 + 5 × 4×10130 ≈ 3.077
3 2 6 P 3 = 10 × 6×15105 + 5 × 6×15
130 ≈ 12.0334 1 4 P 4 = 5 × 5×15
130 + 10 × 5×1575 ≈ 12.885
330 Session Seven Dimensioning and Provisioning
Conventional Traffic EngineeringThe Bandwidth Demands at Each Physical Link
0
1
2
3
4
5
6
link (
1, 2
)
link (
2, 1
)
link (
1, 6
)
link (
6, 1
)
link (
1, 7
)
link (
7, 1
)
link (
2, 3
)
link (
3, 2
)
link (
3, 4
)
link (
4, 3
)
link (
3, 7
)
link (
7, 3
)
link (
4, 5
)
link (
5, 4
)
link (
5, 6
)
link (
6, 5
)
link (
5, 7
)
link (
7, 5
)
Ban
dw
idth
Provisioned Bandwidthat Each Link
Figure 6: The results of the conventional network dimensioning
all links except those that have no data loss. In this paper, the loss ratios are computedvia equation (13) based on the results from the conventional dimensioning under differentlink utilization schemes α.
lossratio =
∑k∈K dkXk
ij − α × cij∑k∈K dkXk
ij
∀(i, j) ∈ E,∑k∈K
dkXkij ≥ α × cij
lossratio = 0 ∀(i, j) ∈ E,∑k∈K
dkXkij < α × cij (13)
Without loss of generosity, the traffic will be forwarded using best-effort servicethrough routes generated by OSPF using hop count as the routing metric when there is nobudget available to upgrade the network. As a result, table 5 shows the shorted paths andthe accumulated loss ratio for each demand. The accumulated loss ratio for a path P iscalculated using 1 − ∑
(i,j)∈P (1 − lossij) where lossij is the loss ratio on link (i, j).The zero-budget network dimensioning is carried out under the same set of link uti-
lization schemes as well. Figure 7 describes the satisfied rate for each demand and thetraffic decomposition on each link when the link utilization scheme is 100%. In thiscase, all demand 1 and demand 4 are satisfied and about two third of demand 3 issatisfied as well. However, no traffic from demand 2 is satisfied. This is due to thefact that demand 2 has a relatively low revenue demand ratio, which is calculated asthe revenue generated by the demand
Bandwidth requirement of the demand , and it is more profitable to satisfy traffics fromother demands, such as demand 3 and 4. The detailed link traffic decompositions for otherlink utilization schemes, namely, 90%, 70% and 50%, are very similar to Figure 7 with theonly difference being that the satisfied traffic rate decreases slightly as the allowed linkutilization decreases. The link decompositions does not vary very significantly: link (1, 2)carrying traffic from demand 1, link (1, 7) carrying traffic from demand 4, link (2, 3) car-rying traffic from demand 3, etc. Please note under all these schemes the appearance ofroute loops [6], e.g., portions of demand 1 on link (3,7) and (7,3). This is a phenomenon
331Zero-budget Network Dimensioning

Table 4 The loss ratio on each link under different link utilization schemes
Links (1, 2) (2, 1) (1, 6) (1, 7) (2, 3) (3, 4)
α = 100% 28.01% 0 40% 40% 40% 40%α = 90% 35.21% 0 46% 46% 46% 46%α = 70% 49.61% 3.11% 58% 58% 58% 58%α = 50% 64.01% 30.8% 70% 70% 70% 70%
Links (3, 7) (7, 3) (4, 5) (5, 4) (5, 6) (7, 5)
α = 100% 0 0 0 0 40% 40%α = 90% 0 0 0 0 46% 46%α = 70% 0 0 5.5% 5.49% 58% 58%α = 50% 24.12% 24.12% 32.5% 32.5% 70% 70%
Table 5 The loss ratio experienced by each demand under different link utilizationschemes
DemandID Route α = 100% α = 90% α = 70% α = 50%
1 1, 2 28.01% 35.21% 49.61% 64.01%2 1, 6 40% 46% 58% 70%3 2, 1, 6 40% 46% 59.31% 79.24%4 1, 7, 3, 4 64% 70.84% 82.36% 93.17%
commonly seen in overlay model and its variants and can be removed by adding penaltyon the number of such route loops in the objective function. Due to the space limit, thedetailed link traffic decompositions are omitted for these link utilization schemes but thesatisfied rate for these schemes are shown in table 6.
Compared to the satisfied rate from the conventional network dimensioning without
Table 6 The satisfied rate under different link utilization schemes
DemandID α = 100% α = 90% α = 70% α = 50%
1 100% 90% 70% 50%2 0 0 0 03 66.67% 51.67% 35% 25%4 100% 100% 84% 60%
332 Session Seven Dimensioning and Provisioning

Alpha = 100%Demand 1 = 100%, Demand 2 = 0%, Demand 3 = 66.67%, Demand 4 = 100%
0%
10%
20%
30%
40%
50%
60%
70%
80%
90%
100%
link (
1, 2
)lin
k (2,
1)
link (
1, 6
)lin
k (6,
1)
link (
1, 7
)lin
k (7,
1)
link (
2, 3
)lin
k (3,
2)
link (
3, 4
)lin
k (4,
3)
link (
3, 7
)lin
k (7,
3)
link (
4, 5
)lin
k (5,
4)
link (
5, 6
)lin
k (6,
5)
link (
5, 7
)lin
k (7,
5)
Lin
k U
tiliz
atio
n(%
)
Unused
Demand 4Demand 3
Demand 2
Demand 1
Figure 7: Zero budget network dimensioning with α = 100%
0.5 0.55 0.6 0.65 0.7 0.75 0.8 0.85 0.9 0.95 14
6
8
10
12
14
16
18
20
22
24
Link Utilization
Rev
enu
e G
ener
ated
($)
The Estimated Revenue
Zero−budget network dimensioningConventional network dimensioning
Figure 8: The comparison of the two approaches in terms of profitability
upgrades, which is considered as 1 − loss ratio in this paper, very high level satisfac-tion rate for demand 1, 3 and 4 are produced with the zero-budget network dimensioning.However, zero budget network dimensioning satisfies no traffic from demand 2 whilesome portion of demand 2 are always being satisfied by the conventional network dimen-sioning. As analyzed before, it is more profitable to carry traffics from other demands,such as 3 and 4. This can be further verified by Figure 8, which compares the profitabil-ity of the results from both the zero-budget network dimensioning and the conventionalnetwork dimensioning under different link utilization schemes.
333Zero-budget Network Dimensioning

4. Scalability ConsiderationsAs the overlay approach are increasingly employed in traffic engineering large real worldnetworks, its scalability issue, namely the so called ”N-square” problem [12], has drawn aconsiderable amount of attention. To create a full meshed connections for a network withN edge nodes, N ×(N −1) logical connections have to be established. When the numberof edge nodes is large, this approach appears rather limited. This is also the case for thezero budget network dimensioning. To compensate, we propose the network decomposi-tion, a process that divides a large network hierarchically into a collection of smaller onesand the large network is then abstracted as a network interconnecting the smaller ones.In the abstraction, the smaller networks are viewed as compound nodes and a compoundnode is weighted using the total revenue generated by the customers within the compoundnode. Meanwhile, the demands that share common source and destination nodes and thatare of a given service are aggregated into a single demand. The aggregated demand gen-erates the total amount of revenue of its constituent demands. When necessary, a smallernetwork can be decomposed further in the same manner. The outcome of the networkdecomposition will be a tree of networks, with parents being the abstracted networks andthe children being the smaller ones.
The traffic engineering can then be carried out in the ”bottom up and then top down”fashion as depicted in Figure 9, which illustrates the process on a tree of networks ofheight n, with the root network being at level 0 and leaf networks being at level n. Duringthe bottom up iteration, a parent acquires the commonly satisfiable demands from all itschild networks and dimensions its network for the commonly satisfiable demands only.This process repeats until the root has been reached and overall traffic matrix can beadjusted accordingly using the commonly satisfiable demands at the root. The top downiteration starts immediately after this. The root network dimensions its network and theoverall traffic matrix is segmented into a list of traffic matrices according to the trafficengineering results. A child node then dimensions its network using the correspondingtraffic matrix segment independently. The entire process stops once all the leaf networkshave been dimensioned.
5. Added ValuesDue to the incorporation of the metrics tree model into traffic engineering, the proposedapproach joins together the network layer, service layer, customer layer and business layerseamlessly for the first time. Using the metrics tree, any change at the network layer canbe propagated to the other layers and its effects to the other layers can be revealed ata glance. As such, the proposed approach can be utilized to address a network serviceprovider’s concern in introducing new customers and services into the network and indeciding whether a performance improvement is possible without conducting upgrades tothe exiting network.
When adding a new customer to the existing network, the customer’s demands foreach service can be estimated using the average demands from the category that the cus-tomer belongs to, and the demand can be incorporated into the service differentiated trafficmatrix afterwards. Network dimensioning can be carried out subsequently. The optimal
334 Session Seven Dimensioning and Provisioning

child(j) ?
level = n
Bottom-up Starts
Choose one node jwhere level(j)=level
and TE(j) = false
Collects demandssatisfied by each child
yes
Generates the commonlysatisfied demands
Prepare traffic matrixpertaining to this node
Traffic engineeringnode j
no
Node j exists ?
yes
level = level - 1no
level >= 0 ?yes
Top-down Starts
Generate overallsatisfiable traffic matrixno
level = 0
Choose one node jwhere level(j)=level
Node j exists ?
Done
no
yes
parent(j) ?
Acquire the correspondingsegmented traffic matrix
from parent
yes
Traffic engineeringnode j
Set the traffic matrix usingthe overall satisfiable
traffic matrix
no
level = level + 1
level <= n ?yes no
level(j): the level node j is in child(j): true if node j has children. False otherwise
TE(j): true if node j have been dimensioned. False otherwise. parent(j): true if node j has parent. False otherwise
Figure 9: The bottom up and top down traffic engineering
logical connections will then be simulated and the network layer performance data canbe acquired. By plugging these acquired data into the metrics tree, the effects to all theservices, to other customers and to the business can be revealed. The introduction of anew service can be viewed as an addition of a group of new customers, with each havinga demand for the service. Again, the same approach can be repeated and the effects canbe analytically obtained as well.
The zero budget network dimensioning can be used to decide whether a performanceimprovement, e.g., 15% increase in the throughput, is possible without upgrading the net-work. The 15% increase in the throughput, for example, can be realized by increasing eachdemand by 15%. Similarly, a zero budget network dimensioning can be conducted withthe current link utilization level and the optimal connections can be simulated. By com-puting the metrics tree using the simulated data, the network service provider is able todecide whether the expected revenue is acceptable. In case it is, the performance improve-ment is deemed possible. Otherwise, the network service provider can slightly increasethe link utilization level and until the link utilization level is considered too high, it can re-peat the process again and again. When the link utilization is already high enough and theexpected revenue is still not acceptable, the performance improvement can be consideredimpossible.
6. Conclusion
In this paper, we proposed a novel traffic engineering approach that complements existingapproaches during economic depressions. Our approach involves network monitoring,performance data correlation, network dimensioning, network simulation and networkcontrol. It allows ISPs to decide analytically whether a traffic re-engineering is necessary.In case a traffic re-engineering is necessary and no budget is available for network up-grades, it helps determining which demand to satisfy in order to maximize revenue. We
335Zero-budget Network Dimensioning

have also addressed the scalability issue originating from the overlay approach throughmeans of network decomposition. The usefulness and effectiveness of the proposed ap-proach is demonstrated through traffic engineering an example network and describingsome of its added values. Up to date, the metrics tree model has been implemented andmetrics trees can be instantiated for any network. As a future work, we will implement theother components, e.g., the network simulation component and the statistics acquisitioncomponent, and test the overall approach on large operational networks.
Compared to existing traffic engineering approaches, the zero budget approach as-sumes the knowledge of the revenue generated by each customer and the service differ-entiated traffic matrix. While the revenue generated by each customer can be acquiredwithout difficulty from billing systems, we agree that the acquisition of the service differ-entiated traffic matrix is a challenging task. We note that works are emerging in estimatingtraffic matrices and some are based on subscribed SLAs/SLSs and monitored data. Weplan to investigate those works and to devise schemes in estimating service differentiatedtraffic matrix in the near future.
References[1] Requirements for Traffic Engineering over MPLS. Technical Report RFC 2702, September
1999.[2] Analysis of an Equal-cost Multi-path Algorithm. Technical Report RFC 2992, November
2000.[3] Overview and Principles of Internet Traffic Engineering. Technical Report RFC 3272, May
2002.[4] G. A. Brosnan. Investment Trends in the United States Telecommunications Sector. The
Telecommunication Review, 2003.[5] John D. Dingell. Subcommittee on Telecommunications and the Internet Hearing on
Health of the Telecommunications Sector: a Perspective from Investors and Economics.http://www.house.gov/commerce democrats/press/108st3.htm.
[6] M. Thorup M. Roughan and Y. Zhang. Traffic Engineering with Estimated Traffic Matrices.In ACM SIGCOMM Conference on Internet Measurement, pages 248–258, Oct. 2003.
[7] G. Pavlou D. Griffin C.F. Cavalcanti P. Georgatsos P. Trimintzios, L. Georgiadis andC. Jacquenet. Engineering the Multi-Service Internet: MPLS and IP-based Techniques. InIEEE International Conference on Telecommunications(ICT), June 2001.
[8] W. Szeto R. Boutaba and Y. Iraqi. DORA: Efficient Routing Algorithm for MPLS TrafficEngineering. International Journal of Network and Systems Management, Special Issue onTraffic Engineering and Management, Vol. 10(No. 3):311–327, 2002.
[9] Y. Wang and Z. Wang. Explicit Routing Algorithms for Internet Traffic Engineering. In IEEEInternational Conference on Computer Communications and Networks (ICCCN), September1999.
[10] B. Bailey X. Xiao, A. Hannan and L. Ni. Traffic Engineering with MPLS in the Internet. InIEEE Network Magazine, March 2000.
[11] J. Xiao and R. Boutaba. Customer-centric Network Upgrade Strategy: Maximizing Invest-ment Benefits for Enhanced Service Quality. In IEEE/IFIP Network Operations and Man-agement Symposium (NOMS), April 2004.
[12] Z. Wang Y. Wang and L. Zhang. Internet Traffic Engineering Without Full Mesh Overlaying.In IEEE Conference on Computer Communications (INFOCOM), April 2001.
336 Session Seven Dimensioning and Provisioning
Related Documents