• DIRECT SENSING • SAMPLING • INSTALLATION • INJECTIONS ZEBRA ENVIRONMENTAL DIRECT SENSING

Zebra Direct Sensing Visualizations
Jul 14, 2015
Welcome message from author
This document is posted to help you gain knowledge. Please leave a comment to let me know what you think about it! Share it to your friends and learn new things together.
Transcript

•DIRECT SENSING
•SAMPLING
•INSTALLATION
•INJECTIONS
ZEBRA ENVIRONMENTAL
DIRECT SENSING
DATA
DATA INTEGRATION

SHAREPOINT WEBSITE FOR DATA SHARING
DATA INTEGRATION

Example of a Microsoft Excel Spreadsheet graphically displaying FID/PID/ECD and Conductivity Logs.
DIRECT SENSING
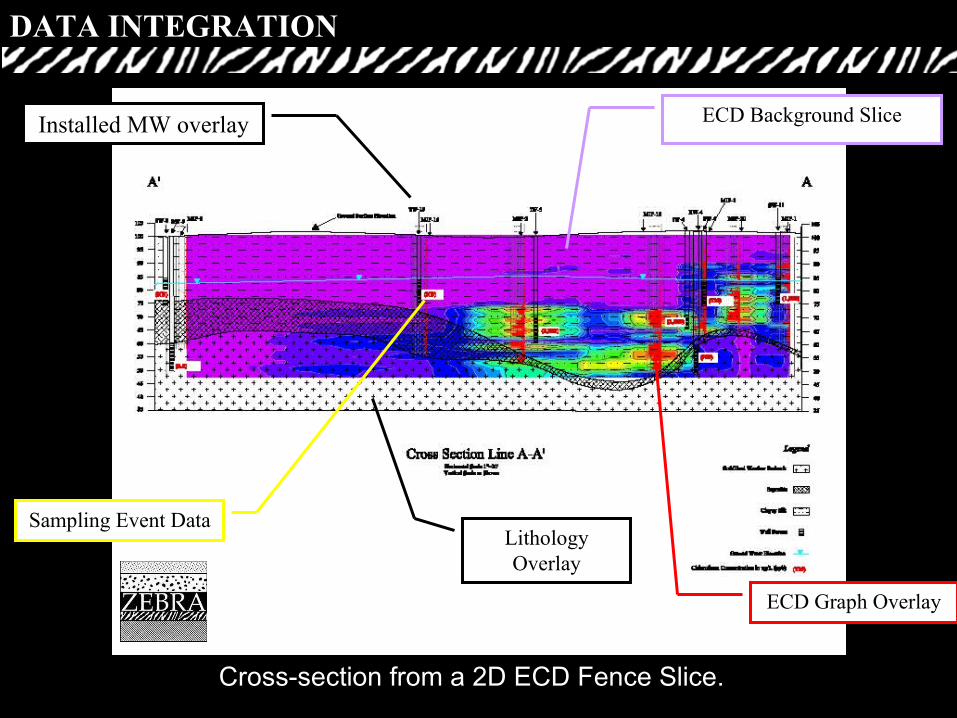
Cross-section from a 2D ECD Fence Slice.
Installed MW overlay ECD Background Slice
Sampling Event DataLithologyOverlay
ECD Graph Overlay
DATA INTEGRATION

Using 3D modeling software, we can generate true 3D Solid Models. This Plan View model was created using ECD data from a recent MIP project . Any orientation can be displayed and cross-sections or fence diagrams can be created.
DATA INTEGRATION

3D ECD Fence Model
DATA INTEGRATION

3D ECD Solid Plume Model
DATA INTEGRATION

3D Solid Model with Surface Objects
DATA INTEGRATION
Related Documents