NASA TECHNICAL MEMORANDUM USAAVSCOM TECHNICAL REPORT / Z 7 _ _:_ /- 104089 91-B-009 DAMAGE CURVED PREDICTION COMPOSITE IN CROSS-PLIED LAMINATES Roderick H. Martin and Wade C. Jackson C_:J£,:,-PL ] !_ _Ltt_-,VL_ _ ru_F'(:)Sl Tr t _I'JAT_ q ' "_LL JULY 1991 National Aeronautics and Space Administration Langley Research Center Hampton, Virginia 23665 US ARMY_ AVIATION SYSTEMS COMMAND AVIATION R&T ACTIVITY

Welcome message from author
This document is posted to help you gain knowledge. Please leave a comment to let me know what you think about it! Share it to your friends and learn new things together.
Transcript

NASA TECHNICAL MEMORANDUM
USAAVSCOM TECHNICAL REPORT
/
Z 7 _ _:_
/-104089
91-B-009
DAMAGE
CURVED
PREDICTION
COMPOSITE
IN CROSS-PLIED
LAMINATES
Roderick H. Martin
and
Wade C. Jackson
C_:J£,:,-PL ] !_ _Ltt_-,VL_ _ ru_F'(:)Sl Tr t _I'JAT_ q
' "_LL
JULY 1991
National Aeronautics andSpace Administration
Langley Research CenterHampton, Virginia 23665
US ARMY_
AVIATIONSYSTEMS COMMANDAVIATION R&T ACTIVITY


SUMMARY
This paper details the analytical and experimental work
required to predict delamination onset and growth in a curved
cross-plied composite laminate subjected to static and fatigue
loads. The composite used was AS4/3501-6, graphite/epoxy.
Analytically, a closed form stress analysis and 2-D and 3-D finite
element analyses were conducted to determine the stress
distribution in an undamaged curved laminate. The finite element
analysis was also used to determine values of strain energy release
rate at a delamination emanating from a matrix crack in a 90 ° ply.
Experimentally, transverse tensile strength and fatigue life were
determined from flat 90 ° coupons. The interlaminar tensile
strength and fatigue life were determined from unidirectional
curved laminates. Also, mode I fatigue and fracture toughness data
were determined from double cantilever beam specimens. Cross-plied
curved laminates were tested statically and in fatigue to give a
comparison to the analytical predictions. A comparison of the
fracture mechanics life prediction technique and the strength based
prediction technique is given.
a o
a
A,B,C,D
E11
E22
E33f
G
G c
GIc
NOMENCLATURE
initial delamination length
delamination length
constants in curve fit expression
elastic modulus in the fiber direction
elastic modulus transverse to fiber direction
elastic modulus through thickness
frequency
total strain energy release rate
critical value of strain energy release rate
mode I static interlaminar fracture toughness

Slmax
LmnP
Pmi.R
Rinnert
W
Z
O
6max
6rain8
O r
a_
_2c
a2max
O3c
aTeex
7re
U12
maximum mode I cyclic strain energy release
rate
moment arm length
constant in DCB compliance expression
exponent in DCB compliance expressionload
maximum cyclic load
minimum cyclic loadradius
inner radius
thickness
width
width wise coordinate
delamination angle counter clockwise
delamination angle clockwise
maximum cyclic displacement
minimum cyclic displacement
angle around curved portion of laminate
radial stress
tangential stress
transverse staticstrength
transverse cyclic stress
interlaminar static strength
interlaminar cyclic stress
interlaminar shear stress
Poisson's ratio
INTRODUCTION
Many laminated composite structures, such as an angle bracket
or a co-cured web or a frame have a loaded curved portion [i], fig.
i. The final failure in such structures may be a complex
progression of ply cracking, delamination and fiber failure.
Delamination may initiate from radial stresses caused by the
bending. Also, any tangential stresses present may cause matrix
cracks to develop in an off-axis ply. If a crack occurs, singular
interlaminar stresses will be created where the matrix crack meets
the adjacent plies. These interlaminar stresses may create local
delaminations, shown schematically in fig. i. The difference in
2

material properties between adjacent plies of different orientation
may also cause mathematically singular stresses at the free edges
which may initiate edge delaminations. These edge delaminations
may interact with the previously mentioned failure modes and
complicate delamination onset predictions using classical strength
based failure criteria. Therefore, the need to understand the
stress distribution and damage mechanisms in a curved laminate is
important in aiding the structural designer to predict the strength
of such a component.
To extend strength prediction techniques to account for
singular stresses from matrix cracks, delaminations, material
defects, edges or any other discontinuity, a fracture mechanics
prediction capability is necessary. Interlaminar fracture
mechanics based failure criteria offer a technique to predict the
onset and growth of delamination in a component with a singular
stress source [2-8]. For an interlaminar fracture mechanics based
failure criterion, a value of strain energy release rate, G, must
be determined at every potential delamination source. This value
of G may be termed the critical value, Gc, and will cause
delamination onset and growth when it equals the interlaminar
fracture toughness of the composite. The techniques to determine
the critical value of G may depend on the source of the potential
delamination.
Figure 2 gives some examples of how Gc was determined for
different structures. For edge delamination in a flat
3

multidirectional laminate, G increased from zero to a plateau
within a few ply thicknesses from the edge, fig. 2a [2]. The value
of G at the plateau was used to predict delamination onset at the
edge. In a tapered laminate, the peak value of G was used to
predict delamination onset, fig. 2b [3]. For delamination growth
from a matrix crack in a curved laminate [6], the point of
inflection in the G versus delamination length curve was postulated
to give the critical value of G required to predict static
delamination onset, fig. 2c. The effect of the free edge on the
growth of local delaminations initiating from a matrix crack in a
flat laminate subjected to tensile loads was investigated in ref.
7. For a straight delamination front perpendicular to the edge,
the value of G increased to a plateau value as the delamination
grew from the matrix crack. This plateau was assumed to give the
critical value of G similar to the edge delamination case, fig. 2a.
A curved laminate was analyzed with a delamination emanating from
a matrix crack in ref. 8. The G versus delamination length curve
was extrapolated to zero delamination length to determine a
critical value of G, fig. 2d.
The purpose of this paper is to predict damage in a curved
laminate subjected to static and fatigue loads using a strength and
a fracture mechanics based failure criterion. The stress
distribution in an undamaged cross-plied" curved laminate was
determined using a closed form solution and a 2-D and 3-D finite
element analyses (FEA). The G distribution for a delamination

initiating from a matrix crack in a set of 90° plies was determined
from the 2-D and 3-D finite element analyses. Static and fatigue
tests were conducted using flat 90° laminates to determine the
transverse strength, o2c, and the fatigue life. Unidirectional
curved laminates were used to determine interlaminar tensile
strength, a3c and the fatigue life. The mode I interlaminar
fatigue and fracture toughnesses of the composite material were
determined using a unidirectional double cantilever beam (DCB)
specimen. Attempts to predict interlaminar tension delamination of
the cross-plied curved laminate were made by comparing the maximum
radial stress to the interlaminar tensile strength and life data
for the composite. Attempts to predict matrix cracking were made
by comparing the maximum radial and tangential stress in a 90 ° ply
to the transverse and interlaminar strength and life data.
Finally, attempts to predict delamination onset from a matrix crack
were made by comparing the appropriate values of G to the fatigue
and fracture toughness data. Static and fatigue tests were also
conducted on a cross-plied curved laminate to determine the damage
modes and static and fatigue strength to compare with the
predictions.
In addition to the curved laminate being used as a structural
component, it has been considered as a possible test specimen to
determine the interlaminar tensile strength, a3c , for composite
materials [9]. Therefore, it is a secondary objective of this
paper to determine whether or not the multidirectional curved
5
laminate is suitable for a3c determination considering the
additional damage modes that may be present and the difficulty in
determining stresses at singularities.
EXPERIMENTAL PROCEDURE AND RESULTS
This section describes the materials, the experimental
procedure and experimental results. All specimens were fabricated
from Hercules AS4/3501-6 graphite/epoxy. The specimens were cured
in an autoclave according to the manufacturer's recommendations.
Material elastic moduli were obtained from ref. 4 and were
E11 = 140 GPa E22 = E33 =11.0 GPa
G12 = G13 = 5.84 GPa u1z= D13=0. 3
The volume fractions for each specimen type are given in their
corresponding subsections below. Prior to testing, all specimens
were dried using the following cycle: 1 hour at 95°C, 1 hour at
110°C, 16 hours at 125°C and 1 hour at 150°C. Following the drying
cycle, the specimens were stored in a desiccator cabinet until
tested.
Transverse Tension Strength Tests
Flat 90 °, unidirectional, 24-ply specimens were fabricated for
the transverse tension tests. The specimen dimensions were
150 X 33mm with the fibers oriented in the 33mm width direction.
The specimens had a volume fraction of 65.0 percent. The specimens
were subjected to static tests and to load controlled fatigue tests
at an R-ratio (P,i_Pmx) of R=0.1 and at a frequency of 5Hz. The
tests were conducted until failure occurred. In most of these
6

tests no loading tabs were used, and most specimens failed at or
near the grips. In a few specimens glass epoxy loading tabs were
used. However the failures were still at or near the grips, so the
use of tabs was discontinued. The static failure load or the
number of cycles to failure was recorded and the results are shown
in fig. 3. The straight lines were drawn through the data to
represent the lower and upper bound curves between 10 2 and 10 6
cycles. The use of these fits will be described later. The arrows
on the fatigue data points in fig. 3 and subsequent figures
indicate that the specimen did not fail.
Interlaminar Tension Strength Tests
Unidirectional, 0° curved laminate specimens were fabricated
for interlaminar tensile strength determination. The specimens had
24 plies and their configuration and dimensions are given in
fig. 4. The pre-preg was laid over a solid aluminum block and the
panels cured in an autoclave. The specimens had an average volume
fraction in the curved region of 54.7 percent. The static
strengths of these specimens were taken from ref. 4. Fatigue tests
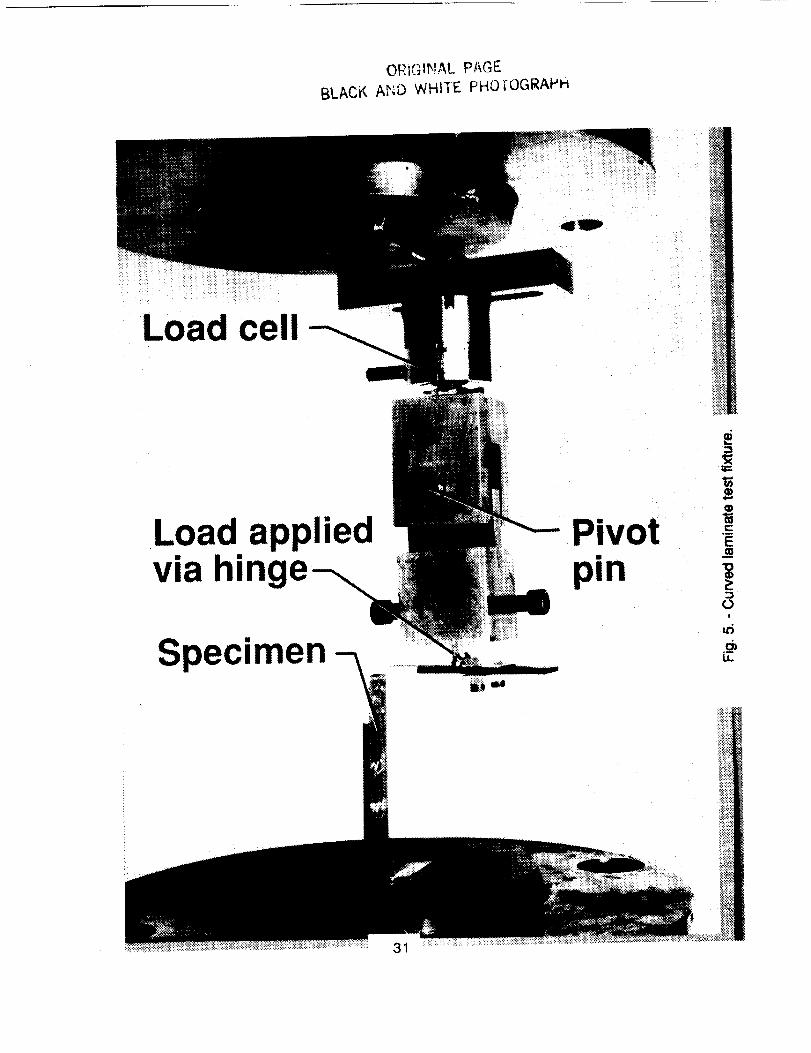
were conducted using the test fixture shown in fig. 5. The fatigue
tests were conducted under load control at an R-ratio of 0.1 and a
frequency of 5Hz. The number of cycles to the onset of
delamination was noted. The onset of delamination also
corresponded to a rapid loss of bending stiffness of the curved
portion. At the loss of bending stiffness the machine hydraulics
and the cyclic counter switched off. From ref. 4 the maximum
7

normalized radial stress was determined to be (a r w/P) = 4.37 mm "I,
occurring near the mid-thickness of the curved region. The
tangential and in-plane shear stresses were negligible at this
location. This value of radial stress was used with the applied
loads to determine a_x (or 03¢ ) using eq. I.
The fatigue results from this work and the static results from ref.
4 are shown in fig. 6. The straight lines were drawn through the
data to represent the lower and upper bound curves between 102 and
106 cycles. The use of these fits will be described later.
Double Cantilever Beam Tests
Double cantilever beam (DCB) specimens were fabricated to
determine the mode I fatigue and static fracture toughness of the
composite. The specimens were 24-ply, 0° unidirectional laminates.
A 13_m non-adhesive Kapton film was placed at the mid-plane at one
end prior to curing to simulate a delamination. The specimen
dimensions were 100 X 25mm. The specimens had a volume fraction of
55.9 percent. Piano hinges were bonded to the surface to allow
load to be transferred to the beam. The static tests were
conducted under displacement control at a loading rate of
0.5mm/min. Fracture toughness, Gic , was determined for a
delamination initiating from the end of the thin insert [I0]. The
fatigue tests were conducted under displacement control at an
8

R-ratio (6mi_6mx) of R=0.1, at a frequency of 5Hz at various
maximum cyclic displacements [i0,ii]. The number of cycles to
delamination onset was determined by monitoring the maximum cyclic
load, Pmx" If a 1 percent decrease in Pmx was observed then the
delamination was assumed to have grown. Delamination onset was
also monitored by visual inspection of the tip of the insert.
Figure 7 shows the fracture toughness and the maximum cyclic strain
energy release rate, Gi_x, versus the number of cycles to
delamination onset, where Gim x was calculated from
n P_8_x (2)GI_x = 2 w a o
where n is the exponent in the static compliance expression
6/P= man (an average value of n= 2.58 from three specimens was used
in equation 2), and a 0 is the initial delamination length. The
visual and 1 percent load drop methods of determining the number of
cycles to delamination onset gave inconsistent results. The visual
detection method gave lives greater, less than and similar to the
1 percent load drop method. In some specimens a 1 percent load
drop was not detected after visual delamination growth had been
observed. Hence, the visual data was used in the predictions
presented later.
Cross-Piled Curved Laminate Tests
Static and fatigue tests were conducted on cross-plied curved
laminates. The cross-plied specimens were laid up to the

dimensions given in fig. 4 using the same procedure described for
the unidirectional curved laminates above. The lay-up used was
[04/90_05] , and will be referred to as lay-up A. This particular
lay-up was chosen because it was anticipated that a matrix crack
would occur in the tension loaded 90 ° plies and that delamination
would grow from the matrix crack. The lay-up was not intended to
represent a viable lay-up for a structural component. The
specimens had a volume fraction of 59.5 percent in the curved
region. During the static and fatigue tests the first audible sign
of damage corresponded to complete loss of bending stiffness of the
curved portion of the specimen.
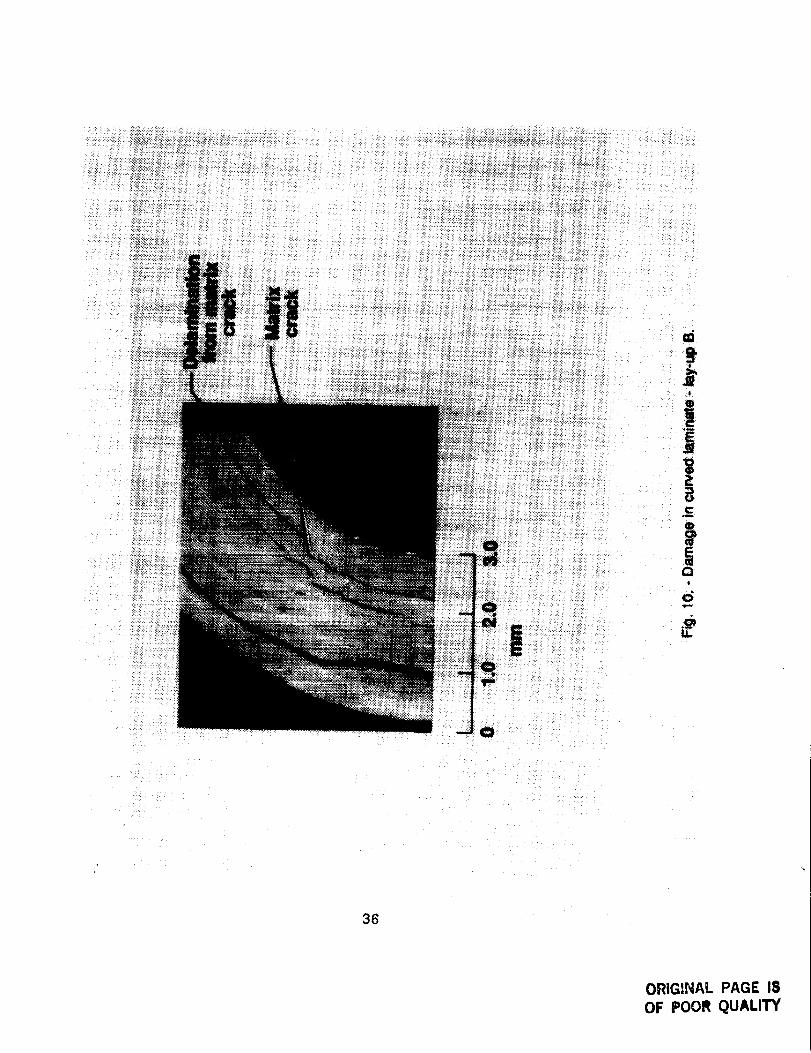
The results of the static and fatigue tests on lay-up A are
shown in fig. 8. The fatigue results are plotted as the maximum
applied load per unit width versus number of cycles to onset of
damage. The static results of ref. 6 are also shown in fig. 8.
The lay-up used in that work was [04/903/0/902/02] s and is referred
to as lay-up B. The failure paths for lay-ups A and B are shown in
figs. 9 and i0 respectively. In fig. 9, an oblique matrix crack
can be seen in the tension loaded [90]3 plies with delaminations
emanating from this crack. Other delaminations consistent with an
interlaminar tension failure can be seen in the 0 ° plies. In
fig. i0 a straight matrix crack can be seen in the tension loaded
[90]3 plies and also in the [90]2 plies above. This second matrix
crack, which was not analyzed in ref. 6, was another reason lay-up
A was chosen for this work, i.e. to eliminate the complications of
i0

two matrix cracks in the analysis.
ANALYSIS
This section details the analysis conducted on the cross-plied
curved laminates to determine the stress distribution with no
damage present and the strain energy release rate distribution with
matrix ply cracking and delamination present. The stress analysis
consists of a closed form multilayer theory. These results are
compared with a 2-D and a 3-D finite element analysis. The finite
element analysis was also used to determine the G distribution. In
the finite element models and the closed form solution, residual
thermal and moisture stresses were not considered.
2-D Closed Form Solution
Classical anisotropic elasticity theory was used to construct
a multilayered theory to calculate stresses and deformation fields
around the curved laminate using the method in ref. 12. Both an
end moment and an end force were applied to a quarter section of a
circular beam. An Airy stress function was written in cylindrical
coordinates for each layer in the beam. At every interface between
layers, both the displacements and stresses were matched to the
adjacent layer to assure continuity and equilibrium between layers.
The boundary conditions for the inner and outer surfaces were
traction free. At the end of the beam, the end force and end
moment were balanced by the shear and tangential stresses,
respectively. The total stress in the beam is a summation of the
stresses caused by the end force and the moment. Once the
ii

constants in the Airy stress function were known, the stresses were
determined at any location (R,8) in the beam using the expressions
in ref. 12.
Finite Element Analysis
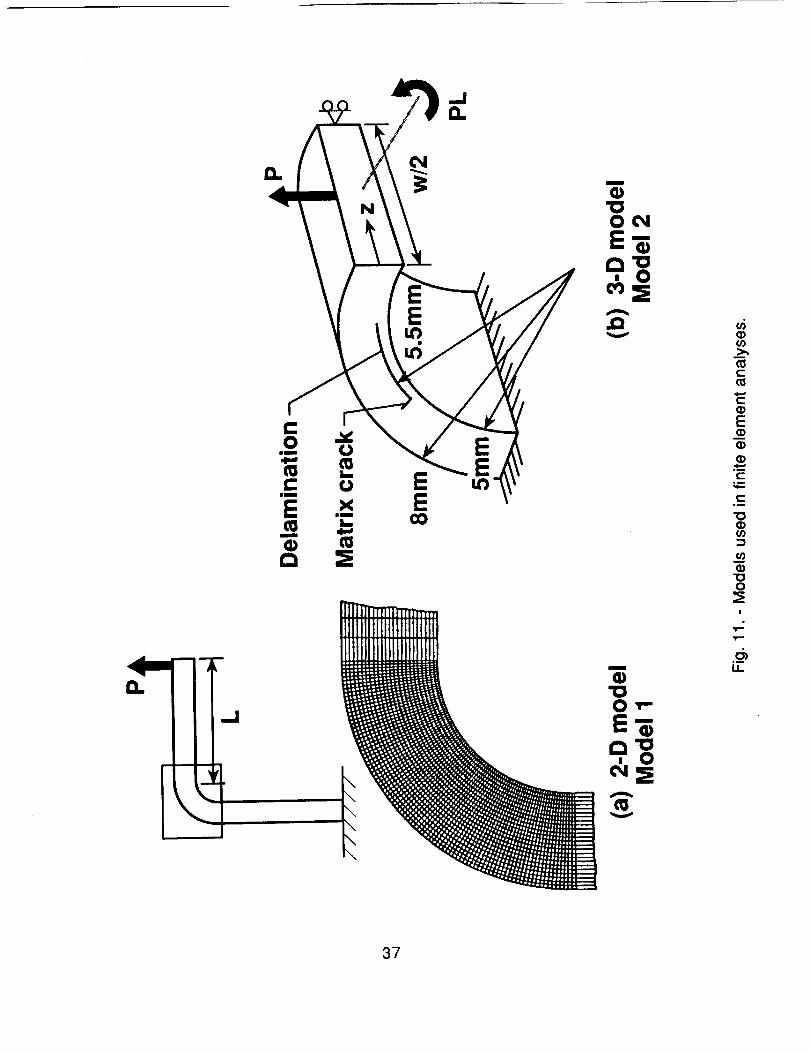
The finite element package MSC/NASTRAN [13] was used for the
analysis. A 2-D finite element model of the complete specimen was
created and is shown in fig. 11a. This model was used to determine
the stress distribution around the radius and through the thickness
for comparison with the closed form solution, and to determine the
global variation of G with delamination length. The model used
4-noded isoparametric elements. Around the curved region there was
one element per ply thickness and one element per one degree sweep.
Larger elements were used in the legs and the arms. The final
model had approximately 8100 degrees of freedom. A matrix crack
was modeled through the group of [90]3 plies nearest to the
smallest radius (R=Smm) at an angle of 45 ° around the radius. This
crack location was consistent with the crack observed
experimentally in figs. 9 and 10. Delaminations were modeled
emanating in each of the four directions from the matrix crack in
one direction at a time, see fig. 11b. The notation for the paths
of these cracks is given in fig. 12. To simulate the matrix crack
and delamination in the model, a free surface was included by the
use of coincident nodes. The coincident nodes were restrained
together using multi-point constraints (MPCs). By releasing the
appropriate MPCs in different analysis cases, several delamination
12

lengths could be modeled using one finite element mesh. Strain
energy release rate was determined using the virtual crack closure
method [14]. This model will be described as model i.
A full 3-D model of only the curved region was also created.
The model is shown in fig. llb and is referred to as model 2. The
model was rigidly supported at one end. Only half the width, w,
was modeled because of symmetry. The total width was 25mm. A
matrix crack was modeled in the same location as in model i. To
reduce the number of degrees of freedom, only the delamination
growing clockwise from the bottom of the matrix crack was modeled,
that is, along path bl, see fig. 12. The 2-D model showed that a
delamination was most likely to form along this path. Near the
matrix crack and the free edge, the elements were 1/16 of a ply
thickness square by one ply thickness wide (z-direction), where one
ply thickness equals 0.125mm. This refinement was used to capture
any G variations in the close vicinity of the matrix crack. The
model had approximately 30,000 degrees of freedom and used 6 and 8
noded, solid, modified isoparametric elements. This model was also
used to determine the effects of the free edges on the stress
distribution assuming an undamaged laminate.
ANALYTICAL RESULTS
Stress Analysis
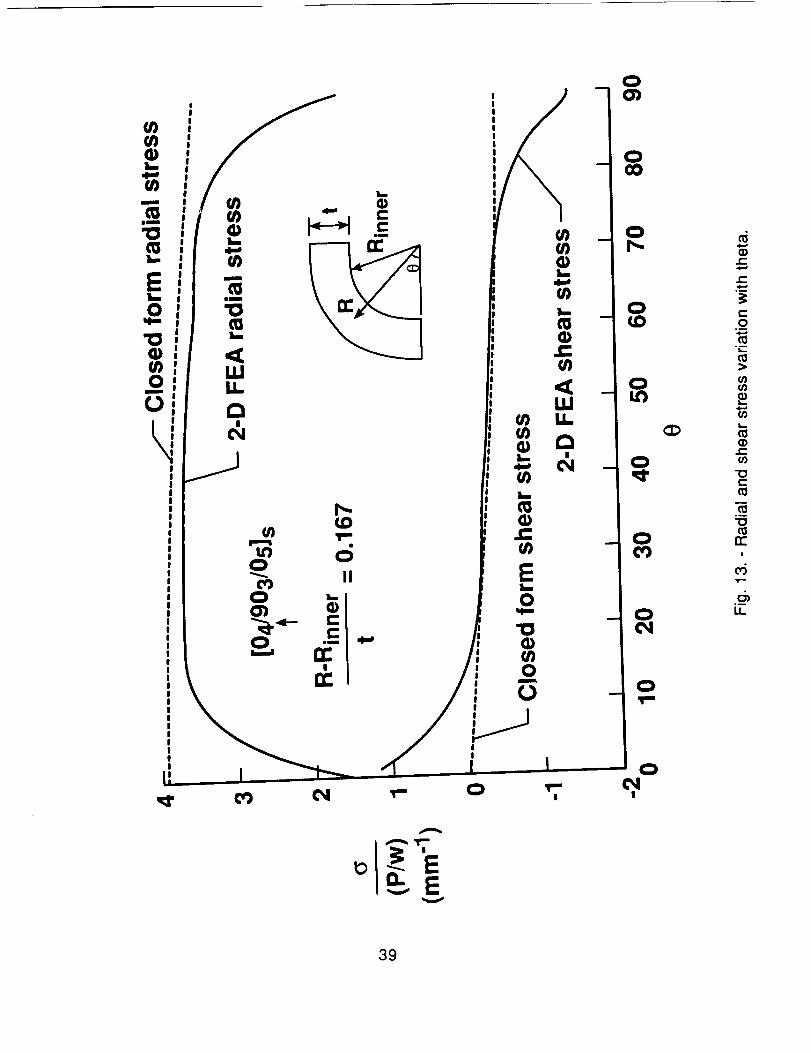
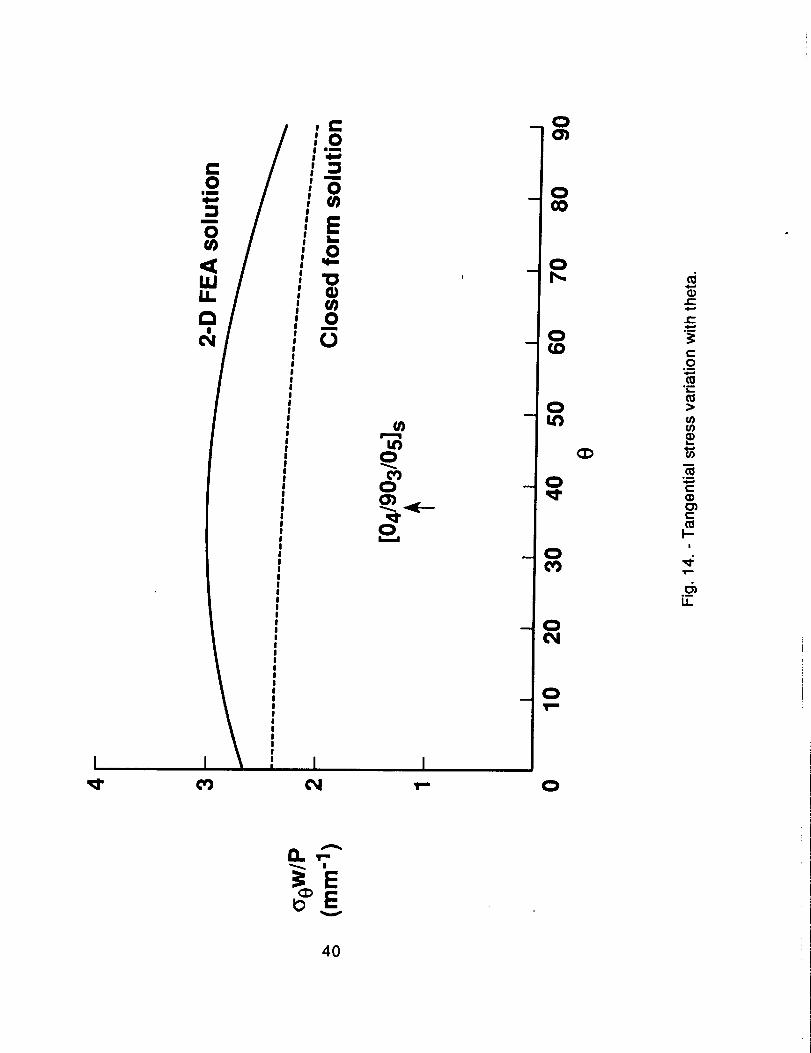
Figure 13 shows the variation of the radial and shear stress
and fig. 14 the variation of the tangential stress with 8 in lay-up
A. The plots are in the first tension loaded 90 ° ply as indicated
13

by the arrow on the figures. The stresses were determined from
model 1 and the closed form solution and 8 is defined in fig. 12.
In fig. 13 the two solutions agree reasonably well around much of
the curved portion and diverge towards 8=0° and 8=90 ° because of
the differences in boundary conditions. In fig. 14 the agreement
is poor but the trend of the variation with theta is similar.
Between 250<8<75 ° the stresses vary by only a small amount and
failure might initiate anywhere in this region.
Figure 15 shows the radial and shear stress components plotted
across the width along the first 0/90 interface determined using
model 2. Also, plotted for comparison, are the results from the
closed form solution. Figure 15 shows that the radial stress is
largest at the free edge, indicative of the singular nature of the
interlaminar radial stress at the free edge in a 0/90 interface.
No attempt was made to further refine the finite element mesh at
the edges to show more clearly the singular stresses because of the
large number of degrees of freedom of the current model. The
closed form solution compared well to the FEA solution away from
the free edge. The shear stress FEA results in fig. 15 did not
agree well with the closed form solution. However the difference
is small compared to the magnitude of the radial stress.
Figures 16, 17 and 18 show the variation of the radial,
tangential and shear stresses, respectively, through the thickness
in lay-up A as determined from model I, model 2 and the closed form
solution and are plotted at 8=45 °. The results from model 2 are
14

plotted at 2z/w=0.0 (the free edge) and 2z/w=l.0 (the center line).
In fig. 16 the 2-D FEA results and the closed form solution agree
reasonably well for the radial stress. The radial stress reaches
a maximum towards the center of the laminate in the 0° plies. At
the center line the results compare well with the closed form
solution_ However, at the free edge the two solutions vary,
demonstrating the singular nature of the stresses at the free edge.
In fig. 17 the tangential stress reaches a maximum at the inside
edge, (R-Ri_r/t=O.O) where there is a 0 ° ply. For the 90 ° plies,
the tangential stress has a maximum tension value in the 90 ° ply
closest to the inner radius, (R-Ri_er/t)=0.167. The tangential
stress at this location may contribute to matrix cracking in these
plies. The results for all three solutions agree reasonably well.
In fig. 18, the shear stress results from the closed form solution
and the 2-D FEA solution agree well, and the shear stress is small.
From the 3-D solution in the center, the results are inconsistent
with the 2-D solutions. The cause for this is not known presently
but may be caused by the large aspect ratio of the elements in the
center width of the model.
Strain Energy Release Rate Analysis
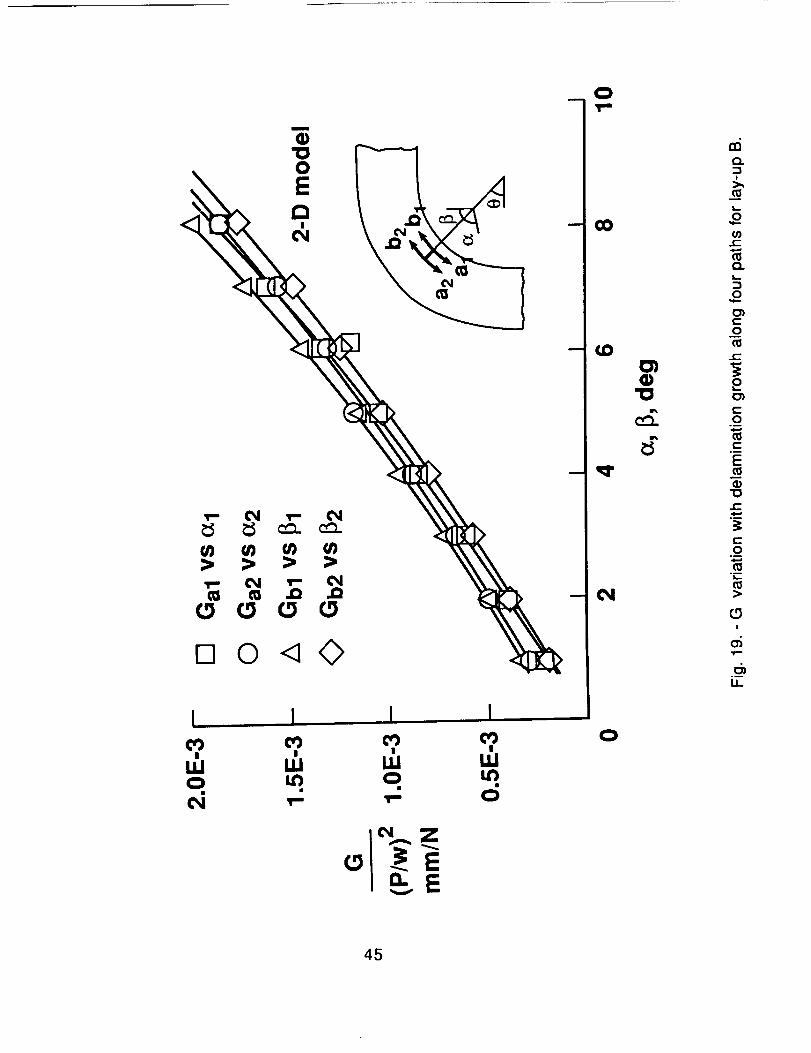
In ref. 6 the variation in G with delamination length for
delamination growth from a matrix crack along each of the four
paths shown in fig. 12, was determined for lay-up B. The value of
G along path bl, Gbl, was usually higher than the other three
values (Gal, Ga2 and G_), fig. 19. Therefore, it was assumed
15

delamination would initiate along path bl. In ref. 4 a technique
for predicting the delamination growth path for a delamination with
two fronts was given. The technique consisted of comparing the
values of G at each front and growing the delamination at the
location of the highest G. Following a similar method the next
highest value to Gbl was Ga2. By assuming growth along bl and
comparing values of G,2 to Gbl it was observed that Gbl was always
larger than Ga2 around most of the curved portion. Therefore,
delamination should grow along the bl path followed by delamination
along path a2 as observed in fig. i0. Figure 20 shows the
variation of Gbl with _ for lay-up B. Because Gbl is continually
increasing, delamination growth should be unstable once initiated
as observed experimentally. Also, shown in fig. 20 is the mode I
component of strain energy release rate, GI. Because of the
oscillatory nature of the stress fields between plies of different
orientation the mode I value may not converge [15]. However, with
the element size used, the delamination remained largely mode I
around much of the curved portion due to the high radial stresses
present. The above analyses were not repeated for lay-up A. A
similar result is expected since the matrix crack and delamination
paths in figs. 9 and i0 are similar.
Figure 21 shows the distribution of Gbl across the width at
several delamination lengths (angle 8) from the matrix crack for
lay-up A using model 2. Across 80 percent of the width G was
constant and reached a maximum at the free edge. The results are
16

very similar for lay-up B in ref. 6. Figure 21 indicates that the
delamination front may not remain straight and perpendicular to the
edge as it grows. Delamination front curvature was not considered
in the analysis. Figure 22 shows the variation of G with _ using
model 2. As delamination grows, the rate of change of G initially
decreases and then begins to increase with a point of inflection in
between. Close to the matrix crack G is very small. Also shown in
fig. 22 are the results using model 1 (solid circular symbols). As
expected, the values of G from model 2 in the interior are similar
to those obtained from the 2-D model. A polynomial curve fit
expression to the G distribution on the free edge and the center
line is shown in fig. 23. The first part of this curve, where
dG/d_ is decreasing, may be analogous to the distributions for edge
delamination [2], fig. 2a or for delamination from dropped plies
[3], fig. 2b where the singular stress source, the edge and the
dropped ply, respectively, dominates the G distribution. However,
for the curved laminate, there is a high radial force which also
contributes to G and causes dG/d_ to increase with no peak or
plateau as observed in refs. 2 and 3. It was postulated in ref. 6
that the point of inflection may be used to determine a critical
value of G to predict delamination growth much as the plateau or
peak value in refs. 2 and 3. At the free edge in lay-up A, the
point of inflection (d2G/d_2=O) was determined to be at 8=2.13 ° (1.6
ply thicknesses from the matrix crack) yielding a critical value of
(G w2/_) = 8.08E-4 mm/N. At the center of the width the point of
17

inflection was determined to be at @=i.08 ° (0.83 ply thicknesses
from the matrix crack) yielding a critical value of (G w2/_) =
4.17E-4 mm/N. These values of G may be compared to the static and
fatigue toughness of the composite to predict delamination onset
for the curved laminate.
DAMAGE ONSET PREDICTIONS
Delaminatlon from Radial Stresses
In refs. 16 and 17 delamination was predicted by comparing the
maximum radial stress to the transverse strength of the composite.
If the delamination occurs in a 0/90 interface and the analysis
used to determine the maximum radial stress ignores the effects of
the free edge, this prediction technique may be incorrect and any
correlation between experimental failure loads and predictions may
be coincidental. However, if the delamination occurs between plies
of the same orientation then this technique is valid. Figure 9
shows an interlaminar tension failure in the 0 ° plies as well as a
matrix crack with delaminations emanating from it. It is not known
which occurred first. From the closed form solution in fig. 16 the
maximum normalized radial stress in the 0 ° plies was
(a r w/P) = 4.04 mm "I at (R-Ri_r/t)_0.42. At this location the
tangential and shear stresses were negligible. By comparing this
value of radial stress to the interlaminar tensile strength results
shown in fig. 6, a prediction for lay-up A can be made using eq. 3
and is shown in fig. 24. Individual experimental data points from
fig. 6 have been used for the predictions. The predictions are
18
_x _ 03_x _ 03_x
w o.ooclose to the experimental failures and are slightly conservative.
From fig. i0 no interlaminar tension delaminations occurred alone
in lay-up B and the criterion in eq. 3 is not relevant.
Transverse Ply Cracking Predlotion
A strength based failure criterion could possibly be used to
predict the onset of matrix cracking in the 90 ° plies. However,
the 3-D stress analysis showed the presence of stress singularities
at the free edge. Also, the strength of the composite in the 90 °
flat tension specimens may not be the same as the in-situ strength
of the 90 ° plies in the laminate [18]. Therefore, any predictions
must be purely qualitative and are included in this paper to show
that matrix cracking in the 90 ° plies may occur. In the 90 ° plies
there is a biaxial stress state composed of the radial and
tangential stresses. The Tsai-Hill criterion has been derived for
predicting first ply failure in composite lamina [19] as
2 2 2
U11 - O11 a22 + U2__/2+ _12 - 1 (4)
X 2 y2 S 2
where X, Y are the tensile strengths in the 1 and 2 directions and
S is the 12 shear strength. In the curved laminates the shear
ratio is negligible compared to the radial and tangential ratios
and may be neglected in eq. 4. Re-writing eq. 4 in terms of the
19
normalized radial and tangential stresses and omitting the shear
stress terms, a predicted load per unit width may be determined as
(5)
From the closed form solutions in figs. 16 and 17 the maximum
were (0 r w/P) = 3.91mm "I and
Because individual data points
and a_x, straight line lower
radial and tangential stresses
(a 0 w/P) = 2.35 mm -I, respectively.
may not be used in eq. 5 for o2m x
and upper bound curves were fit to the transverse tension and
interlaminar tension fatigue data in figs. 3 and 6, respectively.
These curves were drawn for demonstration purposes only and are not
meant to characterize the material property. Using these straight
line fits in eq. 5 lower and upper bound predictions can be made
and are shown in fig. 25. The prediction curves indicate that
matrix cracking may occur prior to final failure of the curved
laminate. These prediction curves do not take into account the
singular nature of the stresses at the free edge nor the residual
thermal stresses both of which will effectively reduce the fatigue
life further. Also, as mentioned in the experimental work, some of
the 90 ° flat specimens failed in the grips and hence may under
estimate the transverse strength of the composite.
Delamlnation Onset from the Matrix Crack
If a matrix crack is assumed to already exist, the values of
G calculated at the point of inflection may be compared to the
2O

delamination data obtained from the DCB in fig. 7. The G
distribution in fig. 20 showed that delamination was predominantly
mode I. If the G distribution had significant mode II and III
components a mixed mode failure criterion would be necessary.
However, assuming a total G criterion and comparing it to mode I
data will yield a conservative approach [3,5,10]. A predicted
load per unit width may be determined from eq. 6.
w (6)
The results of this prediction are shown in fig. 26 using the
values of normalized G at the free edge and in the center. The
predictions at the free edge are conservative and the predictions
at the center are close to the experimental data. This prediction
does not include the number of cycles to form the matrix crack and
hence will generally be a conservative prediction. In the analysis
the matrix crack was assumed to be straight; it is not clear how an
angled crack would effect the G distribution or the mode I/mode II
mix of G. However, if a mode II component was present it would be
anticipated that the predicted number of cycles to delamination
onset would be higher because of the higher fatigue and fracture
toughness in mode II [i0]. It is probable that the matrix crack
occurred before the delamination although it was not detected prior
to final failure in the experimental work.
21

DISCUSSION
If the stresses that cause delamination are not singular, then
damage onset or delamination may be predicted using a strength
criterion. This was demonstrated for interlaminar tension
delaminations initiating in the 0° plies. However, if the stresses
are singular, such as at a free edge or a discontinuity, a fracture
mechanics prediction technique represents a means for predicting
damage onset and growth. This was demonstrated for delaminations
initiating from a matrix crack. Because closed form and 2-D FEA
solutions do not account for free edge singularities, strength
predictions may be inaccurate and more importantly potentially
unconservative using these analyses techniques. Therefore, it is
important to determine where damage initiates before selecting a
particular criterion to predict it. However, 2-D analyses are
useful for initial design because damage initiation depends on lay-
up. For example, matrix cracks can be avoided if a lay-up is
chosen so that the tangential stresses in the 90 ° plies are not
highly tensile. Also, free edge delamination may be minimized if
a lay-up is chosen so that the radial stresses are low at 0/90
interfaces (or other perpendicular interfaces e.g. +45/-45).
Because of matrix cracking and interface effects at free edges
multidirectional laminates should not be used to determine
interlaminar tensile strength, u3c unless it is certain that
interlaminar tension failure occurs within a group of plies of the
same orientation. The simplest means to ensure this is in a
22

unidirectional curved beam [4]. In ref. 4 a 2-D closed form
analysis of a unidirectional curved laminate determined that the
stresses were purely radial at the failure location in the
laminate.
SUMMARY
This paper details the analytical and experimental work
required to predict delamination onset in a curved composite
laminate subjected to static and fatigue loads. The composite used
was AS4/3501-6, graphite/epoxy. Analytically, a closed form stress
analysis and a 2-D and a 3-D finite element analyses were conducted
to determine the stress distribution in an undamaged curved
laminate. The finite element analyses were also used to determine
values of strain energy release rate at a delamination emanating
from a matrix crack in a 90 ° ply. Experimentally, transverse
tensile strength and fatigue life were determined from flat 90 °
coupons. The interlaminar tensile strength and fatigue life were
determined from unidirectional curved laminates. Also, mode I
fatigue and fracture toughness data were determined from double
cantilever beam specimens. The analysis and the strength and
toughness data were used to predict the static and fatigue strength
of cross-plied curved laminates. The prediction for interlaminar
tension delamination in the 0 ° plies was in reasonable agreement
with the experimental results for the curved laminate. The
interlaminar fracture mechanics approach compared the critical
value of strain energy release rate at the free edge, and in the
23

center, to the fatigue and fracture toughness of the composite•
The predictions at the free edge were conservative and the
predictions at the center were in agreement with the experimental
data. This prediction does not include the number of cycles to
form the matrix crack and hence will generally be a conservative
prediction.
REFERENCES
• Kedward, K.T., Wilson, R.S., and McLean, S.K., "Flexure of
Simply Curved Composite Shapes," Composites, Vol. 20, No. 6,
November 1989, pp. 527-536•
. O'Brien, T.K., "Mixed-Mode Strain-Energy-Release Rate Effects
on Edge Delamination of Composites," Effects of Defects in
Composite Materials, ASTMSTP 836, D.J. Wilkins, Ed., American
Society for Testing and Materials, Philadelphia, 1984,
pp. 125-142.
. Murri, G.B., Salpekar, S.A., and O'Brien, T.K., "Fatigue
Delamination Onset Prediction in Tapered Composite Laminates,
"to appear in Composite Materials: Fatique and Fracture (3rd
Volume), ASTM STP iii0, T.K. O'Brien, Ed., 1991. Also
published as NASA TM 101673, December 1989.
• Martin, R.H., "Delamination Failure in a Unidirectional Curved
Composite Laminate,' presented at the 10th ASTM Symposium on
Composite Materials: Testing and Design, San Francisco, April,
1990. Also published as NASA CR 182018, April 1990.
. O'Brien, T.K., "Local Delamination in Laminates with Angle Ply
Matrix Cracks: Part II - Delamination Analysis and
Characterization," to be presented at the 4th ASTM Symposium
on Composite Materials: Fatigue and Fracture, Indianapolis,
May 6-7, 1991. Also published as NASA TM 104076, 1991.
• Martin, R.H., "Analysis of Delamination Onset and Growth in
Curved Laminates," to be presented at the 8th ASCE Engineering
Mechanics Speciality Conference, Ohio State University,
Columbus, Ohio, May 19-22, 1991.
24

•
•
•
i0.
ii.
12.
13.
14.
15.
16.
Salpekar, S.A., and O'Brien, T.K., "Combined Effect of Matrix
Cracking and Stress-Free Edge on Delamination," to be
published in Composite Materials: Fatique and Fracture (3rd
Volume), ASTM STP iii0, T.K. O'Brien, Ed., American Society
for Testing and Materials, Philadelphia, 1991.
Sun, C.T., and Kelly, S.R., "Failure in Composite Angle
Structures - Part II: Onset of Delamination," Journal of
Reinforced Plastics and Composites, Vol. 7, May 1988,
pp. 233-244•
Paul, P.C., Saff, C.R., Sanger, K.B., Mahler, M.A., Kan, H.P.,
and Kautz, E.F., "Analysis and Test Techniques for Composite
Structures Subjected to Out of Plane Loads," presented at the
10th ASTM Symposium on Composite Materials: Testing and
Design, San Francisco, April, 1990.
Murri, G.B., and Martin R.H., "Effect of Initial Delamination
on Mode I and Mode II Interlaminar Fracture Toughness and
Fatigue Fracture Threshold," to be presented at the 4th ASTM
Symposium on Composite Materials: Fatigue and Fracture,
Indianapolis, Indiana, May 6-9, 1991.
Martin, R.H., and O'Brien, T.K., "Characterizing Mode I
Fatigue Delamination of Composite Materials," Proceedings of
the American Society for Composites, Fourth Technical
Conference, Blacksburg, Virginia, October 1989, pp. 257-266•
Ko, W.L. and Jackson, R.H., "Multilayer Theory for
Delamination Analysis of a Composite Curved Bar Subjected to
End Forces and End Moments," Composite Structures 5:
Proceedings of the 5th International Conference, Paisley,
Scotland, July 24-26, 1989, pp. 173-198.
NASTRAN Users Manual, Version 66B,
Corporation, Los Angeles, November 1989.
MacNeal-Schwendler
Shivakumar, K.N., Tan, P.W., and Newman, J.C., Jr., "A Virtual
Crack-Closure Technique for Calculating Stress Intensity
Factors for Cracked Three Dimensional Bodies," International
Journal of Fracture, Vol. 36, 1988, pp. R43-R50.
Sun, C.T., and Jih, C.J., "On the Strain Energy Release Ratesfor Interfacial Cracks in Bi-Material Media," Engineering
Fracture Mechanics, 28:13-27, 1987.
Chang, F.K., and Springer, G.S., "The Strengths of Fiber
Reinforced Composite Bends," Journal of Composite Materials,
Vol. 20, January 1986, pp. 30-45•
25

17.
18.
19.
Sun, C.T., and Kelly, S.R., "Failure in Composite Angle" Journal of ReinforcedStructures Part I: Initial Failure,
Plastics and Composites, Vol. 7, May 1988, pp. 220-232.
Hart-Smith, L.J., "Some Observations About Test Specimens and
Structural Analysis for Fibrous Composites," CompQsite
Materials: Testinq and Design (Ninth Volume), ASTM STP 1059,
S.P. Garbo, Ed., American Society for Testing and Materials,
Philadelphia, 1990, pp. 86-120.
Tsai, S.W., "Strength Theories of Filamentary Structures"
Fundamental Aspects of Fiber Reinforced Plastic Composites,
R.T. Schwartz and H.S. Schwartz, Eds., Wiley Interscience, New
York, pp. 3-11, 1968.
26

J
..0
,o8
iim
"- 0")
0"-
I,,.
m
0
/
27
e-
E
"10
OL,.
O
(1)
OE
E
"tO
e--
if)
g
c-OO
t_
!
U_

28

I I I I I I I I
0 0 0 0 0 0 0 0CO I_ _D _ _r _ _ _-
I-nToI I I
0 0 000 _ _D
[]
A
z
I I I I I0 0 0 0 0
Zv
0
0 _r_
o_
E
o0
E
0
(-
0 =
0_r _ °_
(-
(-
!
LLI0
29

EE
C_
LI,
C_
EE
I!in
G_
Ciim
/
EE
3O
OI_I,._IF.AL P!_,GE
BLACK A_D WHFTE PHOTOGRAPN
Load cell
Load appliedvia hinge
Specimen
Pivotpin
t iiiii!!iii

I I I
0 0 0
[]
A
Zv
32

m
[][]
i [] 0_1,.-1
I I I n I I
o o o o o o
El::
- 0
0
0
I'"0
0 ,r,,,,
[] []I I I I I I
0 0 0 0 0 0
-E
I
0
E0
o
c°i
0
CO
0
I¢1
ce-
0
"0c
0
c
E
h,.
I
b:
U.
33

- 0
D
_I [] -0
O0
oo []L--..m L.--._
D,,_.
OLC'J _jII
IIl_q- r'lO
[]
D
I I I I
T- T-
E _Z
O,r-
o
m
"o
T"
O
Oo_r-,
D rm ¢)DI I
OI
O In OL%I _r- I--
12. Z
in o
o
r-
E
"o
u
"Io
o.
(/)l/)
oU
O
e-
¢/)
O)
"O
0')!
06
LL
34

/
_m
CL-'1
r0i
(D
c--
E
"O(D
fJ
EeClO
i
oic_
U.
WI,,,L
35
ORiGiNAL PAGE ISOF POOR QUALITY
36
ORIGINAL PAGE ISOF POOR QUALITY
n
._1
E
m
o_E_
, 0
,10
m
"0o,l--
E_, 0
v
e-
e-
E
e-o_
e-
"D
o
!
I.L
37

x"r_
EE
2
t-O
o_
c
E
"0
0
c-O
._
0Z
!
N
U.
38
l-
r-
e0
oDI,--
>
(nu)
u)
r-u)
r-
°_
"0
rrI
(6
i,
3g
I
;0
,_=,-_ ' 0
,,<,u.
IIIIIIIIIIIIIIIIIIII!IIIIIIIIII!IIIIIIIIII
I!I!I!I
I ,
c')0
0
I I
_0
_ 0
0
0- CO
0- U')
_ 0
-0
- 0(_1
_0
C_l T- 0
4.J
r-
r-
t-O
°_
°m
>U)U)
4--*
U)
°i
Ca)
O)r"
J
LL
AeL,-
E
40

,_.IE
E
II
to
O
or_ '_
oi,i.
t,l')
'_'_ i III II I
-1 D iII
I I I
II
I
o.
m.O
-c_
m n
C)
q)
@O G
L--
I
"Oo--
(I)O
O,o--
o--'L
(,¢)U)
r-
"10e-
o--
"O
n-!
u_
U-
4.1

WLU
oa_
0
© o0
0
0
0
L J JLt_ _r
o
(Dod
o
n-
o
o
o
a_
o
h-i
ii
42

1 1 JO O O 0 0 O
| |
L_
t--r-
im
mI
rr
{/)6)r-
._o¢-
¢-{3)
¢-
{/)o)
u)
c-
¢-
I
LL
43

0
',ml"
ii
0')liml
00)
0ILl
I
°" -0
• C) o0)
0
0
e-e"
Im
h-i
1'1-
.W
o')O)t-
t,-'-
r-
3
_ot-
o)(,_
If)L
oIl
l-Or)
II
I.I..
'E
44
Do<O
I I
|,,', ua0 t_
I
|
W0
I
|
tl.!
0
0
0
O'J
c8.8
,4
0
¢-
¢'1
0
¢-0
e
c0
o_
t--
E
"O
¢-,m
¢..O
.m
!
c5It.
4S

0
!
m
0
c-O
00_
"z-
>
!
d
LL
E_ _E
46

m
G)"0
I
OO
dO
O ,-
r-
._ rl"|
oI',-
II
OO
o
II
IJ
1"OO
oLI1
o _1U1 _D
_" O
IIm
II
J
(1)C:
|m
main
O
C0O
_D
O
O
O
O1"Oa)
OG)L.
1,1.
.E
E(1)
r-O
E
a)-Q(/)
o
r-
"10
(/)(/)eO
r-O
°_
"E.
I
LL
47

Q
L_@ @E) "_'
C• @
q- CJ
@@ @
O0 0EE E
ILl W LU
aaa_ t'O CO
eOD
00
O400
Z
48
00
0
r_
xk_
E0
_)or;
2O)c-C3
co_
E
CD"0c-
C)
t_
!
C_J
LL

uJIL
r_i
%
II II II II
0)
"0
0
LC_0q
00
'In00
0
Z
E
49

0
00")
00
0 •CI
_,-N
IIII
i
C0 _=E
.co-x11. ILl
• 0
00 0
00
OI
- 0T I
- 0
Cm 0
- 00
ml
r"|m
E,.. m
0
I
0
I
0
I I
0
V
1_(19I
III
0
V
I
u')
I
5O
i
U
0
0
0OT-
i0
o0
e-
I1)
.I0
I1)
°_
e-o
e-
e-°_
E
e-°_
0
e-0
°_
!

O
o
Omm
u
"0
_oEwm
_UJ
II II In-._ 0
0
0
C
99
I I I IO If) O
T- T--
E ZO. v
I I I I I
Z
51
O
O
U_o
m
O U
U
OT _
O
I"
O
o.D
U
I
._
O)c-
°_
U
O
X.n
E
o
Oo_
"o
O.t
LL

0,-- N "_
ot't" _ ,.._,
0
mO0
I I I I
0 _ o
- 0
Io
m 4I Iu') 0
Im4')
.E
0
o w
m
o
0o,i-,,
0
V
I0
0
"c:(...l
(I)0°_
t-'-
0
E
L
°_(Y)iZ)
(D
C0
C0
e,-°_
E
0
c-O
"0
!
.__U_
52

Report Documentation Page',_ :,_Ct' ,%or",r_sfrafO
1. Report No.
NASA TIVl- 104089AVSCOH TR-9 I-B-009
4. Title and Subtitle
2. Government Accession No.
Damage Prediction in Cross-PliedCurved Composite Laminate
7. Author(s)
Roderick H. Martin* and Wade C. Jackson
9. Performing Organization Name and Address
NASA Langley Research Center, Hampton, VA 23665-5225U.S. Army Aviation Research and Technology Activity (AVSCOM)Aerostructures Directorate
Hampton, VA 23665-522512. Sponsoring Agency Name and Address
National Aeronautics and Space AdministrationWashington, DC 20546U.S. Army Aviation Systems CommandSt. Louis, MO 63166
3. Recipient's Catalog No.
5. Report Date
July 1991
6. Performing Organization Code
8. Performing Organization Report No.
10. Work Unit No.
505-63-50-0411. Contract or Grant No.
13. Type of Report and Period Covered
Technical Memorandum
14, Sponsoring Agency Code
15. Supplementary Notes
*Analytical Services and Materials, Inc., Hampton, VA
16. Abstract
This paper details the analytical and experimental work required to predict delamination onset and growthin a curved cross-plied composite laminate subjected to static and fatigue loads. The composite used wasAS4/3501-6, graphite/epoxy. Analytically, a closed form stress analysis and 2-D and 3-D finite element
analyses were conducted to determine the stress distribution in an undamaged curved laminate. The finiteelement analysis was also used to determine values of strain energy release rate at a delamination emanat-ing from a matrix crack in a 90 ° ply. Experimentally, transverse tensile strength and fatigue life weredetermined from flat 90 ° coupons. The interlaminar tensile strength and fatigue life were determinedfrom unidirectional curved laminates. Also, mode I fatigue and fracture toughness data were determinedfrom double cantilever beam specimens. Cross-plied curved laminates were tested statically and in fatiguto give a comparison to the analytical predictions. A comparison of the fracture mechanics life predictiontechnique and the strength based prediction technique is given.
17. Key Words (Suggested by Author(s))
Composite materialsCurved laminateDclamination
Strain energy release rate
19. Security Classif. (of this report)
Unclassified
18. Distribution Statement
Unclassified - Unlimited
Subject Category - 39
20. Security Classif. (of this page)
Unclassified
21. No. of pages
53
22. Price
A04
NASA FORM 1628 OCT 86


Related Documents


![Decision …downloads.hindawi.com/journals/complexity/2020/9602526.pdfcriteria,cangrouppatterns,wheregroupsaresetsofsimilar patterns[54,59,60].Clusteringalgorithms arewidelyap-plied](https://static.cupdf.com/doc/110x72/5f3f6490fc08093e7c56f69c/decision-criteriacangrouppatternswheregroupsaresetsofsimilar-patterns545960clusteringalgorithms.jpg)