Yusen Air & Sea Service Co., Ltd. Annual Report 2007 The cornerstone of an impressive worldwide network

Welcome message from author
This document is posted to help you gain knowledge. Please leave a comment to let me know what you think about it! Share it to your friends and learn new things together.
Transcript
Yusen Air & Sea Service Co., Ltd. A n n u a l R e p o r t 2007
Printed in Japan
Yusen Hakozaki-cho Building, 30-1, Nihonbashi Hakozaki-cho, Chuo-ku,
Tokyo 103-0015, Japan Phone: +81-3-3669-4381
Fax: +81-3-3669-8540 URL: http://www.yusen.co.jp/
YUSEN
AIR &
SEA SERVICE CO
., LTD. A
nnual Report 2007
The cornerstone of an impressive worldwide network
2
●
●
●
●
●
●
●
●
●
●
●
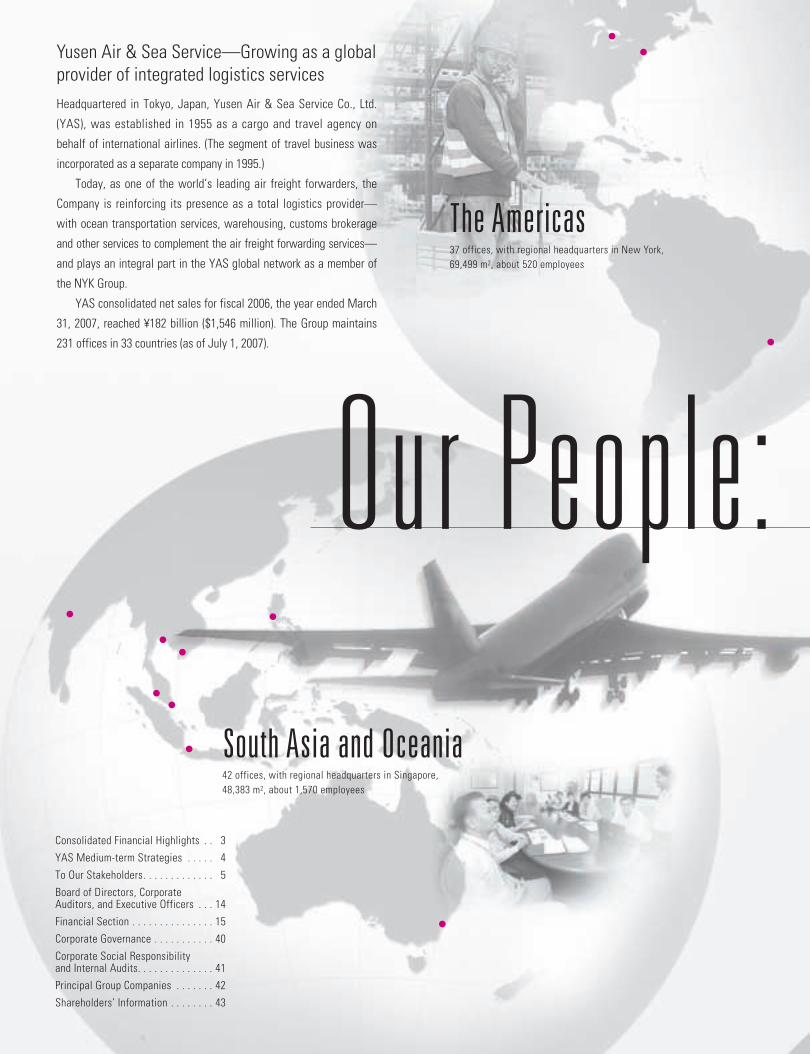
The Americas
South Asia and Oceania
37 offices, with regional headquarters in New York, 69,499 m2, about 520 employees
42 offices, with regional headquarters in Singapore, 48,383 m2, about 1,570 employees
Yusen Air & Sea Service—Growing as a globalprovider of integrated logistics servicesHeadquartered in Tokyo, Japan, Yusen Air & Sea Service Co., Ltd.
(YAS), was established in 1955 as a cargo and travel agency on
behalf of international airlines. (The segment of travel business was
incorporated as a separate company in 1995.)
Today, as one of the world’s leading air freight forwarders, the
Company is reinforcing its presence as a total logistics provider—
with ocean transportation services, warehousing, customs brokerage
and other services to complement the air freight forwarding services—
and plays an integral part in the YAS global network as a member of
the NYK Group.
YAS consolidated net sales for fiscal 2006, the year ended March
31, 2007, reached ¥182 billion ($1,546 million). The Group maintains
231 offices in 33 countries (as of July 1, 2007).
Consolidated Financial Highlights . . 3
YAS Medium-term Strategies . . . . . 4
To Our Stakeholders. . . . . . . . . . . . . 5
Board of Directors, Corporate Auditors, and Executive Officers . . . 14
Financial Section . . . . . . . . . . . . . . . 15
Corporate Governance . . . . . . . . . . . 40
Corporate Social Responsibility and Internal Audits. . . . . . . . . . . . . . 41
Principal Group Companies . . . . . . . 42
Shareholders’ Information . . . . . . . . 43
Our Peop le :
2
Shareholders’ Information(As of March 31, 2007)
43
For Further Information Contact:Corporate Communications & IR Department, Yusen Air & Sea Service Co., Ltd.
E-mail: [email protected]
Head Office Yusen Hakozaki-cho Building,
30-1, Nihonbashi Hakozaki-cho, Chuo-ku,
Tokyo 103-0015, Japan
Phone: +81-3-3669-4381
Fax: +81-3-3669-8540
URL: http://www.yusen.co.jp/
Established February 28, 1955
Paid-in Capital ¥4,301 million
Common Shares Authorized: 80,000,000
Issued: 42,220,800Number of Shareholders 3,645
Number of Employees 4,769(Consolidated)
Annual Meeting The annual meeting of shareholders is held in
June in Tokyo, Japan.
Independent Registered Public Accounting Firm
Deloitte Touche Tohmatsu
MS Shibaura Building, 13-23, Shibaura
4-chome, Minato-ku, Tokyo 108-8530, Japan
Transfer Agent The Mitsubishi UFJ Trust and Banking
Corporation
4-5, Marunouchi 1-chome, Chiyoda-ku,
Tokyo 100-8212, Japan
Stock Listing First Section of Tokyo Stock Exchange
Stock PriceYears ended March 31 (Yen)
2003 2004 2005 2006 2007
3,800 6,840 3,750High 1,670 3,480 4,740 *1 3,480 *3
4,940 *2
3,310 3,500 2,330Low 920 1,100 3,640 *1 2,950 *3
4,290 *2
The above table sets forth the high and low sale prices in the:* 1 Tokyo Stock Exchange (from February 28, 2005);* 2 Jasdaq Securities Exchange (from December 13, 2004, to February 27, 2005)
Other data are based on announcements by the Japan Securities DealersAssociation.
* 3 Indicates the ex-rights price by stock split.
Principal ShareholdersThousands of Percentage of
Name shares voting rights
Nippon Yusen Kabushiki Kaisha 25,123 59.69
Japan Trustee Services Bank, Limited
(Trust Account) 1,760 4.18
The Master Trust Bank of Japan, Limited
(Trust Account) 1,749 4.15
State Street Bank and Trust Company 1,697 4.03
Yamato Holdings Co., Ltd. 605 1.43
Mixx 573 1.36
Japan Trustee Services Bank, Limited
(Trust Account 4) 540 1.28
The Bank of Tokyo-Mitsubishi UFJ, Ltd. 537 1.27
HSBC Bank BLC Account
Atlantis Japan Growth Fund 479 1.13
Tokio Marine & Nichido Fire Insurance Co., Ltd. 406 0.96
a
b
c
d
efg h
i j
a
b
c
d
e
f g h
a
bc
a
bc
d
e
200,000
150,000
100,000
50,000
0
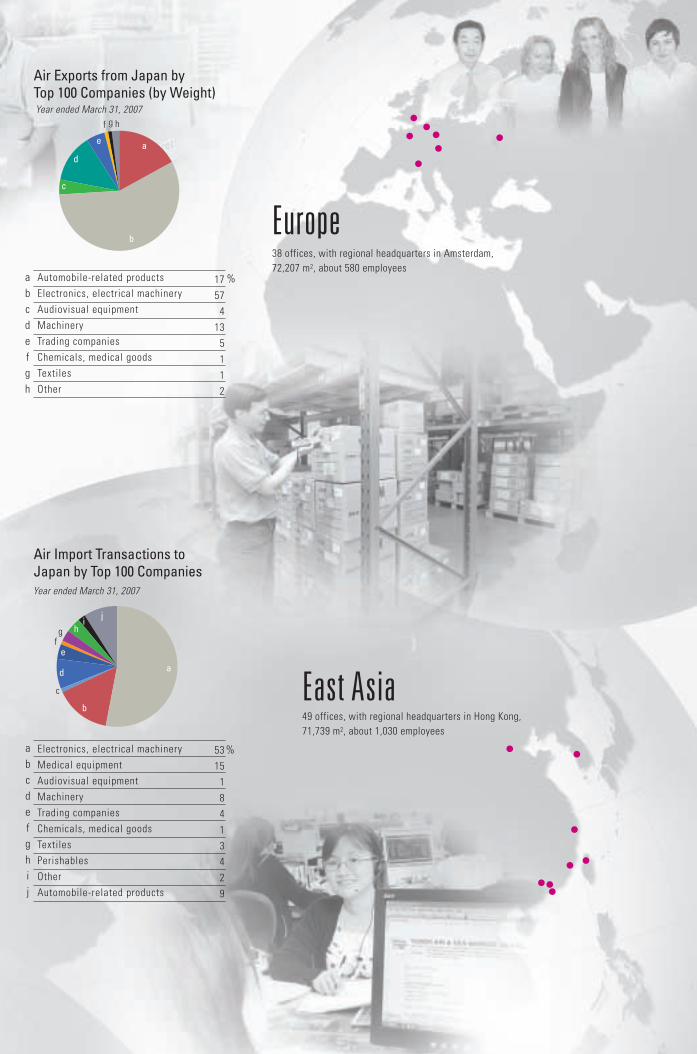
Automobile-related products Electronics, electrical machinery Audiovisual equipment Machinery Trading companiesChemicals, medical goods Textiles Other
1757
413
5112
Year ended March 31, 2007 Year ended March 31, 2007
2005 2006 2007
Air Exports from Japan byTop 100 Companies (by Weight)
Electronics, electrical machinery Medical equipment Audiovisual equipment Machinery Trading companiesChemicals, medical goods Textiles Perishables Other Automobile-related products
%
%
Air Import Transactions to Japan by Top 100 CompaniesYear ended March 31, 2007
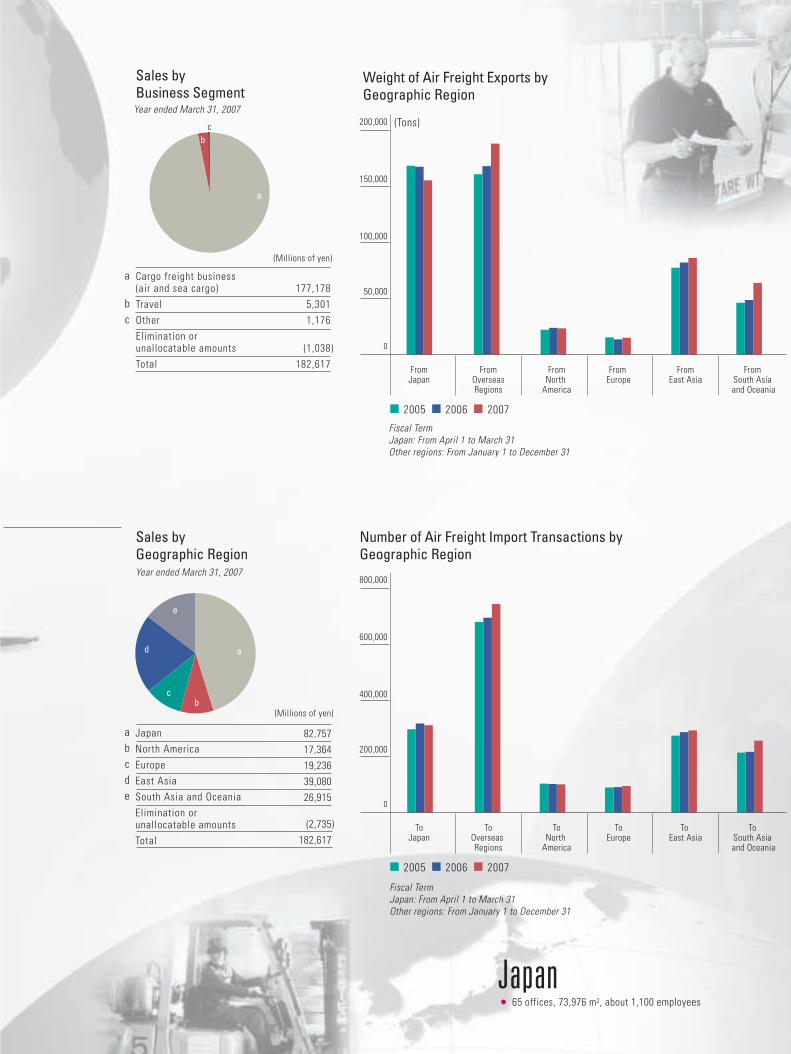
Sales by Geographic Region
Sales by Business Segment
Cargo freight business (air and sea cargo) 177,178Travel 5,301Other 1,176Elimination or unallocatable amounts (1,038)Total 182,617
Number of Air Freight Import Transactions by Geographic Region
Weight of Air Freight Exports by Geographic Region
Year ended March 31, 2007
5315
18413429
abcdefghij
abcde
a
bc
(Millions of yen)
FromJapan
FromNorth
America
From Europe
FromOverseasRegions
FromEast Asia
From South Asia and Oceania
800,000
600,000
400,000
200,000
0
2005 2006 2007
ToJapan
ToNorth
America
ToEurope
ToOverseas Regions
To East Asia
To South Asia and Oceania
abcdefgh
Fiscal Term Japan: From April 1 to March 31Other regions: From January 1 to December 31
Fiscal TermJapan: From April 1 to March 31Other regions: From January 1 to December 31
(Millions of yen)
(Tons)
JapanNorth America Europe East Asia South Asia and Oceania Elimination or unallocatable amountsTotal
82,75717,36419,23639,08026,915
(2,735)182,617
●
●●
●
●●
●
●●
●●●
●
●
●●
Japan
Europe
East Asia49 offices, with regional headquarters in Hong Kong, 71,739 m2, about 1,030 employees
65 offices, 73,976 m2, about 1,100 employees
38 offices, with regional headquarters in Amsterdam, 72,207 m2, about 580 employees
Japan
The Amer i cas
Eu rope
Eas t As i a
Sou th As i a and Ocean i a
Regional Strategic Objectives
●
●
●
●
●
●
●
●
●
●
Fiscal 2006
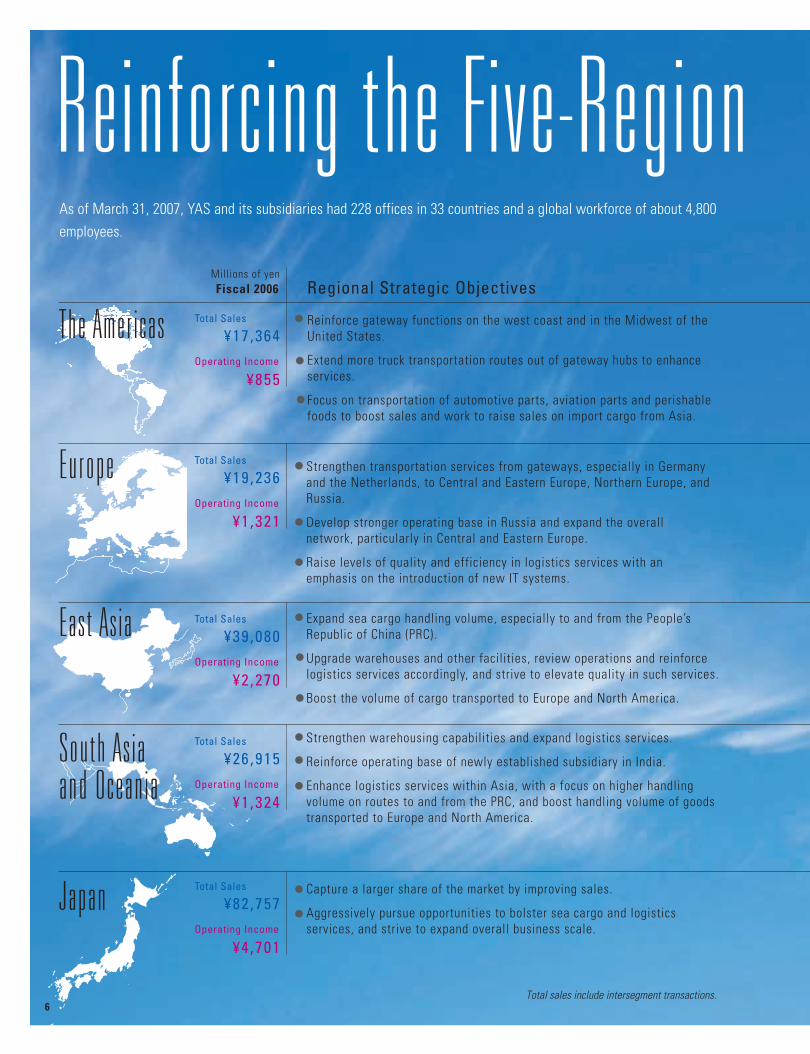
¥82 ,757
¥4 ,701
Total Sales
Millions of yen
Operating Income
¥17 ,364
¥855
Total Sales
Operating Income
¥19 ,236
¥1 ,321
Total Sales
Operating Income
¥39 ,080
¥2 ,270
Total Sales
Operating Income
¥26 ,915
¥1 ,324
Total Sales
Operating Income
Capture a larger share of the market by improving sales.
Aggressively pursue opportunities to bolster sea cargo and logistics services, and strive to expand overall business scale.
Strengthen warehousing capabilities and expand logistics services.
Reinforce operating base of newly established subsidiary in India.
Enhance logistics services within Asia, with a focus on higher handling volume on routes to and from the PRC, and boost handling volume of goods transported to Europe and North America.
Expand sea cargo handling volume, especially to and from the People’s Republic of China (PRC).
Upgrade warehouses and other facilities, review operations and reinforce logistics services accordingly, and strive to elevate quality in such services.
Boost the volume of cargo transported to Europe and North America.
Strengthen transportation services from gateways, especially in Germany and the Netherlands, to Central and Eastern Europe, Northern Europe, and Russia.
Develop stronger operating base in Russia and expand the overall network, particularly in Central and Eastern Europe.
Raise levels of quality and efficiency in logistics services with an emphasis on the introduction of new IT systems.
Reinforce gateway functions on the west coast and in the Midwest of the United States.
Extend more truck transportation routes out of gateway hubs to enhance services.
Focus on transportation of automotive parts, aviation parts and perishable foods to boost sales and work to raise sales on import cargo from Asia.
●
●
●
●
Total sales include intersegment transactions.6
Reinforcing the Five-RegionAs of March 31, 2007, YAS and its subsidiaries had 228 offices in 33 countries and a global workforce of about 4,800employees.
a
b
c
d
efg h
i j
a
b
c
d
e
f g h
a
bc
a
bc
d
e
200,000
150,000
100,000
50,000
0
Automobile-related products Electronics, electrical machinery Audiovisual equipment Machinery Trading companiesChemicals, medical goods Textiles Other
1757
413
5112
Year ended March 31, 2007 Year ended March 31, 2007
2005 2006 2007
Air Exports from Japan byTop 100 Companies (by Weight)
Electronics, electrical machinery Medical equipment Audiovisual equipment Machinery Trading companiesChemicals, medical goods Textiles Perishables Other Automobile-related products
%
%
Air Import Transactions to Japan by Top 100 CompaniesYear ended March 31, 2007
Sales by Geographic Region
Sales by Business Segment
Cargo freight business (air and sea cargo) 177,178Travel 5,301Other 1,176Elimination or unallocatable amounts (1,038)Total 182,617
Number of Air Freight Import Transactions by Geographic Region
Weight of Air Freight Exports by Geographic Region
Year ended March 31, 2007
5315
18413429
abcdefghij
abcde
a
bc
(Millions of yen)
FromJapan
FromNorth
America
From Europe
FromOverseasRegions
FromEast Asia
From South Asia and Oceania
800,000
600,000
400,000
200,000
0
2005 2006 2007
ToJapan
ToNorth
America
ToEurope
ToOverseas Regions
To East Asia
To South Asia and Oceania
abcdefgh
Fiscal Term Japan: From April 1 to March 31Other regions: From January 1 to December 31
Fiscal TermJapan: From April 1 to March 31Other regions: From January 1 to December 31
(Millions of yen)
(Tons)
JapanNorth America Europe East Asia South Asia and Oceania Elimination or unallocatable amountsTotal
82,75717,36419,23639,08026,915
(2,735)182,617
●
●●
●
●●
●
●●
●●●
●
●
●●
Japan
Europe
East Asia49 offices, with regional headquarters in Hong Kong, 71,739 m2, about 1,030 employees
65 offices, 73,976 m2, about 1,100 employees
38 offices, with regional headquarters in Amsterdam, 72,207 m2, about 580 employees
Japan
The Amer i cas
Eu rope
Eas t As i a
Sou th As i a and Ocean i a
Regional Strategic Objectives
●
●
●
●
●
●
●
●
●
●
Fiscal 2006
¥82 ,757
¥4 ,701
Total Sales
Millions of yen
Operating Income
¥17 ,364
¥855
Total Sales
Operating Income
¥19 ,236
¥1 ,321
Total Sales
Operating Income
¥39 ,080
¥2 ,270
Total Sales
Operating Income
¥26 ,915
¥1 ,324
Total Sales
Operating Income
Capture a larger share of the market by improving sales.
Aggressively pursue opportunities to bolster sea cargo and logistics services, and strive to expand overall business scale.
Strengthen warehousing capabilities and expand logistics services.
Reinforce operating base of newly established subsidiary in India.
Enhance logistics services within Asia, with a focus on higher handling volume on routes to and from the PRC, and boost handling volume of goods transported to Europe and North America.
Expand sea cargo handling volume, especially to and from the People’s Republic of China (PRC).
Upgrade warehouses and other facilities, review operations and reinforce logistics services accordingly, and strive to elevate quality in such services.
Boost the volume of cargo transported to Europe and North America.
Strengthen transportation services from gateways, especially in Germany and the Netherlands, to Central and Eastern Europe, Northern Europe, and Russia.
Develop stronger operating base in Russia and expand the overall network, particularly in Central and Eastern Europe.
Raise levels of quality and efficiency in logistics services with an emphasis on the introduction of new IT systems.
Reinforce gateway functions on the west coast and in the Midwest of the United States.
Extend more truck transportation routes out of gateway hubs to enhance services.
Focus on transportation of automotive parts, aviation parts and perishable foods to boost sales and work to raise sales on import cargo from Asia.
●
●
●
●
Total sales include intersegment transactions.6
Reinforcing the Five-RegionAs of March 31, 2007, YAS and its subsidiaries had 228 offices in 33 countries and a global workforce of about 4,800employees.
5
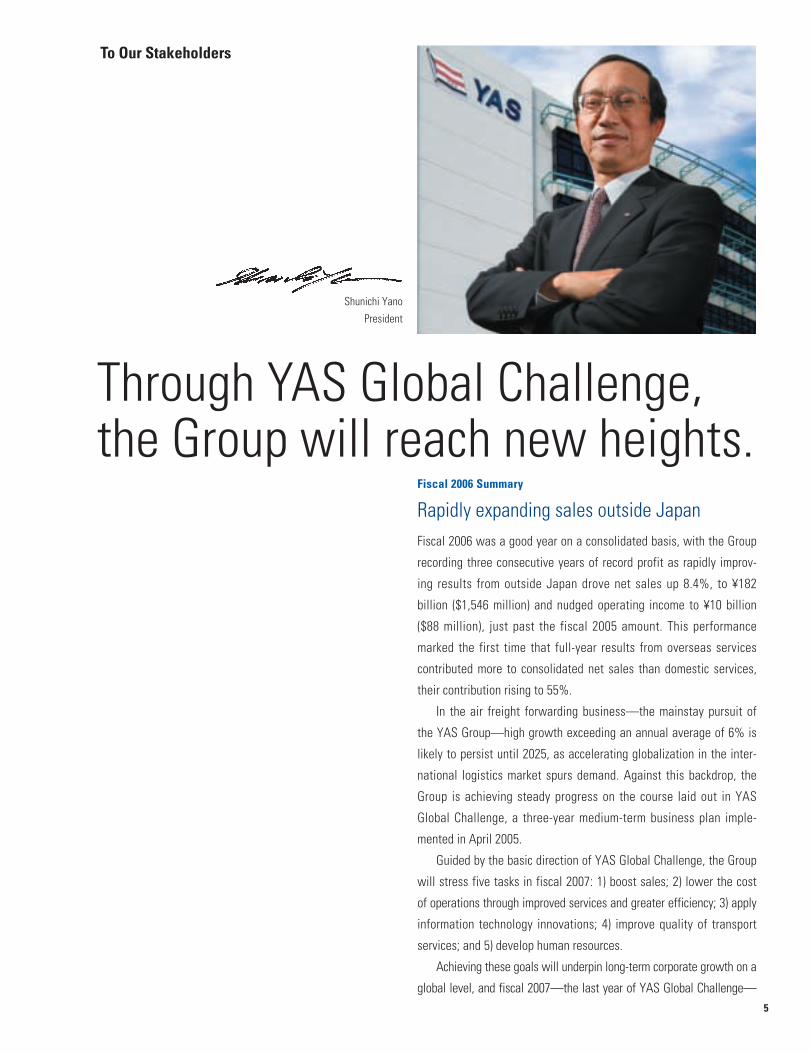
Through YAS Global Challenge, the Group will reach new heights.
To Our Stakeholders
Fiscal 2006 Summary
Rapidly expanding sales outside JapanFiscal 2006 was a good year on a consolidated basis, with the Group
recording three consecutive years of record profit as rapidly improv-
ing results from outside Japan drove net sales up 8.4%, to ¥182
billion ($1,546 million) and nudged operating income to ¥10 billion
($88 million), just past the fiscal 2005 amount. This performance
marked the first time that full-year results from overseas services
contributed more to consolidated net sales than domestic services,
their contribution rising to 55%.
In the air freight forwarding business—the mainstay pursuit of
the YAS Group—high growth exceeding an annual average of 6% is
likely to persist until 2025, as accelerating globalization in the inter-
national logistics market spurs demand. Against this backdrop, the
Group is achieving steady progress on the course laid out in YAS
Global Challenge, a three-year medium-term business plan imple-
mented in April 2005.
Guided by the basic direction of YAS Global Challenge, the Group
will stress five tasks in fiscal 2007: 1) boost sales; 2) lower the cost
of operations through improved services and greater efficiency; 3) apply
information technology innovations; 4) improve quality of transport
services; and 5) develop human resources.
Achieving these goals will underpin long-term corporate growth on a
global level, and fiscal 2007—the last year of YAS Global Challenge—
Shunichi Yano
President
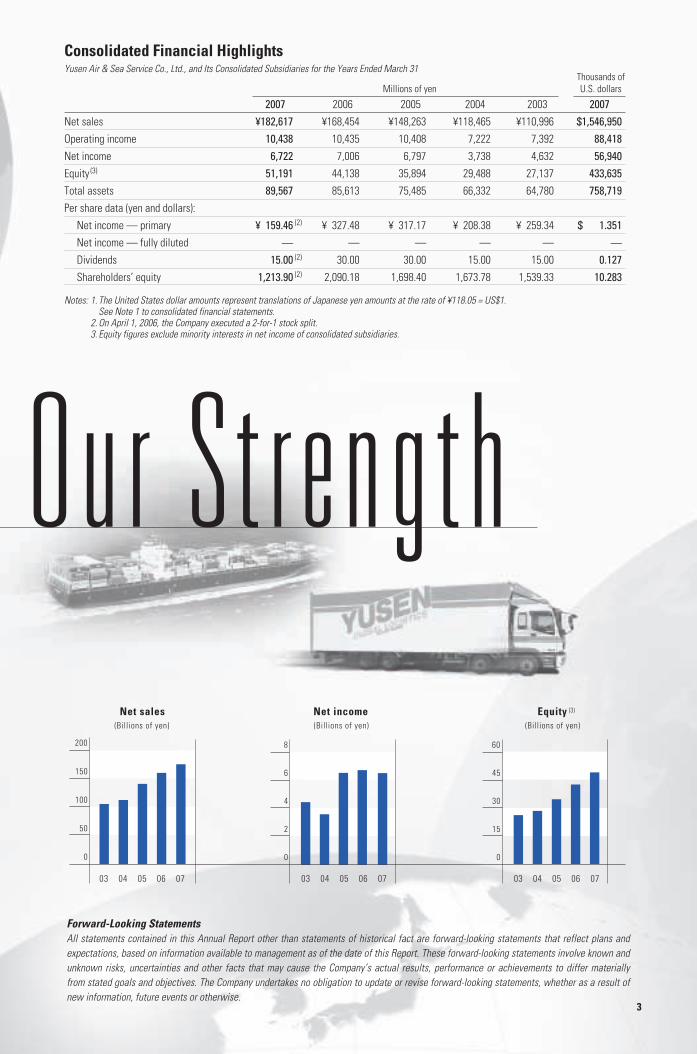
Consolidated Financial HighlightsYusen Air & Sea Service Co., Ltd., and Its Consolidated Subsidiaries for the Years Ended March 31
3
Net sales Net income Equity (3)
200
0
50
100
150
8
0
2
4
6
(Billions of yen)
60
0
15
30
45
(Billions of yen) (Billions of yen)
03 04 05 06 07 03 04 05 06 0703 04 05 06 07
Forward-Looking StatementsAll statements contained in this Annual Report other than statements of historical fact are forward-looking statements that reflect plans andexpectations, based on information available to management as of the date of this Report. These forward-looking statements involve known andunknown risks, uncertainties and other facts that may cause the Company’s actual results, performance or achievements to differ materiallyfrom stated goals and objectives. The Company undertakes no obligation to update or revise forward-looking statements, whether as a result ofnew information, future events or otherwise.
4
Our St rength
Thousands ofMillions of yen U.S. dollars
2007 2006 2005 2004 2003 2007Net sales ¥182,617 ¥168,454 ¥148,263 ¥118,465 ¥110,996 $1,546,950Operating income 10,438 10,435 10,408 7,222 7,392 88,418Net income 6,722 7,006 6,797 3,738 4,632 56,940Equity (3) 51,191 44,138 35,894 29,488 27,137 433,635Total assets 89,567 85,613 75,485 66,332 64,780 758,719Per share data (yen and dollars):
Net income — primary ¥ 159.46 (2) ¥ 327.48 ¥ 317.17 ¥ 208.38 ¥ 259.34 $ 1.351Net income — fully diluted — — — — — —Dividends 15.00 (2) 30.00 30.00 15.00 15.00 0.127Shareholders’ equity 1,213.90 (2) 2,090.18 1,698.40 1,673.78 1,539.33 10.283
Notes: 1. The United States dollar amounts represent translations of Japanese yen amounts at the rate of ¥118.05 = US$1.See Note 1 to consolidated financial statements.
2. On April 1, 2006, the Company executed a 2-for-1 stock split.3. Equity figures exclude minority interests in net income of consolidated subsidiaries.
3
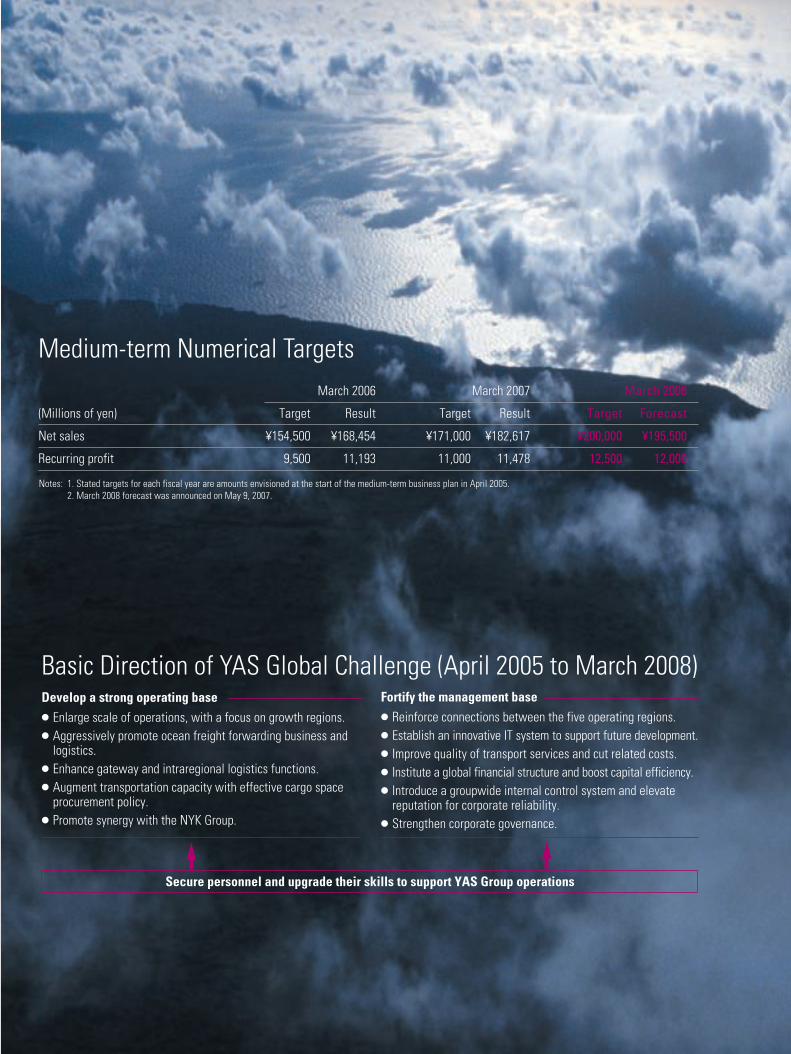
Develop a strong operating base● Enlarge scale of operations, with a focus on growth regions.● Aggressively promote ocean freight forwarding business and
logistics.● Enhance gateway and intraregional logistics functions.● Augment transportation capacity with effective cargo space
procurement policy.● Promote synergy with the NYK Group.
Fortify the management base● Reinforce connections between the five operating regions.● Establish an innovative IT system to support future development. ● Improve quality of transport services and cut related costs.● Institute a global financial structure and boost capital efficiency.● Introduce a groupwide internal control system and elevate
reputation for corporate reliability.● Strengthen corporate governance.
Basic Direction of YAS Global Challenge (April 2005 to March 2008)
Secure personnel and upgrade their skills to support YAS Group operations
March 2006 March 2007 March 2008
(Millions of yen) Target Result Target Result Target Forecast
Net sales ¥154,500 ¥168,454 ¥171,000 ¥182,617 ¥200,000 ¥195,500
Recurring profit 9,500 11,193 11,000 11,478 12,500 12,000
Notes: 1. Stated targets for each fiscal year are amounts envisioned at the start of the medium-term business plan in April 2005.2. March 2008 forecast was announced on May 9, 2007.
Medium-term Numerical Targets
5
Through YAS Global Challenge, the Group will reach new heights.
To Our Stakeholders
Fiscal 2006 Summary
Rapidly expanding sales outside JapanFiscal 2006 was a good year on a consolidated basis, with the Group
recording three consecutive years of record profit as rapidly improv-
ing results from outside Japan drove net sales up 8.4%, to ¥182
billion ($1,546 million) and nudged operating income to ¥10 billion
($88 million), just past the fiscal 2005 amount. This performance
marked the first time that full-year results from overseas services
contributed more to consolidated net sales than domestic services,
their contribution rising to 55%.
In the air freight forwarding business—the mainstay pursuit of
the YAS Group—high growth exceeding an annual average of 6% is
likely to persist until 2025, as accelerating globalization in the inter-
national logistics market spurs demand. Against this backdrop, the
Group is achieving steady progress on the course laid out in YAS
Global Challenge, a three-year medium-term business plan imple-
mented in April 2005.
Guided by the basic direction of YAS Global Challenge, the Group
will stress five tasks in fiscal 2007: 1) boost sales; 2) lower the cost
of operations through improved services and greater efficiency; 3) apply
information technology innovations; 4) improve quality of transport
services; and 5) develop human resources.
Achieving these goals will underpin long-term corporate growth on a
global level, and fiscal 2007—the last year of YAS Global Challenge—
Shunichi Yano
President
Consolidated Financial HighlightsYusen Air & Sea Service Co., Ltd., and Its Consolidated Subsidiaries for the Years Ended March 31
3
Net sales Net income Equity (3)
200
0
50
100
150
8
0
2
4
6
(Billions of yen)
60
0
15
30
45
(Billions of yen) (Billions of yen)
03 04 05 06 07 03 04 05 06 0703 04 05 06 07
Forward-Looking StatementsAll statements contained in this Annual Report other than statements of historical fact are forward-looking statements that reflect plans andexpectations, based on information available to management as of the date of this Report. These forward-looking statements involve known andunknown risks, uncertainties and other facts that may cause the Company’s actual results, performance or achievements to differ materiallyfrom stated goals and objectives. The Company undertakes no obligation to update or revise forward-looking statements, whether as a result ofnew information, future events or otherwise.
4
Our St rength
Thousands ofMillions of yen U.S. dollars
2007 2006 2005 2004 2003 2007Net sales ¥182,617 ¥168,454 ¥148,263 ¥118,465 ¥110,996 $1,546,950Operating income 10,438 10,435 10,408 7,222 7,392 88,418Net income 6,722 7,006 6,797 3,738 4,632 56,940Equity (3) 51,191 44,138 35,894 29,488 27,137 433,635Total assets 89,567 85,613 75,485 66,332 64,780 758,719Per share data (yen and dollars):
Net income — primary ¥ 159.46 (2) ¥ 327.48 ¥ 317.17 ¥ 208.38 ¥ 259.34 $ 1.351Net income — fully diluted — — — — — —Dividends 15.00 (2) 30.00 30.00 15.00 15.00 0.127Shareholders’ equity 1,213.90 (2) 2,090.18 1,698.40 1,673.78 1,539.33 10.283
Notes: 1. The United States dollar amounts represent translations of Japanese yen amounts at the rate of ¥118.05 = US$1.See Note 1 to consolidated financial statements.
2. On April 1, 2006, the Company executed a 2-for-1 stock split.3. Equity figures exclude minority interests in net income of consolidated subsidiaries.
3
Develop a strong operating base● Enlarge scale of operations, with a focus on growth regions.● Aggressively promote ocean freight forwarding business and
logistics.● Enhance gateway and intraregional logistics functions.● Augment transportation capacity with effective cargo space
procurement policy.● Promote synergy with the NYK Group.
Fortify the management base● Reinforce connections between the five operating regions.● Establish an innovative IT system to support future development. ● Improve quality of transport services and cut related costs.● Institute a global financial structure and boost capital efficiency.● Introduce a groupwide internal control system and elevate
reputation for corporate reliability.● Strengthen corporate governance.
Basic Direction of YAS Global Challenge (April 2005 to March 2008)
Secure personnel and upgrade their skills to support YAS Group operations
March 2006 March 2007 March 2008
(Millions of yen) Target Result Target Result Target Forecast
Net sales ¥154,500 ¥168,454 ¥171,000 ¥182,617 ¥200,000 ¥195,500
Recurring profit 9,500 11,193 11,000 11,478 12,500 12,000
Notes: 1. Stated targets for each fiscal year are amounts envisioned at the start of the medium-term business plan in April 2005.2. March 2008 forecast was announced on May 9, 2007.
Medium-term Numerical Targets
a
b
c
d
efg h
i j
a
b
c
d
e
f g h
a
bc
a
bc
d
e
200,000
150,000
100,000
50,000
0
Automobile-related products Electronics, electrical machinery Audiovisual equipment Machinery Trading companiesChemicals, medical goods Textiles Other
1757
413
5112
Year ended March 31, 2007 Year ended March 31, 2007
2005 2006 2007
Air Exports from Japan byTop 100 Companies (by Weight)
Electronics, electrical machinery Medical equipment Audiovisual equipment Machinery Trading companiesChemicals, medical goods Textiles Perishables Other Automobile-related products
%
%
Air Import Transactions to Japan by Top 100 CompaniesYear ended March 31, 2007
Sales by Geographic Region
Sales by Business Segment
Cargo freight business (air and sea cargo) 177,178Travel 5,301Other 1,176Elimination or unallocatable amounts (1,038)Total 182,617
Number of Air Freight Import Transactions by Geographic Region
Weight of Air Freight Exports by Geographic Region
Year ended March 31, 2007
5315
18413429
abcdefghij
abcde
a
bc
(Millions of yen)
FromJapan
FromNorth
America
From Europe
FromOverseasRegions
FromEast Asia
From South Asia and Oceania
800,000
600,000
400,000
200,000
0
2005 2006 2007
ToJapan
ToNorth
America
ToEurope
ToOverseas Regions
To East Asia
To South Asia and Oceania
abcdefgh
Fiscal Term Japan: From April 1 to March 31Other regions: From January 1 to December 31
Fiscal TermJapan: From April 1 to March 31Other regions: From January 1 to December 31
(Millions of yen)
(Tons)
JapanNorth America Europe East Asia South Asia and Oceania Elimination or unallocatable amountsTotal
82,75717,36419,23639,08026,915
(2,735)182,617
●
●●
●
●●
●
●●
●●●
●
●
●●
Japan
Europe
East Asia49 offices, with regional headquarters in Hong Kong, 71,739 m2, about 1,030 employees
65 offices, 73,976 m2, about 1,100 employees
38 offices, with regional headquarters in Amsterdam, 72,207 m2, about 580 employees
Japan
The Amer i cas
Eu rope
Eas t As i a
Sou th As i a and Ocean i a
Regional Strategic Objectives
●
●
●
●
●
●
●
●
●
●
Fiscal 2006
¥82 ,757
¥4 ,701
Total Sales
Millions of yen
Operating Income
¥17 ,364
¥855
Total Sales
Operating Income
¥19 ,236
¥1 ,321
Total Sales
Operating Income
¥39 ,080
¥2 ,270
Total Sales
Operating Income
¥26 ,915
¥1 ,324
Total Sales
Operating Income
Capture a larger share of the market by improving sales.
Aggressively pursue opportunities to bolster sea cargo and logistics services, and strive to expand overall business scale.
Strengthen warehousing capabilities and expand logistics services.
Reinforce operating base of newly established subsidiary in India.
Enhance logistics services within Asia, with a focus on higher handling volume on routes to and from the PRC, and boost handling volume of goods transported to Europe and North America.
Expand sea cargo handling volume, especially to and from the People’s Republic of China (PRC).
Upgrade warehouses and other facilities, review operations and reinforce logistics services accordingly, and strive to elevate quality in such services.
Boost the volume of cargo transported to Europe and North America.
Strengthen transportation services from gateways, especially in Germany and the Netherlands, to Central and Eastern Europe, Northern Europe, and Russia.
Develop stronger operating base in Russia and expand the overall network, particularly in Central and Eastern Europe.
Raise levels of quality and efficiency in logistics services with an emphasis on the introduction of new IT systems.
Reinforce gateway functions on the west coast and in the Midwest of the United States.
Extend more truck transportation routes out of gateway hubs to enhance services.
Focus on transportation of automotive parts, aviation parts and perishable foods to boost sales and work to raise sales on import cargo from Asia.
●
●
●
●
Total sales include intersegment transactions.6
Reinforcing the Five-RegionAs of March 31, 2007, YAS and its subsidiaries had 228 offices in 33 countries and a global workforce of about 4,800employees.
will be crucial to this effort. Indeed, fiscal 2007 will be a springboard,
launching the Group to new heights from fiscal 2008 onward.
We, the management, also recognize the importance of a stronger
shareholder-oriented perspective on operations. The Company will
thus strive earnestly to achieve the targets stated in YAS Global
Challenge and thereby realize a return of profits to shareholders that
is commensurate with our growth.
Fundamental Strategy
Five Closely Knit Regions Facilitate TotalLogistics ServicesYAS maintains a five-region international structure, with regional
headquarters in Japan, the Americas, Europe, East Asia and South
Asia/Oceania. Creating closer ties between and among these regions
is fundamental to stronger Group operations.
Another priority is to increase transactions
with all customers regardless of nationality in
all regions, including Japan. This is a vital
component of the Group’s strategy to enhance
operating revenues, and for this reason, the
Company has delegated authority and respon-
sibility to regional executive officers who can
then make decisions appropriate to respec-
tive markets. In addition, because local staff
represent almost 70% of the Group’s total
workforce of about 4,800 people, YAS supports the implementation
of training programs specifically tailored to the cultural environment
and organizational maturity of respective offices outside Japan.
Emphasizing local perspectives will attract the interest of local
companies.
A growing trend among clients is to combine air and ocean
freight forwarding in an effort to balance transportation costs and
inventory status. In response, the Group is working to reinforce the
ocean freight forwarding aspect of its logistics capabilities.
Expanded expertise in ocean freight forwarding as well as the
logistics business will round out mainstay air freight forwarding oper-
ations and cement the Group’s position as a provider of total logistics
services. In turn, this will underpin enhanced profitability from the
five, interconnected key regions.
Office Network
Enhanced Structure in Markets ParticularlyReceptive to World Economic TrendsThe globalization taking place in the world’s economy has not only
7
Fiscal 2006 Topics
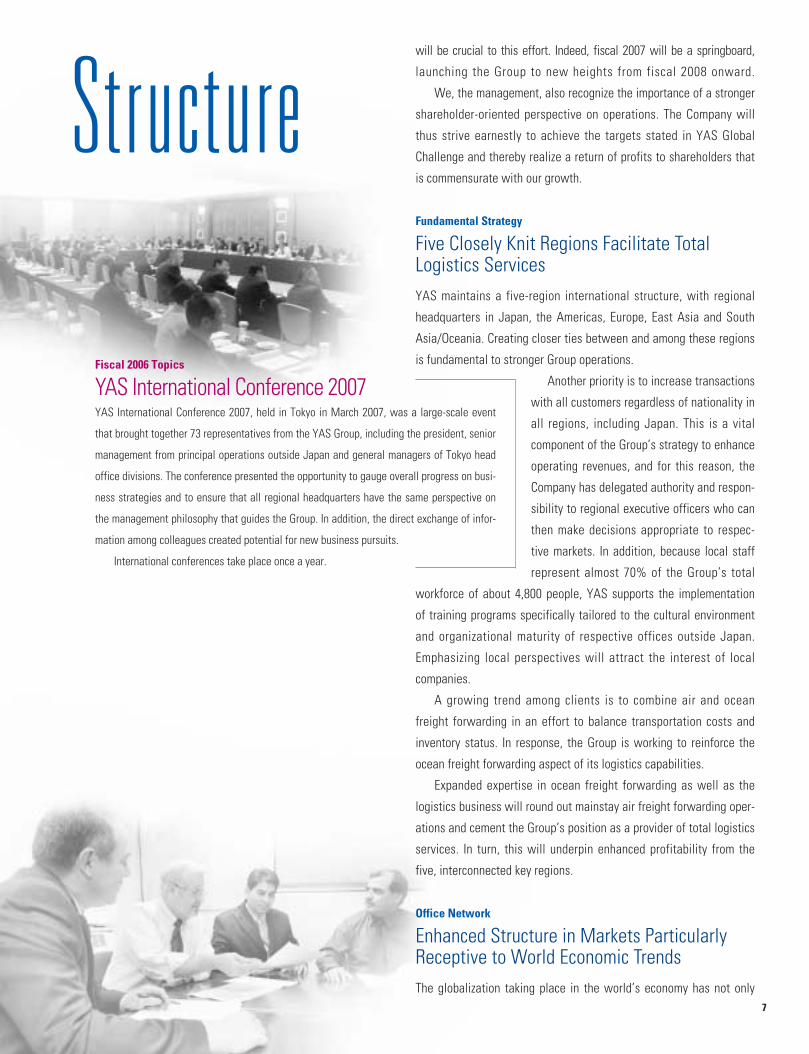
YAS International Conference 2007YAS International Conference 2007, held in Tokyo in March 2007, was a large-scale event
that brought together 73 representatives from the YAS Group, including the president, senior
management from principal operations outside Japan and general managers of Tokyo head
office divisions. The conference presented the opportunity to gauge overall progress on busi-
ness strategies and to ensure that all regional headquarters have the same perspective on
the management philosophy that guides the Group. In addition, the direct exchange of infor-
mation among colleagues created potential for new business pursuits.
International conferences take place once a year.
Structure
88
India India has recently captured the investment interest of many foreign-owned businesses, including Japanesecompanies, especially those engaged in the production of two- and four-wheeled vehicles. To strengthen the Group’spresence in this market, Yusen Air & Sea Service (Singapore) Pte. Ltd. established Yusen Air & Sea Service (India) Pvt.Ltd., with headquarters in New Delhi and a branch in Bangalore.
Business activities began in early April 2007 with a focus on automotive parts and components imported from otherparts of Asia, including Japan, but the subsidiary will also tailor logistics services to clients in other industries needingto send and receive such products as agricultural commodities, heavy machinery, chemicals, pharmaceuticals andelectronic components.
The logistics market in India boasts tremendous growth potential. YAS India is sure to acquire a prominent positionin the local market, and YAS has considered adding bases in such cities as Mumbai in the west and Chennai in the eastto ensure that the subsidiary and its offices can meet evolving client needs.
Central and Eastern Europe and Russia Wider country participation the EuropeanUnion and accelerated investment by Japanese companies in Central and Eastern Europe have spurred the need forlogistics services, especially for automotive- and digital electronics–related parts. To address heightened demand,YAS began actively expanding the Group’s presence in this region in 2000, culminating most recently with the cre-ation of a branch in Budapest, Hungary, under the control of Yusen Air & Sea Service (Deutschland) GmbH., theestablishment of a subsidiary in Prague, in the Czech Republic, and the opening of representative offices in Istanbul,Turkey, Krakow, Poland, Vienna, Austria, and Moscow, Russia.
Seeking to enhance services in Poland, YAS Deutschland set up a branch in Warsaw in February 2007 and broughtthe Krakow representative office under the branch’s control in April 2007.
The Moscow representative office was officially approved for upgrade to subsidiary status, and a complementarybranch was set up in St. Petersburg, where operations commenced at the end of June 2007.
Network Expansion in GrowthThe YAS Group is working to reinforce its sales structure and expand the market for logistics services in Brazil,Russia, India and the PRC—the BRICs countries—and Central and Eastern Europe, where its solid industrial expertiseis drawing attention.
increased the movement of cargo across borders even within the
same region—a situation especially true in Europe and Asia—but
has also spurred demand for logistics services between regions and
greater requests for transportation of cargo from one country to
another without going through Japan.
This trend has become more pronounced in recent years, and the
YAS Group has successfully capitalized on emerging opportunities,
substantiated by rapid growth in the volume of air freight originating
in the high-growth regions of East Asia and South Asia/Oceania.
As principal bases for the packaging, collection and delivery of air
and ocean freight, gateways are a vital component of logistics
services. Against the backdrop of sustained demand for logistics
services in fiscal 2006, YAS continued to rein-
force gateway functions in key cities—Los
Angeles and Chicago, for the Americas;
Frankfurt and Amsterdam, for Europe; Hong
Kong and Shanghai, for East Asia; and in
Singapore, for South Asia/Oceania—and
enhanced its capabilities in growth markets,
with a focus on Russia, Vietnam, India and
the PRC.
As far as routes are concerned, those
between the United States and Europe still
present YAS with considerable room for
expansion. The Company will direct concerted
efforts toward a stronger presence on such
routes.
To sharpen its competitive edge and there-
by improve overall ability to meet heightened
interest among clients for door-to-door logis-
tics services, YAS must enhance its trans-
portation capabilities. A key element of this
strategy is for the Company to extend its reach
into cities located inland from gateways,
especially in the United States, Europe and
the PRC.
A full range of forwarding possibilities is
also extremely important to the promotion of
international logistics services, and support for supply chain manage-
ment and value-added warehousing for cargo storage and inventory
management are indispensable to today’s logistics services. With
this in mind, YAS continued to reinforce existing facilities, including
warehouses, and add new sites for enhanced services, in fiscal 2006.
The Company also drew on the merits afforded by the synergistic
9
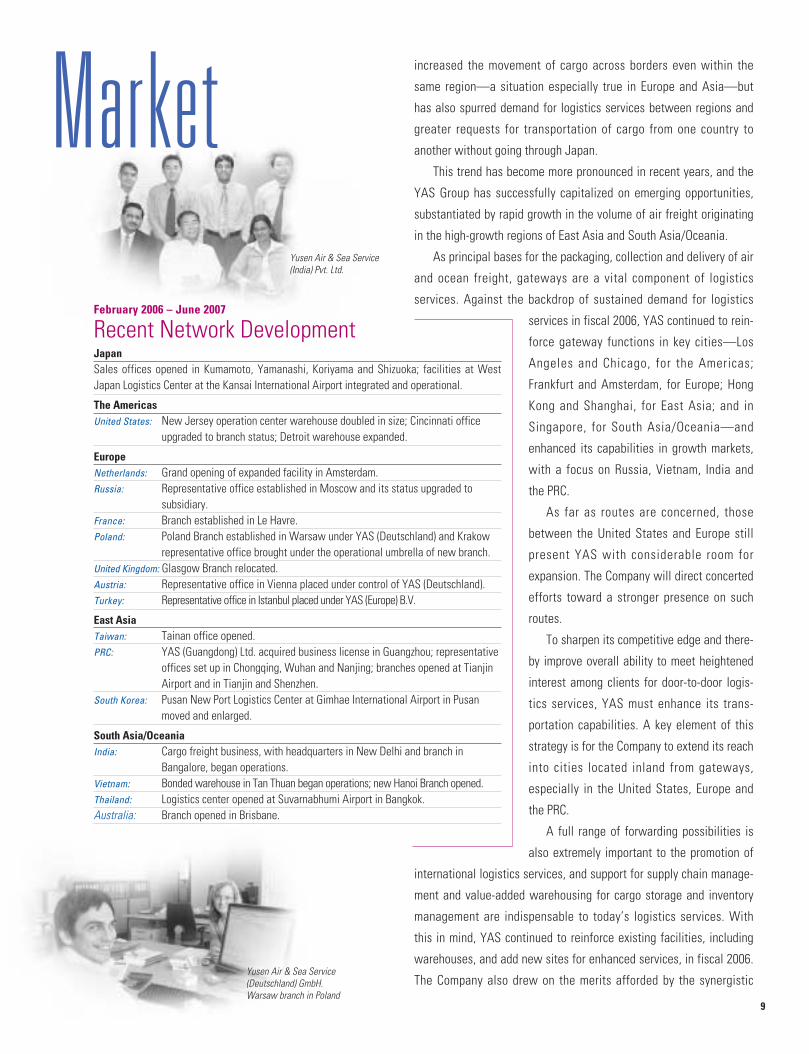
February 2006 – June 2007
Recent Network DevelopmentJapanSales offices opened in Kumamoto, Yamanashi, Koriyama and Shizuoka; facilities at WestJapan Logistics Center at the Kansai International Airport integrated and operational.
The Americas United States: New Jersey operation center warehouse doubled in size; Cincinnati office
upgraded to branch status; Detroit warehouse expanded.
EuropeNetherlands: Grand opening of expanded facility in Amsterdam.Russia: Representative office established in Moscow and its status upgraded to
subsidiary.France: Branch established in Le Havre.Poland: Poland Branch established in Warsaw under YAS (Deutschland) and Krakow
representative office brought under the operational umbrella of new branch.United Kingdom: Glasgow Branch relocated.Austria: Representative office in Vienna placed under control of YAS (Deutschland).Turkey: Representative office in Istanbul placed under YAS (Europe) B.V.
East Asia Taiwan: Tainan office opened. PRC: YAS (Guangdong) Ltd. acquired business license in Guangzhou; representative
offices set up in Chongqing, Wuhan and Nanjing; branches opened at TianjinAirport and in Tianjin and Shenzhen.
South Korea: Pusan New Port Logistics Center at Gimhae International Airport in Pusanmoved and enlarged.
South Asia/OceaniaIndia: Cargo freight business, with headquarters in New Delhi and branch in
Bangalore, began operations.Vietnam: Bonded warehouse in Tan Thuan began operations; new Hanoi Branch opened.Thailand: Logistics center opened at Suvarnabhumi Airport in Bangkok.Australia: Branch opened in Brisbane.
Yusen Air & Sea Service (India) Pvt. Ltd.
Yusen Air & Sea Service(Deutschland) GmbH.Warsaw branch in Poland
Market
1010
Global Partnership Agreement with Panalpina ManagementIn February 2007, YAS and Panalpina Management concluded an all-encompassing reciprocal freight and forwardingagreement covering the global operations of the YAS Group and the Panalpina Group.
The Panalpina Group, headquartered in Basel, Switzerland, is one of the world’s premier providers of forwardingand logistics services and demonstrates excellence in supply chain management solutions combining intercontinentalair and ocean cargo transportation.
Under the agreement, YAS will act as agent for Panalpina in Japan. In return, YAS gains access to Panalpina’sextensive network of some 500 branches in more than 80 countries around the world, further strengthening YAS’global network.
An alliance steering committee is currently being assembled with participants from both corporate groups, andservices utilizing integrated capabilities and networks will be phased in during 2007.
Complemented by the service strengths of the Panalpina Group, the YAS Group will greatly enhance its marketingprowess. In Asia, YAS will extend accumulated groupwide expertise to the mutual benefit of both companies andrespective groups.
10

11
Monika Riber, CEO of Panalpia Management Ltd., and Shunichi Yano, President of YAS
relationship that exists between itself and its parent company, NYK,
to achieve the fullest range of services possible.
YAS’ operations are characterized by a relatively asset-light for-
mula, wherein the Company leases fixed assets. The relationship
with NYK is particularly advantageous in making facilities investment
more efficient since the YAS Group can, for example, utilize ware-
houses and transportation systems that NYK maintains in the inland
provinces of the PRC and in Russia, Eastern Europe and India as well
as in markets where YAS itself has already established a solid pres-
ence with less of a burden on cash flow than rival companies must
shoulder.
Business Alliances
Strategic Alliances with Leading Companiesat Home and AbroadIn fiscal 2006, YAS concluded business alliances that will significant-
ly support the development of Group capabilities.
On the domestic front, YAS formed a business alliance with
Yamato Logistics Co., Ltd., a subsidiary of Yamato Holdings Co., Ltd.,
in May 2006. In line with this alliance, the Company initiated coload-
ing of air freight leaving Japan as an export or entering Japan as an
import from global markets.
A new service that may be launched soon combines the YAS
Group’s enviable global network with the Yamato Group’s top-tier
domestic distribution network. The primary advantage afforded by
this service will be expedited delivery to final destinations, a feature
that given the intense competition that characterizes the air cargo
industry today will distinguish YAS as a logistics service provider
with business approaches perfectly tailored to clients’ needs.
Stronger Operating Base
Greater Efficiency and Accuracy in LogisticsServices
A variety of concerns, albeit temporary, com-
pounded underlying issues in the fiscal 2006
operating environment, which served to sus-
tain downward pressure on earnings in
Japan. Despite the challenges of this situa-
tion, the YAS Group intends to achieve
growth exceeding the market average.
Fiscal 2007 Strategy in Japan
Attack 10The head office in Tokyo and other members of the YAS Group in Japan embarked on this
intense one-year project in April 2007. The underlying concept is “Back to the Basics,” and
the project will entail a review of services and the subsequent rationalization of operations to
tighten all expenses, excluding air freight costs, by about ¥1 billion. Through this project, YAS
will review its workflows and execute service restructuring with an eye to the next medium-
term business plan to achieve sustainable cost-cutting effects over the medium to long term.
The end result will be a revitalized, forward-looking service structure built for success.
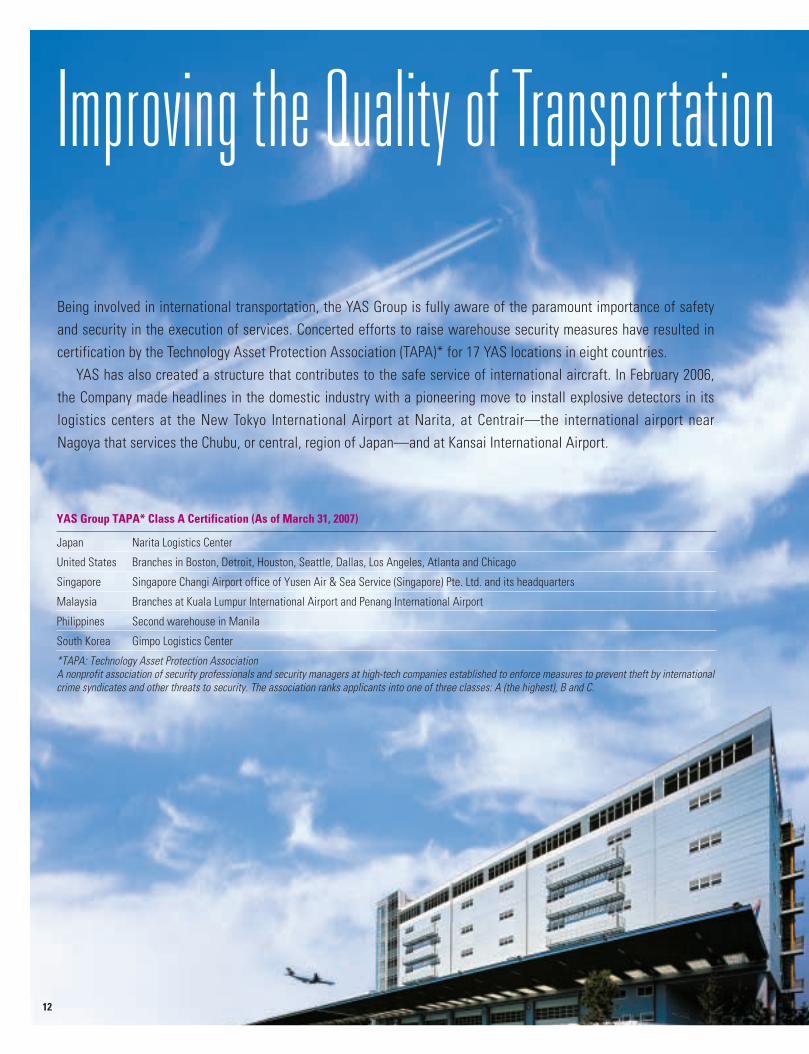
*TAPA: Technology Asset Protection AssociationA nonprofit association of security professionals and security managers at high-tech companies established to enforce measures to prevent theft by internationalcrime syndicates and other threats to security. The association ranks applicants into one of three classes: A (the highest), B and C.
Japan Narita Logistics Center
United States Branches in Boston, Detroit, Houston, Seattle, Dallas, Los Angeles, Atlanta and Chicago
Singapore Singapore Changi Airport office of Yusen Air & Sea Service (Singapore) Pte. Ltd. and its headquarters
Malaysia Branches at Kuala Lumpur International Airport and Penang International Airport
Philippines Second warehouse in Manila
South Korea Gimpo Logistics Center
12
Being involved in international transportation, the YAS Group is fully aware of the paramount importance of safetyand security in the execution of services. Concerted efforts to raise warehouse security measures have resulted incertification by the Technology Asset Protection Association (TAPA)* for 17 YAS locations in eight countries.
YAS has also created a structure that contributes to the safe service of international aircraft. In February 2006,the Company made headlines in the domestic industry with a pioneering move to install explosive detectors in itslogistics centers at the New Tokyo International Airport at Narita, at Centrair—the international airport nearNagoya that services the Chubu, or central, region of Japan—and at Kansai International Airport.
Improving the Quality of Transportation
YAS Group TAPA* Class A Certification (As of March 31, 2007)
13
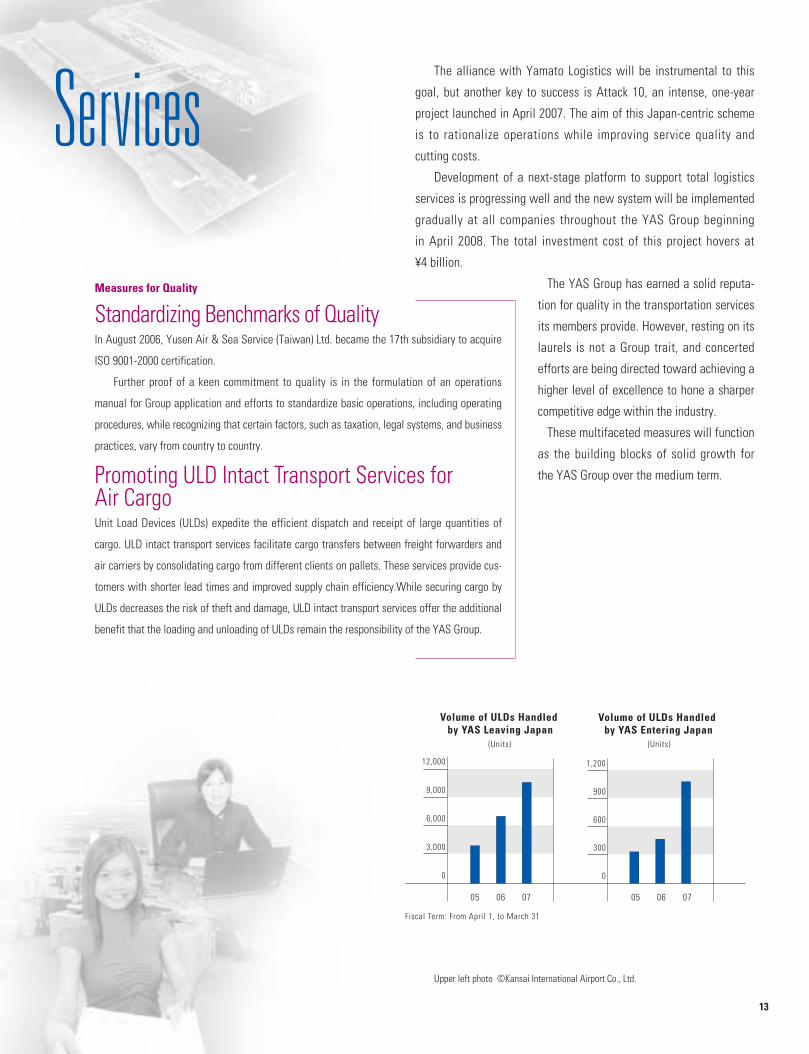
The alliance with Yamato Logistics will be instrumental to this
goal, but another key to success is Attack 10, an intense, one-year
project launched in April 2007. The aim of this Japan-centric scheme
is to rationalize operations while improving service quality and
cutting costs.
Development of a next-stage platform to support total logistics
services is progressing well and the new system will be implemented
gradually at all companies throughout the YAS Group beginning
in April 2008. The total investment cost of this project hovers at
¥4 billion.
The YAS Group has earned a solid reputa-
tion for quality in the transportation services
its members provide. However, resting on its
laurels is not a Group trait, and concerted
efforts are being directed toward achieving a
higher level of excellence to hone a sharper
competitive edge within the industry.
These multifaceted measures will function
as the building blocks of solid growth for
the YAS Group over the medium term.
Volume of ULDs Handled by YAS Leaving Japan
Volume of ULDs Handled by YAS Entering Japan
12,000
0
3,000
6,000
9,000
1,200
0
300
600
900
(Units)
Fiscal Term: From April 1, to March 31
(Units)
05 06 0705 06 07
Measures for Quality
Standardizing Benchmarks of QualityIn August 2006, Yusen Air & Sea Service (Taiwan) Ltd. became the 17th subsidiary to acquire
ISO 9001-2000 certification.
Further proof of a keen commitment to quality is in the formulation of an operations
manual for Group application and efforts to standardize basic operations, including operating
procedures, while recognizing that certain factors, such as taxation, legal systems, and business
practices, vary from country to country.
Promoting ULD Intact Transport Services for Air CargoUnit Load Devices (ULDs) expedite the efficient dispatch and receipt of large quantities of
cargo. ULD intact transport services facilitate cargo transfers between freight forwarders and
air carriers by consolidating cargo from different clients on pallets. These services provide cus-
tomers with shorter lead times and improved supply chain efficiency.While securing cargo by
ULDs decreases the risk of theft and damage, ULD intact transport services offer the additional
benefit that the loading and unloading of ULDs remain the responsibility of the YAS Group.
Upper left photo ©Kansai International Airport Co., Ltd.
Services
14
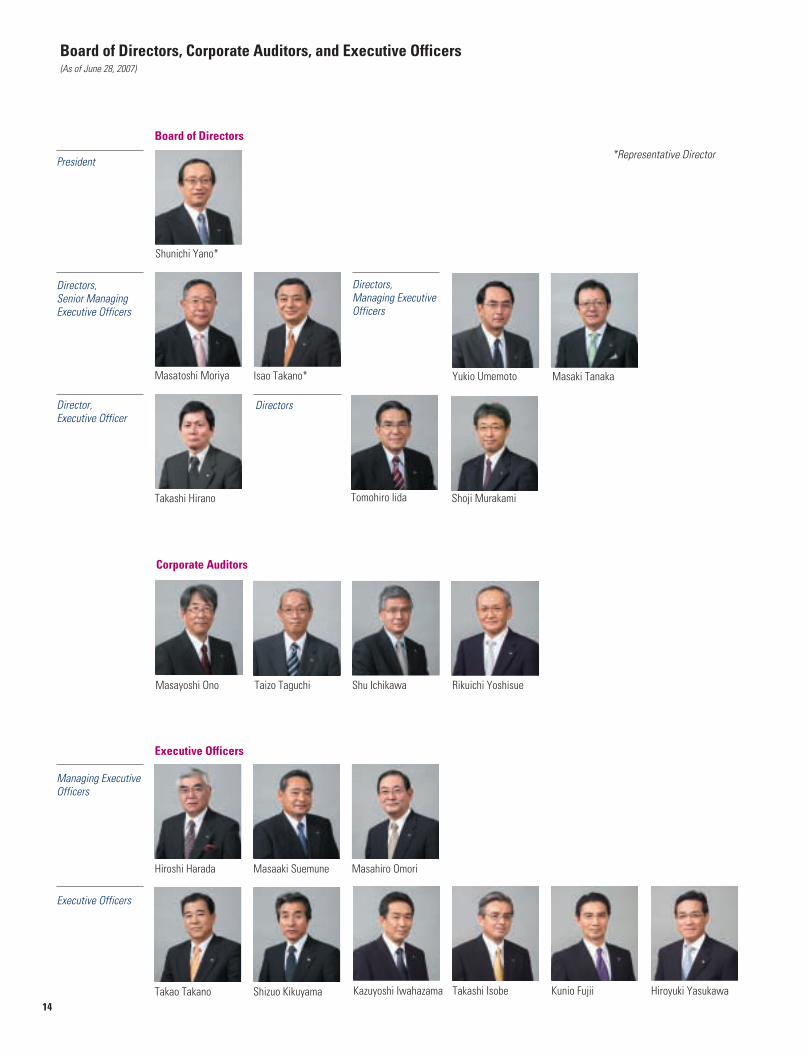
Board of Directors, Corporate Auditors, and Executive Officers(As of June 28, 2007)
President
Directors, Senior ManagingExecutive Officers
Masatoshi Moriya
Shunichi Yano*
Directors, Managing ExecutiveOfficers
Masaki TanakaIsao Takano* Yukio Umemoto
Director, Executive Officer
Directors
Tomohiro IidaTakashi Hirano Shoji Murakami
Rikuichi YoshisueTaizo TaguchiMasayoshi Ono
Managing ExecutiveOfficers
Shu Ichikawa
Shizuo KikuyamaTakao Takano
Masahiro OmoriMasaaki SuemuneHiroshi Harada
*Representative Director
Kazuyoshi Iwahazama Takashi Isobe Kunio Fujii Hiroyuki Yasukawa
Executive Officers
Board of Directors
Corporate Auditors
Executive Officers

15
Consolidated Six-Year Summary . . . . . . . . . . . . . . . . . . . . . . . . . . . . . . 16
Management’s Discussion and Analysis. . . . . . . . . . . . . . . . . . . . . . . . 17
Consolidated Balance Sheets . . . . . . . . . . . . . . . . . . . . . . . . . . . . . . . . 22
Consolidated Statements of Income . . . . . . . . . . . . . . . . . . . . . . . . . . . 24
Consolidated Statements of Changes in Equity . . . . . . . . . . . . . . . . . . 25
Consolidated Statements of Cash Flows. . . . . . . . . . . . . . . . . . . . . . . . 26
Notes to Consolidated Financial Statements . . . . . . . . . . . . . . . . . . . . 27
Independent Auditors’ Report . . . . . . . . . . . . . . . . . . . . . . . . . . . . . . . . 39
Financial Section
16
Millions of yen
2007 2006 2005 2004 2003 2002
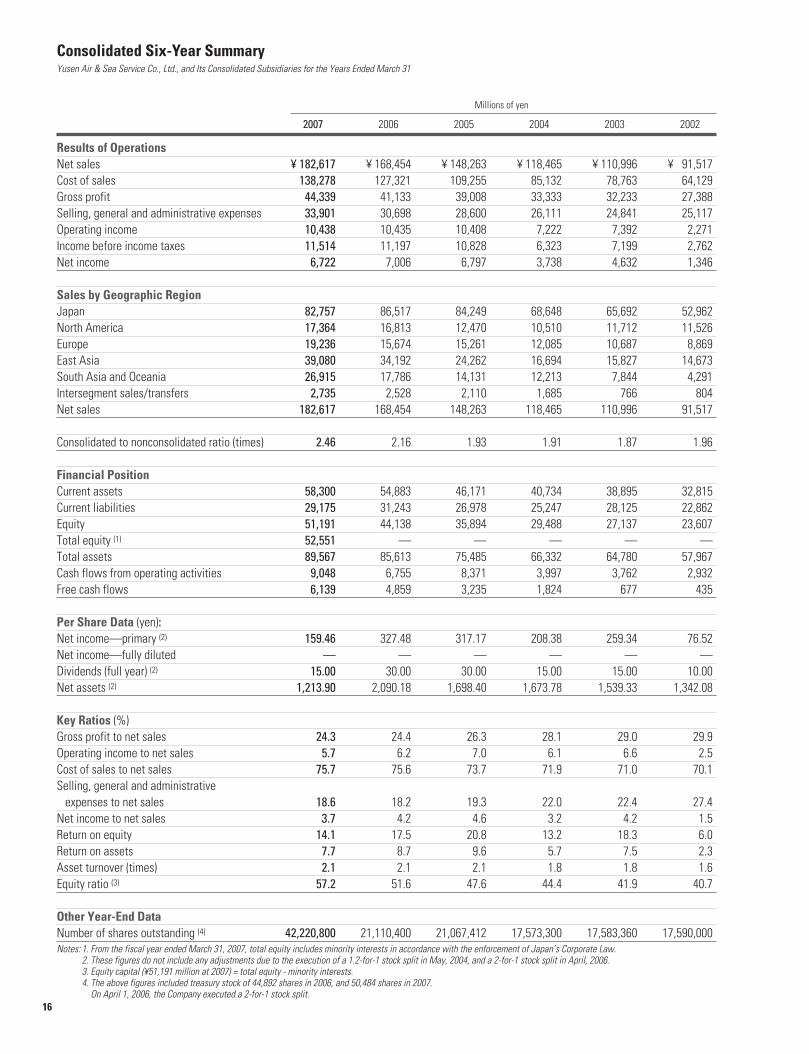
Results of OperationsNet sales ¥ 182,617 ¥ 168,454 ¥ 148,263 ¥ 118,465 ¥ 110,996 ¥ 91,517 Cost of sales 138,278 127,321 109,255 85,132 78,763 64,129 Gross profit 44,339 41,133 39,008 33,333 32,233 27,388 Selling, general and administrative expenses 33,901 30,698 28,600 26,111 24,841 25,117 Operating income 10,438 10,435 10,408 7,222 7,392 2,271 Income before income taxes 11,514 11,197 10,828 6,323 7,199 2,762 Net income 6,722 7,006 6,797 3,738 4,632 1,346
Sales by Geographic RegionJapan 82,757 86,517 84,249 68,648 65,692 52,962 North America 17,364 16,813 12,470 10,510 11,712 11,526 Europe 19,236 15,674 15,261 12,085 10,687 8,869 East Asia 39,080 34,192 24,262 16,694 15,827 14,673 South Asia and Oceania 26,915 17,786 14,131 12,213 7,844 4,291 Intersegment sales/transfers 2,735 2,528 2,110 1,685 766 804Net sales 182,617 168,454 148,263 118,465 110,996 91,517
Consolidated to nonconsolidated ratio (times) 2.46 2.16 1.93 1.91 1.87 1.96
Financial PositionCurrent assets 58,300 54,883 46,171 40,734 38,895 32,815 Current liabilities 29,175 31,243 26,978 25,247 28,125 22,862 Equity 51,191 44,138 35,894 29,488 27,137 23,607 Total equity (1) 52,551 — — — — —Total assets 89,567 85,613 75,485 66,332 64,780 57,967 Cash flows from operating activities 9,048 6,755 8,371 3,997 3,762 2,932 Free cash flows 6,139 4,859 3,235 1,824 677 435
Per Share Data (yen):Net income—primary (2) 159.46 327.48 317.17 208.38 259.34 76.52 Net income—fully diluted — — — — — —Dividends (full year) (2) 15.00 30.00 30.00 15.00 15.00 10.00 Net assets (2) 1,213.90 2,090.18 1,698.40 1,673.78 1,539.33 1,342.08
Key Ratios (%)Gross profit to net sales 24.3 24.4 26.3 28.1 29.0 29.9 Operating income to net sales 5.7 6.2 7.0 6.1 6.6 2.5 Cost of sales to net sales 75.7 75.6 73.7 71.9 71.0 70.1 Selling, general and administrative
expenses to net sales 18.6 18.2 19.3 22.0 22.4 27.4 Net income to net sales 3.7 4.2 4.6 3.2 4.2 1.5 Return on equity 14.1 17.5 20.8 13.2 18.3 6.0 Return on assets 7.7 8.7 9.6 5.7 7.5 2.3 Asset turnover (times) 2.1 2.1 2.1 1.8 1.8 1.6 Equity ratio (3) 57.2 51.6 47.6 44.4 41.9 40.7
Other Year-End DataNumber of shares outstanding (4) 42,220,800 21,110,400 21,067,412 17,573,300 17,583,360 17,590,000 Notes: 1. From the fiscal year ended March 31, 2007, total equity includes minority interests in accordance with the enforcement of Japan’s Corporate Law.
2. These figures do not include any adjustments due to the execution of a 1.2-for-1 stock split in May, 2004, and a 2-for-1 stock split in April, 2006. 3. Equity capital (¥51,191 million at 2007) = total equity - minority interests.4. The above figures included treasury stock of 44,892 shares in 2006, and 50,484 shares in 2007.
On April 1, 2006, the Company executed a 2-for-1 stock split.
Consolidated Six-Year SummaryYusen Air & Sea Service Co., Ltd., and Its Consolidated Subsidiaries for the Years Ended March 31
17
Management’s Discussion and Analysis
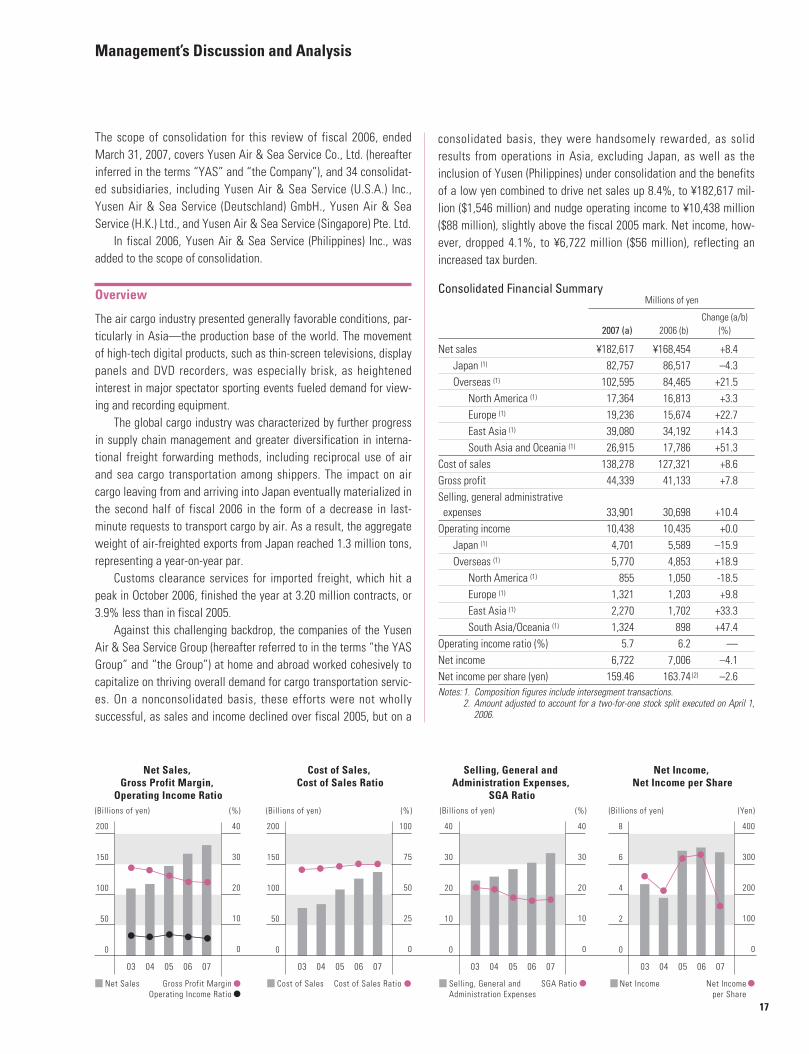
consolidated basis, they were handsomely rewarded, as solidresults from operations in Asia, excluding Japan, as well as theinclusion of Yusen (Philippines) under consolidation and the benefitsof a low yen combined to drive net sales up 8.4%, to ¥182,617 mil-lion ($1,546 million) and nudge operating income to ¥10,438 million($88 million), slightly above the fiscal 2005 mark. Net income, how-ever, dropped 4.1%, to ¥6,722 million ($56 million), reflecting anincreased tax burden.
Consolidated Financial SummaryMillions of yen
Change (a/b) 2007 (a) 2006 (b) (%)
Net sales ¥182,617 ¥168,454 +8.4Japan (1) 82,757 86,517 –4.3Overseas (1) 102,595 84,465 +21.5
North America (1) 17,364 16,813 +3.3Europe (1) 19,236 15,674 +22.7East Asia (1) 39,080 34,192 +14.3South Asia and Oceania (1) 26,915 17,786 +51.3
Cost of sales 138,278 127,321 +8.6Gross profit 44,339 41,133 +7.8Selling, general administrative expenses 33,901 30,698 +10.4
Operating income 10,438 10,435 +0.0Japan (1) 4,701 5,589 –15.9Overseas (1) 5,770 4,853 +18.9
North America (1) 855 1,050 -18.5Europe (1) 1,321 1,203 +9.8East Asia (1) 2,270 1,702 +33.3South Asia/Oceania (1) 1,324 898 +47.4
Operating income ratio (%) 5.7 6.2 —Net income 6,722 7,006 –4.1Net income per share (yen) 159.46 163.74 (2) –2.6Notes: 1. Composition figures include intersegment transactions.
2. Amount adjusted to account for a two-for-one stock split executed on April 1,2006.
The scope of consolidation for this review of fiscal 2006, endedMarch 31, 2007, covers Yusen Air & Sea Service Co., Ltd. (hereafterinferred in the terms “YAS” and “the Company”), and 34 consolidat-ed subsidiaries, including Yusen Air & Sea Service (U.S.A.) Inc.,Yusen Air & Sea Service (Deutschland) GmbH., Yusen Air & SeaService (H.K.) Ltd., and Yusen Air & Sea Service (Singapore) Pte. Ltd.
In fiscal 2006, Yusen Air & Sea Service (Philippines) Inc., wasadded to the scope of consolidation.
Overview
The air cargo industry presented generally favorable conditions, par-ticularly in Asia—the production base of the world. The movementof high-tech digital products, such as thin-screen televisions, displaypanels and DVD recorders, was especially brisk, as heightenedinterest in major spectator sporting events fueled demand for view-ing and recording equipment.
The global cargo industry was characterized by further progressin supply chain management and greater diversification in interna-tional freight forwarding methods, including reciprocal use of airand sea cargo transportation among shippers. The impact on aircargo leaving from and arriving into Japan eventually materialized inthe second half of fiscal 2006 in the form of a decrease in last-minute requests to transport cargo by air. As a result, the aggregateweight of air-freighted exports from Japan reached 1.3 million tons,representing a year-on-year par.
Customs clearance services for imported freight, which hit apeak in October 2006, finished the year at 3.20 million contracts, or3.9% less than in fiscal 2005.
Against this challenging backdrop, the companies of the YusenAir & Sea Service Group (hereafter referred to in the terms “the YASGroup” and “the Group”) at home and abroad worked cohesively tocapitalize on thriving overall demand for cargo transportation servic-es. On a nonconsolidated basis, these efforts were not whollysuccessful, as sales and income declined over fiscal 2005, but on a
(Billions of yen) (%)
200
0
50
100
150
03 04 05 06 07 03 04 05 06 07 03 04 05 06 07 03 04 05 06 07
40
0
10
20
30
200
0
50
100
150
100
0
25
50
75
40
0
10
20
30
40
0
10
20
30
8
0
2
4
6
400
0
100
200
300
(Billions of yen) (%) (Billions of yen) (%) (Billions of yen) (Yen)
Net Sales, Gross Profit Margin,
Operating Income Ratio
Net Sales Gross Profit MarginOperating Income Ratio
Cost of Sales Selling, General and Administration Expenses
SGA Ratio Net Income
Cost of Sales, Cost of Sales Ratio
Selling, General and Administration Expenses,
SGA Ratio
Net Income, Net Income per Share
Cost of Sales Ratio Net Income per Share
18
Segment Performance by Business Type(Figures include intersegment transactions)
Cargo Freight Business (Air and Sea Cargo)Overall, demand for cargo freight services was good, supported bysteady shipment of high-tech digital products, such as thin-screentelevisions, display panels, DVD recorders and digital cameras.Conditions were especially favorable in Asia, but not necessarily soin YAS’ home market of Japan, where the air export transportationmarket was sluggish. This was largely due to a shift toward oceantransportation for freight forwarding of automotive components andgreater use of local procurement channels by manufacturers operat-ing outside Japan.
Demand for sea cargo transportation services was favorablefrom all parts of Asia to Europe and North America.
Consequently, total sales climbed 8.4%, to ¥177,178 million($1,500 million). Operating income inched up 1.0%, to ¥9,748 million($82 million).
Travel ServicesSales were up, supported by demand for international business trav-el and rising interest in vacations aboard cruise ships. Expenses alsorose, mainly from the relocation of sales offices. As a result, totalsales grew 6.9%, to ¥5,301 million ($44 million), and operatingincome fell 5.9%, to ¥581 million ($4 million).
OtherBuoyed by another year-on-year increase in the number of peopledispatched from the Company’s temporary staff employmentagency, total sales expanded 28.5%, to ¥1,176 million ($9 million).However, efforts to enhance the quality of services provided by tem-porary staff caused training costs to rise, inflating expenses, whichled to a 36.4% drop in operating income, to ¥99 million ($0.8 million).
Segment Performance by Geographical Region(Figures include intersegment transactions)
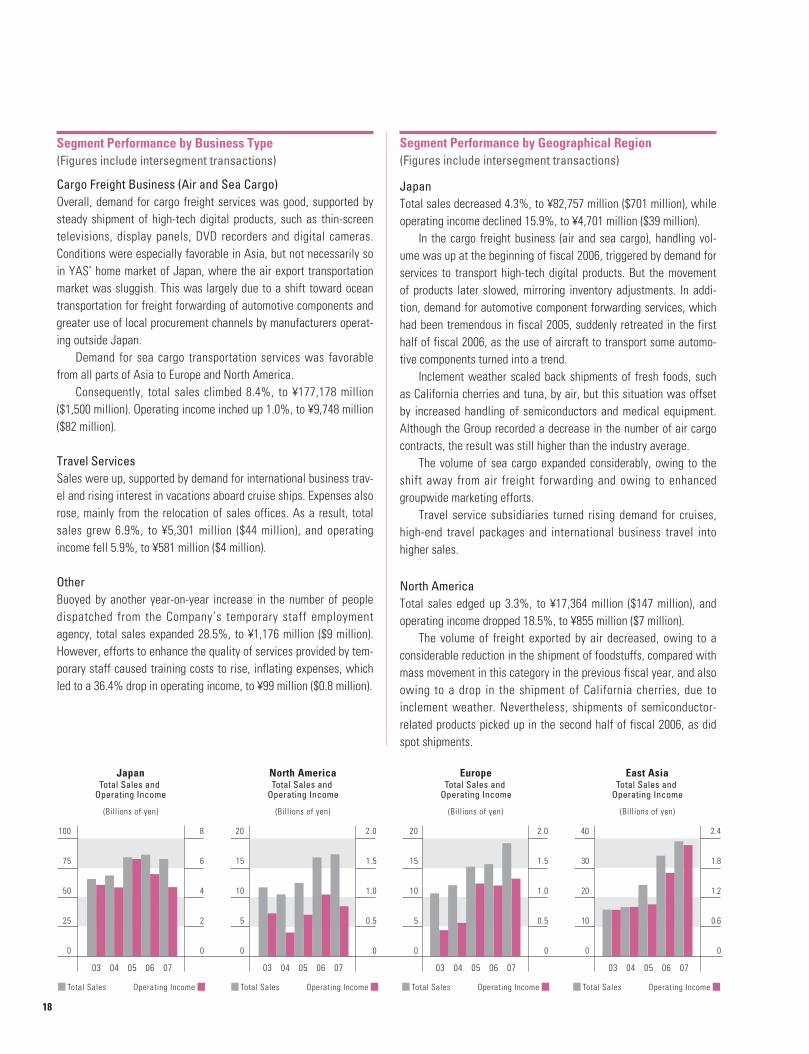
JapanTotal sales decreased 4.3%, to ¥82,757 million ($701 million), whileoperating income declined 15.9%, to ¥4,701 million ($39 million).
In the cargo freight business (air and sea cargo), handling vol-ume was up at the beginning of fiscal 2006, triggered by demand forservices to transport high-tech digital products. But the movementof products later slowed, mirroring inventory adjustments. In addi-tion, demand for automotive component forwarding services, whichhad been tremendous in fiscal 2005, suddenly retreated in the firsthalf of fiscal 2006, as the use of aircraft to transport some automo-tive components turned into a trend.
Inclement weather scaled back shipments of fresh foods, suchas California cherries and tuna, by air, but this situation was offsetby increased handling of semiconductors and medical equipment.Although the Group recorded a decrease in the number of air cargocontracts, the result was still higher than the industry average.
The volume of sea cargo expanded considerably, owing to theshift away from air freight forwarding and owing to enhancedgroupwide marketing efforts.
Travel service subsidiaries turned rising demand for cruises,high-end travel packages and international business travel intohigher sales.
North AmericaTotal sales edged up 3.3%, to ¥17,364 million ($147 million), andoperating income dropped 18.5%, to ¥855 million ($7 million).
The volume of freight exported by air decreased, owing to aconsiderable reduction in the shipment of foodstuffs, compared withmass movement in this category in the previous fiscal year, and alsoowing to a drop in the shipment of California cherries, due toinclement weather. Nevertheless, shipments of semiconductor-related products picked up in the second half of fiscal 2006, as didspot shipments.
03 04 05 06 07 03 04 05 06 07 03 04 05 06 07 03 04 05 06 07
Total Sales
(Billions of yen)
100
0
25
50
75
8
0
2
4
6
20
0
5
10
15
2.0
0
0.5
1.0
1.5
20
0
5
10
15
2.0
0
0.5
1.0
1.5
40
0
10
20
30
2.4
0
0.6
1.2
1.8
(Billions of yen) (Billions of yen) (Billions of yen)
Total Sales and Operating Income
Total Sales and Operating Income
Total Sales and Operating Income
Total Sales and Operating Income
Japan North America Europe East Asia
Operating IncomeTotal Sales Operating IncomeTotal Sales Operating IncomeTotal Sales Operating Income
19
The import of freight, including printers to the United States andaviation equipment components to Canada, by air and sea routeswas steady, but warehousing expenses as well as selling, generaland administrative expenses grew, eroding the benefit of highersales.
For reference, the exchange rate used to calculate the figuresabove was ¥119.11 to the U.S. dollar, compared with ¥118.07, as atfiscal year-end March 2007 and 2006, respectively.
EuropeResults from European operations improved dramatically, with a22.7% jump in total sales, to ¥19,236 million ($162 million), and a9.8% increase in operating income, to ¥1,321 million ($11 million).
The volume of air-freighted exports was favorable, with anemphasis on automotive components in the Benelux area and in theUnited Kingdom, medical equipment in Germany, communications-related components in the Czech Republic, and fresh foods in Italy.Subsidiaries in these countries recorded solid results. While theshipment of Beaujolais nouveau is a customary event in France, thelocal YAS subsidiary marked a dramatic rise in related transactions.
On the import front, local subsidiaries handled a larger volumeof office automation equipment and components for high-tech con-sumer electronics shipped from Asia. A particularly noticeabledevelopment was the increase truck-transported freight forwardingvolume within Europe through the two key gateways of Amsterdam,in the Netherlands, and Frankfurt, in Germany, which reflectedbroader demand for logistics within this region.
For reference, the exchange rate used to calculate the figuresabove was ¥156.60 to the euro, compared with ¥139.83, as at fiscalyear-end March 2007 and 2006, respectively.
East AsiaOperations in East Asia delivered solid results, as total sales grew14.3%, to ¥39,080 million ($331 million), and operating incomeclimbed 33.3%, to ¥2,270 million ($19 million).
The volume of air-freighted exports grew steadily, with anemphasis on high-tech digital consumer electronics and electronicand automotive components destined for the West from throughoutEast Asia but particularly from the PRC. The volume of importedfreight forwarded to East Asia over air and sea routes remained con-stant, with many shipments containing components for automotive,optical, electric and electronic applications.
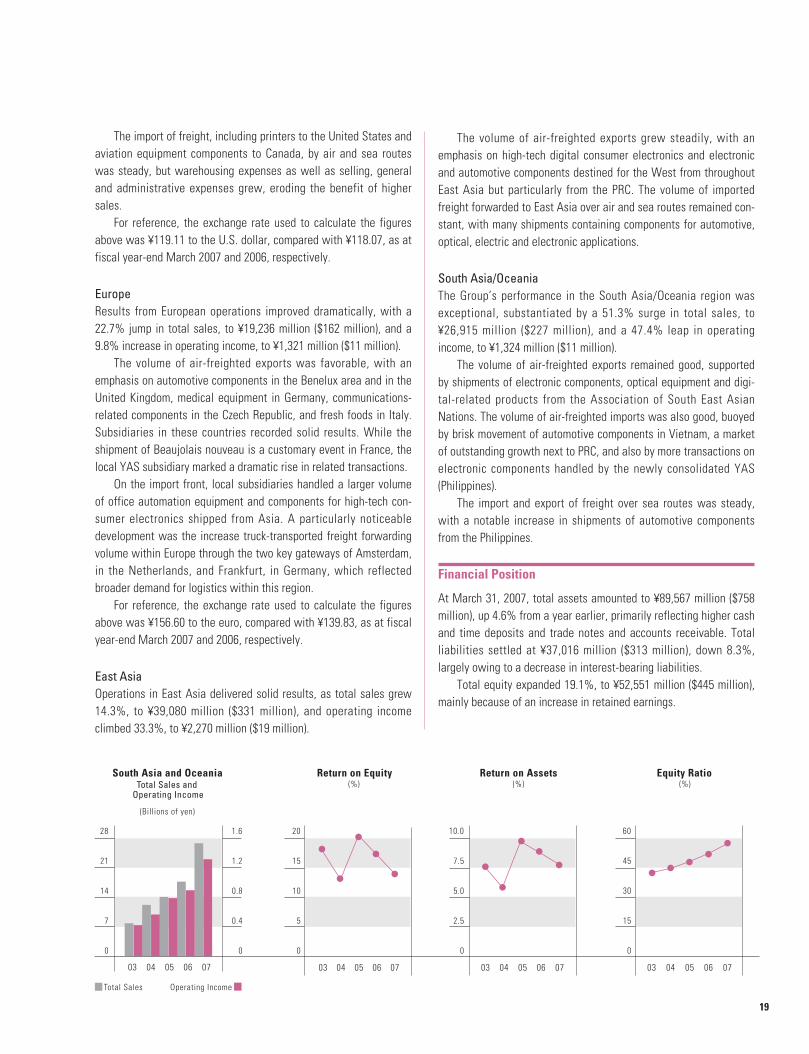
South Asia/OceaniaThe Group’s performance in the South Asia/Oceania region wasexceptional, substantiated by a 51.3% surge in total sales, to¥26,915 million ($227 million), and a 47.4% leap in operatingincome, to ¥1,324 million ($11 million).
The volume of air-freighted exports remained good, supportedby shipments of electronic components, optical equipment and digi-tal-related products from the Association of South East AsianNations. The volume of air-freighted imports was also good, buoyedby brisk movement of automotive components in Vietnam, a marketof outstanding growth next to PRC, and also by more transactions onelectronic components handled by the newly consolidated YAS(Philippines).
The import and export of freight over sea routes was steady,with a notable increase in shipments of automotive componentsfrom the Philippines.
Financial Position
At March 31, 2007, total assets amounted to ¥89,567 million ($758million), up 4.6% from a year earlier, primarily reflecting higher cashand time deposits and trade notes and accounts receivable. Totalliabilities settled at ¥37,016 million ($313 million), down 8.3%,largely owing to a decrease in interest-bearing liabilities.
Total equity expanded 19.1%, to ¥52,551 million ($445 million),mainly because of an increase in retained earnings.
Return on Equity Return on Assets Equity Ratio(%)
20
0
5
10
15
03 04 05 06 07 03 04 05 06 07
(%)
10.0
0
2.5
5.0
7.5
(%)
60
0
15
30
45
03 04 05 06 07
Total Sales Operating Income
28
0
7
14
21
03 04 05 06 07
1.6
0
0.4
0.8
1.2
(Billions of yen)
Total Sales and Operating Income
South Asia and Oceania
20
Regarding indicators of performance, net assets per shareretreated 41.9%, to ¥1,213.90, the equity ratio improved 5.6 per-centage points, to 57.2%, and return on equity (ROE) dropped 3.4percentage points, to 14.1%.Notes: 1. Equity (¥51,191 million as of March 31, 2007) = Total equity – minority interests
2. Equity ratio = Shareholders’ equity / Total assets3. ROE = Net income / Average shareholders’ equity
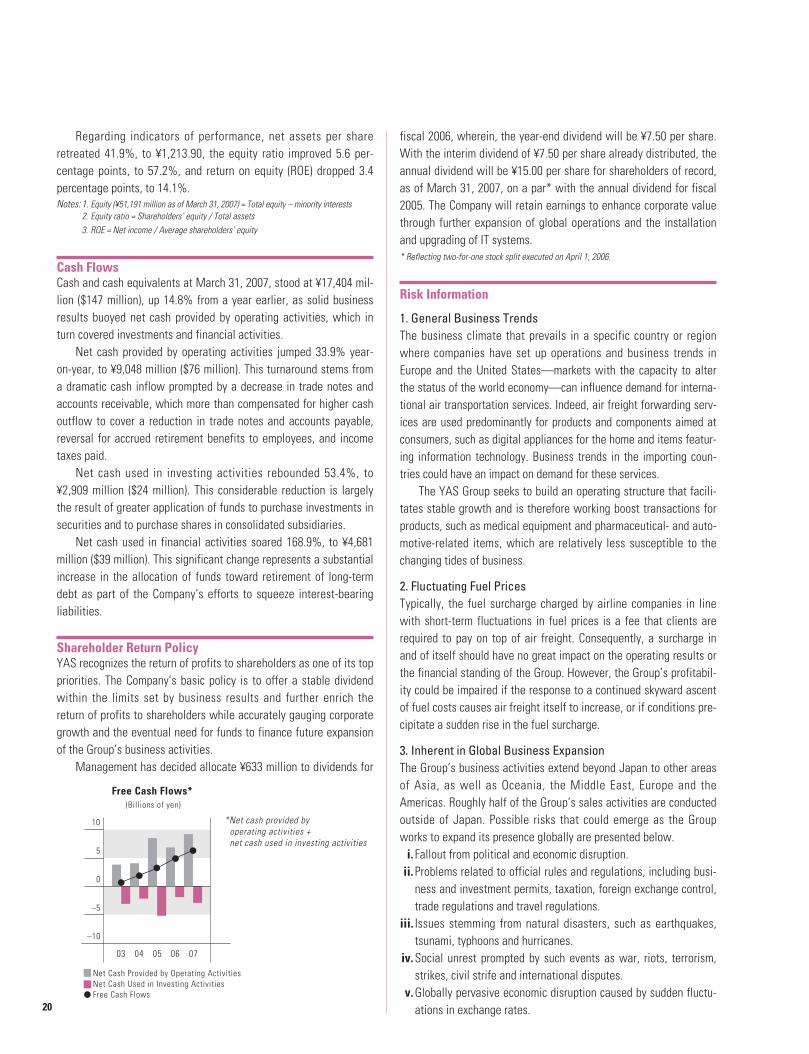
Cash FlowsCash and cash equivalents at March 31, 2007, stood at ¥17,404 mil-lion ($147 million), up 14.8% from a year earlier, as solid businessresults buoyed net cash provided by operating activities, which inturn covered investments and financial activities.
Net cash provided by operating activities jumped 33.9% year-on-year, to ¥9,048 million ($76 million). This turnaround stems froma dramatic cash inflow prompted by a decrease in trade notes andaccounts receivable, which more than compensated for higher cashoutflow to cover a reduction in trade notes and accounts payable,reversal for accrued retirement benefits to employees, and incometaxes paid.
Net cash used in investing activities rebounded 53.4%, to¥2,909 million ($24 million). This considerable reduction is largelythe result of greater application of funds to purchase investments insecurities and to purchase shares in consolidated subsidiaries.
Net cash used in financial activities soared 168.9%, to ¥4,681million ($39 million). This significant change represents a substantialincrease in the allocation of funds toward retirement of long-termdebt as part of the Company’s efforts to squeeze interest-bearingliabilities.
Shareholder Return PolicyYAS recognizes the return of profits to shareholders as one of its toppriorities. The Company’s basic policy is to offer a stable dividendwithin the limits set by business results and further enrich thereturn of profits to shareholders while accurately gauging corporategrowth and the eventual need for funds to finance future expansionof the Group’s business activities.
Management has decided allocate ¥633 million to dividends for
fiscal 2006, wherein, the year-end dividend will be ¥7.50 per share.With the interim dividend of ¥7.50 per share already distributed, theannual dividend will be ¥15.00 per share for shareholders of record,as of March 31, 2007, on a par* with the annual dividend for fiscal2005. The Company will retain earnings to enhance corporate valuethrough further expansion of global operations and the installationand upgrading of IT systems.* Reflecting two-for-one stock split executed on April 1, 2006.
Risk Information
1. General Business TrendsThe business climate that prevails in a specific country or regionwhere companies have set up operations and business trends inEurope and the United States—markets with the capacity to alterthe status of the world economy—can influence demand for interna-tional air transportation services. Indeed, air freight forwarding serv-ices are used predominantly for products and components aimed atconsumers, such as digital appliances for the home and items featur-ing information technology. Business trends in the importing coun-tries could have an impact on demand for these services.
The YAS Group seeks to build an operating structure that facili-tates stable growth and is therefore working boost transactions forproducts, such as medical equipment and pharmaceutical- and auto-motive-related items, which are relatively less susceptible to thechanging tides of business.
2. Fluctuating Fuel PricesTypically, the fuel surcharge charged by airline companies in linewith short-term fluctuations in fuel prices is a fee that clients arerequired to pay on top of air freight. Consequently, a surcharge inand of itself should have no great impact on the operating results orthe financial standing of the Group. However, the Group’s profitabil-ity could be impaired if the response to a continued skyward ascentof fuel costs causes air freight itself to increase, or if conditions pre-cipitate a sudden rise in the fuel surcharge.
3. Inherent in Global Business ExpansionThe Group’s business activities extend beyond Japan to other areasof Asia, as well as Oceania, the Middle East, Europe and theAmericas. Roughly half of the Group’s sales activities are conductedoutside of Japan. Possible risks that could emerge as the Groupworks to expand its presence globally are presented below.
i. Fallout from political and economic disruption.ii. Problems related to official rules and regulations, including busi-
ness and investment permits, taxation, foreign exchange control,trade regulations and travel regulations.
iii. Issues stemming from natural disasters, such as earthquakes,tsunami, typhoons and hurricanes.
iv. Social unrest prompted by such events as war, riots, terrorism,strikes, civil strife and international disputes.
v. Globally pervasive economic disruption caused by sudden fluctu-ations in exchange rates.
Free Cash Flows*
*Net cash provided by operating activities + net cash used in investing activities
(Billions of yen)
10
–10
–5
0
5
03 04 05 06 07
Net Cash Provided by Operating Activities Net Cash Used in Investing Activities Free Cash Flows
21
vi. The spread of highly contagious diseases demonstrating a highdeath rate, such as Severe Acute Respiratory Syndrome, morecommonly known as the SARS virus, and bird flu. Each additional investment abroad is carefully considered. The
Company looks into local political and economic conditions as wellas the culture, customs and public heath situation and strives toeliminate as effectively as possible whatever risks may exist at thetime before making the investment.
However, unexpected events do occur and the state of theworld does change in ways not always correctly anticipated. Suchdevelopments, which include greater sophistication in informationand communications technology, increasingly borderless economicand cultural environments, the frequency of terrorist activities andthe spread of new infectious diseases, could impact the businessresults and financial standing of the Group.
4. Computer Viruses, Hackers and Cyber-TerrorismYAS has established a backup system for its computer lines. TheCompany is also working to enhance backup capabilities to minimizedamage to hardware and data in the event of natural disasters, suchas earthquakes or severe storms with flooding.
The Company has taken all possible measures to prevent unau-thorized access to its systems from outside and to block infection ofits systems by computer viruses. Specifically, the Company hasinstalled firewalls and virus-checking software into its mail serversand all terminals.
Despite these defensive measures, it is possible that unfore-seen situations, such as the use of technology that breaches pre-sumed security protocols and allows a hacker to gain entry to in-house information systems, could lead to a temporary shutdown ofsystem functions or facilitate unauthorized disclosure of informa-tion. Such a situation could hurt the business results and financialstanding of the Group.
5. Claims for Damages and Tarnished Credibility Due to Leaksof Client InformationThe YAS Group handles a vast amount of client information. TheGroup also undertakes customs clearance services. Therefore, theGroup has an obligation to protect client information and strives toprevent information from leaking outside. Despite existing precau-tions, it is possible that unforeseen circumstance could result in aninformation leak. The Group’s business results could be adversely
affected if, for example, such a leak were to lead to claims for dam-ages or if the situation tarnished the Group’s reputation.
6. Fluctuating Exchange RatesThe YAS Group endeavors to minimize the impact of fluctuatingexchange rates on foreign-currency-denominated receivables andpayables by utilizing hedging transactions, such as forwardexchange contracts and currency swaps, and therefore eliminatessuch risk that would exert a major impact on the Group’s business.However, in preparing the Group’s consolidated financial state-ments, the Company translates the financial results of overseas con-solidated subsidiaries into yen, and fluctuating exchange rates couldhave an effect on the business results and financial standing of theGroup, based on such consolidated financial statements.
7. Statutory Regulations YAS is licensed by the Ministry of Land, Infrastructure and Transportas a provider of type 2 freight forwarding services, based on Article20 of the Freight Forwarding Business Law, and conducts air andsea cargo transportation operations—the primary business of theYAS Group.
This license has no expiration date, but if, as set forth in Article33 of the Freight Forwarding Business Law, an event causes opera-tions to be suspended or eliminated, the Company’s business will bepartially or completely suspended for a set period and permission toengage in those areas of business will be withdrawn.
To date, the YAS Group has never encountered such an event,but situations, including the withdrawal of permission to conductbusiness, may occur in the future for any number of reasons, andcould have a sizable impact on the fiscal performance and financialstanding of the Group.
In addition, different parts of the world apply different statutoryregulations with which Group companies must comply. Major rulesand regulations include social issues, such as maintaining safety,and legal issues related to transportation services.
In Japan, YAS has obtained approval and required licenses,including the aforementioned permission to provide type 2 freight for-warding services, from the relevant authorities. If statutory regulationspertaining to such approval and licenses are amended or if approvaland licensing status currently held is cancelled, the fiscal perform-ance and financial standing of the Group could be adversely affected.
Approval and licenses currently held by YAS are listed below.Requirements for
Approval and Licensing Designation Issuing Authority Approval and Licensing ValidityType 2 freight forwarding services Ministry of Land, Infrastructure and Transport Business license OpenAir service agency business Ministry of Land, Infrastructure and Transport Application to operate Open
as a business General cargo truck transportation services Ministry of Land, Infrastructure and Transport Business license OpenCustoms brokerage services Regional customs and duty office Business license OpenWarehousing services Regional transportation bureau Business registration OpenMedical devices manufacturing business: Prefectural offices Business license Sept. 26, 2005 packaging, labeling or storage category to Sept. 25, 2010Retail or rental business of specially Prefectural offices Business license June 12, 2007controlled medical devices to June 11, 2013
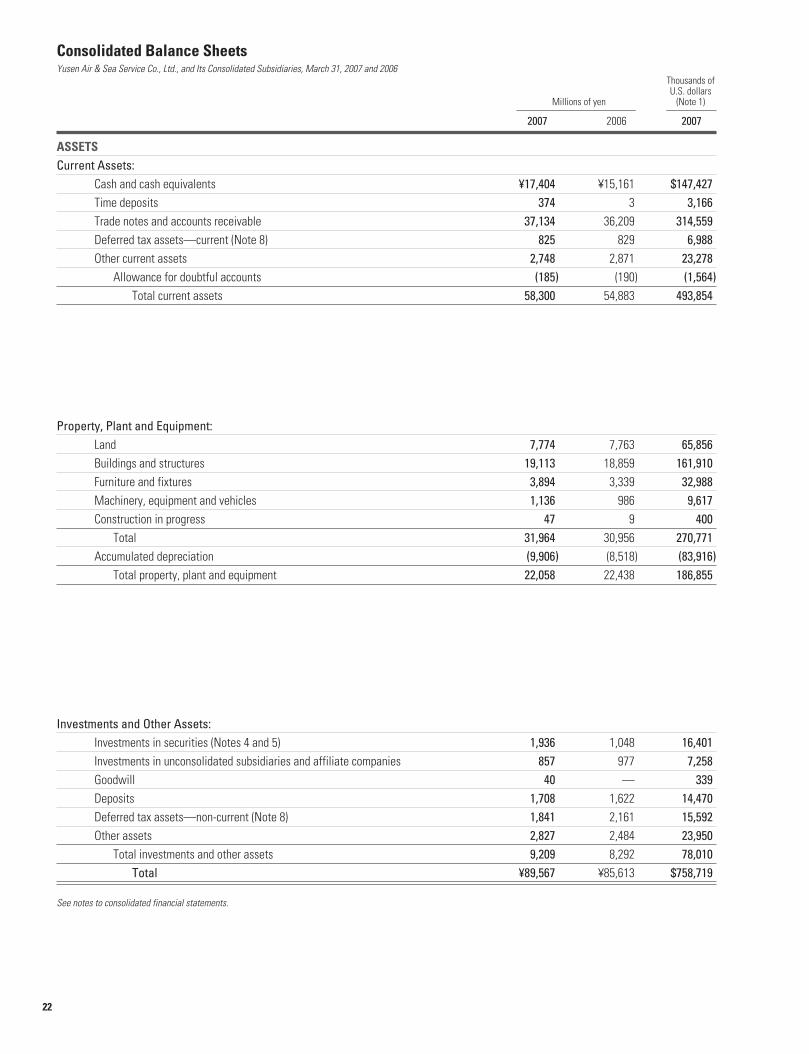
22
Thousands ofU.S. dollars
Millions of yen (Note 1)
2007 2006 2007
ASSETSCurrent Assets:
Cash and cash equivalents ¥17,404 ¥15,161 $147,427Time deposits 374 3 3,166Trade notes and accounts receivable 37,134 36,209 314,559Deferred tax assets—current (Note 8) 825 829 6,988Other current assets 2,748 2,871 23,278
Allowance for doubtful accounts (185) (190) (1,564)Total current assets 58,300 54,883 493,854
Property, Plant and Equipment:Land 7,774 7,763 65,856Buildings and structures 19,113 18,859 161,910Furniture and fixtures 3,894 3,339 32,988Machinery, equipment and vehicles 1,136 986 9,617Construction in progress 47 9 400
Total 31,964 30,956 270,771Accumulated depreciation (9,906) (8,518) (83,916)
Total property, plant and equipment 22,058 22,438 186,855
Investments and Other Assets:Investments in securities (Notes 4 and 5) 1,936 1,048 16,401Investments in unconsolidated subsidiaries and affiliate companies 857 977 7,258Goodwill 40 — 339Deposits 1,708 1,622 14,470Deferred tax assets—non-current (Note 8) 1,841 2,161 15,592Other assets 2,827 2,484 23,950
Total investments and other assets 9,209 8,292 78,010Total ¥89,567 ¥85,613 $758,719
See notes to consolidated financial statements.
Consolidated Balance SheetsYusen Air & Sea Service Co., Ltd., and Its Consolidated Subsidiaries, March 31, 2007 and 2006
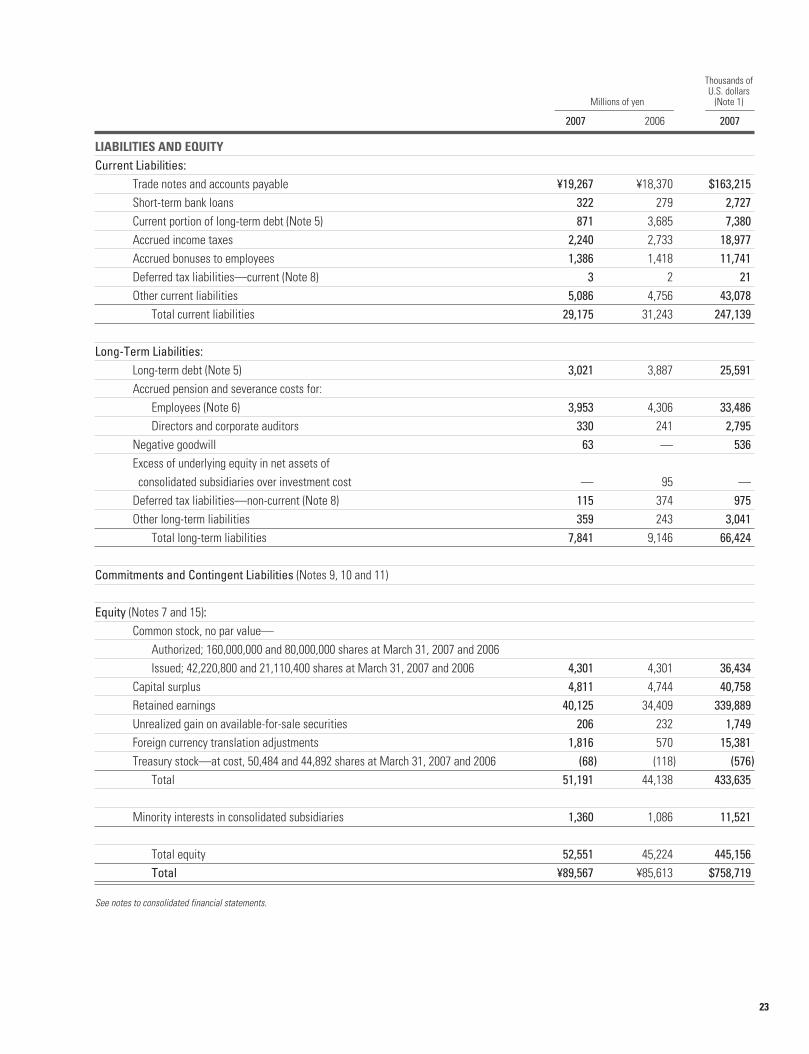
23
Thousands ofU.S. dollars
Millions of yen (Note 1)
2007 2006 2007
LIABILITIES AND EQUITYCurrent Liabilities:
Trade notes and accounts payable ¥19,267 ¥18,370 $163,215Short-term bank loans 322 279 2,727Current portion of long-term debt (Note 5) 871 3,685 7,380Accrued income taxes 2,240 2,733 18,977Accrued bonuses to employees 1,386 1,418 11,741Deferred tax liabilities—current (Note 8) 3 2 21Other current liabilities 5,086 4,756 43,078
Total current liabilities 29,175 31,243 247,139
Long-Term Liabilities:Long-term debt (Note 5) 3,021 3,887 25,591Accrued pension and severance costs for:
Employees (Note 6) 3,953 4,306 33,486Directors and corporate auditors 330 241 2,795
Negative goodwill 63 — 536Excess of underlying equity in net assets ofconsolidated subsidiaries over investment cost — 95 —
Deferred tax liabilities—non-current (Note 8) 115 374 975Other long-term liabilities 359 243 3,041
Total long-term liabilities 7,841 9,146 66,424
Commitments and Contingent Liabilities (Notes 9, 10 and 11)
Equity (Notes 7 and 15):Common stock, no par value—
Authorized; 160,000,000 and 80,000,000 shares at March 31, 2007 and 2006Issued; 42,220,800 and 21,110,400 shares at March 31, 2007 and 2006 4,301 4,301 36,434
Capital surplus 4,811 4,744 40,758Retained earnings 40,125 34,409 339,889Unrealized gain on available-for-sale securities 206 232 1,749Foreign currency translation adjustments 1,816 570 15,381Treasury stock—at cost, 50,484 and 44,892 shares at March 31, 2007 and 2006 (68) (118) (576)
Total 51,191 44,138 433,635
Minority interests in consolidated subsidiaries 1,360 1,086 11,521
Total equity 52,551 45,224 445,156Total ¥89,567 ¥85,613 $758,719
See notes to consolidated financial statements.
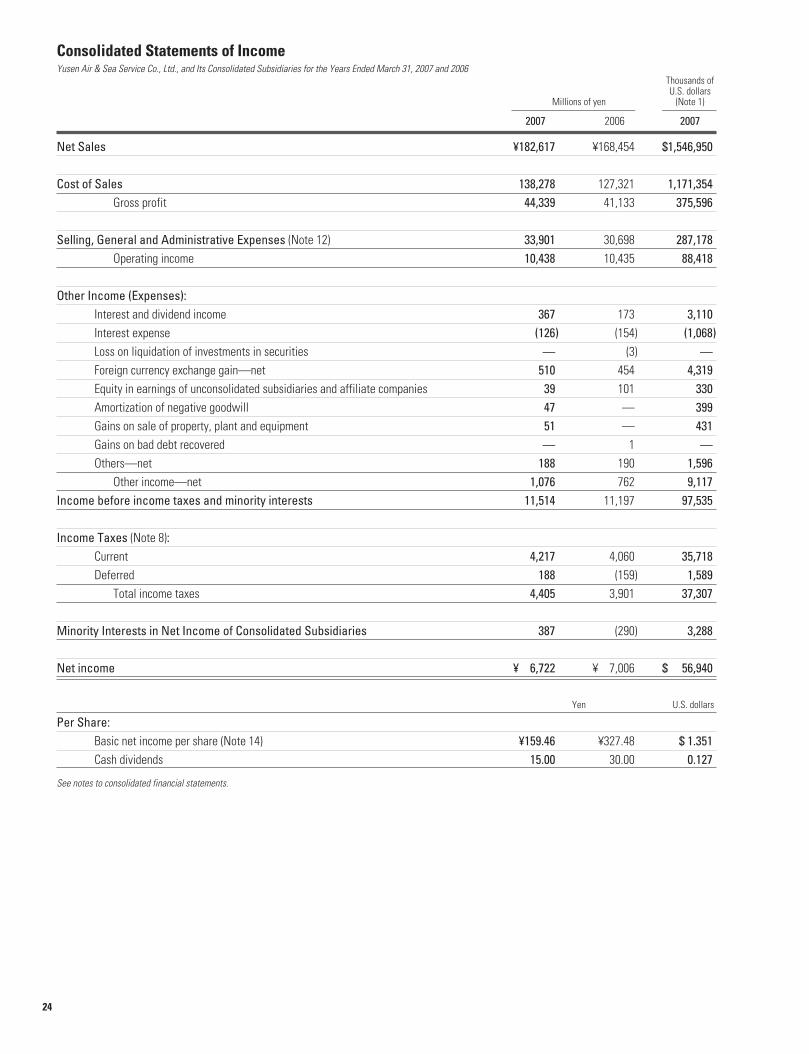
24
Thousands ofU.S. dollars
Millions of yen (Note 1)
2007 2006 2007
Net Sales ¥182,617 ¥168,454 $1,546,950
Cost of Sales 138,278 127,321 1,171,354Gross profit 44,339 41,133 375,596
Selling, General and Administrative Expenses (Note 12) 33,901 30,698 287,178Operating income 10,438 10,435 88,418
Other Income (Expenses):Interest and dividend income 367 173 3,110Interest expense (126) (154) (1,068)Loss on liquidation of investments in securities — (3) —Foreign currency exchange gain—net 510 454 4,319Equity in earnings of unconsolidated subsidiaries and affiliate companies 39 101 330Amortization of negative goodwill 47 — 399Gains on sale of property, plant and equipment 51 — 431Gains on bad debt recovered — 1 —Others—net 188 190 1,596
Other income—net 1,076 762 9,117Income before income taxes and minority interests 11,514 11,197 97,535
Income Taxes (Note 8):Current 4,217 4,060 35,718Deferred 188 (159) 1,589
Total income taxes 4,405 3,901 37,307
Minority Interests in Net Income of Consolidated Subsidiaries 387 (290) 3,288
Net income ¥ 6,722 ¥007,006 $0,056,940
Yen U.S. dollars
Per Share:Basic net income per share (Note 14) ¥159.46 ¥327.48 $ 1.351Cash dividends 15.00 30.00 0.127
See notes to consolidated financial statements.
Consolidated Statements of IncomeYusen Air & Sea Service Co., Ltd., and Its Consolidated Subsidiaries for the Years Ended March 31, 2007 and 2006
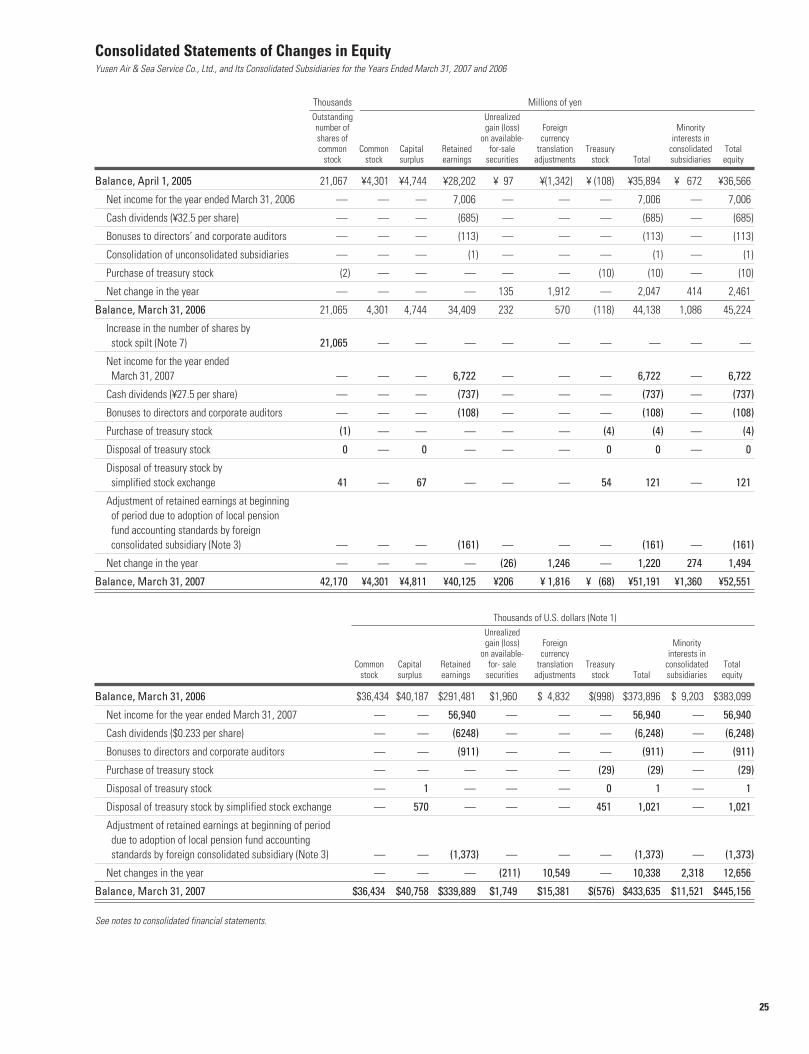
25
Thousands Millions of yenOutstanding Unrealizednumber of gain (loss) Foreign Minorityshares of on available- currency interests incommon Common Capital Retained for-sale translation Treasury consolidated Total
stock stock surplus earnings securities adjustments stock Total subsidiaries equity
Balance, April 1, 2005 21,067 ¥4,301 ¥4,744 ¥28,202 ¥ 97 ¥(1,342) ¥ (108) ¥35,894 ¥ 672 ¥36,566
Net income for the year ended March 31, 2006 — — — 7,006 — — — 7,006 — 7,006
Cash dividends (¥32.5 per share) — — — (685) — — — (685) — (685)
Bonuses to directors’ and corporate auditors — — — (113) — — — (113) — (113)
Consolidation of unconsolidated subsidiaries — — — (1) — — — (1) — (1)
Purchase of treasury stock (2) — — — — — (10) (10) — (10)
Net change in the year — — — — 135 1,912 — 2,047 414 2,461
Balance, March 31, 2006 21,065 4,301 4,744 34,409 232 570 (118) 44,138 1,086 45,224
Increase in the number of shares by stock spilt (Note 7) 21,065 — — — — — — — — —
Net income for the year ended March 31, 2007 — — — 6,722 — — — 6,722 — 6,722
Cash dividends (¥27.5 per share) — — — (737) — — — (737) — (737)
Bonuses to directors and corporate auditors — — — (108) — — — (108) — (108)
Purchase of treasury stock (1) — — — — — (4) (4) — (4)
Disposal of treasury stock 0 — 0 — — — 0 0 — 0
Disposal of treasury stock by simplified stock exchange 41 — 67 — — — 54 121 — 121
Adjustment of retained earnings at beginning of period due to adoption of local pension fund accounting standards by foreign consolidated subsidiary (Note 3) — — — (161) — — — (161) — (161)
Net change in the year — — — — (26) 1,246 — 1,220 274 1,494
Balance, March 31, 2007 42,170 ¥4,301 ¥4,811 ¥40,125 ¥206 ¥ 1,816 ¥ (68) ¥51,191 ¥1,360 ¥52,551
Thousands of U.S. dollars (Note 1)Unrealizedgain (loss) Foreign Minority
on available- currency interests inCommon Capital Retained for- sale translation Treasury consolidated Total
stock surplus earnings securities adjustments stock Total subsidiaries equity
Balance, March 31, 2006 $36,434 $40,187 $291,481 $1,960 $ 4,832 $(998) $373,896 $ 9,203 $383,099
Net income for the year ended March 31, 2007 — — 56,940 — — — 56,940 — 56,940
Cash dividends ($0.233 per share) — — (6248) — — — (6,248) — (6,248)
Bonuses to directors and corporate auditors — — (911) — — — (911) — (911)
Purchase of treasury stock — — — — — (29) (29) — (29)
Disposal of treasury stock — 1 — — — 0 1 — 1
Disposal of treasury stock by simplified stock exchange — 570 — — — 451 1,021 — 1,021
Adjustment of retained earnings at beginning of period due to adoption of local pension fund accounting standards by foreign consolidated subsidiary (Note 3) — — (1,373) — — — (1,373) — (1,373)
Net changes in the year — — — (211) 10,549 — 10,338 2,318 12,656
Balance, March 31, 2007 $36,434 $40,758 $339,889 $1,749 $15,381 $(576) $433,635 $11,521 $445,156
See notes to consolidated financial statements.
Consolidated Statements of Changes in EquityYusen Air & Sea Service Co., Ltd., and Its Consolidated Subsidiaries for the Years Ended March 31, 2007 and 2006
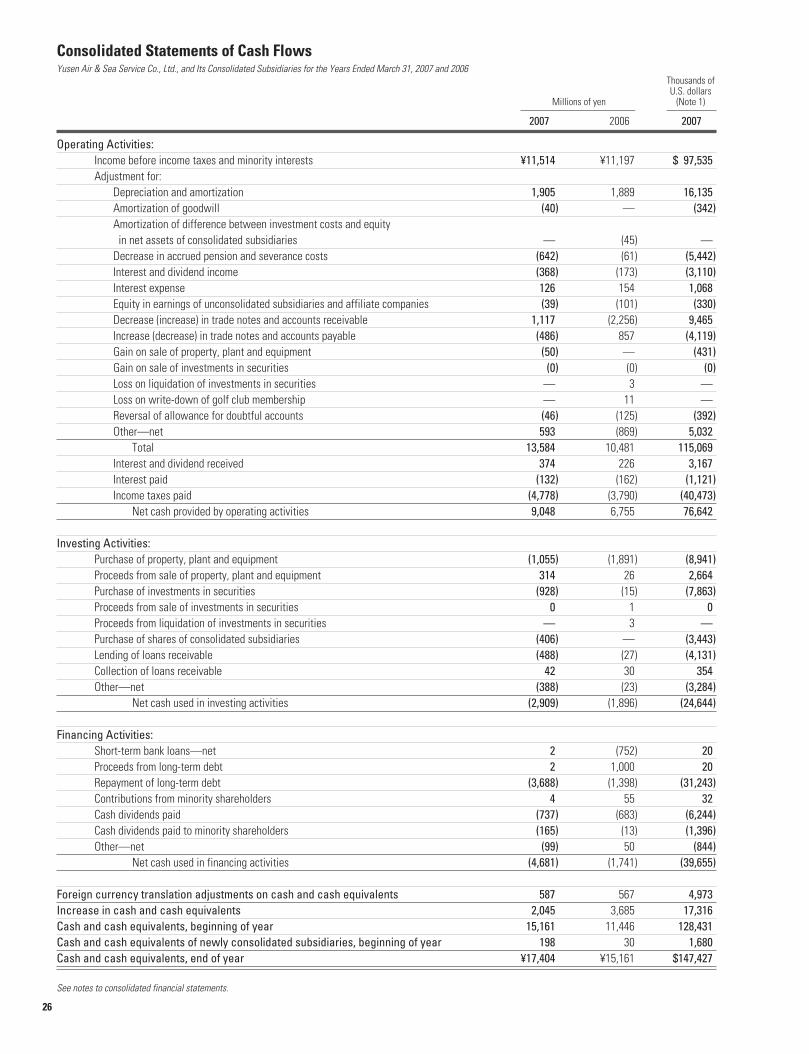
26
Thousands ofU.S. dollars
Millions of yen (Note 1)
2007 2006 2007
Operating Activities:Income before income taxes and minority interests ¥11,514 ¥11,197 $ 97,535Adjustment for:
Depreciation and amortization 1,905 1,889 16,135Amortization of goodwill (40) — (342)Amortization of difference between investment costs and equityin net assets of consolidated subsidiaries — (45) —
Decrease in accrued pension and severance costs (642) (61) (5,442)Interest and dividend income (368) (173) (3,110)Interest expense 126 154 1,068Equity in earnings of unconsolidated subsidiaries and affiliate companies (39) (101) (330)Decrease (increase) in trade notes and accounts receivable 1,117 (2,256) 9,465Increase (decrease) in trade notes and accounts payable (486) 857 (4,119)Gain on sale of property, plant and equipment (50) — (431)Gain on sale of investments in securities (0) (0) (0)Loss on liquidation of investments in securities — 3 —Loss on write-down of golf club membership — 11 —Reversal of allowance for doubtful accounts (46) (125) (392)Other—net 593 (869) 5,032
Total 13,584 10,481 115,069Interest and dividend received 374 226 3,167Interest paid (132) (162) (1,121)Income taxes paid (4,778) (3,790) (40,473)
Net cash provided by operating activities 9,048 6,755 76,642
Investing Activities:Purchase of property, plant and equipment (1,055) (1,891) (8,941)Proceeds from sale of property, plant and equipment 314 26 2,664Purchase of investments in securities (928) (15) (7,863)Proceeds from sale of investments in securities 0 1 0Proceeds from liquidation of investments in securities — 3 —Purchase of shares of consolidated subsidiaries (406) — (3,443)Lending of loans receivable (488) (27) (4,131)Collection of loans receivable 42 30 354Other—net (388) (23) (3,284)
Net cash used in investing activities (2,909) (1,896) (24,644)
Financing Activities:Short-term bank loans—net 2 (752) 20Proceeds from long-term debt 2 1,000 20Repayment of long-term debt (3,688) (1,398) (31,243)Contributions from minority shareholders 4 55 32Cash dividends paid (737) (683) (6,244)Cash dividends paid to minority shareholders (165) (13) (1,396)Other—net (99) 50 (844)
Net cash used in financing activities (4,681) (1,741) (39,655)
Foreign currency translation adjustments on cash and cash equivalents 587 567 4,973Increase in cash and cash equivalents 2,045 3,685 17,316Cash and cash equivalents, beginning of year 15,161 11,446 128,431Cash and cash equivalents of newly consolidated subsidiaries, beginning of year 198 30 1,680Cash and cash equivalents, end of year ¥17,404 ¥15,161 $147,427
See notes to consolidated financial statements.
Consolidated Statements of Cash FlowsYusen Air & Sea Service Co., Ltd., and Its Consolidated Subsidiaries for the Years Ended March 31, 2007 and 2006
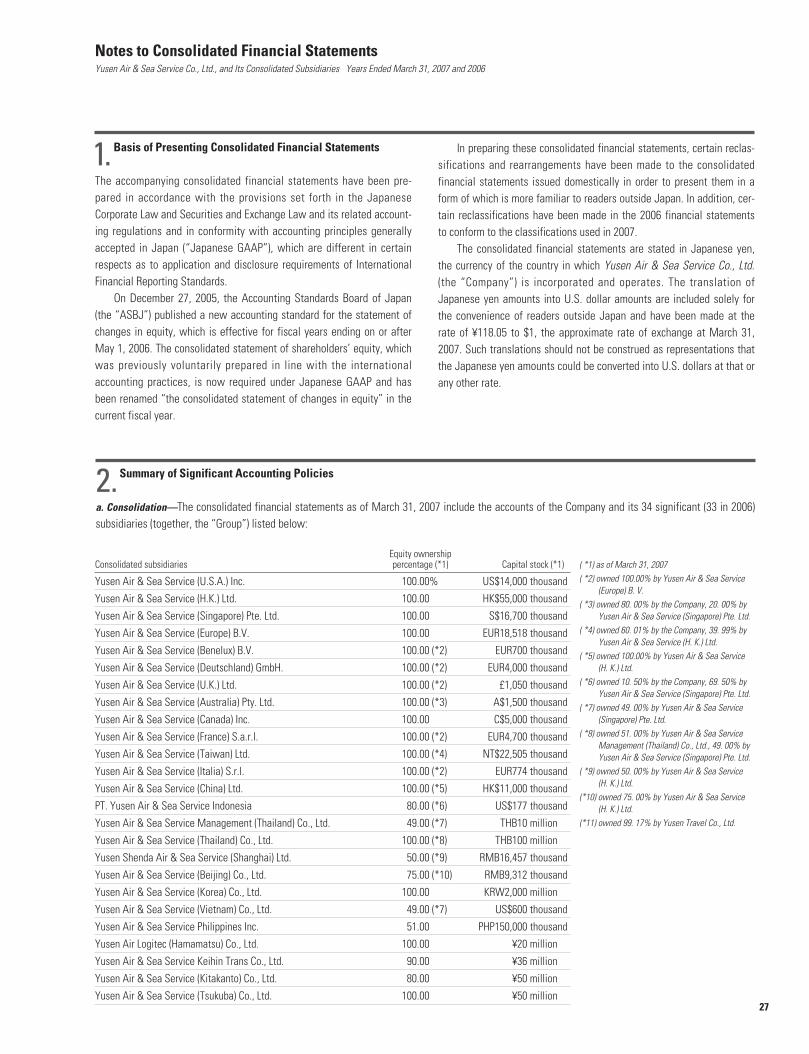
27
Basis of Presenting Consolidated Financial Statements
The accompanying consolidated financial statements have been pre-pared in accordance with the provisions set forth in the JapaneseCorporate Law and Securities and Exchange Law and its related account-ing regulations and in conformity with accounting principles generallyaccepted in Japan (“Japanese GAAP”), which are different in certainrespects as to application and disclosure requirements of InternationalFinancial Reporting Standards.
On December 27, 2005, the Accounting Standards Board of Japan(the “ASBJ”) published a new accounting standard for the statement ofchanges in equity, which is effective for fiscal years ending on or afterMay 1, 2006. The consolidated statement of shareholders’ equity, whichwas previously voluntarily prepared in line with the internationalaccounting practices, is now required under Japanese GAAP and hasbeen renamed “the consolidated statement of changes in equity” in thecurrent fiscal year.
In preparing these consolidated financial statements, certain reclas-sifications and rearrangements have been made to the consolidatedfinancial statements issued domestically in order to present them in aform of which is more familiar to readers outside Japan. In addition, cer-tain reclassifications have been made in the 2006 financial statementsto conform to the classifications used in 2007.
The consolidated financial statements are stated in Japanese yen,the currency of the country in which Yusen Air & Sea Service Co., Ltd.(the “Company”) is incorporated and operates. The translation ofJapanese yen amounts into U.S. dollar amounts are included solely forthe convenience of readers outside Japan and have been made at therate of ¥118.05 to $1, the approximate rate of exchange at March 31,2007. Such translations should not be construed as representations thatthe Japanese yen amounts could be converted into U.S. dollars at that orany other rate.
Summary of Significant Accounting Policies
a. Consolidation—The consolidated financial statements as of March 31, 2007 include the accounts of the Company and its 34 significant (33 in 2006)subsidiaries (together, the “Group”) listed below:
Equity ownershipConsolidated subsidiaries percentage (*1) Capital stock (*1)
Yusen Air & Sea Service (U.S.A.) Inc. 100.00% US$14,000 thousand
Yusen Air & Sea Service (H.K.) Ltd. 100.00 HK$55,000 thousand
Yusen Air & Sea Service (Singapore) Pte. Ltd. 100.00 S$16,700 thousand
Yusen Air & Sea Service (Europe) B.V. 100.00 EUR18,518 thousand
Yusen Air & Sea Service (Benelux) B.V. 100.00 (*2) EUR700 thousand
Yusen Air & Sea Service (Deutschland) GmbH. 100.00 (*2) EUR4,000 thousand
Yusen Air & Sea Service (U.K.) Ltd. 100.00 (*2) £1,050 thousand
Yusen Air & Sea Service (Australia) Pty. Ltd. 100.00 (*3) A$1,500 thousand
Yusen Air & Sea Service (Canada) Inc. 100.00 C$5,000 thousand
Yusen Air & Sea Service (France) S.a.r.l. 100.00 (*2) EUR4,700 thousand
Yusen Air & Sea Service (Taiwan) Ltd. 100.00 (*4) NT$22,505 thousand
Yusen Air & Sea Service (Italia) S.r.l. 100.00 (*2) EUR774 thousand
Yusen Air & Sea Service (China) Ltd. 100.00 (*5) HK$11,000 thousand
PT. Yusen Air & Sea Service Indonesia 80.00 (*6) US$177 thousand
Yusen Air & Sea Service Management (Thailand) Co., Ltd. 49.00 (*7) THB10 million
Yusen Air & Sea Service (Thailand) Co., Ltd. 100.00 (*8) THB100 million
Yusen Shenda Air & Sea Service (Shanghai) Ltd. 50.00 (*9) RMB16,457 thousand
Yusen Air & Sea Service (Beijing) Co., Ltd. 75.00 (*10) RMB9,312 thousand
Yusen Air & Sea Service (Korea) Co., Ltd. 100.00 KRW2,000 million
Yusen Air & Sea Service (Vietnam) Co., Ltd. 49.00 (*7) US$600 thousand
Yusen Air & Sea Service Philippines Inc. 51.00 PHP150,000 thousand
Yusen Air Logitec (Hamamatsu) Co., Ltd. 100.00 ¥20 million
Yusen Air & Sea Service Keihin Trans Co., Ltd. 90.00 ¥36 million
Yusen Air & Sea Service (Kitakanto) Co., Ltd. 80.00 ¥50 million
Yusen Air & Sea Service (Tsukuba) Co., Ltd. 100.00 ¥50 million
1.
Notes to Consolidated Financial StatementsYusen Air & Sea Service Co., Ltd., and Its Consolidated Subsidiaries Years Ended March 31, 2007 and 2006
2.
( *1) as of March 31, 2007( *2) owned 100.00% by Yusen Air & Sea Service
(Europe) B. V.( *3) owned 80. 00% by the Company, 20. 00% by
Yusen Air & Sea Service (Singapore) Pte. Ltd.( *4) owned 60. 01% by the Company, 39. 99% by
Yusen Air & Sea Service (H. K.) Ltd.( *5) owned 100.00% by Yusen Air & Sea Service
(H. K.) Ltd.( *6) owned 10. 50% by the Company, 69. 50% by
Yusen Air & Sea Service (Singapore) Pte. Ltd.( *7) owned 49. 00% by Yusen Air & Sea Service
(Singapore) Pte. Ltd.( *8) owned 51. 00% by Yusen Air & Sea Service
Management (Thailand) Co., Ltd., 49. 00% byYusen Air & Sea Service (Singapore) Pte. Ltd.
( *9) owned 50. 00% by Yusen Air & Sea Service (H. K.) Ltd.
(*10) owned 75. 00% by Yusen Air & Sea Service (H. K.) Ltd.
(*11) owned 99. 17% by Yusen Travel Co., Ltd.
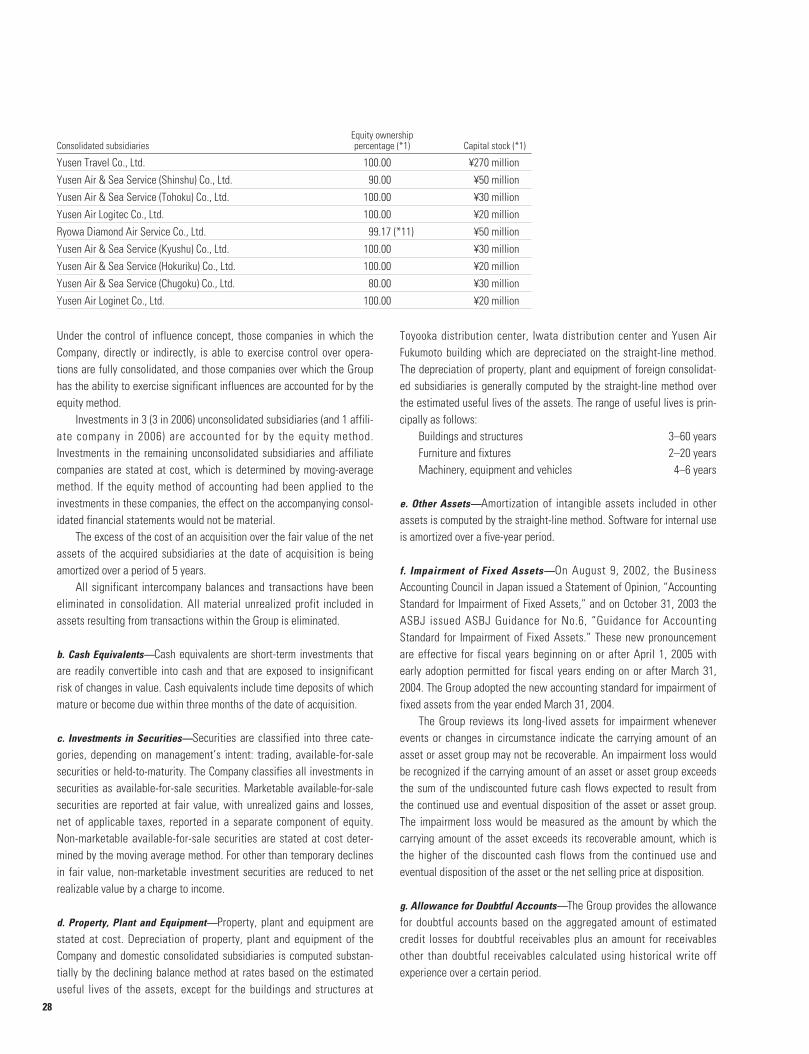
28
Equity ownershipConsolidated subsidiaries percentage (*1) Capital stock (*1)
Yusen Travel Co., Ltd. 100.00 ¥270 million
Yusen Air & Sea Service (Shinshu) Co., Ltd. 90.00 ¥50 million
Yusen Air & Sea Service (Tohoku) Co., Ltd. 100.00 ¥30 million
Yusen Air Logitec Co., Ltd. 100.00 ¥20 million
Ryowa Diamond Air Service Co., Ltd. 99.17 (*11) ¥50 million
Yusen Air & Sea Service (Kyushu) Co., Ltd. 100.00 ¥30 million
Yusen Air & Sea Service (Hokuriku) Co., Ltd. 100.00 ¥20 million
Yusen Air & Sea Service (Chugoku) Co., Ltd. 80.00 ¥30 million
Yusen Air Loginet Co., Ltd. 100.00 ¥20 million
Under the control of influence concept, those companies in which theCompany, directly or indirectly, is able to exercise control over opera-tions are fully consolidated, and those companies over which the Grouphas the ability to exercise significant influences are accounted for by theequity method.
Investments in 3 (3 in 2006) unconsolidated subsidiaries (and 1 affili-ate company in 2006) are accounted for by the equity method.Investments in the remaining unconsolidated subsidiaries and affiliatecompanies are stated at cost, which is determined by moving-averagemethod. If the equity method of accounting had been applied to theinvestments in these companies, the effect on the accompanying consol-idated financial statements would not be material.
The excess of the cost of an acquisition over the fair value of the netassets of the acquired subsidiaries at the date of acquisition is beingamortized over a period of 5 years.
All significant intercompany balances and transactions have beeneliminated in consolidation. All material unrealized profit included inassets resulting from transactions within the Group is eliminated.
b. Cash Equivalents—Cash equivalents are short-term investments thatare readily convertible into cash and that are exposed to insignificantrisk of changes in value. Cash equivalents include time deposits of whichmature or become due within three months of the date of acquisition.
c. Investments in Securities—Securities are classified into three cate-gories, depending on management’s intent: trading, available-for-salesecurities or held-to-maturity. The Company classifies all investments insecurities as available-for-sale securities. Marketable available-for-salesecurities are reported at fair value, with unrealized gains and losses,net of applicable taxes, reported in a separate component of equity.Non-marketable available-for-sale securities are stated at cost deter-mined by the moving average method. For other than temporary declinesin fair value, non-marketable investment securities are reduced to netrealizable value by a charge to income.
d. Property, Plant and Equipment—Property, plant and equipment arestated at cost. Depreciation of property, plant and equipment of theCompany and domestic consolidated subsidiaries is computed substan-tially by the declining balance method at rates based on the estimateduseful lives of the assets, except for the buildings and structures at
Toyooka distribution center, Iwata distribution center and Yusen AirFukumoto building which are depreciated on the straight-line method.The depreciation of property, plant and equipment of foreign consolidat-ed subsidiaries is generally computed by the straight-line method overthe estimated useful lives of the assets. The range of useful lives is prin-cipally as follows:
Buildings and structures 3–60 yearsFurniture and fixtures 2–20 yearsMachinery, equipment and vehicles 4–6 years
e. Other Assets—Amortization of intangible assets included in otherassets is computed by the straight-line method. Software for internal useis amortized over a five-year period.
f. Impairment of Fixed Assets—On August 9, 2002, the BusinessAccounting Council in Japan issued a Statement of Opinion, “AccountingStandard for Impairment of Fixed Assets,” and on October 31, 2003 theASBJ issued ASBJ Guidance for No.6, “Guidance for AccountingStandard for Impairment of Fixed Assets.” These new pronouncementare effective for fiscal years beginning on or after April 1, 2005 withearly adoption permitted for fiscal years ending on or after March 31,2004. The Group adopted the new accounting standard for impairment offixed assets from the year ended March 31, 2004.
The Group reviews its long-lived assets for impairment wheneverevents or changes in circumstance indicate the carrying amount of anasset or asset group may not be recoverable. An impairment loss wouldbe recognized if the carrying amount of an asset or asset group exceedsthe sum of the undiscounted future cash flows expected to result fromthe continued use and eventual disposition of the asset or asset group.The impairment loss would be measured as the amount by which thecarrying amount of the asset exceeds its recoverable amount, which isthe higher of the discounted cash flows from the continued use andeventual disposition of the asset or the net selling price at disposition.
g. Allowance for Doubtful Accounts—The Group provides the allowancefor doubtful accounts based on the aggregated amount of estimatedcredit losses for doubtful receivables plus an amount for receivablesother than doubtful receivables calculated using historical write offexperience over a certain period.
29
es to directors and corporate auditors must be expensed and are nolonger allowed to be directly charged to retained earnings. This account-ing standard is effective for fiscal years ending on or after May 1, 2006.The companies must accrue bonuses to directors and corporate auditorsat the year end to which such bonuses are attributable.
The Company adopted the new accounting standard for bonuses todirectors and corporate auditors from the year ended March 31, 2007.The effect of adoption of this accounting standard was to decreaseincome before income taxes and minority interests for the year endedMarch 31, 2007 by ¥76 million ($644 thousand).
m. Income Taxes—The provision for income taxes is computed based onthe pretax income included in the consolidated statement of income. Theasset and liability approach is used to recognize deferred tax assets andliabilities for the expected future tax consequences of temporary differ-ences between the carrying amounts and the tax bases of assets and lia-bilities. Deferred taxes are measured by applying currently enacted taxlaws to the temporary differences.
n. Accounting for the Consumption Tax—In Japan, the consumption taxis imposed at a flat rate of 5% on all domestic consumption of goods andservices (with certain exemptions). The consumption tax imposed on theGroup's domestic sales to customers is withheld by the Group at the timeof sale and is paid to the national government subsequently. The con-sumption tax withheld upon sale and the consumption tax paid by theGroup on the purchases of goods and services are not included in therelated amounts in the accompanying consolidated statements of income.
o. Appropriation of Retained Earnings—Under the Japanese CorporateLaw and the Articles of Incorporation of the Company, the plan for cashdividends proposed by the board of directors should be approved at theshareholders meeting and the plan for interim dividends should beapproved at the board of directors. Dividends reflected in the accompa-nying consolidated financial statements represent the results of suchdividends applicable to the immediately preceding fiscal year which wasapproved by the shareholders meeting or the board of directors and dis-posed of during that year. Dividends are paid to shareholders on theshareholders' register at the record date of the dividends. The JapaneseCorporate Law also provides that an amount equals to at least 10% ofcash distributions from retained earnings should be appropriated asadditional paid-in capital or legal reserve until the amount of additionalpaid-in capital and legal reserve equal 25% of common stock. The addi-tional paid-in capital and legal reserve may be used to reduce a deficit ormay be transferred to common stock through resolutions by shareholdersand/or directors, and may be transferred to unappropriated retainedearnings to the extent that the amount of additional paid-in capital andlegal reserve does not fall below 25% of common stock. Legal reserve isincluded in “Retained earnings” in the accompanying consolidated finan-cial statements.
p. Treasury Stock—Under the Japanese Corporate Law, the Company isallowed to acquire its own shares to the extent that the aggregate cost
h. Accrued Bonuses to Employees—Employees are paid bonuses in Juneof every year. The bonuses includes amounts for services rendered dur-ing the previous fiscal year which are recorded as accrued bonuses onthe balance sheet as of the respective fiscal year-end.
i. Accrued Pension and Severance Costs
Employee’s Retirement and Pension Plans—The Company and certaindomestic consolidated subsidiaries have a non-contributory fundeddefined benefit pension plan and an unfunded retirement benefit plan.The Company’s certain domestic consolidated subsidiaries have a con-tributory funded defined contribution pension plan, while certain foreignconsolidated subsidiaries have either of a non-contributory fundeddefined benefit pension plan or a contributory funded defined contribu-tion pension plan.
The liability for employees’ retirement benefits is accounted forbased on projected benefit obligations and plan assets at the balancesheet date.
Retirement Allowance for Directors and Corporate Auditors—Retirementallowance for directors and corporate auditors for certain subsidiariesare recorded to state the liability at the amount that would be required ifall directors and corporate auditors retired at each balance sheet date.
j. Presentation of Equity—On December 9, 2005, the ASBJ published anew accounting standard for presentation of equity. Under this account-ing standard, certain items which were previously presented as liabilitiesare now presented as components of equity. Such items include stockacquisition rights, minority interests, and any deferred gain and loss onderivatives accounted for under hedge accounting. This standard is effec-tive for fiscal years ending on or after May 1, 2006. The consolidated bal-ance sheet as of March 31, 2007 is presented in line with this newaccounting standard. As for the consolidated balance sheet as of March31, 2006, certain reclassifications have been made to conform to the wayof presentation of the consolidated balance sheet as of March 31, 2007.
k. Leases—Finance leases other than those that are deemed to transferthe ownership of the leased assets to lessees are generally accountedfor by the method that is applicable to ordinary operating leases.
l. Bonuses to Directors and Corporate Auditors—Prior to the fiscal yearended March 31, 2005, bonuses to directors and corporate auditors wereaccounted for as a reduction of retained earnings in the fiscal year fol-lowing approval at the general shareholders meeting. The ASBJ issuedASBJ Practical Issue Task Force (“PITF”) No.13, “Accounting Treatmentfor Bonuses to Directors and Corporate Auditors,” which encouragedcompanies to record bonuses to directors and corporate auditors on theaccrual basis with a related charge to income, but still permitted thedirect reduction of such bonuses from retained earnings after approval ofthe appropriation of retained earnings.
The ASBJ replaced the above accounting pronouncement by issuinga new accounting standard for bonuses to directors and corporate audi-tors on November 29, 2005. Under the new accounting standard, bonus-

30
of treasury stock does not exceed the maximum amount available for div-idends. Treasury stock is stated at cost in the equity of the accompany-ing consolidated balance sheets. Net gain on disposal of treasury stockis presented under “Capital surplus” in the equity of the accompanyingconsolidated balance sheets.
q. Foreign Currency Transactions—All short-term and long-term mone-tary receivables and payables denominated in foreign currencies aretranslated into Japanese yen at the exchange rates at the balance sheetdate. The foreign exchange gains and losses from translation are recog-nized in the income statement.
r. Foreign Currency Financial Statement—Foreign currency financialstatements of foreign consolidated subsidiaries, and foreign subsidiariesaccounted for by the equity method are translated into Japanese yen atthe current exchange rate as of the balance sheet date except for equity,which is translated at historical rate.
Differences arising from such translations were shown as “Foreigncurrency translation adjustments” in a separate component of equity.
s. Derivatives—The Group uses derivative financial instruments to man-age their exposures to fluctuations in foreign exchange and interestrates. Foreign exchange forward contracts, interest rate swaps and cur-rency swaps are utilized by the Group. The Group does not enter intoderivatives for trading or speculative purposes.
Derivative financial instruments and foreign currency transactions areclassified and accounted for as follows: a) all derivatives are recognizedas either assets or liabilities and measured at fair value, and gains orlosses on derivative transactions are recognized in the income statementand b) for derivatives used for hedging purposes, if derivatives qualifyfor hedge accounting because of high correlation and effectivenessbetween the hedging instruments and the hedged items, gains or losseson derivatives are deferred until maturity of the hedged transactions.
The foreign exchange forward contracts employed to hedge foreignexchange exposures in the Group’s operating activities measured at thefair value and the unrealized gains/losses are recognized in income.Interest rate swaps and currency swaps are utilized to hedge interestrate exposures of long-term debt. While currency swaps are measured atfair value and the unrealized gains/losses are recognized in earnings,interest rate swaps which qualify for hedge accounting and matching cri-teria are not remeasured at market value but the differential paid orreceived under the swap agreements are recognized and included ininterest expense or income.
t. Per Share Information—Net assets per share is computed based onthe outstanding shares of common stock at relevant balance sheet dates.
Basic net income per share is computed by dividing net incomeavailable to shareholders by the weight-average number of shares ofcommon stock outstanding for the period.
Diluted net income per share for the years ended March 31, 2007and 2006 are not presented since the Company had no securities withdilutive effect.
Cash dividends per share presented in the accompanying consolidat-ed statements of income are dividends applicable to the respective yearsincluding dividends to be paid after the year end of the year.
u. New Accounting Pronouncements
Lease Accounting—On March 30, 2007, the ASBJ issued ASBJ State-ment No.13, “Accounting Standard for Lease Transactions,” whichrevised the existing accounting standard for lease transactions issued onJune 17, 1993.
Under the existing accounting standard, finance leases that deem totransfer ownership of the leased property to the lessee are to be capital-ized, however, other finance leases are permitted to be accounted for asoperating lease transactions if certain “as if capitalized” information isdisclosed in the note to the lessee’s financial statements.
The revised accounting standard requires that all finance leasetransactions should be capitalized. The revised accounting standard forlease transactions is effective for fiscal years beginning on or after April1, 2008, with early adoption permitted for fiscal years beginning on orafter April 1, 2007.
Unification of Accounting Policies Applied to Foreign Subsidiaries for the
Consolidated Financial Statements—Under Japanese GAAP, a companycurrently can use the financial statements of foreign subsidiaries whichare prepared in accordance with generally accepted accounting princi-ples in their respective jurisdictions for its consolidation process unlessthey are clearly unreasonable. On May 17, 2006, the ASBJ issued ASBJPITF No. 18, “Practical Solution on Unification of Accounting PoliciesApplies to Foreign Subsidiaries for the Consolidated FinancialStatements.” The new task force prescribes: 1) the accounting policiesand procedures applied to a parent company and its subsidiaries forsimilar transactions and events under similar circumstances should inprinciple be unified for the preparation of the consolidated financialstatements, 2) financial statements prepared by foreign subsidiaries inaccordance with either International Financial Reporting Standards orthe generally accepted accounting principles in the United States tenta-tively may be used for the consolidation process, 3) however, the follow-ing items should be adjusted in the consolidation process so that netincome is accounted for in accordance with Japanese GAAP unless theyare not material;
(1) Amortization of goodwill(2) Actuarial gains and losses of defined benefit plans recognized
outside profit or loss(3) Capitalization of intangible assets arising from development
phases(4) Fair value measurement of investment properties, and the revalu-
ation model for property, plant and equipment, and intangibleassets
(5) Retrospective application when accounting policies are changed(6) Accounting for net income attributable to a minority interestThe new task force is effective for fiscal years beginning on or after
April 1, 2008 with early adoption permitted.
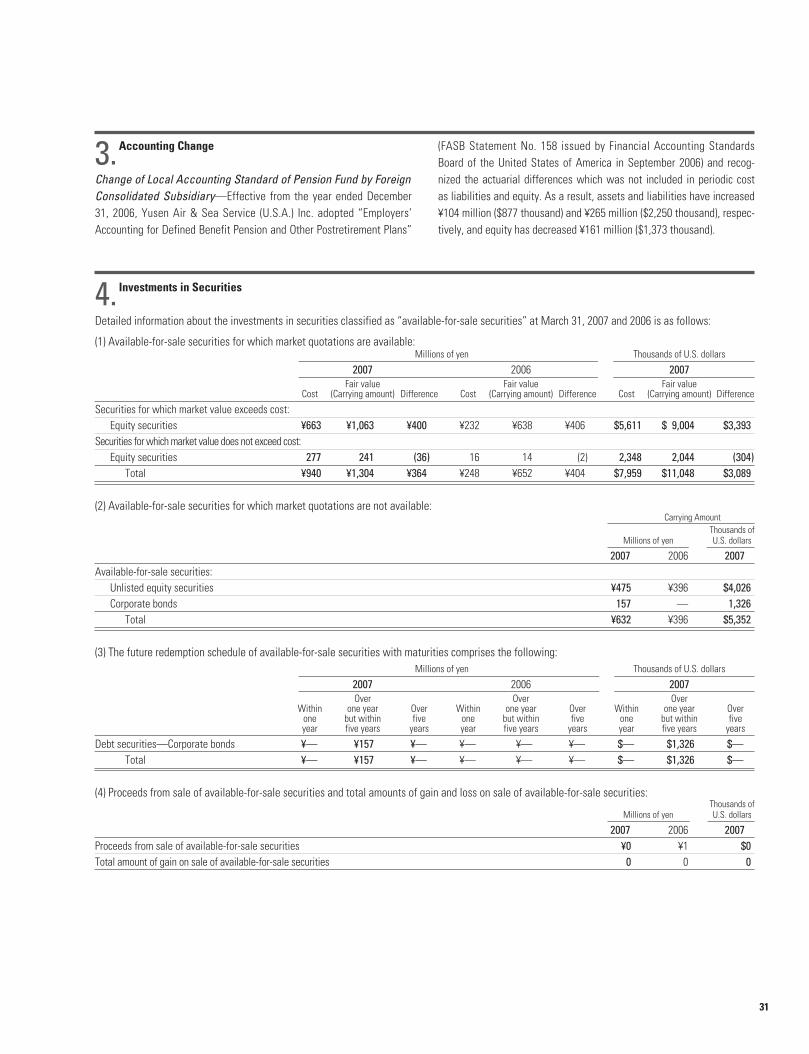
31
Investments in Securities
Detailed information about the investments in securities classified as “available-for-sale securities” at March 31, 2007 and 2006 is as follows:
(1) Available-for-sale securities for which market quotations are available:Millions of yen Thousands of U.S. dollars
2007 2006 2007Fair value Fair value Fair value
Cost (Carrying amount) Difference Cost (Carrying amount) Difference Cost (Carrying amount) Difference
Securities for which market value exceeds cost:Equity securities ¥663 ¥1,063 ¥400 ¥232 ¥638 ¥406 $5,611 $ 9,004 $3,393
Securities for which market value does not exceed cost:Equity securities 277 241 (36) 16 14 (2) 2,348 2,044 (304)
Total ¥940 ¥1,304 ¥364 ¥248 ¥652 ¥404 $7,959 $11,048 $3,089
(2) Available-for-sale securities for which market quotations are not available:Carrying Amount
Thousands ofMillions of yen U.S. dollars
2007 2006 2007Available-for-sale securities:
Unlisted equity securities ¥475 ¥396 $4,026Corporate bonds 157 — 1,326
Total ¥632 ¥396 $5,352
(3) The future redemption schedule of available-for-sale securities with maturities comprises the following:Millions of yen Thousands of U.S. dollars
2007 2006 2007Over Over Over
Within one year Over Within one year Over Within one year Overone but within five one but within five one but within fiveyear five years years year five years years year five years years
Debt securities—Corporate bonds ¥— ¥157 ¥— ¥— ¥— ¥— $— $1,326 $—Total ¥— ¥157 ¥— ¥— ¥— ¥— $— $1,326 $—
(4) Proceeds from sale of available-for-sale securities and total amounts of gain and loss on sale of available-for-sale securities:Thousands of
Millions of yen U.S. dollars
2007 2006 2007Proceeds from sale of available-for-sale securities ¥0 ¥1 $0Total amount of gain on sale of available-for-sale securities 0 0 0
4.
3.Accounting Change
Change of Local Accounting Standard of Pension Fund by ForeignConsolidated Subsidiary—Effective from the year ended December31, 2006, Yusen Air & Sea Service (U.S.A.) Inc. adopted “Employers’Accounting for Defined Benefit Pension and Other Postretirement Plans”
(FASB Statement No. 158 issued by Financial Accounting StandardsBoard of the United States of America in September 2006) and recog-nized the actuarial differences which was not included in periodic costas liabilities and equity. As a result, assets and liabilities have increased¥104 million ($877 thousand) and ¥265 million ($2,250 thousand), respec-tively, and equity has decreased ¥161 million ($1,373 thousand).
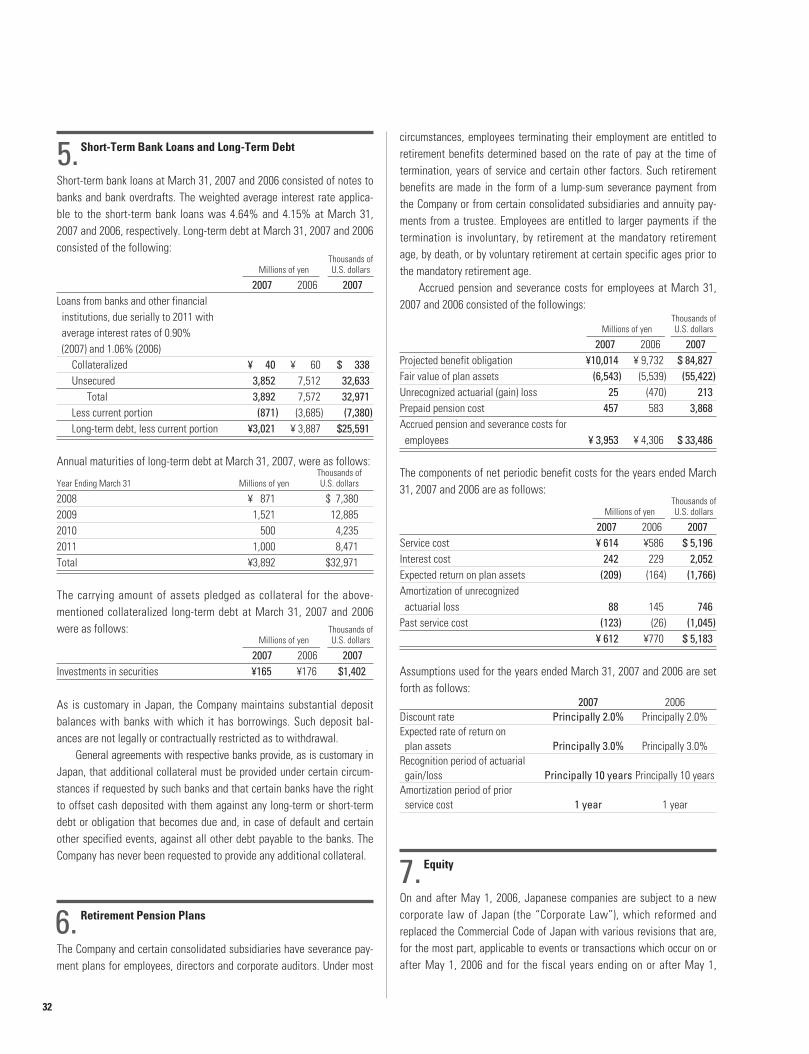
32
Short-Term Bank Loans and Long-Term Debt
Short-term bank loans at March 31, 2007 and 2006 consisted of notes tobanks and bank overdrafts. The weighted average interest rate applica-ble to the short-term bank loans was 4.64% and 4.15% at March 31,2007 and 2006, respectively. Long-term debt at March 31, 2007 and 2006consisted of the following:
Thousands ofMillions of yen U.S. dollars
2007 2006 2007Loans from banks and other financial institutions, due serially to 2011 with average interest rates of 0.90% (2007) and 1.06% (2006)
Collateralized ¥ 40 ¥ 60 $ 338Unsecured 3,852 7,512 32,633
Total 3,892 7,572 32,971Less current portion (871) (3,685) (7,380)Long-term debt, less current portion ¥3,021 ¥ 3,887 $25,591
Annual maturities of long-term debt at March 31, 2007, were as follows:Thousands of
Year Ending March 31 Millions of yen U.S. dollars
2008 ¥ 871 $ 7,3802009 1,521 12,8852010 500 4,2352011 1,000 8,471Total ¥3,892 $32,971
The carrying amount of assets pledged as collateral for the above-mentioned collateralized long-term debt at March 31, 2007 and 2006were as follows:
5.circumstances, employees terminating their employment are entitled toretirement benefits determined based on the rate of pay at the time oftermination, years of service and certain other factors. Such retirementbenefits are made in the form of a lump-sum severance payment fromthe Company or from certain consolidated subsidiaries and annuity pay-ments from a trustee. Employees are entitled to larger payments if thetermination is involuntary, by retirement at the mandatory retirementage, by death, or by voluntary retirement at certain specific ages prior tothe mandatory retirement age.
Accrued pension and severance costs for employees at March 31,2007 and 2006 consisted of the followings:
6.7.
Thousands ofMillions of yen U.S. dollars
2007 2006 2007Projected benefit obligation ¥10,014 ¥ 9,732 $ 84,827Fair value of plan assets (6,543) (5,539) (55,422)Unrecognized actuarial (gain) loss 25 (470) 213Prepaid pension cost 457 583 3,868Accrued pension and severance costs for employees ¥ 3,953 ¥ 4,306 $ 33,486
The components of net periodic benefit costs for the years ended March31, 2007 and 2006 are as follows:
Thousands ofMillions of yen U.S. dollars
2007 2006 2007Service cost ¥ 614 ¥586 $ 5,196Interest cost 242 229 2,052Expected return on plan assets (209) (164) (1,766)Amortization of unrecognized actuarial loss 88 145 746
Past service cost (123) (26) (1,045)¥ 612 ¥770 $ 5,183
Assumptions used for the years ended March 31, 2007 and 2006 are setforth as follows:
Thousands ofMillions of yen U.S. dollars
2007 2006 2007Investments in securities ¥165 ¥176 $1,402
As is customary in Japan, the Company maintains substantial depositbalances with banks with which it has borrowings. Such deposit bal-ances are not legally or contractually restricted as to withdrawal.
General agreements with respective banks provide, as is customary inJapan, that additional collateral must be provided under certain circum-stances if requested by such banks and that certain banks have the rightto offset cash deposited with them against any long-term or short-termdebt or obligation that becomes due and, in case of default and certainother specified events, against all other debt payable to the banks. TheCompany has never been requested to provide any additional collateral.
Retirement Pension Plans
The Company and certain consolidated subsidiaries have severance pay-ment plans for employees, directors and corporate auditors. Under most
2007 2006Discount rate Principally 2.0% Principally 2.0%Expected rate of return on plan assets Principally 3.0% Principally 3.0%
Recognition period of actuarial gain/loss Principally 10 years Principally 10 years
Amortization period of prior service cost 1 year 1 year
Equity
On and after May 1, 2006, Japanese companies are subject to a newcorporate law of Japan (the “Corporate Law”), which reformed andreplaced the Commercial Code of Japan with various revisions that are,for the most part, applicable to events or transactions which occur on orafter May 1, 2006 and for the fiscal years ending on or after May 1,
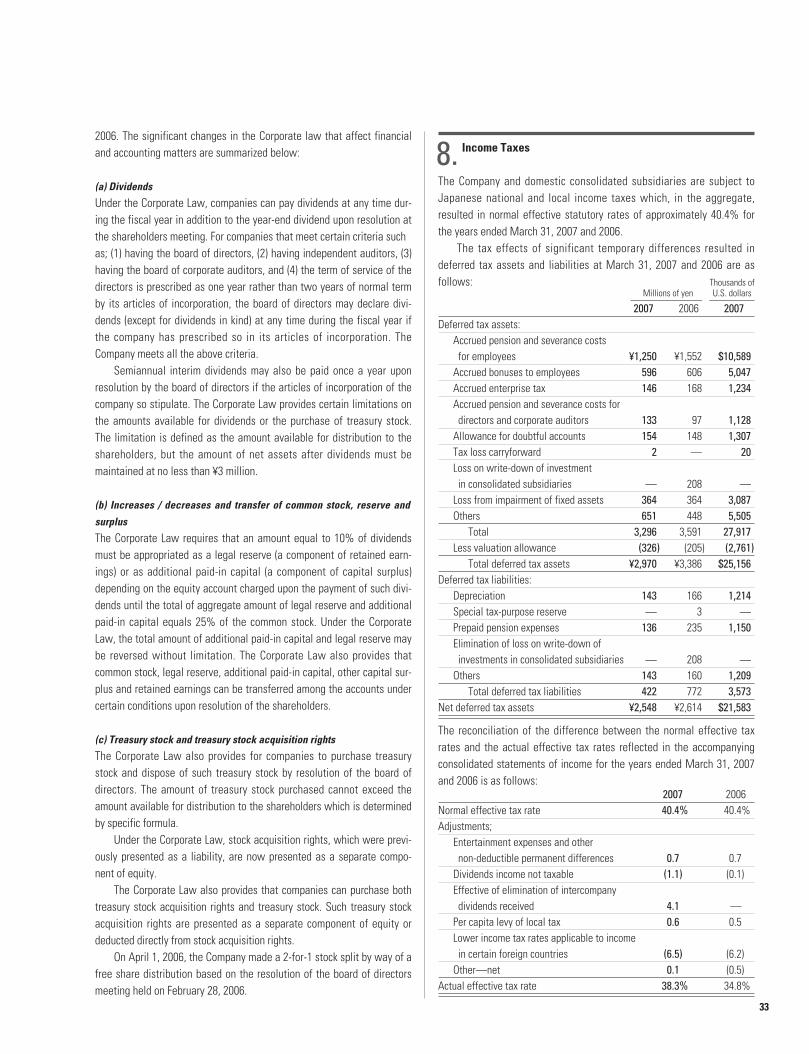
33
2006. The significant changes in the Corporate law that affect financialand accounting matters are summarized below:
(a) Dividends
Under the Corporate Law, companies can pay dividends at any time dur-ing the fiscal year in addition to the year-end dividend upon resolution atthe shareholders meeting. For companies that meet certain criteria suchas; (1) having the board of directors, (2) having independent auditors, (3)having the board of corporate auditors, and (4) the term of service of thedirectors is prescribed as one year rather than two years of normal termby its articles of incorporation, the board of directors may declare divi-dends (except for dividends in kind) at any time during the fiscal year ifthe company has prescribed so in its articles of incorporation. TheCompany meets all the above criteria.
Semiannual interim dividends may also be paid once a year uponresolution by the board of directors if the articles of incorporation of thecompany so stipulate. The Corporate Law provides certain limitations onthe amounts available for dividends or the purchase of treasury stock.The limitation is defined as the amount available for distribution to theshareholders, but the amount of net assets after dividends must bemaintained at no less than ¥3 million.
(b) Increases / decreases and transfer of common stock, reserve and
surplus
The Corporate Law requires that an amount equal to 10% of dividendsmust be appropriated as a legal reserve (a component of retained earn-ings) or as additional paid-in capital (a component of capital surplus)depending on the equity account charged upon the payment of such divi-dends until the total of aggregate amount of legal reserve and additionalpaid-in capital equals 25% of the common stock. Under the CorporateLaw, the total amount of additional paid-in capital and legal reserve maybe reversed without limitation. The Corporate Law also provides thatcommon stock, legal reserve, additional paid-in capital, other capital sur-plus and retained earnings can be transferred among the accounts undercertain conditions upon resolution of the shareholders.
(c) Treasury stock and treasury stock acquisition rights
The Corporate Law also provides for companies to purchase treasurystock and dispose of such treasury stock by resolution of the board ofdirectors. The amount of treasury stock purchased cannot exceed theamount available for distribution to the shareholders which is determinedby specific formula.
Under the Corporate Law, stock acquisition rights, which were previ-ously presented as a liability, are now presented as a separate compo-nent of equity.
The Corporate Law also provides that companies can purchase bothtreasury stock acquisition rights and treasury stock. Such treasury stockacquisition rights are presented as a separate component of equity ordeducted directly from stock acquisition rights.
On April 1, 2006, the Company made a 2-for-1 stock split by way of afree share distribution based on the resolution of the board of directorsmeeting held on February 28, 2006.
Income Taxes
The Company and domestic consolidated subsidiaries are subject toJapanese national and local income taxes which, in the aggregate,resulted in normal effective statutory rates of approximately 40.4% forthe years ended March 31, 2007 and 2006.
The tax effects of significant temporary differences resulted indeferred tax assets and liabilities at March 31, 2007 and 2006 are asfollows:
8.
Thousands ofMillions of yen U.S. dollars
2007 2006 2007Deferred tax assets:
Accrued pension and severance costs for employees ¥1,250 ¥1,552 $10,589
Accrued bonuses to employees 596 606 5,047Accrued enterprise tax 146 168 1,234Accrued pension and severance costs for directors and corporate auditors 133 97 1,128
Allowance for doubtful accounts 154 148 1,307Tax loss carryforward 2 — 20Loss on write-down of investmentin consolidated subsidiaries — 208 —
Loss from impairment of fixed assets 364 364 3,087Others 651 448 5,505
Total 3,296 3,591 27,917Less valuation allowance (326) (205) (2,761)
Total deferred tax assets ¥2,970 ¥3,386 $25,156Deferred tax liabilities:
Depreciation 143 166 1,214Special tax-purpose reserve — 3 —Prepaid pension expenses 136 235 1,150Elimination of loss on write-down of investments in consolidated subsidiaries — 208 —
Others 143 160 1,209Total deferred tax liabilities 422 772 3,573
Net deferred tax assets ¥2,548 ¥2,614 $21,583
The reconciliation of the difference between the normal effective taxrates and the actual effective tax rates reflected in the accompanyingconsolidated statements of income for the years ended March 31, 2007and 2006 is as follows:
2007 2006Normal effective tax rate 40.4% 40.4%Adjustments;
Entertainment expenses and othernon-deductible permanent differences 0.7 0.7
Dividends income not taxable (1.1) (0.1)Effective of elimination of intercompany dividends received 4.1 —
Per capita levy of local tax 0.6 0.5Lower income tax rates applicable to incomein certain foreign countries (6.5) (6.2)
Other—net 0.1 (0.5)Actual effective tax rate 38.3% 34.8%
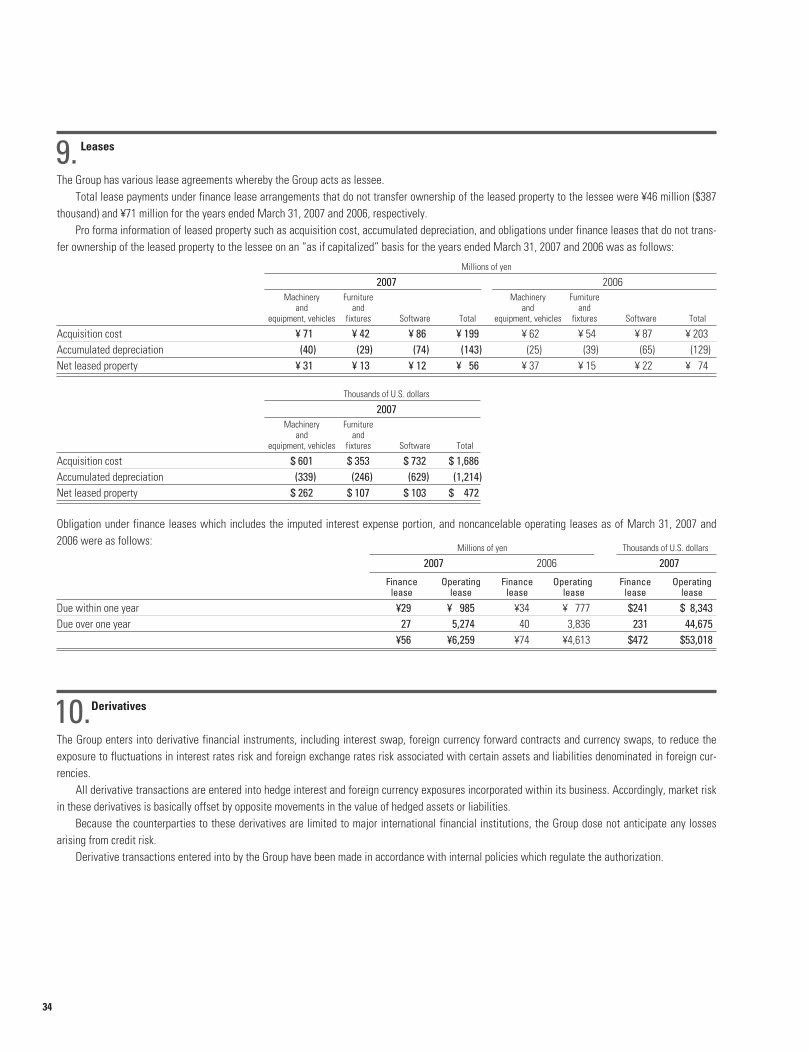
Leases
The Group has various lease agreements whereby the Group acts as lessee.Total lease payments under finance lease arrangements that do not transfer ownership of the leased property to the lessee were ¥46 million ($387
thousand) and ¥71 million for the years ended March 31, 2007 and 2006, respectively.Pro forma information of leased property such as acquisition cost, accumulated depreciation, and obligations under finance leases that do not trans-
fer ownership of the leased property to the lessee on an “as if capitalized” basis for the years ended March 31, 2007 and 2006 was as follows:
Millions of yen
2007 2006Machinery Furniture Machinery Furniture
and and and andequipment, vehicles fixtures Software Total equipment, vehicles fixtures Software Total
Acquisition cost ¥ 71 ¥ 42 ¥ 86 ¥ 199 ¥ 62 ¥ 54 ¥ 87 ¥ 203Accumulated depreciation (40) (29) (74) (143) (25) (39) (65) (129)Net leased property ¥ 31 ¥ 13 ¥ 12 ¥ 56 ¥ 37 ¥ 15 ¥ 22 ¥ 74
Thousands of U.S. dollars
2007Machinery Furniture
and andequipment, vehicles fixtures Software Total
Acquisition cost $ 601 $ 353 $ 732 $ 1,686Accumulated depreciation (339) (246) (629) (1,214)Net leased property $ 262 $ 107 $ 103 $ 472
Obligation under finance leases which includes the imputed interest expense portion, and noncancelable operating leases as of March 31, 2007 and2006 were as follows:
Millions of yen Thousands of U.S. dollars
2007 2006 2007
Finance Operating Finance Operating Finance Operatinglease lease lease lease lease lease
Due within one year ¥29 ¥ 985 ¥34 ¥ 777 $241 $ 8,343Due over one year 27 5,274 40 3,836 231 44,675
¥56 ¥6,259 ¥74 ¥4,613 $472 $53,018
Derivatives
The Group enters into derivative financial instruments, including interest swap, foreign currency forward contracts and currency swaps, to reduce theexposure to fluctuations in interest rates risk and foreign exchange rates risk associated with certain assets and liabilities denominated in foreign cur-rencies.
All derivative transactions are entered into hedge interest and foreign currency exposures incorporated within its business. Accordingly, market riskin these derivatives is basically offset by opposite movements in the value of hedged assets or liabilities.
Because the counterparties to these derivatives are limited to major international financial institutions, the Group dose not anticipate any lossesarising from credit risk.
Derivative transactions entered into by the Group have been made in accordance with internal policies which regulate the authorization.
34
10.
9.
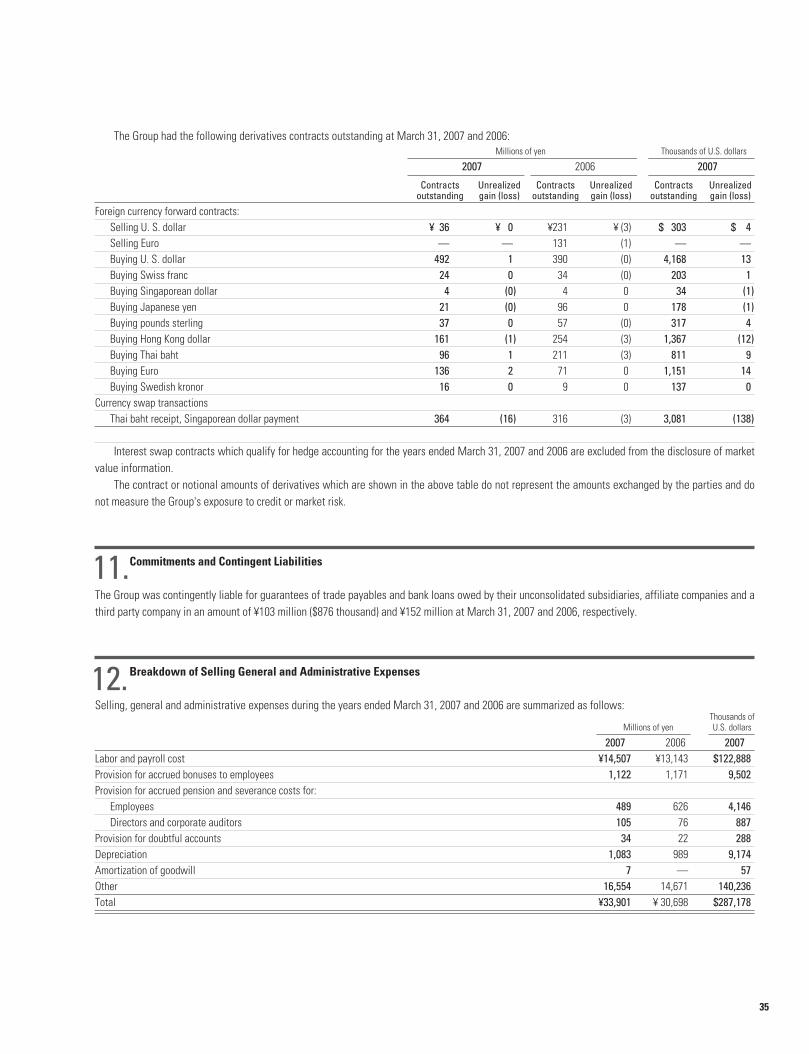
35
The Group had the following derivatives contracts outstanding at March 31, 2007 and 2006:Millions of yen Thousands of U.S. dollars
2007 2006 2007
Contracts Unrealized Contracts Unrealized Contracts Unrealizedoutstanding gain (loss) outstanding gain (loss) outstanding gain (loss)
Foreign currency forward contracts:Selling U. S. dollar ¥ 36 ¥ 0 ¥231 ¥ (3) $ 303 $ 4Selling Euro — — 131 (1) — —Buying U. S. dollar 492 1 390 (0) 4,168 13Buying Swiss franc 24 0 34 (0) 203 1Buying Singaporean dollar 4 (0) 4 0 34 (1)Buying Japanese yen 21 (0) 96 0 178 (1)Buying pounds sterling 37 0 57 (0) 317 4Buying Hong Kong dollar 161 (1) 254 (3) 1,367 (12)Buying Thai baht 96 1 211 (3) 811 9Buying Euro 136 2 71 0 1,151 14Buying Swedish kronor 16 0 9 0 137 0
Currency swap transactionsThai baht receipt, Singaporean dollar payment 364 (16) 316 (3) 3,081 (138)
Interest swap contracts which qualify for hedge accounting for the years ended March 31, 2007 and 2006 are excluded from the disclosure of marketvalue information.
The contract or notional amounts of derivatives which are shown in the above table do not represent the amounts exchanged by the parties and donot measure the Group's exposure to credit or market risk.
Commitments and Contingent Liabilities
The Group was contingently liable for guarantees of trade payables and bank loans owed by their unconsolidated subsidiaries, affiliate companies and athird party company in an amount of ¥103 million ($876 thousand) and ¥152 million at March 31, 2007 and 2006, respectively.
Breakdown of Selling General and Administrative Expenses
Selling, general and administrative expenses during the years ended March 31, 2007 and 2006 are summarized as follows:Thousands of
Millions of yen U.S. dollars
2007 2006 2007Labor and payroll cost ¥14,507 ¥13,143 $122,888Provision for accrued bonuses to employees 1,122 1,171 9,502Provision for accrued pension and severance costs for:
Employees 489 626 4,146Directors and corporate auditors 105 76 887
Provision for doubtful accounts 34 22 288Depreciation 1,083 989 9,174Amortization of goodwill 7 — 57Other 16,554 14,671 140,236Total ¥33,901 ¥ 30,698 $287,178
11.
12.
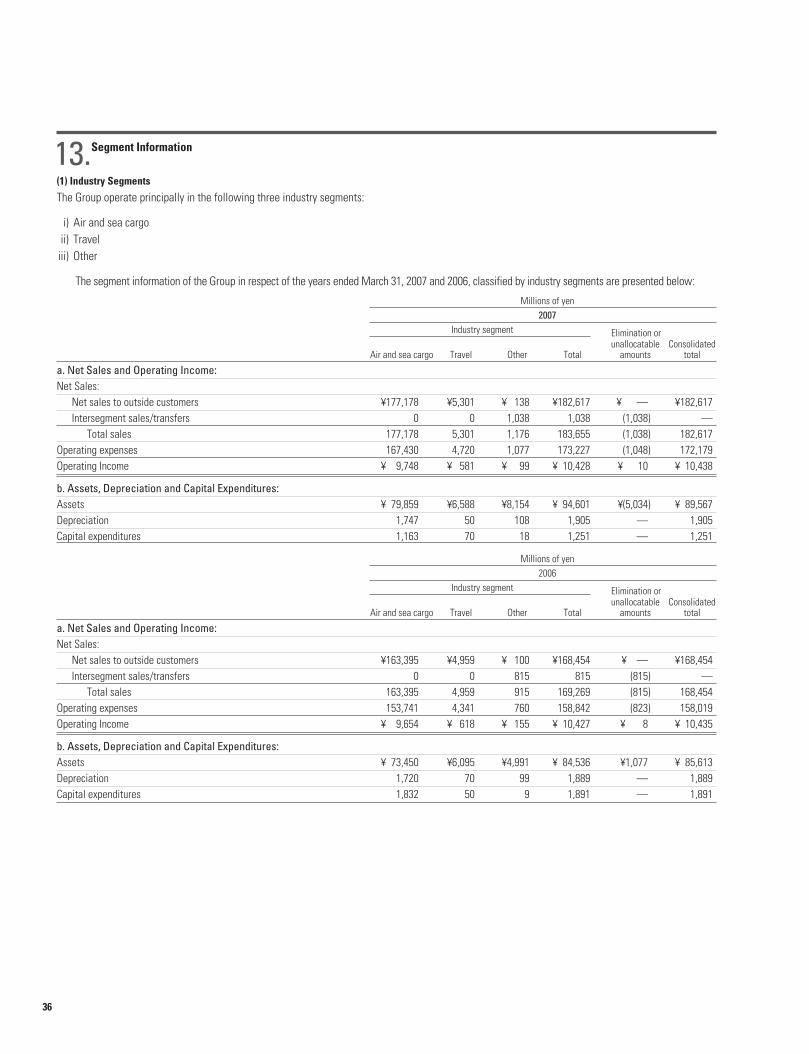
36
Segment Information
(1) Industry Segments
The Group operate principally in the following three industry segments:
i) Air and sea cargoii) Traveliii) Other
The segment information of the Group in respect of the years ended March 31, 2007 and 2006, classified by industry segments are presented below:
Millions of yen2007
Industry segment Elimination orunallocatable Consolidated
Air and sea cargo Travel Other Total amounts total
a. Net Sales and Operating Income:Net Sales:
Net sales to outside customers ¥177,178 ¥5,301 ¥ 138 ¥182,617 ¥ — ¥182,617Intersegment sales/transfers 0 0 1,038 1,038 (1,038) —
Total sales 177,178 5,301 1,176 183,655 (1,038) 182,617Operating expenses 167,430 4,720 1,077 173,227 (1,048) 172,179Operating Income ¥ 9,748 ¥ 581 ¥ 99 ¥ 10,428 ¥ 10 ¥ 10,438
b. Assets, Depreciation and Capital Expenditures:Assets ¥ 79,859 ¥6,588 ¥8,154 ¥ 94,601 ¥(5,034) ¥ 89,567Depreciation 1,747 50 108 1,905 — 1,905Capital expenditures 1,163 70 18 1,251 — 1,251
Millions of yen2006
Industry segment Elimination orunallocatable Consolidated
Air and sea cargo Travel Other Total amounts total
a. Net Sales and Operating Income:Net Sales:
Net sales to outside customers ¥163,395 ¥4,959 ¥0,100 ¥168,454 ¥ ,— ¥168,454Intersegment sales/transfers 0 0 815 815 (815) —
Total sales 163,395 4,959 915 169,269 (815) 168,454Operating expenses 153,741 4,341 760 158,842 (823) 158,019Operating Income ¥009,654 ¥0,618 ¥0,155 ¥010,427 ¥0,008 ¥010,435
b. Assets, Depreciation and Capital Expenditures:Assets ¥073,450 ¥6,095 ¥4,991 ¥084,536 ¥1,077 ¥085,613Depreciation 1,720 70 99 1,889 — 1,889Capital expenditures 1,832 50 9 1,891 — 1,891
13.
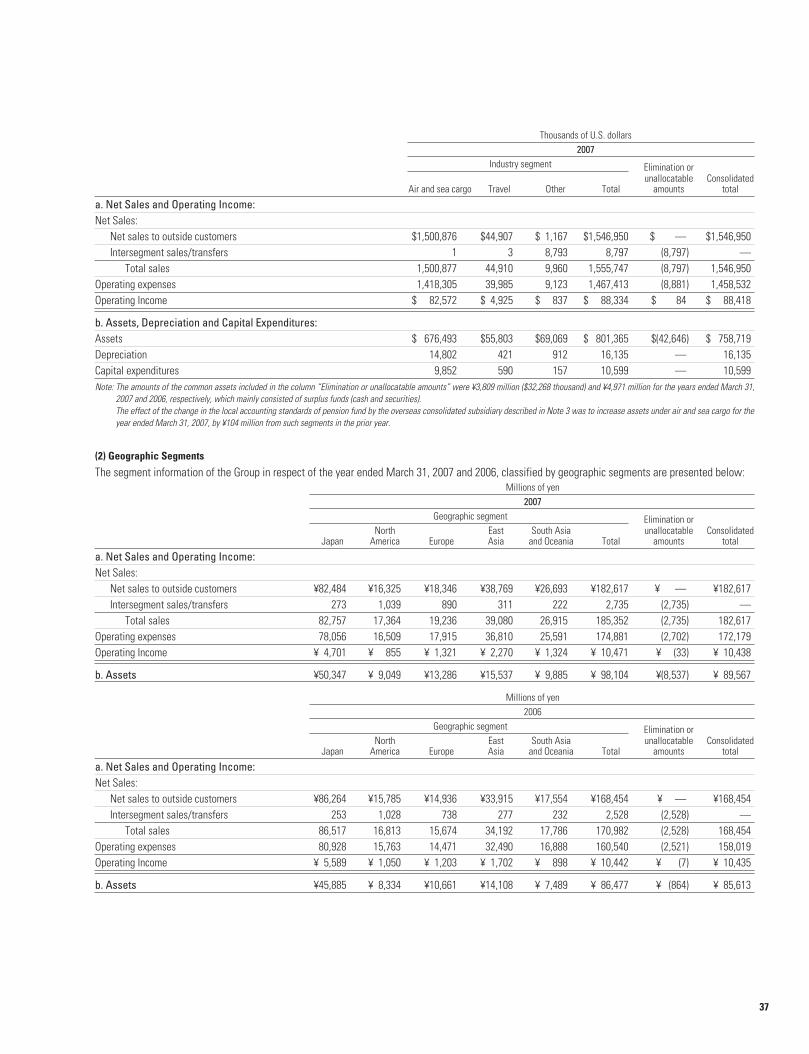
37
Thousands of U.S. dollars2007
Industry segment Elimination orunallocatable Consolidated
Air and sea cargo Travel Other Total amounts total
a. Net Sales and Operating Income:Net Sales:
Net sales to outside customers $1,500,876 $44,907 $ 1,167 $1,546,950 $ — $1,546,950Intersegment sales/transfers 1 3 8,793 8,797 (8,797) —
Total sales 1,500,877 44,910 9,960 1,555,747 (8,797) 1,546,950Operating expenses 1,418,305 39,985 9,123 1,467,413 (8,881) 1,458,532Operating Income $ 82,572 $ 4,925 $ 837 $ 88,334 $ 84 $ 88,418
b. Assets, Depreciation and Capital Expenditures:Assets $ 676,493 $55,803 $69,069 $ 801,365 $(42,646) $ 758,719Depreciation 14,802 421 912 16,135 — 16,135Capital expenditures 9,852 590 157 10,599 — 10,599Note: The amounts of the common assets included in the column “Elimination or unallocatable amounts” were ¥3,809 million ($32,268 thousand) and ¥4,971 million for the years ended March 31,
2007 and 2006, respectively, which mainly consisted of surplus funds (cash and securities).The effect of the change in the local accounting standards of pension fund by the overseas consolidated subsidiary described in Note 3 was to increase assets under air and sea cargo for theyear ended March 31, 2007, by ¥104 million from such segments in the prior year.
(2) Geographic Segments
The segment information of the Group in respect of the year ended March 31, 2007 and 2006, classified by geographic segments are presented below:Millions of yen
2007Geographic segment Elimination or
North East South Asia unallocatable ConsolidatedJapan America Europe Asia and Oceania Total amounts total
a. Net Sales and Operating Income:Net Sales:
Net sales to outside customers ¥82,484 ¥16,325 ¥18,346 ¥38,769 ¥26,693 ¥182,617 ¥ — ¥182,617Intersegment sales/transfers 273 1,039 890 311 222 2,735 (2,735) —
Total sales 82,757 17,364 19,236 39,080 26,915 185,352 (2,735) 182,617Operating expenses 78,056 16,509 17,915 36,810 25,591 174,881 (2,702) 172,179Operating Income ¥ 4,701 ¥ 855 ¥ 1,321 ¥ 2,270 ¥ 1,324 ¥ 10,471 ¥ (33) ¥ 10,438
b. Assets ¥50,347 ¥ 9,049 ¥13,286 ¥15,537 ¥ 9,885 ¥ 98,104 ¥(8,537) ¥ 89,567
Millions of yen2006
Geographic segment Elimination orNorth East South Asia unallocatable Consolidated
Japan America Europe Asia and Oceania Total amounts total
a. Net Sales and Operating Income:Net Sales:
Net sales to outside customers ¥86,264 ¥15,785 ¥14,936 ¥33,915 ¥17,554 ¥168,454 ¥ — ¥168,454Intersegment sales/transfers 253 1,028 738 277 232 2,528 (2,528) —
Total sales 86,517 16,813 15,674 34,192 17,786 170,982 (2,528) 168,454Operating expenses 80,928 15,763 14,471 32,490 16,888 160,540 (2,521) 158,019Operating Income ¥05,589 ¥01,050 ¥01,203 ¥01,702 ¥00,898 ¥010,442 ¥ (7) ¥010,435
b. Assets ¥45,885 ¥08,334 ¥10,661 ¥14,108 ¥07,489 ¥086,477 ¥ (864) ¥085,613
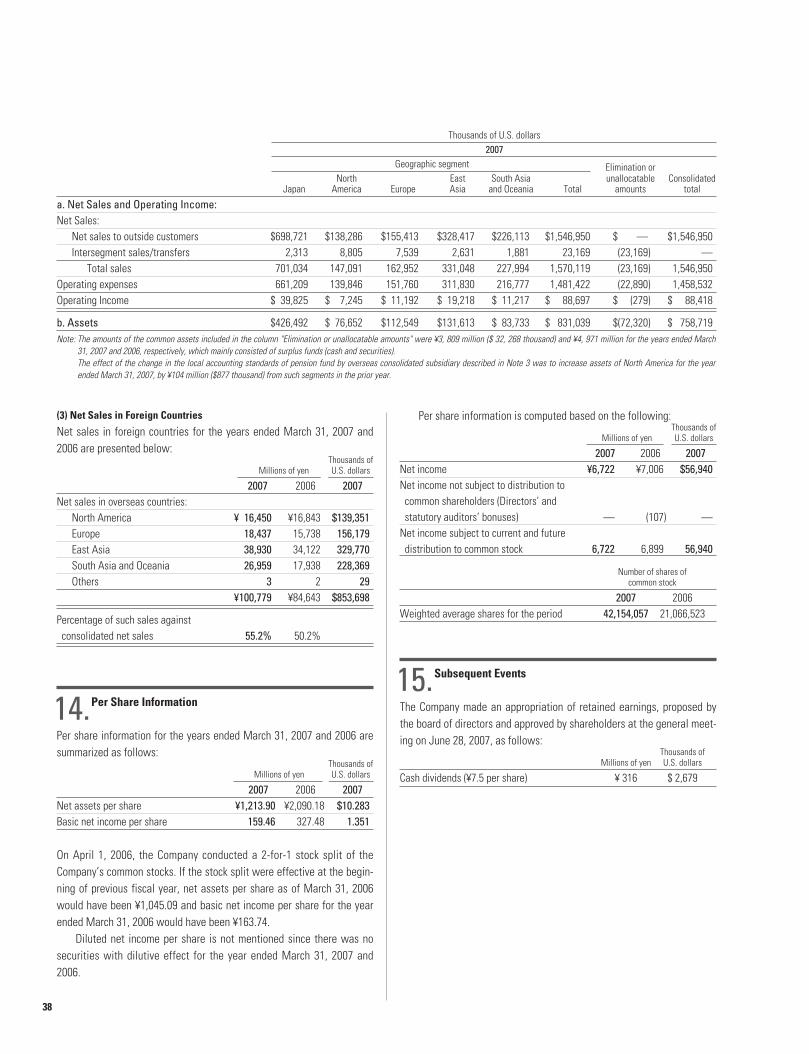
38
Thousands of U.S. dollars2007
Geographic segment Elimination orNorth East South Asia unallocatable Consolidated
Japan America Europe Asia and Oceania Total amounts total
a. Net Sales and Operating Income:Net Sales:
Net sales to outside customers $698,721 $138,286 $155,413 $328,417 $226,113 $1,546,950 $ — $1,546,950Intersegment sales/transfers 2,313 8,805 7,539 2,631 1,881 23,169 (23,169) —
Total sales 701,034 147,091 162,952 331,048 227,994 1,570,119 (23,169) 1,546,950Operating expenses 661,209 139,846 151,760 311,830 216,777 1,481,422 (22,890) 1,458,532Operating Income $ 39,825 $ 7,245 $ 11,192 $ 19,218 $ 11,217 $ 88,697 $ (279) $ 88,418
b. Assets $426,492 $ 76,652 $112,549 $131,613 $ 83,733 $ 831,039 $(72,320) $ 758,719Note: The amounts of the common assets included in the column "Elimination or unallocatable amounts" were ¥3, 809 million ($ 32, 268 thousand) and ¥4, 971 million for the years ended March
31, 2007 and 2006, respectively, which mainly consisted of surplus funds (cash and securities).The effect of the change in the local accounting standards of pension fund by overseas consolidated subsidiary described in Note 3 was to increase assets of North America for the yearended March 31, 2007, by ¥104 million ($877 thousand) from such segments in the prior year.
14.15.
(3) Net Sales in Foreign Countries
Net sales in foreign countries for the years ended March 31, 2007 and2006 are presented below:
Thousands ofMillions of yen U.S. dollars
2007 2006 2007Net sales in overseas countries:
North America ¥ 16,450 ¥16,843 $139,351Europe 18,437 15,738 156,179East Asia 38,930 34,122 329,770South Asia and Oceania 26,959 17,938 228,369Others 3 2 29
¥100,779 ¥84,643 $853,698
Percentage of such sales against consolidated net sales 55.2% 50.2%
Per Share Information
Per share information for the years ended March 31, 2007 and 2006 aresummarized as follows:
Thousands ofMillions of yen U.S. dollars
2007 2006 2007Net assets per share ¥1,213.90 ¥2,090.18 $10.283Basic net income per share 159.46 327.48 1.351
On April 1, 2006, the Company conducted a 2-for-1 stock split of theCompany’s common stocks. If the stock split were effective at the begin-ning of previous fiscal year, net assets per share as of March 31, 2006would have been ¥1,045.09 and basic net income per share for the yearended March 31, 2006 would have been ¥163.74.
Diluted net income per share is not mentioned since there was nosecurities with dilutive effect for the year ended March 31, 2007 and2006.
Per share information is computed based on the following:Thousands of
Millions of yen U.S. dollars
2007 2006 2007Net income ¥6,722 ¥7,006 $56,940Net income not subject to distribution tocommon shareholders (Directors’ and statutory auditors’ bonuses) — (107) —
Net income subject to current and future distribution to common stock 6,722 6,899 56,940
Number of shares ofcommon stock
2007 2006Weighted average shares for the period 42,154,057 21,066,523
Subsequent Events
The Company made an appropriation of retained earnings, proposed bythe board of directors and approved by shareholders at the general meet-ing on June 28, 2007, as follows:
Thousands ofMillions of yen U.S. dollars
Cash dividends (¥7.5 per share) ¥ 316 $ 2,679
39
To the Board of Directors and Shareholders of Yusen Air & Sea Service Co., Ltd.:
We have audited the accompanying consolidated balance sheet of Yusen Air & Sea Service Co., Ltd. (the “Company”) and its consolidated subsidiaries(together, the ”Group”) as of March 31, 2007, and the related consolidated statements of income, changes in equity, and cash flows for the year thenended, all expressed in Japanese yen. These consolidated financial statements are the responsibility of the Company’s management. Our responsibilityis to express an opinion on these consolidated financial statements based on our audit. The consolidated financial statements of the Group for the yearended March 31, 2006 were audited by other auditors whose report, dated June 29, 2006, expressed an unqualified opinion on those statements.
We conducted our audit in accordance with auditing standards generally accepted in Japan. Those standards require that we plan and perform the auditto obtain reasonable assurance about whether the financial statements are free of material misstatement. An audit includes examining, on a test basis,evidence supporting the amounts and disclosures in the financial statements. An audit also includes assessing the accounting principles used and sig-nificant estimates made by management, as well as evaluating the overall financial statement presentation. We believe that our audit provides a rea-sonable basis for our opinion.
In our opinion, the consolidated financial statements referred to above present fairly, in all material respects, the consolidated financial position of theGroup as of March 31, 2007, and the consolidated results of their operations and their cash flows for the year then ended in conformity with accountingprinciples generally accepted in Japan.
Our audit also comprehended the translation of Japanese yen amounts into U.S. dollar amounts and, in our opinion, such translation has been made inconformity with the basis stated in Note 1. Such U.S. dollar amounts are presented solely for the convenience of readers outside Japan.
June 28, 2007
INDEPENDENT AUDITORS’ REPORT
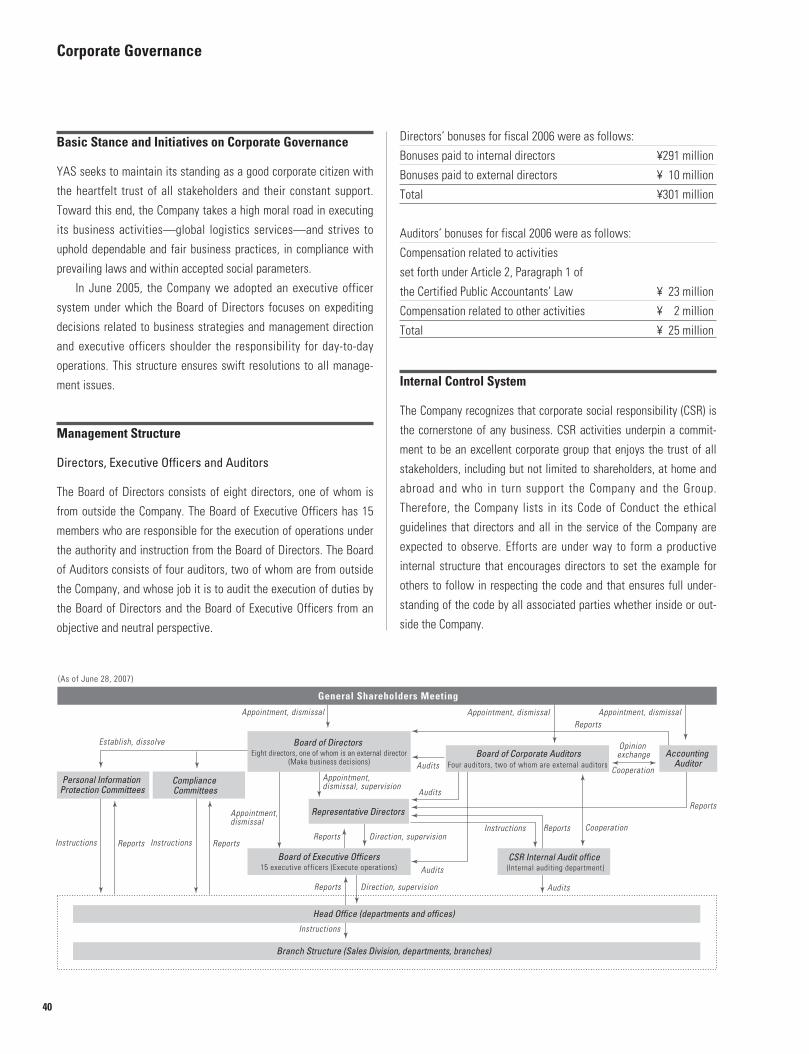
40
Basic Stance and Initiatives on Corporate Governance
YAS seeks to maintain its standing as a good corporate citizen with
the heartfelt trust of all stakeholders and their constant support.
Toward this end, the Company takes a high moral road in executing
its business activities—global logistics services—and strives to
uphold dependable and fair business practices, in compliance with
prevailing laws and within accepted social parameters.
In June 2005, the Company we adopted an executive officer
system under which the Board of Directors focuses on expediting
decisions related to business strategies and management direction
and executive officers shoulder the responsibility for day-to-day
operations. This structure ensures swift resolutions to all manage-
ment issues.
Management Structure
Directors, Executive Officers and Auditors
The Board of Directors consists of eight directors, one of whom is
from outside the Company. The Board of Executive Officers has 15
members who are responsible for the execution of operations under
the authority and instruction from the Board of Directors. The Board
of Auditors consists of four auditors, two of whom are from outside
the Company, and whose job it is to audit the execution of duties by
the Board of Directors and the Board of Executive Officers from an
objective and neutral perspective.
Directors’ bonuses for fiscal 2006 were as follows:
Bonuses paid to internal directors ¥291 million
Bonuses paid to external directors ¥ 10 million
Total ¥301 million
Auditors’ bonuses for fiscal 2006 were as follows:
Compensation related to activities
set forth under Article 2, Paragraph 1 of
the Certified Public Accountants’ Law ¥ 23 million
Compensation related to other activities ¥ 2 million
Total ¥ 25 million
Internal Control System
The Company recognizes that corporate social responsibility (CSR) is
the cornerstone of any business. CSR activities underpin a commit-
ment to be an excellent corporate group that enjoys the trust of all
stakeholders, including but not limited to shareholders, at home and
abroad and who in turn support the Company and the Group.
Therefore, the Company lists in its Code of Conduct the ethical
guidelines that directors and all in the service of the Company are
expected to observe. Efforts are under way to form a productive
internal structure that encourages directors to set the example for
others to follow in respecting the code and that ensures full under-
standing of the code by all associated parties whether inside or out-
side the Company.
Corporate Governance
General Shareholders Meeting
Eight directors, one of whom is an external director(Make business decisions) Four auditors, two of whom are external auditors
15 executive officers (Execute operations) (Internal auditing department)
Board of Corporate Auditors Accounting Auditor
Board of Directors
Representative Directors
CSR Internal Audit officeBoard of Executive Officers
Personal Information Protection Committees
Compliance Committees
Head Office (departments and offices)
Branch Structure (Sales Division, departments, branches)
Audits
Appointment, dismissal Appointment, dismissal Appointment, dismissal
Establish, dissolve
Reports Direction, supervisionInstructions Reports Instructions Reports
Reports
Audits
Audits
Audits
CooperationReports
Opinion exchange
Cooperation
Reports
Appointment, dismissal, supervision
Appointment, dismissal
Reports Direction, supervision
Instructions
(As of June 28, 2007)
Instructions

41
Internal Audits, Audits by Corporate Auditors, AccountingAudits
The Company established the CSR Internal Audit Office, staffed by
four people, to undertake regular CSR-oriented internal audits of the
Company and the Group.
At the beginning of each fiscal year, the Company’s corporate
auditors hear from the accounting auditor’s representatives regard-
ing their auditing plan for the year, and at the interim and year-end,
the Company’s corporate auditors receive reports describing the
results of audits. Corporate auditors are also present during actual
audits by the accounting auditor and will confirm the methods used
in such audits.
Corporate auditors also hear from the CSR Internal Audit Office
regarding that office’s own auditing plan and receive regular
updates on the results of such audits.
The certified public accountants who execute accounting audits
of the Company are Takashi Nagata and Michiharu Matsuda, both
from Deloitte Touche Tohmatsu. They are assisted in their account-
ing operations by three additional certified public accountants, five
junior accountants and two other assistants.
External Director and External Auditors
The external director is a member of the Steering Committee at
Nippon Yusen Kabushiki Kaisha (NYK). Of the two external auditors,
one is the president of Ichikawa Associates Co, Ltd., and the other is
a corporate auditor for Bellrock Media Japan Inc. and Sedona
Capital, Inc.
YAS and NYK, the Company’s principal shareholder, maintain a
cooperative relationship in all logistics services, but business trans-
actions between the two companies are negligible. No business
transactions take place between YAS and Ichikawa Associates,
Bellrock Media or Sedona Capital, and neither the external director
nor the external auditors have any particular interest in the
Company.
Risk Management
Risk management, as it pertains to the execution of business activi-
ties at YAS, is two-fold. For risks associated with operations, each
department determines an appropriate method to deal with the risks
inherent in respective operations. For major risks with the potential
to impact business or the entire company, a person of responsibility
will be swiftly designated to address the situation.
Seeking to be a better corporate citizen, the YAS Grouppromotes CSR activities designed to meet the expectationsof stakeholders.
The CSR Internal Audit Office, which promotes CSR activ-ities, emphasizes four themes: compliance, risk manage-ment, environmental issues and social contribution.Compliance and risk management are of particular inter-est, and the Company strives to create structures encour-aging participation from the entire company, from top man-agement to each and every employee.
Compliance
In line with its compliance program, YAS is implementing a plan,
do, check, action cycle that moves from education and training
through surveys and inspection to practical application of meas-
ures and back to education.
Risk Management
YAS’ risk management efforts extend beyond existing disaster
recovery action plans to the reappraisal of the various risks that
surround the Group’s activities. Risk management is a vital com-
ponent of internal controls and efforts are made to integrate risk-
hedging measures into day-to-day operations.
The Environment
As a member of the NYK Group, YAS is a party to CO2 Diet Action,
a carbon dioxide reduction declaration initiated by Tokyo Electric
Power Co., Ltd. Toward the establishment of concrete numerical
targets for CO2 reduction, in 2006 the Company began collecting
and analyzing data on such aspects of day-to-day operations as
paper consumption, lighting and heating expenses, and gasoline
costs for company cars and trucks. Seeking to reach established
targets, the Company will focus on minimizing the use of energy
and resources and limiting environmental impact.
Social Contribution
YAS exchanges information with the NYK Group and promotes
awareness of social issues through in-house newsletters that
highlight community events so that each employee gains a wider
perspective on local issues and has the opportunity to participate
in such activities.
Corporate Social Responsibility and Internal Audits
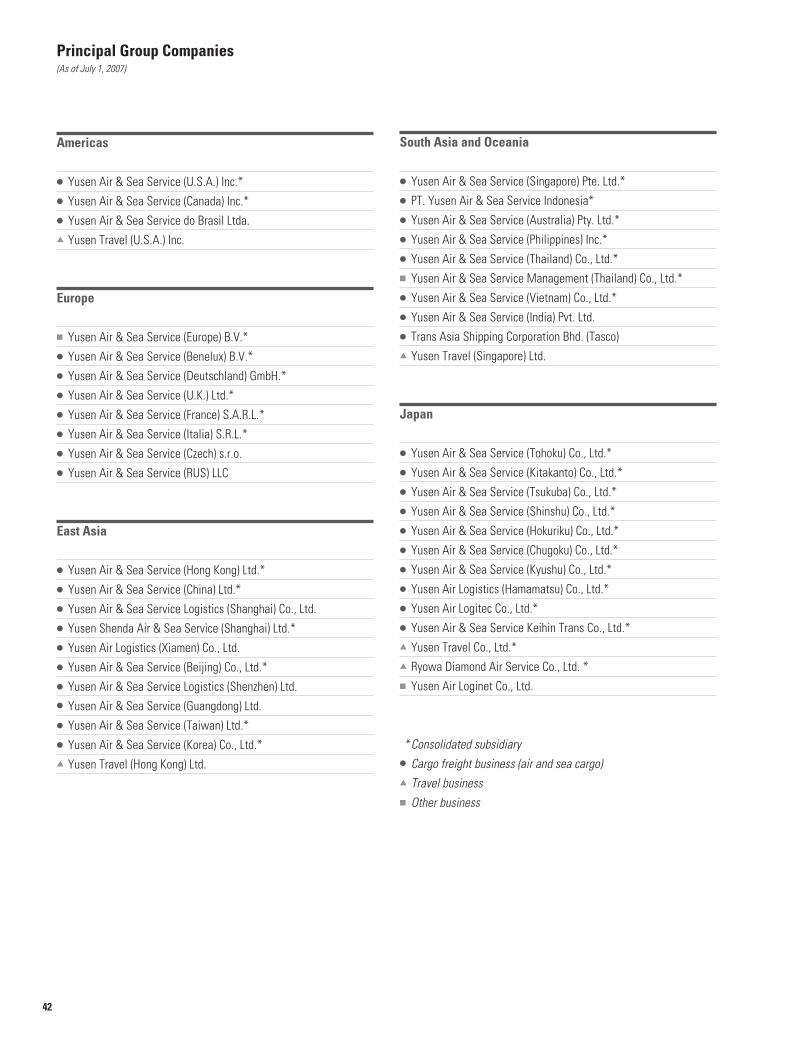
42
Principal Group Companies (As of July 1, 2007)
Americas
● Yusen Air & Sea Service (U.S.A.) Inc.*● Yusen Air & Sea Service (Canada) Inc.*● Yusen Air & Sea Service do Brasil Ltda.▲ Yusen Travel (U.S.A.) Inc.
Europe
■ Yusen Air & Sea Service (Europe) B.V.*● Yusen Air & Sea Service (Benelux) B.V.*● Yusen Air & Sea Service (Deutschland) GmbH.*● Yusen Air & Sea Service (U.K.) Ltd.*● Yusen Air & Sea Service (France) S.A.R.L.*● Yusen Air & Sea Service (Italia) S.R.L.*● Yusen Air & Sea Service (Czech) s.r.o.● Yusen Air & Sea Service (RUS) LLC
East Asia
● Yusen Air & Sea Service (Hong Kong) Ltd.*● Yusen Air & Sea Service (China) Ltd.*● Yusen Air & Sea Service Logistics (Shanghai) Co., Ltd.● Yusen Shenda Air & Sea Service (Shanghai) Ltd.*● Yusen Air Logistics (Xiamen) Co., Ltd.● Yusen Air & Sea Service (Beijing) Co., Ltd.*● Yusen Air & Sea Service Logistics (Shenzhen) Ltd.● Yusen Air & Sea Service (Guangdong) Ltd. ● Yusen Air & Sea Service (Taiwan) Ltd.*● Yusen Air & Sea Service (Korea) Co., Ltd.*▲ Yusen Travel (Hong Kong) Ltd.
South Asia and Oceania
● Yusen Air & Sea Service (Singapore) Pte. Ltd.*● PT. Yusen Air & Sea Service Indonesia* ● Yusen Air & Sea Service (Australia) Pty. Ltd.*● Yusen Air & Sea Service (Philippines) Inc.*● Yusen Air & Sea Service (Thailand) Co., Ltd.*■ Yusen Air & Sea Service Management (Thailand) Co., Ltd.*● Yusen Air & Sea Service (Vietnam) Co., Ltd.*● Yusen Air & Sea Service (India) Pvt. Ltd.● Trans Asia Shipping Corporation Bhd. (Tasco)▲ Yusen Travel (Singapore) Ltd.
Japan
● Yusen Air & Sea Service (Tohoku) Co., Ltd.*● Yusen Air & Sea Service (Kitakanto) Co., Ltd.*● Yusen Air & Sea Service (Tsukuba) Co., Ltd.*● Yusen Air & Sea Service (Shinshu) Co., Ltd.*● Yusen Air & Sea Service (Hokuriku) Co., Ltd.*● Yusen Air & Sea Service (Chugoku) Co., Ltd.*● Yusen Air & Sea Service (Kyushu) Co., Ltd.*● Yusen Air Logistics (Hamamatsu) Co., Ltd.*● Yusen Air Logitec Co., Ltd.*● Yusen Air & Sea Service Keihin Trans Co., Ltd.*▲ Yusen Travel Co., Ltd.*▲ Ryowa Diamond Air Service Co., Ltd. *■ Yusen Air Loginet Co., Ltd.
**Consolidated subsidiary● Cargo freight business (air and sea cargo)▲ Travel business■ Other business
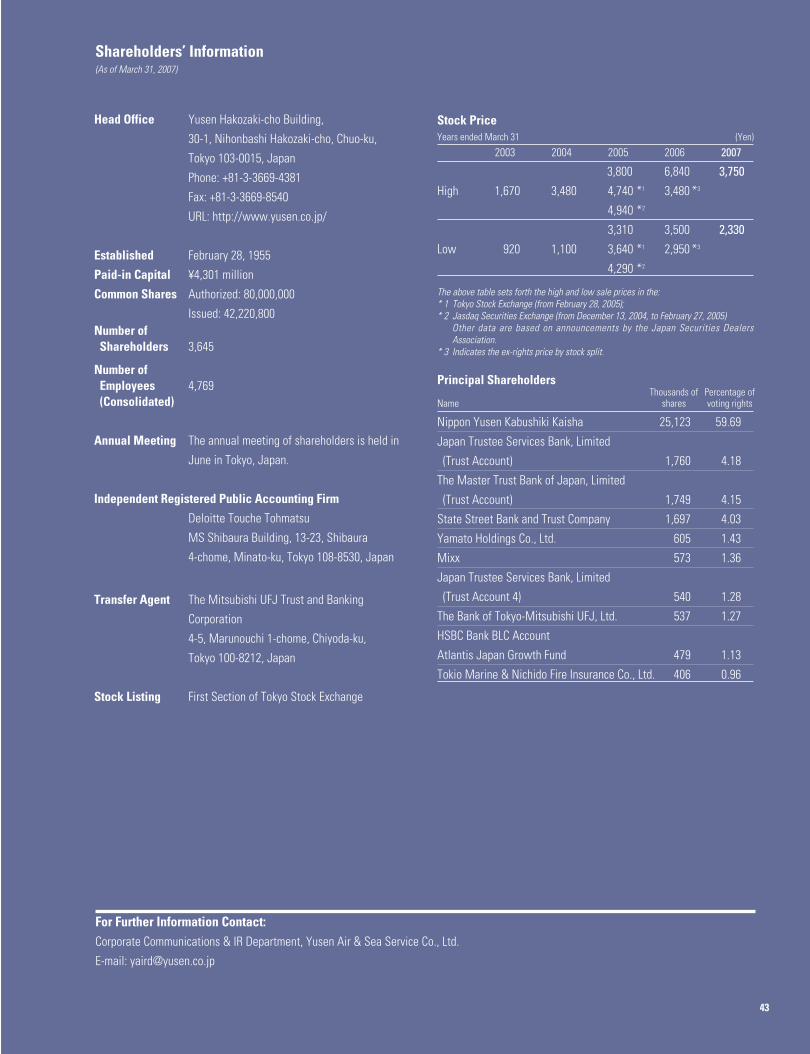
2
●
●
●
●
●
●
●
●
●
●
●
The Americas
South Asia and Oceania
37 offices, with regional headquarters in New York, 69,499 m2, about 520 employees
42 offices, with regional headquarters in Singapore, 48,383 m2, about 1,570 employees
Yusen Air & Sea Service—Growing as a globalprovider of integrated logistics servicesHeadquartered in Tokyo, Japan, Yusen Air & Sea Service Co., Ltd.
(YAS), was established in 1955 as a cargo and travel agency on
behalf of international airlines. (The segment of travel business was
incorporated as a separate company in 1995.)
Today, as one of the world’s leading air freight forwarders, the
Company is reinforcing its presence as a total logistics provider—
with ocean transportation services, warehousing, customs brokerage
and other services to complement the air freight forwarding services—
and plays an integral part in the YAS global network as a member of
the NYK Group.
YAS consolidated net sales for fiscal 2006, the year ended March
31, 2007, reached ¥182 billion ($1,546 million). The Group maintains
231 offices in 33 countries (as of July 1, 2007).
Consolidated Financial Highlights . . 3
YAS Medium-term Strategies . . . . . 4
To Our Stakeholders. . . . . . . . . . . . . 5
Board of Directors, Corporate Auditors, and Executive Officers . . . 14
Financial Section . . . . . . . . . . . . . . . 15
Corporate Governance . . . . . . . . . . . 40
Corporate Social Responsibility and Internal Audits. . . . . . . . . . . . . . 41
Principal Group Companies . . . . . . . 42
Shareholders’ Information . . . . . . . . 43
Our Peop le :
2
Shareholders’ Information(As of March 31, 2007)
43
For Further Information Contact:Corporate Communications & IR Department, Yusen Air & Sea Service Co., Ltd.
E-mail: [email protected]
Head Office Yusen Hakozaki-cho Building,
30-1, Nihonbashi Hakozaki-cho, Chuo-ku,
Tokyo 103-0015, Japan
Phone: +81-3-3669-4381
Fax: +81-3-3669-8540
URL: http://www.yusen.co.jp/
Established February 28, 1955
Paid-in Capital ¥4,301 million
Common Shares Authorized: 80,000,000
Issued: 42,220,800Number of Shareholders 3,645
Number of Employees 4,769(Consolidated)
Annual Meeting The annual meeting of shareholders is held in
June in Tokyo, Japan.
Independent Registered Public Accounting Firm
Deloitte Touche Tohmatsu
MS Shibaura Building, 13-23, Shibaura
4-chome, Minato-ku, Tokyo 108-8530, Japan
Transfer Agent The Mitsubishi UFJ Trust and Banking
Corporation
4-5, Marunouchi 1-chome, Chiyoda-ku,
Tokyo 100-8212, Japan
Stock Listing First Section of Tokyo Stock Exchange
Stock PriceYears ended March 31 (Yen)
2003 2004 2005 2006 2007
3,800 6,840 3,750High 1,670 3,480 4,740 *1 3,480 *3
4,940 *2
3,310 3,500 2,330Low 920 1,100 3,640 *1 2,950 *3
4,290 *2
The above table sets forth the high and low sale prices in the:* 1 Tokyo Stock Exchange (from February 28, 2005);* 2 Jasdaq Securities Exchange (from December 13, 2004, to February 27, 2005)
Other data are based on announcements by the Japan Securities DealersAssociation.
* 3 Indicates the ex-rights price by stock split.
Principal ShareholdersThousands of Percentage of
Name shares voting rights
Nippon Yusen Kabushiki Kaisha 25,123 59.69
Japan Trustee Services Bank, Limited
(Trust Account) 1,760 4.18
The Master Trust Bank of Japan, Limited
(Trust Account) 1,749 4.15
State Street Bank and Trust Company 1,697 4.03
Yamato Holdings Co., Ltd. 605 1.43
Mixx 573 1.36
Japan Trustee Services Bank, Limited
(Trust Account 4) 540 1.28
The Bank of Tokyo-Mitsubishi UFJ, Ltd. 537 1.27
HSBC Bank BLC Account
Atlantis Japan Growth Fund 479 1.13
Tokio Marine & Nichido Fire Insurance Co., Ltd. 406 0.96

Yusen Air & Sea Service Co., Ltd. A n n u a l R e p o r t 2007
Printed in Japan
Yusen Hakozaki-cho Building, 30-1, Nihonbashi Hakozaki-cho, Chuo-ku,
Tokyo 103-0015, Japan Phone: +81-3-3669-4381
Fax: +81-3-3669-8540 URL: http://www.yusen.co.jp/
YUSEN
AIR &
SEA SERVICE CO
., LTD. A
nnual Report 2007
The cornerstone of an impressive worldwide network
Related Documents


