1 1 2 Yttria-Stabilized Zirconia Aided Electrochemical Investigation on 3 Ferric Ions in Mixed Molten Calcium and Sodium Chlorides 4 5 6 7 HONGBO HU, 1,2 YUNMING GAO, 1,2,* YIGUI LAO, 1,2 QINGWEI QIN, 1,2 8 GUANGQIANG LI, 1,2 and GEORGE Z. CHEN 1,2,3 9 10 11 12 1. The State Key Laboratory of Refractories and Metallurgy, Wuhan University of Science and 13 Technology, Wuhan 430081, China. 14 2. Key Laboratory for Ferrous Metallurgy and Resources Utilization of Ministry of Education, 15 Wuhan University of Science and Technology, Wuhan 430081, China. 16 3. Department of Chemical and Environmental Engineering, and Energy Engineering Research 17 Group, Faculty of Science Engineering, University of Nottingham Ningbo China, Ningbo 18 315100, China. 19 20 21 22 *Corresponding Author E-mail: [email protected] 23 24 25 26 27 28 29 30 31 32 33 34 35 36 37

Welcome message from author
This document is posted to help you gain knowledge. Please leave a comment to let me know what you think about it! Share it to your friends and learn new things together.
Transcript
1
1
2
Yttria-Stabilized Zirconia Aided Electrochemical Investigation on 3
Ferric Ions in Mixed Molten Calcium and Sodium Chlorides 4
5
6
7
HONGBO HU,1,2 YUNMING GAO,1,2,* YIGUI LAO,1,2 QINGWEI QIN, 1,2 8
GUANGQIANG LI, 1,2 and GEORGE Z. CHEN1,2,3 9
10
11
12
1. The State Key Laboratory of Refractories and Metallurgy, Wuhan University of Science and 13
Technology, Wuhan 430081, China. 14
2. Key Laboratory for Ferrous Metallurgy and Resources Utilization of Ministry of Education, 15
Wuhan University of Science and Technology, Wuhan 430081, China. 16
3. Department of Chemical and Environmental Engineering, and Energy Engineering Research 17
Group, Faculty of Science Engineering, University of Nottingham Ningbo China, Ningbo 18
315100, China. 19
20
21
22
*Corresponding Author E-mail: [email protected] 23
24
25
26
27
28
29
30
31
32
33
34
35
36
37
2
38
ABSTRACT 39
40
Electrolytic reduction of dissolved iron oxide to metal iron in molten salts with an inert anode 41
is an alternative short route for steelmaking without CO2 emissions. A novel and simple integrated 42
yttria-stabilized zirconia (YSZ) cell was constructed from a YSZ tube with a closed end. The YSZ 43
tube played multiple functions, including the container for the molten salts, the solid electrolyte 44
membrane in the O2- | YSZ | Pt | O2 (air) reference electrode (RE), and the solid electrolyte 45
membrane between the working and counter electrodes (WE and CE). Electrochemical behavior 46
of ferric ions (Fe3+) that were formed by dissolution of 0.5 wt pct Fe2O3 in the molten CaCl2-NaCl 47
eutectic mixture was investigated on a Pt WE at 1273 K by various electrochemical techniques 48
including cyclic voltammetry, linear scan voltammetry, square wave voltammetry, 49
chronopotentiometry, chronoamperometry, and potentiostatic electrolysis. Analysis of the 50
mechanism of electrode reactions was further assisted by scanning electron microscopy, energy 51
dispersive X-ray spectroscopy, and X-ray diffraction. Some electrochemical parameters were 52
obtained, including the number of exchanged electrons and the diffusion coefficient of ferric ions 53
in the mixed molten salts. The results from various electrochemical techniques are in good 54
agreement with each other, and show that the electrochemical reduction of Fe3+ to Fe in the molten 55
salt mixture could be a single three-electron transfer step and diffusion controlled reaction that 56
was also possibly reversible. This work may form the foundation for extraction of iron and alloys 57
from molten salts and also provid a stable O2- | YSZ | Pt | O2 (air) RE with wide applicability for 58
investigation on electrochemical properties of other electroactive metal oxides in molten salts. 59
60
61
KEY WORDS: electrochemical behavior; ferric ions; molten salt; electrodeposition; reference 62
electrode; zirconia-based solid electrolyte 63
64
65
66
67
68
69
70
71
72
73
74
3
I. INTRODUCTION 75
The current industrial approach to iron and steel smelting is a multi-step, long and complex, 76
and energy and emission intensive process. Firstly, the molten iron is produced from carbothermic 77
reduction of iron ore in the blast furnace (ca. 1773 K), and then steel is derived from 78
decarburization of the molten iron in the basic oxygen furnace (ca. 1873 K), followed by refining 79
and alloying. Electrolytic reduction of iron compounds (mainly halides or oxides) in molten salt 80
electrolyte using an inert oxygen-evolving anode is an alternative and short process for 81
ironmaking without CO2 emissions.[1-9] Aiming to drastically reduce CO2 emissions, Europe has 82
set up an ultra-low CO2 steelmaking (ULCOS) program which includes electrolytic reduction in 83
molten salts.[10,11] Molten oxide electrolysis (MOE, ca. 1873 K) was proposed for production of 84
liquid iron in the United States.[12-16] Also, direct electrolytic reduction of solid iron oxide bulk in 85
molten salts, i.e., the Fray-Farthing-Chen (FFC) Cambridge process (ca. 1173 K), has also been 86
extensively investigated in laboratory.[17-21] It is worth noting that molten salt electrolysis proceeds 87
at much lower temperatures and hence should incur less heat loss than the other processes. 88
Since iron can be extracted from molten salts at medium temperatures, and Fe2O3 is a 89
resourceful and low-cost raw material, electrolytic production of iron from Fe2O3 dissolved in 90
molten salts has drawn increasing attention in recent years. Electrochemical behavior of Fe3+ ions 91
in molten salts has been studied by some researchers and some findings have been obtained from 92
these early studies.[6-9] However, it is difficult to draw an unambiguous conclusion from these 93
early studies because different experimental conditions were applied, including molten salt 94
composition, solute concentration, and temperature. In addition, the use of different working 95
electrodes (WEs) and reference electrodes (REs) in the early studies also made it inconvenient to 96
make systematic and comprehensive comparisons. Particularly, the reliability of potential values is 97
still in doubt when measured against those pseudo-REs of metal wires in molten salts.[22,23] 98
Zirconia (ZrO2) doped with magnesia (MgO), yttria (Y2O3), or the like is a kind of solid 99
electrolyte (shorted as MSZ or YSZ, etc.) that is featured by high conductivity to O2- ions, 100
insignificant electronic conductivity, and good resistance to erosion by molten salts at high 101
temperatures. These zirconia-based solid electrolytes are widely used in the metallurgical industry 102
and fundamental research.[24-39] For example, they are used to help the determination of the 103
activity[24,25] and diffusion coefficient [26,27] of oxygen in molten metals, and of the activity of FeO 104
in molten slags,[28,29] to assist the electrolytic refining of molten metals,[30,31] and the extraction of 105
metals from metal oxides dissolved in molten salts and slags.[32-36] Furthermore, in order to 106
conduct electrochemical research on molten media containing O2- ions, MSZ or YSZ can also be 107
used to construct a stable RE, such as the “O2- | MSZ (or YSZ) | Pt | O2 (air)” RE at high 108
temperatures.[37-39] Since the O2 partial pressure is very stable in the air, either stationary or 109
flowing, the O2- | MSZ (or YSZ) | Pt | O2 (air) RE is preferred for its good stability and 110
reproducibility. However, this type of RE is seldom applied to the fundamental electrochemical 111
analysis of molten salts to date.[40-42] 112
4
We recently utilized an MSZ tube to fabricate an integrated electrochemical cell with the O2- | 113
MSZ | Pt | O2 (air) RE similar to the one used by Pal et al.,[38] which is simple and unique in 114
structure and fabrication. With multiple functions such as the container for molten slags, and the 115
electron insulating but ion conducting membrane to separate the anolyte and catholyte, the MSZ 116
tube with a closed end was successfully applied to the electrochemical analyses in molten slags 117
containing FeO or NiO at ultra-high temperatures.[43,44] 118
It is known that the O2- ion conductivity of YSZ is usually higher than that of MSZ at the same 119
temperature. Thus, it was thought that YSZ could offer a sufficiently high O2- ion conductivity at 120
temperatures lower than what is needed for MSZ to achieve the same conductivity. In this work, a 121
YSZ tube with a closed end was used to build an integrated electrochemical cell with the “O2- | 122
YSZ | Pt | O2 (air)” RE for a systematic investigation on the property of Fe3+ ions on a Pt WE in 123
the molten CaCl2-NaCl eutectic mixture [45] containing dissolved 0.5 wt pct Fe2O3 at 1273 K. The 124
experimentally determined operating temperature range in this work was from 1173 K to 1373 K 125
to enable sufficient oxide ion conductivity of the YSZ tube, and also to avoid significant 126
evaporation of the molten salt and attack to the YSZ tube by the molten salt. 127
Various electrochemical techniques were applied, such as cyclic voltammetry/voltammogram 128
(CV), linear scan voltammetry/voltammogram (LSV), square wave voltammetry/voltammogram 129
(SWV), chronopotentiometry/chronopotentiogram (CP), chronoamperometry/chronoamperogram 130
(CA), and potentiostatic electrolysis. Here, the CaCl2-NaCl eutectic mixture was chosen as the 131
medium in terms of source, cost, and wide application. Chen [46] and Haarberg et al. [47] studied the 132
solubility of Fe2O3 in CaCl2-NaCl melt, respectively. It can be reasonably assumed from their 133
work that the solubility of Fe2O3 in the molten CaCl2-NaCl eutectic mixture is above 1.5 wt pct at 134
1273 K and the Fe ions mainly exist in the +3 valence in the present work. 135
This work is part of an ongoing systematic research program aiming at developing a green 136
electrolytic process for iron- and steelmaking without emission of CO2. In the research, a YSZ 137
tube with a closed end was employed as the container of the molten salts, and also as the ion 138
conducting but electron insulating membrane to electronically and physically separate the WE and 139
CE. The YSZ tube was attached with a Pt CE and an “O2- | YSZ | Pt | O2 (air)” RE (in fact an 140
“O2-|O2” RE) on the external wall, forming a simple integrated electrochemical cell. In the work of 141
Pal et al.,[32-34] the solid oxide membrane (SOM) was a tube with a closed end which was 142
immersed in the molten salt and acted only as the ion conducting to electronically and physically 143
separate the anode and cathode. Specifically, their SOM was not used to incorporate the RE. 144
Consequently, the SOM cell of Pal et al. was mainly used for electrolysis for metal extraction, 145
while the integrated cell is designed to enable various electrochemical analyses in high- 146
temperature melts. 147
The goal of the current investigation is to demonstrate the use of the novel integrated cell as a 148
simple and convenient tool for studying the electrochemical behavior of iron oxide dissolved in 149
molten salts, while we hope that the findings reported in the work will benefit similar studies of 150
5
other high-temperature electrolytes and the future design of the industrial cell capable of 151
continuous operation, and the selection, monitor, and control of the process variables for optimal 152
production. 153
154
II. EXPERIMENTAL 155
A. Preparation of Salt Specimen 156
All chemical reagents used in this work were granules or powders of the analytical grade. In 157
order to avoid proportioning deviation caused by moisture absorption, a dehydration test was first 158
conducted at a chamber-type resistance furnace, in which the as-received powders of CaCl2 and 159
NaCl were heated to and held at 773 K for 5 hours and the moisture contents were estimated to be 160
3.4 and 1.05 wt pct, respectively, according to weight loss of the heated salts. When weighing a 161
salt mixture with 65 wt pct CaCl2 and 35 wt pct NaCl,[45] the moisture content was subtracted from 162
the raw reagents. The Fe2O3 reagent was heated at 473 K for 2 hours in a vacuum-drying-oven 163
with absolute pressure below 133 Pa. The dried Fe2O3 was added to the salt mixture of 164
CaCl2-NaCl to reach the composition of 0.5 wt pct Fe2O3. The mixed salts and oxide powders 165
were subjected to ball milling in a sealed polyurethane jar with agate balls on a horizontal roller 166
for 3 hours at 25 RPM to ensure uniform mixing. After milling and separation from the agate balls 167
on a clean 8-mesh SS screener, the CaCl2-NaCl-Fe2O3 mixture was ready for use, or stored in a 168
desiccator for future purposes. 169
170
B. Construction of Electrochemical Cell 171
The integrated electrochemical cell was made from a YSZ (Y2O3, 8 mol pct) tube with one 172
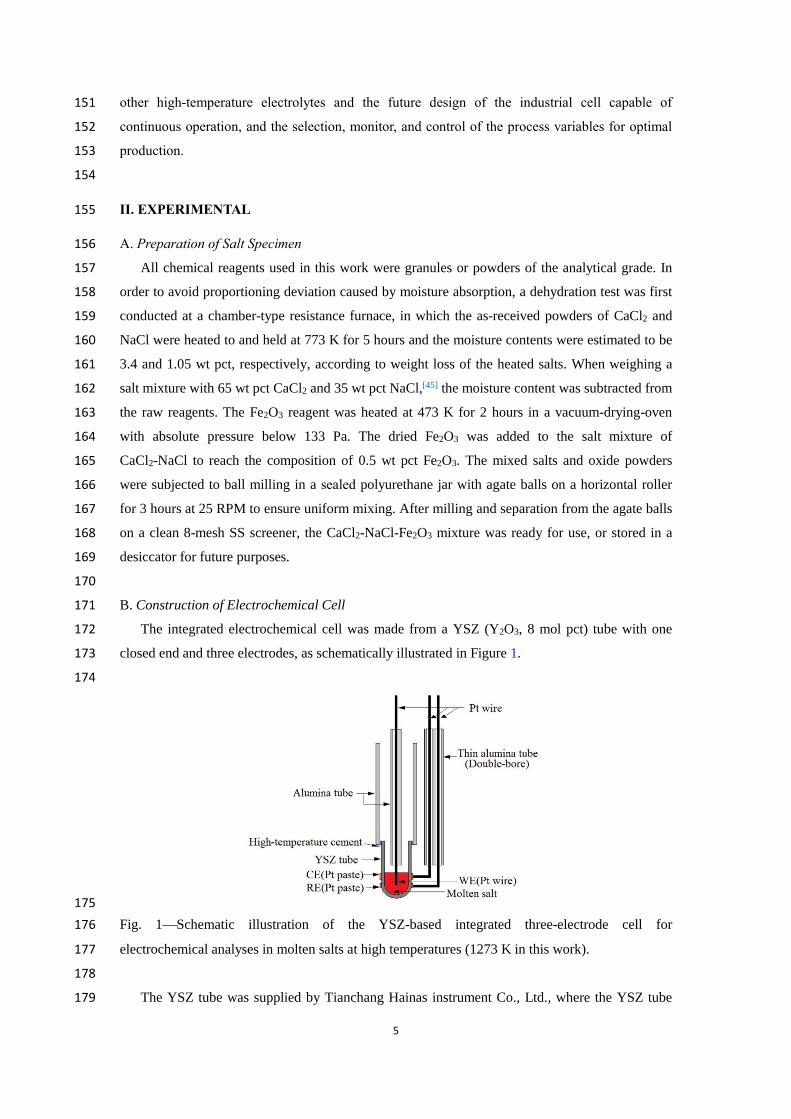
closed end and three electrodes, as schematically illustrated in Figure 1. 173
174
175
Fig. 1Schematic illustration of the YSZ-based integrated three-electrode cell for 176
electrochemical analyses in molten salts at high temperatures (1273 K in this work). 177
178
The YSZ tube was supplied by Tianchang Hainas instrument Co., Ltd., where the YSZ tube 179
6
was prepared by isostatic pressing finely synthetic YSZ powder and sintering, and where the 180
synthetic YSZ powder was also purchased from outside. The size of YSZ tube used was 6.7 and 181
9.6 mm in inner and outer diameter, respectively, and 100 mm in length. The Pt paste (supplied by 182
Sino-Platinum Metals Co., Ltd, China) was uniformly painted on two adjacent circular parts of the 183
outer surface of the YSZ tube near the closed end. The Pt paste-painted YSZ tube was then dried 184
in the air, followed by sintering in air for 30 minutes in the chamber-type resistance furnace at 185
1173 K. Thus, two circular electrodes with good adhesion to the YSZ tube could be obtained. The 186
circular Pt electrode near the bottom was the RE (area: 0.91 cm2), and the other was the CE (area: 187
1.52 cm2). A long Pt wire (purity: 99.95 pct; diameter: 0.5 mm) lead was fastened to the YSZ tube 188
with a thin Pt wire (diameter: 0.3 mm) at each of the two circular Pt electrodes. The Pt wire leads 189
for the RE and CE and a Pt wire WE (diameter: 0.5 mm) were each protected in a thin alumina 190
tube. 191
192
C. Experimental Methods 193
Experimental data were measured and recorded on an electrochemical workstation (model: 194
IviumStat.h, Holland). The integrated electrochemical cell loaded with 1.25 g mixed salt was 195
placed in the thermostatic zone of a SiC high-temperature tube furnace (alumina furnace tube 196
inner diameter: 40 mm). High-purity argon (99.999 pct) was introduced through the silica-gel 197
desiccant for drying at flow rates of 300 and 10 mL min-1 into the furnace tube from the bottom, 198
and into the YSZ tube from the top, respectively. A Pt-Rh (10 wt pct) | Pt thermocouple (Type S) 199
was employed to detect the experimental temperature. The furnace heating was programmed to 200
rise at a rate of 9 K min-1. During heating, the heating program was held at 673 K and 873 K for 1 201
hour, respectively, to remove the moisture in the salt mixture, and also at 1273 K for 2 hours to 202
allow complete melting of the CaCl2-NaCl-Fe2O3 mixture. Then, the Pt wire WE was inserted into 203
the melt, and the liquid level of the melt was determined by monitoring the open-circuit potential 204
(OCP) which became stable once the Pt wire touched the surface of the melt. The depth of the Pt 205
wire was controlled in the melt to 7 mm (contact area: 0.11 cm2). The Ar gas in the furnace tube 206
was subsequently switched to the high-purity synthetic air (containing 20.8 pct O2 and 79.2 pct 207
N2) at the rate of 300 mL min-1. This was to maintain a stable O2 partial pressure outside the YSZ 208
tube that is needed for the “O2- | YSZ | Pt | O2 (air)” RE to work. 209
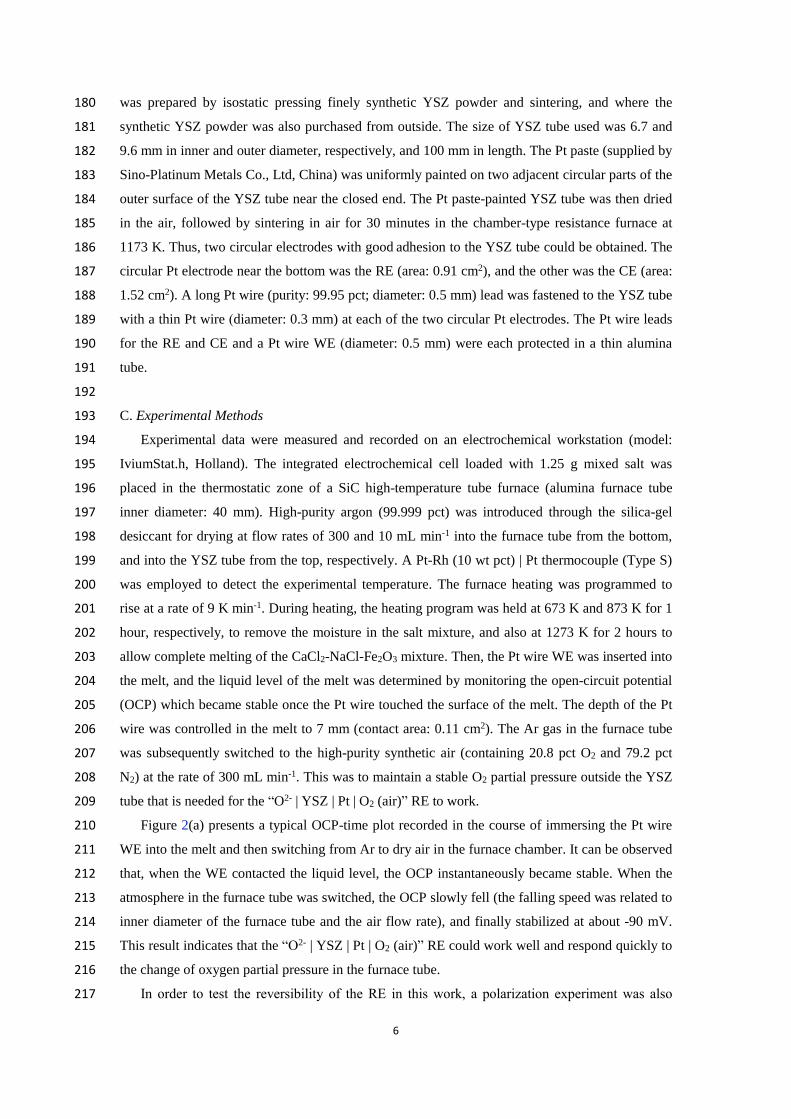
Figure 2(a) presents a typical OCP-time plot recorded in the course of immersing the Pt wire 210
WE into the melt and then switching from Ar to dry air in the furnace chamber. It can be observed 211
that, when the WE contacted the liquid level, the OCP instantaneously became stable. When the 212
atmosphere in the furnace tube was switched, the OCP slowly fell (the falling speed was related to 213
inner diameter of the furnace tube and the air flow rate), and finally stabilized at about -90 mV. 214
This result indicates that the “O2- | YSZ | Pt | O2 (air)” RE could work well and respond quickly to 215
the change of oxygen partial pressure in the furnace tube. 216
In order to test the reversibility of the RE in this work, a polarization experiment was also 217
7
carried out. The cell was discharged by short-circuiting, and then charged by an external current 218
for 1 second, respectively. The WE potential responded quickly as shown in Figure 2(b). However, 219
when the short-circuiting or the external current was removed, the WE potential returned to the 220
initial OCP value within 3 seconds, as shown in Figure 2(b). The polarization result indicates that 221
the “O2- | YSZ | Pt | O2 (air)” RE had a good reversibility. 222
After the OCP-time curve became stable, the total resistance of the melt and the YSZ 223
membrane between the WE and RE was first measured by the alternating current (AC) impedance 224
method (range and number of frequencies: 105~10 Hz and 121, amplitude: 0.025 V, the OCP was 225
taken as the applied bias potential). Figure 2(c) is a typical AC impedance Nyquist plot, showing a 226
resistance of 1.64 ohm at the high frequency end, which was taken as the resistance value for the 227
positive feedback compensation in all relevant electrochemical analyses. 228
229
230
231
Fig. 2A typical OCP-time plot recorded in the course of immersing the Pt wire WE into the 232
molten mixture containing 0.5 wt pct Fe2O3 and then switching from Ar to air in the furnace tube 233
(a); a typical WE potential-time curve recorded in the polarization experiment (b), and a typical 234
AC impedance Nyquist plot recorded at the OCP (bias potential) (c). RE: O2- | YSZ | Pt | O2 (air). 235
236
In the experiment, the OCP-time curve was always measured to determine if the cell had 237
reached at a relatively stable state (usually, the OCP could fluctuate within 10 mV). Also, if 238
necessary, the AC impedance measurement was repeated. It was found that the resistance from 239
repeated measurements was fairly stable in the range of 1.640.08 ohm. Following these analyses, 240
8
a CV was usually recorded first, and repeated when needed, to confirm if the cell was in a stable 241
state. Other electrochemical measurements were then conducted sequentially. No visually 242
noticeable change for the YSZ tube used was observed after experiments. All potentials in this 243
work were reported with reference to the “ O2- | YSZ | Pt | O2 (air)” RE. 244
In order to examine the structural features and the morphology of the reduction products, two 245
potentiostatic electrolysis experiments were carried out, in which a Pt wire and a Pt foil (30 mm 246
2 mm 0.1 mm) were employed as the WE, respectively. Each electrolysis experiment was 247
carried out for 30 minutes at the reduction potential of about -0.7 V based on the CV. When using 248
the Pt foil WE, the amount of the melt in the YSZ tube increased to 2.00 g, the area of CE on the 249
outer surface of the YSZ increased to 4.56 cm2, and the depth of the Pt foil in the melt was 250
controlled to be 15 mm. Other conditions were the same as the experiments for electrochemical 251
analyses as mentioned above. 252
After potentiostatic electrolysis, the Pt WE was separated from the solidified melt, and 253
repeatedly washed, under sonication, in distilled water and absolute ethyl alcohol in succession to 254
remove residual salts attached to the surface of the WE. A short piece was cut from the portion of 255
the Pt wire WE immersed in the melt. It was then mounted in epoxy resine to enable examination 256
of the cross section of the electrode by scanning electron microscopy (SEM) (Nova 400 Nano) 257
equipped with energy dispersive spectrometry (EDS) (INCAIE 350 Penta FET X-3). For the Pt 258
foil WE, the surface phase was analyzed by X-ray diffraction (XRD, Cu K, Philips Xpert Pro 259
MPD). Due to the requirement of XRD analyses for sample size, the Pt foil was cut and re-joined 260
to increase the width from 2 to 4 mm and decrease the length from 15 mm (original depth in the 261
melt) to about 8 mm. 262
263
III. RESULTS AND DISCUSSION 264
A. Cyclic Voltammetry 265
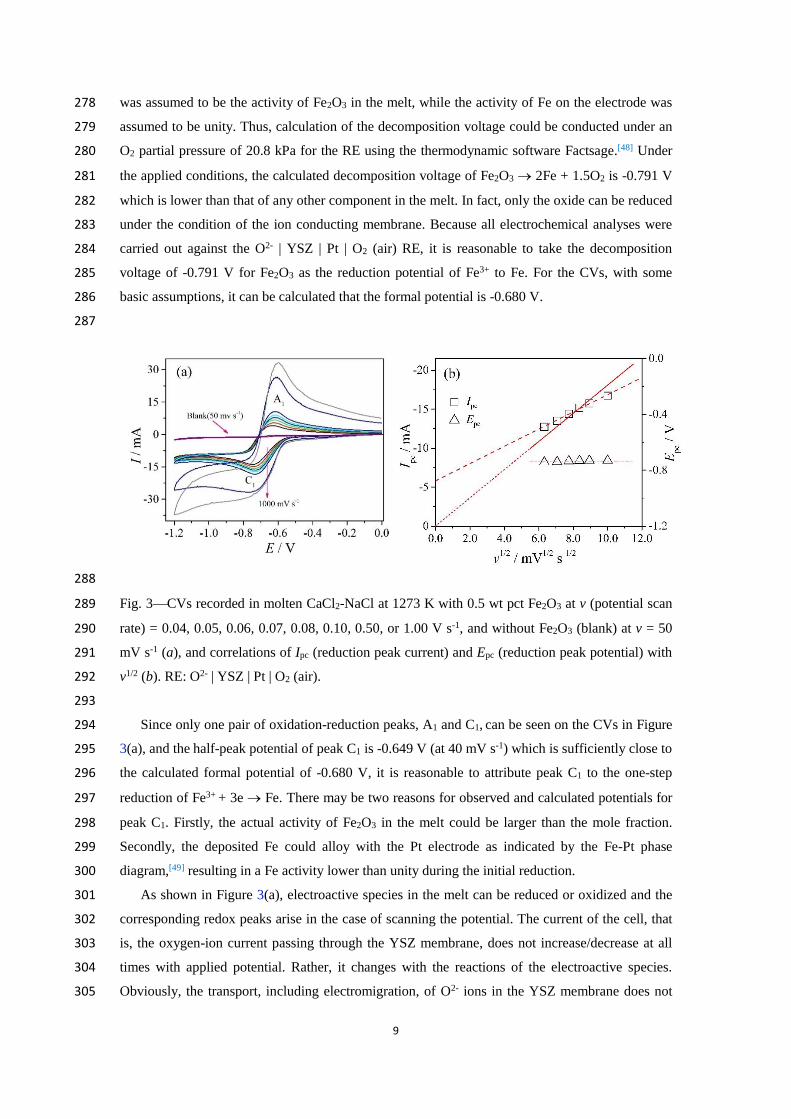
Figure 3(a) presents the CVs recorded in the molten CaCl2-NaCl eutectic mixture with 0.5 wt 266
pct Fe2O3 recorded at an increasing potential scan rate, v, and that recorded without Fe2O3 (i.e., the 267
blank melt) at 50 mV s-1 and 1273 K. It is observed on the CV that, within the potential range 268
scanned, the current of the blank melt is basically zero, indicating negligible redox active 269
impurities and good electrochemical stability of both the blank melt and the WE in this potential 270
range. In presence of Fe2O3, the current on the CV smoothly increases at first with negative 271
potential scan, and then rapidly increases to form a reduction peak C1. After reversing the scan, an 272
oxidation peak A1 appears. 273
Because C1 and A1 are both absent on the CV in the blank melt, they must have been related 274
with dissolved Fe2O3 and may be attributed to the reduction of the Fe3+ ion and the re-oxidation of 275
the reduction product, e.g. Fe. The concentration of Fe2O3 in the molten CaCl2-NaCl mixture was 276
0.5 wt pct which is equivalent to a mole fraction of 2.510-3. For approximation, this mole fraction 277
9
was assumed to be the activity of Fe2O3 in the melt, while the activity of Fe on the electrode was 278
assumed to be unity. Thus, calculation of the decomposition voltage could be conducted under an 279
O2 partial pressure of 20.8 kPa for the RE using the thermodynamic software Factsage.[48] Under 280
the applied conditions, the calculated decomposition voltage of Fe2O3 2Fe + 1.5O2 is -0.791 V 281
which is lower than that of any other component in the melt. In fact, only the oxide can be reduced 282
under the condition of the ion conducting membrane. Because all electrochemical analyses were 283
carried out against the O2- | YSZ | Pt | O2 (air) RE, it is reasonable to take the decomposition 284
voltage of -0.791 V for Fe2O3 as the reduction potential of Fe3+ to Fe. For the CVs, with some 285
basic assumptions, it can be calculated that the formal potential is -0.680 V. 286
287
288
Fig. 3CVs recorded in molten CaCl2-NaCl at 1273 K with 0.5 wt pct Fe2O3 at v (potential scan 289
rate) = 0.04, 0.05, 0.06, 0.07, 0.08, 0.10, 0.50, or 1.00 V s-1, and without Fe2O3 (blank) at v = 50 290
mV s-1 (a), and correlations of Ipc (reduction peak current) and Epc (reduction peak potential) with 291
v1/2 (b). RE: O2- | YSZ | Pt | O2 (air). 292
293
Since only one pair of oxidation-reduction peaks, A1 and C1, can be seen on the CVs in Figure 294
3(a), and the half-peak potential of peak C1 is -0.649 V (at 40 mV s-1) which is sufficiently close to 295
the calculated formal potential of -0.680 V, it is reasonable to attribute peak C1 to the one-step 296
reduction of Fe3+ + 3e Fe. There may be two reasons for observed and calculated potentials for 297
peak C1. Firstly, the actual activity of Fe2O3 in the melt could be larger than the mole fraction. 298
Secondly, the deposited Fe could alloy with the Pt electrode as indicated by the Fe-Pt phase 299
diagram,[49] resulting in a Fe activity lower than unity during the initial reduction. 300
As shown in Figure 3(a), electroactive species in the melt can be reduced or oxidized and the 301
corresponding redox peaks arise in the case of scanning the potential. The current of the cell, that 302
is, the oxygen-ion current passing through the YSZ membrane, does not increase/decrease at all 303
times with applied potential. Rather, it changes with the reactions of the electroactive species. 304
Obviously, the transport, including electromigration, of O2- ions in the YSZ membrane does not 305
10
affect the behavior of electroactive species on the Pt WE in the three-electrode cell at a 306
sufficiently high temperature. However, in a future industrial two-electrode cell, the transports of 307
oxygen ions through the YSZ membrane may be highly likely an important factor affecting the 308
rate of the overall process. It is worth noting that the shapes of peaks C1 and A1 on the CVs 309
indicate that the reduction products could be soluble,[50] and the physical state of the reduction 310
products will be analyzed later by means of correlation detection. 311
In order to evaluate the reversibility of electrode process, the CV tests were performed at 312
different scan rates. Figure 3(a) shows that with the potential scan rate increasing from 0.04 to 0.1 313
V s-1. The ratio of the oxidation and reduction peak currents (base current subtracted), Ipa/Ipc, is 314
close to unity, the reduction peak potential, Epc, remains constant ( -0.735 V) with increasing v, 315
while plotting Ipc vs v1/2 produces a straight line whether or not the origin is passed, as shown in 316
Figure 3(b). These three observations indicate that the reduction of Fe3+ to Fe is diffusion 317
controlled and reversible.[6,50,51] However, when v increases from 0.1 to 0.5 ~ 1.0 V s-1, Epc shifts 318
negatively, and Ipc deviates noticeably from the Ipc – v1/2 fitting straight line (the data from high 319
scan rates are not included in Figure 3(b), and Ipa/Ipc increases beyond 1. These CVs which result 320
from the reduction reaction of Fe3+ to Fe on the Pt electrode show the reversible shape at low scan 321
rates but the CV shape become less reversible or irreversible with increasing the scan rate.[52] A 322
supplementary discussion on the reversibility of the reduction process is added in Section III−E. 323
To sum up, the reduction of Fe3+ to Fe on the Pt WE as represented by the CVs recorded at 324
relatively low potential scan rates is a one-step and diffusion-controlled reversible process. This 325
finding is consistent with the reported CVs of Fe3+ in molten CaCl2-NaCl with molybdenum and 326
silver wires as the WE and RE, respectively, although the Ipa/Ipc ratio on the reported CVs was not 327
unity.[6] It is acknowledged that it is yet uncertain whether the reduction-produced Fe was 328
dissolved in the melt or alloyed with the Pt WE. It is also necessary to check if there was any 329
reduction product and its physical state on the Pt WE before the CVs could be evaluated properly. 330
Hence, three measures were taken as described below. 331
Firstly, reversal CP was applied to investigate the redox couple of Fe3+/Fe in the melt and the 332
findings are shown in Figure 4(a). It can be seen that upon application of the constant negative 333
current, the potential fell initially and soon arrived at a plateau. The plateau potential, ca. -0.8 V, is 334
consistent with the potential of the Fe3+ reduction peak shown in Figure 3(a). 335
The shape of the reversal CP can be explained as follows. With the Fe3+ concentration 336
decreasing in the melt, the diffusion of Fe3+ to the electrode surface becomes slower than the 337
depletion of Fe3+ on the electrode surface. When the Fe3+ concentration on the electrode surface 338
falls to zero, the electrode potential changes quickly to more negative value where the next 339
reduction reaction occurs. Then, when an equal reverse current I is applied, the potential also 340
reverses quickly till another plateau where the previous reduction products are re-oxidized to Fe3+. 341
The difference between the applied currents is very small, and the amount of reduction products is 342
also very small. Also, the reduction-produced Fe dissolves into the Pt electrode to form a solid 343
11
solution (for details, see the follow – up). Thus, there is little difference in the activity of Fe on the 344
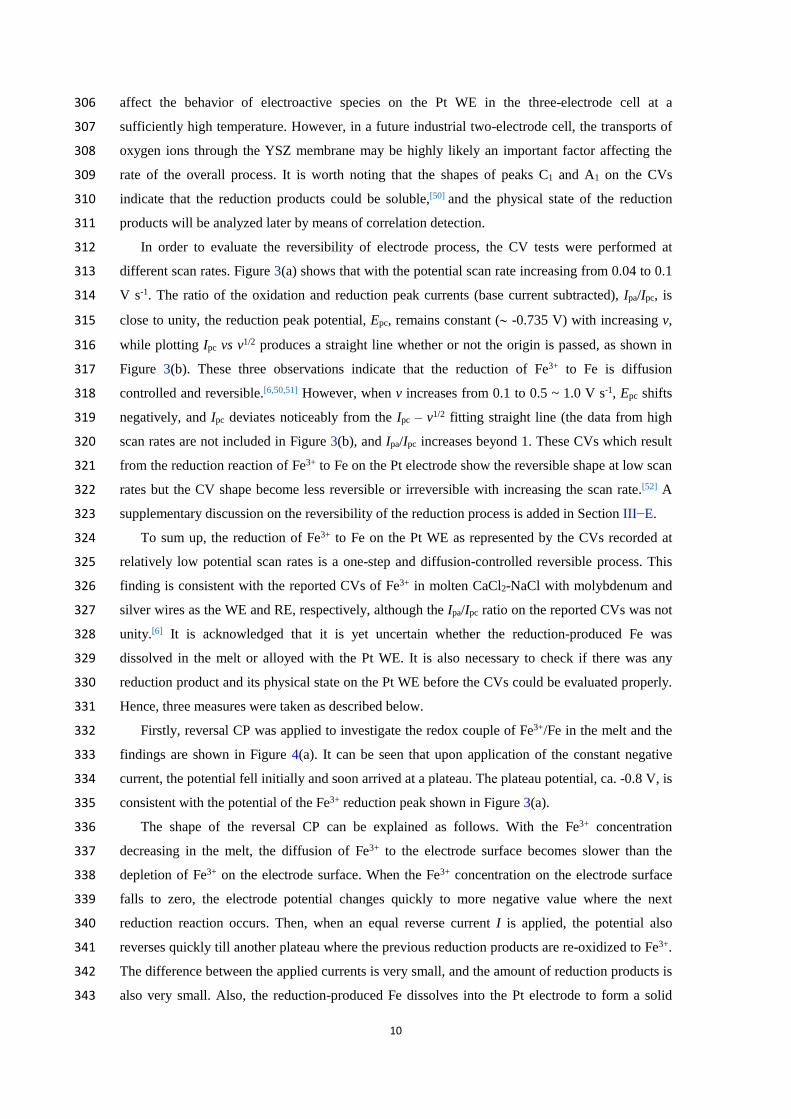
surface of the solid solution, leading to very comparable overpotentials of the re-oxidation, as 345
shown in Figure 4(a). The tilt of the re-oxidation plateau indicates that the activity of iron in the 346
alloy decreases continuously during oxidation, which could be due to the fact that the Fe diffused 347
into the Pt electrode was not oxidizable on the time scale of the CV. Upon completion of the 348
re-oxidation of the reduction produced Fe on the electrode surface, the potential quickly changes 349
to more positive values of about +0.2 V. It is supposed to be the oxidation of oxygen ions to 350
oxygen molecule at potentials of about +0.2 V, where some fluctuations can be observed in Figure 351
4(a), indicating the gas involved in the electrode reaction. This is related to the oxidation of the 352
oxygen ion: O2- →1/2O2 + 2e. It should be noted that oxidation of oxygen ions in the melt was not 353
further investigated in the positive potential range because the present work dealt mainly with the 354
reduction of iron ions in the negative potential range. 355
356
357
358
Fig. 4Reversal CPs on the Pt WE in molten CaCl2-NaCl with 0.5 wt pct Fe2O3 at 1273 K and 359
different currents (10, 11, 12, 13 and 14 mA) (a) and the correlation of the I1/2 (: 360
transition time) value against the cathodic current I for the reduction plateau (b). RE: O2-| YSZ | Pt 361
| O2 (air). 362
363
The transition time for reduction or oxidation (red or ox) is basically the duration of the 364
potential plateau in Figure 4(a). The data listed in Table I were measured using methods in 365
accordance with the literature.[53-55] It can be seen from Table I that, at 1273 K, increasing the 366
applied current led to a quicker depletion of electroactive ions on the electrode surface, resulting 367
in decreased values of red and ox. Table I also shows that the red/ox ratio also decreased from 6 368
to 2.9, suggesting that increasing the applied current has a greater impact on the decrease of red 369
than that of ox. According to the literature,[55] at red/ox = 1, the reduction products should be 370
insoluble; when red/ox = 3, soluble reduction products, usually in the liquid electrolyte, would be 371
expected. In this work, however, red/ox = 6 ~ 2.9 (red/ox = 7 was reported in the literature [55]) 372
which makes it uncertain if the reduction products were insoluble (e.g. Fe) or soluble (e.g. Fe2+). 373
12
Secondly, some experiments were carried out. In these experiments, upon confirmation of the 374
electrochemical cell having reached the equilibrium or steady state as indicated by the OCP, 375
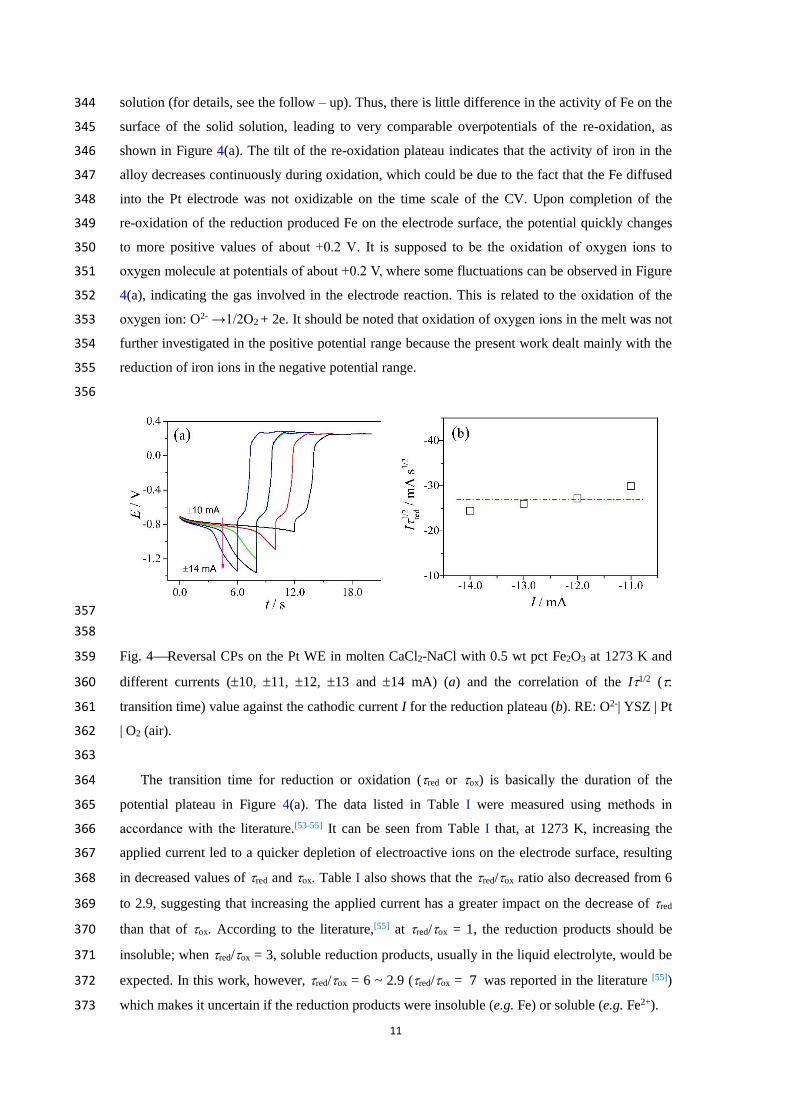
potentiostatic electrolysis was performed at -0.76 V for a predetermined time of 30 seconds. Then, 376
the OCP was monitored for 60 seconds (halting time), while the Pt WE was in two working modes: 377
the usual static mode and the manually rotating mode with 2 circles. Then, anodic LSV was 378
performed from -0.9 to 0 V at v = 50 mV s-1. The same procedure was repeated for another two 379
predetermined times (60 and 90 seconds) of electrolysis at -0.76 V. Thus, the experiments 380
produced six LSVs, as shown in Figure 5. In inset of Figure 5, typical curves of the potentiostatic 381
electrolysis using the Pt wire WE for 30, 60, and 90 seconds are presented. In order to eliminate 382
the influence of the residual products from the reduction, before the next test, the potentiostatic 383
electrolysis was performed at 0.05 V for 90 seconds to oxidize all the materials deposited on the 384
electrode surface in the previous test, where preliminary experiments indicated that the electrode 385
was not oxidized and no new oxidation peak occurred. In addition, the preliminary experiments 386
also indicated that the halting time from 15 to 360 seconds had no detectable effect on the LSVs 387
recorded in the static mode. 388
389
390
Fig. 5LSVs recorded at 50 mV s-1 on the Pt wire WE under the static and rotating modes after 391
the potentiostatic electrolysis for 30, 60, 90 seconds in molten CaCl2-NaCl with 0.5 wt pct Fe2O3. 392
Inset: a set of typical current-time curves of potentiostatic electrolysis using the Pt wire WE for 30, 393
60, 90 seconds. Potentiostatic electrolysis potential: -0.76 V; time: 30, 60, 90 s; temperature: 1273 394
K; RE: O2-| YSZ | Pt | O2 (air). 395
396
It is expected from these experiments that if the reduction products were soluble, they would 397
not accumulate on the electrode surface and, consequently, no significant change on the anodic 398
LSV would happen in the static mode even if the time of the potentiostatic reduction was doubled. 399
Otherwise, if insoluble products were formed, doubling the time of the potentiostatic reduction 400
should lead to likely a double increase of the re-oxidation current. If the Pt WE was rotated 401
manually when measuring the OCP for 60 seconds (halting time), for reduction products soluble in 402

13
the melt, the diffusion flux of the products from the electrode surface into the melt would decrease 403
in the following anodic LSV. However, if the reduction product could remain on the Pt WE due to 404
alloying with Pt, the diffusion flux of the products from the surface into interior of the Pt WE 405
would not markedly change. The current on the following LSV should correspond to the change of 406
the diffusion flux. Consequently, following the potentiostatic reduction and the 60-second OCP 407
measurement with the rotating Pt WE, changes of the oxidation peak on the anodic LSV can be 408
used to judge if the reduction products dissolved in the melt. 409
As can be observed in Figure 5, the anodic LSVs are highly consistent with each other under 410
various conditions. Under the static mode, doubling the time of potentiostatic electrolysis did not 411
lead to a higher current of the oxidation peak on the LSVs, suggesting that the reduction products 412
could be soluble. However, it cannot be determined whether the reduction products dissolved in 413
the melt or alloyed with the Pt electrode. Further, Figure 5 shows that the oxidation peak currents 414
on the LSVs are also the same with or without rotating the Pt WE, indicating the reduction 415
products having alloyed with Pt. 416
Thirdly, the Pt WE was characterized by SEM, EDS, and XRD after the potentiostatic 417
electrolysis to identify the reduction products. Figure 6 shows the SEM image of the cross section 418
of the Pt wire WE, the corresponding EDS, and the line scanning analyses of Pt, Fe, and O. As 419
shown in Figure 6(b), the EDS analysis confirmed the presence of Fe on the Pt wire WE surface. 420
Figure 6(d) presents the line scanning profile for Fe, confirming a maximum Fe content at the 421
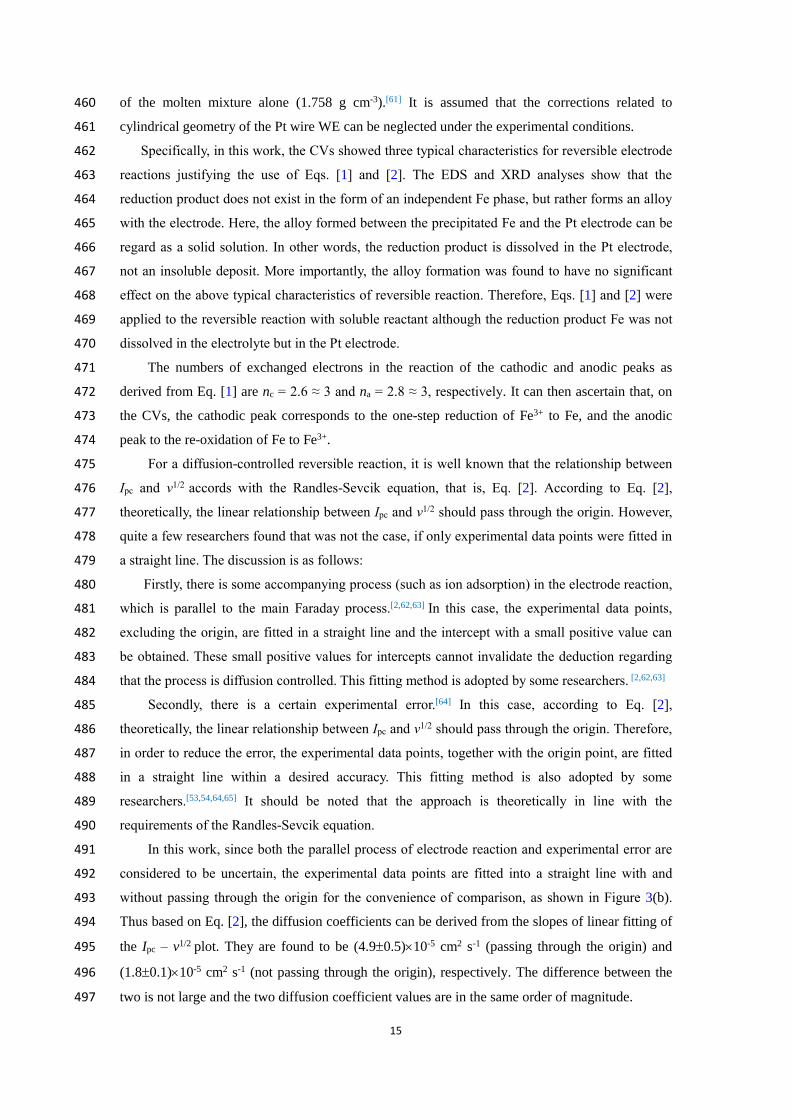
position of 0.5 m from the Pt WE surface. Figure 7 shows the XRD pattern for the Pt foil WE 422
after potentiostatic electrolysis. From Figure 7, the existence of the FePt3 phase is not certain, but 423
the independent pure Fe phase can be excluded. Therefore, based on the EDS analyses, it is 424
believed that reduction-produced Fe could have reacted with the Pt electrode to form an alloy or 425
intermetallic compound, e.g., FePt3 whose XRD pattern overlaps with that of Pt. 426
427
428
429
430
431
14
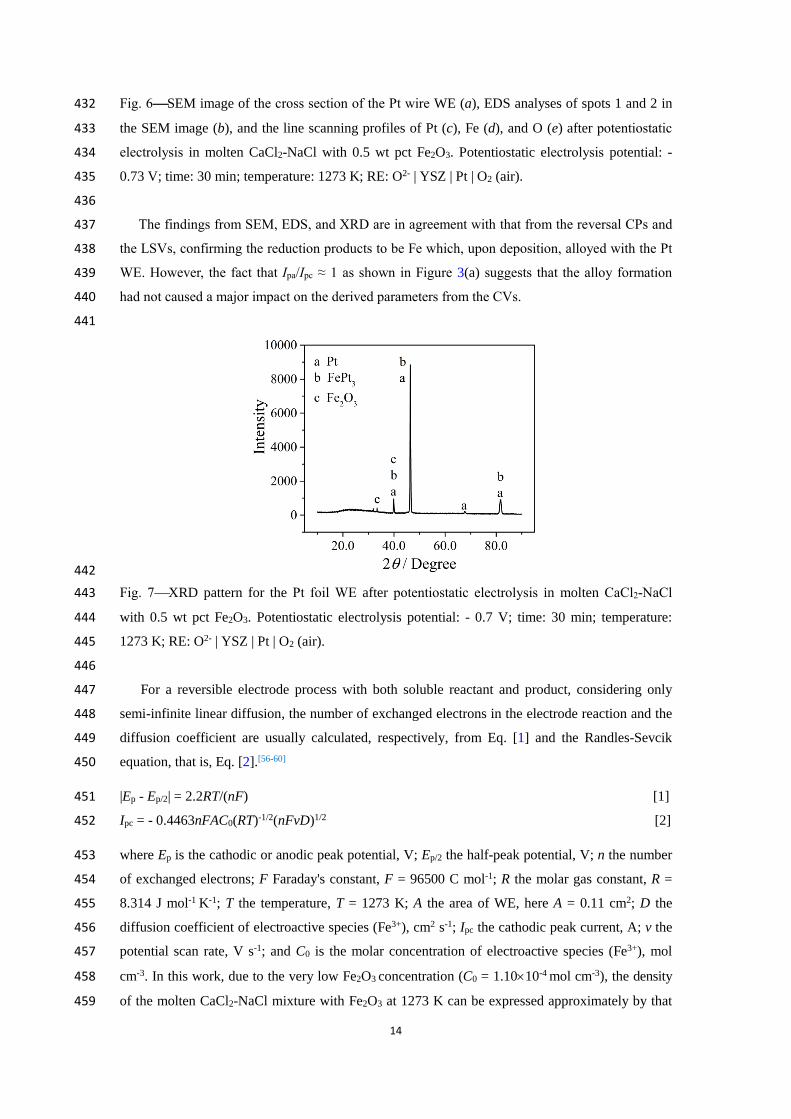
Fig. 6SEM image of the cross section of the Pt wire WE (a), EDS analyses of spots 1 and 2 in 432
the SEM image (b), and the line scanning profiles of Pt (c), Fe (d), and O (e) after potentiostatic 433
electrolysis in molten CaCl2-NaCl with 0.5 wt pct Fe2O3. Potentiostatic electrolysis potential: - 434
0.73 V; time: 30 min; temperature: 1273 K; RE: O2- | YSZ | Pt | O2 (air). 435
436
The findings from SEM, EDS, and XRD are in agreement with that from the reversal CPs and 437
the LSVs, confirming the reduction products to be Fe which, upon deposition, alloyed with the Pt 438
WE. However, the fact that Ipa/Ipc ≈ 1 as shown in Figure 3(a) suggests that the alloy formation 439
had not caused a major impact on the derived parameters from the CVs. 440
441
442
Fig. 7XRD pattern for the Pt foil WE after potentiostatic electrolysis in molten CaCl2-NaCl 443
with 0.5 wt pct Fe2O3. Potentiostatic electrolysis potential: - 0.7 V; time: 30 min; temperature: 444
1273 K; RE: O2- | YSZ | Pt | O2 (air). 445
446
For a reversible electrode process with both soluble reactant and product, considering only 447
semi-infinite linear diffusion, the number of exchanged electrons in the electrode reaction and the 448
diffusion coefficient are usually calculated, respectively, from Eq. [1] and the Randles-Sevcik 449
equation, that is, Eq. [2].[56-60] 450
|Ep - Ep/2| = 2.2RT/(nF) [1] 451
Ipc = - 0.4463nFAC0(RT)-1/2(nFvD)1/2 [2] 452
where Ep is the cathodic or anodic peak potential, V; Ep/2 the half-peak potential, V; n the number 453
of exchanged electrons; F Faraday's constant, F = 96500 C mol-1; R the molar gas constant, R = 454
8.314 J mol-1 K-1; T the temperature, T = 1273 K; A the area of WE, here A = 0.11 cm2; D the 455
diffusion coefficient of electroactive species (Fe3+), cm2 s-1; Ipc the cathodic peak current, A; v the 456
potential scan rate, V s-1; and C0 is the molar concentration of electroactive species (Fe3+), mol 457
cm-3. In this work, due to the very low Fe2O3 concentration (C0 = 1.1010-4 mol cm-3), the density 458
of the molten CaCl2-NaCl mixture with Fe2O3 at 1273 K can be expressed approximately by that 459
15
of the molten mixture alone (1.758 g cm-3).[61] It is assumed that the corrections related to 460
cylindrical geometry of the Pt wire WE can be neglected under the experimental conditions. 461
Specifically, in this work, the CVs showed three typical characteristics for reversible electrode 462
reactions justifying the use of Eqs. [1] and [2]. The EDS and XRD analyses show that the 463
reduction product does not exist in the form of an independent Fe phase, but rather forms an alloy 464
with the electrode. Here, the alloy formed between the precipitated Fe and the Pt electrode can be 465
regard as a solid solution. In other words, the reduction product is dissolved in the Pt electrode, 466
not an insoluble deposit. More importantly, the alloy formation was found to have no significant 467
effect on the above typical characteristics of reversible reaction. Therefore, Eqs. [1] and [2] were 468
applied to the reversible reaction with soluble reactant although the reduction product Fe was not 469
dissolved in the electrolyte but in the Pt electrode. 470
The numbers of exchanged electrons in the reaction of the cathodic and anodic peaks as 471
derived from Eq. [1] are nc = 2.6 ≈ 3 and na = 2.8 ≈ 3, respectively. It can then ascertain that, on 472
the CVs, the cathodic peak corresponds to the one-step reduction of Fe3+ to Fe, and the anodic 473
peak to the re-oxidation of Fe to Fe3+. 474
For a diffusion-controlled reversible reaction, it is well known that the relationship between 475
Ipc and v1/2 accords with the Randles-Sevcik equation, that is, Eq. [2]. According to Eq. [2], 476
theoretically, the linear relationship between Ipc and v1/2 should pass through the origin. However, 477
quite a few researchers found that was not the case, if only experimental data points were fitted in 478
a straight line. The discussion is as follows: 479
Firstly, there is some accompanying process (such as ion adsorption) in the electrode reaction, 480
which is parallel to the main Faraday process.[2,62,63] In this case, the experimental data points, 481
excluding the origin, are fitted in a straight line and the intercept with a small positive value can 482
be obtained. These small positive values for intercepts cannot invalidate the deduction regarding 483
that the process is diffusion controlled. This fitting method is adopted by some researchers. [2,62,63] 484
Secondly, there is a certain experimental error.[64] In this case, according to Eq. [2], 485
theoretically, the linear relationship between Ipc and v1/2 should pass through the origin. Therefore, 486
in order to reduce the error, the experimental data points, together with the origin point, are fitted 487
in a straight line within a desired accuracy. This fitting method is also adopted by some 488
researchers.[53,54,64,65] It should be noted that the approach is theoretically in line with the 489
requirements of the Randles-Sevcik equation. 490
In this work, since both the parallel process of electrode reaction and experimental error are 491
considered to be uncertain, the experimental data points are fitted into a straight line with and 492
without passing through the origin for the convenience of comparison, as shown in Figure 3(b). 493
Thus based on Eq. [2], the diffusion coefficients can be derived from the slopes of linear fitting of 494
the Ipc – v1/2 plot. They are found to be (4.90.5)10-5 cm2 s-1 (passing through the origin) and 495
(1.80.1)10-5 cm2 s-1 (not passing through the origin), respectively. The difference between the 496
two is not large and the two diffusion coefficient values are in the same order of magnitude. 497
16
498
B. Square Wave Voltammetry 499
Due to its high sensitivity, SWV is effective in suppressing the influence of the capacitive 500
background current as often observed on CV, particularly at relatively high scan rates. In this 501
experiment, in order to confirm the reversibility of electrode process and evaluate electrochemical 502
parameters such as the number of transferred electrons and diffusion coefficient, the SWV tests 503
were performed at different scan frequencies. The SWVs of the melt containing 0.5 wt pct Fe2O3 504
(including the blank melt) at 1273 K were measured at 1 mV in step potential and 30 mV in 505
amplitude, and different scan frequencies, as shown in Figure 8(a). 506
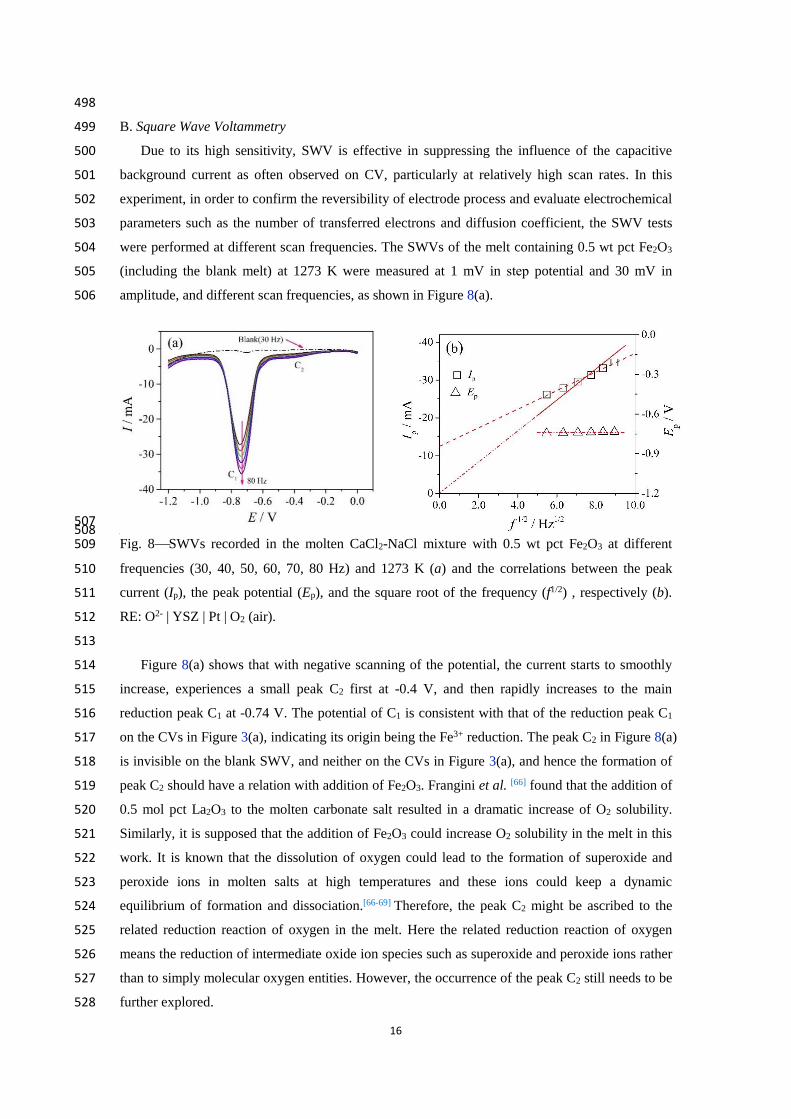
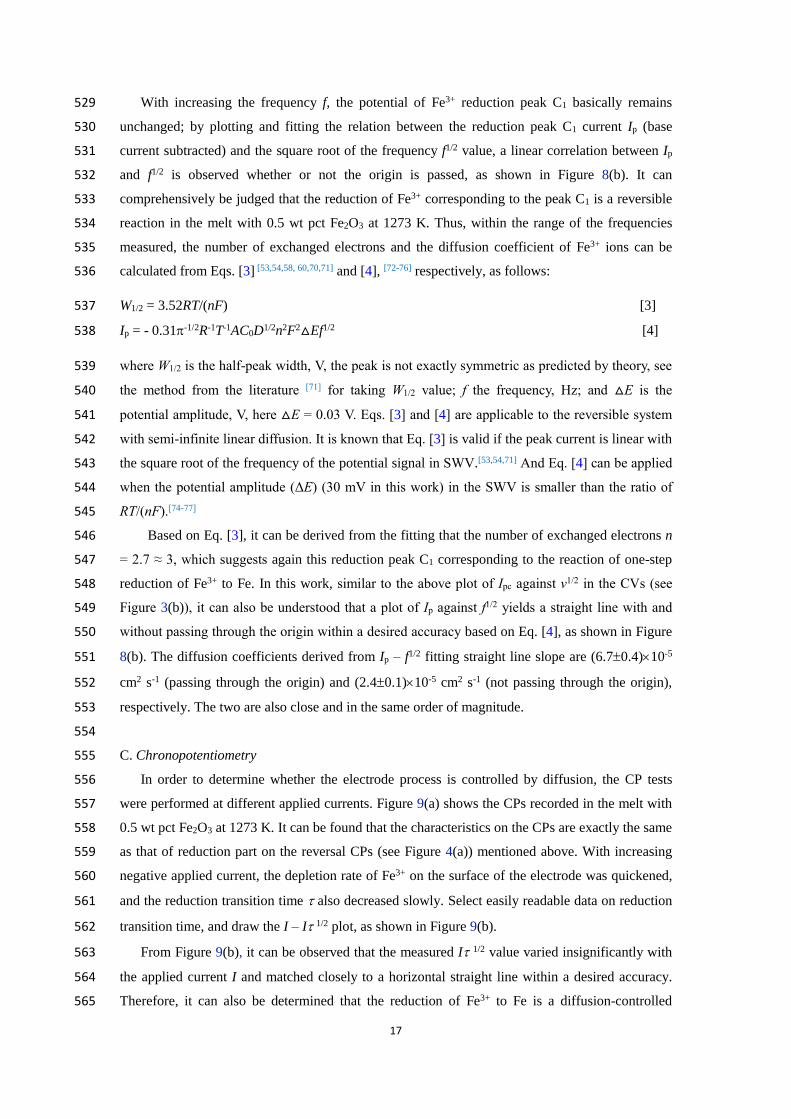
507 508 Fig. 8SWVs recorded in the molten CaCl2-NaCl mixture with 0.5 wt pct Fe2O3 at different 509
frequencies (30, 40, 50, 60, 70, 80 Hz) and 1273 K (a) and the correlations between the peak 510
current (Ip), the peak potential (Ep), and the square root of the frequency (f1/2) , respectively (b). 511
RE: O2- | YSZ | Pt | O2 (air). 512
513
Figure 8(a) shows that with negative scanning of the potential, the current starts to smoothly 514
increase, experiences a small peak C2 first at -0.4 V, and then rapidly increases to the main 515
reduction peak C1 at -0.74 V. The potential of C1 is consistent with that of the reduction peak C1 516
on the CVs in Figure 3(a), indicating its origin being the Fe3+ reduction. The peak C2 in Figure 8(a) 517
is invisible on the blank SWV, and neither on the CVs in Figure 3(a), and hence the formation of 518
peak C2 should have a relation with addition of Fe2O3. Frangini et al. [66] found that the addition of 519
0.5 mol pct La2O3 to the molten carbonate salt resulted in a dramatic increase of O2 solubility. 520
Similarly, it is supposed that the addition of Fe2O3 could increase O2 solubility in the melt in this 521
work. It is known that the dissolution of oxygen could lead to the formation of superoxide and 522
peroxide ions in molten salts at high temperatures and these ions could keep a dynamic 523
equilibrium of formation and dissociation.[66-69] Therefore, the peak C2 might be ascribed to the 524
related reduction reaction of oxygen in the melt. Here the related reduction reaction of oxygen 525
means the reduction of intermediate oxide ion species such as superoxide and peroxide ions rather 526
than to simply molecular oxygen entities. However, the occurrence of the peak C2 still needs to be 527
further explored. 528
17
With increasing the frequency f, the potential of Fe3+ reduction peak C1 basically remains 529
unchanged; by plotting and fitting the relation between the reduction peak C1 current Ip (base 530
current subtracted) and the square root of the frequency f1/2 value, a linear correlation between Ip 531
and f1/2 is observed whether or not the origin is passed, as shown in Figure 8(b). It can 532
comprehensively be judged that the reduction of Fe3+ corresponding to the peak C1 is a reversible 533
reaction in the melt with 0.5 wt pct Fe2O3 at 1273 K. Thus, within the range of the frequencies 534
measured, the number of exchanged electrons and the diffusion coefficient of Fe3+ ions can be 535
calculated from Eqs. [3] [53,54,58, 60,70,71] and [4], [72-76] respectively, as follows: 536
W1/2 = 3.52RT/(nF) [3] 537
Ip = - 0.31-1/2R-1T-1AC0D1/2n2F2△Ef1/2 [4] 538
where W1/2 is the half-peak width, V, the peak is not exactly symmetric as predicted by theory, see 539
the method from the literature [71] for taking W1/2 value; f the frequency, Hz; and △E is the 540
potential amplitude, V, here △E = 0.03 V. Eqs. [3] and [4] are applicable to the reversible system 541
with semi-infinite linear diffusion. It is known that Eq. [3] is valid if the peak current is linear with 542
the square root of the frequency of the potential signal in SWV.[53,54,71] And Eq. [4] can be applied 543
when the potential amplitude (ΔE) (30 mV in this work) in the SWV is smaller than the ratio of 544
RT/(nF).[74-77] 545
Based on Eq. [3], it can be derived from the fitting that the number of exchanged electrons n 546
= 2.7 ≈ 3, which suggests again this reduction peak C1 corresponding to the reaction of one-step 547
reduction of Fe3+ to Fe. In this work, similar to the above plot of Ipc against v1/2 in the CVs (see 548
Figure 3(b)), it can also be understood that a plot of Ip against f1/2 yields a straight line with and 549
without passing through the origin within a desired accuracy based on Eq. [4], as shown in Figure 550
8(b). The diffusion coefficients derived from Ip – f1/2 fitting straight line slope are (6.70.4)10-5 551
cm2 s-1 (passing through the origin) and (2.40.1)10-5 cm2 s-1 (not passing through the origin), 552
respectively. The two are also close and in the same order of magnitude. 553
554
C. Chronopotentiometry 555
In order to determine whether the electrode process is controlled by diffusion, the CP tests 556
were performed at different applied currents. Figure 9(a) shows the CPs recorded in the melt with 557
0.5 wt pct Fe2O3 at 1273 K. It can be found that the characteristics on the CPs are exactly the same 558
as that of reduction part on the reversal CPs (see Figure 4(a)) mentioned above. With increasing 559
negative applied current, the depletion rate of Fe3+ on the surface of the electrode was quickened, 560
and the reduction transition time also decreased slowly. Select easily readable data on reduction 561
transition time, and draw the I – I 1/2 plot, as shown in Figure 9(b). 562
From Figure 9(b), it can be observed that the measured I 1/2 value varied insignificantly with 563
the applied current I and matched closely to a horizontal straight line within a desired accuracy. 564
Therefore, it can also be determined that the reduction of Fe3+ to Fe is a diffusion-controlled 565
18
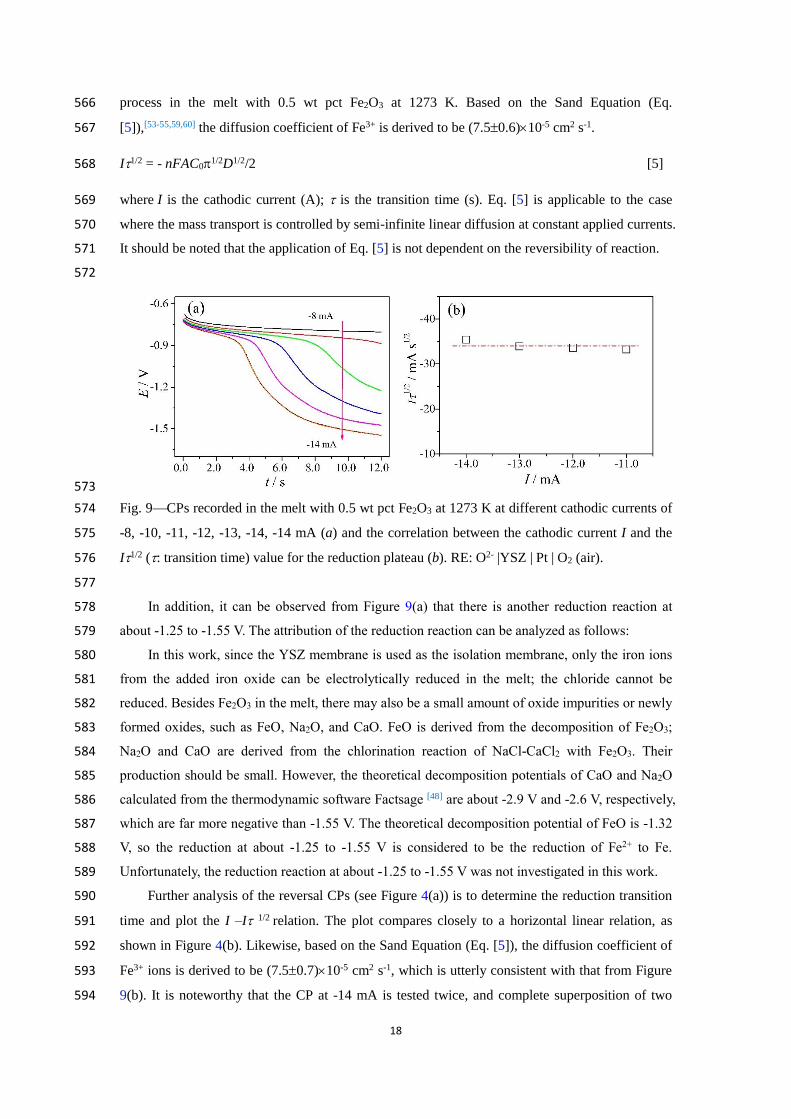
process in the melt with 0.5 wt pct Fe2O3 at 1273 K. Based on the Sand Equation (Eq. 566
[5]),[53-55,59,60] the diffusion coefficient of Fe3+ is derived to be (7.50.6)10-5 cm2 s-1. 567
I1/2 = - nFAC01/2D1/2/2 [5] 568
where I is the cathodic current (A); is the transition time (s). Eq. [5] is applicable to the case 569
where the mass transport is controlled by semi-infinite linear diffusion at constant applied currents. 570
It should be noted that the application of Eq. [5] is not dependent on the reversibility of reaction. 571
572
573
Fig. 9CPs recorded in the melt with 0.5 wt pct Fe2O3 at 1273 K at different cathodic currents of 574
-8, -10, -11, -12, -13, -14, -14 mA (a) and the correlation between the cathodic current I and the 575
I1/2 (: transition time) value for the reduction plateau (b). RE: O2- |YSZ | Pt | O2 (air). 576
577
In addition, it can be observed from Figure 9(a) that there is another reduction reaction at 578
about -1.25 to -1.55 V. The attribution of the reduction reaction can be analyzed as follows: 579
In this work, since the YSZ membrane is used as the isolation membrane, only the iron ions 580
from the added iron oxide can be electrolytically reduced in the melt; the chloride cannot be 581
reduced. Besides Fe2O3 in the melt, there may also be a small amount of oxide impurities or newly 582
formed oxides, such as FeO, Na2O, and CaO. FeO is derived from the decomposition of Fe2O3; 583
Na2O and CaO are derived from the chlorination reaction of NaCl-CaCl2 with Fe2O3. Their 584
production should be small. However, the theoretical decomposition potentials of CaO and Na2O 585
calculated from the thermodynamic software Factsage [48] are about -2.9 V and -2.6 V, respectively, 586
which are far more negative than -1.55 V. The theoretical decomposition potential of FeO is -1.32 587
V, so the reduction at about -1.25 to -1.55 V is considered to be the reduction of Fe2+ to Fe. 588
Unfortunately, the reduction reaction at about -1.25 to -1.55 V was not investigated in this work. 589
Further analysis of the reversal CPs (see Figure 4(a)) is to determine the reduction transition 590
time and plot the I –I 1/2 relation. The plot compares closely to a horizontal linear relation, as 591
shown in Figure 4(b). Likewise, based on the Sand Equation (Eq. [5]), the diffusion coefficient of 592
Fe3+ ions is derived to be (7.50.7)10-5 cm2 s-1, which is utterly consistent with that from Figure 593
9(b). It is noteworthy that the CP at -14 mA is tested twice, and complete superposition of two 594
19
corresponding curves is observed, as shown in Figure 9(a). Almost exactly the same values of the 595
diffusion coefficient obtained from the CPs (Figure 9(b)) and the reversal CPs (Figure 4(b)) as 596
well as the results of repeated test of the CP at -14 mA shown in Figure 9(a) suggest that the 597
experimental cell system is stable in nature, with excellent reproducibility and reliable result of 598
electrochemical test. 599
600
D. Chronoamperometry 601
In order to observe nucleation behavior and confirm whether the electrode process is 602
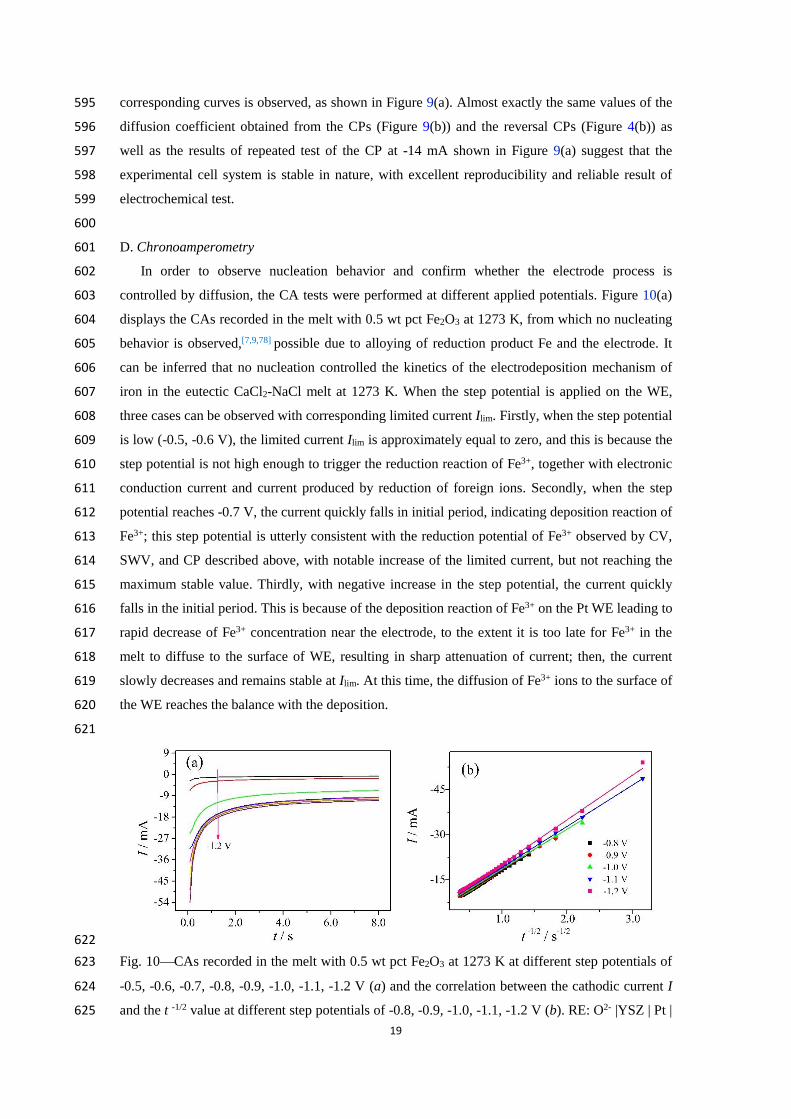
controlled by diffusion, the CA tests were performed at different applied potentials. Figure 10(a) 603
displays the CAs recorded in the melt with 0.5 wt pct Fe2O3 at 1273 K, from which no nucleating 604
behavior is observed,[7,9,78] possible due to alloying of reduction product Fe and the electrode. It 605
can be inferred that no nucleation controlled the kinetics of the electrodeposition mechanism of 606
iron in the eutectic CaCl2-NaCl melt at 1273 K. When the step potential is applied on the WE, 607
three cases can be observed with corresponding limited current Ilim. Firstly, when the step potential 608
is low (-0.5, -0.6 V), the limited current Ilim is approximately equal to zero, and this is because the 609
step potential is not high enough to trigger the reduction reaction of Fe3+, together with electronic 610
conduction current and current produced by reduction of foreign ions. Secondly, when the step 611
potential reaches -0.7 V, the current quickly falls in initial period, indicating deposition reaction of 612
Fe3+; this step potential is utterly consistent with the reduction potential of Fe3+ observed by CV, 613
SWV, and CP described above, with notable increase of the limited current, but not reaching the 614
maximum stable value. Thirdly, with negative increase in the step potential, the current quickly 615
falls in the initial period. This is because of the deposition reaction of Fe3+ on the Pt WE leading to 616
rapid decrease of Fe3+ concentration near the electrode, to the extent it is too late for Fe3+ in the 617
melt to diffuse to the surface of WE, resulting in sharp attenuation of current; then, the current 618
slowly decreases and remains stable at Ilim. At this time, the diffusion of Fe3+ ions to the surface of 619
the WE reaches the balance with the deposition. 620
621
622
Fig. 10CAs recorded in the melt with 0.5 wt pct Fe2O3 at 1273 K at different step potentials of 623
-0.5, -0.6, -0.7, -0.8, -0.9, -1.0, -1.1, -1.2 V (a) and the correlation between the cathodic current I 624
and the t -1/2 value at different step potentials of -0.8, -0.9, -1.0, -1.1, -1.2 V (b). RE: O2- |YSZ | Pt | 625
20
O2 (air). 626
627
It can be inferred that the reduction reaction at the applied potentials from -1.0 to -1.2 V in 628
Figure 10(a) is not the same as that at the second plateau potentials from -1.25 to -1.55 V in Figure 629
9(a). The explanation is as follows: 630
Firstly, from Figure 10(a), the negative shift in potential from -0.8 to -1.2 V does not affect 631
the value of the current. Thus, the stable currents at these potentials (where the diffusion reached 632
the limit rate) have little difference, but are larger than that at -0.7 V (where the diffusion did not 633
reach the limit rate). The reduction reaction taking place at potentials from -0.7 to -1.2 V should be 634
the same. Under the experimental conditions, it is obviously unreasonable that the reaction at -0.7 635
V was considered as the reduction of Fe3+ to Fe and that at the adjacent potentials from -0.8 to -1.2 636
V as another reduction reaction. 637
Secondly, in Figure 9(a), when the applied current is in the range of -11 to -14 mA, the 638
second potential plateau on the CPs appears in the range from -1.25 to -1.55 V in addition to the 639
first potential plateau at about -0.8 V. It can be seen that the potential plateau resulted from an 640
applied current is not the only one in the CPs. That is, the reactions at different potential plateaus 641
cannot be determined directly by only the applied current in the CPs. Similarly, the reactions 642
cannot be determined directly by only the stable currents in the CAs and should be judged in 643
conjunction with the applied potential. It is noted that the second plateau potential in the CPs is 644
more negative than the applied potentials from -0.8 to -1.2 V in the CAs. Therefore, the reaction at 645
applied potentials from -0.8 to -1.2 V in the CAs should be different from that at the plateau 646
potentials from -1.25 to -1.55 V corresponding to the applied currents from -11 to -14 mA in the 647
CPs. Moreover, in this work, there is no IR compensation in the CAs, so that the corresponding 648
reaction at the applied potentials from -0.8 to -1.2 V actually takes place at a less negative 649
potential, which approaches the reaction potential revealed by the CVs, the SWVs, and the CPs, 650
and widens the gap from the second plateau potential. 651
For the part of data involving Fe3+ reduction and the limited current reaching maximum 652
stable value (i.e., above-mentioned case 3) in Figure 10(a), draw corresponding I – t-1/2 curve, as 653
shown in Figure 10(b). It is seen that within the range of 0.5~8 seconds, I – t-1/2 is in good linear 654
relation, suggesting the reduction of Fe3+ to Fe is a diffusion controlled process within the range. 655
The diffusion controlled current conforms to the Cottrell Equation (Eq. [6]): [1,79] 656
I = - nFAC0D1/2-1/2t-1/2 [6] 657
where t is the electrolysis time, seconds. Eq. [6] is analogous to Eq. [5]. It is applicable to the case 658
where the mass transport is controlled by semi-infinite linear diffusion at a constant applied 659
potential. 660
Based on Eq. [6] and fitting I – t-1/2 straight line part in Figure 10(b), the diffusion coefficients 661
at variable step potentials are calculated from the slopes of fitting the straight line. Final diffusion 662
21
coefficient value is obtained as (4.80.2)10-5 cm2 s-1 by horizontal fitting the diffusion 663
coefficients of Fe3+ at each step potential. 664
665
E. Supplementary Discussion 666
Table II collects the diffusion coefficients of Fe3+ derived from multiple testing techniques 667
such as the CV, the SWV, the CP, and the CA in this work. These values are found to be 668
consistent in allowable error, despite of different measuring principles and methods, suggesting it 669
is rational to have the experimental data processed with related equations described above. 670
Although these equations come from the classical electrochemistry where they are mostly 671
established in aqueous solutions, it is known that molten salts like aqueous solutions are also 672
electrolyte solutions, so that the equations can be used to analyze electrochemical data obtained in 673
molten salts when the application conditions on these equations are satisfied. Also, the diffusion 674
coefficients of Fe3+ reported in related literature are compared in Table II. Taking into account 675
different experimental conditions and test methods, it is believed that the results described herein 676
match well with recorded values of the literature, suggesting our research methods are feasible to 677
build the integrated electrochemical cell with zirconia-based solid electrolyte tube. 678
It should be noted that the reversibility of an electrode reaction depends on if the ratio of the 679
product and reactant activities obeys the Nernst equation at the electrode/electrolyte interface, but 680
not by the form of the reaction product. When the reaction product is in a solid phase, its activity 681
at the electrode/electrolyte interface would be either constant (pure metal or intermetallic 682
compound) or variable (alloy). Thus, the reversibility can still be checked by the CV and the 683
SWV.[80] In this work, the obtained CVs have three typical characteristics of a reversible reaction, 684
although reduction product Fe forms an alloy with the Pt electrode. These CV features indicate 685
that alloying has no significant effect on the reversibility of reduction reaction. The calculated 686
results from the CV, the SWV, the CP, the reversal CPs, and the CA, including the number of 687
exchanged electrons and the diffusion coefficient of ferric ions, are in agreement with each other, 688
indicating that the conclusion on the reversibility of the electrode process is reasonable under the 689
present conditions. 690
In this work, Pt was chosen as the WE mainly due to its better chemical and electrochemical 691
stability against oxidation in molten salt although it formed the alloy with reduction product Fe. It 692
should be pointed out that the experimental results with good stability and reproducibility are 693
obtained when the Pt electrode is used as the WE. The authors also acknowledge that it still 694
remains a great challenge to find the suitable inert electrode for electrolytic reduction of iron oxide 695
to iron in molten electrolytes. It is known that graphite reacts with Fe2O3 in the melt at the 696
working temperature and hence cannot be used as the WE in this work. On the other hand, the 697
effort to use other WE materials, including low carbon steel, molybdenum, and tungsten, is still 698
ongoing and we hope to publish the findings separately in the near future. 699
In addition, the key part of the integrated cell is the YSZ tube. It is understandable that the 700
22
stability of the YSZ in the molten salt is a basic necessity to obtain reliable experimental results. 701
In this work, the experimental time in one measurement during one thermal cycle usually lasted 702
for about six hours at high temperatures. In the experiment, erosion of the YSZ tube was never 703
visible, and the reproducibility and consistency of the experimental results not only showed that 704
there was no erosion, but also showed that the RE was stable. Unfortunately, long time electrolysis 705
tests were not performed in this work. It should also be possible to maintain the stability of the RE 706
within a desired accuracy for a long time in practice. 707
It should also be noted that the working temperature of 1273 K studied in this work seems a 708
little too high when heat loss and salt evaporation are significant. However, higher temperatures 709
will also bring about both thermodynamic (lower Gibbs free energy) and kinetic (faster reaction) 710
benefits to the electrode reactions, in addition to the higher conductivity of the YSZ membrane. It 711
is common knowledge that for the same number of joules, electric energy and reaction energy are 712
both of higher prices than that of heat. Thus, from the viewpoint of energy economy, a higher 713
working temperature is not necessarily more expensive for an electrolytic process. The salt loss 714
via vaporization at higher temperatures could, however, be problematic, but the liquid mixture of 715
CaCl2 and NaCl is expected to deviate from the ideal mixture, and hence evaporate less than the 716
pure component salt alone at the same temperature. We also anticipate a lower vapor pressure of 717
the mixture of molten salts when the concentration of dissolved metal oxides approaches to 718
saturation. In addition, the operating temperature is considered not to be the focus in the work 719
because it is limited by some factors such as the resistance of YSZ tube. For the case in this work, 720
if the wall of YSZ tube used became thinner, or Y2O3 and Yb2O3 co-doped zirconia tube was 721
employed, [81,82] so as to decrease the resistance of zirconia membrane, the operating temperature 722
of the integrated cell would be lower than 1273 K, and the evaporation of molten salt would also 723
reduce. 724
725
IV. CONCLUSIONS 726
A unique integrated three-electrode cell with the “O2- |YSZ | Pt | O2 (air)” RE was constructed 727
using yttria-stabilized zirconia (YSZ) solid electrolyte tube with a closed end. Electrochemical 728
behavior of ferric ions was systematically investigated in the molten CaCl2-NaCl eutectic mixture 729
containing 0.5 wt pct Fe2O3 at 1273 K. The test results of various electrochemical techniques, such 730
as CV, LSV, SWV, CP, reversal CP, CA, suggest that the reduction of Fe3+ to Fe on the Pt WE 731
could be a single one-step and diffusion-controlled reaction that was also possibly reversible. The 732
peak potential of the reduction of Fe3+ to Fe on the CV was observed at about -0.73 V, and the 733
reduction product, Fe, was found to alloy with the Pt electrode. The diffusion coefficient of ferric 734
ions was derived in satisfactory consistency from the CV, SWV, CP, reversal CP, and the CA 735
analyses, and also matched reasonably well with those values in related literature. It was found 736
that there was another reduction reaction with potentials more negative than -1.2 V in CPs. It was 737
considered that the reduction reaction was most likely due to the reduction of Fe2+ ions from FeO. 738
23
However, it still needs further investigation and confirmation. The transport of O2- ions in the YSZ 739
membrane seemed to have no or little effect on the behavior of electroactive species on the Pt WE 740
in the three-electrode cell at a sufficiently high temperature. Overall, this work has demonstrated 741
the feasibility of electrochemical investigation of ferric ions in molten salts with the aid of the 742
integrated cell with the “O2-| YSZ | Pt | O2 (air)” RE. We also hope that this work could provide a 743
universal potential reference for the study of other electroactive oxides dissolved in molten salts. It 744
should be noted that the integrated cell as reported in this work is not studied for direct industrial 745
adaption, but the working principle, i.e., using the YSZ membrane for incorporation of RE and 746
also separation of the anode and cathode should be applicable in a future continuous electrolytic 747
steelmaking process, such as the MOE method proposed by Sadoway and co-workers. 748
749
ACKNOWLEDGEMENTS 750
The authors acknowledge funding provided by the National Natural Science Foundation of 751
China (Grant No. 51174148) and the Key Program of Joint Funds of the National Natural Science 752
Foundation of China and the Government of Liaoning Province (Grant No. U1508214). 753
754
REFERENCES 755
[1] Y. Castrillejo, A. M. Martinez, M. Vega and P. S. Batanero: J. Appl. Electrochem., 1996, vol. 756
26, pp. 1279-85. 757
[2] A. Lugovskoy, M. Zinigrad, D. Aurbach and Z. Unger: Electrochim. Acta, 2009, vol. 54, pp. 758
1904-08. 759
[3] G. M. Haarberga and M. Keppertb: Ecs. Trans., 2009, vol. 16, pp. 309-15. 760
[4] S. Licht and H. Wu: J. Phys. Chem. C., 2011, vol. 115, pp. 25138-47. 761
[5] H. Yin, D. Tang, H. Zhu, Y. Zhang and D. Wang: Electrochem. Commun., 2011, vol. 13, pp. 762
1521-24. 763
[6] C. Donath, E. Neacsu and N. Ene: Rev. Roum. Chim., 2011, vol. 56, pp. 763-69. 764
[7] G. M. Haarberg, E. Kvalheim, S. Rolseth, T. Murakami, S. Pietrzyk and S. Wang: Ecs. 765
Trans., 2007, vol. 3, pp. 341-45. 766
[8] L. Li, X. Liu and S. Wang: in Energy Technology 2014: Carbon Dioxide Management and 767
Other Technologies, Eds.: C Wang, J Bakker, C. K. Belt, A. Jha, N. R. Neelameggham, S. 768
Pati, L. H. Prentice, G. Tranell and K. S. Brinkman, John Wiley & Sons, Inc. 2014, pp. 769
135-40. 770
[9] S. L. Wang,G. M. Haarberg and E. Kvalheim: J. Iron Steel. Res. Int., 2008, vol. 15, pp. 771
48-51. 772
[10] M. A. Quader, S. Ahmed, S. Z. Dawal and Y. Nukman: Renew. Sust. Energ. Rev., 2016, vol. 773
55, pp. 537-49. 774
24
[11] S. Jahanshahi, J. G. Mathieson and H. Reimink: J. Sustain. Metall., 2016, vol. 2, pp. 185-90. 775
[12] A. Allanore, L. Yin and D. R. Sadoway: Nature, 2013, vol. 497, pp. 353-56. 776
[13] D. H. Wang, A. J. Gmitter and D. R. Sadoway: J. Electrochem. Soc., 2011, vol. 158, pp. 777
E51-54. 778
[14] A. H. C. Sirk, D. R. Sadoway and L. Sibille: Ecs. Trans., 2010, vol. 28, pp. 367-73. 779
[15] A. Allanore: Electrochim. Acta, 2013, vol. 110, pp. 587-592. 780
[16] A. Allanore: J. Electrochem. Soc., 2015, vol. 162, pp. E13-E22. 781
[17] G. Z. Chen, D. J. Fray and T. W. Farthing: Nature, 2000, vol. 407, pp. 361-64. 782
[18] H. Gao, X. Jin, S. Zou, F. Ling, J. Peng, Z. Wang and G. Z. Chen: Electrochim. Acta, 2013, 783
vol. 107, pp. 261-68. 784
[19] G. Li, D. Wang and Z. Chen: J. Mater. Sci. Technol., 2009, vol. 25, pp. 767-71. 785
[20] D. Tang, H. Yin, W. Xiao, H. Zhu, X. Mao and D. Wang: J. Electroanal. Chem., 2013, vol. 786
689, pp. 109-16. 787
[21] A. Cox and D. J. Fray: J. Appl. Electrochem., 2008, vol. 38, pp. 1401-07. 788
[22] Y. Berghoute, A. Salmi and F. Lantelme: J. Electroanal. Chem., 1994, vol. 365, pp. 171-77. 789
[23] K. K. Kasem and S. Jones: Platinum Metals Rev., 2008, vol. 52, pp. 100-06. 790
[24] D. J. Fray: Metall. Mat. Trans. B, 2003, vol. 34, pp. 589-94. 791
[25] M.J.U.T. Van Wijngaarden, R. J. Dippenaar and P. M. Van Den Heever: J. S. Afr. Inst. Min. 792
Metall., 1987, vol. 87, pp. 269-78. 793
[26] Y. M. Gao, J. X. Song, Y. Q. Zhang and X. M. Guo: Acta Metall. Sin., 2010, vol. 46, pp. 794
277-81. 795
[27] R. Ganesan, T. Gnanasekaran and R. S. Srinivasa: J. Nucl. Mater., 2006, vol. 349, pp. 133-49. 796
[28] T. Ogura, R. Fujiwara, R. Mochizuki, Y. Kawamoto, T. Oishi and M. Iwase: Metall. Trans. B, 797
1992, vol. 23B, pp. 459-66. 798
[29] E.T. Turkdogan: Ironmaking Steelmaking, 2000, vol. 27, pp. 32-36. 799
[30] P. Soral, U. Pal, H. R. Larson and B. Schroeder: Metall. Mat. Trans. B, 1999, vol. 30B, pp. 800
307-21. 801
[31] W. Kim, D. J. Min, Y. S. Lee and J. H. Park: ISIJ Int., 2009, vol. 49, pp. 1882-88. 802
[32] X. Guan, S. Su,U. B. Pal and A. C. Powell: Metall. Mat. Trans. B, 2014, vol. 45B, pp. 803
2138-44. 804
[33] A. Krishnan, X.G. Lu and U.B. Pal: Metall. Mat. Trans. B, 2005, vol. 36B, pp. 463-73. 805
[34] E. S. Gratz, X. Guan, J. D. Milshtein, U. B. Pal and A. C. Powell, Metall. Mat. Trans. B, 806
2014, 45B, pp. 1325-36. 807
[35] Y. M Gao, C. Duan, Y. B. Yang, D. Ruan, C. H. Yang and C. Hong: ISIJ Int., 2015, vol. 55, 808
pp. 2273-82. 809
[36] Y. M. Gao, B. Wang, S. B. Wang and S. Peng: Journal of Mining and Metallurgy, Section B: 810
Metallurgy, 2013, vol. 49, pp. 49-55. 811
[37] C. Mallika, O. M. Sreedharan and R. Subasri: J. Eur. Ceram. Soc., 2000, vol. 20, pp. 812
25
2297-2313. 813
[38] S. C. Britten and U. B. Pal: Metall. Mater. Trans. B, 2000, vol. 31B, pp. 733-53. 814
[39] C. Z. Wang: Solid Electrolyte and Chemical Sensors, Metallurgical Industry Press, Beijing, 815
2000. 816
[40] N. Otsuka: ECS Transactions, 2012, vol. 41, pp. 13-19. 817
[41] S. H. Cho, D. Y. Kim, S. Kwon, B. H. Yoon and J. H. Lee: J. Nucl. Sci. Technol., 2018, vol. 818
55, pp.97-103. 819
[42] S.H. Cho, S.W. Kim, D.Y. Kim, J.H. Lee and J.M. Hur: J. Nucl. Mater., 2017, vol. 490, 820
pp.85-93. 821
[43] Y. Gao, C. Yang, C. Zhang, Q. Qin and G. Z. Chen: Phys. Chem. Chem. Phys., 2017, vol. 19, 822
pp. 15876-90. 823
[44] Y. Gao, C. Hong and C. Yang: J. Electrochem. Soc., 2015, vol. 162, pp. E362-69. 824
[45] K. Igarashi, H. Ohtani and J. Mochinaga: Z. Für Naturforsch. A, 1987, vol. 42A, pp. 825
1421-24. 826
[46] X. Y. Chen: Solubility of oxides in molten salts and the preparation of carbide-derived 827
carbon by fused salt electrolysis process (Master’s Thesis), Northeastern University, 828
Shenyang, 2012. 829
[47] G. M. Haarberg, E. Kvalheim and S. Rolseth: Electrochemical behaviour of dissolved iron 830
species in molten salts, in Molten Salts XIV - Proceedings of the International Symposium, 831
R.A. Mantz et al, Editors, PV 2004-24, The Electrochemical Society Proceedings Series, 832
Pennington, NJ, 2004, p. 890. 833
[48] Factsage 7.1 (Centre for Research in Computational Thermochemistry (CRCT) and 834
GTT-Technologies, 2017), http://www.factsage.com/. Accessed 2 August 2017. 835
[49] J. Yu, W. Yi, B. Chen and H. Chen: Binary Alloy Phase Diagrams, Shanghai Scientific and 836
Technical Publishers, Shanghai, 1987, pp. 371. 837
[50] H. E. Ghallali, H. Groult, A. Barhoun, K. Draoui and D. Krulic: Electrochim. Acta, 2009, vol. 838
54, pp. 3152-60. 839
[51] A. J. Bard and L. R. Faulkner: Electrochemical Methods Fundamentals and Applications, 840
2nd Ed., John Wiley & Sons, Inc, New York, 2001, pp. 226-61. 841
[52] A. J. Bard and L.R. Faulkner: Electrochemical Methods Fundamentals and Applications, 2nd 842
Ed., John Wiley & Sons, Inc, New York, 2001, pp. 669-76. 843
[53] H. Tang and B. Pesic: Electrochim. Acta, 2014, vol. 119, pp. 120-30. 844
[54] M. Gibilaro, L. Massot, P. Chamelot, L. Cassayre and P. Taxil: Electrochim. Acta, 2013, vol. 845
95, pp. 185-91. 846
[55] M. Jayakumar, K. A. Venkatesan and T. G. Srinivasan: Electrochim. Acta. 2008, vol. 53, pp. 847
2794-2801. 848
[56] T. Sakurada, H. Maekawa and T. Yokokawa: Mater. Trans., 2007, vol. 39, pp. 740-46. 849
[57] Q. R. Shi, S. Z. Duan and S. M. Wu: J. Univ. Sci. Technol. B., 1994, vol. 16, pp. 599-603. 850
26
[58] W. Huang, L. Tian, C. She, F. Jiang, H. Zheng, W. Li, G. Wu, D. Long and Q. Li: 851
Electrochim. Acta, 2014, vol. 147, pp. 114-20. 852
[59] Z. Chen, Y. J. Li and S. J. Li: J. Alloys Compd., 2011, vol. 509, pp. 5958-61. 853
[60] C. Nourry, P. Souček, L. Massot, R. Malmbeck, P. Chamelot and J.-P. Glatz: J. Nucl. Mater., 854
2012, vol. 430, pp. 58-63. 855
[61] F. H. Hu: Molten Salt Physical Chemistry, China Industry Press, Beijing, 1963, pp.73-96. 856
[62] D. Shuzhen, P. Dudley and D. Inman: J. Electroanal. Chem. Interf. Electrochem., 1982, vol. 857
142, pp. 215-28. 858
[63] B. Khalaghia, E. Kvalheima, M. Tokushigeb, L. Teng, S. Seetharamanc and G. M. Haarbergd: 859
ECS Trans., 2014, vol. 64, pp. 301-10. 860
[64] Z. Guangwen, L. Yupin and Z. Yuankai: Journal of Beijing iron and steel institute, 1983, (2): 861
68-78. 862
[65] L. Massot, P. Chamelot and F. Bouyer: Electrochim. Acta, 2002, vol. 47, pp. 1949-57. 863
[66] S. Frangini and S. Scaccia: J. Electrochem. Soc., 2005, vol.152, pp. A2155-58. 864
[67] V. A. Volkovich, T. R. Griffiths, D. J. Fray and R. C. Thied: J. Nucl. Mater., 2000, vol. 282, 865
pp. 152-58. 866
[68] M. Hayyan, M. A. Hashim and I. M. AlNashef: Chem. Rev., 2016, vol. 116, pp. 3029-85. 867
[69] P. G. Zambonin: J. Phys. Chem., 1974, vol. 78, pp. 1294-98. 868
[70] M. Chandra, S. Vandarkuzhali, S. Ghosh, N. Gogoi, P. Venkatesh, G. Seenivasan, B. P. 869
Reddy and K. Nagarajan: Electrochim. Acta, 2011, vol. 58, pp. 150-56. 870
[71] C. Hamel, P. Chamelot and P. Taxil: Electrochim. Acta, 2004, vol. 49, pp. 4467-76. 871
[72] A. Wiedenroth and C. Rüssel: J. Non-Cryst. Solids, 2004, vol. 347, pp. 180-86. 872
[73] A. Wiedenroth and C. Rüssel: J. Non-Cryst. Solids, 2001, vol. 290, pp. 41-48. 873
[74] E. Freude: Voltammetrische Untersuchung des Redoxverhaltens polyvalenter Ionen in 874
Glasschmelzen, insbesondere von Technetium,Thesis Erlangen, 1989. 875
[75] C. Rüssel and E. Freude: Glastech. Ber., 1990, vol. 63, pp. 149-53. 876
[76] O. Claussen and C. Rüssel: Glastech. Ber. Glass Sci. Technol., 1996, vol. 69, pp. 95-100. 877
[77] A.W.M. Wondergem·de Best: Redox behaviour and fining of molten glass (Doctoral Thesis), 878
Technische Universiteit Eindhoven, 1994, pp. 126 879
[78] K. Serrano and P. Taxil: J. Appl. Electrochem., 1999, vol. 29, pp. 505-10. 880
[79] A. J. Bard and L. R. Faulkner: Electrochemical Methods Fundamentals and Applications, 881
2nd Ed., John Wiley & Sons, Inc, New York, 2001, pp. 161-65. 882
[80] J. De Strycker, P. Westbroek and E. Temmerman: J. Electroanal. Chem., 2004, vol. 565, 883
pp.149-58. 884
[81] Y. M. Kan, S. L. Li, P. L. Wang, G. J. Zhang, O. V. de Biest and J. Vleugels: Solid State 885
Ionics, 2008, vol. 179, pp. 1531-1534. 886
[82] Z. G. Lv, P. Yao, R. S. Guo and F.Y. Dai: Mat. Sci. Eng. A, 2007, vol. 458, pp. 355-360. 887
888
27
889
Tables: 890
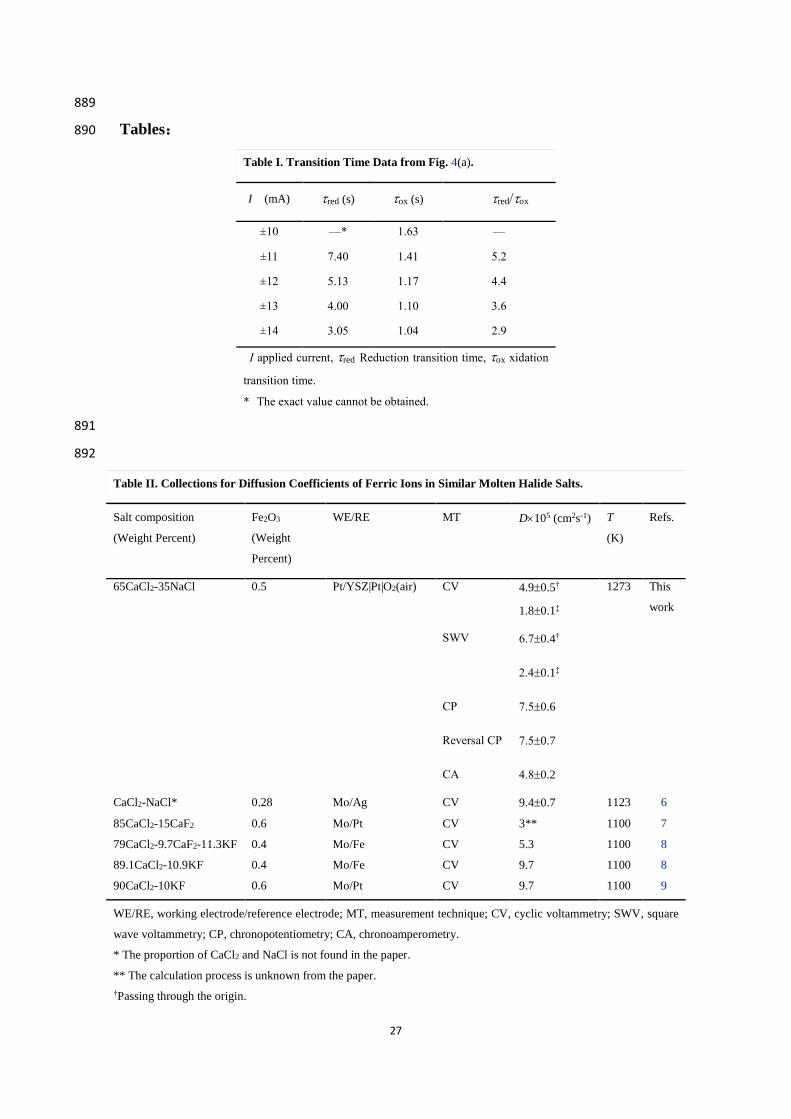
Table I. Transition Time Data from Fig. 4(a).
I (mA) red (s) ox (s) red/ox
±10 —* 1.63 —
±11 7.40 1.41 5.2
±12 5.13 1.17 4.4
±13 4.00 1.10 3.6
±14 3.05 1.04 2.9
I applied current, red Reduction transition time, ox xidation
transition time.
* The exact value cannot be obtained.
891
892
Table II. Collections for Diffusion Coefficients of Ferric Ions in Similar Molten Halide Salts.
Salt composition
(Weight Percent)
Fe2O3
(Weight
Percent)
WE/RE MT D105 (cm2s-1) T
(K)
Refs.
65CaCl2-35NaCl 0.5 Pt/YSZ|Pt|O2(air) CV 4.90.5† 1273 This
work 1.80.1‡
SWV 6.70.4†
2.40.1‡
CP 7.50.6
Reversal CP 7.50.7
CA 4.80.2
CaCl2-NaCl* 0.28 Mo/Ag CV 9.40.7 1123 6
85CaCl2-15CaF2 0.6 Mo/Pt CV 3** 1100 7
79CaCl2-9.7CaF2-11.3KF 0.4 Mo/Fe CV 5.3 1100 8
89.1CaCl2-10.9KF 0.4 Mo/Fe CV 9.7 1100 8
90CaCl2-10KF 0.6 Mo/Pt CV 9.7 1100 9
WE/RE, working electrode/reference electrode; MT, measurement technique; CV, cyclic voltammetry; SWV, square
wave voltammetry; CP, chronopotentiometry; CA, chronoamperometry.
* The proportion of CaCl2 and NaCl is not found in the paper.
** The calculation process is unknown from the paper.
†Passing through the origin.
28
‡Not passing through the origin.
893
894
895
Figure Captions: 896
897
Fig. 1Schematic illustration of the YSZ-based integrated three-electrode cell for 898
electrochemical analyses in molten salt at high temperatures (1273 K in this work). 899
900
Fig. 2A typical OCP-time plot recorded in the course of immersing the Pt wire WE into the 901
molten mixture containing 0.5 wt pct Fe2O3 and then switching from Ar to air in the furnace tube 902
(a); a typical WE potential-time curve recorded in the polarization experiment (b), and a typical 903
AC impedance Nyquist plot recorded at the OCP (bias potential) (c). RE: O2- | YSZ | Pt | O2 (air). 904
905
Fig. 3CVs recorded in molten CaCl2-NaCl at 1273 K with 0.5 wt pct Fe2O3 at v (potential scan 906
rate) = 0.04, 0.05, 0.06, 0.07, 0.08, 0.10, 0.50, or 1.00 V s-1, and without Fe2O3 (blank) at v = 50 907
mV s-1 (a), and correlations of Ipc (reduction peak current) and Epc (reduction peak potential) with 908
v1/2 (b). RE: O2- | YSZ | Pt | O2 (air). 909
910
Fig. 4Reversal CPs on the Pt WE in molten CaCl2-NaCl with 0.5 wt pct Fe2O3 at 1273 K and 911
different currents (10, 11, 12, 13 and 14 mA) (a) and the correlation of the I1/2 (: 912
transition time) value against the cathodic current I for the reduction plateau (b). RE: O2-| YSZ | Pt 913
| O2 (air). 914
915
Fig. 5LSVs recorded at 50 mV s-1 on the Pt wire WE under the static and rotating modes after 916
the potentiostatic electrolysis for 30, 60, 90 seconds in molten CaCl2-NaCl with 0.5 wt pct Fe2O3. 917
Inset: a set of typical current-time curves of potentiostatic electrolysis using the Pt wire WE for 30, 918
60, 90 seconds. Potentiostatic electrolysis potential: -0.76 V; time: 30, 60, 90 s; temperature: 1273 919
K; RE: O2-| YSZ | Pt | O2 (air). 920
921
Fig. 6SEM image of the cross section of the Pt wire WE (a), EDS analyses of spots 1 and 2 in 922
the SEM image (b), and the line scanning profiles of Pt (c), Fe (d) and O (e) after potentiostatic 923
electrolysis in molten CaCl2-NaCl with 0.5 wt pct Fe2O3. Potentiostatic electrolysis potential: - 924
0.73 V; time: 30 min; temperature: 1273 K; RE: O2- | YSZ | Pt | O2 (air). 925
926
Fig. 7XRD pattern for the Pt foil WE after potentiostatic electrolysis in molten CaCl2-NaCl 927
with 0.5 wt pct Fe2O3. Potentiostatic electrolysis potential: - 0.7 V; time: 30 min; temperature: 928
29
1273 K; RE: O2- | YSZ | Pt | O2 (air). 929
930
Fig. 8SWVs recorded in the molten CaCl2-NaCl mixture with 0.5 wt pct Fe2O3 at different 931
frequencies (30, 40, 50, 60, 70, 80 Hz) and 1273 K (a) and the correlations between the peak 932
current (Ip), the peak potential (Ep), and the square root of the frequency (f1/2) , respectively (b). 933
RE: O2- | YSZ | Pt | O2 (air). 934
935
Fig. 9CPs recorded in the melt with 0.5 wt pct Fe2O3 at 1273 K at different cathodic currents of 936
-8, -10, -11, -12, -13, -14, -14 mA (a) and the correlation between the cathodic current I and the 937
I1/2 (: transition time) value for the reduction plateau (b). RE: O2- |YSZ | Pt | O2 (air). 938
939
Fig. 10CAs recorded in the melt with 0.5 wt pct Fe2O3 at 1273 K at different step potentials of 940
-0.5, -0.6, -0.7, -0.8, -0.9, -1.0, -1.1, -1.2 V (a) and the correlation between the cathodic current I 941
and the t -1/2 value at different step potentials of -0.8, -0.9, -1.0, -1.1, -1.2 V (b). RE: O2- |YSZ | Pt | 942
O2 (air). 943
Related Documents