Inside: Continuing Medical Education for U.S. Physicians and Nurses Youth Tobacco Surveillance United States, 1998–1999 U.S. DEPARTMENT OF HEALTH & HUMAN SERVICES Centers for Disease Control and Prevention (CDC) Atlanta, GA 30333 October 13, 2000 / Vol. 49 / No. SS-10 CDC Surveillance Summaries

Welcome message from author
This document is posted to help you gain knowledge. Please leave a comment to let me know what you think about it! Share it to your friends and learn new things together.
Transcript

Insid
e:
Co
nti
nu
ing
Med
ical
Ed
ucati
on
fo
r U
.S.
Ph
ysic
ian
s a
nd
Nu
rses
Youth Tobacco SurveillanceUnited States, 1998–1999
U.S. DEPARTMENT OF HEALTH & HUMAN SERVICESCenters for Disease Control and Prevention (CDC)
Atlanta, GA 30333
October 13, 2000 / Vol. 49 / No. SS-10
CDCSurveillanceSummaries

2 MMWR October 13, 2000
Centers for Disease Control and Prevention .................. Jeffrey P. Koplan, M.D., M.P.H.Director
The production of this report as an MMWR serial publication was coordinated in
Epidemiology Program Office ............................................ Barbara R. Holloway, M.P.H.Acting Director
Office of Scientific and Health Communications ........................ John W. Ward, M.D.Director
Editor, MMWR Series
CDC Surveillance Summaries ...................................... Suzanne M. Hewitt, M.P.A.Managing Editor
.................................................................................................... Valerie R. JohnsonProject Editor
Lynda G. CupellMichael T. Brown
Sandra L. FordVisual Information Specialists
................................................................................................. Michele D. Renshaw
......................................................................................................... Erica R. ShaverInformation Technology Specialists
The MMWR series of publications is published by the Epidemiology Program Office,Centers for Disease Control and Prevention (CDC), U.S. Department of Health andHuman Services, Atlanta, GA 30333.
SUGGESTED CITATION
Centers for Disease Control and Prevention.CDC Surveillance Summaries,October 13, 2000. MMWR 2000;49(No. SS-10).
Use of trade names and commercial sources is for identification only and does notimply endorsement by the U.S. Department of Health and Human Services.
References to non-CDC sites on the Internet are provided as a service to MMWRreaders and do not constitute or imply endorsement of these organizations or theirprograms by CDC or the U.S. Department of Health and Human Services. CDC is notresponsible for the content of pages found at these sites.

Vol. 49 / No. SS-10 MMWR i
Contents
Reports Published in CDC Surveillance SummariesSince January 1, 1990................................................................................. ii
Youth Tobacco Surveillance — United States, 1998–1999 .............................. 1Introduction ....................................................................................................... 2Methods ............................................................................................................. 3Results ............................................................................................................... 5Discussion ....................................................................................................... 38Conclusion ...................................................................................................... 42References ....................................................................................................... 43Tables .............................................................................................................. 45
Sample sizes and response rates ............................................................ 45Prevalence of use...................................................................................... 46Knowledge and attitudes ......................................................................... 60Access ....................................................................................................... 66Media and advertising .............................................................................. 76Cessation .................................................................................................. 82Environmental tobacco smoke ................................................................ 88School ....................................................................................................... 92

ii MMWR October 13, 2000
*Abbreviations
ATSDR Agency for Toxic Substances and Disease RegistryCIO Centers/Institute/OfficesEPO Epidemiology Program OfficeIHPO International Health Program OfficeNCCDPHP National Center for Chronic Disease Prevention and Health PromotionNCEH National Center for Environmental HealthNCEHIC National Center for Environmental Health and Injury ControlNCHSTP National Center for HIV, STD, and TB PreventionNCID National Center for Infectious DiseasesNCIPC National Center for Injury Prevention and ControlNCPS National Center for Prevention ServicesNIOSH National Institute for Occupational Safety and HealthNIP National Immunization Program
Reports Published in CDC Surveillance Summaries Since January 1, 1990
ResponsibleSubject CIO/Agency* Most Recent Report
Abortion NCCDPHP 1999; Vol. 48, No. SS-4Aging
Health Risks NCCDPHP 1999; Vol. 48, No. SS-8Health-Care Services NCCDPHP/NIP 1999; Vol. 48, No. SS-8Health-Related Quality of Life NCEH/NCCDPHP 1999; Vol. 48, No. SS-8Injuries and Violence NCIPC/NCCDPHP 1999; Vol. 48, No. SS-8Morbidity and Mortality NCHS/NCCDPHP 1999; Vol. 48, No. SS-8
AIDS/HIVAIDS-Defining Opportunistic Illnesses NCHSTP/NCID 1999; Vol. 48, No. SS-2Among Black and Hispanic Children
and Women of Childbearing Age NCEHIC 1990; Vol. 39, No. SS-3Asthma NCEH 1998; Vol. 47, No. SS-1Behavioral Risk Factors
State-Specific Prevalence of Selected HealthBehaviors, by Race and Ethnicity NCCDPHP 2000; Vol. 49, No. SS-2
State- and Sex-Specific Prevalenceof Selected Characteristics NCCDPHP 2000; Vol. 49, No. SS-6
Birth DefectsBirth Defects Monitoring Program
(see also Malformations) NCEH 1993; Vol. 42, No. SS-1Contribution of Birth Defects to Infant Mortality
Among Minority Groups NCEHIC 1990; Vol. 39, No. SS-3Breast and Cervical Cancer NCCDPHP 1999; Vol. 48, No. SS-6Cardiovascular Disease EPO/NCCDPHP 1998; Vol. 47, No. SS-5Chancroid NCPS 1992; Vol. 41, No. SS-3Chlamydia NCPS 1993; Vol. 42, No. SS-3Cholera NCID 1992; Vol. 41, No. SS-1Chronic Fatigue Syndrome NCID 1997; Vol. 46, No. SS-2Contraception Practices NCCDPHP 1992; Vol. 41, No. SS-4Cytomegalovirus Disease, Congenital NCID 1992; Vol. 41, No. SS-2Dengue NCID 1994; Vol. 43, No. SS-2Developmental Disabilities NCEH 1996; Vol. 45, No. SS-2Diabetes Mellitus NCCDPHP 1993; Vol. 42, No. SS-2Dracunculiasis NCID 1992; Vol. 41, No. SS-1Ectopic Pregnancy NCCDPHP 1993; Vol. 42, No. SS-6Elderly, Hospitalizations Among NCCDPHP 1991; Vol. 40, No. SS-1Escherichia coli O157 NCID 1991; Vol. 40, No. SS-1Evacuation Camps EPO 1992; Vol. 41, No. SS-4Family Planning Services at Title X Clinics NCCDPHP 1995; Vol. 44, No. SS-2Food Safety NCID 1998; Vol. 47, No. SS-4Foodborne-Disease Outbreaks NCID 2000; Vol. 49, No. SS-1

Vol. 49 / No. SS-10 MMWR iii
Reports Published in CDC Surveillance Summaries Since January 1, 1990 — Continued
ResponsibleSubject CIO/Agency* Most Recent Report
Giardiasis NCID 2000; Vol. 49, No. SS-7Gonorrhea and Syphilis, Teenagers NCPS 1993; Vol. 42, No. SS-3Hazardous Substances Emergency Events ATSDR 1994; Vol. 43, No. SS-2Health Surveillance Systems IHPO 1992; Vol. 41, No. SS-4Homicide NCEHIC 1992; Vol. 41, No. SS-3Hysterectomy NCCDPHP 1997; Vol. 46, No. SS-4Infant Mortality (see also National Infant Mortality;
Birth Defects; Postneonatal Mortality) NCEHIC 1990; Vol. 39, No. SS-3Influenza NCID 2000; Vol. 49, No. SS-3Injury
Head and Neck NCIPC 1993; Vol. 42, No. SS-5In Developing Countries NCEHIC 1992; Vol. 41, No. SS-1
Lead Poisoning, Childhood NCEHIC 1990; Vol. 39, No. SS-4Low Birth Weight NCCDPHP 1990; Vol. 39, No. SS-3Lyme Disease NCID 2000; Vol. 49, No. SS-3Malaria NCID 1999; Vol. 48, No. SS-1Measles NCPS 1992; Vol. 41, No. SS-6Meningococcal Disease NCID 1993; Vol. 42, No. SS-2Mumps NIP 1995; Vol. 44, No. SS-3Neisseria gonorrhoeae, Antimicrobial Resistance in NCPS 1993; Vol. 42, No. SS-3Neural Tube Defects NCEH 1995; Vol. 44, No. SS-4Occupational Injuries/Disease
Asthma NIOSH 1999; Vol. 48, No. SS-3Silicosis NIOSH 1997; Vol. 46, No. SS-1
Parasites, Intestinal NCID 1991; Vol. 40, No. SS-4Pediatric Nutrition NCCDPHP 1992; Vol. 41, No. SS-7Pertussis NCPS 1992; Vol. 41, No. SS-8Poliomyelitis NCPS 1992; Vol. 41, No. SS-1Postneonatal Mortality NCCDPHP 1998; Vol. 47, No. SS-2Pregnancy
Pregnancy Nutrition NCCDPHP 1992; Vol. 41, No. SS-7Pregnancy-Related Mortality NCCDPHP 1997; Vol. 46, No. SS-4Pregnancy Risk Assessment
Monitoring System (PRAMS) NCCDPHP 1999; Vol. 48, No. SS-5Pregnancy, Teenage NCCDPHP 1993; Vol. 42, No. SS-6
Racial/Ethnic Minority Groups Various 1990; Vol. 39, No. SS-3Respiratory Disease NCEHIC 1992; Vol. 41, No. SS-4Rotavirus NCID 1992; Vol. 41, No. SS-3School Health Education Profiles NCCDPHP 2000; Vol. 49, No. SS-8Sexually Transmitted Diseases in Italy NCPS 1992; Vol. 41, No. SS-1Smoking NCCDPHP 1990; Vol. 39, No. SS-3
Smoking-Attributable Mortality NCCDPHP 1994; Vol. 43, No. SS-1Tobacco-Control Laws, State NCCDPHP 1999; Vol. 48, No. SS-3Tobacco-Use Behaviors NCCDPHP 1994; Vol. 43, No. SS-3Youth Tobacco Surveillance NCCDPHP 2000; Vol. 49, No. SS-10
Spina Bifida NCEH 1996; Vol. 45, No. SS-2Streptococcal Disease (Group B) NCID 1992; Vol. 41, No. SS-6Syphilis, Congenital NCPS 1993; Vol. 42, No. SS-6Syphilis, Primary and Secondary NCPS 1993; Vol. 42, No. SS-3Tetanus NIP 1998; Vol. 47, No. SS-2

iv MMWR October 13, 2000
Reports Published in CDC Surveillance Summaries Since January 1, 1990 — Continued
ResponsibleSubject CIO/Agency* Most Recent Report
Trichinosis NCID 1991; Vol. 40, No. SS-3Tuberculosis NCPS 1991; Vol. 40, No. SS-3Vaccination Coverage
Among Children Enrolled in Head StartPrograms or Day Care Facilitiesor Entering School NIP 2000; Vol. 49, No. SS-9
Influenza, Pneumococcal, and Tetanus ToxoidVaccination (Among Adults) NIP 2000; Vol. 49, No. SS-9
National, State, and Urban Areas (AmongChildren Aged 19–35 Months) NIP 2000; Vol. 49, No. SS-9
Waterborne-Disease Outbreaks NCID 2000; Vol. 49, No. SS-4Years of Potential Life Lost EPO 1992; Vol. 41, No. SS-6Youth Risk Behaviors NCCDPHP 2000; Vol. 49, No. SS-5
College Students NCCDPHP 1997; Vol. 46, No. SS-6National Alternative High Schools NCCDPHP 1999; Vol. 48, No. SS-7

Vol. 49 / No. SS-10 MMWR v

vi MMWR October 13, 2000
ContributorsCheri H. Ahern, Scott M. Batchelor, M.P.H.,
Curtis J. Blanton, Ph.D., Marcella Law, M.P.H.,Clifton M. Loo, Ph.D., Eric S. Pevzner, M.P.H.,
Heather A. Ryan, M.P.H., Stephanie A. Stolfus, M.P.H.,Mark Tabladillo, Ph.D., Charles W. Warren, Ph.D.,
Leah R. Zinner, Michael P. Eriksen, Sc.D.Office on Smoking and Health,
National Center for Chronic Disease Prevention and Health Promotion
Cheryl G. Healton, Ph.D., Peter A. Messeri, Ph.D.,Jennifer H. Reynolds, M.P.H.
American Legacy Foundation, Washington, DC
Charles Stokes, M.Ed.CDC Foundation, Atlanta, Georgia
James G. Ross, M.S., Kathryn Flint, M.A., William H. Robb.Macro International, Calverton, Maryland
State Youth Tobacco Survey CoordinatorsPatricia McLean, M.Ed. Arkansas Department of HealthUrsula E. Bauer, Ph.D., M.P.H. Florida Department of HealthFrank Franklin, M.P.H. Georgia Department of Human ResourcesJulia M. Francisco, M.P.H. Kansas Department of Health and EnvironmentEllen S. Jones, M.S., and
Sheila D. Keller, M.S. Mississippi State Department of HealthDennis R. Derenzy, M.P.A. Missouri Department of HealthJudy A. Martin, M.S. Nebraska Department of Health and Human
ServicesDawn M. Berney, M.P.A., and New Jersey Department of Health and Senior
Christine Delnevo, Ph.D., M.P.H. ServicesSally Herndon Malek, M.P.H., and North Carolina Department of Health and
Elizabeth A. Conlisk, Ph.D. Human ServicesJanet M. Love, M.P.H. Oklahoma State Department of HealthCarmen K. Smith South Dakota Department of Human ServicesJoan F. Sartin, M.S. Tennessee Department of HealthCelan J. Alo, M.D., M.P.H., and
Philip P. Huang, M.D., M.P.H. Texas Department of Health

Vol. 49 / No. SS-10 MMWR 1
Youth Tobacco Surveillance —United States, 1998–1999
Office on Smoking and Health,National Center for Chronic Disease Prevention and Health Promotion
American Legacy Foundation, Washington, DCCDC Foundation, Atlanta, Georgia
Macro International, Calverton, MarylandState Youth Tobacco Survey Coordinators
Abstract
Problem/Condition: Tobacco use is the single leading preventable cause of death in theUnited States, accounting for approximately 430,000 deaths each year. The prevalenceof cigarette smoking nationwide among high school students increased during the1990s, peaking in 1996–1997, then began a gradual decline. Approximately 80% oftobacco users initiate use before the age of 18 years. If the trend in early initiation ofcigarette smoking continues, approximately 5 million children aged <18 years who areliving today will die prematurely as adults because they began to smoke cigarettesduring adolescence. The economic liability associated with tobacco use ranges from$50 billion to $73 billion per year in medical expenses alone. Because of these healthand economic consequences, CDC has recommended that states establish andmaintain comprehensive tobacco control programs to reduce tobacco use amongyouth.Reporting Period: February 1998 through December 1999.Description of the System: To assist states in developing and maintaining their state-based comprehensive tobacco prevention and control programs, CDC developed theYouth Tobacco Surveillance and Evaluation System, which includes international,national, and state school-based surveys of middle school and high school students.Two components of this system are discussed — the National Youth Tobacco Surveyand the state Youth Tobacco Surveys. The national survey is representative of studentsin the 50 states and the District of Columbia; 15,061 students in 131 schools completedquestionnaires in 1999. The state surveys were first conducted in 1998, when threestates participated, and in 1999, when 13 states participated (13 states conductedmiddle school surveys and 10 states conducted high school surveys); state sample sizesranged from 452 to 15,478 students. This report summarizes data from the 1999national survey and the 1998 and 1999 state surveys.Results and Interpretation: Findings from the National Youth Tobacco Survey showcurrent tobacco use ranges from 12.8% among middle school students to 34.8% amonghigh school students. Cigarette smoking is the most prevalent form of tobacco used,followed by cigars and smokeless tobacco. Young people have strong cigarette brandpreferences. Almost half of current smokers in both middle school and high schoolreport that they usually smoke Marlboro® cigarettes. Black students are more likely tosmoke Newport® cigarettes than any other brand. Half of current smokers in middleschool and high school report that they want to completely stop smoking. Nearly one

2 MMWR October 13, 2000
fourth of middle school and high school students who have never smoked cigarettesindicate that they are susceptible to initiating smoking in the next year. Environmentaltobacco smoke exposure is very high among both middle school and high schoolstudents. During the week before the survey, approximately 9 out of 10 currentsmokers and half of never smokers were in the same room with someone who wassmoking; 8 out of 10 current smokers and 3 out of 10 never smokers rode in a car withsomeone who was smoking. Six out of 10 current smokers and 3 out of 10 neversmokers live in a home where someone else smokes cigarettes. Approximately 70% ofmiddle school and 60% of high school students who currently smoke and are aged <18years were not asked to show proof of age when they purchased cigarettes.Approximately three fourths of middle school and high school students have seenantismoking commercials; however, 90% report having seen actors smoking ontelevision or in the movies. Approximately 2% of middle school and high school studentswho had never used tobacco would wear or use something with a tobacco companyname or picture on it. This rate increases to approximately 20% for current tobaccousers.Actions Taken: Youth Tobacco Survey data are used by health and education officials toimprove national and state programs to prevent and control youth tobacco use. Manystates also use the data in presentations to their state legislators to demonstrate theneed for increased funding for smoking cessation and prevention programs for youth.
INTRODUCTION
Tobacco use is the single leading preventable cause of death in the United States (1 ),accounting for approximately 430,000 deaths each year (2 ). The prevalence of cigarettesmoking nationwide among high school students increased during the 1990s (3 ), peak-ing in 1996–1997, and then began a gradual decline (4 ). Approximately 80% of tobaccousers initiate use before the age of 18 years (5 ). If the trend in early initiation of cigarettesmoking continues, approximately 5 million children aged <18 years who are living todaywill die prematurely as adults because they began to smoke cigarettes during adoles-cence (2 ). The economic liability associated with tobacco use ranges from $50 billion to$73 billion per year in medical expenses alone (6 ).
CDC recommends that states establish and maintain comprehensive tobacco controlprograms to reduce tobacco use among youth (6 ). Surveillance and evaluation areamong the primary elements of a comprehensive tobacco control program. To assiststates in developing and maintaining their surveillance and evaluation systems, CDCdeveloped the Youth Tobacco Surveillance and Evaluation System, which includes inter-national, national, and state school-based surveys of middle school and high schoolstudents. Two components of this system are the National Youth Tobacco Survey (NYTS)and the state Youth Tobacco Surveys (YTS).
The YTS and NYTS were developed to provide states with the data necessary tosupport the design, implementation, and evaluation of a comprehensive tobacco controlprogram. Many states have data on the prevalence of selected tobacco use behaviorsamong high school students from the Youth Risk Behavior Surveillance System (YRBSS).The YTS supplements the YRBSS by providing more comprehensive data on both middleschool and high school students regarding tobacco use (bidis, cigarettes, cigars, kreteks,pipes, and smokeless tobacco), exposure to environmental tobacco smoke, smokingcessation, school curriculum, minors’ ability to purchase or otherwise obtain tobacco

Vol. 49 / No. SS-10 MMWR 3
products, knowledge and attitudes about tobacco, and familiarity with protobacco andantitobacco media messages. The YTS and YRBSS use identical sampling methodolo-gies and the same wording for questions about tobacco use to enable states to use thehigh school data on tobacco use collected by both surveys.
The NYTS, conducted during the fall of 1999 (7 ), is representative of students in the50 states and the District of Columbia. Funding for the NYTS was provided by the Ameri-can Legacy Foundation (Washington, DC), and the survey was conducted by the CDCFoundation (Atlanta, Georgia). The NYTS will be conducted every other year. State YouthTobacco Surveys were first conducted in 1998, when three states participated, in 1999,when 13 states participated, and in 2000, when 26 states participated. Some statesconduct the YTS annually, whereas others conduct the survey every other year. Thisreport summarizes data from the 1999 NYTS and the 1998 and 1999 state surveys.
METHODS
Sampling
National Youth Tobacco Survey
The 1999 NYTS employed a three-stage cluster sample design to produce a nation-ally representative sample of students in grades 6–12. The first-stage sampling framecontained 1,306 primary sampling units (PSUs) consisting of large counties or groups ofsmaller, adjacent counties. Sixty-six of the 1,306 PSUs were selected from 16 strataformed on the basis of the degree of urbanization and the relative percentage of blackand Hispanic students in the PSU. The PSUs were selected with probability proportionalto weighted school enrollment. At the second sampling stage, 145 schools were selectedwith probability proportional to weighted school enrollment. To enable separate analy-ses of data for black and Hispanic students, schools with substantial numbers of blackand Hispanic students were sampled at higher rates than all other schools through theuse of a weighted measure of size. The third stage of sampling consisted of randomlyselecting approximately five intact classes of a required subject (e.g., English or socialstudies) across grades 6–12 at each participating school. All students in the selectedclasses were eligible to participate in the survey.
A weighting factor was applied to each student record to adjust for nonresponse andfor the varying probabilities of selection, including those resulting from the oversamplingof black and Hispanic students. Numbers of students in other racial and ethnic groupswere too low for meaningful analysis in this report.* The weights were scaled so thata) the weighted count of students was equal to the total sample size, and b) the weightedproportions of students in each grade matched national population proportions. SUDAAN(8 ) was used to compute 95% confidence intervals, which were used to determine differ-ences between subgroups at the p <0.05 level. Differences between prevalence esti-mates were considered statistically significant if the 95% confidence intervals did notoverlap. Only subgroup comparisons that were statistically significant are mentioned inthis report. The NYTS is representative of students in grades 6–12 in public and privateschools in the 50 states and the District of Columbia. For the NYTS, 15,061 questionnaireswere completed in 131 schools. The school response rate was 90.3%, and the studentresponse rate was 93.2%, resulting in an overall response rate of 84.2%.*Estimates are not reported if <30 cases are in the denominator.

4 MMWR October 13, 2000
State Youth Tobacco Surveys
The state YTS employed a two-stage cluster sample design to produce representa-tive samples of students in middle schools (grades 6–8) and high schools (grades 9–12).The first-stage sampling frame included separate lists for middle schools and high schools.In most states, the list consisted of all public schools containing the appropriate grades(i.e., either 6–8 or 9–12). Schools were selected with probability proportional to schoolenrollment size. At the second sampling stage, classes were randomly selected from thelist of classes obtained from each participating school. All students in the selected classeswere eligible to participate in the survey.
Three states participated in the YTS in the spring of 1998 (Florida, Mississippi, andTexas). Thirteen states participated in 1999 — nine states in the spring of 1999(Arkansas, Florida, Georgia, Kansas, Mississippi, Missouri, Oklahoma, Tennessee, andTexas) and four states in the fall of 1999 (Nebraska, New Jersey, North Carolina, andSouth Dakota).
Florida, New Jersey, North Carolina, and Texas conducted separate middle schooland high school surveys for each of their health regions. Oklahoma conducted statewidemiddle school and high school surveys and individual surveys in six counties. Missouri,Nebraska, and South Dakota conducted middle school surveys only. Arkansas and NewJersey included only grades 7 and 8 in their middle school surveys. Mississippiconducted separate surveys of public high schools, private high schools, and publicmiddle schools. The remaining states conducted separate middle school and high schoolsurveys.
Sample sizes ranged from 452 to 15,478. School response rates ranged from 48.0%to 100%; student response rates ranged from 72.9% to 93.5%; and overall responserates ranged from 43.8% to 88.0%. All surveys, except the Georgia and Kansas highschool surveys, had overall response rates of at least 60%; thus, the data were weightedand representative of the respective population (Table 1). Data for Georgia and Kansashigh schools are not included in this report because of low response rates.
Data Collection
Survey procedures were designed to protect students’ privacy by allowing for anony-mous and voluntary participation. Students completed a self-administered question-naire in the classroom, recording their responses on an answer sheet. The survey wasadministered during one class period. The core questionnaire contained 60 questions; tomeet their individual needs, some states added questions. Local parental permissionprocedures were followed before survey administration. The core questionnaire includedquestions about tobacco use (bidis,* cigarettes, cigars, kreteks,† pipes, and smokelesstobacco), exposure to environmental tobacco smoke, smoking cessation, school curricu-lum, minors’ ability to purchase or otherwise obtain tobacco products, knowledge andattitudes about tobacco, and familiarity with protobacco and antitobacco mediamessages.
* Bidis (or beedies) are small brown cigarettes from India consisting of tobacco wrapped ina leaf tied with a thread.
† Kreteks (also called clove cigarettes) are flavored cigarettes containing tobacco and cloveextract. Bidis and kreteks are two emerging forms of tobacco in the United States.

Vol. 49 / No. SS-10 MMWR 5
RESULTS*
Prevalence of Use
Lifetime Use†
Middle school and high school students were asked about their lifetime use of ciga-rettes, cigars, smokeless tobacco, or bidis. Cigarettes were the most prevalent form oftobacco used, followed by cigars, smokeless tobacco, and bidis.
Middle School. Nationally, 29.3% of middle school students had ever smoked ciga-rettes (Figure 1). Black students (34.3%) were significantly more likely than whitestudents (26.6%) to have ever smoked cigarettes (Table 2). Cigars were the second mostprevalent form of tobacco used (15.4%), with males (20.1%) being significantly morelikely than females (10.9%) to have ever smoked cigars. Smokeless tobacco was thethird most prevalent form of tobacco used by middle school students (7.1%), with males(11.0%) being significantly more likely than females (3.3%) to have ever used smokelesstobacco. White students (8.3%) were significantly more likely than black students (4.3%)to have ever used smokeless tobacco. When asked about bidis, 5.4% of middle schoolstudents reported that they had ever smoked these cigarettes. Males (6.7%) were signifi-cantly more likely than females (4.1%) to have ever tried bidis. Black students (6.9%)were significantly more likely than white students to have ever used bidis (3.9%).
Among the 13 states that asked this question, the percentage of middle school stu-dents who had ever smoked cigarettes ranged from 33.4% in Nebraska to 60.2% inArkansas (median: 45.2%) (Table 3). The percentage of students who had ever smokedcigars ranged from 19.0% in South Dakota to 38.6% in Texas (1998) (median: 26.8%). Thepercentage of students who had ever used smokeless tobacco ranged from 8.2% in NewJersey to 27.3% in Arkansas (median:15.2%). Questions on ever use of bidis wereincluded in only the fall 1999 Nebraska and New Jersey surveys; therefore, no stateranges are presented.
High School. Nationally, 63.5% of high school students had ever smoked cigarettes,and 41.6% reported they had tried cigars (Figure 1). Males (51.1%) were significantlymore likely than females (31.9%) to have ever smoked cigars, and white students (45.1%)were significantly more likely than black (35.0%) and Hispanic (36.8%) students to haveever smoked cigars (Table 2). Smokeless tobacco was the third most prevalent form oftobacco used by high school students (18.2%), with males (28.5%) being significantlymore likely than females (7.6%) to have ever used smokeless tobacco. White students(23.4%) were significantly more likely than black (7.4%) and Hispanic (10.7%) students tohave ever used smokeless tobacco. A total of 14.1% of high school students reported thatthey had tried bidis, with males (16.6%) being significantly more likely than females(11.5%) to have ever smoked these cigarettes.
* Unless otherwise noted, the data in this report are for 1999. For the three states thatconducted surveys during 1998 and 1999, the survey year is identified in parentheses. ForMississippi, the type of high school (public or private) also is identified.
† Lifetime use was defined by asking a) Ever tried smoking cigarettes, even one or two puffs?b) Ever tried smoking cigars, cigarillos, or little cigars, even one or two puffs? c) Ever usedchewing tobacco, snuff, or dip, such as Redman, Levi Garrett, Beechnut, Skoal, SkoalBandits, or Copenhagen? and d) Ever tried smoking bidis, even one or two puffs? Questionson ever use of pipes and kreteks were not included in the surveys.

6 MMWR October 13, 2000
Among the eight states that asked this question, the percentage of high school stu-dents who had ever smoked cigarettes ranged from 60.7% in Florida (1999) to 77.2% inMississippi (public schools, 1999) (median: 71.9%) (Table 3). The percentage of studentswho had ever tried cigars ranged from 40.5% in New Jersey to 54.7% in Mississippi(public schools, 1999) (median: 51.2%). The percentage of students who had ever usedsmokeless tobacco ranged from 15.2% in Florida (1999) to 40.7% in Mississippi (privateschools, 1998) (median: 24.3%). Questions on ever use of bidis were included in only thefall 1999 New Jersey survey; therefore, no state ranges are presented.
Current Use
Students were asked if they had used cigarettes, cigars, smokeless tobacco, tobaccoin pipes, bidis, or kreteks on �1 of the 30 days preceding the survey (i.e., current use).
Middle School. Nationally, 12.8% of middle school students were current users of anytobacco product (Figure 2). Among current users, the most prevalent forms oftobacco used were cigarettes (9.2%) and cigars (6.1%), followed by smokeless tobacco(2.7%), bidis (2.5%), tobacco in pipes (2.4%), and kreteks (1.9%). Male students weresignificantly more likely than female students to currently smoke cigars, use smokelesstobacco, or smoke tobacco in pipes (Table 4). Black students (8.9%) were significantlymore likely than white students (4.9%) to smoke cigars.
Among the 13 states that asked this question, the percentage of middle school stu-dents who were current users of any tobacco product ranged from 13.8% in Nebraska to30.6% in Texas (1998) (median: 20.6%) (Table 5). The percentage of those who werecurrent users of cigarettes ranged from 10.0% in Nebraska to 23.4% in Arkansas(median: 15.0%). The percentage of students who were current users of cigars ranged
FIGURE 1. Percentage of middle school and high school students who ever used tobacco,by type of tobacco product — National Youth Tobacco Survey, 1999
Cigarette Cigar Smokeless tobacco Bidi0
20
40
60
80
100
Per
cent
age
Middle SchoolHigh School
29.3
63.5
15.4
41.6
7.1
18.2
5.4
14.1

Vol. 49 / No. SS-10 MMWR 7
from 5.6% in South Dakota to 16.6% in Mississippi (1999) (median: 9.4%). Smokelesstobacco use rates ranged from 3.2% in Nebraska to 12.0% in Arkansas (median: 6.0%).For smoking tobacco in pipes, rates ranged from 1.5% in Missouri to 8.5% in Texas (1998)(median: 3.9%). Questions on current use of bidis and kreteks were included in only thefall 1999 Nebraska and New Jersey surveys; therefore, no state ranges are presented.
High School. Nationally, 34.8% of high school students were current users of anytobacco product (Figure 2). Among current users, the most prevalent forms of tobaccoused were cigarettes (28.5%) and cigars (15.3%), followed by smokeless tobacco (6.6%),kreteks (5.8%), bidis (5.0%), and tobacco in pipes (2.8%). Male students were significantlymore likely than female students to use smokeless tobacco, smoke cigars, smoketobacco in pipes, or smoke bidis (Table 4). White (32.9%) and Hispanic (25.8%) studentswere significantly more likely than black (15.9%) students to smoke cigarettes. Whitestudents (8.7%) also were significantly more likely than black (2.4%) and Hispanic (3.7%)students to use smokeless tobacco.
Among the eight states that asked this question, the percentage of high school stu-dents who were current users of any tobacco product ranged from 32.3% in Florida(1999) to 46.3% in Mississippi (private schools, 1998) (median: 42.0%) (Table 5). Ciga-rette smoking rates ranged from 25.2% in Florida (1999) to 39.0% in Mississippi (privateschools, 1998) (median: 32.7%). Cigar smoking rates ranged from 16.3% in Mississippi(private schools, 1999) to 22.3% in Mississippi (public schools, 1998) (median: 19.7%).Smokeless tobacco use rates ranged from 6.4% in Florida (1999) to 16.6% in Mississippi(private schools, 1998) (median: 9.6%). For smoking tobacco in pipes, rates ranged from4.5% in Florida (1999) to 7.7% in Texas (1998) (median: 5.3%). Questions on the use ofbidis and kreteks were included in only the fall 1999 New Jersey survey; therefore, nostate ranges are presented.
FIGURE 2. Percentage of middle school and high school students who were currentusers of tobacco, by type of tobacco product — National Youth Tobacco Survey, 1999
Any tobacco Cigarette Cigar Smokelesstobacco
Pipe Bidi Kretek0
20
40
60
80
100
Per
cen
tag
e
Middle SchoolHigh School
12.8
34.8
9.2
28.5
6.1
15.3
2.76.6
2.4 2.8 2.5 5.01.9
5.8

8 MMWR October 13, 2000
Ever Daily Use*
Middle School. Nationally, 4.2% of middle school students had ever smoked ciga-rettes daily (Figure 3). White students (4.6%) were significantly more likely than blackstudents (2.7%) to have ever smoked cigarettes daily (Table 6).
Among the 12 states that asked this question, the percentage of middle school stu-dents who had ever smoked cigarettes daily ranged from 5.7% in Nebraska to 14.1% inTexas (1998) (median: 10.6%) (Table 7).
High School. Nationally, 20.1% of high school students had ever smoked cigarettesdaily (Figure 3). White students (24.1%) were significantly more likely than either black(10.4%) or Hispanic students (16.2%) to have ever smoked cigarettes daily (Table 6).
Among the eight states that asked this question, the percentage of high school stu-dents who had ever smoked cigarettes daily ranged from 20.5% in Florida (1999) to28.8% in Mississippi (private schools, 1998) (median: 25.8%) (Table 7).
Number of Cigarettes Smoked Per Day on the Days They Smoked
Middle School. Nationally, 15.4% of current cigarette smokers had smoked �6 ciga-rettes per day on the days they smoked (Figure 3). White students (18.5%) were signifi-cantly more likely than Hispanic students (5.5%) to smoke �6 cigarettes per day on thedays they smoked (Table 6).
*Ever smoking daily was defined as having ever smoked at least one cigarette every day for30 days.
FIGURE 3. Percentage of middle school and high school students who ever smoked dailyand current smokers who smoked �6 cigarettes per day on the days theysmoked — National Youth Tobacco Survey, 1999
Ever smoked daily Smoked 6 cigarettes per dayon the days they smoked
³
0
20
40
60
80
100
Per
cen
tage
Middle SchoolHigh School
4
2015
29

Vol. 49 / No. SS-10 MMWR 9
Among the 13 states that asked this question, the percentage of middle school stu-dents who smoked �6 cigarettes per day on the days they smoked ranged from 11.1% inNorth Carolina to 31.0% in Kansas (median: 16.6%) (Table 7).
High School. Nationally, 29.1% of current cigarette smokers had smoked �6 ciga-rettes per day on the days they smoked (Figure 3). White students (32.0%) were signifi-cantly more likely than black (19.3%) and Hispanic (21.2%) students to smoke �6 cigarettesper day on the days they smoked (Table 6).
Among the eight states that asked this question, the percentage of high school stu-dents who smoked �6 cigarettes per day on the days they smoked ranged from 26.0% inTexas (1999) to 39.7% in Tennessee (median: 32.8%) (Table 7).
Age of Initiation of Tobacco Use*
Cigarettes
Middle School. Nationally, 8.2% of students first smoked a cigarette before the age of11 years (Figure 4 and Table 8).
Among the 12 states that asked this question, the percentage of students who initi-ated cigarette smoking before the age of 11 years ranged from 7.2% in New Jersey to17.5% in Arkansas (median: 11.2%) (Table 9).
*Age of initiation was determined by asking a) How old were you when you smoked a wholecigarette for the first time? b) How old were you when you smoked a cigar, cigarillo, or littlecigar for the first time? and c) How old were you when you used chewing tobacco, snuff, ordip for the first time? Questions on age of initiation were not asked for pipes, bidis, orkreteks.
FIGURE 4. Percentage of middle school and high school students who first used tobaccobefore 11 years of age, by tobacco product — National Youth Tobacco Survey, 1999
Cigarette Cigar Smokeless tobacco0
20
40
60
80
100
Per
cen
tag
e
Middle SchoolHigh School
8 93 4 5 4

10 MMWR October 13, 2000
High School. Nationally, 8.6% of students first smoked a cigarette before the age of 11years (Figure 4). Male students (10.4%) were significantly more likely than female stu-dents (6.8%) to first smoke a cigarette before the age of 11 years. White (9.2%) andHispanic (10.6%) students were significantly more likely than black students (5.3%) tofirst smoke a cigarette before the age of 11 years (Table 8).
Among the seven states that asked this question, the percentage of students who firstsmoked a cigarette before the age of 11 years ranged from 8.8% in New Jersey to 12.5%in Mississippi (public schools, 1998) (median: 10.9%) (Table 9).
Cigars
Middle School. Nationally, 3.1% of students first smoked a cigar before the age of 11years (Figure 4). Males (4.9%) were significantly more likely than females (1.4%) toreport initiating cigar smoking before the age of 11 years (Table 8).
Among the 10 states that asked this question, the percentage of middle school stu-dents who first smoked a cigar before the age of 11 years ranged from 6.4% in Nebraskato 9.3% in Arkansas (median: 7.0%) (Table 9).
High School. Nationally, 4.1% of students first smoked a cigar before the age of 11years (Figure 4). Males (6.5%) were significantly more likely than females (1.6%) to beginsmoking cigars before the age of 11 years (Table 8).
Among the six states that asked this question, the percentage of students who firstsmoked a cigar before the age of 11 years ranged from 4.6% in Oklahoma to 6.9% inTennessee (median: 5.2%) (Table 9).
Smokeless Tobacco
Middle School. Nationally, 4.8% of students reported first using smokeless tobaccobefore the age of 11 years (Figure 4). Males (6.5%) were significantly more likely thanfemales (3.1%) to report initiating smokeless tobacco use before the age of 11 years(Table 8).
Among the 10 states that asked this question, the percentage of students who initi-ated the use of smokeless tobacco before the age of 11 years ranged from 4.0% inNebraska to 12.0% in Arkansas (median: 7.4%) (Table 9).
High School. Nationally, 3.5% of students first used smokeless tobacco before the ageof 11 years (Figure 4). Males (5.2%) were significantly more likely than females (1.8%) toinitiate smokeless tobacco use before the age of 11 years (Table 8).
Among the six states that asked this question, the percentage of students who initi-ated the use of smokeless tobacco before the age of 11 years ranged from 5.7% in NorthCarolina to 10.2% in Tennessee (median: 8.6%) (Table 9).
Established Use of Tobacco Products
Smoked �100 Cigarettes in Lifetime
Middle School. Nationally, 10.1% of ever smokers had smoked �100 cigarettes intheir lifetime (Figure 5). Male students (12.3%) were significantly more likely than femalestudents (7.7%) to have smoked �100 cigarettes in their lifetime; white students (13.7%)were significantly more likely than black (4.0%) and Hispanic (6.2%) students to havesmoked �100 cigarettes in their lifetime (Table 10).

Vol. 49 / No. SS-10 MMWR 11
Among the 11 states that asked this question, the percentage of ever smokers whohad smoked �100 cigarettes in their lifetime ranged from 3.3% in New Jersey to 19.5% inKansas (median: 12.6%) (Table 11).
High School. Nationally, three out of 10 (30.0%) ever smokers had smoked �100cigarettes in their lifetime (Figure 5). White students (37.5%) were significantly morelikely than black (11.2%) and Hispanic (20.1%) students to have smoked �100 cigarettesin their lifetime. Hispanic students were significantly more likely than black students tohave smoked �100 cigarettes in their lifetime (Table 10).
Among the six states that asked this question, the percentage of ever smokers whohad smoked �100 cigarettes in their lifetime ranged from 19.3% in New Jersey to 38.9%in Tennessee (median: 30.8%) (Table 11).
Frequent Use* of Tobacco
Middle School. Nationally, 2.2% of students had frequently smoked cigarettes(Figure 5), and <1% of students were frequent users of cigars, smokeless tobacco, andpipes (Table 10).
Among the 12 states that asked this question, the percentage of students who werefrequent cigarette smokers ranged from 2.2% in New Jersey and South Dakota to 5.4%
*Frequent use was defined as having used a tobacco product on �20 of the 30 days precedingthe survey. The survey included questions on frequent use of cigarettes, cigars, smokelesstobacco, and pipes.
FIGURE 5. Percentage of middle school and high school students who frequently usedtobacco products — National Youth Tobacco Survey, 1999
0
20
40
60
80
100
Per
cen
tag
e
Middle SchoolHigh School
Smoked 100 ³
cigarettes in lifetime
Smoked cigarettes on
days
Smoked cigars on 20 of past ³
30 days
Used smokeless tobacco on 20 of ³
past 30 days
Smoked pipe on 20 of past ³
30 days
10.1
30.0
2.2
13.1
0.4 0.7 0.5 1.5 0.6 0.7

12 MMWR October 13, 2000
in Florida (1998) and Oklahoma (median: 3.8%) (Table 11). The percentage of studentswho were frequent cigar smokers ranged from 0.2% in South Dakota to 1.7% in Florida(1999) and Mississippi (1998) (median: 1.0%). The percentage of students who werefrequent users of smokeless tobacco ranged from 0.6% in Nebraska to 2.2% inMississippi (1998) (median: 1.1%). The percentage of those who frequently smokedtobacco in pipes ranged from 0.3% in Georgia, Missouri, North Carolina, and SouthDakota to 1.8% in Arkansas (median: 0.7%).
High School. Nationally, 13.1% of students had frequently smoked cigarettes (Figure5), and <2% of students were frequent users of cigars, smokeless tobacco, and pipes(Table 10). Frequent cigarette smoking was significantly higher among white students(16.4%) than among black (5.1%) and Hispanic students (8.8%) (Table 10).
Among the seven states that asked this question, the percentage of students whofrequently smoked cigarettes ranged from 12.5% in Florida (1999) to 21.1% in Tennessee(median: 14.3%) (Table 11). The percentage of students who frequently smoked cigarsranged from 1.6% in Tennessee to 2.7% in Mississippi (public schools, 1999) (median:2.0%). The percentage of students who frequently used smokeless tobacco ranged from1.4% in New Jersey to 7.9% in Mississippi (private schools, 1998) (median: 3.2%). Thepercentage of students who frequently smoked tobacco in pipes ranged from 0.3% inTennessee to 1.5% in Florida (1999) (median: 0.9%).
Brand of Cigarettes Usually Smoked
Current cigarette smokers were asked to identify the brand of cigarettes they usuallysmoked. Brand preferences were similar among current smokers in middle and highschools.
Middle School. Nationally, 42.7% of current smokers in middle school identifiedMarlboro® as the most popular brand of cigarettes, followed by Newport® (25.3%) andCamel® (6.9%) (Figure 6). Marlboro® was the most popular brand among white (48.0%)and Hispanic (61.1%) students, whereas Newport® was the favored brand among blackstudents (62.4%) (Table 12).
Among the 12 states that asked this question, the percentage of current smokers whopreferred Marlboro® ranged from 27.8% in New Jersey to 62.1% in Texas (1998)(median: 48.5%) (Table 13).
High School. Nationally, 53.6% of current smokers in high school identified Marlboro®
as the most popular brand of cigarettes, followed by Newport® (18.8%) and Camel®
(10.1%) (Figure 6). Marlboro® was the most popular brand among white (59.9%) andHispanic (52.9%) students, whereas Newport® was the favored brand among blackstudents (59.4%) (Table 12).
Among the eight states that asked this question, the percentage of students whopreferred Marlboro® ranged from 34.2% in New Jersey to 82.1% in Mississippi (privateschools, 1998) (median: 62.2%) (Table 13).
Smoking Intentions and Susceptibility
Smoking Intentions Among Never Smokers
Students were asked three questions to assess their smoking intentions: Do you thinkyou will try a cigarette soon? Do you think you will smoke a cigarette anytime in the nextyear? If one of your best friends offered you a cigarette, would you smoke it? Nine out of

Vol. 49 / No. SS-10 MMWR 13
10 middle and high school students who had never smoked said they would not try acigarette soon.
Middle School. Nationally, 96.2% of students who had never smoked cigarettesresponded that they would not try a cigarette soon; 85.3% of students responded thatthey would definitely not smoke in the next year; and 84.2% of students said they woulddefinitely not smoke if a best friend offered them a cigarette (Table 14).
Among the 13 states that asked this question, the percentage of students who saidthey would not try a cigarette soon ranged from 81.9% in Texas (1998) to 95.9% inOklahoma (median: 92.5%) (Table 15). The percentage of students who would definitelynot smoke in the next year ranged from 74.2% in Texas (1998) to 83.9% in North Carolina(median: 79.8%). The percentage of those who would definitely not smoke if a best friendoffered them a cigarette ranged from 74.2% in Texas (1998) to 84.3% in North Carolina(median: 80.2%).
High School. Nationally, 97.6% of students who had never smoked cigarettesresponded that they would not try a cigarette soon; 82.0% of students responded thatthey would definitely not smoke in the next year; and 84.8% of students said they woulddefinitely not smoke if a best friend offered them a cigarette (Table 14).
Among the eight states that asked this question, the percentage of students who saidthey would not try a cigarette soon ranged from 78.7% in Texas (1998) to 96.9% inTennessee (median: 94.4%) (Table 15). The percentage of students who would definitelynot smoke in the next year ranged from 72.5% in Mississippi (private schools, 1998) to85.6% in Oklahoma (median: 81.0%). The percentage of those who would definitely notsmoke if a best friend offered them a cigarette ranged from 79.4% in Texas (1998) to86.4% in Oklahoma (median: 83.9%).
FIGURE 6. Usual brand of cigarette smoked in the 30 days preceding the survey bycurrent smokers in middle school and high school — National Youth Tobacco Survey,1999
Marlboro® Newport® Camel® Other No usual brand0
20
40
60
80
100
Per
cen
tag
e
Middle SchoolHigh School42.7
53.6
25.3
18.8
6.910.1
12.89.2
12.38.2

14 MMWR October 13, 2000
Susceptibility* Among Never Smokers
Never smokers were classified as not being susceptible to smoking cigarettes if theyresponded that a) they would not smoke a cigarette soon; AND b) they would definitelynot smoke in the next year; AND c) they would definitely not smoke if their best friendoffered them a cigarette. All other students were classified as being susceptible to initiat-ing cigarette smoking in the next year.
Middle School. Nationally, 22.9% of students who had never smoked cigarettes wereclassified as being susceptible to initiating cigarette smoking in the next year (Table 14).
Among the 12 states that asked this question, the percentage of students who weresusceptible to initiating cigarette smoking ranged from 24.8% in Texas (1999) to 39.2% inTexas (1998) (median: 29.8%) (Table 15).
High School. Nationally, 23.7% of students who had never smoked cigarettes wereclassified as being susceptible to initiating cigarette smoking in the next year (Table 14).
Among the eight states that asked this question, the percentage of students whowere susceptible to initiating cigarette smoking ranged from 18.1% in Texas (1999) to33.0% in Texas (1998) (median: 25.8%) (Table 15).
Knowledge and Attitudes
Peer Group Use of Tobacco
One or More Best Friends Smoke Cigarettes
Middle School. Nationally, current cigarette smokers (89.9%) were significantly morelikely than students who had never smoked cigarettes (19.7%) to report that �1 of theirbest friends smoked cigarettes (Figure 7 and Table 16).
Among the 12 states that asked this question, the percentage of never smokers whoreported that �1 of their best friends smoked cigarettes ranged from 17.9% in Nebraskato 55.9% in Arkansas (median: 25.0%). The percentage of current smokers who reportedthat �1 of their best friends smoked cigarettes ranged from 83.0% in Georgia andTennessee to 94.4% in Florida (1999) (median: 89.5%) (Table 17).
High School. Nationally, current cigarette smokers (93.7%) were significantly morelikely than students who had never smoked cigarettes (38.3%) to report that �1 of theirbest friends smoked cigarettes (Figure 7). White (94.7%) and Hispanic (95.3%) currentsmokers were significantly more likely than black current smokers (83.2%) to report that�1 of their best friends smoked cigarettes (Table 16).
Among the seven states that asked this question, the percentage of never smokerswho reported that �1 of their best friends smoked cigarettes ranged from 28.2% inFlorida (1998) to 59.8% in Tennessee (median: 41.7%). The percentage of current smok-ers who reported that �1 of their best friends smoked cigarettes ranged from 88.9% inFlorida (1998) to 96.3% in Tennessee (median: 92.4%) (Table 17).
One or More Best Friends Use Smokeless Tobacco
Middle School. Nationally, current cigarette smokers (43.3%) were significantly morelikely than students who had never smoked (9.7%) to report that �1 of their best friendsused smokeless tobacco (Figure 7). Among current smokers, male students (48.9%)
*This definition for susceptibility was developed by Pierce and colleagues (9 ).

Vol. 49 / No. SS-10 MMWR 15
were significantly more likely than female students (36.4%) to report that �1 of their bestfriends used smokeless tobacco, and white students (50.5%) were significantly morelikely than black (26.8%) and Hispanic (38.0%) students to report that at least one of theirbest friends used smokeless tobacco (Table 16).
Among the 10 states that asked this question, the percentage of never smokers whoreported that �1 of their best friends used smokeless tobacco ranged from 6.2% inFlorida (1999) to 36.3% in Arkansas (median: 13.4%). The percentage of current smokerswho reported that �1 of their best friends used smokeless tobacco ranged from 32.5% inMissouri to 57.9% in Oklahoma (median: 41.9%) (Table 17).
High School. Nationally, current cigarette smokers (38.2%) were significantly morelikely than students who had never smoked (17.6%) to report that �1 of their best friendsused smokeless tobacco (Figure 7). Among never smokers, male students (21.4%) weresignificantly more likely than female students (14.2%) to report that �1 of their bestfriends used smokeless tobacco. Among current smokers, male students (49.1%) weresignificantly more likely than female students (24.6%) to report that �1 of their bestfriends used smokeless tobacco, and white students (43.7%) were significantly morelikely than black students (18.0%) to report that at least one of their best friends usedsmokeless tobacco (Table 16).
Among the five states that asked this question, the percentage of never smokers whoreported that �1 of their best friends used smokeless tobacco ranged from 10.3% inFlorida (1998) to 41.9% in Tennessee (median: 25.3%). The percentage of current smok-ers who reported that �1 of their best friends used smokeless tobacco ranged from28.4% in Florida (1998) to 61.8% in Tennessee (median: 46.9%) (Table 17).
FIGURE 7. Percentage of middle school and high school students with peers who usetobacco, by smoking status — National Youth Tobacco Survey, 1999
Never smokers Current smokers Never smokers Current smokers0
20
40
60
80
100
Per
cen
tag
e
Middle SchoolHigh School
³1 best friends smoke cigarettes
³1 best friends usesmokeless tobacco
19.7
38.3
89.993.7
9.7
17.6
38.243.3
16 MMWR October 13, 2000
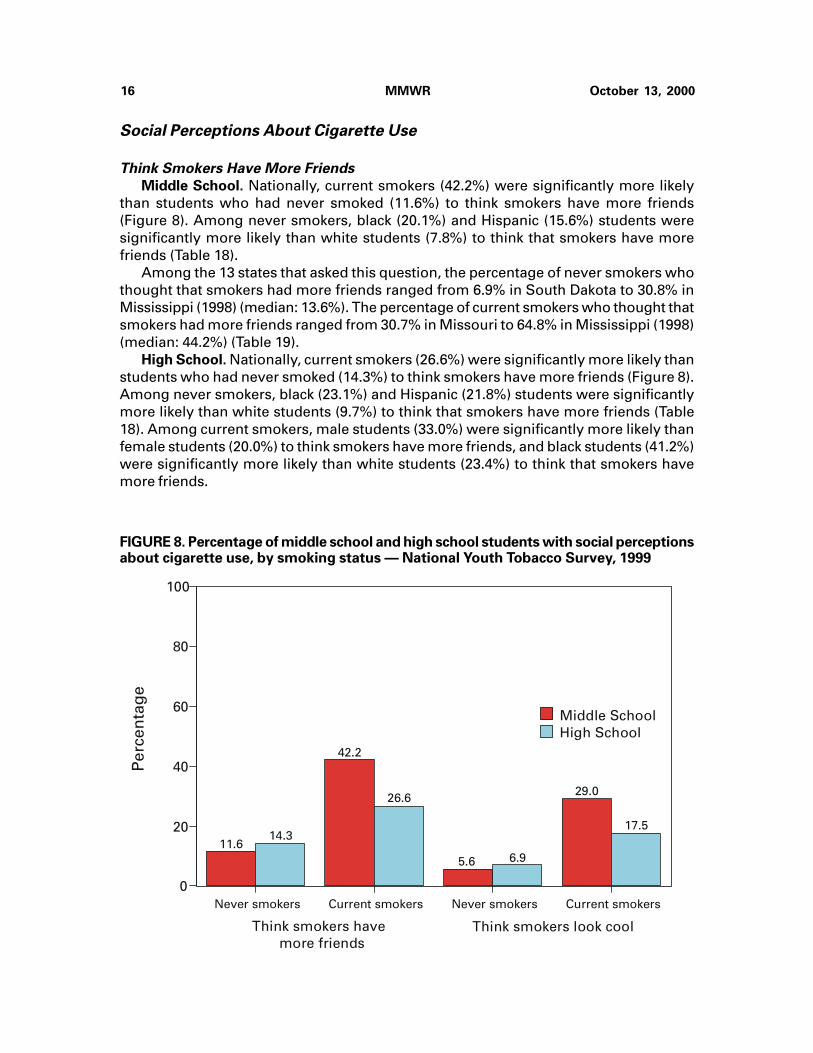
Social Perceptions About Cigarette Use
Think Smokers Have More Friends
Middle School. Nationally, current smokers (42.2%) were significantly more likelythan students who had never smoked (11.6%) to think smokers have more friends(Figure 8). Among never smokers, black (20.1%) and Hispanic (15.6%) students weresignificantly more likely than white students (7.8%) to think that smokers have morefriends (Table 18).
Among the 13 states that asked this question, the percentage of never smokers whothought that smokers had more friends ranged from 6.9% in South Dakota to 30.8% inMississippi (1998) (median: 13.6%). The percentage of current smokers who thought thatsmokers had more friends ranged from 30.7% in Missouri to 64.8% in Mississippi (1998)(median: 44.2%) (Table 19).
High School. Nationally, current smokers (26.6%) were significantly more likely thanstudents who had never smoked (14.3%) to think smokers have more friends (Figure 8).Among never smokers, black (23.1%) and Hispanic (21.8%) students were significantlymore likely than white students (9.7%) to think that smokers have more friends (Table18). Among current smokers, male students (33.0%) were significantly more likely thanfemale students (20.0%) to think smokers have more friends, and black students (41.2%)were significantly more likely than white students (23.4%) to think that smokers havemore friends.
FIGURE 8. Percentage of middle school and high school students with social perceptionsabout cigarette use, by smoking status — National Youth Tobacco Survey, 1999
Never smokers Current smokers Never smokers Current smokers0
20
40
60
80
100
Per
cen
tag
e
Middle SchoolHigh School
Think smokers havemore friends
Think smokers look cool
11.614.3
42.2
26.6
5.6 6.9
29.0
17.5

Vol. 49 / No. SS-10 MMWR 17
Among the eight states that asked this question, the percentage of never smokerswho thought that smokers had more friends ranged from 9.4% in Arkansas to 32.7% inMississippi (public schools, 1998) (median: 19.2%). The percentage of current smokerswho thought that smokers had more friends ranged from 22.9% in Oklahoma to 54.5% inTexas (1998) (median: 34.8%) (Table 19).
Think Smokers Look Cool
Middle School. Nationally, current smokers (29.0%) were significantly more likelythan never smokers (5.6%) to think smokers look cool (Figure 8). Among never smokers,black students (8.4%) were significantly more likely than white students (4.7%) to thinksmokers look cool (Table 18).
Among the 12 states that asked this question, the percentage of never smokers whothought smokers looked cool ranged from 4.6% in Nebraska to 16.3% in Mississippi(1998) (median: 6.9%). Among current smokers, rates ranged from 26.7% in Kansas to56.4% in Texas (1998) (median: 34.8%) (Table 19).
High School. Nationally, current smokers (17.5%) were significantly more likely thannever smokers (6.9%) to think smokers look cool (Figure 8). Among never smokers, malestudents (8.6%) were significantly more likely than female students (5.1%) to think smok-ers look cool. This difference by sex also was evident among current smokers, with malestudents (22.3%) being significantly more likely than female students (12.4%) to thinksmokers look cool (Table 18).
Among the eight states that asked this question, the percentage of never smokerswho thought smokers looked cool ranged from 4.2% in Oklahoma to 14.1% in NewJersey (median: 7.7%). Among current smokers, rates ranged from 16.4% in Oklahomato 29.1% in New Jersey (median: 26.1%) (Table 19).
Perception of Health Consequences of Smoking
Think Cigarettes Are Addictive
Students were asked this question: Can people get addicted to using tobacco just likethey can get addicted to using cocaine or heroine? Approximately nine out of 10 middleand high school students nationwide said they thought cigarettes were addictive(Figures 9 and 10). This trend was evident among current cigarette smokers andstudents who had never smoked.
Middle School. Nationally, among students who had never smoked cigarettes, femalestudents (93.8%) were significantly more likely than male students (88.7%) to think ciga-rettes are addictive; and white students (94.5%) were significantly more likely than black(83.9%) or Hispanic (87.3%) students to think cigarettes are addictive. Among currentsmokers, female students (92.3%) were significantly more likely than male students(83.5%) to think cigarettes are addictive (Table 20).
Among the 12 states that asked this question, the percentage of never smokers whothought cigarettes were addictive ranged from 89.4% in Nebraska to 95.1% in Texas(1998) (median: 92.3%). Among current smokers, rates ranged from 83.0% in Florida(1999) to 93.7% in South Dakota (median: 88.1%) (Table 21).
High School. Nationally, among students who had never smoked cigarettes, whitestudents (95.9%) were significantly more likely than Hispanic students (89.3%) to thinkcigarettes are addictive. Among current smokers, female students (94.6%) were signifi-cantly more likely than male students (89.1%) to think cigarettes are addictive (Table 20).

18 MMWR October 13, 2000
FIGURE 9. Perception of health consequences of smoking among middle schoolstudents — National Youth Tobacco Survey, 1999
FIGURE 10. Perception of health consequences of smoking among high schoolstudents — National Youth Tobacco Survey, 1999
0
20
40
60
80
100
Per
cent
age Never Smoker
Current Smoker
Think cigarettes
are addictive
Think it isnot safeto smoke1-2 yearsthen quit
Think persons
have risk if they smoke³1 packsper day
Talked to doctorabout
dangers of tobacco use
Talked to dentistabout
dangers of tobacco use
91.387.6
94.6
71.8
90.4
84.5
30.134.1
25.4 23.6
0
20
40
60
80
100
Per
cen
tag
e
Never SmokerCurrent Smoker
Think cigarettes
are addictive
Think it isnot safeto smoke1-2 yearsthen quit
Think persons
have risk if they smoke³1 packsper day
Talked to doctorabout
dangers of tobacco use
Talked to dentistabout
dangers of tobacco use
92.3 91.896.2
76.8
93.0 92.6
26.130.0
16.319.4

Vol. 49 / No. SS-10 MMWR 19
Among the seven states that asked this question, the percentage of never smokerswho thought cigarettes were addictive ranged from 87.8% in Florida (1999) to 98.3% inMississippi (private schools, 1999) (median: 94.0%). Among current smokers, ratesranged from 83.4% in Arkansas to 93.9% in Mississippi (private schools, 1999) (median:90.4%) (Table 21).
Think It Is Not Safe to Smoke for 1–2 Years and Then Quit
Middle School. Nationally, students who had never smoked cigarettes (94.6%) weresignificantly more likely than current smokers (71.8%) to think it is not safe to smoke for1–2 years and then quit (Figures 9 and 10). Among never smokers, white students (95.7%)were significantly more likely than Hispanic students (92.7%) to think it is not safe tosmoke for 1–2 years and then quit (Table 20).
Among the 11 states that asked this question, the percentage of never smokers whothought it was not safe to smoke for 1–2 years and then quit ranged from 90.1% inArkansas to 96.7% in Georgia and Nebraska (median: 95.9%). Among current smokers,rates ranged from 64.0% in New Jersey to 78.9% in Georgia (median: 71.1%) (Table 21).
High School. Nationally, students who had never smoked cigarettes (96.2%) weresignificantly more likely than current smokers (76.8%) to think it is not safe to smoke for1–2 years and then quit (Figures 9 and 10). Among never smokers, white middle students(97.4%) were significantly more likely than Hispanic students (92.3%) to think it is not safeto smoke for 1–2 years and then quit. Among current smokers, female students (84.8%)were significantly more likely than male students (69.3%) to think it is not safe to smokefor 1–2 years and then quit (Table 20).
Among the seven states that asked this question, the percentage of never smokerswho thought it was not safe to smoke for 1–2 years and then quit ranged from 89.9% inNew Jersey to 97.2% in Oklahoma (median: 94.9%). Among current smokers, ratesranged from 64.9% in New Jersey to 80.6% in Oklahoma (median: 72.3%) (Table 21).
Think Persons Have Risk If They Smoke �1 Packs of Cigarettes per Day
Approximately nine out of 10 middle and high school students nationwide think per-sons who smoke �1 packs of cigarettes per day are at an increased health risk (Figures 9and 10). This trend is evident among current cigarette smokers and students who havenever smoked.
Middle School. Nationally, among students who had never smoked cigarettes, whitestudents (94.9%) were significantly more likely than black (78.8%) or Hispanic (87.6%)students to think persons who smoke �1 packs of cigarettes per day are at an increasedhealth risk. Hispanic students who had never smoked cigarettes were also significantlymore likely than black students to think persons who smoke �1 packs of cigarettes perday are at an increased health risk (Table 20).
Among the 12 states that asked this question, the percentage of never smokers whothought persons who smoked �1 packs of cigarettes per day were at an increased healthrisk ranged from 87.8% in Nebraska to 94.8% in Missouri (median: 90.5%). Amongcurrent smokers, rates ranged from 82.7% in Mississippi (1998) to 93.5% in Missouri(median: 85.8%) (Table 21).
High School. Nationally, among students who had never smoked cigarettes, whitestudents (96.8%) were significantly more likely than black (84.8%) or Hispanic (89.5%)students to think persons who smoke �1 packs of cigarettes per day are at an increasedhealth risk. Among current smokers, female students (95.3%) were significantly more

20 MMWR October 13, 2000
likely than male students (90.0%) to think persons who smoke �1 packs of cigarettes perday are at an increased health risk. In addition, white (94.8%) and Hispanic (93.2%)current smokers were significantly more likely than black current smokers (79.8%) tothink persons who smoke �1 packs of cigarettes per day are at an increased health risk(Table 20).
Among the seven states that asked this question, the percentage of never smokerswho thought persons who smoked �1 packs of cigarettes per day were at an increasedhealth risk ranged from 88.7% in Florida to 96.6% in Mississippi (private schools, 1998)(median: 93.1%). Among current smokers, rates ranged from 88.5% in Arkansas to 94.4%in Mississippi (private schools, 1998) (median: 91.1%) (Table 21).
Talked to Doctor About Danger of Tobacco Use
Approximately three out of 10 middle and high school students nationwide havetalked to a doctor about the danger of tobacco use (Figures 9 and 10). This trend isevident among current cigarette smokers and students who have never smoked.
Middle School. Nationally, among students who had never smoked cigarettes, black(37.2%) and Hispanic (39.0%) students were significantly more likely than white students(26.3%) to have talked to a doctor about the danger of tobacco use (Table 20).
Among the 11 states that asked this question, the percentage of never smokers whohad talked to a doctor about the danger of tobacco use ranged from 18.6% in Oklahomato 32.0% in Georgia (median: 20.3%). Among current smokers, rates ranged from 21.5%in Florida (1999) to 35.7% in Tennessee (median: 27.4%) (Table 21).
High School. Nationally, among students who had never smoked cigarettes, black(32.8%) and Hispanic (34.5%) students were significantly more likely than white students(23.1%) to have talked to a doctor about the danger of tobacco use (Table 20).
Among the six states that asked this question, the percentage of never smokers whohad talked to a doctor about the danger of tobacco use ranged from 11.8% in Oklahomato 28.8% in North Carolina (median: 15.1%). Among current smokers, rates ranged from23.8% in Oklahoma to 31.0% in Texas (1998) (median: 25.1%) (Table 21).
Talked to Dentist About Danger of Tobacco Use
Approximately two out of 10 middle and high school students had talked to a dentistabout the danger of tobacco use (Figures 9 and 10). This trend was evident amongcurrent cigarette smokers and students who had never smoked.
Middle School. Nationally, among never smokers, black (36.4%) and Hispanic (36.5%)students were significantly more likely than white students (20.3%) to have talked to adentist about the danger of tobacco use. Among current smokers, black students (36.9%)were significantly more likely than white students (18.0%) to have talked to a dentistabout the danger of tobacco use (Table 20).
Among the 11 states that asked this question, the percentage of never smokers whohad talked to a dentist about the danger of tobacco use ranged from 13.3% in Kansas to28.9% in Georgia (median: 19.6%). Among current smokers, rates ranged from 11.3% inArkansas to 30.7% in Tennessee (median: 18.4%) (Table 21).
High School. Nationally, among never smokers, black (27.6%) and Hispanic (24.0%)students were significantly more likely than white students (11.5%) to have talked to adentist about the danger of tobacco use. (Table 20).
Among the six states that asked this question, the percentage of never smokers whohad talked to a dentist about the danger of tobacco use ranged from 9.3% in Arkansas to

Vol. 49 / No. SS-10 MMWR 21
25.2% in Texas (1999) (median: 12.3%). Among current smokers, rates ranged from16.9% in Florida (1999) to 22.2% in North Carolina (median: 19.0%) (Table 21).
Access and Enforcement
How Smokers Usually Got Cigarettes
Middle School. Nationally, current cigarette smokers aged <18 years usually got theircigarettes by borrowing them from someone (24.9%) or having someone else buy ciga-rettes for them (21.8%) (Figure 11). Approximately 10% of smokers in middle schoolreported they usually stole their cigarettes. This pattern was consistent across all sexand race/ethnicity groups (Table 22).
Among the 13 states that asked this question, the percentage of smokers who bor-rowed cigarettes ranged from 13.5% in Florida (1999) to 40.0% in New Jersey (median:23.7%). The percentage of smokers who had someone else buy cigarettes for themranged from 16.9% in North Carolina to 35.3% in Arkansas (median: 22.5%). The percent-age of smokers who stole their cigarettes ranged from 3.3% in New Jersey to 19.4% inKansas (median: 10.4%) (Table 23).
High School. Nationally, current cigarette smokers aged <18 years usually got theircigarettes by having someone else buy them for them (28.6%), followed by buying theircigarettes in a store (25.6%) or borrowing them from someone (23.3%) (Figure 11). Only2.4% of smokers in high school reported they usually stole their cigarettes. This pattern
FIGURE 11. How current smokers aged <18 years in middle school and high schoolusually obtained cigarettes — National Youth Tobacco Survey, 1999
Bought in store
Bought from
vendingmachine
Someoneelse
boughtfor them
0
20
40
60
80
100
Per
cen
tag
e
Middle SchoolHigh School
Borrowedthem from
someone
Stolethem
Got them some
other way
6.7
25.6
2.7 0.7
21.8
28.624.9 23.3
11.4
2.4
9.5 9.1
23.0
10.3
Person aged 18 ³
yearsgave them
to me

22 MMWR October 13, 2000
varied across sex and race/ethnicity groups. Male smokers were more likely to buy theircigarettes in a store (31.7%); female smokers were more likely to have someone elsebuy their cigarettes (32.0%). White smokers were more likely to have someone else buytheir cigarettes (31.4%), whereas black (29.9%) and Hispanic (29.4%) smokers weremore likely to buy their cigarettes in a store (Table 22).
Among the eight states that asked this question, the percentage of smokers whousually borrowed cigarettes ranged from 15.5% in Florida (1999) to 27.0% in New Jersey(median: 21.8%). The percentage of smokers who usually had someone else buy themranged from 21.0% in Mississippi (public schools, 1998) to 37.2% in Mississippi (publicschools, 1999) (median: 25.8%). The percentage of smokers who usually purchased theircigarettes in a store ranged from 19.1% in North Carolina to 47.1% in Mississippi (privateschools, 1998) (median: 28.7%) (Table 23).
Place Smokers Bought Last Pack of Cigarettes
Middle School. Nationally, approximately half of current cigarette smokers aged <18years bought their last pack of cigarettes at a gas station (46.6%), followed by a conve-nience store (19.3%), grocery store (12.3%), and vending machine (11.6%) (Figure 12).This pattern held for all sex and race/ethnicity groups (Table 24).
Among the eight states that asked this question, the percentage of current smokerswho purchased their last pack of cigarettes at a gas station ranged from 33.1% inOklahoma to 57.7% in Nebraska (median: 42.6%) (Table 25).
FIGURE 12. Where current smokers aged <18 years in middle school and high schoolbought their last pack of cigarettes — National Youth Tobacco Survey, 1999
0
20
40
60
80
100
Per
cent
age
Middle SchoolHigh School
Convenience store
Gas station
Discount store
Grocery store
Drug store
Vending machine
Restaurant
46.649.7
19.3
29.5
3.1 2.3
12.3 12.0
3.2 2.7
11.6
2.5 3.91.2

Vol. 49 / No. SS-10 MMWR 23
High School. Nationally, approximately half of current cigarette smokers aged <18years bought their last pack of cigarettes at a gas station (49.7%), followed by a conve-nience store (29.5%), grocery store (12.0%), and vending machine (2.5%) (Figure 12).This pattern held for all sex and race/ethnicity groups except black smokers; 38.1% ofthem bought their last pack of cigarettes at a convenience store (Table 24).
Among the six states that asked this question, the percentage of current smokerswho purchased their last pack of cigarettes at a gas station ranged from 39.2% inOklahoma to 61.7% in Mississippi (private schools, 1999) (median: 48.6%) (Table 25).
How Smokers Usually Got Cigars
Middle School. Nationally, current cigar smokers aged <18 years usually got theircigars by borrowing them from someone (26.6%), having someone else buy cigars forthem (18.6%), or stealing cigars (12.8%) (Figure 13). This pattern was consistent formale, female, and white cigar smokers (Table 26). Black smokers were most likely tohave someone else buy their cigars (30.7%), and Hispanic smokers were most likely toget their cigars some other way (29.1%).
Among the 10 states that asked this question, the percentage of cigar smokers whoborrowed cigars ranged from 13.2% in Georgia to 34.6% in Kansas (median: 24.4%)(Table 27).
High School. Nationally, current cigar smokers aged <18 years usually got their cigarsby buying them in a store (25.0%), borrowing them from someone (24.6%), or having
FIGURE 13. How current cigar smokers aged <18 years in middle school and high schoolusually obtained cigars — National Youth Tobacco Survey, 1999
0
20
40
60
80
100
Per
cen
tag
e
Middle SchoolHigh School
Bought in store
Someoneelse
boughtfor them
Borrowedthem from someone
Stolethem
Person aged 18 ³
yearsgave them
to me
Got them some
other way
9.8
25.0
18.6 17.0
26.6 24.6
12.8
4.8
13.3 14.618.9
13.9

24 MMWR October 13, 2000
someone else buy them (17.0%) (Figure 13). This pattern was consistent across sex andrace/ethnicity groups (Table 26).
Among the seven states that asked this question, the percentage of cigar smokerswho usually got their cigars by buying them in a store ranged from 18.0% in NorthCarolina to 38.4% in Mississippi (private schools, 1998) (median: 27.2%) (Table 27).
How Students Usually Got Smokeless Tobacco
Middle School. Nationally, smokeless tobacco users aged <18 years usually got theirsmokeless tobacco by borrowing it from someone (24.2%), followed by having someoneelse buy it for them (18.1%) or getting it from a person aged �18 years (17.4%) (Figure 14).Approximately 10% of smokeless tobacco users usually stole their smokelesstobacco. This pattern was consistent across all sex and race/ethnicity groups exceptblack students, who were most likely to get their smokeless tobacco from someone aged�18 years (29.2%) (Table 28).
Among the 10 states that asked this question, the percentage of smokeless tobaccousers who usually borrowed smokeless tobacco from someone ranged from 17.7% inFlorida (1999) to 40.0% in Arkansas and South Dakota (median: 27.4%) (Table 29).
High School. Nationally, smokeless tobacco users aged <18 years usually got theirsmokeless tobacco by buying it in a store (29.9%), followed by borrowing it from some-one else (24.1%) or having someone else buy it for them (19.4%) (Figure 14). Male(31.3%), white (30.5%), and Hispanic (31.9%) high school users of smokeless tobaccowere most likely to buy their smokeless tobacco, whereas female (26.0%) and black
FIGURE 14. How current smokeless tobacco users aged <18 years in middle school andhigh school usually obtained smokeless tobacco — National Youth Tobacco Survey,1999
0
20
40
60
80
100
Per
cen
tag
e
Middle SchoolHigh School
Bought in store
Someoneelse bought
for them
Borrowedthem from someone
Stolethem
Person aged 18 ³
yearsgave them
to me
Got them some
other way
5.6
29.9
18.1 19.424.2 24.1
9.56.1
17.4
10.8
25.1
9.6

Vol. 49 / No. SS-10 MMWR 25
(33.2%) high school students were most likely to have a person aged �18 years give it tothem (Table 28).
Among the seven states that asked this question, the percentage of smokelesstobacco users who bought their smokeless tobacco in a store ranged from 21.8% in NorthCarolina to 51.3% in Mississippi (private schools, 1998) (median: 34.0%) (Table 29).
Age and Access
Proof of Age Not Required to Purchase Cigarettes
Middle School. Nationally, 72.2% of current cigarette smokers were not asked toshow proof of age when purchasing cigarettes (Figure 15 and Table 30).
Among the 11 states that asked this question, the percentage of current smokers whowere not asked to show proof of age when purchasing cigarettes ranged from 66.9% inMississippi (1999) to 88.7% in Missouri (median: 75.2%) (Table 31).
High School. Nationally, 59.3% of current cigarette smokers were not asked to showproof of age when purchasing cigarettes (Figure 15 and Table 30).
Among the six states that asked this question, the percentage of current smokerswho were not asked to show proof of age when purchasing cigarettes ranged from45.6% in Mississippi (private schools, 1999) to 67.1% in New Jersey and Texas (1999)(median: 62.5%) (Table 31).
FIGURE 15. Percentage of current smokers aged <18 years in middle school andhigh school who purchased cigarettes in a store and were not asked to show proofof age or who were not refused purchase because of their age — National Youth TobaccoSurvey, 1999
0
20
40
60
80
100
Per
cen
tag
e
Middle SchoolHigh School
Were not refused purchasebecause of their age
Were not asked to show proof of age when purchasing
cigarettes
72.2
59.3
66.2 65.3

26 MMWR October 13, 2000
Not Refused Purchase Because of Age
Middle School. Nationally, 66.2% of current cigarette smokers aged <18 years werenot refused purchase of cigarettes because of their age (Figure 15 and Table 30).
Among the 10 states that asked this question, the percentage of smokers who werenot refused purchase of cigarettes because of their age ranged from 61.4% in Texas(1999) to 79.6% in South Dakota (median: 75.7%) (Table 31).
High School. Nationally, 65.3% of current cigarette smokers aged <18 years were notrefused purchase of cigarettes because of their age (Figure 15 and Table 30).
Among the seven states that asked this question, the percentage of smokers whowere not refused purchase of cigarettes because of their age ranged from 51.4% inMississippi (private schools, 1999) to 67.0% in Texas (1999) (median: 62.3%) (Table 31).
Media and Advertising
Exposure to Media and Advertising Regarding Tobacco
Saw Antismoking Commercials on Television or Heard Them on the Radio
Middle School. Nationally, 75.2% of students saw antismoking commercials on televi-sion or heard antismoking commercials on the radio (Figure 16). White students (77.6%)were significantly more likely than Hispanic students (71.2%) to see or hear such com-mercials (Table 32).
FIGURE 16. Percentage of middle school and high school students who were influencedby media and advertising regarding tobacco — National Youth Tobacco Survey, 1999
0
20
40
60
80
100
Per
cen
tag
e
Middle SchoolHigh School
Saw antismoking commercials
on TV or heard on radio
Saw actors smoking on
TV or in movies
Saw athletessmoking on
TV
Saw ads fortobacco
products on the Internet
75.280.0
87.291.7
19.8 17.7
31.826.8

Vol. 49 / No. SS-10 MMWR 27
Among the nine states that asked this question, the percentage of students who sawantismoking commercials on television or heard them on the radio ranged from 69.7% inFlorida (1998) to 85.1% in Florida (1999) (median: 77.7%) (Table 33).
High School. Nationally, 80.0% of students saw antismoking commercials on tele-vision or heard antismoking commercials on the radio (Figure 16). White students (81.9%)were significantly more likely than black students (72.9%) to see or hear such commer-cials (Table 32).
Among the five states that asked this question, the percentage of students who sawantismoking commercials on television or heard them on the radio ranged from 69.7% inFlorida (1998) to 86.9% in Florida (1999) (median: 77.8%) (Table 33).
Saw Actors Smoking on Television or in Movies
Middle School. Nationally, 87.2% of students had seen actors smoking on televisionor in movies (Figure 16). Female students (88.8%) were significantly more likely thanmale students (85.7%) to have seen actors smoking on television or in movies (Table 32).
Among the 11 states that asked this question, the percentage of students who hadseen actors smoking on television or in movies ranged from 86.8% in Nebraska to 96.1%in Texas (1998) (median: 88.4%) (Table 33).
High School. Nationally, 91.7% of students had seen actors smoking on television or inmovies (Figure 16). Female students (93.4%) were significantly more likely than malestudents (89.9%) to have seen actors smoking on television or in movies (Table 32).
Among the seven states that asked this question, the percentage of students who hadseen actors smoking on television or in movies ranged from 89.4% in Arkansas to 97.7%in Mississippi (private schools, 1998) (median: 92.2%) (Table 33).
Saw Athletes Smoking on Television
Middle School. Nationally, 19.8% of students had seen athletes smoking on television(Figure 16). Hispanic students (22.9%) were significantly more likely than white students(17.2%) to have seen athletes smoking on television (Table 32).
Among the seven states that asked this question, the percentage of students who hadseen athletes smoking on television ranged from 15.8% in Nebraska to 25.8% in Tennessee(median: 21.4%) (Table 33).
High School. Nationally, 17.7% of students had seen athletes smoking on television(Figure 16). Black students (20.6%) were significantly more likely than white students(16.2%) to have seen athletes smoking on television (Table 32).
Among the three states that asked this question, the percentage of students who hadseen athletes smoking on television ranged from 19.0% in Oklahoma to 29.2% in Tennessee(median: 20.7%) (Table 33).
Saw Advertisements for Tobacco Products on Internet
Middle School. Nationally, 31.8% of students had seen advertisements for tobaccoproducts on the Internet (Figure 16 and Table 32).
Among the nine states that asked this question, the percentage of students who hadseen such advertisements on the Internet ranged from 28.3% in Oklahoma to 41.2% inNorth Carolina (median: 33.6%) (Table 33).
High School. Nationally, 26.8% of students had seen advertisements for tobaccoproducts on the Internet (Figure 16 and Table 32).

28 MMWR October 13, 2000
Among the six states that asked this question, the percentage of students who hadseen such advertisements on the Internet ranged from 21.3% in Texas (1998) to 32.8% inTennessee (median: 28.7%) (Table 33).
Participation in Antitobacco Community Events
Students were asked whether they had participated in any antitobacco communityevents to discourage persons from using tobacco products during the past 12 months.
Middle School. Nationally, no difference in participation in antitobacco communityevents was observed between students who had never used tobacco (17.0%) and thosewho had ever used tobacco (18.8%) (Figure 17 and Table 34).
Among the 10 states that asked this question, the percentage of never tobacco userswho had participated in any anti-tobacco community events ranged from 12.2% inArkansas to 21.0% in Texas (1998) (median: 18.5%). For students who had ever usedtobacco, rates ranged from 14.5% in Oklahoma to 28.3% in Texas (1998) (median: 18.0%)(Table 35).
High School. Nationally, no difference in participation in antitobacco community eventswas observed between students who had never used tobacco (12.9%) and those whohad ever used tobacco (11.9%) (Figure 17 and Table 34).
Among the seven states that asked this question, the percentage of never tobaccousers who had participated in any anti-tobacco community events ranged from 7.0% inMississippi (private schools, 1998) to 19.7% in Mississippi (public schools, 1999) (median:10.8%). For students who had ever used tobacco, rates ranged from 6.8% in Oklahoma to24.1% in Texas (1998) (median: 11.4%) (Table 35).
FIGURE 17. Percentage of middle school and high school students who participated inantitobacco community events, by tobacco use status — National Youth Tobacco Survey,1999
0
20
40
60
80
100
Per
cen
tag
e
Middle SchoolHigh School
Ever users who participated in antitobacco events
Never users who participated in antitobacco event
18.8
11.917.0
12.9

Vol. 49 / No. SS-10 MMWR 29
Receptivity
Bought or Received Anything with Tobacco Company Name or Picture on It
Middle School. Nationally, current tobacco users (42.5%) were significantly morelikely than students who had never used tobacco (9.2%) to have bought or receivedanything with a tobacco company name or picture on it (e.g., sports gear, T-shirt,cigarette lighter, hat, jacket, or sunglasses that they purchased or received for free)(Figure 18). Among students who had never used tobacco, male students (10.7%) weresignificantly more likely than female students (7.8%) to have bought or received any-thing with a tobacco company name or picture on it; and white students (10.0%) weresignificantly more likely than black students (7.0%) to have bought or received suchitems (Table 36).
Among the 13 states that asked this question, the percentage of never tobacco userswho had bought or received anything with a tobacco company name or picture on itranged from 8.4% in Mississippi (1999) to 19.3% in Arkansas (median: 12.6%). Amongcurrent tobacco users, rates ranged from 34.1% in Mississippi (1999) to 57.9% inOklahoma (median: 45.2%) (Table 37).
High School. Nationally, current tobacco users (36.2%) were significantly more likelythan students who had never used tobacco (10.5%) to have bought or received anythingwith a tobacco company name or picture on it (Figure 18). Among current tobacco users,male students (39.7%) were significantly more likely than female students (31.9%) to
FIGURE 18. Percentage of middle school and high school students receptive to tobaccocompany merchandise, by tobacco use status — National Youth Tobacco Survey, 1999
Never users Current users Never users Current users0
20
40
60
80
100
Per
cen
tag
e
Middle SchoolHigh School
Bought or received anything with a tobacco company
name or picture on it
Would wear or use something with a tobacco company
name or picture on it
9.2 10.5
42.5
36.2
1.7 2.1
22.4 21.0
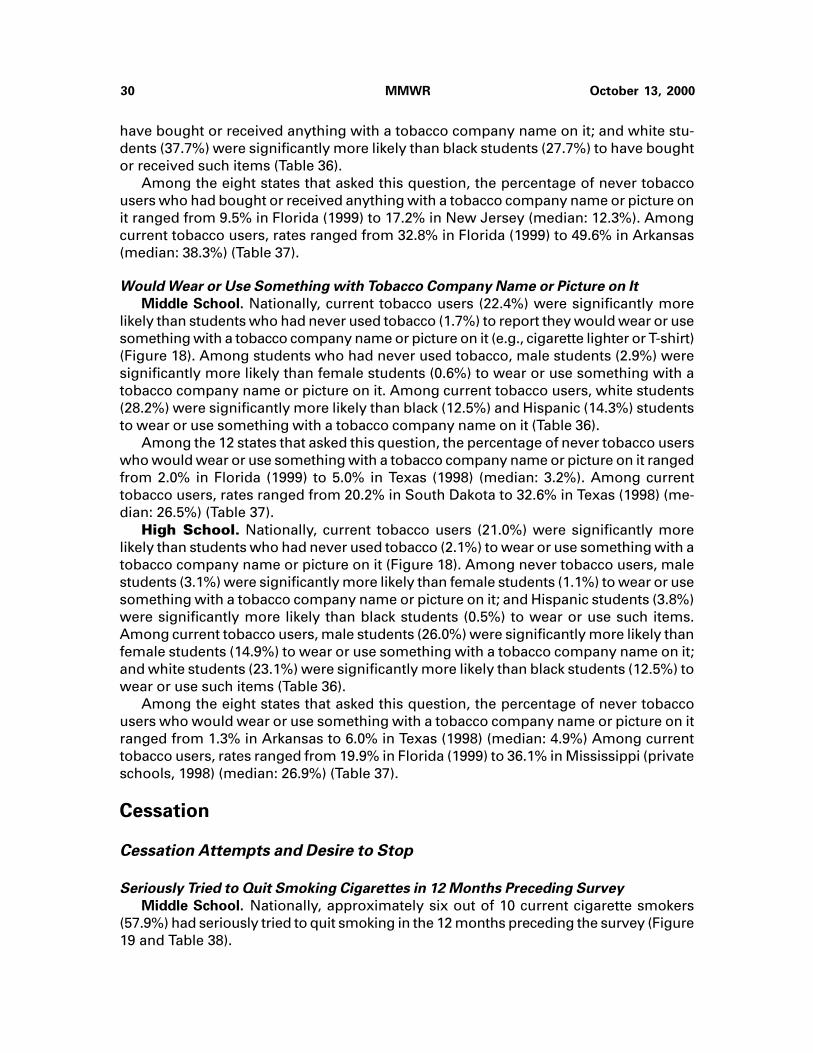
30 MMWR October 13, 2000
have bought or received anything with a tobacco company name on it; and white stu-dents (37.7%) were significantly more likely than black students (27.7%) to have boughtor received such items (Table 36).
Among the eight states that asked this question, the percentage of never tobaccousers who had bought or received anything with a tobacco company name or picture onit ranged from 9.5% in Florida (1999) to 17.2% in New Jersey (median: 12.3%). Amongcurrent tobacco users, rates ranged from 32.8% in Florida (1999) to 49.6% in Arkansas(median: 38.3%) (Table 37).
Would Wear or Use Something with Tobacco Company Name or Picture on It
Middle School. Nationally, current tobacco users (22.4%) were significantly morelikely than students who had never used tobacco (1.7%) to report they would wear or usesomething with a tobacco company name or picture on it (e.g., cigarette lighter or T-shirt)(Figure 18). Among students who had never used tobacco, male students (2.9%) weresignificantly more likely than female students (0.6%) to wear or use something with atobacco company name or picture on it. Among current tobacco users, white students(28.2%) were significantly more likely than black (12.5%) and Hispanic (14.3%) studentsto wear or use something with a tobacco company name on it (Table 36).
Among the 12 states that asked this question, the percentage of never tobacco userswho would wear or use something with a tobacco company name or picture on it rangedfrom 2.0% in Florida (1999) to 5.0% in Texas (1998) (median: 3.2%). Among currenttobacco users, rates ranged from 20.2% in South Dakota to 32.6% in Texas (1998) (me-dian: 26.5%) (Table 37).
High School. Nationally, current tobacco users (21.0%) were significantly morelikely than students who had never used tobacco (2.1%) to wear or use something with atobacco company name or picture on it (Figure 18). Among never tobacco users, malestudents (3.1%) were significantly more likely than female students (1.1%) to wear or usesomething with a tobacco company name or picture on it; and Hispanic students (3.8%)were significantly more likely than black students (0.5%) to wear or use such items.Among current tobacco users, male students (26.0%) were significantly more likely thanfemale students (14.9%) to wear or use something with a tobacco company name on it;and white students (23.1%) were significantly more likely than black students (12.5%) towear or use such items (Table 36).
Among the eight states that asked this question, the percentage of never tobaccousers who would wear or use something with a tobacco company name or picture on itranged from 1.3% in Arkansas to 6.0% in Texas (1998) (median: 4.9%) Among currenttobacco users, rates ranged from 19.9% in Florida (1999) to 36.1% in Mississippi (privateschools, 1998) (median: 26.9%) (Table 37).
Cessation
Cessation Attempts and Desire to Stop
Seriously Tried to Quit Smoking Cigarettes in 12 Months Preceding Survey
Middle School. Nationally, approximately six out of 10 current cigarette smokers(57.9%) had seriously tried to quit smoking in the 12 months preceding the survey (Figure19 and Table 38).

Vol. 49 / No. SS-10 MMWR 31
Among the 12 states that asked this question, the percentage of smokers who hadseriously tried to quit smoking in the 12 months preceding the survey ranged from 46.5%in Texas (1999) to 60.1% in Missouri (median: 53.6%) (Table 39).
High School. Nationally, 55.6% of current cigarette smokers had seriously tried to quitsmoking in the 12 months preceding the survey (Figure 19). Hispanic smokers (63.7%)were significantly more likely than white (54.8%) and black (52.2%) smokers to haveseriously tried to quit smoking cigarettes in the 12 months preceding the survey (Table 38).
Among the eight states that asked this question, the percentage of smokers who hadseriously tried to quit smoking in the 12 months preceding the survey ranged from 46.5%in Texas (1999) to 59.9% in Mississippi (public schools, 1999) (median: 52.9%) (Table 39).
Want to Stop Smoking Cigarettes Completely
Middle School. Nationally, more than half (50.9%) of current smokers in middle schoolsaid they wanted to stop smoking completely (Figure 19 and Table 38).
Among the 11 states that asked this question, the percentage of current smokers whowanted to stop smoking completely ranged from 39.3% in Kansas to 64.6% in SouthDakota (median: 52.1%) (Table 39).
High School. Nationally, 54.4% of current cigarette smokers in high school said theywanted to stop smoking completely (Figure 19 and Table 38).
Among the seven states that asked this question, the percentage of current smokerswho wanted to stop smoking completely ranged from 47.9% in Texas (1999) to 56.4% inNew Jersey (median: 53.2%) (Table 39).
FIGURE 19. Percentage of current smokers in middle school and high school who haveseriously tried to quit and who want to completely stop smoking — National YouthTobacco Survey, 1999
0
20
40
60
80
100
Per
cen
tag
e
Middle SchoolHigh School
Current smokers who seriously tried to quit in past 12 months
Current smokers who want to completely stop smoking cigarettes
57.9 55.650.9
54.4

32 MMWR October 13, 2000
Could Quit Smoking Cigarettes If They Wanted To
Middle School. Nationally, 81.7% of current cigarette smokers thought they could quitsmoking if they wanted to (Figure 20 and Table 40).
Among the 11 states that asked this question, the percentage of current smokers whothought they could quit smoking if they wanted to ranged from 71.9% in Tennessee to86.4% in Oklahoma (median: 78.6%) (Table 41).
High School. Nationally, 83.7% current cigarette smokers thought they could quitsmoking if they wanted to (Figure 20 and Table 40).
Among the six states that asked this question, the percentage of current smoker whothought they could quit smoking if they wanted to ranged from 72.1% in New Jersey to88.9% in Oklahoma (median: 82.8%) (Table 41).
Attended Program to Help Them Quit Smoking Cigarettes
Middle School. Nationally, among students who had ever used tobacco, 19.9% ofstudents had attended a program to help them quit smoking cigarettes (Figure 20). Blackstudents (32.2%) were significantly more likely than white (16.0%) and Hispanic students(17.9%) to have attended a program to help them quit (Table 40).
Among the 10 states that asked this question, the percentage of ever tobacco userswho had attended a program to help them quit smoking ranged from 4.1% in Texas(1999) to 18.7% in South Dakota (median: 12.9%) (Table 41).
High School. Nationally, among students who had ever used tobacco, 8.8% of stu-dents had attended a program to help them quit (Figure 20). Black students (15.5%) weresignificantly more likely than white students (7.8%) to have attended a program to helpthem quit smoking cigarettes (Table 40).
FIGURE 20. Middle school and high school students’ perception of their ability to quitsmoking cigarettes, by tobacco use status — National Youth Tobacco Survey, 1999
0
20
40
60
80
100
Perc
enta
ge
Middle SchoolHigh School
Current smokers who think they Ever tobacco users who have ever attended program to help them quit
81.7 83.7
19.9
8.8

Vol. 49 / No. SS-10 MMWR 33
Among the six states that asked this question, the percentage of ever tobacco userswho had attended a program to help them quit ranged from 3.8% in Texas (1999) to15.2% in Arkansas (median: 12.5%) (Table 41).
Tried to Quit Smoking �1 Times in Past 12 Months
Middle School. Nationally, current smokers (61.2%) were significantly more likelythan ever smokers (41.6%) to have tried to quit smoking at least once in the past 12months (Figure 21). Among current smokers, female students (66.7%) were significantlymore likely than male students (56.1%) to have tried to quit smoking at least once in thepast 12 months (Table 42).
Among the 10 states that asked this question, the percentage of ever smokers whohad tried to quit at least once in the past 12 months ranged from 30.8% in New Jersey to50.6% in Oklahoma (median: 43.8%) (Table 43). Among current smokers, rates rangedfrom 45.9% in New Jersey to 71.4% in Missouri (median: 65.8%) (Table 43).
High School. Nationally, current smokers (61.5%) were significantly more likely thanever smokers (42.4%) to have tried to quit smoking at least once in the past 12 months(Figure 21). Among ever smokers, white (45.8%) and Hispanic (41.6%) students weresignificantly more likely than black students (30.7%) to have tried to quit smoking at leastonce in the past 12 months. Among current smokers, female students (64.3%) weresignificantly more likely than male students (58.7%) to have tried to quit smoking at leastonce in the past 12 months (Table 42).
Among the six states that asked this question, the percentage of ever smokers whohad tried to quit at least once in the past 12 months ranged from 32.0% in New Jersey to
FIGURE 21. Percentage of middle school and high school students who tried to quitsmoking �1 times in the past 12 months, by smoking status — National Youth TobaccoSurvey, 1999
0
20
40
60
80
100
Per
cen
tag
e
Middle SchoolHigh School
Ever smokers who tried to quit 1 times³
Current smokers who tried to quit 1 times³
41.6 42.4
61.2 61.5
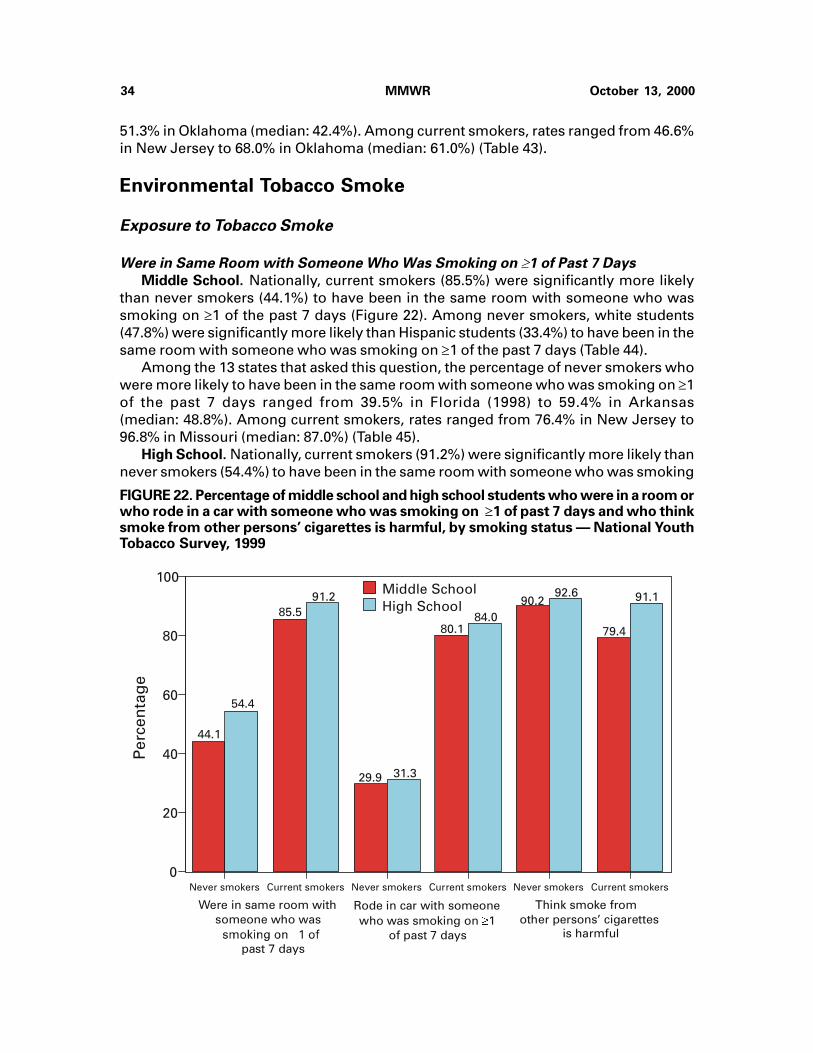
34 MMWR October 13, 2000
51.3% in Oklahoma (median: 42.4%). Among current smokers, rates ranged from 46.6%in New Jersey to 68.0% in Oklahoma (median: 61.0%) (Table 43).
Environmental Tobacco Smoke
Exposure to Tobacco Smoke
Were in Same Room with Someone Who Was Smoking on �1 of Past 7 Days
Middle School. Nationally, current smokers (85.5%) were significantly more likelythan never smokers (44.1%) to have been in the same room with someone who wassmoking on �1 of the past 7 days (Figure 22). Among never smokers, white students(47.8%) were significantly more likely than Hispanic students (33.4%) to have been in thesame room with someone who was smoking on �1 of the past 7 days (Table 44).
Among the 13 states that asked this question, the percentage of never smokers whowere more likely to have been in the same room with someone who was smoking on �1of the past 7 days ranged from 39.5% in Florida (1998) to 59.4% in Arkansas(median: 48.8%). Among current smokers, rates ranged from 76.4% in New Jersey to96.8% in Missouri (median: 87.0%) (Table 45).
High School. Nationally, current smokers (91.2%) were significantly more likely thannever smokers (54.4%) to have been in the same room with someone who was smoking
FIGURE 22. Percentage of middle school and high school students who were in a room orwho rode in a car with someone who was smoking on �1 of past 7 days and who thinksmoke from other persons’ cigarettes is harmful, by smoking status — National YouthTobacco Survey, 1999
Never smokers Current smokers Never smokers Current smokers Never smokers Current smokers0
20
40
60
80
100
Per
cen
tag
e
Middle SchoolHigh School
Were in same room with someone who was
past 7 days
Rode in car with someone who was smoking on 1 ³
of past 7 days
Think smoke from other persons’ cigarettes
is harmful
44.1
54.4
85.591.2
29.9 31.3
80.184.0
90.292.6
79.4
91.1

Vol. 49 / No. SS-10 MMWR 35
on �1 of the past 7 days (Figure 22). Among never smokers, white students (59.3%) weresignificantly more likely than Hispanic students (45.9%) to have been in the same roomwith someone who was smoking on �1 of the past 7 days. Among current smokers, whitestudents (93.7%) were significantly more likely than Hispanic students (83.9%) to havebeen in the same room with someone who was smoking on �1 of the past 7 days(Table 44).
Among the eight states that asked this question, the percentage of never smokerswho had been in the same room with someone who was smoking on �1 of the past 7 daysranged from 48.5% in Florida (1998) to 75.1% in Tennessee (median: 56.1%). Amongcurrent smokers, rates ranged from 83.9% in New Jersey to 93.8% in Oklahoma(median: 91.4%) (Table 45).
Rode in Car with a Someone Who Was Smoking on �1 of Past 7 Days
Middle School. Nationally, current cigarette smokers (80.1%) were significantly morelikely than never smokers (29.9%) to have ridden in a car with someone who was smok-ing on �1 of the past 7 days (Figure 22). Among current smokers, female students (85.1%)were significantly more likely than male students (75.8%) to have ridden in a car withsomeone who was smoking; and white students (84.3%) were significantly more likelythan Hispanic students (72.6%) to have ridden in a car with someone who was smoking(Table 44).
Among the 13 states that asked this question, the percentage of never smokers whohad ridden in a car with someone who was smoking on �1 of the past 7 days ranged from31.3% in Florida (1998) to 47.5% in Arkansas (median: 35.9%). Among current smokers,rates ranged from 71.7% in New Jersey to 88.1% in Missouri (median: 79.2%) (Table 45).
High School. Nationally, current cigarette smokers (84.0%) were significantly morelikely than never smokers (31.3%) to have ridden in a car with someone who was smok-ing on �1 of the past 7 days (Figure 22). Among current smokers, white students (87.2%)were significantly more likely than black (73.5%) or Hispanic (74.4%) students to haveridden in a car with someone who was smoking (Table 44).
Among the eight states that asked this question, the percentage of never smokerswho had ridden in a car with someone who was smoking on �1 of the past 7 days rangedfrom 28.6% in Florida (1998) to 46.2% in Tennessee (median: 33.3%). Among currentsmokers, rates ranged from 78.3% in Texas (1998) to 90.2% in Mississippi (public schools,1998) (median: 86.3%) (Table 45).
Think Smoke From Other Persons’ Cigarettes is Harmful to Them
Middle School. Nationally, 90.2% of students who had never smoked cigarettesthought that smoke from other persons’ cigarettes was harmful to them (Figure 22).Never smokers were significantly more likely than current smokers (79.4%) to thinksecondhand smoke was harmful to them. Among never smokers, white students (93.9%)were significantly more likely than black (81.0%) and Hispanic (86.5%) students to thinksmoke from other persons’ cigarettes was harmful to them (Table 44). Among currentsmokers, white students (83.7%) were significantly more likely than Hispanic students(72.8%) to think that smoke from other persons’ cigarettes was harmful to them(Table 44).
Among the 12 states that asked this question, the percentage of never smokers whothought that smoke from other persons’ cigarettes was harmful to them ranged from89.0% in Texas (1999) to 96.2% in Missouri (median: 91.8%). Among current smokers,

36 MMWR October 13, 2000
rates ranged from 73.6% in Texas (1999) to 90.5% in Florida (1998) (median: 83.6%)(Table 45).
High School. Nationally, 92.6% of never smokers and 91.1% of current smokersthought that smoke from other persons’ cigarettes was harmful to them (Figure 22).Among never smokers, white students (96.2%) were significantly more likely than black(86.5%) or Hispanic (85.4%) students to think that smoke from other persons’ cigaretteswas harmful to them. Among current smokers, female students (93.2%) were signifi-cantly more likely than male students (88.9%) to think that smoke from other persons’cigarettes was harmful to them (Table 44).
Among the eight states that asked this question, the percentage of never smokerswho thought smoke from other persons’ cigarettes was harmful to them ranged from90.4% in Texas (1999) to 98.3% in Mississippi (private schools, 1998) (median: 92.2%).Among current smokers, rates ranged from 86.6% in Texas (1999) to 96.0% inMississippi (private schools, 1999) (median: 88.8%) (Table 45).
Exposure to Tobacco Use at Home
Anyone in Home Smokes Cigarettes
Middle School. Nationally, current cigarette smokers (69.5%) were significantly morelikely than students who had never smoked (32.4%) to live in a home where someonesmoked (Figure 23). Black never smokers (38.7%) were significantly more likely thaneither white (31.2%) or Hispanic (30.1%) never smokers to live in a home where some-one smoked (Table 46).
Among the 13 states that asked this question, the percentage of never smokers wholived in a home where someone smoked ranged from 30.6% in South Dakota to 40.9% inArkansas (median: 35.4%). Among current smokers, rates ranged from 64.6% in NewJersey to 78.2% in Tennessee (median: 69.3%) (Table 47).
High School. Nationally, current cigarette smokers (61.5%) were significantly morelikely than never smokers (28.9%) to live in a home where someone smoked (Figure 23and Table 46).
Among the eight states that asked this question, the percentage of never smokerswho lived in a home where someone smoked ranged from 21.5% in Mississippi (privateschools, 1998) to 43.9% in Tennessee (median: 31.2%). Among current smokers, ratesranged from 46.3% in Mississippi (private schools, 1998) to 67.1% in Texas (1998)(median: 57.4%) (Table 47).
Anyone in Home Uses Smokeless Tobacco
Middle School. Current cigarette smokers (19.5%) were significantly more likely thanstudents who had never smoked (4.5%) to live in a home where someone used smoke-less tobacco (Figure 23). Among never smokers, white students (5.5%) were significantlymore likely than Hispanic students (2.4%) to live in a home where someone used smoke-less tobacco (Table 46).
Among the eight states that asked this question, the percentage of never smokerswho lived in a home where someone used smokeless tobacco ranged from 9.2% inMissouri to 17.6% in Arkansas (median: 13.9%). Among current smokers, rates rangedfrom 18.5% in Missouri to 32.0% in South Dakota (median: 24.1%) (Table 47).

Vol. 49 / No. SS-10 MMWR 37
High School. Current cigarette smokers (17.5%) were significantly more likely thannever smokers (5.4%) to live in a home where someone used smokeless tobacco (Figure 23and Table 46).
Among the four states that asked this question, the percentage of never smokers wholived in a home where someone used smokeless tobacco ranged from 9.9% in NorthCarolina to 13.5% in Texas (1999) (median: 12.6%). Among current smokers, rates rangedfrom 17.6% in North Carolina to 34.8% in Arkansas (median: 21.6%) (Table 47).
School
Students Who Practiced Ways to Say “No” to Tobacco as Part of SchoolCurriculum
The NYTS, conducted in the fall of 1999, did not include questions regarding pastschool year curriculum because of the extended period of recall that would have beenrequired of respondents.
Middle School. Among the 12 states that asked this question, the percentage of evertobacco users who practiced ways to say “no” to tobacco in school ranged from 27.8% inOklahoma to 47.4% in Missouri (median: 34.4%). The percentage of current tobaccousers who practiced ways to say “no” to tobacco in school ranged from 24.6% inOklahoma to 47.5% in South Dakota (median: 33.3%) (Table 48).
FIGURE 23. Percentage of middle school and high school students exposed to tobaccouse at home, by smoking status — National Youth Tobacco Survey, 1999
Never smokers Current smokers Never smokers Current smokers0
20
40
60
80
100
Per
cen
tag
e
Middle SchoolHigh School
Anyone in home smokes cigarettes
Anyone in home uses smokeless tobacco
32.428.9
69.5
61.5
4.5 5.4
19.5 17.5

38 MMWR October 13, 2000
High School. Among the seven states that asked this question, the percentage of evertobacco users who practiced ways to say “no” to tobacco in school ranged from 6.4% inMississippi (private schools, 1998) to 21.7% in Texas (1998) (median: 14.9%). The per-centage of current smokers who practiced ways to say “no” to tobacco in school rangedfrom 5.9% in Mississippi (private schools, 1998) to 22.0% in Texas (1998) (median: 13.7%)(Table 48).
Students Who Smoked Cigarettes On School Property in Past 30 Days
Middle School. Nationally, 2.4% of students smoked cigarettes on school property inthe 30 days preceding the survey (Table 49).
Among the 10 states that asked this question, the percentage of students who hadrecently smoked cigarettes on school property ranged from 2.5% in New Jersey to 7.3%in Arkansas (median: 3.2%) (Table 50).
High School. Nationally, 9.3% of students smoked cigarettes on school property in the30 days preceding the survey. White students (10.5%) were significantly more likely thanblack students (5.1%) to have smoked cigarettes on school property in the past 30 days(Table 49).
Among the seven states that asked this question, the percentage of students who hadrecently smoked cigarettes on school property ranged from 8.2% in Mississippi (privateschools, 1999) to 15.0% in Tennessee (median: 10.9%) (Table 50).
DISCUSSION
The Youth Tobacco Surveillance and Evaluation System was developed by CDC toprovide states with surveillance and evaluation data to support their state-basedtobacco control programs. CDC and participating states designed the Youth TobaccoSurvey to provide states with a mechanism for collecting both the baseline and trenddata necessary to evaluate components of their comprehensive tobacco control pro-grams. The National Youth Tobacco Survey, which was modeled after the state survey,was designed to measure the impact of the programs and activities of the AmericanLegacy Foundation and to provide national estimates with which states can comparetheir data.* CDC recommends that states establish comprehensive tobacco control pro-grams that include nine elements (6 ):
• community programs to reduce tobacco use;†
• chronic disease programs to reduce the burden of tobacco-related diseases;
• school programs;
• enforcement;
• statewide programs;
• countermarketing;
* When making comparisons between NYTS and state-specific YTS data, states shouldinclude a 95% confidence interval to reflect variations in the sample sizes and responserates among populations.
† Bold, italic type indicates the six elements of Best Practices for Tobacco Control Programs(6 ) that are covered in the state Youth Tobacco Surveys. States can use survey data tomonitor these six elements.

Vol. 49 / No. SS-10 MMWR 39
• smoking cessation programs;
• surveillance and evaluation; and
• administration and management.
A comprehensive tobacco control program must have a surveillance and evaluationsystem that can document the extent of the problem and then monitor and documentprogram effectiveness. Surveillance should include periodic and ongoing monitoring oftobacco-related behaviors, attitudes, health outcomes, and the prevalence of protobaccoinfluences (e.g., advertising, promotions, and events that glamorize tobacco use). Evalu-ation elements should measure the impact of program elements on attitudes, behaviors,and policies.
Linking YTS Data to Program Components
States can use this report as a model for developing and reporting on the elements oftheir comprehensive tobacco control programs. National estimates for each of theseelements provide an initial marker by which states can compare their current data. In thefuture, states can a) monitor their trends across time, a step that could lead to programdevelopment and modifications; b) compare their state data with those of other states asa means of identifying successful programs; and c) compare their state data withnational estimates.
The following baseline data from the NYTS provide examples of how states canreport youth surveillance and evaluation data within the context of a comprehensivetobacco control program.
Surveillance
• Current use of tobacco among youth in the United States ranges from 13% formiddle school students to 35% for high school students.
— Cigarettes are the most prevalent form of tobacco used by approximately oneout of 10 middle school and three out of 10 high school students who currentlysmoke. Cigars are the second most prevalent form of tobacco used, followed bysmokeless tobacco. Bidis and kreteks are emerging forms of tobacco use amongyouth, with 2% of middle school and 5% of high school students currently usingthem.
— Among ever smokers, 30% of high school students and 10% of middle schoolstudents have smoked �100 cigarettes in their lifetime, a finding that suggeststhe likelihood of a high level of tobacco dependence among young persons.
— More than one out of five middle school and high school students who havenever smoked cigarettes indicate that they are likely to initiate smoking in thenext year (i.e., they are susceptible to smoking).
• The rate of current cigarette use documented by the 1999 NYTS is consistent withfindings from the 1999 national Youth Risk Behavior Survey and the 1999Monitoring the Future Survey (4 ). For the NYTS and the Monitoring the FutureSurvey, rates are similar for students in grades 8, 10, and 12. For the NYST and thenational Youth Risk Behavior Survey, rates are similar for students in each grade(i.e., 9–12) except grade 10.
40 MMWR October 13, 2000
Community Programs
Community programs to reduce tobacco use should focus on four goals: a) preven-tion of the initiation of tobacco use among young persons; b) cessation for current usersof tobacco; c) protection from environmental tobacco smoke; and d) elimination of dis-parities in tobacco use among populations. CDC encourages states to analyze and reporttheir data on racial and ethnic disparities when possible. NYTS highlights support theneed for these goals:
• Cigarette smoking is initiated at a young age: 8% of both middle school and highschool students smoked their first whole cigarette before the age of 11 years.
• Young persons have a high exposure to environmental tobacco smoke.
— During the previous week, almost nine out of 10 current smokers andapproximately half of never smokers were in the same room with someone whowas smoking.
— During the previous week, eight out of 10 current smokers and three out of 10never smokers rode in a car with someone who was smoking.
— Six out of 10 current smokers and three out of 10 never smokers live in a homewhere someone else smokes cigarettes.
— Approximately 80% of young persons think smoke from others is harmful tothem.
— Only 18% of middle school and 12% of high school students participated in acommunity event to discourage persons from using tobacco.
• In high school, black students have significantly lower rates of current smokingthan white and Hispanic students — a finding consistent with reports from previousnational surveys (3,4,7 ). In middle school, however, NYTS data document thatrates of current smoking among black students do not differ significantly from ratesamong white and Hispanic students.
School Programs
School programs that prevent the onset of tobacco use are a critical element ofcomprehensive tobacco control programs, because most young persons start smokingbefore the age of 18 years (5,10 ). Several studies have documented that school-basedtobacco prevention programs can significantly reduce or delay adolescent smoking(5,10–13 ).
• Few students report receiving instruction regarding the harmful effects of tobaccouse, and adherence to school smoke-free policies appears to be relatively low inhigh schools.
— Only 40% of middle school and 10% of high school students were taught ways tosay “no” to tobacco as part of their curriculum in school during the past year.
— Approximately 2% of middle school and 9% of high school students smokedcigarettes on school property during the past 30 days.

Vol. 49 / No. SS-10 MMWR 41
Enforcement
Enforcement of tobacco control policies enhances their efficacy by deterring viola-tors and by sending a message to the public that community leaders believe that thesepolicies are important (14 ). The two primary areas addressed by local and state policiesthat require enforcement strategies are restrictions on minors’ access to tobacco andrestrictions on smoking (clean indoor air) policies.
• Restriction on minors’ access to tobacco is rare.
— Approximately 70% of middle school and 60% of high school students whocurrently smoke and are <18 years of age were not asked to show proof of agewhen they purchased cigarettes.
— Almost two thirds of middle school and high school students who currentlysmoke and are <18 years of age were not refused purchase of cigarettesbecause of age.
Countermarketing
Countermarketing activities can promote smoking cessation among young personsand decrease the likelihood that they will begin smoking. Countermarketing messagesalso can have a powerful influence on public support for tobacco control intervention andbuild a supportive climate for school and community efforts. Tobacco advertising andpromotion activities appear to stimulate adult consumption and increase the risk of youthinitiation (5,15 ). Children buy the most heavily advertised brands (16 ) and are threetimes more affected by advertising than are adults (17 ).
• A high percentage of young persons are exposed to tobacco advertising andpromotion activities.
— Almost nine out of 10 middle school and high school students saw actorssmoking on television or in movies.
— Approximately two out of 10 middle school and high school students sawathletes smoking on television.
— Approximately three out of 10 middle school and high school students sawadvertisements for tobacco on the Internet.
— Approximately two out of 10 middle school and high school students bought orreceived something with a tobacco company name or picture on it. The ratedoubles for current tobacco users.
— Approximately 20% of current tobacco users in middle school and high schoolwould wear or use something with a tobacco company name or picture on it.Only 2% of middle school and high school students who have never usedtobacco would wear or use such items.
• Young persons who smoke have strong cigarette brand preferences.
— Almost half of middle school and high school students who currently smokereport that they usually smoke Marlboro® cigarettes.

42 MMWR October 13, 2000
— Black students are more likely to smoke Newport® cigarettes than any otherbrand.
• Exposure to countermarketing messages is high. Approximately eight out of 10middle school and high school students saw an antismoking commercial ontelevision or heard one on the radio.
Smoking Cessation
Smoking cessation programs that successfully assist young and adult smokers inquitting can produce a greater short-term public health benefit than any other element ofa comprehensive tobacco control program. The NYTS and state YTS data clearly demon-strate the need for programs that help adolescents to quit smoking. Young current smok-ers’ perceptions regarding their ability to quit smoking is not consistent with their reportedresults. However, little is known about the effectiveness of these interventions amongadolescents (18 ). With no specific proven interventions for adolescents, states shouldcarefully evaluate all programs that are implemented.
• Effective youth cessation programs are needed.
— More than 80% of middle school and high school students who are currentsmokers reported that they could quit if they wanted to.
— Half of both middle school and high school students who are current smokersreported that they want to completely stop smoking.
— More than half of middle school and high school students who are currentsmokers seriously tried to quit in the past 12 months.
Limitations
The findings in this report have at least three limitations. First, these data apply onlyto youth who attended middle school or high school and are not representative of allpersons in this age group. However, few persons aged <16 years do not attend school,and in 1997, only 4% of 16-year-olds and 6% of 17-year-olds who had not completed highschool were not enrolled in a high school program (19 ). The dropout rate for youngadults aged 16–24 years varies greatly by race/ethnicity (7.6%, white; 13.4%, black; and25.3%, Hispanic) (19 ). Second, the NYTS and state surveys for Nebraska, New Jersey,North Carolina, and South Dakota were conducted in the fall semester, whereas theother states conducted surveys in the spring semester. Within each grade, the fall schoolpopulation is approximately 6 months younger than the spring school population. Thisdifference can be expected to lead to higher estimates of ever tobacco use in the springsurveys and also might lead to higher estimates of current use. Future analysis of datafrom the fall 1999 NYTS and the spring 2000 NYTS will provide a measure of this effect.Third, the data are all based on self-reports.
CONCLUSION
Three states conducted Youth Tobacco Surveys in 1998, 13 states conducted surveysin 1999, and 26 states are conducting surveys in 2000. For these participating states andfor states that plan to participate in the future, the state YTS and NYTS are primary

Vol. 49 / No. SS-10 MMWR 43
sources of data for monitoring and evaluating state-based tobacco control programs.After completing their spring 2000 surveys, Florida, Mississippi, and Texas will have3 years of data, and Arkansas, Georgia, and Tennessee will have 2 years of data to beginexamining trends. Florida published a report documenting a dramatic decline in youthtobacco use from spring 1998 through spring 1999 (20 ); assessments are in process todetermine how much of this decline can be attributed to Florida’s aggressive youth-focused tobacco control program. The YTS findings in Florida led to the adoption ofyouth-oriented programs by other states.
States can a) compare their YTS data with national estimates; and b) compare theirYTS data with data from other states to recognize problems unique to their state and toidentify successful programs from other states. For example, in 1998, Texas was the firststate to include questions regarding tobacco use in a pipe. After Texas reported a preva-lence of pipe use of 8.5% among middle school students, other states realized the publichealth significance of monitoring pipe use among adolescents.
The YTS provides states with a mechanism for responding to emerging issues withintobacco control. In response to concerns that the age of initiation was declining,Nebraska implemented a middle school YTS to examine previously undocumented lev-els of tobacco use among middle school students in the state.
A unique feature of the YTS is that it allows states to get substate-level estimates tosupport their tobacco control efforts. For example, both New Jersey and North Carolinawere able to demonstrate previously undocumented regional differences in tobacco usewithin their states. In Oklahoma, the YTS provided both state and community baselinedata for evaluating tobacco control and chronic disease programs. After conducting thesurvey in 1999 to provide baseline data to support the youth component of their tobaccocontrol program, Tennessee expanded the sampling design of its 2000 YTS to providedata at the region level. Tennessee’s 2000 survey will provide estimates for each of thestate’s 13 health regions to support local level tobacco control efforts.
Finally, the YTS has been used in several states to generate legislative support forallocation of dollars from the Master Settlement Agreement to support tobacco controland prevention efforts. The survey can then be used to report on the effectiveness of theprograms developed under the Master Settlement Agreement.References
1. McGinnis JM, Foege WH. Actual causes of death in the United States. JAMA1993;270:2207–12.
2. CDC. Projected smoking-related deaths among youth — United States. MMWR 1996;45:971–4.3. CDC. Tobacco use among high school students — United States, 1997. MMWR 1998;47:
229–33.4. Johnston LD, O’Malley PM, Bachman JG. Monitoring the Future Survey. Ann Arbor, MI:
University of Michigan, 1999. Available at <http://monitoringthefuture.org/data/99data.html#1999data_cigs>. Accessed August 15, 2000.
5. US Department of Health and Human Services. Preventing tobacco use among youngpeople: a report of the Surgeon General. Atlanta, GA: US Department of Health andHuman Services, Public Health Service, CDC, National Center for Chronic DiseasePrevention and Health Promotion, Office on Smoking and Health, 1994. Reprinted withcorrections, July 1994.
6. CDC. Best practices for comprehensive tobacco control programs — August 1999. Atlanta,GA: US Department of Health and Human Services, Public Health Service, CDC, NationalCenter for Chronic Disease Prevention and Health Promotion, Office on Smoking andHealth, 1999.

44 MMWR October 13, 2000
7. CDC. Tobacco use among middle and high school students — United States, 1999.MMWR 2000;49:49–53.
8. Shah BV, Barnwell BG, Bieler GS. SUDAAN: Software for the Statistical Analysis of CorrelatedData: user’s manual, release 7.5, 1997. Research Triangle Park, NC: Research TriangleInstitute, 1997.
9. Pierce JP, Choi WS, Gilpin EA, Farkas AJ, Berry CC. Tobacco industry promotion of cigarettesand adolescent smoking. JAMA 1998;279:511–5.
10. Lynch BS, Bonnie RJ, eds. Growing up tobacco free. Washington, DC: Institute of Medicine,National Academy Press, 1994:143–74.
11. Glynn TJ. Essential elements of school-based smoking prevention programs. J SchoolHealth 1989;59:181–8.
12. Bruvold WH. A meta-analysis of the California school-based risk reduction program.J Drug Educ 1990;20):139–52.
13. Rooney BL, Murray DM. A meta-analysis of smoking prevention programs after adjustmentfor errors in the unit of analysis. Health Educ Q 1996;23:48–64.
14. Forster JL, Wolfson M. Youth access to tobacco: policies and politics. Annu Rev PublicHealth 1998;19:203–35.
15. US Food and Drug Administration. 21 CFR Parts 801, 803, 804, and 897. Regulationsrestricting the sale and distribution of cigarettes and smokeless tobacco products toprotect children and adolescents; proposed rule. Federal Register 1995;60:155:41314–75.
16. CDC. Changes in the cigarette brand preferences of adolescent smokers — United States,1989-1993. MMWR 1994;43:577–81.
17. Pollay RW, Siddarth S, Siegel M, et al. The last straw? Cigarette advertising and realizedmarket shares among youths and adults, 1979–1993. J Marketing 1996;60:1–16.
18. Fiore MC, Bailey WC, Cohen SJ, et al. Treating tobacco use and dependence: a clinicalpractice guideline. Rockville, MD: US Department of Health and Human Services, 2000.AHRQ publication no. 00-0032.
19. National Center for Education Statistics. Dropout rates in the United States, 1997.Washington, DC: US Department of Education, 1999. NCES publication no. 99-082.
20. CDC. Tobacco use among middle and high school students — Florida, 1998 and 1999.MMWR 1999; 48:248–253.

Vol. 49 / No. SS-10 MMWR 45
TABLE 1. Sample sizes and response rates for middle schools and high schools, by state —State Youth Tobacco Surveys, 1998 and 1999
Response rate (%)
Sample size Schools Students Overall
Middle school
Arkansas, 1999 452 92.3 87.8 81.0Florida, 1998 11,865 96.6 82.0 79.2Florida, 1999 10,268 93.4 87.6 81.8Georgia, 1999 1,326 78.0 84.7 66.1Kansas, 1999 1,158 70.8 85.0 60.2Mississippi, 1998 1,700 87.2 85.3 74.4Mississippi, 1999 1,995 85.2 90.0 76.6Missouri, 1999 1,528 83.7 87.6 73.3Nebraska, 1999 3,668 90.2 93.5 84.3New Jersey, 1999 8,720 82.5 90.5 74.6North Carolina, 1999 6,684 97.8 90.0 88.0Oklahoma, 1999 2,169 100.0 83.7 83.7South Dakota, 1999 1,976 87.8 88.6 77.8Tennessee, 1999 1,348 96.4 76.2 73.5Texas, 1998 15,478 84.6 84.2 71.2Texas, 1999 4,753 73.0 86.5 63.1
High school
Arkansas, 1999 1,048 93.4 82.1 76.9Florida, 1998 10,675 94.5 76.5 72.3Florida, 1999 8,950 87.7 80.2 70.3Georgia, 1999 800 48.0 91.2 43.8Kansas, 1999 1,039 54.2 82.6 44.8Mississippi (private), 1998 1,531 80.0 87.4 69.9Mississippi (private), 1999 2,084 92.6 86.8 80.4Mississippi (public), 1998 1,704 82.5 85.5 70.5Mississippi (public), 1999 1,644 85 83.7 71.1New Jersey, 1999 7,151 82.5 82.4 68.0North Carolina, 1999 7,428 97.8 88.3 86.4Oklahoma, 1999 1,941 100.0 82.0 82.0Tennessee, 1999 1,501 96.9 72.9 70.7Texas, 1998 15,478 84.6 84.2 71.2Texas, 1999 5,165 69.1 86.9 60.1

46 MMWR October 13, 2000
TABLE 2. Percentage of middle school and high school students who ever used* cigarettes,cigars, smokeless tobacco, or bidis, by sex and race/ethnicity — National Youth TobaccoSurvey, 1999
SmokelessCigarettes Cigars tobacco Bidis
Middle school
SexMale 31.0 (±3.0)† 20.1 (±2.2) 11.0 (±2.1) 6.7 (±1.3)Female 27.7 (±3.7) 10.9 (±2.0) 3.3 (±0.8) 4.1 (±1.1)
Race/ethnicityWhite 26.6 (±4.0) 13.6 (±1.5) 8.3 (±1.9) 3.9 (±1.0)Black 34.3 (±3.1) 18.4 (±3.6) 4.3 (±1.2) 6.9 (±1.5)Hispanic 32.8 (±7.0) 19.0 (±5.2) 5.4 (±1.4) 8.3 (±3.9)
Total (middle school) 29.3 (±3.2) 15.4 (±1.9) 7.1 (±1.3) 5.4 (±1.1)
High school
SexMale 64.1 (±2.9) 51.1 (±3.1) 28.5 (±4.2) 16.6 (±2.5)Female 63.0 (±3.5) 31.9 (±2.8) 7.6 (±1.5) 11.5 (±2.5)
Race/ethnicityWhite 64.5 (±3.3) 45.1 (±2.8) 23.4 (±3.4) 12.8 (±2.8)Black 61.0 (±4.5) 35.0 (±6.9) 7.4 (±2.7) 16.8 (±4.2)Hispanic 65.1 (±3.2) 36.8 (±4.6) 10.7 (±2.4) 15.0 (±2.9)
Total (high school) 63.5 (±2.9) 41.6 (±2.6) 18.2 (±2.7) 14.1 (±2.4)
* Ever use of cigarettes was determined by asking, “Have you ever tried cigarette smoking, even one or two puffs?”Ever use of cigars was determined by asking, “Have you ever tried smoking cigars, cigarillos, or little cigars,even one or two puffs?” Ever use of smokeless tobacco was determined by asking, “Have you ever used chewingtobacco, snuff, or dip, such as Redman, Levi Garrett, Beechnut, Skoal, Skoal Bandits, or Copenhagen?” Ever useof bidis was determined by asking, “Have you ever tried smoking bidis, even one or two puffs?”
† Ninety-five percent confidence interval.

Vol. 49 / No. SS-10 MMWR 47
TABLE 3. Percentage of middle school and high school students who ever used* cigarettes,cigars, or smokeless tobacco, by state — State Youth Tobacco Surveys, 1998 and 1999
SmokelessCigarettes Cigars tobacco
Middle school
Arkansas, 1999 60.2 (±7.2)† 32.8 (±8.3) 27.3 (±4.8)Florida, 1998 43.7 (±1.8) 27.6 (±1.3) 11.9 (±0.9)Florida, 1999 41.0 (±2.1) 25.9 (±1.7) 9.3 (±0.9)Georgia, 1999 49.4 (±3.9) 29.7 (±3.9) 12.3 (±2.6)Kansas, 1999 41.3 (±6.6) 24.9 (±5.9) 17.3 (±4.7)Mississippi, 1998 54.3 (±3.8) 32.5 (±3.7) 18.1 (±2.9)Mississippi, 1999 57.2 (±4.2) 33.7 (±4.5) 18.8 (±2.7)Missouri, 1999 47.5 (±4.5) 24.0 (±2.7) 14.7 (±2.4)Nebraska, 1999 33.4 (±5.4) 20.5 (±3.1) 12.2 (±1.2)New Jersey, 1999 34.7 (±3.5) 21.8 (±1.9) 8.2 (±0.9)North Carolina, 1999 39.3 (±2.7) 22.4 (±2.1) 13.2 (±1.2)Oklahoma, 1999 46.2 (±5.6) 28.6 (±4.1) 18.6 (±3.4)South Dakota, 1999 36.9 (±6.7) 19.0 (±4.1) 17.4 (±3.7)Tennessee, 1999 44.2 (±4.3) 25.7 (±3.9) 15.6 (±3.3)Texas, 1998 53.1 (±2.7) 38.6 (±2.4) 18.0 (±1.6)Texas, 1999 47.7 (±4.7) 29.0 (±2.6) 13.6 (±1.9)Median 45.2 26.8 15.2
High school
Arkansas, 1999 71.9 (±5.0) 47.4 (±5.1) 27.0 (±5.1)Florida, 1998 68.1 (±1.5) 48.7 (±1.7) 20.0 (±1.5)Florida, 1999 60.7 (±2.1) 43.5 (±1.9) 15.2 (±1.7)Mississippi (private), 1998 73.3 (±4.9) 53.2 (±6.3) 40.7 (±4.9)Mississippi (private), 1999 73.2 (±2.5) 51.2 (±3.5) 31.8 (±5.3)Mississippi (public), 1998 75.6 (±2.7) 53.0 (±2.8) 26.2 (±3.9)Mississippi (public), 1999 77.2 (±2.4) 54.7 (±3.0) 24.3 (±4.5)New Jersey, 1999 63.6 (±2.8) 40.5 (±1.9) 16.1 (±1.6)North Carolina, 1999 68.2 (±2.4) 46.0 (±2.1) 21.5 (±2.1)Oklahoma, 1999 68.9 (±3.1) 52.0 (±3.2) 31.4 (±3.4)Tennessee, 1999 72.9 (±4.0) 51.7 (±4.0) 33.3 (±4.6)Texas, 1998 75.0 (±1.7) 53.3 (±1.8) 23.9 (±1.9)Texas, 1999 71.3 (±2.5) 47.4 (±2.3) 19.2 (±3.0)Median 71.9 51.2 24.3
* Ever use of cigarettes was determined by asking, “Have you ever tried cigarette smoking, even one or two puffs?”Ever use of cigars was determined by asking, “Have you ever tried smoking cigars, cigarillos, or little cigars,even one or two puffs?” Ever use of smokeless tobacco was determined by asking, “Have you ever used chewingtobacco, snuff, or dip, such as Redman, Levi Garrett, Beechnut, Skoal, Skoal Bandits, or Copenhagen?” Ever useof bidis was determined by asking, “Have you ever tried smoking bidis, even one or two puffs?”
† Ninety-five percent confidence interval.

48 MMWR October 13, 2000
TABLE 4. Percentage of middle school and high school students who were current users ofany tobacco product, cigarettes, cigars, smokeless tobacco, pipes, bidis, or kreteks, by sexand race/ethnicity — National Youth Tobacco Survey, 1999
Any Smokelesstobacco* Cigarettes Cigars tobacco Pipes Bidis Kreteks
Middle school
SexMale 14.2 (±2.2)† 9.6 (±1.7) 7.8 (±1.3) 4.2 (±1.3) 3.5 (±0.8) 3.1 (±0.8) 2.2 (±0.6)Female 11.3 (±2.2) 8.9 (±1.7) 4.4 (±1.3) 1.3 (±0.5) 1.4 (±0.6) 1.8 (±0.6) 1.7 (±0.7)
Race/ethnicityWhite 11.6 (±2.3) 8.8 (±2.0) 4.9 (±1.0) 3.0 (±1.1) 2.0 (±0.6) 1.8 (±0.5) 1.7 (±0.7)Black 14.4 (±2.7) 9.0 (±1.8) 8.9 (±2.3) 1.9 (±0.9) 2.0 (±0.9) 2.8 (±1.3) 1.7 (±0.8)Hispanic 15.2 (±5.2) 11.0 (±4.1) 7.6 (±2.9) 2.2 (±0.9) 3.8 (±1.7) 3.5 (±1.6) 2.1 (±0.6)
Total, middle school 12.8 (±2.0) 9.2 (±1.6) 6.1 (±1.1) 2.7 (±0.7) 2.4 (±0.5) 2.5 (±0.6) 1.9 (±0.5)
High school
SexMale 38.1 (±3.2) 28.7 (±2.8) 20.3 (±1.9) 11.7 (±2.8) 4.2 (±0.9) 6.1 (±1.0) 6.2 (±1.1)Female 31.4 (±3.1) 28.2 (±3.3) 10.2 (±1.6) 1.5 (±0.6) 1.4 (±0.5) 3.8 (±1.0) 5.3 (±1.5)
Race/ethnicityWhite 39.4 (±3.2) 32.9 (±3.1) 16.0 (±1.6) 8.7 (±2.1) 2.6 (±0.6) 4.4 (±0.9) 6.5 (±1.5)Black 24.0 (±4.2) 15.9 (±3.8) 14.8 (±3.5) 2.4 (±1.3) 1.9 (±0.9) 5.8 (±2.1) 2.8 (±1.5)Hispanic 30.7 (±4.4) 25.8 (±4.7) 13.4 (±2.9) 3.7 (±1.6) 3.8 (±1.4) 5.6 (±2.1) 5.5 (±1.9)
Total, high school 34.8 (±2.6) 28.5 (±2.6) 15.3 (±1.4) 6.6 (±1.6) 2.8 (±0.5) 5.0 (±0.8) 5.8 (±1.2)
* Current use of cigarettes or cigars or smokeless tobacco or pipes or bidis or kreteks on �1 of the 30 dayspreceding the survey.
† Ninety-five percent confidence interval.

Vol. 49 / No. SS-10 MMWR 49
TABLE 5. Percentage of middle school and high school students who were current users ofany tobacco product, cigarettes, cigars, smokeless tobacco, or pipes, by state — StateYouth Tobacco Surveys, 1998 and 1999
Any Smokelesstobacco* Cigarettes Cigars tobacco Pipes
Middle school
Arkansas, 1999 30.3 (±6.2)† 23.4 (±6.1) 11.5 (±4.0) 12.0 (±3.3) 6.2 (±2.9)Florida, 1998 24.4 (±1.5) 18.5 (±1.4) 14.1 (±1.0) 6.9 (±0.7) NA§
Florida, 1999 19.2 (±1.5) 15.0 (±1.3) 11.9 (±1.1) 4.9 (±0.6) NAGeorgia, 1999 18.8 (±4.0) 13.8 (±3.3) 8.2 (±1.9) 4.4 (±2.0) 3.9 (±1.7)Kansas, 1999 20.2 (±5.9) 16.1 (±5.4) 8.8 (±3.1) 6.3 (±2.3) 3.5 (±0.8)Mississippi, 1998 28.4 (±2.9) 20.6 (±2.7) 16.4 (±3.2) 9.6 (±1.9) NAMississippi, 1999 30.4 (±3.4) 23.0 (±3.2) 16.6 (±2.7) 9.1 (±1.7) NAMissouri, 1999 19.5 (±3.0) 14.9 (±2.9) 8.1 (±1.5) 4.6 (±1.1) 1.5 (±0.6)Nebraska, 1999 13.8 (±2.7) 10.0 (±2.3) 5.7 (±1.4) 3.2 (±0.5) 3.5 (±0.7)New Jersey, 1999 16.3 (±2.0) 10.5 (±1.8) 9.3 (±1.0) 4.3 (±0.8) NANorth Carolina, 1999 18.4 (±2.3) 15.0 (±2.2) 7.9 (±1.3) 3.9 (±0.9) 3.4 (±0.7)Oklahoma, 1999 21.0 (±3.7) 16.9 (±3.8) 9.6 (±2.0) 6.7 (±1.6) 4.9 (±1.1)South Dakota, 1999 16.3 (±4.1) 12.4 (±3.4) 5.6 (±1.8) 5.6 (±2.1) 3.3 (±2.0)Tennessee, 1999 20.9 (±4.0) 13.7 (±2.4) 9.3 (±3.0) 6.0 (±2.4) 4.2 (±1.2)Texas, 1998 30.6 (±2.4) 20.5 (±1.9) 14.2 (±1.5) 6.5 (±1.0) 8.5 (±1.1)Texas, 1999 22.6 (±2.4) 14.8 (±2.2) 9.7 (±1.5) 5.9 (±1.1) 5.2 (±1.2)Median 20.6 15.0 9.4 6.0 3.9
High school
Arkansas, 1999 44.1 (±5.5) 35.3 (±5.3) 21.3 (±3.5) 14.1 (±3.5) 6.1 (±1.9)Florida, 1998 35.3 (±1.6) 27.4 (±1.6) 20.7 (±1.2) 6.7 (±1.0) NAFlorida, 1999 32.3 (±1.9) 25.2 (±1.8) 19.5 (±1.5) 6.4 (±0.9) 4.5 (±0.5)Mississippi (private), 1998 46.3 (±6.3) 39.0 (±5.3) 16.8 (±3.7) 16.6 (±4.7) NAMississippi (private), 1999 44.7 (±3.4) 38.6 (±2.2) 16.3 (±2.6) 14.6 (±4.7) NAMississippi (public), 1998 39.7 (±4.6) 30.3 (±3.8) 22.3 (±3.6) 9.4 (±2.6) NAMississippi (public), 1999 42.0 (±3.2) 32.5 (±3.3) 20.3 (±1.6) 9.6 (±1.7) NANew Jersey, 1999 35.9 (±2.5) 27.6 (±2.6) 18.4 (±1.3) 10.7 (±1.4) NANorth Carolina, 1999 38.3 (±2.2) 31.6 (±2.2) 19.7 (±1.5) 7.9 (±1.5) 5.3 (±1.1)Oklahoma, 1999 42.0 (±3.2) 33.0 (±3.2) 19.7 (±2.0) 13.0 (±1.9) 5.3 (±1.1)Tennessee, 1999 44.5 (±4.4) 36.4 (±3.9) 19.1 (±2.6) 13.4 (±3.1) 4.9 (±1.9)Texas, 1998 43.5 (±1.9) 32.9 (±1.9) 19.4 (±1.7) 9.0 (±1.1) 7.7 (±1.1)Texas, 1999 42.0 (±1.9) 32.7 (±3.3) 19.7 (±1.9) 8.8 (±1.7) 5.0 (±1.4)Median 42.0 32.7 19.7 9.6 5.3
* Current use of cigarettes or cigars or smokeless tobacco or pipes or bidis or kreteks on �1 of the 30 dayspreceding the survey.
† Ninety-five percent confidence interval.§ Question not asked.

50 MMWR October 13, 2000
TABLE 6. Percentage of middle school and high school students who ever smoked daily andcurrent smokers who smoked �6 cigarettes per day on the days they smoked, by sex andrace/ethnicity — National Youth Tobacco Survey, 1999
Current smokers whoAll students who smoked �6 cigarettes per day
ever smoked daily* on the days they smoked†
Middle school
SexMale 4.6 (±1.0)§ 18.4 (±5.9)Female 3.9 (±0.9) 12.3 (±3.3)
Race/ethnicityWhite 4.6 (±1.0) 18.5 (±4.7)Black 2.7 (±0.8) 9.7 (±5.5)Hispanic 3.9 (±1.6) 5.5 (±4.4)
Total (middle school) 4.2 (±0.8) 15.4 (±3.5)
High school
SexMale 20.2 (±2.2) 32.7 (±4.3)Female 19.9 (±2.7) 25.2 (±3.7)
Race/ethnicityWhite 24.1 (±2.8) 32.0 (±3.7)Black 10.4 (±2.5) 19.3 (±8.2)Hispanic 16.2 (±3.6) 21.2 (±6.9)
Total (high school) 20.1 (±2.2) 29.1 (±3.1)
* Students were asked, “Have you ever smoked cigarettes daily, that is, at least one cigarette every day for 30days?”
† Students were asked, “During the past 30 days, on the days you smoked, how many cigarettes did you smoke perday?”
§ Ninety-five percent confidence interval.

Vol. 49 / No. SS-10 MMWR 51
TABLE 7. Percentage of middle school and high school students who ever smoked daily andcurrent smokers who smoked �6 cigarettes per day on the days they smoked, by state —State Youth Tobacco Surveys, 1998 and 1999
Current smokers whoAll students who smoked �6 cigarettes per day
ever smoked daily* on the days they smoked†
Middle school
Arkansas, 1999 12.8 (±4.3)§ 23.5 (± 9.7)Florida, 1998 12.2 (±1.2) 20.6 (± 3.0)Florida, 1999 8.1 (±1.0) 19.9 (± 2.7)Georgia, 1999 8.2 (±2.8) 17.0 (± 4.8)Kansas, 1999 10.6 (±4.0) 31.0 (±13.8)Mississippi, 1998 12.4 (±2.2) 18.2 (± 5.7)Mississippi, 1999 11.2 (±2.1) 11.7 (± 3.9)Missouri, 1999 NA¶ 23.1 (± 7.3)Nebraska, 1999 5.7 (±1.1) 15.4 (± 4.9)New Jersey, 1999 6.4 (±1.0) 11.9 (± 3.2)North Carolina, 1999 7.5 (±1.4) 11.1 (± 2.7)Oklahoma, 1999 11.4 (±2.6) 16.3 (± 4.3)South Dakota, 1999 5.9 (±1.9) 13.1 (± 4.7)Tennessee, 1999 8.3 (±2.0) 21.8 (± 6.0)Texas, 1998 14.1 (±1.5) 13.1 (± 2.6)Texas, 1999 10.6 (±1.5) 14.4 (± 3.8)Median 10.6 16.6
High school
Arkansas, 1999 26.5 (±4.5) 35.7 (± 7.7)Florida, 1998 23.8 (±1.4) 31.7 (± 2.2)Florida, 1999 20.5 (±1.5) 35.3 (± 3.4)Mississippi (private), 1998 28.8 (±3.6) 32.8 (± 4.4)Mississippi (private), 1999 27.8 (±3.0) 29.3 (± 5.0)Mississippi (public), 1998 25.6 (±3.9) 30.0 (± 4.3)Mississippi (public), 1999 26.4 (±4.2) 32.8 (± 4.5)New Jersey, 1999 22.5 (±2.7) 35.7 (± 4.1)North Carolina, 1999 23.2 (±2.1) 32.7 (± 4.1)Oklahoma, 1999 25.8 (±3.1) 33.7 (± 4.2)Tennessee, 1999 28.2 (±3.2) 39.7 (± 8.1)Texas, 1998 25.9 (±2.0) 27.1 (± 3.0)Texas, 1999 22.4 (±2.4) 26.0 (± 3.0)Median 25.8 32.8
* Students were asked, “Have you ever smoked cigarettes daily, that is, at least one cigarette every day for 30days?”
† Students were asked, “During the past 30 days, on the days you smoked, how many cigarettes did you smoke perday?”
§ Ninety-five percent confidence interval.¶ Question not asked.

52 MMWR October 13, 2000
TABLE 8. Percentage of middle school and high school students who first used* cigarettes,cigars, or smokeless tobacco before 11 years of age, by sex and race/ethnicity — NationalYouth Tobacco Survey, 1999
SmokelessCigarettes Cigars tobacco
Middle school
SexMale 9.0 (±1.6)† 4.9 (±1.0) 6.5 (±1.0)Female 7.3 (±1.6) 1.4 (±0.4) 3.1 (±0.8)
Race/ethnicityWhite 7.8 (±1.8) 3.4 (±1.0) 4.6 (±0.8)Black 8.0 (±1.8) 2.6 (±1.0) 4.6 (±1.2)Hispanic 9.5 (±3.9) 2.4 (±0.8) 5.4 (±1.8)
Total (middle school) 8.2 (±1.4) 3.1 (±0.6) 4.8 (±0.6)
High school
SexMale 10.4 (±1.4) 6.5 (±2.0) 5.2 (±1.0)Female 6.8 (±1.4) 1.6 (±0.6) 1.8 (±0.4)
Race/ethnicityWhite 9.2 (±1.6) 4.8 (±1.6) 3.8 (±0.6)Black 5.3 (±1.6) 2.6 (±1.4) 2.0 (±1.4)Hispanic 10.6 (±2.7) 2.3 (±1.0) 4.0 (±1.4)
Total (high school) 8.6 (±1.2) 4.1 (±1.2) 3.5 (±0.6)
* Age of initiation was determined by asking students these questions: “How old were you when you smoked a wholecigarette for the first time?” “How old were you when you smoked a cigar, cigarillo, or little cigar for the firsttime?” “How old were you when you used chewing tobacco, snuff, or dip for the first time?”
† Ninety-five percent confidence interval.

Vol. 49 / No. SS-10 MMWR 53
TABLE 9. Percentage of middle school and high school students who first used* cigarettes,cigars, or smokeless tobacco before 11 years of age, by state — State Youth TobaccoSurveys, 1998 and 1999
SmokelessCigarettes Cigars tobacco
Middle school
Arkansas, 1999 17.5 (±4.9)† 9.3 (±2.6) 12.0 (±3.1)Florida, 1998 NA§ NA NAFlorida, 1999 NA NA NAGeorgia, 1999 6.4¶ (±2.2) 3.4¶ (±1.5) 3.4¶ (±1.1)Kansas, 1999 12.5 (±3.2) 7.7 (±2.5) 9.0 (±2.0)Mississippi, 1998 9.9 (±1.8) NA NAMississippi, 1999 10.8 (±1.6) NA NAMissouri, 1999 14.3 (±2.4) 6.7 (±1.7) 6.2 (±1.7)Nebraska, 1999 10.1 (±1.9) 6.4 (±1.3) 4.0 (±0.8)New Jersey, 1999 7.2 (±1.2) NA NANorth Carolina, 1999 11.2 (±1.4) 6.5 (±1.1) 5.5 (±0.9)Oklahoma, 1999 14.8 (±2.5) 7.1 (±1.7) 8.2 (±1.9)South Dakota, 1999 11.4 (±3.8) 7.0 (±2.0) 7.7 (±2.4)Tennessee, 1999 10.1 (±2.2) 6.9 (±2.3) 7.1 (±2.0)Texas, 1998 10.5¶ (±2.5) 7.6¶ (±2.3) 6.0¶ (±3.1)Texas, 1999 8.1¶ (±4.6) 5.2¶ (±1.8) 5.0¶ (±2.2)Median 11.2 7.0 7.4
High school
Arkansas, 1999 11.1 (±2.8) 4.7 (±1.8) 8.9 (±2.3)Florida, 1998 NA NA NAFlorida, 1999 NA NA NAMississippi (private), 1998 11.6 (±3.4) 3.7¶ (±0.7) 8.7¶ (±3.2)Mississippi (private), 1999 10.6 (±1.9) 2.7¶ (±1.0) 6.9¶ (±1.4)Mississippi (public), 1998 12.5 (±2.0) 4.0¶ (±1.2) 7.7¶ (±1.6)Mississippi (public), 1999 9.8 (±2.2) 3.3¶ (±1.1) 8.4¶ (±2.1)New Jersey, 1999 8.8 (±1.7) NA NANorth Carolina, 1999 10.9 (±1.6) 5.6 (±0.9) 5.7 (±1.1)Oklahoma, 1999 10.7 (±1.7) 4.6 (±0.7) 8.3 (±1.5)Tennessee, 1999 11.4 (±2.2) 6.9 (±1.9) 10.2 (±3.4)Texas, 1998 7.2¶ (±2.8) 5.2¶ (±2.7) 4.5¶ (±2.2)Texas, 1999 6.9¶ (±3.4) 2.8¶ (±2.4) 3.5¶ (±2.5)Median 10.9 5.2 8.6
* Age of initiation was determined by asking students these questions: “How old were you when you smoked a wholecigarette for the first time?” “How old were you when you smoked a cigar, cigarillo, or little cigar for the firsttime?” “How old were you when you used chewing tobacco, snuff, or dip for the first time?”
† Ninety-five percent confidence interval.§ Question not asked.¶ Response categories were different in these states; age of initiation was <10 years.
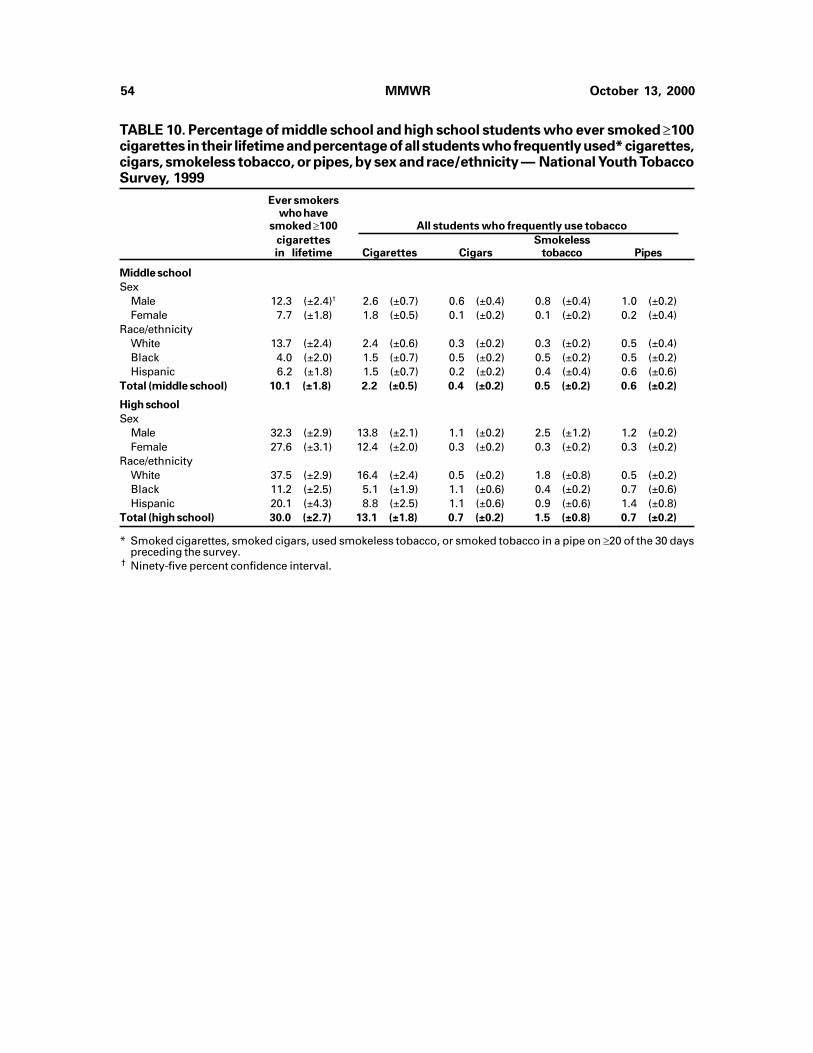
54 MMWR October 13, 2000
TABLE 10. Percentage of middle school and high school students who ever smoked �100cigarettes in their lifetime and percentage of all students who frequently used* cigarettes,cigars, smokeless tobacco, or pipes, by sex and race/ethnicity — National Youth TobaccoSurvey, 1999
Ever smokerswho have
smoked �100 All students who frequently use tobacco
cigarettes Smokelessin lifetime Cigarettes Cigars tobacco Pipes
Middle school
SexMale 12.3 (±2.4)† 2.6 (±0.7) 0.6 (±0.4) 0.8 (±0.4) 1.0 (±0.2)Female 7.7 (±1.8) 1.8 (±0.5) 0.1 (±0.2) 0.1 (±0.2) 0.2 (±0.4)
Race/ethnicityWhite 13.7 (±2.4) 2.4 (±0.6) 0.3 (±0.2) 0.3 (±0.2) 0.5 (±0.4)Black 4.0 (±2.0) 1.5 (±0.7) 0.5 (±0.2) 0.5 (±0.2) 0.5 (±0.2)Hispanic 6.2 (±1.8) 1.5 (±0.7) 0.2 (±0.2) 0.4 (±0.4) 0.6 (±0.6)
Total (middle school) 10.1 (±1.8) 2.2 (±0.5) 0.4 (±0.2) 0.5 (±0.2) 0.6 (±0.2)
High school
SexMale 32.3 (±2.9) 13.8 (±2.1) 1.1 (±0.2) 2.5 (±1.2) 1.2 (±0.2)Female 27.6 (±3.1) 12.4 (±2.0) 0.3 (±0.2) 0.3 (±0.2) 0.3 (±0.2)
Race/ethnicityWhite 37.5 (±2.9) 16.4 (±2.4) 0.5 (±0.2) 1.8 (±0.8) 0.5 (±0.2)Black 11.2 (±2.5) 5.1 (±1.9) 1.1 (±0.6) 0.4 (±0.2) 0.7 (±0.6)Hispanic 20.1 (±4.3) 8.8 (±2.5) 1.1 (±0.6) 0.9 (±0.6) 1.4 (±0.8)
Total (high school) 30.0 (±2.7) 13.1 (±1.8) 0.7 (±0.2) 1.5 (±0.8) 0.7 (±0.2)
* Smoked cigarettes, smoked cigars, used smokeless tobacco, or smoked tobacco in a pipe on �20 of the 30 dayspreceding the survey.
† Ninety-five percent confidence interval.

Vol. 49 / No. SS-10 MMWR 55
TABLE 11. Percentage of middle school and high school students who have ever smoked�100 cigarettes in their lifetime and percentage of all students who frequently used*cigarettes, cigars, smokeless tobacco, or pipes, by state — State Youth Tobacco Surveys,1998 and 1999
Ever smokerswho have
smoked �100 All students who frequently use tobacco
cigarettes Smokelessin lifetime Cigarettes Cigars tobacco Pipes
Middle school
Arkansas, 1999 NA† NA 0.4 (±0.6)§ 1.8 (±1.0) 1.8 (±0.8)Florida, 1998 NA 5.4 (±0.9) 1.4 (±0.2) 1.1 (±0.3) NAFlorida, 1999 12.8 (±1.6) 4.1 (±0.6) 1.7 (±0.3) 1.1 (±0.3) NAGeorgia, 1999 9.8 (±3.8) 3.9 (±2.0) 0.6 (±0.4) 0.9 (±0.6) 0.3 (±0.3)Kansas, 1999 19.5 (±7.2) 5.3 (±2.1) 1.2 (±0.7) 1.2 (±0.7) 0.7 (±0.5)Mississippi, 1998 NA 5.2 (±1.7) 1.7 (±1.0) 2.2 (±1.0) NAMississippi, 1999 NA 4.8 (±1.2) 0.9 (±0.4) 1.3 (±0.5) NAMissouri, 1999 17.1 (±3.9) 4.4 (±1.5) NA 0.7 (±0.3) 0.3 (±0.2)Nebraska, 1999 12.0 (±1.8) 2.6 (±0.7) 0.8 (±0.2) 0.6 (±0.3) 0.6 (±0.2)New Jersey, 1999 3.3 (±0.7) 2.2 (±0.7) 1.1 (±0.3) 0.7 (±0.2) NANorth Carolina, 1999 12.5 (±2.4) 3.2 (±0.8) 0.8 (±0.3) 0.7 (±0.3) 0.3 (±0.2)Oklahoma, 1999 14.2 (±3.0) 5.4 (±1.6) 1.2 (±0.7) 1.6 (±0.6) 0.8 (±0.4)South Dakota, 1999 12.7 (±4.1) 2.2 (±1.0) 0.2 (±0.1) 1.1 (±0.6) 0.3 (±0.3)Tennessee, 1999 12.6 (±3.3) 3.8 (±1.5) 1.0 (±0.5) 1.1 (±0.6) 0.9 (±0.9)Texas, 1998 NA 3.6 (±0.7) 1.0 (±0.3) 1.2 (±0.4) 0.7 (±0.3)Texas, 1999 11.2 (±2.7) 3.0 (±0.8) 1.2 (±0.5) 1.4 (±0.5) 0.8 (±0.4)Median 12.6 3.8 1.0 1.1 0.7
High school
Arkansas, 1999 NA NA 2.4 (±1.0) 4.8 (±2.1) 1.4 (±0.9)Florida, 1998 NA 13.5 (±1.2) 2.0 (±0.4) 2.3 (±0.4) NAFlorida, 1999 30.0 (±2.0) 12.5 (±1.4) 2.5 (±0.5) 2.5 (±0.5) 1.5 (±0.3)Mississippi (private), 1998 NA 18.3 (±3.0) NA 7.9 (±2.4) NAMississippi (private), 1999 NA 17.0 (±1.8) NA 5.6 (±2.1) NAMississippi (public), 1998 NA 14.3 (±2.5) NA 3.7 (±1.6) NAMississippi (public), 1999 NA 16.6 (±3.0) 2.7 (±1.0) 3.2 (±1.0) NANew Jersey, 1999 19.3 (±2.5) 13.8 (±2.2) 2.0 (±0.7) 1.4 (±0.4) NANorth Carolina, 1999 31.7 (±2.8) 15.5 (±1.9) 1.9 (±0.5) 2.1 (±0.5) 0.9 (±0.3)Oklahoma, 1999 35.3 (±3.9) 16.5 (±2.8) 2.3 (±0.8) 5.5 (±1.3) 0.9 (±0.5)Tennessee, 1999 38.9 (±4.3) 21.1 (±3.2) 1.6 (±0.9) 4.2 (±1.4) 0.3 (±0.3)Texas, 1998 NA 13.0 (±1.4) 1.7 (±0.5) 3.0 (±0.6) 0.6 (±0.2)Texas, 1999 28.0 (±2.9) 13.6 (±2.1) 1.8 (±0.5) 2.9 (±0.8) 0.8 (±0.5)Median 30.8 14.3 2.0 3.2 0.9
* Smoked cigarettes, smoked cigars, used smokeless tobacco, or smoked tobacco in a pipe on �20 of the 30 dayspreceding the survey.
† Question not asked.§ Ninety-five percent confidence interval.

56 MMWR October 13, 2000
TABLE 12. Usual brand of cigarette smoked in the 30 days preceding the survey by currentsmokers in middle school and high school (percentage distribution), by sex and race/ethnicity — National Youth Tobacco Survey, 1999
No usualMarlboro® Newport® Camel® Other* brand Total†
Middle school
SexMale 45.5 24.4 8.1 12.4 9.6 100.0
Female 39.8 26.2 5.7 13.1 15.1 100.0
Race/ethnicityWhite 48.0 17.1 9.6 13.2 12.2 100.0
Black 7.0 62.4 1.6 18.2 10.8 100.0
Hispanic 61.1 14.3 3.8 6.6 14.2 100.0
Total (middle school) 42.7 25.3 6.9 12.8 12.3 100.0
High school
SexMale 50.4 19.3 13.2 8.4 8.6 100.0
Female 56.8 18.4 7.0 10.0 7.8 100.0
Race/ethnicityWhite 59.9 11.6 12.3 7.3 8.9 100.0
Black 8.3 59.4 0.5 26.0 5.8 100.0
Hispanic 52.9 28.8 5.0 7.2 6.1 100.0
Total (high school) 53.6 18.8 10.1 9.2 8.2 100.0
* Includes Virginia Slims,® GPC,® Basic,® and Doral.®† Some totals might not add to 100% because of rounding.

Vol. 49 / No. SS-10 MMWR 57
TABLE 13. Usual brand of cigarettes smoked by current smokers in middle school and highschool in the 30 days preceding the survey (percentage distribution), by state — StateYouth Tobacco Surveys, 1998 and 1999
No usualMarlboro® Newport® Camel® Other* brand Total†
Middle school
Arkansas, 1999 50.4 27.0 3.8 10.1 8.7 100.0
Florida, 1998 47.9 26.2 5.1 13.8 7.0 100.0
Florida, 1999 46.1 30.2 5.0 11.8 6.9 100.0
Georgia, 1999 36.2 42.1 6.2 11.3 4.2 100.0
Kansas, 1999 56.8 16.0 7.7 11.4 8.2 100.0
Mississippi, 1998 42.5 35.1 3.6 15.7 3.1 100.0
Mississippi, 1999 36.7 38.8 4.0 14.9 5.6 100.0
Missouri, 1999 NA§ NA NA NA NA NA
Nebraska, 1999 48.5 15.0 7.5 15.3 13.7 100.0
New Jersey, 1999 27.8 47.3 2.4 10.2 12.3 100.0
North Carolina, 1999 30.3 42.3 5.9 10.9 10.6 100.0
Oklahoma, 1999 61.9 10.8 6.1 14.9 6.4 100.0
South Dakota, 1999 48.8 10.7 15.0 10.1 15.3 100.0
Tennessee, 1999 50.3 22.8 3.7 15.1 8.1 100.0
Texas, 1998 62.1 11.3 7.7 11.5 7.4 100.0
Texas, 1999 59.6 9.9 7.7 12.6 10.2 100.0
Median 48.5 26.2 5.9 11.8 8.1
High school
Arkansas, 1999 61.0 21.2 8.1 5.8 4.0 100.0
Florida, 1998 53.8 29.6 4.9 7.5 4.2 100.0
Florida, 1999 50.9 32.3 4.7 8.0 4.1 100.0
Mississippi (private), 1998 82.1 3.2 5.9 5.8 3.0 100.0
Mississippi (private), 1999 75.8 6.4 9.1 5.4 3.3 100.0
Mississippi (public), 1998 63.3 25.8 2.9 6.9 1.1 100.0
Mississippi (public), 1999 58.4 24.3 5.3 7.8 4.2 100.0
New Jersey, 1999 34.2 43.0 4.5 11.5 6.9 100.0
North Carolina, 1999 39.2 33.1 14.9 6.6 6.2 100.0
Oklahoma, 1999 72.7 7.3 7.7 8.3 3.9 100.0
Tennessee, 1999 66.9 16.5 5.6 6.2 4.8 100.0
Texas, 1998 74.3 8.5 5.2 7.6 4.4 100.0
Texas, 1999 66.7 13.7 6.1 8.2 5.3 100.0
Median 62.2 22.8 5.4 7.2 4.2
* Includes Virginia Slims,® GPC,® Basic,® and Doral.®† Some totals might not add to 100% because of rounding.§ Question not asked.

58 MMWR October 13, 2000
TABLE 14. Percentage of middle school and high school students who never smokedcigarettes, by smoking intentions, susceptibility* to initiate cigarette smoking, sex, andrace/ethnicity — National Youth Tobacco Survey, 1999
Woulddefinitely not
Will definitely smoke if bestWill not try a not smoke in friend offeredcigarette soon the next year a cigarette Not susceptible Susceptible
Middle school
SexMale 96.3 (±1.0)† 84.7 (±2.6) 83.9 (±2.0) 75.8 (±2.5) 24.2 (±2.5)Female 96.2 (±1.0) 85.8 (±2.0) 84.5 (±1.6) 78.3 (±2.1) 21.7 (±2.1)
Race/ethnicityWhite 96.9 (±0.8) 86.0 (±2.2) 83.8 (±1.8) 78.1 (±2.0) 21.9 (±2.0)Black 95.9 (±1.4) 84.7 (±2.6) 84.6 (±2.2) 75.0 (±3.2) 25.0 (±3.2)Hispanic 94.5 (±0.8) 83.5 (±4.3) 85.5 (±2.4) 76.6 (±3.9) 23.4 (±3.9)
Total (middle school) 96.2 (±0.6) 85.3 (±1.8) 84.2 (±1.4) 77.1 (±1.6) 22.9 (±1.6)
High school
SexMale 97.5 (±1.0) 83.4 (±3.3) 84.4 (±2.2) 76.8 (±3.3) 23.2 (±3.3)Female 97.6 (±1.0) 80.6 (±3.1) 85.2 (±2.7) 75.8 (±3.5) 24.2 (±3.5)
Race/ethnicityWhite 97.8 (±1.2) 80.5 (±3.1) 83.2 (±2.6) 75.8 (±3.2) 24.2 (±3.2)Black 97.9 (±2.4) 84.9 (±6.7) 89.4 (±4.1) 78.7 (±7.4) 21.3 (±7.4)Hispanic 95.9 (±2.6) 82.2 (±4.1) 85.6 (±3.5) 72.2 (±3.9) 27.3 (±3.9)
Total (high school) 97.6 (±0.8) 82.0 (±2.6) 84.8 (±2.0) 76.3 (±2.7) 23.7 (±2.7)
* Students were considered not susceptible if they answered, “No, will not try a cigarette soon” and “Definitely no,will not smoke in the next year” and “Definitely no, would not smoke if best friend offered.” All other students wereconsidered susceptible.
† Ninety-five percent confidence interval.

Vol. 49 / No. SS-10 MMWR 59
TABLE 15. Percentage of middle school and high school students who never smokedcigarettes, by smoking intentions, susceptibility* to initiate cigarette smoking, and state— State Youth Tobacco Surveys, 1998 and 1999
Woulddefinitely not
Will definitely smoke if bestWill not try a not smoke in friend offeredcigarette soon the next year a cigarette Not susceptible Susceptible
Middle school
Arkansas, 1999 88.1 (±8.4)† 76.9 (±4.0) 77.4 (±5.2) 64.2 (±9.3) 35.8 (±9.3)Florida, 1998 88.6 (±0.9) 76.3 (±1.3) 79.1 (±1.2) 66.8 (±1.4) 33.2 (±1.4)Florida, 1999 95.0 (±0.6) 82.1 (±1.5) 83.5 (±1.3) 70.5 (±1.7) 29.5 (±1.7)Georgia, 1999 91.5 (±2.5) 82.4 (±4.0) 83.2 (±3.3) 71.8 (±4.2) 28.2 (±4.2)Kansas, 1999 93.3 (±2.7) 79.8 (±3.3) 78.0 (±3.3) 68.1 (±4.4) 31.9 (±4.4)Mississippi, 1998 90.4 (±2.1) 74.6 (±3.9) 77.3 (±2.9) 64.2 (±4.0) 35.8 (±4.0)Mississippi, 1999 90.7 (±2.1) 76.9 (±3.2) 79.6 (±3.0) 67.3 (±3.6) 32.7 (±3.6)Missouri, 1999 95.6 (±1.6) 78.5 (±2.9) NA§ NA NANebraska, 1999 93.2 (±1.6) 83.3 (±1.9) 84.2 (±1.8) 73.0 (±2.8) 27.0 (±2.8)New Jersey, 1999 92.5 (±0.8) 78.3 (±1.6) 79.5 (±1.7) 69.1 (±1.9) 30.9 (±1.9)North Carolina, 1999 94.2 (±1.0) 83.9 (±1.7) 84.3 (±1.6) 74.7 (±1.8) 25.3 (±1.8)Oklahoma, 1999 95.9 (±1.1) 81.9 (±2.7) 82.3 (±2.2) 74.0 (±2.2) 26.0 (±2.2)South Dakota, 1999 93.3 (±1.1) 81.3 (±2.9) 80.3 (±2.5) 70.2 (±3.3) 29.8 (±3.3)Tennessee, 1999 92.5 (±2.6) 79.8 (±3.5) 82.0 (±2.8) 70.2 (±4.3) 29.8 (±4.3)Texas, 1998 81.9 (±2.5) 74.2 (±1.8) 74.2 (±1.4) 60.8 (±3.5) 39.2 (±3.5)Texas, 1999 87.3 (±3.4) 81.5 (±2.3) 80.2 (±2.1) 75.2 (±2.5) 24.8 (±2.5)Median 92.5 79.8 80.2 70.2 29.8
High school
Arkansas, 1999 94.0 (±2.6) 83.4 (±5.5) 84.7 (±4.5) 75.8 (±5.3) 24.2 (±5.3)Florida, 1998 90.6 (±1.2) 81.0 (±1.6) 84.0 (±1.4) 73.3 (±1.8) 26.7 (±1.8)Florida, 1999 95.3 (±0.3) 84.1 (±1.7) 85.1 (±3.0) 76.8 (±2.8) 23.2 (±2.8)Mississippi (private), 1998 93.2 (±2.2) 72.5 (±4.4) 81.5 (±3.3) 69.3 (±3.6) 30.7 (±5.6)Mississippi (private), 1999 94.6 (±1.8) 79.2 (±3.5) 83.9 (±2.9) 74.2 (±3.6) 25.8 (±3.6)Mississippi (public), 1998 93.1 (±2.2) 76.6 (±4.9) 79.5 (±4.3) 67.4 (±3.6) 32.6 (±5.2)Mississippi (public), 1999 94.4 (±1.8) 84.1 (±4.6) 86.2 (±4.2) 76.8 (±5.1) 23.2 (±5.1)New Jersey, 1999 94.4 (±1.3) 77.8 (±2.6) 82.2 (±3.0) 70.3 (±2.7) 29.7 (±2.7)North Carolina, 1999 94.7 (±1.3) 79.6 (±2.4) 82.5 (±2.1) 73.7 (±2.7) 26.3 (±2.7)Oklahoma, 1999 96.0 (±1.9) 85.6 (±3.6) 86.4 (±3.3) 79.0 (±4.0) 21.0 (±4.0)Tennessee, 1999 96.9 (±1.8) 82.0 (±3.1) 85.8 (±3.8) 77.5 (±4.5) 22.5 (±4.5)Texas, 1998 78.7 (±2.6) 76.7 (±1.3) 79.4 (±2.8) 67.0 (±2.5) 33.0 (±2.5)Texas, 1999 84.4 (±3.5) 83.4 (±2.6) 82.6 (±2.9) 81.9 (±3.5) 18.1 (±3.5)Median 94.4 81.0 83.9 74.2 25.8
* Students were considered not susceptible if they answered, “No, will not try a cigarette soon” and “Definitely no,will not smoke in the next year” and “Definitely no, would not smoke if best friend offered.” All other studentswere considered susceptible.
† Ninety-five percent confidence interval.§ Question not asked.

60 MMWR October 13, 2000
TABLE 16. Percentage of middle school and high school students with peers who usetobacco, by smoking status, sex, and race/ethnicity — National Youth Tobacco Survey,1999
One or more best friends One or more best friendssmoke cigarettes use smokeless tobacco
Never Current Never Currentsmokers smokers smokers smokers
Middle school
SexMale 20.0 (±3.2)* 89.2 (±3.8) 11.2 (±1.8) 48.9 (±5.7)Female 19.3 (±2.6) 90.9 (±4.2) 8.4 (±1.6) 36.4 (±4.9)
Race/ethnicityWhite 18.2 (±3.3) 91.9 (±3.2) 9.6 (±2.2) 50.5 (±5.3)Black 24.1 (±4.6) 85.3 (±9.9) 10.7 (±2.0) 26.8 (±5.9)Hispanic 21.4 (±3.9) 89.3 (±5.5) 9.6 (±2.2) 38.0 (±6.9)
Total (middle school) 19.7 (±2.5) 89.9 (±2.9) 9.7 (±1.4) 43.3 (±4.5)
High school
SexMale 40.2 (±3.8) 92.8 (±1.7) 21.4 (±3.3) 49.1 (±7.4)Female 36.5 (±3.6) 94.5 (±1.9) 14.2 (±3.5) 24.6 (±4.5)
Race/ethnicityWhite 38.2 (±3.5) 94.7 (±1.2) 19.3 (±3.7) 43.7 (±6.9)Black 37.5 (±6.1) 83.2 (±5.7) 13.1 (±2.9) 18.0 (±6.5)Hispanic 43.4 (±4.8) 95.3 (±2.9) 17.8 (±3.5) 29.8 (±7.8)
Total (high school) 38.3 (±2.7) 93.7 (±1.3) 17.6 (±2.5) 38.2 (±5.9)
* Ninety-five percent confidence interval.

Vol. 49 / No. SS-10 MMWR 61
TABLE 17. Percentage of middle school and high school students with peers who usetobacco, by smoking status and state — State Youth Tobacco Surveys, 1998 and 1999
One or more best friends One or more best friendssmoke cigarettes use smokeless tobacco
Never Current Never Currentsmokers smokers smokers smokers
Middle school
Arkansas, 1999 55.9 (± 7.4)* 91.7 (± 5.4) 36.3 (±6.1) 55.2 (± 5.6)Florida, 1998 21.6 (± 1.5) 90.5 (± 1.6) 7.1 (±0.9) 33.6 (± 2.5)Florida, 1999 22.9 (± 1.8) 94.4 (± 1.6) 6.2 (±1.0) 33.7 (± 3.5)Georgia, 1999 31.8 (± 4.0) 83.0 (± 6.3) 16.0 (±4.4) 38.0 (± 9.2)Kansas, 1999 26.4 (± 4.9) 89.1 (± 5.8) 14.7 (±4.2) 47.9 (±11.6)Mississippi, 1998 36.4 (± 4.3) 91.3 (± 2.4) NA† NAMississippi, 1999 33.3 (± 4.7) 89.3 (± 3.3) NA NAMissouri, 1999 23.4 (± 3.8) 89.7 (± 4.4) 13.4 (±3.2) 32.5 (± 5.4)Nebraska, 1999 17.9 (± 3.4) 85.6 (± 4.6) 9.2 (±1.8) 41.9 (± 6.3)New Jersey, 1999 23.6 (± 1.8) 85.0 (± 3.3) NA NANorth Carolina, 1999 20.8 (± 1.7) 87.8 (± 2.8) 10.4 (±1.4) 36.2 (± 5.1)Oklahoma, 1999 30.8 (± 6.0) 92.6 (± 3.5) 20.4 (±3.4) 57.9 (± 7.9)South Dakota, 1999 19.0 (± 3.5) 89.7 (± 4.1) 11.8 (±3.6) 55.9 (± 6.9)Tennessee, 1999 33.4 (± 5.7) 83.0 (±13.9) 18.1 (±4.5) 56.3 (± 9.9)Texas, 1998 NA NA NA NATexas, 1999 NA NA NA NAMedian 25.0 89.5 13.4 41.9
High school
Arkansas, 1999 53.3 (± 7.0) 92.4 (± 3.3) 33.4 (±6.1) 59.7 (± 9.0)Florida, 1998 28.2 (± 2.3) 88.9 (± 1.4) 10.3 (±1.9) 28.4 (± 3.1)Florida, 1999 33.4 (± 2.8) 92.4 (± 1.1) 10.8 (±2.0) 30.5 (± 3.4)Mississippi (private), 1998 47.9 (±12.4) 93.8 (± 3.4) NA NAMississippi (private), 1999 52.5 (± 5.5) 94.0 (± 1.7) NA NAMississippi (public), 1998 41.7 (± 5.5) 93.5 (± 3.7) NA NAMississippi (public), 1999 42.6 (± 4.7) 92.2 (± 2.6) NA NANew Jersey, 1999 41.3 (± 3.0) 89.7 (± 2.2) NA NANorth Carolina, 1999 38.9 (± 3.1) 92.2 (± 1.4) 17.6 (±2.6) 37.1 (± 3.4)Oklahoma, 1999 40.5 (± 4.8) 94.1 (± 1.7) 33.0 (±4.8) 56.7 (± 4.6)Tennessee, 1999 59.8 (± 6.2) 96.3 (± 1.8) 41.9 (±6.2) 61.8 (± 6.9)Texas, 1998 NA NA NA NATexas, 1999 NA NA NA NAMedian 41.7 92.4 25.3 46.9
* Ninety-five percent confidence interval.† Question not asked.
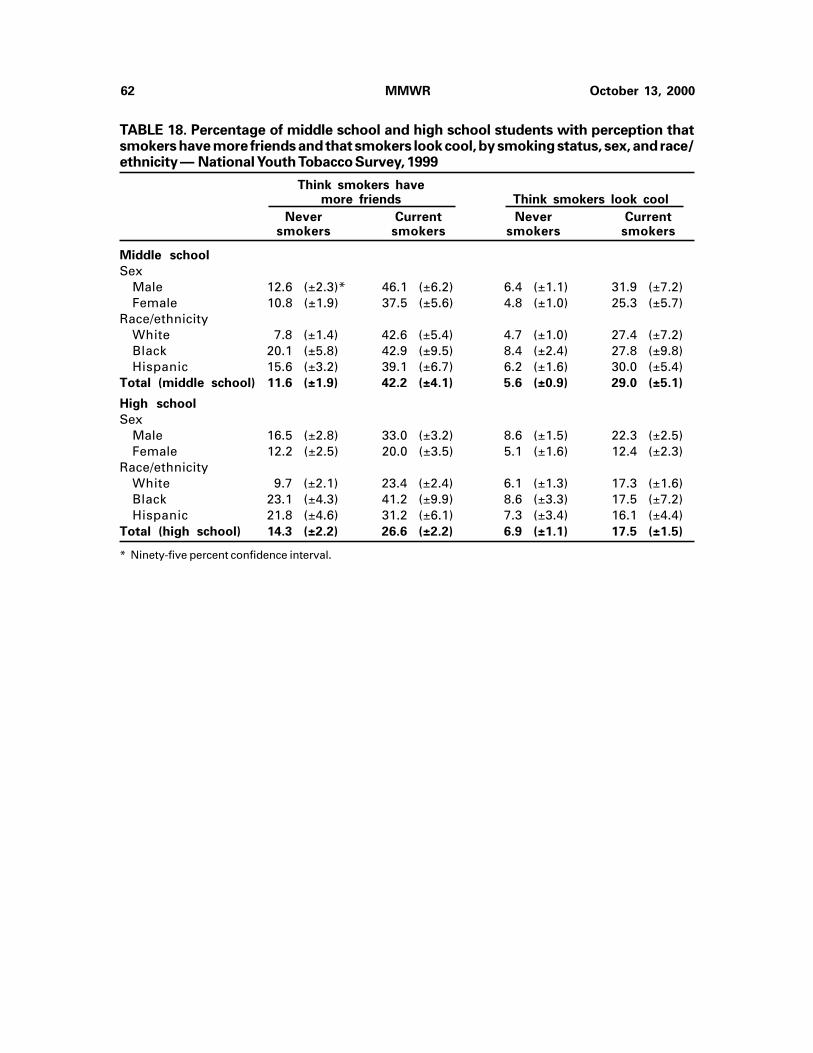
62 MMWR October 13, 2000
TABLE 18. Percentage of middle school and high school students with perception thatsmokers have more friends and that smokers look cool, by smoking status, sex, and race/ethnicity — National Youth Tobacco Survey, 1999
Think smokers havemore friends Think smokers look cool
Never Current Never Currentsmokers smokers smokers smokers
Middle school
SexMale 12.6 (±2.3)* 46.1 (±6.2) 6.4 (±1.1) 31.9 (±7.2)Female 10.8 (±1.9) 37.5 (±5.6) 4.8 (±1.0) 25.3 (±5.7)
Race/ethnicityWhite 7.8 (±1.4) 42.6 (±5.4) 4.7 (±1.0) 27.4 (±7.2)Black 20.1 (±5.8) 42.9 (±9.5) 8.4 (±2.4) 27.8 (±9.8)Hispanic 15.6 (±3.2) 39.1 (±6.7) 6.2 (±1.6) 30.0 (±5.4)
Total (middle school) 11.6 (±1.9) 42.2 (±4.1) 5.6 (±0.9) 29.0 (±5.1)
High school
SexMale 16.5 (±2.8) 33.0 (±3.2) 8.6 (±1.5) 22.3 (±2.5)Female 12.2 (±2.5) 20.0 (±3.5) 5.1 (±1.6) 12.4 (±2.3)
Race/ethnicityWhite 9.7 (±2.1) 23.4 (±2.4) 6.1 (±1.3) 17.3 (±1.6)Black 23.1 (±4.3) 41.2 (±9.9) 8.6 (±3.3) 17.5 (±7.2)Hispanic 21.8 (±4.6) 31.2 (±6.1) 7.3 (±3.4) 16.1 (±4.4)
Total (high school) 14.3 (±2.2) 26.6 (±2.2) 6.9 (±1.1) 17.5 (±1.5)
* Ninety-five percent confidence interval.

Vol. 49 / No. SS-10 MMWR 63
TABLE 19. Percentage of middle school and high school students with perception thatsmokers have more friends and that smokers look cool, by smoking status and state —State Youth Tobacco Surveys, 1998 and 1999
Think smokers havemore friends Think smokers look cool
Never Current Never Currentsmokers smokers smokers smokers
Middle school
Arkansas, 1999 19.2 (±12.9)* 49.6 (±7.4) 14.2 (±5.3) 48.8 (±16.6)Florida, 1998 25.7 (± 1.5) 60.6 (±2.5) 14.0 (±1.1) 46.4 (± 2.4)Florida, 1999 13.7 (± 1.3) 47.3 (±3.6) 6.3 (±0.7) 34.8 (± 3.4)Georgia, 1999 12.7 (± 2.9) 37.6 (±9.6) 6.8 (±2.4) 31.0 (± 7.2)Kansas, 1999 7.9 (± 2.4) 34.4 (±7.3) 5.4 (±2.1) 26.7 (± 6.4)Mississippi, 1998 30.8 (± 4.2) 64.8 (±7.3) 16.3 (±2.7) 43.7 (± 8.0)Mississippi, 1999 25.6 (± 3.8) 59.2 (±3.5) 11.6 (±2.4) 38.5 (± 5.6)Missouri, 1999 9.2 (± 2.0) 30.7 (±4.2) NA† NANebraska, 1999 7.4 (± 1.6) 40.6 (±6.2) 4.6 (±0.9) 32.3 (± 5.5)New Jersey, 1999 14.4 (± 1.8) 41.5 (±4.3) 13.1 (±1.4) 39.4 (± 6.0)North Carolina, 1999 13.4 (± 1.5) 50.2 (±4.7) 5.3 (±0.9) 31.4 (± 4.8)Oklahoma, 1999 10.0 (± 2.2) 35.4 (±6.5) 4.9 (±1.3) 30.8 (± 5.1)South Dakota, 1999 6.9 (± 2.4) 40.1 (±8.2) 4.8 (±1.3) 33.1 (± 7.6)Tennessee, 1999 11.9 (± 4.5) 37.3 (±7.5) 8.1 (±3.8) 33.0 (±12.2)Texas, 1998 24.9 (± 2.7) 57.0 (±4.5) 6.9 (±4.9) 56.4 (± 3.4)Texas, 1999 15.7 (± 1.8) 47.0 (±4.3) 10.0 (±3.5) 37.0 (± 4.5)Median 13.6 44.2 6.9 34.8
High school
Arkansas, 1999 9.4 (± 4.3) 28.2 (±5.8) 7.7 (±3.1) 23.7 (± 6.1)Florida, 1998 25.7 (± 1.9) 41.7 (±2.2) 11.1 (±3.1) 26.2 (± 2.0)Florida, 1999 15.2 (± 1.6) 30.4 (±2.8) 6.6 (±0.9) 18.8 (± 1.7)Mississippi (private), 1998 28.5 (± 6.0) 34.8 (±5.4) 11.7 (±4.2) 27.5 (± 4.9)Mississippi (private), 1999 19.4 (± 2.7) 30.1 (±4.4) 9.4 (±2.3) 26.1 (± 4.9)Mississippi (public), 1998 32.7 (± 7.0) 46.8 (±5.5) 11.8 (±3.1) 27.8 (± 6.4)Mississippi (public), 1999 26.1 (± 6.5) 41.9 (±5.0) 6.9 (±3.4) 26.6 (± 5.5)New Jersey, 1999 18.1 (± 2.6) 32.4 (±3.5) 14.1 (±1.7) 29.1 (± 3.0)North Carolina, 1999 17.8 (± 2.3) 35.0 (±3.7) 6.5 (±1.6) 23.3 (± 3.0)Oklahoma, 1999 9.6 (± 2.7) 22.9 (±4.6) 4.2 (±1.3) 16.4 (± 3.8)Tennessee, 1999 18.9 (± 7.0) 30.3 (±6.2) 5.9 (±3.0) 19.7 (± 5.9)Texas, 1998 27.7 (± 2.2) 54.5 (±2.5) 6.1 (±2.7) 17.2 (± 1.3)Texas, 1999 19.2 (± 3.6) 37.0 (±2.8) 8.2 (±2.8) 27.3 (± 3.4)Median 19.2 34.8 7.7 26.1
* Ninety-five percent confidence interval.† Question not asked.
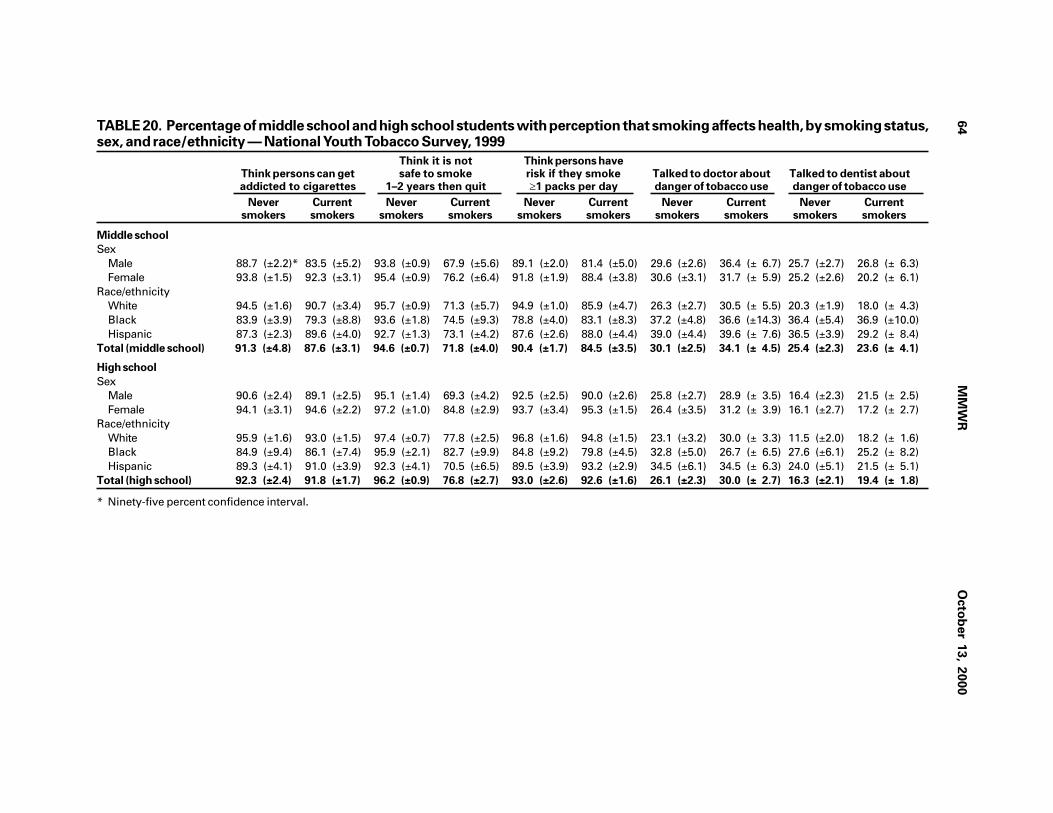
64
MM
WR
Octo
ber 1
3, 2
000
TABLE 20. Percentage of middle school and high school students with perception that smoking affects health, by smoking status,sex, and race/ethnicity — National Youth Tobacco Survey, 1999
Think it is not Think persons haveThink persons can get safe to smoke risk if they smoke Talked to doctor about Talked to dentist aboutaddicted to cigarettes 1–2 years then quit �1 packs per day danger of tobacco use danger of tobacco use
Never Current Never Current Never Current Never Current Never Currentsmokers smokers smokers smokers smokers smokers smokers smokers smokers smokers
Middle school
SexMale 88.7 (±2.2)* 83.5 (±5.2) 93.8 (±0.9) 67.9 (±5.6) 89.1 (±2.0) 81.4 (±5.0) 29.6 (±2.6) 36.4 (± 6.7) 25.7 (±2.7) 26.8 (± 6.3)Female 93.8 (±1.5) 92.3 (±3.1) 95.4 (±0.9) 76.2 (±6.4) 91.8 (±1.9) 88.4 (±3.8) 30.6 (±3.1) 31.7 (± 5.9) 25.2 (±2.6) 20.2 (± 6.1)
Race/ethnicityWhite 94.5 (±1.6) 90.7 (±3.4) 95.7 (±0.9) 71.3 (±5.7) 94.9 (±1.0) 85.9 (±4.7) 26.3 (±2.7) 30.5 (± 5.5) 20.3 (±1.9) 18.0 (± 4.3)Black 83.9 (±3.9) 79.3 (±8.8) 93.6 (±1.8) 74.5 (±9.3) 78.8 (±4.0) 83.1 (±8.3) 37.2 (±4.8) 36.6 (±14.3) 36.4 (±5.4) 36.9 (±10.0)Hispanic 87.3 (±2.3) 89.6 (±4.0) 92.7 (±1.3) 73.1 (±4.2) 87.6 (±2.6) 88.0 (±4.4) 39.0 (±4.4) 39.6 (± 7.6) 36.5 (±3.9) 29.2 (± 8.4)
Total (middle school) 91.3 (±4.8) 87.6 (±3.1) 94.6 (±0.7) 71.8 (±4.0) 90.4 (±1.7) 84.5 (±3.5) 30.1 (±2.5) 34.1 (± 4.5) 25.4 (±2.3) 23.6 (± 4.1)
High school
SexMale 90.6 (±2.4) 89.1 (±2.5) 95.1 (±1.4) 69.3 (±4.2) 92.5 (±2.5) 90.0 (±2.6) 25.8 (±2.7) 28.9 (± 3.5) 16.4 (±2.3) 21.5 (± 2.5)Female 94.1 (±3.1) 94.6 (±2.2) 97.2 (±1.0) 84.8 (±2.9) 93.7 (±3.4) 95.3 (±1.5) 26.4 (±3.5) 31.2 (± 3.9) 16.1 (±2.7) 17.2 (± 2.7)
Race/ethnicityWhite 95.9 (±1.6) 93.0 (±1.5) 97.4 (±0.7) 77.8 (±2.5) 96.8 (±1.6) 94.8 (±1.5) 23.1 (±3.2) 30.0 (± 3.3) 11.5 (±2.0) 18.2 (± 1.6)Black 84.9 (±9.4) 86.1 (±7.4) 95.9 (±2.1) 82.7 (±9.9) 84.8 (±9.2) 79.8 (±4.5) 32.8 (±5.0) 26.7 (± 6.5) 27.6 (±6.1) 25.2 (± 8.2)Hispanic 89.3 (±4.1) 91.0 (±3.9) 92.3 (±4.1) 70.5 (±6.5) 89.5 (±3.9) 93.2 (±2.9) 34.5 (±6.1) 34.5 (± 6.3) 24.0 (±5.1) 21.5 (± 5.1)
Total (high school) 92.3 (±2.4) 91.8 (±1.7) 96.2 (±0.9) 76.8 (±2.7) 93.0 (±2.6) 92.6 (±1.6) 26.1 (±2.3) 30.0 (± 2.7) 16.3 (±2.1) 19.4 (± 1.8)
* Ninety-five percent confidence interval.

Vo
l. 49
/N
o. S
S-1
0M
MW
R6
5
TABLE 21. Percentage of middle school and high school students with perception that smoking affects health, by smoking status andstate — State Youth Tobacco Surveys, 1998 and 1999
Think persons can Think it is not safe Think persons have Talked to doctor Talked to dentistget addicted to to smoke 1–2 years risk if they smoke about danger of about danger of
cigarettes then quit �1 packs per day tobacco use tobacco use
Never Current Never Current Never Current Never Current Never Currentsmokers smokers smokers smokers smokers smokers smokers smokers smokers smokers
Middle school
Arkansas, 1999 91.2 (±5.6)* 91.8 (±2.1) 90.1 (±5.4) 64.8 (±6.6) 90.5 (±5.1) 84.3 (±11.7) 19.7 (±9.9) 25.9 (±10.2) 14.7 (±6.2) 11.3 (± 8.2)Florida, 1998 93.6 (±0.9) 88.8 (±1.4) NA† NA 89.6 (±1.1) 84.2 (± 1.8) NA NA NA NAFlorida, 1999 91.8 (±0.9) 83.0 (±2.6) 96.2 (±0.6) 67.4 (±3.0) NA NA 19.8 (±1.5) 21.5 (± 2.4) 17.5 (±1.2) 18.4 (± 2.5)Georgia, 1999 90.8 (±4.2) 87.0 (±7.8) 96.7 (±1.5) 78.9 (±6.6) 88.3 (±4.6) 83.0 (± 5.7) 32.0 (±5.8) 27.0 (± 5.6) 28.9 (±5.3) 21.1 (± 5.1)Kansas, 1999 92.3 (±2.3) 85.0 (±6.1) 95.9 (±1.9) 70.2 (±6.5) 93.4 (±1.9) 83.1 (± 6.6) 19.9 (±3.6) 29.8 (± 7.5) 13.3 (±3.0) 20.8 (± 6.8)Mississippi, 1998 94.0 (±2.2) 86.1 (±3.8) NA NA 90.9 (±2.6) 82.7 (± 5.3) NA NA NA NAMississippi, 1999 94.5 (±1.9) 89.4 (±3.2) NA NA 90.2 (±2.2) 86.5 (± 4.5) NA NA NA NAMissouri, 1999 93.6 (±2.1) 88.1 (±5.0) NA NA 94.8 (±2.1) 93.5 (± 3.1) 27.3 (±5.0) 34.1 (± 5.7) 20.6 (±4.4) 19.1 (± 6.1)Nebraska, 1999 89.4 (±2.7) 86.0 (±4.0) 96.7 (±1.0) 69.0 (±4.2) 87.8 (±2.1) 85.8 (± 4.4) 24.2 (±2.7) 27.8 (± 4.4) 19.6 (±3.3) 17.2 (± 5.3)New Jersey, 1999 NA NA 90.9 (±1.1) 64.0 (±4.3) NA NA NA NA NA NANorth Carolina, 1999 90.5 (±1.5) 87.3 (±3.0) 95.1 (±0.8) 71.1 (±2.8) 88.0 (±1.7) 86.7 (± 2.8) 28.9 (±2.3) 35.0 (± 4.2) 22.9 (±2.1) 24.7 (± 5.1)Oklahoma, 1999 93.7 (±2.1) 89.1 (±4.2) 96.4 (±0.9) 72.0 (±6.8) 89.6 (±2.9) 87.5 (± 5.2) 18.6 (±3.0) 23.7 (± 3.3) 20.5 (±3.4) 17.6 (± 5.0)South Dakota, 1999 92.2 (±1.9) 93.7 (±3.3) 96.3 (±1.8) 76.4 (±5.9) 91.3 (±1.2) 86.6 (± 6.6) 18.9 (±3.6) 25.8 (± 8.3) 15.5 (±2.8) 16.3 (± 6.1)Tennessee, 1999 91.1 (±4.0) 90.1 (±3.6) 94.1 (±2.5) 77.4 (±5.9) 91.2 (±3.5) 91.4 (± 4.2) 20.7 (±5.0) 35.7 (±13.7) 19.0 (±4.7) 30.7 (±14.1)Texas, 1998 95.1 (±3.2) 89.7 (±3.5) NA NA 92.0 (±3.5) 83.7 (± 5.5) 26.0 (±3.5) 31.1 (± 2.6) NA NATexas, 1999 93.6 (±1.5) 87.6 (±4.2) 91.7 (±1.5) 71.6 (±3.5) NA NA 18.7 (±2.8) 26.1 (± 3.5) 21.5 (±3.4) 16.0 (± 2.8)Median 92.3 88.1 95.9 71.1 90.5 85.8 20.3 27.4 19.6 18.4
High school
Arkansas, 1999 92.2 (±3.3) 83.4 (±5.1) 94.9 (±2.2) 69.7 (±7.5) 96.5 (±2.4)) 88.5 (± 3.8) 13.9 (±5.4) 25.9 (± 3.7) 9.3 (±3.2) 18.2 (± 4.4)Florida, 1998 94.1 (±1.2) 91.2 (±1.4) NA NA 92.4 (±1.4) 91.1 (± 1.2) NA NA NA NAFlorida, 1999 87.8 (±1.5) 83.6 (±2.1) 95.9 (±0.8) 72.3 (±2.4) 88.7 (±1.6) 90.1 (± 1.8) 15.1 (±1.7) 25.1 (± 2.8) 12.6 (±2.8) 16.9 (± 2.8)Mississippi (private), 1998 97.7 (±2.2) 91.1 (±2.8) NA NA 96.6 (±1.7) 94.4 (± 3.0) NA NA NA NAMississippi (private), 1999 98.3 (±0.9) 93.9 (±2.4) NA NA 95.3 (±1.5) 93.1 (± 1.9) NA NA NA NAMississippi (public), 1998 93.9 (±2.8) 93.3 (±2.5) NA NA 88.9 (±3.9) 92.3 (± 2.7) NA NA NA NAMississippi (public), 1999 95.0 (±3.6) 91.8 (±2.6) NA NA 93.1 (±3.0) 92.0 (± 2.8) NA NA NA NANew Jersey, 1999 NA NA 89.9 (±1.5) 64.9 (±3.1) NA NA NA NA NA NANorth Carolina, 1999 92.7 (±1.9) 85.4 (±2.0) 94.9 (±1.3) 74.0 (±2.3) 91.9 (±1.8) 90.9 (± 1.9) 28.8 (±2.9) 35.4 (± 2.8) 15.5 (±1.7) 22.2 (± 2.4)Oklahoma, 1999 96.4 (±1.8) 86.9 (±2.4) 97.2 (±1.3) 80.6 (±3.9) 93.0 (±2.9) 93.2 (± 1.4) 11.8 (±4.1) 23.8 (± 4.3) 12.0 (±4.2) 17.9 (± 3.4)Tennessee, 1999 93.6 (±2.9) 86.3 (±3.0) 93.6 (±2.5) 70.8 (±4.8) 94.7 (±2.8) 91.1 (± 3.4) 14.3 (±5.0) 24.8 (± 4.9) 11.2 (±4.3) 20.9 (± 3.6)Texas, 1998 94.8 (±1.8) 90.8 (±4.3) NA NA 94.2 (±5.5) 90.8 (± 5.5) 22.5 (±3.7) 31.0 (± 3.8) NA NATexas, 1999 93.3 (±1.5) 90.0 (±3.5) 90.3 (±2.5) 75.6 (±4.6) NA NA 15.4 (±3.0) 24.2 (± 4.2) 25.2 (±4.2) 19.9 (± 3.2)Median 94.0 90.4 94.9 72.3 93.1 91.1 15.1 25.1 12.3 19.0
* Ninety-five percent confidence interval.† Question not asked.

66 MMWR October 13, 2000
TABLE 22. How current smokers aged <18 years in middle school and high school usuallyobtained cigarettes, by sex and race/ethnicity —National Youth Tobacco Survey, 1999
Person
Someone aged �18Bought else Borrowed years Got them from bought them gave some
Bought vending them from Stole them otherin store machine for me someone them to me way Total*
Middle school
SexMale 9.1 4.0 23.0 22.8 12.6 6.0 22.5 100.0
Female 4.2 1.2 20.5 27.3 10.1 13.2 23.6 100.0
Race/ethnicityWhite 4.8 2.5 21.8 25.6 11.8 10.3 23.2 100.0
Black 15.6 3.6 21.7 24.6 10.1 7.2 17.3 100.0
Hispanic 4.1 2.1 21.9 23.1 11.3 9.3 28.1 100.0
Total (middle school) 6.7 2.7 21.8 24.9 11.4 9.5 23.0 100.0
High school
SexMale 31.7 1.0 25.3 21.9 3.7 6.7 9.7 100.0
Female 19.4 0.4 32.0 24.6 1.1 11.6 11.0 100.0
Race/ethnicityWhite 24.3 0.8 31.4 22.5 2.0 9.2 9.6 100.0
Black 29.9 0.0 18.1 25.3 1.7 9.5 15.5 100.0
Hispanic 29.4 0.5 20.7 25.9 5.0 8.1 10.4 100.0
Total (high school) 25.6 0.7 28.6 23.3 2.4 9.1 10.3 100.0
* Some totals might not add to 100% because of rounding.

Vol. 49 / No. SS-10 MMWR 67
TABLE 23. How current smokers aged <18 years in middle school and high school usuallyobtained cigarettes, by state — State Youth Tobacco Surveys, 1998 and 1999
PersonSomeone aged �18
Bought else Borrowed years Got themfrom bought them gave some
Bought vending them from Stole them other in store machine for me someone them to me way Total*
Middle school
Arkansas, 1999 7.6 5.0 35.3 21.6 8.5 9.5 12.5 100.0
Florida, 1998 8.2 2.8 22.4 24.0 13.9 11.2 17.6 100.0
Florida, 1999 5.7 3.2 19.7 13.5 14.6 18.0 25.3 100.0
Georgia, 1999 7.3 2.5 28.9 20.4 12.8 13.7 14.4 100.0
Kansas, 1999 2.1 1.7 28.0 18.9 19.4 5.9 24.1 100.0
Mississippi, 1998 13.3 2.1 24.2 20.1 14.2 26.0 0.0 100.0
Mississippi, 1999 11.0 1.5 25.7 22.2 12.2 27.4 0.0 100.0
Missouri, 1999 6.7 1.3 22.4 30.7 7.3 8.8 22.6 100.0
Nebraska, 1999 5.1 1.7 21.9 29.3 9.5 11.0 21.9 100.0
New Jersey, 1999 14.2 2.1 17.0 40.0 3.3 12.9 10.5 100.0
North Carolina, 1999 5.8 2.3 16.9 34.5 9.4 11.5 19.6 100.0
Oklahoma, 1999 6.3 4.6 17.1 28.6 11.5 8.4 23.5 100.0
South Dakota, 1999 2.3 1.2 26.5 34.3 9.5 5.4 20.7 100.0
Tennessee, 1999 6.3 3.4 31.6 23.1 6.9 9.7 18.9 100.0
Texas, 1998 13.1 5.2 22.6 23.4 8.4 11.9 15.4 100.0
Texas, 1999 4.6 1.6 20.0 25.2 11.4 13.9 23.0 100.0
Median 6.5 2.2 22.5 23.7 10.4 11.4 19.2
High school
Arkansas, 1999 20.6 1.9 36.2 21.3 4.6 10.9 4.6 100.0
Florida, 1998 28.9 1.5 25.8 22.1 5.8 7.3 8.6 100.0
Florida, 1999 28.1 1.1 21.6 15.5 5.2 17.0 11.6 100.0
Mississippi (private), 1998 47.1 1.1 23.6 19.3 4.5 4.2 0.0 100.0
Mississippi (private), 1999 27.6 1.1 31.2 25.8 6.0 8.4 0.0 100.0
Mississippi (public), 1998 43.9 2.2 21.0 19.6 7.8 5.4 0.0 100.0
Mississippi (public), 1999 22.4 1.2 37.2 19.1 7.2 13.0 0.0 100.0
New Jersey, 1999 34.2 1.6 22.4 27.0 4.8 3.6 6.4 100.0
North Carolina, 1999 19.1 2.8 27.9 26.3 4.7 9.0 10.2 100.0
Oklahoma, 1999 22.4 1.2 35.1 23.0 2.8 7.8 7.7 100.0
Tennessee, 1999 28.7 1.7 27.2 21.8 2.0 8.8 9.8 100.0
Texas, 1998 34.0 1.6 24.3 20.8 3.0 7.9 8.4 100.0
Texas, 1999 31.8 0.9 22.8 22.7 2.7 10.3 8.8 100.0
Median 28.7 1.5 25.8 21.8 4.7 8.4 7.7
* Some totals might not add to 100% because of rounding.

68 MMWR October 13, 2000
TABLE 24. Where current smokers aged <18 years in middle school and high school boughttheir last pack of cigarettes, by sex and race/ethnicity — National Youth Tobacco Survey,1999
Gas Convenience Discount Grocery Drug Vendingstation store store store store machine Restaurant Total*
Middle school
SexMale 44.8 17.3 3.3 12.3 3.8 14.2 4.2 100.0
Female 48.7 21.6 2.9 12.3 2.4 8.6 3.5 100.0
Race/ethnicityWhite 52.5 16.3 1.5 9.3 4.0 14.1 2.3 100.0
Black 33.3 25.3 5.2 18.2 1.9 5.5 10.5 100.0
Hispanic 44.9 21.2 5.7 14.4 2.1 11.1 0.7 100.0
Total (middle school) 46.6 19.3 3.1 12.3 3.2 11.6 3.9 100.0
High school
SexMale 52.5 26.3 2.2 12.1 3.2 2.8 1.0 100.0
Female 46.8 33.0 2.5 12.0 3.2 2.2 1.3 100.0
Race/ethnicityWhite 53.5 28.4 2.2 10.0 2.3 2.5 1.2 100.0
Black 29.7 38.1 4.4 19.8 6.0 2.1 0.0 100.0
Hispanic 42.9 29.9 1.2 18.1 2.9 3.1 1.9 100.0
Total (high school) 49.7 29.5 2.3 12.0 2.7 2.5 1.2 100.0
* Some totals might not add to 100% because of rounding.

Vol. 49 / No. SS-10 MMWR 69
TABLE 25. Where current smokers aged <18 years in middle school and high school boughttheir last pack of cigarettes, by state — State Youth Tobacco Surveys, 1998 and 1999
Gas Convenience Discount Grocery Drug Vendingstation store store store store machine Restaurant Total*
Middle school
Arkansas, 1999 NA† NA NA NA NA NA NA NA
Florida, 1998 NA NA NA NA NA NA NA NA
Florida, 1999 NA NA NA NA NA NA NA NA
Georgia, 1999 44.9 27.6 2.6 9.2 1.9 12.0 1.7 100.0
Kansas, 1999 45.3 17.6 3.6 11.4 3.9 18.3 0.0 100.0
Mississippi, 1998 NA NA NA NA NA NA NA NA
Mississippi, 1999 NA NA NA NA NA NA NA NA
Missouri, 1999 NA NA NA NA NA NA NA NA
Nebraska, 1999 57.7 12.4 4.4 7.7 2.9 11.6 3.4 100.0
New Jersey, 1999 NA NA NA NA NA NA NA NA
North Carolina, 1999 42.6 21.8 4.7 8.8 3.1 17.9 1.0 100.0
Oklahoma, 1999 33.1 28.8 4.8 8.8 2.6 20.6 1.3 100.0
South Dakota, 1999 48.5 24.1 1.9 12.3 0.0 8.7 4.5 100.0
Tennessee, 1999 35.5 13.7 19.5 7.0 2.8 18.0 3.6 100.0
Texas, 1998 36.6 27.3 4.0 6.9 5.6 16.4 3.2 100.0
Texas, 1999 38.1 20.1 5.3 7.7 4.1 17.4 7.3 100.0
Median 42.6 21.8 4.4 8.8 2.9 17.4 3.2
High school
Arkansas, 1999 NA NA NA NA NA NA NA NA
Florida, 1998 43.2 32.9 5.8 9.0 3.4 3.8 2.0 100.0
Florida, 1999 NA NA NA NA NA NA NA NA
Mississippi (private), 1998 57.3 28.9 3.9 5.0 1.3 2.7 0.9 100.0
Mississippi (private), 1999 61.7 24.5 2.5 4.7 1.4 3.0 2.2 100.0
Mississippi (public), 1998 54.0 34.0 2.5 5.8 0.5 2.5 0.6 100.0
Mississippi (public), 1999 48.6 32.6 6.4 7.1 1.8 2.1 1.3 100.0
New Jersey, 1999 NA NA NA NA NA NA NA NA
North Carolina, 1999 49.0 28.7 2.7 10.4 3.7 3.6 1.9 100.0
Oklahoma, 1999 39.2 42.8 5.2 7.0 2.1 3.3 0.5 100.0
Tennessee, 1999 59.8 24.1 3.9 7.7 0.9 3.1 0.5 100.0
Texas, 1998 42.4 37.5 4.0 8.1 2.5 3.2 2.3 100.0
Texas, 1999 42.7 39.9 2.5 8.5 1.9 2.0 2.5 100.0
Median 48.6 32.6 3.9 7.1 1.9 3.0 1.6
* Some totals might not add to 100% because of rounding.† Question not asked.

70 MMWR October 13, 2000
TABLE 26. How current cigar smokers aged <18 years in middle school and high schoolusually obtained cigars, by sex and race/ethnicity — National Youth Tobacco Survey, 1999
Someone Borrowed Person Got themelse them aged �18 some
Bought bought from Stole years gave otherin store them for me someone them them to me way Total*
Middle school
SexMale 13.1 20.2 25.4 14.1 12.2 15.0 100.0
Female 4.0 15.9 28.8 10.7 15.0 25.7 100.0
Race/ethnicityWhite 8.3 11.0 36.5 16.8 11.1 16.4 100.0
Black 14.2 30.7 15.4 8.5 14.9 16.2 100.0
Hispanic 6.7 18.7 19.7 9.9 16.0 29.1 100.0
Total, middle school 9.8 18.6 26.6 12.8 13.3 18.9 100.0
High school
SexMale 29.8 17.4 21.6 5.9 14.1 11.3 100.0
Female 15.4 16.3 30.7 2.6 15.6 19.4 100.0
Race/ethnicityWhite 21.7 16.7 28.2 4.9 14.4 14.2 100.0
Black 37.9 23.7 10.2 3.9 12.5 11.7 100.0
Hispanic 24.8 9.4 25.7 5.7 18.3 16.0 100.0
Total, high school 25.0 17.0 24.6 4.8 14.6 13.9 100.0
* Some totals might not add to 100% because of rounding.

Vol. 49 / No. SS-10 MMWR 71
TABLE 27. How current cigar smokers aged <18 years in middle school and high schoolusually obtained cigars, by state — State Youth Tobacco Surveys, 1998 and 1999
Someone Borrowed Person Got themelse them aged �18 some
Bought bought from Stole years gave otherin store them for me someone them them to me way Total*
Middle school
Arkansas, 1999 2.8 28.1 30.3 7.6 14.9 16.2 100.0
Florida, 1998 NA† NA NA NA NA NA NA
Florida, 1999 8.0 13.5 15.1 14.0 19.2 30.2 100.0
Georgia, 1999 13.7 27.4 13.2 12.9 24.3 8.4 100.0
Kansas, 1999 7.8 11.5 34.6 19.7 13.7 12.7 100.0
Mississippi, 1998 NA NA NA NA NA NA NA
Mississippi, 1999 NA NA NA NA NA NA NA
Missouri, 1999 NA NA NA NA NA NA NA
Nebraska, 1999 6.5 19.0 26.5 16.2 10.1 21.8 100.0
New Jersey, 1999 NA NA NA NA NA NA NA
North Carolina, 1999 10.3 14.7 24.5 15.7 17.7 17.0 100.0
Oklahoma, 1999 7.7 20.5 24.4 9.7 17.8 19.9 100.0
South Dakota, 1999 16.1 8.9 31.0 15.7 8.9 19.4 100.0
Tennessee, 1999 10.9 17.4 21.3 9.1 21.7 19.7 100.0
Texas, 1998 10.4 20.7 21.0 9.5 22.2 16.2 100.0
Texas, 1999 8.8 18.4 21.0 10.2 13.3 28.3 100.0
Median 8.8 18.4 24.4 12.9 17.7 19.4
High school
Arkansas, 1999 21.6 22.9 25.0 8.7 11.4 10.4 100.0
Florida, 1998 27.3 17.4 24.7 7.7 12.2 10.7 100.0
Florida, 1999 27.1 10.9 16.3 8.5 16.4 20.8 100.0
Mississippi (private), 1998 38.4 13.2 29.2 10.4 8.8 0.0 100.0
Mississippi (private), 1999 27.8 14.0 31.1 17.7 9.4 0.0 100.0
Mississippi (public), 1998 34.2 18.8 28.2 11.8 6.9 0.0 100.0
Mississippi (public), 1999 24.9 22.1 25.7 10.5 16.8 0.0 100.0
New Jersey, 1999 NA NA NA NA NA NA NA
North Carolina, 1999 18.0 16.9 29.6 10.0 13.9 11.6 100.0
Oklahoma, 1999 22.2 20.8 27.4 3.9 14.5 11.3 100.0
Tennessee, 1999 27.9 16.7 27.3 5.8 8.8 13.6 100.0
Texas, 1998 27.0 13.7 25.9 6.3 16.4 10.7 100.0
Texas, 1999 32.1 14.0 23.1 4.4 13.3 13.1 100.0
Median 27.2 16.8 26.6 8.6 12.8 10.7
* Some totals might not add to 100% because of rounding.† Question not asked.

72 MMWR October 13, 2000
TABLE 28. How current smokeless tobacco users aged <18 years in middle school and highschool usually obtained smokeless tobacco, by sex and race/ethnicity — National YouthTobacco Survey, 1999
Someone Borrowed Person Got themelse them aged �18 some
Bought bought from Stole years gave otherin store them for me someone them them to me way Total*
Middle school
SexMale 7.2 21.7 24.7 7.6 14.7 24.1 100.0
Female 0.0 5.3 22.3 16.6 27.1 28.7 100.0
Race/ethnicityWhite 3.2 21.0 25.6 9.3 14.2 26.7 100.0
Black 16.4 15.9 13.1 3.3 29.2 22.2 100.0
Hispanic 7.4 5.0 27.9 17.2 22.7 19.7 100.0
Total, middle school 5.6 18.1 24.2 9.5 17.4 25.1 100.0
High school
SexMale 31.3 20.8 24.8 5.8 9.0 8.3 100.0
Female 18.6 7.9 18.3 8.9 26.0 20.4 100.0
Race/ethnicityWhite 30.5 20.4 25.0 4.8 9.9 9.3 100.0
Black 19.8 18.1 17.5 7.2 33.2 4.1 100.0
Hispanic 31.9 4.0 19.5 19.4 2.3 18.4 100.0
Total, high school 29.9 19.4 24.1 6.1 10.8 9.6 100.0
* Some totals might not add to 100% because of rounding.

Vol. 49 / No. SS-10 MMWR 73
TABLE 29. How current smokeless tobacco users aged <18 years in middle school and highschool usually obtained smokeless tobacco, by state — State Youth Tobacco Surveys, 1998and 1999
Someone Borrowed Person Got themelse them aged �18 some
Bought bought from Stole years gave otherin store them for me someone them them to me way Total*
Middle school
Arkansas, 1999 11.6 23.6 40.0 4.7 7.7 12.4 100.0
Florida, 1998 NA† NA NA NA NA NA NA
Florida, 1999 9.4 12.5 17.7 19.6 17.9 22.9 100.0
Georgia, 1999 20.4 20.4 21.8 12.0 9.1 16.3 100.0
Kansas, 1999 9.2 8.1 37.5 16.5 16.6 12.1 100.0
Mississippi, 1998 NA NA NA NA NA NA NA
Mississippi, 1999 NA NA NA NA NA NA NA
Missouri, 1999 NA NA NA NA NA NA NA
Nebraska, 1999 3.1 21.5 27.4 18.6 11.2 18.3 100.0
New Jersey, 1999 NA NA NA NA NA NA NA
North Carolina, 1999 16.4 12.0 23.5 13.1 23.0 12.0 100.0
Oklahoma, 1999 15.4 21.1 30.5 8.2 6.6 18.3 100.0
South Dakota, 1999 2.6 22.8 40.0 11.5 9.4 13.8 100.0
Tennessee, 1999 12.5 29.1 32.0 6.4 11.5 8.4 100.0
Texas, 1998 11.7 29.8 20.0 10.5 17.8 10.2 100.0
Texas, 1999 12.1 19.7 27.1 16.8 8.3 16.0 100.0
Median 11.7 21.1 27.4 12.0 11.2 13.8
High school
Arkansas, 1999 25.6 16.0 34.3 7.0 10.5 6.1 100.0
Florida, 1998 29.5 20.8 21.1 13.0 9.0 6.7 100.0
Florida, 1999 26.6 13.6 15.0 14.9 9.5 20.4 100.0
Mississippi (private), 1998 51.3 15.0 20.8 6.1 6.7 0.0 100.0
Mississippi (private), 1999 37.6 23.7 21.5 7.4 9.8 0.0 100.0
Mississippi (public), 1998 50.3 14.9 25.0 4.8 4.9 0.0 100.0
Mississippi (public), 1999 37.2 18.2 24.5 8.3 11.8 0.0 100.0
New Jersey, 1999 NA NA NA NA NA NA NA
North Carolina, 1999 21.8 17.5 29.0 10.9 11.5 9.2 100.0
Oklahoma, 1999 27.0 24.5 27.5 4.4 6.0 10.6 100.0
Tennessee, 1999 33.4 27.2 25.8 4.8 5.1 3.7 100.0
Texas, 1998 34.6 22.8 25.7 5.6 7.3 4.0 100.0
Texas, 1999 34.9 13.4 26.2 5.6 10.8 9.1 100.0
Median 34.0 17.8 25.4 6.6 9.3 5.0
* Some totals might not add to 100% because of rounding.† Question not asked.
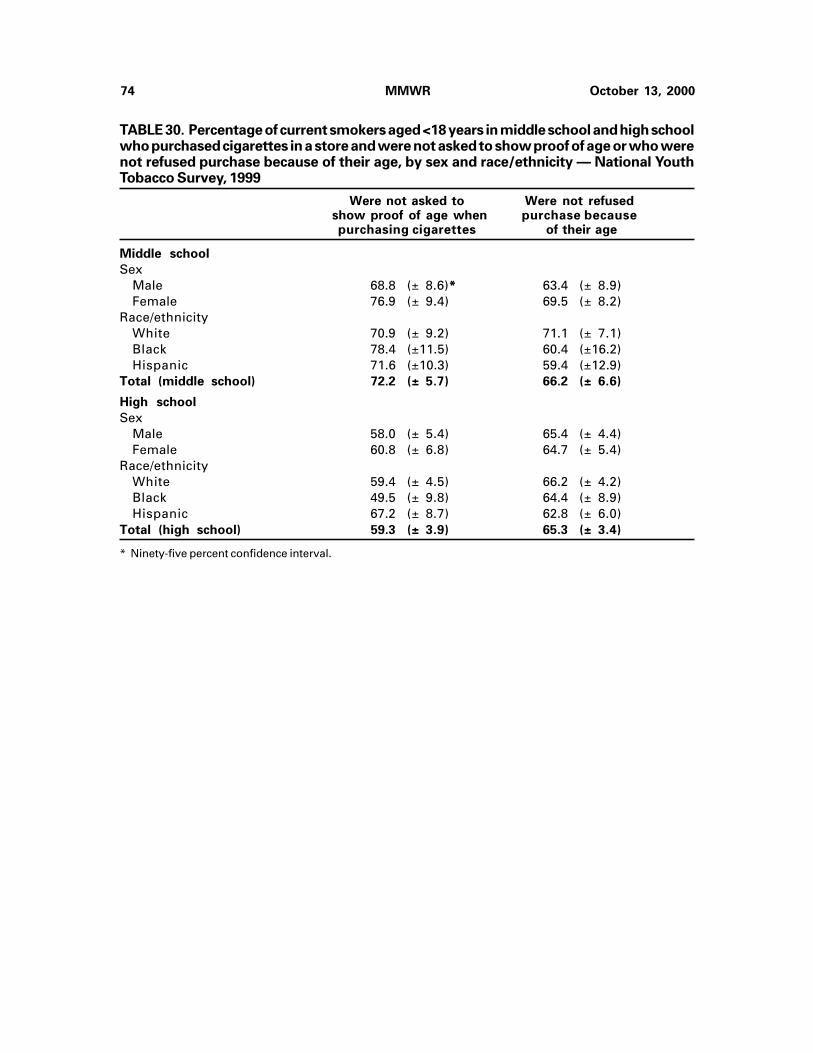
74 MMWR October 13, 2000
TABLE 30. Percentage of current smokers aged <18 years in middle school and high schoolwho purchased cigarettes in a store and were not asked to show proof of age or who werenot refused purchase because of their age, by sex and race/ethnicity — National YouthTobacco Survey, 1999
Were not asked to Were not refused show proof of age when purchase because
purchasing cigarettes of their age
Middle school
SexMale 68.8 (± 8.6)* 63.4 (± 8.9)Female 76.9 (± 9.4) 69.5 (± 8.2)
Race/ethnicityWhite 70.9 (± 9.2) 71.1 (± 7.1)Black 78.4 (±11.5) 60.4 (±16.2)Hispanic 71.6 (±10.3) 59.4 (±12.9)
Total (middle school) 72.2 (± 5.7) 66.2 (± 6.6)
High school
SexMale 58.0 (± 5.4) 65.4 (± 4.4)Female 60.8 (± 6.8) 64.7 (± 5.4)
Race/ethnicityWhite 59.4 (± 4.5) 66.2 (± 4.2)Black 49.5 (± 9.8) 64.4 (± 8.9)Hispanic 67.2 (± 8.7) 62.8 (± 6.0)
Total (high school) 59.3 (± 3.9) 65.3 (± 3.4)
* Ninety-five percent confidence interval.

Vol. 49 / No. SS-10 MMWR 75
TABLE 31. Percentage of current smokers aged <18 years in middle school and high schoolwho purchased cigarettes in a store and were not asked to show proof of age or who werenot refused purchase because of their age, by state — State Youth Tobacco Surveys, 1998and 1999
Were not asked to Were not refusedshow proof of age when purchase because
purchasing cigarettes of age
Middle school
Arkansas, 1999 NA* 78.5 (±14.7)†Florida, 1998 69.9 (± 4.0) NAFlorida, 1999 75.3 (± 5.1) NAGeorgia, 1999 71.7 (± 9.7) 77.9 (±13.1)Kansas, 1999 73.7 (±16.7) 76.6 (±13.7)Mississippi, 1998 82.9 (± 6.4) NAMississippi, 1999 66.9 (± 7.9) NAMissouri, 1999 88.7 (±11.0) 68.1 (±11.1)Nebraska, 1999 75.2 (± 8.0) 70.2 (± 9.7)New Jersey, 1999 80.3 (± 4.5) 69.5 (± 5.9)North Carolina, 1999 NA NAOklahoma, 1999 81.1 (± 7.6) 75.9 (± 8.3)South Dakota, 1999 81.0 (±13.5) 79.6 (±10.6)Tennessee, 1999 84.5 (±11.1) 67.1 (±11.7)Texas, 1998 73.8 (± 4.3) 75.7 (±13.9)Texas, 1999 68.4 (± 3.4) 61.4 (± 7.1)Median 75.2 75.7
High school
Arkansas, 1999 NA 58.7 (±10.0)Florida, 1998 58.6 (± 3.6) 56.4 (± 2.9)Florida, 1999 61.0 (± 4.1) 63.0 (± 3.2)Mississippi (private), 1998 62.5 (± 9.6) 58.9 (± 9.3)Mississippi (private), 1999 45.6 (± 5.0) 51.4 (± 7.5)Mississippi (public), 1998 66.7 (± 3.9) 64.9 (± 8.2)Mississippi (public), 1999 50.1 (± 8.4) 53.5 (± 7.1)New Jersey, 1999 67.1 (± 4.4) 62.1 (± 4.2)North Carolina, 1999 NA NAOklahoma, 1999 58.9 (± 7.7) 63.6 (± 7.8)Tennessee, 1999 62.5 (± 7.0) 63.2 (± 5.5)Texas, 1998 63.1 (± 3.4) 62.5 (± 4.5)Texas, 1999 67.1 (± 4.5) 67.0 (± 5.5)Median 62.5 62.3
* Question not asked.† Ninety-five percent confidence interval.

76 MMWR October 13, 2000
TABLE 32. Percentage of middle school and high school students who were influenced bymedia and advertising regarding tobacco, by sex and race/ethnicity — National YouthTobacco Survey, 1999
Saw antismoking Saw actors Saw ads forcommercials on smoking Saw tobacco
television or on television athletes smoking products onheard on radio or in movies on television the Internet
Middle school
SexMale 72.8 (±2.8)* 85.7 (±1.6) 18.5 (±2.2) 31.3 (±1.8)Female 77.7 (±2.7) 88.8 (±1.1) 20.9 (±2.0) 32.4 (±2.5)
Race/ethnicityWhite 77.6 (±3.6) 87.8 (±1.2) 17.2 (±1.7) 31.1 (±2.3)Black 71.1 (±2.9) 86.2 (±2.2) 23.3 (±5.2) 33.9 (±3.4)Hispanic 71.2 (±2.0) 86.8 (±2.4) 22.9 (±3.2) 32.7 (±3.6)
Total (middle school) 75.2 (±2.4) 87.2 (±1.0) 19.8 (±1.8) 31.8 (±1.7)
High school
SexMale 78.5 (±3.0) 89.9 (±1.9) 17.6 (±1.7) 25.2 (±2.2)Female 81.5 (±2.3) 93.4 (±1.1) 17.9 (±1.7) 28.6 (±2.6)
Race/ethnicityWhite 81.9 (±1.9) 92.5 (±1.0) 16.2 (±1.6) 25.5 (±2.7)Black 72.9 (±6.0) 89.1 (±4.3) 20.6 (±2.7) 28.6 (±4.3)Hispanic 80.0 (±4.3) 90.6 (±1.8) 19.8 (±2.8) 30.0 (±3.6)
Total (high school) 80.0 (±2.1) 91.7 (±1.2) 17.7 (±1.3) 26.8 (±2.1)
* Ninety-five percent confidence interval.

Vol. 49 / No. SS-10 MMWR 77
TABLE 33. Percentage of middle school and high school students who were influenced bymedia and advertising regarding tobacco, by state — State Youth Tobacco Surveys, 1998and 1999
Saw antismoking Saw actors Saw ads forcommercials on smoking Saw tobacco
television or on television athletes smoking products on
heard on radio or in movies on television the Internet
Middle school
Arkansas, 1999 NA* 88.4 (±3.6)† NA 36.4 (±5.9)Florida, 1998 69.7 (±1.0) NA NA NAFlorida, 1999 85.1 (±1.1) NA NA NAGeorgia, 1999 74.5 (±3.8) 90.1 (±2.8) 24.2 (±2.8) NAKansas, 1999 76.9 (±4.3) 90.5 (±1.8) 22.8 (±2.9) 30.5 (±3.5)Mississippi, 1998 NA NA NA NAMississippi, 1999 NA NA NA NAMissouri, 1999 79.3 (±3.3) 92.8 (±1.3) NA NANebraska, 1999 77.8 (±1.5) 86.8 (±1.3) 15.8 (±2.4) 31.0 (±3.2)New Jersey, 1999 NA 91.5 (±0.7) NA 33.7 (±1.9)North Carolina, 1999 75.2 (±1.8) 86.9 (±1.1) 21.4 (±1.4) 41.2 (±2.7)Oklahoma, 1999 78.7 (±2.1) 87.1 (±1.4) 20.5 (±2.2) 28.3 (±4.1)South Dakota, 1999 78.8 (±1.4) 88.1 (±2.9) 20.1 (±3.3) 34.0 (±4.0)Tennessee, 1999 77.6 (±4.6) 88.5 (±3.6) 25.8 (±4.2) 36.2 (±3.7)Texas, 1998 NA 96.1 (±0.7) NA NATexas, 1999 NA 87.3 (±1.3) NA 33.5 (±1.3)Median 77.7 88.4 21.4 33.6
High school
Arkansas, 1999 81.0 (±5.1) 89.4 (±2.8) NA 28.7 (±5.3)Florida, 1998 69.7 (±1.4) NA NA NAFlorida, 1999 86.9 (±1.1) NA NA NAMississippi (private), 1998 NA 97.7 (±1.1) NA NAMississippi (private), 1999 NA 97.3 (±0.9) NA NAMississippi (public), 1998 NA 97.4 (±0.8) NA NAMississippi (public), 1999 NA 96.2 (±1.3) NA NANew Jersey, 1999 NA 92.2 (±0.8) NA 29.1 (±2.2)North Carolina, 1999 76.2 (±1.6) 90.5 (±1.0) 20.7 (±1.7) 30.9 (±1.8)Oklahoma, 1999 79.4 (±2.3) 91.7 (±1.3) 19.0 (±2.4) 22.9 (±2.3)Tennessee, 1999 75.3 (±2.3) 91.1 (±1.5) 29.2 (±3.3) 32.8 (±4.5)Texas, 1998 NA 95.9 (±0.8) NA 21.3 (±3.0)Texas, 1999 NA 90.0 (±1.2) NA 28.0 (±2.4)Median 77.8 92.2 20.7 28.7
* Question not asked.† Ninety-five percent confidence interval.

78 MMWR October 13, 2000
TABLE 34. Percentage of middle school and high school students who participated in anycommunity event to discourage people from using tobacco products, by tobacco usestatus, sex, and race/ethnicity — National Youth Tobacco Survey, 1999
Never tobacco users Ever tobacco users
Middle school
SexMale 15.6 (±1.8)* 18.4 (±2.7)Female 18.3 (±2.0) 19.2 (±2.7)
Race/ethnicityWhite 15.8 (±1.8) 17.9 (±1.8)Black 18.3 (±1.4) 21.2 (±2.9)Hispanic 18.7 (±5.1) 18.1 (±3.9)
Total (middle school) 17.0 (±1.6) 18.8 (±1.4)
High school
SexMale 10.9 (±2.0) 11.6 (±2.2)Female 14.8 (±3.1) 12.2 (±2.2)
Race/ethnicityWhite 13.7 (±1.4) 10.4 (±2.0)Black 9.3 (±3.7) 16.7 (±3.5)Hispanic 11.8 (±3.9) 11.2 (±2.4)
Total (high school) 12.9 (±2.2) 11.9 (±2.0)
* Ninety-five percent confidence interval.

Vol. 49 / No. SS-10 MMWR 79
TABLE 35. Percentage of middle school and high school students who participated in anycommunity event to discourage people from using tobacco products, by tobacco use statusand state — State Youth Tobacco Surveys, 1998 and 1999
Never tobacco users Ever tobacco users
Middle school
Arkansas, 1999 12.2 (±7.1)* 14.6 (±2.7)Florida, 1998 15.5 (±1.4) 16.5 (±1.2)Florida, 1999 17.8 (±1.3) 19.0 (±1.8)Georgia, 1999 20.8 (±3.4) 19.4 (±3.1)Kansas, 1999 20.8 (±3.3) 16.7 (±4.9)Mississippi, 1998 NA† NAMississippi, 1999 NA NAMissouri, 1999 NA NANebraska, 1999 19.7 (±1.9) 17.0 (±2.2)New Jersey, 1999 NA NANorth Carolina, 1999 19.2 (±1.9) 21.3 (±2.3)Oklahoma, 1999 13.9 (±2.9) 14.5 (±2.4)South Dakota, 1999 20.5 (±3.3) 21.4 (±3.8)Tennessee, 1999 17.7 (±5.1) 16.9 (±4.4)Texas, 1998 21.0 (±3.8) 28.3 (±4.5)Texas, 1999 16.0 (±4.3) 27.2 (±3.4)Median 18.5 18.0
High school
Arkansas, 1999 13.1 (±6.2) 10.1 (±2.5)Florida, 1998 10.8 (±1.4) 13.8 (±1.2)Florida, 1999 10.4 (±1.9) 10.6 (±1.1)Mississippi (private), 1998 7.0 (±2.2) 8.7 (±3.3)Mississippi (private), 1999 10.4 (±3.7) 11.4 (±3.1)Mississippi (public), 1998 14.2 (±4.1) 14.2 (±1.9)Mississippi (public), 1999 19.7 (±6.8) 15.3 (±2.8)New Jersey, 1999 NA NANorth Carolina, 1999 9.8 (±1.7) 11.4 (±1.5)Oklahoma, 1999 8.7 (±3.4) 6.8 (±1.4)Tennessee, 1999 11.0 (±4.6) 8.9 (±1.9)Texas, 1998 16.0 (±4.5) 24.1 (±2.3)Texas, 1999 10.9 (±3.8) 15.0 (±2.3)Median 10.8 11.4
* Ninety-five percent confidence interval.† Question not asked.

80 MMWR October 13, 2000
TABLE 36. Percentage of middle school and high school students receptive to tobaccocompany merchandise,* by tobacco use status, sex, and race/ethnicity — National YouthTobacco Survey, 1999
Bought or received anything Would wear or use somethingwith tobacco company name with tobacco company name
or picture on it or picture on it
Never Current Never Currenttobacco users tobacco users tobacco users tobacco users
Middle school
SexMale 10.7 (±1.2)† 46.7 (±4.5) 2.9 (±1.0) 27.2 (±5.5)Female 7.8 (±1.2) 37.3 (±5.5) 0.6 (±0.2) 16.6 (±5.1)
Race/ethnicityWhite 10.0 (±1.0) 45.9 (±4.9) 1.7 (±0.6) 28.2 (±3.7)Black 7.0 (±1.8) 35.8 (±6.1) 1.3 (±1.0) 12.5 (±6.5)Hispanic 9.7 (±2.0) 36.2 (±5.9) 1.9 (±0.8) 14.3 (±7.3)
Total (middle school) 9.2 (±0.8) 42.5 (±3.5) 1.7 (±0.4) 22.4 (±4.3)
High school
SexMale 12.1 (±2.5) 39.7 (±2.7) 3.1 (±1.2) 26.0 (±2.9)Female 9.1 (±1.6) 31.9 (±2.7) 1.1 (±0.6) 14.9 (±2.9)
Race/ethnicityWhite 11.2 (±2.0) 37.7 (±2.7) 2.2 (±1.0) 23.1 (±2.5)Black 8.7 (±3.3) 27.7 (±7.2) 0.5 (±0.8) 12.5 (±4.7)Hispanic 10.4 (±4.5) 34.0 (±7.4) 3.8 (±2.4) 18.6 (±6.7)
Total (high school) 10.5 (±1.6) 36.2 (±2.2) 2.1 (±0.8) 21.0 (±2.2)
* For example, a cigarette lighter or T-shirt.† Ninety-five percent confidence interval.

Vol. 49 / No. SS-10 MMWR 81
TABLE 37. Percentage of middle school and high school students receptive to tobaccocompany merchandise,* by tobacco use status and state — State Youth Tobacco Surveys,1998 and 1999
Bought or received anything Would wear or use somethingwith tobacco company name with tobacco company name
or picture on it or picture on it
Never Current Never Currenttobacco users tobacco users tobacco users tobacco users
Middle school
Arkansas, 1999 19.3 (±5.6)† 49.0 (± 4.3) 3.2 (±3.6) 26.7 (±8.4)Florida, 1998 13.7 (±1.1) 45.3 (± 2.2) 4.1 (±0.6) 30.1 (±2.1)Florida, 1999 10.8 (±1.1) 44.8 (± 2.8) 2.0 (±0.4) 24.1 (±2.5)Georgia, 1999 13.2 (±4.0) 45.0 (± 7.0) 2.6 (±1.9) 25.5 (±6.4)Kansas, 1999 12.8 (±2.1) 47.4 (± 3.7) 3.9 (±2.0) 31.7 (±3.6)Mississippi, 1998 12.2 (±2.4) 42.1 (± 4.6) 4.9 (±1.9) 30.8 (±2.6)Mississippi, 1999 8.4 (±1.7) 34.1 (± 6.3) 2.8 (±1.1) 24.4 (±4.8)Missouri, 1999 11.4 (±2.6) 46.9 (± 7.9) NA§ NANebraska, 1999 10.9 (±1.6) 43.1 (± 4.3) 2.1 (±0.7) 24.6 (±4.9)New Jersey, 1999 15.0 (±1.3) 43.6 (± 3.4) 3.0 (±0.5) 25.1 (±5.2)North Carolina, 1999 14.2 (±1.4) 41.6 (± 4.3) 3.4 (±1.0) 24.0 (±4.3)Oklahoma, 1999 15.0 (±2.4) 57.9 (± 5.6) 3.1 (±1.0) 30.9 (±5.7)South Dakota, 1999 17.1 (±2.0) 52.6 (± 6.0) 2.3 (±1.0) 20.2 (±5.7)Tennessee, 1999 11.0 (±2.7) 46.7 (±10.9) 3.9 (±2.7) 20.6 (±7.2)Texas, 1998 10.7 (±3.3) 43.8 (± 4.1) 5.0 (±2.2) 32.6 (±4.4)Texas, 1999 12.5 (±1.7) 48.6 (± 3.7) 2.8 (±1.5) 23.1 (±3.2)Median 12.6 45.2 3.2 26.5
High school
Arkansas, 1999 16.2 (±4.7) 49.6 (± 5.4) 1.3 (±1.4) 22.0 (±5.9)Florida, 1998 11.4 (±1.2) 39.8 (± 2.0) 4.8 (±1.0) 31.4 (±1.9)Florida, 1999 9.5 (±1.2) 32.8 (± 2.1) 2.4 (±0.7) 19.9 (±1.8)Mississippi (private), 1998 13.3 (±3.0) 37.9 (± 4.2) 5.6 (±2.1) 36.1 (±5.2)Mississippi (private), 1999 12.3 (±3.1) 34.7 (± 2.9) 5.2 (±2.1) 31.0 (±3.9)Mississippi (public), 1998 12.0 (±3.2) 33.8 (± 4.3) 5.6 (±2.7) 26.1 (±3.9)Mississippi (public), 1999 10.1 (±4.1) 36.9 (± 4.1) 5.0 (±2.6) 23.0 (±4.3)New Jersey, 1999 17.2 (±2.1) 47.9 (± 3.6) 4.0 (±1.0) 26.1 (±2.9)North Carolina, 1999 14.5 (±1.3) 44.8 (± 2.8) 3.3 (±1.0) 25.0 (±2.3)Oklahoma, 1999 14.7 (±3.3) 45.5 (± 3.6) 4.8 (±1.9) 26.2 (±3.0)Tennessee, 1999 11.1 (±2.8) 46.1 (± 4.0) 5.2 (±3.2) 27.8 (±4.4)Texas, 1998 11.6 (±2.6) 38.3 (± 2.5) 6.0 (±2.4) 28.4 (±4.5)Texas, 1999 15.2 (±2.3) 37.2 (± 2.6) 4.2 (±2.7) 23.2 (±3.6)Median 12.3 38.3 4.9 26.9
* For example, a cigarette lighter or T-shirt.† Ninety-five percent confidence interval.§ Question not asked.
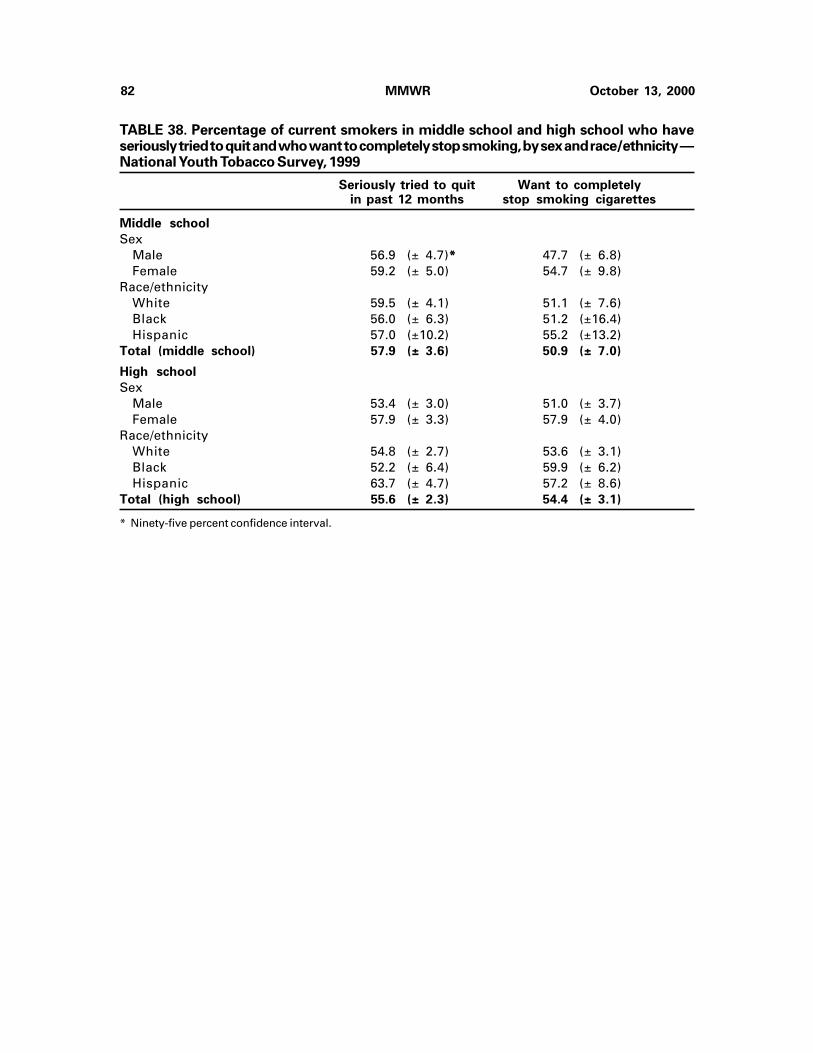
82 MMWR October 13, 2000
TABLE 38. Percentage of current smokers in middle school and high school who haveseriously tried to quit and who want to completely stop smoking, by sex and race/ethnicity —National Youth Tobacco Survey, 1999
Seriously tried to quit Want to completelyin past 12 months stop smoking cigarettes
Middle school
SexMale 56.9 (± 4.7)* 47.7 (± 6.8)Female 59.2 (± 5.0) 54.7 (± 9.8)
Race/ethnicityWhite 59.5 (± 4.1) 51.1 (± 7.6)Black 56.0 (± 6.3) 51.2 (±16.4)Hispanic 57.0 (±10.2) 55.2 (±13.2)
Total (middle school) 57.9 (± 3.6) 50.9 (± 7.0)
High school
SexMale 53.4 (± 3.0) 51.0 (± 3.7)Female 57.9 (± 3.3) 57.9 (± 4.0)
Race/ethnicityWhite 54.8 (± 2.7) 53.6 (± 3.1)Black 52.2 (± 6.4) 59.9 (± 6.2)Hispanic 63.7 (± 4.7) 57.2 (± 8.6)
Total (high school) 55.6 (± 2.3) 54.4 (± 3.1)
* Ninety-five percent confidence interval.
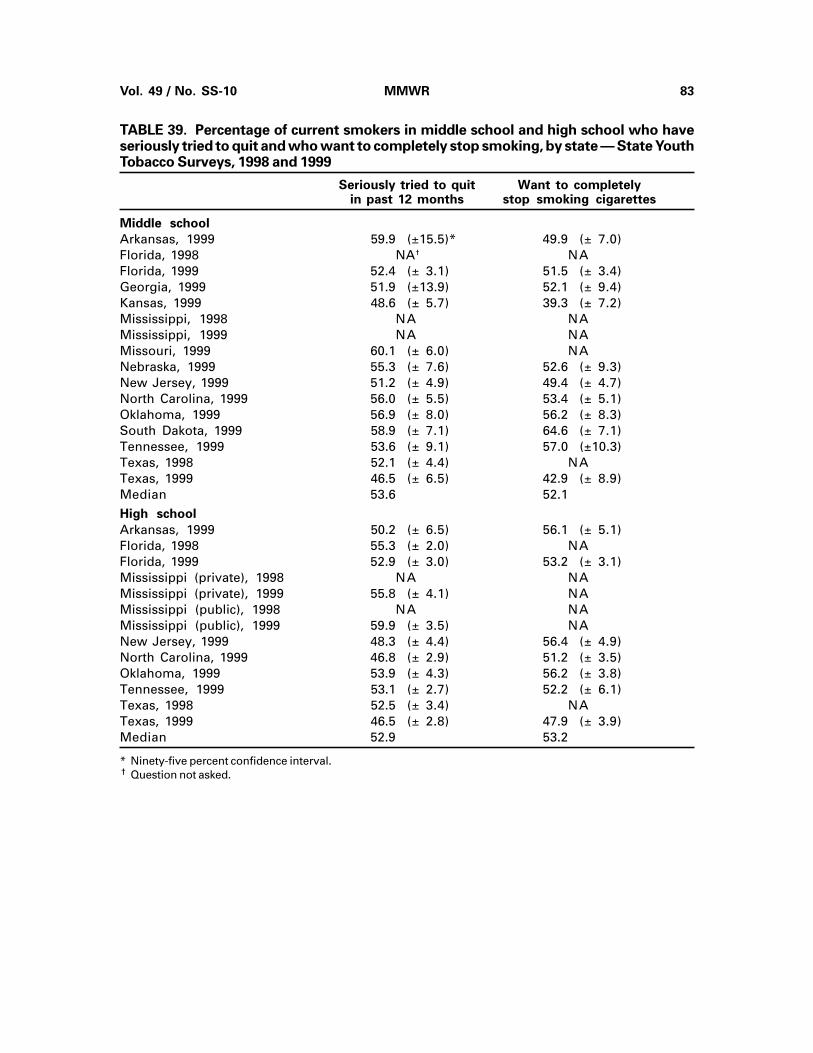
Vol. 49 / No. SS-10 MMWR 83
TABLE 39. Percentage of current smokers in middle school and high school who haveseriously tried to quit and who want to completely stop smoking, by state — State YouthTobacco Surveys, 1998 and 1999
Seriously tried to quit Want to completelyin past 12 months stop smoking cigarettes
Middle school
Arkansas, 1999 59.9 (±15.5)* 49.9 (± 7.0)Florida, 1998 NA† NAFlorida, 1999 52.4 (± 3.1) 51.5 (± 3.4)Georgia, 1999 51.9 (±13.9) 52.1 (± 9.4)Kansas, 1999 48.6 (± 5.7) 39.3 (± 7.2)Mississippi, 1998 NA NAMississippi, 1999 NA NAMissouri, 1999 60.1 (± 6.0) NANebraska, 1999 55.3 (± 7.6) 52.6 (± 9.3)New Jersey, 1999 51.2 (± 4.9) 49.4 (± 4.7)North Carolina, 1999 56.0 (± 5.5) 53.4 (± 5.1)Oklahoma, 1999 56.9 (± 8.0) 56.2 (± 8.3)South Dakota, 1999 58.9 (± 7.1) 64.6 (± 7.1)Tennessee, 1999 53.6 (± 9.1) 57.0 (±10.3)Texas, 1998 52.1 (± 4.4) NATexas, 1999 46.5 (± 6.5) 42.9 (± 8.9)Median 53.6 52.1
High school
Arkansas, 1999 50.2 (± 6.5) 56.1 (± 5.1)Florida, 1998 55.3 (± 2.0) NAFlorida, 1999 52.9 (± 3.0) 53.2 (± 3.1)Mississippi (private), 1998 NA NAMississippi (private), 1999 55.8 (± 4.1) NAMississippi (public), 1998 NA NAMississippi (public), 1999 59.9 (± 3.5) NANew Jersey, 1999 48.3 (± 4.4) 56.4 (± 4.9)North Carolina, 1999 46.8 (± 2.9) 51.2 (± 3.5)Oklahoma, 1999 53.9 (± 4.3) 56.2 (± 3.8)Tennessee, 1999 53.1 (± 2.7) 52.2 (± 6.1)Texas, 1998 52.5 (± 3.4) NATexas, 1999 46.5 (± 2.8) 47.9 (± 3.9)Median 52.9 53.2
* Ninety-five percent confidence interval.† Question not asked.

84 MMWR October 13, 2000
TABLE 40. Percentage of middle school and high school students who currently smoke whothink they could quit if they wanted to and percentage of ever smokers who have everattended a program to help them quit, by sex and race/ethnicity — National Youth TobaccoSurvey, 1999
Current smokers who Ever tobacco usersthink they could quit who have ever attended
if they wanted to program to help them quit
Middle school
SexMale 82.5 (± 5.2)* 23.0 (±4.5)Female 81.3 (± 5.1) 16.1 (±3.8)
Race/ethnicityWhite 81.3 (± 4.9) 16.0 (±3.3)Black 83.9 (±13.1) 32.2 (±7.2)Hispanic 85.6 (± 3.8) 17.9 (±2.7)
Total (middle school) 81.7 (± 4.3) 19.9 (±3.1)
High school
SexMale 84.2 (± 2.8) 8.7 (±1.8)Female 83.3 (± 2.9) 8.9 (±2.1)
Race/ethnicityWhite 82.8 (± 2.3) 7.8 (±1.7)Black 87.6 (± 6.7) 15.5 (±4.5)Hispanic 85.8 (± 6.0) 9.1 (±3.8)
Total (high school) 83.7 (± 2.4) 8.8 (±1.4)
* Ninety-five percent confident interval.

Vol. 49 / No. SS-10 MMWR 85
TABLE 41. Percentage of middle school and high school students who currently smoke whothink they could quit if they wanted to and percentage of ever smokers who have everattended a program to help them quit, by state — State Youth Tobacco Surveys, 1998 and1999
Current smokers who Ever tobacco usersthink they could quit who have ever attended
if they wanted to program to help them quit
Middle school
Arkansas, 1999 80.6 (±10.1)* 16.2 (±6.6)Florida, 1998 NA† NAFlorida, 1999 NA NAGeorgia, 1999 78.6 (± 6.9) 8.0 (±2.0)Kansas, 1999 72.0 (± 9.4) 12.4 (±3.4)Mississippi, 1998 NA NAMississippi, 1999 NA NAMissouri, 1999 80.2 (± 6.0) NANebraska, 1999 79.0 (± 5.0) 11.4 (±1.8)New Jersey, 1999 76.8 (± 4.6) 7.3 (±1.1)North Carolina, 1999 82.3 (± 3.5) 13.3 (±1.7)Oklahoma, 1999 86.4 (± 4.5) 14.2 (±2.4)South Dakota, 1999 73.1 (± 6.7) 18.7 (±5.7)Tennessee, 1999 71.9 (±11.5) 15.7 (±4.4)Texas, 1998 NA NATexas, 1999 77.0 (± 3.6) 4.1 (±3.5)Median 78.6 12.9
High school
Arkansas, 1999 83.2 (±5.1) 15.2 (±3.1)Florida, 1998 N A NAFlorida, 1999 NA NAMississippi (private), 1998 NA NAMississippi (private), 1999 NA NAMississippi (public), 1998 NA NAMississippi (public), 1999 NA NANew Jersey, 1999 72.1 (± 2.7) 8.3 (±1.1)North Carolina, 1999 81.9 (± 2.6) 12.2 (±1.8)Oklahoma, 1999 88.9 (± 3.0) 12.8 (±1.3)Tennessee, 1999 82.5 (± 4.3) 12.8 (±2.9)Texas, 1998 NA NATexas, 1999 86.4 (± 2.2) 3.8 (±7.5)Median 82.8 12.5
* Ninety-five percent confidence interval.† Question not asked.

86 MMWR October 13, 2000
TABLE 42. Percentage of middle school and high school students who have tried to quitsmoking �1 times in the past 12 months, by smoking status, sex, and race/ethnicity —National Youth Tobacco Survey, 1999
Ever smokers Current smokers
Middle school
SexMale 40.2 (±2.0)* 56.1 (±3.1)Female 43.2 (±1.9) 66.7 (±2.2)Race/ethnicityWhite 42.5 (±2.0) 61.7 (±2.7)Black 38.9 (±2.8) 60.2 (±5.1)Hispanic 42.6 (±3.7) 60.6 (±5.8)Total (middle school) 41.6 (±1.6) 61.2 (±2.1)
High school
SexMale 41.3 (±1.7) 58.7 (±2.3)Female 43.5 (±1.7) 64.3 (±2.2)Race/ethnicityWhite 45.8 (±1.6) 61.4 (±1.9)Black 30.7 (±2.0) 58.9 (±4.6)Hispanic 41.6 (±2.6) 64.5 (±3.2)Total (high school) 42.4 (±1.4) 61.5 (±1.8)
* Ninety-five percent confident interval.

Vol. 49 / No. SS-10 MMWR 87
TABLE 43. Percentage of middle school and high school students who have tried to quitsmoking �1 times in the past 12 months, by smoking status and state — State YouthTobacco Surveys, 1998 and 1999
Ever smokers Current smokers
Middle school
Arkansas, 1999 NA* NAFlorida, 1998 NA NAFlorida, 1999 NA NAGeorgia, 1999 41.6 (±6.4)† 61.9 (±11.2)Kansas, 1999 49.1 (±7.2) 62.2 (± 9.6)Mississippi, 1998 NA NAMississippi, 1999 NA NAMissouri, 1999 46.5 (±3.8) 71.4 (± 8.5)Nebraska, 1999 43.7 (±4.8) 67.0 (± 6.4)New Jersey, 1999 30.8 (±2.6) 45.9 (± 4.1)North Carolina, 1999 44.0 (±3.3) 64.7 (± 4.7)Oklahoma, 1999 50.6 (±4.4) 71.1 (± 6.1)South Dakota, 1999 43.6 (±5.1) 67.9 (±10.2)Tennessee, 1999 49.1 (±4.5) 68.4 (± 8.7)Texas, 1998 NA NATexas, 1999 43.3 (±2.1) 56.2 (± 3.5)Median 43.8 65.8
High school
Arkansas, 1999 NA NAFlorida, 1998 NA NAFlorida, 1999 44.2 (±1.6) 63.2 (± 2.5)Mississippi (private), 1998 NA NAMississippi (private), 1999 NA NAMississippi (public), 1998 NA NAMississippi (public), 1999 NA NANew Jersey, 1999 32.0 (±1.9) 46.6 (± 4.4)North Carolina, 1999 40.7 (±2.4) 58.8 (± 2.7)Oklahoma, 1999 51.3 (±2.7) 68.0 (± 3.5)Tennessee, 1999 44.6 (±3.1) 63.5 (± 3.1)Texas, 1998 NA NATexas, 1999 40.3 (±2.7) 56.0 (± 3.8)Median 42.4 61.0
* Question not asked.† Ninety-five percent confidence interval.

88 MMWR October 13, 2000
TABLE 44. Percentage of middle school and high school students who were in a room or whorode in a car with someone who was smoking on �1 of past 7 days and who think smokefrom other persons’ cigarettes is harmful, by smoking status, sex, and race/ethnicity —National Youth Tobacco Survey, 1999
Were in same room Rode in car Think smoke fromwith someone who with someone who other persons’
was smoking on was smoking cigarettes is�1 of past 7 days �1 of past 7 days harmful to you
Never Current Never Current Never Currentsmokers smokers smokers smokers smokers smokers
Middle school
SexMale 42.2 (±2.4)* 81.4 (±5.4) 28.2 (±2.7) 75.8 (±5.3) 88.6 (±2.1) 77.2 (±4.6)Female 45.8 (±3.2) 89.8 (±3.4) 31.5 (±3.5) 85.1 (±3.2) 91.8 (±1.6) 81.9 (±5.7)
Race/ethnicityWhite 47.8 (±2.5) 89.1 (±3.5) 31.0 (±3.4) 84.3 (±3.4) 93.9 (±1.3) 83.7 (±4.0)Black 43.1 (±4.4) 79.1 (±8.7) 32.9 (±2.7) 74.0 (±9.9) 81.0 (±3.2) 79.0 (±7.2)Hispanic 33.4 (±5.7) 81.3 (±8.8) 24.1 (±6.0) 72.6 (±7.8) 86.5 (±3.4) 72.8 (±5.2)
Total, middle school 44.1 (±2.3) 85.5 (±3.2) 29.9 (±2.6) 80.1 (±3.0) 90.2 (±1.6) 79.4 (±3.8)
High school
SexMale 52.7 (±3.9) 89.1 (±2.9) 31.8 (±4.0) 82.4 (±3.0) 91.5 (±2.6) 88.9 (±2.1)Female 56.0 (±3.5) 93.5 (±1.7) 30.7 (±4.2) 85.5 (±2.8) 93.7 (±2.8) 93.2 (±1.9)
Race/ethnicityWhite 59.3 (±4.2) 93.7 (±1.5) 33.3 (±4.7) 87.2 (±2.1) 96.2 (±1.5) 92.4 (±1.6)Black 48.6 (±8.3) 85.6 (±7.3) 30.3 (±6.9) 73.5 (±6.5) 86.5 (±7.9) 85.3 (±7.7)Hispanic 45.9 (±5.8) 83.9 (±4.9) 26.9 (±4.4) 74.4 (±6.9) 85.4 (±5.7) 88.3 (±3.6)
Total, high school 54.4 (±3.1) 91.2 (±1.6) 31.3 (±3.6) 84.0 (±2.2) 92.6 (±2.3) 91.1 (±1.6)
* Ninety-five percent confidence interval.

Vol. 49 / No. SS-10 MMWR 89
TABLE 45. Percentage of middle school and high school students who were in a room or whorode in a car with someone who was smoking on �1 of past 7 days and who think smokefrom other persons’ cigarettes is harmful, by smoking status and state — State YouthTobacco Surveys, 1998 and 1999
Were in same room Rode in car Think smoke fromwith someone who with someone who other perspns’
was smoking on was smoking cigarettes is�1 of past 7 days �1 of past 7 days harmful to you
Never Current Never Current Never Currentsmokers smokers smokers smokers smokers smokers
Middle school
Arkansas, 1999 59.4 (±11.8)* 89.9 (±5.4) 47.5 (±5.3) 81.5 (± 6.6) 95.7 (±5.8) 82.8 (±9.3)Florida, 1998 39.5 (± 1.9) 87.7 (±1.4) 31.3 (±1.6) 77.3 (± 2.0) 94.2 (±0.8) 90.5 (±1.4)Florida, 1999 51.2 (± 1.8) 89.6 (±2.1) 36.2 (±1.9) 80.1 (± 3.1) 90.7 (±1.0) 82.5 (±2.8)Georgia, 1999 40.1 (± 5.8) 83.0 (±6.3) 42.7 (±4.9) 82.0 (± 7.3) 91.5 (±4.0) 84.1 (±4.8)Kansas, 1999 45.9 (± 7.2) 88.2 (±4.6) 32.2 (±5.7) 82.5 (± 5.3) 94.7 (±1.9) 83.6 (±6.4)Mississippi, 1998 44.9 (± 4.0) 88.2 (±3.8) 34.7 (±3.4) 82.6 (± 3.6) NA† NAMississippi, 1999 42.3 (± 2.8) 86.3 (±3.5) 33.1 (±3.2) 78.8 (± 4.7) NA NAMissouri, 1999 56.0 (± 4.3) 96.8 (±2.3) 37.6 (±3.9) 88.1 (± 4.6) 96.2 (±1.3) 86.9 (±4.5)Nebraska, 1999 49.9 (± 2.7) 84.8 (±3.9) 34.6 (±3.2) 79.0 (± 3.3) 91.8 (±2.0) 81.8 (±4.1)New Jersey, 1999 45.5 (± 2.7) 76.4 (±5.1) 31.6 (±2.8) 71.7 (± 4.4) 94.1 (±0.7) 84.9 (±2.4)North Carolina, 1999 48.8 (± 2.1) 86.8 (±3.5) 36.7 (±2.8) 78.5 (± 3.7) 91.7 (±1.5) 82.5 (±3.1)Oklahoma, 1999 51.2 (± 3.9) 89.5 (±2.5) 37.9 (±3.8) 86.4 (± 3.2) 92.3 (±2.1) 82.2 (±4.2)South Dakota, 1999 48.9 (± 5.0) 86.5 (±4.4) 33.6 (±4.5) 79.3 (± 8.1) 90.8 (±2.6) 87.7 (±5.5)Tennessee, 1999 51.3 (± 7.0) 87.2 (±5.9) 35.6 (±6.3) 77.8 (±13.2) 89.8 (±4.3) 84.6 (±6.3)Texas, 1998 46.4 (± 3.5) 76.6 (±5.5) 36.5 (±6.5) 71.8 (± 3.5) NA NATexas, 1999 52.6 (± 4.5) 84.4 (±5.6) 40.9 (±4.5) 76.7 (± 4.5) 89.0 (±5.5) 73.6 (±6.5)Median 48.8 87.0 35.9 79.2 91.8 83.6
High school
Arkansas, 1999 58.0 (± 6.7) 90.4 (±4.5) 37.2 (±7.3) 87.6 (± 3.9) 97.5 (±1.8) 88.0 (±4.7)Florida, 1998 48.5 (± 2.3) 92.4 (±1.2) 28.6 (±2.0) 85.1 (± 1.3) 95.2 (±1.0) 93.4 (±1.0)Florida, 1999 54.3 (± 2.2) 91.4 (±2.2) 32.0 (±1.8) 84.3 (± 2.0) 91.1 (±1.5) 88.1 (±1.6)Mississippi (private), 1998 56.1 (± 6.5) 91.6 (±3.2) 30.4 (±7.4) 89.6 (± 2.9) 98.3 (±1.2) 94.4 (±2.0)Mississippi (private), 1999 55.3 (± 3.9) 90.7 (±2.9) 30.6 (±4.5) 88.9 (± 1.2) 97.9 (±1.5) 96.0 (±1.2)Mississippi (public), 1998 55.7 (± 6.6) 92.2 (±2.2) 35.6 (±5.7) 90.2 (± 2.2) 96.1 (±1.7) 94.5 (±2.5)Mississippi (public), 1999 56.8 (± 4.0) 92.5 (±2.6) 38.9 (±5.5) 86.3 (± 3.0) 94.6 (±2.4) 94.8 (±2.0)New Jersey, 1999 49.7 (± 2.3) 83.9 (±2.9) 31.8 (±2.7) 81.3 (± 2.9) 95.3 (±1.3) 87.0 (±1.7)North Carolina, 1999 55.3 (± 3.5) 90.2 (±1.8) 32.8 (±3.3) 82.4 (± 2.2) 93.9 (±1.2) 88.6 (±2.5)Oklahoma, 1999 61.4 (± 5.1) 93.8 (±2.2) 33.3 (±4.6) 86.4 (± 3.9) 95.3 (±2.2) 89.1 (±3.0)Tennessee, 1999 75.1 (± 5.9) 93.1 (±2.3) 46.2 (±7.3) 88.4 (± 3.2) 94.5 (±2.3) 87.7 (±4.4)Texas, 1998 56.8 (± 4.5) 87.0 (±3.3) 40.9 (±4.5) 78.3 (± 2.5) NA NATexas, 1999 61.4 (± 3.2) 89.2 (±2.2) 42.3 (±4.5) 84.0 (± 3.9) 90.4 (±2.5) 86.6 (±3.4)Median 56.1 91.4 33.3 86.3 92.2 88.8
* Ninety-five percent confidence interval.† Question not asked.

90 MMWR October 13, 2000
TABLE 46. Percentage of middle school and high school students who were exposed totobacco use at home from either cigarettes or smokeless tobacco, by smoking status, sex,and race/ethnicity — National Youth Tobacco Survey, 1999
Anyone else in home Anyone else in homesmokes cigarettes uses smokeless tobacco
Never Current Never Currentsmokers smokers smokers smokers
Middle school
SexMale 32.4 (±2.4)* 64.6 (±6.7) 4.3 (±1.0) 21.2 (±4.5)Female 32.2 (±3.8) 74.7 (±4.4) 4.6 (±1.4) 17.5 (±4.3)
Race/ethnicityWhite 31.2 (±3.5) 72.2 (±5.1) 5.5 (±1.4) 23.7 (±5.1)Black 38.7 (±3.8) 61.2 (±9.0) 3.3 (±1.8) 10.9 (±4.3)Hispanic 30.1 (±4.4) 68.1 (±6.7) 2.4 (±1.2) 13.7 (±4.3)
Total (middle school) 32.4 (±2.8) 69.5 (±3.9) 4.5 (±1.0) 19.5 (±3.5)
High school
SexMale 29.2 (±4.3) 62.3 (±4.1) 4.5 (±1.6) 19.5 (±4.9)Female 28.6 (±3.1) 60.9 (±4.5) 6.2 (±2.9) 14.9 (±4.3)
Race/ethnicityWhite 28.7 (±4.4) 62.4 (±4.0) 6.9 (±2.5) 18.2 (±4.3)Black 31.8 (±4.2) 61.9 (±8.7) 2.8 (±1.8) 18.9 (±6.5)Hispanic 27.7 (±4.2) 55.6 (±5.8) 3.3 (±2.5) 11.8 (±7.4)
Total (high school) 28.9 (±3.1) 61.5 (±3.6) 5.4 (±1.8) 17.5 (±4.3)
* Ninety-five percent confidence interval.

Vol. 49 / No. SS-10 MMWR 91
TABLE 47. Percentage of middle school and high school students who were exposed totobacco use at home from either cigarettes or smokeless tobacco, by smoking status andstate — State Youth Tobacco Surveys, 1998 and 1999
Anyone else in home Anyone else in home
smokes cigarettes uses smokeless tobacco
Never Current Never Current
smokers smokers smokers smokers
Middle school
Arkansas, 1999 40.9 (±5.6)* 76.8 (±13.4) 17.6 (±4.8) 24.0 (±7.8)Florida, 1998 33.8 (±1.5) 67.0 (± 2.7) NA† NAFlorida, 1999 34.2 (±2.0) 69.1 (± 3.1) NA NAGeorgia, 1999 36.8 (±5.1) 65.0 (± 7.4) NA NAKansas, 1999 32.5 (±5.9) 74.0 (± 5.4) 12.5 (±4.9) 27.1 (±8.3)Mississippi, 1998 34.0 (±3.3) 65.0 (± 6.9) NA NAMississippi, 1999 32.6 (±2.9) 66.0 (± 5.1) NA NAMissouri, 1999 35.6 (±4.8) 75.6 (± 4.6) 9.2 (±2.8) 18.5 (±4.5)Nebraska, 1999 36.0 (±3.6) 68.9 (± 4.5) 9.4 (±1.7) 19.3 (±6.1)New Jersey, 1999 35.3 (±2.7) 64.6 (± 4.1) NA NANorth Carolina, 1999 38.8 (±2.4) 70.4 (± 4.2) 12.8 (±1.9) 24.2 (±4.9)Oklahoma, 1999 37.1 (±3.9) 74.3 (± 5.2) NA NASouth Dakota, 1999 30.6 (±4.3) 77.9 (± 6.7) 16.7 (±3.6) 32.0 (±6.2)Tennessee, 1999 38.7 (±6.3) 78.2 (± 7.2) 16.2 (±6.8) 22.0 (±7.9)Texas, 1998 32.6 (±6.5) 69.5 (± 7.5) NA NATexas, 1999 40.4 (±5.5) 65.6 (± 5.5) 15.0 (±4.5) 26.7 (±4.2)Median 35.4 69.3 13.9 24.1
High school
Arkansas, 1999 31.2 (±8.3) 57.1 (± 5.9) 12.5 (±4.3) 34.8 (±6.6)Florida, 1998 30.4 (±2.3) 56.7 (± 2.1) NA NAFlorida, 1999 31.2 (±1.7) 56.4 (± 2.9) NA NAMississippi (private), 1998 21.5 (±4.5) 46.3 (± 6.1) NA NAMississippi (private), 1999 22.7 (±3.8) 46.6 (± 4.2) NA NAMississippi (public), 1998 29.4 (±5.4) 58.3 (± 4.1) NA NAMississippi (public), 1999 32.2 (±6.6) 63.0 (± 5.1) NA NANew Jersey, 1999 32.7 (±2.7) 57.4 (± 4.5) NA NANorth Carolina, 1999 30.6 (±2.5) 59.4 (± 3.2) 9.9 (±2.2) 17.6 (±2.6)Oklahoma, 1999 30.5 (±4.4) 64.6 (± 5.3) NA NATennessee, 1999 43.9 (±8.0) 61.2 (± 5.1) 12.7 (±4.0) 24.0 (±4.0)Texas, 1998 35.1 (±6.5) 67.1 (± 4.5) NA NATexas, 1999 38.9 (±5.7) 57.1 (± 6.5) 13.5 (±6.5) 19.1 (±3.4)Median 31.2 57.4 12.6 21.6
* Ninety-five percent confidence interval.† Question not asked.

92 MMWR October 13, 2000
TABLE 48. Percentage of middle school and high school students who practiced ways to say“No” to tobacco as part of school curriculum, by tobacco use status and state — State YouthTobacco Surveys, 1998 and 1999
Ever tobacco users Current tobacco users
Middle school
Arkansas, 1999 34.4 (±4.5)* 33.3 (±12.3)Florida, 1998 29.8 (±2.4) 28.4 (± 2.3)Florida, 1999 33.7 (±2.8) 30.0 (± 3.4)Georgia, 1999 28.5 (±5.6) 30.0 (± 7.1)Kansas, 1999 41.3 (±5.0) 40.6 (± 8.1)Mississippi, 1998 36.9 (±5.4) 24.9 (± 9.0)Mississippi, 1999 34.2 (±5.8) 36.0 (± 7.0)Missouri, 1999 47.4 (±7.2) 43.2 (± 8.5)Nebraska, 1999 33.8 (±3.2) 29.7 (± 4.0)New Jersey, 1999 NA† NANorth Carolina, 1999 33.9 (±3.0) 30.7 (± 4.1)Oklahoma, 1999 27.8 (±4.2) 24.6 (± 5.3)South Dakota, 1999 41.3 (±5.2) 47.5 (± 6.5)Tennessee, 1999 39.2 (±3.9) 36.9 (± 5.9)Texas, 1998 39.1 (±3.4) 39.6 (± 3.7)Texas, 1999 40.5 (±3.9) 34.9 (± 4.9)Median 34.4 33.3
High school
Arkansas, 1999 17.8 (±4.3) 17.1 (± 5.2)Florida, 1998 15.4 (±1.4) 14.3 (± 1.6)Florida, 1999 14.1 (±2.2) 12.8 (± 2.3)Mississippi (private), 1998 6.4 (±1.5) 5.9 (± 2.1)Mississippi (private), 1999 8.3 (±3.5) 7.4 (± 2.4)Mississippi (public), 1998 16.9 (±2.8) 14.5 (± 3.5)Mississippi (public), 1999 17.7 (±4.1) 16.1 (± 5.1)New Jersey, 1999 NA NANorth Carolina, 1999 14.4 (±1.6) 13.1 (± 1.9)Oklahoma, 1999 8.6 (±2.3) 8.7 (± 2.2)Tennessee, 1999 13.2 (±4.0) 12.2 (± 3.5)Texas, 1998 21.7 (±2.9) 22.0 (± 3.9)Texas, 1999 17.2 (±3.8) 16.0 (± 4.2)Median 14.9 13.7
* Ninety-five percent confidence interval.† Question not asked.

Vol. 49 / No. SS-10 MMWR 93
TABLE 49. Percentage of middle school and high school students who smoked cigarettes onschool property during the 30 days preceding the survey, by sex and race/ethnicity —National Youth Tobacco Survey, 1999
Middle school
SexMale 2.9 (±0.8)*Female 2.0 (±0.6)
Race/ethnicityWhite 2.4 (±0.7)Black 1.9 (±0.7)Hispanic 2.8 (±1.3)
Total (middle school) 2.4 (±0.5)
High school
SexMale 9.9 (±1.4)Female 8.6 (±1.9)
Race/ethnicityWhite 10.5 (±2.0)Black 5.1 (±1.5)Hispanic 8.9 (±2.6)
Total (high school) 9.3 (±1.4)
* Ninety-five percent confidence interval.
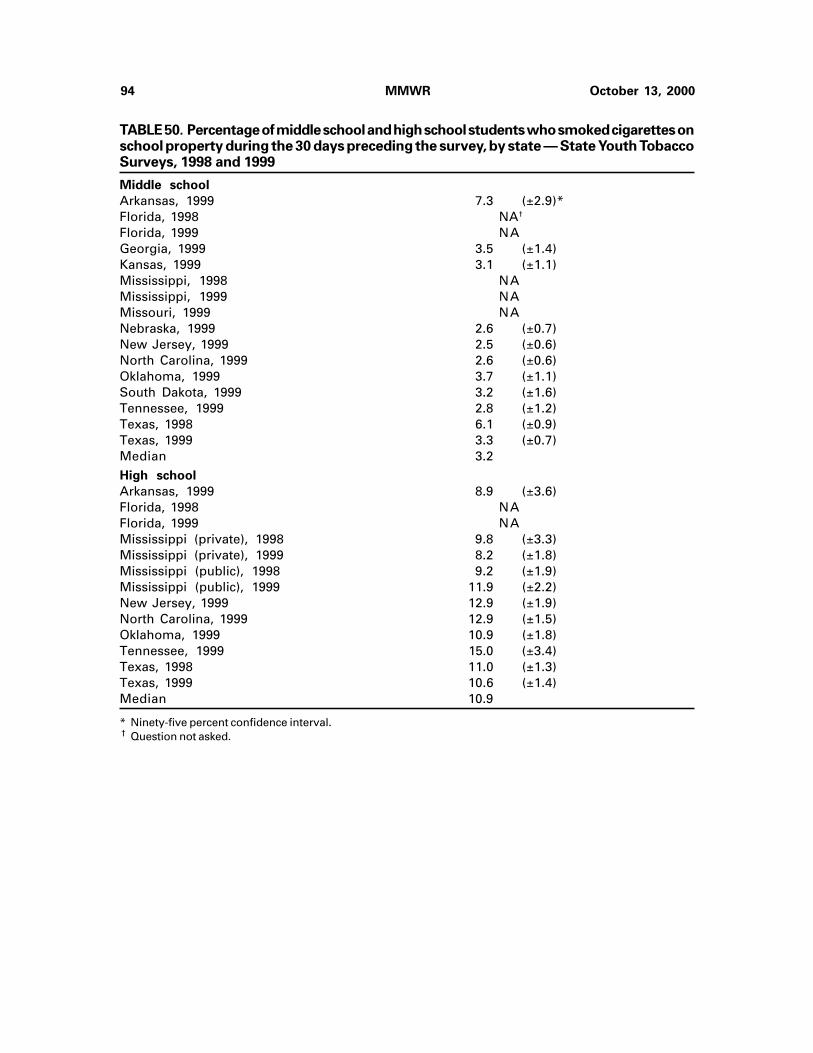
94 MMWR October 13, 2000
TABLE 50. Percentage of middle school and high school students who smoked cigarettes onschool property during the 30 days preceding the survey, by state — State Youth TobaccoSurveys, 1998 and 1999
Middle school
Arkansas, 1999 7.3 (±2.9)*Florida, 1998 NA†
Florida, 1999 NAGeorgia, 1999 3.5 (±1.4)Kansas, 1999 3.1 (±1.1)Mississippi, 1998 NAMississippi, 1999 NAMissouri, 1999 NANebraska, 1999 2.6 (±0.7)New Jersey, 1999 2.5 (±0.6)North Carolina, 1999 2.6 (±0.6)Oklahoma, 1999 3.7 (±1.1)South Dakota, 1999 3.2 (±1.6)Tennessee, 1999 2.8 (±1.2)Texas, 1998 6.1 (±0.9)Texas, 1999 3.3 (±0.7)Median 3.2
High school
Arkansas, 1999 8.9 (±3.6)Florida, 1998 NAFlorida, 1999 NAMississippi (private), 1998 9.8 (±3.3)Mississippi (private), 1999 8.2 (±1.8)Mississippi (public), 1998 9.2 (±1.9)Mississippi (public), 1999 11.9 (±2.2)New Jersey, 1999 12.9 (±1.9)North Carolina, 1999 12.9 (±1.5)Oklahoma, 1999 10.9 (±1.8)Tennessee, 1999 15.0 (±3.4)Texas, 1998 11.0 (±1.3)Texas, 1999 10.6 (±1.4)Median 10.9
* Ninety-five percent confidence interval.† Question not asked.
State and Territorial Epidemiologists and Laboratory Directors
State and Territorial Epidemiologists and Laboratory Directors are acknowledged for theircontributions to CDC Surveillance Summaries. The epidemiologists and the laboratory directorslisted below were in the positions shown as of September 2000.State/Territory Epidemiologist Laboratory DirectorAlabama John P. Lofgren, MD William J. Callan, PhDAlaska John P. Middaugh, MD Bernard Jilly, PhDArizona Norman Peterson, MD, MPH Wes B. Press, MSArkansas Thomas C. McChesney, DVM Michael G. ForemanCalifornia Duc Vugia, MD, MPH Paul Kimsey, PhDColorado Richard E. Hoffman, MD, MPH Ronald L. Cada, DrPHConnecticut James L. Hadler, MD, MPH Katherine Kelley, DrPHDelaware A. LeRoy Hathcock, PhD Jane Getchall, DrPHDistrict of Columbia Martin E. Levy, MD, MPH Ivan C. A. WalksFlorida Richard S. Hopkins, MD, MSPH Ming S. Chan, PhDGeorgia Paul Blake, MD, MPH Elizabeth A. Franko, DrPHHawaii Paul V. Effler, MD, MPH Vernon K. Miyamoto, PhDIdaho Christine G. Hahn, MD Richard H. Hudson, PhDIllinois Shari L. Bornstein, MD, MPH David L. Maserang, PhDIndiana Robert Teclaw, DVM, PhD, MPH David E. NauthIowa M. Patricia Quinlisk, MD, MPH Mary J. R. Gilchrist, PhDKansas Gianfranco Pezzino, MD, MPH Roger H. Carlson, PhDKentucky Glyn G. Caldwell, MD Samuel B. Gregorio, DrPHLouisiana Louise McFarland, DrPH Henry B. Bradford, Jr, PhDMaine Kathleen F. Gensheimer, MD, MPH John A. KruegerMaryland Jeffrey Roche, MD, MPH J. Mehsen Joseph, PhDMassachusetts Alfred DeMaria, Jr, MD Ralph J. Timperi, MPHMichigan Matthew L. Boulton, MD, MPH Frances Pouch Downes, DrPHMinnesota Richard Danila, PhD, MPH Norman Crouch, PhDMississippi Mary Currier, MD, MPH Joe O. Graves, PhDMissouri Eduardo Simoes, MSPH Eric C. Blank, DrPHMontana Todd A. Damrow, PhD, MPH Mike Spence, MDNebraska Thomas J. Safranek, MD Steve Hinrichs, MDNevada Randall L. Todd, DrPH L. Dee Brown, MD, MPHNew Hampshire Jesse Greenblatt, MD, MPH Veronica C. Malmberg, MSNNew Jersey Eddy A. Bresnitz, MD, MS S. I. Shahied, PhDNew Mexico C. Mack Sewell, DrPH, MS David E. Mills, PhDNew York City Benjamin A. Mojica, MD, MPH Alex Ramon, MD, MPHNew York State Perry F. Smith, MD Lawrence S. Sturman, MD, PhDNorth Carolina J. Newton MacCormack, MD, MPH Lou F. Turner, DrPHNorth Dakota Larry A. Shireley, MPH, MS Bonna R. Cunningham, MSOhio Forrest W. Smith, MD William Becker, DOOklahoma J. Michael Crutcher, MD, MPH John Hitz, DrPHOregon Melvin Kohn, MD Michael R. Skeels, PhD, MPHPennsylvania James T. Rankin, Jr, DVM, PhD, MPH Bruce Kleger, DrPHRhode Island Utpala Bandyopadhyay, MD, MPH Gregory Hayes, DrPHSouth Carolina James J. Gibson, MD, MPH Harold Dowda, PhDSouth Dakota Sarah L. Patrick, PhD, MPH Michael SmithTennessee William L. Moore, Jr, MD Michael W. Kimberly, DrPHTexas Dennis Perrotta, PhD, CIC Susan Neil, PhD, MBAUtah Craig R. Nichols, MPA Charles D. Brokopp, DrPHVermont Peter D. Galbraith, DMD, MPH Burton W. Wilcke, Jr, PhDVirginia Robert B. Stroube, MD, MPH James L. Pearson, DrPHWashington Juliet VanEenwyk, PhD (Acting) John KobayashiWest Virginia Loretta E. Haddy, MS, MA Andrea Labik, PhDWisconsin Jeffrey P. Davis, MD Ronald H. Laessig, PhDWyoming Karl Musgrave, DVM, MPH Richard Harris, PhDAmerican Samoa Joseph Tufa, DSM, MPH Joseph Tufa, DSM, MPHFederated States
of Micronesia Jean-Paul Chaine —Guam Robert L. Haddock, DVM, MPH Aurelto S. Espinola, MDMarshall Islands Tom D. Kijiner —Northern Mariana Islands Jose L. Chong, MD Joseph K.P. VillagomezPalau — —Puerto Rico Carmen C. Deseda, MD, MPH José Luis Miranda Arroyo, MDVirgin Islands Jose Poblete, MD (Acting) Norbert Mantor, PhD
Vol. 49 / No. SS-10
The Morbidity and Mortality Weekly Report (MMWR) Series is prepared by the Centers for Disease Controland Prevention (CDC) and is available free of charge in electronic format and on a paid subscription basis forpaper copy. To receive an electronic copy on Friday of each week, send an e-mail message [email protected]. The body content should read SUBscribe mmwr-toc. Electronic copy also is availablefrom CDC’s World-Wide Web server at http://www.cdc.gov/mmwr or from CDC’s file transfer protocol server atftp://ftp.cdc.gov/pub/Publications/mmwr. To subscribe for paper copy, contact Superintendent of Documents,U.S. Government Printing Office, Washington, DC 20402; telephone (202) 512-1800.
Data in the weekly MMWR are provisional, based on weekly reports to CDC by state health departments.The reporting week concludes at close of business on Friday; compiled data on a national basis are officiallyreleased to the public on the following Friday. Address inquiries about the MMWR Series, including material tobe considered for publication, to: Editor, MMWR Series, Mailstop C-08, CDC, 1600 Clifton Rd., N.E., Atlanta, GA30333; telephone (888) 232-3228.
All material in the MMWR Series is in the public domain and may be used and reprinted without permis-sion; citation as to source, however, is appreciated.
IU.S. Government Printing Office: 2001-633-173/48001 Region IV
MMWR
Related Documents