Youth in India: Situation and Needs 2006–2007 ANDHRA PRADESH Hkkjr ljdkj LokLF; ,oa ifjokj dY;k.k ea=ky; fuekZ.k Hkou] ubZ fnYyh & 110011 GOVERNMENT OF INDIA MINISTRY OF HEALTH & FAMILY WELFARE NIRMAN BHAWAN, NEW DELHI - 110011 International Institute for Population Sciences, Mumbai

Welcome message from author
This document is posted to help you gain knowledge. Please leave a comment to let me know what you think about it! Share it to your friends and learn new things together.
Transcript
Youth in India: Situation and Needs 2006–2007
ANDHRA PRADESH
Hkkjr ljdkjLokLF; ,oa ifjokj dY;k.k ea=ky;fuekZ.k Hkou] ubZ fnYyh & 110011
GOVERNMENT OF INDIAMINISTRY OF HEALTH & FAMILY WELFARE
NIRMAN BHAWAN, NEW DELHI - 110011
Supported by:
International Institute for Population Sciences, Mumbai
Youth in India: Situation and Needs 2006–2007 A
ND
HR
A PR
AD
ESH
This report is the result of a sub-national study undertaken by the International Institute for Population
Sciences, Mumbai and the Population Council, New Delhi, as part of a project to collect information
on key transitions experienced by youth in India, including those related to education, work force
participation, sexual activity, marriage, health and civic participation; the magnitude and patterns of
young people’s sexual and reproductive practices before, within and outside of marriage as well as related
knowledge, decision-making and attitudes. The project was implemented in six states of India, namely,
Andhra Pradesh, Bihar, Jharkhand, Maharashtra, Rajasthan and Tamil Nadu.
The International Institute for Population Sciences (IIPS) is a deemed university under administrative control
of Ministry of Health and Family Welfare, Government of India. The Institute engages in teaching and
research in population sciences, and has been actively involved in building the capacity of Population Research
Centres, and other state and central government offices that address population issues in the country and
in the Asia-Pacific region. It has a proven record in conducting national- and sub-national-level studies in
reproductive health, including the National Family Health Surveys and District Level Household and Facility
Survey under the Reproductive and Child Health programme.
The Population Council is an international, non-profit, non-governmental organisation that seeks to improve
the well-being and reproductive health of current and future generations around the world and to help
achieve a humane, equitable and sustainable balance between people and resources. The Council conducts
biomedical, social science and public health research, and helps build research capacities in developing
countries.
Copyright © 2010 International Institute for Population Sciences, Mumbai and Population Council, New Delhi
Suggested citation: International Institute for Population Sciences (IIPS) and Population Council. 2010.
Youth in India: Situation and Needs 2006–2007, Andhra Pradesh. Mumbai: IIPS.
For additional copies of this report please contact:
International Institute for Population Sciences Population CouncilGovandi Station Road, Deonar Zone 5-A, Ground FloorMumbai 400088 India Habitat CentreIndia Lodi RoadPhone: 022-42372400/42372518 New Delhi 110003email: [email protected] Phone: 011-2464 2901/02 Website: http://www.iipsindia.org email: [email protected] Website: http://www.popcouncil.org/asia/india.html
Youth in India:Situation and Needs2006–2007
ANDHRA pRADESH
Usha Ram S.K. Mohanty Abhishek Singh F. Ram
International Institute for Population Sciences, Mumbai
K.G. Santhya Shireen J. Jejeebhoy Rajib Acharya
Population Council, New Delhi

iii
Contents
Contents
Page No.
Tables........................................................................................................................................................................... viii
Figures ........................................................................................................................................................................ xiii
Foreword................................................................................................................................................................... xvii
Acknowledgements ................................................................................................................................................xix
Executive summary ............................................................................................................................................. xxii
Chapter 1: Introduction .........................................................................................................................................1
1.1 Rationale ...............................................................................................................................................................1
1.2 Study objectives ....................................................................................................................................................2
1.3 Andhra Pradesh: Overview of demographic and socio-economic features ...................................................2
1.4 Situation of youth in Andhra Pradesh ..............................................................................................................3
1.5 Youth-related policy and programme environment in Andhra Pradesh .......................................................4
1.6 Study phases .........................................................................................................................................................6
1.6.1 Pre-survey qualitative phase ................................................................................................................6
1.6.2 Survey phase ..........................................................................................................................................6
1.6.3 Post-survey qualitative phase ...............................................................................................................6
1.7 Study instruments ................................................................................................................................................7
1.7.1 Interview guidelines ..............................................................................................................................7
1.7.2 Questionnaires .......................................................................................................................................7
1.8 Study design and sample size estimation for individual interviews ............................................................10
1.8.1 Sample selection strategy ...................................................................................................................11
1.8.1.a Selection of households in rural areas ..............................................................................11
1.8.1.b Selection of households in urban areas ............................................................................13
1.8.2 Selection of individual respondents within selected households ...................................................15
1.8.3 Sample weights ....................................................................................................................................15
1.9 Recruitment, training and fieldwork ...............................................................................................................16
1.10 Ethical considerations ........................................................................................................................................17
1.11 Data processing ..................................................................................................................................................18
1.12 Interview outcomes ............................................................................................................................................19
1.13 Structure of the report ......................................................................................................................................21
iv
Youth in India: Situation and Needs 2006–2007 ANDHRA pRADESH
Page No.
Chapter 2: Profile of surveyed communities, households and youth ............................................22
2.1 Profile of rural communities surveyed ............................................................................................................22
2.2 Profile of the household population: Age-sex distribution ...........................................................................25
2.3 Profile of the household population: Marital status ......................................................................................27
2.4 Profile of the household population: Educational attainment .....................................................................29
2.5 Profile of the household population: Work participation .............................................................................29
2.6 Socio-demographic characteristics of households and heads of households ..............................................31
2.7 Profile of the household population: Housing characteristics ......................................................................34
2.8 Profile of the household population: Ownership of agricultural land ........................................................36
2.9 Profile of the household population: Overall economic status ....................................................................36
2.10 Profile of surveyed youth: Background characteristics ..................................................................................38
2.11 Profile of surveyed youth: Parental characteristics .........................................................................................39
Chapter 3: Education .............................................................................................................................................45
3.1 Educational attainment .....................................................................................................................................45
3.2 Differentials in educational attainment ...........................................................................................................47
3.3 School attendance ..............................................................................................................................................51
3.4 Reasons for school non-attendance or discontinuation ................................................................................52
3.5 School/college type, quality and experiences ..................................................................................................59
3.5.1 School/college type and quality .........................................................................................................60
3.5.2 School/college experiences .................................................................................................................62
3.6 Summary .............................................................................................................................................................64
Chapter 4: Economic and non-economic activity....................................................................................66
4.1 Economic activity ...............................................................................................................................................66
4.2 Unemployment ...................................................................................................................................................69
4.3 Work-related mobility .......................................................................................................................................73
4.4 Economic activity and schooling status ..........................................................................................................73
4.5 Participation in non-economic activity ...........................................................................................................75
4.6 Participation in vocational training programmes ..........................................................................................77
4.7 Summary .............................................................................................................................................................81
Chapter 5: Media exposure and access to pornographic materials .................................................82
5.1 Mass media exposure ........................................................................................................................................82
5.2 Exposure to pornographic materials ................................................................................................................84
5.3 Youth perceptions about the influence of television and films on youth behaviours ...............................87
5.4 Summary .............................................................................................................................................................88
v
Contents
Page No.
Chapter 6: Growing up .........................................................................................................................................89
6.1 Puberty ................................................................................................................................................................89
6.2 Family life and interaction with parents .........................................................................................................89
6.2.1 Socialisation experiences ....................................................................................................................89
6.2.2 Communication with parents ............................................................................................................95
6.3 Peer networks and interaction ..........................................................................................................................99
6.4 Support networks .............................................................................................................................................101
6.5 Summary ...........................................................................................................................................................105
Chapter 7: Agency and gender role attitudes ...........................................................................................106
7.1 Decision-making ..............................................................................................................................................106
7.2 Freedom of movement ....................................................................................................................................111
7.3 Access to money ...............................................................................................................................................116
7.4 Gender role attitudes .......................................................................................................................................117
7.5 Attitudes towards wife beating .......................................................................................................................120
7.6 Summary ...........................................................................................................................................................123
Chapter 8: Awareness of sexual and reproductive health matters .................................................124
8.1 Awareness of sex and pregnancy, contraception, STIs and HIV ................................................................124
8.1.1 Sex and pregnancy ............................................................................................................................124
8.1.2 Socio-demographic differentials in awareness of sex- and pregnancy-related matters .............127
8.1.3 Awareness of contraceptive methods ..............................................................................................127
8.1.4 Condom-related perceptions ...........................................................................................................130
8.1.5 Awareness of contraception prior to marriage ..............................................................................133
8.1.6 Awareness of medical abortion .......................................................................................................133
8.1.7 Awareness of sexually transmitted infections (STIs) and HIV/AIDS ..........................................133
8.1.8 Comprehensive awareness of HIV/AIDS ........................................................................................137
8.2 Knowledge of legal issues related to marriage and abortion ......................................................................140
8.2.1 Knowledge of the legal minimum age at marriage.......................................................................141
8.2.2 Awareness of the conditions under which abortion is legal ........................................................141
8.3 Sources of information on sex and reproduction ........................................................................................142
8.3.1 Sources of information on sexual matters .....................................................................................143
8.3.2 Current sources of information on contraception ........................................................................144
8.4 Perceptions and experience of family life or sex education ........................................................................146
8.5 Summary ...........................................................................................................................................................152
vi
Youth in India: Situation and Needs 2006–2007 ANDHRA pRADESH
Page No.
Chapter 9: Pre-marital romantic and sexual relationships ...............................................................153
9.1 Development of the questionnaire module on pre-marital romantic and sexual relationships .............153
9.2 Attitudes toward pre-marital physical intimacy and sexual relations ........................................................154
9.3 Pre-marital romantic relationships ................................................................................................................156
9.3.1 Prevalence of pre-marital romantic relationships .........................................................................156
9.3.2 Characteristics of pre-marital romantic relationships ..................................................................158
9.3.3 Parental and peer awareness of romantic partnerships ................................................................165
9.3.4 Marriage intentions and duration of pre-marital romantic relationships ..................................166
9.3.5 Pre-marital physical intimacy and sex with a romantic partner .................................................168
9.3.6 Characteristics of sexual experiences within pre-marital romantic relationships ......................168
9.4 Pre-marital sexual experiences within romantic and other relationships ..................................................171
9.4.1 Extent of pre-marital sexual experiences .......................................................................................172
9.4.2 Age at initiation of pre-marital sex ................................................................................................173
9.4.3 Pre-marital sexual risk behaviours ..................................................................................................176
9.4.4 Non-consensual sexual experiences .................................................................................................177
9.5 Triangulation of data on pre-marital sexual experiences among young people .......................................178
9.6 Summary ...........................................................................................................................................................181
Chapter 10: Transition to marriage and early married life ..............................................................182
10.1 Young people’s preferences regarding timing and type of marriage ..........................................................182
10.2 Marriage planning and extent of youth involvement ..................................................................................182
10.3 Age at marriage and cohabitation ..................................................................................................................186
10.4 Marriage preparedness .....................................................................................................................................186
10.5 Payment of dowry ...........................................................................................................................................189
10.6 Early marital experiences: Spousal communication and interaction .........................................................189
10.7 Nature of marital sexual experiences .............................................................................................................191
10.8 Experience of domestic violence within marriage .......................................................................................192
10.9 Extent and nature of extra-marital sexual relations ....................................................................................192
10.10 Contraceptive practice within marriage: Lifetime, current and prior to first pregnancy ........................195
10.11 Reproductive history ........................................................................................................................................195
10.11.1 First pregnancy experiences .............................................................................................................198
10.11.2 Children ever born and surviving ...................................................................................................198
10.11.3 Wantedness of recent pregnancies ..................................................................................................198
10.12 Ideal family size................................................................................................................................................201
10.13 Summary ...........................................................................................................................................................204
vii
Contents
Page No.
Chapter 11: Health and health seeking behaviour ................................................................................205
11.1 Substance use ...................................................................................................................................................205
11.2 General and sexual and reproductive health problems ...............................................................................206
11.2.1 General health problems ..................................................................................................................206
11.2.2 Sexual and reproductive health problems ......................................................................................207
11.3 Mental health disorders ...................................................................................................................................208
11.4 Care and advice seeking ..................................................................................................................................208
11.4.1 General health problems ..................................................................................................................208
11.4.2 Sexual and reproductive health problems ......................................................................................210
11.5 Hesitation to access contraceptive supplies ...................................................................................................212
11.6 Attitudes towards pre-marital HIV testing and extent of HIV testing ......................................................213
11.7 Summary ...........................................................................................................................................................214
Chapter 12: Participation in civil society and political life ..............................................................215
12.1 Awareness of and participation in government- and NGO-sponsored programmes ..............................215
12.2 Participation in community- or panchayat-sponsored programmes .........................................................219
12.3 Membership in organised groups ..................................................................................................................220
12.4 Perceptions about action taken by panchayats in addressing defiance of social norms ..........................220
12.5 Voting behaviour and perceptions of political matters ...............................................................................222
12.6 Expression of secular attitudes .......................................................................................................................223
12.7 Physical fights in the village or urban neighbourhood ...............................................................................226
12.8 Perceptions of the leading problems facing youth .......................................................................................228
12.9 Summary ...........................................................................................................................................................229
Chapter 13: Looking forward ..........................................................................................................................231
13.1 Recommendations for programmes ...............................................................................................................231
13.2 Directions for future research ........................................................................................................................236
References .................................................................................................................................................................240
Appendix A ...............................................................................................................................................................246
Principal investigators and authors ..................................................................................................246
Andhra Pradesh study staff ...............................................................................................................247
Advisory committees ..........................................................................................................................250
Appendix B Estimates of sampling errors ............................................................................................................252
Appendix C Data quality tables .............................................................................................................................272
viii
Youth in India: Situation and Needs 2006–2007 ANDHRA pRADESH
Tables
Page No.
Chapter 1: Introduction
Table 1.1 Sampling stratification scheme ...........................................................................................................12
Table 1.2 Results of household interviews .........................................................................................................19
Table 1.3 Results of eligible respondent interviews ..........................................................................................20
Chapter 2: Profile of surveyed communities, households and youth
Table 2.1 Profile of surveyed villages ..................................................................................................................23
Table 2.2 Proximity of study residents to selected facilities .............................................................................24
Table 2.3 Distribution of the surveyed population by age and sex ................................................................25
Table 2.4 Marital status of the surveyed population ........................................................................................28
Table 2.5 Age at marriage of usual residents of households ...........................................................................29
Table 2.6 Educational attainment........................................................................................................................30
Table 2.7 Work participation ...............................................................................................................................32
Table 2.8 Socio-demographic characteristics of households and heads of households ................................32
Table 2.9 Housing characteristics ........................................................................................................................35
Table 2.10 Household ownership of agricultural land .......................................................................................37
Table 2.11 Household assets and wealth status ...................................................................................................38
Table 2.12 Background characteristics of surveyed youth ..................................................................................40
Table 2.13 Parental characteristics of surveyed youth ........................................................................................42
Chapter 3: Education
Table 3.1 Educational attainment and current educational status ..................................................................46
Table 3.2 Educational attainment of young men by selected background characteristics ...........................47
Table 3.3 Educational attainment of young women by selected background characteristics .......................49
Table 3.4a Reasons for never attending school ...................................................................................................54
Table 3.4b Reasons for school discontinuation by level of education ..............................................................56
Table 3.5 Educational facilities availed ...............................................................................................................61
Table 3.6 Schooling experiences ..........................................................................................................................63
ix
Tables
Page No.
Chapter 4: Economic and non-economic activity
Table 4.1 Economic activity .................................................................................................................................67
Table 4.2 Unemployment .....................................................................................................................................70
Table 4.3 Unemployment by selected background characteristics ...................................................................71
Table 4.4 Work-related mobility ..........................................................................................................................73
Table 4.5 Participation in household chores ......................................................................................................76
Table 4.6 Participation in vocational training programmes .............................................................................78
Table 4.7 Willingness of youth to participate in vocational training programmes .......................................79
Chapter 5: Media exposure and access to pornographic materials
Table 5.1 Mass media exposure ...........................................................................................................................83
Table 5.2 Exposure to pornographic materials ..................................................................................................85
Table 5.3 Perceptions about the influence of television and films on youth behaviours .............................87
Chapter 6: Growing up
Table 6.1a Age at puberty among young women ...............................................................................................90
Table 6.1b Age at puberty among young men ....................................................................................................90
Table 6.2 Socialisation experiences......................................................................................................................91
Table 6.3 Perceptions of parental reactions to selected activities ....................................................................93
Table 6.4 Experience of domestic violence ........................................................................................................96
Table 6.5 Parental communication......................................................................................................................97
Table 6.6 Size of peer networks ........................................................................................................................100
Table 6.7 Interaction with same- and opposite-sex friends ...........................................................................102
Table 6.8a Leading confidante on personal matters .........................................................................................103
Table 6.8b Leading confidante on matters relating to the experience of teasing
among young women ........................................................................................................................104
Chapter 7: Agency and gender role attitudes
Table 7.1 Decision-making .................................................................................................................................107
Table 7.2 Decision-making autonomy by selected background characteristics ............................................109
Table 7.3 Freedom of movement ......................................................................................................................112
Table 7.4 Freedom of movement by selected background characteristics ....................................................114
Table 7.5 Access to money .................................................................................................................................116
Table 7.6 Gender role attitudes .........................................................................................................................118
Table 7.7 Attitudes towards wife beating .........................................................................................................121
x
Youth in India: Situation and Needs 2006–2007 ANDHRA pRADESH
Page No.
Chapter 8: Awareness of sexual and reproductive health matters
Table 8.1 Awareness of sex- and pregnancy-related matters ..........................................................................125
Table 8.2 Awareness of sex- and pregnancy-related matters by selected
background characteristics ................................................................................................................128
Table 8.3 Awareness of contraceptive methods ...............................................................................................131
Table 8.4 Perceptions of selected issues related to condom use ....................................................................134
Table 8.5 Awareness of contraception prior to marriage ...............................................................................135
Table 8.6 Awareness of STIs and HIV/AIDS ...................................................................................................136
Table 8.7 Comprehensive knowledge of HIV/AIDS by selected background characteristics .....................138
Table 8.8 Knowledge of the legal minimum age at marriage ........................................................................142
Table 8.9 Awareness of the conditions under which abortion is legal .........................................................143
Table 8.10 Sources of information on sexual matters before marriage ..........................................................145
Table 8.11 Current sources of information on contraception .........................................................................147
Table 8.12 Perceptions about family life or sex education ...............................................................................148
Table 8.13 Experiences of family life or sex education ....................................................................................150
Chapter 9: Pre-marital romantic and sexual relationships
Table 9.1 Attitudes toward pre-marital physical intimacy and sexual relations ..........................................155
Table 9.2 Pre-marital romantic relationships ...................................................................................................157
Table 9.3 Prevalence of pre-marital romantic relationships by selected
background characteristics ................................................................................................................159
Table 9.4 Characteristics of pre-marital romantic relationships and partners.............................................162
Table 9.5 Meeting places with pre-marital romantic partners .......................................................................166
Table 9.6 Peer and parental awareness of first pre-marital romantic relationship ......................................167
Table 9.7 Marriage intentions and duration of pre-marital romantic relationships ...................................169
Table 9.8 Physical intimacy and sexual experiences in pre-marital romantic relationships .......................170
Table 9.9 Characteristics of sexual experiences within pre-marital romantic relationships .......................172
Table 9.10 Overall pre-marital sexual experiences ............................................................................................174
Table 9.11 Overall pre-marital sexual experiences by selected background characteristics ..........................175
Table 9.12 Age at initiation of pre-marital sex..................................................................................................176
Table 9.13 Pre-marital sexual risk behaviours ...................................................................................................177
Table 9.14 Pre-marital non-consensual sexual experiences ..............................................................................179
Table 9.15 Levels of pre-marital romantic and sexual experiences by different
reporting methods..............................................................................................................................180
xi
Tables
Page No.
Chapter 10: Transition to marriage and early married life
Table 10.1 Preferences regarding timing and type of marriage .......................................................................183
Table 10.2 Initiation of discussion on marriage and extent of youth involvement ......................................185
Table 10.3 Age at marriage and cohabitation ....................................................................................................187
Table 10.4 Marriage preparedness .......................................................................................................................188
Table 10.5 Early marital experiences...................................................................................................................190
Table 10.6 Sexual experiences within marriage .................................................................................................191
Table 10.7 Domestic violence within marriage .................................................................................................193
Table 10.8 Extent of extra-marital sexual experiences ......................................................................................194
Table 10.9 Contraceptive use within marriage ..................................................................................................196
Table 10.10 First pregnancy experience ................................................................................................................197
Table 10.11 Reproductive history ..........................................................................................................................199
Table 10.12 Children ever born and surviving by selected background characteristics .................................199
Table 10.13 Wantedness of most recent pregnancy ............................................................................................200
Table 10.14 Ideal family size ..................................................................................................................................201
Table 10.15a Married young men’s preferences for sons and daughters by selected
background characteristics ................................................................................................................202
Table 10.15b Married young women’s preferences for sons and daughters by selected
background characteristics ................................................................................................................203
Chapter 11: Health and health seeking behaviour
Table 11.1 Substance use ......................................................................................................................................206
Table 11.2 Self-reported health problems ..........................................................................................................207
Table 11.3 Reported symptoms or behaviours suggestive of mental health disorders ..................................209
Table 11.4 Care and advice seeking for reported health problems .................................................................211
Table 11.5 Hesitation to access contraceptive supplies .....................................................................................212
Table 11.6 Attitudes towards pre-marital HIV testing and extent of HIV testing ........................................213
Chapter 12: Participation in civil society and political life
Table 12.1 Awareness of and participation in government-and NGO-sponsored programmes ..................216
Table 12.2 Participation in community-led programmes .................................................................................219
Table 12.3 Membership in organised groups .....................................................................................................221
Table 12.4 Perceptions about actions taken by the panchayat in case of defiance of social norms ............222
Table 12.5 Voting behaviour of eligible youth and perceptions about political matters ..............................224
Table 12.6 Expression of secular attitudes .........................................................................................................225
Table 12.7 Physical fights in village/neighbourhood .........................................................................................227
Table 12.8 Perceptions about the leading problem facing youth ....................................................................228
xii
Youth in India: Situation and Needs 2006–2007 ANDHRA pRADESH
Page No.
Appendix B: Estimates of sampling errors
Table B.1 List of selected variables for sampling errors, Andhra Pradesh, 2007–08 ...................................254
Table B.2 Sampling errors, Andhra Pradesh, 2007–08 ....................................................................................256
Appendix C: Data quality tables
Table C.1 Household age distribution ...............................................................................................................272
Table C.2 Single-year age distribution of eligible, selected and interviewed young men ...........................273
Table C.3 Single-year age distribution of eligible, selected and interviewed young women ......................274
Table C.4 Completeness of reporting ................................................................................................................275
xiii
Figures
Figures
Figure 3.1 Percentage of youth who were in school at ages 12 and 15, according to
residence, Andhra Pradesh, 2007–08 ..................................................................................................51
Figure 3.2a Cumulative percentage of youth who had completed each year of education
(Classes1 to 17), Andhra Pradesh (combined), 2007–08 .................................................................52
Figure 3.2b Cumulative percentage of youth who had completed each year of education
(Classes1 to 17), Andhra Pradesh (urban), 2007–08 .......................................................................53
Figure 3.2c Cumulative percentage of youth who had completed each year of education
(Classes1 to 17), Andhra Pradesh (rural), 2007–08 .........................................................................53
Figure 3.3a Percentage of married youth who had discontinued schooling by class when
discontinued and reasons for discontinuation, Andhra Pradesh 2007–08 .....................................59
Figure 3.3b Percentage of unmarried youth who had discontinued schooling by class when
discontinued and reasons for discontinuation, Andhra Pradesh, 2007–08 ....................................59
Figure 4.1a Economic activity and schooling status among youth aged 15–24, by age,
Andhra Pradesh, 2007–08 ...................................................................................................................74
Figure 4.1b Economic activity and schooling status among married men aged 15–29 and
married women aged 15–24, by age, Andhra Pradesh, 2007–08 ....................................................74
Figure 4.1c Economic activity and schooling status among unmarried men and
women aged 15–24, by age, Andhra Pradesh, 2007–08 ...................................................................74
Figure 4.2 Percentage of youth who participated in domestic chores, according to residence,
Andhra Pradesh, 2007–08 ...................................................................................................................77
Figure 4.3 Percentage of youth who ever attended a vocational training programme
and percentage who were interested in participating in such programmes,
according to residence, Andhra Pradesh, 2007–08 ...........................................................................79
Figure 5.1 Percentage of youth exposed to television, films, print media and the internet,
Andhra Pradesh, 2007–08 ...................................................................................................................82
Figure 6.1 Percentage of youth reporting gendered socialisation experiences relative to
an opposite-sex sibling/cousin, according to residence, Andhra Pradesh, 2007–08 ......................92
Figure 6.2 Percentage of youth reporting that their father or mother, respectively, would disapprove
if they brought same- and opposite-sex friends home, Andhra Pradesh, 2007–08 ......................95
Page No.
xiv
Youth in India: Situation and Needs 2006–2007 ANDHRA pRADESH
Page No.
Figure 6.3a Percentage of youth who discussed various matters with their father,
according to residence, Andhra Pradesh, 2007–08 ...........................................................................98
Figure 6.3b Percentage of youth who discussed various matters with their mother,
according to residence, Andhra Pradesh, 2007–08 ...........................................................................98
Figure 6.4 Percentage of youth reporting at least one opposite-sex friend, according to
residence, Andhra Pradesh, 2007–08 ................................................................................................101
Figure 7.1 Percent distribution of youth by participation in decision-making on
selected matters, Andhra Pradesh, 2007–08 ....................................................................................108
Figure 7.2 Percentage of youth allowed to visit selected places within and outside the
village/neighbourhood unescorted, Andhra Pradesh, 2007–08 .....................................................113
Figure 7.3 Percentage of youth who expressed egalitarian gender role attitudes on
selected issues, Andhra Pradesh, 2007–08 .......................................................................................120
Figure 7.4 Percentage of youth who believed wife beating is justified in selected situations,
Andhra Pradesh, 2007–08 .................................................................................................................122
Figure 8.1 Percentage of youth reporting awareness of selected sex- and pregnancy-related matters,
according to residence, Andhra Pradesh, 2007–08 .........................................................................126
Figure 8.2 Percentage of youth who reported correct specific knowledge of oral pills and
condoms, according to residence, Andhra Pradesh, 2007–08........................................................133
Figure 8.3 Percent distribution of youth by awareness of medical abortion, according to
residence, Andhra Pradesh, 2007–08 ................................................................................................135
Figure 8.4a Comprehensive knowledge of HIV/AIDS by educational level,
Andhra Pradesh, 2007–08 .................................................................................................................140
Figure 8.4b Comprehensive knowledge of HIV/AIDS by wealth quintile,
Andhra Pradesh, 2007–08 .................................................................................................................140
Figure 8.5 Percentage of youth by awareness of HIV/AIDS, comprehensive knowledge
about HIV/AIDS and awareness of STIs, Andhra Pradesh, 2007–08 ...........................................141
Figure 8.6 Percentage of youth who were aware of selected conditions under which
abortion is legal, Andhra Pradesh, 2007–08 ....................................................................................144
Figure 8.7 Percentage of youth who received family life or sex education, according to
residence, Andhra Pradesh, 2007–08 ................................................................................................149
Figure 8.8 Percentage of youth reporting knowledge of selected sexual and reproductive
health matters according to whether they had or had not received family life or
sex education, Andhra Pradesh, 2007–08 ........................................................................................151
Figure 9.1 Percentage of youth who had made or received a “proposal” for
romantic partnership formation and percentage who had an opposite-sex
romantic partner, according to residence, Andhra Pradesh, 2007–08 ..........................................156
Figure 9.2 Percentage of youth reporting experiences of physical intimacy and sex
with a pre-marital romantic partner, Andhra Pradesh, 2007–08 ..................................................170
Figure 9.3 Percentage of youth reporting any pre-marital sexual experiences
(in face-to-face interview or sealed envelope), according to residence,
Andhra Pradesh, 2007–08 .................................................................................................................175
xv
Figures
Page No.
Figure 10.1 Percentage of youth reporting that their parents had ever sought their
opinion on timing of marriage, according to residence, Andhra Pradesh, 2007–08 ..................184
Figure 10.2 Percent distribution of married youth by degree of acquaintance with
future spouse before marriage, according to residence, Andhra Pradesh, 2007–08....................188
Figure 10.3 Percentage of married youth who reported receiving or giving dowry,
according to residence, Andhra Pradesh, 2007–08 .........................................................................189
Figure 10.4 Percentage of married youth who reported spousal communication on
selected topics, according to residence, Andhra Pradesh, 2007–08...............................................190
Figure 10.5 Percentage of married young women reporting experience of physical violence
perpetrated by their husband and percentage of married young men reporting
perpetration of physical violence against their wife, according to residence,
Andhra Pradesh, 2007–08 .................................................................................................................192
Figure 10.6 Percentage of married youth reporting lifetime and current use of
contraceptive methods within marriage, Andhra Pradesh, 2007–08 ............................................195
Figure 11.1 Percentage of youth reporting symptoms/behaviours suggestive of
mental health disorders in the month preceding the interview, according to
residence, Andhra Pradesh, 2007–08 ................................................................................................210
Figure 12.1 Percentage of youth reporting awareness of and participation in government- and
NGO-sponsored programmes in the three years preceding the interview,
according to residence, Andhra Pradesh, 2007–08 .........................................................................218
Figure 12.2 Percentage of youth aged 20 or above who had voted in the last election,
according to residence, Andhra Pradesh, 2007–08 .........................................................................223
xvi
Youth in India: Situation and Needs 2006–2007 ANDHRA pRADESH
Acknowledgements
ForewordThe Government of India is committed to addressing the multiple needs of young people. The Eleventh Five Year Plan, the National Youth Policy, the National Population Policy 2000 and the National Rural Health Mission have all advocated special programmatic attention to addressing this population. National AIDS Control Programme, Reproductive and Child Health Programme and notably the National Adolescent Reproductive and Sexual Health Strategy provide the framework for a range of sexual and reproductive health services to be provided to youth.
Effective implementation of policies and programmes, however, has been difficult because of the lack of evidence on young people’s situation and needs. The project Youth in India: Situation and Needs is intended to provide this evidence. Research has been conducted in a total of six states of India—Andhra Pradesh, Bihar, Jharkhand, Maharashtra, Rajasthan and Tamil Nadu. It provides a wealth of evidence on married and unmarried young women and young men from both rural and urban settings of each state. It covers almost every major dimension of youth life: education, work force participation, family life, sexual activity, marriage, health and civic participation. It provides state-level evidence on the magnitude and patterns of sexual and reproductive practices in and outside of marriage as well as related knowledge, decision-making and attitudes. Findings from the study provide important base-line indicators against which the long-term impact of programmes may be measured and will certainly go a long way in guiding policy, programmes and advocacy on youth issues.
This report focuses on findings from Andhra Pradesh and is based on interviews with 8330 youth from all over the state. The report provides an enormous amount of information for the first time at the state level. The information will be useful to policy makers, programme implementers in government and non government sectors, rights activists and researchers alike who are committed to addressing the needs of Andhra Pradesh’s young generation. I appreciate the efforts put in by the International Institute for Population Sciences, Population Council and the technical advisory committee who guided the study.
Naresh Dayal
Naresh DayalHealth & FW SecretaryTel.: 23061863 Fax : 23061252e-mail : [email protected] [email protected]
Government of IndiaMinistry of Health & Family WelfareNirman Bhavan, New Delhi-110108
Hkkjr ljdkjLokLF; ,oa ifjokj dY;k.k ea=ky;fuekZ.k Hkou] ubZ fnYyh & 110108
National Rural Health Mission
xviii
Youth in India: Situation and Needs 2006–2007 ANDHRA pRADESH
xix
Acknowledgements
This report from the Youth in India: Situation and Needs study describes the transition to adulthood experienced by young men and women in Andhra Pradesh. It covers multiple dimensions of their situation, ranging from education, work and marriage to sexual and reproductive health and behaviours. Evidence and recommendations contained in this report highlight, moreover, directions for programming and research that will enable youth in Andhra Pradesh to make a successful transition to adulthood.
The Youth in India: Situation and Needs study has benefited immeasurably from the input of many. We are grateful to the Ministry of Health and Family Welfare, Government of India, for granting permission to conduct this study and to the former Secretary, Shri Naresh Dayal, for his support throughout the project, and to the Secretary, Smt. K. Sujatha Rao, for her continuing support. We are also grateful to Shri G.C. Chaturvedi, former Mission Director, National Rural Health Mission, Shri P. K. Pradhan, Additional Secretary and Mission Director, National Rural Health Mission, Smt. S. Jalaja, former Additional Secretary, Shri V. K. Malhotra, Additional Director General, Dr. Rattan Chand, Chief Director, and Shri Rajesh Bhatia, Joint Director, Statistics Division for their support and guidance. We would also like to acknowledge the significant contribution of Smt. S. Jalaja as chair of our Project Advisory Committee; and Shri S.K. Das, Director General, Central Statistical Organisation and former Additional Director General, Ministry of Health and Family Welfare, Government of India for support provided throughout the project.
We would also like to express our thanks to Shri J Satyanarayana, Principal Secretary, Department of Health, Medical and Family Welfare, Government of Andhra Pradesh and Shri A. K. Parida, Principal Secretary, Youth Services and Sports, for facilitating the study in Andhra Pradesh. The smooth functioning of fieldwork was due, in large part, to the support of the state health department, and we would like to acknowledge the contribution of all, including staff at the district headquarters level and primary health centre level. The Office of the Registrar General, New Delhi and the State Census Office, Hyderabad, generously provided the project with information and maps pertaining to the 2001 Census. Their role in enabling the study to implement its sampling design is gratefully acknowledged. We would also like to express our appreciation to the Director, Indian Institute of Health and Family Welfare, Hyderabad and the Director, Osmania University Centre for International Programme, Osmania University, Hyderabad who provided us logistic support in organizing the training programme for the project.
The study received generous financial support from the John D. and Catherine T. MacArthur Foundation and the David and Lucile Packard Foundation; we are grateful for their financial support as well as for useful comments and suggestions provided by Lester Coutinho, Don Lauro and Lana Dakan of the Packard Foundation, and Poonam Muttreja and Dipa Nag Chowdhury of the MacArthur Foundation over the course of the project.
We would like to acknowledge the contribution of the late P. N. Mari Bhat, Director, International Institute for Population Sciences, during 2005-07. His input in the design and implementation of the study and in ensuring the progress of this challenging project contributed immensely to the quality of the study.
Acknowledgements
xx
Youth in India: Situation and Needs 2006–2007 ANDHRA pRADESH
We are grateful to our Project Advisory Committee members for their input, which ensured that our study did indeed address all the key issues that require policy and programme attention. We appreciate their contribution both during meetings of the committee and in various one-on-one discussions during the course of the project.
We acknowledge with gratitude the contribution of members of our Technical Advisory Committee. We were privileged that individuals with a wide range of expertise, from youth health and development to survey and qualitative approaches and ethics in research, agreed to serve as technical committee members. Our technical advisory group—Shalini Bharat, P.M. Kulkarni, Arvind Pandey, Pertti Pelto, T.K. Roy and Leela Visaria—supported the project from conceptualisation to completion. Their guidance at all stages of the study was central in enabling us to confront methodological, ethical and analytical challenges that arose over the course of the study and is gratefully acknowledged. We would like to record our deep appreciation, moreover, to P.M. Kulkarni for giving us so generously of his time in working through problems encountered during the design and implementation phases.
Several specialist group meetings were held over the course of the project that focused on study design, instrument development, qualitative component development and analysis, tabulation planning and report review;; several others who did not attend these meetings provided extensive comments on one or more of these issues. We are grateful to all these specialists—Dinesh Agarwal, Mallika Alexander, John Cleland, Nimesh Desai, Lalit Deshpande, Sudha Deshpande, Kamla Gupta, M.E. Khan, Sumati Kulkarni, Shiva Kumar, Cynthia Lloyd, S. Niranjan, Sulabha Parasuraman, Vikram Patel and Sunayana Walia—for their valuable contribution. John Cleland provided inputs at almost every phase of this study—design, instrument development and analysis—and his thought-provoking suggestions are gratefully acknowledged. In particular, we would like to acknowledge our external peer reviewers, P.M. Kulkarni and Sumati Kukarni, for their thoughtful and careful assessments of an earlier draft of this report.
Given that our study probed a number of highly sensitive matters, including young people’s sexual and reproductive behaviours, it was an ethical imperative that those in need of information or services would be provided appropriate materials and referrals, respectively. We are grateful to those who provided services to our respondents in need and would like to acknowledge the TARSHI (New Delhi) whose materials (Neeli Rangu Pustakam) were distributed to the young men and women during the survey.
We would like to express our appreciation and gratitude to the International Institute for Population Sciences and the Population Council and all their staff members who helped in small and big ways in making this report possible. T.K. Roy and the late P.N. Mari Bhat as Directors of the International Institute for Population Sciences, and G. Rama Rao and S. Lahiri as officiating Directors, oversaw the activities of the project from the Institute’s perspective. Saroj Pachauri, Regional Director, South and East Asia Office, Population Council oversaw the project on behalf of the Population Council. Their insight and supervision are gratefully acknowledged.
A number of research officers, consultants and administrative staff members, both at the International Institute for Population Sciences, Mumbai, and at the Population Council, New Delhi, contributed to the smooth implementation of the study as well as the data management, analysis and report writing phases. We would like to thank those responsible for the administrative aspects of this project. At the International Institute for Population Sciences, we would like to acknowledge M. K. Kulkarni, Registrar and V. Ramakrishnan, Accounts Officer for their support at all stages of the project. We would also like to express our appreciation to the Computer Centre In-Charge, the Library In-Charge, Jeba Kumar, Pranita H. Dalvi, Usha D. Sonawane, Seema Jadhav and Avadesh Kumar who were responsible for the smooth functioning of the project. From the Population Council, we are grateful to Komal Saxena, M.A. Jose, Anil Paul and Ashutosh Mishra who ably managed the administrative, financial and IT aspects of the project. We are grateful to our Senior Research Officers, Research Officers and Assistant Research Officers for their excellent supervision of fieldwork and data management as well as for their support in analysing the data and preparing the tables for this report. Abhishekh Kumar, Lucky Singh, and Prashant Kumar Singh from the International Institute for Population Sciences, and Francis Zavier and Shilpi Rampal from the Population Council, did a painstaking job in ensuring the accuracy of data presented in the report and their contribution is gratefully acknowledged.
xxi
Acknowledgements
Shanti Menon and Komal Saxena edited and ably managed the preparation of this report; we are grateful to them for their editorial contribution and meticulous attention to detail, which have made the report more readable and precise.
We would also like to acknowledge with thanks the contribution of our team of young and enthusiastic interviewers in eliciting information on difficult topics with sensitivity and skill. They were required to overcome discomfort when asking about intimate experiences and were required to record many disturbing experiences narrated by youth, which they did professionally and empathetically. It was due to their skill and ability to engage with youth in non-judgmental ways that this study was so well received by youth in Andhra Pradesh.
We would also like to record our appreciation of the support and kindness of the people in the villages and urban neighbourhoods in which we conducted our study, and specifically panchayat members and community leaders. While initially sceptical about the study, community members opened their homes to us and acknowledged the importance of this study for the health and development of future generations. Indeed, despite the sensitive issues covered, not a single study community refused our field teams entry. The trust and support of the people are gratefully acknowledged.
Finally, and most importantly, we would like to thank the young women and men from Andhra Pradesh who welcomed us, generously gave their time and shared so many intimate details of their lives with us. We hope that the evidence generated in this report will be useful in influencing the design and content of programmes intended to meet their multiple needs and enable them to make a safe transition to adulthood.
K. G. Santhya Usha Ram Shireen Jejeebhoy S. K. Mohanty Rajib Acharya Abhishek Singh Population Council, New Delhi F. Ram International Institute for Population Sciences, Mumbai
xxii
Youth in India: Situation and Needs 2006–2007 ANDHRA pRADESH
Executive summary
The Youth in India: Situation and Needs study (referred to as the Youth Study), implemented by the International Institute for Population Sciences, Mumbai and the Population Council, New Delhi is the first-ever sub-nationally representative study conducted to identify key transitions experienced by married and unmarried youth in India. Young people (aged 10–24) constituted almost 315 million and represented 31% of the Indian population in 2001. Not only does this cohort represent India’s future in the socio-economic and political realms, but its experiences will largely determine India’s achievement of its goal of population stabilisation and the extent to which the nation will be able to harness its demographic dividend. While today’s youth are healthier, more urbanised and better educated than earlier generations, social and economic vulnerabilities persist. In the course of the transition to adulthood, moreover, young people face significant risks related to sexual and reproductive health, and many lack the knowledge and power to make informed sexual and reproductive choices.
In recognition of the importance of investing in young people, several national policies and programmes formulated since 2000, including the National Population Policy 2000, the National Youth Policy 2003, the Tenth and Eleventh Five-Year Plans, the National Adolescent Reproductive and Sexual Health Strategy and the National Rural Health Mission, have underscored a commitment to addressing the multiple needs of this group in India. Effective implementation of both policies and programmes, however, has been handicapped by the lack of evidence on young people’s situation and needs. Currently available evidence is limited, at best, and comes largely from small-scale and unrepresentative studies.
The Youth Study focused on married and unmarried young women and unmarried young men aged 15–24 and, because of the paucity of married young men in the younger ages, married men aged 15–29 in both rural and urban settings. The study collected information pertaining to key transitions experienced by youth, including those related to education, work participation, sexual activity, marriage, health and civic participation; the magnitude and patterns of young people’s sexual and reproductive practices within and outside of marriage as well as related knowledge, decision-making and attitudes.
The Youth Study comprised three phases, and included both a survey and qualitative data gathering exercises prior to and after the survey. The study was conducted in a phased manner in six states of India: Andhra Pradesh, Bihar, Jharkhand, Maharashtra, Rajasthan and Tamil Nadu.
This report focuses on findings from the survey conducted in Andhra Pradesh. The survey was undertaken between October 2007 and April 2008. During the survey, 9,121 young people were contacted, of which a total of 8,330 married and unmarried young women and men were successfully interviewed.
Characteristics of the household population
A total of 32,348 households were selected for the interview. Among these, interviews were successfully completed in 31,123 sample households, and 125,953 individuals, who were usual residents in these households, were enumerated. The age distribution was typical of a population in which fertility has been declining, with relatively smaller proportions in both younger (0–9 years) and older (60+ years) age groups. With regard to the youth population,
xxiii
Executive summary
the distribution suggests that, at the time of the survey, 10% of the population was aged 10–14 years, 9% each was aged 15–19 years and 20–24 years. A total of 18% of the population was aged 15–24 years. Overall, the sex ratio of the de jure population of the state was 1,018 females per 1,000 males, considerably higher than that observed in the 2001 census (978).
The educational profile of the household population highlights low levels of educational attainment in the state: about two-fifths of the population aged 6 years and above had no formal education. Notably, as many as 47% of females compared to 29% of males, and as many as 44% of the rural population compared to 23% of the urban population had never been to school. Reaffirming the low levels of educational attainment in the state, findings also indicate that just 10% of the total population had received 12 or more years of education.
Housing characteristics of the surveyed population suggest that 17% of all households lived in kachcha houses (constructed from mud, thatch or other low-quality materials), 38% lived in semi-pucca houses (constructed using a mix of low- and high-quality materials) and 45% lived in pucca houses (constructed entirely from cement, masonry or other high-quality materials). Some 92% of households had electricity, including almost all urban households (97%) and 90% of rural households. The majority of households (95%) reported that their main source of drinking water was either piped water, or water obtained from a hand-pump or a covered well. Access to a toilet facility of any kind was reported by about half of all households (47%).
The distribution of households by wealth quintiles shows that more than two-fifths of urban households were in the wealthiest (fifth) quintile; in contrast, only 12% of rural households were in this quintile. Likewise, one-fourth of rural households were in the poorest (first) quintile compared to only 6% of urban households.
Situation of youth
As mentioned earlier, a total of 8,330 youth were interviewed. Age profiles suggest that young men and women were about equally distributed in the 15–19 and 20–24 age groups (47–51% and 49–53%, respectively). The unmarried were, however, younger than the married, and rural youth were somewhat younger than their urban counterparts. Distributions by religion show that 84–85% of youth were Hindu, 7–10% were Muslim and 5–8% were Christian. Caste-wise distributions show that 24–25% of youth belonged to general castes, 22–23% to scheduled castes, 6% to scheduled tribes and 46–49% to other backward castes. Four in five youth reported that both parents were surviving. For those with just one parent surviving, this parent was more likely to be the mother (13–14%) than the father (2–4%). Finally, 1–2% reported that neither parent was alive.
Education
While youth in Andhra Pradesh were better educated than the general population in the state, schooling was far from universal among young people. As many as one in twelve young men and one in five young women had never attended school. Findings show, moreover, that young women in rural areas and married young women in general were particularly disadvantaged; about one-third of married young women and one quarter of women residing in rural areas had never been to school. At the time of the interview, about two-fifths of unmarried youth (and very few married) were still in school or college, and gender differences were negligible.
Not only was school enrolment limited, but school completion rates were also low among young people, particularly young women. For example, among young women, of those who had completed Class 1, only 95% had completed Class 4, and completion rates fell below 90% in Class 5. Among young men, completion rates fell below 90% a year later, that is, in Class 6. Declines in school completion were steep among both young men and women at around the time of high school completion, that is, between Classes 9 and 11, suggesting that many youth discontinued their education at high school level. Indeed, just 52% of young men and 36% of young women in the state had completed high school.
xxiv
Youth in India: Situation and Needs 2006–2007 ANDHRA pRADESH
Findings suggest moreover that youth were considerably better educated than their parents. More than half of the parents of both young men and women had never been to school.
Leading reasons for never attending school among young men and women were economic (for example, the respondent was required for work on the family farm/business or for outside wage earning work, or the family could not afford school-related expenses), attitude and perception-related (for example, education was unnecessary or the respondent was not interested in schooling) and housework-related reasons (the respondent was required for care of siblings or housework).
Among those who had ever been to school, gender differences in reasons for school discontinuation became more apparent. Leading reasons for school discontinuation among young men were economic and attitude and perception-related, irrespective of the level at which education was discontinued. Far fewer young men cited school-related reasons. Among young women, in contrast, while economic and attitude and perception-related reasons were important, school-related reasons (academic failure, distance to school, poor school quality and infrastructure) were prominent factors underlying discontinuation at all levels; housework responsibilities were also significant, particularly among those who discontinued at primary or middle school levels. Of note are findings that more than one quarter of youth who discontinued their education before completing high school cited academic failure as a reason for discontinuing their education; and that one in five married young women who discontinued their education in Classes 7–9 and one-third of those who discontinued their education in Classes 10–11 reported doing so in order to marry.
As far as type of educational facility youth attended is concerned, while the majority of young men and women attended co-educational facilities at all levels of education, young women were less likely to attend a co-educational facility at higher secondary school and college levels. Typically, more youth who had discontinued their education reported government school attendance than did those who were pursuing their education; private school attendance was reported, moreover, among large proportions who were pursuing a higher secondary or college education or had discontinued their education at this level; while gender differences were relatively mild, youth from urban areas were considerably more likely than their rural counterparts to have attended a private school or college.
Most youth, irrespective of whether they were pursuing their education or not, had access to drinking water and playgrounds. However, for the most part, youth still studying were somewhat more likely, to report the availability of toilets as well as libraries than those who had discontinued their education. The availability of all four amenities was, for the most part, somewhat more likely to be reported by those who were studying at the time of the interview than those who had discontinued their education.
Schooling experiences also differed in some instances between those who had discontinued schooling and those who were studying at the time of the interview. While differences in experience of private tuition were typically narrow, those who had discontinued their education were more likely than those who were continuing their education to perceive the academic workload to be heavy and somewhat less likely to have attended classes regularly. They were considerably less likely, moreover, to have passed the last examination for which they had appeared, suggesting that poor school performance was a significant factor leading to school discontinuation among both young men and women.
Work
Work profiles suggest that three-quarters of young men and three-fifths of young women had ever engaged in paid or unpaid work. Indeed, almost all married young men and over two-thirds of unmarried young men had done so, compared with over two-thirds and half of married and unmarried young women, respectively. Likewise, more youth in rural than urban areas had ever worked. While the majority of youth were engaged in paid work, considerable proportions of young men and women (26% each) reported unpaid work on the family farm or business. Economic activity was often initiated at an early age: 37% and 39% of young men and women, respectively, reported initiating
xxv
Executive summary
work in childhood or early adolescence (before age 15). The majority of young men (98% of the married and 67% of the unmarried) and a substantial proportion of young women (51% and 44%, respectively) had engaged in paid or unpaid work at some point in the 12 months preceding the survey. The majority of young men (85%) who had worked in the year prior to the interview had done so for the major part (at least six months) of the year. In contrast among young women, 71% had done so.
Unemployment rates ranged from 7% among young men to 10% among young women. Unemployment rates tended to be higher among the unmarried than the married. While rural-urban differences were negligible among young men, young women in urban areas reported considerably higher rates of unemployment than did their rural counterparts. Unemployment was particularly high among the educated and the economically better off than any other group. Youth were clearly interested in acquiring skills that would enable employment generation; 48% of young men and 63% of young women reported interest in vocational skills training. However, far fewer—one-third of young men and young women—had attended even one vocational training programme.
Media exposure
Findings suggest that almost all youth in Andhra Pradesh were exposed to the media, typically television (90% of all young men and 94% of all young women), newspapers, magazines or books (94% of young men and 78% of young women with five or more years of education) and films either on CD/DVD or at a theatre or video parlour (94% of young men and 77% of young women). Exposure to the internet was reported by many fewer (22% of young men and 9% of young women with five or more years of education). Gender differences were apparent with regard to exposure to the print media, to films and to the internet, with young men considerably more likely than young women to report exposure.
Findings also suggest that almost half of young men and hardly any young women had watched pornographic or “blue” films, and one-third of young men and 4% of young women had read or looked at pornographic books/magazines. Finally, half of young men (and 7% of young women) who had accessed the internet reported that they had accessed pornographic materials on the internet. At least half of young men who reported watching pornographic films or reading pornographic materials reported that they accessed these materials sometimes or frequently. Finally, between three-fifths and three-quarters of young men and women acknowledged the influence that media had on youth behaviours.
Socialisation experiences and communication with parents
Findings reveal a mixed scenario regarding the nature of socialisation experienced by youth. While responses from young men indicate that large proportions of households did discriminate between their sons and daughters in terms of freedom of movement and expectations regarding housework, responses from young women suggest the reverse. While three-quarters of young men reported that they had more freedom to go out than their sisters or female cousins did, many fewer young women, just two-fifths, agreed that they had less freedom to go out than their brothers or male cousins did. Likewise, two-thirds of young men reported that they were expected to do less housework than their sisters or female cousins, and only two-fifths of young women agreed that they were expected to do more housework than their brothers or male cousins.At the same time, far more consistently observed were gender differences in perceptions of parental control: young women were more likely than young men to perceive that their parents would disapprove of social activities in which youth tend to participate that involved members of the opposite sex.
Findings regarding communication with parents on issues relevant to youth—such as school performance, friendships, being teased or bullied, physical maturation, romantic relationships and reproductive processes—reiterate those from other studies, showing that such communication is far from universal. Indeed, sensitive topics such as romantic relationships, reproductive processes and contraception were rarely discussed with either parent.
xxvi
Youth in India: Situation and Needs 2006–2007 ANDHRA pRADESH
That parent-child communication was restricted was also evident from responses to questions probing the most likely confidante on a range of topics from taking a job to boy-girl relationships. While parents were mentioned as leading confidantes on topics such as taking a job, they were rarely cited as leading confidantes on more sensitive matters. Moreover, while young women identified their mother as the most likely confidante on such matters as menstrual problems and the experience of being teased by a boy, young men rarely identified a parent as a leading confidante on matters relating to nocturnal emission or swapnadosh. Indeed, neither young men nor women identified a parent as a leading confidante on boy-girl matters.
Young people’s family lives were marked by violence, both experienced and witnessed. Over one in three youth had observed their father beating their mother. Many youth reported being beaten by a parent during adolescence; almost half of young men and almost one-quarter of young women reported such experiences.
Peer networks and interaction
Growing up was associated with close peer networks. Almost all youth reported having same-sex friends. Young men, however, reported larger networks of friends than did young women. Opposite-sex peer networks were less common but nonetheless reported by one-third of young men and one-seventh of young women. Interaction with friends tended to be restricted to activities such as chatting and studying, although large proportions of young men did report engaging in outside activities such as going out on picnics or to see films and outdoor sports. An important measure of support was derived from these networks, however, with peers reported as the most likely confidante on issues related to boy-girl relationships for both young men and women, and on nocturnal emission for young men.
Agency and gender role attitudes
Findings highlight young women’s limited agency. For example, just one in four young women reported independent decision-making on all three issues explored in the survey, namely, choice of friends, spending one’s own money and purchase of clothes for oneself. Likewise, freedom of movement even within the village or neighbourhood was not universal among young women; just four in five young women had the freedom to visit locations within their own village or neighbourhood unescorted. Many fewer, just one in four young women reported freedom to visit at least one place outside their village or neighbourhood unescorted, and one in 10 could visit a health facility unescorted. Access to and control over financial resources tended to be limited among young women; just one in four reported some savings and one in six owned a bank or post office savings account. Of those who owned an account, just three in five operated it themselves.
Within the sub-group of young women, findings indicate that the married were more disadvantaged, in some respects, than the unmarried. For example, compared to the unmarried, married young women were less likely to exercise control over financial resources, and at the same time, more likely to hold unequal gender role attitudes and to justify wife-beating. They were, however, about as likely as the unmarried to report independent decision-making and freedom of movement.
Also notable from the findings is the striking gender divide in most dimensions of young people’s agency explored in the survey. Young women were far more disadvantaged than young men. For example, even the least educated young man was more likely than the most educated woman to report independent decision-making on all three issues explored in the survey. Although young women were as likely as young men to have money saved (25% and 24%, respectively) and own a bank or post office savings account (17% and 19%, respectively), they were less likely than young men to operate the account themselves (61% and 93%, respectively, of those who had an account).
While young men were not as disadvantaged as young women, findings indicate that many young men were also not able to exercise agency in their everyday lives. For example, only 55% of young men reported independent
xxvii
Executive summary
decision-making on all three issues explored in the survey. Similarly, young men’s freedom to visit selected localities was far from universal; for example, just over half of unmarried young men (55%) were allowed to visit a place of entertainment or to attend a programme conducted outside their village or neighbourhood unescorted, and just two-fifths were allowed to visit a health facility unescorted.
Relatively large proportions of youth espoused egalitarian gender role attitudes on such issues as the relative importance attached to educating boys versus girls, the role of the husband as the main decision-maker with regard to spending money, girls’ participation in decisions about their own marriage and so on. Even so, it is notable that young men were generally more likely than young women to report unequal gender role attitudes. A somewhat different picture emerged, however, with regard to attitudes to wife-beating. Findings highlight widespread acceptance of violence within marriage among youth, and in this case, young women were more likely than young men to so perceive; 88% of young women compared to 63% of young men justified wife beating in at least one situation explored in the survey.
Awareness of sexual and reproductive health matters
Findings underscore young people’s limited awareness of most sexual and reproductive matters, ranging from how pregnancy occurs to contraception, HIV and safe sex practices. For example, just over two-fifths of young men and over three-fifths of young women were aware that a woman can get pregnant at first sex, and just 30% of young men and 16% of young women reported awareness of STIs other than HIV.
Even on topics about which young people were generally aware, findings show that in-depth understanding was limited. For example, while 97–98% of youth reported awareness of at least one modern contraceptive method, in-depth awareness of condoms and oral contraceptives, the non-terminal methods most familiar to youth, was reported by just 80% and 17% of young men and 21% and 15% of young women, respectively. Likewise, although 94–95% of youth had heard of HIV/AIDS, just 62% of young men and 33% of young women had comprehensive knowledge of HIV/AIDS.
Youth, particularly young women had few sources of information on sex and reproduction. Indeed, half of young women and one-tenth of young men reported that they had never received any information on sexual matters (prior to marriage among the married).
Leading sources of information on sex and reproduction varied considerably between young men and women. Among young men, the leading sources of information reported were friends and neighbours (68%), followed by the media (47%). Among young women, leading sources of information were the media (21%), teachers and schools (18%) and friends and neighbours (16%). Notably, just 3–5% cited a family member. Among the leading current sources of information on contraception among young people who were aware of at least one method were similarly, peers and the media. Teachers and health care providers were relatively infrequently reported as such. Indeed, health care providers were cited as an important source of information on contraception by only a quarter of married youth; they were far less likely to have provided information to the unmarried (9–16%). Likewise, teachers were cited by just 17–18% of youth. However considerable proportions of young women (29%) but hardly any young men cited family members as a leading source of information about contraception. In short, health care providers, teachers and family members—often assumed to be more reliable sources of information than peers and the media—were infrequently and inconsistently cited as sources of information on sensitive topics such as sexual matters and contraception by young people.
Few youth—just one-third of young men and almost one-quarter of young women—had attended family life or sex education programmes either in or outside the school setting. Despite this, youth were overwhelmingly in favour of the provision of family life or sex education to young people; while young men preferred to receive this education from a professional (health care provider or teacher) and peers, young women preferred parents and teachers. Findings suggest, moreover, that youth who had undergone family life or sex education were indeed more knowledgeable about sexual and reproductive matters than those not exposed to this education.
xxviii
Youth in India: Situation and Needs 2006–2007 ANDHRA pRADESH
Pre-marital romantic relations
Findings confirm that despite strict norms prohibiting pre-marital opposite-sex mixing, opportunities do exist for the formation of pre-marital romantic relationships. Indeed, significant minorities of young men and women have made or received a “proposal” for a romantic relationship (23%), and noteworthy, if smaller, percentages reported that they had been involved in a romantic partnership (17% and 11% of young men and women, respectively). Patterns of pre-marital romantic partnerships suggest that where partnerships occurred, they were initiated at about age 18 among young men and age 16 among young women, and were hidden from parents by many, but were rarely hidden from peers. Notable gender disparities in expectations of a longer-term commitment emerged: young women were more likely than young men to have expected a romantic relationship to lead to marriage. The experiences of the married suggest, moreover, a disconnect between intentions and reality: although almost all (95%) young women and two-thirds (68%) of young men reported the intention to marry their pre-marital partner, fewer—70% of young women and 23% of young men—had done so.
While the majority—95% of young men and 82% of young women—had held hands with their romantic partner, fewer—46%—had engaged in sexual relations with their partner. It is notable that unlike the findings of many previous studies, no gender differences in reports of pre-marital sex with a romantic partner were apparent. Findings suggest, moreover, that the vast majority had engaged in unprotected sex. However, many young men and women who reported contraception at first sex reported that the female partner was involved in the decision. Very few young women who had engaged in sexual relations with a romantic partner reported that their opposite-sex romantic partner had forced them to engage in sex the first time.
Pre-marital sexual experiences in romantic and other relationships
In total, 16% of young men and 6% of young women reported the experience of pre-marital sex within romantic and/or other partnerships. In general, life table estimates reveal that roughly similar proportions of young men and women—3% and 5%, respectively—had initiated first sex before age 18; however, larger proportions of youth in rural than urban areas had initiated pre-marital sexual relations in adolescence. Moreover, initiation into pre-marital sexual activity increased as young people transitioned from early into late adolescence and further as they transitioned into young adulthood.
While sex with a romantic partner characterised pre-marital experiences for many of the sexually experienced, findings suggest that young men, but not young women, also engaged in sex in other contexts—mainly with sex workers, married women and casual partners. Many pre-marital sexual experiences reported by youth were risky, for example, one-fifth of young men and 7% of young women reporting pre-marital sex had engaged in sex with more than one partner. Moreover, consistent condom use was limited—only 17% and 2% of sexually experienced young men and women, respectively, reported condom use in all pre-marital encounters.
We acknowledge that youth, especially young women, may not report sexual experience in a survey situation. Hence, the Youth Study supplemented a series of direct questions with an opportunity to report sexual experience in an anonymous format. Surprisingly, findings suggest that a larger percentage of sexually active young men than women reported pre-marital sex only in the anonymous format. In total, direct reporting yielded somewhat higher estimates than anonymous third-party reporting, although the differences were narrow among young women. However, direct questioning supplemented by self-reporting in an anonymous format provided higher estimates of sexual experience than did face-to-face questioning alone or anonymous third-party reporting of peer behaviours.
Transition to marriage and early married life
Findings indicate that although most youth preferred to marry after age 18, early marriage continues to characterise the lives of many young women and to a certain extent the lives of young men as well. Among young women aged 20–24 years, almost one in five young women (18%) was married before age 15, 54% before age 18 and almost
xxix
Executive summary
three in four before age 20. Even though early marriage was less prevalent among young men, one in ten young men aged 20–24 years was married before age 20.
Almost all youth reported arranged marriages; it is notable, however, that 86–89% of youth were given an opportunity to participate in the decision on the choice of their spouse. At the same time, reported pre-marital acquaintance was limited. Just a little over one-quarter of young men and one-fifth of young women reported that they had ever had a chance to meet and interact alone with their spouse-to-be prior to marriage. Over two in five married youth reported that they had met their spouse for the first time on the wedding day. Compounding the lack of pre-marital acquaintance was the lack of awareness of what to expect of married life, reported by over two-thirds of young men and over four-fifths of young women.
Despite the existence of laws against the payment of dowry, this practice characterised the marriages of 81% of young men and 86% of women. Findings also show that families of urban youth appeared as likely as their rural counterparts to conform to traditional practices, such as payment of dowry.
Reports of marital life suggest that married life was characterised by considerable inter-spousal communication on most topics, yet, just one in eight young men and one in three young women had ever discussed matters relating to contraception with their spouse, clearly undermining married young people’s ability to adopt protective actions.
Physical violence and forced sex within marriage were reported by sizeable proportions of youth. For example, a little less than one-quarter of young women reported that they had ever faced physical violence perpetrated by their husband and one-fifth of young men reported perpetrating violence on their wife. Recent physical violence was likewise reported by about one-sixth of young men and about one-fifth of young women. Sexual violence was also reported by significant minorities of youth. One in ten young women reported ever being forced to engage in sex by their husband; one in seven young men reported forcing their wife to engage in sex. Fewer youth (5%) reported recent sexual violence.
While the Youth Study did not explore extra-marital sexual experiences in detail, the available data indicate that 6% of young men reported an extra-marital sexual encounter. In contrast, less than 1% of young women reported an extra-marital sexual encounter.
Contraceptive practice and pregnancy experience
Contraceptive use at any time within marriage was relatively limited, reported by 10% of young men and 23% of young women. Moreover, just 8% of young men and 21% of young women reported current use of contraception. Among contraceptive methods typically used, female sterilisation was mostly likely to be reported; indeed, over three-quarters of young men and over four-fifths of young women who were practising contraception at the time of the interview reported that their wife or they had been sterilised. Just 2–3% of young people practised contraception to delay the first birth. Not surprisingly, pregnancy typically occurred within a year of marriage for over three-fifths of young women and over half of young men who reported that they or their wife had been pregnant at least once. Moreover, substantial proportions of youth reported experiencing unintended pregnancy. For example, among young women who were not pregnant at the time of the interview and among young men whose wife was not pregnant at the time of the interview, 23% and 15%, respectively, reported that the last pregnancy was mistimed or unwanted.
Circumstances of the first birth suggest that the overwhelming majority of first births were delivered in a health care facility (72–76%) and 89–90% of first birth were delivered by a skilled attendant.
Findings also show that most respondents wanted one child of each sex and just a small minority of young men and women expressed a preference for more sons than daughters.
xxx
Youth in India: Situation and Needs 2006–2007 ANDHRA pRADESH
Substance use
Findings show that substantial proportions of young men reported the consumption of tobacco and alcohol; one-fifth of young men reported tobacco consumption and over one-fourth reported alcohol consumption. In contrast, consumption of tobacco products and alcohol was reported by very few young women (less than 2%). Drug use was reported by very few young men and not a single young woman.
Health seeking behaviour
Although youth is a generally healthy period of life, significant minorities reported experiencing general, mental, and sexual and reproductive health problems in the period preceding the interview. For example, 22% of young men and 33% of young women had experienced high fever, 7% and 2%, respectively, had experienced an injury, and 1% and 11%, respectively, reported experience of symptoms of genital infection. Moreover, 12% of young women reported menstrual problems; at the same time, 18% of young men reported anxiety about nocturnal emission. Finally, responses indicative of mental health disorders were reported by 10–11% of young men and women.
With regard to care seeking for general and sexual and reproductive health problems, patterns varied by type of problem experienced. While the large majority of those who had experienced high fever, for example, had sought care, many fewer had sought care for sexual and reproductive health problems. Of those who had sought treatment, the majority had sought advice or treatment from a private facility or provider, irrespective of the type of problem experienced. It is notable, however, that in the case of anxiety about nocturnal emission, young men rarely sought advice from a health care provider, preferring to do so from peers.
Findings suggest that youth were uncomfortable about seeking sexual and reproductive health services. For example, many youth, including the married, reported that they would indeed hesitate to approach a health care provider or a pharmacy/medical shop for contraceptive supplies.
Finally, although youth were overwhelmingly in favour of pre-marital HIV testing, relatively few had undergone HIV testing. Just 5% of young men and almost one-quarter of young women had undergone HIV testing. Married young women were far more likely than any other group to have done so; over two-fifths of married young women had undergone HIV testing, most likely as part of antenatal check-ups.
Participation in civil society and political life
Findings highlight somewhat limited participation of youth in civil society. Although a number of programmes are organised by the government or NGOs at the community level in which youth can participate, familiarity with these programmes was far from universal. Just two-fifths of young men and two-thirds of young women reported familiarity with these programmes and even fewer youth—19% of young men 22% of young women—reported participating in such programmes. Considerably more young men (59%), but fewer young women (17%) reported that they had participated in community-led activities such as cleanliness drives and the celebration of festivals and national days. Finally, just 10% of young men compared to 26% of young women reported membership in organised groups.
Findings suggest that voting behaviour was far from universal. Among those eligible to vote, 62–63% of young men and women had cast their vote in the most recent election. Also of note is that while most youth (89–90%) perceived that one could vote freely and without fear and pressure, as many as 60% of young men and 53% of young women reported disillusionment with the commitment of political parties to work for change at the community level.
By and large, youth reported secular attitudes; 88–98% reported that they mixed freely and would eat together with individuals of different religions and castes, and that they would talk to a person who has had an inter-caste marriage. However, only one-third of young men and three-fifths of young women agreed that it was best to tolerate rather than punish someone who had shown disrespect to their religion.
xxxi
Executive summary
Considerable proportions of young men and women acknowledged that physical fights among young men as well as among young women did occur in their village or urban neighbourhood. However, few youth—8% of young men and 3% of young women—reported that they had been involved in a physical fight in the year preceding the interview.
Youth reported a number of leading problems facing them and gender differences were evident. Among young men, the majority reported difficulty in finding employment and concerns about poverty more generally as leading problems. In contrast, leading problems expressed by young women were poverty and to a lesser extent, lack of amenities and infrastructure, lack of opportunities for education and difficulty in finding employment.
Recommendations for programmes
Findings presented in the sections above underscore the fact that youth face numerous challenges while making the transition to adulthood. These challenges call for programme interventions at the youth, family and service delivery levels. Key programme recommendations emerging from this study are outlined below.
Address obstacles to school completion
Youth Study findings highlight that school enrolment was far from universal among young people in the state: indeed, one in twelve young men and one in five young women had never been enrolled in school. School completion rates were also relatively low, particularly among young women; just 52% of young men and 36% of young women had completed high school. The state government has articulated its commitment to improving schooling situation in the state, and what is required now, particularly if the state is to achieve the Millennium Development Goal of ensuring universal primary school completion, are actions to implement these commitments. While the achievement of universal primary school completion is a key goal, the importance of high school education in enabling youth to make a successful transition to adulthood underscores the need, at the same time, for efforts to overcome barriers to high school completion. The gender divide and rural-urban divide observed in school enrolment and completion call, moreover, for efforts that target female children and children in rural areas.
A number of factors have been identified in the Youth Study that inhibit school completion; leading among these were economic reasons; attitudes and perceptions; and, among young women, school-related reasons. Multiple activities are needed to address these barriers. Efforts must be made, for example, to address the economic pressures that dissuade parents from enrolling their children in school and from keeping them in school once enrolled. While a number of state government programmes are ongoing that aim to reduce the cost of education, additional inputs, by way of conditional grants that encourage school completion among disadvantaged groups, also need also to be considered. Moreover, there is a need to ensure that ongoing government programmes do indeed reach the most disadvantaged groups. At the same time, activities are needed that raise awareness among parents about the importance of a secondary school education in expanding their children’s livelihood opportunities.
Activities must also address school-level barriers, notably, poor infrastructure, quality of education and academic failure, particularly among young women. There is a need to incorporate livelihoods skills building models within the school setting that will not only raise young people’s aspirations regarding their education and careers but also provide them opportunities to gain market-driven job skills. There is also a need to focus on providing better training and ensuring accountability for teachers—investments that are likely to improve the quality of the schooling experience for youth.
Findings suggesting that married young men and women remain considerably disadvantaged call for interventions that give the married a second chance to continue their education. Likewise, evidence that rural youth, particularly young women, were more disadvantaged with regard to educational opportunities than their urban counterparts calls for efforts to provide those out of school an opportunity to complete their schooling.
xxxii
Youth in India: Situation and Needs 2006–2007 ANDHRA pRADESH
Strengthen efforts to prevent child labor
Findings of the Youth Study that almost two in five young men and women had initiated work in childhood or in early adolescence (before age 15) reiterate the recommendation highlighted above regarding the need to provide conditional grants and targeted subsidies to disadvantaged groups, which would encourage parents to opt for schooling over work for their children. At the same time, it is important to vigorously enforce existing laws that prohibit child labour.
Enable opportunities for employment
Although unemployment rates were relatively low (7–10%) among youth, findings that unemployment rates were particularly high among the educated suggest a possible disconnect between youth skills and market needs. Indeed, few youth were aware of employment generation programmes and even fewer had availed of these or vocational skills training. It is notable that while considerable proportions of urban youth reported exposure to computer skills, English language skills and so on, rural youth tended to opt for relatively traditional vocational skills and may not have had the opportunity to learn about market needs or develop appropriate skills for which a demand exists. Formal mechanisms need to be developed that enable youth—and particularly rural youth—to acquire skills for which there is an established market demand, and that link eligible youth to market opportunities.
Build upon youth’s growing access to the internet
Findings suggesting that one quarter of young men and one in ten young women with five or more years of education—and considerably more in urban areas—had accessed the internet highlight the role that this medium can play in building youth awareness of the world around them and the opportunities available to them. The development of youth-friendly web-sites in Telugu may be a useful way to convey such information to youth.
Promote agency and gender equitable norms among youth
Findings highlight the limited agency of young women and the persistence of gender double standards among youth. Young women were particularly disadvantaged in terms of school completion, mobility, opportunities to build peer networks, decision-making authority in matters relating to their own lives and control over resources. And although young women were more likely to express equitable gender role attitudes than young men, they were more likely than young men to express traditional attitudes concerning wife beating. These findings call for attention to promote life skills education programmes for young women, both unmarried and married, that will not only raise their awareness of new ideas and the world around them but also enable them to put information into practice, encourage them to question gender stereotypes, develop self-esteem and strengthen their skills in problem-solving, decision-making, communication and inter-personal relations and negotiation. Safe spaces should be identified in which young women can build social networks and find social support among peers.
Interventions intended to build life skills must also be inclusive of young men. Indeed, findings that inegalitarian gender role attitudes were expressed by many young men, on the one hand, and that considerable numbers of young men were not able to exercise agency in their everyday lives, on the other, call for programmes that build their life skills, promote new concepts of masculinity and femininity and at the same time, promote messages that build egalitarian relations between women and men.
Promoting gender equitable norms and practices requires active engagement with the community. It is essential that programmes for youth work with key community members, such as parents and political and religious leaders in the community, to critically examine prevailing gender norms and forces that perpetuate such norms.
An increasing number of intervention models to build agency and promote egalitarian gender role attitudes among young people have been tested in India. These models could be reviewed and replicated or scaled up as appropriate.
xxxiii
Executive summary
Provide opportunities for formal saving, especially for young women
Findings suggest that that just one-quarter of young men and women had some savings and few youth owned a bank or post office account (just 19% of young men and 17% of young women). Despite the fact that young women were as likely as young men to report savings and to own a savings account, they were considerably less likely to operate the account independently. Programmes are needed that inculcate a savings orientation among young people, that offer savings products that are attractive and appropriate to the small and erratic savings patterns of young people and that enable young women in particular to overcome obstacles related to owning and controlling savings products.
Promote youth participation in civil society and political processes and reinforce secular attitudes
Findings have noted that large proportions of youth have exercised their right to vote, that the majority hold secular attitudes with regard to mixing with a person from another caste and religion, and few engage in community-level violence. Nevertheless, not all youth expressed secular attitudes—two thirds of young men and about two-fifths of young women reported that they would endorse violence against someone who showed disrespect to their religion. Moreover, relatively few had taken part in civil society, that is, government- or NGO-sponsored programmes or community-led activities. Programmes are needed—at the school, college and community levels, through national service programmes, sports and other non-formal mechanisms—that encourage civic participation, incorporate value building components and reinforce secular attitudes and values that espouse responsible citizenship.
Strengthen family life or sex education for those in school and out of school
Youth Study findings provide considerable evidence suggesting that family life or sex education is urgently needed among youth, both for those in school and for those who have discontinued their education. Findings demonstrate a limited understanding of sexual and reproductive matters among young people, including the married. Misconceptions abound on most topics: sex and pregnancy, contraceptive methods including condoms, STIs and HIV/AIDS and the conditions under which abortion is legally available or restricted. Where awareness exists, it is superficial in many cases.
Youth themselves have called for family life or sex education. Findings highlight that large proportions of youth recognised the need for information and education on these issues, and indicated a preference for receiving this education from teachers, health care providers or other experts; many youth also indicated a preference for receiving this education from friends, and large proportions of young women, from parents. However, no more than one in three youth had been exposed to family life or sex education, notwithstanding the School AIDS Education Programme, the Red Ribbon Clubs and special programmes for out-of-school youth. Indeed, substantial proportions of married young women (and some young men) reported entering marriage completely unaware of what marriage entailed. At the same time, several young people had engaged in sexual risk taking.
As mentioned above, a number of state government programmes are ongoing that aim to impart sexual and reproductive health information to young people. What is needed is a strong commitment to ensuring that these programmes do indeed reach young people, both those in school and out-of-school, married and unmarried, and rural and urban. Moreover, there is a need to expand the contents of existing awareness raising programmes to include not just HIV-related information but broader sexual and reproductive topics. These programmes should be designed not only to raise awareness among youth but also to enable young people to correctly understand and assess the risks they face and to adopt appropriate protective actions.
In addition, special attention needs to be paid to the training of trainers. It is important that teachers, health care providers and other experts undergo training that enables them to overcome their reluctance to communicate with youth on sensitive sexual and reproductive matters, dispels their misconceptions on these matters, and enhances their technical knowledge of these issues. Peers and, in the case of young women, parents have also been identified
xxxiv
Youth in India: Situation and Needs 2006–2007 ANDHRA pRADESH
as acceptable sources of information and efforts must therefore be made that identify youth leaders and build networks of peer educators. Also needed are efforts to engage parents—providing them with accurate information and working with them to overcome inhibitions about imparting this information to their children, particularly their daughters.
Ensure that the transition to sexual life is safe and wanted
While for the vast majority of young women sexual activity is initiated within the context of marriage, findings show that small proportions of young men and women had engaged in sex before marriage. As documented in this report, many youth had initiated sexual activities uninformed, reiterating the need for providing family life or sex education to young people. Moreover, the finding that for many youth, pre-marital sexual experiences were unsafe, and for some unwanted, calls for programmes that focus on building sexual and reproductive health awareness among young people, and developing their skills in negotiating safe sex and communicating with their partners on sexual and reproductive health matters. At the same time, programmes must make available appropriate family planning and infection prevention services for both married and unmarried young men and women in a manner acceptable to them.
Intensify efforts to eliminate the practice of early marriage
Findings indicate that although most youth prefer to marry after age 18, the practice of early marriage is widespread among young women. These findings call for measures that go beyond information campaigns to address the underlying factors—social norms and economic constraints—driving early marriage in the state.
There is a need for a multi-pronged approach to eliminate the practice of early marriage. Strategies are needed that mobilise communities to help parents resist pressures that foster the practice of early marriage; that establish new norms and practices; as well as that initiate campaigns highlighting the adverse consequences of early marriage and how it is a violation of the rights of the child. Community mobilisation efforts must involve youth themselves, their families, as well as influential persons in the community, including religious and political leaders.
Equally important is to ensure greater commitment on the part of law enforcement agencies to enforce existing laws on the minimum age at marriage and the registration of marriages, and to levy penalties on violators. Allowing anonymous reporting, making law enforcement agencies and others aware that the practice of early marriage is not a minor violation, and making the guidelines for penalties clear to enforcement agencies and the wider community are possible steps in this direction.
Efforts to delay marriage also require providing girls with viable alternatives to marriage in the form of accessible and quality schooling and opportunities to build and use livelihood skills. Working with the education sector to make schooling for girls more accessible, and to make classrooms gender-sensitive and responsive to the needs of girls and the concerns of their parents is important. At the same time, it is necessary to provide livelihoods training within and outside the educational system.
Findings that most marriages were arranged with the participation of young people themselves are encouraging. However, the finding that few young people had an opportunity to meet their spouse-to-be prior to the wedding day calls for actions to sensitise parents to the need to enable their children to interact with their prospective spouse prior to the wedding. Parents must also be made aware of the physical and mental health consequences of early marriage and the adverse experiences of many young women (and some young men) who were married early or who were unprepared for marriage.
Support newly-weds to postpone the first pregnancy
Findings show that the social pressure to bear children as soon as possible following marriage persists. Contraceptives were rarely used to postpone the first pregnancy and many young women experienced their first pregnancy soon
xxxv
Executive summary
after marriage. It would appear that numerous forces work against delaying the first pregnancy—young people’s lack of awareness of appropriate methods of contraception and access to supplies, their limited skills in countering social expectations and negotiating pregnancy postponement, overwhelming pressure from the family and the community to bear children as soon as possible after marriage, and the lack of attention from health care providers.
Programmes are needed that inform youth about their pregnancy postponement options and enable them to access appropriate contraception. At the same time, providers must be trained and charged with the responsibility of reaching married young women and men—including those who have not yet experienced pregnancy—with information regarding contraception and other reproductive health matters as well as contraceptive supplies. Many married young women lack the freedom of movement to seek health care, underscoring the need for health workers to reach these women—particularly those newly married and first time pregnant—in their homes.
Address power imbalances within marriage
Findings confirm that within marriage, large proportions reported communication and interaction with their spouse; nevertheless communication on sensitive matters such as contraception was limited for many. In addition, married life was marked by violence for many; for example, notable proportions of young women had suffered physical and sexual violence perpetrated by their husband.
Efforts are needed to encourage couple communication on sensitive issues (contraception, for example), negotiation and conflict management skills early in marriage. Efforts are also needed to inform married young women of their rights so that they have the opportunity to exercise control over their own lives; at the same time, efforts must be made to promote new concepts of masculinity and femininity and egalitarian couple relations among young men and women. Intervention models exist in India that have attempted to address these needs; these should be reviewed and up-scaled as appropriate.
Create a supportive family environment
Findings highlight the limited interaction and social distance between parents and young people while growing up and the gendered nature of perceptions regarding parental controls on youth behaviours. Efforts must be made to create a supportive environment for young people. While evidence on models that are effective in bridging the distance between parents and children or that enable parents to adopt more gender-egalitarian socialisation practices is not currently available, findings presented in this report call for programmes that address parental inhibitions about discussing sexual matters with their children, encourage greater openness and interaction between parents and children, and enable the adoption of gender-egalitarian child-rearing practices. Programmes that aim to encourage universal education or eliminate child marriage must, likewise, address parental concerns about the potential consequences of keeping daughters in school or delaying their marriage.
Reorient service provision to address the unique needs of unmarried and married young women and men
Although the RCH Programme has advocated special services for youth, including the unmarried, these services had not reached the youth in our survey. For example, relatively small percentages of young people have ever practised contraception and the method most likely to be adopted was sterilisation. Few had sought care for symptoms of STI or gynaecological problems, and most youth who had sought care for the latter preferred private to public sector facilities. Lack of care seeking and the disconnect between the public health sector and youth underscores the need to sensitise health care providers about the special needs, heterogeneity and vulnerability of unmarried and married young women and men, and to orient them to the need for developing appropriate strategies to reach these diverse groups, including young newlyweds. It raises, at the same time, the need to explore the feasibility of implementing various financing strategies, for example, health insurance, competitive voucher schemes and community financing schemes, which will allow youth to have a wider choice of providers and enhance the possibility of obtaining quality care.
xxxvi
Youth in India: Situation and Needs 2006–2007 ANDHRA pRADESH
Programmes must be inclusive of unmarried as well as married young people and recognise their need and right to sexual and reproductive health and related information and services. Counselling and contraceptive services must be made available to all young people, including the unmarried, in a non-threatening, non-judgmental and confidential environment. Indeed, these findings call for the implementation of strategies outlined under the National Rural Health Mission’s RCH Programme.
Findings that one in ten young men and women reported symptoms suggestive of mental health disorders suggest that there is a need to establish systems that address young people’s mental health. Efforts are needed to screen young people—particularly the married among whom symptoms were more likely to be reported—for mental health disorders when they avail of other primary health services, including, for example, sexual and reproductive health services, and to refer youth with such symptoms to appropriate health facilities and providers.
Directions for future research
Findings presented in this report provide a broad picture of youth in Andhra Pradesh. At the same time, findings have raised a number of issues that require further investigation, particularly with regard to the determinants and consequences of youth behaviours and practices during the transition to adulthood. While the Youth Study is indeed a rich source of data that will enable investigators to fill many of the information gaps identified, there are several gaps in knowledge that will require additional research.
Youth Study findings highlight the need for further study in terms of formative research that explores in greater depth the factors impeding successful transitions to adulthood, in the areas, for example, of school completion, economic activity, sexual relations, and marriage and parenthood. Research is also needed that explores the role of peers, socialisation practices, young people’s access to information and services, and the ways in which these factors may contribute to or impede young people’s ability to make successful transitions to adulthood. A general research recommendation is the urgent need for prospective or panel study designs that follow a cohort of adolescents at regular intervals up to age 24. Prospective study designs would enable researchers to take a life course approach, identify, with compelling data, the factors responsible for healthy transitions to adulthood and point to the ways in which the situation and experiences of youth influence their life course at later ages.
Operations research is also needed. While a number of interventions to address the needs of youth have been initiated in India—for example, addressing the needs of married girls, changing the norms of masculinity and femininity, encouraging education for girls, developing market-oriented vocational skills and providing family life or sex education—few have been rigorously evaluated. Urgently needed, therefore, are carefully designed and rigorously tested intervention models that not only pay attention to the content and delivery of the intervention but also measure its effectiveness and acceptability—in short, that will enable a shift from the implementation of promising to best practices in addressing young people’s needs. Ultimately, research is needed that evaluates the reach, effectiveness and feasibility of existing programmes, and that monitors the scaling up of successful interventions in terms of their impact on young people’s lives.
In brief, the Youth Study has documented, for the first time, the multi-faceted situation of youth in Andhra Pradesh. The study highlights several positive aspects of young people’s lives but also alerts us to the many challenges confronting youth and their ability to make a successful transition to adulthood. It emphasises the heterogeneity of youth, not only in terms of their situation but also with regard to their stated needs and preferred mechanisms to address these needs. Programmes must recognise the heterogeneity of young people, and interventions and delivery mechanisms should be appropriately tailored to meet their needs. Evidence presented here provides not only a blue-print for the programming needs of youth in Andhra Pradesh but also a base-line by which to measure the impact of programmes intended to address youth needs.
1
Introduction
Chapter 1
Introduction
1.1 Rationale
The Youth in India: Situation and Needs Study (referred to as the Youth Study) is the first-ever sub-nationally representative study conducted to identify key transitions experienced by married and unmarried youth in India. There is a strong rationale for this study. Young people (aged 10–24) constitute almost 315 million and represent 31% of the Indian population (Office of the Registrar General and Census Commissioner, 2001a). Numbers are projected to increase and peak at around 358 million in 2011 before stabilising at around 336 million by 2026 (Office of the Registrar General and Census Commissioner, 2006). Not only does this cohort represent India’s future in the socio-economic and political realms, but its experiences will largely determine India’s achievement of its goal of population stabilisation articulated in the National Population Policy 2000 (MOHFW, 2000) and the extent to which the nation will be able to harness its demographic dividend. In addition, it is clear that the realisation of the Millennium Development Goals (UNDP, 2000) depends, to a considerable extent, upon the situation of young people. While today’s youth are healthier, more urbanised and better educated than earlier generations, social vulnerabilities persist and transitions to adulthood are too frequently marked by early entry into the labour force, abrupt and premature exit from school, early marriage and strongly held gender norms. In the course of the transition to adulthood, moreover, young people face significant risks related to sexual and reproductive health, and many lack the knowledge and power to make informed sexual and reproductive choices (Jejeebhoy and Sebastian, 2003).
In recognition of the importance of investing in young people, several national policies formulated since 2000 have underscored a commitment to addressing the multiple needs of this group in India. The National Population Policy 2000 recognised, for the first time, that adolescents constitute an under-served group with special sexual and reproductive health needs, and advocates special programmatic attention to addressing this population (MOHFW, 2000). The National Youth Policy 2003 focuses on the needs of those aged 13–35, but recognises adolescents (aged 13–19) as a special group requiring a different approach from that appropriate for young adults (aged 20–35), and promotes strategies to meet youth needs in areas including education, training and employment, health, recreation and sports, and good citizenship (Ministry of Youth Affairs and Sports, 2003). Also notable is the commitment to addressing the needs of adolescents and young people articulated in the Tenth and Eleventh Five-Year Plans (Planning Commission, 2002; 2006). In addition, the National Adolescent Reproductive and Sexual Health Strategy provides the framework for the adolescent sexual and reproductive health services proposed in the Reproductive and Child Health (RCH) Programme II (MOHFW, 2006). The National Rural Health Mission (2005–12) has incorporated adolescent health services as part of its service guarantees in health sub-centres, primary health centres and schools (MOHFW, 2005).
Effective implementation of both policies and programmes, however, has been handicapped by a lack of evidence on young people’s situation and needs. Currently available evidence is limited, at best, and comes largely from small scale and unrepresentative studies. The most recent National Family Health Survey (NFHS-3) obtained, for the first time, valuable data on unmarried young women and men (IIPS and Macro International, 2007a). Even so, the information that it provides on young people’s various transitions remains limited and the small sample sizes obtained in most states preclude the possibility of in-depth analysis and of obtaining state-representative estimates of behaviours and practices among different sub-groups of young people.
2
Youth in India: Situation and Needs 2006–2007 ANDHRA pRADESH
1.2 Study objectives
The objectives of the Youth Study were to identify key transitions experienced by youth, including those pertaining to education, work force participation, sexual activity, marriage, health and civic participation; provide state level evidence on the magnitude and patterns of young people’s sexual and reproductive practices in and outside of marriage as well as related knowledge, decision-making and attitudes; and, finally, identify key factors underlying young people’s sexual and reproductive health knowledge, attitudes and life choices. Findings from the study are expected to guide policy, programmes and advocacy on youth issues, enable programmes and policies to recognise the heterogeneity of youth in India, and provide important base-line indicators against which the long-term impact of programmes may be measured.
The Youth Study focused on married and unmarried young women and unmarried young men aged 15–24 and, because of the paucity of married young men in the younger ages, married men aged 15–29 in both rural and urban settings. The study was conducted in a phased manner in six states of India: Andhra Pradesh, Bihar, Jharkhand, Maharashtra, Rajasthan and Tamil Nadu. This report focuses on findings from Andhra Pradesh.
Funding for the Youth Study was provided by the David and Lucile Packard Foundation and the John D. and Catherine T. MacArthur Foundation. The Youth Study was conducted jointly by the International Institute for Population Sciences, Mumbai (IIPS) and the Population Council, New Delhi. The design and implementation of this study were guided by the Project Advisory Committee, headed by the Additional Secretary, Ministry of Health and Family Welfare (MOHFW).
1.3 Andhra Pradesh: Overview of demographic and socio-economic features
The state of Andhra Pradesh, situated in the southern part of India, is India’s fourth largest state in terms of area, covering a total of 275,069 square kilometers. The state has 23 districts divided into three regions, namely, coastal Andhra, Rayalseema, and Telangana. With a population of 76.2 million in 2001, Andhra Pradesh ranks fifth in terms of total population among states in India (Office of the Registrar General and Census Commissioner, 2001b). The state’s population more than doubled between 1961 and 2001 and is projected to have reached 84 million by 2009 (Office of the Registrar General and Census Commissioner, 2006). With 978 females per 1,000 males in 2001, the state registered the fourth highest sex ratio among states in India. Population density in the state was 277 persons per square kilometer in 2001. The distribution of the population by religion indicates that 89% of the state’s population was Hindu, 9% was Muslim and 2% Christians (Office of the Registrar General and Census Commissioner, 2001c). About one-sixth (16%) of the state’s population belonged to scheduled castes and 7% belonged to scheduled tribes (Office of the Registrar General and Census Commissioner, 2001b).
The state is characterized by a large rural population; just 27% of the state’s population lives in urban areas and the state ranked eleventh in terms of percentage of the population residing in urban areas (Office of the Registrar General and Census Commissioner, 2001b). It has witnessed considerable out-migration. According to the 2001 Census, during the decade 1991–2001, over half a million persons migrated to states outside of Andhra Pradesh (Office of the Registrar General and Census Commissioner, 2001d).
Andhra Pradesh is among the more economically progressive states in the country; in 2006–2007 it accounted for about 7% to the national Gross Domestic Product (GDP) (Ministry of Statistics and Programme Implementation, 2008). Its per capita income in 2005–06 stood at Rs.26,211, somewhat higher than the national average of Rs.25,716 (Ministry of Finance, 2008). Andhra Pradesh’s Gross State Domestic Product (GSDP) at current prices stood at Rs.269,173 crores in 2006–07 (Ministry of Statistics and Programme Implementation, 2008); at constant prices (1993–94), the GSDP increased by 8.7% between 2004–05 and 2005–06. Although agriculture was traditionally the main source of income, the primary sector contributed just 26.6% to the state’s economy in 2006–07, compared to 21.6% by the secondary sector and as much as 51.8% by the tertiary sector (Planning Department,
3
Introduction
Government of Andhra Pradesh, 2007). Indeed, the large contribution by the tertiary sector reflects the considerable role played by the fields of information technology and biotechnology in the economic development of the state.
About one-sixth of the state’s population (15.8%, based on the Uniform Recall Period consumption distribution) was estimated to live below the poverty line (2004–05), compared to 28% at national level. Rural-urban differences in the state were wide, with 28% and 11% of the urban and rural populations, respectively, living below the poverty line (Planning Commission, 2007).
Unemployment rates are low in Andhra Pradesh. In 2004–05, 1.6% and 3.9% of rural and urban males, respectively, were unemployed for a major part of the year, as measured by the usual principal status definition. The corresponding figures for females were 1.1% and 4.3%, respectively (NSSO, 2006).
Andhra Pradesh lags behind much of India in terms of literacy. Indeed, it ranks twenty-third among Indian states in terms of literacy, with a literacy rate of 61% in 2001. Male and female literacy rates in the state, at 50% for females and 70% among males, were considerably lower than the national average of 54% and 75%, respectively (Office of the Registrar General and Census Commissioner, 2001b).
Despite these average education indicators, the state’s achievements in the health sector are notable. Life expectancy for females in Andhra Pradesh was higher than the national average during 2002–06 (66 versus 64 years), life expectancy for males was identical to the national average (63 years) (Office of the Registrar General, 2008a). Likewise, the infant mortality rate was lower than the national average (54 versus 57) in 2005–06. Similarly, fertility levels in Andhra Pradesh are much lower than the national average. Indeed, the fertility rate in the state had reached replacement levels by 2004 (Office of the Registrar General and Census Commissioner, 2006) and the total fertility rate stood at 1.8 in 2005–06, compared to 2.7 for India as a whole. The contraceptive prevalence rate was, correspondingly, much higher than the national average (68% versus 56% and just 5% of women in Andhra Pradesh, compared to 13% in India as a whole, reported an unmet need for contraception (IIPS and Macro International, 2007a).
As is well known, however, Andhra Pradesh is one of six states of India in which HIV prevalence is highest. During 2005–06, the HIV prevalence rate in the state was reported to be 0.97%, that is, 1.22% among men and 0.75% among women, far higher than national rates of 0.22% and 0.35%, respectively (IIPS and Macro International, 2007a).
1.4 Situation of youth in Andhra Pradesh
Young people in Andhra Pradesh aged 10–24 constituted a total of 23 million, and accounted for 31% of the state’s population in 2001. The youth population, that is, those aged 15–24 numbered 14.5 million and accounted for about 19% of the state’s population (Office of the Registrar General and Census Commissioner, 2001a). The share of the youth population as a proportion of the total population of Andhra Pradesh is projected to increase to 20% during 2006–11, before beginning to decline (Office of the Registrar General and Census Commissioner, 2006).
Educational attainment levels among youth in Andhra Pradesh are similar to those in India as a whole, and gender differences in enrolment are relatively narrow. Among young people (aged 10–24), 85% of men and 71% of women were literate in 2001 (Office of the Registrar General and Census Commissioner, 2001e). While the state has achieved near universal primary school enrolment (as evident from a gross enrolment ratio of 97% among children aged 6–11 years), enrolment at secondary school level remains limited. The gross enrolment ratios for 11–14 year-olds and 14–16 year-olds were 72% and 53%, respectively. The Gender Parity Index (GPI) at the elementary, secondary and higher secondary levels of education indicates that while learning opportunities are nearly equally available to boys and girls at the elementary level, such opportunities are limited for girls at the secondary and higher secondary level in the state; GPI scores were 0.99 at the elementary level and 0.82 at the secondary and higher secondary level in 2004–05 (Ministry of Human Resource Development, 2007).
4
Youth in India: Situation and Needs 2006–2007 ANDHRA pRADESH
As elsewhere in the country, unemployment rates in Andhra Pradesh were much higher among young people than among the general population discussed above. During 2004–05, unemployment rates among the population aged 15–29, as measured in terms of principal usual status, were 3.4% and 8.6% among young men in rural and urban settings, respectively; the corresponding rates for young women were 1.9% and 10.5% (NSSO, 2006).
Available evidence on the sexual and reproductive health profile of young people in Andhra Pradesh indicates their vulnerability. Marriage continues to take place before the legal minimum age for both young women and men; as recently as 2005–06, 55% of women aged 20–24 were married by age 18 and 35% of men aged 25–29 were married by age 21. Moreover, 18% of 15–19 year-old girls had begun childbearing (IIPS and Macro International, 2008).
While it is clear that sexual relations are initiated early and within the context of marriage for large proportions of young men and women in Andhra Pradesh, behavioural surveillance surveys and small-scale studies report that sexual risk taking before or within marriage is not unheard of among young people in the state. For example, the recent National Behavioural Surveillance Survey reports that some 22% and 3% of young men and women, respectively, aged 15–24 had engaged in sexual intercourse with a non-regular partner in the 12 months preceding the survey, and of these, just half (49%) had used condoms consistently with these partners (National Institute of Medical Statistics and NACO, 2008). Likewise, a recent study exploring the pre-marital sexual experiences of married youth in Guntur district reports that 32% of young men aged 15–29 and 5% of young women aged 15–24 had experienced pre-marital sex. Moreover, among those married youth who had experienced pre-marital sex, few reported consistent condom use (7% and 2% of young men and women, respectively) and multiple partner relations were reported by 37% of young men and 2% of young women (Santhya, Jejeebhoy and Ghosh, 2008).
Despite the early onset of sexual relations within or before marriage among significant proportions of youth in Andhra Pradesh, available evidence suggests that young people’s knowledge of sexual and reproductive health matters tends to be limited. Data from NFHS-3 indicate that only 37% of young men and even fewer (20%) of young women had comprehensive knowledge about HIV/AIDS. While 87% of young men were aware of a source for condoms, just 27% of young women reported such awareness (IIPS and Macro International, 2007a). Care seeking for symptoms of genital tract infection was, moreover, far from universal. A study of married youth in Guntur district observed that among those reporting symptoms of infection, just 52% of young women and 64% of young men sought care promptly, and just 19% and 25%, respectively, sought care as soon as symptoms were observed (Santhya, Jejeebhoy and Ghosh, 2008).
1.5 Youth-related policy and programme environment in Andhra Pradesh
The Andhra Pradesh state government has articulated its commitment to promote and protect the rights of adolescents and youth in a number of policies, including its Population Policy 1997 and its Vision 2020 document. The Population Policy articulates a number of goals to improve the situation of adolescents, particularly girls. In the area of health, it aims to promote family planning among newly-married couples by providing counselling on birth spacing, and raising awareness about such issues as delaying first birth, increasing birth spacing and increasing male responsibility in reproductive behaviour. One of the stated objectives of the Policy is to increase age at marriage of females; the Policy contains a number of recommendations to achieve this objective, including IEC efforts to highlight the adverse effects of early marriage and pregnancy, introduction of the girl child scheme to delay marriage at young ages, involvement of political and community leadership, involvement of women’s groups and NGOs in promoting attitudinal changes among young men, parents and communities, and the promotion of education for the girl child through awards and incentives for panchayats/nagarpalikas districts that achieve full enrolment and retention of girl children in schools (Government of Andhra Pradesh, 1997; Santhya and Jejeebhoy, 2007).
The Vision 2020 document of Andhra Pradesh also reaffirms this commitment. In line with the Population Policy, the Vision 2020 also aims to promote family planning among newly-married couples by providing counselling on birth spacing, encouraging male involvement in contraception, and improving maternal health by encouraging adolescents to delay pregnancy until age 21. It seeks to address such health problems of adolescent girls as chronic
5
Introduction
anaemia through the establishment of nutrition programmes for adolescent girls at anganwadi centres. As in the population policy, the document also discusses the need to ensure the enrolment and retention of girls in school, and proposes to expand the number of anganwadi centres to provide crèche services so as to enable older girls to attend schools; provide “Back to School” bridge courses to help girl drop-outs return to school; and equip girls with vocational skills to make them self-reliant. The Vision 2020 document also underscores the need to involve communities in building awareness about the adverse effects of early marriage (Government of Andhra Pradesh, 1999; Santhya and Jejeebhoy, 2007).
A number of programmes have been implemented by the Andhra Pradesh state government to meet the needs of youth. For example, state government initiatives have focused on the expansion of schooling facilities so as to improve physical access to adolescents, especially girls. Over the period 1993 to 2002, the state recorded a 24% increase in the number of primary schools, a 137% increase in the number of upper primary schools and a 78% increase in secondary schools. The state has also paid attention to back-to-school initiatives, including bridge courses (Balika Shikshan Shivir, residential condensed courses), that enable the out of school to return to school and older girls to complete key classes (Centre for Good Governance, n.d.). Under the National Programme for the Education of Girls at Elementary Level, intended to ensure the retention of girls at least up to the completion of elementary school, 3,373 model cluster schools were set up in the state; girls attending these schools were provided vocational skills training as well and teachers were sensitized about the constraints that girls face in attending school. (Planning Department, Government of Andhra Pradesh, 2007).
The Government of Andhra Pradesh has also initiated public-private partnership models to build skills among rural and under-privileged youth under its employment generation programme. In this model, private sector agencies provide training in IT & ITeS to educated, unemployed youth. The government has recently launched the Rajiv Yuva Shakthi (RYS) Programme, intended to promote self-employment among both educated and uneducated youth in the state. Under this programme, unemployed youth are provided financial assistance to set up small-scale industries as well as service and business sector enterprises. So far 76,038 young people have been supported in establishing self-employment units (Planning Department, Government of Andhra Pradesh, 2007).
Programmes have also been introduced to impart information on sexual and reproductive health to young people. For example, the School AIDS Education Programme has been implemented for students of Class IX and Class X since 2002 (Government of Andhra Pradesh, 2004). As of 2005, the programme has been implemented in over 21,000 secondary schools, that is, nearly 80% of the schools in the state (MHRD, NACO and UNICEF, 2005). In order to raise awareness among adolescents, the state Education Department has also incorporated a chapter on HIV/AIDS in its biology textbook for students of Class IX and Class X. Similarly, with the support of the Andhra Pradesh State AIDS Control Society (APSACS), the Colleges Talk AIDS Programme has been implemented in 5,000 colleges in the state, covering about 1.2 million students (APSACS, 2005). In addition, the APSACS has formed Red Ribbon Clubs (RRC) in over 15,000 high schools and junior colleges, covering 1.7 million students in classes 9–12. The members of the RRCs are trained to act as change agents to provide correct information to other young people about HIV/AIDS and life skills, notably with regard to coping with peer pressure, promoting healthy life styles and adopting responsible behaviours. It is reported that over 80% of RRCs formed in the country are located in the state (Planning Department, Government of Andhra Pradesh, 2007). Village AIDS awareness clubs have also been initiated in some districts, starting with youth in junior colleges. And under Chaitanya Kishoram, a scheme implemented by the state Women Development and Child Welfare Department, girls from each district are trained and subsequently impart information on sexual and reproductive health matters to their peers (Government of Andhra Pradesh, 2006).
Programmes that target adolescent girls specifically have also been implemented in the state. For example, the Kishori Shakthi Yojana scheme has been implemented in 376 ICDS blocks in the state. Under this scheme, Balika Mandals, each comprising 25–30 adolescent girls aged 11–18 years, were formed in project villages and activities are carried out to raise these girls’ awareness regarding such issues as child marriage, child trafficking, health and hygiene, nutrition, legal rights, home management, child care and so on. So far, 11,340 Balika Mandals
6
Youth in India: Situation and Needs 2006–2007 ANDHRA pRADESH
have been formed, and cover 340,000 adolescent girls in the state (Department of Women Development and Child Welfare, Government of Andhra Pradesh, n.d.). In addition to centrally-sponsored incentive schemes such as the Balika Samridhi Yojana, the state government has launched a number of financial incentive schemes intended to promote girls’ education, delay their marriage and prevent discrimination against girls. For example, in order to promote schooling among girls and increase their age at marriage, a pilot scheme, Chaduvula Talli, provides financial incentives to girls belonging to scheduled castes and tribes attending classes 8–10 in all government and government-aided schools in 10 backward districts of the state (Planning Department, Government of Andhra Pradesh, 2007). Another incentive scheme launched in 2005, the Girl Child Protection Scheme, targets economically poor families who have a maximum of two daughters, the youngest of whom is aged 3 years or younger and in which one parent has undergone sterilization (Planning Department, Government of Andhra Pradesh, 2007).
1.6 Study phases
The Youth Study comprised three phases and included both a survey and qualitative data gathering exercises.
1.6.1 Pre-survey qualitative phase
As the Youth Study was one of the first of its kind in India, precedents did not exist for youth terminologies, particularly with reference to sensitive issues (romantic relationships, sexual experience and so on), youth perceptions or youth willingness to share their experiences with study teams. In order to better understand these matters and to inform the design of the survey instrument, focus group discussions were conducted with married and unmarried young men and women, and key informant interviews conducted with teachers, health care providers, and community and youth leaders, in the first phase of the Youth Study. This phase also offered us an opportunity to explore community reactions to the kinds of issues to be raised by the survey.
In the course of this pre-survey qualitative phase, we also conducted in-depth interviews with parents of youth to collect parental perspectives on young people’s situation and needs. In each site, eight categories of parents were selected (mothers and fathers of married and unmarried young men and women, respectively). The discussion focused on the life experiences of the child of interest.
The pre-survey qualitative phase was undertaken during May-July 2005 and covered at least one urban area and one rural area of all five regions of the state. In total, 18 focus group discussions were held with young people; 36 key informant interviews were held with community leaders, health care providers, teachers and youth leaders; and 70 in-depth interviews were held with mothers and fathers.
1.6.2 Survey phase
Fieldwork was undertaken between October 2007 and April 2008. A total of 8,330 married and unmarried young men and women were interviewed during this phase.
1.6.3 Post-survey qualitative phase
In order to better understand the sexual and reproductive experiences of youth and the factors inhibiting and facilitating safe transitions into these behaviours, in-depth interviews were conducted with consenting survey respondents who reported certain experiences in the course of the survey interview. These experiences included, notably, having an opposite-sex romantic partner; having sexual relations with an opposite-sex romantic partner; experiencing same-sex, forced or exchange sexual relations; and among young men, engaging in relations with sex workers or married women. Among the married, in addition, experiences included exercising choice in spouse selection and practising contraception to delay the first pregnancy.
7
Introduction
1 Separate reports, drawn from in-depth interviews with parents and youth, respectively, will discuss parental perspectives on young people’s experience of growing up and provide insights on the sexual and reproductive experiences of youth, as well as factors inhibiting and facilitating safe transitions into these behaviours.
At the conclusion of the survey interview, interviewers sought the consent of respondents for an in-depth interview. Those who consented were then approached by a trained investigator who conducted the interview in the form of an unstructured conversation. In-depth interviews therefore took place at around the same time as did the survey. A total of 62 in-depth interviews were completed, 39 from among rural respondents and 23 from among urban respondents. Findings from the survey are presented in this report1.
1.7 Study instruments
1.7.1 Interview guidelines
For the pre-survey qualitative phase, three sets of guidelines were prepared for focus group discussions, key informant interviews and in-depth interviews, respectively. These guidelines were appropriately modified for each youth group (married and unmarried young men and women) and parent group (mothers and fathers of married and unmarried young men and women). As mentioned above, specific guidelines were not prepared for the post-survey in-depth interviews with youth reporting selected behaviours; instead, interviewers were trained to steer the interview to focus on the experience of interest, and obtain information on the circumstances surrounding the experience and the respondent’s own perceptions about the experience.
1.7.2 Questionnaires
A total of six questionnaires were developed for the study: a community questionnaire; a household questionnaire, administered in each selected household; and four individual questionnaires, one each for married young men, married young women, unmarried young men and unmarried young women. The community questionnaire was administered in each village selected for the survey. This questionnaire collected information on different aspects of village life, including the village population, numbers engaged in agriculture, and the availability of various facilities and infrastructure in and around the village. Team supervisors administered the questionnaire to one or more individuals from each village who were well-informed about the village.
The household questionnaire listed all the usual residents of the selected households and collected basic information on each listed household member, including his or her age, sex, marital status, relationship to the head of the household, education and current activity status. Information was also obtained on the religion and caste of the head of the household as well as on ownership of the residential structure and agricultural land, number of rooms in the residence, and such amenities available as type of toilet facility, main source of lighting, main type of cooking fuel and main source of drinking water. The survey also inquired about ownership of 17 consumer durables. Finally, information was sought on the marriage of any usual resident of the household in the three years preceding the interview as well as the sex and age of the person at the time of marriage.
The development of individual questionnaires was informed by other survey instruments, notably the World Health Organisation core questionnaire for youth surveys (Cleland, 2001) and a recent survey conducted in Pune district on the formation of partnerships among youth (Alexander et al., 2003). Other instruments consulted included surveys of youth conducted in India (Andrew, Patel and Ramakrishna, 2003; IIPS and Population Council, 2002; Sebastian et al. 2003), Pakistan (Sathar et al., 2003), the Philippines (DRDF and UPPI, 2002), Vietnam (Mensch, Anh and Clark, 2000) and sub-Saharan Africa (Guttmacher Institute, 2004a; 2004b; 2004c). Finally, our survey instrument drew upon the questionnaire used in the NFHS-3 (IIPS and Macro International, 2007b).
8
Youth in India: Situation and Needs 2006–2007 ANDHRA pRADESH
The development of individual questionnaires was also informed by insights obtained in the pre-survey qualitative phase. Once the pre-survey qualitative phase was completed in all six states, the data generated were analysed to identify the kinds of issues that would be explored in the survey, ways of presenting sensitive issues, and terminologies to be used that would be comprehensible and acceptable to youth. The survey instruments were finalised after extensive pre-testing in several states.
Individual questionnaires were employed to interview eligible youth who usually resided in selected households. Currently married young men and women aged 15–29 and 15–24, respectively, as well as unmarried young men and women aged 15–24, were eligible for interview. Widowed and divorced individuals were excluded from the survey. Keeping in mind the sensitive nature of the questions, the questionnaire was divided into several sections and arranged in such a way that the most sensitive questions were administered towards the middle of the interview. This strategy of asking a series of non-sensitive questions in the early part of the interview served two purposes: it enabled the interviewer and respondent to build rapport before sensitive questions were posed; it also permitted the investigator to maintain privacy for sensitive questions, as interested bystanders would usually depart while questions in the early sections were posed. The individual questionnaires collected information on the following topics:
Background characteristics: Questions were asked regarding age, education and schooling, quality of school or college attended, work patterns including housework and paid employment, vocational training, short-term migration and characteristics of parents.
Additionally, a Life Event Calendar (LEC), adapted from that used in a nationally representative survey of adolescents and youth in Pakistan (Sathar et al., 2003), was administered to obtain information on education, work, living arrangements, marriage and family building (for married respondents), starting from the age of 12 years. This system of recording life events is considered one of the most effective approaches to minimise recall error.
Media exposure: Respondents were asked whether they were exposed to newspapers, television or the internet, and whether they watched pornographic films or read pornographic magazines. They were also asked about their views on the influence of films and television on their own life as well as young people’s lives in general.
Puberty: In order to assess the age at which puberty was experienced, respondents were asked to report their age at key signs of maturation. Young women were questioned about their first menstruation while young men were asked about the onset of voice changes and growth of pubic hair.
Parental interaction/relationship: Detailed questions were asked on the extent of parent-child communication on everyday activities as well as sexual and reproductive issues. Questions were also asked that assessed the extent to which a respondent had witnessed parental violence or been the victim of violence perpetrated by a parent while growing up.
Communication, mobility and decision-making: This section collected information on the person in whom youth were most likely to confide on matters related to getting a job, growing up, boy-girl relationships and personal problems. Detailed questions were also asked on decision-making and, for all groups except married males, mobility.
Gender and self-efficacy: In order to evaluate the respondent’s gender role attitudes and level of self-efficacy, questions were asked to probe opinions about a range of gender-related issues, such as, the importance of boys’ vis-à-vis girls’ education, housework and freedom of movement.
Awareness of sexual and reproductive matters: This section probed young people’s awareness about sexual intercourse, pregnancy, contraceptive methods, HIV/AIDS and sexually transmitted infection (STI) as well as the legal minimum age at marriage and conditions under which abortion is legally permitted. This section also probed young people’s sources of information on sexual matters and contraception, the extent to which they had obtained formal sex or family life education, and their experiences and perceptions about this education.
9
Introduction
Connectedness and friendship: Questions relating to connectedness and friendship explored respondents’ friendship networks among those of the same sex and activities in which they participated with their friends. This was followed in a gradual fashion by questions on interaction with the opposite sex, whether or not the respondent had exchanged a “proposal” of romantic partnership with someone of the opposite sex and whether the respondent had ever met someone of the opposite sex secretly in a number of likely places.
Pre-marital romantic heterosexual relationships: This was a highly sensitive section, conducted only if complete privacy was assured. The section started by probing the pre-marital romantic and sexual experiences of up to five of the respondent’s best friends. This technique, known as anonymous third-party reporting (developed by Rossier, 2003), was used to assess the extent to which youth were more likely to report the romantic and sexual relationships of their peers than of themselves. Respondents were then asked about their own experiences of pre-marital romantic partnership and, if reported, detailed questions were asked on the nature of such relationships with the first partner and the last or most recent partner (if more than one partner was reported). Questions were designed to gradually probe sensitive behaviours, for example, starting with whether the respondent had ever held hands with a romantic opposite-sex partner, and continuing with questions on hugging, kissing and finally having sex with the partner. We believe this gradual progression of questions was more culturally appropriate than a single question on pre-marital sex and provided insights into the range of behaviours youth experienced. If sex with a pre-marital romantic partner was reported, a host of questions followed that probed the consensuality of first sex with this partner, condom use, frequency of such relations and experience of pre-marital pregnancy. Questions were also asked about the characteristics of the romantic partner and parental awareness of and reactions to the romantic relationship.
Marriage process: In this section questions covered marriage planning, dowry, the participation of the respondent in decision-making related to marriage and the respondent’s feelings about his or her own marriage. This section was administered, suitably modified, to both married and unmarried respondents.
Married life: Married respondents were asked detailed questions on married life. These included the nature of marriage (love or arranged), acquaintance with spouse before marriage and age at cohabitation. Questions about the marital relationship were also covered, including spousal communication and joint decision-making, the nature of the first sexual experience with spouse, experience of forced sex within marriage, inter-spousal violence, pregnancy experiences and outcomes, and contraceptive practice.
Same-sex, paid and forced sexual experiences: This was a second highly sensitive section in which respondents were asked a series of questions on their personal experience of several types of sexual encounters, for example, paid or exchange sex, forced sex perpetrated on the respondent and casual sex. In the case of male respondents, additional questions were asked about sex with a same-sex partner, relations with sex workers and married women (other than their wife for married males) and whether they had ever perpetrated forced sex. All married respondents were also asked about the experience of extra-marital sexual relations. Respondents who reported any of these experiences were probed about their age at their first experience of such a sexual encounter and the extent to which they had used condoms in these encounters.
Attitudes: This section probed respondents’ views on pre-marital physical intimacy and wife beating.
Health and health seeking: This section collected information on respondents’ experience of common health problems, specifically high fever and injury, as well as symptoms of genital infections in the three months preceding the interview. In addition, respondents were asked whether they had sought treatment for these health issues and, if so, from what source. Respondents’ mental health in the last one month was assessed using the 12-item General Health Questionnaire, developed for use in field conditions (Goldberg, 1992).
Substance use and violence: A series of questions were asked about consumption of tobacco products, alcohol or drugs. In each case, questions were asked about use and frequency of use of such substances by family members
10
Youth in India: Situation and Needs 2006–2007 ANDHRA pRADESH
and by the respondents themselves. Additional questions sought respondents’ assessments of the frequency with which young people in their neighbourhoods engaged in violence (fights or beatings) and their own participation in such violence.
Programmes and participation: The final section of the questionnaire collected information on programmes available to young people in the village or neighbourhood in which they resided, and the extent to which youth participated in such programmes. In addition, rural respondents were asked about the role of panchayats in decisions affecting young people’s lives. All respondents were asked about their participation in community activities, opinions about political processes, secular attitudes and participation in recent elections. Finally, respondents were asked to identify the most important problem facing youth in their village or neighbourhood.
Sealed envelope response: However carefully designed and culturally sensitive the survey questions may have been, the possibility that young people would deliberately withhold information about their sexual experiences in a face-to-face interview could not be discounted. Drawing from other research in the field, an anonymous reporting method was included in our survey to obtain responses to a single question: Have you ever had sex with anyone [for the unmarried]/Did you ever have sex with anyone before marriage [for the married]? Interviewers first explained the technique to respondents, noting in particular its confidential nature. The interviewer then gave each respondent a blank card and asked him or her to simply mark a “3” or an “X” on the card to indicate that he/she had or had not experienced pre-marital sex. Once marked, the respondent placed the card inside an envelope provided by the interviewer; the envelope was sealed by the respondent and returned to the interviewer. Unique identification numbers linked the individual’s questionnaire with his or her responses in the sealed envelope. Envelopes were opened only at the central office at the time of data entry.
Draft tools were extensively reviewed at meetings of the study’s Technical Advisory Committee and were then translated into four languages (Hindi, Marathi, Tamil and Telugu), extensively pre-tested and finalised after appropriate modification. Copies of all these instruments are provided in the CD enclosed with this report.
1.8 Study design and sample size estimation for individual interviews
The Youth Survey was designed to provide estimates for the state as a whole, as well as for urban and rural areas for each of the four categories of respondents, namely married and unmarried young men and women, separately. The study was not designed to provide estimates at district or sub-district levels.
While arriving at sample size estimates, on the basis of the scarce available evidence, the following assumptions were made:
l 10% of unmarried young women would report the experience of pre-marital sexual relations;l Among married men, 20% would report unsafe sexual relations (multiple partner sex or non-use of
condoms, unintended pregnancy or experience of STI symptoms);l The coefficient of variation was set at 10% (equivalent to fixing the absolute error at 20% of the true
value and 95% confidence interval);l The non-response rate for the individual interviews was assumed to be 25–30%;l Design effect was assumed to be in the range of 1.5 to 2.
The chances of finding an unmarried young man were greater than the chances of finding a married young man in a given household, and conversely, the chances of finding a married young woman were greater than the chances of finding an unmarried young woman. As a result, in the case of the male sample, our strategy was to estimate the number of households required to obtain the target number of married young men aged 15–29, that is, the harder to reach group of males. Similarly, in the case of the female sample, the strategy was to identify the total number of households required based on the target number of unmarried young women aged 15–24, again, the harder to reach group of females.
11
Introduction
Following from the assumptions described above, and in consultation with the study’s Technical Advisory Committee, the required sample of each sub-group of youth was determined at 1,000 married young men, 1,250 unmarried young men, 1,250 married young women and 1,750 unmarried young women each for urban and rural areas, that is, a total sample size of 5,250 in each area2. However, our earlier experience suggested that because of the considerable mobility of youth, there was likely to be a shortfall in achieving these numbers. Hence, in Andhra Pradesh, Bihar and Rajasthan, the sample size in both rural and urban areas was revised to 1,200 married young men, 1,800 unmarried young men, 1,500 married young women and 2,100 unmarried young women, that is, a total sample size of 6,600 in each area. Moreover in Andhra Pradesh, because the ratio of unmarried to married young men in rural areas was smaller than that required by our sampling design, we further inflated the sample of married young men in rural areas to 1,313 in order to obtain a minimum of 1,800 unmarried men. Hence, the targeted sample size for rural Andhra Pradesh was 1,313 married young men, 1,800 unmarried young men, 1,500 married young women and 2,100 unmarried young women, that is, a total sample size of 6,713. In order to achieve the above-mentioned number of individual interviews, an estimated 31,544 households were required to be covered in Andhra Pradesh.
We further determined that a total of 300 primary sampling units (PSUs)—villages in rural areas and Census Enumeration Blocks (CEBs) in urban areas—divided into 150 female PSUs and 150 male PSUs, would be visited in order to conduct interviews in the required number of households. Thus, the average number of household interviews to be conducted in each rural PSU was calculated to be 181 among female PSUs and 69 among male PSUs. Corresponding averages for each urban PSU were 99 and 73, respectively.
1.8.1 Sample selection strategy
The study treated rural and urban areas of each state as independent sampling domains and, therefore, drew sample areas independently for each of these two domains. In order to avoid potential risks associated with interviewing both women and men from the same PSU, we decided to conduct interviews in separate PSUs for female and male respondents, that is, interviews with young women in 150 PSUs and young men in the remaining 150 PSUs. These 150 PSUs were further divided equally into rural and urban areas, that is, 75 for rural respondents and 75 for urban respondents. Within each sampling domain, a systematic, multi-stage sampling design was adopted. Sample selection procedures differed somewhat in rural and urban areas, as described below.
1.8.1.a Selection of households in rural areas
In rural areas, the 2001 Census list of villages served as the sampling frame for the selection of villages. This list was stratified using four variables, namely, region, village size, proportion of the population belonging to scheduled castes and scheduled tribes, and female literacy. At the first level of stratification, the state of Andhra Pradesh was stratified into six contiguous geographical regions, with districts classified into these regions as follows:
Region I : Srikakulam, Vizianagaram, VishakhapatnamRegion II : East Godavari, West Godavari, Krishna, GunturRegion III : Prakasam, NelloreRegion IV : Cuddapah, Kurnool, Anantapur, ChittoorRegion V : Adilabad, Nizamabad, Medak, Rangaredi, Mahbubnagar, NalgondaRegion VI : Karimnagar, Warangal, Khammam
2 In estimating the number of households required, the study used the age-sex-marital status distributions observed in rural and urban areas, respectively, in the 2001 Census. The following formula was used to estimate sample size:
Coefficient of Variation
pcvqn 2=
npqcv =)(
In order to obtain the actual number of respondents, the above numbers were multiplied by the design effect and a factor ‘K’ (1 + the non-response rate).
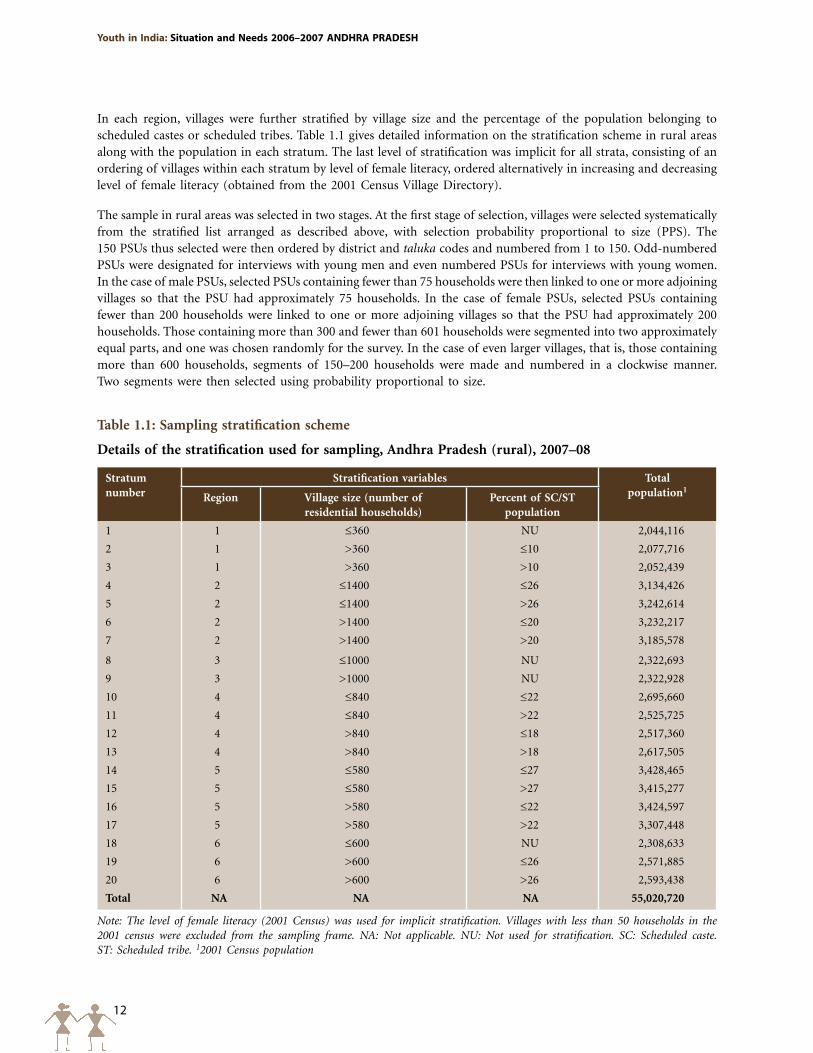
12
Youth in India: Situation and Needs 2006–2007 ANDHRA pRADESH
In each region, villages were further stratified by village size and the percentage of the population belonging to scheduled castes or scheduled tribes. Table 1.1 gives detailed information on the stratification scheme in rural areas along with the population in each stratum. The last level of stratification was implicit for all strata, consisting of an ordering of villages within each stratum by level of female literacy, ordered alternatively in increasing and decreasing level of female literacy (obtained from the 2001 Census Village Directory).
The sample in rural areas was selected in two stages. At the first stage of selection, villages were selected systematically from the stratified list arranged as described above, with selection probability proportional to size (PPS). The 150 PSUs thus selected were then ordered by district and taluka codes and numbered from 1 to 150. Odd-numbered PSUs were designated for interviews with young men and even numbered PSUs for interviews with young women. In the case of male PSUs, selected PSUs containing fewer than 75 households were then linked to one or more adjoining villages so that the PSU had approximately 75 households. In the case of female PSUs, selected PSUs containing fewer than 200 households were linked to one or more adjoining villages so that the PSU had approximately 200 households. Those containing more than 300 and fewer than 601 households were segmented into two approximately equal parts, and one was chosen randomly for the survey. In the case of even larger villages, that is, those containing more than 600 households, segments of 150–200 households were made and numbered in a clockwise manner. Two segments were then selected using probability proportional to size.
Table 1.1: Sampling stratification scheme
Details of the stratification used for sampling, Andhra Pradesh (rural), 2007–08
Stratum number
Stratification variables Total population1
Region Village size (number of residential households)
Percent of SC/ST
population
1 1 ≤360 NU 2,044,116
2 1 >360 ≤10 2,077,716
3 1 >360 >10 2,052,439
4 2 ≤1400 ≤26 3,134,426
5 2 ≤1400 >26 3,242,614
6 2 >1400 ≤20 3,232,217
7 2 >1400 >20 3,185,578
8 3 ≤1000 NU 2,322,693
9 3 >1000 NU 2,322,928
10 4 ≤840 ≤22 2,695,660
11 4 ≤840 >22 2,525,725
12 4 >840 ≤18 2,517,360
13 4 >840 >18 2,617,505
14 5 ≤580 ≤27 3,428,465
15 5 ≤580 >27 3,415,277
16 5 >580 ≤22 3,424,597
17 5 >580 >22 3,307,448
18 6 ≤600 NU 2,308,633
19 6 >600 ≤26 2,571,885
20 6 >600 >26 2,593,438
Total NA NA NA 55,020,720
Note: The level of female literacy (2001 Census) was used for implicit stratification. Villages with less than 50 households in the 2001 census were excluded from the sampling frame. NA: Not applicable. NU: Not used for stratification. SC: Scheduled caste. ST: Scheduled tribe. 12001 Census population
13
Introduction
The rural domain sampling fraction for a particular category, that is, the probability of selecting an eligible respondent of a particular category in rural Andhra Pradesh (f R), was computed as:
R
RR
Nnf =
where
nR = number of eligible respondents in a particular category to be interviewed (target number of interviews as described before), and
NR = projected rural population of eligible respondents in the state as of October 1, 2006.
The probability of selecting a PSU from rural Andhra Pradesh (f1R) was computed as:
∑×
=i
iR
vvaf1
where
a = number of PSUs selected from rural areas for the particular category, vi = population of the ith PSU, and ∑vi = total rural population of the state.
A complete mapping and household listing operation was carried out in each selected PSU (or in selected segments or linked villages as appropriate). This list of households provided the necessary frame for selecting households at the second stage. Mapping and listing were conducted by teams, each comprising one mapper and one lister. Households to be interviewed were selected with equal probability from the list using systematic sampling.
The probability of selecting a household from a selected rural PSU (f2R) was calculated as:
R
RR
fff1
2 =
No replacement for selected households was allowed even if a selected household could not be contacted after several attempts.
All the sampling fractions (f R, f1R, f2
R) described above were computed separately for male and female PSUs on the basis of the target sample of married males and unmarried females, respectively.
Because we expected more unmarried than married males in our age groups, we needed to visit fewer households to obtain the required number of unmarried compared to married males. Likewise, because we expected more married than unmarried females, we needed to visit fewer households to obtain the required number of married compared to unmarried females. Appropriate intervals were computed to operationalise each of these selection processes.
1.8.1.b Selection of households in urban areas
In selecting the urban sample, the 2001 Census list of wards (each consisting of several CEBs of 100–200 households) provided the sampling frame. For operational convenience, the Youth Study first determined male PSUs (equivalent to a CEB) and followed this with the selection of female PSUs (another CEB) in CEBs adjacent to male CEBs. As a result, half the total required number of PSUs was first selected.
In urban areas, the 2001 Census list of wards was first ordered by district, and within each district, by level of female literacy. The sample was then selected in three stages. At the first stage of selection, 75 wards were selected systematically with probability proportional to size. At the second stage, within each selected ward, CEBs were
14
Youth in India: Situation and Needs 2006–2007 ANDHRA pRADESH
arranged by their administrative number and one CEB (designated as a male PSU) was selected using probability proportional to size. For each selected male CEB, an adjacent CEB was chosen to represent the female PSU in the same ward.
The urban domain sampling fraction for a particular category, that is, the probability of selecting an eligible respondent of a particular category in urban Andhra Pradesh (f U), was computed as:
U
UU
Nnf =
where
nU = number of eligible respondents in a particular category to be interviewed in urban areas (target number of interviews as described before), and
NU = projected urban population of eligible respondents in the state as of October 1, 2006.
The probability of selecting a ward (or section) from urban Andhra Pradesh (f1U) was computed as:
∑×
=i
iU
wwaf1
where
a = number of wards selected from urban areas for the particular category, wi = population of ith ward, and ∑wi = total urban population of the state.
The probability of selecting a CEB from a selected ward (f2U) was computed as:
∑=
i
iU
ccf2
where
ci = population of ith CEB from a selected ward, and ∑ci = total population of the selected ward.
A complete mapping and household listing operation was carried out in each selected PSU and the resulting list provided the necessary frame for selecting households at the third stage. Households to be interviewed were selected with equal probability from the list using systematic sampling. In some CEBs the number of households listed was smaller than the minimum expected number of households, and in such cases, a part of an adjacent CEB was listed.
The probability of selecting a household from a selected urban PSU (f3U) was calculated as:
UU
UU
ffff
213 ×=
As in the case of rural areas, (a) no replacement of selected households was allowed under any circumstances; (b) all sampling fractions (f U, f1
U, f2U, f3
U) were computed separately for male and female PSUs on the basis of the target sample of married males and unmarried females, respectively; and (c) appropriate intervals were computed to enable us to select fewer households for the interview of unmarried compared to married males and married compared to unmarried females.
15
Introduction
1.8.2 Selection of individual respondents within selected households
In each PSU, households to be interviewed were selected by systematic sampling. The value of the interval (between one selected household and the next) was determined in advance to ensure a self-weighing design. As mentioned earlier, fewer households needed to be selected in order to obtain our sample of unmarried males and married females. Hence, further intervals were computed, using the target sample for unmarried males and married females.
Within each selected household, no more than one married and one unmarried respondent was interviewed, resulting in a maximum of two interviews from any household. In case more than one respondent from a single category was found in the household, one respondent was selected randomly using the Kish table.3 No replacement of the respondent thus selected was allowed.
1.8.3 Sample weights
In Andhra Pradesh, the sample was weighted at the level of the sampling domain, that is, urban and rural males and females, respectively, making for a total of four sampling domains. In order to consider differential non-response rates in different geographical areas, non-response rates were calculated in smaller sub-domains of 2–3 PSUs within each domain. If WDi is the design weight for the ith domain (i=1…4) and RHij is the response rate for households in the jth sub-domain within the ith domain, then the household weight for the jth sub-domain within the ith domain (WHij) was calculated as follows:
Hij
DiHij R
WW =
where WDi was calculated as the inverse of the probability of selecting an eligible married male in urban and rural male domains, respectively; and similarly, of selecting an eligible unmarried female in urban and rural female domains.
Weights were also calculated for eligible married males and unmarried females, denoted by WEij and calculated as follows:
ijEijHij
DiEij KRR
WW××
=
where
REij = response rate for married males or unmarried females in the jth sub-domain within the ith domain, and
Kij = probability that a married male or an unmarried female is selected by the Kish table procedure in the jth sub-domain within the ith domain.
The design weight described above was also used in the case of unmarried males and married females in each domain. Also, since the survey did not attempt to interview an unmarried male or a married female in all selected
3 The probability of selection of individuals in rural areas is (f R/KiR ) and in urban areas (f U/Ki
U), where KiR, and Ki
U denote the number of individuals of the specified category (married and unmarried males and females, respectively) in the ith selected household in rural and urban areas, respectively.
16
Youth in India: Situation and Needs 2006–2007 ANDHRA pRADESH
households, an additional interval needed to be incorporated in the weight calculation. Hence, weights for eligible unmarried males and married females, denoted by WEij were calculated using the following equation:
iijEijHij
DiEij I
KRRWW ×
××=
where Ii is the interval at which selected households were assigned for the interview of a married female (in female PSUs) or an unmarried male (in male PSUs) in the ith domain.
The weights were then normalised so that the total number of cases was unchanged after weighting. Hence, the normalised weights for households and eligible respondents were:
HijijHij
ijHij W
nWn
W ××
=∑∑'
EijijEij
ijEij W
nWn
W ××
=∑∑'
where nij refers to the number of completed interviews in the jth sub-domain within the ith domain.
In order to provide estimates for all young males or females (married and unmarried), multiplication factors were computed for married and unmarried males and females (four categories) in urban and rural areas, which, when multiplied with existing individual weights, provided the combined weights for the male and female samples, respectively. For example, the multiplication factor for the male sample (M lk) was computed as follows:
l
lk
l
lk
lk
sspp
M =
where
plk = number of eligible male respondents of category k (married or unmarried) in the lth area (urban or
rural), pl = number of eligible male respondents in the lth area (urban or rural), sl
k = number of completed interviews with male respondents from category k (married or unmarried) in
the lth area (urban or rural), and sl = number of completed interviews with male respondents in the lth area (urban or rural).
Similar fractions were computed for the female sample.
1.9 Recruitment, training and fieldwork
Some 71 young men and 48 young women underwent interviewer training and 22 underwent training for mapping and house listing exercises. On the basis of their performance, 74 youth were recruited as field investigators. In addition, some 18 individuals were recruited for mapping and house-listing exercises.
Training of interviewers was conducted jointly by principal investigators from IIPS and the Population Council. House-listing staff underwent a four-day training, during which trainees were familiarised with house-listing procedures in both classroom and field situations. Training for field investigators for the main survey lasted three
17
Introduction
weeks. It included lectures and interactive sessions on a range of issues, such as the sexual and reproductive health situation of youth in India, an overview of gender issues, ethical issues in research, violence against women and mental health as well as detailed explanations of sex and contraception. Efforts were also made to enable trainees to overcome their own inhibitions about discussing sexual and reproductive health matters. Trainees were provided opportunities to ask questions via an anonymous drop-box; questions were then answered in the course of training. Trainees were familiarised with each module of the questionnaire, complicated concepts and questions and their underlying rationale. Role-plays and mock interviews were conducted in reference to each module. Towards the end of the training programme, field practice sessions were organised in which trainees were taken to a village and an urban slum setting and asked to conduct interviews. The training team monitored each trainee’s progress on a regular basis and selected as interviewers only those trainees who demonstrated full understanding of the questionnaire as well as the ability to ask questions appropriately and record responses accurately.
Interviewers were initially divided into 12 teams, six each to interview young men and women, respectively. Subsequently, because several interviewers found other employment opportunities, remaining interviewers were regrouped into 8 teams, four each to interview young men and women, respectively. Male interviewers interviewed young men and female interviewers interviewed young women. Each team comprised one field editor to take care of field editing, back-checks and quality control of interviews; and one supervisor, responsible for the overall management of fieldwork and team-related logistics as well as assisting in field editing and back-checking. Interviewer and supervisor/editor manuals were prepared, translated into Telugu and provided to each team member as appropriate. These manuals clarified the meaning and appropriate coding of every question in the questionnaire.
Research officers were deputed to oversee fieldwork and ensure that correct survey procedures were followed and data quality maintained. Principal investigators from IIPS and the Population Council made monthly or bi-monthly visits to monitor and supervise data collection operations. Each team filled quality control sheets regularly, giving the team, research officers and coordinators a quick view of the quality of ongoing fieldwork. These control sheets were designed to provide information on response rates in each PSU covered, track sensitive issue reporting and interviewer performance.
1.10 Ethical considerations
As this was the first such study in India in which sensitive sexual and reproductive experiences of young people were sought in a survey situation, it was unclear how youth respondents and community members would react. At the same time, it was clear that if youth participated in the interview, its content was likely to prompt questions and problems for which support would be requested. A number of ethical issues arose which influenced the design and implementation of the Youth Study.
First, to address our concern that if interviews with young women and men were conducted in the same PSU, it could lead to teasing, harassment, harm to girls’ reputations and even violence, we decided that the study would be undertaken in one set of PSUs for young men and in a completely different set for young women. Likewise, we also ensured that two unmarried brothers or sisters, two married brothers or sisters or two sisters- or brothers-in- law would not be interviewed from the same household in case such a practice caused conflict within the family. Hence, just one individual from any category was selected for interview in each household. In case both a married and an unmarried individual were selected from a particular household, interviews were conducted separately but simultaneously.
Second, youth themselves contributed—albeit indirectly—to the development of the questionnaire. In the course of our pre-survey qualitative phase, youth and key informants informed our study teams of various youth behaviours; youth described the ways in which they referred to various sensitive behaviours. In order to minimise discomfort during questioning, the scenarios and terminologies described by youth themselves were adapted for use in the most sensitive parts of our questionnaire.
18
Youth in India: Situation and Needs 2006–2007 ANDHRA pRADESH
Third, interviewers underwent extensive training in ethical issues. Emphasis was laid on explaining the content of the questionnaire, respondents’ right to refuse to participate or answer any question and informed consent. At the same time, we trained interviewers on how to ask sensitive questions—regarding sexual experience, domestic violence and forced sex in particular—in empathetic and non-judgemental ways, and emphasised the importance of offering to refer those in need to appropriate nearby organisations.
Fourth, before entering a PSU, teams were instructed to apprise community leaders of the study and seek their support for its implementation in the community. This step ensured that community support was forthcoming and enabled team members to build rapport within the community easily. We note that despite the sensitive nature of the questions, not a single PSU in Andhra Pradesh refused permission to our teams on the grounds of study content.
Fifth, even though consent was sought from each individual to be interviewed, in the case of unmarried youth aged 15–17, consent was also sought from a parent or guardian.
Sixth, all questionnaires were anonymous and names were never recorded. In order to preserve the confidentiality of the respondent or the parent/guardian, signature on the consent form was optional; however, the interviewer was required to sign that she or he had explained the content of the consent form to the respondent or parent. Consent forms were detached and stored separately from the questionnaires.
Seventh, every effort was made to maintain privacy in the course of the interview. Interviewers were permitted to skip to relatively non-sensitive sections in case the interview was observed by parents or other family members. If possible, particularly in the case of young men, interviews were held outside the home—often in a nearby field—in order to ensure privacy. Each team was trained to assign one interviewer to conduct parallel discussion sessions with bystanders, thereby providing privacy to the interview. This proved particularly useful in the case of interviews with young women. Finally, interviewers were instructed that if privacy could not be ensured, the interview must be terminated without asking sensitive questions. Due to these strategies, few interviews had to be terminated for want of privacy and in no case was a young respondent’s privacy breached.
Eighth, the study team realised that this was perhaps one of the first opportunities many youth would have to discuss intimate matters and that respondents might request information on sexual and reproductive issues or seek counselling or treatment for a health problem. In each state, therefore, we approached non-governmental organisations (NGOs) that conduct youth- or health-related activities at the district level and sought their consent for referring any youth in need to their organisation. Many NGOs agreed, and youth (and some adults) in need were later referred to these organisations, along with an indication that the individual had been part of the Youth Study. At the same time, research officers and team members themselves built rapport with public health authorities and referred to their facilities those who preferred to seek public services, again, along with the information that the individual had been part of the Youth Study.
Finally, many youth were in need of information on sexual and reproductive health matters. On occasion, interviewers themselves responded to their questions. In addition, easy to read booklets (for example, the Neeli Rangu Pustakam prepared by TARSHI) were distributed to youth who requested them. In total, some 500 booklets were distributed.
1.11 Data processing
All completed questionnaires were sent to the project office at IIPS, Mumbai for editing and data processing. Completed questionnaires were rechecked and further edited in the office for omissions and consistency. Responses to open-ended questions were scrutinised and common responses were provided codes. The edited data were entered using a special software package that was developed using CSPro 3.0. Data were entered twice by different entry operators to minimise entry problems. The raw data were validated and cleaned to remove possible inconsistencies. The analysis of data was carried out using SPSS 14.0.
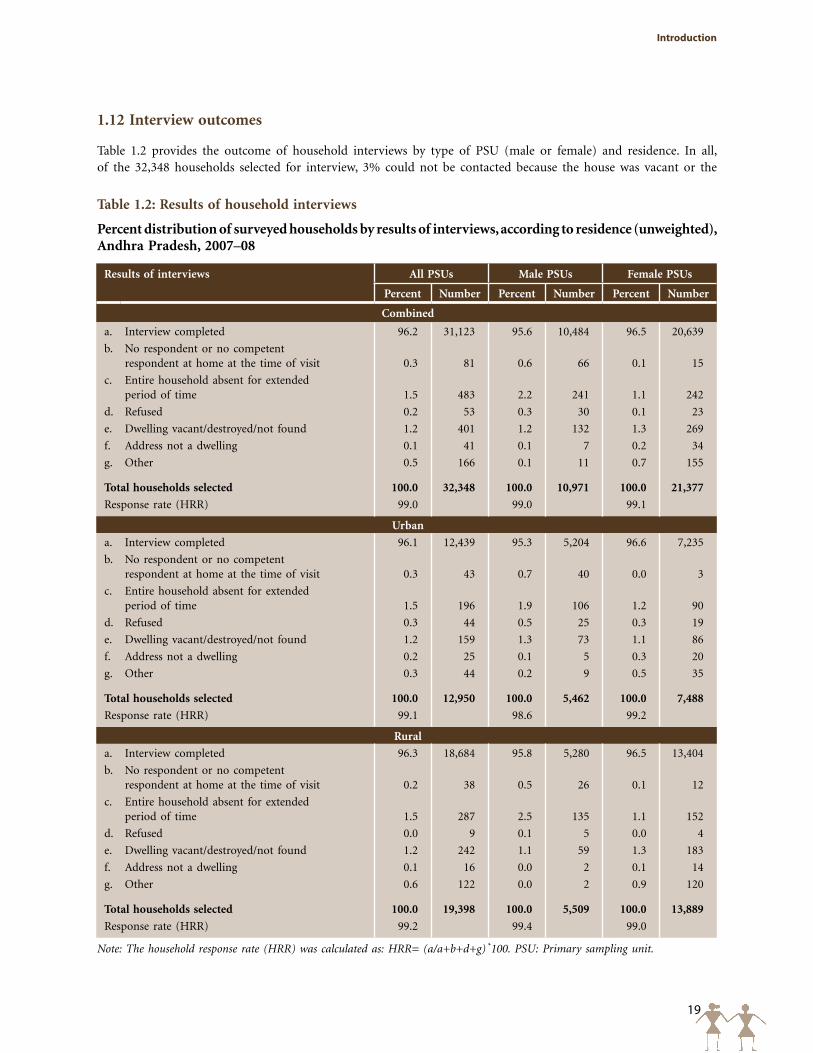
19
Introduction
1.12 Interview outcomes
Table 1.2 provides the outcome of household interviews by type of PSU (male or female) and residence. In all, of the 32,348 households selected for interview, 3% could not be contacted because the house was vacant or the
Table 1.2: Results of household interviews
Percent distribution of surveyed households by results of interviews, according to residence (unweighted), Andhra Pradesh, 2007–08
Results of interviews All PSUs Male PSUs Female PSUs
Percent Number Percent Number Percent Number
Combined
a. Interview completed 96.2 31,123 95.6 10,484 96.5 20,639
b. No respondent or no competent respondent at home at the time of visit 0.3 81 0.6 66 0.1 15
c. Entire household absent for extended period of time 1.5 483 2.2 241 1.1 242
d. Refused 0.2 53 0.3 30 0.1 23
e. Dwelling vacant/destroyed/not found 1.2 401 1.2 132 1.3 269
f. Address not a dwelling 0.1 41 0.1 7 0.2 34
g. Other 0.5 166 0.1 11 0.7 155
Total households selected 100.0 32,348 100.0 10,971 100.0 21,377
Response rate (HRR) 99.0 99.0 99.1
Urban
a. Interview completed 96.1 12,439 95.3 5,204 96.6 7,235
b. No respondent or no competent respondent at home at the time of visit 0.3 43 0.7 40 0.0 3
c. Entire household absent for extended period of time 1.5 196 1.9 106 1.2 90
d. Refused 0.3 44 0.5 25 0.3 19
e. Dwelling vacant/destroyed/not found 1.2 159 1.3 73 1.1 86
f. Address not a dwelling 0.2 25 0.1 5 0.3 20
g. Other 0.3 44 0.2 9 0.5 35
Total households selected 100.0 12,950 100.0 5,462 100.0 7,488
Response rate (HRR) 99.1 98.6 99.2
Rural
a. Interview completed 96.3 18,684 95.8 5,280 96.5 13,404
b. No respondent or no competent respondent at home at the time of visit 0.2 38 0.5 26 0.1 12
c. Entire household absent for extended period of time 1.5 287 2.5 135 1.1 152
d. Refused 0.0 9 0.1 5 0.0 4
e. Dwelling vacant/destroyed/not found 1.2 242 1.1 59 1.3 183
f. Address not a dwelling 0.1 16 0.0 2 0.1 14
g. Other 0.6 122 0.0 2 0.9 120
Total households selected 100.0 19,398 100.0 5,509 100.0 13,889
Response rate (HRR) 99.2 99.4 99.0
Note: The household response rate (HRR) was calculated as: HRR= (a/a+b+d+g) *100. PSU: Primary sampling unit.
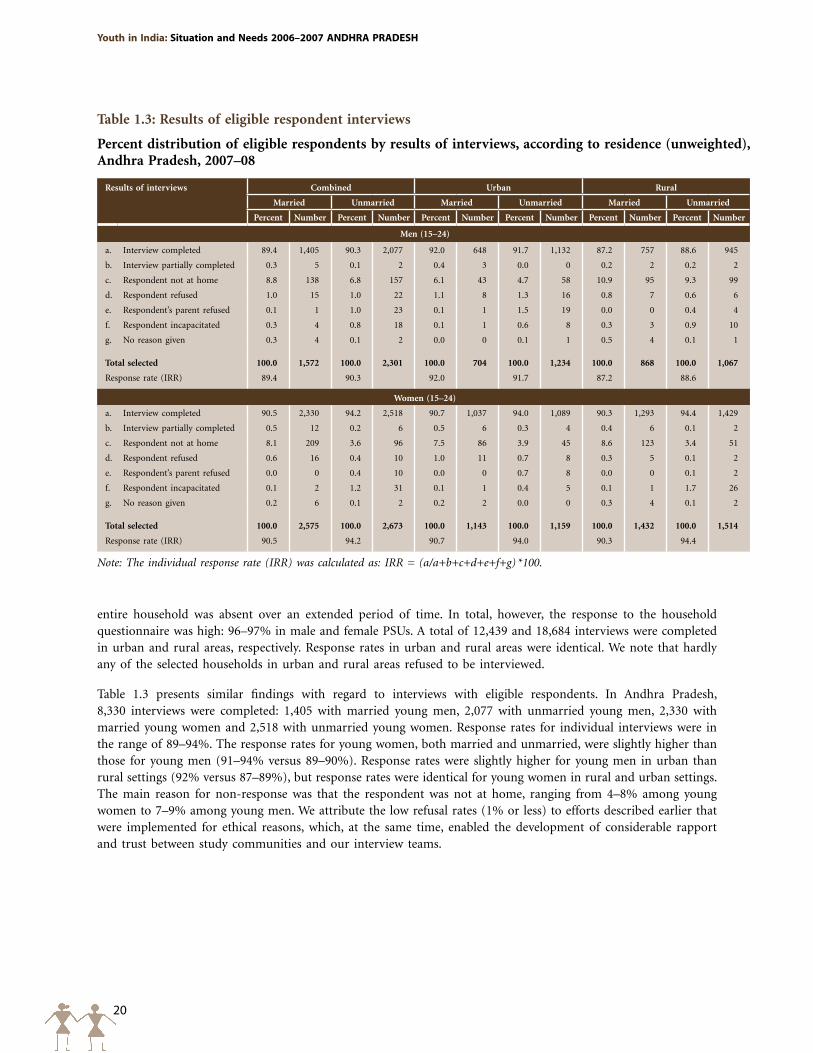
20
Youth in India: Situation and Needs 2006–2007 ANDHRA pRADESH
Table 1.3: Results of eligible respondent interviews
Percent distribution of eligible respondents by results of interviews, according to residence (unweighted), Andhra Pradesh, 2007–08
Results of interviews Combined Urban Rural
Married Unmarried Married Unmarried Married Unmarried
Percent Number Percent Number Percent Number Percent Number Percent Number Percent Number
Men (15–24)
a. Interview completed 89.4 1,405 90.3 2,077 92.0 648 91.7 1,132 87.2 757 88.6 945
b. Interview partially completed 0.3 5 0.1 2 0.4 3 0.0 0 0.2 2 0.2 2
c. Respondent not at home 8.8 138 6.8 157 6.1 43 4.7 58 10.9 95 9.3 99
d. Respondent refused 1.0 15 1.0 22 1.1 8 1.3 16 0.8 7 0.6 6
e. Respondent’s parent refused 0.1 1 1.0 23 0.1 1 1.5 19 0.0 0 0.4 4
f. Respondent incapacitated 0.3 4 0.8 18 0.1 1 0.6 8 0.3 3 0.9 10
g. No reason given 0.3 4 0.1 2 0.0 0 0.1 1 0.5 4 0.1 1
Total selected 100.0 1,572 100.0 2,301 100.0 704 100.0 1,234 100.0 868 100.0 1,067
Response rate (IRR) 89.4 90.3 92.0 91.7 87.2 88.6
Women (15–24)
a. Interview completed 90.5 2,330 94.2 2,518 90.7 1,037 94.0 1,089 90.3 1,293 94.4 1,429
b. Interview partially completed 0.5 12 0.2 6 0.5 6 0.3 4 0.4 6 0.1 2
c. Respondent not at home 8.1 209 3.6 96 7.5 86 3.9 45 8.6 123 3.4 51
d. Respondent refused 0.6 16 0.4 10 1.0 11 0.7 8 0.3 5 0.1 2
e. Respondent’s parent refused 0.0 0 0.4 10 0.0 0 0.7 8 0.0 0 0.1 2
f. Respondent incapacitated 0.1 2 1.2 31 0.1 1 0.4 5 0.1 1 1.7 26
g. No reason given 0.2 6 0.1 2 0.2 2 0.0 0 0.3 4 0.1 2
Total selected 100.0 2,575 100.0 2,673 100.0 1,143 100.0 1,159 100.0 1,432 100.0 1,514
Response rate (IRR) 90.5 94.2 90.7 94.0 90.3 94.4
Note: The individual response rate (IRR) was calculated as: IRR = (a/a+b+c+d+e+f+g) *100.
entire household was absent over an extended period of time. In total, however, the response to the household questionnaire was high: 96–97% in male and female PSUs. A total of 12,439 and 18,684 interviews were completed in urban and rural areas, respectively. Response rates in urban and rural areas were identical. We note that hardly any of the selected households in urban and rural areas refused to be interviewed.
Table 1.3 presents similar findings with regard to interviews with eligible respondents. In Andhra Pradesh, 8,330 interviews were completed: 1,405 with married young men, 2,077 with unmarried young men, 2,330 with married young women and 2,518 with unmarried young women. Response rates for individual interviews were in the range of 89–94%. The response rates for young women, both married and unmarried, were slightly higher than those for young men (91–94% versus 89–90%). Response rates were slightly higher for young men in urban than rural settings (92% versus 87–89%), but response rates were identical for young women in rural and urban settings. The main reason for non-response was that the respondent was not at home, ranging from 4–8% among young women to 7–9% among young men. We attribute the low refusal rates (1% or less) to efforts described earlier that were implemented for ethical reasons, which, at the same time, enabled the development of considerable rapport and trust between study communities and our interview teams.
21
Introduction
1.13 Structure of the report
This report is structured as follows. Chapter 2 provides a socio-demographic profile of the surveyed population and respondents, and facilities available to the rural population. Chapters 3, 4 and 5 discuss young people’s educational attainment patterns, economic and non-economic activity experiences and media exposure, respectively. Chapter 6 discusses growing up issues, including young people’s relationships with parents and peers. Chapters 7 and 8 focus, respectively, on young people’s autonomy and gender role attitudes, and awareness of sexual and reproductive health matters. Chapter 9 describes the formation of pre-marital romantic relationships and pre-marital sexual experience with romantic and non-romantic partners. Chapter 10 discusses the transition to marriage and experiences in early married life. Chapter 11 presents information on health and health seeking behaviours and substance use. Chapter 12 focuses on civic and political participation and related attitudes. A summary of each chapter (3–12) is provided at its conclusion. Finally, Chapter 13 offers recommendations for programmes and research.
In view of the heterogeneity of youth by sex, marital status and rural-urban residence, in each chapter, tables are presented that describe findings, separately, on the situation of married and unmarried young men and women residing in urban and rural areas, respectively. In order to provide information on all youth in Andhra Pradesh, we provide findings for all young men and women aged 15–24. We excluded married young men aged 25–29) to enable comparison.
All means, medians and percentages indicated in tables have been weighted using normalised weights for the total population. However, in order to show the total number of youth interviewed, unweighted numbers of respondents (Ns) are provided in each table. Because numbers are unweighted and percentages are weighted, we caution readers against deriving numbers based on percentages provided in tables.
22
Youth in India: Situation and Needs 2006–2007 ANDHRA pRADESH
Chapter 2
profile of surveyed communities, households and youth
This chapter presents a summary of the community-level characteristics of the rural areas surveyed as well as household- and respondent-level profiles of the surveyed population. First, using data drawn from the community questionnaire, it describes the rural communities in which the survey was undertaken in terms of village size, agricultural land holding and access to facilities. Thereafter, drawing on data from the household questionnaire, the chapter profiles surveyed households in terms of socio-demographic and housing characteristics, agricultural land holding and economic status. Comparisons are drawn throughout between the distribution of the population as recorded in the present survey and that reported by the 2001 Census of India (Office of the Registrar General and Census Commissioner, 2001a; 2001b) as well as the most recent NFHS (IIPS and Macro International, 2007a). Finally, we present the socio-demographic characteristics of youth respondents and their parents drawn from individual questionnaires.
2.1 Profile of rural communities surveyed
This section provides a profile of the rural PSUs (150 selected villages and 3 link villages) in which the survey was conducted. It should be noted that as sampling of rural PSUs was conducted with the probability of selection proportional to size, the proportion of large villages in our sample is likely to have been greater than the proportion of such villages in Andhra Pradesh as a whole. However, because the selection of villages was made from a list of villages stratified by size, the effect of using the probability proportional to size sampling technique on village size distribution is likely to have been small.
As indicated in Table 2.1, 6% of the villages surveyed were relatively small in size (less than 1,000 persons, or about 200 households), while 38% were large villages (5,000 or more persons, or about 1,000 households). The remaining 56% of the surveyed villages were of medium size (1,000–4,999 persons). The majority of villages surveyed (67%) contained more than 1,000 hectares of agricultural land. More than half of all agricultural land was irrigated in 71% of the surveyed villages.
Table 2.2 presents data regarding access to a variety of facilities among the rural population surveyed. Findings show that the median distance to the nearest town was 15 kilometres from the village of residence. Furthermore, 41% of the rural population had access to all-weather roads in their village; the median distance to the nearest all-weather road was 2 kilometres. Access to banks was limited: just 32% of the rural population had a bank located in their village. In contrast, four-fifths had a post office located in their village.
Primary schools were available in the village of residence of virtually the entire population (98%). Middle, secondary and higher secondary schools were progressively less likely to be available within the village of residence (81%, 67% and 26% of rural residents, respectively, resided in a village containing these facilities). The median distance to the nearest higher secondary school was 5 kilometres. Colleges and technical institutions were much less accessible; just 11% and 7% respectively, of the population had a college and technical institution within the village and median distances to the nearest college and the technical institution were 10 and 18 kilometers, respectively.
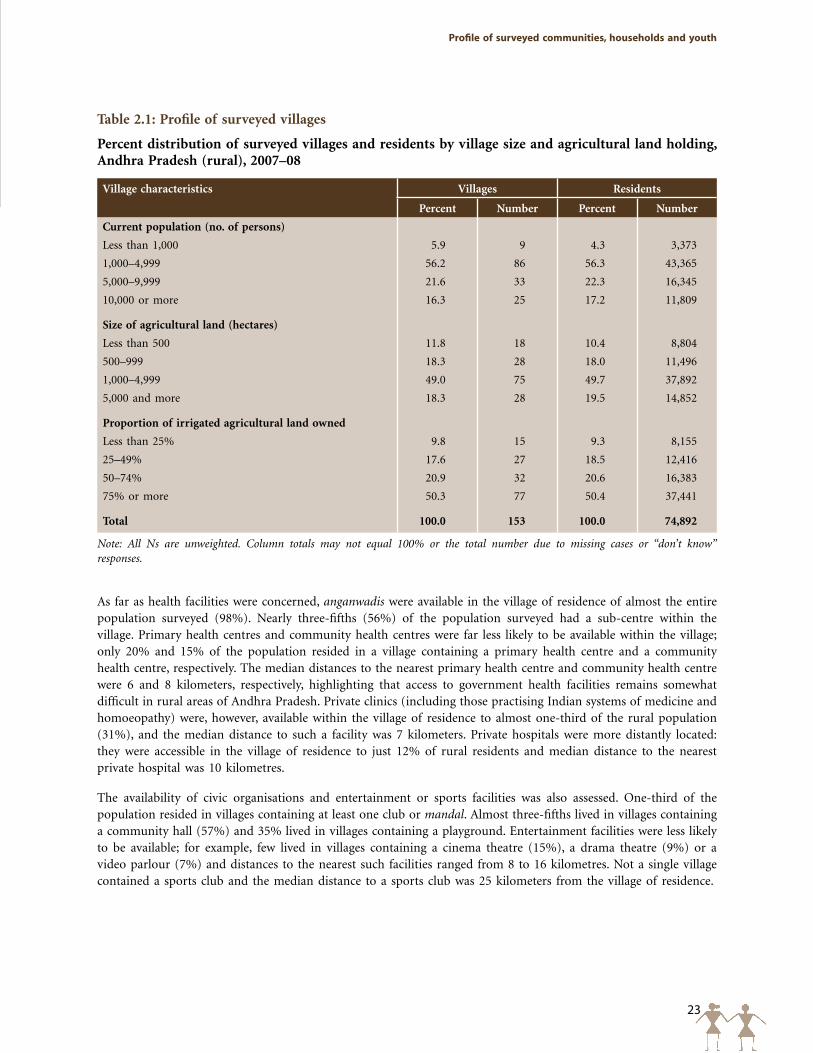
23
profile of surveyed communities, households and youth
Table 2.1: Profile of surveyed villages
Percent distribution of surveyed villages and residents by village size and agricultural land holding, Andhra Pradesh (rural), 2007–08
Village characteristics Villages Residents
Percent Number Percent Number
Current population (no. of persons)
Less than 1,000 5.9 9 4.3 3,373
1,000–4,999 56.2 86 56.3 43,365
5,000–9,999 21.6 33 22.3 16,345
10,000 or more 16.3 25 17.2 11,809
Size of agricultural land (hectares)
Less than 500 11.8 18 10.4 8,804
500–999 18.3 28 18.0 11,496
1,000–4,999 49.0 75 49.7 37,892
5,000 and more 18.3 28 19.5 14,852
Proportion of irrigated agricultural land owned
Less than 25% 9.8 15 9.3 8,155
25–49% 17.6 27 18.5 12,416
50–74% 20.9 32 20.6 16,383
75% or more 50.3 77 50.4 37,441
Total 100.0 153 100.0 74,892
Note: All Ns are unweighted. Column totals may not equal 100% or the total number due to missing cases or “don’t know” responses.
As far as health facilities were concerned, anganwadis were available in the village of residence of almost the entire population surveyed (98%). Nearly three-fifths (56%) of the population surveyed had a sub-centre within the village. Primary health centres and community health centres were far less likely to be available within the village; only 20% and 15% of the population resided in a village containing a primary health centre and a community health centre, respectively. The median distances to the nearest primary health centre and community health centre were 6 and 8 kilometers, respectively, highlighting that access to government health facilities remains somewhat difficult in rural areas of Andhra Pradesh. Private clinics (including those practising Indian systems of medicine and homoeopathy) were, however, available within the village of residence to almost one-third of the rural population (31%), and the median distance to such a facility was 7 kilometers. Private hospitals were more distantly located: they were accessible in the village of residence to just 12% of rural residents and median distance to the nearest private hospital was 10 kilometres.
The availability of civic organisations and entertainment or sports facilities was also assessed. One-third of the population resided in villages containing at least one club or mandal. Almost three-fifths lived in villages containing a community hall (57%) and 35% lived in villages containing a playground. Entertainment facilities were less likely to be available; for example, few lived in villages containing a cinema theatre (15%), a drama theatre (9%) or a video parlour (7%) and distances to the nearest such facilities ranged from 8 to 16 kilometres. Not a single village contained a sports club and the median distance to a sports club was 25 kilometers from the village of residence.
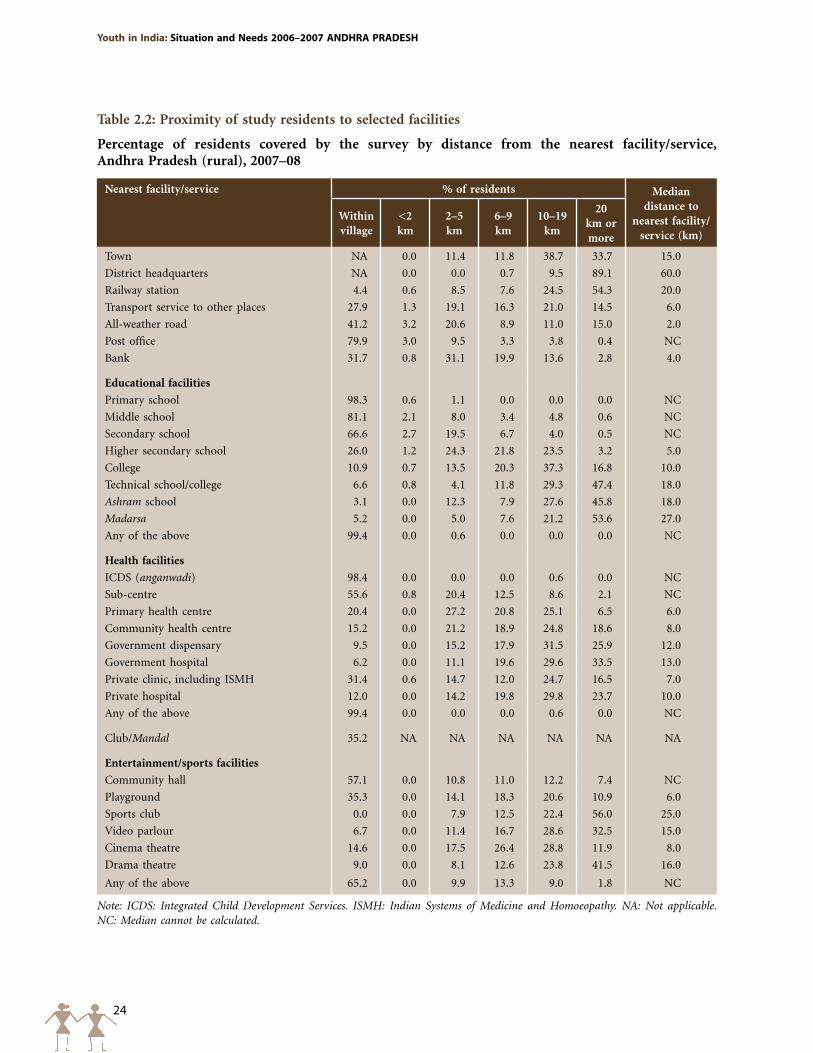
24
Youth in India: Situation and Needs 2006–2007 ANDHRA pRADESH
Table 2.2: Proximity of study residents to selected facilities
Percentage of residents covered by the survey by distance from the nearest facility/service, Andhra Pradesh (rural), 2007–08
Nearest facility/service % of residents Median distance to
nearest facility/ service (km)
Within village
<2 km
2–5 km
6–9 km
10–19 km
20 km or more
Town NA 0.0 11.4 11.8 38.7 33.7 15.0
District headquarters NA 0.0 0.0 0.7 9.5 89.1 60.0
Railway station 4.4 0.6 8.5 7.6 24.5 54.3 20.0
Transport service to other places 27.9 1.3 19.1 16.3 21.0 14.5 6.0
All-weather road 41.2 3.2 20.6 8.9 11.0 15.0 2.0
Post office 79.9 3.0 9.5 3.3 3.8 0.4 NC
Bank 31.7 0.8 31.1 19.9 13.6 2.8 4.0
Educational facilities
Primary school 98.3 0.6 1.1 0.0 0.0 0.0 NC
Middle school 81.1 2.1 8.0 3.4 4.8 0.6 NC
Secondary school 66.6 2.7 19.5 6.7 4.0 0.5 NC
Higher secondary school 26.0 1.2 24.3 21.8 23.5 3.2 5.0
College 10.9 0.7 13.5 20.3 37.3 16.8 10.0
Technical school/college 6.6 0.8 4.1 11.8 29.3 47.4 18.0
Ashram school 3.1 0.0 12.3 7.9 27.6 45.8 18.0
Madarsa 5.2 0.0 5.0 7.6 21.2 53.6 27.0
Any of the above 99.4 0.0 0.6 0.0 0.0 0.0 NC
Health facilities
ICDS (anganwadi) 98.4 0.0 0.0 0.0 0.6 0.0 NC
Sub-centre 55.6 0.8 20.4 12.5 8.6 2.1 NC
Primary health centre 20.4 0.0 27.2 20.8 25.1 6.5 6.0
Community health centre 15.2 0.0 21.2 18.9 24.8 18.6 8.0
Government dispensary 9.5 0.0 15.2 17.9 31.5 25.9 12.0
Government hospital 6.2 0.0 11.1 19.6 29.6 33.5 13.0
Private clinic, including ISMH 31.4 0.6 14.7 12.0 24.7 16.5 7.0
Private hospital 12.0 0.0 14.2 19.8 29.8 23.7 10.0
Any of the above 99.4 0.0 0.0 0.0 0.6 0.0 NC
Club/Mandal 35.2 NA NA NA NA NA NA
Entertainment/sports facilities
Community hall 57.1 0.0 10.8 11.0 12.2 7.4 NC
Playground 35.3 0.0 14.1 18.3 20.6 10.9 6.0
Sports club 0.0 0.0 7.9 12.5 22.4 56.0 25.0
Video parlour 6.7 0.0 11.4 16.7 28.6 32.5 15.0
Cinema theatre 14.6 0.0 17.5 26.4 28.8 11.9 8.0
Drama theatre 9.0 0.0 8.1 12.6 23.8 41.5 16.0
Any of the above 65.2 0.0 9.9 13.3 9.0 1.8 NC
Note: ICDS: Integrated Child Development Services. ISMH: Indian Systems of Medicine and Homoeopathy. NA: Not applicable. NC: Median cannot be calculated.
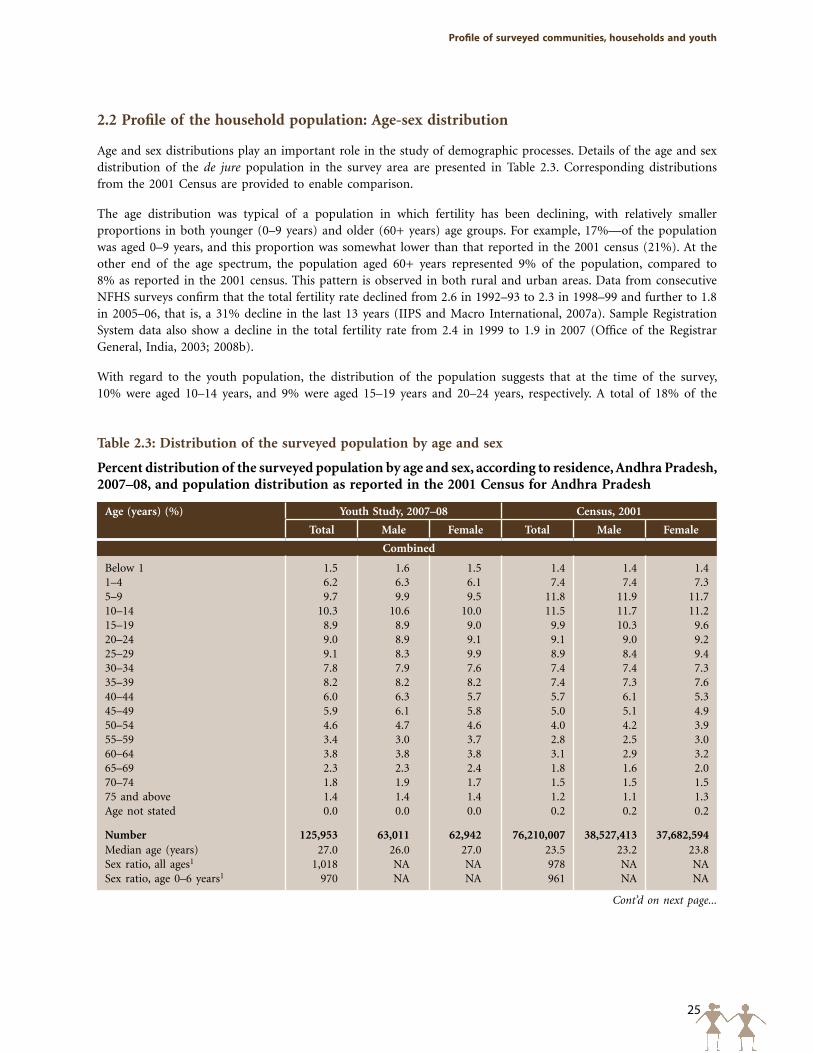
25
profile of surveyed communities, households and youth
Table 2.3: Distribution of the surveyed population by age and sex
Percent distribution of the surveyed population by age and sex, according to residence, Andhra Pradesh, 2007–08, and population distribution as reported in the 2001 Census for Andhra Pradesh
Age (years) (%) Youth Study, 2007–08 Census, 2001
Total Male Female Total Male Female
Combined
Below 1 1.5 1.6 1.5 1.4 1.4 1.41–4 6.2 6.3 6.1 7.4 7.4 7.35–9 9.7 9.9 9.5 11.8 11.9 11.710–14 10.3 10.6 10.0 11.5 11.7 11.215–19 8.9 8.9 9.0 9.9 10.3 9.620–24 9.0 8.9 9.1 9.1 9.0 9.225–29 9.1 8.3 9.9 8.9 8.4 9.430–34 7.8 7.9 7.6 7.4 7.4 7.335–39 8.2 8.2 8.2 7.4 7.3 7.640–44 6.0 6.3 5.7 5.7 6.1 5.345–49 5.9 6.1 5.8 5.0 5.1 4.950–54 4.6 4.7 4.6 4.0 4.2 3.955–59 3.4 3.0 3.7 2.8 2.5 3.060–64 3.8 3.8 3.8 3.1 2.9 3.265–69 2.3 2.3 2.4 1.8 1.6 2.070–74 1.8 1.9 1.7 1.5 1.5 1.575 and above 1.4 1.4 1.4 1.2 1.1 1.3Age not stated 0.0 0.0 0.0 0.2 0.2 0.2
Number 125,953 63,011 62,942 76,210,007 38,527,413 37,682,594Median age (years) 27.0 26.0 27.0 23.5 23.2 23.8Sex ratio, all ages1 1,018 NA NA 978 NA NASex ratio, age 0–6 years1 970 NA NA 961 NA NA
Cont’d on next page...
2.2 Profile of the household population: Age-sex distribution
Age and sex distributions play an important role in the study of demographic processes. Details of the age and sex distribution of the de jure population in the survey area are presented in Table 2.3. Corresponding distributions from the 2001 Census are provided to enable comparison.
The age distribution was typical of a population in which fertility has been declining, with relatively smaller proportions in both younger (0–9 years) and older (60+ years) age groups. For example, 17%—of the population was aged 0–9 years, and this proportion was somewhat lower than that reported in the 2001 census (21%). At the other end of the age spectrum, the population aged 60+ years represented 9% of the population, compared to 8% as reported in the 2001 census. This pattern is observed in both rural and urban areas. Data from consecutive NFHS surveys confirm that the total fertility rate declined from 2.6 in 1992–93 to 2.3 in 1998–99 and further to 1.8 in 2005–06, that is, a 31% decline in the last 13 years (IIPS and Macro International, 2007a). Sample Registration System data also show a decline in the total fertility rate from 2.4 in 1999 to 1.9 in 2007 (Office of the Registrar General, India, 2003; 2008b).
With regard to the youth population, the distribution of the population suggests that at the time of the survey, 10% were aged 10–14 years, and 9% were aged 15–19 years and 20–24 years, respectively. A total of 18% of the
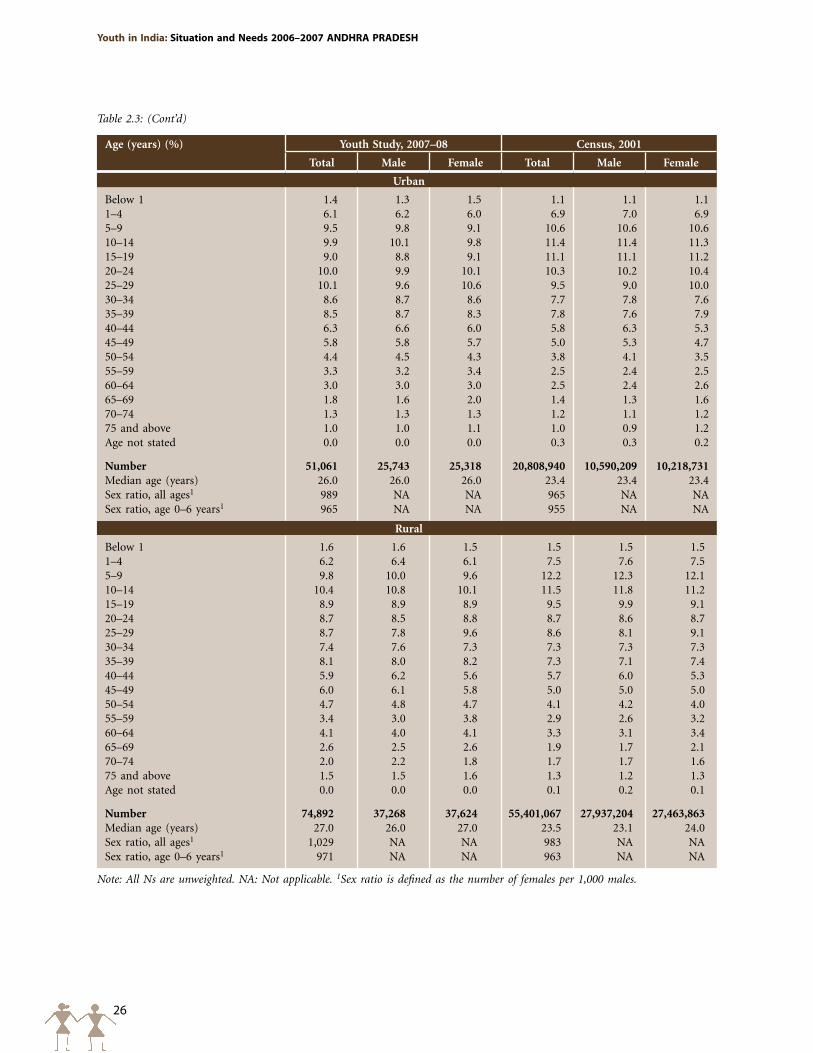
26
Youth in India: Situation and Needs 2006–2007 ANDHRA pRADESH
Age (years) (%) Youth Study, 2007–08 Census, 2001
Total Male Female Total Male Female
Urban
Below 1 1.4 1.3 1.5 1.1 1.1 1.11–4 6.1 6.2 6.0 6.9 7.0 6.95–9 9.5 9.8 9.1 10.6 10.6 10.610–14 9.9 10.1 9.8 11.4 11.4 11.315–19 9.0 8.8 9.1 11.1 11.1 11.220–24 10.0 9.9 10.1 10.3 10.2 10.425–29 10.1 9.6 10.6 9.5 9.0 10.030–34 8.6 8.7 8.6 7.7 7.8 7.635–39 8.5 8.7 8.3 7.8 7.6 7.940–44 6.3 6.6 6.0 5.8 6.3 5.345–49 5.8 5.8 5.7 5.0 5.3 4.750–54 4.4 4.5 4.3 3.8 4.1 3.555–59 3.3 3.2 3.4 2.5 2.4 2.560–64 3.0 3.0 3.0 2.5 2.4 2.665–69 1.8 1.6 2.0 1.4 1.3 1.670–74 1.3 1.3 1.3 1.2 1.1 1.275 and above 1.0 1.0 1.1 1.0 0.9 1.2Age not stated 0.0 0.0 0.0 0.3 0.3 0.2
Number 51,061 25,743 25,318 20,808,940 10,590,209 10,218,731Median age (years) 26.0 26.0 26.0 23.4 23.4 23.4Sex ratio, all ages1 989 NA NA 965 NA NASex ratio, age 0–6 years1 965 NA NA 955 NA NA
Rural
Below 1 1.6 1.6 1.5 1.5 1.5 1.51–4 6.2 6.4 6.1 7.5 7.6 7.55–9 9.8 10.0 9.6 12.2 12.3 12.110–14 10.4 10.8 10.1 11.5 11.8 11.215–19 8.9 8.9 8.9 9.5 9.9 9.120–24 8.7 8.5 8.8 8.7 8.6 8.725–29 8.7 7.8 9.6 8.6 8.1 9.130–34 7.4 7.6 7.3 7.3 7.3 7.335–39 8.1 8.0 8.2 7.3 7.1 7.440–44 5.9 6.2 5.6 5.7 6.0 5.345–49 6.0 6.1 5.8 5.0 5.0 5.050–54 4.7 4.8 4.7 4.1 4.2 4.055–59 3.4 3.0 3.8 2.9 2.6 3.260–64 4.1 4.0 4.1 3.3 3.1 3.465–69 2.6 2.5 2.6 1.9 1.7 2.170–74 2.0 2.2 1.8 1.7 1.7 1.675 and above 1.5 1.5 1.6 1.3 1.2 1.3Age not stated 0.0 0.0 0.0 0.1 0.2 0.1
Number 74,892 37,268 37,624 55,401,067 27,937,204 27,463,863Median age (years) 27.0 26.0 27.0 23.5 23.1 24.0Sex ratio, all ages1 1,029 NA NA 983 NA NASex ratio, age 0–6 years1 971 NA NA 963 NA NA
Note: All Ns are unweighted. NA: Not applicable. 1Sex ratio is defined as the number of females per 1,000 males.
Table 2.3: (Cont’d)
27
profile of surveyed communities, households and youth
population was aged 15–24 years, almost identical to that reported in the 2001 Census (19%) (Office of the Registrar General and Census Commissioner, 2001a).
Overall, the sex ratio of the de jure population of the state was 1,018 females per 1,000 males, considerably higher than that observed in the 2001 census (978). While the urban sex ratio was somewhat higher than that observed in the 2001 census (989 and 965, respectively), the rural sex ratio observed in the Youth Study was considerably higher (1,029 and 983, respectively).
The child sex ratio of the surveyed population was 970 females per 1,000 males aged 0–6, relatively similar to that reported in the 2001 census (961). The ratios observed in rural and urban areas were, likewise, somewhat similar to that observed in the 2001 census (971 and 963, respectively, in rural areas; 965 and 955, respectively, in urban areas).
2.3 Profile of the household population: Marital status
Table 2.4 presents the marital status distribution of the surveyed population, classified by age, residence and sex. A comparison with the marital status distribution as obtained in the 2001 Census (data not shown in tabular form) suggests that proportions never married have increased somewhat in the period 2001–08 (Office of the Registrar General and Census Commissioner, 2001a). The currently married include both those who have married and cohabited with their spouse as well as those for whom cohabitation has not been initiated.
Findings suggest wide gender differences in marriage age distributions, notably between the ages of 15 and 29. Of those aged 15–19 years, just 1.3% of young men compared to 26% of young women were currently married. This increased to 28% and 76%, respectively, for those aged 20–24 years and further to 72% and 92% for those aged 25–29 years. Patterns were similar for both rural and urban areas, but larger percentages of young men were married among those aged 20–29 years in rural than in urban areas and larger percentages of young women were married in each group up to age 25 in rural than in urban areas.
Table 2.4 also provides estimates of the singulate mean age at marriage (SMAM), calculated from the age-specific proportion of never-married individuals obtained in the household survey. As suggested above, the singulate mean age at marriage was considerably higher among the male population compared to the female: 25 and 20 years, respectively. Differences were also observed by rural-urban residence, with the singulate mean age at marriage about two years higher among urban compared to rural males and females. Findings also suggest that women tended to marry men who were an average of five years older than themselves.
In order to assess age at marriage among those married more recently, the Youth Study household questionnaire asked specifically about marriages that had taken place in the three years prior to the interview among the household’s usual residents at that time. Table 2.5 suggests that the median age at marriage for those who married in the recent past was 23 years among young men and 18 years among young women. Rural-urban differences were similar to those observed above, that is median ages at marriage were two years higher among urban youth than their rural counterparts. Findings also show that large proportions of both young women and men had married before the legal minimum age at marriage. More than one quarter of young women (28%) had married before they were aged 18, that is, the legal minimum age at marriage for females. As many as one in five young men had married before they were 21, the legal minimum age at marriage for males. Rural youth were twice as likely as urban youth to have married before the minimum legal age at marriage: 32% of rural females compared to 16% of urban females had married before they were 18 years of age. Among young men, 23% and 11% of respondents from rural and urban areas, respectively, had married before they reached 21 years.
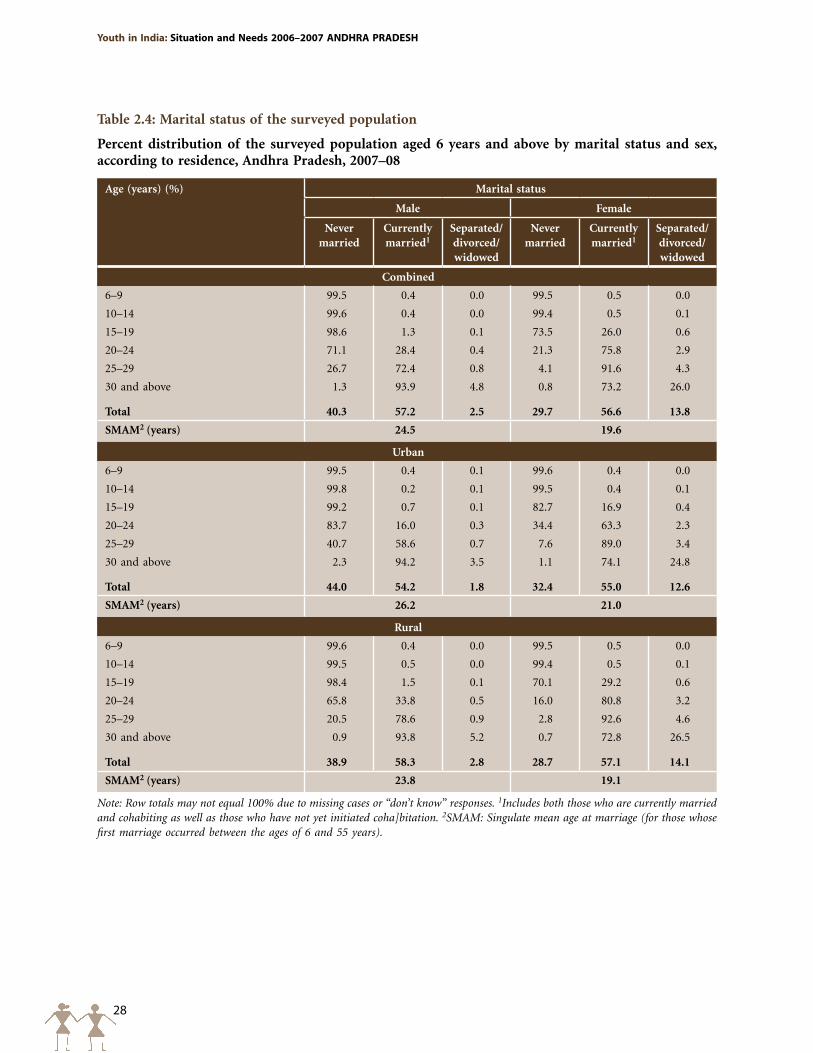
28
Youth in India: Situation and Needs 2006–2007 ANDHRA pRADESH
Table 2.4: Marital status of the surveyed population
Percent distribution of the surveyed population aged 6 years and above by marital status and sex, according to residence, Andhra Pradesh, 2007–08
Age (years) (%) Marital status
Male Female
Never married
Currently married1
Separated/ divorced/ widowed
Never married
Currently married1
Separated/ divorced/ widowed
Combined
6–9 99.5 0.4 0.0 99.5 0.5 0.0
10–14 99.6 0.4 0.0 99.4 0.5 0.1
15–19 98.6 1.3 0.1 73.5 26.0 0.6
20–24 71.1 28.4 0.4 21.3 75.8 2.9
25–29 26.7 72.4 0.8 4.1 91.6 4.3
30 and above 1.3 93.9 4.8 0.8 73.2 26.0
Total 40.3 57.2 2.5 29.7 56.6 13.8
SMAM2 (years) 24.5 19.6
Urban
6–9 99.5 0.4 0.1 99.6 0.4 0.0
10–14 99.8 0.2 0.1 99.5 0.4 0.1
15–19 99.2 0.7 0.1 82.7 16.9 0.4
20–24 83.7 16.0 0.3 34.4 63.3 2.3
25–29 40.7 58.6 0.7 7.6 89.0 3.4
30 and above 2.3 94.2 3.5 1.1 74.1 24.8
Total 44.0 54.2 1.8 32.4 55.0 12.6
SMAM2 (years) 26.2 21.0
Rural
6–9 99.6 0.4 0.0 99.5 0.5 0.0
10–14 99.5 0.5 0.0 99.4 0.5 0.1
15–19 98.4 1.5 0.1 70.1 29.2 0.6
20–24 65.8 33.8 0.5 16.0 80.8 3.2
25–29 20.5 78.6 0.9 2.8 92.6 4.6
30 and above 0.9 93.8 5.2 0.7 72.8 26.5
Total 38.9 58.3 2.8 28.7 57.1 14.1
SMAM2 (years) 23.8 19.1
Note: Row totals may not equal 100% due to missing cases or “don’t know” responses. 1Includes both those who are currently married and cohabiting as well as those who have not yet initiated coha]bitation. 2SMAM: Singulate mean age at marriage (for those whose first marriage occurred between the ages of 6 and 55 years).
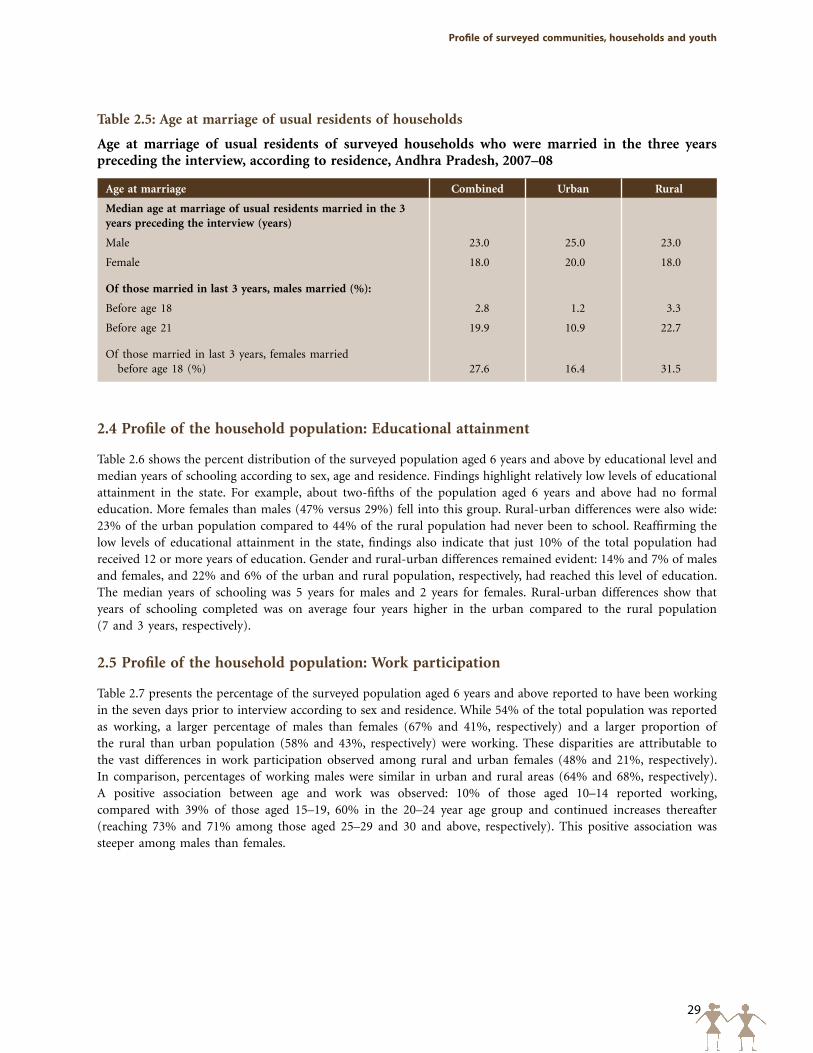
29
profile of surveyed communities, households and youth
Table 2.5: Age at marriage of usual residents of households
Age at marriage of usual residents of surveyed households who were married in the three years preceding the interview, according to residence, Andhra Pradesh, 2007–08
Age at marriage Combined Urban Rural
Median age at marriage of usual residents married in the 3 years preceding the interview (years)
Male 23.0 25.0 23.0
Female 18.0 20.0 18.0
Of those married in last 3 years, males married (%):
Before age 18 2.8 1.2 3.3
Before age 21 19.9 10.9 22.7
Of those married in last 3 years, females married before age 18 (%) 27.6 16.4 31.5
2.4 Profile of the household population: Educational attainment
Table 2.6 shows the percent distribution of the surveyed population aged 6 years and above by educational level and median years of schooling according to sex, age and residence. Findings highlight relatively low levels of educational attainment in the state. For example, about two-fifths of the population aged 6 years and above had no formal education. More females than males (47% versus 29%) fell into this group. Rural-urban differences were also wide: 23% of the urban population compared to 44% of the rural population had never been to school. Reaffirming the low levels of educational attainment in the state, findings also indicate that just 10% of the total population had received 12 or more years of education. Gender and rural-urban differences remained evident: 14% and 7% of males and females, and 22% and 6% of the urban and rural population, respectively, had reached this level of education. The median years of schooling was 5 years for males and 2 years for females. Rural-urban differences show that years of schooling completed was on average four years higher in the urban compared to the rural population (7 and 3 years, respectively).
2.5 Profile of the household population: Work participation
Table 2.7 presents the percentage of the surveyed population aged 6 years and above reported to have been working in the seven days prior to interview according to sex and residence. While 54% of the total population was reported as working, a larger percentage of males than females (67% and 41%, respectively) and a larger proportion of the rural than urban population (58% and 43%, respectively) were working. These disparities are attributable to the vast differences in work participation observed among rural and urban females (48% and 21%, respectively). In comparison, percentages of working males were similar in urban and rural areas (64% and 68%, respectively). A positive association between age and work was observed: 10% of those aged 10–14 reported working, compared with 39% of those aged 15–19, 60% in the 20–24 year age group and continued increases thereafter (reaching 73% and 71% among those aged 25–29 and 30 and above, respectively). This positive association was steeper among males than females.
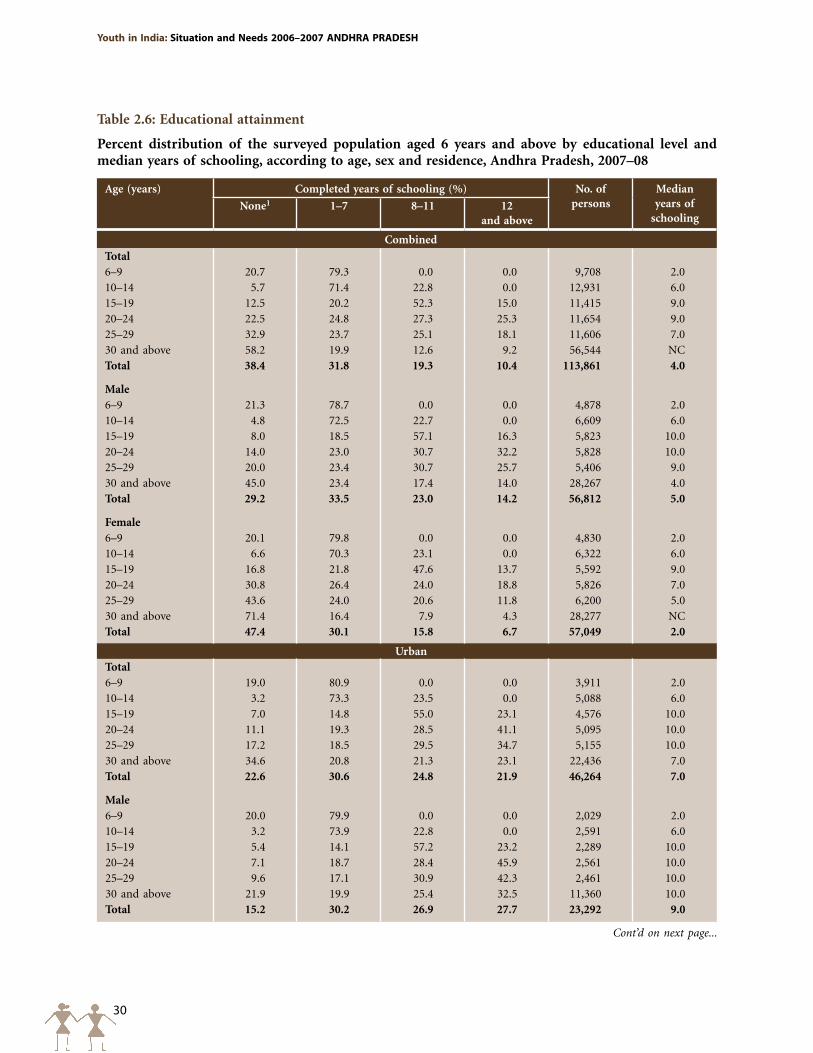
30
Youth in India: Situation and Needs 2006–2007 ANDHRA pRADESH
Table 2.6: Educational attainment
Percent distribution of the surveyed population aged 6 years and above by educational level and median years of schooling, according to age, sex and residence, Andhra Pradesh, 2007–08
Age (years) Completed years of schooling (%) No. of persons
Median years of
schoolingNone1 1–7 8–11 12
and above
Combined
Total6–9 20.7 79.3 0.0 0.0 9,708 2.010–14 5.7 71.4 22.8 0.0 12,931 6.015–19 12.5 20.2 52.3 15.0 11,415 9.020–24 22.5 24.8 27.3 25.3 11,654 9.025–29 32.9 23.7 25.1 18.1 11,606 7.030 and above 58.2 19.9 12.6 9.2 56,544 NCTotal 38.4 31.8 19.3 10.4 113,861 4.0
Male6–9 21.3 78.7 0.0 0.0 4,878 2.010–14 4.8 72.5 22.7 0.0 6,609 6.015–19 8.0 18.5 57.1 16.3 5,823 10.020–24 14.0 23.0 30.7 32.2 5,828 10.025–29 20.0 23.4 30.7 25.7 5,406 9.030 and above 45.0 23.4 17.4 14.0 28,267 4.0Total 29.2 33.5 23.0 14.2 56,812 5.0
Female6–9 20.1 79.8 0.0 0.0 4,830 2.010–14 6.6 70.3 23.1 0.0 6,322 6.015–19 16.8 21.8 47.6 13.7 5,592 9.020–24 30.8 26.4 24.0 18.8 5,826 7.025–29 43.6 24.0 20.6 11.8 6,200 5.030 and above 71.4 16.4 7.9 4.3 28,277 NCTotal 47.4 30.1 15.8 6.7 57,049 2.0
UrbanTotal6–9 19.0 80.9 0.0 0.0 3,911 2.010–14 3.2 73.3 23.5 0.0 5,088 6.015–19 7.0 14.8 55.0 23.1 4,576 10.020–24 11.1 19.3 28.5 41.1 5,095 10.025–29 17.2 18.5 29.5 34.7 5,155 10.030 and above 34.6 20.8 21.3 23.1 22,436 7.0Total 22.6 30.6 24.8 21.9 46,264 7.0
Male6–9 20.0 79.9 0.0 0.0 2,029 2.010–14 3.2 73.9 22.8 0.0 2,591 6.015–19 5.4 14.1 57.2 23.2 2,289 10.020–24 7.1 18.7 28.4 45.9 2,561 10.025–29 9.6 17.1 30.9 42.3 2,461 10.030 and above 21.9 19.9 25.4 32.5 11,360 10.0Total 15.2 30.2 26.9 27.7 23,292 9.0
Cont’d on next page...
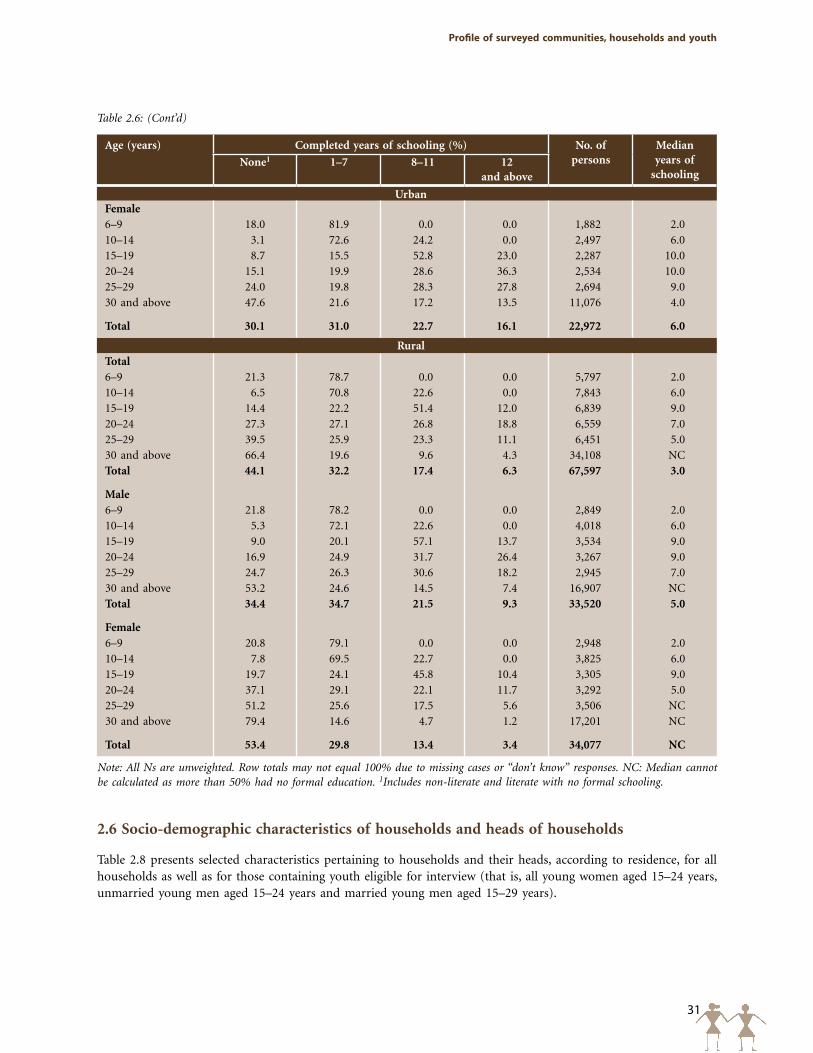
31
profile of surveyed communities, households and youth
Age (years) Completed years of schooling (%) No. of persons
Median years of
schoolingNone1 1–7 8–11 12
and above
UrbanFemale6–9 18.0 81.9 0.0 0.0 1,882 2.010–14 3.1 72.6 24.2 0.0 2,497 6.015–19 8.7 15.5 52.8 23.0 2,287 10.020–24 15.1 19.9 28.6 36.3 2,534 10.025–29 24.0 19.8 28.3 27.8 2,694 9.030 and above 47.6 21.6 17.2 13.5 11,076 4.0
Total 30.1 31.0 22.7 16.1 22,972 6.0
RuralTotal6–9 21.3 78.7 0.0 0.0 5,797 2.010–14 6.5 70.8 22.6 0.0 7,843 6.015–19 14.4 22.2 51.4 12.0 6,839 9.020–24 27.3 27.1 26.8 18.8 6,559 7.025–29 39.5 25.9 23.3 11.1 6,451 5.030 and above 66.4 19.6 9.6 4.3 34,108 NCTotal 44.1 32.2 17.4 6.3 67,597 3.0
Male6–9 21.8 78.2 0.0 0.0 2,849 2.010–14 5.3 72.1 22.6 0.0 4,018 6.015–19 9.0 20.1 57.1 13.7 3,534 9.020–24 16.9 24.9 31.7 26.4 3,267 9.025–29 24.7 26.3 30.6 18.2 2,945 7.030 and above 53.2 24.6 14.5 7.4 16,907 NCTotal 34.4 34.7 21.5 9.3 33,520 5.0
Female6–9 20.8 79.1 0.0 0.0 2,948 2.010–14 7.8 69.5 22.7 0.0 3,825 6.015–19 19.7 24.1 45.8 10.4 3,305 9.020–24 37.1 29.1 22.1 11.7 3,292 5.025–29 51.2 25.6 17.5 5.6 3,506 NC30 and above 79.4 14.6 4.7 1.2 17,201 NC
Total 53.4 29.8 13.4 3.4 34,077 NC
Note: All Ns are unweighted. Row totals may not equal 100% due to missing cases or “don’t know” responses. NC: Median cannot be calculated as more than 50% had no formal education. 1Includes non-literate and literate with no formal schooling.
Table 2.6: (Cont’d)
2.6 Socio-demographic characteristics of households and heads of households
Table 2.8 presents selected characteristics pertaining to households and their heads, according to residence, for all households as well as for those containing youth eligible for interview (that is, all young women aged 15–24 years, unmarried young men aged 15–24 years and married young men aged 15–29 years).
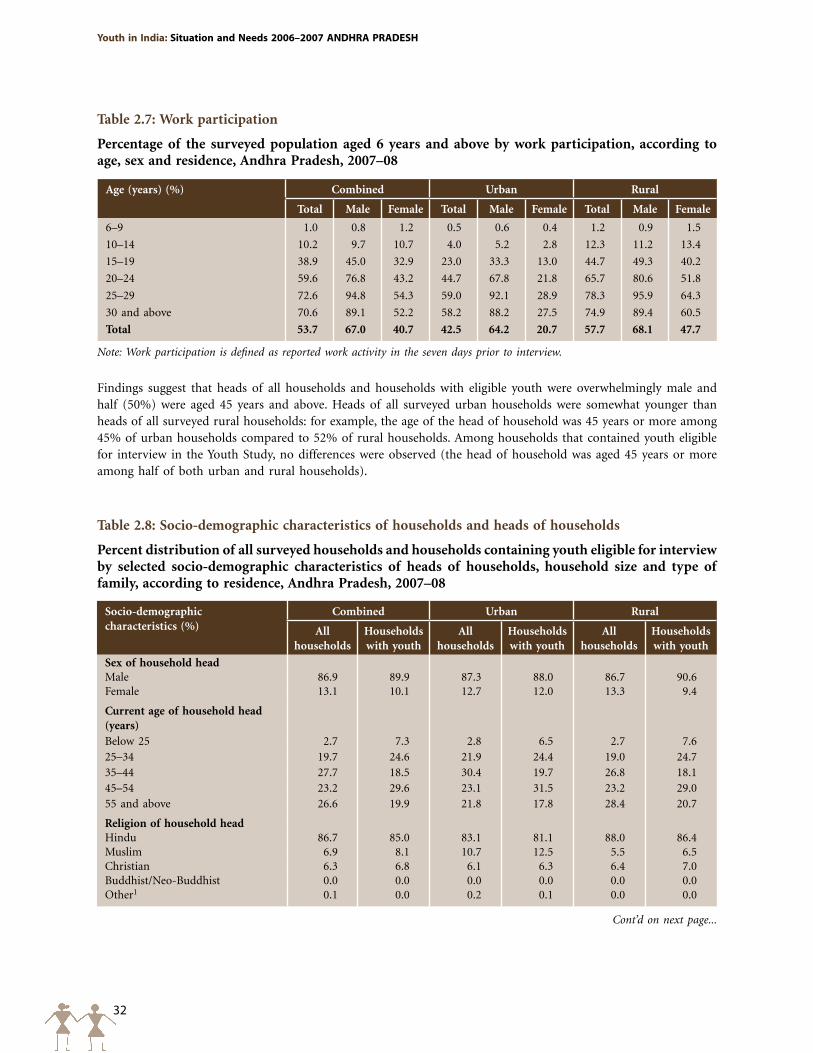
32
Youth in India: Situation and Needs 2006–2007 ANDHRA pRADESH
Cont’d on next page...
Table 2.8: Socio-demographic characteristics of households and heads of households
Percent distribution of all surveyed households and households containing youth eligible for interview by selected socio-demographic characteristics of heads of households, household size and type of family, according to residence, Andhra Pradesh, 2007–08
Socio-demographic characteristics (%)
Combined Urban Rural
All households
Households with youth
All households
Households with youth
All households
Households with youth
Sex of household headMale 86.9 89.9 87.3 88.0 86.7 90.6Female 13.1 10.1 12.7 12.0 13.3 9.4
Current age of household head (years)Below 25 2.7 7.3 2.8 6.5 2.7 7.625–34 19.7 24.6 21.9 24.4 19.0 24.735–44 27.7 18.5 30.4 19.7 26.8 18.145–54 23.2 29.6 23.1 31.5 23.2 29.055 and above 26.6 19.9 21.8 17.8 28.4 20.7
Religion of household headHindu 86.7 85.0 83.1 81.1 88.0 86.4Muslim 6.9 8.1 10.7 12.5 5.5 6.5Christian 6.3 6.8 6.1 6.3 6.4 7.0Buddhist/Neo-Buddhist 0.0 0.0 0.0 0.0 0.0 0.0Other1 0.1 0.0 0.2 0.1 0.0 0.0
Table 2.7: Work participation
Percentage of the surveyed population aged 6 years and above by work participation, according to age, sex and residence, Andhra Pradesh, 2007–08
Age (years) (%) Combined Urban Rural
Total Male Female Total Male Female Total Male Female
6–9 1.0 0.8 1.2 0.5 0.6 0.4 1.2 0.9 1.5
10–14 10.2 9.7 10.7 4.0 5.2 2.8 12.3 11.2 13.4
15–19 38.9 45.0 32.9 23.0 33.3 13.0 44.7 49.3 40.2
20–24 59.6 76.8 43.2 44.7 67.8 21.8 65.7 80.6 51.8
25–29 72.6 94.8 54.3 59.0 92.1 28.9 78.3 95.9 64.3
30 and above 70.6 89.1 52.2 58.2 88.2 27.5 74.9 89.4 60.5
Total 53.7 67.0 40.7 42.5 64.2 20.7 57.7 68.1 47.7
Note: Work participation is defined as reported work activity in the seven days prior to interview.
Findings suggest that heads of all households and households with eligible youth were overwhelmingly male and half (50%) were aged 45 years and above. Heads of all surveyed urban households were somewhat younger than heads of all surveyed rural households: for example, the age of the head of household was 45 years or more among 45% of urban households compared to 52% of rural households. Among households that contained youth eligible for interview in the Youth Study, no differences were observed (the head of household was aged 45 years or more among half of both urban and rural households).
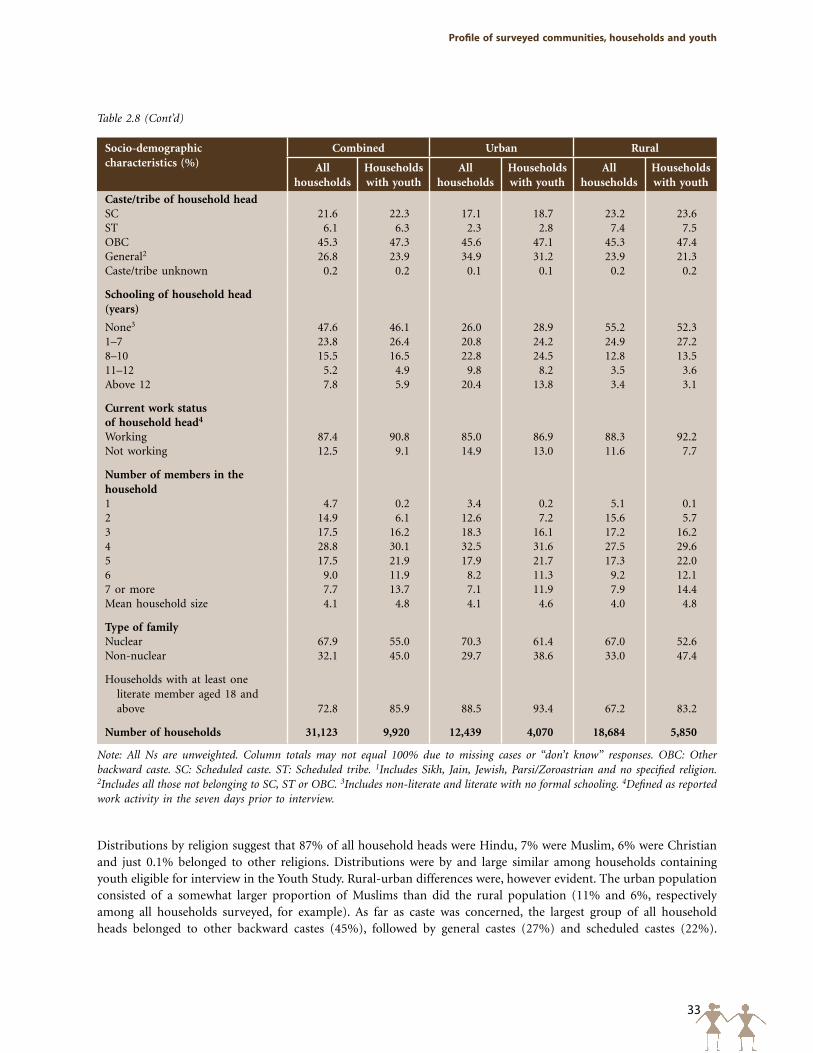
33
profile of surveyed communities, households and youth
Table 2.8 (Cont’d)
Socio-demographic characteristics (%)
Combined Urban Rural
All households
Households with youth
All households
Households with youth
All households
Households with youth
Caste/tribe of household headSC 21.6 22.3 17.1 18.7 23.2 23.6ST 6.1 6.3 2.3 2.8 7.4 7.5OBC 45.3 47.3 45.6 47.1 45.3 47.4General2 26.8 23.9 34.9 31.2 23.9 21.3Caste/tribe unknown 0.2 0.2 0.1 0.1 0.2 0.2
Schooling of household head (years)
None3 47.6 46.1 26.0 28.9 55.2 52.31–7 23.8 26.4 20.8 24.2 24.9 27.28–10 15.5 16.5 22.8 24.5 12.8 13.511–12 5.2 4.9 9.8 8.2 3.5 3.6Above 12 7.8 5.9 20.4 13.8 3.4 3.1
Current work statusof household head4
Working 87.4 90.8 85.0 86.9 88.3 92.2Not working 12.5 9.1 14.9 13.0 11.6 7.7
Number of members in the household1 4.7 0.2 3.4 0.2 5.1 0.12 14.9 6.1 12.6 7.2 15.6 5.73 17.5 16.2 18.3 16.1 17.2 16.24 28.8 30.1 32.5 31.6 27.5 29.65 17.5 21.9 17.9 21.7 17.3 22.06 9.0 11.9 8.2 11.3 9.2 12.17 or more 7.7 13.7 7.1 11.9 7.9 14.4Mean household size 4.1 4.8 4.1 4.6 4.0 4.8
Type of familyNuclear 67.9 55.0 70.3 61.4 67.0 52.6Non-nuclear 32.1 45.0 29.7 38.6 33.0 47.4
Households with at least one literate member aged 18 and above 72.8 85.9 88.5 93.4 67.2 83.2
Number of households 31,123 9,920 12,439 4,070 18,684 5,850
Note: All Ns are unweighted. Column totals may not equal 100% due to missing cases or “don’t know” responses. OBC: Other backward caste. SC: Scheduled caste. ST: Scheduled tribe. 1Includes Sikh, Jain, Jewish, Parsi/Zoroastrian and no specified religion. 2Includes all those not belonging to SC, ST or OBC. 3Includes non-literate and literate with no formal schooling. 4Defined as reported work activity in the seven days prior to interview.
Distributions by religion suggest that 87% of all household heads were Hindu, 7% were Muslim, 6% were Christian and just 0.1% belonged to other religions. Distributions were by and large similar among households containing youth eligible for interview in the Youth Study. Rural-urban differences were, however evident. The urban population consisted of a somewhat larger proportion of Muslims than did the rural population (11% and 6%, respectively among all households surveyed, for example). As far as caste was concerned, the largest group of all household heads belonged to other backward castes (45%), followed by general castes (27%) and scheduled castes (22%).
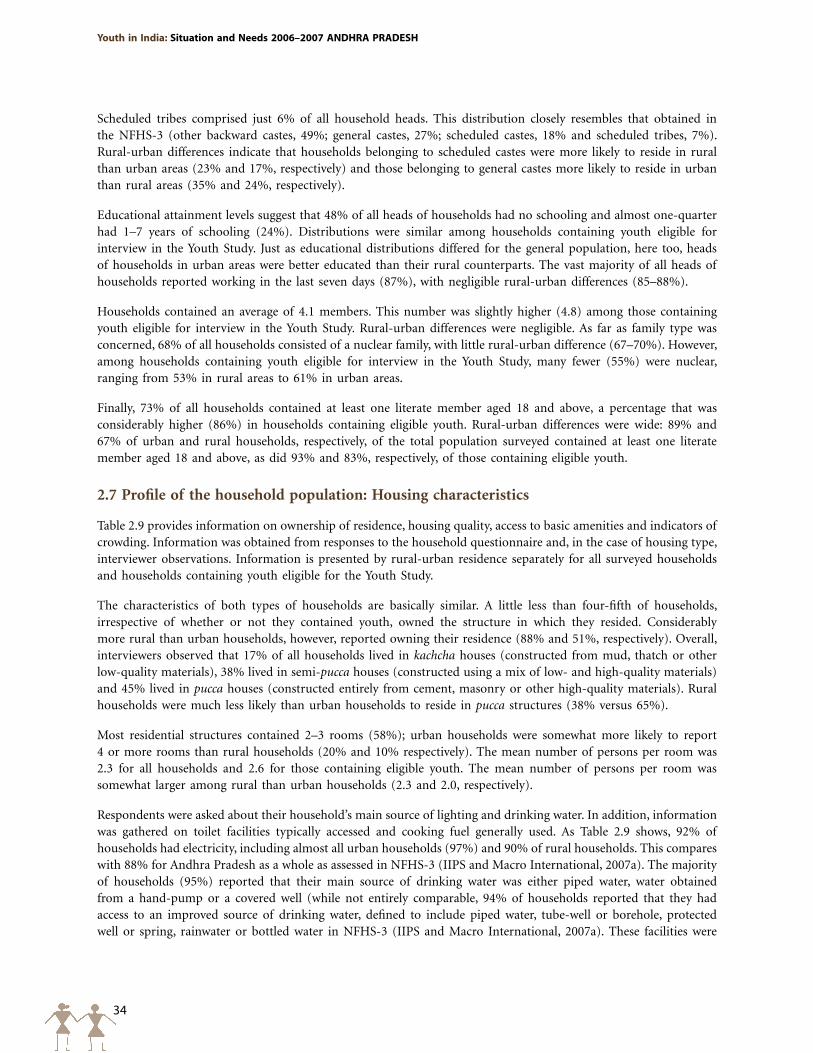
34
Youth in India: Situation and Needs 2006–2007 ANDHRA pRADESH
Scheduled tribes comprised just 6% of all household heads. This distribution closely resembles that obtained in the NFHS-3 (other backward castes, 49%; general castes, 27%; scheduled castes, 18% and scheduled tribes, 7%). Rural-urban differences indicate that households belonging to scheduled castes were more likely to reside in rural than urban areas (23% and 17%, respectively) and those belonging to general castes more likely to reside in urban than rural areas (35% and 24%, respectively).
Educational attainment levels suggest that 48% of all heads of households had no schooling and almost one-quarter had 1–7 years of schooling (24%). Distributions were similar among households containing youth eligible for interview in the Youth Study. Just as educational distributions differed for the general population, here too, heads of households in urban areas were better educated than their rural counterparts. The vast majority of all heads of households reported working in the last seven days (87%), with negligible rural-urban differences (85–88%).
Households contained an average of 4.1 members. This number was slightly higher (4.8) among those containing youth eligible for interview in the Youth Study. Rural-urban differences were negligible. As far as family type was concerned, 68% of all households consisted of a nuclear family, with little rural-urban difference (67–70%). However, among households containing youth eligible for interview in the Youth Study, many fewer (55%) were nuclear, ranging from 53% in rural areas to 61% in urban areas.
Finally, 73% of all households contained at least one literate member aged 18 and above, a percentage that was considerably higher (86%) in households containing eligible youth. Rural-urban differences were wide: 89% and 67% of urban and rural households, respectively, of the total population surveyed contained at least one literate member aged 18 and above, as did 93% and 83%, respectively, of those containing eligible youth.
2.7 Profile of the household population: Housing characteristics
Table 2.9 provides information on ownership of residence, housing quality, access to basic amenities and indicators of crowding. Information was obtained from responses to the household questionnaire and, in the case of housing type, interviewer observations. Information is presented by rural-urban residence separately for all surveyed households and households containing youth eligible for the Youth Study.
The characteristics of both types of households are basically similar. A little less than four-fifth of households, irrespective of whether or not they contained youth, owned the structure in which they resided. Considerably more rural than urban households, however, reported owning their residence (88% and 51%, respectively). Overall, interviewers observed that 17% of all households lived in kachcha houses (constructed from mud, thatch or other low-quality materials), 38% lived in semi-pucca houses (constructed using a mix of low- and high-quality materials) and 45% lived in pucca houses (constructed entirely from cement, masonry or other high-quality materials). Rural households were much less likely than urban households to reside in pucca structures (38% versus 65%).
Most residential structures contained 2–3 rooms (58%); urban households were somewhat more likely to report 4 or more rooms than rural households (20% and 10% respectively). The mean number of persons per room was 2.3 for all households and 2.6 for those containing eligible youth. The mean number of persons per room was somewhat larger among rural than urban households (2.3 and 2.0, respectively).
Respondents were asked about their household’s main source of lighting and drinking water. In addition, information was gathered on toilet facilities typically accessed and cooking fuel generally used. As Table 2.9 shows, 92% of households had electricity, including almost all urban households (97%) and 90% of rural households. This compares with 88% for Andhra Pradesh as a whole as assessed in NFHS-3 (IIPS and Macro International, 2007a). The majority of households (95%) reported that their main source of drinking water was either piped water, water obtained from a hand-pump or a covered well (while not entirely comparable, 94% of households reported that they had access to an improved source of drinking water, defined to include piped water, tube-well or borehole, protected well or spring, rainwater or bottled water in NFHS-3 (IIPS and Macro International, 2007a). These facilities were
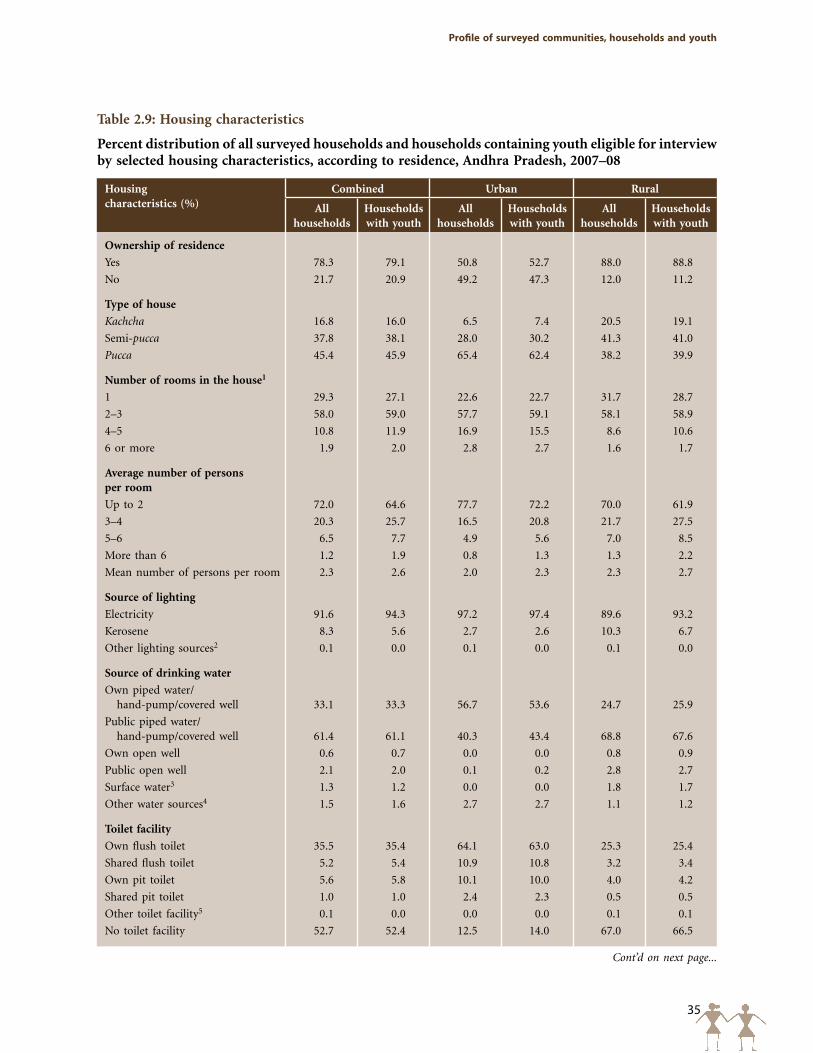
35
profile of surveyed communities, households and youth
Table 2.9: Housing characteristics
Percent distribution of all surveyed households and households containing youth eligible for interview by selected housing characteristics, according to residence, Andhra Pradesh, 2007–08
Housingcharacteristics (%)
Combined Urban Rural
All households
Households with youth
All households
Households with youth
All households
Households with youth
Ownership of residence
Yes 78.3 79.1 50.8 52.7 88.0 88.8
No 21.7 20.9 49.2 47.3 12.0 11.2
Type of house
Kachcha 16.8 16.0 6.5 7.4 20.5 19.1
Semi-pucca 37.8 38.1 28.0 30.2 41.3 41.0
Pucca 45.4 45.9 65.4 62.4 38.2 39.9
Number of rooms in the house1
1 29.3 27.1 22.6 22.7 31.7 28.7
2–3 58.0 59.0 57.7 59.1 58.1 58.9
4–5 10.8 11.9 16.9 15.5 8.6 10.6
6 or more 1.9 2.0 2.8 2.7 1.6 1.7
Average number of persons per room
Up to 2 72.0 64.6 77.7 72.2 70.0 61.9
3–4 20.3 25.7 16.5 20.8 21.7 27.5
5–6 6.5 7.7 4.9 5.6 7.0 8.5
More than 6 1.2 1.9 0.8 1.3 1.3 2.2
Mean number of persons per room 2.3 2.6 2.0 2.3 2.3 2.7
Source of lighting
Electricity 91.6 94.3 97.2 97.4 89.6 93.2
Kerosene 8.3 5.6 2.7 2.6 10.3 6.7
Other lighting sources2 0.1 0.0 0.1 0.0 0.1 0.0
Source of drinking water
Own piped water/ hand-pump/covered well 33.1 33.3 56.7 53.6 24.7 25.9
Public piped water/ hand-pump/covered well 61.4 61.1 40.3 43.4 68.8 67.6
Own open well 0.6 0.7 0.0 0.0 0.8 0.9
Public open well 2.1 2.0 0.1 0.2 2.8 2.7
Surface water3 1.3 1.2 0.0 0.0 1.8 1.7
Other water sources4 1.5 1.6 2.7 2.7 1.1 1.2
Toilet facility
Own flush toilet 35.5 35.4 64.1 63.0 25.3 25.4
Shared flush toilet 5.2 5.4 10.9 10.8 3.2 3.4
Own pit toilet 5.6 5.8 10.1 10.0 4.0 4.2
Shared pit toilet 1.0 1.0 2.4 2.3 0.5 0.5
Other toilet facility5 0.1 0.0 0.0 0.0 0.1 0.1
No toilet facility 52.7 52.4 12.5 14.0 67.0 66.5
Cont’d on next page...
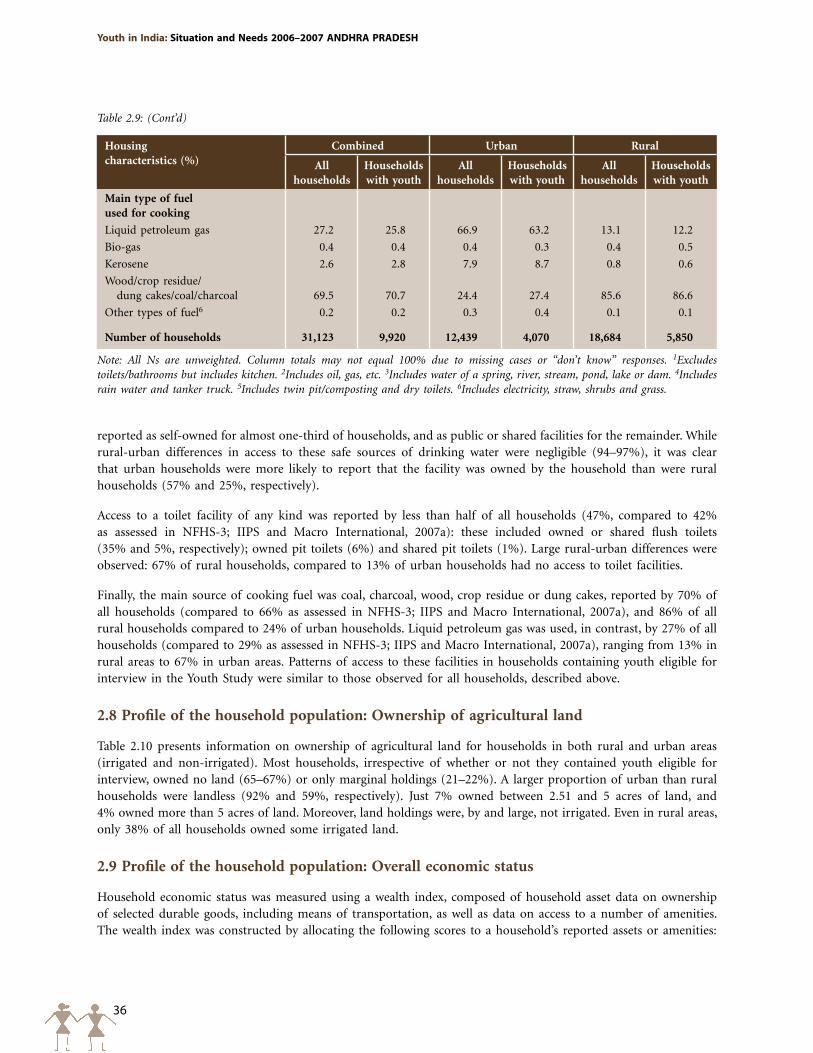
36
Youth in India: Situation and Needs 2006–2007 ANDHRA pRADESH
Housingcharacteristics (%)
Combined Urban Rural
All households
Households with youth
All households
Households with youth
All households
Households with youth
Main type of fuel used for cooking
Liquid petroleum gas 27.2 25.8 66.9 63.2 13.1 12.2
Bio-gas 0.4 0.4 0.4 0.3 0.4 0.5
Kerosene 2.6 2.8 7.9 8.7 0.8 0.6
Wood/crop residue/ dung cakes/coal/charcoal 69.5 70.7 24.4 27.4 85.6 86.6
Other types of fuel6 0.2 0.2 0.3 0.4 0.1 0.1
Number of households 31,123 9,920 12,439 4,070 18,684 5,850
Note: All Ns are unweighted. Column totals may not equal 100% due to missing cases or “don’t know” responses. 1Excludes toilets/bathrooms but includes kitchen. 2Includes oil, gas, etc. 3Includes water of a spring, river, stream, pond, lake or dam. 4Includes rain water and tanker truck. 5Includes twin pit/composting and dry toilets. 6Includes electricity, straw, shrubs and grass.
Table 2.9: (Cont’d)
reported as self-owned for almost one-third of households, and as public or shared facilities for the remainder. While rural-urban differences in access to these safe sources of drinking water were negligible (94–97%), it was clear that urban households were more likely to report that the facility was owned by the household than were rural households (57% and 25%, respectively).
Access to a toilet facility of any kind was reported by less than half of all households (47%, compared to 42% as assessed in NFHS-3; IIPS and Macro International, 2007a): these included owned or shared flush toilets (35% and 5%, respectively); owned pit toilets (6%) and shared pit toilets (1%). Large rural-urban differences were observed: 67% of rural households, compared to 13% of urban households had no access to toilet facilities.
Finally, the main source of cooking fuel was coal, charcoal, wood, crop residue or dung cakes, reported by 70% of all households (compared to 66% as assessed in NFHS-3; IIPS and Macro International, 2007a), and 86% of all rural households compared to 24% of urban households. Liquid petroleum gas was used, in contrast, by 27% of all households (compared to 29% as assessed in NFHS-3; IIPS and Macro International, 2007a), ranging from 13% in rural areas to 67% in urban areas. Patterns of access to these facilities in households containing youth eligible for interview in the Youth Study were similar to those observed for all households, described above.
2.8 Profile of the household population: Ownership of agricultural land
Table 2.10 presents information on ownership of agricultural land for households in both rural and urban areas (irrigated and non-irrigated). Most households, irrespective of whether or not they contained youth eligible for interview, owned no land (65–67%) or only marginal holdings (21–22%). A larger proportion of urban than rural households were landless (92% and 59%, respectively). Just 7% owned between 2.51 and 5 acres of land, and 4% owned more than 5 acres of land. Moreover, land holdings were, by and large, not irrigated. Even in rural areas, only 38% of all households owned some irrigated land.
2.9 Profile of the household population: Overall economic status
Household economic status was measured using a wealth index, composed of household asset data on ownership of selected durable goods, including means of transportation, as well as data on access to a number of amenities. The wealth index was constructed by allocating the following scores to a household’s reported assets or amenities:
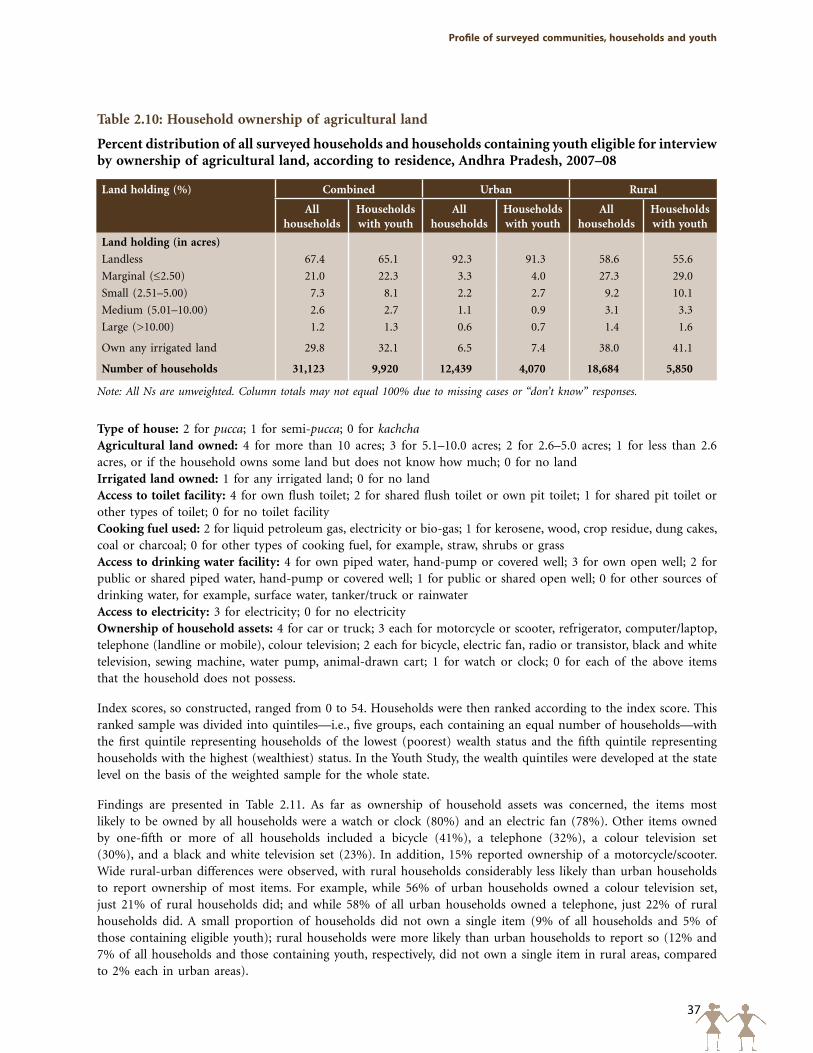
37
profile of surveyed communities, households and youth
Table 2.10: Household ownership of agricultural land
Percent distribution of all surveyed households and households containing youth eligible for interview by ownership of agricultural land, according to residence, Andhra Pradesh, 2007–08
Land holding (%) Combined Urban Rural
All households
Households with youth
All households
Households with youth
All households
Households with youth
Land holding (in acres)
Landless 67.4 65.1 92.3 91.3 58.6 55.6
Marginal (≤2.50) 21.0 22.3 3.3 4.0 27.3 29.0
Small (2.51–5.00) 7.3 8.1 2.2 2.7 9.2 10.1
Medium (5.01–10.00) 2.6 2.7 1.1 0.9 3.1 3.3
Large (>10.00) 1.2 1.3 0.6 0.7 1.4 1.6
Own any irrigated land 29.8 32.1 6.5 7.4 38.0 41.1
Number of households 31,123 9,920 12,439 4,070 18,684 5,850
Note: All Ns are unweighted. Column totals may not equal 100% due to missing cases or “don’t know” responses.
Type of house: 2 for pucca; 1 for semi-pucca; 0 for kachchaAgricultural land owned: 4 for more than 10 acres; 3 for 5.1–10.0 acres; 2 for 2.6–5.0 acres; 1 for less than 2.6 acres, or if the household owns some land but does not know how much; 0 for no landIrrigated land owned: 1 for any irrigated land; 0 for no landAccess to toilet facility: 4 for own flush toilet; 2 for shared flush toilet or own pit toilet; 1 for shared pit toilet or other types of toilet; 0 for no toilet facilityCooking fuel used: 2 for liquid petroleum gas, electricity or bio-gas; 1 for kerosene, wood, crop residue, dung cakes, coal or charcoal; 0 for other types of cooking fuel, for example, straw, shrubs or grassAccess to drinking water facility: 4 for own piped water, hand-pump or covered well; 3 for own open well; 2 for public or shared piped water, hand-pump or covered well; 1 for public or shared open well; 0 for other sources of drinking water, for example, surface water, tanker/truck or rainwaterAccess to electricity: 3 for electricity; 0 for no electricityOwnership of household assets: 4 for car or truck; 3 each for motorcycle or scooter, refrigerator, computer/laptop, telephone (landline or mobile), colour television; 2 each for bicycle, electric fan, radio or transistor, black and white television, sewing machine, water pump, animal-drawn cart; 1 for watch or clock; 0 for each of the above items that the household does not possess.
Index scores, so constructed, ranged from 0 to 54. Households were then ranked according to the index score. This ranked sample was divided into quintiles—i.e., five groups, each containing an equal number of households—with the first quintile representing households of the lowest (poorest) wealth status and the fifth quintile representing households with the highest (wealthiest) status. In the Youth Study, the wealth quintiles were developed at the state level on the basis of the weighted sample for the whole state.
Findings are presented in Table 2.11. As far as ownership of household assets was concerned, the items most likely to be owned by all households were a watch or clock (80%) and an electric fan (78%). Other items owned by one-fifth or more of all households included a bicycle (41%), a telephone (32%), a colour television set (30%), and a black and white television set (23%). In addition, 15% reported ownership of a motorcycle/scooter. Wide rural-urban differences were observed, with rural households considerably less likely than urban households to report ownership of most items. For example, while 56% of urban households owned a colour television set, just 21% of rural households did; and while 58% of all urban households owned a telephone, just 22% of rural households did. A small proportion of households did not own a single item (9% of all households and 5% of those containing eligible youth); rural households were more likely than urban households to report so (12% and 7% of all households and those containing youth, respectively, did not own a single item in rural areas, compared to 2% each in urban areas).
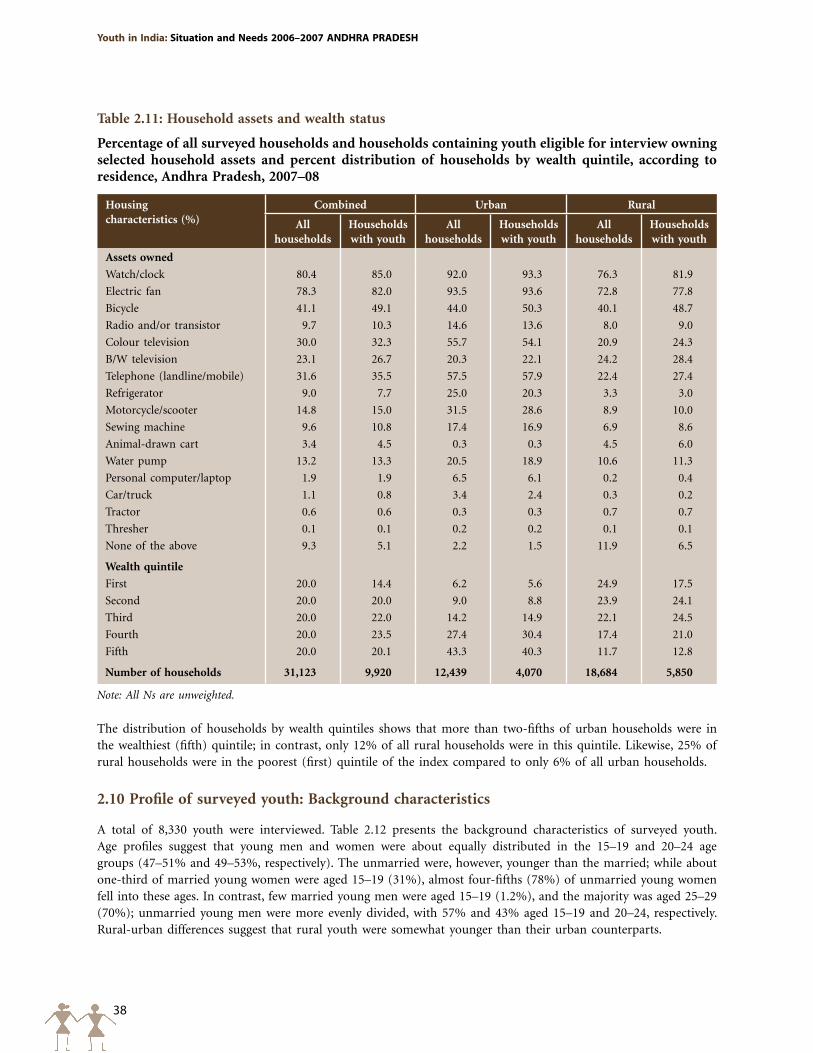
38
Youth in India: Situation and Needs 2006–2007 ANDHRA pRADESH
Table 2.11: Household assets and wealth status
Percentage of all surveyed households and households containing youth eligible for interview owning selected household assets and percent distribution of households by wealth quintile, according to residence, Andhra Pradesh, 2007–08
Housing characteristics (%)
Combined Urban Rural
All households
Households with youth
All households
Households with youth
All households
Households with youth
Assets owned
Watch/clock 80.4 85.0 92.0 93.3 76.3 81.9
Electric fan 78.3 82.0 93.5 93.6 72.8 77.8
Bicycle 41.1 49.1 44.0 50.3 40.1 48.7
Radio and/or transistor 9.7 10.3 14.6 13.6 8.0 9.0
Colour television 30.0 32.3 55.7 54.1 20.9 24.3
B/W television 23.1 26.7 20.3 22.1 24.2 28.4
Telephone (landline/mobile) 31.6 35.5 57.5 57.9 22.4 27.4
Refrigerator 9.0 7.7 25.0 20.3 3.3 3.0
Motorcycle/scooter 14.8 15.0 31.5 28.6 8.9 10.0
Sewing machine 9.6 10.8 17.4 16.9 6.9 8.6
Animal-drawn cart 3.4 4.5 0.3 0.3 4.5 6.0
Water pump 13.2 13.3 20.5 18.9 10.6 11.3
Personal computer/laptop 1.9 1.9 6.5 6.1 0.2 0.4
Car/truck 1.1 0.8 3.4 2.4 0.3 0.2
Tractor 0.6 0.6 0.3 0.3 0.7 0.7
Thresher 0.1 0.1 0.2 0.2 0.1 0.1
None of the above 9.3 5.1 2.2 1.5 11.9 6.5
Wealth quintile
First 20.0 14.4 6.2 5.6 24.9 17.5
Second 20.0 20.0 9.0 8.8 23.9 24.1
Third 20.0 22.0 14.2 14.9 22.1 24.5
Fourth 20.0 23.5 27.4 30.4 17.4 21.0
Fifth 20.0 20.1 43.3 40.3 11.7 12.8
Number of households 31,123 9,920 12,439 4,070 18,684 5,850
Note: All Ns are unweighted.
The distribution of households by wealth quintiles shows that more than two-fifths of urban households were in the wealthiest (fifth) quintile; in contrast, only 12% of all rural households were in this quintile. Likewise, 25% of rural households were in the poorest (first) quintile of the index compared to only 6% of all urban households.
2.10 Profile of surveyed youth: Background characteristics
A total of 8,330 youth were interviewed. Table 2.12 presents the background characteristics of surveyed youth. Age profiles suggest that young men and women were about equally distributed in the 15–19 and 20–24 age groups (47–51% and 49–53%, respectively). The unmarried were, however, younger than the married; while about one-third of married young women were aged 15–19 (31%), almost four-fifths (78%) of unmarried young women fell into these ages. In contrast, few married young men were aged 15–19 (1.2%), and the majority was aged 25–29 (70%); unmarried young men were more evenly divided, with 57% and 43% aged 15–19 and 20–24, respectively. Rural-urban differences suggest that rural youth were somewhat younger than their urban counterparts.
39
profile of surveyed communities, households and youth
The distribution of youth by religion and caste was fairly similar to that observed in the household population: 84–85% of youth were Hindu, 7–10% were Muslim and 5–8% were Christian. While no differences were evident by marital status, rural-urban differences suggest that youth in urban areas were somewhat less likely than their rural counterparts to be Hindu (80–81% versus 86%) and conversely, more likely to be Muslim (12–14% versus 5–8%).
Caste-wise distributions were similar among young men and women, with 24–25% of youth falling into general castes, 22–23% into scheduled castes, 6% into scheduled tribes and 46–49% into other backward castes. Distributions by marital status show that more unmarried than married youth belonged to general castes (27% versus 20–21%). Rural-urban differences were also evident; urban youth were more likely than rural youth to belong to general castes (30–31% versus 21–22%); conversely young men in urban areas were less likely to belong to scheduled castes (16% versus 25%).
Educational distributions suggest that youth were better educated than the population at large. In total, 8% of young men and 21% of young women had no formal education (compared to 29% and 47%, respectively, of the total population described in Table 2.6) and 23% of young men and 14% of young women had 12 or more years of education (compared to 14% and 7% of the total population). As can be seen from the above, gender differences were evident, with young women more likely than young men to be concentrated among the uneducated or poorly educated. This difference is attributable to differences observed primarily among the married. Differences were also evident by marital status and rural-urban residence. Among married youth for example, 21% of young men and 31% of young women had no formal education, and 14% and 7%, respectively had attained 12 or more years of education. The unmarried were typically better educated than the married—5% of young men and 7% of young women had no formal education and 26% and 24%, respectively, had more than 12 years of education. Urban youth were generally better educated than rural youth: for example, 5% of young men and 10% of young women in urban areas had no formal education compared to 9% and 25% of rural youth, respectively. Similarly, 32% and 28% of urban young men and women had completed 12 or more years of education compared to 19% and 9% of rural youth, respectively.
Gender differences were wide with regard to work status: 73% of young men compared to 47% of young women had ever worked in paid or unpaid activities in the 12 months preceding the interview. Married youth were typically more likely to be engaged in work activities than the unmarried: while almost all married young men had worked in the year preceding the interview, 67% of unmarried young men had done so, and among young women, correspondingly, 51% and 44% reported so. Also evident was that more rural than urban youth were engaged in work activities and that gender differences were narrower in rural than urban areas: 76% of young men and 57% of young women in rural areas were engaged in work activites compared to 65% and 25%, respectively, in urban areas.
Household economic status distributions, as measured by wealth quintiles, suggest that young men were somewhat less likely than young women to belong to households in the poorer (first and second) quintiles (30% versus 36%), and somewhat more likely than young women to belong to households in the wealthier (fourth and fifth) quintiles (49% versus 42%). Likewise, the married were more likely than the unmarried to belong to households in the poorer quintiles (34–41% versus 28–30%) and conversely, less likely to fall into households in the wealthier quintiles (35–43% versus 49–51%). Rural-urban differences were wide, with rural youth more likely than their urban counterparts to belong to households in the poorer quintiles; conversely, more urban than rural youth belonged to households in the wealthiest quintiles.
2.11 Profile of surveyed youth: Parental characteristics
The Youth Study inquired about the characteristics of respondents’ parents, including their survival status, education and occupation. Four in five respondents reported that both parents were surviving (Table 2.13). Fewer married than unmarried youth reported that both parents were surviving (71–77% and 84–85%, respectively).
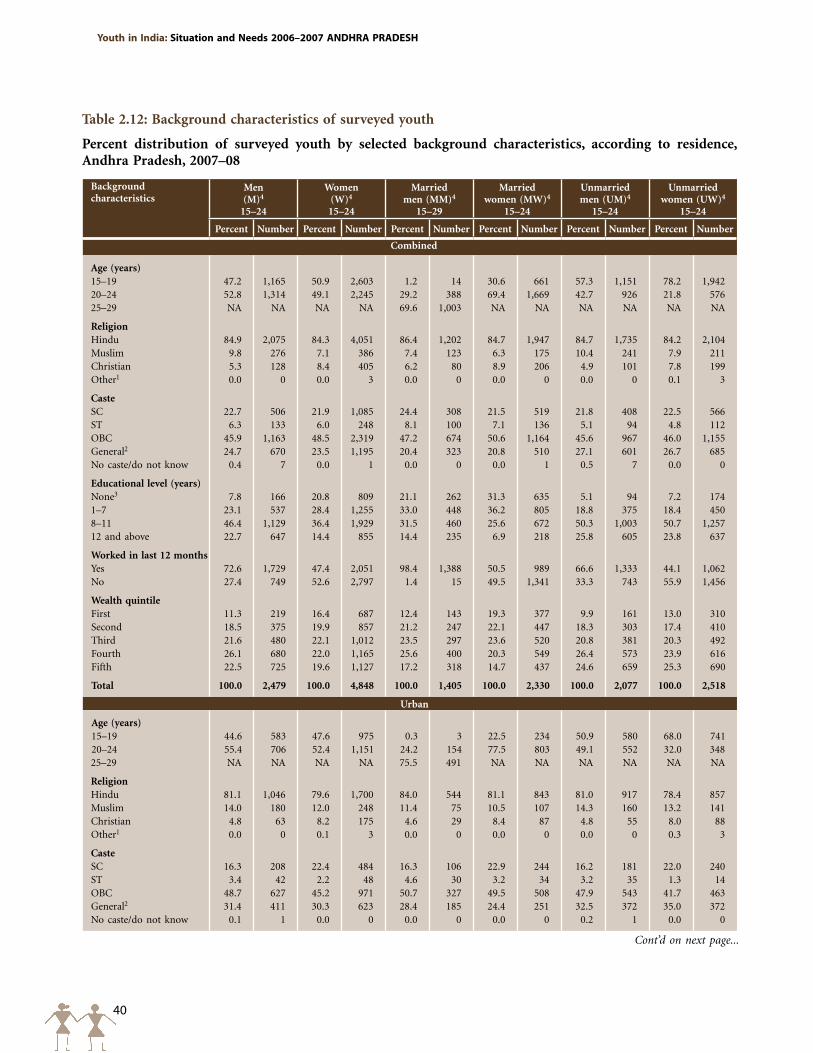
40
Youth in India: Situation and Needs 2006–2007 ANDHRA pRADESH
Table 2.12: Background characteristics of surveyed youth
Percent distribution of surveyed youth by selected background characteristics, according to residence, Andhra Pradesh, 2007–08
Background characteristics
Men (M)4
15–24
Women (W)4
15–24
Married men (MM)4
15–29
Married women (MW)4
15–24
Unmarried men (UM)4
15–24
Unmarried women (UW)4
15–24
Percent Number Percent Number Percent Number Percent Number Percent Number Percent Number
Combined
Age (years)15–19 47.2 1,165 50.9 2,603 1.2 14 30.6 661 57.3 1,151 78.2 1,94220–24 52.8 1,314 49.1 2,245 29.2 388 69.4 1,669 42.7 926 21.8 57625–29 NA NA NA NA 69.6 1,003 NA NA NA NA NA NA
ReligionHindu 84.9 2,075 84.3 4,051 86.4 1,202 84.7 1,947 84.7 1,735 84.2 2,104Muslim 9.8 276 7.1 386 7.4 123 6.3 175 10.4 241 7.9 211Christian 5.3 128 8.4 405 6.2 80 8.9 206 4.9 101 7.8 199Other1 0.0 0 0.0 3 0.0 0 0.0 0 0.0 0 0.1 3
CasteSC 22.7 506 21.9 1,085 24.4 308 21.5 519 21.8 408 22.5 566ST 6.3 133 6.0 248 8.1 100 7.1 136 5.1 94 4.8 112OBC 45.9 1,163 48.5 2,319 47.2 674 50.6 1,164 45.6 967 46.0 1,155General2 24.7 670 23.5 1,195 20.4 323 20.8 510 27.1 601 26.7 685No caste/do not know 0.4 7 0.0 1 0.0 0 0.0 1 0.5 7 0.0 0
Educational level (years)None3 7.8 166 20.8 809 21.1 262 31.3 635 5.1 94 7.2 1741–7 23.1 537 28.4 1,255 33.0 448 36.2 805 18.8 375 18.4 4508–11 46.4 1,129 36.4 1,929 31.5 460 25.6 672 50.3 1,003 50.7 1,25712 and above 22.7 647 14.4 855 14.4 235 6.9 218 25.8 605 23.8 637
Worked in last 12 monthsYes 72.6 1,729 47.4 2,051 98.4 1,388 50.5 989 66.6 1,333 44.1 1,062No 27.4 749 52.6 2,797 1.4 15 49.5 1,341 33.3 743 55.9 1,456
Wealth quintileFirst 11.3 219 16.4 687 12.4 143 19.3 377 9.9 161 13.0 310Second 18.5 375 19.9 857 21.2 247 22.1 447 18.3 303 17.4 410Third 21.6 480 22.1 1,012 23.5 297 23.6 520 20.8 381 20.3 492Fourth 26.1 680 22.0 1,165 25.6 400 20.3 549 26.4 573 23.9 616Fifth 22.5 725 19.6 1,127 17.2 318 14.7 437 24.6 659 25.3 690
Total 100.0 2,479 100.0 4,848 100.0 1,405 100.0 2,330 100.0 2,077 100.0 2,518
Urban
Age (years)
15–19 44.6 583 47.6 975 0.3 3 22.5 234 50.9 580 68.0 74120–24 55.4 706 52.4 1,151 24.2 154 77.5 803 49.1 552 32.0 34825–29 NA NA NA NA 75.5 491 NA NA NA NA NA NA
ReligionHindu 81.1 1,046 79.6 1,700 84.0 544 81.1 843 81.0 917 78.4 857Muslim 14.0 180 12.0 248 11.4 75 10.5 107 14.3 160 13.2 141Christian 4.8 63 8.2 175 4.6 29 8.4 87 4.8 55 8.0 88Other1 0.0 0 0.1 3 0.0 0 0.0 0 0.0 0 0.3 3
CasteSC 16.3 208 22.4 484 16.3 106 22.9 244 16.2 181 22.0 240ST 3.4 42 2.2 48 4.6 30 3.2 34 3.2 35 1.3 14OBC 48.7 627 45.2 971 50.7 327 49.5 508 47.9 543 41.7 463General2 31.4 411 30.3 623 28.4 185 24.4 251 32.5 372 35.0 372No caste/do not know 0.1 1 0.0 0 0.0 0 0.0 0 0.2 1 0.0 0
Cont’d on next page...
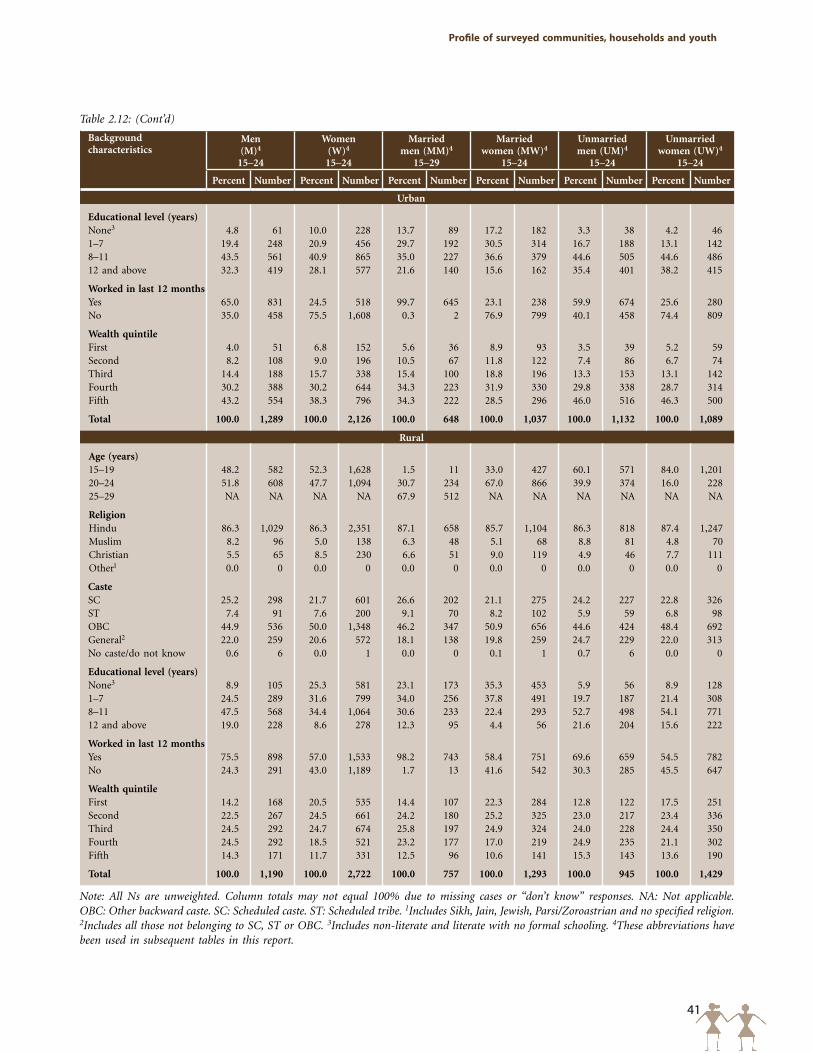
41
profile of surveyed communities, households and youth
Background characteristics
Men (M)4
15–24
Women (W)4
15–24
Married men (MM)4
15–29
Married women (MW)4
15–24
Unmarried men (UM)4
15–24
Unmarried women (UW)4
15–24
Percent Number Percent Number Percent Number Percent Number Percent Number Percent Number
Urban
Educational level (years)None3 4.8 61 10.0 228 13.7 89 17.2 182 3.3 38 4.2 461–7 19.4 248 20.9 456 29.7 192 30.5 314 16.7 188 13.1 1428–11 43.5 561 40.9 865 35.0 227 36.6 379 44.6 505 44.6 48612 and above 32.3 419 28.1 577 21.6 140 15.6 162 35.4 401 38.2 415
Worked in last 12 monthsYes 65.0 831 24.5 518 99.7 645 23.1 238 59.9 674 25.6 280No 35.0 458 75.5 1,608 0.3 2 76.9 799 40.1 458 74.4 809
Wealth quintileFirst 4.0 51 6.8 152 5.6 36 8.9 93 3.5 39 5.2 59Second 8.2 108 9.0 196 10.5 67 11.8 122 7.4 86 6.7 74Third 14.4 188 15.7 338 15.4 100 18.8 196 13.3 153 13.1 142Fourth 30.2 388 30.2 644 34.3 223 31.9 330 29.8 338 28.7 314Fifth 43.2 554 38.3 796 34.3 222 28.5 296 46.0 516 46.3 500
Total 100.0 1,289 100.0 2,126 100.0 648 100.0 1,037 100.0 1,132 100.0 1,089
Rural
Age (years)15–19 48.2 582 52.3 1,628 1.5 11 33.0 427 60.1 571 84.0 1,20120–24 51.8 608 47.7 1,094 30.7 234 67.0 866 39.9 374 16.0 22825–29 NA NA NA NA 67.9 512 NA NA NA NA NA NA
ReligionHindu 86.3 1,029 86.3 2,351 87.1 658 85.7 1,104 86.3 818 87.4 1,247Muslim 8.2 96 5.0 138 6.3 48 5.1 68 8.8 81 4.8 70Christian 5.5 65 8.5 230 6.6 51 9.0 119 4.9 46 7.7 111Other1 0.0 0 0.0 0 0.0 0 0.0 0 0.0 0 0.0 0
CasteSC 25.2 298 21.7 601 26.6 202 21.1 275 24.2 227 22.8 326ST 7.4 91 7.6 200 9.1 70 8.2 102 5.9 59 6.8 98OBC 44.9 536 50.0 1,348 46.2 347 50.9 656 44.6 424 48.4 692General2 22.0 259 20.6 572 18.1 138 19.8 259 24.7 229 22.0 313No caste/do not know 0.6 6 0.0 1 0.0 0 0.1 1 0.7 6 0.0 0
Educational level (years)None3 8.9 105 25.3 581 23.1 173 35.3 453 5.9 56 8.9 1281–7 24.5 289 31.6 799 34.0 256 37.8 491 19.7 187 21.4 3088–11 47.5 568 34.4 1,064 30.6 233 22.4 293 52.7 498 54.1 77112 and above 19.0 228 8.6 278 12.3 95 4.4 56 21.6 204 15.6 222
Worked in last 12 monthsYes 75.5 898 57.0 1,533 98.2 743 58.4 751 69.6 659 54.5 782No 24.3 291 43.0 1,189 1.7 13 41.6 542 30.3 285 45.5 647
Wealth quintileFirst 14.2 168 20.5 535 14.4 107 22.3 284 12.8 122 17.5 251Second 22.5 267 24.5 661 24.2 180 25.2 325 23.0 217 23.4 336Third 24.5 292 24.7 674 25.8 197 24.9 324 24.0 228 24.4 350Fourth 24.5 292 18.5 521 23.2 177 17.0 219 24.9 235 21.1 302Fifth 14.3 171 11.7 331 12.5 96 10.6 141 15.3 143 13.6 190
Total 100.0 1,190 100.0 2,722 100.0 757 100.0 1,293 100.0 945 100.0 1,429
Note: All Ns are unweighted. Column totals may not equal 100% due to missing cases or “don’t know” responses. NA: Not applicable. OBC: Other backward caste. SC: Scheduled caste. ST: Scheduled tribe. 1Includes Sikh, Jain, Jewish, Parsi/Zoroastrian and no specified religion. 2Includes all those not belonging to SC, ST or OBC. 3Includes non-literate and literate with no formal schooling. 4These abbreviations have been used in subsequent tables in this report.
Table 2.12: (Cont’d)
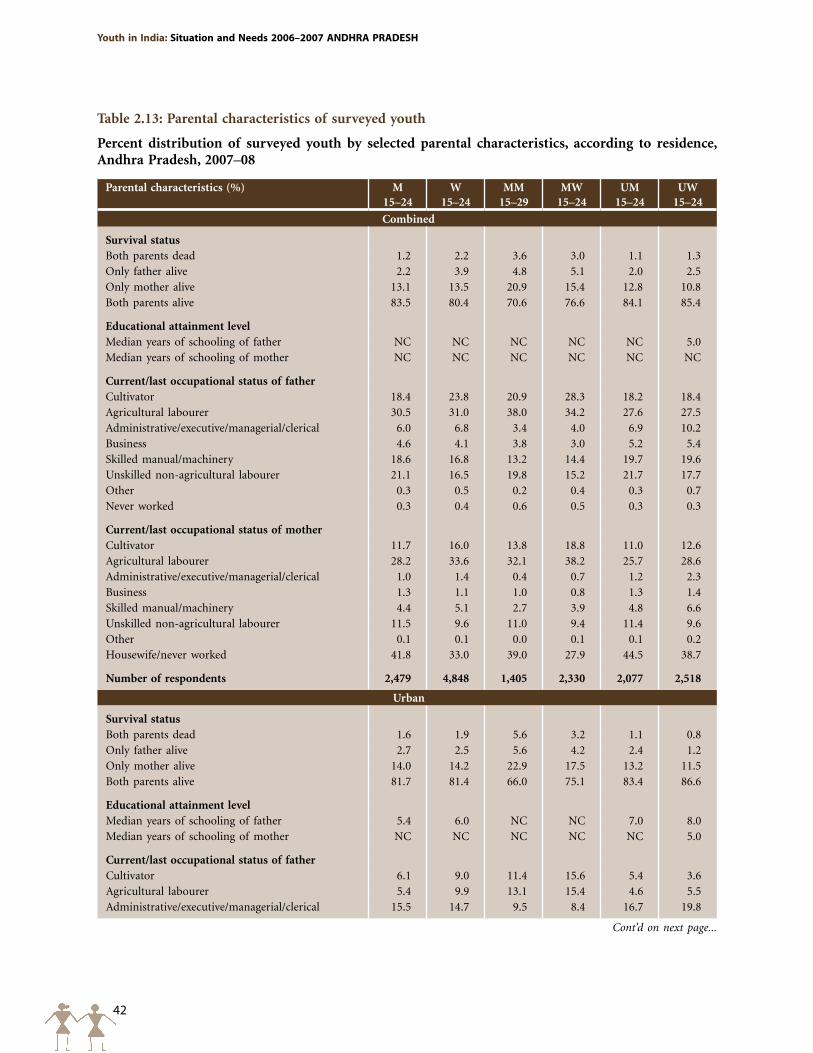
42
Youth in India: Situation and Needs 2006–2007 ANDHRA pRADESH
Table 2.13: Parental characteristics of surveyed youth
Percent distribution of surveyed youth by selected parental characteristics, according to residence, Andhra Pradesh, 2007–08
Parental characteristics (%) M15–24
W15–24
MM15–29
MW15–24
UM15–24
UW15–24
Combined
Survival statusBoth parents dead 1.2 2.2 3.6 3.0 1.1 1.3Only father alive 2.2 3.9 4.8 5.1 2.0 2.5Only mother alive 13.1 13.5 20.9 15.4 12.8 10.8Both parents alive 83.5 80.4 70.6 76.6 84.1 85.4
Educational attainment levelMedian years of schooling of father NC NC NC NC NC 5.0Median years of schooling of mother NC NC NC NC NC NC
Current/last occupational status of fatherCultivator 18.4 23.8 20.9 28.3 18.2 18.4Agricultural labourer 30.5 31.0 38.0 34.2 27.6 27.5Administrative/executive/managerial/clerical 6.0 6.8 3.4 4.0 6.9 10.2Business 4.6 4.1 3.8 3.0 5.2 5.4Skilled manual/machinery 18.6 16.8 13.2 14.4 19.7 19.6Unskilled non-agricultural labourer 21.1 16.5 19.8 15.2 21.7 17.7Other 0.3 0.5 0.2 0.4 0.3 0.7Never worked 0.3 0.4 0.6 0.5 0.3 0.3
Current/last occupational status of motherCultivator 11.7 16.0 13.8 18.8 11.0 12.6Agricultural labourer 28.2 33.6 32.1 38.2 25.7 28.6Administrative/executive/managerial/clerical 1.0 1.4 0.4 0.7 1.2 2.3Business 1.3 1.1 1.0 0.8 1.3 1.4Skilled manual/machinery 4.4 5.1 2.7 3.9 4.8 6.6Unskilled non-agricultural labourer 11.5 9.6 11.0 9.4 11.4 9.6Other 0.1 0.1 0.0 0.1 0.1 0.2Housewife/never worked 41.8 33.0 39.0 27.9 44.5 38.7
Number of respondents 2,479 4,848 1,405 2,330 2,077 2,518
Urban
Survival statusBoth parents dead 1.6 1.9 5.6 3.2 1.1 0.8Only father alive 2.7 2.5 5.6 4.2 2.4 1.2Only mother alive 14.0 14.2 22.9 17.5 13.2 11.5Both parents alive 81.7 81.4 66.0 75.1 83.4 86.6
Educational attainment levelMedian years of schooling of father 5.4 6.0 NC NC 7.0 8.0Median years of schooling of mother NC NC NC NC NC 5.0
Current/last occupational status of fatherCultivator 6.1 9.0 11.4 15.6 5.4 3.6Agricultural labourer 5.4 9.9 13.1 15.4 4.6 5.5Administrative/executive/managerial/clerical 15.5 14.7 9.5 8.4 16.7 19.8
Cont’d on next page...
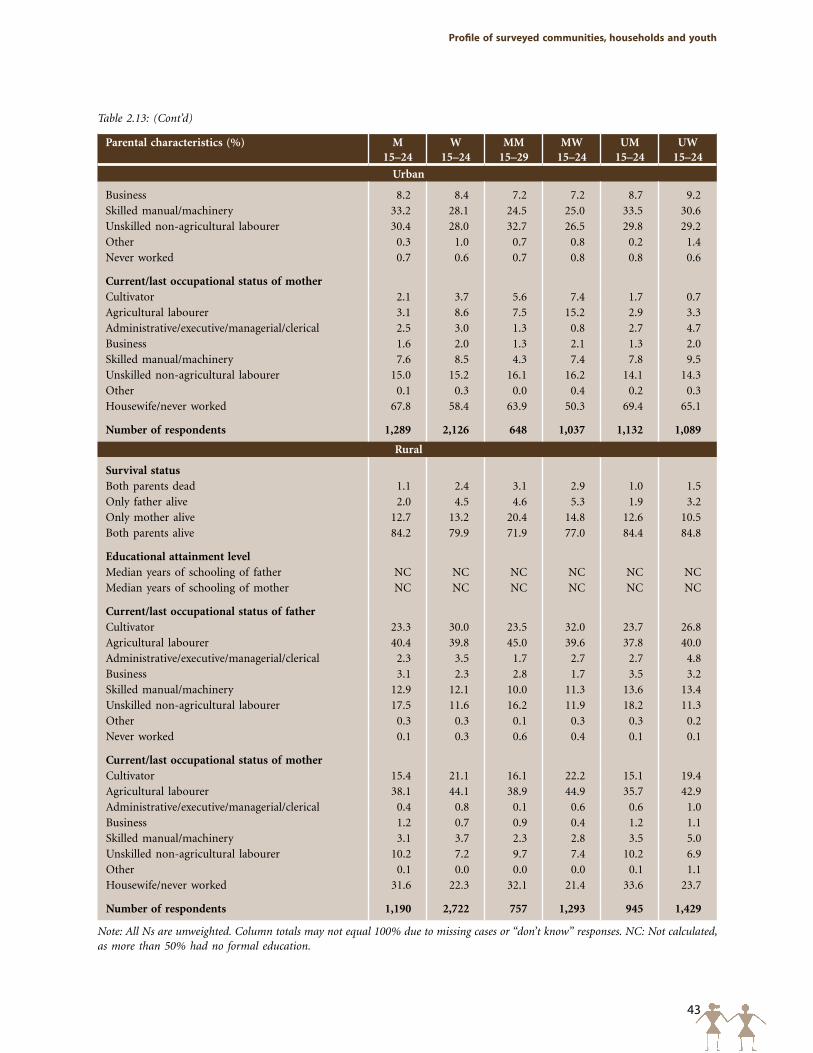
43
profile of surveyed communities, households and youth
Parental characteristics (%) M15–24
W15–24
MM15–29
MW15–24
UM15–24
UW15–24
Urban
Business 8.2 8.4 7.2 7.2 8.7 9.2Skilled manual/machinery 33.2 28.1 24.5 25.0 33.5 30.6Unskilled non-agricultural labourer 30.4 28.0 32.7 26.5 29.8 29.2Other 0.3 1.0 0.7 0.8 0.2 1.4Never worked 0.7 0.6 0.7 0.8 0.8 0.6
Current/last occupational status of motherCultivator 2.1 3.7 5.6 7.4 1.7 0.7Agricultural labourer 3.1 8.6 7.5 15.2 2.9 3.3Administrative/executive/managerial/clerical 2.5 3.0 1.3 0.8 2.7 4.7Business 1.6 2.0 1.3 2.1 1.3 2.0Skilled manual/machinery 7.6 8.5 4.3 7.4 7.8 9.5Unskilled non-agricultural labourer 15.0 15.2 16.1 16.2 14.1 14.3Other 0.1 0.3 0.0 0.4 0.2 0.3Housewife/never worked 67.8 58.4 63.9 50.3 69.4 65.1
Number of respondents 1,289 2,126 648 1,037 1,132 1,089
Rural
Survival statusBoth parents dead 1.1 2.4 3.1 2.9 1.0 1.5Only father alive 2.0 4.5 4.6 5.3 1.9 3.2Only mother alive 12.7 13.2 20.4 14.8 12.6 10.5Both parents alive 84.2 79.9 71.9 77.0 84.4 84.8
Educational attainment levelMedian years of schooling of father NC NC NC NC NC NCMedian years of schooling of mother NC NC NC NC NC NC
Current/last occupational status of fatherCultivator 23.3 30.0 23.5 32.0 23.7 26.8Agricultural labourer 40.4 39.8 45.0 39.6 37.8 40.0Administrative/executive/managerial/clerical 2.3 3.5 1.7 2.7 2.7 4.8Business 3.1 2.3 2.8 1.7 3.5 3.2Skilled manual/machinery 12.9 12.1 10.0 11.3 13.6 13.4Unskilled non-agricultural labourer 17.5 11.6 16.2 11.9 18.2 11.3Other 0.3 0.3 0.1 0.3 0.3 0.2Never worked 0.1 0.3 0.6 0.4 0.1 0.1
Current/last occupational status of motherCultivator 15.4 21.1 16.1 22.2 15.1 19.4Agricultural labourer 38.1 44.1 38.9 44.9 35.7 42.9Administrative/executive/managerial/clerical 0.4 0.8 0.1 0.6 0.6 1.0Business 1.2 0.7 0.9 0.4 1.2 1.1Skilled manual/machinery 3.1 3.7 2.3 2.8 3.5 5.0Unskilled non-agricultural labourer 10.2 7.2 9.7 7.4 10.2 6.9Other 0.1 0.0 0.0 0.0 0.1 1.1Housewife/never worked 31.6 22.3 32.1 21.4 33.6 23.7
Number of respondents 1,190 2,722 757 1,293 945 1,429
Note: All Ns are unweighted. Column totals may not equal 100% due to missing cases or “don’t know” responses. NC: Not calculated, as more than 50% had no formal education.
Table 2.13: (Cont’d)
44
Youth in India: Situation and Needs 2006–2007 ANDHRA pRADESH
The finding that married young men were less likely than both married young women and unmarried youth to report that both parents were living is likely a function of the fact that married young men in our sample were older than other youth. Rural-urban differences were generally narrow. For those with just one parent surviving, this parent was more likely to be the mother (13–14%) than the father (2–4%). Finally, 1–2% of youth reported that neither parent was alive.
Parents’ educational attainment was considerably lower than that of youth respondents. Indeed, the parents of more than half of both young men and women had never been to school. The only exception was fathers of unmarried young women, who typically had 5 years of education. Rural-urban differences in educational attainment were wide as far as father’s educational attainment levels were concerned; fathers of over half of rural youth had never been to school and fathers of urban young men and women had 5 and 6 years of schooling, respectively (7–8 years among fathers of the unmarried youth). Other rural-urban differences were not observed.
The Youth Study also inquired about the current or last main occupation of respondents’ parents. Distributions of occupational status suggest that fathers of 18% and 24% of young men and women, respectively, were working on their own farms, compared to mothers of 12% and 16%, respectively, of young men and women. In contrast, 31% of fathers and 28–34% of mothers were agricultural labourers; 17–19% of fathers and 4–5% of mothers were engaged in skilled manual occupations; and 17–21% of fathers and 10–12% of mothers were unskilled non-agricultural labourers. Few parents reported administrative, executive, managerial or clerical occupations (6–7% of fathers and 1% of mothers); few, likewise, reported that they were doing their own business (4–5% of fathers and 1% of mothers). Finally, mothers of 42% and 33% of young men and women, respectively, were housewives; just a handful of fathers (less than 1%) had never worked. Differences by marital status were evident. Fathers of married youth were more likely to have been engaged in agricultural activities and less likely to have been engaged in skilled manual or administrative, executive, managerial or clerical occupations than were fathers of unmarried youth. Mothers of the married were similarly more likely than mothers of the unmarried to have been engaged in agricultural activities, and conversely, mothers of the unmarried were more likely to be housewives. Rural-urban differences were evident. While rural parents were largely cultivators and agricultural labourers, urban parents were more likely than their rural counterparts to be concentrated in skilled manual occupations and unskilled non-agricultural activities. Additionally, urban fathers were more likely than rural fathers to be engaged in administrative, managerial or clerical occupations, and urban mothers were more likely than rural mothers to be engaged in housework.
45
Education
Young people in India are spending more of their adolescent years acquiring an education than ever before. Educational attainment levels have increased, the percentage that has never been to school has declined and gender differences in educational attainment levels have diminished (Office of the Registrar General and Census Commissioner, 2001a). This does not mean, however, that schooling is universal or that gender differences are no longer a concern. Attainment of primary school education is still far from universal, especially among girls. Differences by caste, religion, region and poverty levels persist; and the quality of education varies widely for different sub-groups of youth. This chapter examines the schooling experiences of youth in terms of educational attainment, reasons for school non-attendance or discontinuation, quality of schools and colleges attended and schooling experiences.
3.1 Educational attainment
The Youth Study obtained information on whether the respondent had ever been to school and, if so, the number of years of schooling successfully completed. Current schooling status was also assessed and a Life Event Calendar inquired about the schooling status of all respondents from the age of 12. Findings are presented in Table 3.1.
Findings highlight that schooling was far from universal among young people, particularly among young women in Andhra Pradesh: 8% of young men and 21% of young women had never been to school. Wide differences by marital status were evident: 5% of unmarried young men compared to 21% of married young men had no formal education. The corresponding difference among young women was much wider: 7% of unmarried young women compared to 31% of married young women had never been to school. As expected, a larger percentage of rural than urban youth—particularly young women—had never attended school; indeed, one quarter of young women in rural areas, compared to 10% of those in urban areas had never been to school.
Educational attainment levels of young people also reconfirm differences by sex, marital status and rural-urban residence. Young men, on average, had 2 more years of schooling than young women (10 versus 8); however, gender differences were not observed among the unmarried, among whom both young men and women had attained 10 years of schooling. Differences by marital status were evident, with unmarried young men attaining 3 more years of education than their married counterparts (10 versus 7); and unmarried young women attaining 5 more years of education than their married counterparts (10 versus 5). Rural-urban differences suggest that urban young men typically had 1 more year of schooling than their rural counterparts (10 versus 9); the corresponding difference among young women was 3 years (10 versus 7).
Similar patterns were evident in terms of the proportion who had completed high school (Class 10). Young men were more likely than young women to have completed high school (52% versus 36%). However, this gender difference was observed only among the married; about equal proportions of unmarried young men and women had completed high school (56–57%). Married youth were considerably less likely to have completed high school than the unmarried (31% and 57%, respectively, among young men; 21% and 56%, respectively, among young women). We note that disparities by marital status may be wider than what is reflected here because the unmarried were younger and more likely to be pursuing their education at the time of the interview. Finally, rural youth were considerably less likely to have completed high school than urban youth (49% and 59%, respectively, among young men; 29% and 53% among young women, respectively).
Chapter 3
Education
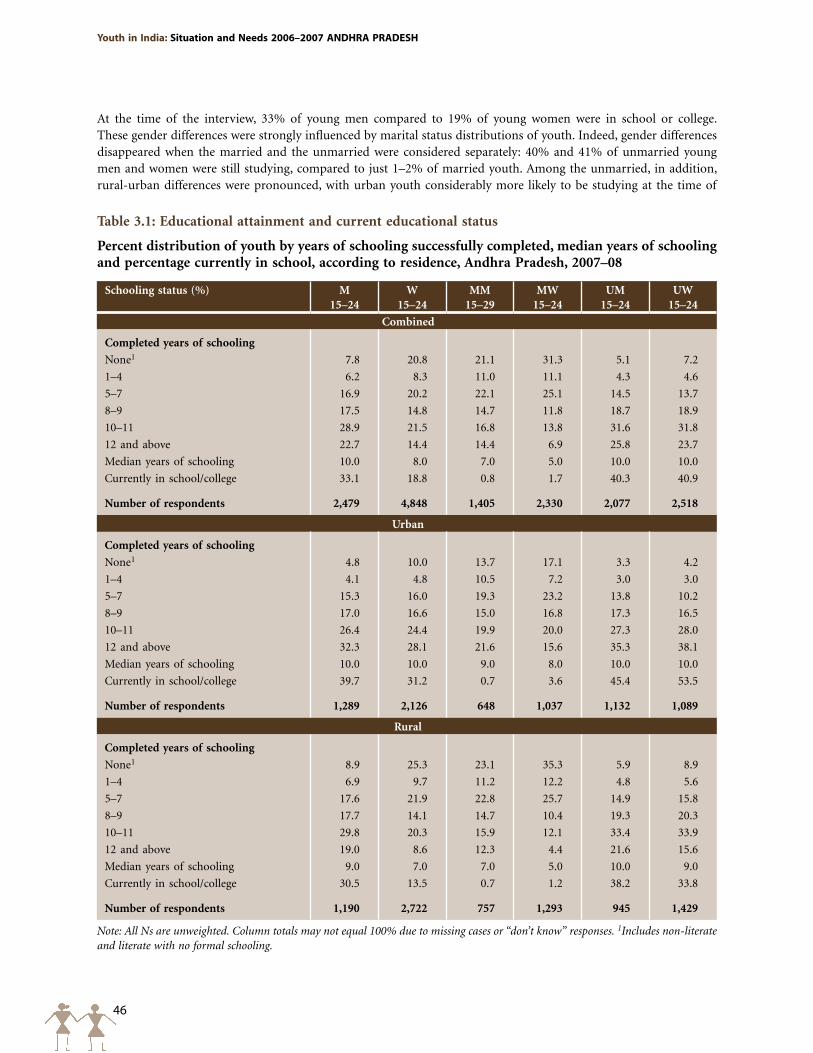
46
Youth in India: Situation and Needs 2006–2007 ANDHRA pRADESH
Table 3.1: Educational attainment and current educational status
Percent distribution of youth by years of schooling successfully completed, median years of schooling and percentage currently in school, according to residence, Andhra Pradesh, 2007–08
Schooling status (%) M15–24
W15–24
MM15–29
MW15–24
UM15–24
UW15–24
Combined
Completed years of schooling
None1 7.8 20.8 21.1 31.3 5.1 7.2
1–4 6.2 8.3 11.0 11.1 4.3 4.6
5–7 16.9 20.2 22.1 25.1 14.5 13.7
8–9 17.5 14.8 14.7 11.8 18.7 18.9
10–11 28.9 21.5 16.8 13.8 31.6 31.8
12 and above 22.7 14.4 14.4 6.9 25.8 23.7
Median years of schooling 10.0 8.0 7.0 5.0 10.0 10.0
Currently in school/college 33.1 18.8 0.8 1.7 40.3 40.9
Number of respondents 2,479 4,848 1,405 2,330 2,077 2,518
Urban
Completed years of schooling
None1 4.8 10.0 13.7 17.1 3.3 4.2
1–4 4.1 4.8 10.5 7.2 3.0 3.0
5–7 15.3 16.0 19.3 23.2 13.8 10.2
8–9 17.0 16.6 15.0 16.8 17.3 16.5
10–11 26.4 24.4 19.9 20.0 27.3 28.0
12 and above 32.3 28.1 21.6 15.6 35.3 38.1
Median years of schooling 10.0 10.0 9.0 8.0 10.0 10.0
Currently in school/college 39.7 31.2 0.7 3.6 45.4 53.5
Number of respondents 1,289 2,126 648 1,037 1,132 1,089
Rural
Completed years of schooling
None1 8.9 25.3 23.1 35.3 5.9 8.9
1–4 6.9 9.7 11.2 12.2 4.8 5.6
5–7 17.6 21.9 22.8 25.7 14.9 15.8
8–9 17.7 14.1 14.7 10.4 19.3 20.3
10–11 29.8 20.3 15.9 12.1 33.4 33.9
12 and above 19.0 8.6 12.3 4.4 21.6 15.6
Median years of schooling 9.0 7.0 7.0 5.0 10.0 9.0
Currently in school/college 30.5 13.5 0.7 1.2 38.2 33.8
Number of respondents 1,190 2,722 757 1,293 945 1,429
Note: All Ns are unweighted. Column totals may not equal 100% due to missing cases or “don’t know” responses. 1Includes non-literate and literate with no formal schooling.
At the time of the interview, 33% of young men compared to 19% of young women were in school or college. These gender differences were strongly influenced by marital status distributions of youth. Indeed, gender differences disappeared when the married and the unmarried were considered separately: 40% and 41% of unmarried young men and women were still studying, compared to just 1–2% of married youth. Among the unmarried, in addition, rural-urban differences were pronounced, with urban youth considerably more likely to be studying at the time of
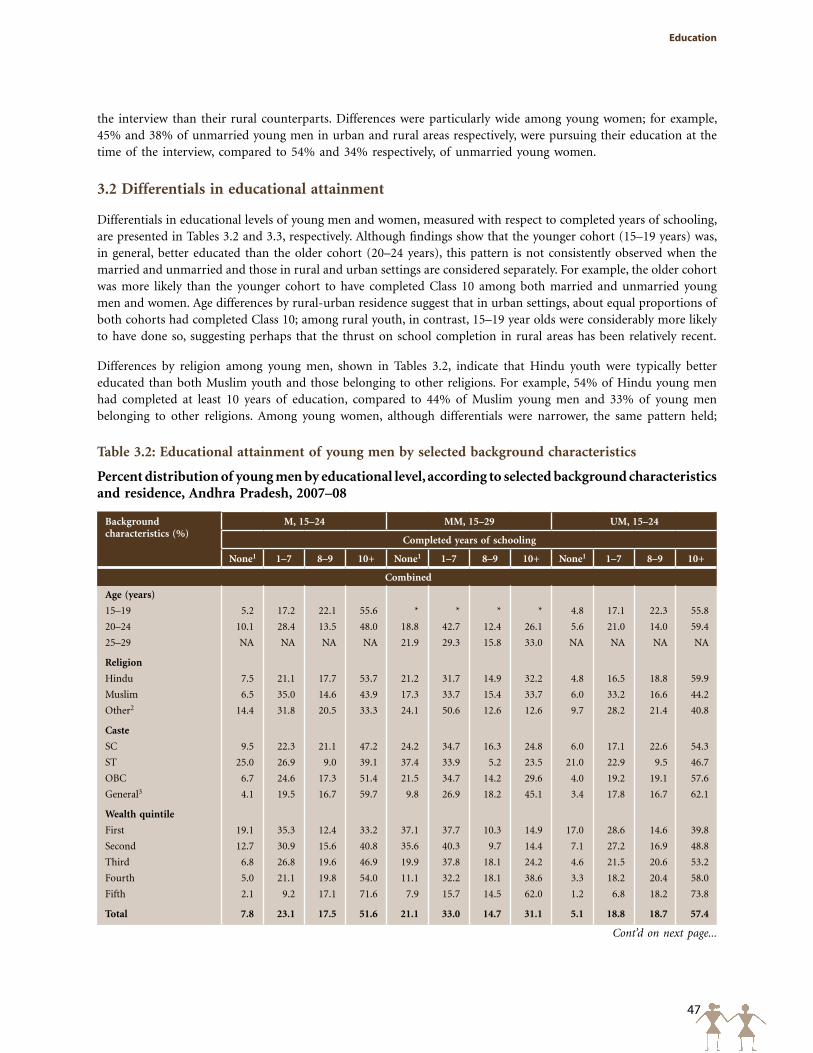
47
Education
Cont’d on next page...
Table 3.2: Educational attainment of young men by selected background characteristics
Percent distribution of young men by educational level, according to selected background characteristics and residence, Andhra Pradesh, 2007–08
Background characteristics (%)
M, 15–24 MM, 15–29 UM, 15–24
Completed years of schooling
None1 1–7 8–9 10+ None1 1–7 8–9 10+ None1 1–7 8–9 10+
Combined
Age (years)
15–19 5.2 17.2 22.1 55.6 * * * * 4.8 17.1 22.3 55.8
20–24 10.1 28.4 13.5 48.0 18.8 42.7 12.4 26.1 5.6 21.0 14.0 59.4
25–29 NA NA NA NA 21.9 29.3 15.8 33.0 NA NA NA NA
Religion
Hindu 7.5 21.1 17.7 53.7 21.2 31.7 14.9 32.2 4.8 16.5 18.8 59.9
Muslim 6.5 35.0 14.6 43.9 17.3 33.7 15.4 33.7 6.0 33.2 16.6 44.2
Other2 14.4 31.8 20.5 33.3 24.1 50.6 12.6 12.6 9.7 28.2 21.4 40.8
Caste
SC 9.5 22.3 21.1 47.2 24.2 34.7 16.3 24.8 6.0 17.1 22.6 54.3
ST 25.0 26.9 9.0 39.1 37.4 33.9 5.2 23.5 21.0 22.9 9.5 46.7
OBC 6.7 24.6 17.3 51.4 21.5 34.7 14.2 29.6 4.0 19.2 19.1 57.6
General3 4.1 19.5 16.7 59.7 9.8 26.9 18.2 45.1 3.4 17.8 16.7 62.1
Wealth quintile
First 19.1 35.3 12.4 33.2 37.1 37.7 10.3 14.9 17.0 28.6 14.6 39.8
Second 12.7 30.9 15.6 40.8 35.6 40.3 9.7 14.4 7.1 27.2 16.9 48.8
Third 6.8 26.8 19.6 46.9 19.9 37.8 18.1 24.2 4.6 21.5 20.6 53.2
Fourth 5.0 21.1 19.8 54.0 11.1 32.2 18.1 38.6 3.3 18.2 20.4 58.0
Fifth 2.1 9.2 17.1 71.6 7.9 15.7 14.5 62.0 1.2 6.8 18.2 73.8
Total 7.8 23.1 17.5 51.6 21.1 33.0 14.7 31.1 5.1 18.8 18.7 57.4
the interview than their rural counterparts. Differences were particularly wide among young women; for example, 45% and 38% of unmarried young men in urban and rural areas respectively, were pursuing their education at the time of the interview, compared to 54% and 34% respectively, of unmarried young women.
3.2 Differentials in educational attainment
Differentials in educational levels of young men and women, measured with respect to completed years of schooling, are presented in Tables 3.2 and 3.3, respectively. Although findings show that the younger cohort (15–19 years) was, in general, better educated than the older cohort (20–24 years), this pattern is not consistently observed when the married and unmarried and those in rural and urban settings are considered separately. For example, the older cohort was more likely than the younger cohort to have completed Class 10 among both married and unmarried young men and women. Age differences by rural-urban residence suggest that in urban settings, about equal proportions of both cohorts had completed Class 10; among rural youth, in contrast, 15–19 year olds were considerably more likely to have done so, suggesting perhaps that the thrust on school completion in rural areas has been relatively recent.
Differences by religion among young men, shown in Tables 3.2, indicate that Hindu youth were typically better educated than both Muslim youth and those belonging to other religions. For example, 54% of Hindu young men had completed at least 10 years of education, compared to 44% of Muslim young men and 33% of young men belonging to other religions. Among young women, although differentials were narrower, the same pattern held;
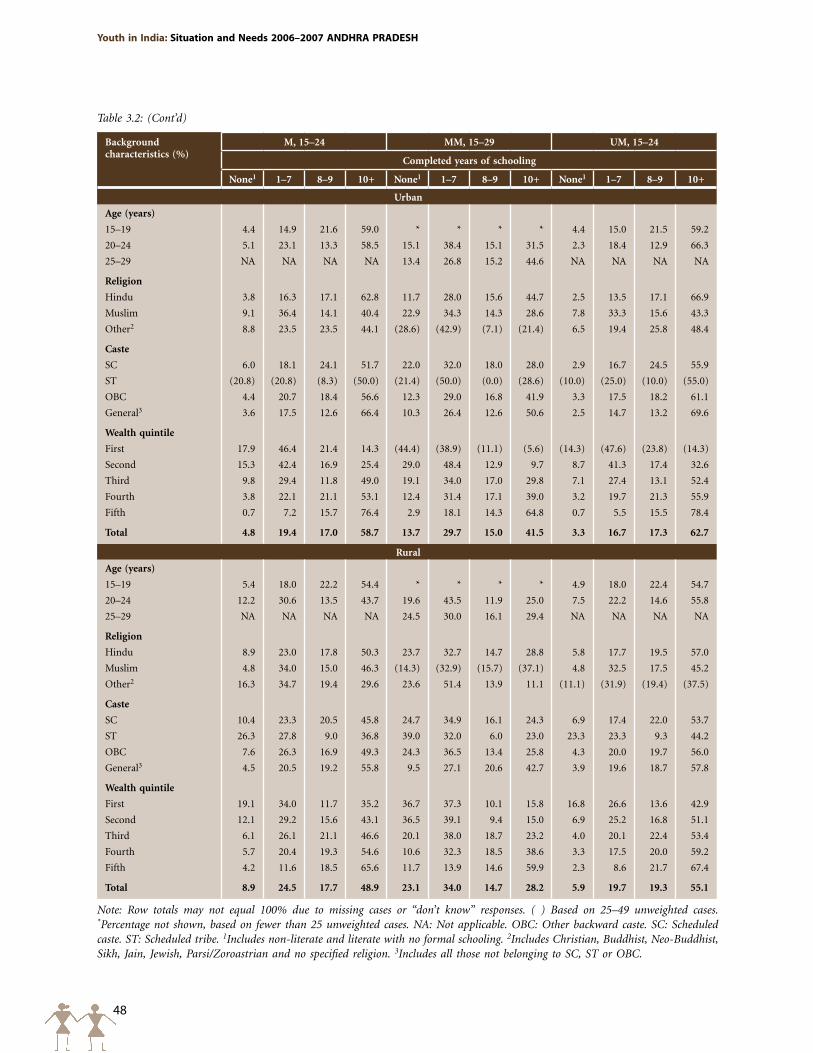
48
Youth in India: Situation and Needs 2006–2007 ANDHRA pRADESH
Table 3.2: (Cont’d)
Background characteristics (%)
M, 15–24 MM, 15–29 UM, 15–24
Completed years of schooling
None1 1–7 8–9 10+ None1 1–7 8–9 10+ None1 1–7 8–9 10+
Urban
Age (years)
15–19 4.4 14.9 21.6 59.0 * * * * 4.4 15.0 21.5 59.2
20–24 5.1 23.1 13.3 58.5 15.1 38.4 15.1 31.5 2.3 18.4 12.9 66.3
25–29 NA NA NA NA 13.4 26.8 15.2 44.6 NA NA NA NA
Religion
Hindu 3.8 16.3 17.1 62.8 11.7 28.0 15.6 44.7 2.5 13.5 17.1 66.9
Muslim 9.1 36.4 14.1 40.4 22.9 34.3 14.3 28.6 7.8 33.3 15.6 43.3
Other2 8.8 23.5 23.5 44.1 (28.6) (42.9) (7.1) (21.4) 6.5 19.4 25.8 48.4
Caste
SC 6.0 18.1 24.1 51.7 22.0 32.0 18.0 28.0 2.9 16.7 24.5 55.9
ST (20.8) (20.8) (8.3) (50.0) (21.4) (50.0) (0.0) (28.6) (10.0) (25.0) (10.0) (55.0)
OBC 4.4 20.7 18.4 56.6 12.3 29.0 16.8 41.9 3.3 17.5 18.2 61.1
General3 3.6 17.5 12.6 66.4 10.3 26.4 12.6 50.6 2.5 14.7 13.2 69.6
Wealth quintile
First 17.9 46.4 21.4 14.3 (44.4) (38.9) (11.1) (5.6) (14.3) (47.6) (23.8) (14.3)
Second 15.3 42.4 16.9 25.4 29.0 48.4 12.9 9.7 8.7 41.3 17.4 32.6
Third 9.8 29.4 11.8 49.0 19.1 34.0 17.0 29.8 7.1 27.4 13.1 52.4
Fourth 3.8 22.1 21.1 53.1 12.4 31.4 17.1 39.0 3.2 19.7 21.3 55.9
Fifth 0.7 7.2 15.7 76.4 2.9 18.1 14.3 64.8 0.7 5.5 15.5 78.4
Total 4.8 19.4 17.0 58.7 13.7 29.7 15.0 41.5 3.3 16.7 17.3 62.7
Rural
Age (years)
15–19 5.4 18.0 22.2 54.4 * * * * 4.9 18.0 22.4 54.7
20–24 12.2 30.6 13.5 43.7 19.6 43.5 11.9 25.0 7.5 22.2 14.6 55.8
25–29 NA NA NA NA 24.5 30.0 16.1 29.4 NA NA NA NA
Religion
Hindu 8.9 23.0 17.8 50.3 23.7 32.7 14.7 28.8 5.8 17.7 19.5 57.0
Muslim 4.8 34.0 15.0 46.3 (14.3) (32.9) (15.7) (37.1) 4.8 32.5 17.5 45.2
Other2 16.3 34.7 19.4 29.6 23.6 51.4 13.9 11.1 (11.1) (31.9) (19.4) (37.5)
Caste
SC 10.4 23.3 20.5 45.8 24.7 34.9 16.1 24.3 6.9 17.4 22.0 53.7
ST 26.3 27.8 9.0 36.8 39.0 32.0 6.0 23.0 23.3 23.3 9.3 44.2
OBC 7.6 26.3 16.9 49.3 24.3 36.5 13.4 25.8 4.3 20.0 19.7 56.0
General3 4.5 20.5 19.2 55.8 9.5 27.1 20.6 42.7 3.9 19.6 18.7 57.8
Wealth quintile
First 19.1 34.0 11.7 35.2 36.7 37.3 10.1 15.8 16.8 26.6 13.6 42.9
Second 12.1 29.2 15.6 43.1 36.5 39.1 9.4 15.0 6.9 25.2 16.8 51.1
Third 6.1 26.1 21.1 46.6 20.1 38.0 18.7 23.2 4.0 20.1 22.4 53.4
Fourth 5.7 20.4 19.3 54.6 10.6 32.3 18.5 38.6 3.3 17.5 20.0 59.2
Fifth 4.2 11.6 18.5 65.6 11.7 13.9 14.6 59.9 2.3 8.6 21.7 67.4
Total 8.9 24.5 17.7 48.9 23.1 34.0 14.7 28.2 5.9 19.7 19.3 55.1
Note: Row totals may not equal 100% due to missing cases or “don’t know” responses. ( ) Based on 25–49 unweighted cases. *Percentage not shown, based on fewer than 25 unweighted cases. NA: Not applicable. OBC: Other backward caste. SC: Scheduled caste. ST: Scheduled tribe. 1Includes non-literate and literate with no formal schooling. 2Includes Christian, Buddhist, Neo-Buddhist, Sikh, Jain, Jewish, Parsi/Zoroastrian and no specified religion. 3Includes all those not belonging to SC, ST or OBC.
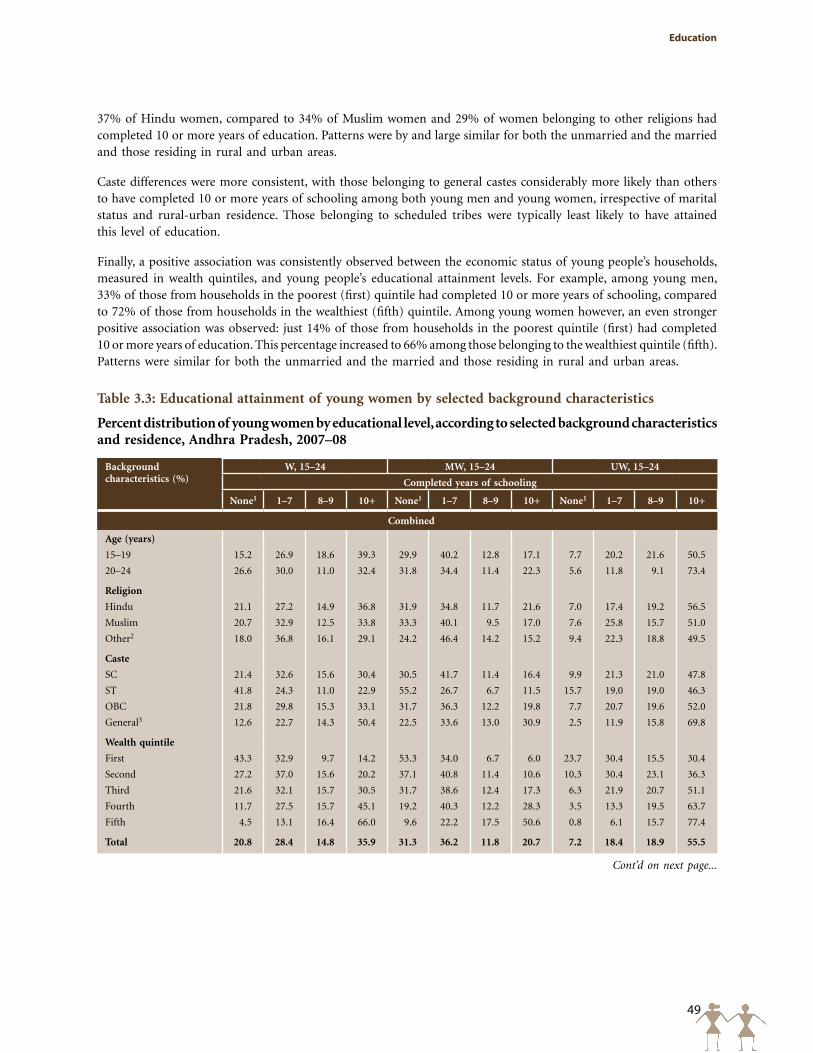
49
Education
Cont’d on next page...
Table 3.3: Educational attainment of young women by selected background characteristics
Percent distribution of young women by educational level, according to selected background characteristics and residence, Andhra Pradesh, 2007–08
Background characteristics (%)
W, 15–24 MW, 15–24 UW, 15–24
Completed years of schooling
None1 1–7 8–9 10+ None1 1–7 8–9 10+ None1 1–7 8–9 10+
Combined
Age (years)
15–19 15.2 26.9 18.6 39.3 29.9 40.2 12.8 17.1 7.7 20.2 21.6 50.5
20–24 26.6 30.0 11.0 32.4 31.8 34.4 11.4 22.3 5.6 11.8 9.1 73.4
Religion
Hindu 21.1 27.2 14.9 36.8 31.9 34.8 11.7 21.6 7.0 17.4 19.2 56.5
Muslim 20.7 32.9 12.5 33.8 33.3 40.1 9.5 17.0 7.6 25.8 15.7 51.0
Other2 18.0 36.8 16.1 29.1 24.2 46.4 14.2 15.2 9.4 22.3 18.8 49.5
Caste
SC 21.4 32.6 15.6 30.4 30.5 41.7 11.4 16.4 9.9 21.3 21.0 47.8
ST 41.8 24.3 11.0 22.9 55.2 26.7 6.7 11.5 15.7 19.0 19.0 46.3
OBC 21.8 29.8 15.3 33.1 31.7 36.3 12.2 19.8 7.7 20.7 19.6 52.0
General3 12.6 22.7 14.3 50.4 22.5 33.6 13.0 30.9 2.5 11.9 15.8 69.8
Wealth quintile
First 43.3 32.9 9.7 14.2 53.3 34.0 6.7 6.0 23.7 30.4 15.5 30.4
Second 27.2 37.0 15.6 20.2 37.1 40.8 11.4 10.6 10.3 30.4 23.1 36.3
Third 21.6 32.1 15.7 30.5 31.7 38.6 12.4 17.3 6.3 21.9 20.7 51.1
Fourth 11.7 27.5 15.7 45.1 19.2 40.3 12.2 28.3 3.5 13.3 19.5 63.7
Fifth 4.5 13.1 16.4 66.0 9.6 22.2 17.5 50.6 0.8 6.1 15.7 77.4
Total 20.8 28.4 14.8 35.9 31.3 36.2 11.8 20.7 7.2 18.4 18.9 55.5
37% of Hindu women, compared to 34% of Muslim women and 29% of women belonging to other religions had completed 10 or more years of education. Patterns were by and large similar for both the unmarried and the married and those residing in rural and urban areas.
Caste differences were more consistent, with those belonging to general castes considerably more likely than others to have completed 10 or more years of schooling among both young men and young women, irrespective of marital status and rural-urban residence. Those belonging to scheduled tribes were typically least likely to have attained this level of education.
Finally, a positive association was consistently observed between the economic status of young people’s households, measured in wealth quintiles, and young people’s educational attainment levels. For example, among young men, 33% of those from households in the poorest (first) quintile had completed 10 or more years of schooling, compared to 72% of those from households in the wealthiest (fifth) quintile. Among young women however, an even stronger positive association was observed: just 14% of those from households in the poorest quintile (first) had completed 10 or more years of education. This percentage increased to 66% among those belonging to the wealthiest quintile (fifth). Patterns were similar for both the unmarried and the married and those residing in rural and urban areas.
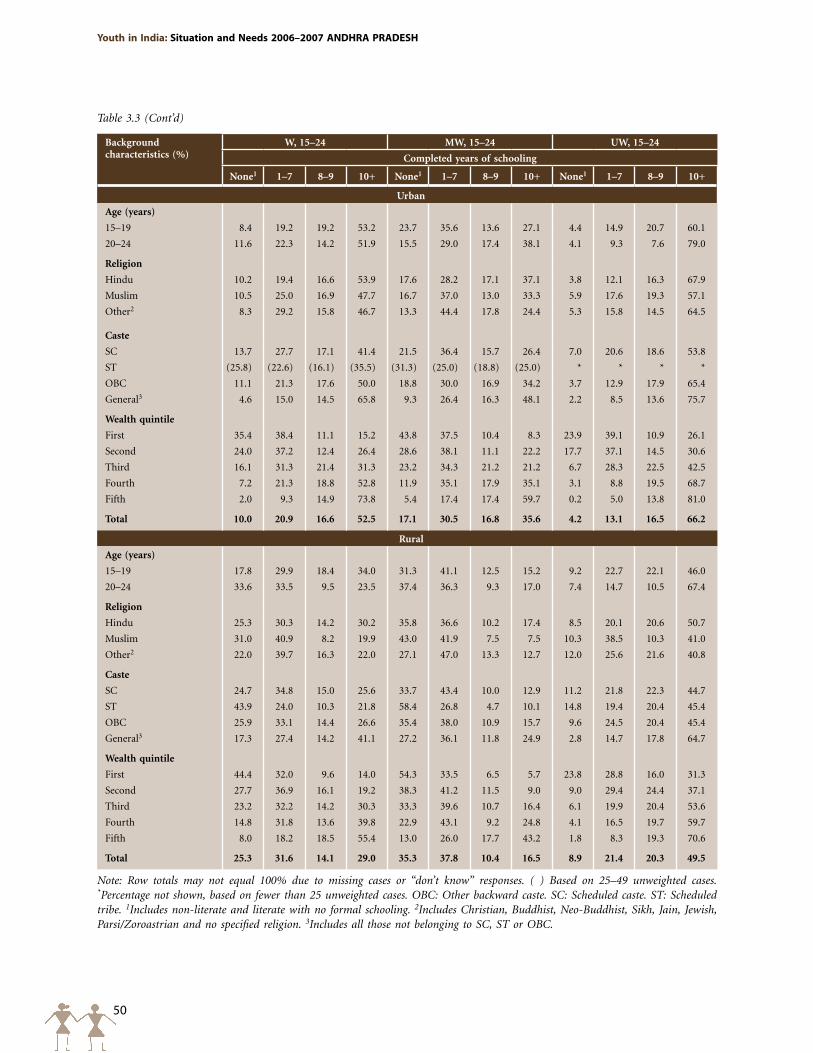
50
Youth in India: Situation and Needs 2006–2007 ANDHRA pRADESH
Table 3.3 (Cont’d)
Background characteristics (%)
W, 15–24 MW, 15–24 UW, 15–24
Completed years of schooling
None1 1–7 8–9 10+ None1 1–7 8–9 10+ None1 1–7 8–9 10+
Urban
Age (years)
15–19 8.4 19.2 19.2 53.2 23.7 35.6 13.6 27.1 4.4 14.9 20.7 60.1
20–24 11.6 22.3 14.2 51.9 15.5 29.0 17.4 38.1 4.1 9.3 7.6 79.0
Religion
Hindu 10.2 19.4 16.6 53.9 17.6 28.2 17.1 37.1 3.8 12.1 16.3 67.9
Muslim 10.5 25.0 16.9 47.7 16.7 37.0 13.0 33.3 5.9 17.6 19.3 57.1
Other2 8.3 29.2 15.8 46.7 13.3 44.4 17.8 24.4 5.3 15.8 14.5 64.5
Caste
SC 13.7 27.7 17.1 41.4 21.5 36.4 15.7 26.4 7.0 20.6 18.6 53.8
ST (25.8) (22.6) (16.1) (35.5) (31.3) (25.0) (18.8) (25.0) * * * *
OBC 11.1 21.3 17.6 50.0 18.8 30.0 16.9 34.2 3.7 12.9 17.9 65.4
General3 4.6 15.0 14.5 65.8 9.3 26.4 16.3 48.1 2.2 8.5 13.6 75.7
Wealth quintile
First 35.4 38.4 11.1 15.2 43.8 37.5 10.4 8.3 23.9 39.1 10.9 26.1
Second 24.0 37.2 12.4 26.4 28.6 38.1 11.1 22.2 17.7 37.1 14.5 30.6
Third 16.1 31.3 21.4 31.3 23.2 34.3 21.2 21.2 6.7 28.3 22.5 42.5
Fourth 7.2 21.3 18.8 52.8 11.9 35.1 17.9 35.1 3.1 8.8 19.5 68.7
Fifth 2.0 9.3 14.9 73.8 5.4 17.4 17.4 59.7 0.2 5.0 13.8 81.0
Total 10.0 20.9 16.6 52.5 17.1 30.5 16.8 35.6 4.2 13.1 16.5 66.2
Rural
Age (years)
15–19 17.8 29.9 18.4 34.0 31.3 41.1 12.5 15.2 9.2 22.7 22.1 46.0
20–24 33.6 33.5 9.5 23.5 37.4 36.3 9.3 17.0 7.4 14.7 10.5 67.4
Religion
Hindu 25.3 30.3 14.2 30.2 35.8 36.6 10.2 17.4 8.5 20.1 20.6 50.7
Muslim 31.0 40.9 8.2 19.9 43.0 41.9 7.5 7.5 10.3 38.5 10.3 41.0
Other2 22.0 39.7 16.3 22.0 27.1 47.0 13.3 12.7 12.0 25.6 21.6 40.8
Caste
SC 24.7 34.8 15.0 25.6 33.7 43.4 10.0 12.9 11.2 21.8 22.3 44.7
ST 43.9 24.0 10.3 21.8 58.4 26.8 4.7 10.1 14.8 19.4 20.4 45.4
OBC 25.9 33.1 14.4 26.6 35.4 38.0 10.9 15.7 9.6 24.5 20.4 45.4
General3 17.3 27.4 14.2 41.1 27.2 36.1 11.8 24.9 2.8 14.7 17.8 64.7
Wealth quintile
First 44.4 32.0 9.6 14.0 54.3 33.5 6.5 5.7 23.8 28.8 16.0 31.3
Second 27.7 36.9 16.1 19.2 38.3 41.2 11.5 9.0 9.0 29.4 24.4 37.1
Third 23.2 32.2 14.2 30.3 33.3 39.6 10.7 16.4 6.1 19.9 20.4 53.6
Fourth 14.8 31.8 13.6 39.8 22.9 43.1 9.2 24.8 4.1 16.5 19.7 59.7
Fifth 8.0 18.2 18.5 55.4 13.0 26.0 17.7 43.2 1.8 8.3 19.3 70.6
Total 25.3 31.6 14.1 29.0 35.3 37.8 10.4 16.5 8.9 21.4 20.3 49.5
Note: Row totals may not equal 100% due to missing cases or “don’t know” responses. ( ) Based on 25–49 unweighted cases. *Percentage not shown, based on fewer than 25 unweighted cases. OBC: Other backward caste. SC: Scheduled caste. ST: Scheduled tribe. 1Includes non-literate and literate with no formal schooling. 2Includes Christian, Buddhist, Neo-Buddhist, Sikh, Jain, Jewish, Parsi/Zoroastrian and no specified religion. 3Includes all those not belonging to SC, ST or OBC.
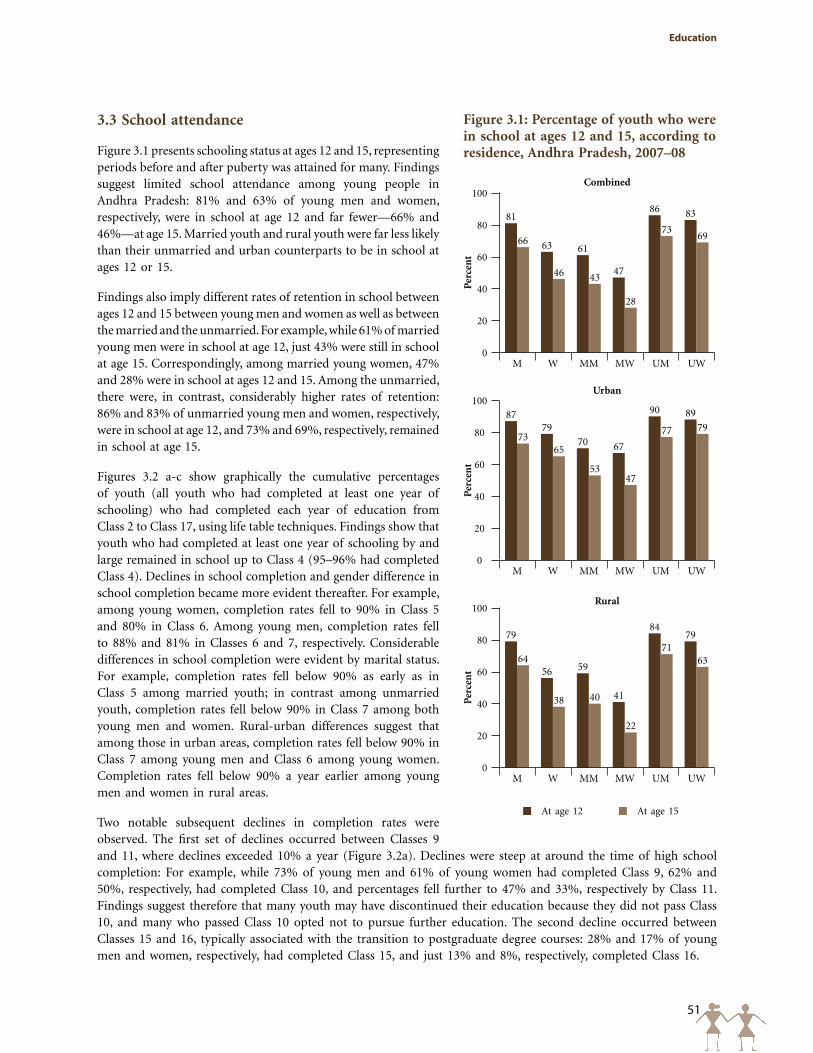
51
Education
3.3 School attendance
Figure 3.1 presents schooling status at ages 12 and 15, representing periods before and after puberty was attained for many. Findings suggest limited school attendance among young people in Andhra Pradesh: 81% and 63% of young men and women, respectively, were in school at age 12 and far fewer—66% and 46%—at age 15. Married youth and rural youth were far less likely than their unmarried and urban counterparts to be in school at ages 12 or 15.
Findings also imply different rates of retention in school between ages 12 and 15 between young men and women as well as between the married and the unmarried. For example, while 61% of married young men were in school at age 12, just 43% were still in school at age 15. Correspondingly, among married young women, 47% and 28% were in school at ages 12 and 15. Among the unmarried, there were, in contrast, considerably higher rates of retention: 86% and 83% of unmarried young men and women, respectively, were in school at age 12, and 73% and 69%, respectively, remained in school at age 15.
Figures 3.2 a-c show graphically the cumulative percentages of youth (all youth who had completed at least one year of schooling) who had completed each year of education from Class 2 to Class 17, using life table techniques. Findings show that youth who had completed at least one year of schooling by and large remained in school up to Class 4 (95–96% had completed Class 4). Declines in school completion and gender difference in school completion became more evident thereafter. For example, among young women, completion rates fell to 90% in Class 5 and 80% in Class 6. Among young men, completion rates fell to 88% and 81% in Classes 6 and 7, respectively. Considerable differences in school completion were evident by marital status. For example, completion rates fell below 90% as early as in Class 5 among married youth; in contrast among unmarried youth, completion rates fell below 90% in Class 7 among both young men and women. Rural-urban differences suggest that among those in urban areas, completion rates fell below 90% in Class 7 among young men and Class 6 among young women. Completion rates fell below 90% a year earlier among young men and women in rural areas.
Two notable subsequent declines in completion rates were observed. The first set of declines occurred between Classes 9 and 11, where declines exceeded 10% a year (Figure 3.2a). Declines were steep at around the time of high school completion: For example, while 73% of young men and 61% of young women had completed Class 9, 62% and 50%, respectively, had completed Class 10, and percentages fell further to 47% and 33%, respectively by Class 11. Findings suggest therefore that many youth may have discontinued their education because they did not pass Class 10, and many who passed Class 10 opted not to pursue further education. The second decline occurred between Classes 15 and 16, typically associated with the transition to postgraduate degree courses: 28% and 17% of young men and women, respectively, had completed Class 15, and just 13% and 8%, respectively, completed Class 16.
Figure 3.1: Percentage of youth who were in school at ages 12 and 15, according to residence, Andhra Pradesh, 2007–08
Per
cen
t
100
80
60
40
20
0
81
63 61
47
86 83
66
46 43
28
7369
Combined
M W MM MW UM UW
Per
cen
t
100
80
60
40
20
0
8779
70 67
90 89
7365
5347
77 79
Urban
M W MM MW UM UW
Per
cen
t
100
80
60
40
20
0
79
56 59
41
8479
64
38 40
22
7163
Rural
M W MM MW UM UW
At age 12 At age 15
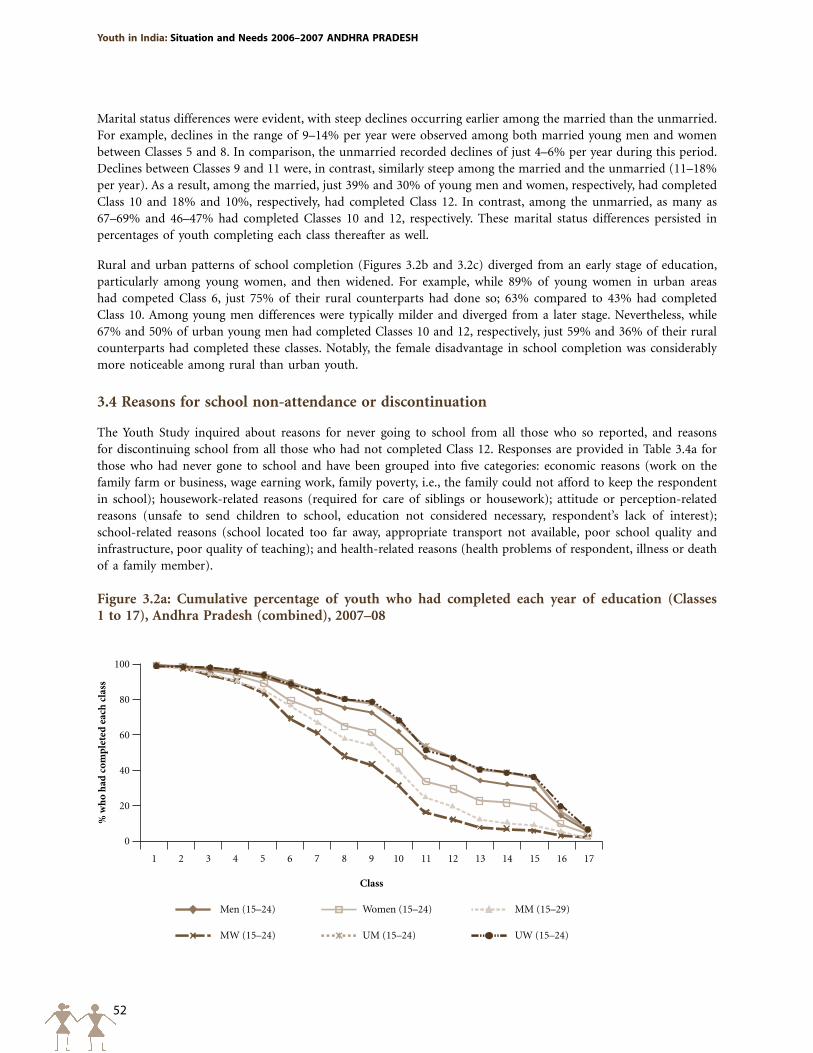
52
Youth in India: Situation and Needs 2006–2007 ANDHRA pRADESH
Figure 3.2a: Cumulative percentage of youth who had completed each year of education (Classes 1 to 17), Andhra Pradesh (combined), 2007–08
Marital status differences were evident, with steep declines occurring earlier among the married than the unmarried. For example, declines in the range of 9–14% per year were observed among both married young men and women between Classes 5 and 8. In comparison, the unmarried recorded declines of just 4–6% per year during this period. Declines between Classes 9 and 11 were, in contrast, similarly steep among the married and the unmarried (11–18% per year). As a result, among the married, just 39% and 30% of young men and women, respectively, had completed Class 10 and 18% and 10%, respectively, had completed Class 12. In contrast, among the unmarried, as many as 67–69% and 46–47% had completed Classes 10 and 12, respectively. These marital status differences persisted in percentages of youth completing each class thereafter as well.
Rural and urban patterns of school completion (Figures 3.2b and 3.2c) diverged from an early stage of education, particularly among young women, and then widened. For example, while 89% of young women in urban areas had competed Class 6, just 75% of their rural counterparts had done so; 63% compared to 43% had completed Class 10. Among young men differences were typically milder and diverged from a later stage. Nevertheless, while 67% and 50% of urban young men had completed Classes 10 and 12, respectively, just 59% and 36% of their rural counterparts had completed these classes. Notably, the female disadvantage in school completion was considerably more noticeable among rural than urban youth.
3.4 Reasons for school non-attendance or discontinuation
The Youth Study inquired about reasons for never going to school from all those who so reported, and reasons for discontinuing school from all those who had not completed Class 12. Responses are provided in Table 3.4a for those who had never gone to school and have been grouped into five categories: economic reasons (work on the family farm or business, wage earning work, family poverty, i.e., the family could not afford to keep the respondent in school); housework-related reasons (required for care of siblings or housework); attitude or perception-related reasons (unsafe to send children to school, education not considered necessary, respondent’s lack of interest); school-related reasons (school located too far away, appropriate transport not available, poor school quality and infrastructure, poor quality of teaching); and health-related reasons (health problems of respondent, illness or death of a family member).
0
20
40
60
80
100
%wh
oha
dco
mpl
eted
each
class
1 2 3 4 5 6 7 8 9 10 11 12 13 14 15 16 17
Class
Men (15–24) Women (15 24)– MM (15 29)–
MW (15 24)– UM (15 24)– UW (15 24)–
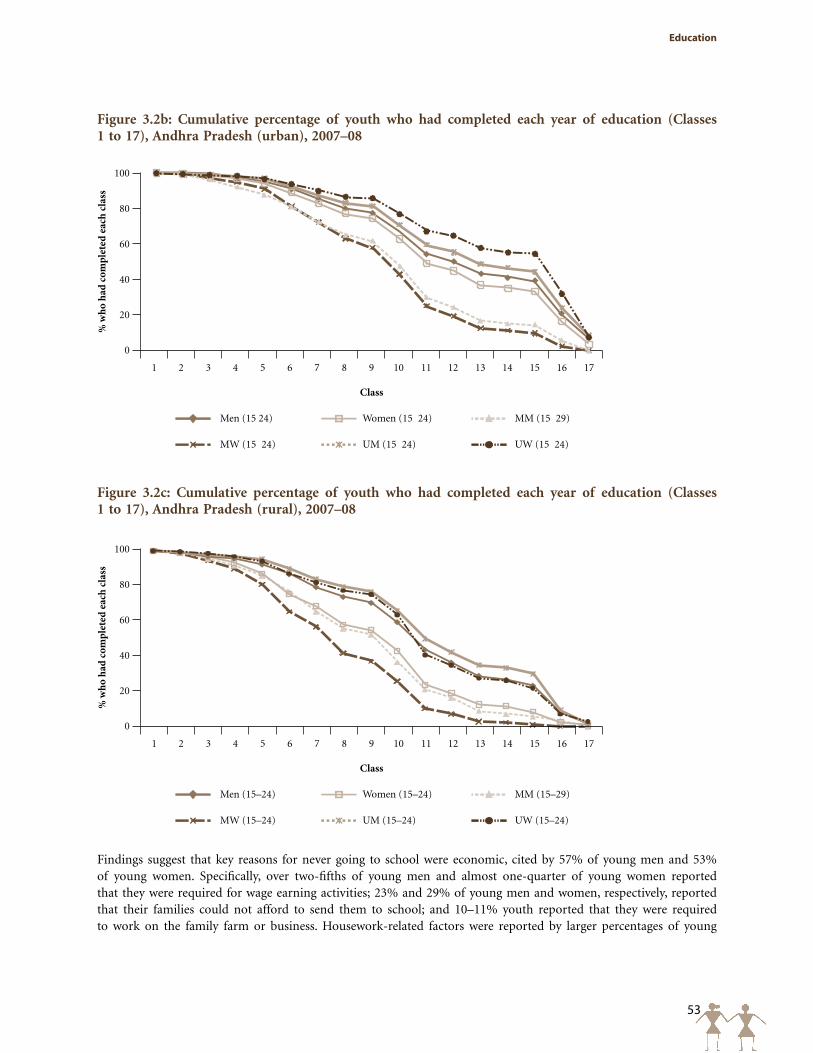
53
Education
Figure 3.2c: Cumulative percentage of youth who had completed each year of education (Classes 1 to 17), Andhra Pradesh (rural), 2007–08
Figure 3.2b: Cumulative percentage of youth who had completed each year of education (Classes 1 to 17), Andhra Pradesh (urban), 2007–08
Findings suggest that key reasons for never going to school were economic, cited by 57% of young men and 53% of young women. Specifically, over two-fifths of young men and almost one-quarter of young women reported that they were required for wage earning activities; 23% and 29% of young men and women, respectively, reported that their families could not afford to send them to school; and 10–11% youth reported that they were required to work on the family farm or business. Housework-related factors were reported by larger percentages of young
Men (15 24) Women (15 24) MM (15 29)
MW (15 24) UM (15 24) UW (15 24)
0
20
40
60
80
100
%wh
oha
dco
mpl
eted
each
class
1 2 3 4 5 6 7 8 9 10 11 12 13 14 15 16 17
Class
Men (15–24) Women (15 24)– MM (15 29)–
MW (15 24)– UM (15 24)– UW (15 24)–
0
20
40
60
80
100
%wh
oha
dco
mpl
eted
each
class
1 2 3 4 5 6 7 8 9 10 11 12 13 14 15 16 17
Class
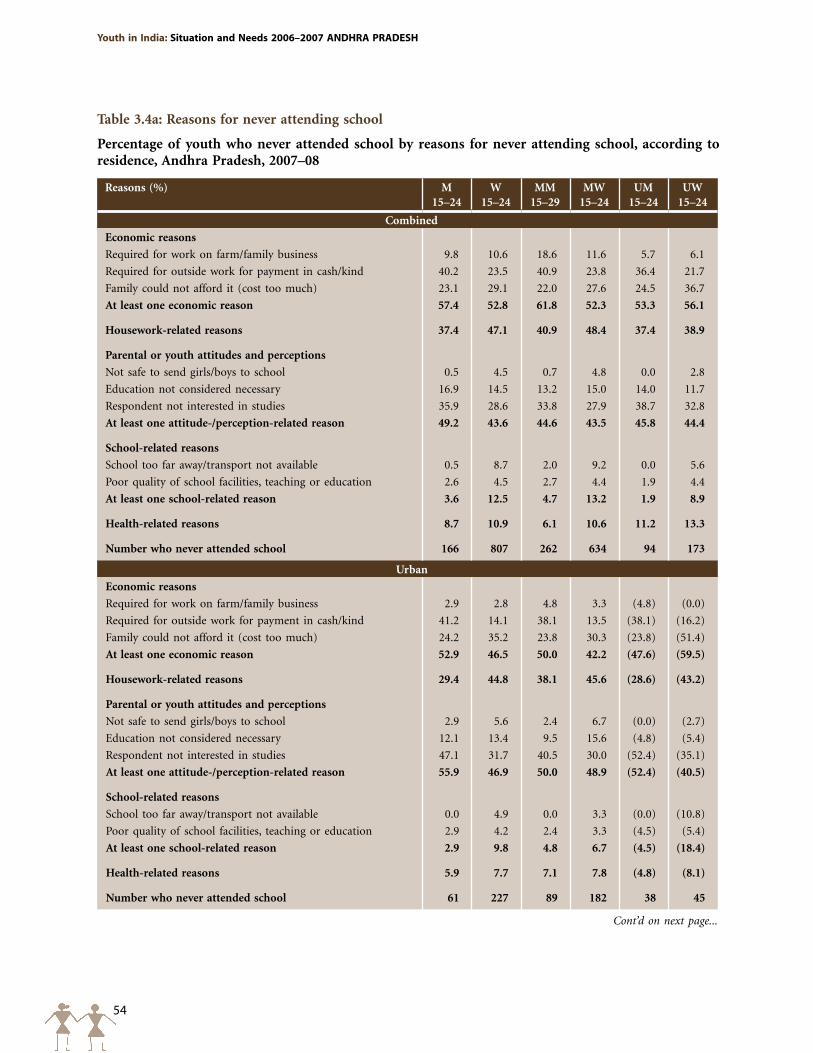
54
Youth in India: Situation and Needs 2006–2007 ANDHRA pRADESH
Table 3.4a: Reasons for never attending school
Percentage of youth who never attended school by reasons for never attending school, according to residence, Andhra Pradesh, 2007–08
Reasons (%) M 15–24
W 15–24
MM 15–29
MW 15–24
UM 15–24
UW 15–24
Combined
Economic reasons
Required for work on farm/family business 9.8 10.6 18.6 11.6 5.7 6.1
Required for outside work for payment in cash/kind 40.2 23.5 40.9 23.8 36.4 21.7
Family could not afford it (cost too much) 23.1 29.1 22.0 27.6 24.5 36.7
At least one economic reason 57.4 52.8 61.8 52.3 53.3 56.1
Housework-related reasons 37.4 47.1 40.9 48.4 37.4 38.9
Parental or youth attitudes and perceptions
Not safe to send girls/boys to school 0.5 4.5 0.7 4.8 0.0 2.8
Education not considered necessary 16.9 14.5 13.2 15.0 14.0 11.7
Respondent not interested in studies 35.9 28.6 33.8 27.9 38.7 32.8
At least one attitude-/perception-related reason 49.2 43.6 44.6 43.5 45.8 44.4
School-related reasons
School too far away/transport not available 0.5 8.7 2.0 9.2 0.0 5.6
Poor quality of school facilities, teaching or education 2.6 4.5 2.7 4.4 1.9 4.4
At least one school-related reason 3.6 12.5 4.7 13.2 1.9 8.9
Health-related reasons 8.7 10.9 6.1 10.6 11.2 13.3
Number who never attended school 166 807 262 634 94 173
Urban
Economic reasons
Required for work on farm/family business 2.9 2.8 4.8 3.3 (4.8) (0.0)
Required for outside work for payment in cash/kind 41.2 14.1 38.1 13.5 (38.1) (16.2)
Family could not afford it (cost too much) 24.2 35.2 23.8 30.3 (23.8) (51.4)
At least one economic reason 52.9 46.5 50.0 42.2 (47.6) (59.5)
Housework-related reasons 29.4 44.8 38.1 45.6 (28.6) (43.2)
Parental or youth attitudes and perceptions
Not safe to send girls/boys to school 2.9 5.6 2.4 6.7 (0.0) (2.7)
Education not considered necessary 12.1 13.4 9.5 15.6 (4.8) (5.4)
Respondent not interested in studies 47.1 31.7 40.5 30.0 (52.4) (35.1)
At least one attitude-/perception-related reason 55.9 46.9 50.0 48.9 (52.4) (40.5)
School-related reasons
School too far away/transport not available 0.0 4.9 0.0 3.3 (0.0) (10.8)
Poor quality of school facilities, teaching or education 2.9 4.2 2.4 3.3 (4.5) (5.4)
At least one school-related reason 2.9 9.8 4.8 6.7 (4.5) (18.4)
Health-related reasons 5.9 7.7 7.1 7.8 (4.8) (8.1)
Number who never attended school 61 227 89 182 38 45
Cont’d on next page...
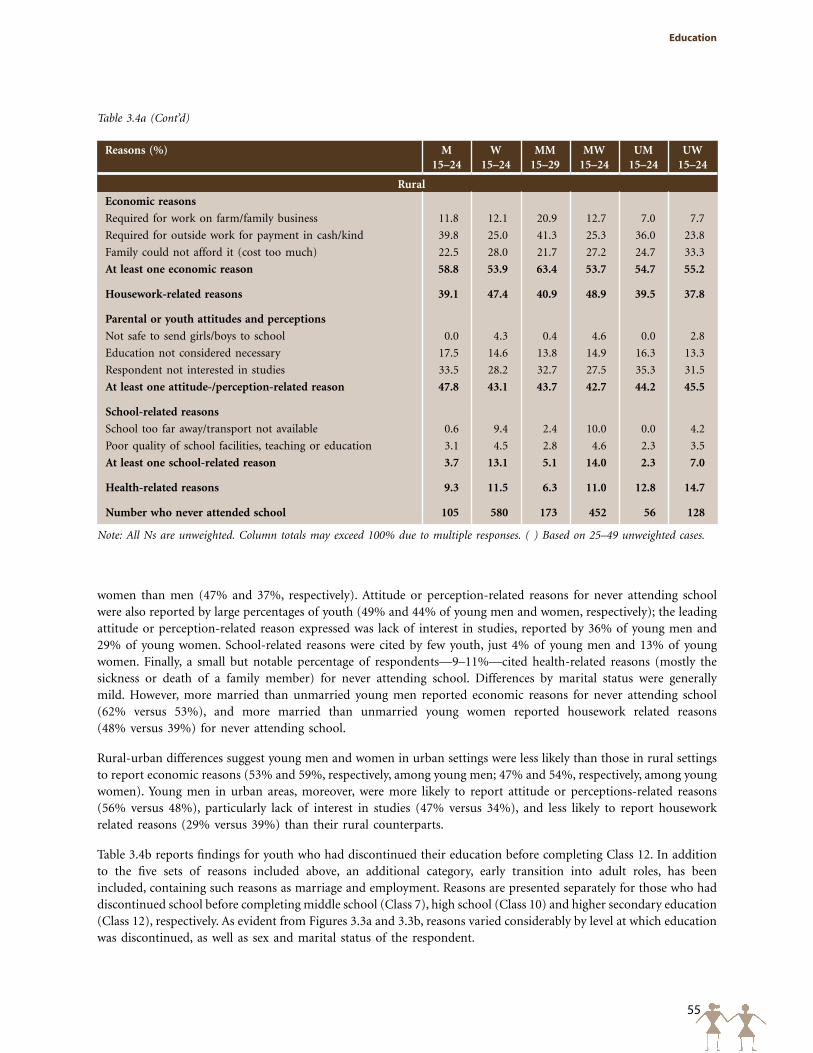
55
Education
women than men (47% and 37%, respectively). Attitude or perception-related reasons for never attending school were also reported by large percentages of youth (49% and 44% of young men and women, respectively); the leading attitude or perception-related reason expressed was lack of interest in studies, reported by 36% of young men and 29% of young women. School-related reasons were cited by few youth, just 4% of young men and 13% of young women. Finally, a small but notable percentage of respondents—9–11%—cited health-related reasons (mostly the sickness or death of a family member) for never attending school. Differences by marital status were generally mild. However, more married than unmarried young men reported economic reasons for never attending school (62% versus 53%), and more married than unmarried young women reported housework related reasons (48% versus 39%) for never attending school.
Rural-urban differences suggest young men and women in urban settings were less likely than those in rural settings to report economic reasons (53% and 59%, respectively, among young men; 47% and 54%, respectively, among young women). Young men in urban areas, moreover, were more likely to report attitude or perceptions-related reasons (56% versus 48%), particularly lack of interest in studies (47% versus 34%), and less likely to report housework related reasons (29% versus 39%) than their rural counterparts.
Table 3.4b reports findings for youth who had discontinued their education before completing Class 12. In addition to the five sets of reasons included above, an additional category, early transition into adult roles, has been included, containing such reasons as marriage and employment. Reasons are presented separately for those who had discontinued school before completing middle school (Class 7), high school (Class 10) and higher secondary education (Class 12), respectively. As evident from Figures 3.3a and 3.3b, reasons varied considerably by level at which education was discontinued, as well as sex and marital status of the respondent.
Reasons (%) M 15–24
W 15–24
MM 15–29
MW 15–24
UM 15–24
UW 15–24
Rural
Economic reasons
Required for work on farm/family business 11.8 12.1 20.9 12.7 7.0 7.7
Required for outside work for payment in cash/kind 39.8 25.0 41.3 25.3 36.0 23.8
Family could not afford it (cost too much) 22.5 28.0 21.7 27.2 24.7 33.3
At least one economic reason 58.8 53.9 63.4 53.7 54.7 55.2
Housework-related reasons 39.1 47.4 40.9 48.9 39.5 37.8
Parental or youth attitudes and perceptions
Not safe to send girls/boys to school 0.0 4.3 0.4 4.6 0.0 2.8
Education not considered necessary 17.5 14.6 13.8 14.9 16.3 13.3
Respondent not interested in studies 33.5 28.2 32.7 27.5 35.3 31.5
At least one attitude-/perception-related reason 47.8 43.1 43.7 42.7 44.2 45.5
School-related reasons
School too far away/transport not available 0.6 9.4 2.4 10.0 0.0 4.2
Poor quality of school facilities, teaching or education 3.1 4.5 2.8 4.6 2.3 3.5
At least one school-related reason 3.7 13.1 5.1 14.0 2.3 7.0
Health-related reasons 9.3 11.5 6.3 11.0 12.8 14.7
Number who never attended school 105 580 173 452 56 128
Note: All Ns are unweighted. Column totals may exceed 100% due to multiple responses. ( ) Based on 25–49 unweighted cases.
Table 3.4a (Cont’d)
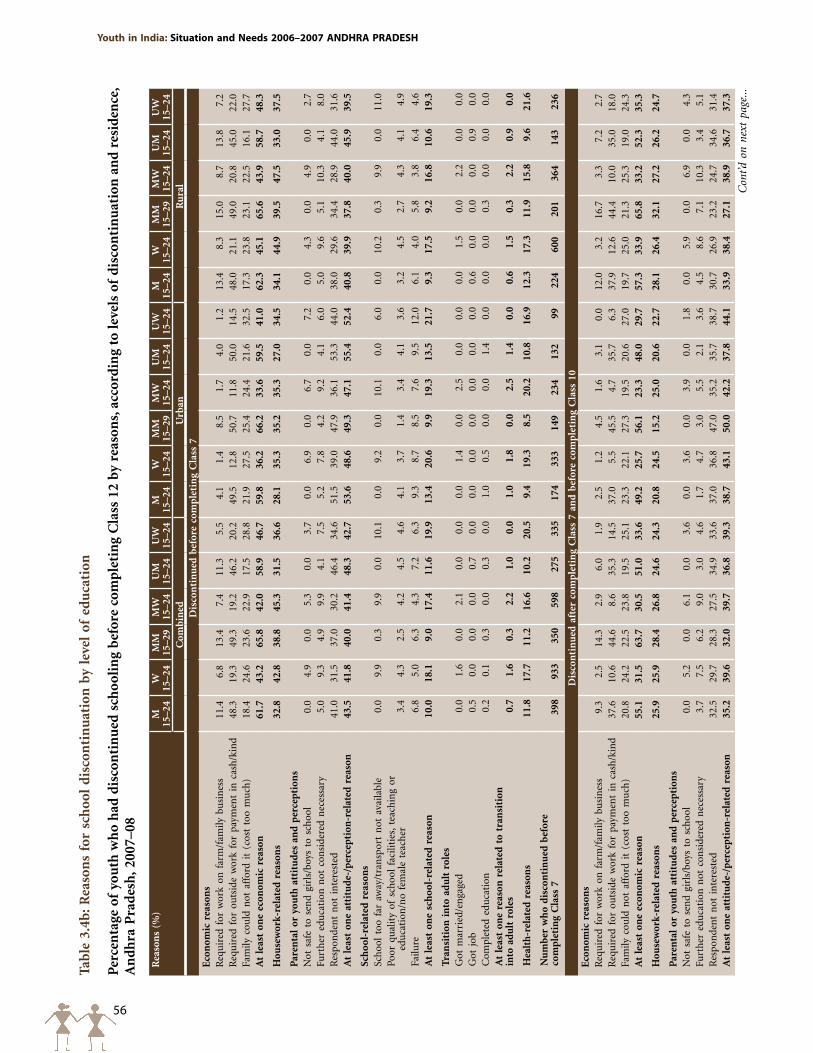
56
Youth in India: Situation and Needs 2006–2007 ANDHRA pRADESH
Tabl
e 3.
4b: R
easo
ns
for
sch
ool
dis
con
tin
uat
ion
by
leve
l of
ed
uca
tion
Per
cen
tage
of
you
th w
ho
had
dis
con
tin
ued
sch
ooli
ng
bef
ore
com
ple
tin
g C
lass
12
by r
easo
ns,
acc
ord
ing
to le
vels
of
dis
con
tin
uat
ion
an
d r
esid
ence
, A
nd
hra
Pra
des
h, 2
007–
08
Rea
son
s (%
)M
15–2
4W
15–2
4M
M15
–29
MW
15–2
4U
M15
–24
UW
15–2
4M
15–2
4W
15–2
4M
M15
–29
MW
15–2
4U
M15
–24
UW
15–2
4M
15–2
4W
15–2
4M
M15
–29
MW
15–2
4U
M15
–24
UW
15–2
4C
omb
ined
Urb
anR
ura
lD
isco
nti
nu
ed b
efor
e co
mp
leti
ng
Cla
ss 7
Eco
nom
ic r
easo
ns
Req
uir
ed f
or w
ork
on f
arm
/fam
ily b
usi
nes
s11
.46.
813
.47.
411
.35.
5 4
.11.
48.
51.
74.
01.
213
.48.
315
.08.
713
.87.
2R
equ
ired
for
ou
tsid
e w
ork
for
paym
ent
in c
ash
/kin
d48
.319
.349
.319
.246
.220
.249
.512
.850
.711
.850
.014
.548
.021
.149
.020
.845
.022
.0Fa
mily
cou
ld n
ot a
ffor
d it
(co
st t
oo m
uch
)18
.424
.623
.622
.917
.528
.8 2
1.9
27.5
25.4
24.4
21.6
32.5
17.3
23.8
23.1
22.5
16.1
27.7
At
leas
t on
e ec
onom
ic r
easo
n61
.743
.265
.842
.058
.946
.759
.836
.266
.233
.659
.541
.062
.345
.165
.643
.958
.748
.3
Hou
sew
ork-
rela
ted
rea
son
s32
.842
.838
.845
.331
.536
.628
.135
.335
.235
.327
.034
.534
.144
.939
.547
.533
.037
.5
Par
enta
l or
you
th a
ttit
ud
es a
nd
per
cep
tion
sN
ot s
afe
to s
end
girl
s/bo
ys t
o sc
hoo
l0.
04.
90.
05.
30.
03.
70.
06.
90.
06.
70.
07.
20.
04.
30.
04.
90.
02.
7Fu
rth
er e
duca
tion
not
con
side
red
nec
essa
ry5.
09.
34.
99.
94.
17.
55.
27.
84.
29.
24.
16.
05.
09.
65.
110
.34.
18.
0R
espo
nde
nt
not
in
tere
sted
41.0
31.5
37.0
30.2
46.4
34.6
51.5
39.0
47.9
36.1
53.3
44.0
38.0
29
.634
.428
.944
.031
.6
At
leas
t on
e at
titu
de-
/per
cep
tion
-rel
ated
rea
son
43.5
41.8
40.0
41.4
48.3
42.7
53.6
48.6
49.3
47.1
55.4
52.4
40.8
39.9
37.8
40.0
45.9
39.5
Sch
ool-
rela
ted
rea
son
sSc
hoo
l to
o fa
r aw
ay/t
ran
spor
t n
ot a
vaila
ble
0.0
9.9
0.3
9.9
0.0
10.1
0.0
9.2
0.0
10.1
0.0
6.0
0.0
10.2
0.3
9.9
0.0
11.0
Poor
qu
alit
y of
sch
ool
faci
litie
s, t
each
ing
or
edu
cati
on/n
o fe
mal
e te
ach
er3.
44.
32.
54.
24.
54.
64.
13.
71.
43.
44.
13.
63.
24.
52.
74.
34.
14.
9
Failu
re6.
85.
06.
34.
37.
26.
39.
38.
78.
57.
69.
512
.06.
14.
05.
83.
86.
44.
6A
t le
ast
one
sch
ool-
rela
ted
rea
son
10.0
18.1
9.0
17.4
11.6
19.9
13.4
20.6
9.9
19.3
13.5
21.7
9.3
17.5
9.2
16.8
10.6
19.3
Tran
siti
on i
nto
ad
ult
rol
esG
ot m
arri
ed/e
nga
ged
0.0
1.6
0.0
2.1
0.0
0.0
0.0
1.4
0.0
2.5
0.0
0.0
0.0
1.5
0.0
2.2
0.0
0.0
Got
job
0.5
0.0
0.0
0.0
0.7
0.0
0.0
0.0
0.0
0.0
0.0
0.0
0.6
0.0
0.0
0.0
0.9
0.0
Com
plet
ed e
duca
tion
0.2
0.1
0.3
0.0
0.3
0.0
1.0
0.5
0.0
0.0
1.4
0.0
0.0
0.0
0.3
0.0
0.0
0.0
At
leas
t on
e re
ason
rel
ated
to
tran
siti
on
into
ad
ult
rol
es0.
71.
6 0.
32.
21.
00.
01.
01.
80.
02.
51.
40.
00.
61.
50.
32.
20.
90.
0
Hea
lth
-rel
ated
rea
son
s11
.8
17.7
11.2
16.6
10.2
20.5
9.4
19.3
8.5
20.2
10.8
16.9
12.3
17.3
11.9
15.8
9.6
21.6
Nu
mb
er w
ho
dis
con
tin
ued
bef
ore
com
ple
tin
g C
lass
739
893
335
059
827
533
517
433
314
923
413
299
224
600
201
364
143
236
Dis
con
tin
ued
aft
er c
omp
leti
ng
Cla
ss 7
an
d b
efor
e co
mp
leti
ng
Cla
ss 1
0E
con
omic
rea
son
sR
equ
ired
for
wor
k on
far
m/f
amily
bu
sin
ess
9.3
2.5
14.3
2.9
6.0
1.9
2.5
1.2
4.5
1.6
3.1
0.0
12.0
3.2
16.7
3.3
7.2
2.7
Req
uir
ed f
or o
uts
ide
wor
k fo
r pa
ymen
t in
cas
h/k
ind
37.6
10.6
44.6
8.6
35.3
14.5
37.0
5.5
45.5
4.7
35.7
6.3
37.9
12.6
44.4
10.0
35.0
18.0
Fam
ily c
ould
not
aff
ord
it (
cost
too
mu
ch)
20.8
24.2
22.5
23.8
19.5
25.1
23.3
22.1
27.3
19.5
20.6
27.0
19.7
25.0
21.3
25.3
19.0
24.3
At
leas
t on
e ec
onom
ic r
easo
n55
.131
.563
.730
.551
.033
.649
.225
.756
.123
.348
.029
.757
.333
.965
.833
.252
.335
.3
Hou
sew
ork-
rela
ted
rea
son
s25
.925
.928
.426
.824
.624
.320
.824
.515
.225
.020
.622
.728
.126
.432
.127
.226
.224
.7
Par
enta
l or
you
th a
ttit
ud
es a
nd
per
cep
tion
sN
ot s
afe
to s
end
girl
s/bo
ys t
o sc
hoo
l0.
05.
20.
06.
10.
03.
60.
03.
60.
03.
90.
01.
80.
05.
90.
06.
90.
04.
3Fu
rth
er e
duca
tion
not
con
side
red
nec
essa
ry3.
77.
56.
29.
03.
04.
61.
74.
73.
05.
52.
13.
64.
58.
67.
110
.33.
45.
1R
espo
nde
nt
not
in
tere
sted
32.5
29.7
28.3
27.5
34.9
33.6
37.0
36.8
47.0
35.2
35.7
38.7
30.7
26.9
23.2
24.7
34.6
31.4
At
leas
t on
e at
titu
de-
/per
cep
tion
-rel
ated
rea
son
35.2
39.6
32.0
39.7
36.8
39.3
38.7
43.1
50.0
42.2
37.8
44.1
33.9
38.4
27.1
38.9
36.7
37.3
Con
t’d o
n ne
xt p
age.
..
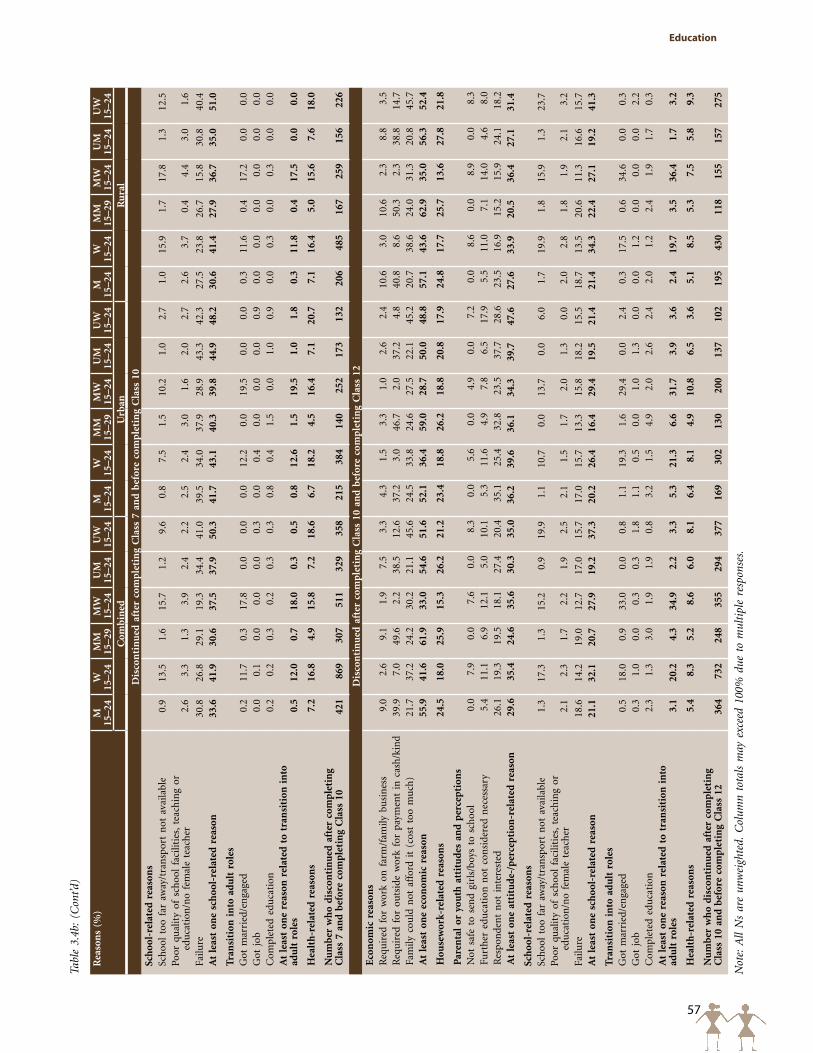
57
Education
Rea
son
s (%
)M
15–2
4W
15–2
4M
M15
–29
MW
15–2
4U
M15
–24
UW
15–2
4M
15–2
4W
15–2
4M
M15
–29
MW
15–2
4U
M15
–24
UW
15–2
4M
15–2
4W
15–2
4M
M15
–29
MW
15–2
4U
M15
–24
UW
15–2
4C
omb
ined
Urb
anR
ura
l
Dis
con
tin
ued
aft
er c
omp
leti
ng
Cla
ss 7
an
d b
efor
e co
mp
leti
ng
Cla
ss 1
0Sc
hoo
l-re
late
d r
easo
ns
Sch
ool
too
far
away
/tra
nsp
ort
not
ava
ilabl
e0.
913
.51.
6 1
5.7
1.2
9.6
0.8
7.5
1.5
10.2
1.0
2.7
1.0
15.9
1.7
17.8
1.3
12.5
Poor
qu
alit
y of
sch
ool
faci
litie
s, t
each
ing
or
edu
cati
on/n
o fe
mal
e te
ach
er2.
63.
31.
33.
92.
42.
22.
52.
43.
01.
62.
02.
72.
63.
70.
44.
43.
01.
6
Failu
re30
.826
.829
.119
.334
.441
.039
.534
.037
.928
.943
.342
.327
.523
.826
.715
.830
.840
.4A
t le
ast
one
sch
ool-
rela
ted
rea
son
33.6
41.9
30.6
37.5
37.9
50.3
41.7
43.1
40.3
39.8
44.9
48.2
30.6
41.4
27.9
36.7
35.0
51.0
Tran
siti
on i
nto
ad
ult
rol
esG
ot m
arri
ed/e
nga
ged
0.2
11.7
0.3
17.8
0.0
0.0
0.0
12.2
0.0
19.5
0.0
0.0
0.3
11.6
0.4
17.2
0.0
0.0
Got
job
0.0
0.1
0.0
0.0
0.0
0.3
0.0
0.4
0.0
0.0
0.0
0.9
0.0
0.0
0.0
0.0
0.0
0.0
Com
plet
ed e
duca
tion
0.2
0.2
0.3
0.2
0.3
0.3
0.8
0.4
1.5
0.0
1.0
0.9
0.0
0.3
0.0
0.3
0.0
0.0
At
leas
t on
e re
ason
rel
ated
to
tran
siti
on i
nto
ad
ult
rol
es0.
512
.00.
718
.00.
30.
50.
812
.61.
519
.51.
01.
80.
311
.80.
417
.50.
00.
0
Hea
lth
-rel
ated
rea
son
s7.
216
.84.
915
.87.
218
.66.
718
.24.
516
.47.
120
.77.
116
.45.
015
.67.
618
.0
Nu
mb
er w
ho
dis
con
tin
ued
aft
er c
omp
leti
ng
Cla
ss 7
an
d b
efor
e co
mp
leti
ng
Cla
ss 1
042
186
930
751
132
935
821
538
414
025
217
313
220
648
516
725
915
622
6
Dis
con
tin
ued
aft
er c
omp
leti
ng
Cla
ss 1
0 an
d b
efor
e co
mp
leti
ng
Cla
ss 1
2E
con
omic
rea
son
sR
equ
ired
for
wor
k on
far
m/f
amily
bu
sin
ess
9.0
2.6
9.1
1.9
7.5
3.3
4.3
1.5
3.3
1.0
2.6
2.4
10.6
3.0
10.6
2.3
8.8
3.5
Req
uir
ed f
or o
uts
ide
wor
k fo
r pa
ymen
t in
cas
h/k
ind
39.9
7.0
49.6
2.2
38.5
12.6
37.2
3.0
46.
72.
037
.24.
840
.88.
650
.32.
338
.814
.7Fa
mily
cou
ld n
ot a
ffor
d it
(co
st t
oo m
uch
)21
.737
.224
.230
.221
.145
.624
.533
.824
.627
.522
.145
.220
.738
.624
.031
.320
.845
.7A
t le
ast
one
econ
omic
rea
son
55.9
41.6
61.9
33.0
54.6
51.6
52.1
36.4
59.0
28.7
50.0
48.8
57.1
43.6
62.9
35.0
56.3
52.4
Hou
sew
ork-
rela
ted
rea
son
s24
.518
.025
.915
.326
.221
.223
.418
.826
.218
.820
.817
.924
.817
.725
.713
.627
.821
.8
Par
enta
l or
you
th a
ttit
ud
es a
nd
per
cep
tion
sN
ot s
afe
to s
end
girl
s/bo
ys t
o sc
hoo
l0.
07.
90.
07.
60.
08.
30.
05.
60.
04.
90.
07.
20.
08.
60.
08.
90.
08.
3Fu
rth
er e
duca
tion
not
con
side
red
nec
essa
ry5.
411
.16.
912
.15.
010
.15.
311
.64.
97.
86.
517
.95.
511
.07.
114
.04.
68.
0R
espo
nde
nt
not
in
tere
sted
26.1
19.3
19.5
18.1
27.4
20.4
35.1
25.4
32.8
23.5
37.7
28.6
23.5
16.9
15.2
15.9
24.1
18.2
At
leas
t on
e at
titu
de-
/per
cep
tion
-rel
ated
rea
son
29.6
35.4
24.6
35.6
30.3
35.0
36.2
39.6
36.1
34.3
39.7
47.6
27.6
33.9
20.5
36.4
27.1
31.4
Sch
ool-
rela
ted
rea
son
sSc
hoo
l to
o fa
r aw
ay/t
ran
spor
t n
ot a
vaila
ble
1.3
17.3
1.3
15.2
0.9
19.9
1.1
10.7
0.0
13.7
0.0
6.0
1.7
19.9
1.8
15.9
1.3
23.7
Poor
qu
alit
y of
sch
ool
faci
litie
s, t
each
ing
or
edu
cati
on/n
o fe
mal
e te
ach
er2.
12.
31.
72.
21.
92.
52.
11.
51.
72.
01.
30.
02.
02.
81.
81.
92.
13.
2
Failu
re18
.614
.2 1
9.0
12.7
17.0
15.7
17.0
15.7
13.3
15.8
18.2
15.5
18.7
13.5
20.6
11.3
16.6
15.7
At
leas
t on
e sc
hoo
l-re
late
d r
easo
n21
.132
.120
.727
.919
.237
.320
.226
.416
.429
.419
.521
.421
.434
.322
.427
.119
.241
.3
Tran
siti
on i
nto
ad
ult
rol
esG
ot m
arri
ed/e
nga
ged
0.5
18.0
0.9
33.0
0.0
0.8
1.1
19.3
1.6
29.4
0.0
2.4
0.3
17.5
0.6
34.6
0.0
0.3
Got
job
0.3
1.0
0.0
0.3
0.3
1.8
1.1
0.5
0.0
1.0
1.3
0.0
0.0
1.2
0.0
0.0
0.0
2.2
Com
plet
ed e
duca
tion
2.3
1.3
3.0
1.9
1.9
0.8
3.2
1.5
4.9
2.0
2.6
2.4
2.0
1.2
2.4
1.9
1.7
0.3
At
leas
t on
e re
ason
rel
ated
to
tran
siti
on i
nto
ad
ult
rol
es3.
120
.24.
334
.92.
23.
35.
321
.36.
631
.73.
93.
62.
419
.73.
536
.41.
73.
2
Hea
lth
-rel
ated
rea
son
s5.
48.
35.
28.
66.
08.
16.
48.
14.
910
.86.
53.
65.
18.
55.
37.
55.
89.
3
Nu
mb
er w
ho
dis
con
tin
ued
aft
er c
omp
leti
ng
Cla
ss 1
0 an
d b
efor
e co
mp
leti
ng
Cla
ss 1
236
473
224
835
529
437
716
930
213
020
013
710
219
543
011
815
515
727
5
Not
e: A
ll N
s ar
e un
wei
ghte
d. C
olum
n to
tals
may
exc
eed
100%
due
to
mul
tipl
e re
spon
ses.
Tabl
e 3.
4b:
(Con
t’d)
58
Youth in India: Situation and Needs 2006–2007 ANDHRA pRADESH
Among those who had completed just 1–6 years of schooling, three main sets of reasons for school discontinuation were cited by both young men and women: economic considerations, attitude or perception-related factors, and housework-related factors. Gender differences were evident. Among young men, for example, economic considerations (62%) and attitude or perception-related reasons (44%) dominated; fewer young men cited housework-related reasons (33%). Among young women, each of the three key reasons was cited by about or more than two in five (42–43%). School-related reasons were reported by relatively few young men and women (10% and 18%, respectively). Similar patterns were observed among the married and the unmarried, except that married young men were somewhat more likely than their unmarried counterparts to report economic reasons (66% versus 59%) and housework related reasons (39% versus 32%), and conversely less likely to report attitude or perception-related reasons (40% versus 48%); married young women were somewhat more likely than their unmarried counterparts to report housework-related reasons (45% versus 37%). Although reasons reported by rural and urban youth were somewhat similar, some notable differences were evident: urban youth were considerably more likely than the rural to cite attitude or perception-related reasons (54% versus 41% among young men; 49% versus 40% among young women), and conversely, less likely to cite housework related reasons (28% versus 34% among young men; 35% versus 45% among young women); urban young women were also less likely than their rural counterparts to cite economic reasons (36% versus 45%).
Among those who had completed Classes 7–9, gender differences in leading reasons reported for school discontinuation persisted. Among young women, leading reasons for discontinuation at this level were school-related, expressed by 42% of all young women; other reasons were attitude or perception-related (40%), economic (32%) and housework-related (26%). Among young men, economic reasons continued to dominate, reported by over half (55%), and were followed by attitude or perception-related and school-related reasons (34–35%) and housework-related reasons (26%). While reported by relatively few youth, considerably more young women than men reported a health-related reason (17% versus 7%). Findings also show that transitions into adult roles were rarely expressed as a reason for discontinuation at this level of education by young men but by more than one in ten young women (1% versus 12%). The leading sets of reasons indicated by married and unmarried youth as also urban and rural youth were by and large similar; with some notable exceptions. Married young men were more likely than unmarried young men to report economic (64% versus 51%); married young women were considerably less likely than their unmarried counterparts to report school-related reasons (38% versus 50%). In addition, as many as 18% of married young women reported marriage as a reason for school discontinuation. In addition, more rural than urban youth reported economic reasons. More urban than rural young men reported school-related reasons, notably academic failure, as a reason for school discontinuation; while corresponding rural-urban differences were not observed among young women (41–43%), it is notable that considerably more rural than urban young women reported long distances as a reason for school discontinuation (16% versus 8%) and fewer rural than urban young women reported academic failure as a reason (24% versus 34%).
Among those who had discontinued their education after completing Classes 10 or 11, leading sets of reasons cited for discontinuation were similar. Leading reasons for both young men and women were economic (56% and 42%, respectively), attitude or perception-related (30% and 35%, respectively), school-related (21% and 32%, respectively), and housework-related (25% and 18%, respectively). For considerable proportions—one in five—of young women, moreover, marriage was cited as the reason for school discontinuation. Of note is the finding that academic failure was cited as a reason for discontinuing education by fewer youth who discontinued their education at this level (19% of young men and 14% of young women) than those who discontinued their education in Classes 7–9 (31% of young men and 27% of young women).
Differences by marital status were mild among young men; among young women, however, the married were less likely than the unmarried to cite economic (33% versus 52%) and school-related reasons (28% versus 37%). Also notable is that a sizeable proportion of married young women—35%—reported discontinuing their education in order to marry. Rural-urban differences were evident in a few instances. For example, more rural than urban young women reported economic (44% versus 36%) and school-related reasons (34% versus 26%) and more urban than rural youth reported attitude or perception-related reasons (36% versus 28% among young men; 40% versus 34%
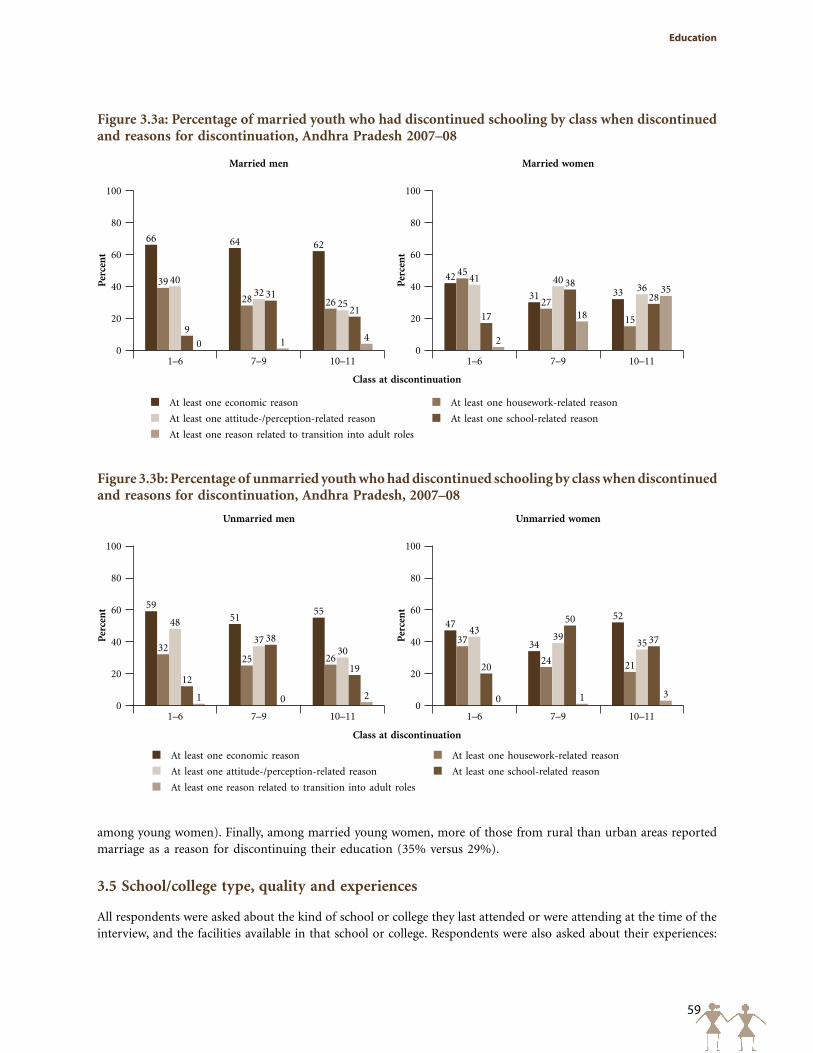
59
Education
among young women). Finally, among married young women, more of those from rural than urban areas reported marriage as a reason for discontinuing their education (35% versus 29%).
3.5 School/college type, quality and experiences
All respondents were asked about the kind of school or college they last attended or were attending at the time of the interview, and the facilities available in that school or college. Respondents were also asked about their experiences:
At least one economic reason
At least one attitude-/perception-related reason
At least one reason related to transition into adult roles
At least one housework-related reason
At least one school-related reason
Figure 3.3a: Percentage of married youth who had discontinued schooling by class when discontinued and reasons for discontinuation, Andhra Pradesh 2007–08
Per
cen
t
100
80
60
40
20
0
42
31 33
45
27
15
41 4036
17
38
28
2
18
35
Married women
Per
cen
t
100
80
60
40
20
0
66 64 62
39
28 26
4032
25
9
31
21
0 1 4
Married men
1–6 1–67–9 7–910–11 10–11
Class at discontinuation
Figure 3.3b: Percentage of unmarried youth who had discontinued schooling by class when discontinued and reasons for discontinuation, Andhra Pradesh, 2007–08
Per
cen
t
100
80
60
40
20
0
47
34
52
37
24 21
4339
35
20
50
37
0 1 3
Unmarried women
Per
cen
t
100
80
60
40
20
0
5951
55
3225 26
48
3730
12
38
19
1 0 2
Unmarried men
1–6 1–67–9 7–910–11 10–11
At least one economic reason
At least one attitude-/perception-related reason
At least one reason related to transition into adult roles
At least one housework-related reason
At least one school-related reason
Class at discontinuation
60
Youth in India: Situation and Needs 2006–2007 ANDHRA pRADESH
whether they attended classes regularly, their attitudes towards education and their performance in that school or college. Tables 3.5 and 3.6 present findings on type and quality of educational institutions most recently attended and schooling experiences, respectively; as school quality and experiences are unlikely to be different for the married and unmarried, information is provided by sex and rural-urban residence of respondents only. Moreover, because school/college quality and experiences may have differed for those who were still in school or college at the time of the interview and those who had discontinued their education, findings are presented separately by level of education attained, namely, for those currently in high school or higher secondary school or college (few youth were in primary or middle school at the time of interview) and those who had discontinued their education at primary or middle levels, high school level or before completing Class 12.
3.5.1 School/college type and quality
Findings presented in Table 3.5 show that the majority of youth irrespective of sex, level of education attained and current schooling status attended co-educational facilities. Typically, percentages studying in a co-educational facility declined with level of education attained. Gender differences were evident, particularly among those currently studying in higher secondary school or college; young men were considerably more likely than young women to attend a co-educational facility (90% versus 75%). Young men in urban areas were considerably more likely than young women to report co-educational school attendance, both at high school (95% versus 88%) and higher secondary school and college (88% versus 71%); among rural youth, this difference was only evident among those at secondary or higher levels of education (90% versus 80%). Among those who had discontinued their education, a generally similar pattern prevailed.
Attendance at government versus private educational facilities also varied. The majority of youth who had discontinued their education tended to have attended a government school or college; even so, percentages attending a government school or college declined with level at which education was discontinued (92–93%, 84–88% and 57–62% at primary/middle, high and higher secondary and higher levels, respectively). Among those continuing their education, percentages attending a government facility revealed a similar pattern: attendance declined from 69–72% among those at high school level to 40–41% among those at higher secondary or higher levels. More youth studying at higher secondary or higher levels were attending a private institution than those studying at high school level; 47–54% versus 26–28%. Irrespective of current schooling status gender differences were typically mild. Rural-urban differences indicate that more urban than rural youth attended a private educational institution, particularly among those still studying at the time of the interview; for example, among those studying at high school levels, 55% and 54% of young men and women in urban areas compared to 17% and 10%, respectively, in rural areas were attending a private educational institution. The only exception was that among young women who discontinued their education at higher secondary or higher levels, more of those from rural than urban settings had attended a private educational facility (37% versus 23%).
School quality was assessed by questions on the availability of drinking water, toilets, playgrounds and library facilities. Findings from Table 3.5 show vast differences between those pursuing their education at the time of the interview and those who had discontinued their education; differences were also observed by level of education attained and by type of amenity considered. Among those pursuing their education at the time of the interview, well over 90% of youth, irrespective of sex or rural-urban residence, had access to drinking water. Between 75% and 94% had access to playgrounds, and between 74% and 96% had access to toilet facilities. Library facilities were less likely to be available, and differences emerged by level of education attained—while 29–32% of those in high school had access to library facilities, 63–71% of those in higher secondary school or college did. By and large, more urban than rural youth reported toilet facilities (88–91% versus 68–82% among those in high school; 95–99% versus 82–93% among those at higher secondary and higher levels). At higher secondary levels, more urban than rural youth reported the availability of a library (76–79% compared to 56–61%). In contrast, fewer urban than rural youth attending high school reported the availability of a playground (78–88% and 87–97%, respectively).
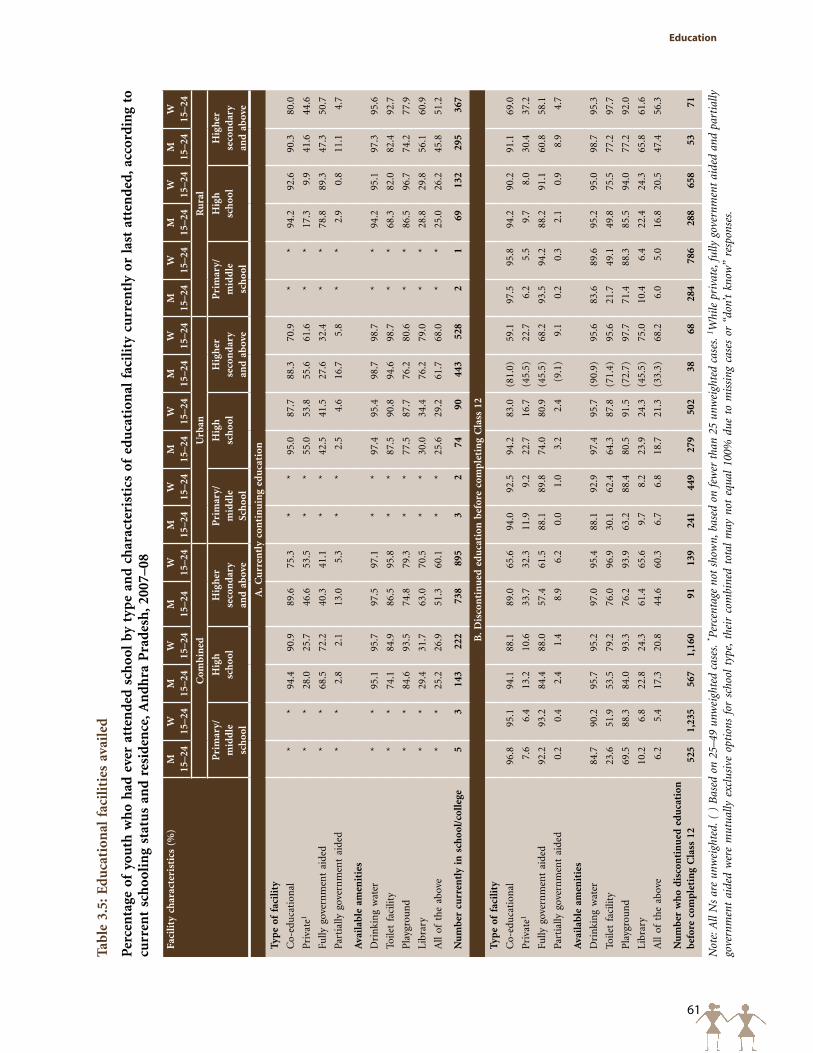
61
Education
Tabl
e 3.
5: E
du
cati
onal
fac
ilit
ies
avai
led
Per
cen
tage
of
you
th w
ho
had
eve
r at
ten
ded
sch
ool
by t
ype
and
ch
arac
teri
stic
s of
ed
uca
tion
al f
acil
ity
curr
entl
y or
las
t at
ten
ded
, acc
ord
ing
to
curr
ent
sch
ooli
ng
stat
us
and
res
iden
ce, A
nd
hra
Pra
des
h, 2
007–
08
Faci
lity
ch
arac
teri
stic
s (%
)M
15–2
4W
15–2
4M
15–2
4W
15–2
4M
15–2
4W
15–2
4M
15–2
4W
15–2
4M
15–2
4W
15–2
4M
15–2
4W
15–2
4M
15–2
4W
15–2
4M
15–2
4W
15–2
4M
15–2
4W
15–2
4
Com
bin
edU
rban
Ru
ral
Pri
mar
y/
mid
dle
sc
hoo
l
Hig
hsc
hoo
lH
igh
erse
con
dar
yan
d a
bov
e
Pri
mar
y/m
idd
leSc
hoo
l
Hig
hsc
hoo
lH
igh
erse
con
dar
yan
d a
bov
e
Pri
mar
y/m
idd
lesc
hoo
l
Hig
hsc
hoo
lH
igh
erse
con
dar
yan
d a
bov
e
A. C
urr
entl
y co
nti
nu
ing
edu
cati
on
Typ
e of
fac
ilit
y
Co-
edu
cati
onal
*
*94
.490
.989
.675
.3*
*95
.087
.788
.370
.9*
*94
.292
.690
.380
.0
Pri
vate
1*
*28
.025
.746
.653
.5*
*55
.053
.855
.661
.6*
*17
.39.
941
.644
.6
Fully
gov
ern
men
t ai
ded
**
68.5
72.2
40.3
41.1
**
42.5
41.5
27.6
32.4
**
78.8
89.3
47.3
50.7
Part
ially
gov
ern
men
t ai
ded
**
2.8
2.1
13.0
5.3
**
2.5
4.6
16.7
5.8
**
2.9
0.8
11.1
4.7
Ava
ilab
le a
men
itie
s
Dri
nki
ng
wat
er
**
95.1
95.7
97.5
97.1
**
97.4
95.4
98.7
98.7
**
94.2
95.1
97.3
95.6
Toile
t fa
cilit
y *
*74
.184
.986
.595
.8*
*87
.590
.894
.698
.7*
*68
.382
.082
.492
.7
Pla
ygro
un
d *
*84
.693
.574
.879
.3*
*77
.587
.776
.280
.6*
*86
.596
.774
.277
.9
Libr
ary
**
29.4
31.7
63.0
70.5
**
30.0
34.4
76.2
79.0
**
28.8
29.8
56.1
60.9
All
of t
he
abov
e*
*25
.226
.951
.360
.1*
*25
.629
.261
.768
.0*
*25
.026
.245
.851
.2
Nu
mb
er c
urr
entl
y in
sch
ool/
coll
ege
53
143
222
738
895
32
7490
443
528
21
6913
229
536
7
B. D
isco
nti
nu
ed e
du
cati
on b
efor
e co
mp
leti
ng
Cla
ss 1
2
Typ
e of
fac
ilit
y
Co-
edu
cati
onal
96
.895
.194
.188
.189
.065
.694
.092
.594
.283
.0(8
1.0)
59.1
97.5
95.8
94.2
90.2
91.1
69.0
Pri
vate
1 7.
66.
413
.210
.633
.732
.311
.99.
222
.716
.7(4
5.5)
22.7
6.2
5.5
9.7
8.0
30.4
37.2
Fully
gov
ern
men
t ai
ded
92.2
93.2
84.4
88.0
57.4
61.5
88.1
89.8
74.0
80.9
(45.
5)68
.293
.594
.288
.291
.160
.858
.1
Part
ially
gov
ern
men
t ai
ded
0.2
0.4
2.4
1.4
8.9
6.2
0.0
1.0
3.2
2.4
(9.1
)9.
10.
20.
32.
10.
98.
94.
7
Ava
ilab
le a
men
itie
s
Dri
nki
ng
wat
er
84.7
90.2
95.7
95.2
97.0
95.4
88.1
92.9
97.4
95.7
(90.
9)95
.683
.689
.695
.295
.098
.795
.3
Toile
t fa
cilit
y 23
.651
.953
.579
.276
.096
.930
.162
.464
.387
.8(7
1.4)
95.6
21.7
49.1
49.8
75.5
77.2
97.7
Pla
ygro
un
d 69
.588
.384
.093
.376
.293
.963
.288
.480
.591
.5(7
2.7)
97.7
71.4
88.3
85.5
94.0
77.2
92.0
Libr
ary
10.2
6.8
22.8
24.3
61.4
65.6
9.7
8.2
23.9
24.3
(45.
5)75
.010
.46.
422
.424
.365
.861
.6
All
of t
he
abov
e6.
25.
417
.320
.844
.660
.36.
76.
818
.721
.3(3
3.3)
68.2
6.0
5.0
16.8
20.5
47.4
56.3
Nu
mb
er w
ho
dis
con
tin
ued
ed
uca
tion
b
efor
e co
mp
leti
ng
Cla
ss 1
252
51,
235
567
1,16
091
139
241
449
279
502
3868
284
786
288
658
5371
Not
e: A
ll N
s ar
e un
wei
ghte
d. (
) B
ased
on
25–4
9 un
wei
ghte
d ca
ses.
* Perc
enta
ge n
ot s
how
n, b
ased
on
few
er t
han
25 u
nwei
ghte
d ca
ses.
1 Whi
le p
riva
te, f
ully
gov
ernm
ent
aide
d an
d pa
rtia
lly
gove
rnm
ent
aide
d w
ere
mut
ually
exc
lusi
ve o
ptio
ns f
or s
choo
l ty
pe,
thei
r co
mbi
ned
tota
l m
ay n
ot e
qual
100
% d
ue t
o m
issi
ng c
ases
or
“don
’t kn
ow”
resp
onse
s.
62
Youth in India: Situation and Needs 2006–2007 ANDHRA pRADESH
The situation was somewhat different among youth who had discontinued their education. Drinking water was available at schools/colleges attended by over 80% of youth, irrespective of the level at which they had discontinued their education, and irrespective of sex and rural-urban residence. Likewise, 70% or more youth, irrespective of the level at which they had discontinued their education, reported that a playground was available in the school/college they attended. Access to toilet facilities was more likely to be reported by young women than men, and by those who had discontinued their education at progressively higher levels. For example, 24% of young men, compared to 52% of young women who had discontinued their education at primary or middle levels reported that toilet facilities were available; considerably larger proportions of young men and women who had discontinued at high school (54% and 79%, respectively) or higher secondary levels (76% and 97%, respectively) reported the availability of toilets. With regard to the availability of library facilities, similarly, access increased with level at which education was discontinued (10%, 23% and 61%, respectively, at each of the three levels of education among young men who had discontinued their education; and 7%, 24% and 66%, respectively, among young women). Rural-urban differences were evident in some instances; for example, availability of toilet facilities were more likely to be reported by urban than rural youth, particularly at primary or middle level and high school levels.
The availability of all four amenities—drinking water, playgrounds, toilets and libraries—increased systematically with level of schooling attained among all youth, irrespective of whether or not they had discontinued their education. Among those still in school, all four amenities were available to 25% and 27% of young men and women, respectively, in high school and 51% and 60% of young men and women, respectively, at higher levels. Among those who had discontinued their education, the availability of all four amenities increased from 5–6% among those who had discontinued their education at primary or middle school levels, to 17–21% among those who had discontinued at high school, and 45–60% among those who had discontinued at higher levels. Gender differences were relatively narrow, however, more young women than men women who were currently studying at higher secondary or college levels or had discontinued their education at these levels reported the availability of all four amenities. Rural-urban differences were also narrow, except that urban youth attending higher secondary schools and colleges were more likely than their rural counterparts to have access to all four amenities. Also narrow were differences in the availability of all four amenities reported by those who were studying at the time of the interview than those who had discontinued their education; in most instances, those pursuing their education were, however, somewhat more likely than those who had discontinued their education to report so.
3.5.2 School/college experiences
Table 3.6 presents young people’s schooling experiences, namely, whether or not they attended class regularly, took private tuition, considered the academic workload to be heavy and had passed the last examination for which they had appeared. Among those still in school or college, almost all youth (95% or more) reported that they attended classes regularly, almost all youth reported that they had passed the last examination for which they had appeared (96–99%) and relatively few youth (10–19%) reported feeling that the academic workload was heavy. In contrast, 42% and 36% of young men and women in high school and considerably fewer, 20% and 14%, respectively, of those at higher secondary or higher levels, reported that they had taken private tuition. Rural-urban differences were notably narrow on most indicators; however, among those in high school, urban youth were somewhat more likely than their rural counterparts to have attended coaching classes. Additionally, among those in high school young men in rural areas were somewhat more likely than those in urban areas to feel that the academic workload was heavy.
Among youth who had discontinued their education, regular attendance was reported by 70% or more youth, irrespective of sex, rural-urban residence and level at which education was discontinued. As far as private tuition was concerned, few (10–11%) of those who discontinued at primary or middle school levels had taken private tuition, compared to 27–33% and 15–22% of those who discontinued at high school or higher levels, respectively. Between 28% and 44% of young men and somewhat fewer young women—22% to 27%—perceived the academic workload to be heavy. Finally, percentages who passed the last examination for which they had appeared declined systematically as level of education increased: 79%, 65% and 24% of young men, and 88%, 70% and 28% of young women who discontinued at primary/middle school, high school, or higher secondary or higher levels, respectively.
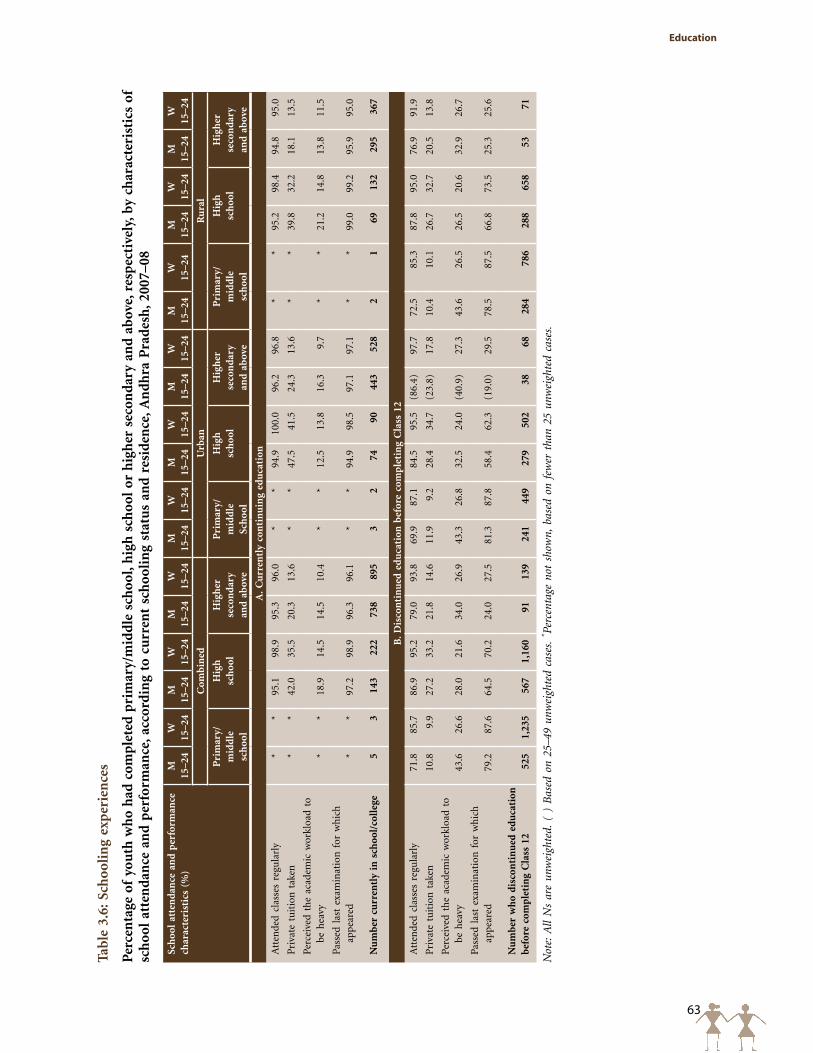
63
Education
Tabl
e 3.
6: S
choo
lin
g ex
per
ien
ces
Per
cen
tage
of
you
th w
ho
had
com
ple
ted
pri
mar
y/m
idd
le s
choo
l, h
igh
sch
ool
or h
igh
er s
econ
dar
y an
d a
bov
e, r
esp
ecti
vely
, by
char
acte
rist
ics
of
sch
ool
atte
nd
ance
an
d p
erfo
rman
ce, a
ccor
din
g to
cu
rren
t sc
hoo
lin
g st
atu
s an
d r
esid
ence
, An
dh
ra P
rad
esh
, 200
7–08
Sch
ool
atte
nd
ance
an
d p
erfo
rman
ce
char
acte
rist
ics
(%)
M15
–24
W15
–24
M15
–24
W15
–24
M15
–24
W15
–24
M15
–24
W15
–24
M15
–24
W15
–24
M15
–24
W15
–24
M15
–24
W15
–24
M15
–24
W15
–24
M15
–24
W15
–24
Com
bin
edU
rban
Ru
ral
Pri
mar
y/
mid
dle
sc
hoo
l
Hig
hsc
hoo
lH
igh
erse
con
dar
yan
d a
bov
e
Pri
mar
y/m
idd
leSc
hoo
l
Hig
hsc
hoo
lH
igh
erse
con
dar
yan
d a
bov
e
Pri
mar
y/m
idd
lesc
hoo
l
Hig
hsc
hoo
lH
igh
erse
con
dar
yan
d a
bov
e
A. C
urr
entl
y co
nti
nu
ing
edu
cati
on
Att
ende
d cl
asse
s re
gula
rly
**
95.1
98.9
95.3
96.0
**
94.9
100.
096
.296
.8*
*95
.298
.494
.895
.0
Pri
vate
tu
itio
n t
aken
**
42.0
35.5
20.3
13.6
**
47.5
41.5
24.3
13.6
**
39.8
32.2
18.1
13.5
Perc
eive
d th
e ac
adem
ic w
orkl
oad
to
be h
eavy
**
18.9
14.5
14.5
10.4
**
12.5
13.8
16.3
9.7
**
21.2
14.8
13.8
11.5
Pass
ed l
ast
exam
inat
ion
for
wh
ich
ap
pea
red
**
97.2
98.9
96.3
96.1
**
94.9
98.5
97.1
97.1
**
99.0
99.2
95.9
95.0
Nu
mb
er c
urr
entl
y in
sch
ool/
coll
ege
53
143
222
738
895
32
7490
443
528
21
6913
229
536
7
B. D
isco
nti
nu
ed e
du
cati
on b
efor
e co
mp
leti
ng
Cla
ss 1
2
Att
ende
d cl
asse
s re
gula
rly
71.8
85.7
86.9
95.2
79.0
93.8
69.9
87.1
84.5
95.5
(86.
4)97
.772
.585
.387
.895
.076
.991
.9
Pri
vate
tu
itio
n t
aken
10.8
9.9
27.2
33.2
21.8
14.6
11.9
9.2
28.4
34.7
(23.
8)17
.810
.410
.126
.732
.720
.513
.8
Perc
eive
d th
e ac
adem
ic w
orkl
oad
to
be h
eavy
43.6
26.6
28.0
21.6
34.0
26.9
43.3
26.8
32.5
24.0
(40.
9)27
.343
.626
.526
.520
.632
.926
.7
Pass
ed l
ast
exam
inat
ion
for
wh
ich
ap
pea
red
79.2
87.6
64.5
70.2
24.0
27.5
81.3
87.8
58.4
62.3
(19.
0)29
.578
.587
.566
.873
.525
.325
.6
Nu
mb
er w
ho
dis
con
tin
ued
ed
uca
tion
b
efor
e co
mp
leti
ng
Cla
ss 1
252
51,
235
567
1,16
091
139
241
449
279
502
3868
284
786
288
658
5371
Not
e: A
ll N
s ar
e un
wei
ghte
d. (
) B
ased
on
25–4
9 un
wei
ghte
d ca
ses.
* Perc
enta
ge n
ot s
how
n, b
ased
on
few
er t
han
25 u
nwei
ghte
d ca
ses.
64
Youth in India: Situation and Needs 2006–2007 ANDHRA pRADESH
Rural-urban differences were narrow, however, fewer urban than rural youth who had discontinued their education at high school level had passed the last examination for which they had appeared and more urban than rural youth who discontinued their education at higher secondary and above level had attended classes regularly.
Schooling experiences were different among those who had discontinued schooling and those who were studying at the time of the interview. For example, youth who were pursuing their education at the time of the interview were less likely than those who had discontinued their education to report feelin g that the academic workload was heavy and somewhat more likely to have attended classes regularly. A much wider difference was observed in reporting of school performance: while almost all youth who were still in school reported passing the last examination for which they had appeared (96–99%), only 65% and 70% of young men and women, respectively, who had discontinued their education at high school level, and even fewer (24% and 28%, respectively) of those who had discontinued at higher levels, so reported. Clearly, academic failure was an important factor precipitating school discontinuation for both young men and young women.
3.6 Summary
While youth in Andhra Pradesh were better educated than the population at large in the state, schooling was far from universal among young people. As many as one in twelve young men and one in five young women had never attended school. Findings show, moreover, that young women in rural areas and married young women in general were particularly disadvantaged; about one-third of married young women and one quarter of women residing in rural areas had never been to school. At the time of the interview, about two-fifths of unmarried youth (and very few married) were still in school or college, and gender differences were negligible.
Not only was school enrolment limited, but school completion rates were also low among young people, particularly among young women. For example, among young women, of those who had completed Class 1, only 95% had completed Class 4, and completion rates fell below 90% in Class 5. Among young men, completion rates fell below 90% a year later, that is, in Class 6. Declines in school completion were steep, among both young men and women at around the time of high school completion, that is, between Classes 9 and 11, suggesting that many youth discontinued their education at high school level. Indeed, just 52% of young men and 36% of young women in the state had completed high school.
Leading reasons for never attending school among young men and women were economic (for example, the respondent was required for work on the family farm/business or for outside wage earning work, or the family could not afford school-related expenses), attitude and perception-related (for example, education was unnecessary or the respondent was not interested in schooling) and housework-related reasons (the respondent was required for care of siblings or housework).
Among those who had ever been to school, gender differences in reasons for school discontinuation became more apparent. Leading reasons for school discontinuation among young men were economic and attitude and perception-related, irrespective of level at which education was discontinued. Far fewer young men cited school-related reasons. Among young women, in contrast, while economic and attitude and perception-related reasons were important, school-related reasons (academic failure, distance to school, poor school quality and infrastructure) were prominent factors underlying discontinuation at all levels; housework responsibilities were also significant, particularly among those who discontinued at primary or middle school levels. Of note are findings that more than one quarter of youth who discontinued their education before completing high school cited academic failure as a reason for discontinuing their education; and that one in five married young women who discontinued their education in Classes 7–9 and one-third of those who discontinued their education in Classes 10–11 reported doing so in order to marry.
As far as type of educational facility youth attended is concerned, while the majority of young men and women attended co-educational facilities at all levels of education, young women were less likely to attend a co-educational
65
Education
facility at higher secondary school and college levels. Typically, more youth who had discontinued their education reported government school attendance than did those who were pursuing their education; private school attendance was reported, moreover, among large proportions who were pursuing a higher secondary or college education or had discontinued their education at this level; while gender differences were relatively mild, youth from urban areas were considerably more likely than their rural counterparts to have attended a private school or college.
Most youth, irrespective of whether they were pursuing their education or not, had access to drinking water and playgrounds. However, for the most part, youth still studying were somewhat more likely, to report the availability of toilets as well as libraries than those who had discontinued their education. The availability of all four amenities was, for the most part, somewhat more likely to be reported by those who were studying at the time of the interview than those who had discontinued their education. Gender and rural-urban differences were, by and large, narrow.
Schooling experiences differed in some instances between those who had discontinued schooling and those who were studying at the time of the interview. While differences in experience of private tuition were typically narrow, those who had discontinued their education were more likely than those who were still in school to perceive the academic workload to be heavy and somewhat less likely to have attended classes regularly. They were considerably less likely, moreover, to have passed the last examination for which they had appeared, suggesting that poor school performance was a significant factor leading to school discontinuation among both young men and women.
66
Youth in India: Situation and Needs 2006–2007 ANDHRA pRADESH
Chapter 4
Economic and non-economic activity
The period between the ages of 15 and 29 marks, for many young people, entry into the labour market and economic independence, acquisition of professional and technical skills and new living arrangements. Economic uncertainty, however, dominates the lives of many youth. According to International Labour Organisation (ILO) estimates, although youth (aged 15–24) comprise around 25% of the world’s working-age population, they constitute around 44% of the unemployed (ILO, 2006). The unemployment rate among youth has also been identified as one of the key indicators for monitoring the progress towards achieving the UN Millennium Development Goals (UNDP, 2000). For many young people, this period also marks the discontinuation of education and increasing acceptance of domestic responsibilities. This chapter explores the economic activity of young people, their work-related mobility, their participation in non-economic activities (domestic work) and their vocational skill-building experiences and preferences.
4.1 Economic activity
During the survey, a number of questions were asked to assess the economic activity and occupational status of youth. Youth were asked whether they had ever worked, either for or without remuneration. They were also asked whether they had worked in the 12 months preceding the interview, whether they were seeking employment, the type of work in which they engaged, and the number of months during which they had worked or sought work in the year preceding the interview.
Work profiles varied widely, as shown in Table 4.1. In total, three-fourths of young men and three-fifths of young women reported that they had been engaged in paid or unpaid work at some point in their lives. They were, moreover, more likely to have been engaged in paid than in unpaid work: 71% and 26%, respectively, among young men, 53% and 26%, respectively, among young women. Marital status differences indicate that the married were more likely than the unmarried to have engaged in paid or unpaid work. Differences were wide, particularly among young men. Almost all married young men compared to 71% of unmarried young men reported ever having worked; among young women, correspondingly, 70% and 48%, respectively, had ever worked. Rural-urban differences suggest, moreover, that more rural than urban youth had ever worked—79% versus 68% of young men and 70% versus 37% of young women.
For many, work was initiated in childhood or early adolescence, that is, by age 15; 37% of young men and 39% of young women reported that they had initiated either paid or unpaid work before age 15. More married than unmarried and more rural than urban youth had initiated economic activity from an early age, irrespective of sex.
Table 4.1 also presents the percentages of youth reporting that they had worked any time in the 12 months prior to the interview. We note that the measure of work in the year prior to the interview covers a wide range of experiences that go beyond what is typically considered an employment rate (for example, as per the usual principal status definition, employment is defined as those who worked for the major part of the year preceding the interview as a fraction of those in the labour force, that is, those who had worked or had sought work for the major part of the year). Included in our measure of work are youth who worked for any length of time during the year as a proportion of all youth irrespective of whether they had worked or sought work in the year preceding the interview.
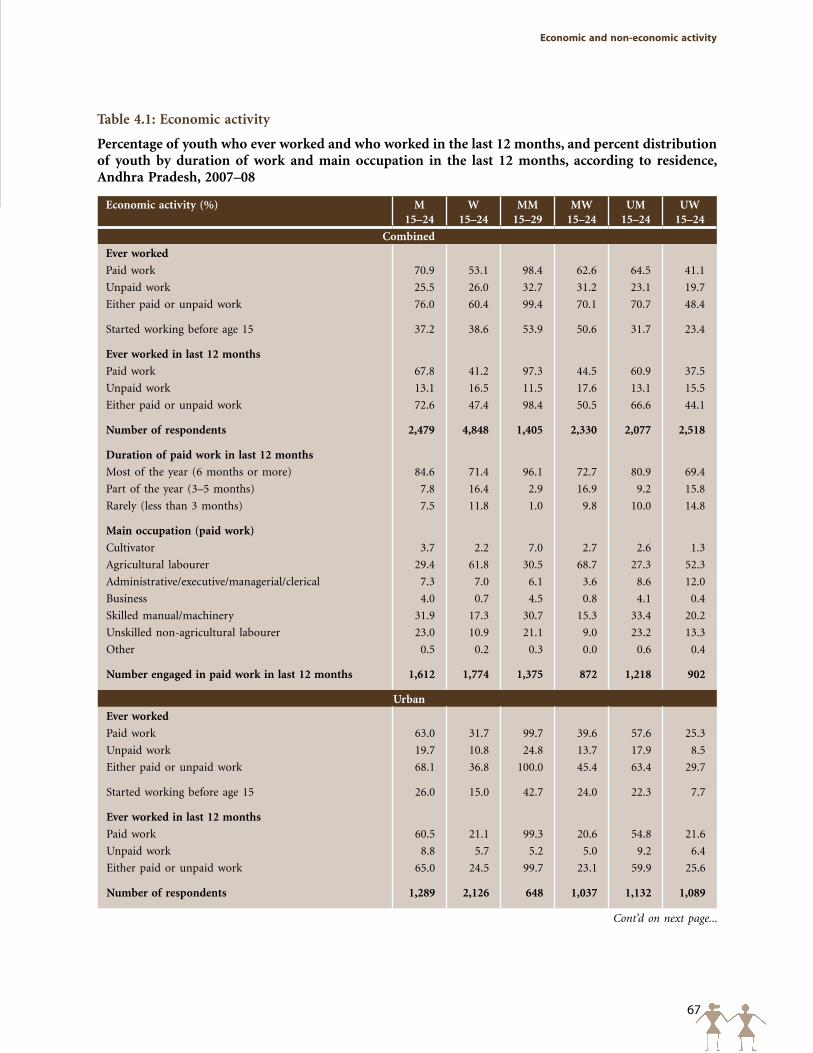
67
Economic and non-economic activity
Table 4.1: Economic activity
Percentage of youth who ever worked and who worked in the last 12 months, and percent distribution of youth by duration of work and main occupation in the last 12 months, according to residence, Andhra Pradesh, 2007–08
Economic activity (%) M15–24
W15–24
MM15–29
MW15–24
UM15–24
UW15–24
Combined
Ever worked
Paid work 70.9 53.1 98.4 62.6 64.5 41.1
Unpaid work 25.5 26.0 32.7 31.2 23.1 19.7
Either paid or unpaid work 76.0 60.4 99.4 70.1 70.7 48.4
Started working before age 15 37.2 38.6 53.9 50.6 31.7 23.4
Ever worked in last 12 months
Paid work 67.8 41.2 97.3 44.5 60.9 37.5
Unpaid work 13.1 16.5 11.5 17.6 13.1 15.5
Either paid or unpaid work 72.6 47.4 98.4 50.5 66.6 44.1
Number of respondents 2,479 4,848 1,405 2,330 2,077 2,518
Duration of paid work in last 12 months
Most of the year (6 months or more) 84.6 71.4 96.1 72.7 80.9 69.4
Part of the year (3–5 months) 7.8 16.4 2.9 16.9 9.2 15.8
Rarely (less than 3 months) 7.5 11.8 1.0 9.8 10.0 14.8
Main occupation (paid work)
Cultivator 3.7 2.2 7.0 2.7 2.6 1.3
Agricultural labourer 29.4 61.8 30.5 68.7 27.3 52.3
Administrative/executive/managerial/clerical 7.3 7.0 6.1 3.6 8.6 12.0
Business 4.0 0.7 4.5 0.8 4.1 0.4
Skilled manual/machinery 31.9 17.3 30.7 15.3 33.4 20.2
Unskilled non-agricultural labourer 23.0 10.9 21.1 9.0 23.2 13.3
Other 0.5 0.2 0.3 0.0 0.6 0.4
Number engaged in paid work in last 12 months 1,612 1,774 1,375 872 1,218 902
Urban
Ever worked
Paid work 63.0 31.7 99.7 39.6 57.6 25.3
Unpaid work 19.7 10.8 24.8 13.7 17.9 8.5
Either paid or unpaid work 68.1 36.8 100.0 45.4 63.4 29.7
Started working before age 15 26.0 15.0 42.7 24.0 22.3 7.7
Ever worked in last 12 months
Paid work 60.5 21.1 99.3 20.6 54.8 21.6
Unpaid work 8.8 5.7 5.2 5.0 9.2 6.4
Either paid or unpaid work 65.0 24.5 99.7 23.1 59.9 25.6
Number of respondents 1,289 2,126 648 1,037 1,132 1,089
Cont’d on next page...
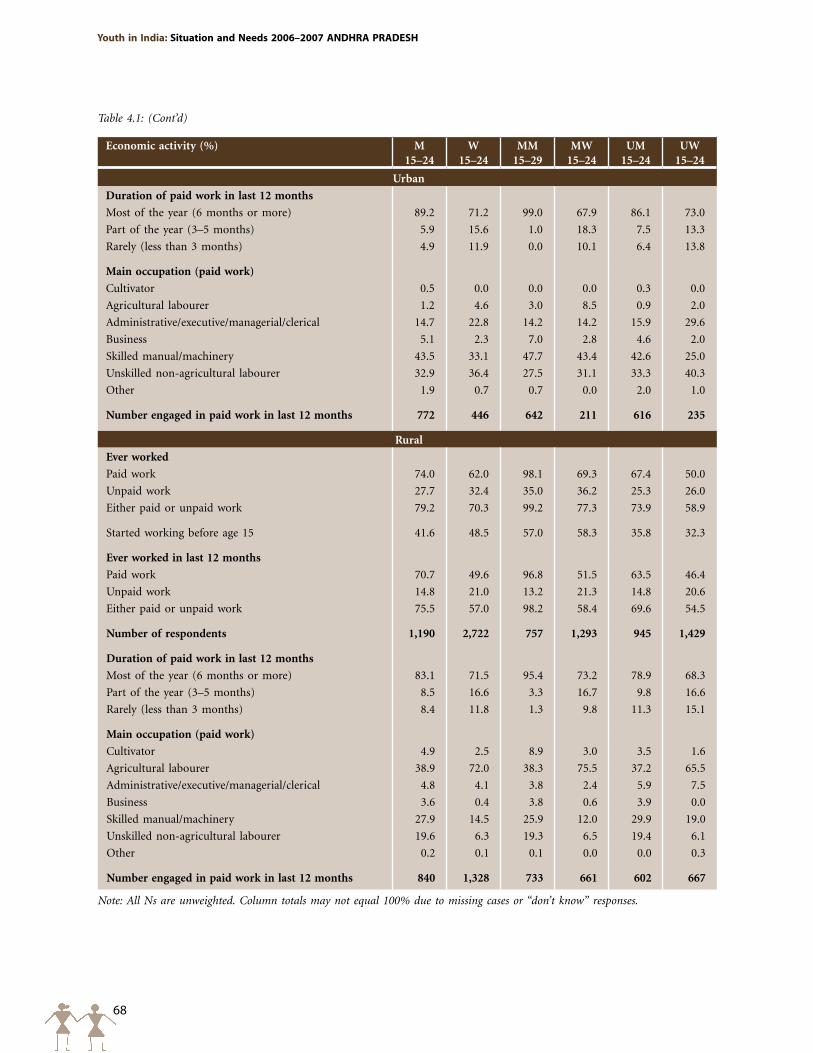
68
Youth in India: Situation and Needs 2006–2007 ANDHRA pRADESH
Economic activity (%) M15–24
W15–24
MM15–29
MW15–24
UM15–24
UW15–24
Urban
Duration of paid work in last 12 months
Most of the year (6 months or more) 89.2 71.2 99.0 67.9 86.1 73.0
Part of the year (3–5 months) 5.9 15.6 1.0 18.3 7.5 13.3
Rarely (less than 3 months) 4.9 11.9 0.0 10.1 6.4 13.8
Main occupation (paid work)
Cultivator 0.5 0.0 0.0 0.0 0.3 0.0
Agricultural labourer 1.2 4.6 3.0 8.5 0.9 2.0
Administrative/executive/managerial/clerical 14.7 22.8 14.2 14.2 15.9 29.6
Business 5.1 2.3 7.0 2.8 4.6 2.0
Skilled manual/machinery 43.5 33.1 47.7 43.4 42.6 25.0
Unskilled non-agricultural labourer 32.9 36.4 27.5 31.1 33.3 40.3
Other 1.9 0.7 0.7 0.0 2.0 1.0
Number engaged in paid work in last 12 months 772 446 642 211 616 235
Rural
Ever worked
Paid work 74.0 62.0 98.1 69.3 67.4 50.0
Unpaid work 27.7 32.4 35.0 36.2 25.3 26.0
Either paid or unpaid work 79.2 70.3 99.2 77.3 73.9 58.9
Started working before age 15 41.6 48.5 57.0 58.3 35.8 32.3
Ever worked in last 12 months
Paid work 70.7 49.6 96.8 51.5 63.5 46.4
Unpaid work 14.8 21.0 13.2 21.3 14.8 20.6
Either paid or unpaid work 75.5 57.0 98.2 58.4 69.6 54.5
Number of respondents 1,190 2,722 757 1,293 945 1,429
Duration of paid work in last 12 months
Most of the year (6 months or more) 83.1 71.5 95.4 73.2 78.9 68.3
Part of the year (3–5 months) 8.5 16.6 3.3 16.7 9.8 16.6
Rarely (less than 3 months) 8.4 11.8 1.3 9.8 11.3 15.1
Main occupation (paid work)
Cultivator 4.9 2.5 8.9 3.0 3.5 1.6
Agricultural labourer 38.9 72.0 38.3 75.5 37.2 65.5
Administrative/executive/managerial/clerical 4.8 4.1 3.8 2.4 5.9 7.5
Business 3.6 0.4 3.8 0.6 3.9 0.0
Skilled manual/machinery 27.9 14.5 25.9 12.0 29.9 19.0
Unskilled non-agricultural labourer 19.6 6.3 19.3 6.5 19.4 6.1
Other 0.2 0.1 0.1 0.0 0.0 0.3
Number engaged in paid work in last 12 months 840 1,328 733 661 602 667
Note: All Ns are unweighted. Column totals may not equal 100% due to missing cases or “don’t know” responses.
Table 4.1: (Cont’d)
69
Economic and non-economic activity
Percentages of youth who had worked in the last 12 months largely mirrored lifetime economic activity for young men. Among young women, this was true for the unmarried. Considerably fewer married young women reported economic activity in the last 12 months compared to lifetime economic activity (51% compared to 70%), a finding that may be attributed to conflict with childbearing and childrearing activities, on the one hand, and the tendency of married young women to be secluded from outside work, on the other.
Findings also suggest that among young men and women who worked for remuneration in the year prior to the interview, most young men (85%) and somewhat fewer young women (71%) worked for at least six months of the year. Marital status differences were not wide among young women, but more married than unmarried young men reported working for most of the year, and this pattern prevailed in both urban and rural settings. Differences by rural-urban residence were narrow, with similar proportions of youth in urban and rural areas reporting working for most of the year (83% and 89% among young men in rural and urban areas, respectively; 72% and 71%, respectively, among young women).
Occupational distributions of those engaged in remunerated work in the 12 months preceding the interview differed widely between young men and women. Young men were far more likely than young women to be engaged in skilled manual labour (32% versus 17%) and unskilled non-agricultural labour (23% versus 11%) and far less likely to be employed as agricultural labourers (29% versus 62%).
Occupational distributions also differed widely among youth in rural and urban areas. Leading occupations for young men in rural areas were agricultural labour (39%), skilled manual labour (28%) and unskilled non-agricultural labour (20%). In contrast, young men in urban areas were most likely to report skilled manual labour (44%), unskilled non-agricultural labour (33%) and administrative, executive, managerial and clerical occupations (15%). While percentages differed, the three leading occupations reported by young women in rural and urban areas, respectively, resembled those of young men. For example, in rural areas, as many as 72% of working young women were engaged in agricultural labour, while skilled manual labour and unskilled non-agricultural labour occupied small proportions (15% and 6%, respectively). In urban areas, in contrast, 36%, 33% and 23% of working women reported engaging in unskilled non-agricultural labour, skilled manual labour and administrative, executive, managerial and clerical occupations, respectively.
Differences by marital status were not wide among young men, irrespective of rural-urban residence. Among young women, however, differences were notable and these varied by rural-urban residence. For example, in rural areas, the married were more likely to be engaged in agricultural labour than the unmarried (76% and 66%, respectively) and somewhat less likely to have engaged in skilled manual labour (12% versus 19%). Differences in urban areas were wider: the unmarried were considerably more likely than the married to have engaged in administrative, executive, managerial or clerical occupations (30% versus 14%), somewhat more likely to have engaged in unskilled non-agricultural labour (40% versus 31%) and considerably less likely to have worked as skilled manual labourers (25% versus 43%).
4.2 Unemployment
To measure unemployment rates among respondents, the Youth Study assessed (a) whether youth had worked in the 12 months preceding the interview and if so, the number of months worked; and (b) whether youth were seeking work and if so, the number of months during which they had been searching for work. Table 4.2 presents unemployment rates, defined as those seeking employment for the major part of the year preceding the interview as a fraction of those in the labour force. Labour force refers to those who were working or seeking work for the major part of the year. It does not, therefore, include those exclusively studying, those who may have worked for a short period in the year preceding the interview, or those who had sought work for a short period in the year preceding the interview.
Measured in this way, the percentage of unemployed youth was 7% among young men and 10% among young women, rates somewhat similar to those observed by the National Sample Survey (NSS) (NSSO, 2006) among youth using the principal usual status definition. We note, however, that rates obtained in the Youth Study are not
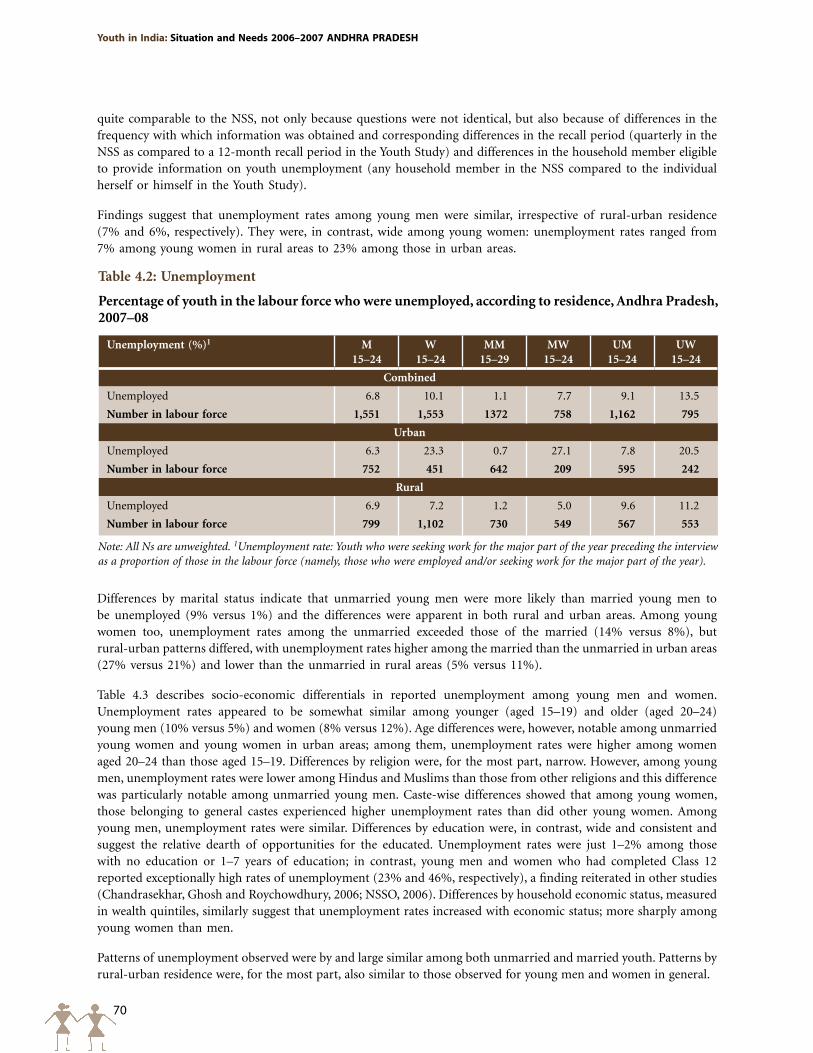
70
Youth in India: Situation and Needs 2006–2007 ANDHRA pRADESH
Table 4.2: Unemployment
Percentage of youth in the labour force who were unemployed, according to residence, Andhra Pradesh, 2007–08
Unemployment (%)1 M15–24
W15–24
MM15–29
MW15–24
UM15–24
UW15–24
Combined
Unemployed 6.8 10.1 1.1 7.7 9.1 13.5
Number in labour force 1,551 1,553 1372 758 1,162 795
Urban
Unemployed 6.3 23.3 0.7 27.1 7.8 20.5
Number in labour force 752 451 642 209 595 242
Rural
Unemployed 6.9 7.2 1.2 5.0 9.6 11.2
Number in labour force 799 1,102 730 549 567 553
Note: All Ns are unweighted. 1Unemployment rate: Youth who were seeking work for the major part of the year preceding the interview as a proportion of those in the labour force (namely, those who were employed and/or seeking work for the major part of the year).
quite comparable to the NSS, not only because questions were not identical, but also because of differences in the frequency with which information was obtained and corresponding differences in the recall period (quarterly in the NSS as compared to a 12-month recall period in the Youth Study) and differences in the household member eligible to provide information on youth unemployment (any household member in the NSS compared to the individual herself or himself in the Youth Study).
Findings suggest that unemployment rates among young men were similar, irrespective of rural-urban residence (7% and 6%, respectively). They were, in contrast, wide among young women: unemployment rates ranged from 7% among young women in rural areas to 23% among those in urban areas.
Differences by marital status indicate that unmarried young men were more likely than married young men to be unemployed (9% versus 1%) and the differences were apparent in both rural and urban areas. Among young women too, unemployment rates among the unmarried exceeded those of the married (14% versus 8%), but rural-urban patterns differed, with unemployment rates higher among the married than the unmarried in urban areas (27% versus 21%) and lower than the unmarried in rural areas (5% versus 11%).
Table 4.3 describes socio-economic differentials in reported unemployment among young men and women. Unemployment rates appeared to be somewhat similar among younger (aged 15–19) and older (aged 20–24) young men (10% versus 5%) and women (8% versus 12%). Age differences were, however, notable among unmarried young women and young women in urban areas; among them, unemployment rates were higher among women aged 20–24 than those aged 15–19. Differences by religion were, for the most part, narrow. However, among young men, unemployment rates were lower among Hindus and Muslims than those from other religions and this difference was particularly notable among unmarried young men. Caste-wise differences showed that among young women, those belonging to general castes experienced higher unemployment rates than did other young women. Among young men, unemployment rates were similar. Differences by education were, in contrast, wide and consistent and suggest the relative dearth of opportunities for the educated. Unemployment rates were just 1–2% among those with no education or 1–7 years of education; in contrast, young men and women who had completed Class 12 reported exceptionally high rates of unemployment (23% and 46%, respectively), a finding reiterated in other studies (Chandrasekhar, Ghosh and Roychowdhury, 2006; NSSO, 2006). Differences by household economic status, measured in wealth quintiles, similarly suggest that unemployment rates increased with economic status; more sharply among young women than men.
Patterns of unemployment observed were by and large similar among both unmarried and married youth. Patterns by rural-urban residence were, for the most part, also similar to those observed for young men and women in general.
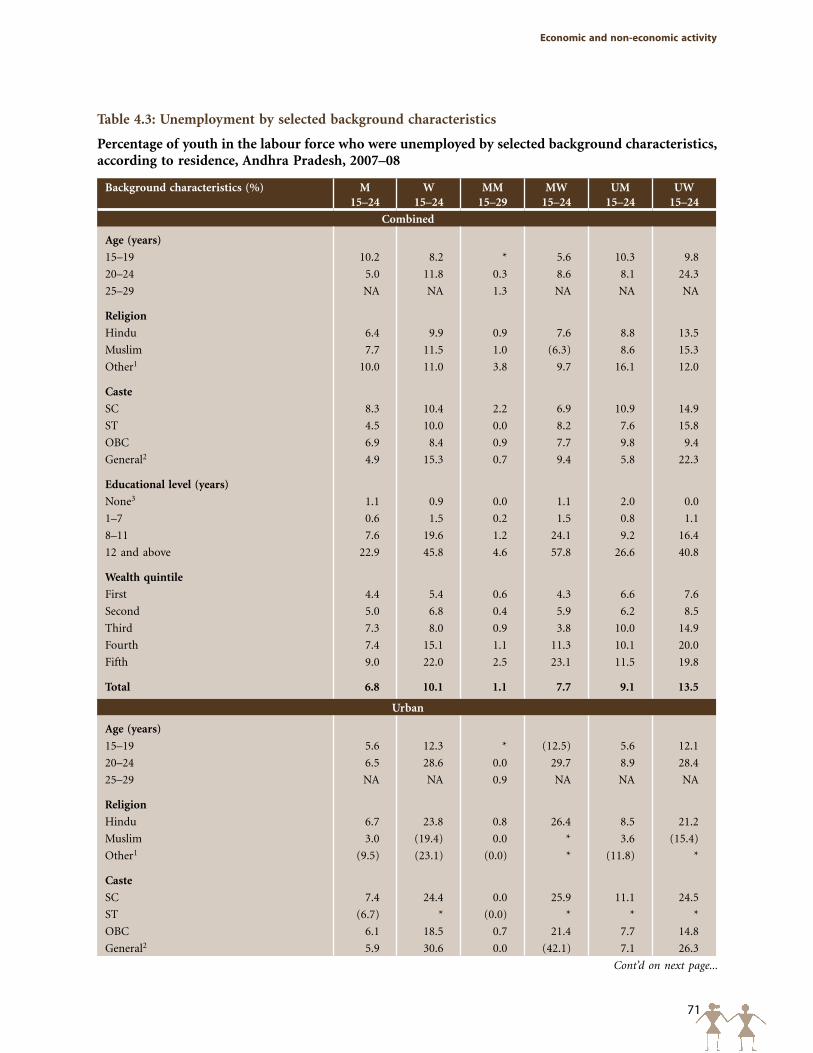
71
Economic and non-economic activity
Table 4.3: Unemployment by selected background characteristics
Percentage of youth in the labour force who were unemployed by selected background characteristics, according to residence, Andhra Pradesh, 2007–08
Background characteristics (%) M15–24
W15–24
MM15–29
MW15–24
UM15–24
UW15–24
Combined
Age (years)
15–19 10.2 8.2 * 5.6 10.3 9.8
20–24 5.0 11.8 0.3 8.6 8.1 24.3
25–29 NA NA 1.3 NA NA NA
Religion
Hindu 6.4 9.9 0.9 7.6 8.8 13.5
Muslim 7.7 11.5 1.0 (6.3) 8.6 15.3
Other1 10.0 11.0 3.8 9.7 16.1 12.0
Caste
SC 8.3 10.4 2.2 6.9 10.9 14.9
ST 4.5 10.0 0.0 8.2 7.6 15.8
OBC 6.9 8.4 0.9 7.7 9.8 9.4
General2 4.9 15.3 0.7 9.4 5.8 22.3
Educational level (years)
None3 1.1 0.9 0.0 1.1 2.0 0.0
1–7 0.6 1.5 0.2 1.5 0.8 1.1
8–11 7.6 19.6 1.2 24.1 9.2 16.4
12 and above 22.9 45.8 4.6 57.8 26.6 40.8
Wealth quintile
First 4.4 5.4 0.6 4.3 6.6 7.6
Second 5.0 6.8 0.4 5.9 6.2 8.5
Third 7.3 8.0 0.9 3.8 10.0 14.9
Fourth 7.4 15.1 1.1 11.3 10.1 20.0
Fifth 9.0 22.0 2.5 23.1 11.5 19.8
Total 6.8 10.1 1.1 7.7 9.1 13.5
Urban
Age (years)
15–19 5.6 12.3 * (12.5) 5.6 12.1
20–24 6.5 28.6 0.0 29.7 8.9 28.4
25–29 NA NA 0.9 NA NA NA
Religion
Hindu 6.7 23.8 0.8 26.4 8.5 21.2
Muslim 3.0 (19.4) 0.0 * 3.6 (15.4)
Other1 (9.5) (23.1) (0.0) * (11.8) *
Caste
SC 7.4 24.4 0.0 25.9 11.1 24.5
ST (6.7) * (0.0) * * *
OBC 6.1 18.5 0.7 21.4 7.7 14.8
General2 5.9 30.6 0.0 (42.1) 7.1 26.3
Cont’d on next page...
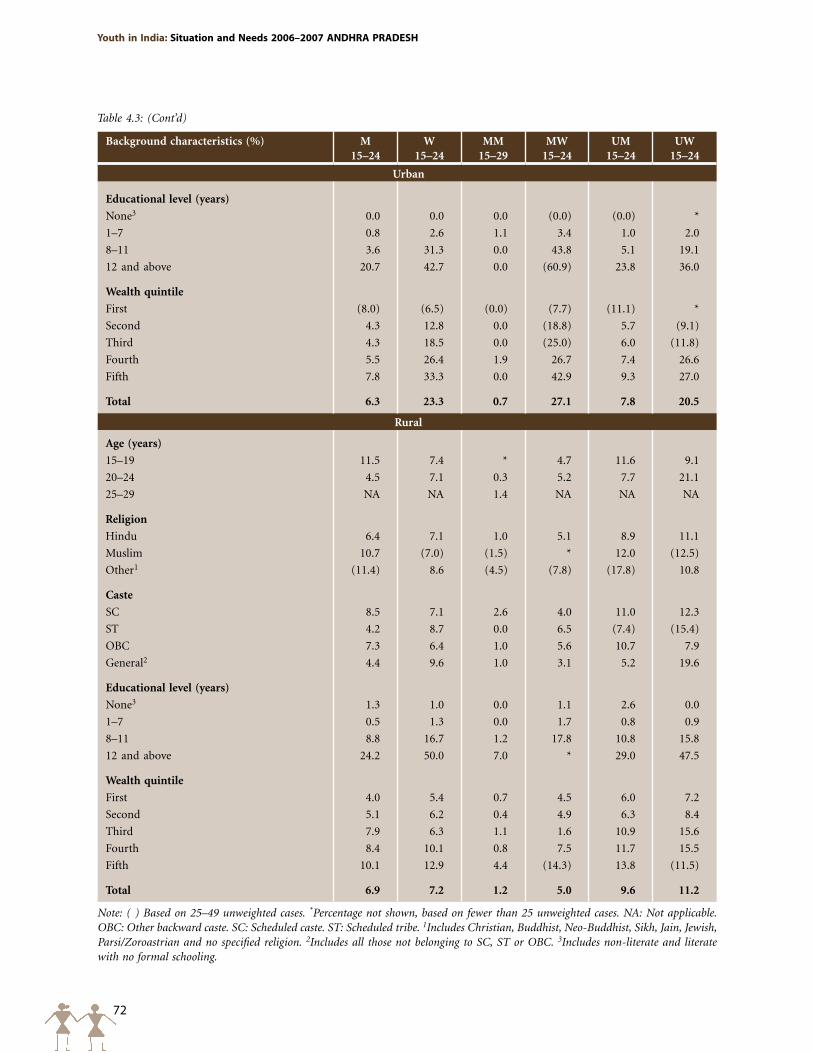
72
Youth in India: Situation and Needs 2006–2007 ANDHRA pRADESH
Background characteristics (%) M15–24
W15–24
MM15–29
MW15–24
UM15–24
UW15–24
Urban
Educational level (years)
None3 0.0 0.0 0.0 (0.0) (0.0) *
1–7 0.8 2.6 1.1 3.4 1.0 2.0
8–11 3.6 31.3 0.0 43.8 5.1 19.1
12 and above 20.7 42.7 0.0 (60.9) 23.8 36.0
Wealth quintile
First (8.0) (6.5) (0.0) (7.7) (11.1) *
Second 4.3 12.8 0.0 (18.8) 5.7 (9.1)
Third 4.3 18.5 0.0 (25.0) 6.0 (11.8)
Fourth 5.5 26.4 1.9 26.7 7.4 26.6
Fifth 7.8 33.3 0.0 42.9 9.3 27.0
Total 6.3 23.3 0.7 27.1 7.8 20.5
Rural
Age (years)
15–19 11.5 7.4 * 4.7 11.6 9.1
20–24 4.5 7.1 0.3 5.2 7.7 21.1
25–29 NA NA 1.4 NA NA NA
Religion
Hindu 6.4 7.1 1.0 5.1 8.9 11.1
Muslim 10.7 (7.0) (1.5) * 12.0 (12.5)
Other1 (11.4) 8.6 (4.5) (7.8) (17.8) 10.8
Caste
SC 8.5 7.1 2.6 4.0 11.0 12.3
ST 4.2 8.7 0.0 6.5 (7.4) (15.4)
OBC 7.3 6.4 1.0 5.6 10.7 7.9
General2 4.4 9.6 1.0 3.1 5.2 19.6
Educational level (years)
None3 1.3 1.0 0.0 1.1 2.6 0.0
1–7 0.5 1.3 0.0 1.7 0.8 0.9
8–11 8.8 16.7 1.2 17.8 10.8 15.8
12 and above 24.2 50.0 7.0 * 29.0 47.5
Wealth quintile
First 4.0 5.4 0.7 4.5 6.0 7.2
Second 5.1 6.2 0.4 4.9 6.3 8.4
Third 7.9 6.3 1.1 1.6 10.9 15.6
Fourth 8.4 10.1 0.8 7.5 11.7 15.5
Fifth 10.1 12.9 4.4 (14.3) 13.8 (11.5)
Total 6.9 7.2 1.2 5.0 9.6 11.2
Note: ( ) Based on 25–49 unweighted cases. *Percentage not shown, based on fewer than 25 unweighted cases. NA: Not applicable. OBC: Other backward caste. SC: Scheduled caste. ST: Scheduled tribe. 1Includes Christian, Buddhist, Neo-Buddhist, Sikh, Jain, Jewish, Parsi/Zoroastrian and no specified religion. 2Includes all those not belonging to SC, ST or OBC. 3Includes non-literate and literate with no formal schooling.
Table 4.3: (Cont’d)
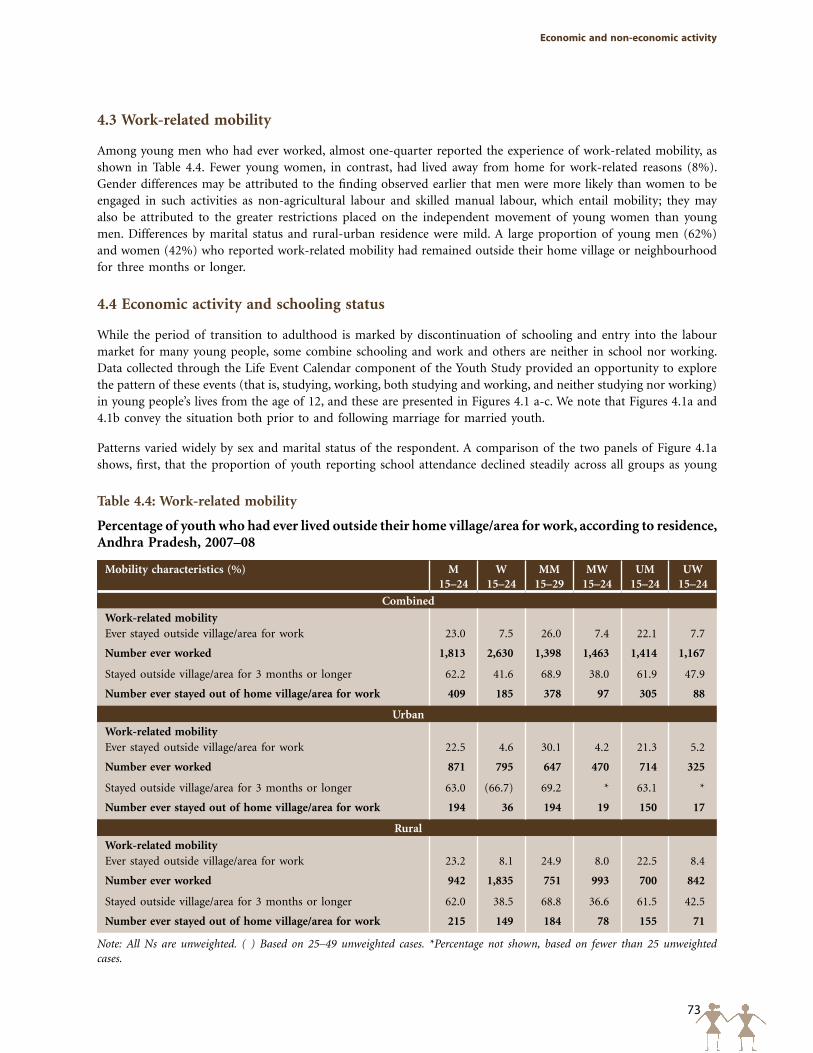
73
Economic and non-economic activity
4.3 Work-related mobility
Among young men who had ever worked, almost one-quarter reported the experience of work-related mobility, as shown in Table 4.4. Fewer young women, in contrast, had lived away from home for work-related reasons (8%). Gender differences may be attributed to the finding observed earlier that men were more likely than women to be engaged in such activities as non-agricultural labour and skilled manual labour, which entail mobility; they may also be attributed to the greater restrictions placed on the independent movement of young women than young men. Differences by marital status and rural-urban residence were mild. A large proportion of young men (62%) and women (42%) who reported work-related mobility had remained outside their home village or neighbourhood for three months or longer.
4.4 Economic activity and schooling status
While the period of transition to adulthood is marked by discontinuation of schooling and entry into the labour market for many young people, some combine schooling and work and others are neither in school nor working. Data collected through the Life Event Calendar component of the Youth Study provided an opportunity to explore the pattern of these events (that is, studying, working, both studying and working, and neither studying nor working) in young people’s lives from the age of 12, and these are presented in Figures 4.1 a-c. We note that Figures 4.1a and 4.1b convey the situation both prior to and following marriage for married youth.
Patterns varied widely by sex and marital status of the respondent. A comparison of the two panels of Figure 4.1a shows, first, that the proportion of youth reporting school attendance declined steadily across all groups as young
Table 4.4: Work-related mobility
Percentage of youth who had ever lived outside their home village/area for work, according to residence, Andhra Pradesh, 2007–08
Mobility characteristics (%) M15–24
W15–24
MM15–29
MW15–24
UM15–24
UW15–24
Combined
Work-related mobilityEver stayed outside village/area for work 23.0 7.5 26.0 7.4 22.1 7.7
Number ever worked 1,813 2,630 1,398 1,463 1,414 1,167
Stayed outside village/area for 3 months or longer 62.2 41.6 68.9 38.0 61.9 47.9
Number ever stayed out of home village/area for work 409 185 378 97 305 88
Urban
Work-related mobilityEver stayed outside village/area for work 22.5 4.6 30.1 4.2 21.3 5.2
Number ever worked 871 795 647 470 714 325
Stayed outside village/area for 3 months or longer 63.0 (66.7) 69.2 * 63.1 *
Number ever stayed out of home village/area for work 194 36 194 19 150 17
Rural
Work-related mobilityEver stayed outside village/area for work 23.2 8.1 24.9 8.0 22.5 8.4
Number ever worked 942 1,835 751 993 700 842
Stayed outside village/area for 3 months or longer 62.0 38.5 68.8 36.6 61.5 42.5
Number ever stayed out of home village/area for work 215 149 184 78 155 71
Note: All Ns are unweighted. ( ) Based on 25–49 unweighted cases. *Percentage not shown, based on fewer than 25 unweighted cases.
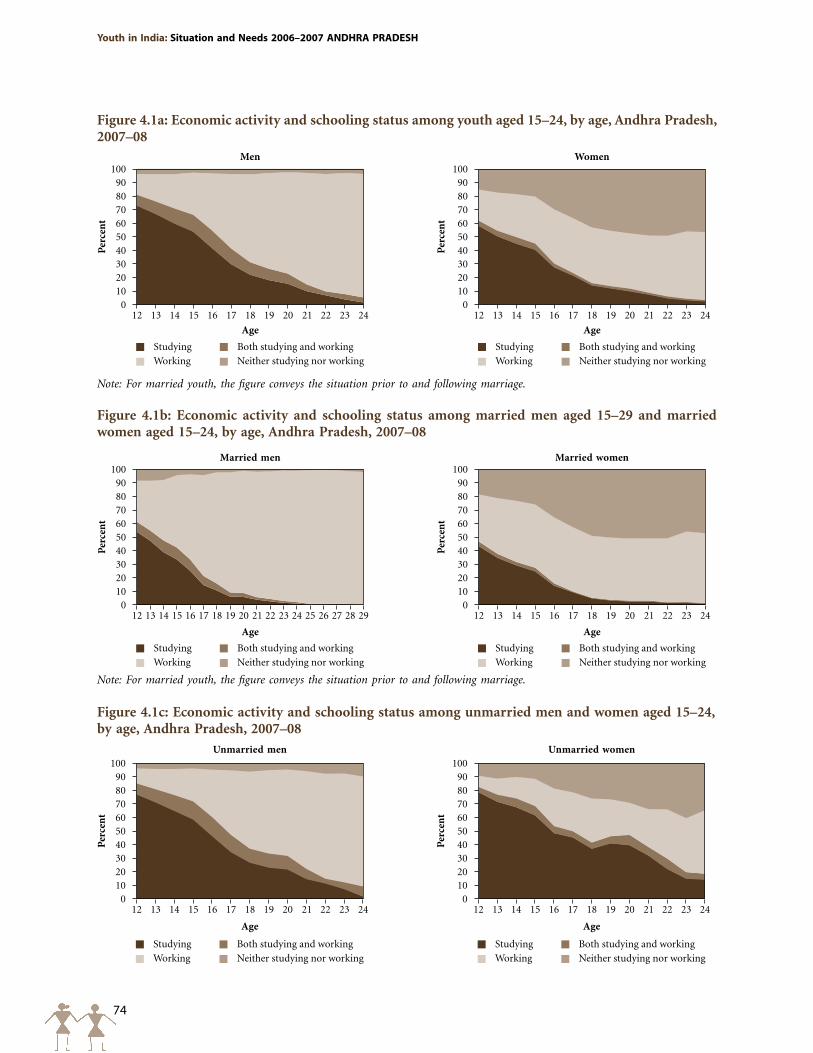
74
Youth in India: Situation and Needs 2006–2007 ANDHRA pRADESH
Figure 4.1b: Economic activity and schooling status among married men aged 15–29 and married women aged 15–24, by age, Andhra Pradesh, 2007–08
Figure 4.1a: Economic activity and schooling status among youth aged 15–24, by age, Andhra Pradesh, 2007–08
Note: For married youth, the figure conveys the situation prior to and following marriage.
Note: For married youth, the figure conveys the situation prior to and following marriage.
Figure 4.1c: Economic activity and schooling status among unmarried men and women aged 15–24, by age, Andhra Pradesh, 2007–08
Men Women
12 13 14 15 16 17 18 19 20 21 22 23 24
Age
0102030
50
70
90
40
60
80
100
12 13 14 15 16 17 18 19 20 21 22 23 24
Age
0102030
50
70
90
40
60
80
100
Perc
ent
Perc
ent
Studying
Working
Both studying and working
Neither studying nor working
Studying
Working
Both studying and working
Neither studying nor working
Studying
Working
Both studying and working
Neither studying nor working
Studying
Working
Both studying and working
Neither studying nor working
Married men Married women
12 13 14 15 16 17 18 19 20 21 22 23 24
Age
0102030
50
70
90
40
60
80
100
12 13 14 15 16 17 18 19 20 21 22 23 24 25 26 27 28 29
Age
0102030
50
70
90
40
60
80
100
Perc
ent
Perc
ent
Studying
Working
Both studying and working
Neither studying nor working
Studying
Working
Both studying and working
Neither studying nor working
Unmarried men Unmarried women
12 13 14 15 16 17 18 19 20 21 22 23 24
Age
0102030
50
70
90
40
60
80
100
12 13 14 15 16 17 18 19 20 21 22 23 24
Age
0102030
50
70
90
40
60
80
100
Perc
ent
Perc
ent
75
Economic and non-economic activity
people transitioned out of childhood or early adolescence into late adolescence and young adulthood. For example, while 81% of young men and 63% of young women were in school (a small minority of these were also working) at age 12, the percentage who remained in school at age 15 fell to 66 % for young men and 46% for young women. Second, very few youth (4–13% of young men; 1–5% of young women) reported having combined studying and working at any age. Third, exit from school was accompanied by a rise in work participation over the ages for both young men and women; however, the increase was steeper among young men than among young women. Among young men, work participation increased consistently from age 12 onwards; among young women, in contrast, work participation increased between ages 12 and 16 and then remained more or less steady up to age 24. Findings also suggest that larger percentages were working than in school by age 17 among young men and 16 among young women. Finally, significant proportions of young women but not young men were neither in school nor working from age 12 onwards. Among young men, small proportions (less than 5%) were neither working nor in school at any age. On the contrary among young women, there was a steady increase in proportion of women who were neither studying nor working by age. At age 12, 14% of young women were neither working nor in school; percentages increased to 20% at age 15 and 47% at age 20.
Figures 4.1b and 4.1c suggest that patterns differed between married and unmarried youth. For one, the married were less likely than the unmarried to be in school at each age. For example, 62% and 47% of married young men and women, respectively, and 86% and 82% of the unmarried, respectively, were in school (a small minority of these were also working) at age 12, and the percentages of those who remained in school fell thereafter. At age 20, for example, only 9% of married young men and 4% of married young women were pursuing their education compared to 32% and 48% of unmarried young men and women, respectively. Second, the unmarried were more likely than the married to combine studying and working at any age. Third, while slightly larger percentages of married than unmarried young men were neither in school nor working in early adolescence, a reverse pattern was observed once young men transitioned out of adolescence to young adulthood. Among young women, more married than unmarried were neither in school nor working from age 12. The percentage of those neither in school nor working increased steadily till age 18 and thereafter plateaued among married young women; among unmarried, it continued to increase even at later ages. Finally, more youth were working than in school at a younger age among the married than the unmarried. Indeed, by ages 13 and 14, respectively, more married young men and women were working than in school; this crossover occurred at considerably older ages among the unmarried (17 and 22 among young men and women, respectively).
4.5 Participation in non-economic activity
The Youth Study also inquired about the extent to which young men and women participated in domestic chores. All youth were asked whether and how frequently they were engaged in activities such as housework (cooking, cleaning, child/sibling care), shopping for groceries for the family and tasks such as collecting firewood or fetching water, and paying electricity or phone bills (as appropriate for urban and rural areas). Findings, reported in Table 4.5 and Figure 4.2, highlight the gendered nature of young people’s participation in domestic chores. They show that the large majority of young women (83%), compared with just 8% of young men were often engaged in housework. It is notable, nonetheless, that two in three young men reported “sometimes” participating in housework. In contrast, 94% of young men compared with 75% of young women reported sometimes or often shopping for groceries. Tasks such as collecting firewood or fetching water, and paying electricity or phone bills were conducted by both young men and women. Larger proportions of young men than women reported participating in these tasks—95% and 74%, respectively—suggesting that young women were more likely than young men to be engaged in work inside the home, and less likely to be engaged in tasks that violated norms restricting their mobility outside the home.
In terms of differences in household work participation by marital status, patterns varied by type of activity and sex of the respondent. For example, among young women, the unmarried were about as likely as the married to engage in housework and shopping but less likely than the married to engage in other tasks; among young men, differences by marital status were modest. These patterns were evident, by and large, in both rural and urban areas.
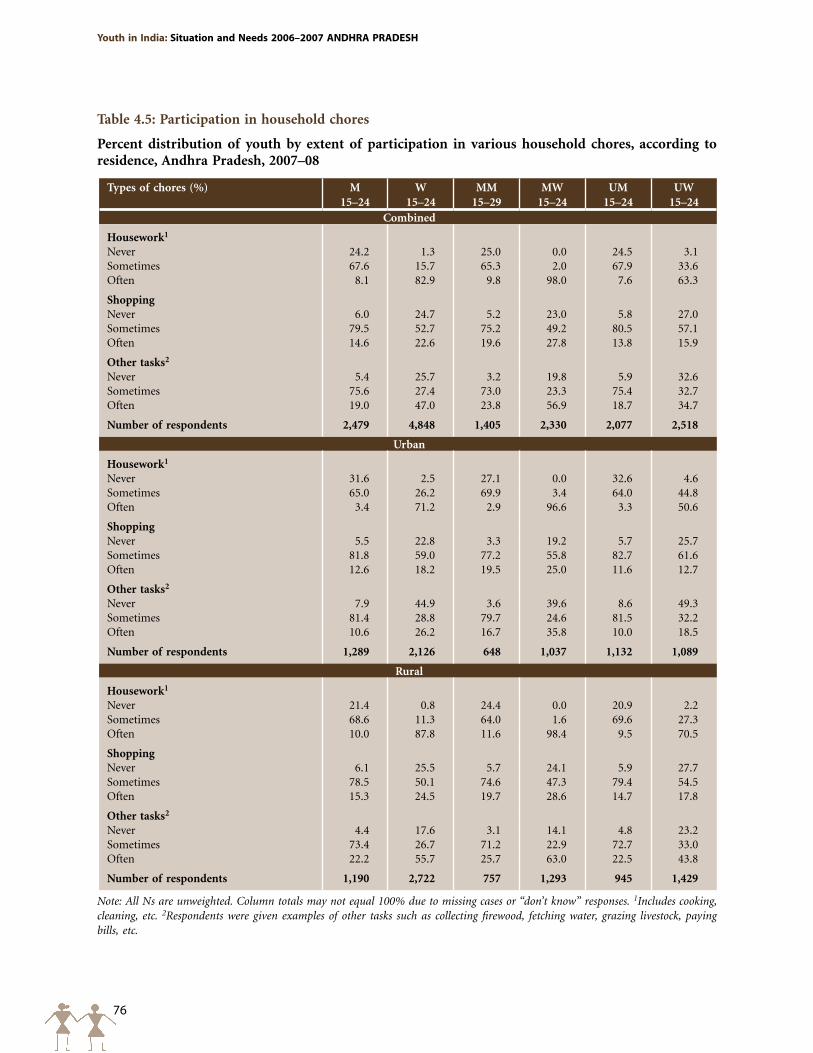
76
Youth in India: Situation and Needs 2006–2007 ANDHRA pRADESH
Table 4.5: Participation in household chores
Percent distribution of youth by extent of participation in various household chores, according to residence, Andhra Pradesh, 2007–08
Types of chores (%) M15–24
W15–24
MM15–29
MW15–24
UM15–24
UW15–24
Combined
Housework1
Never 24.2 1.3 25.0 0.0 24.5 3.1Sometimes 67.6 15.7 65.3 2.0 67.9 33.6Often 8.1 82.9 9.8 98.0 7.6 63.3
ShoppingNever 6.0 24.7 5.2 23.0 5.8 27.0Sometimes 79.5 52.7 75.2 49.2 80.5 57.1Often 14.6 22.6 19.6 27.8 13.8 15.9
Other tasks2
Never 5.4 25.7 3.2 19.8 5.9 32.6Sometimes 75.6 27.4 73.0 23.3 75.4 32.7Often 19.0 47.0 23.8 56.9 18.7 34.7
Number of respondents 2,479 4,848 1,405 2,330 2,077 2,518
Urban
Housework1
Never 31.6 2.5 27.1 0.0 32.6 4.6Sometimes 65.0 26.2 69.9 3.4 64.0 44.8Often 3.4 71.2 2.9 96.6 3.3 50.6
ShoppingNever 5.5 22.8 3.3 19.2 5.7 25.7Sometimes 81.8 59.0 77.2 55.8 82.7 61.6Often 12.6 18.2 19.5 25.0 11.6 12.7
Other tasks2
Never 7.9 44.9 3.6 39.6 8.6 49.3Sometimes 81.4 28.8 79.7 24.6 81.5 32.2Often 10.6 26.2 16.7 35.8 10.0 18.5
Number of respondents 1,289 2,126 648 1,037 1,132 1,089
Rural
Housework1
Never 21.4 0.8 24.4 0.0 20.9 2.2Sometimes 68.6 11.3 64.0 1.6 69.6 27.3Often 10.0 87.8 11.6 98.4 9.5 70.5
ShoppingNever 6.1 25.5 5.7 24.1 5.9 27.7Sometimes 78.5 50.1 74.6 47.3 79.4 54.5Often 15.3 24.5 19.7 28.6 14.7 17.8
Other tasks2
Never 4.4 17.6 3.1 14.1 4.8 23.2Sometimes 73.4 26.7 71.2 22.9 72.7 33.0Often 22.2 55.7 25.7 63.0 22.5 43.8
Number of respondents 1,190 2,722 757 1,293 945 1,429
Note: All Ns are unweighted. Column totals may not equal 100% due to missing cases or “don’t know” responses. 1Includes cooking, cleaning, etc. 2Respondents were given examples of other tasks such as collecting firewood, fetching water, grazing livestock, paying bills, etc.
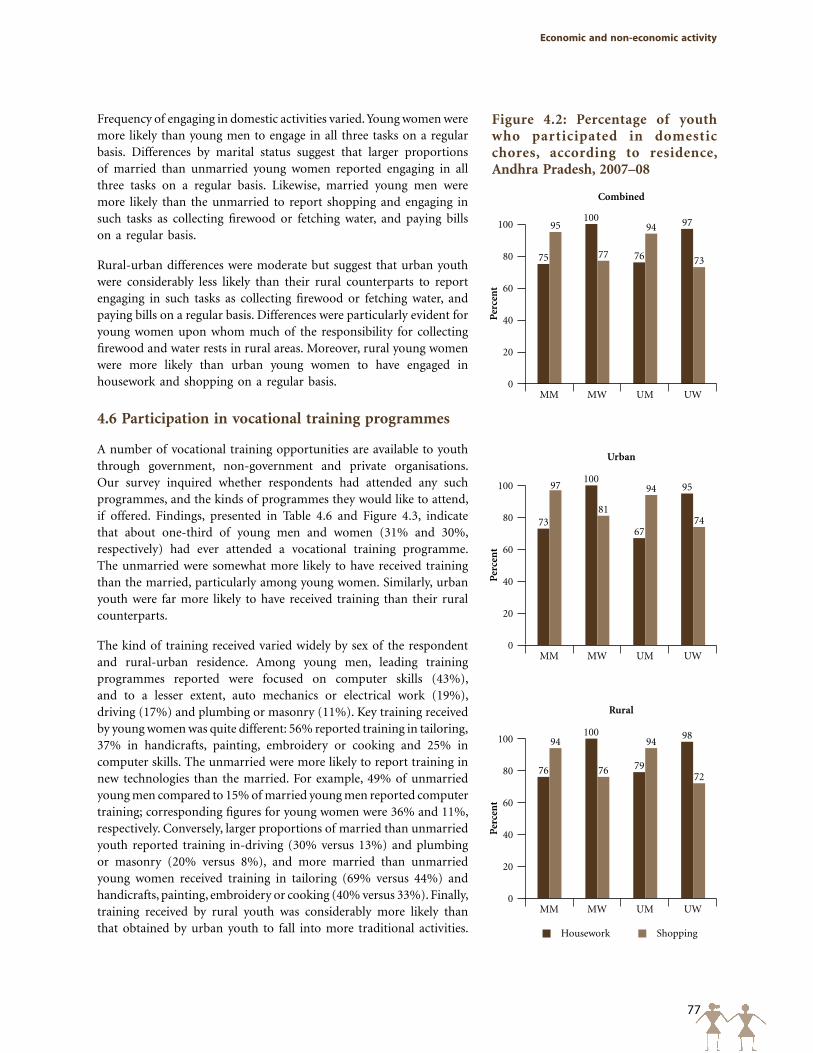
77
Economic and non-economic activity
Frequency of engaging in domestic activities varied. Young women were more likely than young men to engage in all three tasks on a regular basis. Differences by marital status suggest that larger proportions of married than unmarried young women reported engaging in all three tasks on a regular basis. Likewise, married young men were more likely than the unmarried to report shopping and engaging in such tasks as collecting firewood or fetching water, and paying bills on a regular basis.
Rural-urban differences were moderate but suggest that urban youth were considerably less likely than their rural counterparts to report engaging in such tasks as collecting firewood or fetching water, and paying bills on a regular basis. Differences were particularly evident for young women upon whom much of the responsibility for collecting firewood and water rests in rural areas. Moreover, rural young women were more likely than urban young women to have engaged in housework and shopping on a regular basis.
4.6 Participation in vocational training programmes
A number of vocational training opportunities are available to youth through government, non-government and private organisations. Our survey inquired whether respondents had attended any such programmes, and the kinds of programmes they would like to attend, if offered. Findings, presented in Table 4.6 and Figure 4.3, indicate that about one-third of young men and women (31% and 30%, respectively) had ever attended a vocational training programme. The unmarried were somewhat more likely to have received training than the married, particularly among young women. Similarly, urban youth were far more likely to have received training than their rural counterparts.
The kind of training received varied widely by sex of the respondent and rural-urban residence. Among young men, leading training programmes reported were focused on computer skills (43%), and to a lesser extent, auto mechanics or electrical work (19%), driving (17%) and plumbing or masonry (11%). Key training received by young women was quite different: 56% reported training in tailoring, 37% in handicrafts, painting, embroidery or cooking and 25% in computer skills. The unmarried were more likely to report training in new technologies than the married. For example, 49% of unmarried young men compared to 15% of married young men reported computer training; corresponding figures for young women were 36% and 11%, respectively. Conversely, larger proportions of married than unmarried youth reported training in-driving (30% versus 13%) and plumbing or masonry (20% versus 8%), and more married than unmarried young women received training in tailoring (69% versus 44%) and handicrafts, painting, embroidery or cooking (40% versus 33%). Finally, training received by rural youth was considerably more likely than that obtained by urban youth to fall into more traditional activities.
Figure 4.2: Percentage of youth who participated in domestic chores, according to residence, Andhra Pradesh, 2007–08
Per
cen
t
100
80
60
40
20
0
75
100
76
9795
77
94
73
Combined
MM MW UM UW
Per
cen
t100
80
60
40
20
0
73
100
67
9597
81
94
74
Urban
MM MW UM UW
Per
cen
t
100
80
60
40
20
0
76
100
79
9894
76
94
72
Rural
MM MW UM UW
Housework Shopping
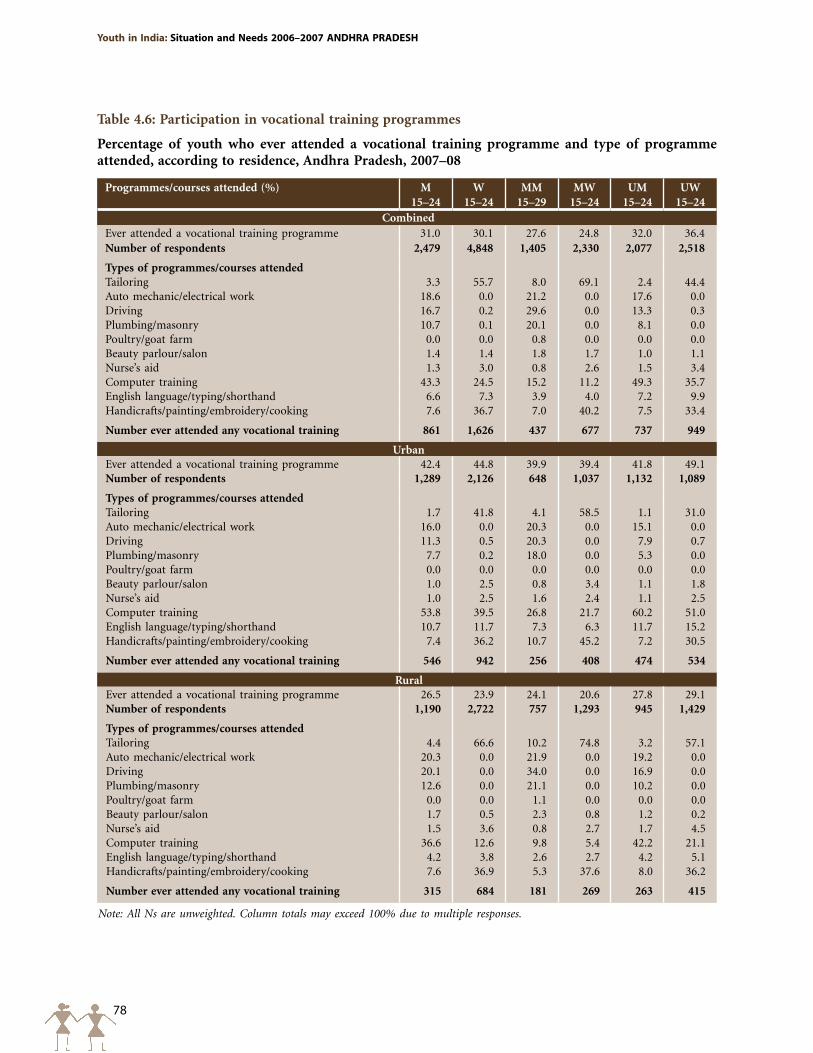
78
Youth in India: Situation and Needs 2006–2007 ANDHRA pRADESH
Table 4.6: Participation in vocational training programmes
Percentage of youth who ever attended a vocational training programme and type of programme attended, according to residence, Andhra Pradesh, 2007–08
Programmes/courses attended (%) M 15–24
W 15–24
MM 15–29
MW 15–24
UM 15–24
UW 15–24
CombinedEver attended a vocational training programme 31.0 30.1 27.6 24.8 32.0 36.4Number of respondents 2,479 4,848 1,405 2,330 2,077 2,518
Types of programmes/courses attendedTailoring 3.3 55.7 8.0 69.1 2.4 44.4Auto mechanic/electrical work 18.6 0.0 21.2 0.0 17.6 0.0Driving 16.7 0.2 29.6 0.0 13.3 0.3Plumbing/masonry 10.7 0.1 20.1 0.0 8.1 0.0Poultry/goat farm 0.0 0.0 0.8 0.0 0.0 0.0Beauty parlour/salon 1.4 1.4 1.8 1.7 1.0 1.1Nurse’s aid 1.3 3.0 0.8 2.6 1.5 3.4Computer training 43.3 24.5 15.2 11.2 49.3 35.7English language/typing/shorthand 6.6 7.3 3.9 4.0 7.2 9.9Handicrafts/painting/embroidery/cooking 7.6 36.7 7.0 40.2 7.5 33.4
Number ever attended any vocational training 861 1,626 437 677 737 949
UrbanEver attended a vocational training programme 42.4 44.8 39.9 39.4 41.8 49.1Number of respondents 1,289 2,126 648 1,037 1,132 1,089
Types of programmes/courses attendedTailoring 1.7 41.8 4.1 58.5 1.1 31.0Auto mechanic/electrical work 16.0 0.0 20.3 0.0 15.1 0.0Driving 11.3 0.5 20.3 0.0 7.9 0.7Plumbing/masonry 7.7 0.2 18.0 0.0 5.3 0.0Poultry/goat farm 0.0 0.0 0.0 0.0 0.0 0.0Beauty parlour/salon 1.0 2.5 0.8 3.4 1.1 1.8Nurse’s aid 1.0 2.5 1.6 2.4 1.1 2.5Computer training 53.8 39.5 26.8 21.7 60.2 51.0English language/typing/shorthand 10.7 11.7 7.3 6.3 11.7 15.2Handicrafts/painting/embroidery/cooking 7.4 36.2 10.7 45.2 7.2 30.5
Number ever attended any vocational training 546 942 256 408 474 534
RuralEver attended a vocational training programme 26.5 23.9 24.1 20.6 27.8 29.1Number of respondents 1,190 2,722 757 1,293 945 1,429
Types of programmes/courses attendedTailoring 4.4 66.6 10.2 74.8 3.2 57.1Auto mechanic/electrical work 20.3 0.0 21.9 0.0 19.2 0.0Driving 20.1 0.0 34.0 0.0 16.9 0.0Plumbing/masonry 12.6 0.0 21.1 0.0 10.2 0.0Poultry/goat farm 0.0 0.0 1.1 0.0 0.0 0.0Beauty parlour/salon 1.7 0.5 2.3 0.8 1.2 0.2Nurse’s aid 1.5 3.6 0.8 2.7 1.7 4.5Computer training 36.6 12.6 9.8 5.4 42.2 21.1English language/typing/shorthand 4.2 3.8 2.6 2.7 4.2 5.1Handicrafts/painting/embroidery/cooking 7.6 36.9 5.3 37.6 8.0 36.2
Number ever attended any vocational training 315 684 181 269 263 415
Note: All Ns are unweighted. Column totals may exceed 100% due to multiple responses.
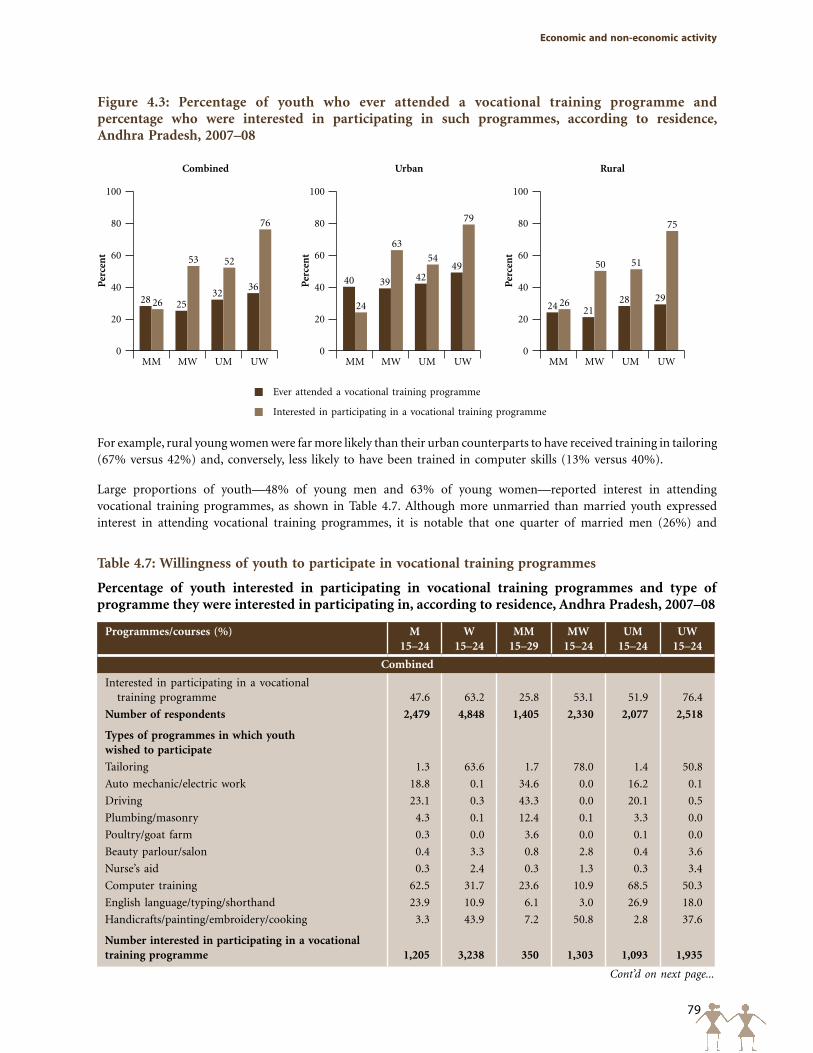
79
Economic and non-economic activity
For example, rural young women were far more likely than their urban counterparts to have received training in tailoring (67% versus 42%) and, conversely, less likely to have been trained in computer skills (13% versus 40%).
Large proportions of youth—48% of young men and 63% of young women—reported interest in attending vocational training programmes, as shown in Table 4.7. Although more unmarried than married youth expressed interest in attending vocational training programmes, it is notable that one quarter of married men (26%) and
Cont’d on next page...
Figure 4.3: Percentage of youth who ever attended a vocational training programme and percentage who were interested in participating in such programmes, according to residence, Andhra Pradesh, 2007–08
Per
cen
t
100
80
60
40
20
0
28 2532
36
26
53 52
76
Combined
MM MW UM UW
Per
cen
t
100
80
60
40
20
0
40 39 4249
24
63
54
79
Urban
MM MW UM UW
Per
cen
t
100
80
60
40
20
0
24 2128 2926
50 51
75
Rural
MM MW UM UW
Ever attended a vocational training programme
Interested in participating in a vocational training programme
Table 4.7: Willingness of youth to participate in vocational training programmes
Percentage of youth interested in participating in vocational training programmes and type of programme they were interested in participating in, according to residence, Andhra Pradesh, 2007–08
Programmes/courses (%) M15–24
W 15–24
MM 15–29
MW 15–24
UM 15–24
UW 15–24
Combined
Interested in participating in a vocational training programme 47.6 63.2 25.8 53.1 51.9 76.4
Number of respondents 2,479 4,848 1,405 2,330 2,077 2,518
Types of programmes in which youth wished to participate
Tailoring 1.3 63.6 1.7 78.0 1.4 50.8
Auto mechanic/electric work 18.8 0.1 34.6 0.0 16.2 0.1
Driving 23.1 0.3 43.3 0.0 20.1 0.5
Plumbing/masonry 4.3 0.1 12.4 0.1 3.3 0.0
Poultry/goat farm 0.3 0.0 3.6 0.0 0.1 0.0
Beauty parlour/salon 0.4 3.3 0.8 2.8 0.4 3.6
Nurse’s aid 0.3 2.4 0.3 1.3 0.3 3.4
Computer training 62.5 31.7 23.6 10.9 68.5 50.3
English language/typing/shorthand 23.9 10.9 6.1 3.0 26.9 18.0
Handicrafts/painting/embroidery/cooking 3.3 43.9 7.2 50.8 2.8 37.6
Number interested in participating in a vocational training programme 1,205 3,238 350 1,303 1,093 1,935
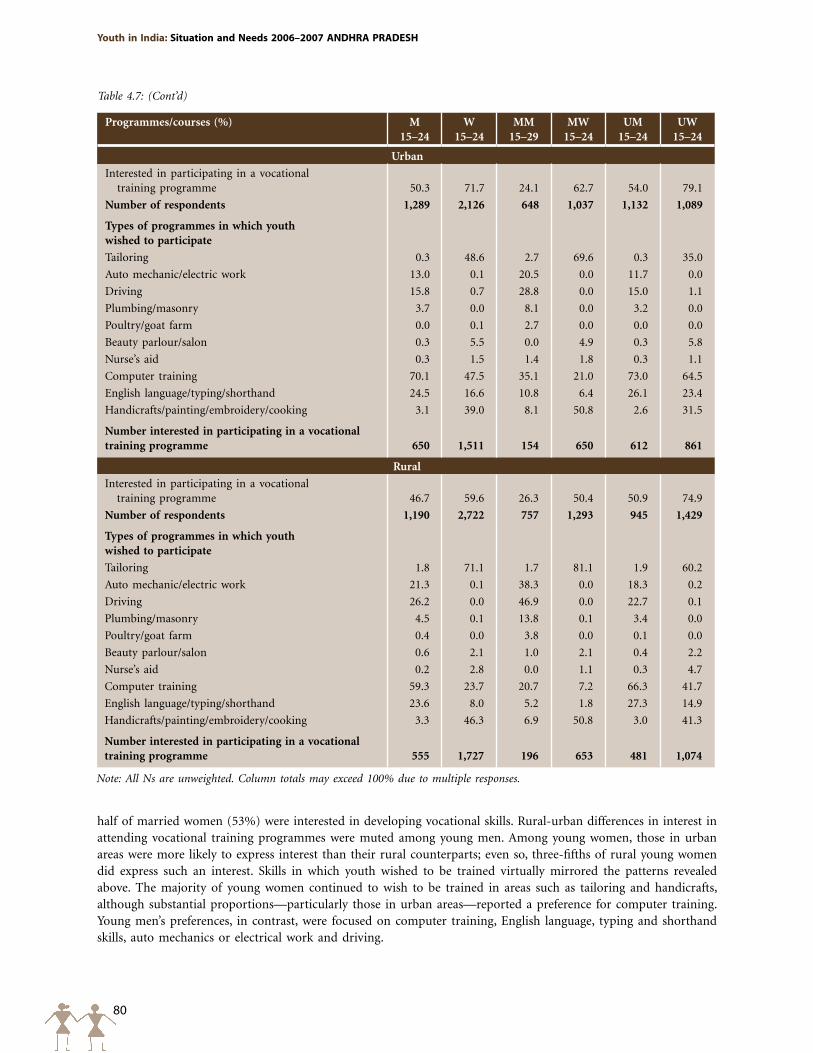
80
Youth in India: Situation and Needs 2006–2007 ANDHRA pRADESH
Programmes/courses (%) M15–24
W 15–24
MM 15–29
MW 15–24
UM 15–24
UW 15–24
Urban
Interested in participating in a vocational training programme 50.3 71.7 24.1 62.7 54.0 79.1
Number of respondents 1,289 2,126 648 1,037 1,132 1,089
Types of programmes in which youth wished to participate
Tailoring 0.3 48.6 2.7 69.6 0.3 35.0
Auto mechanic/electric work 13.0 0.1 20.5 0.0 11.7 0.0
Driving 15.8 0.7 28.8 0.0 15.0 1.1
Plumbing/masonry 3.7 0.0 8.1 0.0 3.2 0.0
Poultry/goat farm 0.0 0.1 2.7 0.0 0.0 0.0
Beauty parlour/salon 0.3 5.5 0.0 4.9 0.3 5.8
Nurse’s aid 0.3 1.5 1.4 1.8 0.3 1.1
Computer training 70.1 47.5 35.1 21.0 73.0 64.5
English language/typing/shorthand 24.5 16.6 10.8 6.4 26.1 23.4
Handicrafts/painting/embroidery/cooking 3.1 39.0 8.1 50.8 2.6 31.5
Number interested in participating in a vocational training programme 650 1,511 154 650 612 861
Rural
Interested in participating in a vocational training programme 46.7 59.6 26.3 50.4 50.9 74.9
Number of respondents 1,190 2,722 757 1,293 945 1,429
Types of programmes in which youth wished to participate
Tailoring 1.8 71.1 1.7 81.1 1.9 60.2
Auto mechanic/electric work 21.3 0.1 38.3 0.0 18.3 0.2
Driving 26.2 0.0 46.9 0.0 22.7 0.1
Plumbing/masonry 4.5 0.1 13.8 0.1 3.4 0.0
Poultry/goat farm 0.4 0.0 3.8 0.0 0.1 0.0
Beauty parlour/salon 0.6 2.1 1.0 2.1 0.4 2.2
Nurse’s aid 0.2 2.8 0.0 1.1 0.3 4.7
Computer training 59.3 23.7 20.7 7.2 66.3 41.7
English language/typing/shorthand 23.6 8.0 5.2 1.8 27.3 14.9
Handicrafts/painting/embroidery/cooking 3.3 46.3 6.9 50.8 3.0 41.3
Number interested in participating in a vocational training programme 555 1,727 196 653 481 1,074
Note: All Ns are unweighted. Column totals may exceed 100% due to multiple responses.
Table 4.7: (Cont’d)
half of married women (53%) were interested in developing vocational skills. Rural-urban differences in interest in attending vocational training programmes were muted among young men. Among young women, those in urban areas were more likely to express interest than their rural counterparts; even so, three-fifths of rural young women did express such an interest. Skills in which youth wished to be trained virtually mirrored the patterns revealed above. The majority of young women continued to wish to be trained in areas such as tailoring and handicrafts, although substantial proportions—particularly those in urban areas—reported a preference for computer training. Young men’s preferences, in contrast, were focused on computer training, English language, typing and shorthand skills, auto mechanics or electrical work and driving.
81
Economic and non-economic activity
4.7 Summary
Work profiles suggest that three-quarters of young men and three-fifths of young women had at some time engaged in paid or unpaid work. Indeed, almost all married young men and over two-thirds of unmarried young men had done so, compared with over two-thirds and half of married and unmarried young women, respectively. Likewise, more youth in rural than urban areas had ever worked. While the majority of youth were engaged in paid work, considerable proportions of young men and women (26% each) reported unpaid work on the family farm or business. Economic activity was often initiated at an early age: 37% and 39% of young men and women, respectively, reported initiating work in childhood or early adolescence (before age 15). Data on work participation in the 12 months prior to the interview indicate that the majority of young men (98% of married and 67% of unmarried) and a substantial proportion of young women (51% and 44%, respectively) had engaged in paid or unpaid work at some point in the 12 months preceding the survey. The majority of young men (85%) who worked in the year prior to the interview had done so for the major part (at least six months) of the year. In contrast among young women, 71% had done so.
Occupational profiles among those working for wages differed widely among youth in rural and urban areas. Among young men in rural areas, leading occupations were agricultural labour, skilled manual labour and unskilled non-agricultural labour, together reported by 86%. Those in urban areas were also likely to report skilled manual labour and unskilled non-agricultural labour, but in addition, many reported administrative, executive, managerial and clerical occupations; almost all men (91%) reported these occupations. While percentages differed, leading occupations reported by young women resembled those of young men, although considerably more young women than men in rural areas were engaged in agricultural labour (72% versus 39%).
Unemployment rates ranged from 7% among young men to 10% among young women. Unemployment tended to be higher among the unmarried than the married. While rural-urban differences were negligible among young men, young women in urban areas reported considerably higher rates of unemployment than did their rural counterparts. Unemployment was particularly high among the educated and the economically better off.
Youth were interested in acquiring skills that would enable employment generation; 48% of young men and 63% of young women expressed interest in vocational skills training. However, far fewer—just one-third each of young men and women—had attended at least one vocational training programme.
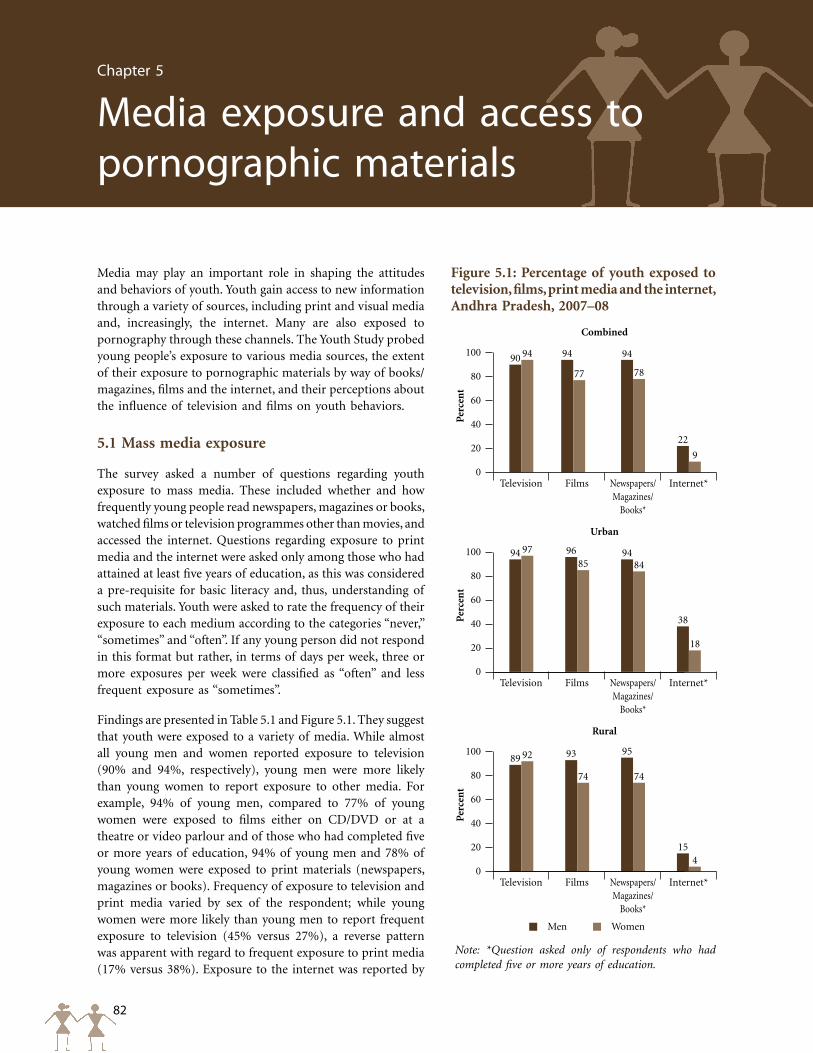
82
Youth in India: Situation and Needs 2006–2007 ANDHRA pRADESH
Media may play an important role in shaping the attitudes and behaviors of youth. Youth gain access to new information through a variety of sources, including print and visual media and, increasingly, the internet. Many are also exposed to pornography through these channels. The Youth Study probed young people’s exposure to various media sources, the extent of their exposure to pornographic materials by way of books/magazines, films and the internet, and their perceptions about the influence of television and films on youth behaviors.
5.1 Mass media exposure
The survey asked a number of questions regarding youth exposure to mass media. These included whether and how frequently young people read newspapers, magazines or books, watched films or television programmes other than movies, and accessed the internet. Questions regarding exposure to print media and the internet were asked only among those who had attained at least five years of education, as this was considered a pre-requisite for basic literacy and, thus, understanding of such materials. Youth were asked to rate the frequency of their exposure to each medium according to the categories “never,” “sometimes” and “often”. If any young person did not respond in this format but rather, in terms of days per week, three or more exposures per week were classified as “often” and less frequent exposure as “sometimes”.
Findings are presented in Table 5.1 and Figure 5.1. They suggest that youth were exposed to a variety of media. While almost all young men and women reported exposure to television (90% and 94%, respectively), young men were more likely than young women to report exposure to other media. For example, 94% of young men, compared to 77% of young women were exposed to films either on CD/DVD or at a theatre or video parlour and of those who had completed five or more years of education, 94% of young men and 78% of young women were exposed to print materials (newspapers, magazines or books). Frequency of exposure to television and print media varied by sex of the respondent; while young women were more likely than young men to report frequent exposure to television (45% versus 27%), a reverse pattern was apparent with regard to frequent exposure to print media (17% versus 38%). Exposure to the internet was reported by
Chapter 5
Media exposure and access to pornographic materials
Figure 5.1: Percentage of youth exposed to television, films, print media and the internet, Andhra Pradesh, 2007–08
Combined
Urban
Rural
Per
cen
t
100
80
60
40
20
0
90 94 94
22
94
77 78
9
Television Films Newspapers/ Magazines/
Books*
Internet*
Television Films Newspapers/ Magazines/
Books*
Internet*
Per
cen
t
100
80
60
40
20
0
94 96 94
38
97
85 84
18
Per
cen
t
100
80
60
40
20
0
89 93 95
15
92
74 74
4
Note: *Question asked only of respondents who had completed five or more years of education.
Men Women
Television Films Newspapers/ Magazines/
Books*
Internet*
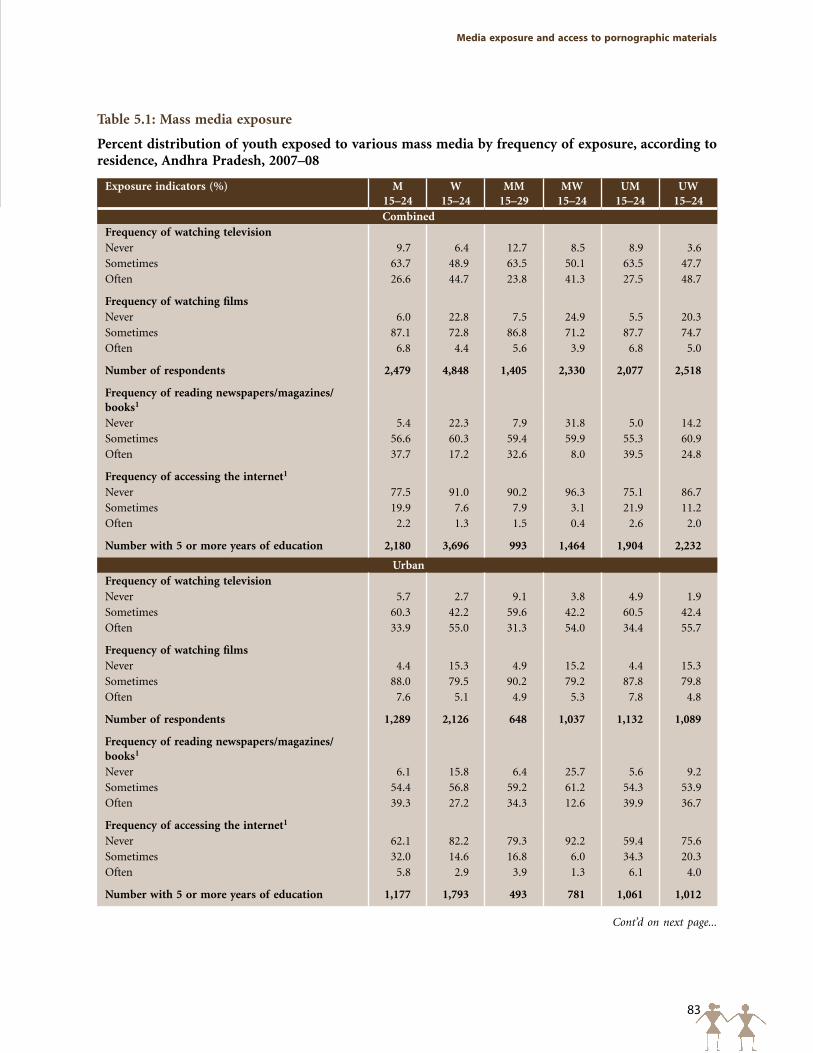
83
Media exposure and access to pornographic materials
Cont’d on next page...
Table 5.1: Mass media exposure
Percent distribution of youth exposed to various mass media by frequency of exposure, according to residence, Andhra Pradesh, 2007–08
Exposure indicators (%) M15–24
W 15–24
MM 15–29
MW 15–24
UM 15–24
UW 15–24
CombinedFrequency of watching televisionNever 9.7 6.4 12.7 8.5 8.9 3.6Sometimes 63.7 48.9 63.5 50.1 63.5 47.7Often 26.6 44.7 23.8 41.3 27.5 48.7
Frequency of watching filmsNever 6.0 22.8 7.5 24.9 5.5 20.3Sometimes 87.1 72.8 86.8 71.2 87.7 74.7Often 6.8 4.4 5.6 3.9 6.8 5.0
Number of respondents 2,479 4,848 1,405 2,330 2,077 2,518
Frequency of reading newspapers/magazines/books1
Never 5.4 22.3 7.9 31.8 5.0 14.2Sometimes 56.6 60.3 59.4 59.9 55.3 60.9Often 37.7 17.2 32.6 8.0 39.5 24.8
Frequency of accessing the internet1
Never 77.5 91.0 90.2 96.3 75.1 86.7Sometimes 19.9 7.6 7.9 3.1 21.9 11.2Often 2.2 1.3 1.5 0.4 2.6 2.0
Number with 5 or more years of education 2,180 3,696 993 1,464 1,904 2,232
UrbanFrequency of watching televisionNever 5.7 2.7 9.1 3.8 4.9 1.9Sometimes 60.3 42.2 59.6 42.2 60.5 42.4Often 33.9 55.0 31.3 54.0 34.4 55.7
Frequency of watching filmsNever 4.4 15.3 4.9 15.2 4.4 15.3Sometimes 88.0 79.5 90.2 79.2 87.8 79.8Often 7.6 5.1 4.9 5.3 7.8 4.8
Number of respondents 1,289 2,126 648 1,037 1,132 1,089
Frequency of reading newspapers/magazines/books1
Never 6.1 15.8 6.4 25.7 5.6 9.2Sometimes 54.4 56.8 59.2 61.2 54.3 53.9Often 39.3 27.2 34.3 12.6 39.9 36.7
Frequency of accessing the internet1
Never 62.1 82.2 79.3 92.2 59.4 75.6Sometimes 32.0 14.6 16.8 6.0 34.3 20.3Often 5.8 2.9 3.9 1.3 6.1 4.0
Number with 5 or more years of education 1,177 1,793 493 781 1,061 1,012
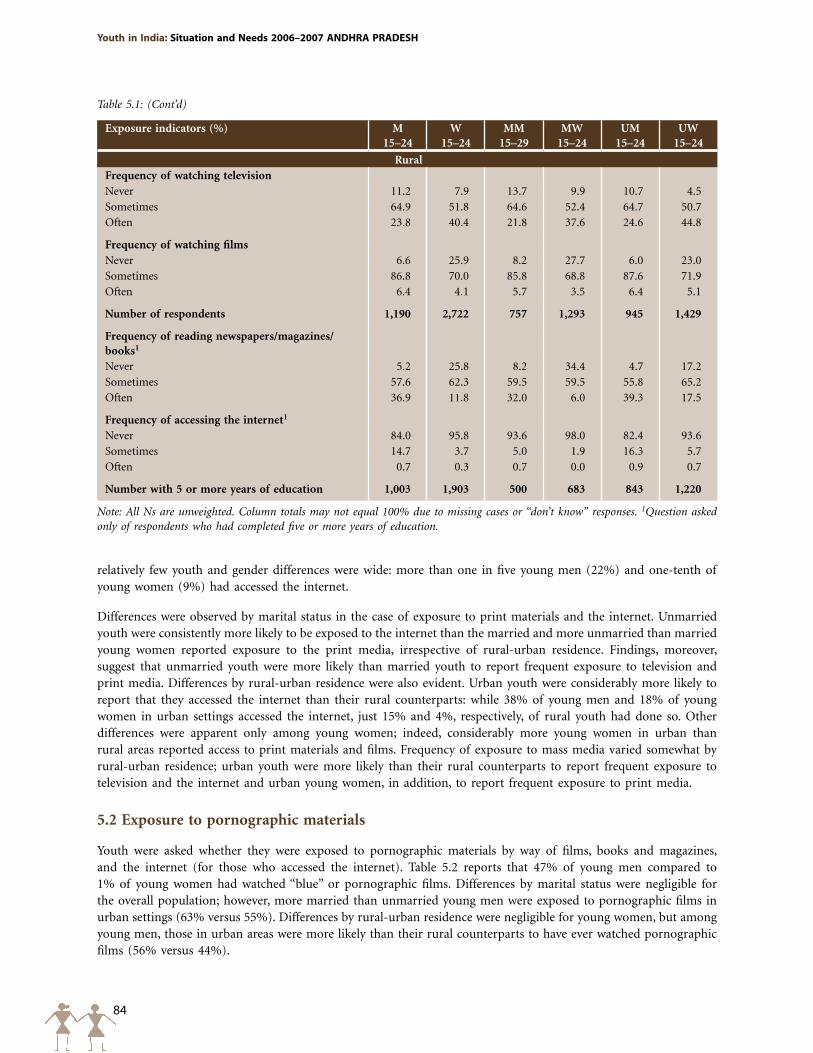
84
Youth in India: Situation and Needs 2006–2007 ANDHRA pRADESH
Exposure indicators (%) M15–24
W 15–24
MM 15–29
MW 15–24
UM 15–24
UW 15–24
RuralFrequency of watching televisionNever 11.2 7.9 13.7 9.9 10.7 4.5Sometimes 64.9 51.8 64.6 52.4 64.7 50.7Often 23.8 40.4 21.8 37.6 24.6 44.8
Frequency of watching filmsNever 6.6 25.9 8.2 27.7 6.0 23.0Sometimes 86.8 70.0 85.8 68.8 87.6 71.9Often 6.4 4.1 5.7 3.5 6.4 5.1
Number of respondents 1,190 2,722 757 1,293 945 1,429
Frequency of reading newspapers/magazines/books1
Never 5.2 25.8 8.2 34.4 4.7 17.2Sometimes 57.6 62.3 59.5 59.5 55.8 65.2Often 36.9 11.8 32.0 6.0 39.3 17.5
Frequency of accessing the internet1
Never 84.0 95.8 93.6 98.0 82.4 93.6Sometimes 14.7 3.7 5.0 1.9 16.3 5.7Often 0.7 0.3 0.7 0.0 0.9 0.7
Number with 5 or more years of education 1,003 1,903 500 683 843 1,220
Note: All Ns are unweighted. Column totals may not equal 100% due to missing cases or “don’t know” responses. 1Question asked only of respondents who had completed five or more years of education.
Table 5.1: (Cont’d)
relatively few youth and gender differences were wide: more than one in five young men (22%) and one-tenth of young women (9%) had accessed the internet.
Differences were observed by marital status in the case of exposure to print materials and the internet. Unmarried youth were consistently more likely to be exposed to the internet than the married and more unmarried than married young women reported exposure to the print media, irrespective of rural-urban residence. Findings, moreover, suggest that unmarried youth were more likely than married youth to report frequent exposure to television and print media. Differences by rural-urban residence were also evident. Urban youth were considerably more likely to report that they accessed the internet than their rural counterparts: while 38% of young men and 18% of young women in urban settings accessed the internet, just 15% and 4%, respectively, of rural youth had done so. Other differences were apparent only among young women; indeed, considerably more young women in urban than rural areas reported access to print materials and films. Frequency of exposure to mass media varied somewhat by rural-urban residence; urban youth were more likely than their rural counterparts to report frequent exposure to television and the internet and urban young women, in addition, to report frequent exposure to print media.
5.2 Exposure to pornographic materials
Youth were asked whether they were exposed to pornographic materials by way of films, books and magazines, and the internet (for those who accessed the internet). Table 5.2 reports that 47% of young men compared to 1% of young women had watched “blue” or pornographic films. Differences by marital status were negligible for the overall population; however, more married than unmarried young men were exposed to pornographic films in urban settings (63% versus 55%). Differences by rural-urban residence were negligible for young women, but among young men, those in urban areas were more likely than their rural counterparts to have ever watched pornographic films (56% versus 44%).
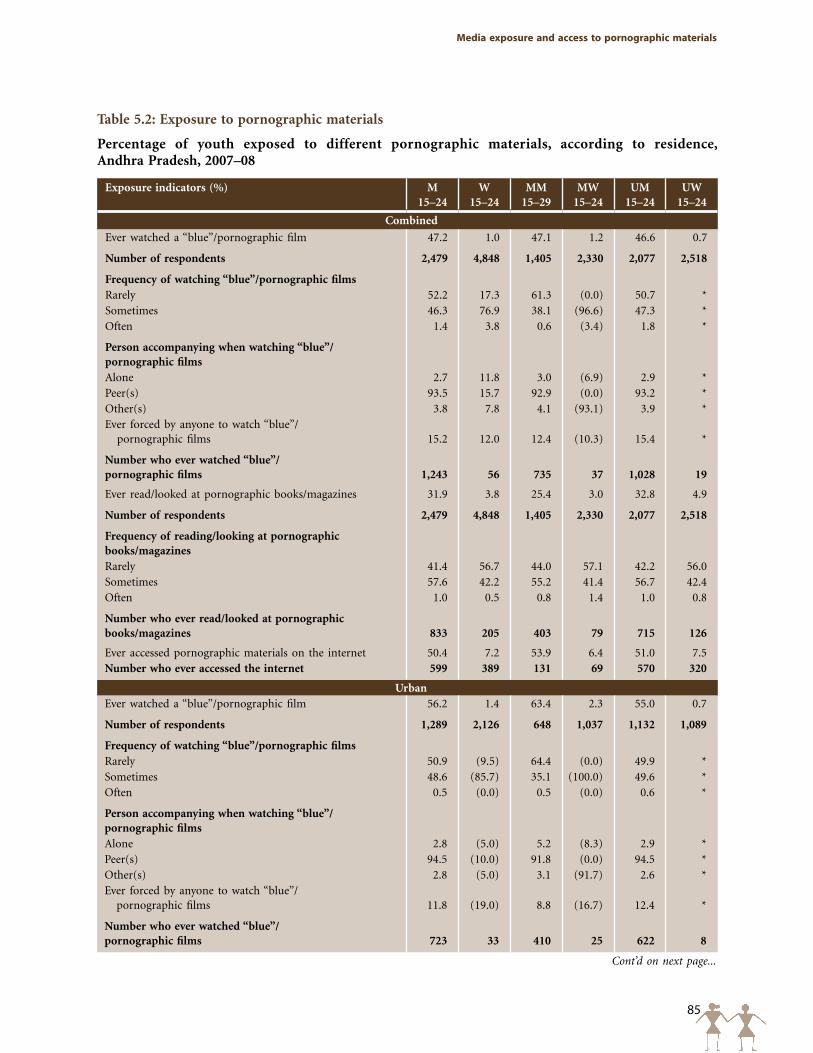
85
Media exposure and access to pornographic materials
Table 5.2: Exposure to pornographic materials
Percentage of youth exposed to different pornographic materials, according to residence, Andhra Pradesh, 2007–08
Exposure indicators (%) M 15–24
W 15–24
MM 15–29
MW 15–24
UM 15–24
UW 15–24
Combined
Ever watched a “blue”/pornographic film 47.2 1.0 47.1 1.2 46.6 0.7
Number of respondents 2,479 4,848 1,405 2,330 2,077 2,518
Frequency of watching “blue”/pornographic filmsRarely 52.2 17.3 61.3 (0.0) 50.7 *Sometimes 46.3 76.9 38.1 (96.6) 47.3 *Often 1.4 3.8 0.6 (3.4) 1.8 *
Person accompanying when watching “blue”/ pornographic filmsAlone 2.7 11.8 3.0 (6.9) 2.9 *Peer(s) 93.5 15.7 92.9 (0.0) 93.2 *Other(s) 3.8 7.8 4.1 (93.1) 3.9 *Ever forced by anyone to watch “blue”/
pornographic films 15.2 12.0 12.4 (10.3) 15.4 *
Number who ever watched “blue”/ pornographic films 1,243 56 735 37 1,028 19
Ever read/looked at pornographic books/magazines 31.9 3.8 25.4 3.0 32.8 4.9
Number of respondents 2,479 4,848 1,405 2,330 2,077 2,518
Frequency of reading/looking at pornographic books/magazinesRarely 41.4 56.7 44.0 57.1 42.2 56.0Sometimes 57.6 42.2 55.2 41.4 56.7 42.4Often 1.0 0.5 0.8 1.4 1.0 0.8
Number who ever read/looked at pornographic books/magazines 833 205 403 79 715 126
Ever accessed pornographic materials on the internet 50.4 7.2 53.9 6.4 51.0 7.5Number who ever accessed the internet 599 389 131 69 570 320
UrbanEver watched a “blue”/pornographic film 56.2 1.4 63.4 2.3 55.0 0.7
Number of respondents 1,289 2,126 648 1,037 1,132 1,089
Frequency of watching “blue”/pornographic filmsRarely 50.9 (9.5) 64.4 (0.0) 49.9 *Sometimes 48.6 (85.7) 35.1 (100.0) 49.6 *Often 0.5 (0.0) 0.5 (0.0) 0.6 *
Person accompanying when watching “blue”/ pornographic filmsAlone 2.8 (5.0) 5.2 (8.3) 2.9 *Peer(s) 94.5 (10.0) 91.8 (0.0) 94.5 *Other(s) 2.8 (5.0) 3.1 (91.7) 2.6 *Ever forced by anyone to watch “blue”/
pornographic films 11.8 (19.0) 8.8 (16.7) 12.4 *
Number who ever watched “blue”/ pornographic films 723 33 410 25 622 8
Cont’d on next page...
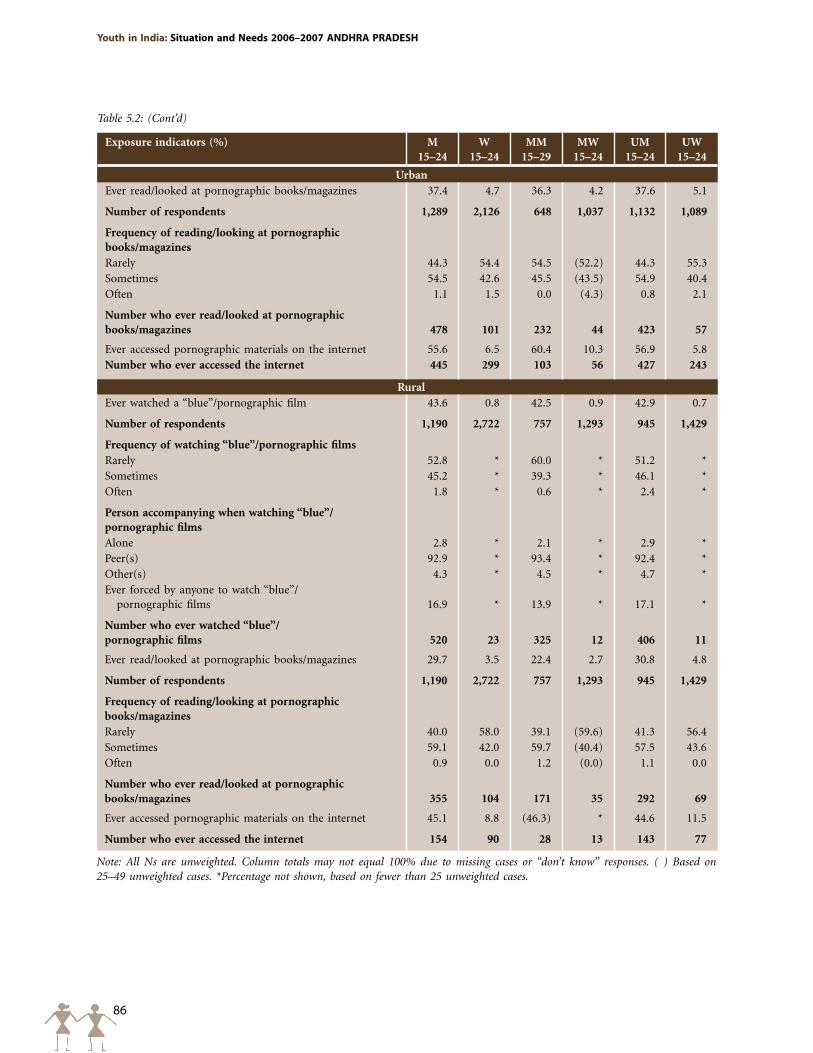
86
Youth in India: Situation and Needs 2006–2007 ANDHRA pRADESH
Exposure indicators (%) M 15–24
W 15–24
MM 15–29
MW 15–24
UM 15–24
UW 15–24
UrbanEver read/looked at pornographic books/magazines 37.4 4.7 36.3 4.2 37.6 5.1
Number of respondents 1,289 2,126 648 1,037 1,132 1,089
Frequency of reading/looking at pornographic books/magazinesRarely 44.3 54.4 54.5 (52.2) 44.3 55.3Sometimes 54.5 42.6 45.5 (43.5) 54.9 40.4Often 1.1 1.5 0.0 (4.3) 0.8 2.1
Number who ever read/looked at pornographic books/magazines 478 101 232 44 423 57
Ever accessed pornographic materials on the internet 55.6 6.5 60.4 10.3 56.9 5.8Number who ever accessed the internet 445 299 103 56 427 243
RuralEver watched a “blue”/pornographic film 43.6 0.8 42.5 0.9 42.9 0.7
Number of respondents 1,190 2,722 757 1,293 945 1,429
Frequency of watching “blue”/pornographic filmsRarely 52.8 * 60.0 * 51.2 *Sometimes 45.2 * 39.3 * 46.1 *Often 1.8 * 0.6 * 2.4 *
Person accompanying when watching “blue”/ pornographic filmsAlone 2.8 * 2.1 * 2.9 *Peer(s) 92.9 * 93.4 * 92.4 *Other(s) 4.3 * 4.5 * 4.7 *Ever forced by anyone to watch “blue”/
pornographic films 16.9 * 13.9 * 17.1 *
Number who ever watched “blue”/ pornographic films 520 23 325 12 406 11
Ever read/looked at pornographic books/magazines 29.7 3.5 22.4 2.7 30.8 4.8
Number of respondents 1,190 2,722 757 1,293 945 1,429
Frequency of reading/looking at pornographic books/magazinesRarely 40.0 58.0 39.1 (59.6) 41.3 56.4Sometimes 59.1 42.0 59.7 (40.4) 57.5 43.6Often 0.9 0.0 1.2 (0.0) 1.1 0.0
Number who ever read/looked at pornographic books/magazines 355 104 171 35 292 69
Ever accessed pornographic materials on the internet 45.1 8.8 (46.3) * 44.6 11.5
Number who ever accessed the internet 154 90 28 13 143 77
Note: All Ns are unweighted. Column totals may not equal 100% due to missing cases or “don’t know” responses. ( ) Based on 25–49 unweighted cases. *Percentage not shown, based on fewer than 25 unweighted cases.
Table 5.2: (Cont’d)
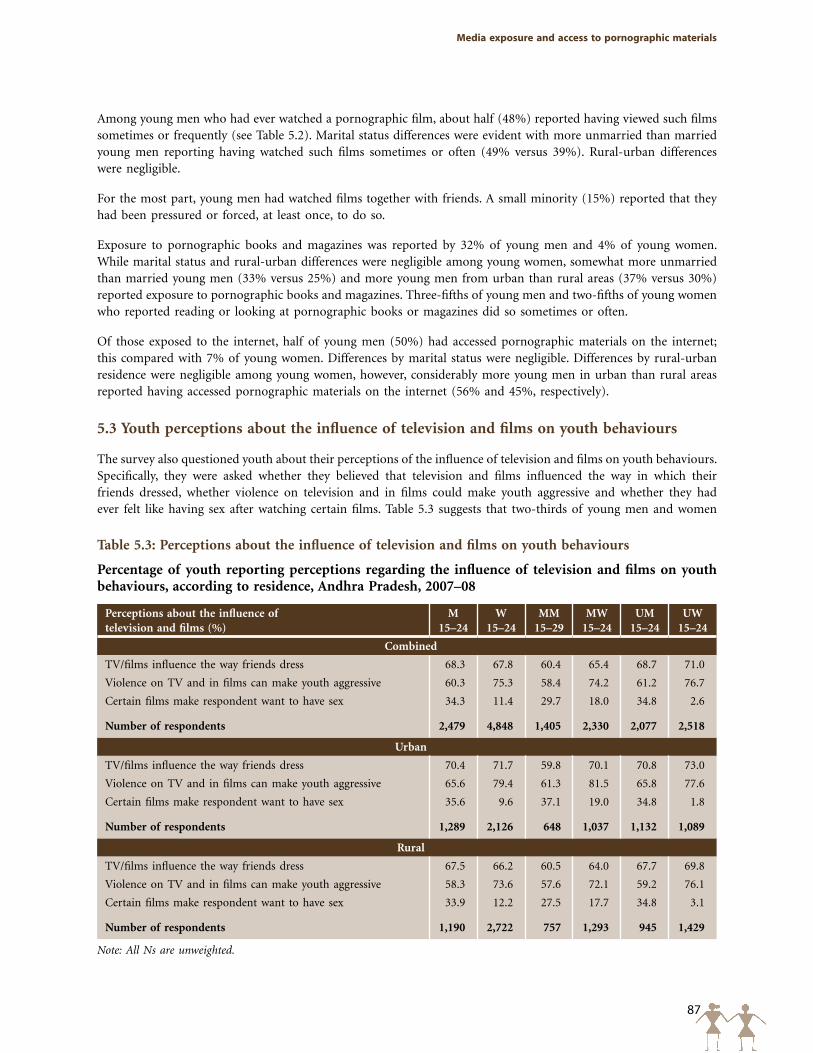
87
Media exposure and access to pornographic materials
Among young men who had ever watched a pornographic film, about half (48%) reported having viewed such films sometimes or frequently (see Table 5.2). Marital status differences were evident with more unmarried than married young men reporting having watched such films sometimes or often (49% versus 39%). Rural-urban differences were negligible.
For the most part, young men had watched films together with friends. A small minority (15%) reported that they had been pressured or forced, at least once, to do so.
Exposure to pornographic books and magazines was reported by 32% of young men and 4% of young women. While marital status and rural-urban differences were negligible among young women, somewhat more unmarried than married young men (33% versus 25%) and more young men from urban than rural areas (37% versus 30%) reported exposure to pornographic books and magazines. Three-fifths of young men and two-fifths of young women who reported reading or looking at pornographic books or magazines did so sometimes or often.
Of those exposed to the internet, half of young men (50%) had accessed pornographic materials on the internet; this compared with 7% of young women. Differences by marital status were negligible. Differences by rural-urban residence were negligible among young women, however, considerably more young men in urban than rural areas reported having accessed pornographic materials on the internet (56% and 45%, respectively).
5.3 Youth perceptions about the influence of television and films on youth behaviours
The survey also questioned youth about their perceptions of the influence of television and films on youth behaviours. Specifically, they were asked whether they believed that television and films influenced the way in which their friends dressed, whether violence on television and in films could make youth aggressive and whether they had ever felt like having sex after watching certain films. Table 5.3 suggests that two-thirds of young men and women
Table 5.3: Perceptions about the influence of television and films on youth behaviours
Percentage of youth reporting perceptions regarding the influence of television and films on youth behaviours, according to residence, Andhra Pradesh, 2007–08
Perceptions about the influence of television and films (%)
M15–24
W 15–24
MM 15–29
MW 15–24
UM 15–24
UW 15–24
Combined
TV/films influence the way friends dress 68.3 67.8 60.4 65.4 68.7 71.0
Violence on TV and in films can make youth aggressive 60.3 75.3 58.4 74.2 61.2 76.7
Certain films make respondent want to have sex 34.3 11.4 29.7 18.0 34.8 2.6
Number of respondents 2,479 4,848 1,405 2,330 2,077 2,518
Urban
TV/films influence the way friends dress 70.4 71.7 59.8 70.1 70.8 73.0
Violence on TV and in films can make youth aggressive 65.6 79.4 61.3 81.5 65.8 77.6
Certain films make respondent want to have sex 35.6 9.6 37.1 19.0 34.8 1.8
Number of respondents 1,289 2,126 648 1,037 1,132 1,089
Rural
TV/films influence the way friends dress 67.5 66.2 60.5 64.0 67.7 69.8
Violence on TV and in films can make youth aggressive 58.3 73.6 57.6 72.1 59.2 76.1
Certain films make respondent want to have sex 33.9 12.2 27.5 17.7 34.8 3.1
Number of respondents 1,190 2,722 757 1,293 945 1,429
Note: All Ns are unweighted.
88
Youth in India: Situation and Needs 2006–2007 ANDHRA pRADESH
(68% each) believed that television and films influenced the way their friends dressed. Three-fifths of young men and three-quarters of young women believed that violence on television and in films could make youth aggressive. One-third (34%) of young men and one-tenth (11%) of young women reported that watching certain films had made them desire sex. Clearly, considerable proportions of youth felt that television and films influenced their friends’, and in the case of young men their own, behaviours.
Differences in reported perceptions by marital status were narrow, although unmarried youth were somewhat more likely than others to acknowledge the influence of television and films on the way youth dress. Married young women, moreover, were more likely than unmarried young women to report that watching certain films had made them desire sex. Differences by rural-urban residence were, likewise, narrow, although urban youth were somewhat more likely than rural youth to report that violence on television and in films could make youth aggressive (66% versus 58% among urban and rural young men; 79% versus 74%, respectively, among young women) and urban young women were more likely than their rural counterparts to report that TV/films influenced the way their friends dressed (72% versus 66%).
5.4 Summary
Findings suggest that almost all youth in Andhra Pradesh were exposed to the media, typically television (90% of all young men and 94% of all young women), newspapers, magazines or books (94% of young men and 78% of young women with five or more years of education) and films either on CD/DVD or at a theatre or video parlour (94% of young men and 77% of young women). Exposure to the internet was reported by many fewer (22% of young men and 9% of young women with five or more years of education). Gender differences were apparent with regard to exposure to the print media, to films and to the internet, with young men considerably more likely than young women to report exposure.
Findings also suggest that almost half of young men and hardly any young women had watched pornographic or “blue” films, and one-third of young men and 4% of young women had read or looked at pornographic books and magazines. Finally, half of young men (and 7% of young women) who had accessed the internet reported that they had accessed pornographic materials on the internet. At least half of young men who reported watching pornographic films or reading pornographic materials reported that they accessed these materials sometimes or frequently. Finally, between three-fifths and three-quarters of young men and women acknowledged the influence that media have on youth behaviours.
89
Growing up
Chapter 6
Growing up
This chapter focuses on such experiences as puberty as well as youth interaction with parents and peers while growing up. Globally, studies have suggested a declining age at puberty for young men and women and stress that this, along with rising age at marriage, provides a longer window in which young people can make same- and opposite-sex friends (National Research Council and Institute of Medicine, 2005). Several studies have highlighted the importance of close parental interaction for the healthy development of young people (Laird et al., 2003; Marta, 1997; Sroufe, 1991). Others note that young people’s interaction with parents is particularly limited when it comes to discussion of sensitive issues, for example, girl-boy relations or sexual and reproductive matters (Alexander et al., 2006a; 2006b; Lambert and Wood, 2005; Mehra, Savithri and Coutinho, 2002). In addition, a few studies have shown that the peer group is, for many youth, a central source of both information and support, but at the same time, a source of misinformation and pressure to adopt risky behaviours (Bhuiya et al., 2003; Sachdev, 1998; Ul Haque and Faizunnisa, 2003).
The Youth Study included several questions relating to each of these issues. This chapter begins by describing the age at which young people experienced signs of puberty. It then explores aspects of their family life and interaction with parents on various matters of importance to youth. It also addresses peer networks and interaction, specifically, the size of the same- and opposite-sex peer network and peer activities in which respondents engaged. Finally, the chapter discusses young people’s access to support networks for discussing personal matters.
6.1 Puberty
In order to examine age at which puberty occurs among young men and women, the Youth Study included questions on age at menarche for young women and age at which voice change and growth of pubic hair were noticed for young men. Table 6.1a shows that mean age at menarche was 12.9 years for young women, irrespective of rural-urban residence.
Voice change and appearance of pubic hair for young men occurred 2 to 2.5 years later than did menarche for young women. Table 6.1b shows that the average age at which young men reported voice change was 15.1 years, and growth of pubic hair was 15.7 years, with those in rural and urban areas reporting similar mean age at which these changes occurred.
6.2 Family life and interaction with parents
The Youth Study explored a variety of issues that capture the nature of family life, and youth interaction with parents in particular. Married respondents were specifically asked to recall the period before marriage.
6.2.1 Socialisation experiences
Table 6.2 presents findings on the socialisation experiences of youth during their teenage years as compared with siblings, or cousins of the opposite sex if the respondent did not have an opposite-sex sibling. Wide gender differences were evident in relation to respondents’ freedom to go out as well as housework expectations. For example, three-quarters of young men (75%) reported that they had more freedom to go out than their sisters or female
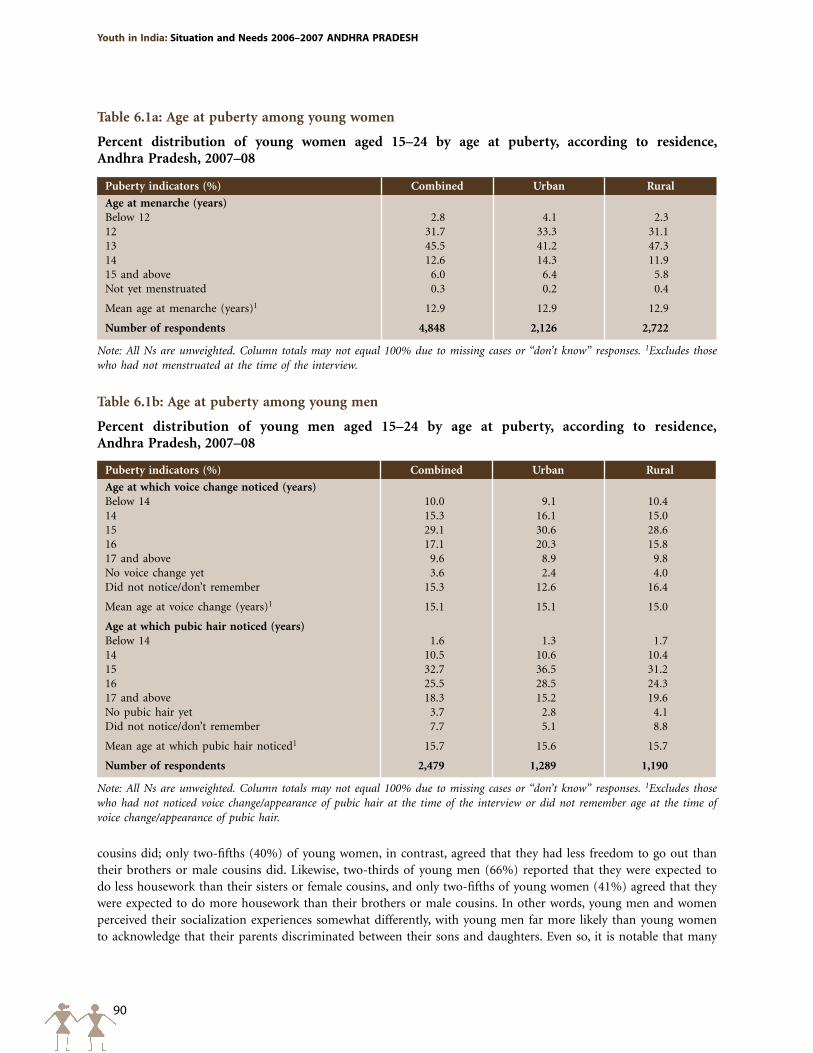
90
Youth in India: Situation and Needs 2006–2007 ANDHRA pRADESH
Table 6.1a: Age at puberty among young women
Percent distribution of young women aged 15–24 by age at puberty, according to residence, Andhra Pradesh, 2007–08
Puberty indicators (%) Combined Urban Rural
Age at menarche (years)Below 12 2.8 4.1 2.312 31.7 33.3 31.113 45.5 41.2 47.314 12.6 14.3 11.915 and above 6.0 6.4 5.8Not yet menstruated 0.3 0.2 0.4
Mean age at menarche (years)1 12.9 12.9 12.9
Number of respondents 4,848 2,126 2,722
Note: All Ns are unweighted. Column totals may not equal 100% due to missing cases or “don’t know” responses. 1Excludes those who had not menstruated at the time of the interview.
Table 6.1b: Age at puberty among young men
Percent distribution of young men aged 15–24 by age at puberty, according to residence, Andhra Pradesh, 2007–08
Puberty indicators (%) Combined Urban Rural
Age at which voice change noticed (years)Below 14 10.0 9.1 10.414 15.3 16.1 15.015 29.1 30.6 28.616 17.1 20.3 15.817 and above 9.6 8.9 9.8No voice change yet 3.6 2.4 4.0Did not notice/don’t remember 15.3 12.6 16.4
Mean age at voice change (years)1 15.1 15.1 15.0
Age at which pubic hair noticed (years)Below 14 1.6 1.3 1.714 10.5 10.6 10.415 32.7 36.5 31.216 25.5 28.5 24.317 and above 18.3 15.2 19.6No pubic hair yet 3.7 2.8 4.1Did not notice/don’t remember 7.7 5.1 8.8
Mean age at which pubic hair noticed1 15.7 15.6 15.7
Number of respondents 2,479 1,289 1,190
Note: All Ns are unweighted. Column totals may not equal 100% due to missing cases or “don’t know” responses. 1Excludes those who had not noticed voice change/appearance of pubic hair at the time of the interview or did not remember age at the time of voice change/appearance of pubic hair.
cousins did; only two-fifths (40%) of young women, in contrast, agreed that they had less freedom to go out than their brothers or male cousins did. Likewise, two-thirds of young men (66%) reported that they were expected to do less housework than their sisters or female cousins, and only two-fifths of young women (41%) agreed that they were expected to do more housework than their brothers or male cousins. In other words, young men and women perceived their socialization experiences somewhat differently, with young men far more likely than young women to acknowledge that their parents discriminated between their sons and daughters. Even so, it is notable that many
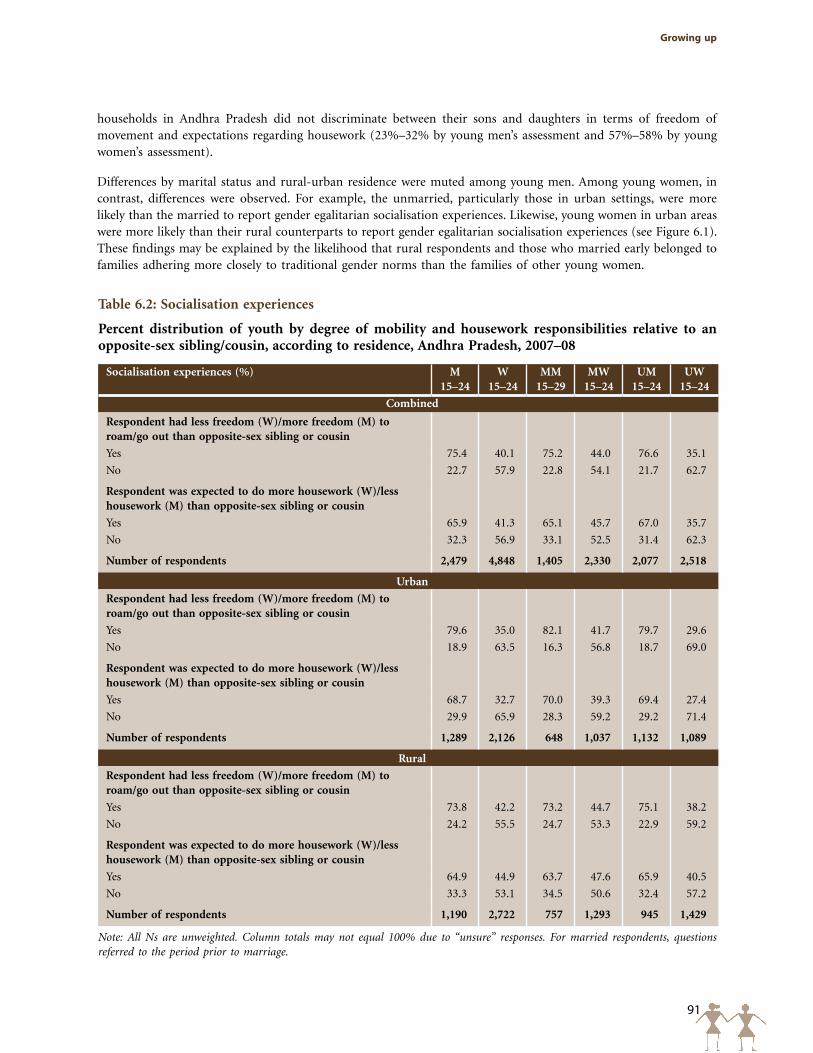
91
Growing up
Table 6.2: Socialisation experiences
Percent distribution of youth by degree of mobility and housework responsibilities relative to an opposite-sex sibling/cousin, according to residence, Andhra Pradesh, 2007–08
Socialisation experiences (%) M 15–24
W 15–24
MM 15–29
MW 15–24
UM 15–24
UW 15–24
Combined
Respondent had less freedom (W)/more freedom (M) to roam/go out than opposite-sex sibling or cousin
Yes 75.4 40.1 75.2 44.0 76.6 35.1
No 22.7 57.9 22.8 54.1 21.7 62.7
Respondent was expected to do more housework (W)/less housework (M) than opposite-sex sibling or cousin
Yes 65.9 41.3 65.1 45.7 67.0 35.7
No 32.3 56.9 33.1 52.5 31.4 62.3
Number of respondents 2,479 4,848 1,405 2,330 2,077 2,518
Urban
Respondent had less freedom (W)/more freedom (M) to roam/go out than opposite-sex sibling or cousin
Yes 79.6 35.0 82.1 41.7 79.7 29.6
No 18.9 63.5 16.3 56.8 18.7 69.0
Respondent was expected to do more housework (W)/less housework (M) than opposite-sex sibling or cousin
Yes 68.7 32.7 70.0 39.3 69.4 27.4
No 29.9 65.9 28.3 59.2 29.2 71.4
Number of respondents 1,289 2,126 648 1,037 1,132 1,089
Rural
Respondent had less freedom (W)/more freedom (M) to roam/go out than opposite-sex sibling or cousin
Yes 73.8 42.2 73.2 44.7 75.1 38.2
No 24.2 55.5 24.7 53.3 22.9 59.2
Respondent was expected to do more housework (W)/less housework (M) than opposite-sex sibling or cousin
Yes 64.9 44.9 63.7 47.6 65.9 40.5
No 33.3 53.1 34.5 50.6 32.4 57.2
Number of respondents 1,190 2,722 757 1,293 945 1,429
Note: All Ns are unweighted. Column totals may not equal 100% due to “unsure” responses. For married respondents, questions referred to the period prior to marriage.
households in Andhra Pradesh did not discriminate between their sons and daughters in terms of freedom of movement and expectations regarding housework (23%–32% by young men’s assessment and 57%–58% by young women’s assessment).
Differences by marital status and rural-urban residence were muted among young men. Among young women, in contrast, differences were observed. For example, the unmarried, particularly those in urban settings, were more likely than the married to report gender egalitarian socialisation experiences. Likewise, young women in urban areas were more likely than their rural counterparts to report gender egalitarian socialisation experiences (see Figure 6.1). These findings may be explained by the likelihood that rural respondents and those who married early belonged to families adhering more closely to traditional gender norms than the families of other young women.
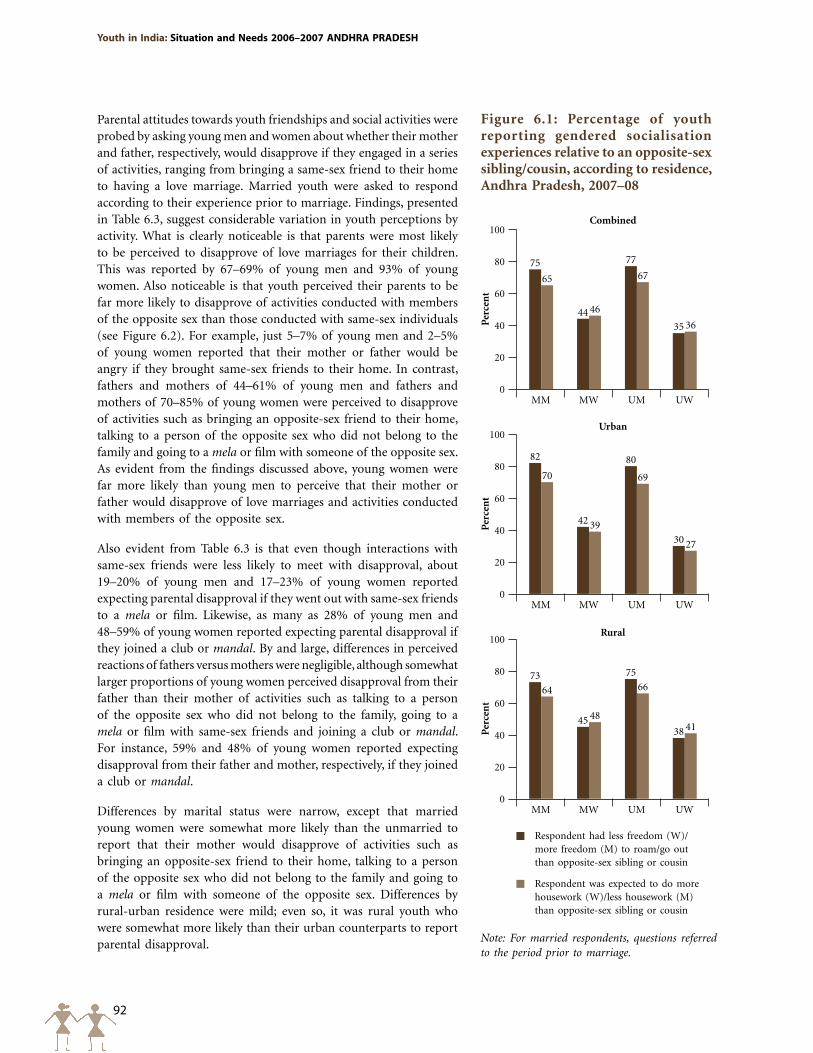
92
Youth in India: Situation and Needs 2006–2007 ANDHRA pRADESH
Figure 6.1: Percentage of youth reporting gendered socialisation experiences relative to an opposite-sex sibling/cousin, according to residence, Andhra Pradesh, 2007–08
Per
cen
t
100
80
60
40
20
0
75
44
77
35
65
46
67
36
Combined
MM MW UM UW
Per
cen
t
100
80
60
40
20
0
82
42
80
30
70
39
69
27
Urban
MM MW UM UW
Per
cen
t
100
80
60
40
20
0
73
45
75
38
64
48
66
41
Rural
MM MW UM UW
Note: For married respondents, questions referred to the period prior to marriage.
Respondent had less freedom (W)/ more freedom (M) to roam/go out than opposite-sex sibling or cousin
Respondent was expected to do more housework (W)/less housework (M) than opposite-sex sibling or cousin
Parental attitudes towards youth friendships and social activities were probed by asking young men and women about whether their mother and father, respectively, would disapprove if they engaged in a series of activities, ranging from bringing a same-sex friend to their home to having a love marriage. Married youth were asked to respond according to their experience prior to marriage. Findings, presented in Table 6.3, suggest considerable variation in youth perceptions by activity. What is clearly noticeable is that parents were most likely to be perceived to disapprove of love marriages for their children. This was reported by 67–69% of young men and 93% of young women. Also noticeable is that youth perceived their parents to be far more likely to disapprove of activities conducted with members of the opposite sex than those conducted with same-sex individuals (see Figure 6.2). For example, just 5–7% of young men and 2–5% of young women reported that their mother or father would be angry if they brought same-sex friends to their home. In contrast, fathers and mothers of 44–61% of young men and fathers and mothers of 70–85% of young women were perceived to disapprove of activities such as bringing an opposite-sex friend to their home, talking to a person of the opposite sex who did not belong to the family and going to a mela or film with someone of the opposite sex. As evident from the findings discussed above, young women were far more likely than young men to perceive that their mother or father would disapprove of love marriages and activities conducted with members of the opposite sex.
Also evident from Table 6.3 is that even though interactions with same-sex friends were less likely to meet with disapproval, about 19–20% of young men and 17–23% of young women reported expecting parental disapproval if they went out with same-sex friends to a mela or film. Likewise, as many as 28% of young men and 48–59% of young women reported expecting parental disapproval if they joined a club or mandal. By and large, differences in perceived reactions of fathers versus mothers were negligible, although somewhat larger proportions of young women perceived disapproval from their father than their mother of activities such as talking to a person of the opposite sex who did not belong to the family, going to a mela or film with same-sex friends and joining a club or mandal. For instance, 59% and 48% of young women reported expecting disapproval from their father and mother, respectively, if they joined a club or mandal.
Differences by marital status were narrow, except that married young women were somewhat more likely than the unmarried to report that their mother would disapprove of activities such as bringing an opposite-sex friend to their home, talking to a person of the opposite sex who did not belong to the family and going to a mela or film with someone of the opposite sex. Differences by rural-urban residence were mild; even so, it was rural youth who were somewhat more likely than their urban counterparts to report parental disapproval.
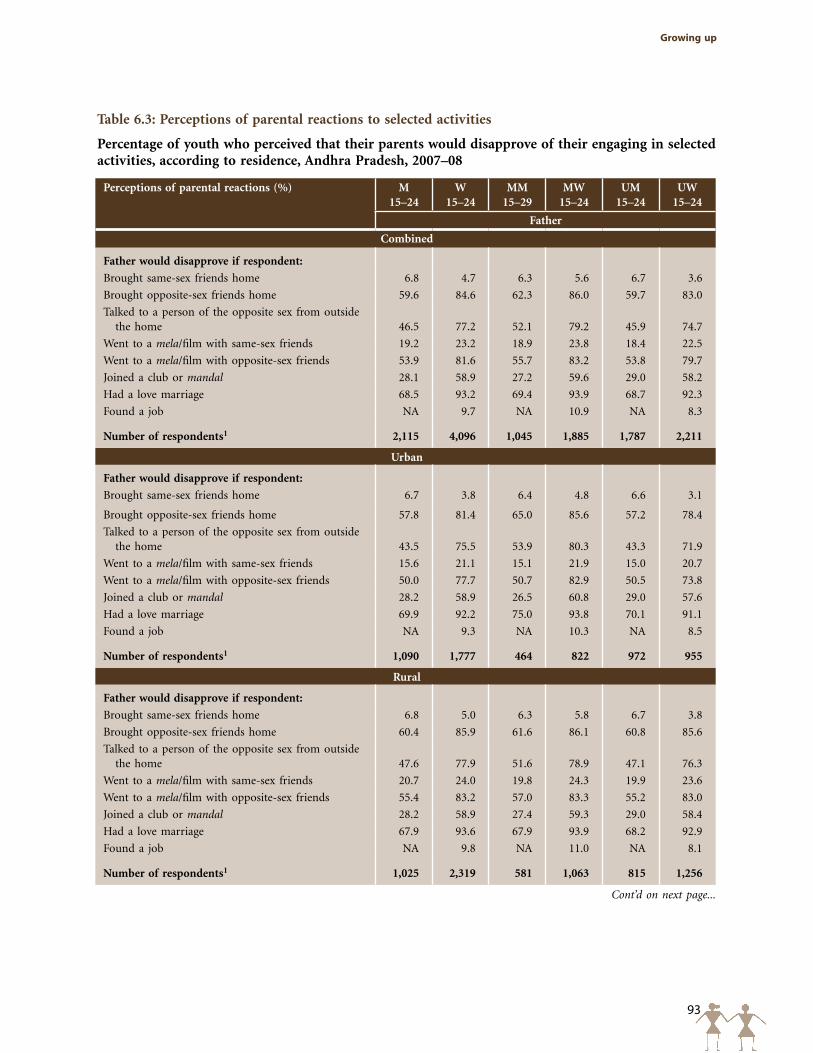
93
Growing up
Table 6.3: Perceptions of parental reactions to selected activities
Percentage of youth who perceived that their parents would disapprove of their engaging in selected activities, according to residence, Andhra Pradesh, 2007–08
Perceptions of parental reactions (%) M15–24
W 15–24
MM 15–29
MW 15–24
UM 15–24
UW 15–24
Father
Combined
Father would disapprove if respondent:
Brought same-sex friends home 6.8 4.7 6.3 5.6 6.7 3.6
Brought opposite-sex friends home 59.6 84.6 62.3 86.0 59.7 83.0
Talked to a person of the opposite sex from outside the home 46.5 77.2 52.1 79.2 45.9 74.7
Went to a mela/film with same-sex friends 19.2 23.2 18.9 23.8 18.4 22.5
Went to a mela/film with opposite-sex friends 53.9 81.6 55.7 83.2 53.8 79.7
Joined a club or mandal 28.1 58.9 27.2 59.6 29.0 58.2
Had a love marriage 68.5 93.2 69.4 93.9 68.7 92.3
Found a job NA 9.7 NA 10.9 NA 8.3
Number of respondents1 2,115 4,096 1,045 1,885 1,787 2,211
Urban
Father would disapprove if respondent:
Brought same-sex friends home 6.7 3.8 6.4 4.8 6.6 3.1
Brought opposite-sex friends home 57.8 81.4 65.0 85.6 57.2 78.4
Talked to a person of the opposite sex from outside the home 43.5 75.5 53.9 80.3 43.3 71.9
Went to a mela/film with same-sex friends 15.6 21.1 15.1 21.9 15.0 20.7
Went to a mela/film with opposite-sex friends 50.0 77.7 50.7 82.9 50.5 73.8
Joined a club or mandal 28.2 58.9 26.5 60.8 29.0 57.6
Had a love marriage 69.9 92.2 75.0 93.8 70.1 91.1
Found a job NA 9.3 NA 10.3 NA 8.5
Number of respondents1 1,090 1,777 464 822 972 955
Rural
Father would disapprove if respondent:
Brought same-sex friends home 6.8 5.0 6.3 5.8 6.7 3.8
Brought opposite-sex friends home 60.4 85.9 61.6 86.1 60.8 85.6
Talked to a person of the opposite sex from outside the home 47.6 77.9 51.6 78.9 47.1 76.3
Went to a mela/film with same-sex friends 20.7 24.0 19.8 24.3 19.9 23.6
Went to a mela/film with opposite-sex friends 55.4 83.2 57.0 83.3 55.2 83.0
Joined a club or mandal 28.2 58.9 27.4 59.3 29.0 58.4
Had a love marriage 67.9 93.6 67.9 93.9 68.2 92.9
Found a job NA 9.8 NA 11.0 NA 8.1
Number of respondents1 1,025 2,319 581 1,063 815 1,256
Cont’d on next page...
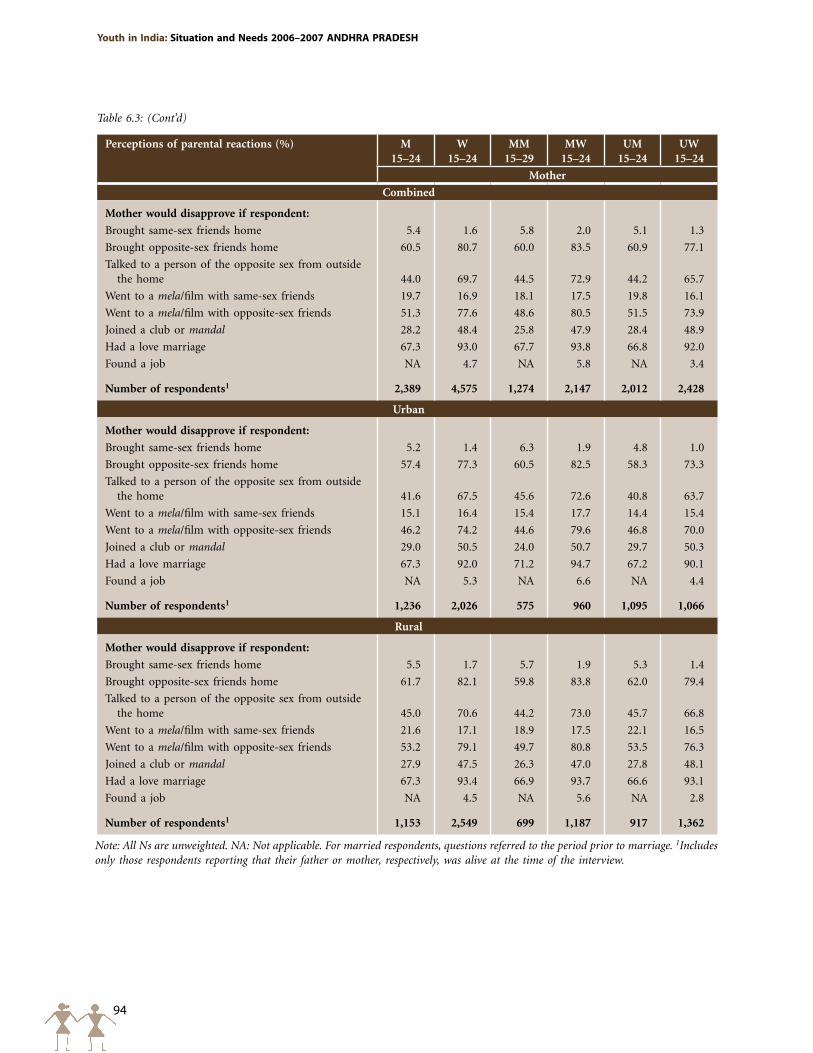
94
Youth in India: Situation and Needs 2006–2007 ANDHRA pRADESH
Perceptions of parental reactions (%) M15–24
W 15–24
MM 15–29
MW 15–24
UM 15–24
UW 15–24
Mother
Combined
Mother would disapprove if respondent:
Brought same-sex friends home 5.4 1.6 5.8 2.0 5.1 1.3
Brought opposite-sex friends home 60.5 80.7 60.0 83.5 60.9 77.1
Talked to a person of the opposite sex from outside the home 44.0 69.7 44.5 72.9 44.2 65.7
Went to a mela/film with same-sex friends 19.7 16.9 18.1 17.5 19.8 16.1
Went to a mela/film with opposite-sex friends 51.3 77.6 48.6 80.5 51.5 73.9
Joined a club or mandal 28.2 48.4 25.8 47.9 28.4 48.9
Had a love marriage 67.3 93.0 67.7 93.8 66.8 92.0
Found a job NA 4.7 NA 5.8 NA 3.4
Number of respondents1 2,389 4,575 1,274 2,147 2,012 2,428
Urban
Mother would disapprove if respondent:
Brought same-sex friends home 5.2 1.4 6.3 1.9 4.8 1.0
Brought opposite-sex friends home 57.4 77.3 60.5 82.5 58.3 73.3
Talked to a person of the opposite sex from outside the home 41.6 67.5 45.6 72.6 40.8 63.7
Went to a mela/film with same-sex friends 15.1 16.4 15.4 17.7 14.4 15.4
Went to a mela/film with opposite-sex friends 46.2 74.2 44.6 79.6 46.8 70.0
Joined a club or mandal 29.0 50.5 24.0 50.7 29.7 50.3
Had a love marriage 67.3 92.0 71.2 94.7 67.2 90.1
Found a job NA 5.3 NA 6.6 NA 4.4
Number of respondents1 1,236 2,026 575 960 1,095 1,066
Rural
Mother would disapprove if respondent:
Brought same-sex friends home 5.5 1.7 5.7 1.9 5.3 1.4
Brought opposite-sex friends home 61.7 82.1 59.8 83.8 62.0 79.4
Talked to a person of the opposite sex from outside the home 45.0 70.6 44.2 73.0 45.7 66.8
Went to a mela/film with same-sex friends 21.6 17.1 18.9 17.5 22.1 16.5
Went to a mela/film with opposite-sex friends 53.2 79.1 49.7 80.8 53.5 76.3
Joined a club or mandal 27.9 47.5 26.3 47.0 27.8 48.1
Had a love marriage 67.3 93.4 66.9 93.7 66.6 93.1
Found a job NA 4.5 NA 5.6 NA 2.8
Number of respondents1 1,153 2,549 699 1,187 917 1,362
Note: All Ns are unweighted. NA: Not applicable. For married respondents, questions referred to the period prior to marriage. 1Includes only those respondents reporting that their father or mother, respectively, was alive at the time of the interview.
Table 6.3: (Cont’d)
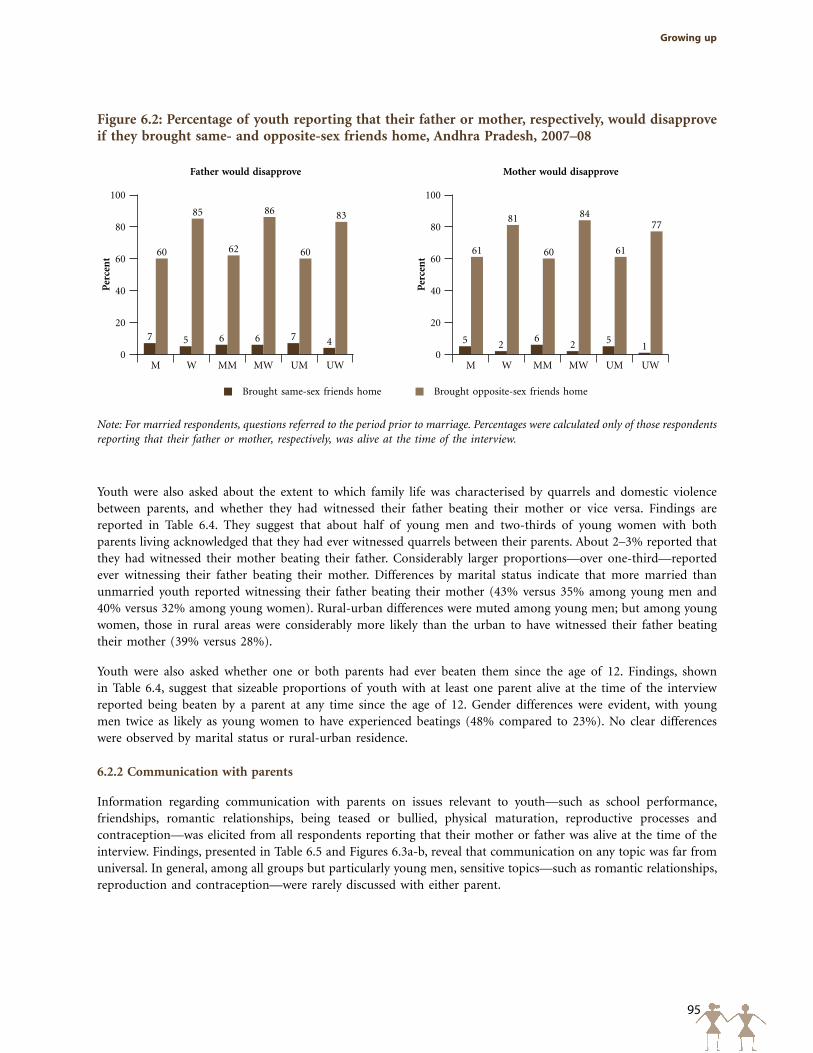
95
Growing up
Note: For married respondents, questions referred to the period prior to marriage. Percentages were calculated only of those respondents reporting that their father or mother, respectively, was alive at the time of the interview.
Figure 6.2: Percentage of youth reporting that their father or mother, respectively, would disapprove if they brought same- and opposite-sex friends home, Andhra Pradesh, 2007–08
Per
cen
t
100
80
60
40
20
0
7 5 6 6 7 4
60
85
62
86
60
83
Father would disapprove
MMWM MW UM UW
Per
cen
t
100
80
60
40
20
0
5 26
2 51
61
81
60
84
61
77
Mother would disapprove
MMWM MW UM UW
Brought same-sex friends home Brought opposite-sex friends home
Youth were also asked about the extent to which family life was characterised by quarrels and domestic violence between parents, and whether they had witnessed their father beating their mother or vice versa. Findings are reported in Table 6.4. They suggest that about half of young men and two-thirds of young women with both parents living acknowledged that they had ever witnessed quarrels between their parents. About 2–3% reported that they had witnessed their mother beating their father. Considerably larger proportions—over one-third—reported ever witnessing their father beating their mother. Differences by marital status indicate that more married than unmarried youth reported witnessing their father beating their mother (43% versus 35% among young men and 40% versus 32% among young women). Rural-urban differences were muted among young men; but among young women, those in rural areas were considerably more likely than the urban to have witnessed their father beating their mother (39% versus 28%).
Youth were also asked whether one or both parents had ever beaten them since the age of 12. Findings, shown in Table 6.4, suggest that sizeable proportions of youth with at least one parent alive at the time of the interview reported being beaten by a parent at any time since the age of 12. Gender differences were evident, with young men twice as likely as young women to have experienced beatings (48% compared to 23%). No clear differences were observed by marital status or rural-urban residence.
6.2.2 Communication with parents
Information regarding communication with parents on issues relevant to youth—such as school performance, friendships, romantic relationships, being teased or bullied, physical maturation, reproductive processes and contraception—was elicited from all respondents reporting that their mother or father was alive at the time of the interview. Findings, presented in Table 6.5 and Figures 6.3a-b, reveal that communication on any topic was far from universal. In general, among all groups but particularly young men, sensitive topics—such as romantic relationships, reproduction and contraception—were rarely discussed with either parent.
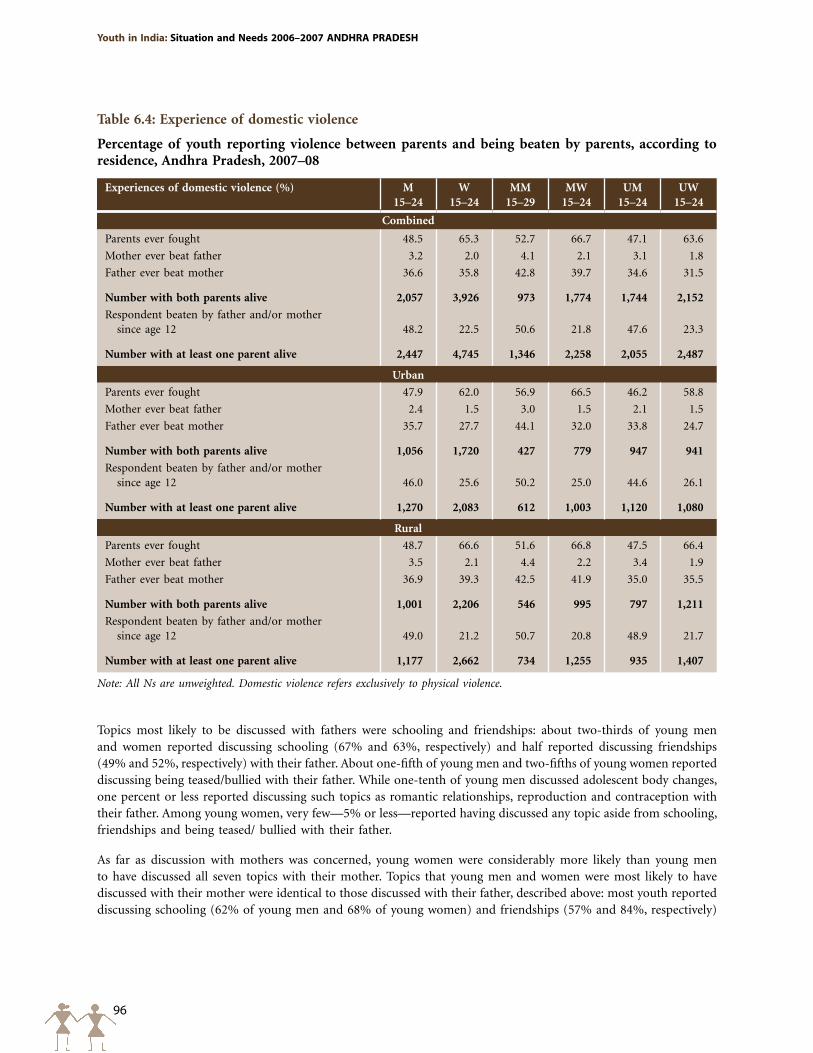
96
Youth in India: Situation and Needs 2006–2007 ANDHRA pRADESH
Table 6.4: Experience of domestic violence
Percentage of youth reporting violence between parents and being beaten by parents, according to residence, Andhra Pradesh, 2007–08
Experiences of domestic violence (%) M15–24
W 15–24
MM 15–29
MW 15–24
UM 15–24
UW 15–24
Combined
Parents ever fought 48.5 65.3 52.7 66.7 47.1 63.6
Mother ever beat father 3.2 2.0 4.1 2.1 3.1 1.8
Father ever beat mother 36.6 35.8 42.8 39.7 34.6 31.5
Number with both parents alive 2,057 3,926 973 1,774 1,744 2,152
Respondent beaten by father and/or mother since age 12 48.2 22.5 50.6 21.8 47.6 23.3
Number with at least one parent alive 2,447 4,745 1,346 2,258 2,055 2,487
Urban
Parents ever fought 47.9 62.0 56.9 66.5 46.2 58.8
Mother ever beat father 2.4 1.5 3.0 1.5 2.1 1.5
Father ever beat mother 35.7 27.7 44.1 32.0 33.8 24.7
Number with both parents alive 1,056 1,720 427 779 947 941
Respondent beaten by father and/or mother since age 12 46.0 25.6 50.2 25.0 44.6 26.1
Number with at least one parent alive 1,270 2,083 612 1,003 1,120 1,080
Rural
Parents ever fought 48.7 66.6 51.6 66.8 47.5 66.4
Mother ever beat father 3.5 2.1 4.4 2.2 3.4 1.9
Father ever beat mother 36.9 39.3 42.5 41.9 35.0 35.5
Number with both parents alive 1,001 2,206 546 995 797 1,211
Respondent beaten by father and/or mother since age 12 49.0 21.2 50.7 20.8 48.9 21.7
Number with at least one parent alive 1,177 2,662 734 1,255 935 1,407
Note: All Ns are unweighted. Domestic violence refers exclusively to physical violence.
Topics most likely to be discussed with fathers were schooling and friendships: about two-thirds of young men and women reported discussing schooling (67% and 63%, respectively) and half reported discussing friendships (49% and 52%, respectively) with their father. About one-fifth of young men and two-fifths of young women reported discussing being teased/bullied with their father. While one-tenth of young men discussed adolescent body changes, one percent or less reported discussing such topics as romantic relationships, reproduction and contraception with their father. Among young women, very few—5% or less—reported having discussed any topic aside from schooling, friendships and being teased/ bullied with their father.
As far as discussion with mothers was concerned, young women were considerably more likely than young men to have discussed all seven topics with their mother. Topics that young men and women were most likely to have discussed with their mother were identical to those discussed with their father, described above: most youth reported discussing schooling (62% of young men and 68% of young women) and friendships (57% and 84%, respectively)
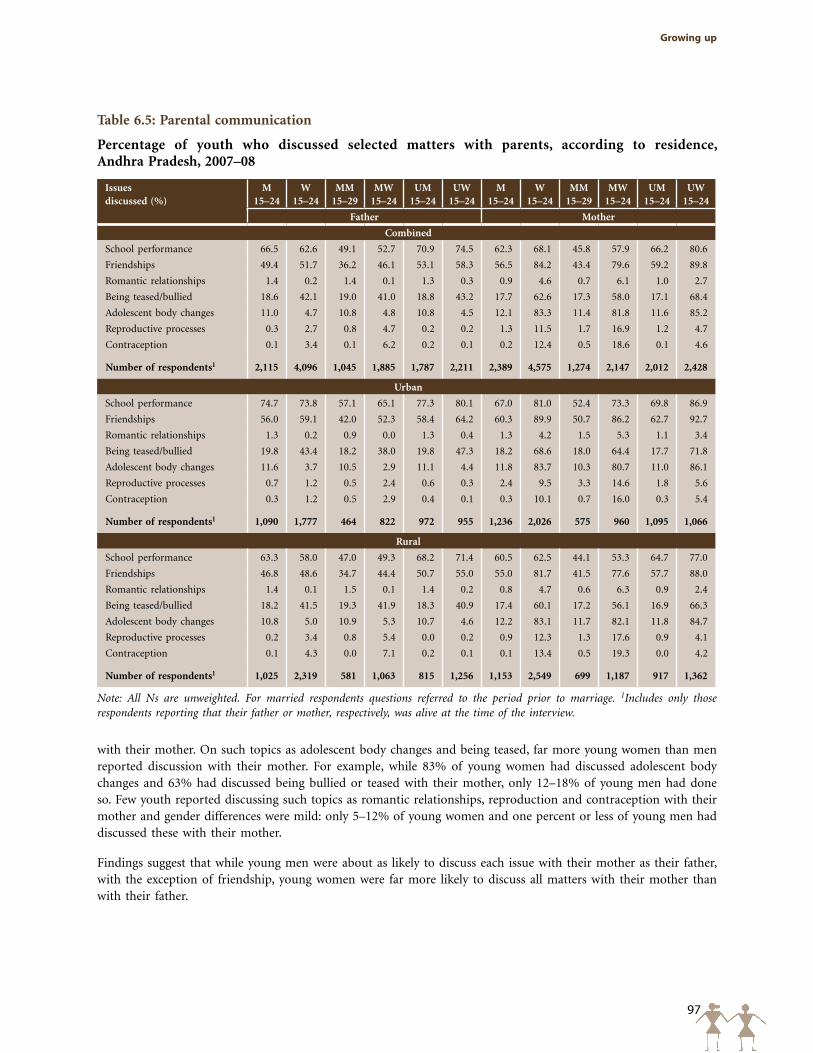
97
Growing up
Table 6.5: Parental communication
Percentage of youth who discussed selected matters with parents, according to residence, Andhra Pradesh, 2007–08
Issues discussed (%)
M 15–24
W 15–24
MM 15–29
MW 15–24
UM 15–24
UW 15–24
M 15–24
W 15–24
MM 15–29
MW 15–24
UM 15–24
UW 15–24
Father Mother
Combined
School performance 66.5 62.6 49.1 52.7 70.9 74.5 62.3 68.1 45.8 57.9 66.2 80.6
Friendships 49.4 51.7 36.2 46.1 53.1 58.3 56.5 84.2 43.4 79.6 59.2 89.8
Romantic relationships 1.4 0.2 1.4 0.1 1.3 0.3 0.9 4.6 0.7 6.1 1.0 2.7
Being teased/bullied 18.6 42.1 19.0 41.0 18.8 43.2 17.7 62.6 17.3 58.0 17.1 68.4
Adolescent body changes 11.0 4.7 10.8 4.8 10.8 4.5 12.1 83.3 11.4 81.8 11.6 85.2
Reproductive processes 0.3 2.7 0.8 4.7 0.2 0.2 1.3 11.5 1.7 16.9 1.2 4.7
Contraception 0.1 3.4 0.1 6.2 0.2 0.1 0.2 12.4 0.5 18.6 0.1 4.6
Number of respondents1 2,115 4,096 1,045 1,885 1,787 2,211 2,389 4,575 1,274 2,147 2,012 2,428
Urban
School performance 74.7 73.8 57.1 65.1 77.3 80.1 67.0 81.0 52.4 73.3 69.8 86.9
Friendships 56.0 59.1 42.0 52.3 58.4 64.2 60.3 89.9 50.7 86.2 62.7 92.7
Romantic relationships 1.3 0.2 0.9 0.0 1.3 0.4 1.3 4.2 1.5 5.3 1.1 3.4
Being teased/bullied 19.8 43.4 18.2 38.0 19.8 47.3 18.2 68.6 18.0 64.4 17.7 71.8
Adolescent body changes 11.6 3.7 10.5 2.9 11.1 4.4 11.8 83.7 10.3 80.7 11.0 86.1
Reproductive processes 0.7 1.2 0.5 2.4 0.6 0.3 2.4 9.5 3.3 14.6 1.8 5.6
Contraception 0.3 1.2 0.5 2.9 0.4 0.1 0.3 10.1 0.7 16.0 0.3 5.4
Number of respondents1 1,090 1,777 464 822 972 955 1,236 2,026 575 960 1,095 1,066
Rural
School performance 63.3 58.0 47.0 49.3 68.2 71.4 60.5 62.5 44.1 53.3 64.7 77.0
Friendships 46.8 48.6 34.7 44.4 50.7 55.0 55.0 81.7 41.5 77.6 57.7 88.0
Romantic relationships 1.4 0.1 1.5 0.1 1.4 0.2 0.8 4.7 0.6 6.3 0.9 2.4
Being teased/bullied 18.2 41.5 19.3 41.9 18.3 40.9 17.4 60.1 17.2 56.1 16.9 66.3
Adolescent body changes 10.8 5.0 10.9 5.3 10.7 4.6 12.2 83.1 11.7 82.1 11.8 84.7
Reproductive processes 0.2 3.4 0.8 5.4 0.0 0.2 0.9 12.3 1.3 17.6 0.9 4.1
Contraception 0.1 4.3 0.0 7.1 0.2 0.1 0.1 13.4 0.5 19.3 0.0 4.2
Number of respondents1 1,025 2,319 581 1,063 815 1,256 1,153 2,549 699 1,187 917 1,362
Note: All Ns are unweighted. For married respondents questions referred to the period prior to marriage. 1Includes only those respondents reporting that their father or mother, respectively, was alive at the time of the interview.
with their mother. On such topics as adolescent body changes and being teased, far more young women than men reported discussion with their mother. For example, while 83% of young women had discussed adolescent body changes and 63% had discussed being bullied or teased with their mother, only 12–18% of young men had done so. Few youth reported discussing such topics as romantic relationships, reproduction and contraception with their mother and gender differences were mild: only 5–12% of young women and one percent or less of young men had discussed these with their mother.
Findings suggest that while young men were about as likely to discuss each issue with their mother as their father, with the exception of friendship, young women were far more likely to discuss all matters with their mother than with their father.
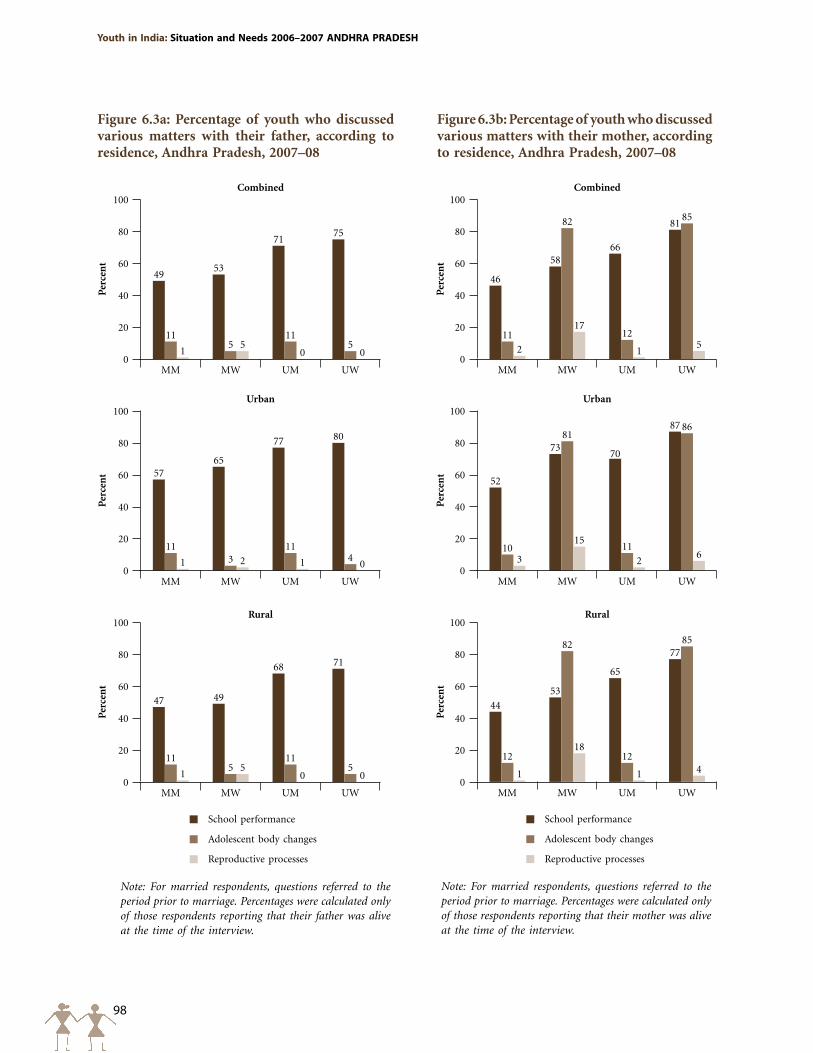
98
Youth in India: Situation and Needs 2006–2007 ANDHRA pRADESH
Note: For married respondents, questions referred to the period prior to marriage. Percentages were calculated only of those respondents reporting that their father was alive at the time of the interview.
Figure 6.3a: Percentage of youth who discussed various matters with their father, according to residence, Andhra Pradesh, 2007–08
Per
cen
t
100
80
60
40
20
0
4953
7175
115
115
15
0 0
Combined
MM MW UM UW
Per
cen
t
100
80
60
40
20
0
5765
77 80
113
1141 2 1 0
Urban
MM MW UM UW
Per
cen
t
100
80
60
40
20
0
47 49
68 71
115
115
15
0 0
Rural
MM MW UM UW
School performance
Adolescent body changes
Reproductive processes
Figure 6.3b: Percentage of youth who discussed various matters with their mother, according to residence, Andhra Pradesh, 2007–08
Note: For married respondents, questions referred to the period prior to marriage. Percentages were calculated only of those respondents reporting that their mother was alive at the time of the interview.
Per
cen
t
100
80
60
40
20
0
46
5866
81
11
82
12
85
2
17
15
Combined
MM MW UM UW
Per
cen
t
100
80
60
40
20
0
52
7370
87
10
81
11
86
3
15
26
Urban
MM MW UM UW
Per
cen
t
100
80
60
40
20
0
44
53
65
77
12
82
12
85
1
18
1 4
Rural
MM MW UM UW
School performance
Adolescent body changes
Reproductive processes
99
Growing up
Differences by marital status suggest that unmarried youth were more likely than the married to have discussed such topics as school performance and friendships with their father or mother. Additionally, unmarried young women were more likely than married women to have discussed being teased/bullied with their mother. In contrast, married women were more likely than unmarried women to share such sensitive topics as reproduction and contraception with their parents, particularly their mother. Differences by rural-urban residence suggest greater openness between a parent and youth in urban areas compared to those in rural areas on non-sensitive topics—schooling and friendships. Additionally, urban young women were more likely than their rural counterparts to have discussed being teased/ bullied with their mother.
6.3 Peer networks and interaction
In order to assess the size of peer networks and the nature of peer interaction, the Youth Study asked young people about the number of same-sex friends they had, whether they had opposite-sex friends and the kinds of activities in which they engaged with their same- and opposite-sex friends. Married respondents were asked to recall the situation prior to marriage.
Table 6.6 reports findings on the size of peer networks. Same-sex peer networks of young men were typically wider than those of young women. The proportion of youth reporting five or more same-sex friends ranged from 58% among young men to 25% among young women, and the median number of same-sex friends reported by young men exceeded that reported by young women by two (5 versus 3). Unmarried young men reported more same-sex friends—a median of one additional friend—than their married counterparts; however, among young women, no differences were evident by marital status. In terms of rural-urban differences, the median number of same-sex friends reported by young men in urban settings (6) exceeded, by one, the median number reported by those in rural settings (5). In the case of young women, however, no differences were observed (all reported a median number of three friends).
Opposite-sex peer networks were reported by sizeable proportions of young people and gender differences were apparent. Young men were twice as likely as young women to report having at least one opposite-sex friend (31% compared to 15%). The unmarried were, likewise, more likely than the married to report an opposite-sex friend—33% and 22%, respectively, among young men, and 23% and 10%, respectively, among young women (see Figure 6.4). Finally, rural young men and women were considerably less likely than their urban counterparts to report an opposite-sex friend.
Table 6.7 reports the nature of interaction with same- and opposite-sex friends. Again, the married were asked to recall the situation prior to marriage. Respondents were asked if they went on picnics or to films with their peers, studied together, spent time chatting, engaged in sporting activities or drank or gambled with their friends.
The activity in which almost all young people engaged was chatting with their same-sex friends. Also, over 70% of young men and women reported studying together with their same-sex friends. Significant gender differences were evident in other forms of interaction: young men were considerably more likely than young women to report going on picnics or to films (92% versus 61%) or engaging in sports or outdoor games (84% versus 63%) with same-sex friends. It is notable that one in four young men (26%) reported drinking or gambling with their same-sex friends; very few young women so reported (1%).
Among young men and women, the unmarried were more likely than the married to report studying with their same-sex friends (77% versus 51% among young men and 85% versus 59% among young women), presumably a function of the higher levels of school attainment of the unmarried, on the one hand, and the relatively curtailed adolescent experience of the married, on the other. Additionally among young men, the unmarried were more likely to report engaging in sports (88% versus 65%), and conversely, the married were more likely than the unmarried to report drinking or gambling with their same-sex friends (47% versus 23%). The patterns remained by and large similar in both urban and rural settings. Rural-urban differences were generally mild, with some exceptions. For example, urban young men were somewhat more likely than their rural counterparts to report drinking or gambling
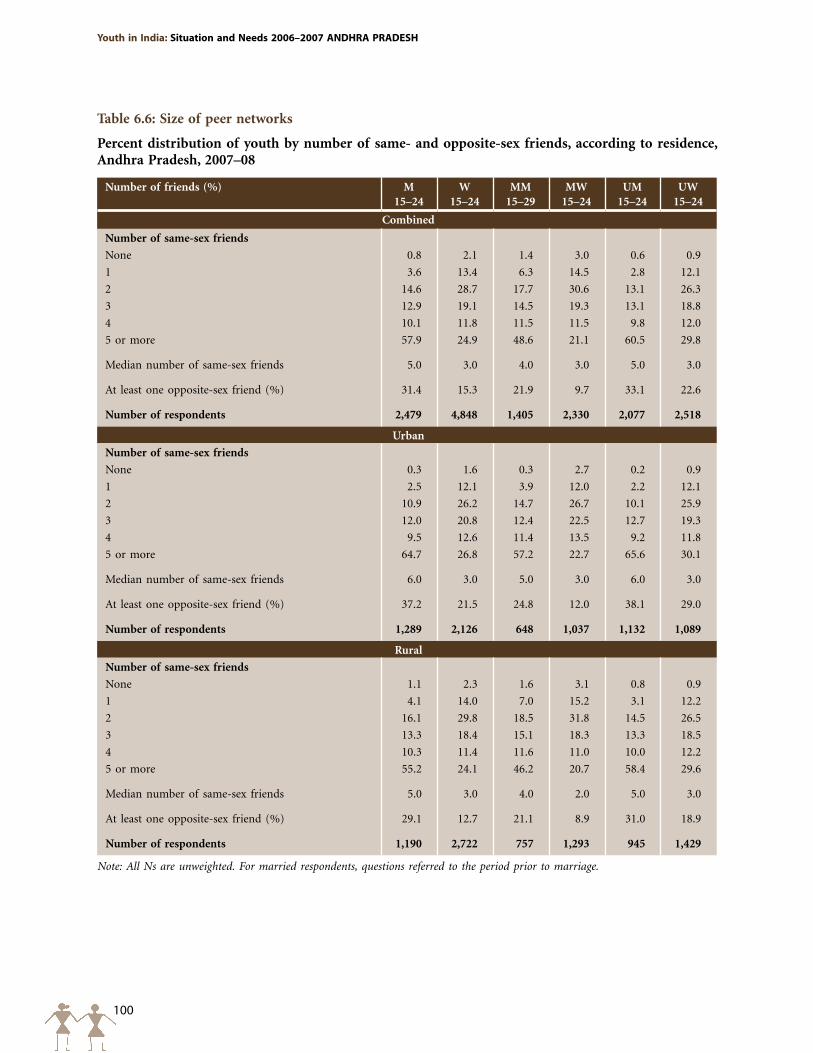
100
Youth in India: Situation and Needs 2006–2007 ANDHRA pRADESH
Table 6.6: Size of peer networks
Percent distribution of youth by number of same- and opposite-sex friends, according to residence, Andhra Pradesh, 2007–08
Number of friends (%) M 15–24
W 15–24
MM 15–29
MW 15–24
UM 15–24
UW 15–24
Combined
Number of same-sex friends
None 0.8 2.1 1.4 3.0 0.6 0.9
1 3.6 13.4 6.3 14.5 2.8 12.1
2 14.6 28.7 17.7 30.6 13.1 26.3
3 12.9 19.1 14.5 19.3 13.1 18.8
4 10.1 11.8 11.5 11.5 9.8 12.0
5 or more 57.9 24.9 48.6 21.1 60.5 29.8
Median number of same-sex friends 5.0 3.0 4.0 3.0 5.0 3.0
At least one opposite-sex friend (%) 31.4 15.3 21.9 9.7 33.1 22.6
Number of respondents 2,479 4,848 1,405 2,330 2,077 2,518
Urban
Number of same-sex friends
None 0.3 1.6 0.3 2.7 0.2 0.9
1 2.5 12.1 3.9 12.0 2.2 12.1
2 10.9 26.2 14.7 26.7 10.1 25.9
3 12.0 20.8 12.4 22.5 12.7 19.3
4 9.5 12.6 11.4 13.5 9.2 11.8
5 or more 64.7 26.8 57.2 22.7 65.6 30.1
Median number of same-sex friends 6.0 3.0 5.0 3.0 6.0 3.0
At least one opposite-sex friend (%) 37.2 21.5 24.8 12.0 38.1 29.0
Number of respondents 1,289 2,126 648 1,037 1,132 1,089
Rural
Number of same-sex friends
None 1.1 2.3 1.6 3.1 0.8 0.9
1 4.1 14.0 7.0 15.2 3.1 12.2
2 16.1 29.8 18.5 31.8 14.5 26.5
3 13.3 18.4 15.1 18.3 13.3 18.5
4 10.3 11.4 11.6 11.0 10.0 12.2
5 or more 55.2 24.1 46.2 20.7 58.4 29.6
Median number of same-sex friends 5.0 3.0 4.0 2.0 5.0 3.0
At least one opposite-sex friend (%) 29.1 12.7 21.1 8.9 31.0 18.9
Number of respondents 1,190 2,722 757 1,293 945 1,429
Note: All Ns are unweighted. For married respondents, questions referred to the period prior to marriage.
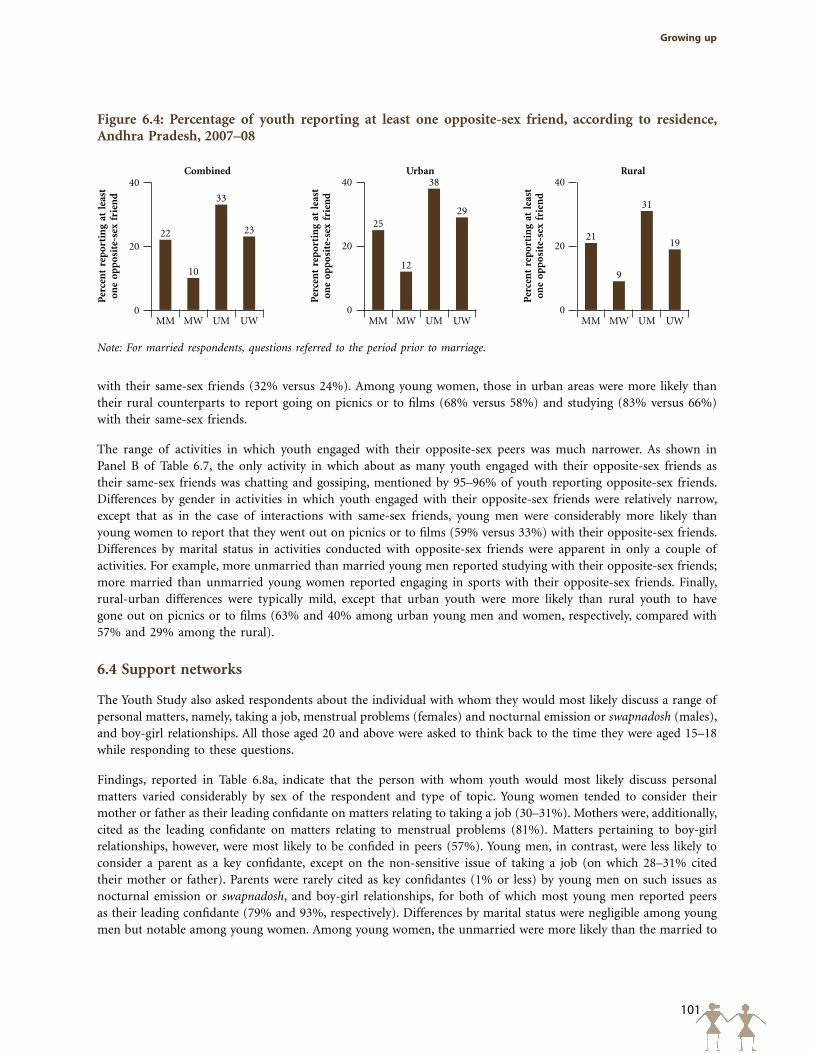
101
Growing up
Figure 6.4: Percentage of youth reporting at least one opposite-sex friend, according to residence, Andhra Pradesh, 2007–08
Note: For married respondents, questions referred to the period prior to marriage.
Per
cen
t re
por
tin
g at
lea
ston
e op
pos
ite-
sex
frie
nd
40
20
0
22
10
33
23
Combined
MM MW UM UWP
erce
nt
rep
orti
ng
at l
east
one
opp
osit
e-se
x fr
ien
d
40
20
0
25
12
38
29
Urban
MM MW UM UW
Per
cen
t re
por
tin
g at
lea
ston
e op
pos
ite-
sex
frie
nd
40
20
0
21
9
31
19
Rural
MM MW UM UW
with their same-sex friends (32% versus 24%). Among young women, those in urban areas were more likely than their rural counterparts to report going on picnics or to films (68% versus 58%) and studying (83% versus 66%) with their same-sex friends.
The range of activities in which youth engaged with their opposite-sex peers was much narrower. As shown in Panel B of Table 6.7, the only activity in which about as many youth engaged with their opposite-sex friends as their same-sex friends was chatting and gossiping, mentioned by 95–96% of youth reporting opposite-sex friends. Differences by gender in activities in which youth engaged with their opposite-sex friends were relatively narrow, except that as in the case of interactions with same-sex friends, young men were considerably more likely than young women to report that they went out on picnics or to films (59% versus 33%) with their opposite-sex friends. Differences by marital status in activities conducted with opposite-sex friends were apparent in only a couple of activities. For example, more unmarried than married young men reported studying with their opposite-sex friends; more married than unmarried young women reported engaging in sports with their opposite-sex friends. Finally, rural-urban differences were typically mild, except that urban youth were more likely than rural youth to have gone out on picnics or to films (63% and 40% among urban young men and women, respectively, compared with 57% and 29% among the rural).
6.4 Support networks
The Youth Study also asked respondents about the individual with whom they would most likely discuss a range of personal matters, namely, taking a job, menstrual problems (females) and nocturnal emission or swapnadosh (males), and boy-girl relationships. All those aged 20 and above were asked to think back to the time they were aged 15–18 while responding to these questions.
Findings, reported in Table 6.8a, indicate that the person with whom youth would most likely discuss personal matters varied considerably by sex of the respondent and type of topic. Young women tended to consider their mother or father as their leading confidante on matters relating to taking a job (30–31%). Mothers were, additionally, cited as the leading confidante on matters relating to menstrual problems (81%). Matters pertaining to boy-girl relationships, however, were most likely to be confided in peers (57%). Young men, in contrast, were less likely to consider a parent as a key confidante, except on the non-sensitive issue of taking a job (on which 28–31% cited their mother or father). Parents were rarely cited as key confidantes (1% or less) by young men on such issues as nocturnal emission or swapnadosh, and boy-girl relationships, for both of which most young men reported peers as their leading confidante (79% and 93%, respectively). Differences by marital status were negligible among young men but notable among young women. Among young women, the unmarried were more likely than the married to
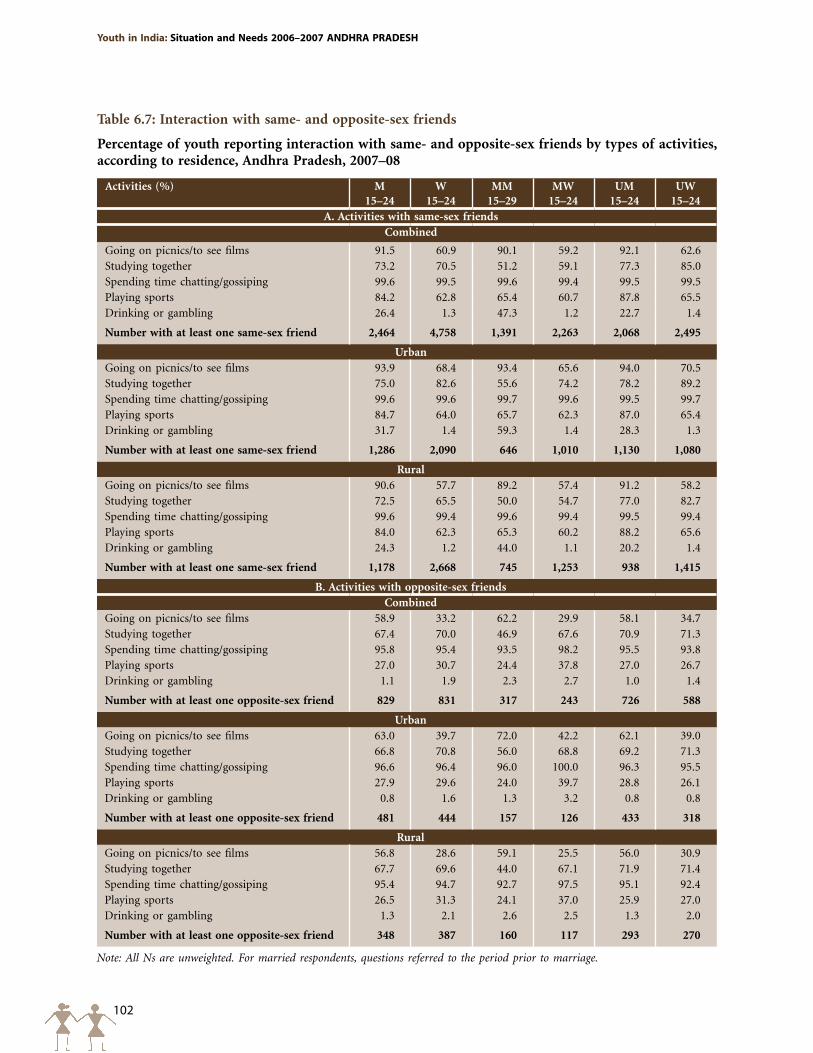
102
Youth in India: Situation and Needs 2006–2007 ANDHRA pRADESH
Table 6.7: Interaction with same- and opposite-sex friends
Percentage of youth reporting interaction with same- and opposite-sex friends by types of activities, according to residence, Andhra Pradesh, 2007–08
Activities (%) M 15–24
W 15–24
MM 15–29
MW 15–24
UM 15–24
UW 15–24
A. Activities with same-sex friendsCombined
Going on picnics/to see films 91.5 60.9 90.1 59.2 92.1 62.6Studying together 73.2 70.5 51.2 59.1 77.3 85.0Spending time chatting/gossiping 99.6 99.5 99.6 99.4 99.5 99.5Playing sports 84.2 62.8 65.4 60.7 87.8 65.5Drinking or gambling 26.4 1.3 47.3 1.2 22.7 1.4
Number with at least one same-sex friend 2,464 4,758 1,391 2,263 2,068 2,495
UrbanGoing on picnics/to see films 93.9 68.4 93.4 65.6 94.0 70.5Studying together 75.0 82.6 55.6 74.2 78.2 89.2Spending time chatting/gossiping 99.6 99.6 99.7 99.6 99.5 99.7Playing sports 84.7 64.0 65.7 62.3 87.0 65.4Drinking or gambling 31.7 1.4 59.3 1.4 28.3 1.3
Number with at least one same-sex friend 1,286 2,090 646 1,010 1,130 1,080
RuralGoing on picnics/to see films 90.6 57.7 89.2 57.4 91.2 58.2Studying together 72.5 65.5 50.0 54.7 77.0 82.7Spending time chatting/gossiping 99.6 99.4 99.6 99.4 99.5 99.4Playing sports 84.0 62.3 65.3 60.2 88.2 65.6Drinking or gambling 24.3 1.2 44.0 1.1 20.2 1.4
Number with at least one same-sex friend 1,178 2,668 745 1,253 938 1,415
B. Activities with opposite-sex friendsCombined
Going on picnics/to see films 58.9 33.2 62.2 29.9 58.1 34.7Studying together 67.4 70.0 46.9 67.6 70.9 71.3Spending time chatting/gossiping 95.8 95.4 93.5 98.2 95.5 93.8Playing sports 27.0 30.7 24.4 37.8 27.0 26.7Drinking or gambling 1.1 1.9 2.3 2.7 1.0 1.4
Number with at least one opposite-sex friend 829 831 317 243 726 588
UrbanGoing on picnics/to see films 63.0 39.7 72.0 42.2 62.1 39.0Studying together 66.8 70.8 56.0 68.8 69.2 71.3Spending time chatting/gossiping 96.6 96.4 96.0 100.0 96.3 95.5Playing sports 27.9 29.6 24.0 39.7 28.8 26.1Drinking or gambling 0.8 1.6 1.3 3.2 0.8 0.8
Number with at least one opposite-sex friend 481 444 157 126 433 318
RuralGoing on picnics/to see films 56.8 28.6 59.1 25.5 56.0 30.9Studying together 67.7 69.6 44.0 67.1 71.9 71.4Spending time chatting/gossiping 95.4 94.7 92.7 97.5 95.1 92.4Playing sports 26.5 31.3 24.1 37.0 25.9 27.0Drinking or gambling 1.3 2.1 2.6 2.5 1.3 2.0
Number with at least one opposite-sex friend 348 387 160 117 293 270
Note: All Ns are unweighted. For married respondents, questions referred to the period prior to marriage.

103
Growing up
Tabl
e 6.
8a: L
ead
ing
con
fid
ante
on
per
son
al m
atte
rs
Per
cen
t d
istr
ibu
tion
of
you
th b
y p
erso
n w
ith
wh
om t
hey
wer
e m
ost
like
ly t
o d
iscu
ss s
elec
ted
per
son
al m
atte
rs b
etw
een
age
s 15
an
d 1
8,
acco
rdin
g to
top
ic a
nd
res
iden
ce, A
nd
hra
Pra
des
h, 2
007–
08
Lead
ing
con
fid
ante
(%
)M
15–2
4W
15
–24
MM
15
–29
MW
15
–24
UM
15
–24
UW
15
–24
M15
–24
W
15–2
4M
M
15–2
9M
W
15–2
4U
M
15–2
4U
W
15–2
4M
15–2
4W
15
–24
MM
15
–29
MW
15
–24
UM
15
–24
UW
15
–24
Taki
ng
a jo
bM
enst
rual
pro
blem
s (W
)/an
xiet
y ab
out
noc
turn
al e
mis
sion
or
swap
nad
osh
(M)
Boy
-gir
l re
lati
onsh
ips
Com
bin
ed
Mot
her
28.3
31.3
26.5
28.4
28.2
35.1
0.6
80.8
0.6
73.9
0.5
89.7
0.2
7.6
0.1
6.5
0.1
9.2
Fath
er30
.529
.525
.823
.432
.137
.61.
00.
20.
90.
10.
80.
40.
21.
40.
41.
60.
21.
1
Sibl
ing
7.8
9.1
7.1
6.6
8.0
12.4
0.8
3.3
0.4
3.7
0.9
2.7
0.5
8.9
0.7
9.8
0.4
7.6
Frie
nd
23.4
6.6
26.0
5.4
22.9
8.3
78.6
2.4
76.7
2.1
79.5
2.9
93.2
57.0
93.1
48.2
93.4
68.5
Spou
se
NA
NA
0.2
26.4
NA
NA
NA
NA
0.1
12.3
NA
NA
NA
NA
0.0
16.1
NA
NA
HC
P/l
ocal
ly i
nfl
uen
tial
p
erso
n/t
each
er2.
40.
93.
10.
82.
11.
00.
70.
20.
90.
30.
90.
10.
00.
10.
00.
10.
00.
1
Oth
er4.
44.
55.
64.
94.
43.
90.
65.
00.
96.
40.
63.
10.
43.
10.
44.
20.
41.
6
Non
e3.
23.
15.
64.
12.
41.
717
.81.
119
.61.
116
.91.
15.
612
.75.
213
.45.
411
.9
Nu
mb
er o
f re
spon
den
ts2,
479
4,84
81,
405
2,33
02,
077
2,51
82,
479
4,84
81,
405
2,33
02,
077
2,51
82,
479
4,84
81,
405
2,33
02,
077
2,51
8
Urb
an
Mot
her
26.4
32.0
26.8
29.5
25.5
34.0
1.0
85.8
1.0
76.9
1.0
93.3
0.6
7.9
0.7
6.7
0.5
8.9
Fath
er36
.334
.229
.426
.037
.940
.91.
40.
21.
00.
01.
30.
30.
61.
20.
31.
10.
61.
3
Sibl
ing
8.1
10.8
7.8
8.6
8.6
12.7
0.7
3.1
0.7
4.0
0.6
2.5
0.9
8.7
1.6
8.6
1.0
8.8
Frie
nd
20.6
6.7
21.6
5.3
20.6
7.7
76.6
1.5
72.5
1.5
77.5
1.3
91.5
64.2
90.2
56.8
91.6
70.0
Spou
se
NA
N
A
0.0
24.3
NA
NA
NA
NA
0.0
10.1
NA
NA
NA
NA
0.0
12.4
NA
NA
HC
P/l
ocal
ly i
nfl
uen
tial
p
erso
n/t
each
er1.
70.
51.
60.
41.
70.
70.
30.
11.
00.
20.
30.
00.
00.
00.
00.
00.
00.
0
Oth
er
5.5
2.9
8.5
2.5
4.4
3.3
1.0
3.9
2.0
6.1
0.8
2.1
0.6
2.3
1.6
3.6
0.6
1.2
Non
e1.
42.
04.
23.
41.
30.
819
.00.
821
.91.
118
.60.
46.
010
.25.
610
.85.
79.
7
Nu
mb
er o
f re
spon
den
ts1,
289
2,12
664
81,
037
1,13
21,
089
1,28
92,
126
648
1,03
71,
132
1,08
91,
289
2,12
664
81,
037
1,13
21,
089
Ru
ral
Mot
her
29.1
31.0
26.4
28.1
29.4
35.7
0.3
78.7
0.4
73.1
0.3
87.8
0.0
7.5
0.0
6.4
0.0
9.3
Fath
er28
.227
.624
.922
.529
.535
.70.
80.
20.
80.
20.
60.
40.
11.
50.
51.
80.
11.
0
Sibl
ing
7.7
8.4
6.9
6.1
7.7
12.2
0.9
3.4
0.5
3.7
0.9
2.9
0.3
9.0
0.5
10.2
0.2
6.9
Frie
nd
24.4
6.6
27.2
5.4
23.9
8.6
79.3
2.8
77.8
2.3
80.4
3.8
93.9
54.0
93.8
45.7
94.1
67.6
Spou
se
NA
NA
0.
327
.0N
AN
AN
AN
A
0.2
13.0
NA
NA
NA
NA
0.0
17.2
NA
N
A
HC
P/l
ocal
ly i
nfl
uen
tial
p
erso
n/t
each
er2.
71.
13.
50.
92.
21.
20.
90.
20.
80.
21.
10.
10.
00.
20.
00.
20.
00.
2
Oth
er
4.0
5.1
4.8
5.7
4.4
4.3
0.4
5.4
0.5
6.5
0.5
3.7
0.3
3.4
0.2
4.4
0.3
1.9
Non
e3.
93.
56.
04.
32.
82.
217
.31.
219
.01.
116
.11.
45.
413
.85.
114
.25.
313
.2
Nu
mb
er o
f re
spon
den
ts1,
190
2,72
275
71,
293
945
1,42
91,
190
2,72
275
71,
293
945
1,42
91,
190
2,72
275
71,
293
945
1,42
9
Not
e: A
ll N
s ar
e un
wei
ghte
d. C
olum
n to
tals
may
not
equ
al 1
00%
due
to
mis
sing
cas
es o
r “d
on’t
know
” re
spon
ses.
Tho
se a
ged
20 o
r ab
ove
wer
e as
ked
to r
ecal
l th
e pe
riod
whe
n th
ey w
ere
aged
15–
18 y
ears
. H
CP
: H
ealt
h ca
re p
rovi
der.
NA
: N
ot a
pplic
able
.
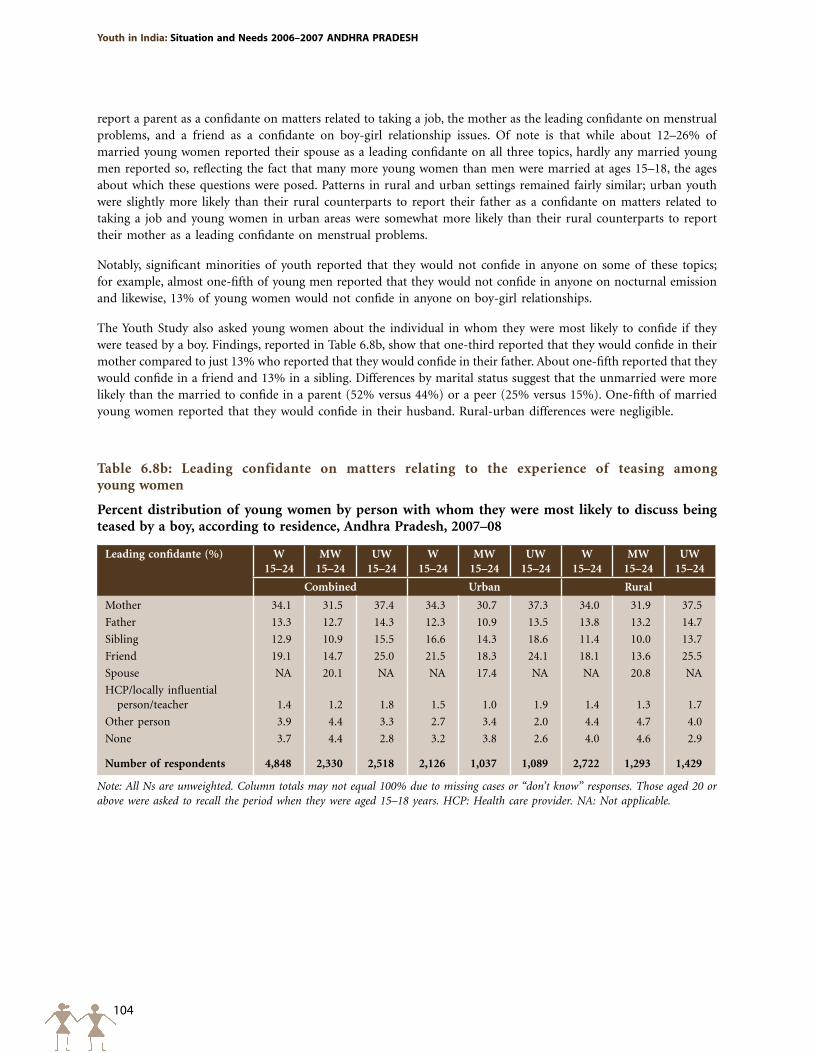
104
Youth in India: Situation and Needs 2006–2007 ANDHRA pRADESH
Table 6.8b: Leading confidante on matters relating to the experience of teasing among young women
Percent distribution of young women by person with whom they were most likely to discuss being teased by a boy, according to residence, Andhra Pradesh, 2007–08
Leading confidante (%) W 15–24
MW 15–24
UW 15–24
W 15–24
MW 15–24
UW 15–24
W 15–24
MW 15–24
UW 15–24
Combined Urban Rural
Mother 34.1 31.5 37.4 34.3 30.7 37.3 34.0 31.9 37.5
Father 13.3 12.7 14.3 12.3 10.9 13.5 13.8 13.2 14.7
Sibling 12.9 10.9 15.5 16.6 14.3 18.6 11.4 10.0 13.7
Friend 19.1 14.7 25.0 21.5 18.3 24.1 18.1 13.6 25.5
Spouse NA 20.1 NA NA 17.4 NA NA 20.8 NA
HCP/locally influential person/teacher 1.4 1.2 1.8 1.5 1.0 1.9 1.4 1.3 1.7
Other person 3.9 4.4 3.3 2.7 3.4 2.0 4.4 4.7 4.0
None 3.7 4.4 2.8 3.2 3.8 2.6 4.0 4.6 2.9
Number of respondents 4,848 2,330 2,518 2,126 1,037 1,089 2,722 1,293 1,429
Note: All Ns are unweighted. Column totals may not equal 100% due to missing cases or “don’t know” responses. Those aged 20 or above were asked to recall the period when they were aged 15–18 years. HCP: Health care provider. NA: Not applicable.
report a parent as a confidante on matters related to taking a job, the mother as the leading confidante on menstrual problems, and a friend as a confidante on boy-girl relationship issues. Of note is that while about 12–26% of married young women reported their spouse as a leading confidante on all three topics, hardly any married young men reported so, reflecting the fact that many more young women than men were married at ages 15–18, the ages about which these questions were posed. Patterns in rural and urban settings remained fairly similar; urban youth were slightly more likely than their rural counterparts to report their father as a confidante on matters related to taking a job and young women in urban areas were somewhat more likely than their rural counterparts to report their mother as a leading confidante on menstrual problems.
Notably, significant minorities of youth reported that they would not confide in anyone on some of these topics; for example, almost one-fifth of young men reported that they would not confide in anyone on nocturnal emission and likewise, 13% of young women would not confide in anyone on boy-girl relationships.
The Youth Study also asked young women about the individual in whom they were most likely to confide if they were teased by a boy. Findings, reported in Table 6.8b, show that one-third reported that they would confide in their mother compared to just 13% who reported that they would confide in their father. About one-fifth reported that they would confide in a friend and 13% in a sibling. Differences by marital status suggest that the unmarried were more likely than the married to confide in a parent (52% versus 44%) or a peer (25% versus 15%). One-fifth of married young women reported that they would confide in their husband. Rural-urban differences were negligible.
105
Growing up
6.5 Summary
Youth Study findings reveal a mixed scenario regarding the nature of socialisation experienced by young people. While responses from young men indicate that large proportions of households did discriminate between their sons and daughters in terms of freedom of movement and expectations regarding housework, responses from young women suggest the reverse. While three-quarters of young men reported that they had more freedom to go out than their sisters or female cousins did, many fewer young women, just two-fifths, agreed that they had less freedom to go out than their brothers or male cousins did. Likewise, two-thirds of young men reported that they were expected to do less housework than their sisters or female cousins, and only two-fifths of young women agreed that they were expected to do more housework than their brothers or male cousins. At the same time, far more consistently observed were gender differences in perceptions of parental control: young women were more likely than young men to perceive that their parents would disapprove of social activities in which youth tend to participate that involved members of the opposite sex.
Findings regarding communication with parents on issues relevant to youth—such as school performance, friendships, being teased or bullied, physical maturation, romantic relationships and reproductive processes—reiterate those from other studies, showing that such communication is far from universal. Indeed, sensitive topics—such as romantic relationships, reproduction and contraception among all youth—were rarely discussed with either parent.
That parent-child communication was restricted was also evident from responses to questions probing the most likely confidante on a range of topics from taking a job to boy-girl relationships. While parents were mentioned as leading confidantes on topics such as taking a job, they were rarely cited as leading confidantes on more sensitive matters. Moreover, while young women identified their mother as the most likely confidante on such matters as menstrual problems and experience of teasing, young men rarely identified a parent as a leading confidante on matters relating to nocturnal emission or swapnadosh. Indeed, neither young men nor women identified a parent as a leading confidante on boy-girl matters.
Young people’s family lives were marked by violence, both experienced and witnessed. Over one in three youth had observed their father beating their mother. Many young people reported experiencing a beating by a parent during adolescence; almost half of young men and almost one-quarter of young women reported such experiences.
In contrast, growing up was associated with close peer networks. Almost all youth reported having some same-sex friends. Young men, however, reported larger networks of friends than did young women. Opposite-sex peer networks were less common but nonetheless reported by nearly one-third of young men and one-seventh of young women. Interactions with friends tended to be restricted to activities such as chatting and studying, although young men did report engaging in activities such as going out on picnics or to films and playing games and outdoor sports. Indeed, findings suggest that youth derived an important measure of support from their peer networks on personal matters: friends were by far the leading confidante on boy-girl relationships for both young men and women, and on nocturnal emission for young men.
106
Youth in India: Situation and Needs 2006–2007 ANDHRA pRADESH
Evidence on agency among youth, although sparse, suggests that in traditional settings such as India, young women and even some young men have limited agency in terms of decision-making on matters affecting their own lives, freedom of movement and access to resources. Gender role attitudes, similarly, tend to be traditional, assigning greater value to young men than young women (Alexander et al., 2006a; 2006b; Ram et al., 2006; Santhya, Jejeebhoy and Ghosh, 2008; Sebastian, Grant and Mensch, 2005). This chapter discusses Youth Study findings on agency and gender role attitudes.
7.1 Decision-making
In order to assess young people’s involvement in decision-making, the Youth Study asked all respondents about their involvement in decisions related to three specific matters: choice of friends, spending one’s own money and buying clothes for oneself. If youth reported that they were involved in decision-making on any issue, they were asked whether they made the decision entirely on their own or jointly with other family members.
Findings, presented in Table 7.1 and Figure 7.1, reveal that irrespective of sex, youth were overwhelmingly likely to choose their friends on their own (92%). Differences by marital status and rural-urban residence were also narrow.
Fewer youth were involved in making decisions on spending their own money than on choice of friends, and this was particularly evident among young women. For example, while 63% of young men reported that they made decisions on their own about spending money, only 48% of young women so reported. Findings further suggest that a significant minority of young men (8%) and women (15%) reported that it was other family members who made decisions on spending money, without their involvement. As shown in Figure 7.1, marital status differences were mild among young women, but notable among young men among whom the married were more likely than the unmarried (77% versus 61%) to make this decision independently. Rural-urban differences were notable, particularly among young women; urban youth were more likely than rural youth to make independent decisions related to spending their own money.
With regard to decisions about the purchase of clothes for themselves, while 74% of young men decided on their own about purchasing clothes, only 34% of young women did so. One in seven young women reported that they did not have any say in decisions to buy clothes for themselves, and that it was other family members who made this decision for them, compared to 6% of young men.
Differences by marital status were observed among young men but not among young women; married young men were considerably more likely than unmarried young men to make decisions related to buying clothes on their own (86% versus 72%). Finally, rural-urban differences were muted among young men. Among young women, however, more urban than rural women made independent decisions relating to the purchase of clothes (41% versus 32%).
In order to assess the extent to which youth had independent decision-making authority on all three matters, Table 7.2 presents the percentage of youth who reported that they independently made decisions on choice of
Chapter 7
Agency and gender role attitudes
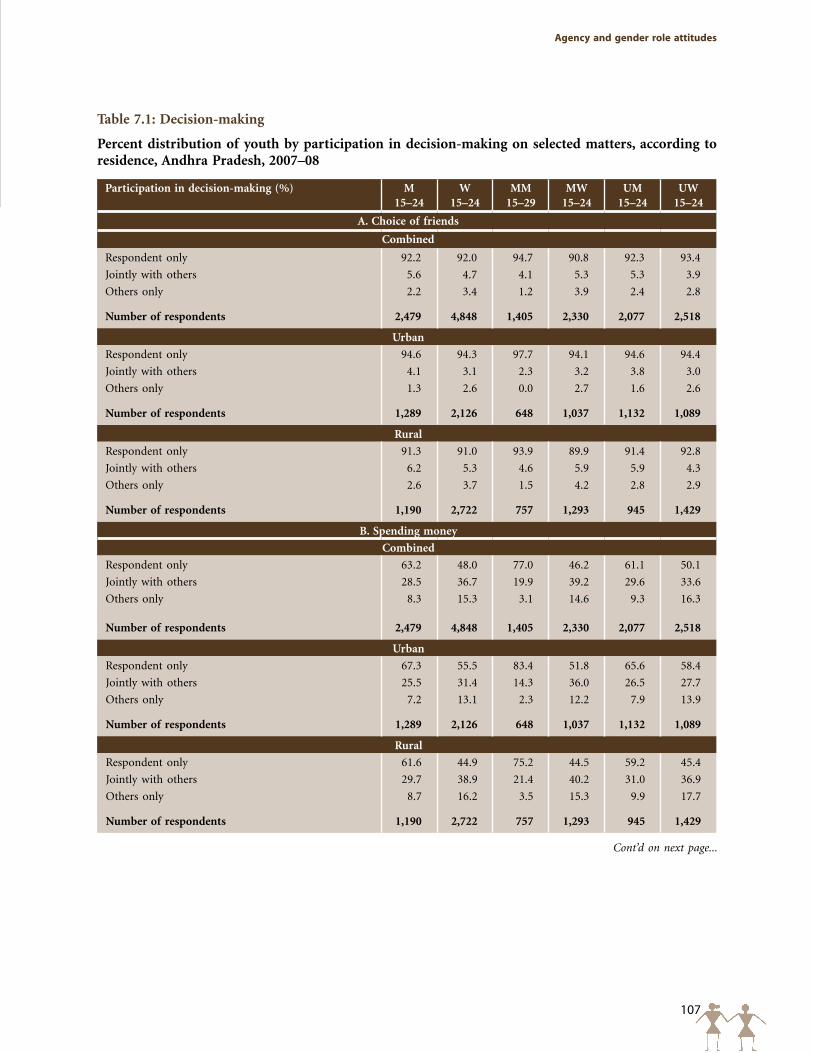
107
Agency and gender role attitudes
Table 7.1: Decision-making
Percent distribution of youth by participation in decision-making on selected matters, according to residence, Andhra Pradesh, 2007–08
Participation in decision-making (%) M15–24
W15–24
MM15–29
MW15–24
UM15–24
UW15–24
A. Choice of friends
Combined
Respondent only 92.2 92.0 94.7 90.8 92.3 93.4
Jointly with others 5.6 4.7 4.1 5.3 5.3 3.9
Others only 2.2 3.4 1.2 3.9 2.4 2.8
Number of respondents 2,479 4,848 1,405 2,330 2,077 2,518
Urban
Respondent only 94.6 94.3 97.7 94.1 94.6 94.4
Jointly with others 4.1 3.1 2.3 3.2 3.8 3.0
Others only 1.3 2.6 0.0 2.7 1.6 2.6
Number of respondents 1,289 2,126 648 1,037 1,132 1,089
Rural
Respondent only 91.3 91.0 93.9 89.9 91.4 92.8
Jointly with others 6.2 5.3 4.6 5.9 5.9 4.3
Others only 2.6 3.7 1.5 4.2 2.8 2.9
Number of respondents 1,190 2,722 757 1,293 945 1,429
B. Spending money
Combined
Respondent only 63.2 48.0 77.0 46.2 61.1 50.1
Jointly with others 28.5 36.7 19.9 39.2 29.6 33.6
Others only 8.3 15.3 3.1 14.6 9.3 16.3
Number of respondents 2,479 4,848 1,405 2,330 2,077 2,518
Urban
Respondent only 67.3 55.5 83.4 51.8 65.6 58.4
Jointly with others 25.5 31.4 14.3 36.0 26.5 27.7
Others only 7.2 13.1 2.3 12.2 7.9 13.9
Number of respondents 1,289 2,126 648 1,037 1,132 1,089
Rural
Respondent only 61.6 44.9 75.2 44.5 59.2 45.4
Jointly with others 29.7 38.9 21.4 40.2 31.0 36.9
Others only 8.7 16.2 3.5 15.3 9.9 17.7
Number of respondents 1,190 2,722 757 1,293 945 1,429
Cont’d on next page...
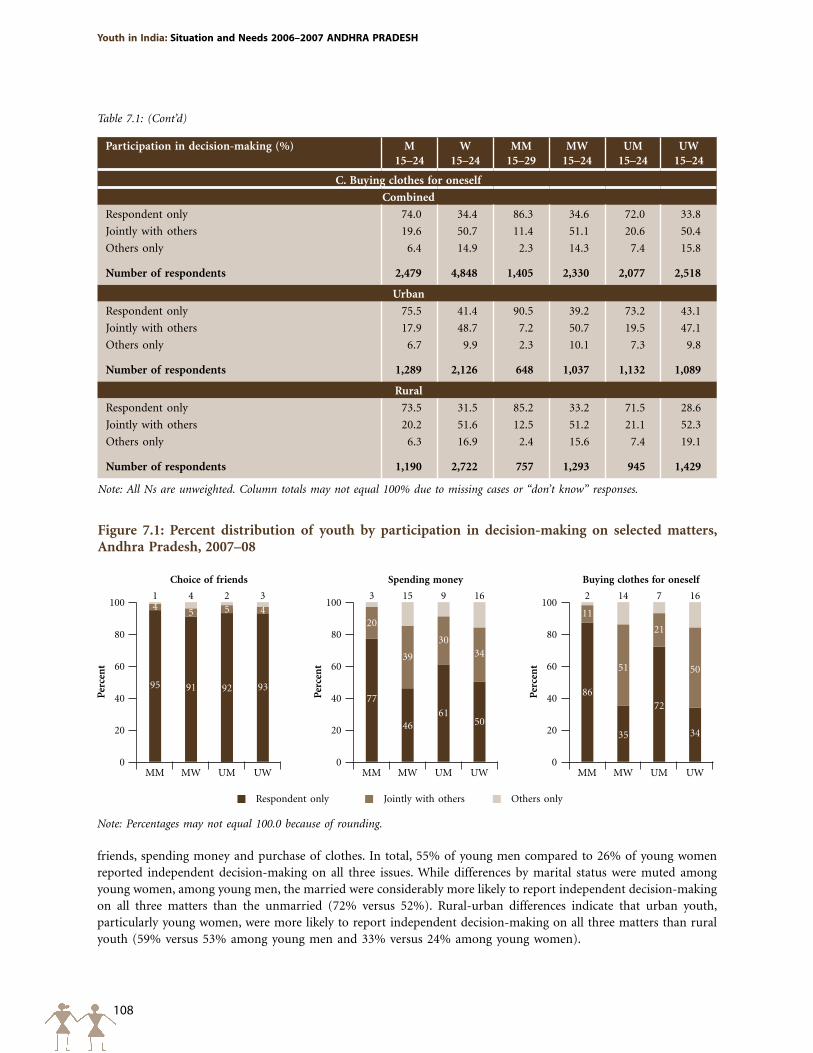
108
Youth in India: Situation and Needs 2006–2007 ANDHRA pRADESH
Participation in decision-making (%) M15–24
W15–24
MM15–29
MW15–24
UM15–24
UW15–24
C. Buying clothes for oneself
Combined
Respondent only 74.0 34.4 86.3 34.6 72.0 33.8
Jointly with others 19.6 50.7 11.4 51.1 20.6 50.4
Others only 6.4 14.9 2.3 14.3 7.4 15.8
Number of respondents 2,479 4,848 1,405 2,330 2,077 2,518
Urban
Respondent only 75.5 41.4 90.5 39.2 73.2 43.1
Jointly with others 17.9 48.7 7.2 50.7 19.5 47.1
Others only 6.7 9.9 2.3 10.1 7.3 9.8
Number of respondents 1,289 2,126 648 1,037 1,132 1,089
Rural
Respondent only 73.5 31.5 85.2 33.2 71.5 28.6
Jointly with others 20.2 51.6 12.5 51.2 21.1 52.3
Others only 6.3 16.9 2.4 15.6 7.4 19.1
Number of respondents 1,190 2,722 757 1,293 945 1,429
Note: All Ns are unweighted. Column totals may not equal 100% due to missing cases or “don’t know” responses.
Table 7.1: (Cont’d)
friends, spending money and purchase of clothes. In total, 55% of young men compared to 26% of young women reported independent decision-making on all three issues. While differences by marital status were muted among young women, among young men, the married were considerably more likely to report independent decision-making on all three matters than the unmarried (72% versus 52%). Rural-urban differences indicate that urban youth, particularly young women, were more likely to report independent decision-making on all three matters than rural youth (59% versus 53% among young men and 33% versus 24% among young women).
Figure 7.1: Percent distribution of youth by participation in decision-making on selected matters, Andhra Pradesh, 2007–08
Per
cen
t
Per
cen
t
Per
cen
t
100
80
60
40
20
0
100
80
60
40
20
0
100
80
60
40
20
0
9577
8691
4635
93
5034
92
6172
1 3 24 15 142 9 73 16 16
Choice of friends Spending money Buying clothes for oneself
MM MM MMMW MW MWUM UM UMUW UW UW
Respondent only Jointly with others Others only
3951
3021
34
50
20
Note: Percentages may not equal 100.0 because of rounding.
45 5 4 11
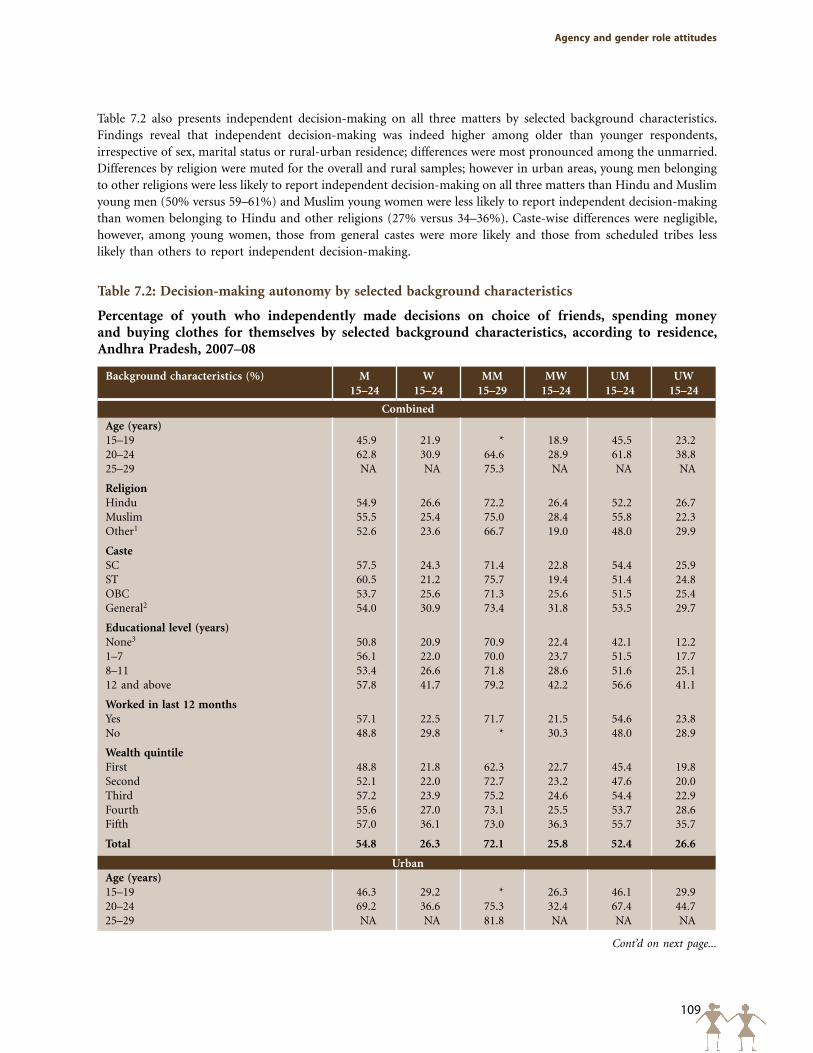
109
Agency and gender role attitudes
Table 7.2: Decision-making autonomy by selected background characteristics
Percentage of youth who independently made decisions on choice of friends, spending money and buying clothes for themselves by selected background characteristics, according to residence, Andhra Pradesh, 2007–08
Background characteristics (%) M 15–24
W 15–24
MM 15–29
MW 15–24
UM 15–24
UW 15–24
Combined
Age (years)15–19 45.9 21.9 * 18.9 45.5 23.220–24 62.8 30.9 64.6 28.9 61.8 38.825–29 NA NA 75.3 NA NA NA
Religion Hindu 54.9 26.6 72.2 26.4 52.2 26.7Muslim 55.5 25.4 75.0 28.4 55.8 22.3Other1 52.6 23.6 66.7 19.0 48.0 29.9
CasteSC 57.5 24.3 71.4 22.8 54.4 25.9ST 60.5 21.2 75.7 19.4 51.4 24.8OBC 53.7 25.6 71.3 25.6 51.5 25.4General2 54.0 30.9 73.4 31.8 53.5 29.7
Educational level (years)None3 50.8 20.9 70.9 22.4 42.1 12.21–7 56.1 22.0 70.0 23.7 51.5 17.78–11 53.4 26.6 71.8 28.6 51.6 25.112 and above 57.8 41.7 79.2 42.2 56.6 41.1
Worked in last 12 monthsYes 57.1 22.5 71.7 21.5 54.6 23.8No 48.8 29.8 * 30.3 48.0 28.9
Wealth quintileFirst 48.8 21.8 62.3 22.7 45.4 19.8Second 52.1 22.0 72.7 23.2 47.6 20.0Third 57.2 23.9 75.2 24.6 54.4 22.9Fourth 55.6 27.0 73.1 25.5 53.7 28.6Fifth 57.0 36.1 73.0 36.3 55.7 35.7
Total 54.8 26.3 72.1 25.8 52.4 26.6
UrbanAge (years)15–19 46.3 29.2 * 26.3 46.1 29.920–24 69.2 36.6 75.3 32.4 67.4 44.725–29 NA NA 81.8 NA NA NA
Cont’d on next page...
Table 7.2 also presents independent decision-making on all three matters by selected background characteristics. Findings reveal that independent decision-making was indeed higher among older than younger respondents, irrespective of sex, marital status or rural-urban residence; differences were most pronounced among the unmarried. Differences by religion were muted for the overall and rural samples; however in urban areas, young men belonging to other religions were less likely to report independent decision-making on all three matters than Hindu and Muslim young men (50% versus 59–61%) and Muslim young women were less likely to report independent decision-making than women belonging to Hindu and other religions (27% versus 34–36%). Caste-wise differences were negligible, however, among young women, those from general castes were more likely and those from scheduled tribes less likely than others to report independent decision-making.
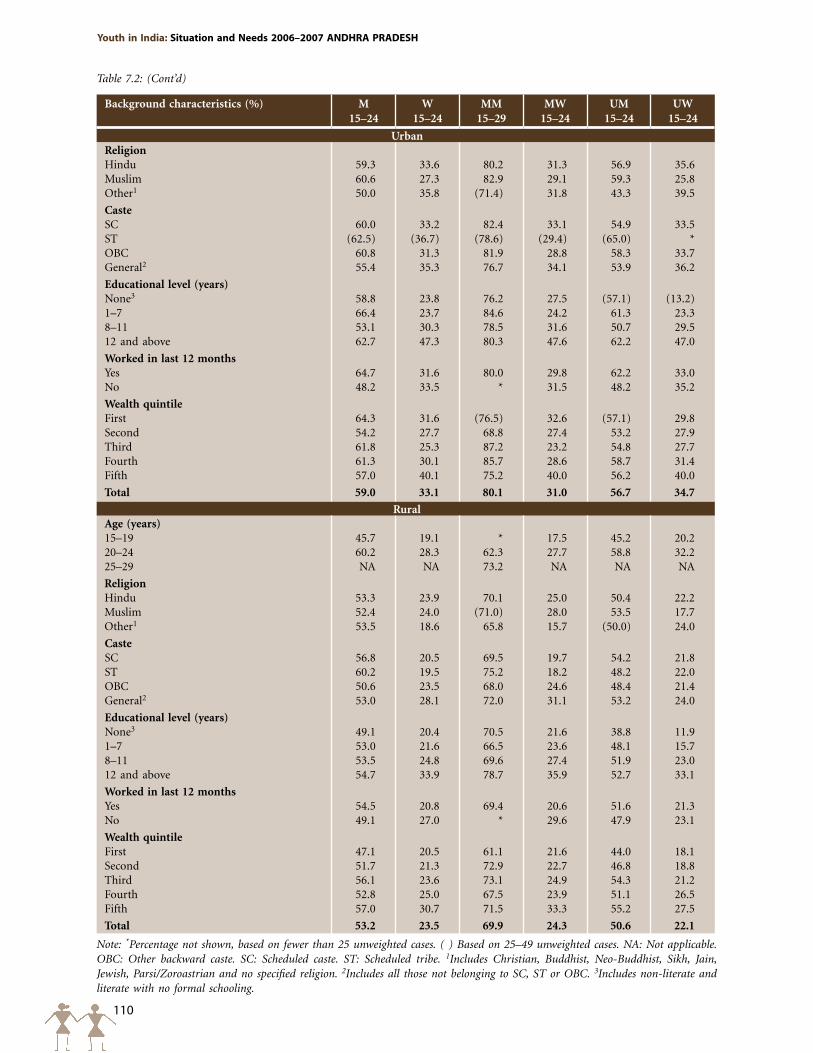
110
Youth in India: Situation and Needs 2006–2007 ANDHRA pRADESH
Background characteristics (%) M 15–24
W 15–24
MM 15–29
MW 15–24
UM 15–24
UW 15–24
UrbanReligion Hindu 59.3 33.6 80.2 31.3 56.9 35.6Muslim 60.6 27.3 82.9 29.1 59.3 25.8Other1 50.0 35.8 (71.4) 31.8 43.3 39.5
CasteSC 60.0 33.2 82.4 33.1 54.9 33.5ST (62.5) (36.7) (78.6) (29.4) (65.0) *OBC 60.8 31.3 81.9 28.8 58.3 33.7General2 55.4 35.3 76.7 34.1 53.9 36.2
Educational level (years)None3 58.8 23.8 76.2 27.5 (57.1) (13.2)1–7 66.4 23.7 84.6 24.2 61.3 23.38–11 53.1 30.3 78.5 31.6 50.7 29.512 and above 62.7 47.3 80.3 47.6 62.2 47.0
Worked in last 12 monthsYes 64.7 31.6 80.0 29.8 62.2 33.0No 48.2 33.5 * 31.5 48.2 35.2
Wealth quintileFirst 64.3 31.6 (76.5) 32.6 (57.1) 29.8Second 54.2 27.7 68.8 27.4 53.2 27.9Third 61.8 25.3 87.2 23.2 54.8 27.7Fourth 61.3 30.1 85.7 28.6 58.7 31.4Fifth 57.0 40.1 75.2 40.0 56.2 40.0
Total 59.0 33.1 80.1 31.0 56.7 34.7
RuralAge (years)15–19 45.7 19.1 * 17.5 45.2 20.220–24 60.2 28.3 62.3 27.7 58.8 32.225–29 NA NA 73.2 NA NA NA
Religion Hindu 53.3 23.9 70.1 25.0 50.4 22.2Muslim 52.4 24.0 (71.0) 28.0 53.5 17.7Other1 53.5 18.6 65.8 15.7 (50.0) 24.0
CasteSC 56.8 20.5 69.5 19.7 54.2 21.8ST 60.2 19.5 75.2 18.2 48.2 22.0OBC 50.6 23.5 68.0 24.6 48.4 21.4General2 53.0 28.1 72.0 31.1 53.2 24.0
Educational level (years)None3 49.1 20.4 70.5 21.6 38.8 11.91–7 53.0 21.6 66.5 23.6 48.1 15.78–11 53.5 24.8 69.6 27.4 51.9 23.012 and above 54.7 33.9 78.7 35.9 52.7 33.1
Worked in last 12 monthsYes 54.5 20.8 69.4 20.6 51.6 21.3No 49.1 27.0 * 29.6 47.9 23.1
Wealth quintileFirst 47.1 20.5 61.1 21.6 44.0 18.1Second 51.7 21.3 72.9 22.7 46.8 18.8Third 56.1 23.6 73.1 24.9 54.3 21.2Fourth 52.8 25.0 67.5 23.9 51.1 26.5Fifth 57.0 30.7 71.5 33.3 55.2 27.5
Total 53.2 23.5 69.9 24.3 50.6 22.1
Note: *Percentage not shown, based on fewer than 25 unweighted cases. ( ) Based on 25–49 unweighted cases. NA: Not applicable. OBC: Other backward caste. SC: Scheduled caste. ST: Scheduled tribe. 1Includes Christian, Buddhist, Neo-Buddhist, Sikh, Jain, Jewish, Parsi/Zoroastrian and no specified religion. 2Includes all those not belonging to SC, ST or OBC. 3Includes non-literate and literate with no formal schooling.
Table 7.2: (Cont’d)
111
Agency and gender role attitudes
Independent decision-making increased consistently with level of education among young women but not so among young men, and this pattern was observed irrespective of marital status and rural-urban residence. Among young women, for example, 42% of those with 12 or more years of education decided independently on all three issues, compared with just 21% of non-literate young women or those without any formal education. The differences were much wider in urban than in rural settings (47% and 24% in urban settings compared to 34% and 20% in rural settings). Among young men, however, differences in percentages who decided independently on all three issues between those with no formal education and those with 12 or more years of education were typically narrow; even so, when the married and unmarried were considered separately, those with 12 or more years of education were more likely to have decided independently on all three issues than those without any formal education. Interestingly, even the least educated young men were more likely than the most educated young women to report independent decision-making on all three matters.
Associations between economic activity status and independent decision-making differed among young men and women. Among young men, those who had worked in the last 12 months tended to be more likely than others to make decisions independently; however, among young women, a reverse pattern was apparent. The pattern remained by and large similar among the married and the unmarried.
Associations between the economic status of households and independent decision-making were inconsistent among young men. Among young women, however, those belonging to the wealthiest (fifth) quintile were more likely than those belonging to other quintiles to have made independent decisions on all three matters. As in the case of education, even young men from households in the poorest (first) quintile were typically more likely to report independent decision-making than young women in the wealthiest quintile.
7.2 Freedom of movement
Freedom of movement was assessed only for all young women and unmarried young men because married young men generally have unrestricted mobility. Mobility was measured by a number of questions relating to whether the respondent was permitted to visit places within and outside the village (rural) or neighbourhood (urban) unescorted, only if accompanied by someone else, or was not permitted to visit the place at all. Places within the village or neighbourhood included a shop/market, the home of a friend/relative and a community programme. Places outside the village or neighbourhood included the home of a relative or friend, movie theatre, video parlour or other place of entertainment and a community programme. Finally, all respondents were asked if they could go to a health facility unescorted if required. Table 7.3 and Figure 7.2 report findings relating to mobility.
Findings confirm that freedom of movement even within the village or neighbourhood was not universal, although the mobility of young women, both married and unmarried, was more restricted than that of unmarried young men. For example, findings suggest that 80% of young women could go unescorted to a shop or market within the village or neighbourhood compared with 89% of unmarried young men. Freedom to attend programmes within the village or neighbourhood was more restricted, particularly among young women. Only 9% of young women compared with 61% of unmarried young men were allowed to attend community programmes within the village or neighbourhood unescorted. While three-quarters of young women were allowed to attend such programmes, if accompanied, as many as one in seven were not allowed to attend such programmes under any circumstances.
Freedom to visit places outside the village or neighbourhood unescorted was even more restricted than mobility within the village. Of the three sites, freedom to visit a place of entertainment or to attend a programme was more curtailed than freedom to visit a friend or relative residing outside the village or neighbourhood. Young women’s mobility was particularly limited: for example, just 22% were permitted to visit a friend or relative outside the village unescorted and just 3–4% were permitted to visit a place of entertainment or to attend a programme conducted outside the village or neighbourhood unescorted. While 85% and 70% of young women were allowed to visit a place of entertainment or attend a programme, respectively, if accompanied, as many as 27% were not allowed to
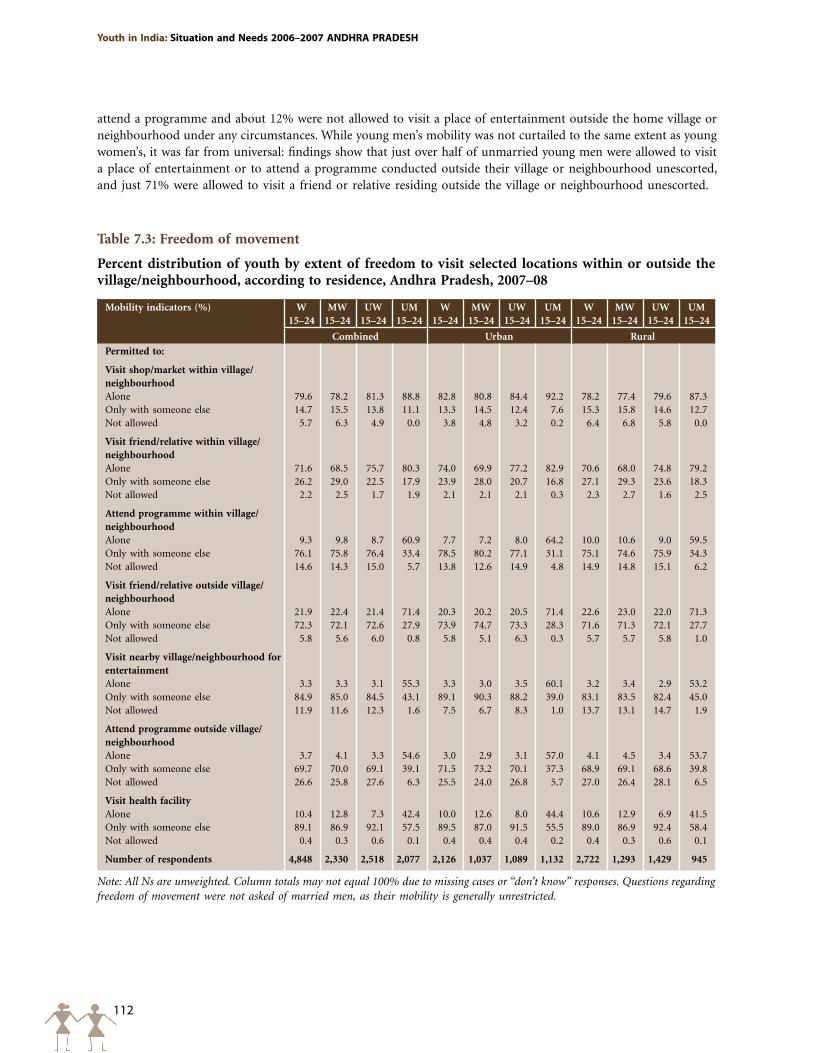
112
Youth in India: Situation and Needs 2006–2007 ANDHRA pRADESH
attend a programme and about 12% were not allowed to visit a place of entertainment outside the home village or neighbourhood under any circumstances. While young men’s mobility was not curtailed to the same extent as young women’s, it was far from universal: findings show that just over half of unmarried young men were allowed to visit a place of entertainment or to attend a programme conducted outside their village or neighbourhood unescorted, and just 71% were allowed to visit a friend or relative residing outside the village or neighbourhood unescorted.
Table 7.3: Freedom of movement
Percent distribution of youth by extent of freedom to visit selected locations within or outside the village/neighbourhood, according to residence, Andhra Pradesh, 2007–08
Mobility indicators (%) W15–24
MW 15–24
UW 15–24
UM 15–24
W15–24
MW 15–24
UW 15–24
UM 15–24
W15–24
MW 15–24
UW 15–24
UM 15–24
Combined Urban Rural
Permitted to:
Visit shop/market within village/neighbourhoodAlone 79.6 78.2 81.3 88.8 82.8 80.8 84.4 92.2 78.2 77.4 79.6 87.3Only with someone else 14.7 15.5 13.8 11.1 13.3 14.5 12.4 7.6 15.3 15.8 14.6 12.7Not allowed 5.7 6.3 4.9 0.0 3.8 4.8 3.2 0.2 6.4 6.8 5.8 0.0
Visit friend/relative within village/neighbourhoodAlone 71.6 68.5 75.7 80.3 74.0 69.9 77.2 82.9 70.6 68.0 74.8 79.2Only with someone else 26.2 29.0 22.5 17.9 23.9 28.0 20.7 16.8 27.1 29.3 23.6 18.3Not allowed 2.2 2.5 1.7 1.9 2.1 2.1 2.1 0.3 2.3 2.7 1.6 2.5
Attend programme within village/neighbourhoodAlone 9.3 9.8 8.7 60.9 7.7 7.2 8.0 64.2 10.0 10.6 9.0 59.5Only with someone else 76.1 75.8 76.4 33.4 78.5 80.2 77.1 31.1 75.1 74.6 75.9 34.3Not allowed 14.6 14.3 15.0 5.7 13.8 12.6 14.9 4.8 14.9 14.8 15.1 6.2
Visit friend/relative outside village/neighbourhoodAlone 21.9 22.4 21.4 71.4 20.3 20.2 20.5 71.4 22.6 23.0 22.0 71.3Only with someone else 72.3 72.1 72.6 27.9 73.9 74.7 73.3 28.3 71.6 71.3 72.1 27.7Not allowed 5.8 5.6 6.0 0.8 5.8 5.1 6.3 0.3 5.7 5.7 5.8 1.0
Visit nearby village/neighbourhood for entertainmentAlone 3.3 3.3 3.1 55.3 3.3 3.0 3.5 60.1 3.2 3.4 2.9 53.2Only with someone else 84.9 85.0 84.5 43.1 89.1 90.3 88.2 39.0 83.1 83.5 82.4 45.0Not allowed 11.9 11.6 12.3 1.6 7.5 6.7 8.3 1.0 13.7 13.1 14.7 1.9
Attend programme outside village/neighbourhoodAlone 3.7 4.1 3.3 54.6 3.0 2.9 3.1 57.0 4.1 4.5 3.4 53.7Only with someone else 69.7 70.0 69.1 39.1 71.5 73.2 70.1 37.3 68.9 69.1 68.6 39.8Not allowed 26.6 25.8 27.6 6.3 25.5 24.0 26.8 5.7 27.0 26.4 28.1 6.5
Visit health facilityAlone 10.4 12.8 7.3 42.4 10.0 12.6 8.0 44.4 10.6 12.9 6.9 41.5Only with someone else 89.1 86.9 92.1 57.5 89.5 87.0 91.5 55.5 89.0 86.9 92.4 58.4Not allowed 0.4 0.3 0.6 0.1 0.4 0.4 0.4 0.2 0.4 0.3 0.6 0.1
Number of respondents 4,848 2,330 2,518 2,077 2,126 1,037 1,089 1,132 2,722 1,293 1,429 945
Note: All Ns are unweighted. Column totals may not equal 100% due to missing cases or “don’t know” responses. Questions regarding freedom of movement were not asked of married men, as their mobility is generally unrestricted.
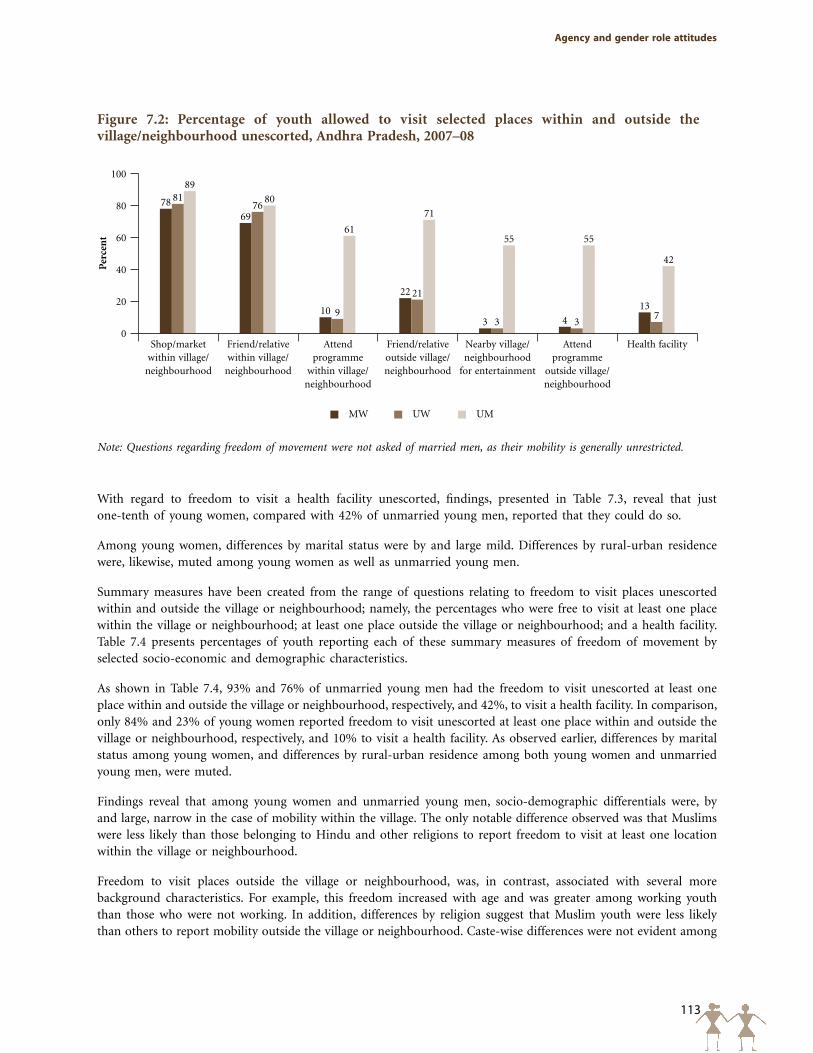
113
Agency and gender role attitudes
Figure 7.2: Percentage of youth allowed to visit selected places within and outside the village/neighbourhood unescorted, Andhra Pradesh, 2007–08
Note: Questions regarding freedom of movement were not asked of married men, as their mobility is generally unrestricted.
MW UW UM
Per
cen
t
100
80
60
40
20
0
78
69
10
22
3 4
13
8176
9
21
3 37
89
80
61
71
55 55
42
Shop/marketwithin village/
neighbourhood
Friend/relativewithin village/
neighbourhood
Attend programme
within village/neighbourhood
Friend/relativeoutside village/neighbourhood
Nearby village/ neighbourhood
for entertainment
Attend programme
outside village/neighbourhood
Health facility
With regard to freedom to visit a health facility unescorted, findings, presented in Table 7.3, reveal that just one-tenth of young women, compared with 42% of unmarried young men, reported that they could do so.
Among young women, differences by marital status were by and large mild. Differences by rural-urban residence were, likewise, muted among young women as well as unmarried young men.
Summary measures have been created from the range of questions relating to freedom to visit places unescorted within and outside the village or neighbourhood; namely, the percentages who were free to visit at least one place within the village or neighbourhood; at least one place outside the village or neighbourhood; and a health facility. Table 7.4 presents percentages of youth reporting each of these summary measures of freedom of movement by selected socio-economic and demographic characteristics.
As shown in Table 7.4, 93% and 76% of unmarried young men had the freedom to visit unescorted at least one place within and outside the village or neighbourhood, respectively, and 42%, to visit a health facility. In comparison, only 84% and 23% of young women reported freedom to visit unescorted at least one place within and outside the village or neighbourhood, respectively, and 10% to visit a health facility. As observed earlier, differences by marital status among young women, and differences by rural-urban residence among both young women and unmarried young men, were muted.
Findings reveal that among young women and unmarried young men, socio-demographic differentials were, by and large, narrow in the case of mobility within the village. The only notable difference observed was that Muslims were less likely than those belonging to Hindu and other religions to report freedom to visit at least one location within the village or neighbourhood.
Freedom to visit places outside the village or neighbourhood, was, in contrast, associated with several more background characteristics. For example, this freedom increased with age and was greater among working youth than those who were not working. In addition, differences by religion suggest that Muslim youth were less likely than others to report mobility outside the village or neighbourhood. Caste-wise differences were not evident among
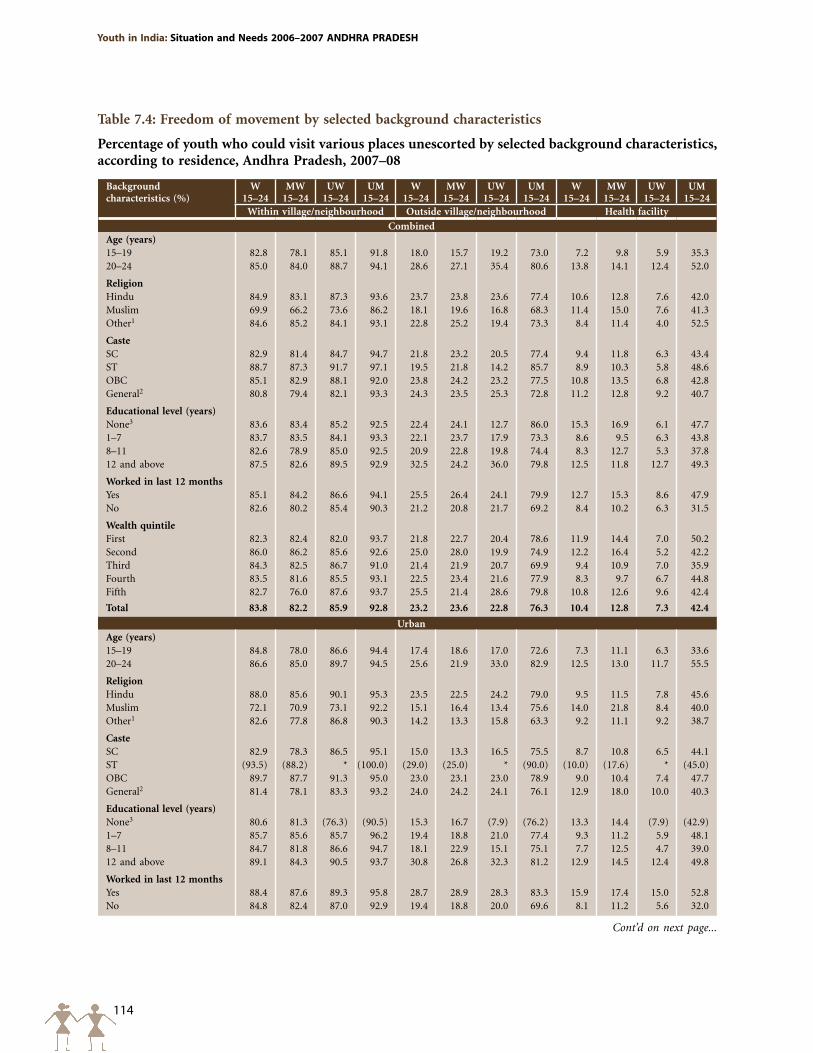
114
Youth in India: Situation and Needs 2006–2007 ANDHRA pRADESH
Table 7.4: Freedom of movement by selected background characteristics
Percentage of youth who could visit various places unescorted by selected background characteristics, according to residence, Andhra Pradesh, 2007–08
Background characteristics (%)
W15–24
MW15–24
UW15–24
UM15–24
W15–24
MW15–24
UW15–24
UM15–24
W15–24
MW15–24
UW15–24
UM15–24
Within village/neighbourhood Outside village/neighbourhood Health facility
CombinedAge (years)15–19 82.8 78.1 85.1 91.8 18.0 15.7 19.2 73.0 7.2 9.8 5.9 35.320–24 85.0 84.0 88.7 94.1 28.6 27.1 35.4 80.6 13.8 14.1 12.4 52.0
Religion Hindu 84.9 83.1 87.3 93.6 23.7 23.8 23.6 77.4 10.6 12.8 7.6 42.0Muslim 69.9 66.2 73.6 86.2 18.1 19.6 16.8 68.3 11.4 15.0 7.6 41.3Other1 84.6 85.2 84.1 93.1 22.8 25.2 19.4 73.3 8.4 11.4 4.0 52.5
CasteSC 82.9 81.4 84.7 94.7 21.8 23.2 20.5 77.4 9.4 11.8 6.3 43.4ST 88.7 87.3 91.7 97.1 19.5 21.8 14.2 85.7 8.9 10.3 5.8 48.6OBC 85.1 82.9 88.1 92.0 23.8 24.2 23.2 77.5 10.8 13.5 6.8 42.8General2 80.8 79.4 82.1 93.3 24.3 23.5 25.3 72.8 11.2 12.8 9.2 40.7
Educational level (years)None3 83.6 83.4 85.2 92.5 22.4 24.1 12.7 86.0 15.3 16.9 6.1 47.71–7 83.7 83.5 84.1 93.3 22.1 23.7 17.9 73.3 8.6 9.5 6.3 43.88–11 82.6 78.9 85.0 92.5 20.9 22.8 19.8 74.4 8.3 12.7 5.3 37.812 and above 87.5 82.6 89.5 92.9 32.5 24.2 36.0 79.8 12.5 11.8 12.7 49.3
Worked in last 12 monthsYes 85.1 84.2 86.6 94.1 25.5 26.4 24.1 79.9 12.7 15.3 8.6 47.9No 82.6 80.2 85.4 90.3 21.2 20.8 21.7 69.2 8.4 10.2 6.3 31.5
Wealth quintileFirst 82.3 82.4 82.0 93.7 21.8 22.7 20.4 78.6 11.9 14.4 7.0 50.2Second 86.0 86.2 85.6 92.6 25.0 28.0 19.9 74.9 12.2 16.4 5.2 42.2Third 84.3 82.5 86.7 91.0 21.4 21.9 20.7 69.9 9.4 10.9 7.0 35.9Fourth 83.5 81.6 85.5 93.1 22.5 23.4 21.6 77.9 8.3 9.7 6.7 44.8Fifth 82.7 76.0 87.6 93.7 25.5 21.4 28.6 79.8 10.8 12.6 9.6 42.4
Total 83.8 82.2 85.9 92.8 23.2 23.6 22.8 76.3 10.4 12.8 7.3 42.4
UrbanAge (years)15–19 84.8 78.0 86.6 94.4 17.4 18.6 17.0 72.6 7.3 11.1 6.3 33.620–24 86.6 85.0 89.7 94.5 25.6 21.9 33.0 82.9 12.5 13.0 11.7 55.5
Religion Hindu 88.0 85.6 90.1 95.3 23.5 22.5 24.2 79.0 9.5 11.5 7.8 45.6Muslim 72.1 70.9 73.1 92.2 15.1 16.4 13.4 75.6 14.0 21.8 8.4 40.0Other1 82.6 77.8 86.8 90.3 14.2 13.3 15.8 63.3 9.2 11.1 9.2 38.7
CasteSC 82.9 78.3 86.5 95.1 15.0 13.3 16.5 75.5 8.7 10.8 6.5 44.1ST (93.5) (88.2) * (100.0) (29.0) (25.0) * (90.0) (10.0) (17.6) * (45.0)OBC 89.7 87.7 91.3 95.0 23.0 23.1 23.0 78.9 9.0 10.4 7.4 47.7General2 81.4 78.1 83.3 93.2 24.0 24.2 24.1 76.1 12.9 18.0 10.0 40.3
Educational level (years)None3 80.6 81.3 (76.3) (90.5) 15.3 16.7 (7.9) (76.2) 13.3 14.4 (7.9) (42.9)1–7 85.7 85.6 85.7 96.2 19.4 18.8 21.0 77.4 9.3 11.2 5.9 48.18–11 84.7 81.8 86.6 94.7 18.1 22.9 15.1 75.1 7.7 12.5 4.7 39.012 and above 89.1 84.3 90.5 93.7 30.8 26.8 32.3 81.2 12.9 14.5 12.4 49.8
Worked in last 12 monthsYes 88.4 87.6 89.3 95.8 28.7 28.9 28.3 83.3 15.9 17.4 15.0 52.8No 84.8 82.4 87.0 92.9 19.4 18.8 20.0 69.6 8.1 11.2 5.6 32.0
Cont’d on next page...
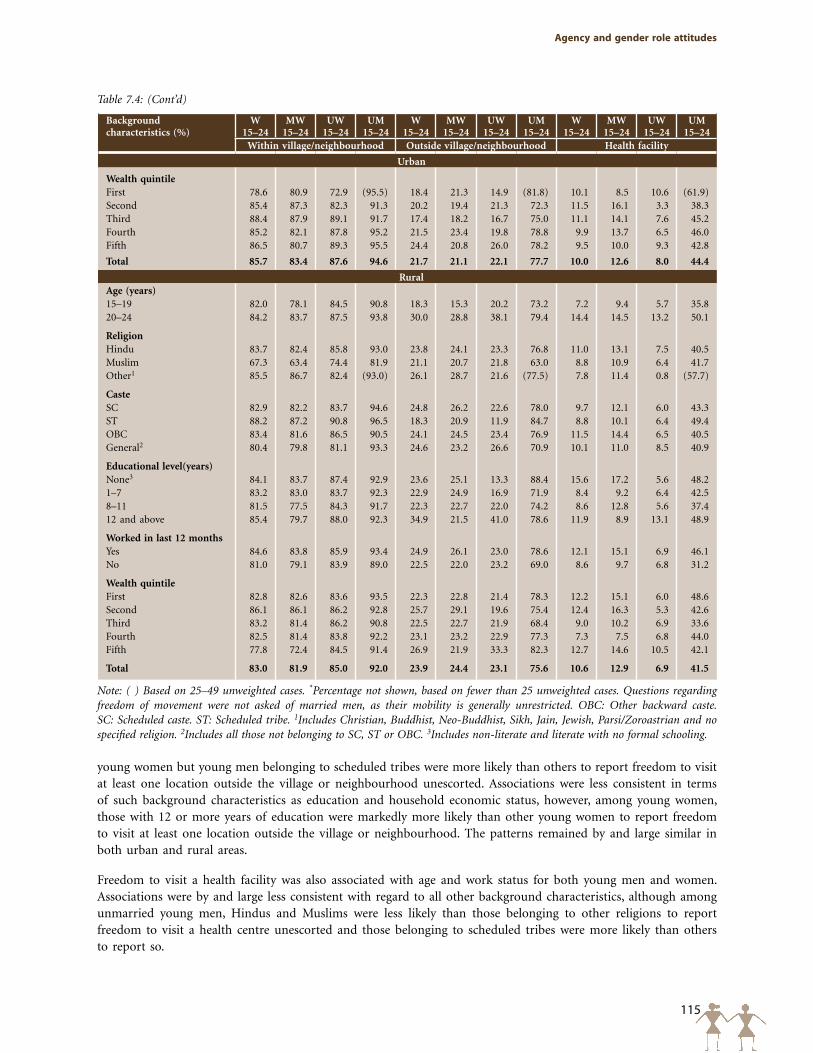
115
Agency and gender role attitudes
Background characteristics (%)
W15–24
MW15–24
UW15–24
UM15–24
W15–24
MW15–24
UW15–24
UM15–24
W15–24
MW15–24
UW15–24
UM15–24
Within village/neighbourhood Outside village/neighbourhood Health facility
Urban
Wealth quintileFirst 78.6 80.9 72.9 (95.5) 18.4 21.3 14.9 (81.8) 10.1 8.5 10.6 (61.9)Second 85.4 87.3 82.3 91.3 20.2 19.4 21.3 72.3 11.5 16.1 3.3 38.3Third 88.4 87.9 89.1 91.7 17.4 18.2 16.7 75.0 11.1 14.1 7.6 45.2Fourth 85.2 82.1 87.8 95.2 21.5 23.4 19.8 78.8 9.9 13.7 6.5 46.0Fifth 86.5 80.7 89.3 95.5 24.4 20.8 26.0 78.2 9.5 10.0 9.3 42.8
Total 85.7 83.4 87.6 94.6 21.7 21.1 22.1 77.7 10.0 12.6 8.0 44.4
RuralAge (years)15–19 82.0 78.1 84.5 90.8 18.3 15.3 20.2 73.2 7.2 9.4 5.7 35.820–24 84.2 83.7 87.5 93.8 30.0 28.8 38.1 79.4 14.4 14.5 13.2 50.1
Religion Hindu 83.7 82.4 85.8 93.0 23.8 24.1 23.3 76.8 11.0 13.1 7.5 40.5Muslim 67.3 63.4 74.4 81.9 21.1 20.7 21.8 63.0 8.8 10.9 6.4 41.7Other1 85.5 86.7 82.4 (93.0) 26.1 28.7 21.6 (77.5) 7.8 11.4 0.8 (57.7)
CasteSC 82.9 82.2 83.7 94.6 24.8 26.2 22.6 78.0 9.7 12.1 6.0 43.3ST 88.2 87.2 90.8 96.5 18.3 20.9 11.9 84.7 8.8 10.1 6.4 49.4OBC 83.4 81.6 86.5 90.5 24.1 24.5 23.4 76.9 11.5 14.4 6.5 40.5General2 80.4 79.8 81.1 93.3 24.6 23.2 26.6 70.9 10.1 11.0 8.5 40.9
Educational level(years)None3 84.1 83.7 87.4 92.9 23.6 25.1 13.3 88.4 15.6 17.2 5.6 48.21–7 83.2 83.0 83.7 92.3 22.9 24.9 16.9 71.9 8.4 9.2 6.4 42.58–11 81.5 77.5 84.3 91.7 22.3 22.7 22.0 74.2 8.6 12.8 5.6 37.412 and above 85.4 79.7 88.0 92.3 34.9 21.5 41.0 78.6 11.9 8.9 13.1 48.9
Worked in last 12 monthsYes 84.6 83.8 85.9 93.4 24.9 26.1 23.0 78.6 12.1 15.1 6.9 46.1No 81.0 79.1 83.9 89.0 22.5 22.0 23.2 69.0 8.6 9.7 6.8 31.2
Wealth quintileFirst 82.8 82.6 83.6 93.5 22.3 22.8 21.4 78.3 12.2 15.1 6.0 48.6Second 86.1 86.1 86.2 92.8 25.7 29.1 19.6 75.4 12.4 16.3 5.3 42.6Third 83.2 81.4 86.2 90.8 22.5 22.7 21.9 68.4 9.0 10.2 6.9 33.6Fourth 82.5 81.4 83.8 92.2 23.1 23.2 22.9 77.3 7.3 7.5 6.8 44.0Fifth 77.8 72.4 84.5 91.4 26.9 21.9 33.3 82.3 12.7 14.6 10.5 42.1
Total 83.0 81.9 85.0 92.0 23.9 24.4 23.1 75.6 10.6 12.9 6.9 41.5
Note: ( ) Based on 25–49 unweighted cases. *Percentage not shown, based on fewer than 25 unweighted cases. Questions regarding freedom of movement were not asked of married men, as their mobility is generally unrestricted. OBC: Other backward caste. SC: Scheduled caste. ST: Scheduled tribe. 1Includes Christian, Buddhist, Neo-Buddhist, Sikh, Jain, Jewish, Parsi/Zoroastrian and no specified religion. 2Includes all those not belonging to SC, ST or OBC. 3Includes non-literate and literate with no formal schooling.
Table 7.4: (Cont’d)
young women but young men belonging to scheduled tribes were more likely than others to report freedom to visit at least one location outside the village or neighbourhood unescorted. Associations were less consistent in terms of such background characteristics as education and household economic status, however, among young women, those with 12 or more years of education were markedly more likely than other young women to report freedom to visit at least one location outside the village or neighbourhood. The patterns remained by and large similar in both urban and rural areas.
Freedom to visit a health facility was also associated with age and work status for both young men and women. Associations were by and large less consistent with regard to all other background characteristics, although among unmarried young men, Hindus and Muslims were less likely than those belonging to other religions to report freedom to visit a health centre unescorted and those belonging to scheduled tribes were more likely than others to report so.
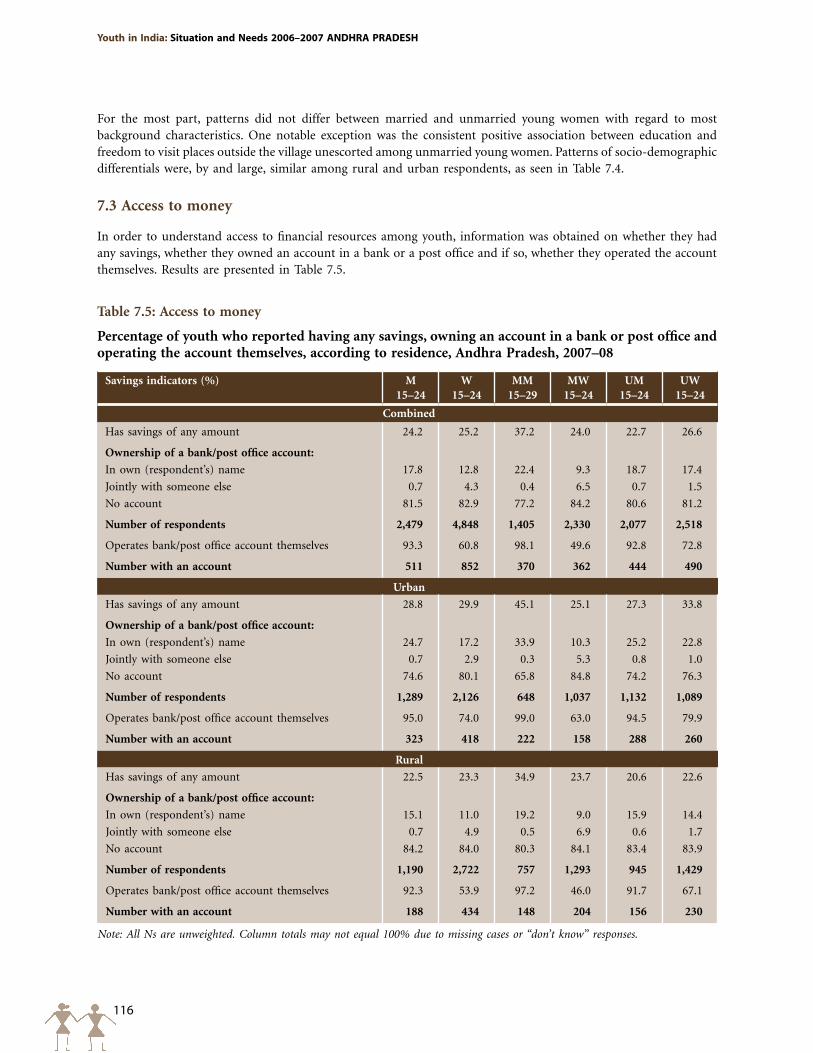
116
Youth in India: Situation and Needs 2006–2007 ANDHRA pRADESH
For the most part, patterns did not differ between married and unmarried young women with regard to most background characteristics. One notable exception was the consistent positive association between education and freedom to visit places outside the village unescorted among unmarried young women. Patterns of socio-demographic differentials were, by and large, similar among rural and urban respondents, as seen in Table 7.4.
7.3 Access to money
In order to understand access to financial resources among youth, information was obtained on whether they had any savings, whether they owned an account in a bank or a post office and if so, whether they operated the account themselves. Results are presented in Table 7.5.
Table 7.5: Access to money
Percentage of youth who reported having any savings, owning an account in a bank or post office and operating the account themselves, according to residence, Andhra Pradesh, 2007–08
Savings indicators (%) M 15–24
W 15–24
MM15–29
MW15–24
UM15–24
UW15–24
Combined
Has savings of any amount 24.2 25.2 37.2 24.0 22.7 26.6
Ownership of a bank/post office account:
In own (respondent’s) name 17.8 12.8 22.4 9.3 18.7 17.4
Jointly with someone else 0.7 4.3 0.4 6.5 0.7 1.5
No account 81.5 82.9 77.2 84.2 80.6 81.2
Number of respondents 2,479 4,848 1,405 2,330 2,077 2,518
Operates bank/post office account themselves 93.3 60.8 98.1 49.6 92.8 72.8
Number with an account 511 852 370 362 444 490
Urban
Has savings of any amount 28.8 29.9 45.1 25.1 27.3 33.8
Ownership of a bank/post office account:
In own (respondent’s) name 24.7 17.2 33.9 10.3 25.2 22.8
Jointly with someone else 0.7 2.9 0.3 5.3 0.8 1.0
No account 74.6 80.1 65.8 84.8 74.2 76.3
Number of respondents 1,289 2,126 648 1,037 1,132 1,089
Operates bank/post office account themselves 95.0 74.0 99.0 63.0 94.5 79.9
Number with an account 323 418 222 158 288 260
Rural
Has savings of any amount 22.5 23.3 34.9 23.7 20.6 22.6
Ownership of a bank/post office account:
In own (respondent’s) name 15.1 11.0 19.2 9.0 15.9 14.4
Jointly with someone else 0.7 4.9 0.5 6.9 0.6 1.7
No account 84.2 84.0 80.3 84.1 83.4 83.9
Number of respondents 1,190 2,722 757 1,293 945 1,429
Operates bank/post office account themselves 92.3 53.9 97.2 46.0 91.7 67.1
Number with an account 188 434 148 204 156 230
Note: All Ns are unweighted. Column totals may not equal 100% due to missing cases or “don’t know” responses.
117
Agency and gender role attitudes
Findings suggest that young men were as likely as young women to have reported some savings (24–25%). While similar proportions of young women and unmarried young men reported having savings (23–27%), considerably more married young men reported so (37%). Moreover, while marital status differences were muted for the overall and rural samples of young women, unmarried young women in urban areas were more likely than the married to report savings (34% versus 25%). Differences by rural-urban residence indicate that somewhat more urban youth reported some savings than did rural youth (29–30% versus 23%).
Fewer youth reported owning a bank/post office account (17–19%). Gender differences were narrow for the overall population; however, differences were apparent among the married among whom men were somewhat more likely than women to own an account. Differences by marital status were muted for the overall and rural samples, but notable for the urban sample. In urban areas, while married young men were somewhat more likely than their unmarried counterparts to own an account (34% versus 26%), a reverse pattern was evident among young women (16% and 24% of married and unmarried young women, respectively). Rural-urban differences were apparent among young men, with urban young men considerably more likely than rural young men to report owning a bank account (25% versus 16%); but difference were negligible among young women (20% versus 16%).
With regard to operation of the account, gender differences were stark. While 93% of young men who owned an account operated it themselves, only 61% of young women who owned an account did so. Marital status differences were modest among young men; however among young women, the unmarried were more likely than the married to operate their account on their own (73% versus 50%). Likewise, rural-urban differences were negligible among young men, but wide among young women, among whom those in urban areas were more likely than their rural counterparts to operate their account on their own (74% versus 54%).
7.4 Gender role attitudes
In order to understand gender role attitudes, youth were asked seven questions reflecting attitudes, including the relative importance attached to educating boys versus girls, the role of the husband as the main decision-maker with regard to spending money, girls’ participation in decisions about their own marriages, a woman’s need to take permission from her husband for any activity, the comparative performance of girls versus boys in studies, gender roles in domestic work and whether girls who dress provocatively deserve to be teased. Findings, presented in Table 7.6, suggest a mixed scenario.
Questions that were most likely to elicit egalitarian attitudes from both young men and women included whether educating boys is more important than educating girls, whether the husband should be the main decision-maker with regard to spending money, whether girls should be allowed to decide about their own marriage and whether girls who dress provocatively deserve to be teased; 64–70% of young men and 66–84% of young women expressed egalitarian views on these matters. In addition, almost three-fifths of young men and women (56–58%) expressed egalitarian views about whether girls are usually as good as boys in studies. Questions that were least likely to elicit egalitarian responses from youth included whether women should obtain their husbands’ permission for most things (44% of young men and 31% of young women disagreed with the statement) and whether boys should do as much domestic work as girls (17% of young men and 30% of young women agreed with the statement).
Young men were more likely than young women to report unequal gender role attitudes in relation to four out of the seven statements and less likely to do so in relation to just one statement. For example, even though large proportions of youth believed that educating boys is no more important than educating girls, more young men than women (31% versus 16%) expressed the traditional attitude that educating boys is more important than educating girls. Nonetheless, roughly similar percentages of young men and women agreed that the husband alone should not be the main decision-maker with regard to spending money (70% and 66%, respectively) and that girls are usually as good as boys in studies (56% and 58%, respectively). Finally, considerably more young men than women agreed on one statement—that a woman need not obtain her husband’s permission for most things (44% versus 31%). Patterns remained, by and large, similar in both urban and rural settings.
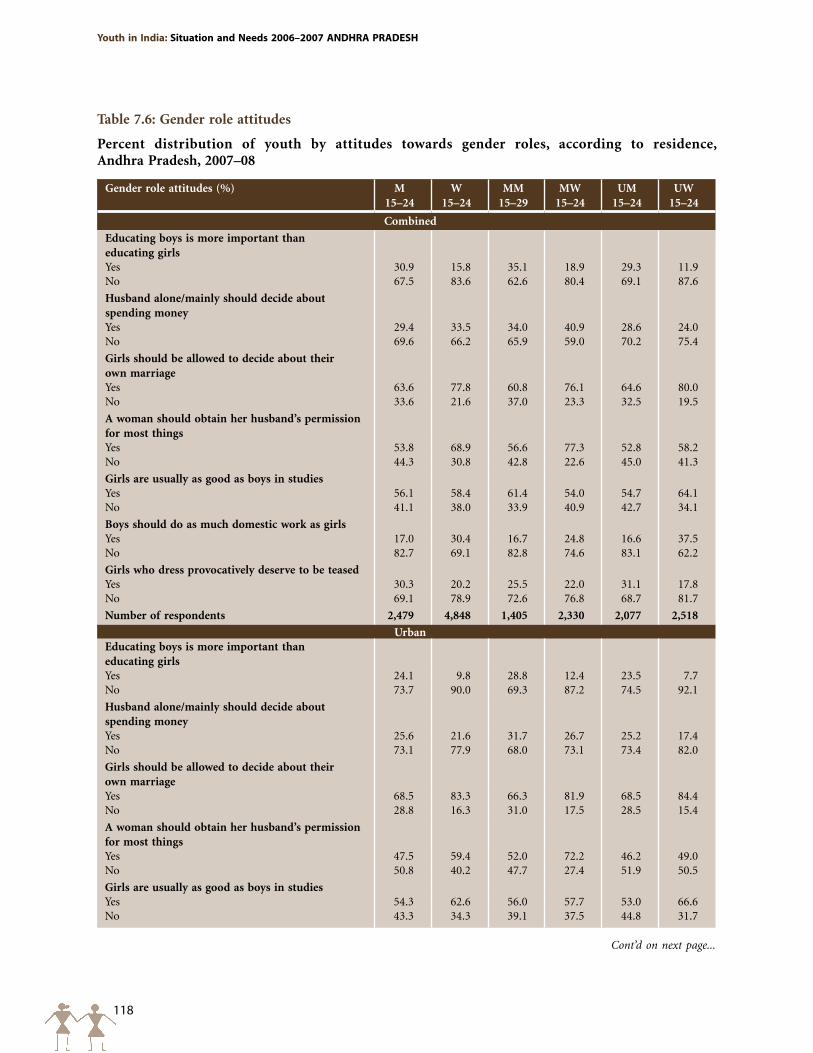
118
Youth in India: Situation and Needs 2006–2007 ANDHRA pRADESH
Table 7.6: Gender role attitudes
Percent distribution of youth by attitudes towards gender roles, according to residence, Andhra Pradesh, 2007–08
Gender role attitudes (%) M15–24
W15–24
MM15–29
MW15–24
UM15–24
UW15–24
Combined
Educating boys is more important than educating girlsYes 30.9 15.8 35.1 18.9 29.3 11.9No 67.5 83.6 62.6 80.4 69.1 87.6
Husband alone/mainly should decide about spending moneyYes 29.4 33.5 34.0 40.9 28.6 24.0No 69.6 66.2 65.9 59.0 70.2 75.4
Girls should be allowed to decide about their own marriageYes 63.6 77.8 60.8 76.1 64.6 80.0No 33.6 21.6 37.0 23.3 32.5 19.5
A woman should obtain her husband’s permission for most things Yes 53.8 68.9 56.6 77.3 52.8 58.2No 44.3 30.8 42.8 22.6 45.0 41.3
Girls are usually as good as boys in studiesYes 56.1 58.4 61.4 54.0 54.7 64.1No 41.1 38.0 33.9 40.9 42.7 34.1
Boys should do as much domestic work as girlsYes 17.0 30.4 16.7 24.8 16.6 37.5No 82.7 69.1 82.8 74.6 83.1 62.2
Girls who dress provocatively deserve to be teasedYes 30.3 20.2 25.5 22.0 31.1 17.8No 69.1 78.9 72.6 76.8 68.7 81.7
Number of respondents 2,479 4,848 1,405 2,330 2,077 2,518
UrbanEducating boys is more important than educating girlsYes 24.1 9.8 28.8 12.4 23.5 7.7No 73.7 90.0 69.3 87.2 74.5 92.1
Husband alone/mainly should decide about spending moneyYes 25.6 21.6 31.7 26.7 25.2 17.4No 73.1 77.9 68.0 73.1 73.4 82.0
Girls should be allowed to decide about their own marriageYes 68.5 83.3 66.3 81.9 68.5 84.4No 28.8 16.3 31.0 17.5 28.5 15.4
A woman should obtain her husband’s permission for most things Yes 47.5 59.4 52.0 72.2 46.2 49.0No 50.8 40.2 47.7 27.4 51.9 50.5
Girls are usually as good as boys in studiesYes 54.3 62.6 56.0 57.7 53.0 66.6No 43.3 34.3 39.1 37.5 44.8 31.7
Cont’d on next page...
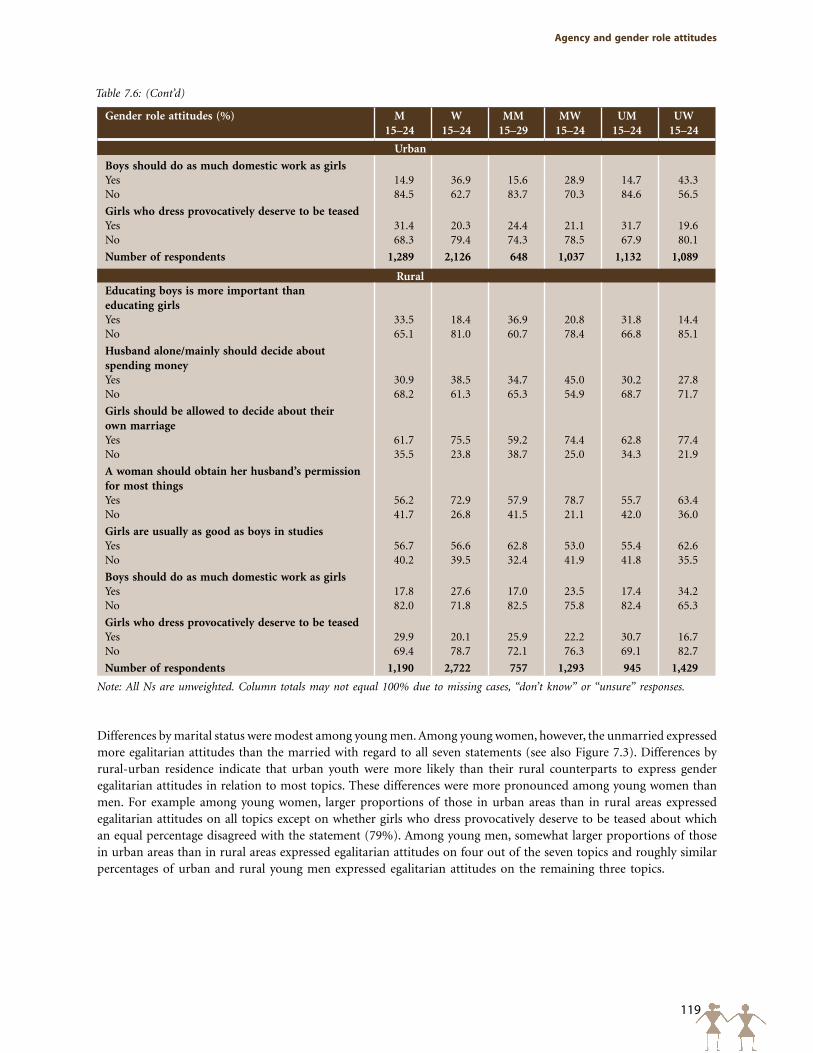
119
Agency and gender role attitudes
Gender role attitudes (%) M15–24
W15–24
MM15–29
MW15–24
UM15–24
UW15–24
Urban
Boys should do as much domestic work as girlsYes 14.9 36.9 15.6 28.9 14.7 43.3No 84.5 62.7 83.7 70.3 84.6 56.5
Girls who dress provocatively deserve to be teasedYes 31.4 20.3 24.4 21.1 31.7 19.6No 68.3 79.4 74.3 78.5 67.9 80.1
Number of respondents 1,289 2,126 648 1,037 1,132 1,089
RuralEducating boys is more important than educating girlsYes 33.5 18.4 36.9 20.8 31.8 14.4No 65.1 81.0 60.7 78.4 66.8 85.1
Husband alone/mainly should decide about spending moneyYes 30.9 38.5 34.7 45.0 30.2 27.8No 68.2 61.3 65.3 54.9 68.7 71.7
Girls should be allowed to decide about their own marriageYes 61.7 75.5 59.2 74.4 62.8 77.4No 35.5 23.8 38.7 25.0 34.3 21.9
A woman should obtain her husband’s permission for most things Yes 56.2 72.9 57.9 78.7 55.7 63.4No 41.7 26.8 41.5 21.1 42.0 36.0
Girls are usually as good as boys in studiesYes 56.7 56.6 62.8 53.0 55.4 62.6No 40.2 39.5 32.4 41.9 41.8 35.5
Boys should do as much domestic work as girlsYes 17.8 27.6 17.0 23.5 17.4 34.2No 82.0 71.8 82.5 75.8 82.4 65.3
Girls who dress provocatively deserve to be teasedYes 29.9 20.1 25.9 22.2 30.7 16.7No 69.4 78.7 72.1 76.3 69.1 82.7
Number of respondents 1,190 2,722 757 1,293 945 1,429
Note: All Ns are unweighted. Column totals may not equal 100% due to missing cases, “don’t know” or “unsure” responses.
Table 7.6: (Cont’d)
Differences by marital status were modest among young men. Among young women, however, the unmarried expressed more egalitarian attitudes than the married with regard to all seven statements (see also Figure 7.3). Differences by rural-urban residence indicate that urban youth were more likely than their rural counterparts to express gender egalitarian attitudes in relation to most topics. These differences were more pronounced among young women than men. For example among young women, larger proportions of those in urban areas than in rural areas expressed egalitarian attitudes on all topics except on whether girls who dress provocatively deserve to be teased about which an equal percentage disagreed with the statement (79%). Among young men, somewhat larger proportions of those in urban areas than in rural areas expressed egalitarian attitudes on four out of the seven topics and roughly similar percentages of urban and rural young men expressed egalitarian attitudes on the remaining three topics.
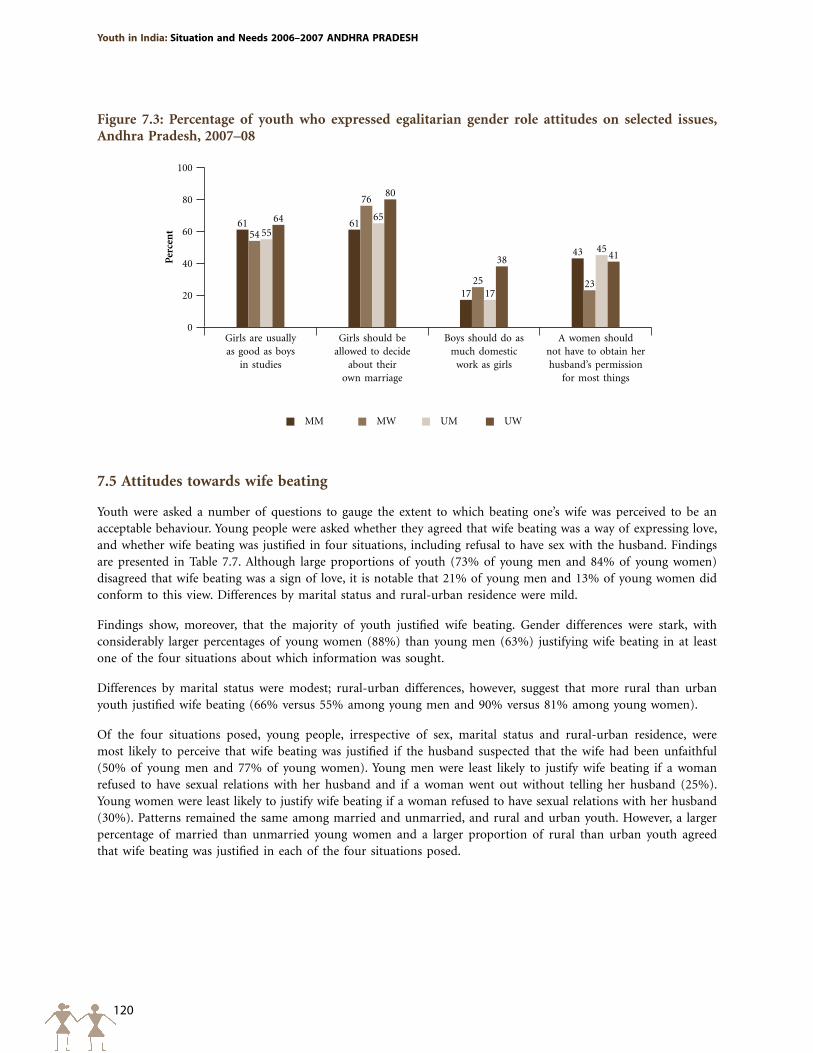
120
Youth in India: Situation and Needs 2006–2007 ANDHRA pRADESH
7.5 Attitudes towards wife beating
Youth were asked a number of questions to gauge the extent to which beating one’s wife was perceived to be an acceptable behaviour. Young people were asked whether they agreed that wife beating was a way of expressing love, and whether wife beating was justified in four situations, including refusal to have sex with the husband. Findings are presented in Table 7.7. Although large proportions of youth (73% of young men and 84% of young women) disagreed that wife beating was a sign of love, it is notable that 21% of young men and 13% of young women did conform to this view. Differences by marital status and rural-urban residence were mild.
Findings show, moreover, that the majority of youth justified wife beating. Gender differences were stark, with considerably larger percentages of young women (88%) than young men (63%) justifying wife beating in at least one of the four situations about which information was sought.
Differences by marital status were modest; rural-urban differences, however, suggest that more rural than urban youth justified wife beating (66% versus 55% among young men and 90% versus 81% among young women).
Of the four situations posed, young people, irrespective of sex, marital status and rural-urban residence, were most likely to perceive that wife beating was justified if the husband suspected that the wife had been unfaithful (50% of young men and 77% of young women). Young men were least likely to justify wife beating if a woman refused to have sexual relations with her husband and if a woman went out without telling her husband (25%). Young women were least likely to justify wife beating if a woman refused to have sexual relations with her husband (30%). Patterns remained the same among married and unmarried, and rural and urban youth. However, a larger percentage of married than unmarried young women and a larger proportion of rural than urban youth agreed that wife beating was justified in each of the four situations posed.
Figure 7.3: Percentage of youth who expressed egalitarian gender role attitudes on selected issues, Andhra Pradesh, 2007–08
MWMM UM UW
Per
cen
t100
80
60
40
20
0
6154 55
64 61
76
65
80
1725
17
3843
23
4541
Girls are usually as good as boys
in studies
Girls should be allowed to decide
about their own marriage
Boys should do as much domestic
work as girls
A women should not have to obtain her husband’s permission
for most things
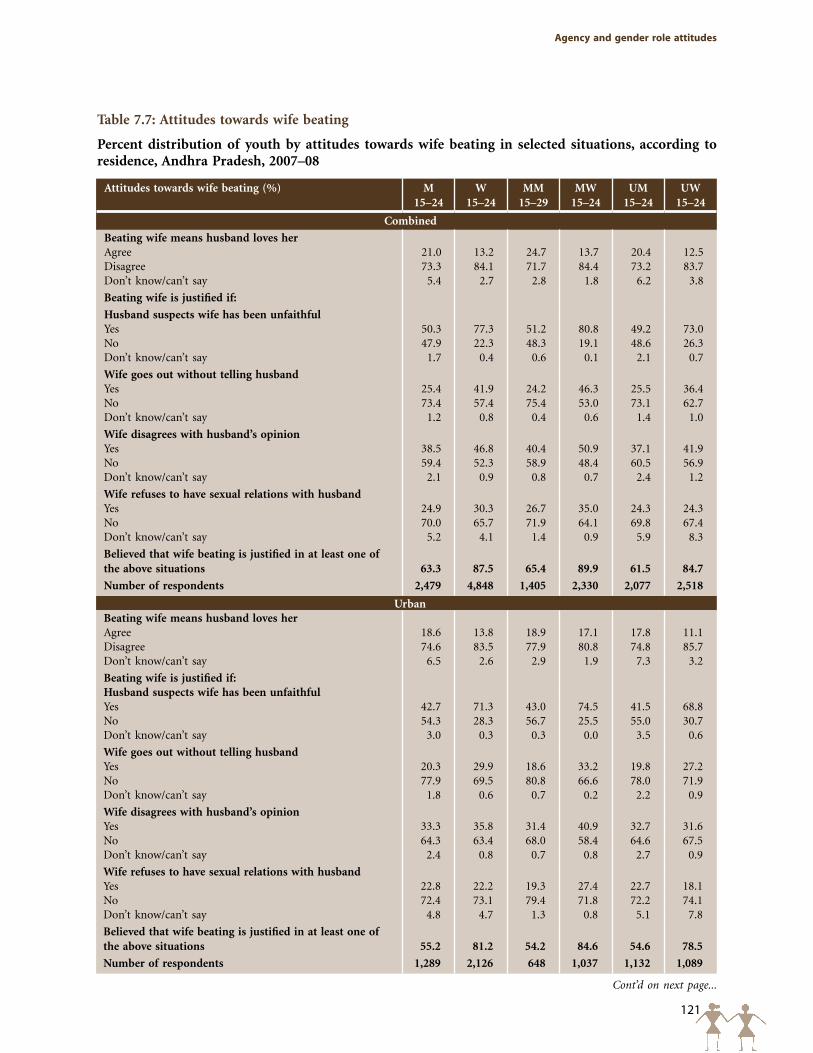
121
Agency and gender role attitudes
Cont’d on next page...
Table 7.7: Attitudes towards wife beating
Percent distribution of youth by attitudes towards wife beating in selected situations, according to residence, Andhra Pradesh, 2007–08
Attitudes towards wife beating (%) M15–24
W15–24
MM15–29
MW15–24
UM15–24
UW15–24
Combined
Beating wife means husband loves herAgree 21.0 13.2 24.7 13.7 20.4 12.5Disagree 73.3 84.1 71.7 84.4 73.2 83.7Don’t know/can’t say 5.4 2.7 2.8 1.8 6.2 3.8
Beating wife is justified if:
Husband suspects wife has been unfaithfulYes 50.3 77.3 51.2 80.8 49.2 73.0No 47.9 22.3 48.3 19.1 48.6 26.3Don’t know/can’t say 1.7 0.4 0.6 0.1 2.1 0.7
Wife goes out without telling husbandYes 25.4 41.9 24.2 46.3 25.5 36.4No 73.4 57.4 75.4 53.0 73.1 62.7Don’t know/can’t say 1.2 0.8 0.4 0.6 1.4 1.0
Wife disagrees with husband’s opinionYes 38.5 46.8 40.4 50.9 37.1 41.9No 59.4 52.3 58.9 48.4 60.5 56.9Don’t know/can’t say 2.1 0.9 0.8 0.7 2.4 1.2
Wife refuses to have sexual relations with husband Yes 24.9 30.3 26.7 35.0 24.3 24.3No 70.0 65.7 71.9 64.1 69.8 67.4Don’t know/can’t say 5.2 4.1 1.4 0.9 5.9 8.3
Believed that wife beating is justified in at least one of the above situations 63.3 87.5 65.4 89.9 61.5 84.7
Number of respondents 2,479 4,848 1,405 2,330 2,077 2,518
UrbanBeating wife means husband loves herAgree 18.6 13.8 18.9 17.1 17.8 11.1Disagree 74.6 83.5 77.9 80.8 74.8 85.7Don’t know/can’t say 6.5 2.6 2.9 1.9 7.3 3.2
Beating wife is justified if:Husband suspects wife has been unfaithfulYes 42.7 71.3 43.0 74.5 41.5 68.8No 54.3 28.3 56.7 25.5 55.0 30.7Don’t know/can’t say 3.0 0.3 0.3 0.0 3.5 0.6
Wife goes out without telling husbandYes 20.3 29.9 18.6 33.2 19.8 27.2No 77.9 69.5 80.8 66.6 78.0 71.9Don’t know/can’t say 1.8 0.6 0.7 0.2 2.2 0.9
Wife disagrees with husband’s opinionYes 33.3 35.8 31.4 40.9 32.7 31.6No 64.3 63.4 68.0 58.4 64.6 67.5Don’t know/can’t say 2.4 0.8 0.7 0.8 2.7 0.9
Wife refuses to have sexual relations with husband Yes 22.8 22.2 19.3 27.4 22.7 18.1No 72.4 73.1 79.4 71.8 72.2 74.1Don’t know/can’t say 4.8 4.7 1.3 0.8 5.1 7.8
Believed that wife beating is justified in at least one of the above situations 55.2 81.2 54.2 84.6 54.6 78.5
Number of respondents 1,289 2,126 648 1,037 1,132 1,089
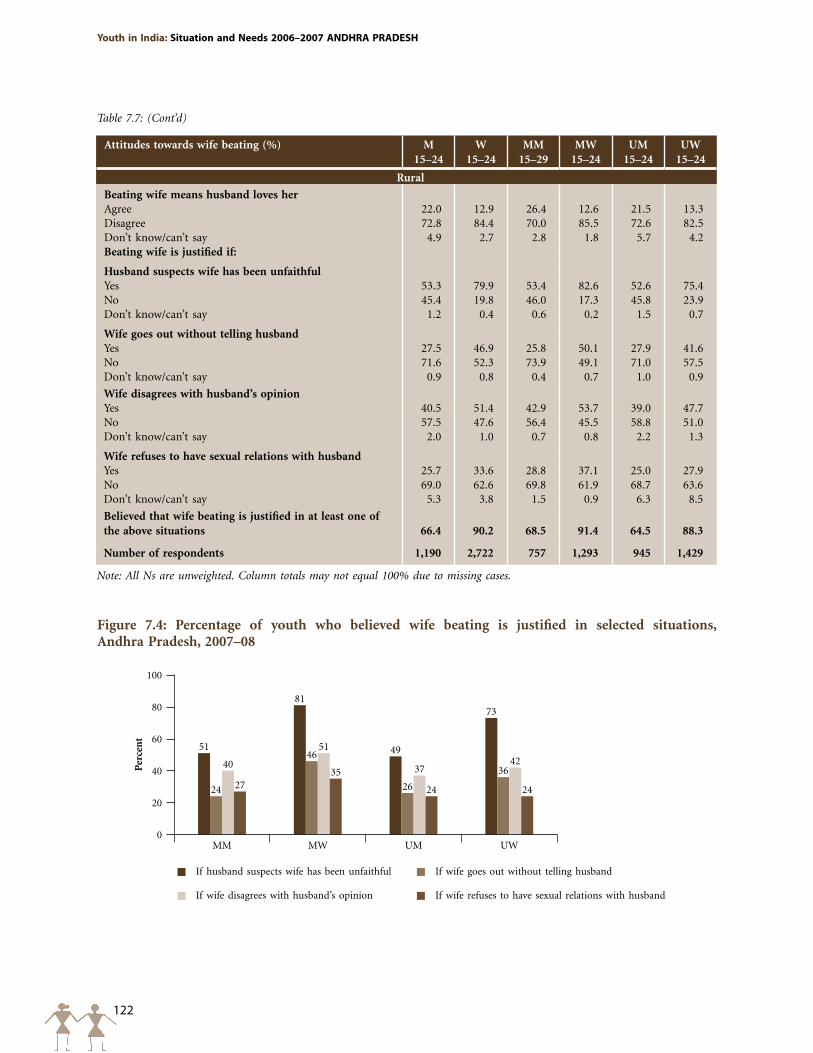
122
Youth in India: Situation and Needs 2006–2007 ANDHRA pRADESH
Table 7.7: (Cont’d)
Figure 7.4: Percentage of youth who believed wife beating is justified in selected situations, Andhra Pradesh, 2007–08
If husband suspects wife has been unfaithful
If wife disagrees with husband’s opinion
If wife goes out without telling husband
If wife refuses to have sexual relations with husband
Per
cen
t
100
80
60
40
20
0
51
81
49
73
24
46
26
3640
51
3742
2735
24 24
MM MW UM UW
Attitudes towards wife beating (%) M15–24
W15–24
MM15–29
MW15–24
UM15–24
UW15–24
Rural
Beating wife means husband loves herAgree 22.0 12.9 26.4 12.6 21.5 13.3Disagree 72.8 84.4 70.0 85.5 72.6 82.5Don’t know/can’t say 4.9 2.7 2.8 1.8 5.7 4.2Beating wife is justified if:
Husband suspects wife has been unfaithfulYes 53.3 79.9 53.4 82.6 52.6 75.4No 45.4 19.8 46.0 17.3 45.8 23.9Don’t know/can’t say 1.2 0.4 0.6 0.2 1.5 0.7
Wife goes out without telling husbandYes 27.5 46.9 25.8 50.1 27.9 41.6No 71.6 52.3 73.9 49.1 71.0 57.5Don’t know/can’t say 0.9 0.8 0.4 0.7 1.0 0.9
Wife disagrees with husband’s opinionYes 40.5 51.4 42.9 53.7 39.0 47.7No 57.5 47.6 56.4 45.5 58.8 51.0Don’t know/can’t say 2.0 1.0 0.7 0.8 2.2 1.3
Wife refuses to have sexual relations with husband Yes 25.7 33.6 28.8 37.1 25.0 27.9No 69.0 62.6 69.8 61.9 68.7 63.6Don’t know/can’t say 5.3 3.8 1.5 0.9 6.3 8.5
Believed that wife beating is justified in at least one of the above situations 66.4 90.2 68.5 91.4 64.5 88.3
Number of respondents 1,190 2,722 757 1,293 945 1,429
Note: All Ns are unweighted. Column totals may not equal 100% due to missing cases.
123
Agency and gender role attitudes
7.6 Summary
Findings highlight young women’s limited agency. For example, just one in four young women reported independent decision-making on all three issues explored in the survey, namely, choice of friends, spending one’s own money and purchase of clothes for oneself. Likewise, freedom of movement even within the village or neighbourhood was not universal among young women; just four in five young women had the freedom to visit even locations within their own village or neighbourhood unescorted. Many fewer, just one in four young women reported freedom to visit at least one place outside their village or neighbourhood unescorted, and one in 10 could visit a health facility unescorted. Access to and control over financial resources tended to be limited among young women; just one in four reported some savings and one in six owned a bank or post office savings account. Of those who owned an account, just three in five young women operated it themselves.
Within the sub-group of young women, findings indicate that the married were more disadvantaged, in some respects, than the unmarried. For example, compared to the unmarried, married young women were less likely to exercise control over financial resources, and at the same time, more likely to hold unequal gender role attitudes and to justify wife-beating. They were, however, about as likely as the unmarried to report independent decision-making and freedom of movement.
Also notable from the findings is the striking gender divide in most dimensions of young people’s agency explored in the survey. Young women were far more disadvantaged than young men. For example, even the least educated young men were more likely than the most educated women to report independent decision-making on all three issues explored in the survey. Although young women were as likely as young men to have some money saved (25% and 24%, respectively) and own a bank or post office savings account (17% and 19%, respectively), they were less likely than young men to operate these accounts themselves (61% and 93%, respectively, of those who had an account).
While young men were not as disadvantaged as young women, findings indicate that many young men were also not able to exercise agency in their everyday lives. For example, only 55% of young men reported independent decision-making on all three issues explored in the survey. Similarly, young men’s freedom to visit selected localities was far from universal; for example, just over half of unmarried young men (55%) were allowed to visit a place of entertainment or to attend a programme conducted outside their village or neighbourhood unescorted, and just two-fifths were allowed to visit a health facility unescorted.
Relatively large proportions of youth espoused egalitarian gender role attitudes on such issues as the relative importance attached to educating boys versus girls, the role of the husband as the main decision-maker with regard to spending money, girls’ participation in decisions about their own marriages and so on. Even so, it is notable that young men were generally more likely than young women to report unequal gender role attitudes. A somewhat different picture emerged, however, with regard to attitudes to wife-beating. Findings highlight widespread acceptance of violence within marriage among youth, and in this case, young women were more likely than young men to so perceive; 88% of young women compared to 63% of young men justified wife beating in at least one situation explored in the survey.
124
Youth in India: Situation and Needs 2006–2007 ANDHRA pRADESH
Chapter 8
Awareness of sexual and reproductive health matters
A considerable body of research, including the NFHS (IIPS and Macro International, 2007a), has highlighted relatively low levels of awareness regarding selected sexual and reproductive health issues in both the general and youth populations. The Youth Study sought to explore awareness of a wide range of issues relating to sex, pregnancy, contraception and STIs, including HIV/AIDS, as well as knowledge of laws governing age at marriage and abortion. Where possible, further questions were posed to assess the extent of in-depth awareness of these matters. Along with the results of these items, this chapter presents findings on communication about and sources of information for sexual and reproductive health matters, as well as youth perceptions and experiences of family life or sex education.
8.1 Awareness of sex and pregnancy, contraception, STIs and HIV
In this section, we present evidence of the extent to which young people were aware of or held misconceptions about various issues related to sex and pregnancy, contraception, STIs and HIV.
8.1.1 Sex and pregnancy
In order to assess young people’s knowledge about sex and pregnancy, the Youth Study asked youth whether they agreed or disagreed with four statements: (a) a woman can get pregnant after kissing or hugging; (b) a woman is most likely to get pregnant if she has sex half-way between her periods; (c) a woman has to bleed at first intercourse; and (d) a woman can get pregnant at first sex. Given the prevalence of sex-selective abortions in the country (Bhat and Zavier, 2007; Dagar, 2007), we also asked whether youth were aware of any tests that could determine the sex of the foetus.
Findings, presented in Table 8.1, clearly suggest that awareness of sex- and pregnancy-related matters among youth was limited. The one exception was knowledge that women cannot become pregnant after kissing or hugging; 98% of young men and 96% of young women were aware of this and no differences in awareness were observed by marital status or rural-urban residence.
Awareness of other matters was reported by far smaller proportions of youth. Over two-fifths of young men and women were aware that women are most likely to become pregnant if they engage in sexual relations mid-cycle (45% and 41%, respectively). Awareness that a woman can get pregnant at first sex was correctly reported by just 42% of young men and 62% of young women. Finally, awareness that a woman does not have to bleed at first intercourse was reported by even fewer (33% of young men and 22% of young women).
Marital status differences were evident, with the married consistently more likely to report awareness than the unmarried. For example, more married than unmarried youth (61% versus 41% among young men and 54% versus 24% among young women) were aware that women are most likely to become pregnant if they engage in sexual relations mid-cycle (see Figure 8.1). Likewise, more married than unmarried youth (49% versus 41% among young men and 70% versus 51% among young women) reported correctly that a woman can become pregnant at first sex, and that a woman does not have to bleed at first intercourse (46% versus 31% among young men and 32% versus 10% among young women).
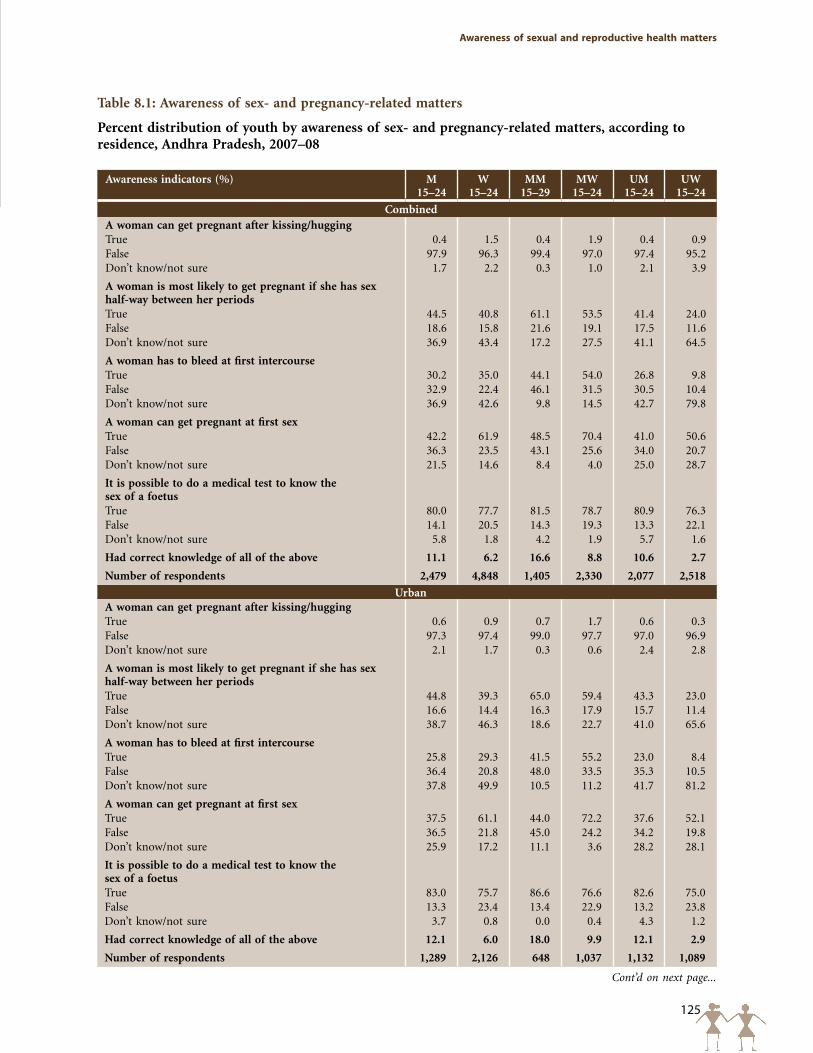
125
Awareness of sexual and reproductive health matters
Table 8.1: Awareness of sex- and pregnancy-related matters
Percent distribution of youth by awareness of sex- and pregnancy-related matters, according to residence, Andhra Pradesh, 2007–08
Awareness indicators (%) M15–24
W 15–24
MM 15–29
MW 15–24
UM 15–24
UW 15–24
CombinedA woman can get pregnant after kissing/huggingTrue 0.4 1.5 0.4 1.9 0.4 0.9False 97.9 96.3 99.4 97.0 97.4 95.2Don’t know/not sure 1.7 2.2 0.3 1.0 2.1 3.9
A woman is most likely to get pregnant if she has sex half-way between her periods True 44.5 40.8 61.1 53.5 41.4 24.0False 18.6 15.8 21.6 19.1 17.5 11.6Don’t know/not sure 36.9 43.4 17.2 27.5 41.1 64.5
A woman has to bleed at first intercourseTrue 30.2 35.0 44.1 54.0 26.8 9.8False 32.9 22.4 46.1 31.5 30.5 10.4Don’t know/not sure 36.9 42.6 9.8 14.5 42.7 79.8
A woman can get pregnant at first sexTrue 42.2 61.9 48.5 70.4 41.0 50.6False 36.3 23.5 43.1 25.6 34.0 20.7Don’t know/not sure 21.5 14.6 8.4 4.0 25.0 28.7
It is possible to do a medical test to know the sex of a foetusTrue 80.0 77.7 81.5 78.7 80.9 76.3False 14.1 20.5 14.3 19.3 13.3 22.1Don’t know/not sure 5.8 1.8 4.2 1.9 5.7 1.6
Had correct knowledge of all of the above 11.1 6.2 16.6 8.8 10.6 2.7
Number of respondents 2,479 4,848 1,405 2,330 2,077 2,518
UrbanA woman can get pregnant after kissing/huggingTrue 0.6 0.9 0.7 1.7 0.6 0.3False 97.3 97.4 99.0 97.7 97.0 96.9Don’t know/not sure 2.1 1.7 0.3 0.6 2.4 2.8
A woman is most likely to get pregnant if she has sex half-way between her periods True 44.8 39.3 65.0 59.4 43.3 23.0False 16.6 14.4 16.3 17.9 15.7 11.4Don’t know/not sure 38.7 46.3 18.6 22.7 41.0 65.6
A woman has to bleed at first intercourseTrue 25.8 29.3 41.5 55.2 23.0 8.4False 36.4 20.8 48.0 33.5 35.3 10.5Don’t know/not sure 37.8 49.9 10.5 11.2 41.7 81.2
A woman can get pregnant at first sexTrue 37.5 61.1 44.0 72.2 37.6 52.1False 36.5 21.8 45.0 24.2 34.2 19.8Don’t know/not sure 25.9 17.2 11.1 3.6 28.2 28.1
It is possible to do a medical test to know the sex of a foetusTrue 83.0 75.7 86.6 76.6 82.6 75.0False 13.3 23.4 13.4 22.9 13.2 23.8Don’t know/not sure 3.7 0.8 0.0 0.4 4.3 1.2
Had correct knowledge of all of the above 12.1 6.0 18.0 9.9 12.1 2.9
Number of respondents 1,289 2,126 648 1,037 1,132 1,089
Cont’d on next page...
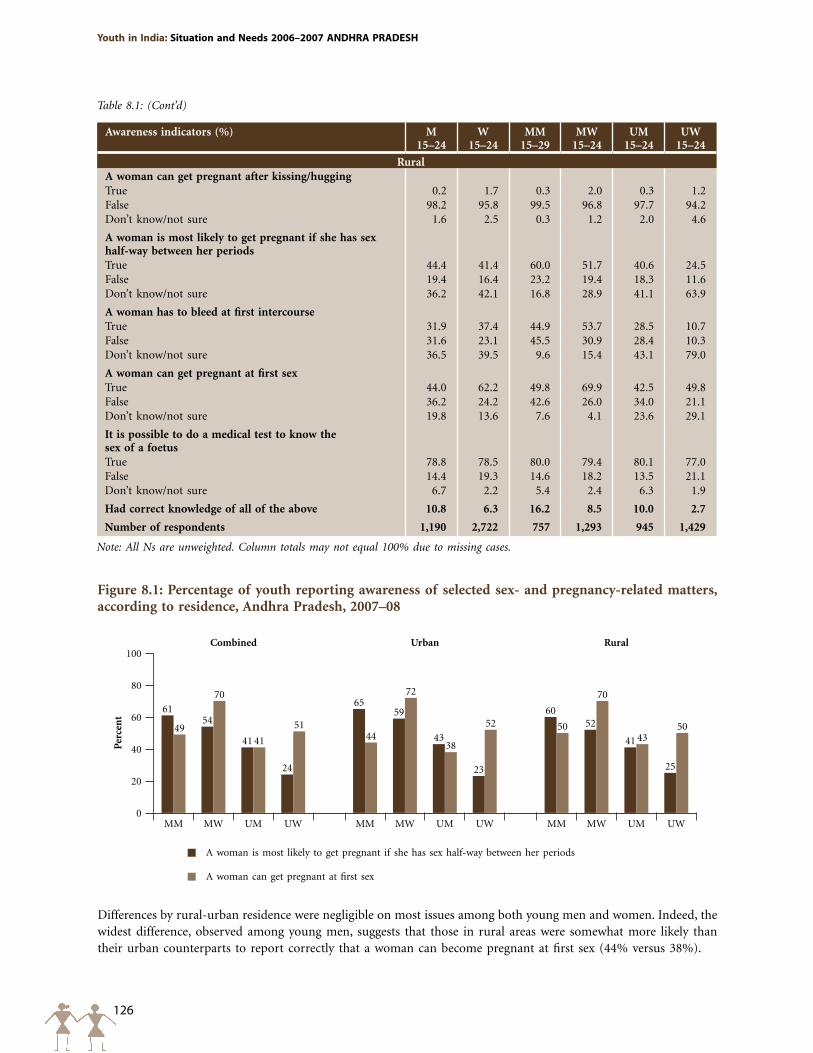
126
Youth in India: Situation and Needs 2006–2007 ANDHRA pRADESH
Table 8.1: (Cont’d)
Awareness indicators (%) M15–24
W 15–24
MM 15–29
MW 15–24
UM 15–24
UW 15–24
RuralA woman can get pregnant after kissing/huggingTrue 0.2 1.7 0.3 2.0 0.3 1.2False 98.2 95.8 99.5 96.8 97.7 94.2Don’t know/not sure 1.6 2.5 0.3 1.2 2.0 4.6
A woman is most likely to get pregnant if she has sex half-way between her periods True 44.4 41.4 60.0 51.7 40.6 24.5False 19.4 16.4 23.2 19.4 18.3 11.6Don’t know/not sure 36.2 42.1 16.8 28.9 41.1 63.9
A woman has to bleed at first intercourseTrue 31.9 37.4 44.9 53.7 28.5 10.7False 31.6 23.1 45.5 30.9 28.4 10.3Don’t know/not sure 36.5 39.5 9.6 15.4 43.1 79.0
A woman can get pregnant at first sexTrue 44.0 62.2 49.8 69.9 42.5 49.8False 36.2 24.2 42.6 26.0 34.0 21.1Don’t know/not sure 19.8 13.6 7.6 4.1 23.6 29.1
It is possible to do a medical test to know the sex of a foetusTrue 78.8 78.5 80.0 79.4 80.1 77.0False 14.4 19.3 14.6 18.2 13.5 21.1Don’t know/not sure 6.7 2.2 5.4 2.4 6.3 1.9
Had correct knowledge of all of the above 10.8 6.3 16.2 8.5 10.0 2.7
Number of respondents 1,190 2,722 757 1,293 945 1,429
Note: All Ns are unweighted. Column totals may not equal 100% due to missing cases.
Figure 8.1: Percentage of youth reporting awareness of selected sex- and pregnancy-related matters, according to residence, Andhra Pradesh, 2007–08
Per
cen
t
100
80
60
40
20
0
6154
41
24
6559
43
23
6052
41
25
49
70
41
5144
72
38
52 50
70
4350
Combined Urban Rural
MM MM MMMW MW MWUM UM UMUW UW UW
A woman is most likely to get pregnant if she has sex half-way between her periods
A woman can get pregnant at first sex
Differences by rural-urban residence were negligible on most issues among both young men and women. Indeed, the widest difference, observed among young men, suggests that those in rural areas were somewhat more likely than their urban counterparts to report correctly that a woman can become pregnant at first sex (44% versus 38%).
127
Awareness of sexual and reproductive health matters
Almost four-fifths (78–80%) of youth were aware of the availability of tests to determine the sex of the foetus. Differences by sex, marital status and rural-urban residence were narrow.
In order to examine overall knowledge regarding sex and pregnancy, a summary measure was computed that assessed the percentage of youth who were aware of all five matters, and is presented in Table 8.1. Findings show that just 11% of young men and 6% of young women had correct knowledge of all five matters. Differences by marital status were noted; more married than unmarried youth had correct knowledge of all five issues (17% versus 11% among young men and 9% versus 3% among young women). Differences by rural-urban residence were muted.
8.1.2 Socio-demographic differentials in awareness of sex- and pregnancy-related matters
Differentials in awareness, measured with respect to the percentage aware of all five issues relating to sex and pregnancy discussed above, are presented in Table 8.2. Levels of awareness did not differ much by background characteristics, which is not surprising given the low level of awareness observed for the overall population. However, some notable differences were apparent, particularly among young men. For example among young men, larger proportions of Hindu and Muslim men than those belonging to other religions reported awareness of all five matters, irrespective of marital status (12% versus 3%). Findings also show that awareness of all matters increased from 5% among uneducated young men to 15% among those with 12 or more years of education; the differences were wider among the married than the unmarried. Although awareness of all five matters did not increase steadily with household economic status, larger proportions of those belonging to the wealthiest quintile than others reported awareness of all five matters (17% versus 7–13%). Differentials with regard to other socio-demographic characteristics were narrow and less consistent. Among young women, too, differentials were typically narrow and consistent, except that among married young women, those belonging to scheduled tribe were less likely than others to be aware of all five matters (2% versus 8–11%). Patterns remained more or less similar in both rural and urban settings.
8.1.3 Awareness of contraceptive methods
The Youth Study explored young people’s awareness of contraceptive methods in several ways. First, youth were asked to list all contraceptive methods about which they had heard; second, interviewers gave respondents a brief description of a variety of non-terminal contraceptive methods not mentioned spontaneously and inquired whether the respondent had heard of each; and third, further questioning probed for specific knowledge regarding the use of oral pills, emergency contraception, condoms, the intra-uterine device (IUD) and withdrawal. Table 8.3 presents percentages of youth reporting awareness—spontaneously or on prompting—of condoms, oral contraceptives, emergency contraception, the IUD and withdrawal; and those spontaneously reporting awareness of such methods as sterilisation, implants, vaginal methods, injectables and herbal and other traditional methods. Also presented are percentages of respondents reporting correct specific knowledge of the five methods indicated above.
The vast majority of youth reported awareness (spontaneous or prompted) of at least one method of contraception and a similar range of youth were aware of at least one modern contraceptive method (97–98%). Differences in awareness of any method, specifically, any modern method, by sex, marital status and rural-urban residence of the respondent were muted. The most widely known spacing methods were condoms (reported by 94% and 69% of young men and women, respectively) and oral contraceptives (reported by 63–65%). Fewer youth reported awareness of emergency contraception (28% of young men and 18% of young women), the IUD (5% of young men and 22% of young women) or implants or injectables (3%). Terminal method awareness was not probed, even so, female sterilisation was spontaneously reported by 79% of young men and 93% of young women. Fewer young people, however, spontaneously reported awareness of male sterilisation—53% of young men and 44% of young women.
Compared to awareness of modern methods, awareness of traditional methods was reported by far fewer youth, with somewhat more young men than women reporting awareness (17% versus 10%). The most widely known traditional method was withdrawal, reported by 16% of young men and 7% of young women. Married youth were more likely than the unmarried to report awareness of at least one traditional method (32% versus 14% among young men and 14% versus 5% among young women). Rural-urban differences were generally narrow, except that
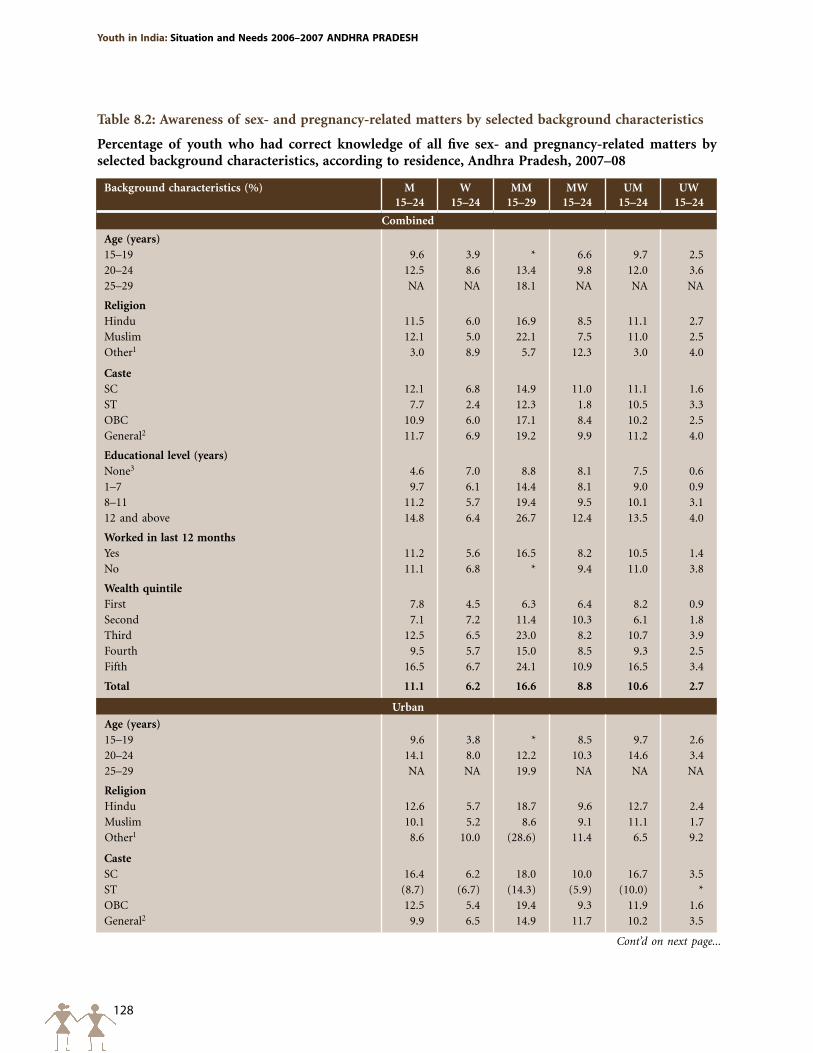
128
Youth in India: Situation and Needs 2006–2007 ANDHRA pRADESH
Cont’d on next page...
Table 8.2: Awareness of sex- and pregnancy-related matters by selected background characteristics
Percentage of youth who had correct knowledge of all five sex- and pregnancy-related matters by selected background characteristics, according to residence, Andhra Pradesh, 2007–08
Background characteristics (%) M15–24
W 15–24
MM 15–29
MW 15–24
UM 15–24
UW 15–24
Combined
Age (years)15–19 9.6 3.9 * 6.6 9.7 2.520–24 12.5 8.6 13.4 9.8 12.0 3.625–29 NA NA 18.1 NA NA NA
Religion Hindu 11.5 6.0 16.9 8.5 11.1 2.7Muslim 12.1 5.0 22.1 7.5 11.0 2.5Other1 3.0 8.9 5.7 12.3 3.0 4.0
CasteSC 12.1 6.8 14.9 11.0 11.1 1.6ST 7.7 2.4 12.3 1.8 10.5 3.3OBC 10.9 6.0 17.1 8.4 10.2 2.5General2 11.7 6.9 19.2 9.9 11.2 4.0
Educational level (years)None3 4.6 7.0 8.8 8.1 7.5 0.61–7 9.7 6.1 14.4 8.1 9.0 0.98–11 11.2 5.7 19.4 9.5 10.1 3.112 and above 14.8 6.4 26.7 12.4 13.5 4.0
Worked in last 12 monthsYes 11.2 5.6 16.5 8.2 10.5 1.4No 11.1 6.8 * 9.4 11.0 3.8
Wealth quintileFirst 7.8 4.5 6.3 6.4 8.2 0.9Second 7.1 7.2 11.4 10.3 6.1 1.8Third 12.5 6.5 23.0 8.2 10.7 3.9Fourth 9.5 5.7 15.0 8.5 9.3 2.5Fifth 16.5 6.7 24.1 10.9 16.5 3.4
Total 11.1 6.2 16.6 8.8 10.6 2.7
Urban
Age (years)15–19 9.6 3.8 * 8.5 9.7 2.620–24 14.1 8.0 12.2 10.3 14.6 3.425–29 NA NA 19.9 NA NA NA
Religion Hindu 12.6 5.7 18.7 9.6 12.7 2.4Muslim 10.1 5.2 8.6 9.1 11.1 1.7Other1 8.6 10.0 (28.6) 11.4 6.5 9.2
CasteSC 16.4 6.2 18.0 10.0 16.7 3.5ST (8.7) (6.7) (14.3) (5.9) (10.0) *OBC 12.5 5.4 19.4 9.3 11.9 1.6General2 9.9 6.5 14.9 11.7 10.2 3.5
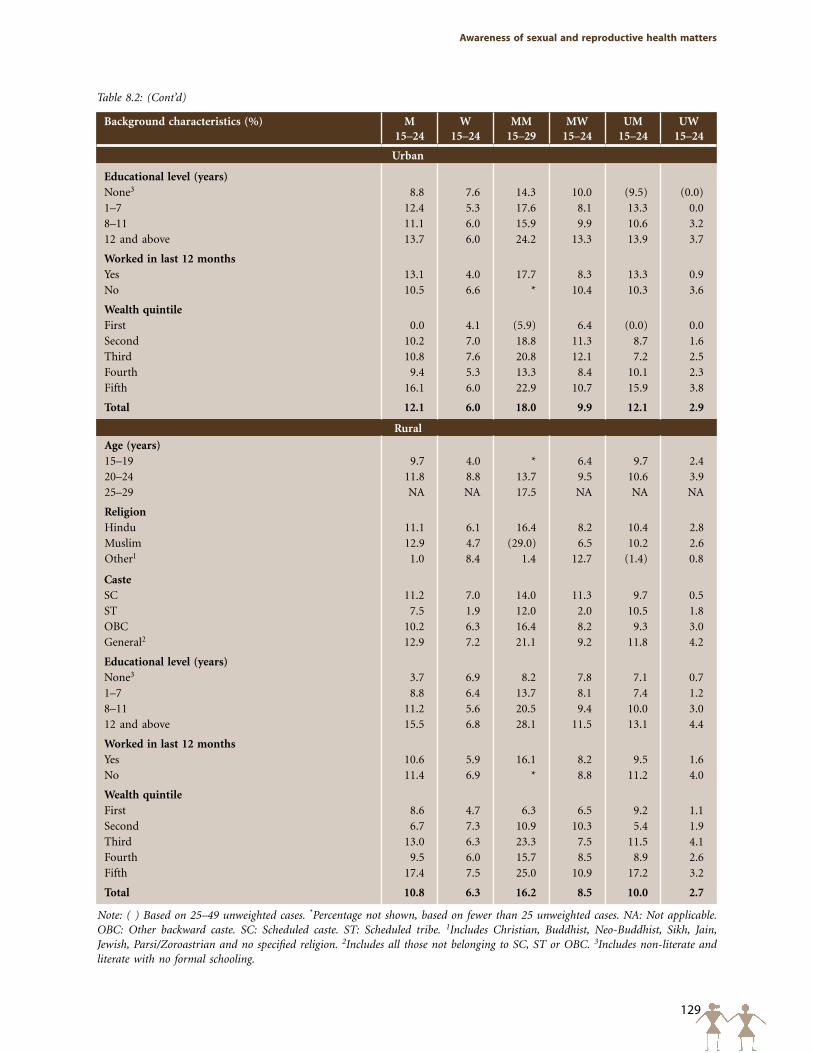
129
Awareness of sexual and reproductive health matters
Table 8.2: (Cont’d)
Background characteristics (%) M15–24
W 15–24
MM 15–29
MW 15–24
UM 15–24
UW 15–24
Urban
Educational level (years)None3 8.8 7.6 14.3 10.0 (9.5) (0.0)1–7 12.4 5.3 17.6 8.1 13.3 0.08–11 11.1 6.0 15.9 9.9 10.6 3.212 and above 13.7 6.0 24.2 13.3 13.9 3.7
Worked in last 12 monthsYes 13.1 4.0 17.7 8.3 13.3 0.9No 10.5 6.6 * 10.4 10.3 3.6
Wealth quintileFirst 0.0 4.1 (5.9) 6.4 (0.0) 0.0Second 10.2 7.0 18.8 11.3 8.7 1.6Third 10.8 7.6 20.8 12.1 7.2 2.5Fourth 9.4 5.3 13.3 8.4 10.1 2.3Fifth 16.1 6.0 22.9 10.7 15.9 3.8
Total 12.1 6.0 18.0 9.9 12.1 2.9
Rural
Age (years)15–19 9.7 4.0 * 6.4 9.7 2.420–24 11.8 8.8 13.7 9.5 10.6 3.925–29 NA NA 17.5 NA NA NA
Religion Hindu 11.1 6.1 16.4 8.2 10.4 2.8Muslim 12.9 4.7 (29.0) 6.5 10.2 2.6Other1 1.0 8.4 1.4 12.7 (1.4) 0.8
CasteSC 11.2 7.0 14.0 11.3 9.7 0.5ST 7.5 1.9 12.0 2.0 10.5 1.8OBC 10.2 6.3 16.4 8.2 9.3 3.0General2 12.9 7.2 21.1 9.2 11.8 4.2
Educational level (years)None3 3.7 6.9 8.2 7.8 7.1 0.71–7 8.8 6.4 13.7 8.1 7.4 1.28–11 11.2 5.6 20.5 9.4 10.0 3.012 and above 15.5 6.8 28.1 11.5 13.1 4.4
Worked in last 12 monthsYes 10.6 5.9 16.1 8.2 9.5 1.6No 11.4 6.9 * 8.8 11.2 4.0
Wealth quintileFirst 8.6 4.7 6.3 6.5 9.2 1.1Second 6.7 7.3 10.9 10.3 5.4 1.9Third 13.0 6.3 23.3 7.5 11.5 4.1Fourth 9.5 6.0 15.7 8.5 8.9 2.6Fifth 17.4 7.5 25.0 10.9 17.2 3.2
Total 10.8 6.3 16.2 8.5 10.0 2.7
Note: ( ) Based on 25–49 unweighted cases. *Percentage not shown, based on fewer than 25 unweighted cases. NA: Not applicable. OBC: Other backward caste. SC: Scheduled caste. ST: Scheduled tribe. 1Includes Christian, Buddhist, Neo-Buddhist, Sikh, Jain, Jewish, Parsi/Zoroastrian and no specified religion. 2Includes all those not belonging to SC, ST or OBC. 3Includes non-literate and literate with no formal schooling.
130
Youth in India: Situation and Needs 2006–2007 ANDHRA pRADESH
married young women in urban areas were somewhat more likely than their rural counterparts to report awareness of traditional methods (19% versus 12%).
Findings also show significant gender differences in terms of awareness of individual contraceptive methods; larger percentages of young men than women were aware of most methods (emergency contraceptive pills, condoms, male sterilisation and withdrawal). Young women, in contrast, were more likely than young men to be aware of IUDs and female sterilisation and about as likely to be aware of oral pills and implants or injectables. Differences by marital status were narrow among young men, except that more married than unmarried young men reported awareness of female sterilisation, male sterilisation and withdrawal. Among young women, the differences were more pronounced. More married than unmarried young women reported awareness of oral pills, IUDs, male sterilisation and withdrawal and conversely, more unmarried than married young women reported awareness of condoms. Rural-urban differences were modest among young men, except that those in urban areas were more likely than their rural counterparts to report awareness of emergency contraceptive pills and conversely less likely to report awareness of female sterilisation. The differences were pronounced among young women among whom those in urban areas were more likely than their rural counterparts to be aware of most methods.
In order to assess the extent to which youth had correct specific knowledge of contraceptive methods, and had not just heard of various methods, the Youth Study inquired whether youth were aware of the frequency with which oral contraceptives must be consumed (daily or weekly); the number of sex acts for which one condom could be used (one); the number of hours following sex that emergency contraceptive pills could be consumed (72 hours); where the IUD is placed (uterus); and when a man practising withdrawal should pull out of a woman (prior to ejaculation). Panel B of Table 8.3 presents percentages of youth reporting correct specific knowledge of these five methods.
Correct specific knowledge of at least one of these five methods was reported by four-fifths of young men and about one-third of young women. While differences by marital status and rural-urban differences were muted among young men, married and urban young women were more likely than their corresponding counterparts to report correct specific knowledge of at least one method (34% and 25% of married and unmarried young women, respectively; 37% and 27% of urban and rural young women, respectively).
Differentials in correct specific knowledge of contraceptive methods by sex, marital status and rural-urban residence are evident from findings presented in Table 8.3. In general, young men were more likely than young women to report correct specific knowledge of male-oriented methods such as condoms (80% versus 21%) and withdrawal (15% versus 4%). While somewhat more young women than men reported correct specific knowledge of the IUD (11% versus 2%), roughly similar percentages of young women and men reported correct specific knowledge of oral contraceptives (15–17%) and emergency contraceptive pills (7–9%). Differences by marital status were mild, except that married young men were more likely than their unmarried counterparts to report specific knowledge of withdrawal (30% versus 12%) and married young women were more likely than the unmarried to report specific knowledge of oral contraceptives (18% versus 10%) and the IUD (13% versus 8%) (see also Figure 8.2). Differences by marital status among young women were particularly evident in urban areas where somewhat larger proportions of married young women, reported correct specific knowledge of condoms and withdrawal, compared to their unmarried counterparts. Likewise, rural-urban differences were mild, except that urban youth were somewhat more likely than their rural counterparts to report correct specific knowledge of emergency contraceptive pills and urban young women, in addition, were more likely to report correct specific knowledge of condoms.
8.1.4 Condom-related perceptions
Among youth who reported awareness of condoms, the Youth Study probed perceptions regarding three specific aspects of this method, namely, whether condoms are a suitable method for preventing pregnancy, whether condoms can slip off a man and disappear inside a woman’s body and whether condoms reduce sexual pleasure. Findings, presented in Table 8.4, show that nine in ten young men (91%) and three in four young women (78%) agreed that condoms are a suitable method for preventing pregnancy. However, just 42% of young men and 13% of young
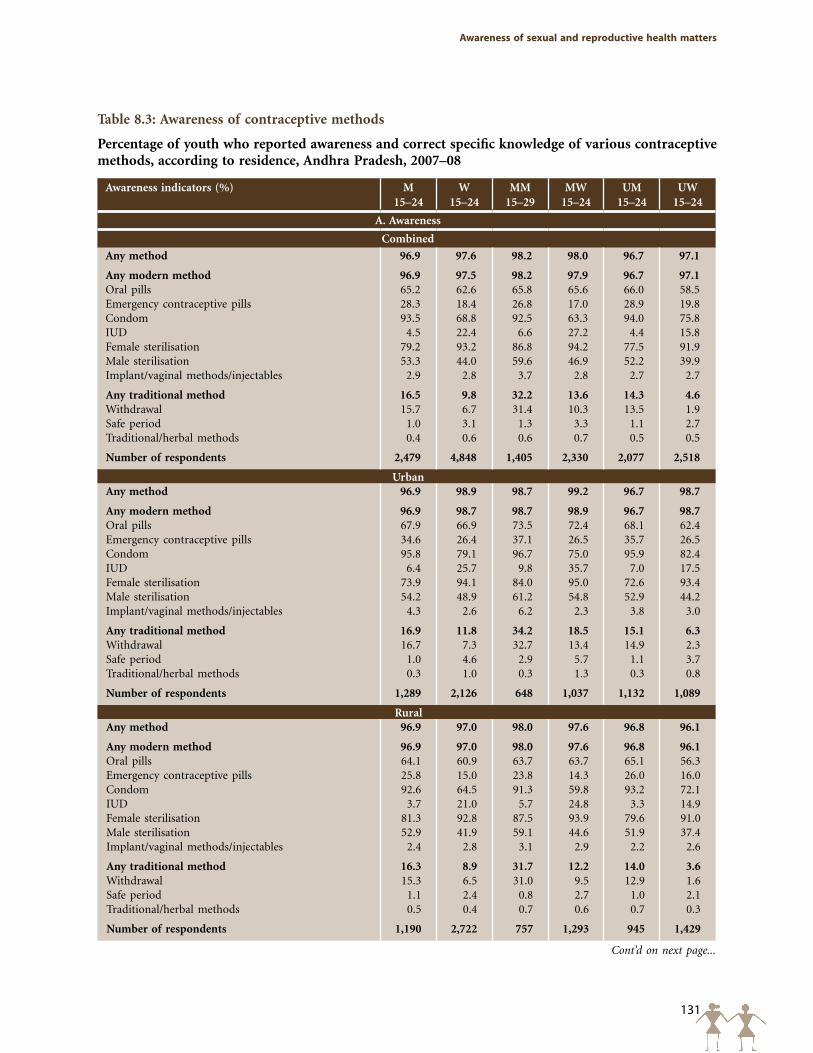
131
Awareness of sexual and reproductive health matters
Table 8.3: Awareness of contraceptive methods
Percentage of youth who reported awareness and correct specific knowledge of various contraceptive methods, according to residence, Andhra Pradesh, 2007–08
Awareness indicators (%) M15–24
W 15–24
MM 15–29
MW 15–24
UM 15–24
UW 15–24
A. Awareness
Combined
Any method 96.9 97.6 98.2 98.0 96.7 97.1
Any modern method 96.9 97.5 98.2 97.9 96.7 97.1Oral pills 65.2 62.6 65.8 65.6 66.0 58.5Emergency contraceptive pills 28.3 18.4 26.8 17.0 28.9 19.8Condom 93.5 68.8 92.5 63.3 94.0 75.8IUD 4.5 22.4 6.6 27.2 4.4 15.8Female sterilisation 79.2 93.2 86.8 94.2 77.5 91.9Male sterilisation 53.3 44.0 59.6 46.9 52.2 39.9Implant/vaginal methods/injectables 2.9 2.8 3.7 2.8 2.7 2.7
Any traditional method 16.5 9.8 32.2 13.6 14.3 4.6Withdrawal 15.7 6.7 31.4 10.3 13.5 1.9Safe period 1.0 3.1 1.3 3.3 1.1 2.7Traditional/herbal methods 0.4 0.6 0.6 0.7 0.5 0.5
Number of respondents 2,479 4,848 1,405 2,330 2,077 2,518
UrbanAny method 96.9 98.9 98.7 99.2 96.7 98.7
Any modern method 96.9 98.7 98.7 98.9 96.7 98.7Oral pills 67.9 66.9 73.5 72.4 68.1 62.4Emergency contraceptive pills 34.6 26.4 37.1 26.5 35.7 26.5Condom 95.8 79.1 96.7 75.0 95.9 82.4IUD 6.4 25.7 9.8 35.7 7.0 17.5Female sterilisation 73.9 94.1 84.0 95.0 72.6 93.4Male sterilisation 54.2 48.9 61.2 54.8 52.9 44.2Implant/vaginal methods/injectables 4.3 2.6 6.2 2.3 3.8 3.0
Any traditional method 16.9 11.8 34.2 18.5 15.1 6.3Withdrawal 16.7 7.3 32.7 13.4 14.9 2.3Safe period 1.0 4.6 2.9 5.7 1.1 3.7Traditional/herbal methods 0.3 1.0 0.3 1.3 0.3 0.8
Number of respondents 1,289 2,126 648 1,037 1,132 1,089
RuralAny method 96.9 97.0 98.0 97.6 96.8 96.1
Any modern method 96.9 97.0 98.0 97.6 96.8 96.1Oral pills 64.1 60.9 63.7 63.7 65.1 56.3Emergency contraceptive pills 25.8 15.0 23.8 14.3 26.0 16.0Condom 92.6 64.5 91.3 59.8 93.2 72.1IUD 3.7 21.0 5.7 24.8 3.3 14.9Female sterilisation 81.3 92.8 87.5 93.9 79.6 91.0Male sterilisation 52.9 41.9 59.1 44.6 51.9 37.4Implant/vaginal methods/injectables 2.4 2.8 3.1 2.9 2.2 2.6
Any traditional method 16.3 8.9 31.7 12.2 14.0 3.6Withdrawal 15.3 6.5 31.0 9.5 12.9 1.6Safe period 1.1 2.4 0.8 2.7 1.0 2.1Traditional/herbal methods 0.5 0.4 0.7 0.6 0.7 0.3
Number of respondents 1,190 2,722 757 1,293 945 1,429
Cont’d on next page...
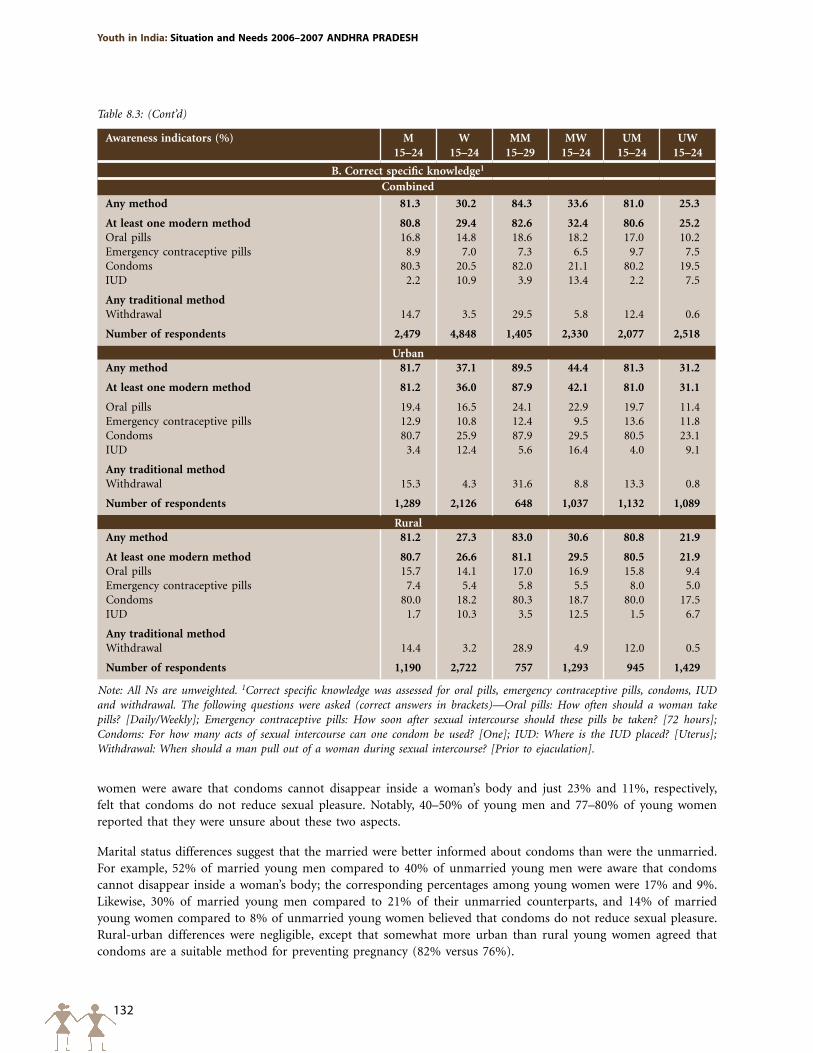
132
Youth in India: Situation and Needs 2006–2007 ANDHRA pRADESH
Awareness indicators (%) M15–24
W 15–24
MM 15–29
MW 15–24
UM 15–24
UW 15–24
B. Correct specific knowledge1
Combined
Any method 81.3 30.2 84.3 33.6 81.0 25.3
At least one modern method 80.8 29.4 82.6 32.4 80.6 25.2Oral pills 16.8 14.8 18.6 18.2 17.0 10.2Emergency contraceptive pills 8.9 7.0 7.3 6.5 9.7 7.5Condoms 80.3 20.5 82.0 21.1 80.2 19.5IUD 2.2 10.9 3.9 13.4 2.2 7.5
Any traditional methodWithdrawal 14.7 3.5 29.5 5.8 12.4 0.6
Number of respondents 2,479 4,848 1,405 2,330 2,077 2,518
UrbanAny method 81.7 37.1 89.5 44.4 81.3 31.2
At least one modern method 81.2 36.0 87.9 42.1 81.0 31.1
Oral pills 19.4 16.5 24.1 22.9 19.7 11.4Emergency contraceptive pills 12.9 10.8 12.4 9.5 13.6 11.8Condoms 80.7 25.9 87.9 29.5 80.5 23.1IUD 3.4 12.4 5.6 16.4 4.0 9.1
Any traditional methodWithdrawal 15.3 4.3 31.6 8.8 13.3 0.8
Number of respondents 1,289 2,126 648 1,037 1,132 1,089
RuralAny method 81.2 27.3 83.0 30.6 80.8 21.9
At least one modern method 80.7 26.6 81.1 29.5 80.5 21.9Oral pills 15.7 14.1 17.0 16.9 15.8 9.4Emergency contraceptive pills 7.4 5.4 5.8 5.5 8.0 5.0Condoms 80.0 18.2 80.3 18.7 80.0 17.5IUD 1.7 10.3 3.5 12.5 1.5 6.7
Any traditional methodWithdrawal 14.4 3.2 28.9 4.9 12.0 0.5
Number of respondents 1,190 2,722 757 1,293 945 1,429
Note: All Ns are unweighted. 1Correct specific knowledge was assessed for oral pills, emergency contraceptive pills, condoms, IUD and withdrawal. The following questions were asked (correct answers in brackets)—Oral pills: How often should a woman take pills? [Daily/Weekly]; Emergency contraceptive pills: How soon after sexual intercourse should these pills be taken? [72 hours]; Condoms: For how many acts of sexual intercourse can one condom be used? [One]; IUD: Where is the IUD placed? [Uterus]; Withdrawal: When should a man pull out of a woman during sexual intercourse? [Prior to ejaculation].
Table 8.3: (Cont’d)
women were aware that condoms cannot disappear inside a woman’s body and just 23% and 11%, respectively, felt that condoms do not reduce sexual pleasure. Notably, 40–50% of young men and 77–80% of young women reported that they were unsure about these two aspects.
Marital status differences suggest that the married were better informed about condoms than were the unmarried. For example, 52% of married young men compared to 40% of unmarried young men were aware that condoms cannot disappear inside a woman’s body; the corresponding percentages among young women were 17% and 9%. Likewise, 30% of married young men compared to 21% of their unmarried counterparts, and 14% of married young women compared to 8% of unmarried young women believed that condoms do not reduce sexual pleasure. Rural-urban differences were negligible, except that somewhat more urban than rural young women agreed that condoms are a suitable method for preventing pregnancy (82% versus 76%).
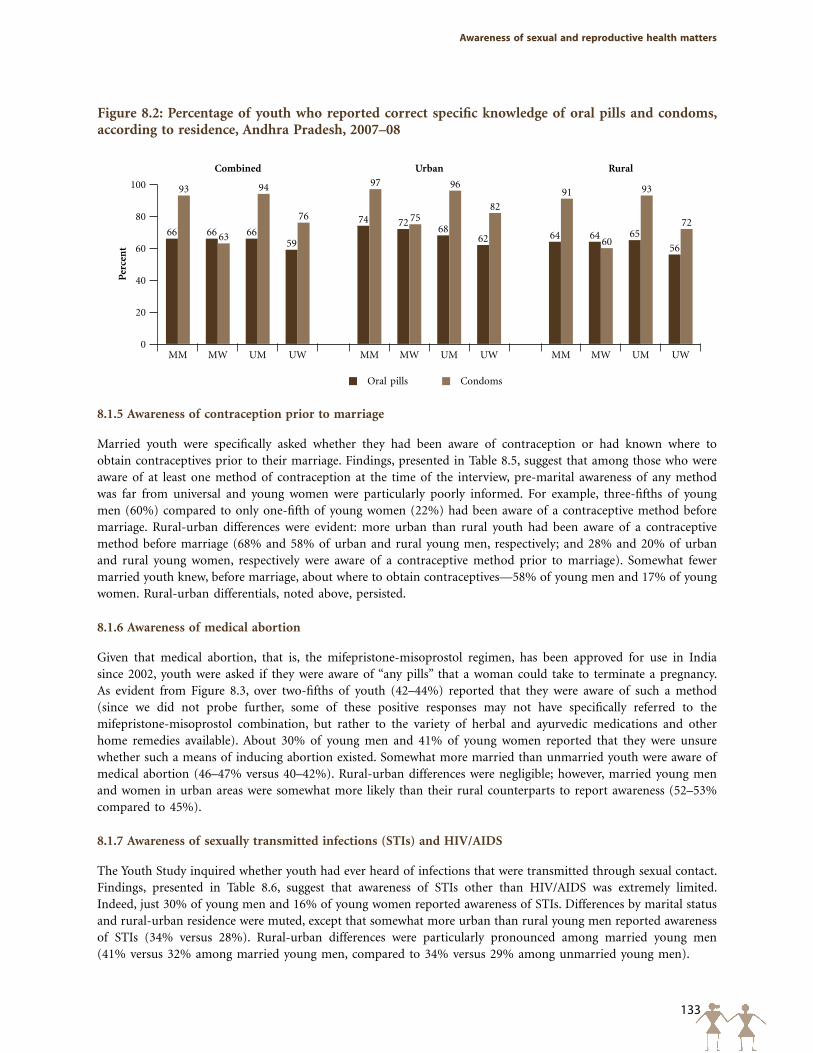
133
Awareness of sexual and reproductive health matters
Figure 8.2: Percentage of youth who reported correct specific knowledge of oral pills and condoms, according to residence, Andhra Pradesh, 2007–08
Per
cen
t
100
80
60
40
20
0
66 66 6659
74 7268
62 64 64 65
56
93
63
94
76
97
75
96
82
91
60
93
72
Combined Urban Rural
MM MM MMMW MW MWUM UM UMUW UW UW
Oral pills Condoms
8.1.5 Awareness of contraception prior to marriage
Married youth were specifically asked whether they had been aware of contraception or had known where to obtain contraceptives prior to their marriage. Findings, presented in Table 8.5, suggest that among those who were aware of at least one method of contraception at the time of the interview, pre-marital awareness of any method was far from universal and young women were particularly poorly informed. For example, three-fifths of young men (60%) compared to only one-fifth of young women (22%) had been aware of a contraceptive method before marriage. Rural-urban differences were evident: more urban than rural youth had been aware of a contraceptive method before marriage (68% and 58% of urban and rural young men, respectively; and 28% and 20% of urban and rural young women, respectively were aware of a contraceptive method prior to marriage). Somewhat fewer married youth knew, before marriage, about where to obtain contraceptives—58% of young men and 17% of young women. Rural-urban differentials, noted above, persisted.
8.1.6 Awareness of medical abortion
Given that medical abortion, that is, the mifepristone-misoprostol regimen, has been approved for use in India since 2002, youth were asked if they were aware of “any pills” that a woman could take to terminate a pregnancy. As evident from Figure 8.3, over two-fifths of youth (42–44%) reported that they were aware of such a method (since we did not probe further, some of these positive responses may not have specifically referred to the mifepristone-misoprostol combination, but rather to the variety of herbal and ayurvedic medications and other home remedies available). About 30% of young men and 41% of young women reported that they were unsure whether such a means of inducing abortion existed. Somewhat more married than unmarried youth were aware of medical abortion (46–47% versus 40–42%). Rural-urban differences were negligible; however, married young men and women in urban areas were somewhat more likely than their rural counterparts to report awareness (52–53% compared to 45%).
8.1.7 Awareness of sexually transmitted infections (STIs) and HIV/AIDS
The Youth Study inquired whether youth had ever heard of infections that were transmitted through sexual contact. Findings, presented in Table 8.6, suggest that awareness of STIs other than HIV/AIDS was extremely limited. Indeed, just 30% of young men and 16% of young women reported awareness of STIs. Differences by marital status and rural-urban residence were muted, except that somewhat more urban than rural young men reported awareness of STIs (34% versus 28%). Rural-urban differences were particularly pronounced among married young men (41% versus 32% among married young men, compared to 34% versus 29% among unmarried young men).
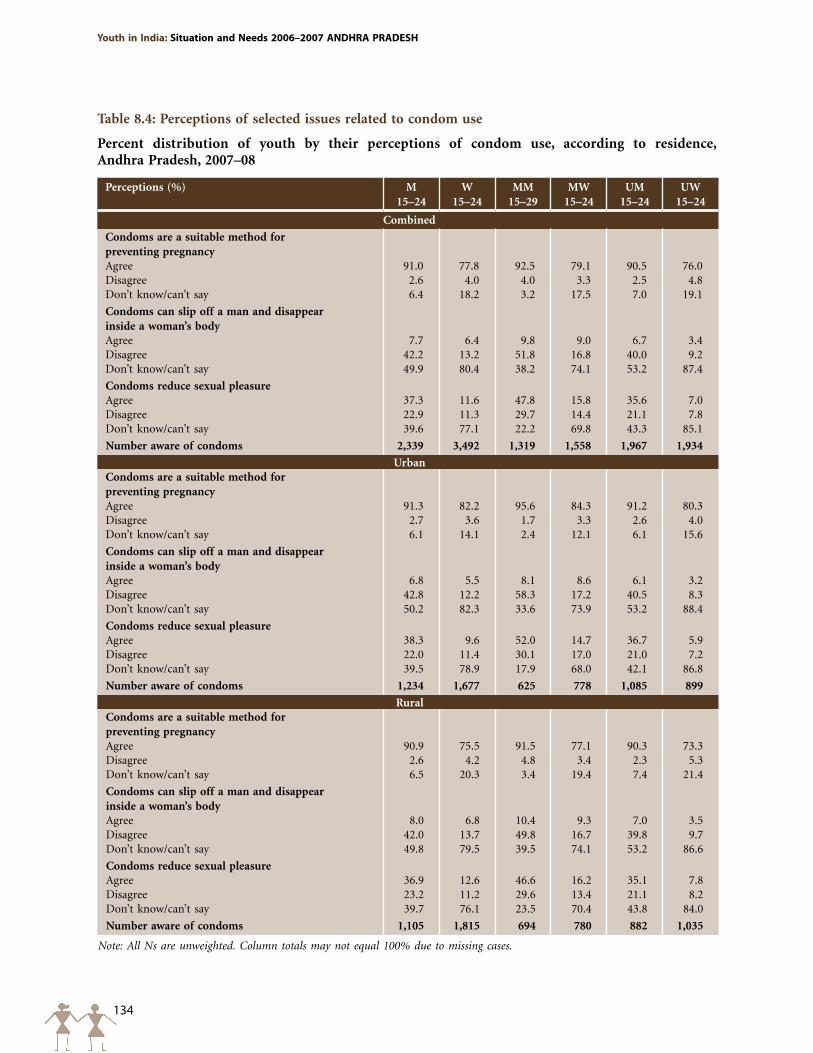
134
Youth in India: Situation and Needs 2006–2007 ANDHRA pRADESH
Table 8.4: Perceptions of selected issues related to condom use
Percent distribution of youth by their perceptions of condom use, according to residence, Andhra Pradesh, 2007–08
Perceptions (%) M15–24
W 15–24
MM 15–29
MW 15–24
UM 15–24
UW 15–24
Combined
Condoms are a suitable method for preventing pregnancy Agree 91.0 77.8 92.5 79.1 90.5 76.0Disagree 2.6 4.0 4.0 3.3 2.5 4.8Don’t know/can’t say 6.4 18.2 3.2 17.5 7.0 19.1
Condoms can slip off a man and disappear inside a woman’s bodyAgree 7.7 6.4 9.8 9.0 6.7 3.4Disagree 42.2 13.2 51.8 16.8 40.0 9.2Don’t know/can’t say 49.9 80.4 38.2 74.1 53.2 87.4
Condoms reduce sexual pleasure Agree 37.3 11.6 47.8 15.8 35.6 7.0Disagree 22.9 11.3 29.7 14.4 21.1 7.8Don’t know/can’t say 39.6 77.1 22.2 69.8 43.3 85.1
Number aware of condoms 2,339 3,492 1,319 1,558 1,967 1,934
UrbanCondoms are a suitable method for preventing pregnancy Agree 91.3 82.2 95.6 84.3 91.2 80.3Disagree 2.7 3.6 1.7 3.3 2.6 4.0Don’t know/can’t say 6.1 14.1 2.4 12.1 6.1 15.6
Condoms can slip off a man and disappear inside a woman’s bodyAgree 6.8 5.5 8.1 8.6 6.1 3.2Disagree 42.8 12.2 58.3 17.2 40.5 8.3Don’t know/can’t say 50.2 82.3 33.6 73.9 53.2 88.4
Condoms reduce sexual pleasure Agree 38.3 9.6 52.0 14.7 36.7 5.9Disagree 22.0 11.4 30.1 17.0 21.0 7.2Don’t know/can’t say 39.5 78.9 17.9 68.0 42.1 86.8
Number aware of condoms 1,234 1,677 625 778 1,085 899
RuralCondoms are a suitable method for preventing pregnancy Agree 90.9 75.5 91.5 77.1 90.3 73.3Disagree 2.6 4.2 4.8 3.4 2.3 5.3Don’t know/can’t say 6.5 20.3 3.4 19.4 7.4 21.4
Condoms can slip off a man and disappear inside a woman’s bodyAgree 8.0 6.8 10.4 9.3 7.0 3.5Disagree 42.0 13.7 49.8 16.7 39.8 9.7Don’t know/can’t say 49.8 79.5 39.5 74.1 53.2 86.6
Condoms reduce sexual pleasure Agree 36.9 12.6 46.6 16.2 35.1 7.8Disagree 23.2 11.2 29.6 13.4 21.1 8.2Don’t know/can’t say 39.7 76.1 23.5 70.4 43.8 84.0
Number aware of condoms 1,105 1,815 694 780 882 1,035
Note: All Ns are unweighted. Column totals may not equal 100% due to missing cases.
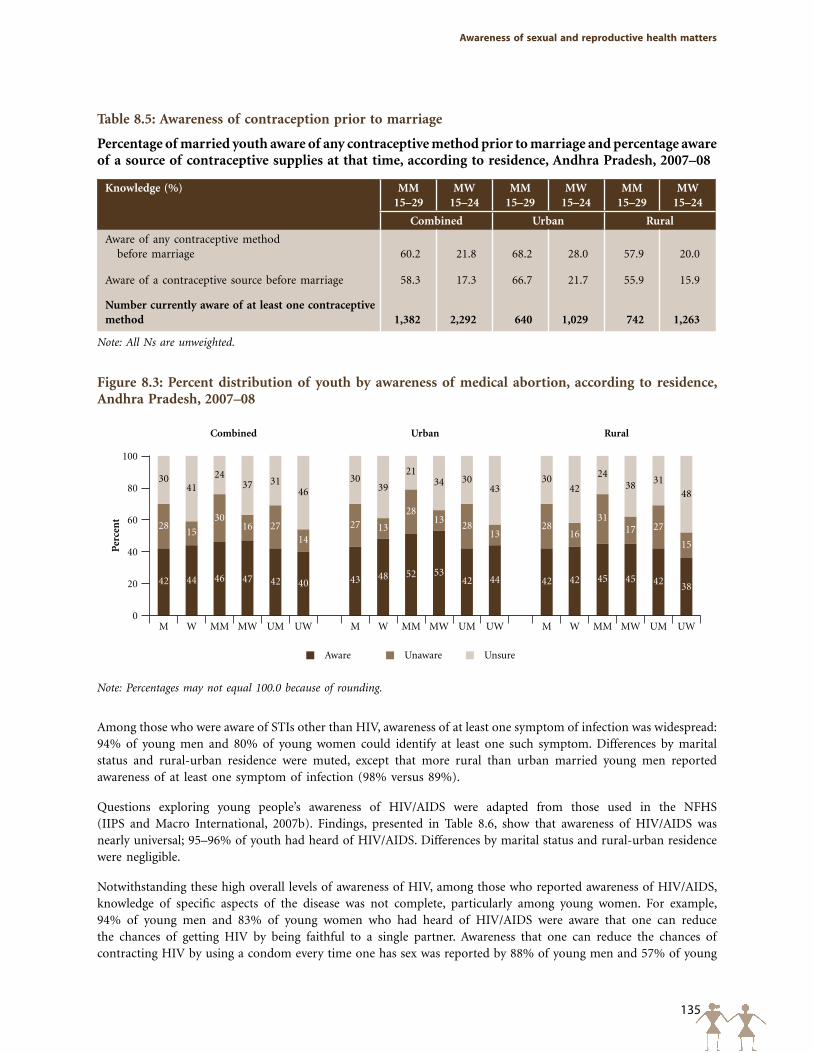
135
Awareness of sexual and reproductive health matters
Table 8.5: Awareness of contraception prior to marriage
Percentage of married youth aware of any contraceptive method prior to marriage and percentage aware of a source of contraceptive supplies at that time, according to residence, Andhra Pradesh, 2007–08
Knowledge (%) MM15–29
MW15–24
MM15–29
MW15–24
MM15–29
MW15–24
Combined Urban Rural
Aware of any contraceptive method before marriage 60.2 21.8 68.2 28.0 57.9 20.0
Aware of a contraceptive source before marriage 58.3 17.3 66.7 21.7 55.9 15.9
Number currently aware of at least one contraceptive method 1,382 2,292 640 1,029 742 1,263
Note: All Ns are unweighted.
Among those who were aware of STIs other than HIV, awareness of at least one symptom of infection was widespread: 94% of young men and 80% of young women could identify at least one such symptom. Differences by marital status and rural-urban residence were muted, except that more rural than urban married young men reported awareness of at least one symptom of infection (98% versus 89%).
Questions exploring young people’s awareness of HIV/AIDS were adapted from those used in the NFHS (IIPS and Macro International, 2007b). Findings, presented in Table 8.6, show that awareness of HIV/AIDS was nearly universal; 95–96% of youth had heard of HIV/AIDS. Differences by marital status and rural-urban residence were negligible.
Notwithstanding these high overall levels of awareness of HIV, among those who reported awareness of HIV/AIDS, knowledge of specific aspects of the disease was not complete, particularly among young women. For example, 94% of young men and 83% of young women who had heard of HIV/AIDS were aware that one can reduce the chances of getting HIV by being faithful to a single partner. Awareness that one can reduce the chances of contracting HIV by using a condom every time one has sex was reported by 88% of young men and 57% of young
Figure 8.3: Percent distribution of youth by awareness of medical abortion, according to residence, Andhra Pradesh, 2007–08
Per
cen
t
100
80
60
40
20
0
44 4846 524753
45
30 30 3041 39 42
24 21 2437 34 3831 30 31
46 43 48
Combined Urban Rural
M M MW W WMM MM MMMW MW MWUM UM UMUW UW UW
Aware Unaware Unsure
28 27 2815 13
16
3028
3116
131727 28 27
14 1315
Note: Percentages may not equal 100.0 because of rounding.
42 42 40 43 42 44 42 42 45 42 38
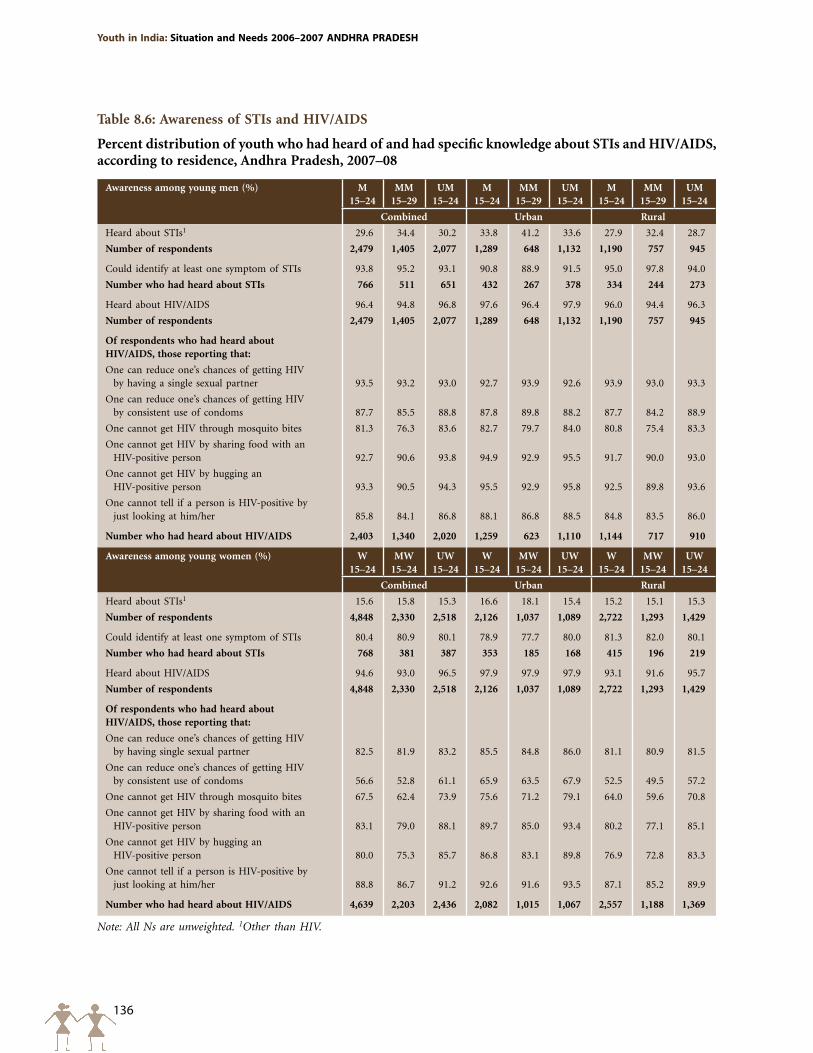
136
Youth in India: Situation and Needs 2006–2007 ANDHRA pRADESH
Table 8.6: Awareness of STIs and HIV/AIDS
Percent distribution of youth who had heard of and had specific knowledge about STIs and HIV/AIDS, according to residence, Andhra Pradesh, 2007–08
Awareness among young men (%) M15–24
MM15–29
UM15–24
M15–24
MM15–29
UM15–24
M15–24
MM15–29
UM15–24
Combined Urban Rural
Heard about STIs1 29.6 34.4 30.2 33.8 41.2 33.6 27.9 32.4 28.7
Number of respondents 2,479 1,405 2,077 1,289 648 1,132 1,190 757 945
Could identify at least one symptom of STIs 93.8 95.2 93.1 90.8 88.9 91.5 95.0 97.8 94.0
Number who had heard about STIs 766 511 651 432 267 378 334 244 273
Heard about HIV/AIDS 96.4 94.8 96.8 97.6 96.4 97.9 96.0 94.4 96.3
Number of respondents 2,479 1,405 2,077 1,289 648 1,132 1,190 757 945
Of respondents who had heard about HIV/AIDS, those reporting that:
One can reduce one’s chances of getting HIV by having a single sexual partner 93.5 93.2 93.0 92.7 93.9 92.6 93.9 93.0 93.3
One can reduce one’s chances of getting HIV by consistent use of condoms 87.7 85.5 88.8 87.8 89.8 88.2 87.7 84.2 88.9
One cannot get HIV through mosquito bites 81.3 76.3 83.6 82.7 79.7 84.0 80.8 75.4 83.3
One cannot get HIV by sharing food with an HIV-positive person 92.7 90.6 93.8 94.9 92.9 95.5 91.7 90.0 93.0
One cannot get HIV by hugging an HIV-positive person 93.3 90.5 94.3 95.5 92.9 95.8 92.5 89.8 93.6
One cannot tell if a person is HIV-positive by just looking at him/her 85.8 84.1 86.8 88.1 86.8 88.5 84.8 83.5 86.0
Number who had heard about HIV/AIDS 2,403 1,340 2,020 1,259 623 1,110 1,144 717 910
Awareness among young women (%) W15–24
MW15–24
UW15–24
W15–24
MW15–24
UW15–24
W15–24
MW15–24
UW15–24
Combined Urban Rural
Heard about STIs1 15.6 15.8 15.3 16.6 18.1 15.4 15.2 15.1 15.3
Number of respondents 4,848 2,330 2,518 2,126 1,037 1,089 2,722 1,293 1,429
Could identify at least one symptom of STIs 80.4 80.9 80.1 78.9 77.7 80.0 81.3 82.0 80.1
Number who had heard about STIs 768 381 387 353 185 168 415 196 219
Heard about HIV/AIDS 94.6 93.0 96.5 97.9 97.9 97.9 93.1 91.6 95.7
Number of respondents 4,848 2,330 2,518 2,126 1,037 1,089 2,722 1,293 1,429
Of respondents who had heard about HIV/AIDS, those reporting that:
One can reduce one’s chances of getting HIV by having single sexual partner 82.5 81.9 83.2 85.5 84.8 86.0 81.1 80.9 81.5
One can reduce one’s chances of getting HIV by consistent use of condoms 56.6 52.8 61.1 65.9 63.5 67.9 52.5 49.5 57.2
One cannot get HIV through mosquito bites 67.5 62.4 73.9 75.6 71.2 79.1 64.0 59.6 70.8
One cannot get HIV by sharing food with an HIV-positive person 83.1 79.0 88.1 89.7 85.0 93.4 80.2 77.1 85.1
One cannot get HIV by hugging an HIV-positive person 80.0 75.3 85.7 86.8 83.1 89.8 76.9 72.8 83.3
One cannot tell if a person is HIV-positive by just looking at him/her 88.8 86.7 91.2 92.6 91.6 93.5 87.1 85.2 89.9
Number who had heard about HIV/AIDS 4,639 2,203 2,436 2,082 1,015 1,067 2,557 1,188 1,369
Note: All Ns are unweighted. 1Other than HIV.
137
Awareness of sexual and reproductive health matters
women. Differences by marital status were narrow, except that somewhat more unmarried than married young women reported awareness of consistent condom use as a way of reducing HIV transmission (61% versus 53%). Rural-urban differences were muted among young men, but notable among young women among whom larger proportions of those in urban than rural areas reported awareness of consistent condom use as a way of reducing HIV transmission (66% versus 53%).
Findings show, moreover, that rejection of common misconceptions about modes of transmission was far from universal, and that in several instances, more young men than young women rejected these misconceptions. For example, among those aware of HIV/AIDS, 86–93% of young men and 80–89% of young women were correctly aware that one cannot get HIV by sharing food with or hugging an infected person and that one cannot tell if a person is HIV-positive by just looking at him/her. As many as 81% of young men compared to 68% of young women believed, moreover, that one cannot acquire HIV through mosquito bites. Misconceptions about modes of transmission were somewhat more likely to be rejected by unmarried than married youth, particularly among young women. For example, 84% of unmarried young men compared to 76% of married young men were aware that one cannot acquire HIV through mosquito bites; the corresponding percentages among young women were 74% and 62%, respectively. Rural-urban differences suggest that more urban than rural youth, particularly young women, rejected these misconceptions.
8.1.8 Comprehensive awareness of HIV/AIDS
We measure comprehensive awareness of HIV/AIDS on the basis of information obtained regarding respondents’ knowledge of HIV prevention and transmission. Comprehensive awareness is defined as knowledge of two ways of preventing HIV (specifically, condom use and single partner relations), rejection of common misconceptions about HIV transmission (namely, that HIV can be transmitted through mosquito bites, sharing food or hugging) and awareness that one cannot tell by looking at a person whether he or she has HIV. Findings are presented in Table 8.7 and suggest limited comprehensive awareness of HIV/AIDS, particularly among young women. For example, young men were almost twice as likely as young women to report comprehensive awareness (62% versus 33%). More unmarried than married youth reported comprehensive awareness; for example, 64% of unmarried young men compared to 55% married young men, and 41% of unmarried young women compared to 27% married young women, respectively, reported so. Likewise, urban youth, particularly young women, were more likely to report comprehensive awareness than rural youth (66% versus 60% among young men and 46% versus 28% among young women).
Differences in comprehensive awareness of HIV/AIDS by age were narrow for the overall sample; however, when the married and unmarried were analysed separately, a positive association was observed, particularly among both the married and the unmarried in urban areas and among unmarried young women, irrespective of rural-urban residence. Differences by religion suggest that Hindu and Muslim young men were more likely than those belonging to other religions to report comprehensive awareness of HIV/AIDS; however among young women, the association was less consistent. Caste wise differences indicate that comprehensive awareness of HIV/AIDS was most limited among youth belonging to scheduled tribes and most widespread among those belonging to general castes.
Comprehensive awareness of HIV/AIDS was greater among better educated and economically better off youth than others in all groups of youth. For example, as shown in Figure 8.4a, 33% of married young men with no formal education displayed comprehensive HIV/AIDS awareness compared to 87% of those with 12 or more years of education; comprehensive HIV/AIDS awareness was reported likewise by just 9% of married young women with no education compared to 63% of those with 12 or more years of education. Likewise, Figure 8.4b shows that comprehensive awareness increased from 54% among unmarried young men in the poorest (first) wealth quintile to 74% among those in the wealthiest (fifth) quintile, and from 22% to 55%, respectively, among unmarried young women.
Differentials with regard to religion were mild among young women; however, more Muslim and Hindu young men reported comprehensive awareness of HIV/AIDS than did those from other religions (62% and 53%, respectively). Caste-wise differences indicate that youth from scheduled tribes were considerably less likely to report comprehensive awareness than were those from other castes (50% and 61–65% respectively, among young men; 22% and 31–42%,
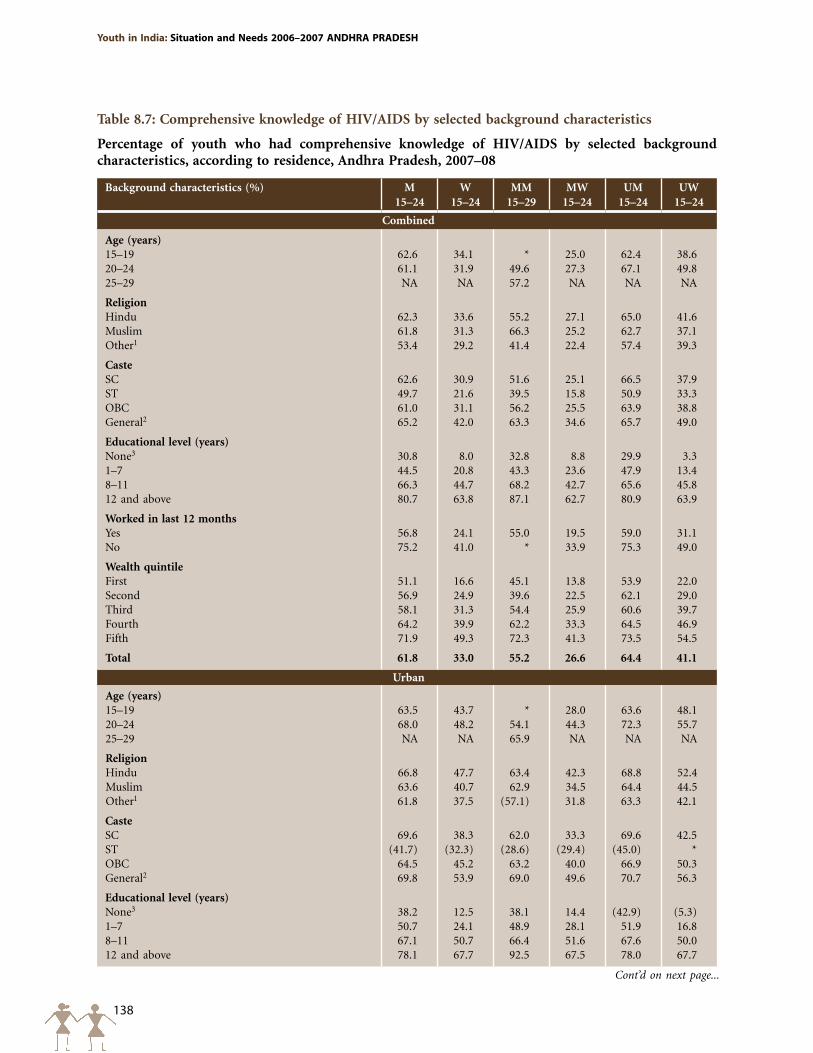
138
Youth in India: Situation and Needs 2006–2007 ANDHRA pRADESH
Table 8.7: Comprehensive knowledge of HIV/AIDS by selected background characteristics
Percentage of youth who had comprehensive knowledge of HIV/AIDS by selected background characteristics, according to residence, Andhra Pradesh, 2007–08
Background characteristics (%) M15–24
W 15–24
MM 15–29
MW 15–24
UM 15–24
UW 15–24
Combined
Age (years)15–19 62.6 34.1 * 25.0 62.4 38.620–24 61.1 31.9 49.6 27.3 67.1 49.825–29 NA NA 57.2 NA NA NA
Religion Hindu 62.3 33.6 55.2 27.1 65.0 41.6Muslim 61.8 31.3 66.3 25.2 62.7 37.1Other1 53.4 29.2 41.4 22.4 57.4 39.3
CasteSC 62.6 30.9 51.6 25.1 66.5 37.9ST 49.7 21.6 39.5 15.8 50.9 33.3OBC 61.0 31.1 56.2 25.5 63.9 38.8General2 65.2 42.0 63.3 34.6 65.7 49.0
Educational level (years)None3 30.8 8.0 32.8 8.8 29.9 3.31–7 44.5 20.8 43.3 23.6 47.9 13.48–11 66.3 44.7 68.2 42.7 65.6 45.812 and above 80.7 63.8 87.1 62.7 80.9 63.9
Worked in last 12 monthsYes 56.8 24.1 55.0 19.5 59.0 31.1No 75.2 41.0 * 33.9 75.3 49.0
Wealth quintileFirst 51.1 16.6 45.1 13.8 53.9 22.0Second 56.9 24.9 39.6 22.5 62.1 29.0Third 58.1 31.3 54.4 25.9 60.6 39.7Fourth 64.2 39.9 62.2 33.3 64.5 46.9Fifth 71.9 49.3 72.3 41.3 73.5 54.5
Total 61.8 33.0 55.2 26.6 64.4 41.1
Urban
Age (years)15–19 63.5 43.7 * 28.0 63.6 48.120–24 68.0 48.2 54.1 44.3 72.3 55.725–29 NA NA 65.9 NA NA NA
Religion Hindu 66.8 47.7 63.4 42.3 68.8 52.4Muslim 63.6 40.7 62.9 34.5 64.4 44.5Other1 61.8 37.5 (57.1) 31.8 63.3 42.1
CasteSC 69.6 38.3 62.0 33.3 69.6 42.5ST (41.7) (32.3) (28.6) (29.4) (45.0) *OBC 64.5 45.2 63.2 40.0 66.9 50.3General2 69.8 53.9 69.0 49.6 70.7 56.3
Educational level (years)None3 38.2 12.5 38.1 14.4 (42.9) (5.3)1–7 50.7 24.1 48.9 28.1 51.9 16.88–11 67.1 50.7 66.4 51.6 67.6 50.012 and above 78.1 67.7 92.5 67.5 78.0 67.7
Cont’d on next page...
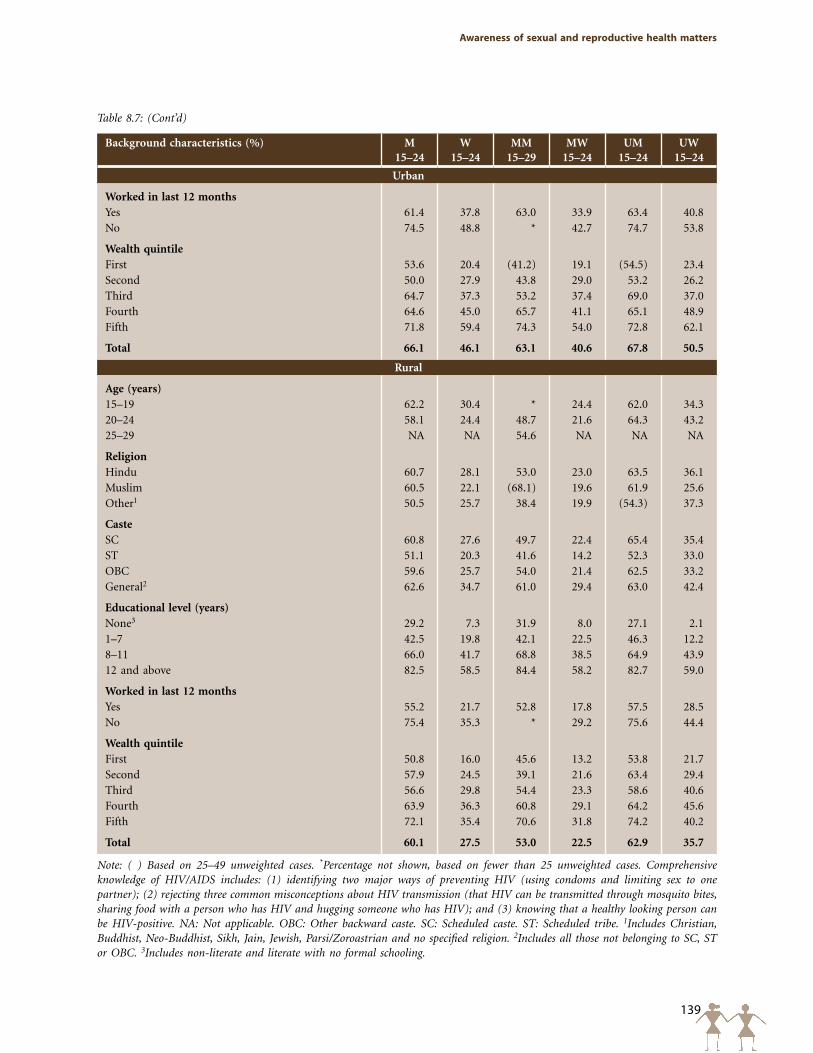
139
Awareness of sexual and reproductive health matters
Background characteristics (%) M15–24
W 15–24
MM 15–29
MW 15–24
UM 15–24
UW 15–24
Urban
Worked in last 12 monthsYes 61.4 37.8 63.0 33.9 63.4 40.8No 74.5 48.8 * 42.7 74.7 53.8
Wealth quintileFirst 53.6 20.4 (41.2) 19.1 (54.5) 23.4Second 50.0 27.9 43.8 29.0 53.2 26.2Third 64.7 37.3 53.2 37.4 69.0 37.0Fourth 64.6 45.0 65.7 41.1 65.1 48.9Fifth 71.8 59.4 74.3 54.0 72.8 62.1
Total 66.1 46.1 63.1 40.6 67.8 50.5
Rural
Age (years)15–19 62.2 30.4 * 24.4 62.0 34.320–24 58.1 24.4 48.7 21.6 64.3 43.225–29 NA NA 54.6 NA NA NA
Religion Hindu 60.7 28.1 53.0 23.0 63.5 36.1Muslim 60.5 22.1 (68.1) 19.6 61.9 25.6Other1 50.5 25.7 38.4 19.9 (54.3) 37.3
CasteSC 60.8 27.6 49.7 22.4 65.4 35.4ST 51.1 20.3 41.6 14.2 52.3 33.0OBC 59.6 25.7 54.0 21.4 62.5 33.2General2 62.6 34.7 61.0 29.4 63.0 42.4
Educational level (years)None3 29.2 7.3 31.9 8.0 27.1 2.11–7 42.5 19.8 42.1 22.5 46.3 12.28–11 66.0 41.7 68.8 38.5 64.9 43.912 and above 82.5 58.5 84.4 58.2 82.7 59.0
Worked in last 12 monthsYes 55.2 21.7 52.8 17.8 57.5 28.5No 75.4 35.3 * 29.2 75.6 44.4
Wealth quintileFirst 50.8 16.0 45.6 13.2 53.8 21.7Second 57.9 24.5 39.1 21.6 63.4 29.4Third 56.6 29.8 54.4 23.3 58.6 40.6Fourth 63.9 36.3 60.8 29.1 64.2 45.6Fifth 72.1 35.4 70.6 31.8 74.2 40.2
Total 60.1 27.5 53.0 22.5 62.9 35.7
Note: ( ) Based on 25–49 unweighted cases. *Percentage not shown, based on fewer than 25 unweighted cases. Comprehensive knowledge of HIV/AIDS includes: (1) identifying two major ways of preventing HIV (using condoms and limiting sex to one partner); (2) rejecting three common misconceptions about HIV transmission (that HIV can be transmitted through mosquito bites, sharing food with a person who has HIV and hugging someone who has HIV); and (3) knowing that a healthy looking person can be HIV-positive. NA: Not applicable. OBC: Other backward caste. SC: Scheduled caste. ST: Scheduled tribe. 1Includes Christian, Buddhist, Neo-Buddhist, Sikh, Jain, Jewish, Parsi/Zoroastrian and no specified religion. 2Includes all those not belonging to SC, ST or OBC. 3Includes non-literate and literate with no formal schooling.
Table 8.7: (Cont’d)
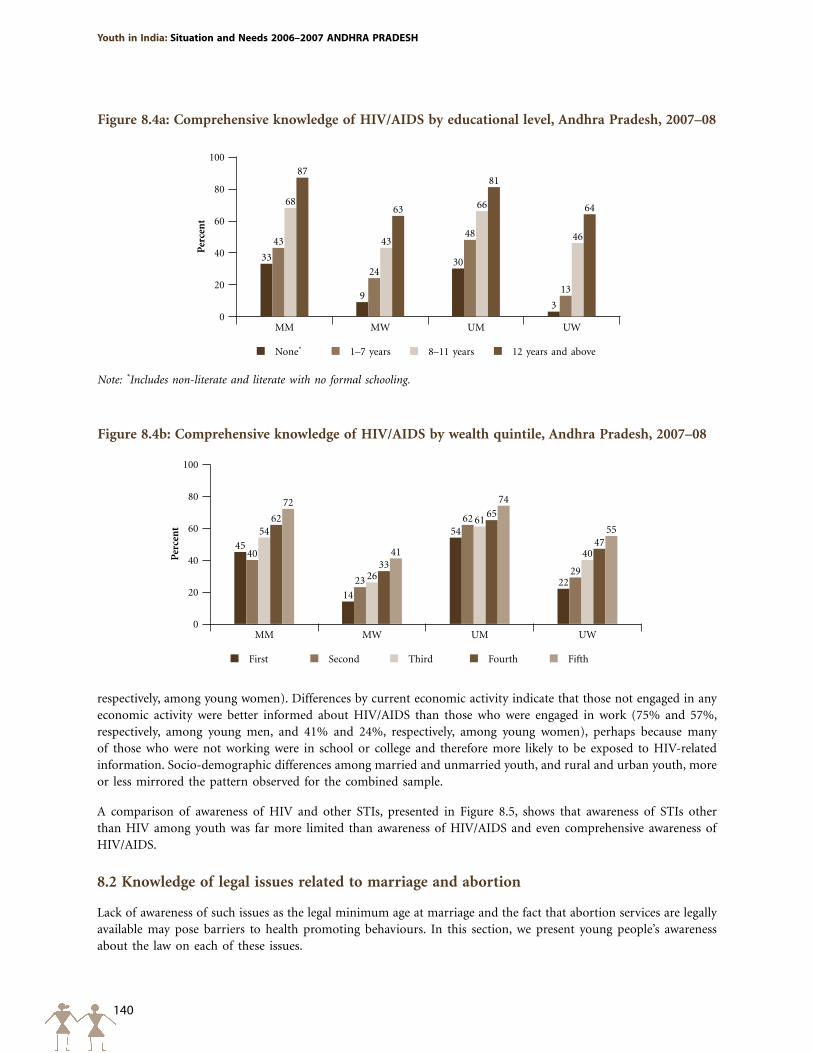
140
Youth in India: Situation and Needs 2006–2007 ANDHRA pRADESH
Figure 8.4a: Comprehensive knowledge of HIV/AIDS by educational level, Andhra Pradesh, 2007–08
Note: *Includes non-literate and literate with no formal schooling.
None* 1–7 years 8–11 years 12 years and above
Per
cen
t
100
80
60
40
20
0
33
43
68
87
9
24
43
63
30
48
66
81
3
13
46
64
MM MW UM UW
Figure 8.4b: Comprehensive knowledge of HIV/AIDS by wealth quintile, Andhra Pradesh, 2007–08
First Second Third Fourth Fifth
Per
cen
t
100
80
60
40
20
0
45
14
54
22
40
23
62
29
54
26
61
40
62
33
65
47
72
41
74
55
MM MW UM UW
respectively, among young women). Differences by current economic activity indicate that those not engaged in any economic activity were better informed about HIV/AIDS than those who were engaged in work (75% and 57%, respectively, among young men, and 41% and 24%, respectively, among young women), perhaps because many of those who were not working were in school or college and therefore more likely to be exposed to HIV-related information. Socio-demographic differences among married and unmarried youth, and rural and urban youth, more or less mirrored the pattern observed for the combined sample.
A comparison of awareness of HIV and other STIs, presented in Figure 8.5, shows that awareness of STIs other than HIV among youth was far more limited than awareness of HIV/AIDS and even comprehensive awareness of HIV/AIDS.
8.2 Knowledge of legal issues related to marriage and abortion
Lack of awareness of such issues as the legal minimum age at marriage and the fact that abortion services are legally available may pose barriers to health promoting behaviours. In this section, we present young people’s awareness about the law on each of these issues.
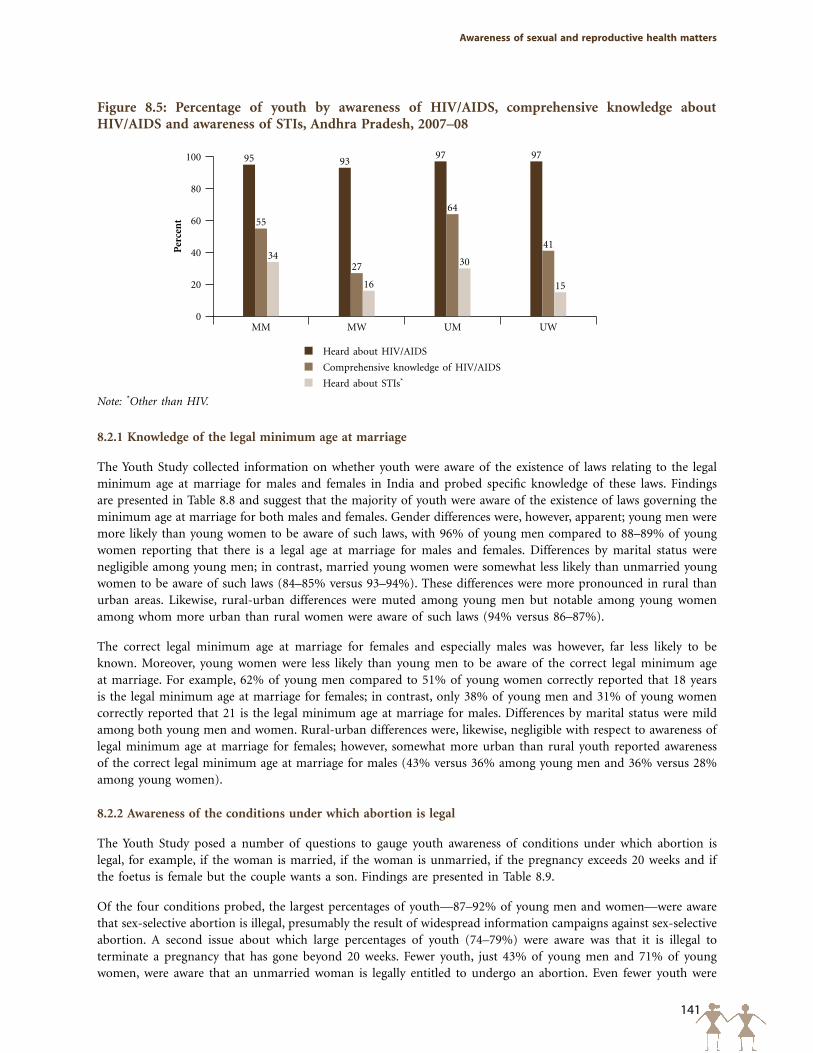
141
Awareness of sexual and reproductive health matters
Figure 8.5: Percentage of youth by awareness of HIV/AIDS, comprehensive knowledge about HIV/AIDS and awareness of STIs, Andhra Pradesh, 2007–08
Note: *Other than HIV.
Heard about HIV/AIDS
Comprehensive knowledge of HIV/AIDS
Heard about STIs*
Per
cen
t
100
80
60
40
20
0
95 9397 97
55
27
64
4134
16
30
15
MM MW UM UW
8.2.1 Knowledge of the legal minimum age at marriage
The Youth Study collected information on whether youth were aware of the existence of laws relating to the legal minimum age at marriage for males and females in India and probed specific knowledge of these laws. Findings are presented in Table 8.8 and suggest that the majority of youth were aware of the existence of laws governing the minimum age at marriage for both males and females. Gender differences were, however, apparent; young men were more likely than young women to be aware of such laws, with 96% of young men compared to 88–89% of young women reporting that there is a legal age at marriage for males and females. Differences by marital status were negligible among young men; in contrast, married young women were somewhat less likely than unmarried young women to be aware of such laws (84–85% versus 93–94%). These differences were more pronounced in rural than urban areas. Likewise, rural-urban differences were muted among young men but notable among young women among whom more urban than rural women were aware of such laws (94% versus 86–87%).
The correct legal minimum age at marriage for females and especially males was however, far less likely to be known. Moreover, young women were less likely than young men to be aware of the correct legal minimum age at marriage. For example, 62% of young men compared to 51% of young women correctly reported that 18 years is the legal minimum age at marriage for females; in contrast, only 38% of young men and 31% of young women correctly reported that 21 is the legal minimum age at marriage for males. Differences by marital status were mild among both young men and women. Rural-urban differences were, likewise, negligible with respect to awareness of legal minimum age at marriage for females; however, somewhat more urban than rural youth reported awareness of the correct legal minimum age at marriage for males (43% versus 36% among young men and 36% versus 28% among young women).
8.2.2 Awareness of the conditions under which abortion is legal
The Youth Study posed a number of questions to gauge youth awareness of conditions under which abortion is legal, for example, if the woman is married, if the woman is unmarried, if the pregnancy exceeds 20 weeks and if the foetus is female but the couple wants a son. Findings are presented in Table 8.9.
Of the four conditions probed, the largest percentages of youth—87–92% of young men and women—were aware that sex-selective abortion is illegal, presumably the result of widespread information campaigns against sex-selective abortion. A second issue about which large percentages of youth (74–79%) were aware was that it is illegal to terminate a pregnancy that has gone beyond 20 weeks. Fewer youth, just 43% of young men and 71% of young women, were aware that an unmarried woman is legally entitled to undergo an abortion. Even fewer youth were
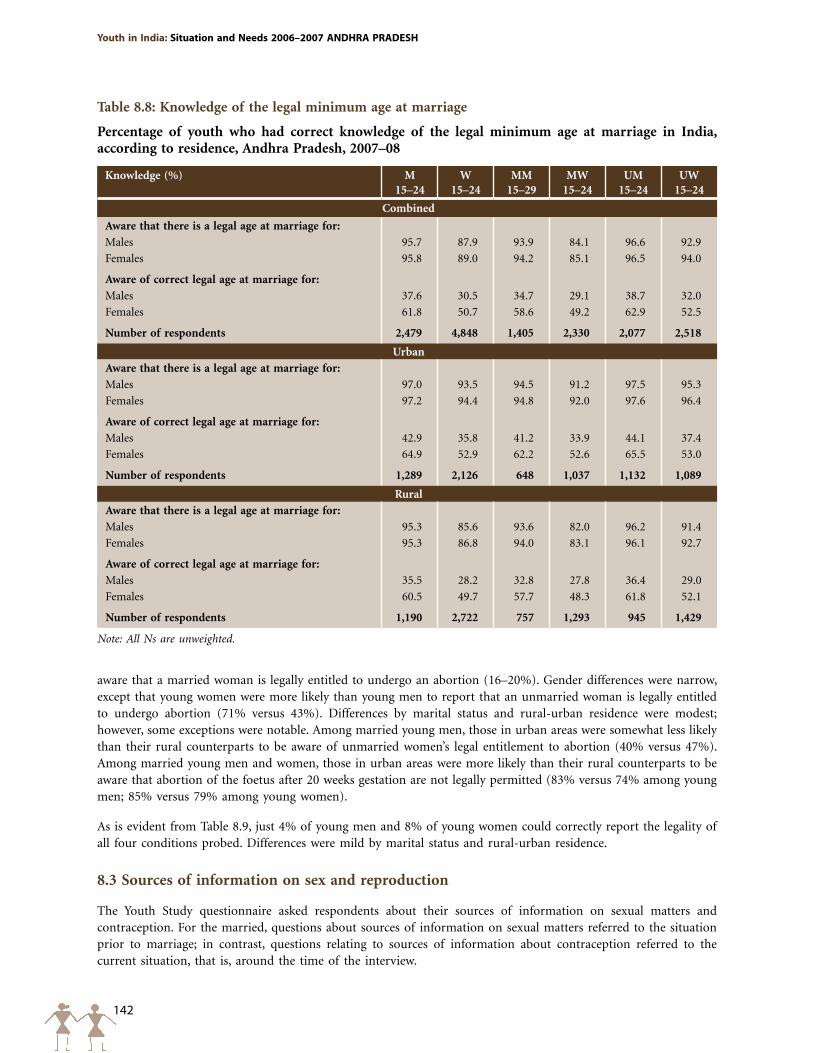
142
Youth in India: Situation and Needs 2006–2007 ANDHRA pRADESH
aware that a married woman is legally entitled to undergo an abortion (16–20%). Gender differences were narrow, except that young women were more likely than young men to report that an unmarried woman is legally entitled to undergo abortion (71% versus 43%). Differences by marital status and rural-urban residence were modest; however, some exceptions were notable. Among married young men, those in urban areas were somewhat less likely than their rural counterparts to be aware of unmarried women’s legal entitlement to abortion (40% versus 47%). Among married young men and women, those in urban areas were more likely than their rural counterparts to be aware that abortion of the foetus after 20 weeks gestation are not legally permitted (83% versus 74% among young men; 85% versus 79% among young women).
As is evident from Table 8.9, just 4% of young men and 8% of young women could correctly report the legality of all four conditions probed. Differences were mild by marital status and rural-urban residence.
8.3 Sources of information on sex and reproduction
The Youth Study questionnaire asked respondents about their sources of information on sexual matters and contraception. For the married, questions about sources of information on sexual matters referred to the situation prior to marriage; in contrast, questions relating to sources of information about contraception referred to the current situation, that is, around the time of the interview.
Table 8.8: Knowledge of the legal minimum age at marriage
Percentage of youth who had correct knowledge of the legal minimum age at marriage in India, according to residence, Andhra Pradesh, 2007–08
Knowledge (%) M15–24
W 15–24
MM 15–29
MW 15–24
UM 15–24
UW 15–24
Combined
Aware that there is a legal age at marriage for:
Males 95.7 87.9 93.9 84.1 96.6 92.9
Females 95.8 89.0 94.2 85.1 96.5 94.0
Aware of correct legal age at marriage for:
Males 37.6 30.5 34.7 29.1 38.7 32.0
Females 61.8 50.7 58.6 49.2 62.9 52.5
Number of respondents 2,479 4,848 1,405 2,330 2,077 2,518
Urban
Aware that there is a legal age at marriage for:
Males 97.0 93.5 94.5 91.2 97.5 95.3
Females 97.2 94.4 94.8 92.0 97.6 96.4
Aware of correct legal age at marriage for:
Males 42.9 35.8 41.2 33.9 44.1 37.4
Females 64.9 52.9 62.2 52.6 65.5 53.0
Number of respondents 1,289 2,126 648 1,037 1,132 1,089
Rural
Aware that there is a legal age at marriage for:
Males 95.3 85.6 93.6 82.0 96.2 91.4
Females 95.3 86.8 94.0 83.1 96.1 92.7
Aware of correct legal age at marriage for:
Males 35.5 28.2 32.8 27.8 36.4 29.0
Females 60.5 49.7 57.7 48.3 61.8 52.1
Number of respondents 1,190 2,722 757 1,293 945 1,429
Note: All Ns are unweighted.
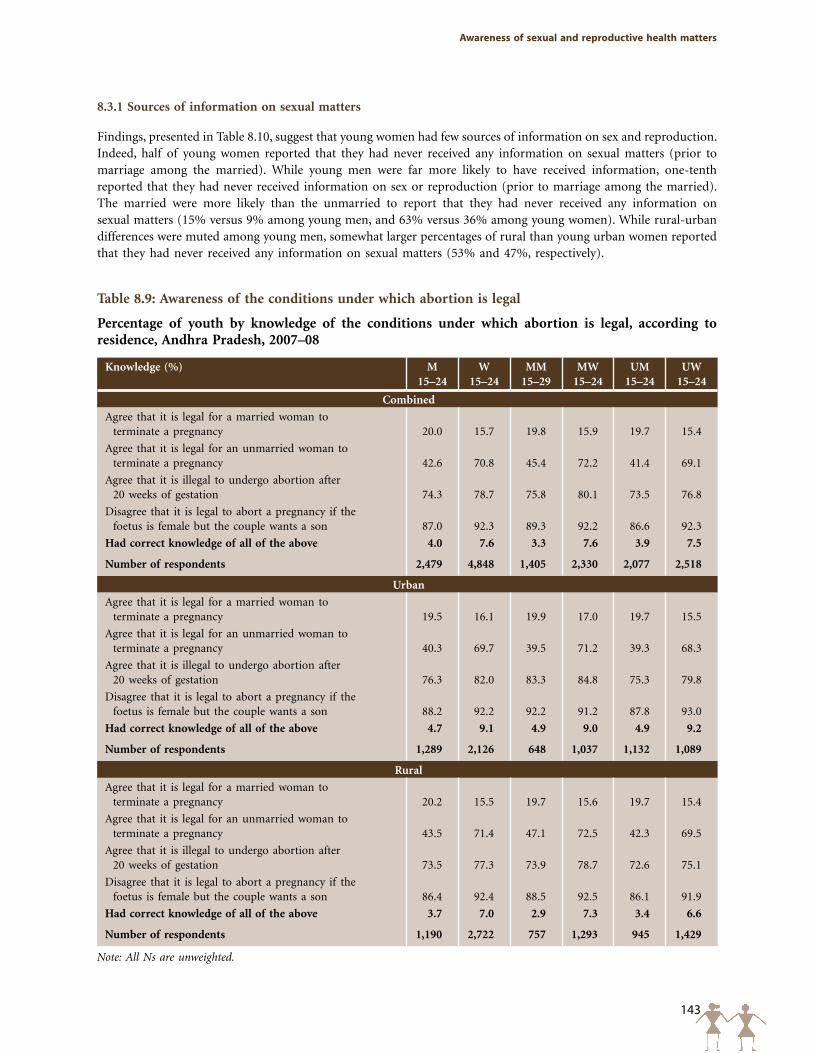
143
Awareness of sexual and reproductive health matters
8.3.1 Sources of information on sexual matters
Findings, presented in Table 8.10, suggest that young women had few sources of information on sex and reproduction. Indeed, half of young women reported that they had never received any information on sexual matters (prior to marriage among the married). While young men were far more likely to have received information, one-tenth reported that they had never received information on sex or reproduction (prior to marriage among the married). The married were more likely than the unmarried to report that they had never received any information on sexual matters (15% versus 9% among young men, and 63% versus 36% among young women). While rural-urban differences were muted among young men, somewhat larger percentages of rural than young urban women reported that they had never received any information on sexual matters (53% and 47%, respectively).
Table 8.9: Awareness of the conditions under which abortion is legal
Percentage of youth by knowledge of the conditions under which abortion is legal, according to residence, Andhra Pradesh, 2007–08
Knowledge (%) M15–24
W 15–24
MM 15–29
MW 15–24
UM 15–24
UW 15–24
Combined
Agree that it is legal for a married woman to terminate a pregnancy 20.0 15.7 19.8 15.9 19.7 15.4
Agree that it is legal for an unmarried woman to terminate a pregnancy 42.6 70.8 45.4 72.2 41.4 69.1
Agree that it is illegal to undergo abortion after 20 weeks of gestation 74.3 78.7 75.8 80.1 73.5 76.8
Disagree that it is legal to abort a pregnancy if the foetus is female but the couple wants a son 87.0 92.3 89.3 92.2 86.6 92.3
Had correct knowledge of all of the above 4.0 7.6 3.3 7.6 3.9 7.5
Number of respondents 2,479 4,848 1,405 2,330 2,077 2,518
Urban
Agree that it is legal for a married woman to terminate a pregnancy 19.5 16.1 19.9 17.0 19.7 15.5
Agree that it is legal for an unmarried woman to terminate a pregnancy 40.3 69.7 39.5 71.2 39.3 68.3
Agree that it is illegal to undergo abortion after 20 weeks of gestation 76.3 82.0 83.3 84.8 75.3 79.8
Disagree that it is legal to abort a pregnancy if the foetus is female but the couple wants a son 88.2 92.2 92.2 91.2 87.8 93.0
Had correct knowledge of all of the above 4.7 9.1 4.9 9.0 4.9 9.2
Number of respondents 1,289 2,126 648 1,037 1,132 1,089
Rural
Agree that it is legal for a married woman to terminate a pregnancy 20.2 15.5 19.7 15.6 19.7 15.4
Agree that it is legal for an unmarried woman to terminate a pregnancy 43.5 71.4 47.1 72.5 42.3 69.5
Agree that it is illegal to undergo abortion after 20 weeks of gestation 73.5 77.3 73.9 78.7 72.6 75.1
Disagree that it is legal to abort a pregnancy if the foetus is female but the couple wants a son 86.4 92.4 88.5 92.5 86.1 91.9
Had correct knowledge of all of the above 3.7 7.0 2.9 7.3 3.4 6.6
Number of respondents 1,190 2,722 757 1,293 945 1,429
Note: All Ns are unweighted.
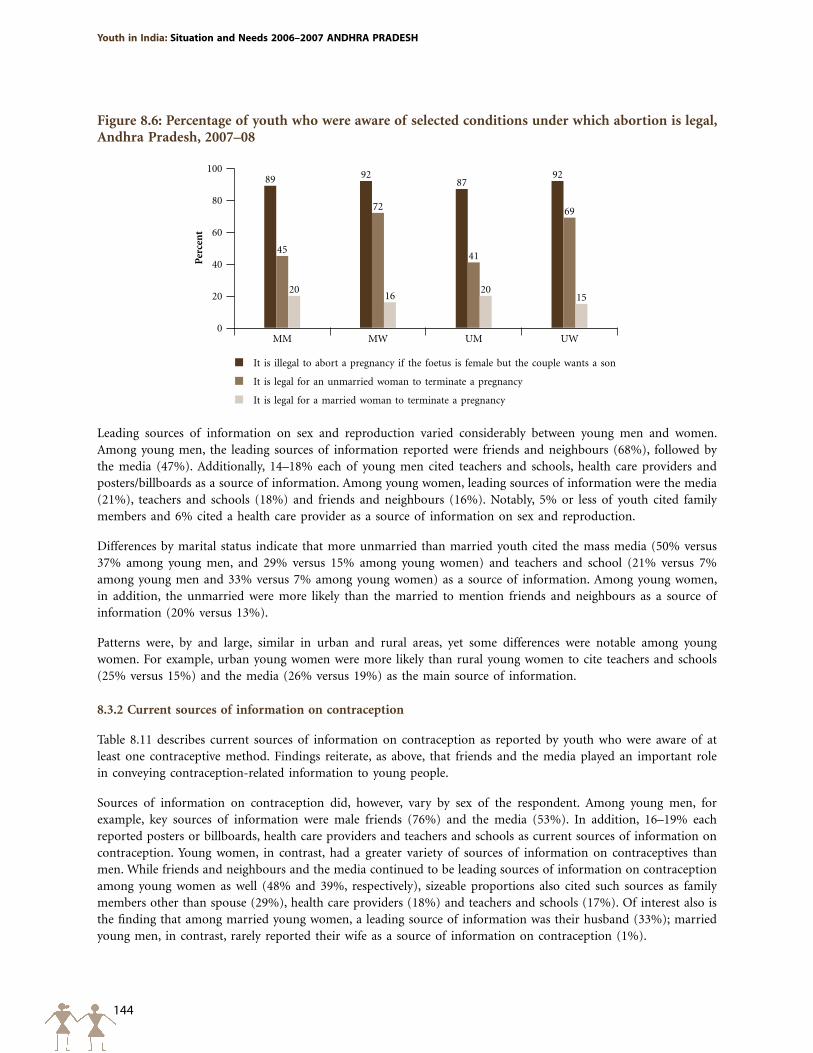
144
Youth in India: Situation and Needs 2006–2007 ANDHRA pRADESH
Figure 8.6: Percentage of youth who were aware of selected conditions under which abortion is legal, Andhra Pradesh, 2007–08
It is illegal to abort a pregnancy if the foetus is female but the couple wants a son
It is legal for an unmarried woman to terminate a pregnancy
It is legal for a married woman to terminate a pregnancy
Per
cen
t
100
80
60
40
20
0
89 9287
92
45
72
41
69
2016
2015
MM MW UM UW
Leading sources of information on sex and reproduction varied considerably between young men and women. Among young men, the leading sources of information reported were friends and neighbours (68%), followed by the media (47%). Additionally, 14–18% each of young men cited teachers and schools, health care providers and posters/billboards as a source of information. Among young women, leading sources of information were the media (21%), teachers and schools (18%) and friends and neighbours (16%). Notably, 5% or less of youth cited family members and 6% cited a health care provider as a source of information on sex and reproduction.
Differences by marital status indicate that more unmarried than married youth cited the mass media (50% versus 37% among young men, and 29% versus 15% among young women) and teachers and school (21% versus 7% among young men and 33% versus 7% among young women) as a source of information. Among young women, in addition, the unmarried were more likely than the married to mention friends and neighbours as a source of information (20% versus 13%).
Patterns were, by and large, similar in urban and rural areas, yet some differences were notable among young women. For example, urban young women were more likely than rural young women to cite teachers and schools (25% versus 15%) and the media (26% versus 19%) as the main source of information.
8.3.2 Current sources of information on contraception
Table 8.11 describes current sources of information on contraception as reported by youth who were aware of at least one contraceptive method. Findings reiterate, as above, that friends and the media played an important role in conveying contraception-related information to young people.
Sources of information on contraception did, however, vary by sex of the respondent. Among young men, for example, key sources of information were male friends (76%) and the media (53%). In addition, 16–19% each reported posters or billboards, health care providers and teachers and schools as current sources of information on contraception. Young women, in contrast, had a greater variety of sources of information on contraceptives than men. While friends and neighbours and the media continued to be leading sources of information on contraception among young women as well (48% and 39%, respectively), sizeable proportions also cited such sources as family members other than spouse (29%), health care providers (18%) and teachers and schools (17%). Of interest also is the finding that among married young women, a leading source of information was their husband (33%); married young men, in contrast, rarely reported their wife as a source of information on contraception (1%).
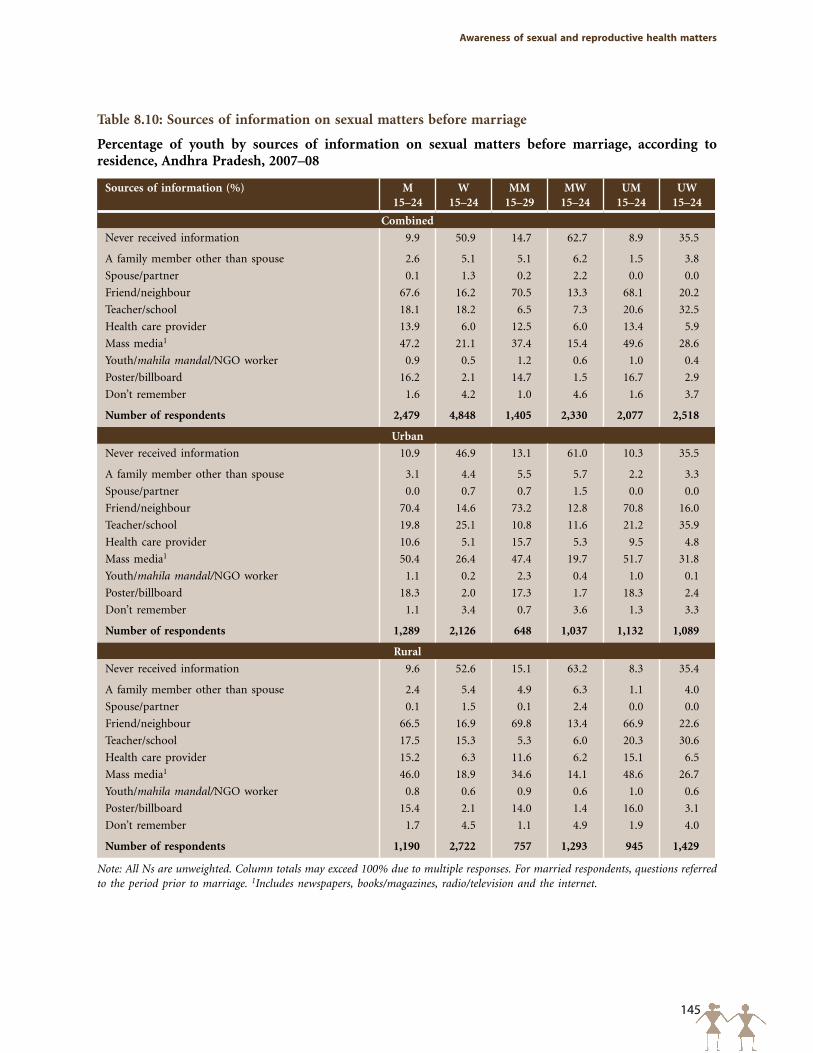
145
Awareness of sexual and reproductive health matters
Table 8.10: Sources of information on sexual matters before marriage
Percentage of youth by sources of information on sexual matters before marriage, according to residence, Andhra Pradesh, 2007–08
Sources of information (%) M15–24
W 15–24
MM 15–29
MW 15–24
UM 15–24
UW 15–24
Combined
Never received information 9.9 50.9 14.7 62.7 8.9 35.5
A family member other than spouse 2.6 5.1 5.1 6.2 1.5 3.8
Spouse/partner 0.1 1.3 0.2 2.2 0.0 0.0
Friend/neighbour 67.6 16.2 70.5 13.3 68.1 20.2
Teacher/school 18.1 18.2 6.5 7.3 20.6 32.5
Health care provider 13.9 6.0 12.5 6.0 13.4 5.9
Mass media1 47.2 21.1 37.4 15.4 49.6 28.6
Youth/mahila mandal/NGO worker 0.9 0.5 1.2 0.6 1.0 0.4
Poster/billboard 16.2 2.1 14.7 1.5 16.7 2.9
Don’t remember 1.6 4.2 1.0 4.6 1.6 3.7
Number of respondents 2,479 4,848 1,405 2,330 2,077 2,518
Urban
Never received information 10.9 46.9 13.1 61.0 10.3 35.5
A family member other than spouse 3.1 4.4 5.5 5.7 2.2 3.3
Spouse/partner 0.0 0.7 0.7 1.5 0.0 0.0
Friend/neighbour 70.4 14.6 73.2 12.8 70.8 16.0
Teacher/school 19.8 25.1 10.8 11.6 21.2 35.9
Health care provider 10.6 5.1 15.7 5.3 9.5 4.8
Mass media1 50.4 26.4 47.4 19.7 51.7 31.8
Youth/mahila mandal/NGO worker 1.1 0.2 2.3 0.4 1.0 0.1
Poster/billboard 18.3 2.0 17.3 1.7 18.3 2.4
Don’t remember 1.1 3.4 0.7 3.6 1.3 3.3
Number of respondents 1,289 2,126 648 1,037 1,132 1,089
Rural
Never received information 9.6 52.6 15.1 63.2 8.3 35.4
A family member other than spouse 2.4 5.4 4.9 6.3 1.1 4.0
Spouse/partner 0.1 1.5 0.1 2.4 0.0 0.0
Friend/neighbour 66.5 16.9 69.8 13.4 66.9 22.6
Teacher/school 17.5 15.3 5.3 6.0 20.3 30.6
Health care provider 15.2 6.3 11.6 6.2 15.1 6.5
Mass media1 46.0 18.9 34.6 14.1 48.6 26.7
Youth/mahila mandal/NGO worker 0.8 0.6 0.9 0.6 1.0 0.6
Poster/billboard 15.4 2.1 14.0 1.4 16.0 3.1
Don’t remember 1.7 4.5 1.1 4.9 1.9 4.0
Number of respondents 1,190 2,722 757 1,293 945 1,429
Note: All Ns are unweighted. Column totals may exceed 100% due to multiple responses. For married respondents, questions referred to the period prior to marriage. 1Includes newspapers, books/magazines, radio/television and the internet.
146
Youth in India: Situation and Needs 2006–2007 ANDHRA pRADESH
Differences by marital status suggest that unmarried youth were more likely than the married to cite the media (56% versus 43% among young men and 50% versus 32% among young women) and teachers and schools (19% versus 5% among young men and 33% versus 5% among young women), and less likely to cite health care providers (16% versus 23% among young men and 9% versus 25% among young women) as a source of information on contraception. In addition, married young men were more likely than the unmarried to mention friends and neighbours (82% versus 75%), and married young women were more likely than the unmarried to report family members (34% versus 23%) and friends and neighbours (51% versus 45%), as a source of information on contraception.
Rural-urban differences were mild among young men but wide among young women. Among young men, those in urban areas were more likely than their rural counterparts to cite the media as a source of information on contraception (62% versus 50%). Among young women, those in urban areas were more likely than their rural counterparts to obtain information from teachers and schools (24% versus 15%) and the media (54% versus 33%), and conversely, less likely to rely on family members other than spouse (24% versus 31%), friends and neighbours (41% versus 51%) and health care providers (13% versus 21%).
It is evident that current leading sources of information on contraception among young people who were aware of at least one contraceptive method were largely similar to the sources of information on sexual matters reported by all youth (prior to marriage for the married) reported in the previous section. Among the leading sources of information on both contraception and sexual matters were peers and the media, although among young women, teachers and schools ranked second as a leading source of information on sexual matters. Of note are findings that health care providers reached just 6–14% of youth on sexual matters and 17–18% on contraception. Indeed, no more than a quarter of married youth and no more than one-sixth of unmarried youth obtained information on sexual matters or contraception from health care providers, possibly a consequence of the lack of attention that the RCH Programme has paid, thus far, to young people. Although teachers, charged with providing family life education to youth, did indeed reach considerable proportions of unmarried youth and were the leading source of information on sexual matters among unmarried young women, their reach was far from universal. Teachers were cited as a source of information on sexual matters or contraception by only between one-fifth and one-third of unmarried youth and by just 5–7% of married youth. So too, family members, often considered a credible source of information, were almost never a source of information about sex or contraception to young men, and rarely a source of information on sexual matters to young women. In short, health care providers, teachers and family members—often assumed to be more reliable sources of information than peers and the media—were relatively infrequently cited as sources of information on these sensitive topics by young people.
8.4 Perceptions and experience of family life or sex education
In the Youth Study, we asked respondents about their views on the importance of imparting family life or sex education to youth, the ideal age at which youth should receive information about sexual matters and the best person to provide that information. We also asked youth whether they had received formal family life or sex education and if so, the source of this education and their opinion about its quality.
Table 8.12 presents findings on young people’s perceptions of family life or sex education. The majority of youth felt that it is important to impart family life or sex education to youth. Young men were more likely than young women to report so (88% compared to 79%). Differences by marital status were modest, although the unmarried were somewhat more likely than the married to report so. Urban youth, irrespective of sex, were somewhat more likely than their rural counterparts to report this perception (92% versus 86% among young men and 83% versus 78% among young women).
Of those who perceived family life or sex education to be important, half or more youth reported that such education should be provided to young people at ages between 15 and 17 years (56% and 50% among young men and women, respectively). Young women were more likely than young men to believe that information on sexual matters should be provided from an earlier age: 19% of young women compared to 9% of young men believed that this information
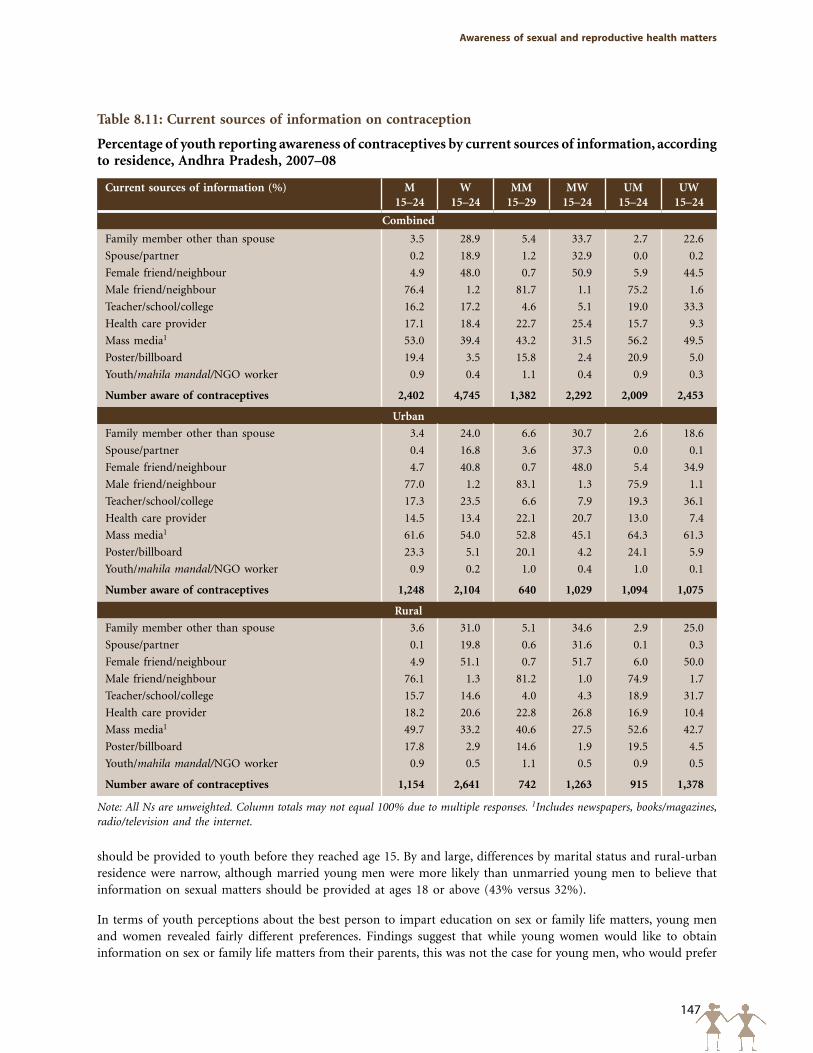
147
Awareness of sexual and reproductive health matters
Table 8.11: Current sources of information on contraception
Percentage of youth reporting awareness of contraceptives by current sources of information, according to residence, Andhra Pradesh, 2007–08
Current sources of information (%) M15–24
W 15–24
MM 15–29
MW 15–24
UM 15–24
UW 15–24
Combined
Family member other than spouse 3.5 28.9 5.4 33.7 2.7 22.6
Spouse/partner 0.2 18.9 1.2 32.9 0.0 0.2
Female friend/neighbour 4.9 48.0 0.7 50.9 5.9 44.5
Male friend/neighbour 76.4 1.2 81.7 1.1 75.2 1.6
Teacher/school/college 16.2 17.2 4.6 5.1 19.0 33.3
Health care provider 17.1 18.4 22.7 25.4 15.7 9.3
Mass media1 53.0 39.4 43.2 31.5 56.2 49.5
Poster/billboard 19.4 3.5 15.8 2.4 20.9 5.0
Youth/mahila mandal/NGO worker 0.9 0.4 1.1 0.4 0.9 0.3
Number aware of contraceptives 2,402 4,745 1,382 2,292 2,009 2,453
Urban
Family member other than spouse 3.4 24.0 6.6 30.7 2.6 18.6
Spouse/partner 0.4 16.8 3.6 37.3 0.0 0.1
Female friend/neighbour 4.7 40.8 0.7 48.0 5.4 34.9
Male friend/neighbour 77.0 1.2 83.1 1.3 75.9 1.1
Teacher/school/college 17.3 23.5 6.6 7.9 19.3 36.1
Health care provider 14.5 13.4 22.1 20.7 13.0 7.4
Mass media1 61.6 54.0 52.8 45.1 64.3 61.3
Poster/billboard 23.3 5.1 20.1 4.2 24.1 5.9
Youth/mahila mandal/NGO worker 0.9 0.2 1.0 0.4 1.0 0.1
Number aware of contraceptives 1,248 2,104 640 1,029 1,094 1,075
Rural
Family member other than spouse 3.6 31.0 5.1 34.6 2.9 25.0
Spouse/partner 0.1 19.8 0.6 31.6 0.1 0.3
Female friend/neighbour 4.9 51.1 0.7 51.7 6.0 50.0
Male friend/neighbour 76.1 1.3 81.2 1.0 74.9 1.7
Teacher/school/college 15.7 14.6 4.0 4.3 18.9 31.7
Health care provider 18.2 20.6 22.8 26.8 16.9 10.4
Mass media1 49.7 33.2 40.6 27.5 52.6 42.7
Poster/billboard 17.8 2.9 14.6 1.9 19.5 4.5
Youth/mahila mandal/NGO worker 0.9 0.5 1.1 0.5 0.9 0.5
Number aware of contraceptives 1,154 2,641 742 1,263 915 1,378
Note: All Ns are unweighted. Column totals may not equal 100% due to multiple responses. 1Includes newspapers, books/magazines, radio/television and the internet.
should be provided to youth before they reached age 15. By and large, differences by marital status and rural-urban residence were narrow, although married young men were more likely than unmarried young men to believe that information on sexual matters should be provided at ages 18 or above (43% versus 32%).
In terms of youth perceptions about the best person to impart education on sex or family life matters, young men and women revealed fairly different preferences. Findings suggest that while young women would like to obtain information on sex or family life matters from their parents, this was not the case for young men, who would prefer
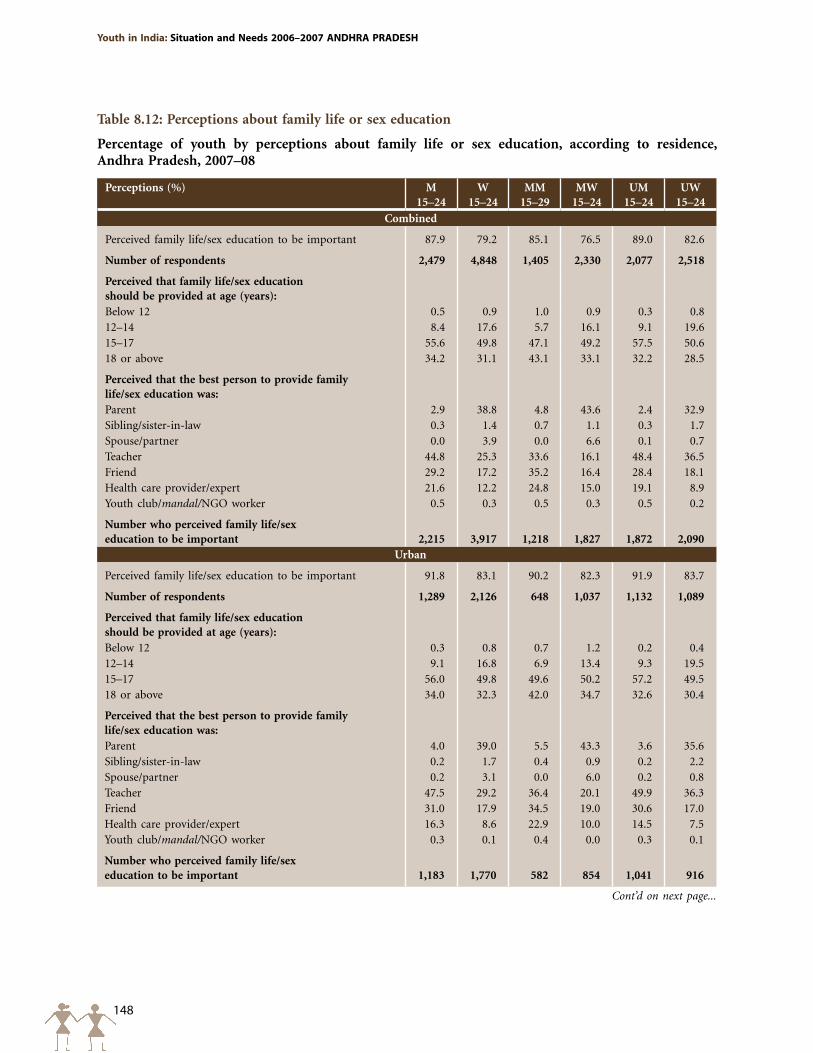
148
Youth in India: Situation and Needs 2006–2007 ANDHRA pRADESH
Table 8.12: Perceptions about family life or sex education
Percentage of youth by perceptions about family life or sex education, according to residence, Andhra Pradesh, 2007–08
Perceptions (%) M15–24
W 15–24
MM 15–29
MW 15–24
UM 15–24
UW 15–24
Combined
Perceived family life/sex education to be important 87.9 79.2 85.1 76.5 89.0 82.6
Number of respondents 2,479 4,848 1,405 2,330 2,077 2,518
Perceived that family life/sex education should be provided at age (years): Below 12 0.5 0.9 1.0 0.9 0.3 0.812–14 8.4 17.6 5.7 16.1 9.1 19.615–17 55.6 49.8 47.1 49.2 57.5 50.618 or above 34.2 31.1 43.1 33.1 32.2 28.5
Perceived that the best person to provide family life/sex education was:Parent 2.9 38.8 4.8 43.6 2.4 32.9Sibling/sister-in-law 0.3 1.4 0.7 1.1 0.3 1.7Spouse/partner 0.0 3.9 0.0 6.6 0.1 0.7Teacher 44.8 25.3 33.6 16.1 48.4 36.5Friend 29.2 17.2 35.2 16.4 28.4 18.1Health care provider/expert 21.6 12.2 24.8 15.0 19.1 8.9Youth club/mandal/NGO worker 0.5 0.3 0.5 0.3 0.5 0.2
Number who perceived family life/sex education to be important 2,215 3,917 1,218 1,827 1,872 2,090
Urban
Perceived family life/sex education to be important 91.8 83.1 90.2 82.3 91.9 83.7
Number of respondents 1,289 2,126 648 1,037 1,132 1,089
Perceived that family life/sex education should be provided at age (years): Below 12 0.3 0.8 0.7 1.2 0.2 0.412–14 9.1 16.8 6.9 13.4 9.3 19.515–17 56.0 49.8 49.6 50.2 57.2 49.518 or above 34.0 32.3 42.0 34.7 32.6 30.4
Perceived that the best person to provide family life/sex education was:Parent 4.0 39.0 5.5 43.3 3.6 35.6Sibling/sister-in-law 0.2 1.7 0.4 0.9 0.2 2.2Spouse/partner 0.2 3.1 0.0 6.0 0.2 0.8Teacher 47.5 29.2 36.4 20.1 49.9 36.3Friend 31.0 17.9 34.5 19.0 30.6 17.0Health care provider/expert 16.3 8.6 22.9 10.0 14.5 7.5Youth club/mandal/NGO worker 0.3 0.1 0.4 0.0 0.3 0.1
Number who perceived family life/sex education to be important 1,183 1,770 582 854 1,041 916
Cont’d on next page...
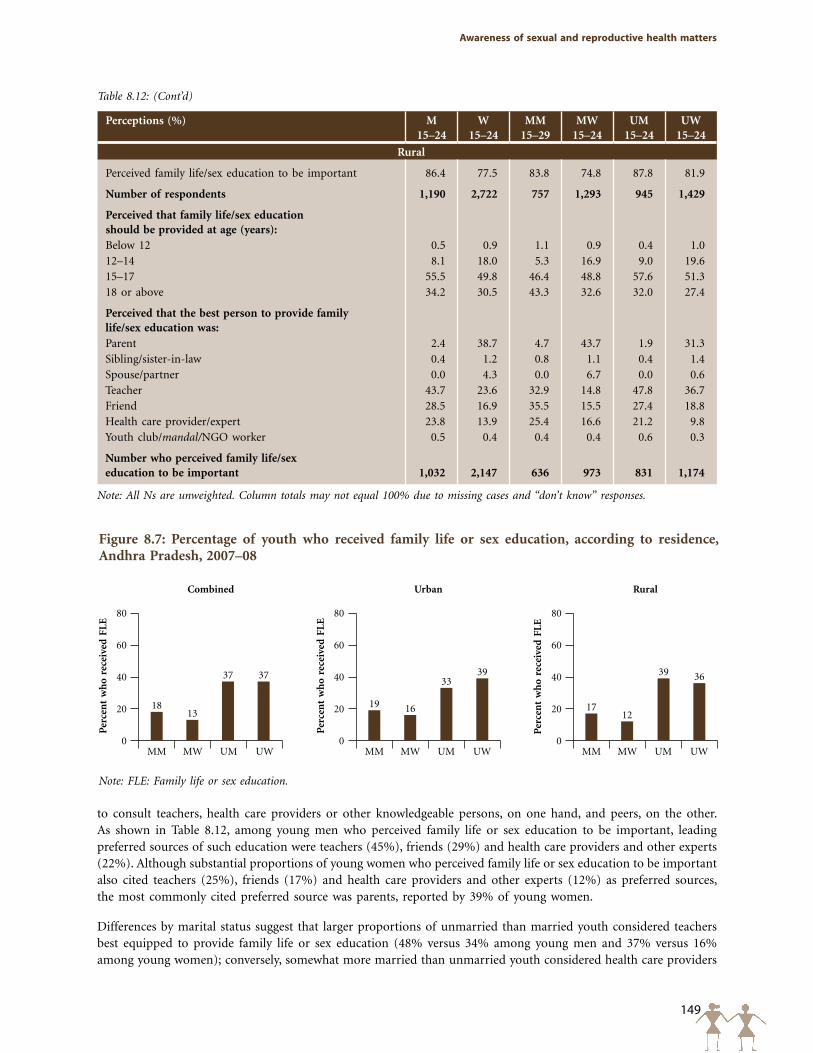
149
Awareness of sexual and reproductive health matters
Table 8.12: (Cont’d)
Perceptions (%) M15–24
W 15–24
MM 15–29
MW 15–24
UM 15–24
UW 15–24
Rural
Perceived family life/sex education to be important 86.4 77.5 83.8 74.8 87.8 81.9
Number of respondents 1,190 2,722 757 1,293 945 1,429
Perceived that family life/sex education should be provided at age (years): Below 12 0.5 0.9 1.1 0.9 0.4 1.012–14 8.1 18.0 5.3 16.9 9.0 19.615–17 55.5 49.8 46.4 48.8 57.6 51.318 or above 34.2 30.5 43.3 32.6 32.0 27.4
Perceived that the best person to provide family life/sex education was:Parent 2.4 38.7 4.7 43.7 1.9 31.3Sibling/sister-in-law 0.4 1.2 0.8 1.1 0.4 1.4Spouse/partner 0.0 4.3 0.0 6.7 0.0 0.6Teacher 43.7 23.6 32.9 14.8 47.8 36.7Friend 28.5 16.9 35.5 15.5 27.4 18.8Health care provider/expert 23.8 13.9 25.4 16.6 21.2 9.8Youth club/mandal/NGO worker 0.5 0.4 0.4 0.4 0.6 0.3
Number who perceived family life/sex education to be important 1,032 2,147 636 973 831 1,174
Note: All Ns are unweighted. Column totals may not equal 100% due to missing cases and “don’t know” responses.
Figure 8.7: Percentage of youth who received family life or sex education, according to residence, Andhra Pradesh, 2007–08
Note: FLE: Family life or sex education.
Per
cen
t w
ho
rece
ived
FLE
80
60
40
20
0
80
60
40
20
0
80
60
40
20
0
1813
37 37
MM MW UM UW
Combined
Per
cen
t w
ho
rece
ived
FLE
19 16
3339
MM MW UM UW
Urban
Per
cen
t w
ho
rece
ived
FLE
1712
39 36
MM MW UM UW
Rural
to consult teachers, health care providers or other knowledgeable persons, on one hand, and peers, on the other. As shown in Table 8.12, among young men who perceived family life or sex education to be important, leading preferred sources of such education were teachers (45%), friends (29%) and health care providers and other experts (22%). Although substantial proportions of young women who perceived family life or sex education to be important also cited teachers (25%), friends (17%) and health care providers and other experts (12%) as preferred sources, the most commonly cited preferred source was parents, reported by 39% of young women.
Differences by marital status suggest that larger proportions of unmarried than married youth considered teachers best equipped to provide family life or sex education (48% versus 34% among young men and 37% versus 16% among young women); conversely, somewhat more married than unmarried youth considered health care providers
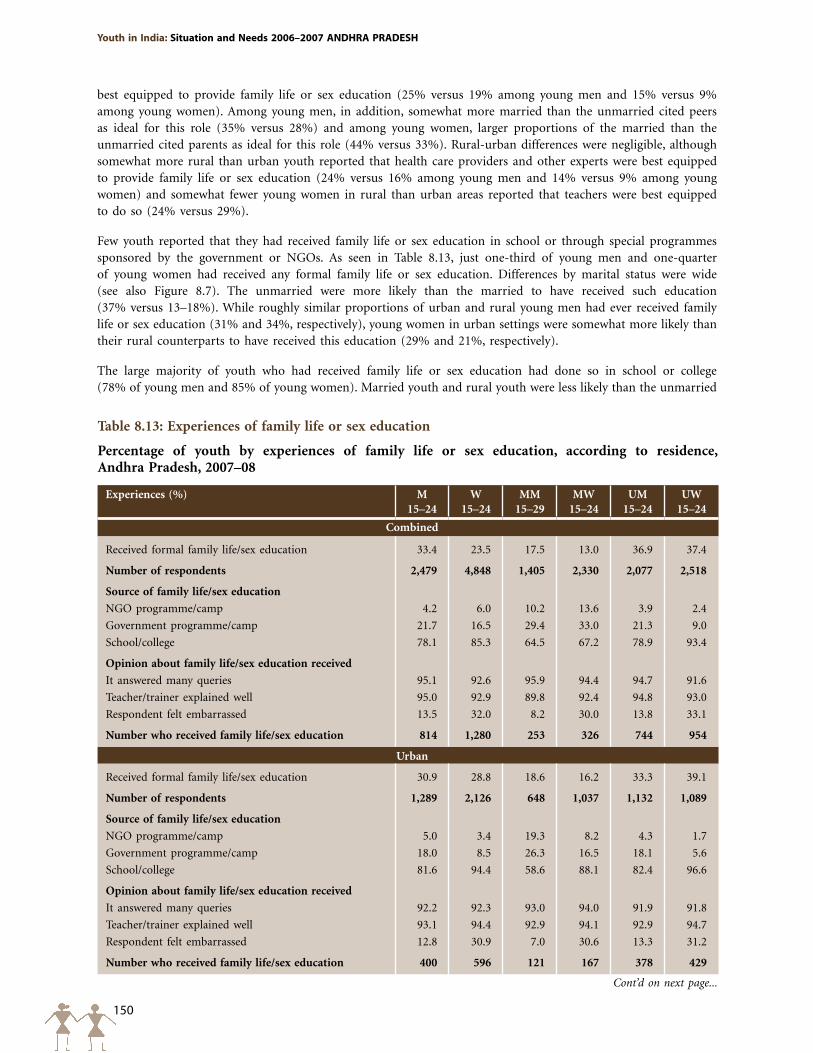
150
Youth in India: Situation and Needs 2006–2007 ANDHRA pRADESH
best equipped to provide family life or sex education (25% versus 19% among young men and 15% versus 9% among young women). Among young men, in addition, somewhat more married than the unmarried cited peers as ideal for this role (35% versus 28%) and among young women, larger proportions of the married than the unmarried cited parents as ideal for this role (44% versus 33%). Rural-urban differences were negligible, although somewhat more rural than urban youth reported that health care providers and other experts were best equipped to provide family life or sex education (24% versus 16% among young men and 14% versus 9% among young women) and somewhat fewer young women in rural than urban areas reported that teachers were best equipped to do so (24% versus 29%).
Few youth reported that they had received family life or sex education in school or through special programmes sponsored by the government or NGOs. As seen in Table 8.13, just one-third of young men and one-quarter of young women had received any formal family life or sex education. Differences by marital status were wide (see also Figure 8.7). The unmarried were more likely than the married to have received such education (37% versus 13–18%). While roughly similar proportions of urban and rural young men had ever received family life or sex education (31% and 34%, respectively), young women in urban settings were somewhat more likely than their rural counterparts to have received this education (29% and 21%, respectively).
The large majority of youth who had received family life or sex education had done so in school or college (78% of young men and 85% of young women). Married youth and rural youth were less likely than the unmarried
Table 8.13: Experiences of family life or sex education
Percentage of youth by experiences of family life or sex education, according to residence, Andhra Pradesh, 2007–08
Experiences (%) M15–24
W 15–24
MM 15–29
MW 15–24
UM 15–24
UW 15–24
Combined
Received formal family life/sex education 33.4 23.5 17.5 13.0 36.9 37.4
Number of respondents 2,479 4,848 1,405 2,330 2,077 2,518
Source of family life/sex education
NGO programme/camp 4.2 6.0 10.2 13.6 3.9 2.4
Government programme/camp 21.7 16.5 29.4 33.0 21.3 9.0
School/college 78.1 85.3 64.5 67.2 78.9 93.4
Opinion about family life/sex education received
It answered many queries 95.1 92.6 95.9 94.4 94.7 91.6
Teacher/trainer explained well 95.0 92.9 89.8 92.4 94.8 93.0
Respondent felt embarrassed 13.5 32.0 8.2 30.0 13.8 33.1
Number who received family life/sex education 814 1,280 253 326 744 954
Urban
Received formal family life/sex education 30.9 28.8 18.6 16.2 33.3 39.1
Number of respondents 1,289 2,126 648 1,037 1,132 1,089
Source of family life/sex education
NGO programme/camp 5.0 3.4 19.3 8.2 4.3 1.7
Government programme/camp 18.0 8.5 26.3 16.5 18.1 5.6
School/college 81.6 94.4 58.6 88.1 82.4 96.6
Opinion about family life/sex education received
It answered many queries 92.2 92.3 93.0 94.0 91.9 91.8
Teacher/trainer explained well 93.1 94.4 92.9 94.1 92.9 94.7
Respondent felt embarrassed 12.8 30.9 7.0 30.6 13.3 31.2
Number who received family life/sex education 400 596 121 167 378 429
Cont’d on next page...
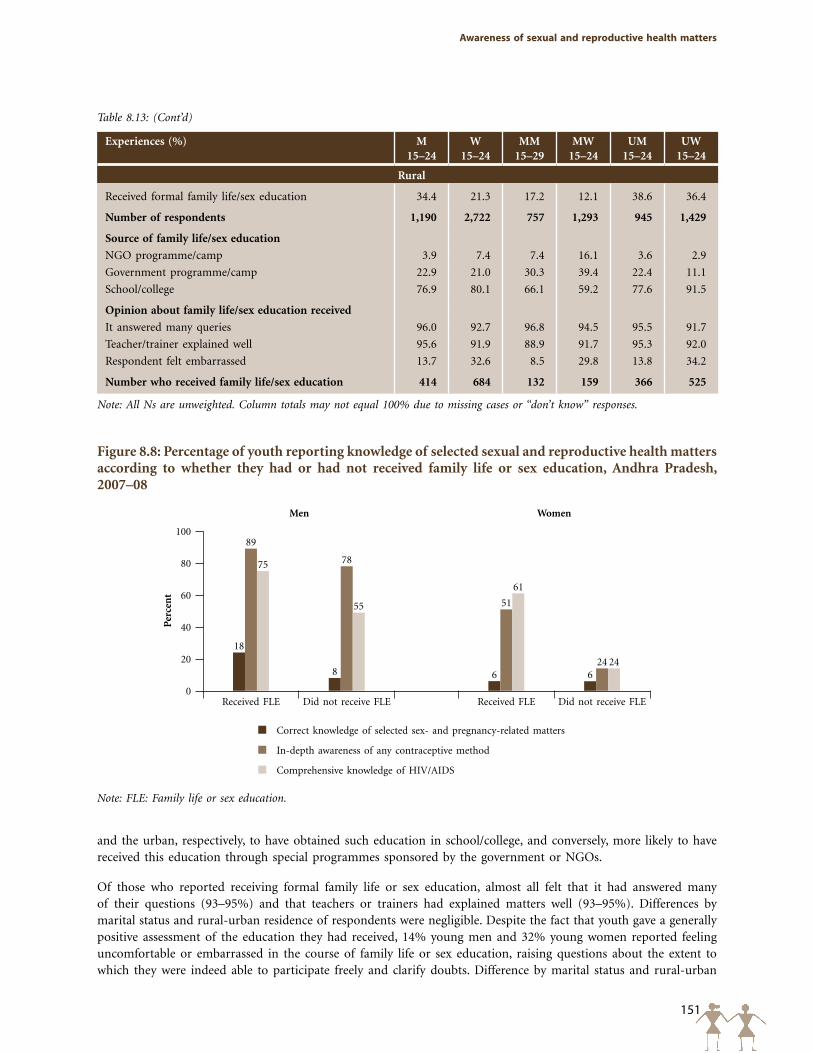
151
Awareness of sexual and reproductive health matters
Figure 8.8: Percentage of youth reporting knowledge of selected sexual and reproductive health matters according to whether they had or had not received family life or sex education, Andhra Pradesh, 2007–08
Note: FLE: Family life or sex education.
Correct knowledge of selected sex- and pregnancy-related matters
In-depth awareness of any contraceptive method
Comprehensive knowledge of HIV/AIDS
Per
cen
t
100
80
60
40
20
0
18
8 6 6
89
78
51
24
75
55
61
24
Received FLE Did not receive FLE Received FLE Did not receive FLE
Men Women
Experiences (%) M15–24
W 15–24
MM 15–29
MW 15–24
UM 15–24
UW 15–24
Rural
Received formal family life/sex education 34.4 21.3 17.2 12.1 38.6 36.4
Number of respondents 1,190 2,722 757 1,293 945 1,429
Source of family life/sex education
NGO programme/camp 3.9 7.4 7.4 16.1 3.6 2.9
Government programme/camp 22.9 21.0 30.3 39.4 22.4 11.1
School/college 76.9 80.1 66.1 59.2 77.6 91.5
Opinion about family life/sex education received
It answered many queries 96.0 92.7 96.8 94.5 95.5 91.7
Teacher/trainer explained well 95.6 91.9 88.9 91.7 95.3 92.0
Respondent felt embarrassed 13.7 32.6 8.5 29.8 13.8 34.2
Number who received family life/sex education 414 684 132 159 366 525
Note: All Ns are unweighted. Column totals may not equal 100% due to missing cases or “don’t know” responses.
Table 8.13: (Cont’d)
and the urban, respectively, to have obtained such education in school/college, and conversely, more likely to have received this education through special programmes sponsored by the government or NGOs.
Of those who reported receiving formal family life or sex education, almost all felt that it had answered many of their questions (93–95%) and that teachers or trainers had explained matters well (93–95%). Differences by marital status and rural-urban residence of respondents were negligible. Despite the fact that youth gave a generally positive assessment of the education they had received, 14% young men and 32% young women reported feeling uncomfortable or embarrassed in the course of family life or sex education, raising questions about the extent to which they were indeed able to participate freely and clarify doubts. Difference by marital status and rural-urban
152
Youth in India: Situation and Needs 2006–2007 ANDHRA pRADESH
residence were generally negligible except that unmarried men were somewhat more likely than married men to report feeling uncomfortable or embarrassed (14% versus 8%).
Figure 8.8 compares the extent to which those who had received family life or sex education differed in terms of correct knowledge of selected sexual and reproductive health matters with those who had not (see Sections 8.1.1, 8.1.3 and 8.1.8 for details of items considered in each summary measure). Findings suggest that youth who had received family life or sex education were more likely than those who had not to report in-depth awareness of contraception and comprehensive knowledge of HIV/AIDS. Young men who received such education, in addition, were more likely to report correct knowledge of selected sex and pregnancy matters. This pattern was, by and large, evident among both rural and urban respondents (not shown in figure).
8.5 Summary
Findings presented in this chapter underscore young people’s limited awareness of most sexual and reproductive matters, ranging from how pregnancy occurs to contraception, HIV and safe sex practices. For example, just over two-fifths of young men and over three-fifths of young women were aware that a woman can get pregnant at first sex, and just 30% of young men and 16% of young women reported awareness of STIs other than HIV.
Even on topics about which young people were generally aware, findings show that in-depth understanding was limited. For example, while 97–98% of youth reported awareness of at least one modern contraceptive method, in-depth awareness of condoms and oral contraceptives, the methods most familiar to youth, was reported by just 80% and 17% of young men and 21% and 15% of young women, respectively. Likewise, although 94–95% of youth had heard of HIV/AIDS, just 62% of young men and 33% of young women had comprehensive knowledge of HIV/AIDS.
Youth, particularly young women had few sources of information on sex and reproduction. Indeed, half of young women and one-tenth of young men reported that they had never received any information on sexual matters (prior to marriage among the married).
Leading sources of information on sex and reproduction varied considerably between young men and women. Among young men, the leading sources of information reported were friends and neighbours (68%), followed by the media (47%). Among young women, leading sources of information were the media (21%), teachers and schools (18%) and friends and neighbours (16%). Notably, just 3–5% cited a family member. Among the leading current sources of information on contraception among young people who were aware of at least one method were similarly, peers and the media. Teachers and health care providers were relatively infrequently reported as such. Indeed, health care providers were cited as an important source of information on contraception by only a quarter of married youth; they were far less likely to have provided information to the unmarried (9–16%). Likewise, teachers were cited by just 16–17% of youth. However considerable proportions of young women (29%) but hardly any young men (4%) cited family members as a leading source of information about contraception. In short, health care providers, teachers and family members—often assumed to be more reliable sources of information than peers or the media—were infrequently and inconsistently cited as sources of information on sensitive topics such as sexual matters and contraception by young people.
Few youth had attended family life or sex education programmes either in or outside the school setting—just one-third of young men and almost one-quarter of young women. Despite this, youth were overwhelmingly in favour of the provision of family life or sex education to young people; while young men preferred to receive this education from a professional (health care provider or teacher) and peers, young women preferred parents and teachers. Findings suggest, moreover, that youth who had undergone family life or sex education were indeed more knowledgeable about sexual and reproductive matters than those not exposed to this education.
153
pre-marital romantic and sexual relationships
Chapter 9
pre-marital romantic and sexual relationships
While evidence is sparse, several studies have noted that despite socio-cultural taboos, youth in India do find opportunities to mix and form romantic relationships, and to engage in pre-marital sex with a range of partners and in a variety of situations (Abraham, 2001; 2002; Abraham and Kumar, 1999; Alexander et al., 2006a; 2006b; Awasthi, Nichter and Pande, 2000). This chapter begins by describing the development of questions intended to capture these youth relationships. The chapter then explores young people’s attitudes towards pre-marital physical intimacy and sex, and the extent and nature of their pre-marital romantic experiences, followed by a description of their pre-marital sexual experiences, including those within romantic partnerships and other situations. Finally, the chapter compares reports of pre-marital romantic and sexual experiences derived using three different methodological approaches, that is, face-to-face interviews, anonymous reporting of respondents’ own experiences using a sealed envelope and anonymous third-party reporting of the experiences of respondents’ friends.
9.1 Development of the questionnaire module on pre-marital romantic and sexual relationships
In view of the fact that social norms prohibiting pre-marital opposite-sex mixing may result in serious under-reporting of romantic and sexual relationships by youth, the Youth Study initiated the development of this module with a series of focus group discussions among married and unmarried young men and women. In the course of these focus group discussions, youth confirmed that romantic relationships were indeed formed, and mapped a range of places in which youth met their romantic partners secretly. They also listed the vocabulary used by youth to describe their romantic relationships, including the commonly used term “to give a proposal” to describe the act of conveying romantic intentions to opposite-sex individuals.
Building on these insights, a romantic relationship was defined as one comprising a boyfriend-girlfriend relationship (worded culturally appropriately) in which an emotional, physical or sexual relationship was experienced; one in which a “proposal” was accepted or one in which the couple spent time together alone and secretly. Correspondingly, all respondents were asked questions on whether or not they had ever had a boy- or girl-friend; whether they had ever “proposed” to anyone of the opposite sex or whether someone of the opposite sex had ever “proposed” to them and whether the “proposal” was accepted; and whether they had spent time alone and secretly with an opposite-sex person. Youth who reported any of the above experiences were considered to have experienced a romantic relationship. We note that our definition of romantic relationships precluded the possibility of reporting same-sex romantic relationships.
All respondents who had reported a romantic partner were then probed regarding the nature of the relationship and the extent of physical contact experienced in the relationship. Questions probing respondents’ experience with physical intimacy were posed on a continuum, starting with hand-holding and extending to sexual relations. Thus, the instrument sought to ask potentially sensitive or embarrassing questions in a gradual way, thereby also enabling the interviewer to build rapport with the respondent. Detailed questions concerning the nature of the relationship were asked with reference to the first romantic partner as well as the most recent, if more than one was reported.
Pre-survey focus group discussions also probed the nature of situations in which sex was experienced. Participants discussed an array of partners with whom youth engaged in sexual relations, including romantic and casual,
154
Youth in India: Situation and Needs 2006–2007 ANDHRA pRADESH
heterosexual and homosexual, sex workers and older married women. Situations of forced and exchange sex were also discussed. Our survey, correspondingly, inquired about each of these different types of relationships after we had obtained detailed information on the nature of relationships with romantic partners.
Additionally, recognising the reluctance of youth to disclose sexual experience in a survey situation, at the conclusion of the interview, all respondents were asked a single question [“Have you ever had sex with anyone?” (for the unmarried)/“Did you ever have sex with anyone before marriage?” (for the married)] and asked to mark a blank card with a “3” or a “X,” place the card in an envelope, seal it and return it to the interviewer. Respondents were informed that the envelope would not be opened in the field, and that only the principal investigators would be able to link the information provided in the envelope with what was provided in the main body of the questionnaire.
We also recognised that despite significant rapport building and a well-developed sequence of questions eliciting sexual behaviours, young people may not have wished to disclose sexual activity in either of the above formats. Other researchers have observed that respondents may be more forthcoming about reporting sensitive behaviours among their peer networks than about themselves and that responses relating to the peer network correspond closely to their own experiences (Rossier, 2003). Hence the Youth Study incorporated anonymous third-party reporting questions, in which respondents reported the romantic and sexual experiences of up to five same-sex peers.
In addition, efforts were made to ensure that youth were comfortable revealing sensitive behaviours. Interviewers were young and trained to build rapport, discuss sensitive experiences in empathetic and matter-of-fact ways and generally make respondents feel comfortable about the topics to be discussed during the interview. As far as possible, interviews were held at times and places that assured the respondent maximum confidentiality. In cases in which family members attempted to participate in or overhear the interview, another interviewer was called upon to conduct an informal discussion or interview with other family members so as to ensure privacy for the interview. Nevertheless, we acknowledge that ensuring privacy may have been a problem, especially in low-income urban settings characterised by cramped housing conditions or that some youth may not have felt entirely at ease despite the extensive efforts made to ensure confidentiality. While findings are indeed in line with those observed in other small-scale and less representative studies (see Jejeebhoy and Sebastian, 2004 for a review), we acknowledge that romantic and sexual experiences may have been under-reported in the survey, notably by young women, and suggest that percentages presented here may be interpreted as conservative estimates.
9.2 Attitudes toward pre-marital physical intimacy and sexual relations
The Youth Study included a number of questions to assess young people’s attitudes regarding the acceptability of pre-marital physical intimacy and sexual activity. Findings, presented in Table 9.1, suggest that young people’s attitudes towards pre-marital physical intimacy and sex were generally negative; that is, most disapproved of kissing a partner before marriage, and agreed that a young person’s future would be ruined if he or she had sex before marriage. Even so, notable proportions of young men and women considered pre-marital kissing and sexual activity acceptable. Young men were more likely than young women to condone such behaviours. For example, 40% of young men compared to just 13% of young women felt that it is all right for a boy and girl to kiss each other before marriage. Findings also indicate gendered attitudes towards pre-marital physical intimacy and sex. While about one-quarter of young men and one in ten young women condoned pre-marital sexual activity among young men, far fewer—11% of young men and just 3% of young women—considered such behaviour acceptable among young women.
Differences by marital status were mild, although in urban areas, somewhat more married than unmarried young men considered it unacceptable for a boy and girl to kiss each other before marriage (60% versus 53%) and in rural areas, somewhat more married than unmarried young men condoned pre-marital sexual activity among young men (27% compared to 21%). Rural-urban differences were, likewise, negligible; however, somewhat more urban than rural young men expressed the view that it is all right for a boy and girl to kiss each other before marriage (44% versus 38%) and considered pre-marital sexual activity acceptable among young men (28% versus 23%).
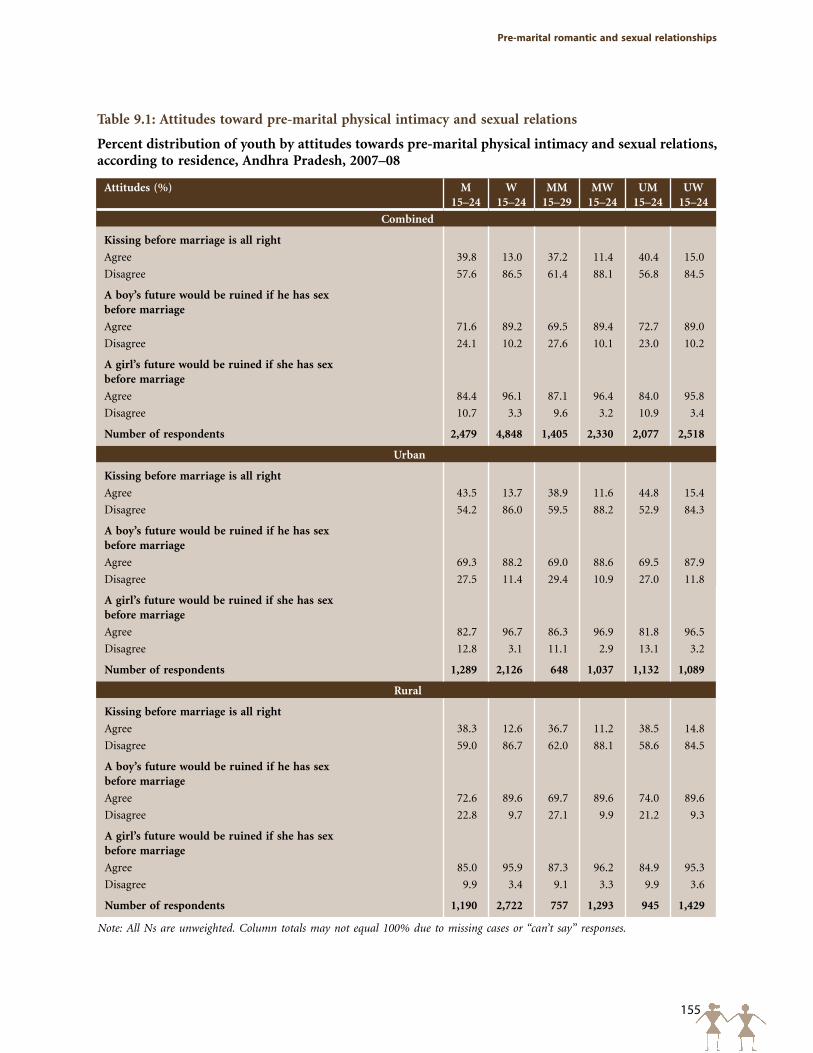
155
pre-marital romantic and sexual relationships
Table 9.1: Attitudes toward pre-marital physical intimacy and sexual relations
Percent distribution of youth by attitudes towards pre-marital physical intimacy and sexual relations, according to residence, Andhra Pradesh, 2007–08
Attitudes (%) M 15–24
W 15–24
MM 15–29
MW 15–24
UM 15–24
UW 15–24
Combined
Kissing before marriage is all right
Agree 39.8 13.0 37.2 11.4 40.4 15.0
Disagree 57.6 86.5 61.4 88.1 56.8 84.5
A boy’s future would be ruined if he has sex before marriage
Agree 71.6 89.2 69.5 89.4 72.7 89.0
Disagree 24.1 10.2 27.6 10.1 23.0 10.2
A girl’s future would be ruined if she has sex before marriage
Agree 84.4 96.1 87.1 96.4 84.0 95.8
Disagree 10.7 3.3 9.6 3.2 10.9 3.4
Number of respondents 2,479 4,848 1,405 2,330 2,077 2,518
Urban
Kissing before marriage is all right
Agree 43.5 13.7 38.9 11.6 44.8 15.4
Disagree 54.2 86.0 59.5 88.2 52.9 84.3
A boy’s future would be ruined if he has sex before marriage
Agree 69.3 88.2 69.0 88.6 69.5 87.9
Disagree 27.5 11.4 29.4 10.9 27.0 11.8
A girl’s future would be ruined if she has sex before marriage
Agree 82.7 96.7 86.3 96.9 81.8 96.5
Disagree 12.8 3.1 11.1 2.9 13.1 3.2
Number of respondents 1,289 2,126 648 1,037 1,132 1,089
Rural
Kissing before marriage is all right
Agree 38.3 12.6 36.7 11.2 38.5 14.8
Disagree 59.0 86.7 62.0 88.1 58.6 84.5
A boy’s future would be ruined if he has sex before marriage
Agree 72.6 89.6 69.7 89.6 74.0 89.6
Disagree 22.8 9.7 27.1 9.9 21.2 9.3
A girl’s future would be ruined if she has sex before marriage
Agree 85.0 95.9 87.3 96.2 84.9 95.3
Disagree 9.9 3.4 9.1 3.3 9.9 3.6
Number of respondents 1,190 2,722 757 1,293 945 1,429
Note: All Ns are unweighted. Column totals may not equal 100% due to missing cases or “can’t say” responses.
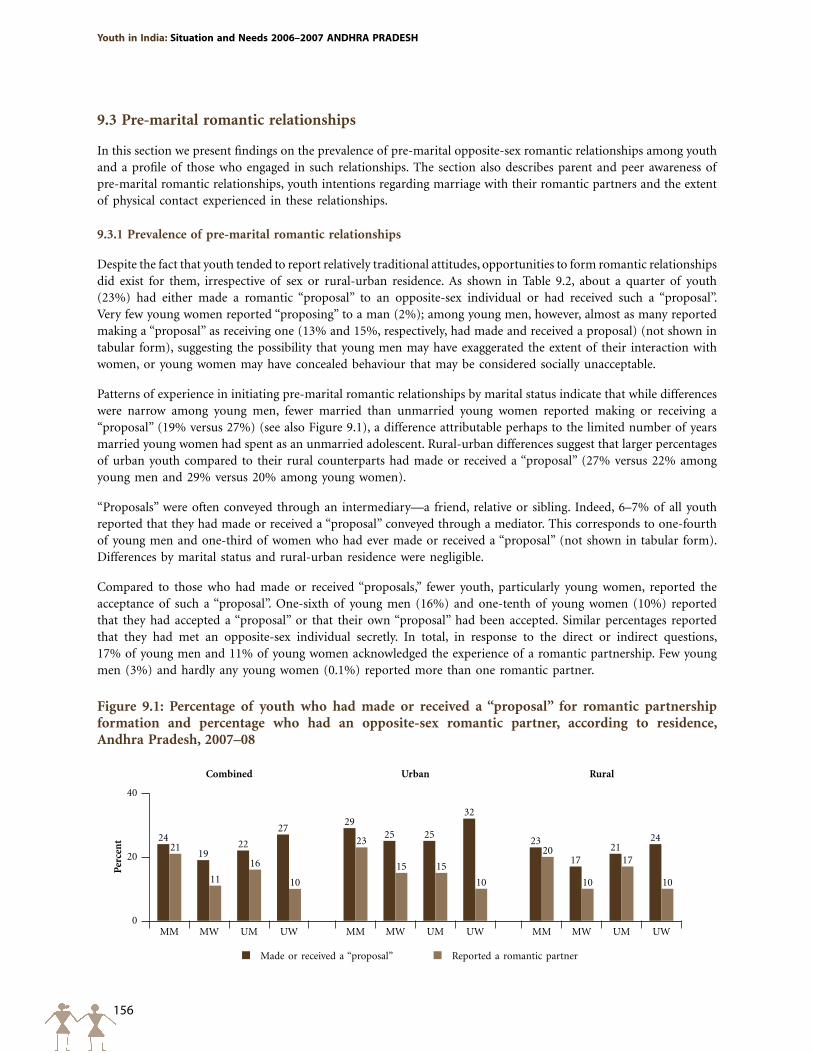
156
Youth in India: Situation and Needs 2006–2007 ANDHRA pRADESH
Made or received a “proposal” Reported a romantic partner
Per
cen
t
40
20
0
24
29
2319
25
17
2225
21
27
32
2421
2320
1115
10
16 1517
10 10
Combined
10
Urban Rural
MM MM MMMW MW MWUM UM UMUW UW UW
Figure 9.1: Percentage of youth who had made or received a “proposal” for romantic partnership formation and percentage who had an opposite-sex romantic partner, according to residence, Andhra Pradesh, 2007–08
9.3 Pre-marital romantic relationships
In this section we present findings on the prevalence of pre-marital opposite-sex romantic relationships among youth and a profile of those who engaged in such relationships. The section also describes parent and peer awareness of pre-marital romantic relationships, youth intentions regarding marriage with their romantic partners and the extent of physical contact experienced in these relationships.
9.3.1 Prevalence of pre-marital romantic relationships
Despite the fact that youth tended to report relatively traditional attitudes, opportunities to form romantic relationships did exist for them, irrespective of sex or rural-urban residence. As shown in Table 9.2, about a quarter of youth (23%) had either made a romantic “proposal” to an opposite-sex individual or had received such a “proposal”. Very few young women reported “proposing” to a man (2%); among young men, however, almost as many reported making a “proposal” as receiving one (13% and 15%, respectively, had made and received a proposal) (not shown in tabular form), suggesting the possibility that young men may have exaggerated the extent of their interaction with women, or young women may have concealed behaviour that may be considered socially unacceptable.
Patterns of experience in initiating pre-marital romantic relationships by marital status indicate that while differences were narrow among young men, fewer married than unmarried young women reported making or receiving a “proposal” (19% versus 27%) (see also Figure 9.1), a difference attributable perhaps to the limited number of years married young women had spent as an unmarried adolescent. Rural-urban differences suggest that larger percentages of urban youth compared to their rural counterparts had made or received a “proposal” (27% versus 22% among young men and 29% versus 20% among young women).
“Proposals” were often conveyed through an intermediary—a friend, relative or sibling. Indeed, 6–7% of all youth reported that they had made or received a “proposal” conveyed through a mediator. This corresponds to one-fourth of young men and one-third of women who had ever made or received a “proposal” (not shown in tabular form). Differences by marital status and rural-urban residence were negligible.
Compared to those who had made or received “proposals,” fewer youth, particularly young women, reported the acceptance of such a “proposal”. One-sixth of young men (16%) and one-tenth of young women (10%) reported that they had accepted a “proposal” or that their own “proposal” had been accepted. Similar percentages reported that they had met an opposite-sex individual secretly. In total, in response to the direct or indirect questions, 17% of young men and 11% of young women acknowledged the experience of a romantic partnership. Few young men (3%) and hardly any young women (0.1%) reported more than one romantic partner.
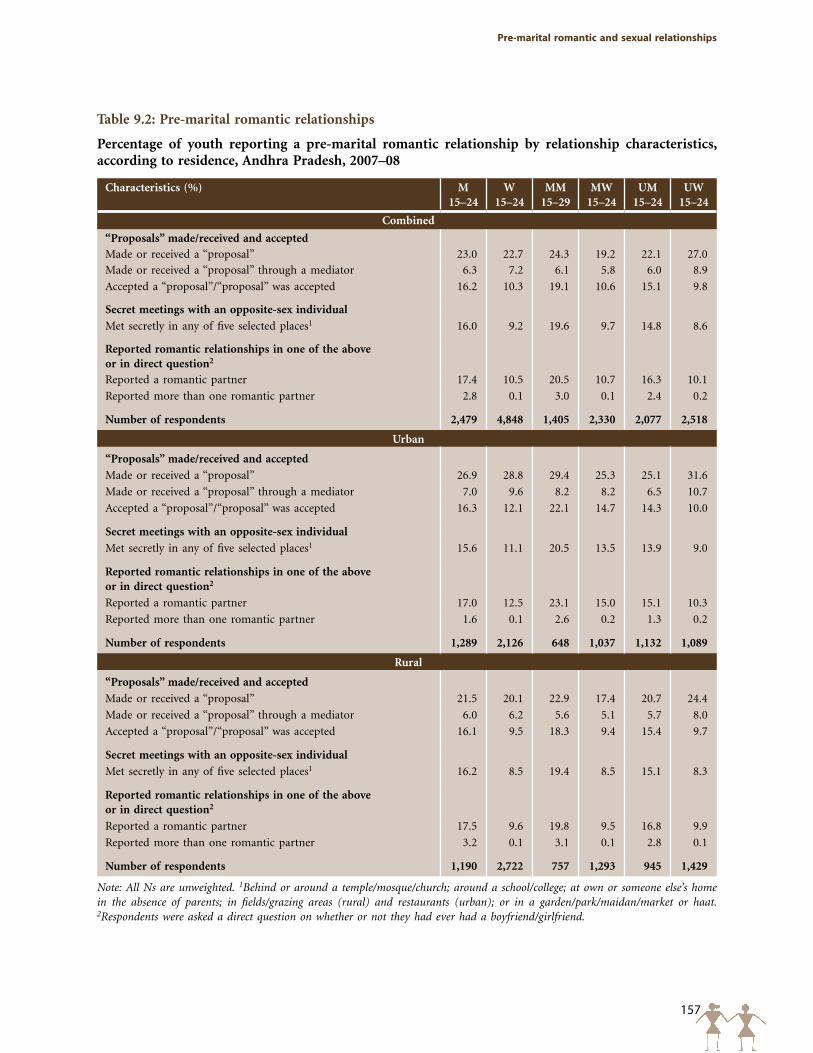
157
pre-marital romantic and sexual relationships
Table 9.2: Pre-marital romantic relationships
Percentage of youth reporting a pre-marital romantic relationship by relationship characteristics, according to residence, Andhra Pradesh, 2007–08
Characteristics (%) M 15–24
W 15–24
MM 15–29
MW 15–24
UM 15–24
UW 15–24
Combined
“Proposals” made/received and acceptedMade or received a “proposal” 23.0 22.7 24.3 19.2 22.1 27.0
Made or received a “proposal” through a mediator 6.3 7.2 6.1 5.8 6.0 8.9
Accepted a “proposal”/“proposal” was accepted 16.2 10.3 19.1 10.6 15.1 9.8
Secret meetings with an opposite-sex individual
Met secretly in any of five selected places1 16.0 9.2 19.6 9.7 14.8 8.6
Reported romantic relationships in one of the above or in direct question2
Reported a romantic partner 17.4 10.5 20.5 10.7 16.3 10.1
Reported more than one romantic partner 2.8 0.1 3.0 0.1 2.4 0.2
Number of respondents 2,479 4,848 1,405 2,330 2,077 2,518
Urban
“Proposals” made/received and accepted
Made or received a “proposal” 26.9 28.8 29.4 25.3 25.1 31.6
Made or received a “proposal” through a mediator 7.0 9.6 8.2 8.2 6.5 10.7
Accepted a “proposal”/“proposal” was accepted 16.3 12.1 22.1 14.7 14.3 10.0
Secret meetings with an opposite-sex individual
Met secretly in any of five selected places1 15.6 11.1 20.5 13.5 13.9 9.0
Reported romantic relationships in one of the above or in direct question2
Reported a romantic partner 17.0 12.5 23.1 15.0 15.1 10.3
Reported more than one romantic partner 1.6 0.1 2.6 0.2 1.3 0.2
Number of respondents 1,289 2,126 648 1,037 1,132 1,089
Rural
“Proposals” made/received and accepted
Made or received a “proposal” 21.5 20.1 22.9 17.4 20.7 24.4
Made or received a “proposal” through a mediator 6.0 6.2 5.6 5.1 5.7 8.0
Accepted a “proposal”/“proposal” was accepted 16.1 9.5 18.3 9.4 15.4 9.7
Secret meetings with an opposite-sex individual
Met secretly in any of five selected places1 16.2 8.5 19.4 8.5 15.1 8.3
Reported romantic relationships in one of the above or in direct question2
Reported a romantic partner 17.5 9.6 19.8 9.5 16.8 9.9
Reported more than one romantic partner 3.2 0.1 3.1 0.1 2.8 0.1
Number of respondents 1,190 2,722 757 1,293 945 1,429
Note: All Ns are unweighted. 1Behind or around a temple/mosque/church; around a school/college; at own or someone else’s home in the absence of parents; in fields/grazing areas (rural) and restaurants (urban); or in a garden/park/maidan/market or haat. 2Respondents were asked a direct question on whether or not they had ever had a boyfriend/girlfriend.
158
Youth in India: Situation and Needs 2006–2007 ANDHRA pRADESH
Differentials by marital status in reporting a romantic relationship for the combined sample were negligible among young women but evident among young men, with the married somewhat more likely than the unmarried to report a romantic relationship (21% versus 16%). Differences by marital status were also notable for the urban sample. In urban areas, the married were more likely than their unmarried counterparts to report a romantic relationship (23% versus 15% among young men and 15% versus 10% among young women). Rural-urban differences were negligible, although married young women in urban areas were somewhat more likely than their rural counterparts (15% versus 10%), to acknowledge the experience of a romantic partnership.
Table 9.3 presents the percentage of youth reporting pre-marital romantic relationships by background characteristics. We note that such characteristics as work status and household economic status reflect the situation of youth at the time of interview, and not necessarily at the time when romantic relationships were formed. Age profiles indicate a positive association between age and the formation of romantic relationships among young men; this association was evident among the unmarried but not among the married. Among young women, differences by age were negligible.
Differentials by religion suggest that Hindu and Muslim young men were considerably less likely than those belonging to the other religions to report a pre-marital romantic relationship, irrespective of marital status (17% versus 25%). Although a similar pattern was evident among young women, the differences were much narrow (8–10% versus 14%). Caste-wise differences indicate that young men belonging to scheduled tribes, general castes or other backward castes were less likely than those belonging to scheduled castes to report a pre-marital romantic relationship. Among young women, those belonging to both scheduled castes and tribes were more likely than those belonging to general castes or other backward castes to report a romantic relationship. This association was consistently observed among both the married and the unmarried.
Findings also show a largely positive association between schooling and the formation of romantic relationship, perhaps a result of greater opportunities for mobility and social mixing offered by schooling. For example, the percentage of young men who reported a romantic partner increased from 12% among those without formal schooling to 21% among those who had completed 12 or more years of schooling. The corresponding percentages among young women were 7% and 14%, respectively. While a positive association between work participation and the formation of romantic relationship was evident among young men (20% of those who worked in the 12 months preceding the survey versus 12% of those who did not), no such differences were evident among young women. The association between household economic status and the formation of romantic partnership was inconsistent among both young men and women, although among unmarried young women, those belonging to the poorest quintile were more likely than others to report a romantic partner (16% versus 8–10%).
Similar patterns of socio-demographic differentials were observed, by and large, among rural and urban respondents. Some exceptions were, however, notable. For example, the association between schooling and the formation of romantic relationship was found to be inverse in urban areas, but positive in rural areas, as observed for the overall samples. Similarly, an inverse association between household economic status and the formation of romantic relationship was evident in urban areas, in contrast to the inconsistent pattern observed for the overall and rural samples.
9.3.2 Characteristics of pre-marital romantic relationships
Selected characteristics of reported pre-marital romantic relationships are presented in Table 9.4; in cases in which more than one romantic partner was reported, only information relating to the respondent’s first romantic relationship was included. Age at initiation of pre-marital romantic relationships was measured by the age at which youth first spent time alone with their partner.
Findings indicate that relationships were initiated at a young age for substantial proportions of youth who had experienced pre-marital romantic relationships. One-fifth of young men and two-fifths of young women reported that they had spent time alone with their first romantic partner at age 15 or below. Among young men, the
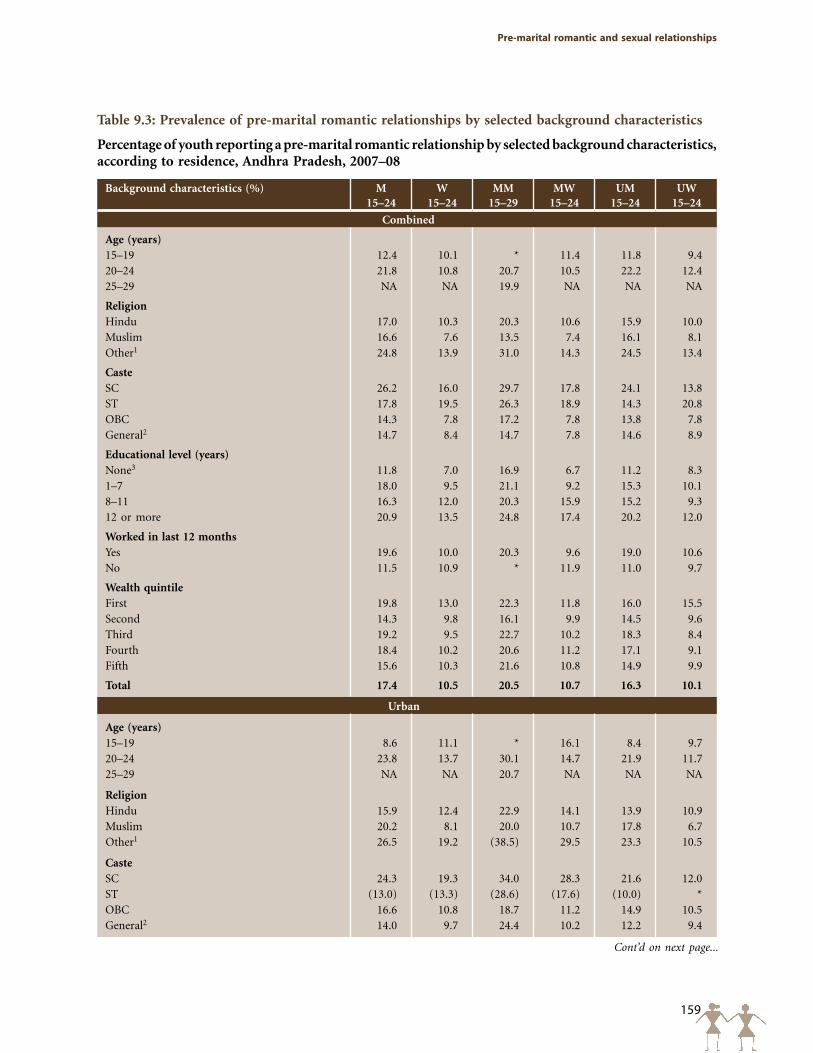
159
pre-marital romantic and sexual relationships
Table 9.3: Prevalence of pre-marital romantic relationships by selected background characteristics
Percentage of youth reporting a pre-marital romantic relationship by selected background characteristics, according to residence, Andhra Pradesh, 2007–08
Background characteristics (%) M 15–24
W 15–24
MM 15–29
MW 15–24
UM 15–24
UW 15–24
Combined
Age (years)15–19 12.4 10.1 * 11.4 11.8 9.420–24 21.8 10.8 20.7 10.5 22.2 12.425–29 NA NA 19.9 NA NA NA
Religion Hindu 17.0 10.3 20.3 10.6 15.9 10.0Muslim 16.6 7.6 13.5 7.4 16.1 8.1Other1 24.8 13.9 31.0 14.3 24.5 13.4
CasteSC 26.2 16.0 29.7 17.8 24.1 13.8ST 17.8 19.5 26.3 18.9 14.3 20.8OBC 14.3 7.8 17.2 7.8 13.8 7.8General2 14.7 8.4 14.7 7.8 14.6 8.9
Educational level (years)None3 11.8 7.0 16.9 6.7 11.2 8.31–7 18.0 9.5 21.1 9.2 15.3 10.18–11 16.3 12.0 20.3 15.9 15.2 9.312 or more 20.9 13.5 24.8 17.4 20.2 12.0
Worked in last 12 monthsYes 19.6 10.0 20.3 9.6 19.0 10.6No 11.5 10.9 * 11.9 11.0 9.7
Wealth quintileFirst 19.8 13.0 22.3 11.8 16.0 15.5Second 14.3 9.8 16.1 9.9 14.5 9.6Third 19.2 9.5 22.7 10.2 18.3 8.4Fourth 18.4 10.2 20.6 11.2 17.1 9.1Fifth 15.6 10.3 21.6 10.8 14.9 9.9
Total 17.4 10.5 20.5 10.7 16.3 10.1
Urban
Age (years)15–19 8.6 11.1 * 16.1 8.4 9.720–24 23.8 13.7 30.1 14.7 21.9 11.725–29 NA NA 20.7 NA NA NA
Religion Hindu 15.9 12.4 22.9 14.1 13.9 10.9Muslim 20.2 8.1 20.0 10.7 17.8 6.7Other1 26.5 19.2 (38.5) 29.5 23.3 10.5
CasteSC 24.3 19.3 34.0 28.3 21.6 12.0ST (13.0) (13.3) (28.6) (17.6) (10.0) *OBC 16.6 10.8 18.7 11.2 14.9 10.5General2 14.0 9.7 24.4 10.2 12.2 9.4
Cont’d on next page...
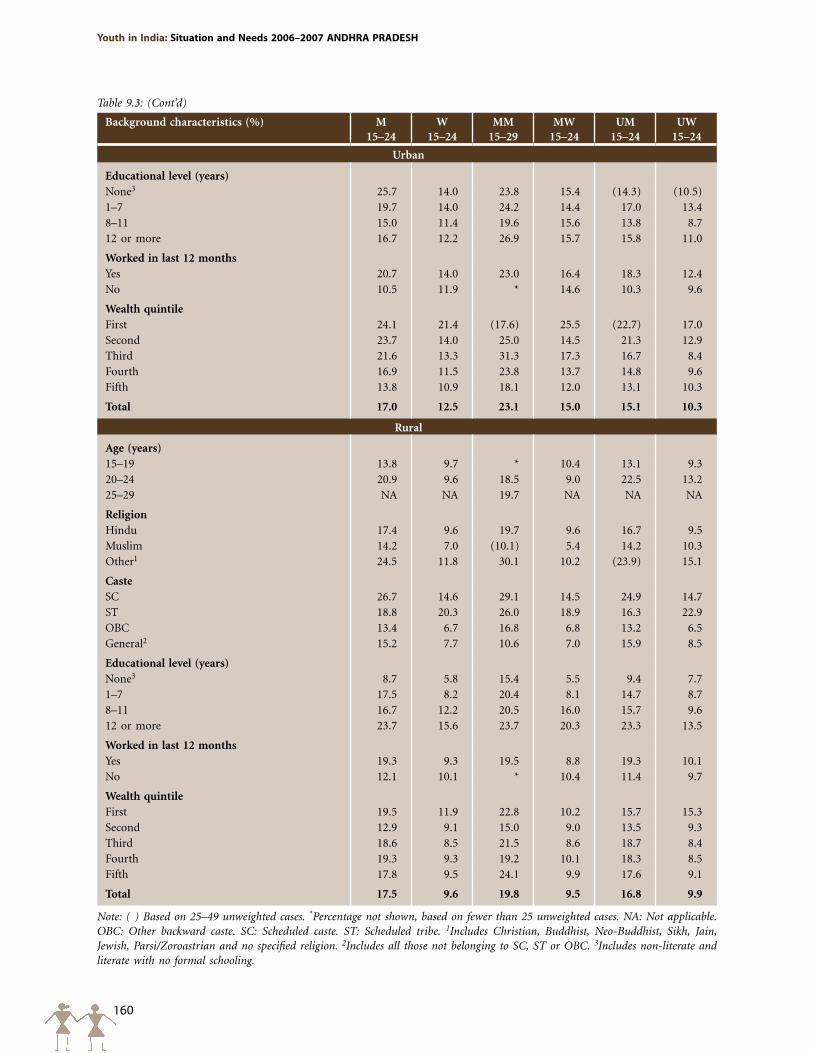
160
Youth in India: Situation and Needs 2006–2007 ANDHRA pRADESH
Background characteristics (%) M 15–24
W 15–24
MM 15–29
MW 15–24
UM 15–24
UW 15–24
Urban
Educational level (years)None3 25.7 14.0 23.8 15.4 (14.3) (10.5)1–7 19.7 14.0 24.2 14.4 17.0 13.48–11 15.0 11.4 19.6 15.6 13.8 8.712 or more 16.7 12.2 26.9 15.7 15.8 11.0
Worked in last 12 monthsYes 20.7 14.0 23.0 16.4 18.3 12.4No 10.5 11.9 * 14.6 10.3 9.6
Wealth quintileFirst 24.1 21.4 (17.6) 25.5 (22.7) 17.0Second 23.7 14.0 25.0 14.5 21.3 12.9Third 21.6 13.3 31.3 17.3 16.7 8.4Fourth 16.9 11.5 23.8 13.7 14.8 9.6Fifth 13.8 10.9 18.1 12.0 13.1 10.3
Total 17.0 12.5 23.1 15.0 15.1 10.3
Rural
Age (years)15–19 13.8 9.7 * 10.4 13.1 9.320–24 20.9 9.6 18.5 9.0 22.5 13.225–29 NA NA 19.7 NA NA NA
Religion Hindu 17.4 9.6 19.7 9.6 16.7 9.5Muslim 14.2 7.0 (10.1) 5.4 14.2 10.3Other1 24.5 11.8 30.1 10.2 (23.9) 15.1
CasteSC 26.7 14.6 29.1 14.5 24.9 14.7ST 18.8 20.3 26.0 18.9 16.3 22.9OBC 13.4 6.7 16.8 6.8 13.2 6.5General2 15.2 7.7 10.6 7.0 15.9 8.5
Educational level (years)None3 8.7 5.8 15.4 5.5 9.4 7.71–7 17.5 8.2 20.4 8.1 14.7 8.78–11 16.7 12.2 20.5 16.0 15.7 9.612 or more 23.7 15.6 23.7 20.3 23.3 13.5
Worked in last 12 monthsYes 19.3 9.3 19.5 8.8 19.3 10.1No 12.1 10.1 * 10.4 11.4 9.7
Wealth quintileFirst 19.5 11.9 22.8 10.2 15.7 15.3Second 12.9 9.1 15.0 9.0 13.5 9.3Third 18.6 8.5 21.5 8.6 18.7 8.4Fourth 19.3 9.3 19.2 10.1 18.3 8.5Fifth 17.8 9.5 24.1 9.9 17.6 9.1
Total 17.5 9.6 19.8 9.5 16.8 9.9
Note: ( ) Based on 25–49 unweighted cases. *Percentage not shown, based on fewer than 25 unweighted cases. NA: Not applicable. OBC: Other backward caste. SC: Scheduled caste. ST: Scheduled tribe. 1Includes Christian, Buddhist, Neo-Buddhist, Sikh, Jain, Jewish, Parsi/Zoroastrian and no specified religion. 2Includes all those not belonging to SC, ST or OBC. 3Includes non-literate and literate with no formal schooling.
Table 9.3: (Cont’d)
161
pre-marital romantic and sexual relationships
unmarried were more likely than the married to have initiated their romantic relationship at age 15 or below (21% versus 10%); a reverse pattern was, however, evident among young women (48% and 32% of married and unmarried young women, respectively). Youth in rural areas were more likely than those in urban areas to have initiated a pre-marital romantic relationship at age 15 or below (21% compared to 13% among young men and 47% compared to 31% among young women). Median ages of respondents when they first spent time alone with their pre-marital romantic partner were two years older among young men than among young women (18 years and 16 years, respectively), one year older among unmarried young women compared to married young women (16 and 15, respectively) and identical among married and unmarried young men (18 years). Irrespective of marital status, youth in urban areas initiated their relationships one year later than did their rural counterparts (18 versus 17 years among young men, and 16 versus15 years among young women). Information on the relative ages of reported partners suggests that male partners were, for the most part, older than female partners. For example, 79% of young men reported a female partner who was younger than they were, while 89% of young women reported a male partner who was older than they were. While differences by marital status and rural-urban residence were negligible among young women, unmarried young men and those in rural areas were considerably more likely than their married and urban counterparts, respectively to report a pre-marital romantic relationship with a young woman of their own age (21% versus 9% among the unmarried and married; 20% and 13% among rural and urban young men, respectively). Overwhelmingly, the partner was unmarried, reported by 97–98% of youth.
The first reported romantic partner was typically a neighbour or friend (40%), or a fellow student or colleague (27%) among young men, and a relative (38%) or a neighbour or friend (31%) among young women. Findings, moreover, suggest that young men were more likely than young women to cite a fellow student or colleague (27% versus 15%), a neighbour or friend (40% versus 31%) and an acquaintance from outside the village/urban community (20 versus 16%), and conversely less likely to report a relative (13% versus 38%). This gender difference may be attributed to young women’s relatively limited mobility and fewer opportunities for social mixing as compared to young men, described in Chapter 7.
This pattern was fairly consistent among both married and unmarried youth. Nonetheless, married youth were less likely than the unmarried to report a fellow student or colleague (14% versus 32% among young men and 11% versus 20% among young women) and conversely, somewhat more likely to report an acquaintance from outside the village/urban community (24% versus 18% among young men and 19% versus 11% among young women) as the first romantic partner. Married young men, in addition, were more likely than their unmarried counterparts to report a neighbour or friend from the village or urban community (47% versus 37%). Marital status differences were more pronounced in urban than rural areas. Rural-urban differences were mild, although urban young men were somewhat more likely than their rural counterparts to report a fellow student or colleague (31% versus 25%) and considerably less likely to report an acquaintance from outside the village/urban community (9% versus 24%), and urban young women were somewhat less likely than their rural counterparts to report a relative (33% versus 40%) as the first romantic partner.
Respondents had typically been acquainted with their first romantic partner for one year or more before becoming romantically linked; this was consistently observed in all groups, irrespective of sex, marital status and rural-urban residence. Many young men and women (29–31%) reported that they had been acquainted with their partner since childhood, a finding not surprising given that a sizeable proportion of partners were either from the same neighbourhood or, among young women, relatives. Differences by marital status and rural-urban residence suggest that married and rural youth were somewhat more likely than unmarried and urban youth to report that they had been acquainted with their first romantic partner since childhood.
The majority of youth reported that their partners came from religious and caste backgrounds similar to their own. Nevertheless, it is notable that considerable proportions of young people did engage in a romantic relationship with someone of a different religion and caste. For example, 18% of young men and 24% of young women reported that their first romantic partner was someone from a different religion and over two-fifths of young men (44%) and one-third of young women (34%) reported that their first romantic partner was someone from a different caste.
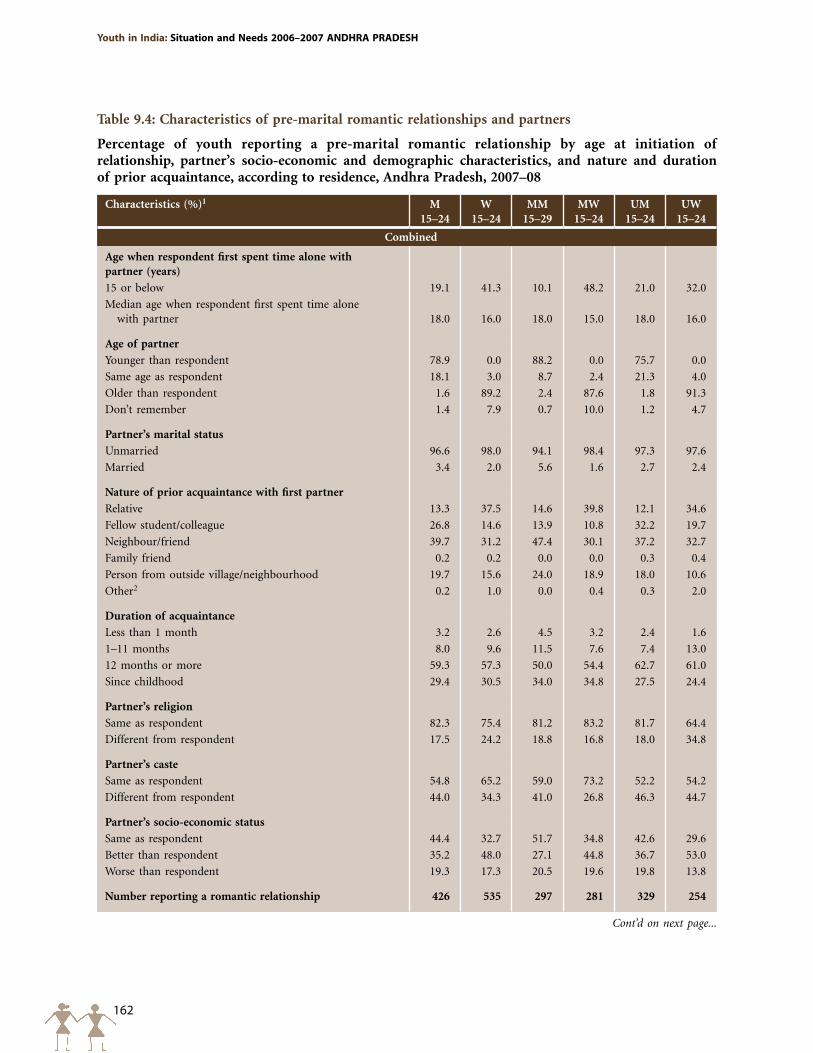
162
Youth in India: Situation and Needs 2006–2007 ANDHRA pRADESH
Table 9.4: Characteristics of pre-marital romantic relationships and partners
Percentage of youth reporting a pre-marital romantic relationship by age at initiation of relationship, partner’s socio-economic and demographic characteristics, and nature and duration of prior acquaintance, according to residence, Andhra Pradesh, 2007–08
Characteristics (%)1 M 15–24
W 15–24
MM 15–29
MW 15–24
UM 15–24
UW 15–24
Combined
Age when respondent first spent time alone with partner (years)
15 or below 19.1 41.3 10.1 48.2 21.0 32.0
Median age when respondent first spent time alone with partner 18.0 16.0 18.0 15.0 18.0 16.0
Age of partner
Younger than respondent 78.9 0.0 88.2 0.0 75.7 0.0
Same age as respondent 18.1 3.0 8.7 2.4 21.3 4.0
Older than respondent 1.6 89.2 2.4 87.6 1.8 91.3
Don’t remember 1.4 7.9 0.7 10.0 1.2 4.7
Partner’s marital status
Unmarried 96.6 98.0 94.1 98.4 97.3 97.6
Married 3.4 2.0 5.6 1.6 2.7 2.4
Nature of prior acquaintance with first partner
Relative 13.3 37.5 14.6 39.8 12.1 34.6
Fellow student/colleague 26.8 14.6 13.9 10.8 32.2 19.7
Neighbour/friend 39.7 31.2 47.4 30.1 37.2 32.7
Family friend 0.2 0.2 0.0 0.0 0.3 0.4
Person from outside village/neighbourhood 19.7 15.6 24.0 18.9 18.0 10.6
Other2 0.2 1.0 0.0 0.4 0.3 2.0
Duration of acquaintance
Less than 1 month 3.2 2.6 4.5 3.2 2.4 1.6
1–11 months 8.0 9.6 11.5 7.6 7.4 13.0
12 months or more 59.3 57.3 50.0 54.4 62.7 61.0
Since childhood 29.4 30.5 34.0 34.8 27.5 24.4
Partner’s religion
Same as respondent 82.3 75.4 81.2 83.2 81.7 64.4
Different from respondent 17.5 24.2 18.8 16.8 18.0 34.8
Partner’s caste
Same as respondent 54.8 65.2 59.0 73.2 52.2 54.2
Different from respondent 44.0 34.3 41.0 26.8 46.3 44.7
Partner’s socio-economic status
Same as respondent 44.4 32.7 51.7 34.8 42.6 29.6
Better than respondent 35.2 48.0 27.1 44.8 36.7 53.0
Worse than respondent 19.3 17.3 20.5 19.6 19.8 13.8
Number reporting a romantic relationship 426 535 297 281 329 254
Cont’d on next page...
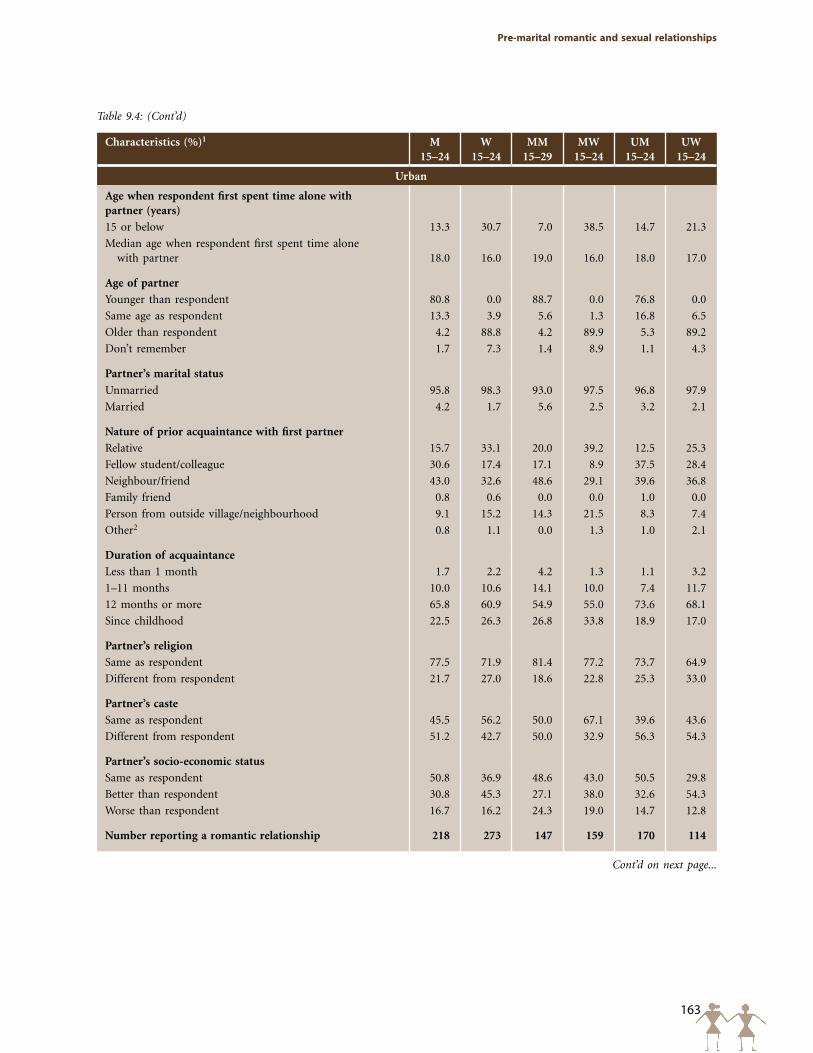
163
pre-marital romantic and sexual relationships
Characteristics (%)1 M 15–24
W 15–24
MM 15–29
MW 15–24
UM 15–24
UW 15–24
Urban
Age when respondent first spent time alone with partner (years)
15 or below 13.3 30.7 7.0 38.5 14.7 21.3
Median age when respondent first spent time alone with partner 18.0 16.0 19.0 16.0 18.0 17.0
Age of partner
Younger than respondent 80.8 0.0 88.7 0.0 76.8 0.0
Same age as respondent 13.3 3.9 5.6 1.3 16.8 6.5
Older than respondent 4.2 88.8 4.2 89.9 5.3 89.2
Don’t remember 1.7 7.3 1.4 8.9 1.1 4.3
Partner’s marital status
Unmarried 95.8 98.3 93.0 97.5 96.8 97.9
Married 4.2 1.7 5.6 2.5 3.2 2.1
Nature of prior acquaintance with first partner
Relative 15.7 33.1 20.0 39.2 12.5 25.3
Fellow student/colleague 30.6 17.4 17.1 8.9 37.5 28.4
Neighbour/friend 43.0 32.6 48.6 29.1 39.6 36.8
Family friend 0.8 0.6 0.0 0.0 1.0 0.0
Person from outside village/neighbourhood 9.1 15.2 14.3 21.5 8.3 7.4
Other2 0.8 1.1 0.0 1.3 1.0 2.1
Duration of acquaintance
Less than 1 month 1.7 2.2 4.2 1.3 1.1 3.2
1–11 months 10.0 10.6 14.1 10.0 7.4 11.7
12 months or more 65.8 60.9 54.9 55.0 73.6 68.1
Since childhood 22.5 26.3 26.8 33.8 18.9 17.0
Partner’s religion
Same as respondent 77.5 71.9 81.4 77.2 73.7 64.9
Different from respondent 21.7 27.0 18.6 22.8 25.3 33.0
Partner’s caste
Same as respondent 45.5 56.2 50.0 67.1 39.6 43.6
Different from respondent 51.2 42.7 50.0 32.9 56.3 54.3
Partner’s socio-economic status
Same as respondent 50.8 36.9 48.6 43.0 50.5 29.8
Better than respondent 30.8 45.3 27.1 38.0 32.6 54.3
Worse than respondent 16.7 16.2 24.3 19.0 14.7 12.8
Number reporting a romantic relationship 218 273 147 159 170 114
Table 9.4: (Cont’d)
Cont’d on next page...
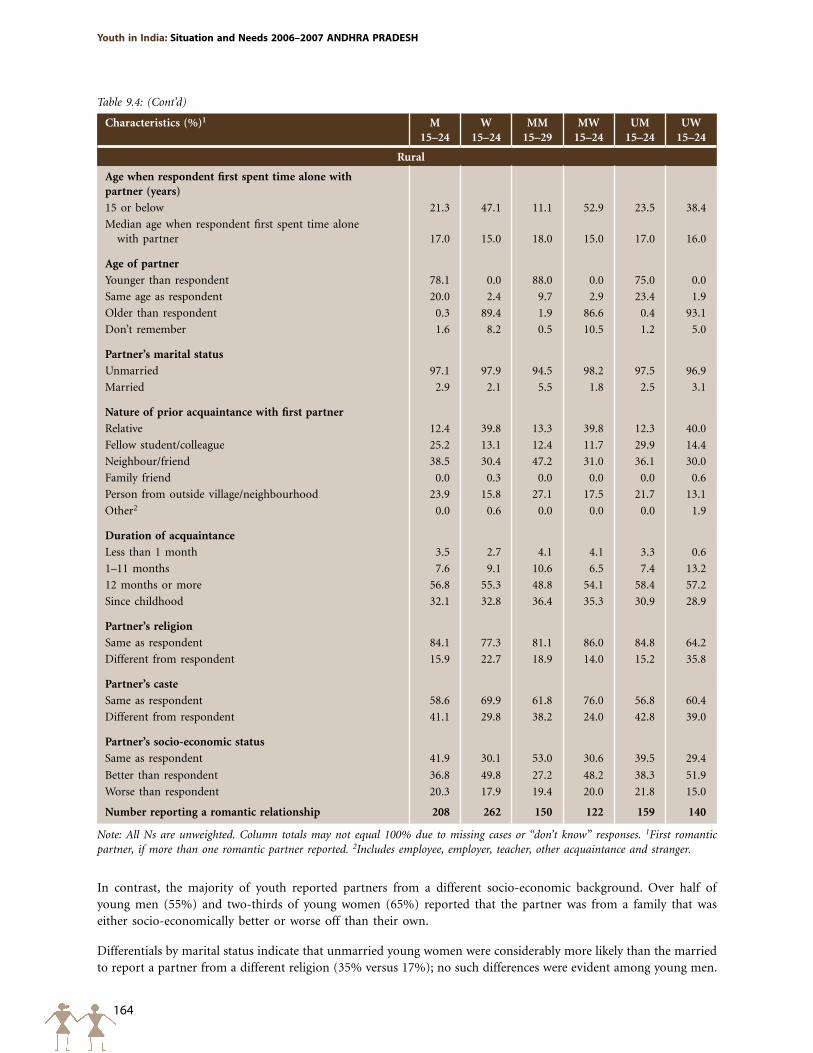
164
Youth in India: Situation and Needs 2006–2007 ANDHRA pRADESH
Characteristics (%)1 M 15–24
W 15–24
MM 15–29
MW 15–24
UM 15–24
UW 15–24
Rural
Age when respondent first spent time alone with partner (years)
15 or below 21.3 47.1 11.1 52.9 23.5 38.4
Median age when respondent first spent time alone with partner 17.0 15.0 18.0 15.0 17.0 16.0
Age of partner
Younger than respondent 78.1 0.0 88.0 0.0 75.0 0.0
Same age as respondent 20.0 2.4 9.7 2.9 23.4 1.9
Older than respondent 0.3 89.4 1.9 86.6 0.4 93.1
Don’t remember 1.6 8.2 0.5 10.5 1.2 5.0
Partner’s marital status
Unmarried 97.1 97.9 94.5 98.2 97.5 96.9
Married 2.9 2.1 5.5 1.8 2.5 3.1
Nature of prior acquaintance with first partner
Relative 12.4 39.8 13.3 39.8 12.3 40.0
Fellow student/colleague 25.2 13.1 12.4 11.7 29.9 14.4
Neighbour/friend 38.5 30.4 47.2 31.0 36.1 30.0
Family friend 0.0 0.3 0.0 0.0 0.0 0.6
Person from outside village/neighbourhood 23.9 15.8 27.1 17.5 21.7 13.1
Other2 0.0 0.6 0.0 0.0 0.0 1.9
Duration of acquaintance
Less than 1 month 3.5 2.7 4.1 4.1 3.3 0.6
1–11 months 7.6 9.1 10.6 6.5 7.4 13.2
12 months or more 56.8 55.3 48.8 54.1 58.4 57.2
Since childhood 32.1 32.8 36.4 35.3 30.9 28.9
Partner’s religion
Same as respondent 84.1 77.3 81.1 86.0 84.8 64.2
Different from respondent 15.9 22.7 18.9 14.0 15.2 35.8
Partner’s caste
Same as respondent 58.6 69.9 61.8 76.0 56.8 60.4
Different from respondent 41.1 29.8 38.2 24.0 42.8 39.0
Partner’s socio-economic status
Same as respondent 41.9 30.1 53.0 30.6 39.5 29.4
Better than respondent 36.8 49.8 27.2 48.2 38.3 51.9
Worse than respondent 20.3 17.9 19.4 20.0 21.8 15.0
Number reporting a romantic relationship 208 262 150 122 159 140
Note: All Ns are unweighted. Column totals may not equal 100% due to missing cases or “don’t know” responses. 1First romantic partner, if more than one romantic partner reported. 2Includes employee, employer, teacher, other acquaintance and stranger.
Table 9.4: (Cont’d)
In contrast, the majority of youth reported partners from a different socio-economic background. Over half of young men (55%) and two-thirds of young women (65%) reported that the partner was from a family that was either socio-economically better or worse off than their own.
Differentials by marital status indicate that unmarried young women were considerably more likely than the married to report a partner from a different religion (35% versus 17%); no such differences were evident among young men.
165
pre-marital romantic and sexual relationships
Findings also show that the unmarried were more likely than the married to report a partner from a different caste (46% versus 41% among young men and 45% versus 27% among young women). Unmarried young men were, likewise, more likely than their married counterparts to report a partner from a different socio-economic background (57% versus 48%); differences were narrower among young women. Rural-urban differences were mild with regard to partner’s religious background, although somewhat more urban than rural young men reported a partner from a different religion (22% versus 16%). Rural-urban differences in the partner’s caste and socio-economic background were wide. More urban than rural youth reported a partner from a caste other than their own (51% versus 41% among young men and 43% versus 30% among young women). In contrast, more rural than urban youth reported a partner from a different socio-economic background (57% versus 48% among young men and 68% versus 62% among young women).
Table 9.5 presents youth responses to questions regarding places in which youth met their first romantic partner secretly, without adults present. The majority of youth who reported romantic relationships met their first romantic partner in each other’s homes when other family members were absent (44% of young men and 51% of young women). At the same time, sizeable proportions of youth met secretly in places that offered them privacy or anonymity, including parks and gardens (39% of young men and 28% of young women), movie theatres (35% of young men and 26% of young women), places of worship (28% of young men and 39% of young women) and fields or grazing areas (22–24%). About 8–12% of youth reported not meeting their romantic partner in secret, without adults present, with unmarried youth somewhat more likely than married youth to report so (9% versus 4% among young men and 15% versus 10% among young women).
9.3.3 Parental and peer awareness of romantic partnerships
Table 9.6 reports findings on peer and parental awareness of young people’s romantic partnerships. Youth overwhelmingly (94% of young men and 82% of young women) reported that their peers were aware of their romantic relationships. A larger percentage of unmarried than married young men reported peer awareness of romantic relationships (95% versus 86%); among young women, however, somewhat more married than the unmarried so reported (84% versus 79%). Rural-urban differences were negligible, although somewhat more married young men and unmarried young women in urban than rural areas reported peer awareness of their romantic relationships, and conversely, more married young women in rural than urban areas so reported.
Relatively few youth reported that their parents were aware of these partnerships. Young women were more likely than young men to report that parents were aware of their relationship (59% and 40%, respectively), and the married were considerably more likely to report parental awareness than the unmarried (49% and 35% of young men and 74% and 38% of young women, respectively). Rural-urban differences were mild, although somewhat more urban than rural married young men reported parental awareness of their relationship (59% versus 46%). Gender differences may be attributed to the likelihood that young women, who tend to be more strictly supervised, have fewer opportunities to hide a relationship from their parents than young men. Differences by marital status may be attributed to the likelihood that revelation of the relationship could itself have triggered marriage, either to the same person or someone else, as seen in the panel on parental reactions.
The reported reactions of those parents who became aware of their children’s pre-marital romantic relationships are presented in Table 9.6. Given the small numbers, we provide findings for the rural and urban populations together. Parents’ reported reactions varied between young men and young women. Large proportions of young men and women reported negative reactions. Half of young men and over one-third of young women (36%) reported that their parents had shouted at them and one-fifth (18% and 21%, respectively) reported that their parents had beaten them. Some 7–12% of youth were not permitted to go out and 12–15% were forbidden from meeting their partner. Among young women, 2% were withdrawn from school as a consequence.
For considerable percentages of young women, parents reacted by arranging their marriages, more often to the romantic partner (42%) than to someone else (12%), perhaps in order to protect the family’s reputation. In contrast, few young men reported that their parents reacted in this way (2–6%).
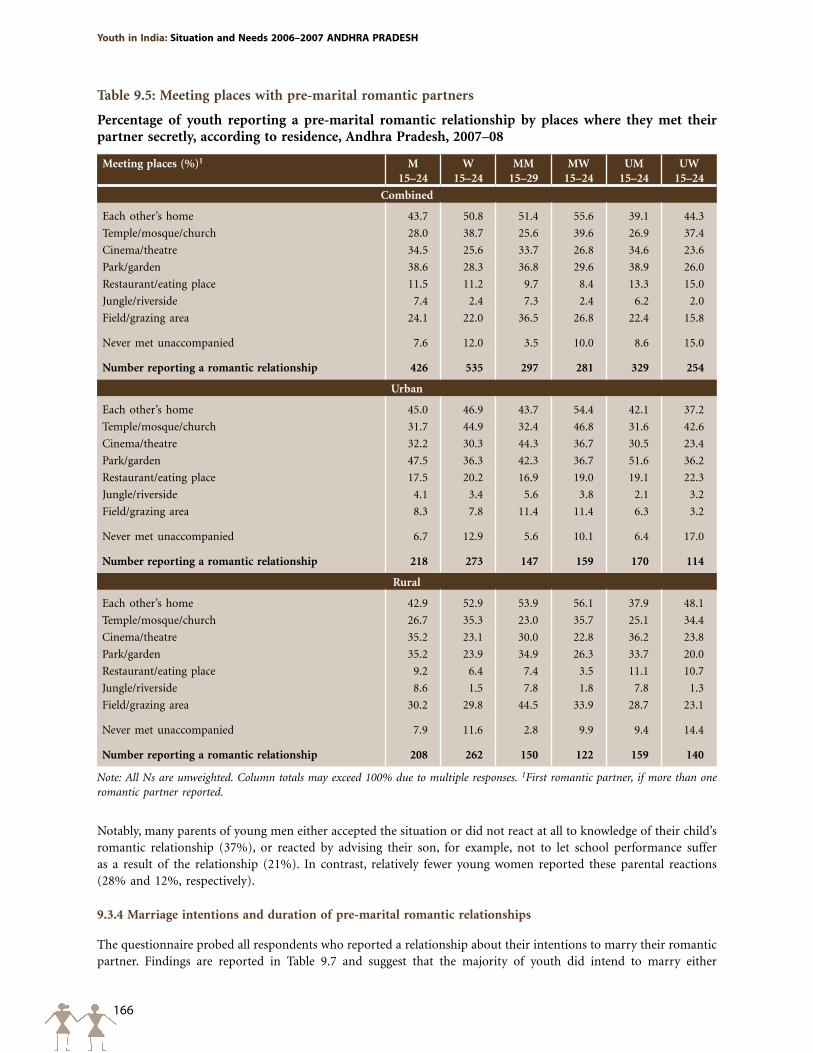
166
Youth in India: Situation and Needs 2006–2007 ANDHRA pRADESH
Table 9.5: Meeting places with pre-marital romantic partners
Percentage of youth reporting a pre-marital romantic relationship by places where they met their partner secretly, according to residence, Andhra Pradesh, 2007–08
Meeting places (%)1 M 15–24
W 15–24
MM 15–29
MW 15–24
UM 15–24
UW 15–24
Combined
Each other’s home 43.7 50.8 51.4 55.6 39.1 44.3
Temple/mosque/church 28.0 38.7 25.6 39.6 26.9 37.4
Cinema/theatre 34.5 25.6 33.7 26.8 34.6 23.6
Park/garden 38.6 28.3 36.8 29.6 38.9 26.0
Restaurant/eating place 11.5 11.2 9.7 8.4 13.3 15.0
Jungle/riverside 7.4 2.4 7.3 2.4 6.2 2.0
Field/grazing area 24.1 22.0 36.5 26.8 22.4 15.8
Never met unaccompanied 7.6 12.0 3.5 10.0 8.6 15.0
Number reporting a romantic relationship 426 535 297 281 329 254
Urban
Each other’s home 45.0 46.9 43.7 54.4 42.1 37.2
Temple/mosque/church 31.7 44.9 32.4 46.8 31.6 42.6
Cinema/theatre 32.2 30.3 44.3 36.7 30.5 23.4
Park/garden 47.5 36.3 42.3 36.7 51.6 36.2
Restaurant/eating place 17.5 20.2 16.9 19.0 19.1 22.3
Jungle/riverside 4.1 3.4 5.6 3.8 2.1 3.2
Field/grazing area 8.3 7.8 11.4 11.4 6.3 3.2
Never met unaccompanied 6.7 12.9 5.6 10.1 6.4 17.0
Number reporting a romantic relationship 218 273 147 159 170 114
Rural
Each other’s home 42.9 52.9 53.9 56.1 37.9 48.1
Temple/mosque/church 26.7 35.3 23.0 35.7 25.1 34.4
Cinema/theatre 35.2 23.1 30.0 22.8 36.2 23.8
Park/garden 35.2 23.9 34.9 26.3 33.7 20.0
Restaurant/eating place 9.2 6.4 7.4 3.5 11.1 10.7
Jungle/riverside 8.6 1.5 7.8 1.8 7.8 1.3
Field/grazing area 30.2 29.8 44.5 33.9 28.7 23.1
Never met unaccompanied 7.9 11.6 2.8 9.9 9.4 14.4
Number reporting a romantic relationship 208 262 150 122 159 140
Note: All Ns are unweighted. Column totals may exceed 100% due to multiple responses. 1First romantic partner, if more than one romantic partner reported.
Notably, many parents of young men either accepted the situation or did not react at all to knowledge of their child’s romantic relationship (37%), or reacted by advising their son, for example, not to let school performance suffer as a result of the relationship (21%). In contrast, relatively fewer young women reported these parental reactions (28% and 12%, respectively).
9.3.4 Marriage intentions and duration of pre-marital romantic relationships
The questionnaire probed all respondents who reported a relationship about their intentions to marry their romantic partner. Findings are reported in Table 9.7 and suggest that the majority of youth did intend to marry either
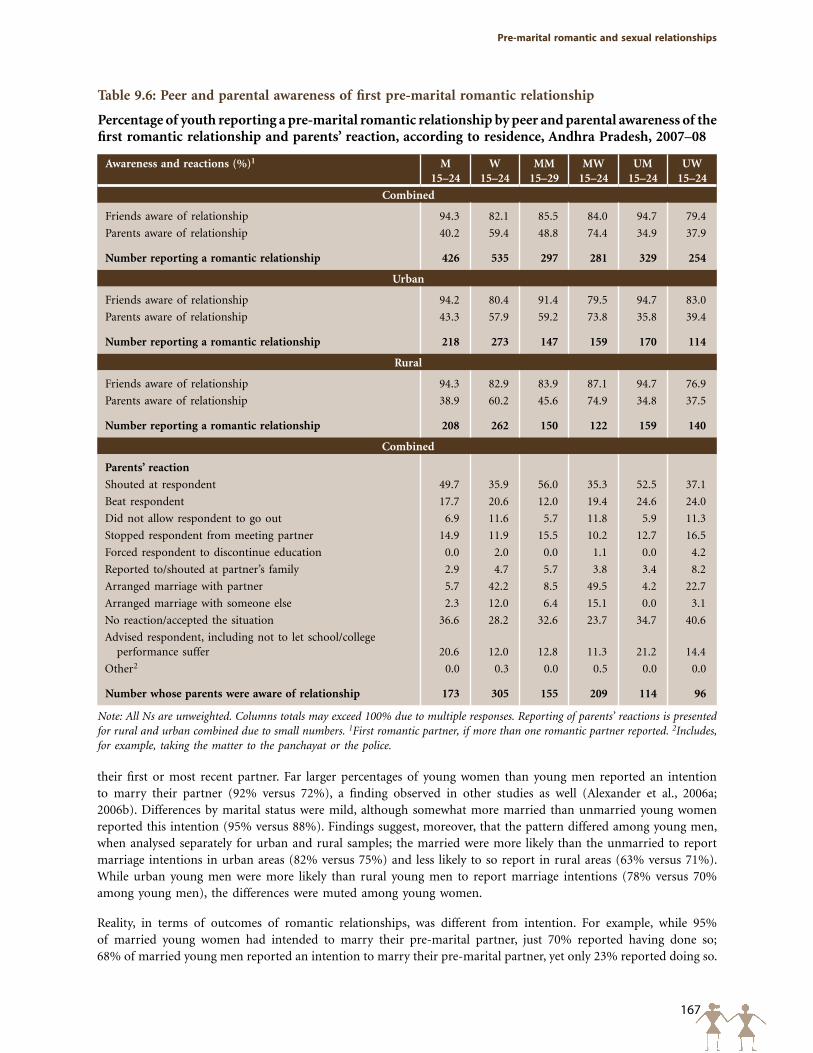
167
pre-marital romantic and sexual relationships
Table 9.6: Peer and parental awareness of first pre-marital romantic relationship
Percentage of youth reporting a pre-marital romantic relationship by peer and parental awareness of the first romantic relationship and parents’ reaction, according to residence, Andhra Pradesh, 2007–08
Awareness and reactions (%)1 M 15–24
W 15–24
MM 15–29
MW 15–24
UM 15–24
UW 15–24
Combined
Friends aware of relationship 94.3 82.1 85.5 84.0 94.7 79.4
Parents aware of relationship 40.2 59.4 48.8 74.4 34.9 37.9
Number reporting a romantic relationship 426 535 297 281 329 254
Urban
Friends aware of relationship 94.2 80.4 91.4 79.5 94.7 83.0
Parents aware of relationship 43.3 57.9 59.2 73.8 35.8 39.4
Number reporting a romantic relationship 218 273 147 159 170 114
Rural
Friends aware of relationship 94.3 82.9 83.9 87.1 94.7 76.9
Parents aware of relationship 38.9 60.2 45.6 74.9 34.8 37.5
Number reporting a romantic relationship 208 262 150 122 159 140
Combined
Parents’ reaction
Shouted at respondent 49.7 35.9 56.0 35.3 52.5 37.1
Beat respondent 17.7 20.6 12.0 19.4 24.6 24.0
Did not allow respondent to go out 6.9 11.6 5.7 11.8 5.9 11.3
Stopped respondent from meeting partner 14.9 11.9 15.5 10.2 12.7 16.5
Forced respondent to discontinue education 0.0 2.0 0.0 1.1 0.0 4.2
Reported to/shouted at partner’s family 2.9 4.7 5.7 3.8 3.4 8.2
Arranged marriage with partner 5.7 42.2 8.5 49.5 4.2 22.7
Arranged marriage with someone else 2.3 12.0 6.4 15.1 0.0 3.1
No reaction/accepted the situation 36.6 28.2 32.6 23.7 34.7 40.6
Advised respondent, including not to let school/college performance suffer 20.6 12.0 12.8 11.3 21.2 14.4
Other2 0.0 0.3 0.0 0.5 0.0 0.0
Number whose parents were aware of relationship 173 305 155 209 114 96
Note: All Ns are unweighted. Columns totals may exceed 100% due to multiple responses. Reporting of parents’ reactions is presented for rural and urban combined due to small numbers. 1First romantic partner, if more than one romantic partner reported. 2Includes, for example, taking the matter to the panchayat or the police.
their first or most recent partner. Far larger percentages of young women than young men reported an intention to marry their partner (92% versus 72%), a finding observed in other studies as well (Alexander et al., 2006a; 2006b). Differences by marital status were mild, although somewhat more married than unmarried young women reported this intention (95% versus 88%). Findings suggest, moreover, that the pattern differed among young men, when analysed separately for urban and rural samples; the married were more likely than the unmarried to report marriage intentions in urban areas (82% versus 75%) and less likely to so report in rural areas (63% versus 71%). While urban young men were more likely than rural young men to report marriage intentions (78% versus 70% among young men), the differences were muted among young women.
Reality, in terms of outcomes of romantic relationships, was different from intention. For example, while 95% of married young women had intended to marry their pre-marital partner, just 70% reported having done so; 68% of married young men reported an intention to marry their pre-marital partner, yet only 23% reported doing so.
168
Youth in India: Situation and Needs 2006–2007 ANDHRA pRADESH
Rural-urban differences were apparent; more urban than rural youth had married their pre-marital romantic partner (42% versus 17% among young men and 80% versus 66% among young women).
The majority of unmarried youth were still in a relationship at the time of the interview (57% of young men and 79% of young women); unmarried young women (but not young men) in urban areas were slightly more likely than those in rural areas to be in a relationship. Some 7–8% of married young men and women reported continuing a relationship with their pre-marital partner even after marriage; more rural than urban married youth reported so (9–10% versus 3%).
Among those who had discontinued their romantic relationship (the longest one, if more than one romantic partner was reported), relationships extended over fairly long time periods (more than one year for 48–50% of young men and women). Differences by marital status suggest that married young women (but not young men) were more likely than their unmarried counterparts to report that relationships extended over a year (52% versus 42%). Rural-urban differences varied between young men and young women; while somewhat more urban than rural young men reported that relationships extended over a year (55% versus 48%), a reverse pattern was evident among young women (36% versus 51%).
9.3.5 Pre-marital physical intimacy and sex with a romantic partner
Respondents who reported a pre-marital romantic relationship were asked whether they had engaged in a number of intimate behaviours with their romantic partner. These ranged from behaviours reflecting minimal physical intimacy (hand-holding, hugging) to those reflecting increased physical intimacy (kissing on the lips) and finally, engaging in sexual relations. Findings, presented in Table 9.8, refer to youth experiences of physical intimacy with their first and/or most recent romantic partner, if more than one.
While the large majority of youth had held hands with a romantic partner, consistently fewer reported progressively more intimate behaviours. Wide gender differences were apparent in reporting of such experiences as hand-holding, hugging and kissing on the lips. For example, 95% of young men compared to 82% of young women reported holding hands with a romantic partner and 77% and 63%, respectively, reported kissing their romantic partner on the lips. No such gender differences were, however, evident in the case of sexual experiences with a romantic partner, an equal percentage of young men and women reported such an experience (46%). Gender differences were however apparent when the married and unmarried, and the rural and urban were analysed separately. Among the married, for example, young men were consistently more likely than young women to report each of these forms of behaviour. Among urban youth, too, young men were more likely than young women to have held hands, hugged and kissed their romantic partner, they were somewhat less likely than young women to have engaged in sex (33% versus 38%).
Differences by marital status suggest that more married than unmarried youth reported each of these intimate behaviours (see also Figure 9.2). Differences by rural-urban residence differed somewhat between young men and women. Among young men, the differences were by and large mild, although rural young men were more likely than their urban counterparts to have engaged in sex with a romantic partner. Among both young men and women, larger proportions of those in rural than urban areas reported engaging in sex with a romantic partner (51% versus 33% among young men; 50% versus 38% among young women); young women in rural areas were also more likely than their urban counterparts to have hugged and kissed their romantic partners. Rural-urban differences, especially in the case of engaging in sex, may be attributed to the greater opportunities for privacy in rural than urban areas.
In short, findings confirm that pre-marital romantic relationships among youth almost always included some form of physical intimacy. Indeed, nearly half (46%) of youth who reported a pre-marital romantic relationship had experienced sex with a romantic partner.
9.3.6 Characteristics of sexual experiences within pre-marital romantic relationships
The Youth Study asked all respondents reporting pre-marital sex with a romantic partner about fears of pregnancy or infection at the time of first sex, condom and contraceptive decision-making and use at first and subsequent
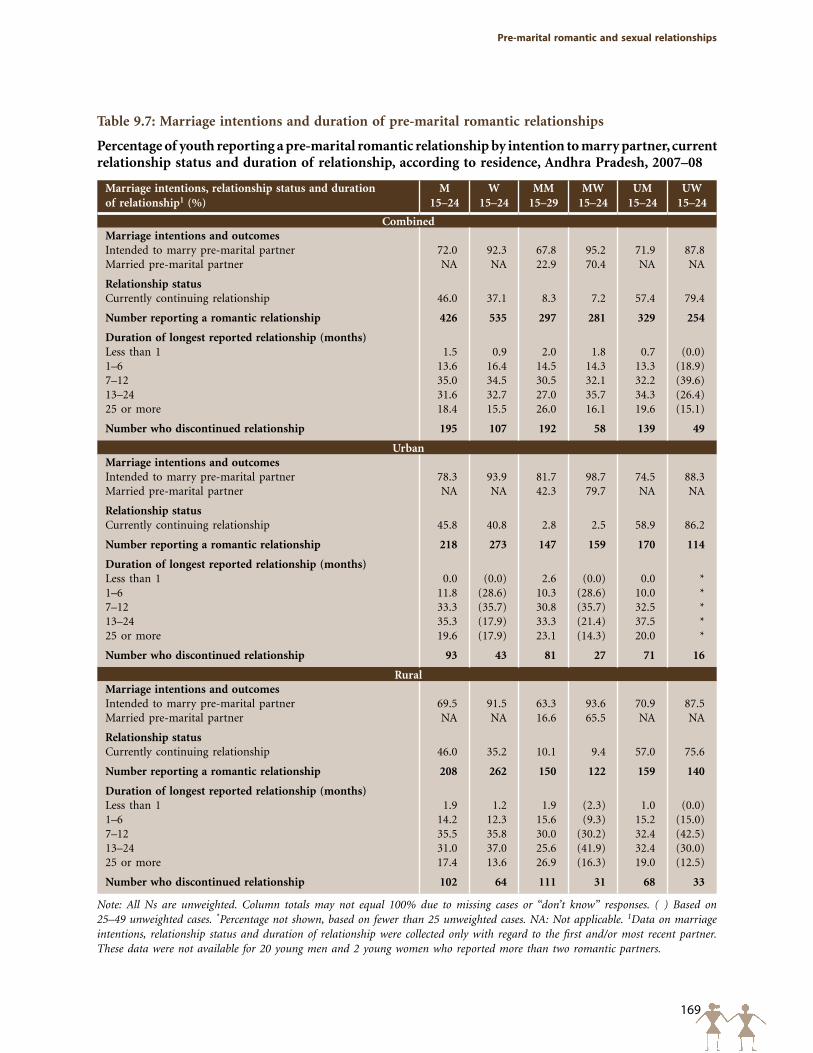
169
pre-marital romantic and sexual relationships
Table 9.7: Marriage intentions and duration of pre-marital romantic relationships
Percentage of youth reporting a pre-marital romantic relationship by intention to marry partner, current relationship status and duration of relationship, according to residence, Andhra Pradesh, 2007–08
Marriage intentions, relationship status and duration of relationship1 (%)
M 15–24
W 15–24
MM 15–29
MW 15–24
UM 15–24
UW 15–24
CombinedMarriage intentions and outcomes Intended to marry pre-marital partner 72.0 92.3 67.8 95.2 71.9 87.8Married pre-marital partner NA NA 22.9 70.4 NA NA
Relationship statusCurrently continuing relationship 46.0 37.1 8.3 7.2 57.4 79.4
Number reporting a romantic relationship 426 535 297 281 329 254
Duration of longest reported relationship (months)Less than 1 1.5 0.9 2.0 1.8 0.7 (0.0)1–6 13.6 16.4 14.5 14.3 13.3 (18.9)7–12 35.0 34.5 30.5 32.1 32.2 (39.6)13–24 31.6 32.7 27.0 35.7 34.3 (26.4)25 or more 18.4 15.5 26.0 16.1 19.6 (15.1)
Number who discontinued relationship 195 107 192 58 139 49
UrbanMarriage intentions and outcomes Intended to marry pre-marital partner 78.3 93.9 81.7 98.7 74.5 88.3Married pre-marital partner NA NA 42.3 79.7 NA NA
Relationship statusCurrently continuing relationship 45.8 40.8 2.8 2.5 58.9 86.2
Number reporting a romantic relationship 218 273 147 159 170 114
Duration of longest reported relationship (months)Less than 1 0.0 (0.0) 2.6 (0.0) 0.0 *1–6 11.8 (28.6) 10.3 (28.6) 10.0 *7–12 33.3 (35.7) 30.8 (35.7) 32.5 *13–24 35.3 (17.9) 33.3 (21.4) 37.5 *25 or more 19.6 (17.9) 23.1 (14.3) 20.0 *
Number who discontinued relationship 93 43 81 27 71 16
RuralMarriage intentions and outcomes Intended to marry pre-marital partner 69.5 91.5 63.3 93.6 70.9 87.5Married pre-marital partner NA NA 16.6 65.5 NA NA
Relationship statusCurrently continuing relationship 46.0 35.2 10.1 9.4 57.0 75.6
Number reporting a romantic relationship 208 262 150 122 159 140
Duration of longest reported relationship (months)Less than 1 1.9 1.2 1.9 (2.3) 1.0 (0.0)1–6 14.2 12.3 15.6 (9.3) 15.2 (15.0)7–12 35.5 35.8 30.0 (30.2) 32.4 (42.5)13–24 31.0 37.0 25.6 (41.9) 32.4 (30.0)25 or more 17.4 13.6 26.9 (16.3) 19.0 (12.5)
Number who discontinued relationship 102 64 111 31 68 33
Note: All Ns are unweighted. Column totals may not equal 100% due to missing cases or “don’t know” responses. ( ) Based on 25–49 unweighted cases. *Percentage not shown, based on fewer than 25 unweighted cases. NA: Not applicable. 1Data on marriage intentions, relationship status and duration of relationship were collected only with regard to the first and/or most recent partner. These data were not available for 20 young men and 2 young women who reported more than two romantic partners.
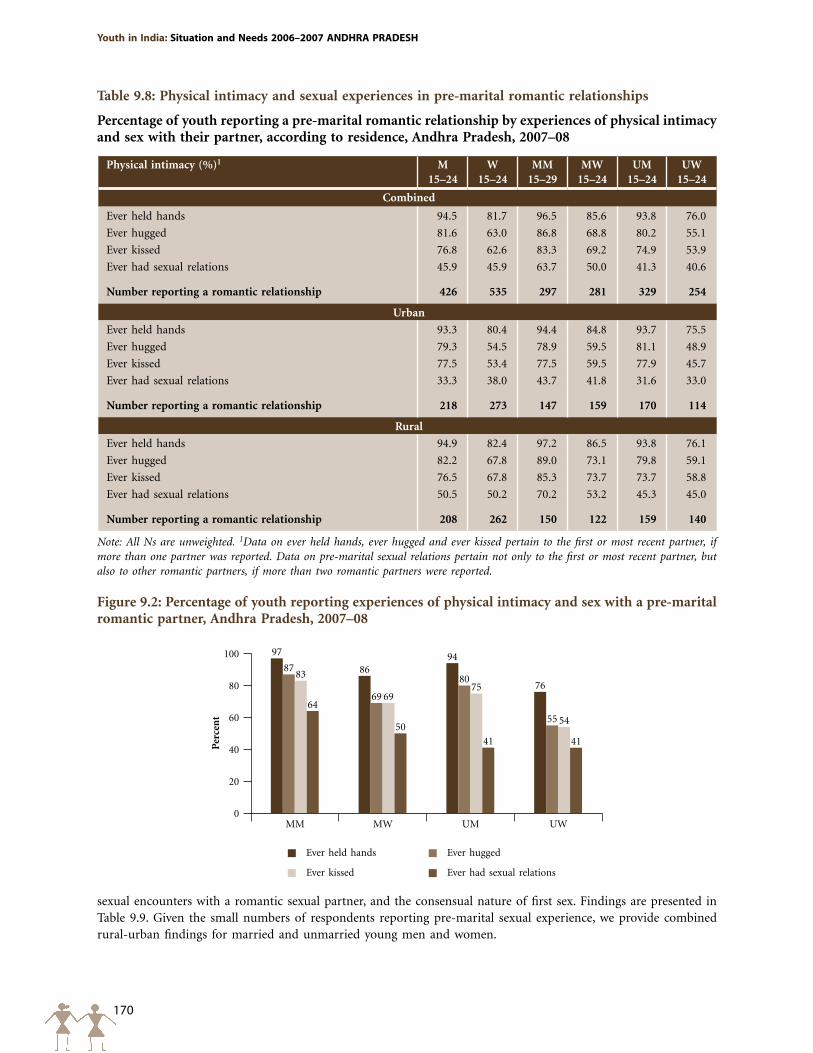
170
Youth in India: Situation and Needs 2006–2007 ANDHRA pRADESH
Figure 9.2: Percentage of youth reporting experiences of physical intimacy and sex with a pre-marital romantic partner, Andhra Pradesh, 2007–08
Per
cen
t
100
80
60
40
20
0
97
8694
76
87
69
80
55
83
6975
54
64
50
41 41
MM MW UM UW
Ever hugged
Ever had sexual relations
Ever held hands
Ever kissed
Table 9.8: Physical intimacy and sexual experiences in pre-marital romantic relationships
Percentage of youth reporting a pre-marital romantic relationship by experiences of physical intimacy and sex with their partner, according to residence, Andhra Pradesh, 2007–08
Physical intimacy (%)1 M 15–24
W 15–24
MM 15–29
MW 15–24
UM 15–24
UW 15–24
Combined
Ever held hands 94.5 81.7 96.5 85.6 93.8 76.0
Ever hugged 81.6 63.0 86.8 68.8 80.2 55.1
Ever kissed 76.8 62.6 83.3 69.2 74.9 53.9
Ever had sexual relations 45.9 45.9 63.7 50.0 41.3 40.6
Number reporting a romantic relationship 426 535 297 281 329 254
Urban
Ever held hands 93.3 80.4 94.4 84.8 93.7 75.5
Ever hugged 79.3 54.5 78.9 59.5 81.1 48.9
Ever kissed 77.5 53.4 77.5 59.5 77.9 45.7
Ever had sexual relations 33.3 38.0 43.7 41.8 31.6 33.0
Number reporting a romantic relationship 218 273 147 159 170 114
Rural
Ever held hands 94.9 82.4 97.2 86.5 93.8 76.1
Ever hugged 82.2 67.8 89.0 73.1 79.8 59.1
Ever kissed 76.5 67.8 85.3 73.7 73.7 58.8
Ever had sexual relations 50.5 50.2 70.2 53.2 45.3 45.0
Number reporting a romantic relationship 208 262 150 122 159 140
Note: All Ns are unweighted. 1Data on ever held hands, ever hugged and ever kissed pertain to the first or most recent partner, if more than one partner was reported. Data on pre-marital sexual relations pertain not only to the first or most recent partner, but also to other romantic partners, if more than two romantic partners were reported.
sexual encounters with a romantic sexual partner, and the consensual nature of first sex. Findings are presented in Table 9.9. Given the small numbers of respondents reporting pre-marital sexual experience, we provide combined rural-urban findings for married and unmarried young men and women.
171
pre-marital romantic and sexual relationships
Among those who reported sexual experience within pre-marital romantic relationships, many more young women than men reported fear of pregnancy or infection at the time of first sex. For example, fear of pregnancy was reported by 28% of young men and 49% of young women; far fewer young men and women reported fear of infection, 6% and 14%, respectively. Unmarried young men were somewhat more likely than married young men to report fear of pregnancy (32% versus 26%), but were as likely to report fear of infection (4–5%). Among young women, the unmarried were more likely than the married to report fear of both pregnancy (54% and 46%, respectively) and infection (18% and 11%, respectively).
Reported contraceptive use at first pre-marital sex with a romantic partner and consistent contraceptive use in subsequent sexual encounters were limited. In total, just 24% of young men and 9% of young women reported using contraception at first sex, and 19% and 3%, respectively, reported that contraception was consistently practised in all sexual encounters with their romantic opposite-sex partner(s). More unmarried than married youth reported using contraception at first sex (26% compared to 20% among young men and 15% compared to 6% among young women) and consistent contraceptive use (20% versus 10% among young men and 7% versus 1% among young women).
Condom use was limited. Just 20% of young men and 6% of young women had used a condom during their first sexual encounter with a romantic partner. Even so, it is clear that the majority of those who practised contraception at first sex used a condom (85% of young men and 70% of young women). Of note, however, is that fewer married than unmarried youth who practised contraception at first sex used a condom (57–69% compared to 80–85%). Somewhat fewer—16% of young men and 3% of young women—reported that they had used condoms in all sexual encounters with their romantic partner(s). Virtually all young men and women who used a condom at first sex, irrespective of marital status, reported doing so to prevent pregnancy, many fewer reported doing so to prevent infection as well.
Youth reports of decision-making regarding contraceptive use at first pre-marital sex with an opposite-sex romantic partner reveal that, in many cases, the female partner was involved in the decision to practise contraception at first sex. While 24% of young men and 9% of young women had practised contraception at first sex with an opposite-sex romantic partner, as many as 16% and 6%, respectively, reported that the female partner had participated in the decision.
While the majority of young men and women reported that their first experience of pre-marital sex with an opposite-sex romantic partner was consensual, several youth reported that it occurred without consent. Gender differences were modest. For example, 81% of young men and 76% of young women reported that sex was consensual. A small minority of young women (6%) reported that their opposite-sex romantic partner had forced them to engage in sex the first time and 3% of young men acknowledged that they had forced their partner to do so. Somewhat larger percentages of young men (10%) and women (14%) reported that the male partner had persuaded the female partner to engage in sexual relations. Very few youth reported that the female partner had persuaded (3–4%) or forced (1–2%) the male partner to engage in sex.
Differences by marital status were mild, although more married than unmarried young men reported that their first experience of pre-marital sex with an opposite-sex romantic partner was consensual (88% versus 77%) and more unmarried than married young women reported that male partner had forced the female partner to engage in sexual relations (12% versus 3%).
9.4 Pre-marital sexual experiences within romantic and other relationships
Aside from the heterosexual romantic partnerships discussed in previous sections, the Youth Study also probed youth experiences of pre-marital sex with other partners, including casual partners and spouse before marriage, and in situations characterised by force and exchange of gifts or favours. In addition, in the case of male respondents, questions were asked about pre-marital sex with same-sex partners, sex workers and married women. In this and subsequent sections of this chapter, we present findings on the prevalence of pre-marital sexual experiences (irrespective of whether such experiences took place within romantic or other partnerships) among all youth in the sample.
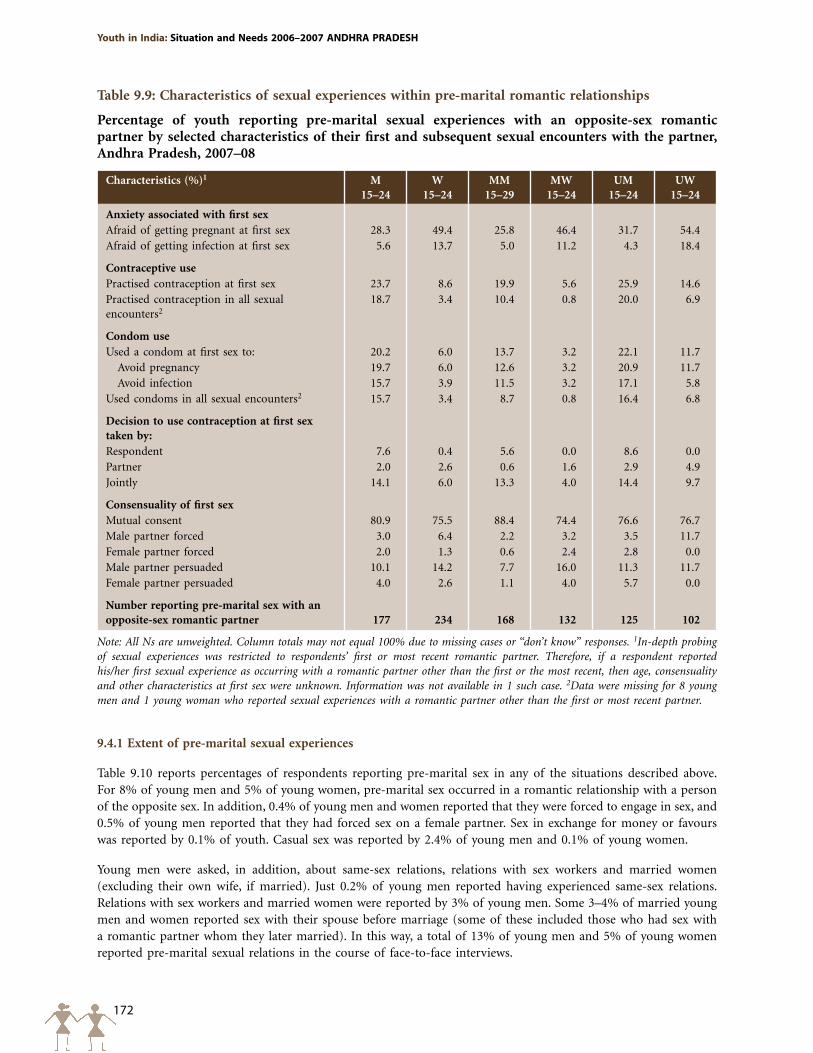
172
Youth in India: Situation and Needs 2006–2007 ANDHRA pRADESH
Table 9.9: Characteristics of sexual experiences within pre-marital romantic relationships
Percentage of youth reporting pre-marital sexual experiences with an opposite-sex romantic partner by selected characteristics of their first and subsequent sexual encounters with the partner, Andhra Pradesh, 2007–08
Characteristics (%)1 M 15–24
W 15–24
MM 15–29
MW 15–24
UM 15–24
UW 15–24
Anxiety associated with first sexAfraid of getting pregnant at first sex 28.3 49.4 25.8 46.4 31.7 54.4Afraid of getting infection at first sex 5.6 13.7 5.0 11.2 4.3 18.4
Contraceptive usePractised contraception at first sex 23.7 8.6 19.9 5.6 25.9 14.6Practised contraception in all sexual encounters2
18.7 3.4 10.4 0.8 20.0 6.9
Condom useUsed a condom at first sex to: 20.2 6.0 13.7 3.2 22.1 11.7 Avoid pregnancy 19.7 6.0 12.6 3.2 20.9 11.7 Avoid infection 15.7 3.9 11.5 3.2 17.1 5.8Used condoms in all sexual encounters2 15.7 3.4 8.7 0.8 16.4 6.8
Decision to use contraception at first sex taken by:Respondent 7.6 0.4 5.6 0.0 8.6 0.0Partner 2.0 2.6 0.6 1.6 2.9 4.9Jointly 14.1 6.0 13.3 4.0 14.4 9.7
Consensuality of first sex Mutual consent 80.9 75.5 88.4 74.4 76.6 76.7Male partner forced 3.0 6.4 2.2 3.2 3.5 11.7Female partner forced 2.0 1.3 0.6 2.4 2.8 0.0Male partner persuaded 10.1 14.2 7.7 16.0 11.3 11.7Female partner persuaded 4.0 2.6 1.1 4.0 5.7 0.0
Number reporting pre-marital sex with an opposite-sex romantic partner 177 234 168 132 125 102
Note: All Ns are unweighted. Column totals may not equal 100% due to missing cases or “don’t know” responses. 1In-depth probing of sexual experiences was restricted to respondents’ first or most recent romantic partner. Therefore, if a respondent reported his/her first sexual experience as occurring with a romantic partner other than the first or the most recent, then age, consensuality and other characteristics at first sex were unknown. Information was not available in 1 such case. 2Data were missing for 8 young men and 1 young woman who reported sexual experiences with a romantic partner other than the first or most recent partner.
9.4.1 Extent of pre-marital sexual experiences
Table 9.10 reports percentages of respondents reporting pre-marital sex in any of the situations described above. For 8% of young men and 5% of young women, pre-marital sex occurred in a romantic relationship with a person of the opposite sex. In addition, 0.4% of young men and women reported that they were forced to engage in sex, and 0.5% of young men reported that they had forced sex on a female partner. Sex in exchange for money or favours was reported by 0.1% of youth. Casual sex was reported by 2.4% of young men and 0.1% of young women.
Young men were asked, in addition, about same-sex relations, relations with sex workers and married women (excluding their own wife, if married). Just 0.2% of young men reported having experienced same-sex relations. Relations with sex workers and married women were reported by 3% of young men. Some 3–4% of married young men and women reported sex with their spouse before marriage (some of these included those who had sex with a romantic partner whom they later married). In this way, a total of 13% of young men and 5% of young women reported pre-marital sexual relations in the course of face-to-face interviews.
173
pre-marital romantic and sexual relationships
Several youth, particularly young men who had not admitted sexual experience in the face-to-face interview did so in the anonymous sealed envelope. Including these, in total, 16% of young men and 6% of young women had reported any pre-marital sexual experience. Although the Youth Study findings fall within ranges observed in a variety of small case studies (15–30% for males and fewer than 10% for females; Jejeebhoy and Sebastian, 2004), the possibility that youth opted not to disclose sexual experience in various situations cannot be discounted, particularly in the case of reporting by young women, and in the reporting of forced, same-sex or sex worker relations.
Married young men were twice as likely as the unmarried to report any pre-marital sexual experience (27% versus 14%), however, the differences were relatively narrow among young women (6% and 5%, respectively) (see also Figure 9.3). Rural-urban differences were muted among both young men and women; however, rural young men were somewhat more likely than their urban counterparts to report sex with a romantic opposite sex partner and this was particularly evident among the married (14% versus 10%).
Table 9.11 presents percentages reporting pre-marital sexual experience by selected socio-demographic characteristics of youth. As indicated earlier, such background characteristics as work status and household economic status reflect the situation of youth at the time of interview, and not necessarily at the time when pre-marital sex was experienced. In view of the small numbers of respondents reporting such experiences, findings are presented for all married and unmarried young men and women; findings for rural and urban respondents are not separately provided.
Age profiles confirm the positive association between age and pre-marital sexual experience among young men, with those aged 20–24 being twice as likely as younger respondents to report sexual experience (22% versus 10%). Differences were, however, muted among young women. Differentials by religion and caste were pronounced among both young men and women. Findings consistently show that Hindu and Muslim young men and women were less likely than those belonging to the other religions to report pre-marital sex, although the differences were narrow among young women. Among young men, for example, 15–16% of Hindus and Muslims reported pre-marital sex compared with 26% of those belonging to the other religions. Caste-wise differences suggest that young men from scheduled castes were more likely than others to report pre-marital sexual experience (24% versus 12–17%). Among young women, those from scheduled tribes were more likely than others to report pre-marital sex (13% versus 4–9%).
Associations between reported pre-marital sexual experience and both educational attainment and wealth quintile were inconsistent among both young men and women. However, among unmarried young women, those belonging to the poorest quintile were more likely than others to report pre-marital sexual experience (10% versus 4–6%). A strong positive relationship was observed with economic activity status among young men, a finding that may be attributed to the greater mobility and relative freedom from parental supervision experienced by working young men as compared to non-working young men. Young men who had worked in the last year were considerably more likely than non-working young men to have experienced pre-marital sex (20% versus 7%). No such differences were, however, apparent among young women.
Socio-demographic differentials described above were by and large observed among both married and unmarried youth.
9.4.2 Age at initiation of pre-marital sex
Table 9.12 presents cumulative percentages of youth who experienced first pre-marital sex at selected ages (among all youth in the sample) calculated using life table techniques, with censoring taking place at the time of marriage for married youth and at the time of the interview for unmarried youth. For youth who reported pre-marital sex only through the anonymous sealed envelope method, age at first premarital sex was imputed conservatively, using age at marriage (for the married) and current age (for the unmarried) as age at initiation of pre-marital sex.
Several findings are notable. First, roughly similar proportions of young men and women—3% and 5%, respectively—had initiated first sex before age 18. Second, youth in rural areas were considerably more likely to initiate pre-marital sexual relations in adolescence than their urban counterparts; for example, 10–12% of rural youth compared to 6–7% of urban youth had their sexual debut in adolescence, that is, before they were aged 20. Third, findings indicate notable increases in the initiation of pre-marital sexual activity as young people transitioned
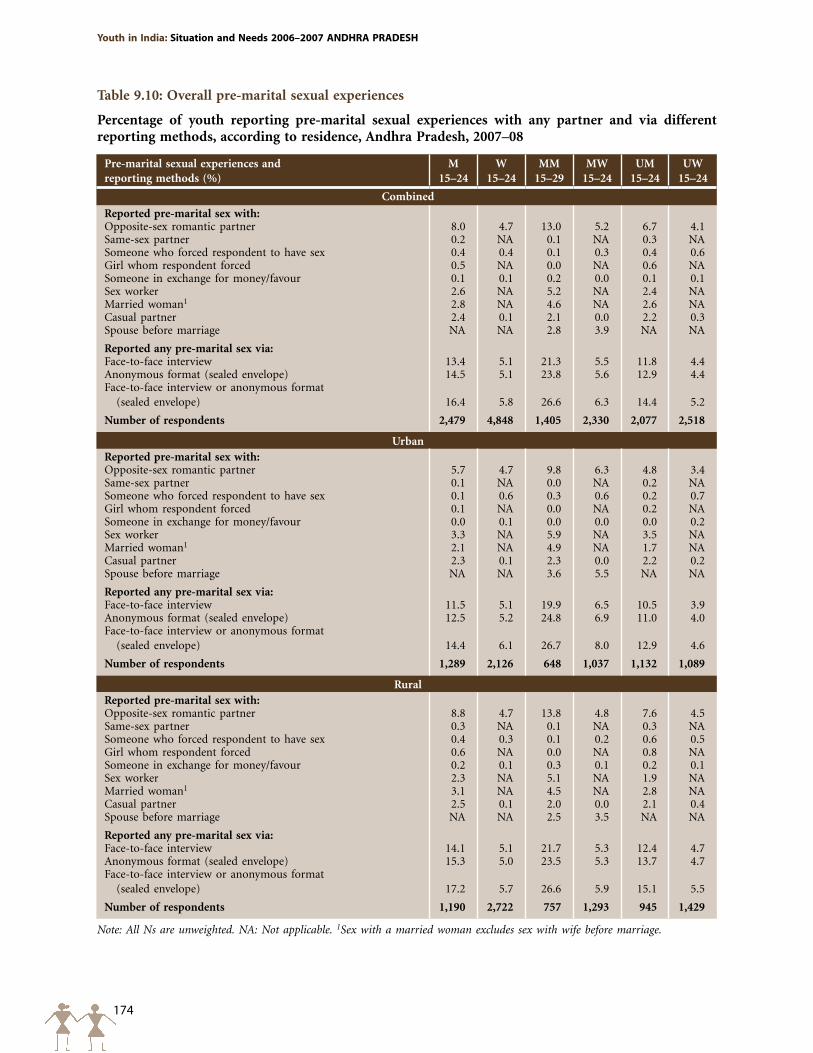
174
Youth in India: Situation and Needs 2006–2007 ANDHRA pRADESH
Table 9.10: Overall pre-marital sexual experiences
Percentage of youth reporting pre-marital sexual experiences with any partner and via different reporting methods, according to residence, Andhra Pradesh, 2007–08
Pre-marital sexual experiences and reporting methods (%)
M 15–24
W 15–24
MM 15–29
MW 15–24
UM 15–24
UW 15–24
Combined
Reported pre-marital sex with:Opposite-sex romantic partner 8.0 4.7 13.0 5.2 6.7 4.1Same-sex partner 0.2 NA 0.1 NA 0.3 NASomeone who forced respondent to have sex 0.4 0.4 0.1 0.3 0.4 0.6Girl whom respondent forced 0.5 NA 0.0 NA 0.6 NASomeone in exchange for money/favour 0.1 0.1 0.2 0.0 0.1 0.1Sex worker 2.6 NA 5.2 NA 2.4 NAMarried woman1 2.8 NA 4.6 NA 2.6 NACasual partner 2.4 0.1 2.1 0.0 2.2 0.3Spouse before marriage NA NA 2.8 3.9 NA NA
Reported any pre-marital sex via:Face-to-face interview 13.4 5.1 21.3 5.5 11.8 4.4Anonymous format (sealed envelope) 14.5 5.1 23.8 5.6 12.9 4.4Face-to-face interview or anonymous format
(sealed envelope) 16.4 5.8 26.6 6.3 14.4 5.2
Number of respondents 2,479 4,848 1,405 2,330 2,077 2,518
UrbanReported pre-marital sex with:Opposite-sex romantic partner 5.7 4.7 9.8 6.3 4.8 3.4Same-sex partner 0.1 NA 0.0 NA 0.2 NASomeone who forced respondent to have sex 0.1 0.6 0.3 0.6 0.2 0.7Girl whom respondent forced 0.1 NA 0.0 NA 0.2 NASomeone in exchange for money/favour 0.0 0.1 0.0 0.0 0.0 0.2Sex worker 3.3 NA 5.9 NA 3.5 NAMarried woman1 2.1 NA 4.9 NA 1.7 NACasual partner 2.3 0.1 2.3 0.0 2.2 0.2Spouse before marriage NA NA 3.6 5.5 NA NA
Reported any pre-marital sex via:Face-to-face interview 11.5 5.1 19.9 6.5 10.5 3.9Anonymous format (sealed envelope) 12.5 5.2 24.8 6.9 11.0 4.0Face-to-face interview or anonymous format
(sealed envelope) 14.4 6.1 26.7 8.0 12.9 4.6
Number of respondents 1,289 2,126 648 1,037 1,132 1,089
RuralReported pre-marital sex with:Opposite-sex romantic partner 8.8 4.7 13.8 4.8 7.6 4.5Same-sex partner 0.3 NA 0.1 NA 0.3 NASomeone who forced respondent to have sex 0.4 0.3 0.1 0.2 0.6 0.5Girl whom respondent forced 0.6 NA 0.0 NA 0.8 NASomeone in exchange for money/favour 0.2 0.1 0.3 0.1 0.2 0.1Sex worker 2.3 NA 5.1 NA 1.9 NAMarried woman1 3.1 NA 4.5 NA 2.8 NACasual partner 2.5 0.1 2.0 0.0 2.1 0.4Spouse before marriage NA NA 2.5 3.5 NA NA
Reported any pre-marital sex via:Face-to-face interview 14.1 5.1 21.7 5.3 12.4 4.7Anonymous format (sealed envelope) 15.3 5.0 23.5 5.3 13.7 4.7Face-to-face interview or anonymous format
(sealed envelope) 17.2 5.7 26.6 5.9 15.1 5.5
Number of respondents 1,190 2,722 757 1,293 945 1,429
Note: All Ns are unweighted. NA: Not applicable. 1Sex with a married woman excludes sex with wife before marriage.
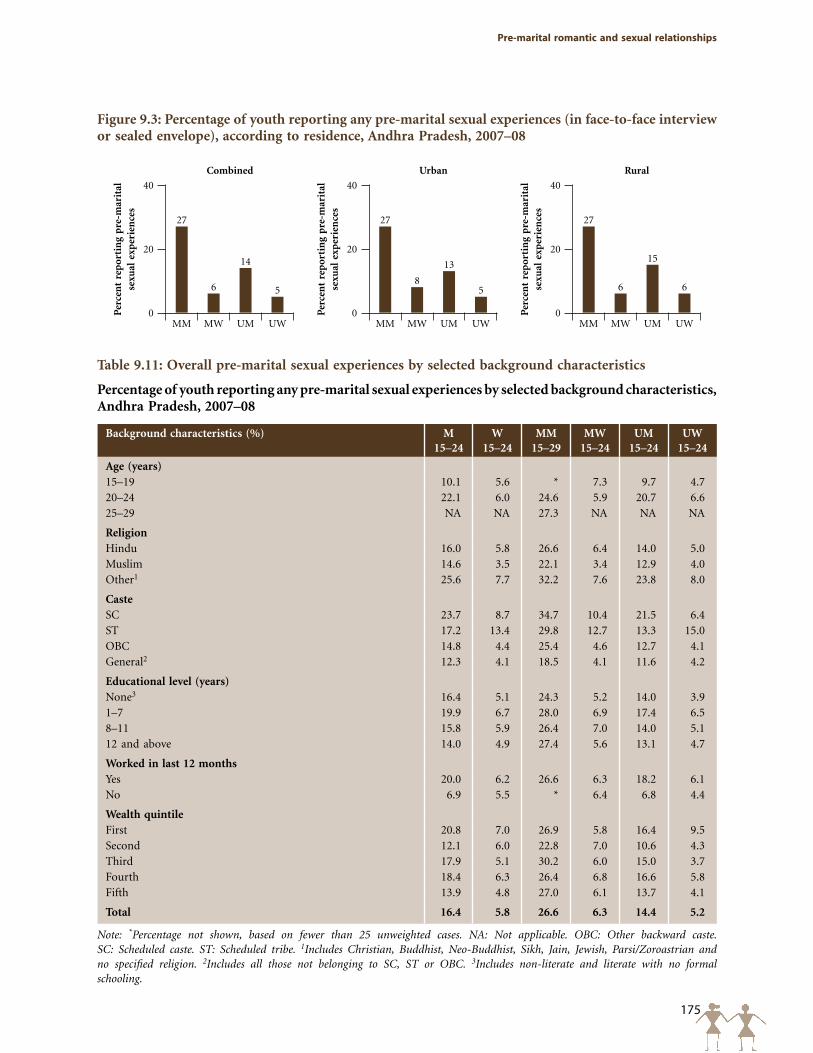
175
pre-marital romantic and sexual relationships
Figure 9.3: Percentage of youth reporting any pre-marital sexual experiences (in face-to-face interview or sealed envelope), according to residence, Andhra Pradesh, 2007–08
Per
cen
t re
por
tin
g p
re-m
arit
al
sexu
al e
xper
ien
ces
40
20
0
27
6
14
5
MM MW UM UW
Combined
Per
cen
t re
por
tin
g p
re-m
arit
al
sexu
al e
xper
ien
ces
40
20
0
27
8
13
5
MM MW UM UW
Urban
Per
cen
t re
por
tin
g p
re-m
arit
al
sexu
al e
xper
ien
ces
40
20
0
27
6
15
6
MM MW UM UW
Rural
Table 9.11: Overall pre-marital sexual experiences by selected background characteristics
Percentage of youth reporting any pre-marital sexual experiences by selected background characteristics, Andhra Pradesh, 2007–08
Background characteristics (%) M 15–24
W 15–24
MM 15–29
MW 15–24
UM 15–24
UW 15–24
Age (years)15–19 10.1 5.6 * 7.3 9.7 4.720–24 22.1 6.0 24.6 5.9 20.7 6.625–29 NA NA 27.3 NA NA NA
Religion Hindu 16.0 5.8 26.6 6.4 14.0 5.0Muslim 14.6 3.5 22.1 3.4 12.9 4.0Other1 25.6 7.7 32.2 7.6 23.8 8.0
CasteSC 23.7 8.7 34.7 10.4 21.5 6.4ST 17.2 13.4 29.8 12.7 13.3 15.0OBC 14.8 4.4 25.4 4.6 12.7 4.1General2 12.3 4.1 18.5 4.1 11.6 4.2
Educational level (years)None3 16.4 5.1 24.3 5.2 14.0 3.91–7 19.9 6.7 28.0 6.9 17.4 6.58–11 15.8 5.9 26.4 7.0 14.0 5.112 and above 14.0 4.9 27.4 5.6 13.1 4.7
Worked in last 12 monthsYes 20.0 6.2 26.6 6.3 18.2 6.1No 6.9 5.5 * 6.4 6.8 4.4
Wealth quintileFirst 20.8 7.0 26.9 5.8 16.4 9.5Second 12.1 6.0 22.8 7.0 10.6 4.3Third 17.9 5.1 30.2 6.0 15.0 3.7Fourth 18.4 6.3 26.4 6.8 16.6 5.8Fifth 13.9 4.8 27.0 6.1 13.7 4.1
Total 16.4 5.8 26.6 6.3 14.4 5.2
Note: *Percentage not shown, based on fewer than 25 unweighted cases. NA: Not applicable. OBC: Other backward caste. SC: Scheduled caste. ST: Scheduled tribe. 1Includes Christian, Buddhist, Neo-Buddhist, Sikh, Jain, Jewish, Parsi/Zoroastrian and no specified religion. 2Includes all those not belonging to SC, ST or OBC. 3Includes non-literate and literate with no formal schooling.
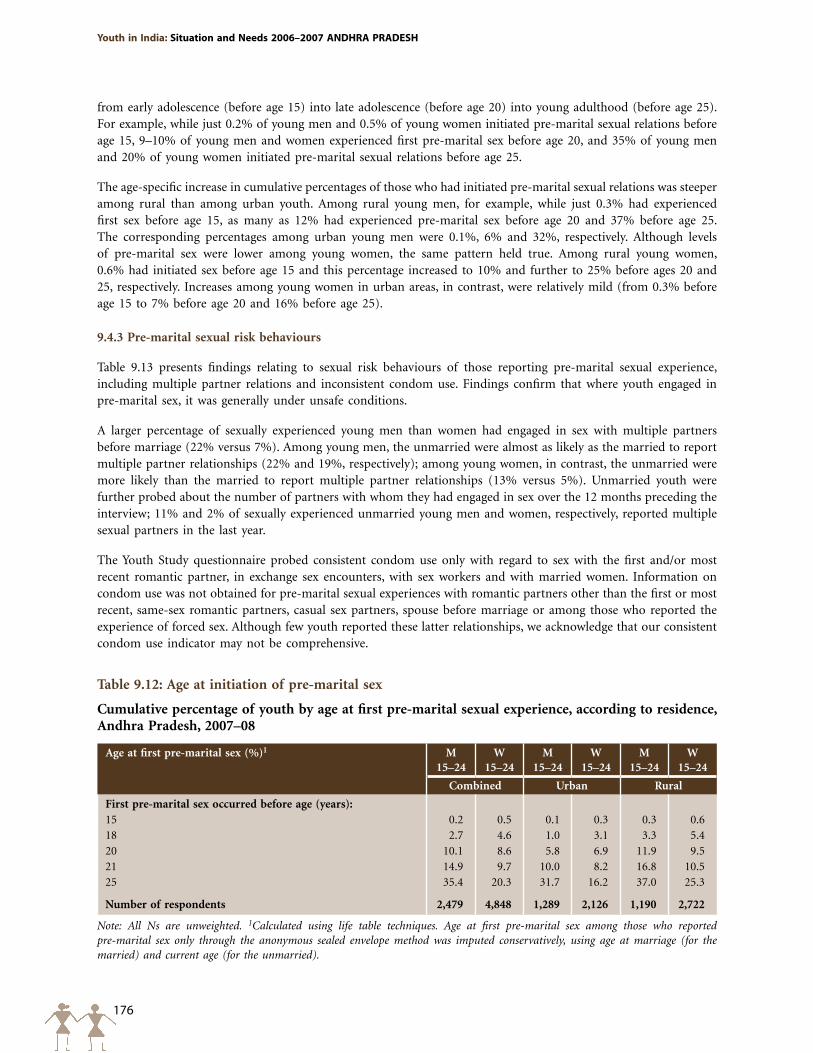
176
Youth in India: Situation and Needs 2006–2007 ANDHRA pRADESH
from early adolescence (before age 15) into late adolescence (before age 20) into young adulthood (before age 25). For example, while just 0.2% of young men and 0.5% of young women initiated pre-marital sexual relations before age 15, 9–10% of young men and women experienced first pre-marital sex before age 20, and 35% of young men and 20% of young women initiated pre-marital sexual relations before age 25.
The age-specific increase in cumulative percentages of those who had initiated pre-marital sexual relations was steeper among rural than among urban youth. Among rural young men, for example, while just 0.3% had experienced first sex before age 15, as many as 12% had experienced pre-marital sex before age 20 and 37% before age 25. The corresponding percentages among urban young men were 0.1%, 6% and 32%, respectively. Although levels of pre-marital sex were lower among young women, the same pattern held true. Among rural young women, 0.6% had initiated sex before age 15 and this percentage increased to 10% and further to 25% before ages 20 and 25, respectively. Increases among young women in urban areas, in contrast, were relatively mild (from 0.3% before age 15 to 7% before age 20 and 16% before age 25).
9.4.3 Pre-marital sexual risk behaviours
Table 9.13 presents findings relating to sexual risk behaviours of those reporting pre-marital sexual experience, including multiple partner relations and inconsistent condom use. Findings confirm that where youth engaged in pre-marital sex, it was generally under unsafe conditions.
A larger percentage of sexually experienced young men than women had engaged in sex with multiple partners before marriage (22% versus 7%). Among young men, the unmarried were almost as likely as the married to report multiple partner relationships (22% and 19%, respectively); among young women, in contrast, the unmarried were more likely than the married to report multiple partner relationships (13% versus 5%). Unmarried youth were further probed about the number of partners with whom they had engaged in sex over the 12 months preceding the interview; 11% and 2% of sexually experienced unmarried young men and women, respectively, reported multiple sexual partners in the last year.
The Youth Study questionnaire probed consistent condom use only with regard to sex with the first and/or most recent romantic partner, in exchange sex encounters, with sex workers and with married women. Information on condom use was not obtained for pre-marital sexual experiences with romantic partners other than the first or most recent, same-sex romantic partners, casual sex partners, spouse before marriage or among those who reported the experience of forced sex. Although few youth reported these latter relationships, we acknowledge that our consistent condom use indicator may not be comprehensive.
Table 9.12: Age at initiation of pre-marital sex
Cumulative percentage of youth by age at first pre-marital sexual experience, according to residence, Andhra Pradesh, 2007–08
Age at first pre-marital sex (%)1 M 15–24
W 15–24
M 15–24
W 15–24
M 15–24
W 15–24
Combined Urban Rural
First pre-marital sex occurred before age (years):15 0.2 0.5 0.1 0.3 0.3 0.618 2.7 4.6 1.0 3.1 3.3 5.420 10.1 8.6 5.8 6.9 11.9 9.521 14.9 9.7 10.0 8.2 16.8 10.525 35.4 20.3 31.7 16.2 37.0 25.3
Number of respondents 2,479 4,848 1,289 2,126 1,190 2,722
Note: All Ns are unweighted. 1Calculated using life table techniques. Age at first pre-marital sex among those who reported pre-marital sex only through the anonymous sealed envelope method was imputed conservatively, using age at marriage (for the married) and current age (for the unmarried).
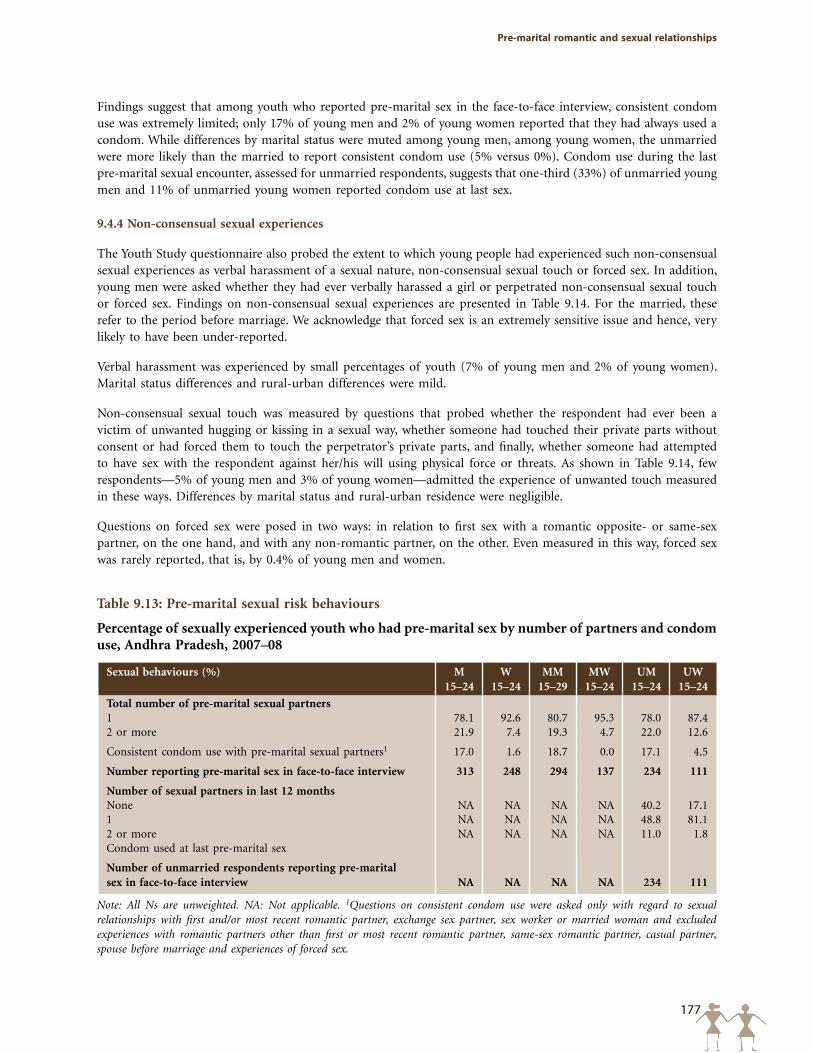
177
pre-marital romantic and sexual relationships
Findings suggest that among youth who reported pre-marital sex in the face-to-face interview, consistent condom use was extremely limited; only 17% of young men and 2% of young women reported that they had always used a condom. While differences by marital status were muted among young men, among young women, the unmarried were more likely than the married to report consistent condom use (5% versus 0%). Condom use during the last pre-marital sexual encounter, assessed for unmarried respondents, suggests that one-third (33%) of unmarried young men and 11% of unmarried young women reported condom use at last sex.
9.4.4 Non-consensual sexual experiences
The Youth Study questionnaire also probed the extent to which young people had experienced such non-consensual sexual experiences as verbal harassment of a sexual nature, non-consensual sexual touch or forced sex. In addition, young men were asked whether they had ever verbally harassed a girl or perpetrated non-consensual sexual touch or forced sex. Findings on non-consensual sexual experiences are presented in Table 9.14. For the married, these refer to the period before marriage. We acknowledge that forced sex is an extremely sensitive issue and hence, very likely to have been under-reported.
Verbal harassment was experienced by small percentages of youth (7% of young men and 2% of young women). Marital status differences and rural-urban differences were mild.
Non-consensual sexual touch was measured by questions that probed whether the respondent had ever been a victim of unwanted hugging or kissing in a sexual way, whether someone had touched their private parts without consent or had forced them to touch the perpetrator’s private parts, and finally, whether someone had attempted to have sex with the respondent against her/his will using physical force or threats. As shown in Table 9.14, few respondents—5% of young men and 3% of young women—admitted the experience of unwanted touch measured in these ways. Differences by marital status and rural-urban residence were negligible.
Questions on forced sex were posed in two ways: in relation to first sex with a romantic opposite- or same-sex partner, on the one hand, and with any non-romantic partner, on the other. Even measured in this way, forced sex was rarely reported, that is, by 0.4% of young men and women.
Table 9.13: Pre-marital sexual risk behaviours
Percentage of sexually experienced youth who had pre-marital sex by number of partners and condom use, Andhra Pradesh, 2007–08
Sexual behaviours (%) M 15–24
W 15–24
MM 15–29
MW 15–24
UM 15–24
UW 15–24
Total number of pre-marital sexual partners1 78.1 92.6 80.7 95.3 78.0 87.42 or more 21.9 7.4 19.3 4.7 22.0 12.6
Consistent condom use with pre-marital sexual partners1 17.0 1.6 18.7 0.0 17.1 4.5
Number reporting pre-marital sex in face-to-face interview 313 248 294 137 234 111
Number of sexual partners in last 12 monthsNone NA NA NA NA 40.2 17.11 NA NA NA NA 48.8 81.12 or more NA NA NA NA 11.0 1.8Condom used at last pre-marital sex
Number of unmarried respondents reporting pre-marital sex in face-to-face interview NA NA NA NA 234 111
Note: All Ns are unweighted. NA: Not applicable. 1Questions on consistent condom use were asked only with regard to sexual relationships with first and/or most recent romantic partner, exchange sex partner, sex worker or married woman and excluded experiences with romantic partners other than first or most recent romantic partner, same-sex romantic partner, casual partner, spouse before marriage and experiences of forced sex.
178
Youth in India: Situation and Needs 2006–2007 ANDHRA pRADESH
Young men’s reports of perpetration of these acts, presented in Table 9.14, suggest, however, that non-consensual sexual experiences may well have been under-reported by young women. Indeed, as many as 43% of young men admitted that they had ever verbally harassed a girl. Moreover, 31% of young men admitted touching or brushing past a girl without her consent. Unmarried young men were more likely than married young men to report perpetration of verbal harassment (44% versus 37%), but as likely to report perpetration of unwanted touch (30–31%). Rural-urban differences were negligible.
9.5 Triangulation of data on pre-marital sexual experiences among young people
Acknowledging that young people may have been reluctant to disclose behaviours perceived as socially unacceptable such as pre-marital sex, the Youth Study included three approaches to elicit data on sexual behaviours. These were face-to-face interviews, anonymous reporting of respondents’ own experiences via the sealed envelope and anonymous third-party reporting of peer experiences. Anonymous third-party reporting of peer experiences is a useful method by which to assess sensitive behaviours that individuals may be reluctant to disclose about themselves; findings are intended to shed light on the behaviours of the peer network and not necessarily on those of the individual himself or herself (Rossier, 2003).
We note that in anonymous third-party reporting, respondents may have reported as peers individuals whose ages fell outside our sample ages (15–24 and, in the case of married males, 15–29); therefore, in estimating pre-marital romantic and sexual experiences of young people using this reporting method, these individuals were excluded. In addition, we recognise that in anonymous third-party reporting, friends reported by one respondent may also be reported by others. In estimating pre-marital romantic and sexual experiences of young people using this reporting method, our analysis sought to minimise the chances that the experience of an individual belonging to more than one peer network would be included multiple times. Specifically, we inversely weighted the total sample of friends by the number of friends reported by each respondent. As a result, each respondent’s network was given equal weight irrespective of its size.
Findings, presented in Table 9.15, compare the levels of pre-marital romantic and sexual experiences obtained through these different approaches. Specifically, three indicators are presented: (a) percent reporting a pre-marital romantic relationship, (b) percent reporting the experience of pre-marital sex with a romantic opposite-sex partner, and (c) percent reporting any pre-marital sexual experience. For indicators a-b, we compare two sets of estimates derived from the face-to-face interview: respondents’ reports of their own experiences as well as third-party reporting of the experiences of their peers. For indicator c, we compare three sets of estimates: any pre-marital sex as reported in the face-to-face format; any pre-marital sex among peers as assessed through anonymous third-party reporting; and any pre-marital sex as reported in the face-to-face interview supplemented by reports of pre-marital sexual experience recorded in the anonymous format, using the sealed envelope.
Comparisons indicate differences in reporting level by sex of the respondent and type of behaviour under consideration. In terms of pre-marital romantic relationships, anonymous third-party reporting yielded higher rates than did face-to-face reporting for both young men and women. Differences were more apparent among young women than men (18% and 11%, respectively, among young women, and 20% and 17%, respectively, among young men), and similar patterns were observed among both married and unmarried young men and women. Differences in reporting were similar among young women in urban and rural areas, but wider among young men in urban than rural areas.
As far as reporting of experience of pre-marital sex with a romantic partner was concerned, differences were narrow. Young men and women were about as likely to report sexual relations with a romantic partner in the face-to-face interview as in the anonymous third-party reporting method. Among married young men in urban areas, however, the anonymous third-party reporting method provided mildly higher estimates of sexual experiences with a romantic partner than did the face-to-face interview.
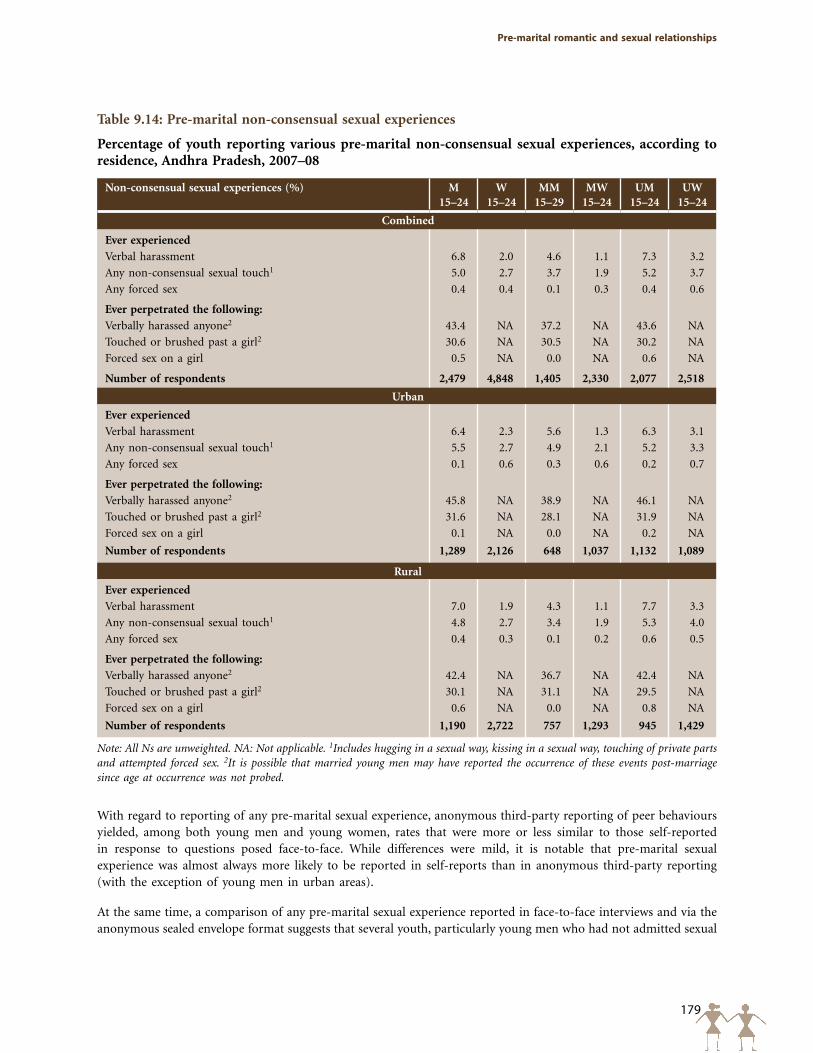
179
pre-marital romantic and sexual relationships
Table 9.14: Pre-marital non-consensual sexual experiences
Percentage of youth reporting various pre-marital non-consensual sexual experiences, according to residence, Andhra Pradesh, 2007–08
Non-consensual sexual experiences (%) M 15–24
W 15–24
MM 15–29
MW 15–24
UM 15–24
UW 15–24
Combined
Ever experienced
Verbal harassment 6.8 2.0 4.6 1.1 7.3 3.2
Any non-consensual sexual touch1 5.0 2.7 3.7 1.9 5.2 3.7
Any forced sex 0.4 0.4 0.1 0.3 0.4 0.6
Ever perpetrated the following:
Verbally harassed anyone2 43.4 NA 37.2 NA 43.6 NA
Touched or brushed past a girl2 30.6 NA 30.5 NA 30.2 NA
Forced sex on a girl 0.5 NA 0.0 NA 0.6 NA
Number of respondents 2,479 4,848 1,405 2,330 2,077 2,518
Urban
Ever experienced
Verbal harassment 6.4 2.3 5.6 1.3 6.3 3.1
Any non-consensual sexual touch1 5.5 2.7 4.9 2.1 5.2 3.3
Any forced sex 0.1 0.6 0.3 0.6 0.2 0.7
Ever perpetrated the following:
Verbally harassed anyone2 45.8 NA 38.9 NA 46.1 NA
Touched or brushed past a girl2 31.6 NA 28.1 NA 31.9 NA
Forced sex on a girl 0.1 NA 0.0 NA 0.2 NA
Number of respondents 1,289 2,126 648 1,037 1,132 1,089
Rural
Ever experienced
Verbal harassment 7.0 1.9 4.3 1.1 7.7 3.3
Any non-consensual sexual touch1 4.8 2.7 3.4 1.9 5.3 4.0
Any forced sex 0.4 0.3 0.1 0.2 0.6 0.5
Ever perpetrated the following:
Verbally harassed anyone2 42.4 NA 36.7 NA 42.4 NA
Touched or brushed past a girl2 30.1 NA 31.1 NA 29.5 NA
Forced sex on a girl 0.6 NA 0.0 NA 0.8 NA
Number of respondents 1,190 2,722 757 1,293 945 1,429
Note: All Ns are unweighted. NA: Not applicable. 1Includes hugging in a sexual way, kissing in a sexual way, touching of private parts and attempted forced sex. 2It is possible that married young men may have reported the occurrence of these events post-marriage since age at occurrence was not probed.
With regard to reporting of any pre-marital sexual experience, anonymous third-party reporting of peer behaviours yielded, among both young men and young women, rates that were more or less similar to those self-reported in response to questions posed face-to-face. While differences were mild, it is notable that pre-marital sexual experience was almost always more likely to be reported in self-reports than in anonymous third-party reporting (with the exception of young men in urban areas).
At the same time, a comparison of any pre-marital sexual experience reported in face-to-face interviews and via the anonymous sealed envelope format suggests that several youth, particularly young men who had not admitted sexual
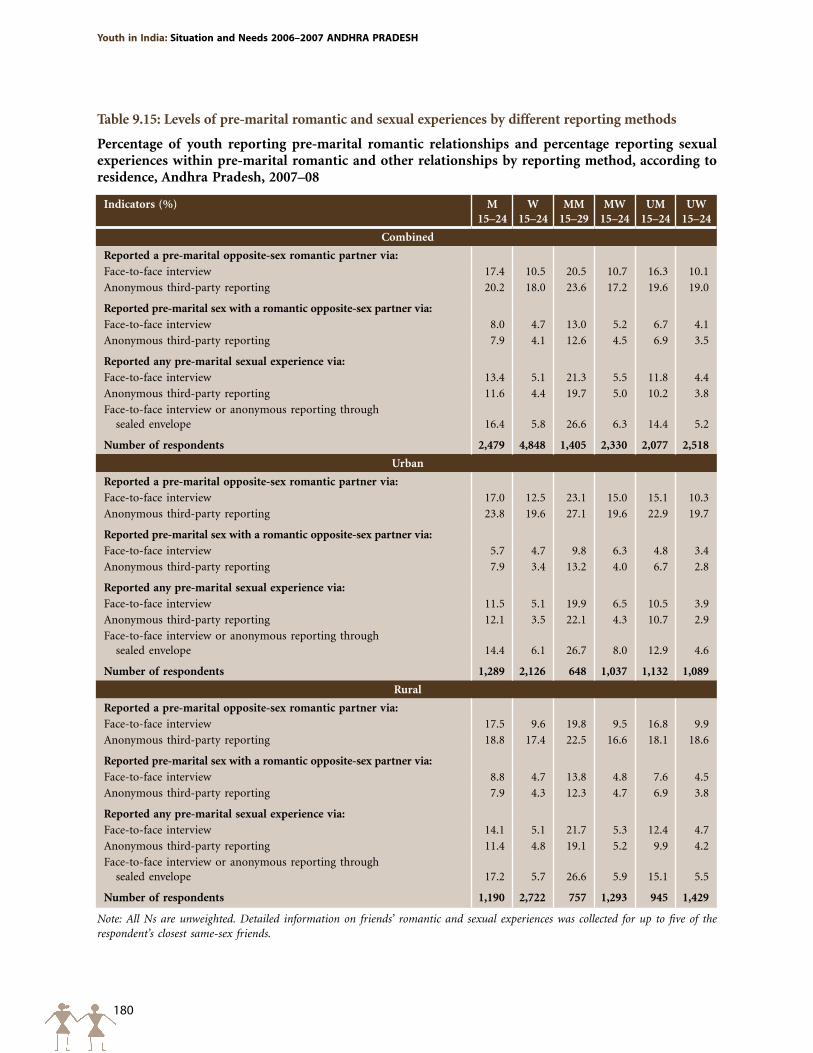
180
Youth in India: Situation and Needs 2006–2007 ANDHRA pRADESH
Table 9.15: Levels of pre-marital romantic and sexual experiences by different reporting methods
Percentage of youth reporting pre-marital romantic relationships and percentage reporting sexual experiences within pre-marital romantic and other relationships by reporting method, according to residence, Andhra Pradesh, 2007–08
Indicators (%) M 15–24
W 15–24
MM 15–29
MW 15–24
UM 15–24
UW 15–24
Combined
Reported a pre-marital opposite-sex romantic partner via:Face-to-face interview 17.4 10.5 20.5 10.7 16.3 10.1
Anonymous third-party reporting 20.2 18.0 23.6 17.2 19.6 19.0
Reported pre-marital sex with a romantic opposite-sex partner via:Face-to-face interview 8.0 4.7 13.0 5.2 6.7 4.1
Anonymous third-party reporting 7.9 4.1 12.6 4.5 6.9 3.5
Reported any pre-marital sexual experience via:Face-to-face interview 13.4 5.1 21.3 5.5 11.8 4.4
Anonymous third-party reporting 11.6 4.4 19.7 5.0 10.2 3.8
Face-to-face interview or anonymous reporting through sealed envelope 16.4 5.8 26.6 6.3 14.4 5.2
Number of respondents 2,479 4,848 1,405 2,330 2,077 2,518
Urban
Reported a pre-marital opposite-sex romantic partner via:Face-to-face interview 17.0 12.5 23.1 15.0 15.1 10.3
Anonymous third-party reporting 23.8 19.6 27.1 19.6 22.9 19.7
Reported pre-marital sex with a romantic opposite-sex partner via:Face-to-face interview 5.7 4.7 9.8 6.3 4.8 3.4
Anonymous third-party reporting 7.9 3.4 13.2 4.0 6.7 2.8
Reported any pre-marital sexual experience via:Face-to-face interview 11.5 5.1 19.9 6.5 10.5 3.9
Anonymous third-party reporting 12.1 3.5 22.1 4.3 10.7 2.9
Face-to-face interview or anonymous reporting through sealed envelope 14.4 6.1 26.7 8.0 12.9 4.6
Number of respondents 1,289 2,126 648 1,037 1,132 1,089
Rural
Reported a pre-marital opposite-sex romantic partner via:Face-to-face interview 17.5 9.6 19.8 9.5 16.8 9.9
Anonymous third-party reporting 18.8 17.4 22.5 16.6 18.1 18.6
Reported pre-marital sex with a romantic opposite-sex partner via:Face-to-face interview 8.8 4.7 13.8 4.8 7.6 4.5
Anonymous third-party reporting 7.9 4.3 12.3 4.7 6.9 3.8
Reported any pre-marital sexual experience via:Face-to-face interview 14.1 5.1 21.7 5.3 12.4 4.7
Anonymous third-party reporting 11.4 4.8 19.1 5.2 9.9 4.2
Face-to-face interview or anonymous reporting through sealed envelope 17.2 5.7 26.6 5.9 15.1 5.5
Number of respondents 1,190 2,722 757 1,293 945 1,429
Note: All Ns are unweighted. Detailed information on friends’ romantic and sexual experiences was collected for up to five of the respondent’s closest same-sex friends.
181
pre-marital romantic and sexual relationships
experience in the face-to-face interview did so in the anonymous format: 3% of young men and less than 1% of young women. Indeed, 18% of young men and 14% of young women who reported sexual experience did so only in this more anonymous format (not shown in tabular form). It would appear, therefore, that self-reports of sexual experience, supplemented by self-reported experience in an anonymous format, provide consistently higher estimates of pre-marital sex among youth than does anonymous third-party reporting of pre-marital sexual experience among peers: for example, while 12% of young men reported pre-marital sex through anonymous third-party reporting, 16% acknowledged the experience through direct reporting. Among young women too, direct reporting yielded somewhat higher estimates than anonymous third-party reporting (6% versus 4%).
9.6 Summary
Findings confirm that despite strict norms prohibiting pre-marital opposite-sex mixing, opportunities do exist for the formation of pre-marital romantic relationships. Indeed, significant minorities of young men and women have made or received a “proposal” for a romantic relationship (23%), and noteworthy, if smaller, percentages reported that they had been involved in a romantic partnership (17% and 11% of young men and women, respectively). Patterns of pre-marital romantic partnerships suggest that where partnerships occurred, they were initiated at an early age by many, were hidden from parents by many, but were rarely hidden from peers. Notable disparities in expectations of a longer-term commitment emerged that show that young women were more likely than young men to have expected a romantic relationship to lead to marriage. The experiences of the married suggest, moreover, a disconnect between intentions and reality: although almost all (95%) young women and two-thirds (68%) of young men reported the intention to marry their pre-marital partner, fewer—70% of young women and 23% of young men—had done so.
While the majority—95% of young men and 82% of young women—had held hands with a romantic partner, fewer—46%—had engaged in sexual relations with their partner. It is notable that unlike the findings of many previous studies, no gender differences in reports of pre-marital sex with a romantic partner were apparent. Findings suggest, moreover, that the vast majority had engaged in unprotected sex. However, many young men and women who reported contraception at first sex reported that the female partner was involved in the decision. Very few young women who had engaged in sexual relations with a romantic partner reported that their opposite-sex romantic partner had forced them to engage in sex the first time.
In total, 16% of young men and 6% of young women reported the experience of pre-marital sex within romantic and/or other partnerships. Roughly similar proportions of young men and women—3% and 5%, respectively—had initiated first sex before age 18; however, larger proportions of youth in rural than urban areas had initiated pre-marital sexual relations in adolescence. Moreover, initiation into pre-marital sexual activity increased as young people transitioned from early into late adolescence and further as they transitioned into young adulthood.
While sex with a romantic partner characterised pre-marital sexual experiences for many of the sexually experienced, findings suggest that young men, but not young women, also engaged in sex in other contexts; other partners reported by young men included, mainly, sex workers, married women and casual partners. Many of the pre-marital sexual experiences reported by youth were risky, for example, one-fifth of young men and 7% of young women reporting pre-marital sex had engaged in sex with more than one partner. Moreover, consistent condom use was limited—only 17% of young men and 2% of young women reported condom use in all the pre-marital encounters reported.
We acknowledge that youth, especially young women, may not report sexual experience in a survey situation. Hence, the Youth Study supplemented a series of direct questions with an opportunity to report sexual experience in an anonymous format. Surprisingly, findings suggest that a larger percentage of sexually active young men than women reported pre-marital sex only in the anonymous format. In total, direct reporting yielded somewhat higher estimates than anonymous third-party reporting, although the differences were narrow among young women. However, direct questioning supplemented by self-reporting in an anonymous format provided higher estimates of sexual experience than did face-to-face questioning alone or anonymous third-party reporting of peer behaviours.
182
Youth in India: Situation and Needs 2006–2007 ANDHRA pRADESH
As is well known, the transition to marriage occurs early in India, both for young men and young women. The recent NFHS (IIPS and Macro International, 2007a) shows, for example, that 47% of young women aged 20–24 had married before the age of 18, the minimum legal age at marriage for females; 32% of young men aged 25–29 had, likewise, married before they reached the age of 21, the legal minimum age at marriage for males. While marriage occurs early, marriage-related planning occurs even earlier, often as soon as a girl reaches menarche and, in many cases, even before she does so and without her participation. Moreover, while the consummation of marriage generally occurs following menarche, early married life tends to be isolating and frightening for many adolescent girls and young women. This chapter captures some of these experiences, including young people’s preferences regarding the timing and type of marriage, marriage preparation and planning, and young people’s participation in these processes, as well as their experiences in early married life and the fertility and contraceptive behaviours of young couples in the state of Andhra Pradesh.
10.1 Young people’s preferences regarding timing and type of marriage
The Youth Study sought to assess young people’s preferences about the age at which to marry and, among the unmarried, their preferences for love or arranged marriages. While it is possible that youth who were married in adolescence might have reported the age at which they married as the preferred age, findings, presented in Table 10.1, indicate that most youth preferred to marry after age 18. This preference was indicated by all youth, irrespective of sex, marital status or rural-urban residence. Even so, it is notable that substantial proportions of young women (26%) and just 1% of young men preferred to marry before age 20, that is, while still adolescent. The majority of young men (66%) preferred to marry at age 25 or later, a preference articulated by 10% of young women as well. Notably, 9% of young women and 12% of married young women expressed a preference not to marry at all; just 3% of young men expressed this view.
Differentials by marital status and rural-urban residence of respondents were notable. Married young women were more likely than the unmarried to report that they preferred to marry before age 20 (35% versus 15%). Conversely, more unmarried than married youth preferred to marry at age 25 or later (73% versus 51% among young men and 18% versus 4% among young women). A larger proportion of rural than urban young women expressed a preference to marry before age 20 (31% versus 14%). Conversely, a smaller proportion of rural than urban youth expressed a preference to marry late; for example, 63% of rural young men compared to 74% of urban young men preferred to marry at age 25 or later, as did 7% and 19%, respectively, of young women.
Findings also show that the vast majority of unmarried youth preferred to have an arranged rather than love marriage. For example, just 11% of young men and 8% of young women reported that they would prefer a love marriage. Rural-urban differences were muted.
10.2 Marriage planning and extent of youth involvement
Several questions were put to both married and unmarried youth to understand the process of marriage planning as well as their involvement in it. While questions on marriage planning were similar for the married and the unmarried, some questions were unique to one or the other group. For example, the Youth Study asked unmarried
Chapter 10
Transition to marriage and early married life
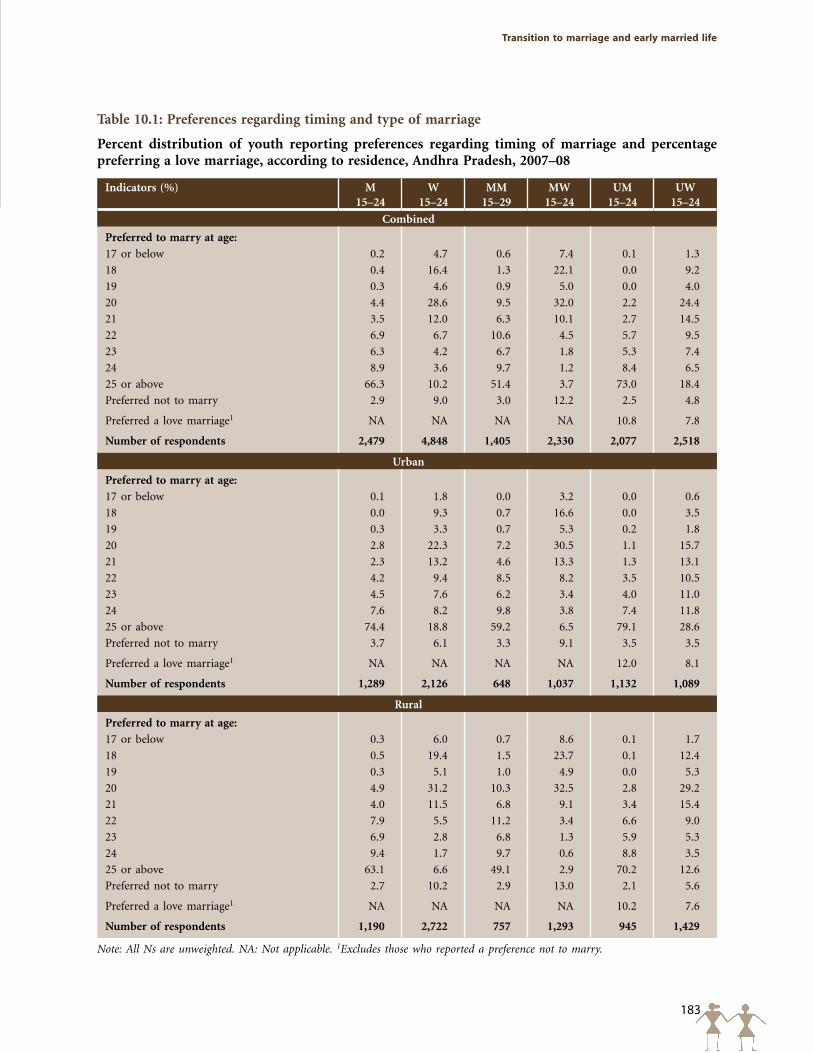
183
Transition to marriage and early married life
Table 10.1: Preferences regarding timing and type of marriage
Percent distribution of youth reporting preferences regarding timing of marriage and percentage preferring a love marriage, according to residence, Andhra Pradesh, 2007–08
Indicators (%) M 15–24
W 15–24
MM 15–29
MW 15–24
UM 15–24
UW 15–24
Combined
Preferred to marry at age:
17 or below 0.2 4.7 0.6 7.4 0.1 1.3
18 0.4 16.4 1.3 22.1 0.0 9.2
19 0.3 4.6 0.9 5.0 0.0 4.0
20 4.4 28.6 9.5 32.0 2.2 24.4
21 3.5 12.0 6.3 10.1 2.7 14.5
22 6.9 6.7 10.6 4.5 5.7 9.5
23 6.3 4.2 6.7 1.8 5.3 7.4
24 8.9 3.6 9.7 1.2 8.4 6.5
25 or above 66.3 10.2 51.4 3.7 73.0 18.4
Preferred not to marry 2.9 9.0 3.0 12.2 2.5 4.8
Preferred a love marriage1 NA NA NA NA 10.8 7.8
Number of respondents 2,479 4,848 1,405 2,330 2,077 2,518
Urban
Preferred to marry at age:
17 or below 0.1 1.8 0.0 3.2 0.0 0.6
18 0.0 9.3 0.7 16.6 0.0 3.5
19 0.3 3.3 0.7 5.3 0.2 1.8
20 2.8 22.3 7.2 30.5 1.1 15.7
21 2.3 13.2 4.6 13.3 1.3 13.1
22 4.2 9.4 8.5 8.2 3.5 10.5
23 4.5 7.6 6.2 3.4 4.0 11.0
24 7.6 8.2 9.8 3.8 7.4 11.8
25 or above 74.4 18.8 59.2 6.5 79.1 28.6
Preferred not to marry 3.7 6.1 3.3 9.1 3.5 3.5
Preferred a love marriage1 NA NA NA NA 12.0 8.1
Number of respondents 1,289 2,126 648 1,037 1,132 1,089
Rural
Preferred to marry at age:
17 or below 0.3 6.0 0.7 8.6 0.1 1.7
18 0.5 19.4 1.5 23.7 0.1 12.4
19 0.3 5.1 1.0 4.9 0.0 5.3
20 4.9 31.2 10.3 32.5 2.8 29.2
21 4.0 11.5 6.8 9.1 3.4 15.4
22 7.9 5.5 11.2 3.4 6.6 9.0
23 6.9 2.8 6.8 1.3 5.9 5.3
24 9.4 1.7 9.7 0.6 8.8 3.5
25 or above 63.1 6.6 49.1 2.9 70.2 12.6
Preferred not to marry 2.7 10.2 2.9 13.0 2.1 5.6
Preferred a love marriage1 NA NA NA NA 10.2 7.6
Number of respondents 1,190 2,722 757 1,293 945 1,429
Note: All Ns are unweighted. NA: Not applicable. 1Excludes those who reported a preference not to marry.
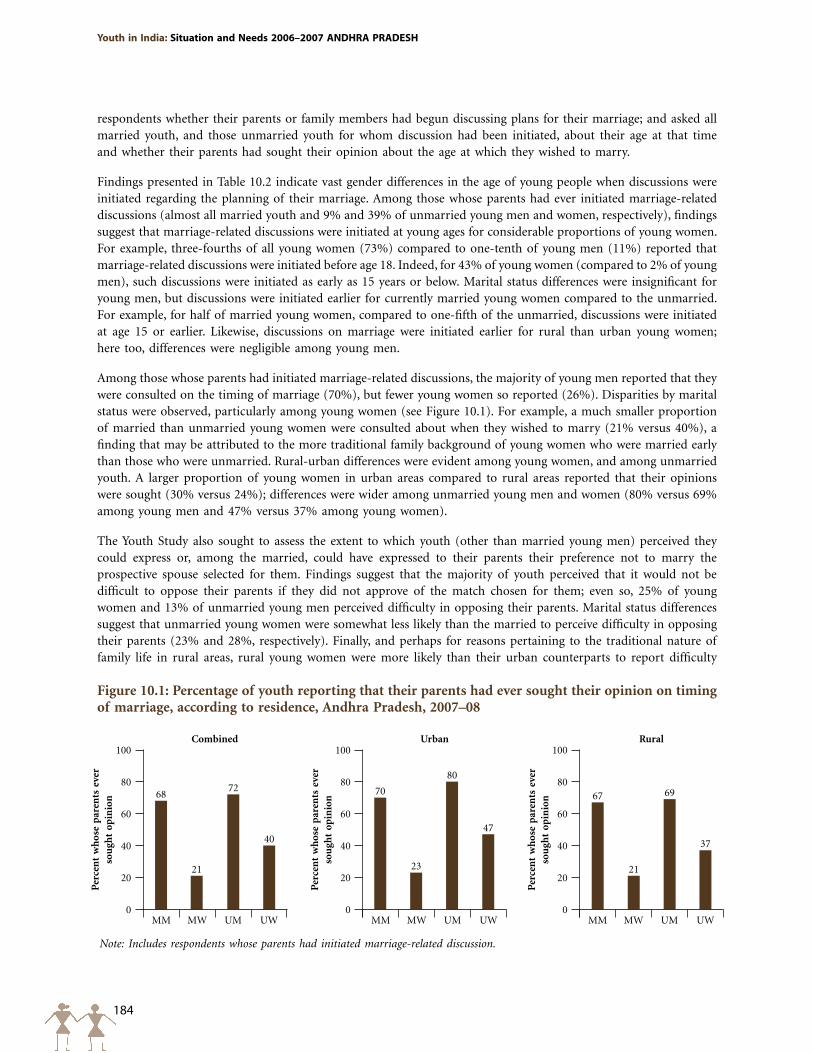
184
Youth in India: Situation and Needs 2006–2007 ANDHRA pRADESH
respondents whether their parents or family members had begun discussing plans for their marriage; and asked all married youth, and those unmarried youth for whom discussion had been initiated, about their age at that time and whether their parents had sought their opinion about the age at which they wished to marry.
Findings presented in Table 10.2 indicate vast gender differences in the age of young people when discussions were initiated regarding the planning of their marriage. Among those whose parents had ever initiated marriage-related discussions (almost all married youth and 9% and 39% of unmarried young men and women, respectively), findings suggest that marriage-related discussions were initiated at young ages for considerable proportions of young women. For example, three-fourths of all young women (73%) compared to one-tenth of young men (11%) reported that marriage-related discussions were initiated before age 18. Indeed, for 43% of young women (compared to 2% of young men), such discussions were initiated as early as 15 years or below. Marital status differences were insignificant for young men, but discussions were initiated earlier for currently married young women compared to the unmarried. For example, for half of married young women, compared to one-fifth of the unmarried, discussions were initiated at age 15 or earlier. Likewise, discussions on marriage were initiated earlier for rural than urban young women; here too, differences were negligible among young men.
Among those whose parents had initiated marriage-related discussions, the majority of young men reported that they were consulted on the timing of marriage (70%), but fewer young women so reported (26%). Disparities by marital status were observed, particularly among young women (see Figure 10.1). For example, a much smaller proportion of married than unmarried young women were consulted about when they wished to marry (21% versus 40%), a finding that may be attributed to the more traditional family background of young women who were married early than those who were unmarried. Rural-urban differences were evident among young women, and among unmarried youth. A larger proportion of young women in urban areas compared to rural areas reported that their opinions were sought (30% versus 24%); differences were wider among unmarried young men and women (80% versus 69% among young men and 47% versus 37% among young women).
The Youth Study also sought to assess the extent to which youth (other than married young men) perceived they could express or, among the married, could have expressed to their parents their preference not to marry the prospective spouse selected for them. Findings suggest that the majority of youth perceived that it would not be difficult to oppose their parents if they did not approve of the match chosen for them; even so, 25% of young women and 13% of unmarried young men perceived difficulty in opposing their parents. Marital status differences suggest that unmarried young women were somewhat less likely than the married to perceive difficulty in opposing their parents (23% and 28%, respectively). Finally, and perhaps for reasons pertaining to the traditional nature of family life in rural areas, rural young women were more likely than their urban counterparts to report difficulty
Figure 10.1: Percentage of youth reporting that their parents had ever sought their opinion on timing of marriage, according to residence, Andhra Pradesh, 2007–08
Note: Includes respondents whose parents had initiated marriage-related discussion.
Per
cen
t w
hos
e p
aren
ts e
ver
sou
ght
opin
ion
100
80
60
40
20
0
70
23
80
47
MM MW UM UW
Urban
Per
cen
t w
hos
e p
aren
ts e
ver
sou
ght
opin
ion
100
80
60
40
20
0
68
21
72
40
MM MW UM UW
Combined
Per
cen
t w
hos
e p
aren
ts e
ver
sou
ght
opin
ion
100
80
60
40
20
0
67
21
69
37
MM MW UM UW
Rural
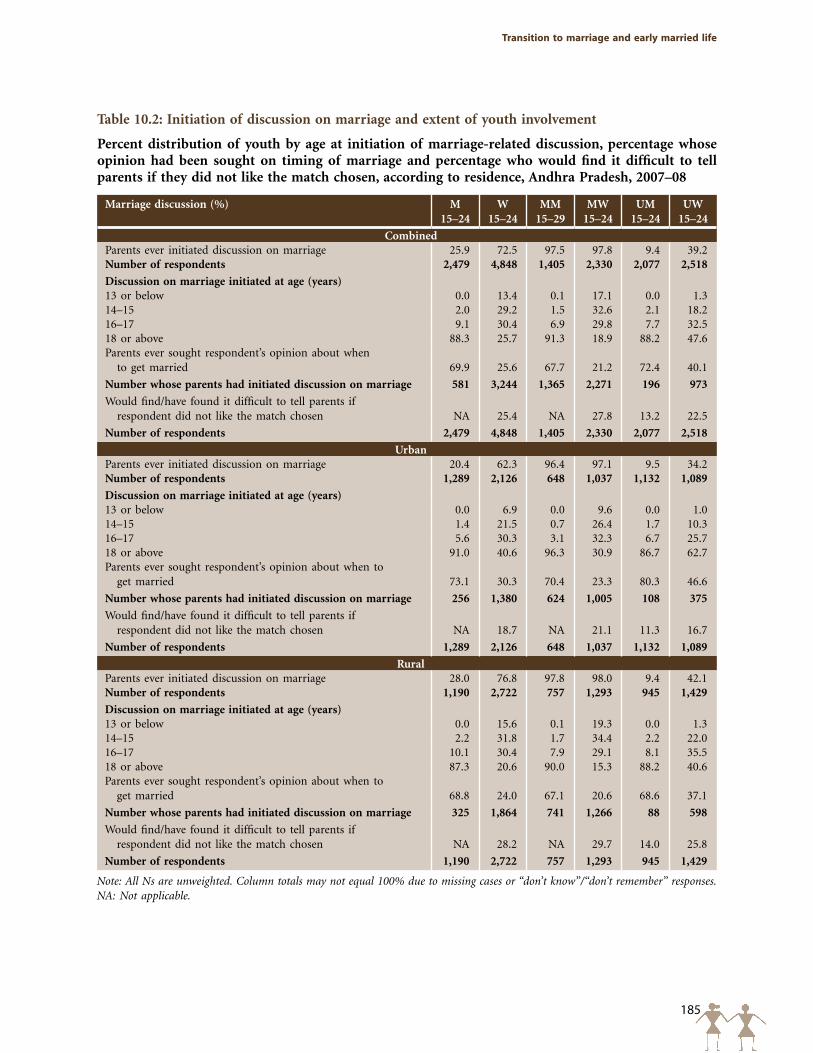
185
Transition to marriage and early married life
Table 10.2: Initiation of discussion on marriage and extent of youth involvement
Percent distribution of youth by age at initiation of marriage-related discussion, percentage whose opinion had been sought on timing of marriage and percentage who would find it difficult to tell parents if they did not like the match chosen, according to residence, Andhra Pradesh, 2007–08
Marriage discussion (%) M 15–24
W 15–24
MM 15–29
MW 15–24
UM 15–24
UW 15–24
CombinedParents ever initiated discussion on marriage 25.9 72.5 97.5 97.8 9.4 39.2Number of respondents 2,479 4,848 1,405 2,330 2,077 2,518
Discussion on marriage initiated at age (years)13 or below 0.0 13.4 0.1 17.1 0.0 1.314–15 2.0 29.2 1.5 32.6 2.1 18.216–17 9.1 30.4 6.9 29.8 7.7 32.518 or above 88.3 25.7 91.3 18.9 88.2 47.6Parents ever sought respondent’s opinion about when to get married 69.9 25.6 67.7 21.2 72.4 40.1
Number whose parents had initiated discussion on marriage 581 3,244 1,365 2,271 196 973
Would find/have found it difficult to tell parents if respondent did not like the match chosen NA 25.4 NA 27.8 13.2 22.5
Number of respondents 2,479 4,848 1,405 2,330 2,077 2,518
UrbanParents ever initiated discussion on marriage 20.4 62.3 96.4 97.1 9.5 34.2Number of respondents 1,289 2,126 648 1,037 1,132 1,089
Discussion on marriage initiated at age (years)13 or below 0.0 6.9 0.0 9.6 0.0 1.014–15 1.4 21.5 0.7 26.4 1.7 10.316–17 5.6 30.3 3.1 32.3 6.7 25.718 or above 91.0 40.6 96.3 30.9 86.7 62.7Parents ever sought respondent’s opinion about when to get married 73.1 30.3 70.4 23.3 80.3 46.6
Number whose parents had initiated discussion on marriage 256 1,380 624 1,005 108 375
Would find/have found it difficult to tell parents if respondent did not like the match chosen NA 18.7 NA 21.1 11.3 16.7
Number of respondents 1,289 2,126 648 1,037 1,132 1,089
RuralParents ever initiated discussion on marriage 28.0 76.8 97.8 98.0 9.4 42.1Number of respondents 1,190 2,722 757 1,293 945 1,429
Discussion on marriage initiated at age (years)13 or below 0.0 15.6 0.1 19.3 0.0 1.314–15 2.2 31.8 1.7 34.4 2.2 22.016–17 10.1 30.4 7.9 29.1 8.1 35.518 or above 87.3 20.6 90.0 15.3 88.2 40.6Parents ever sought respondent’s opinion about when to get married 68.8 24.0 67.1 20.6 68.6 37.1
Number whose parents had initiated discussion on marriage 325 1,864 741 1,266 88 598
Would find/have found it difficult to tell parents if respondent did not like the match chosen NA 28.2 NA 29.7 14.0 25.8
Number of respondents 1,190 2,722 757 1,293 945 1,429
Note: All Ns are unweighted. Column totals may not equal 100% due to missing cases or “don’t know”/“don’t remember” responses. NA: Not applicable.
186
Youth in India: Situation and Needs 2006–2007 ANDHRA pRADESH
in confronting their parents on marriage-related issues (28% compared to 19%); differences were negligible among unmarried young men (14% and 11%, respectively).
10.3 Age at marriage and cohabitation
Youth Study findings underscore the early age at marriage among young women in Andhra Pradesh (Table 10.3). Of those aged 20–24, almost one-fifth (18%) of young women were married before age 15, over half (54%) before age 18 and almost three-quarters (72%) before age 20. In rural areas, as many as 63% and 81% of women aged 20–24 years were married before age 18 and 20, respectively; the corresponding percentages in urban areas were 34% and 51%. Findings from the NFHS-3 also indicate that as many as 55% of 20–24 year-old women in Andhra Pradesh were married before age 18 (IIPS and Macro International, 2008). Youth Study findings, moreover, indicate that even though there were indications of a decline in very early marriage (before age 15) among young women, significant minorities continued to marry before age 15: 18% of those aged 20–24, compared to 9% of those aged 15–19, were married before age 15.
Early marriage was less prevalent among young men, only 2% young men aged 20–24 years were married before age 18. Even so, one in ten young men (11%) was married in adolescence. In rural areas, 3% and 13% of men aged 20–24 were married before age 18 and 20, respectively.
Almost all married youth (99.5%) had been married just once (not shown in tabular form). The mean age at marriage among those who were married was 21.5 years among young men and 16.2 years among young women. As expected, rural youth married earlier than urban youth; the mean age at marriage among rural youth was one year earlier than that of urban youth (21.3 years versus 22.4 years for young men and 15.9 years versus 17.2 years for young women). The mean age at cohabitation was almost the same as the mean age at marriage.
10.4 Marriage preparedness
Several questions were put to both married and unmarried youth who were engaged to be married to understand their preparedness for marriage. Questions ranged from whether the proposed spouse was chosen by the young person or by his/her parents; whether the young person’s approval of the prospective spouse, if chosen by the parents, was sought; and how much contact the young person and the prospective spouse had prior to marriage. As fewer than 1% and 4% of unmarried young men and women, respectively, reported that they were engaged to be married (not shown in tabular form), we restrict our discussion to the currently married.
Table 10.4 describes marriage-related preparedness among the married. An overwhelming proportion (93–95%) of respondents, whether male or female, had married a partner chosen by their parents. While the young person’s approval of the prospective spouse had been sought in the majority of cases (86–89%), 6–7% of young men and women reported that their parents had not sought their approval. Five percent of young men and 7% of young women reported having chosen their marriage partner on their own. While gender differences were negligible, urban youth were somewhat more likely than their rural counterparts to report so (9–11% versus 4–6%). Also indicative of the lack of preparedness was the short gap between the point at which marriage arrangements were fixed and the date of the actual marriage: on average one month; over three in four young men and four in five young women reporting the occurrence of their marriage within three months of the completion of marriage negotiations (not shown in tabular form).
Reported pre-marital acquaintance was limited, and highlights that even those who reported that they had approved their parents’ choice of spouse had rarely had an opportunity to meet their prospective spouse prior to marriage. Indeed, a little over one-quarter of young men (29%) and one-fifth of young women (19%) reported that they had ever had a chance to meet and interact with their spouse-to-be alone prior to marriage. Rural-urban differences suggest that more urban than rural youth had met or talked with their fiancé/fiancée alone before marriage (39% versus 26% among young men and 27% versus 16% among young women). Over two in five married youth (43–44%) reported that they had met their spouse for the first time on the wedding day. About one-third of youth
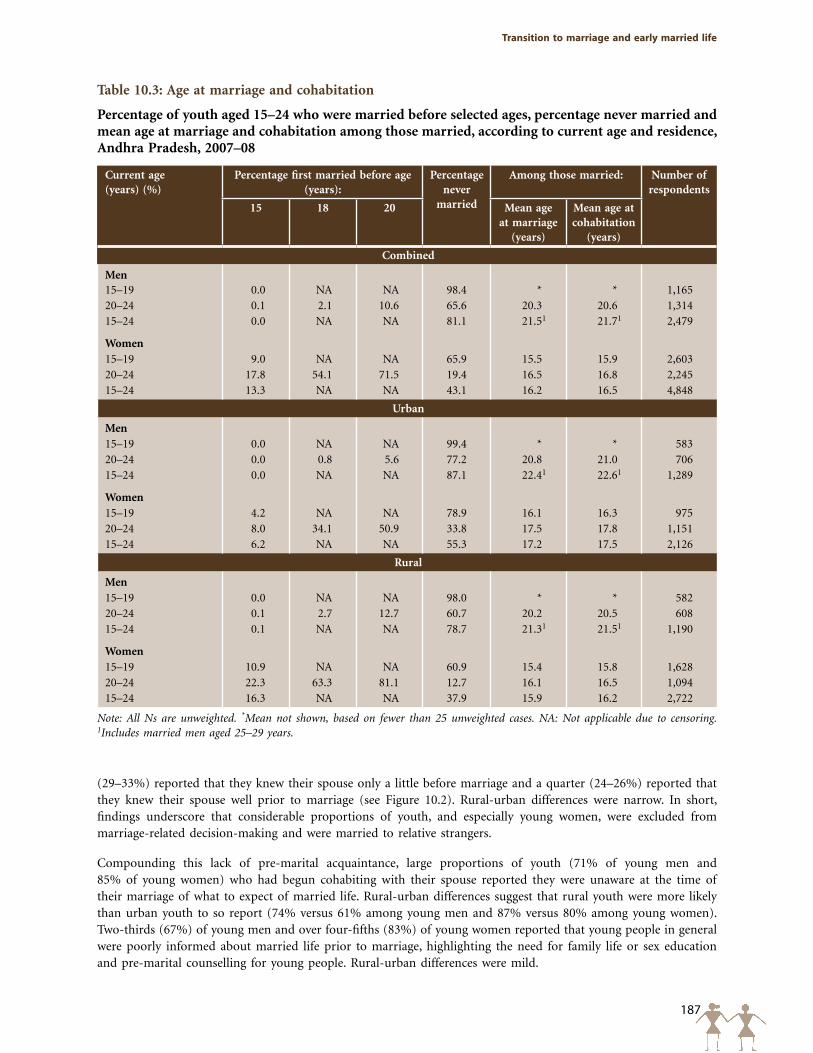
187
Transition to marriage and early married life
Table 10.3: Age at marriage and cohabitation
Percentage of youth aged 15–24 who were married before selected ages, percentage never married and mean age at marriage and cohabitation among those married, according to current age and residence, Andhra Pradesh, 2007–08
Current age (years) (%)
Percentage first married before age (years):
Percentage never
married
Among those married: Number of respondents
15 18 20 Mean age at marriage
(years)
Mean age at cohabitation
(years)
Combined
Men15–19 0.0 NA NA 98.4 * * 1,16520–24 0.1 2.1 10.6 65.6 20.3 20.6 1,31415–24 0.0 NA NA 81.1 21.51 21.71 2,479
Women15–19 9.0 NA NA 65.9 15.5 15.9 2,60320–24 17.8 54.1 71.5 19.4 16.5 16.8 2,24515–24 13.3 NA NA 43.1 16.2 16.5 4,848
Urban
Men15–19 0.0 NA NA 99.4 * * 58320–24 0.0 0.8 5.6 77.2 20.8 21.0 70615–24 0.0 NA NA 87.1 22.41 22.61 1,289
Women15–19 4.2 NA NA 78.9 16.1 16.3 97520–24 8.0 34.1 50.9 33.8 17.5 17.8 1,15115–24 6.2 NA NA 55.3 17.2 17.5 2,126
Rural
Men15–19 0.0 NA NA 98.0 * * 58220–24 0.1 2.7 12.7 60.7 20.2 20.5 60815–24 0.1 NA NA 78.7 21.31 21.51 1,190
Women15–19 10.9 NA NA 60.9 15.4 15.8 1,62820–24 22.3 63.3 81.1 12.7 16.1 16.5 1,09415–24 16.3 NA NA 37.9 15.9 16.2 2,722
Note: All Ns are unweighted. *Mean not shown, based on fewer than 25 unweighted cases. NA: Not applicable due to censoring. 1Includes married men aged 25–29 years.
(29–33%) reported that they knew their spouse only a little before marriage and a quarter (24–26%) reported that they knew their spouse well prior to marriage (see Figure 10.2). Rural-urban differences were narrow. In short, findings underscore that considerable proportions of youth, and especially young women, were excluded from marriage-related decision-making and were married to relative strangers.
Compounding this lack of pre-marital acquaintance, large proportions of youth (71% of young men and 85% of young women) who had begun cohabiting with their spouse reported they were unaware at the time of their marriage of what to expect of married life. Rural-urban differences suggest that rural youth were more likely than urban youth to so report (74% versus 61% among young men and 87% versus 80% among young women). Two-thirds (67%) of young men and over four-fifths (83%) of young women reported that young people in general were poorly informed about married life prior to marriage, highlighting the need for family life or sex education and pre-marital counselling for young people. Rural-urban differences were mild.
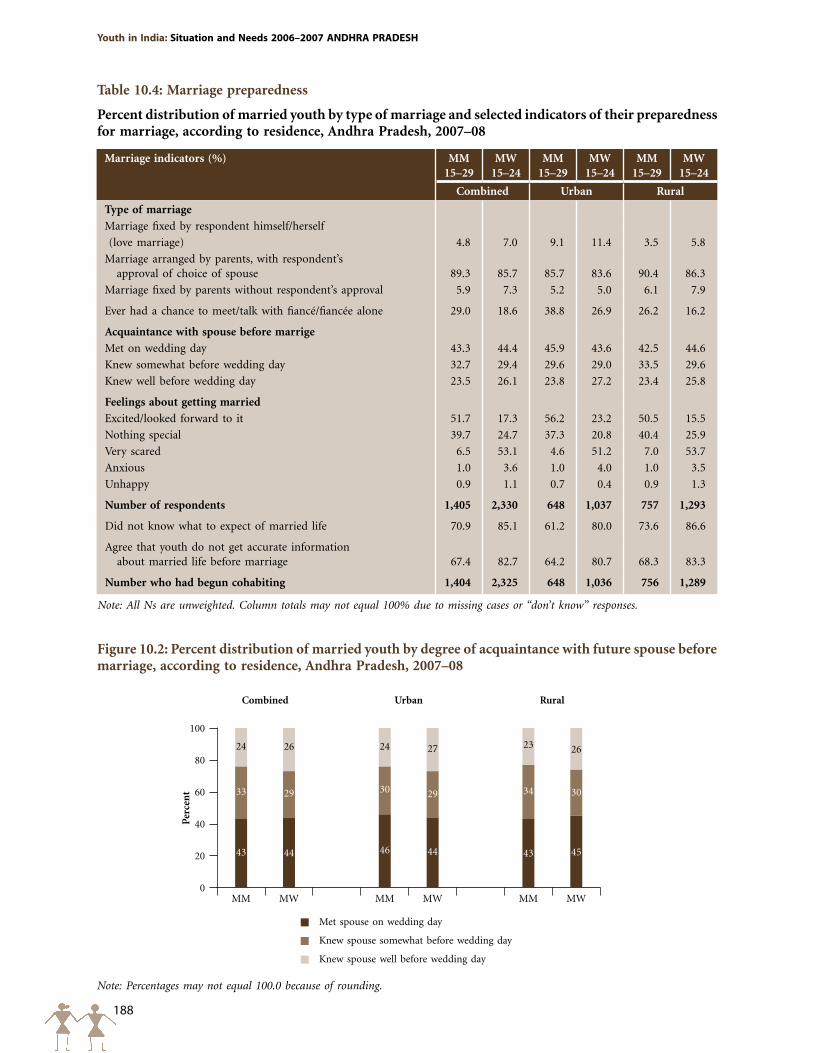
188
Youth in India: Situation and Needs 2006–2007 ANDHRA pRADESH
Table 10.4: Marriage preparedness
Percent distribution of married youth by type of marriage and selected indicators of their preparedness for marriage, according to residence, Andhra Pradesh, 2007–08
Marriage indicators (%) MM 15–29
MW 15–24
MM 15–29
MW 15–24
MM 15–29
MW 15–24
Combined Urban Rural
Type of marriage
Marriage fixed by respondent himself/herself
(love marriage) 4.8 7.0 9.1 11.4 3.5 5.8
Marriage arranged by parents, with respondent’s approval of choice of spouse 89.3 85.7 85.7 83.6 90.4 86.3
Marriage fixed by parents without respondent’s approval 5.9 7.3 5.2 5.0 6.1 7.9
Ever had a chance to meet/talk with fiancé/fiancée alone 29.0 18.6 38.8 26.9 26.2 16.2
Acquaintance with spouse before marrige
Met on wedding day 43.3 44.4 45.9 43.6 42.5 44.6
Knew somewhat before wedding day 32.7 29.4 29.6 29.0 33.5 29.6
Knew well before wedding day 23.5 26.1 23.8 27.2 23.4 25.8
Feelings about getting married
Excited/looked forward to it 51.7 17.3 56.2 23.2 50.5 15.5
Nothing special 39.7 24.7 37.3 20.8 40.4 25.9
Very scared 6.5 53.1 4.6 51.2 7.0 53.7
Anxious 1.0 3.6 1.0 4.0 1.0 3.5
Unhappy 0.9 1.1 0.7 0.4 0.9 1.3
Number of respondents 1,405 2,330 648 1,037 757 1,293
Did not know what to expect of married life 70.9 85.1 61.2 80.0 73.6 86.6
Agree that youth do not get accurate information about married life before marriage 67.4 82.7 64.2 80.7 68.3 83.3
Number who had begun cohabiting 1,404 2,325 648 1,036 756 1,289
Note: All Ns are unweighted. Column totals may not equal 100% due to missing cases or “don’t know” responses.
Figure 10.2: Percent distribution of married youth by degree of acquaintance with future spouse before marriage, according to residence, Andhra Pradesh, 2007–08
Per
cen
t
100
80
60
40
20
0MM MM MMMW MW MW
43 44
33 29
24 26
Combined
46 44
30 29
24 27
Urban
43 45
34 30
23 26
Rural
Met spouse on wedding day
Knew spouse somewhat before wedding day
Knew spouse well before wedding day
Note: Percentages may not equal 100.0 because of rounding.
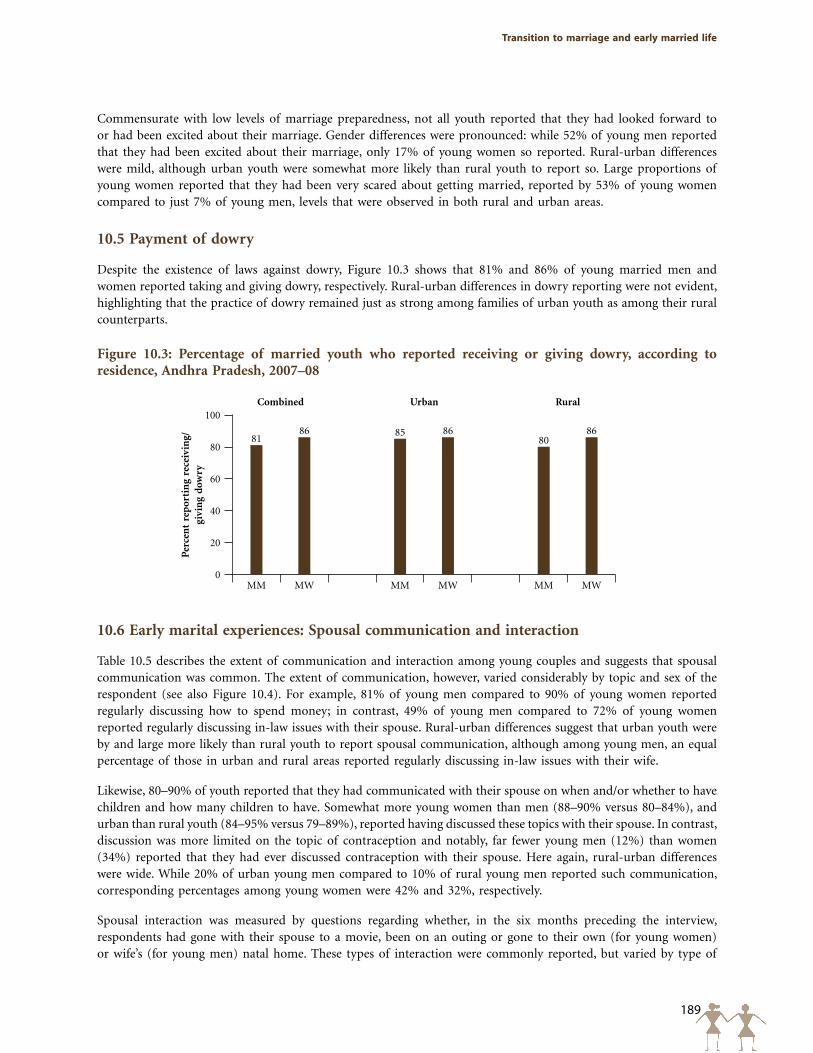
189
Transition to marriage and early married life
100
80
60
40
20
0
Figure 10.3: Percentage of married youth who reported receiving or giving dowry, according to residence, Andhra Pradesh, 2007–08
Per
cen
t re
por
tin
g re
ceiv
ing/
gi
vin
g do
wry
MM MM MMMW MW MW
8185
8086 86 86
Combined Urban Rural
Commensurate with low levels of marriage preparedness, not all youth reported that they had looked forward to or had been excited about their marriage. Gender differences were pronounced: while 52% of young men reported that they had been excited about their marriage, only 17% of young women so reported. Rural-urban differences were mild, although urban youth were somewhat more likely than rural youth to report so. Large proportions of young women reported that they had been very scared about getting married, reported by 53% of young women compared to just 7% of young men, levels that were observed in both rural and urban areas.
10.5 Payment of dowry
Despite the existence of laws against dowry, Figure 10.3 shows that 81% and 86% of young married men and women reported taking and giving dowry, respectively. Rural-urban differences in dowry reporting were not evident, highlighting that the practice of dowry remained just as strong among families of urban youth as among their rural counterparts.
10.6 Early marital experiences: Spousal communication and interaction
Table 10.5 describes the extent of communication and interaction among young couples and suggests that spousal communication was common. The extent of communication, however, varied considerably by topic and sex of the respondent (see also Figure 10.4). For example, 81% of young men compared to 90% of young women reported regularly discussing how to spend money; in contrast, 49% of young men compared to 72% of young women reported regularly discussing in-law issues with their spouse. Rural-urban differences suggest that urban youth were by and large more likely than rural youth to report spousal communication, although among young men, an equal percentage of those in urban and rural areas reported regularly discussing in-law issues with their wife.
Likewise, 80–90% of youth reported that they had communicated with their spouse on when and/or whether to have children and how many children to have. Somewhat more young women than men (88–90% versus 80–84%), and urban than rural youth (84–95% versus 79–89%), reported having discussed these topics with their spouse. In contrast, discussion was more limited on the topic of contraception and notably, far fewer young men (12%) than women (34%) reported that they had ever discussed contraception with their spouse. Here again, rural-urban differences were wide. While 20% of urban young men compared to 10% of rural young men reported such communication, corresponding percentages among young women were 42% and 32%, respectively.
Spousal interaction was measured by questions regarding whether, in the six months preceding the interview, respondents had gone with their spouse to a movie, been on an outing or gone to their own (for young women) or wife’s (for young men) natal home. These types of interaction were commonly reported, but varied by type of
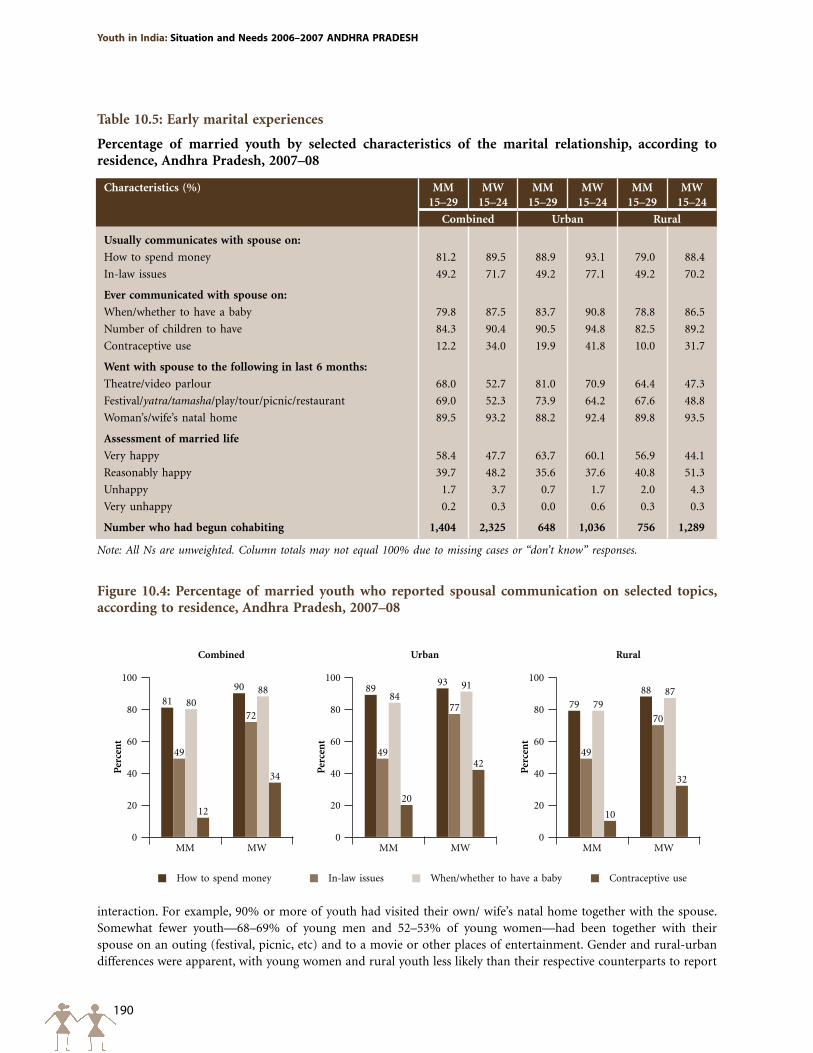
190
Youth in India: Situation and Needs 2006–2007 ANDHRA pRADESH
Table 10.5: Early marital experiences
Percentage of married youth by selected characteristics of the marital relationship, according to residence, Andhra Pradesh, 2007–08
Characteristics (%) MM 15–29
MW 15–24
MM 15–29
MW 15–24
MM 15–29
MW 15–24
Combined Urban Rural
Usually communicates with spouse on:
How to spend money 81.2 89.5 88.9 93.1 79.0 88.4
In-law issues 49.2 71.7 49.2 77.1 49.2 70.2
Ever communicated with spouse on:
When/whether to have a baby 79.8 87.5 83.7 90.8 78.8 86.5
Number of children to have 84.3 90.4 90.5 94.8 82.5 89.2
Contraceptive use 12.2 34.0 19.9 41.8 10.0 31.7
Went with spouse to the following in last 6 months:
Theatre/video parlour 68.0 52.7 81.0 70.9 64.4 47.3
Festival/yatra/tamasha/play/tour/picnic/restaurant 69.0 52.3 73.9 64.2 67.6 48.8
Woman’s/wife’s natal home 89.5 93.2 88.2 92.4 89.8 93.5
Assessment of married life
Very happy 58.4 47.7 63.7 60.1 56.9 44.1
Reasonably happy 39.7 48.2 35.6 37.6 40.8 51.3
Unhappy 1.7 3.7 0.7 1.7 2.0 4.3
Very unhappy 0.2 0.3 0.0 0.6 0.3 0.3
Number who had begun cohabiting 1,404 2,325 648 1,036 756 1,289
Note: All Ns are unweighted. Column totals may not equal 100% due to missing cases or “don’t know” responses.
Figure 10.4: Percentage of married youth who reported spousal communication on selected topics, according to residence, Andhra Pradesh, 2007–08
Per
cen
t
100
80
60
40
20
0
81
90
49
7280
88
12
34
Combined
MM MW
Per
cen
t
100
80
60
40
20
0
8993
49
7784
91
20
42
Urban
MM MW
Per
cen
t
100
80
60
40
20
0
7988
49
70
7987
10
32
Rural
MM MW
How to spend money In-law issues When/whether to have a baby Contraceptive use
interaction. For example, 90% or more of youth had visited their own/ wife’s natal home together with the spouse. Somewhat fewer youth—68–69% of young men and 52–53% of young women—had been together with their spouse on an outing (festival, picnic, etc) and to a movie or other places of entertainment. Gender and rural-urban differences were apparent, with young women and rural youth less likely than their respective counterparts to report
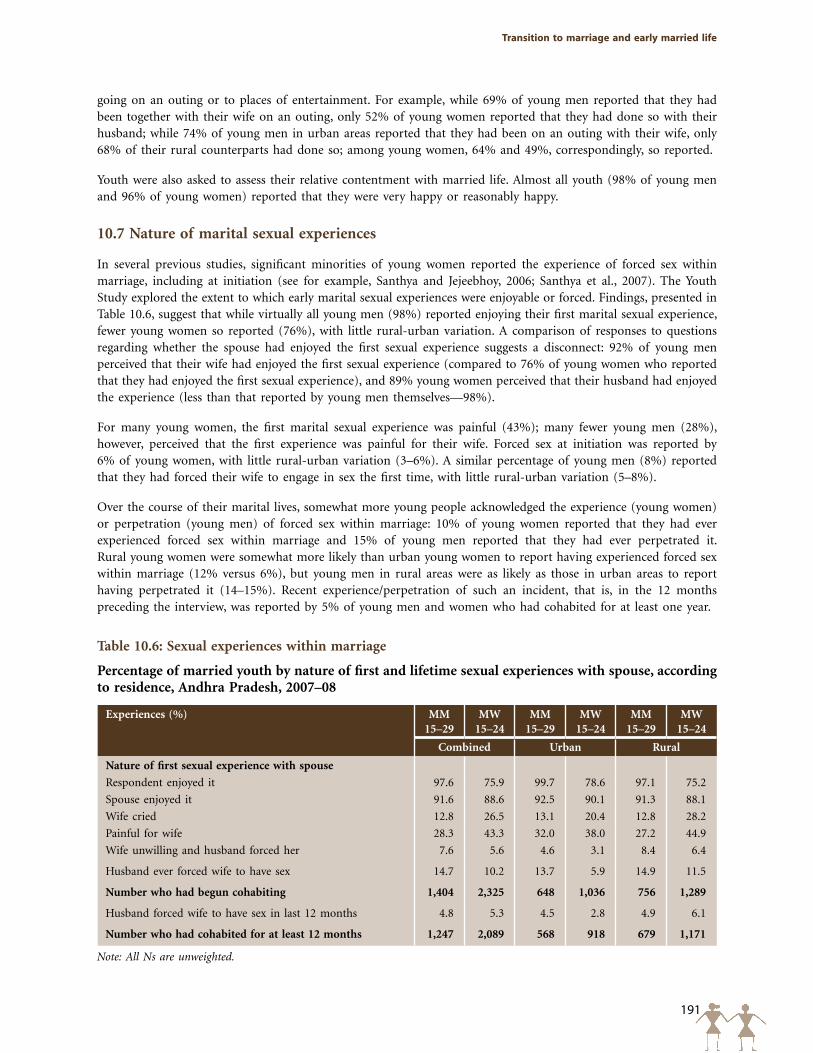
191
Transition to marriage and early married life
Table 10.6: Sexual experiences within marriage
Percentage of married youth by nature of first and lifetime sexual experiences with spouse, according to residence, Andhra Pradesh, 2007–08
Experiences (%) MM 15–29
MW 15–24
MM 15–29
MW 15–24
MM 15–29
MW 15–24
Combined Urban Rural
Nature of first sexual experience with spouse
Respondent enjoyed it 97.6 75.9 99.7 78.6 97.1 75.2
Spouse enjoyed it 91.6 88.6 92.5 90.1 91.3 88.1
Wife cried 12.8 26.5 13.1 20.4 12.8 28.2
Painful for wife 28.3 43.3 32.0 38.0 27.2 44.9
Wife unwilling and husband forced her 7.6 5.6 4.6 3.1 8.4 6.4
Husband ever forced wife to have sex 14.7 10.2 13.7 5.9 14.9 11.5
Number who had begun cohabiting 1,404 2,325 648 1,036 756 1,289
Husband forced wife to have sex in last 12 months 4.8 5.3 4.5 2.8 4.9 6.1
Number who had cohabited for at least 12 months 1,247 2,089 568 918 679 1,171
Note: All Ns are unweighted.
going on an outing or to places of entertainment. For example, while 69% of young men reported that they had been together with their wife on an outing, only 52% of young women reported that they had done so with their husband; while 74% of young men in urban areas reported that they had been on an outing with their wife, only 68% of their rural counterparts had done so; among young women, 64% and 49%, correspondingly, so reported.
Youth were also asked to assess their relative contentment with married life. Almost all youth (98% of young men and 96% of young women) reported that they were very happy or reasonably happy.
10.7 Nature of marital sexual experiences
In several previous studies, significant minorities of young women reported the experience of forced sex within marriage, including at initiation (see for example, Santhya and Jejeebhoy, 2006; Santhya et al., 2007). The Youth Study explored the extent to which early marital sexual experiences were enjoyable or forced. Findings, presented in Table 10.6, suggest that while virtually all young men (98%) reported enjoying their first marital sexual experience, fewer young women so reported (76%), with little rural-urban variation. A comparison of responses to questions regarding whether the spouse had enjoyed the first sexual experience suggests a disconnect: 92% of young men perceived that their wife had enjoyed the first sexual experience (compared to 76% of young women who reported that they had enjoyed the first sexual experience), and 89% young women perceived that their husband had enjoyed the experience (less than that reported by young men themselves—98%).
For many young women, the first marital sexual experience was painful (43%); many fewer young men (28%), however, perceived that the first experience was painful for their wife. Forced sex at initiation was reported by 6% of young women, with little rural-urban variation (3–6%). A similar percentage of young men (8%) reported that they had forced their wife to engage in sex the first time, with little rural-urban variation (5–8%).
Over the course of their marital lives, somewhat more young people acknowledged the experience (young women) or perpetration (young men) of forced sex within marriage: 10% of young women reported that they had ever experienced forced sex within marriage and 15% of young men reported that they had ever perpetrated it. Rural young women were somewhat more likely than urban young women to report having experienced forced sex within marriage (12% versus 6%), but young men in rural areas were as likely as those in urban areas to report having perpetrated it (14–15%). Recent experience/perpetration of such an incident, that is, in the 12 months preceding the interview, was reported by 5% of young men and women who had cohabited for at least one year.
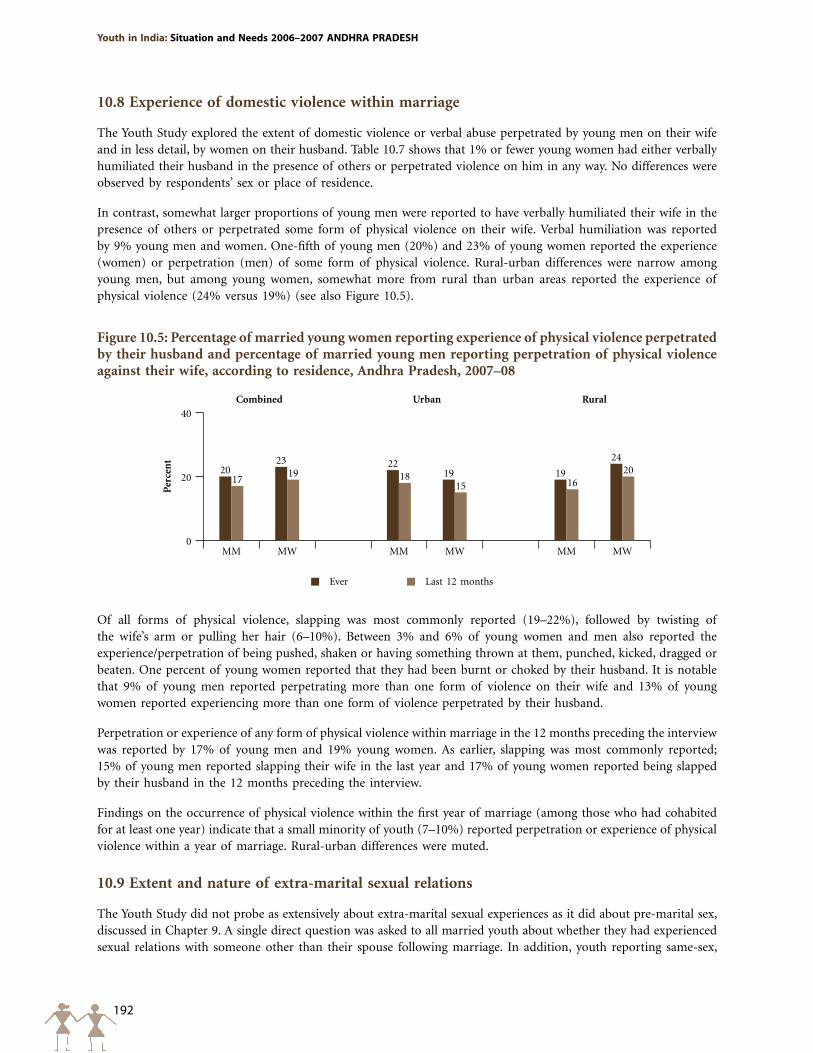
192
Youth in India: Situation and Needs 2006–2007 ANDHRA pRADESH
10.8 Experience of domestic violence within marriage
The Youth Study explored the extent of domestic violence or verbal abuse perpetrated by young men on their wife and in less detail, by women on their husband. Table 10.7 shows that 1% or fewer young women had either verbally humiliated their husband in the presence of others or perpetrated violence on him in any way. No differences were observed by respondents’ sex or place of residence.
In contrast, somewhat larger proportions of young men were reported to have verbally humiliated their wife in the presence of others or perpetrated some form of physical violence on their wife. Verbal humiliation was reported by 9% young men and women. One-fifth of young men (20%) and 23% of young women reported the experience (women) or perpetration (men) of some form of physical violence. Rural-urban differences were narrow among young men, but among young women, somewhat more from rural than urban areas reported the experience of physical violence (24% versus 19%) (see also Figure 10.5).
Figure 10.5: Percentage of married young women reporting experience of physical violence perpetrated by their husband and percentage of married young men reporting perpetration of physical violence against their wife, according to residence, Andhra Pradesh, 2007–08
Per
cen
t
40
20
0
20 1917 16
23 24
19 2022
18 1915
Combined Urban Rural
MM MM MMMW MW MW
Ever Last 12 months
Of all forms of physical violence, slapping was most commonly reported (19–22%), followed by twisting of the wife’s arm or pulling her hair (6–10%). Between 3% and 6% of young women and men also reported the experience/perpetration of being pushed, shaken or having something thrown at them, punched, kicked, dragged or beaten. One percent of young women reported that they had been burnt or choked by their husband. It is notable that 9% of young men reported perpetrating more than one form of violence on their wife and 13% of young women reported experiencing more than one form of violence perpetrated by their husband.
Perpetration or experience of any form of physical violence within marriage in the 12 months preceding the interview was reported by 17% of young men and 19% young women. As earlier, slapping was most commonly reported; 15% of young men reported slapping their wife in the last year and 17% of young women reported being slapped by their husband in the 12 months preceding the interview.
Findings on the occurrence of physical violence within the first year of marriage (among those who had cohabited for at least one year) indicate that a small minority of youth (7–10%) reported perpetration or experience of physical violence within a year of marriage. Rural-urban differences were muted.
10.9 Extent and nature of extra-marital sexual relations
The Youth Study did not probe as extensively about extra-marital sexual experiences as it did about pre-marital sex, discussed in Chapter 9. A single direct question was asked to all married youth about whether they had experienced sexual relations with someone other than their spouse following marriage. In addition, youth reporting same-sex,
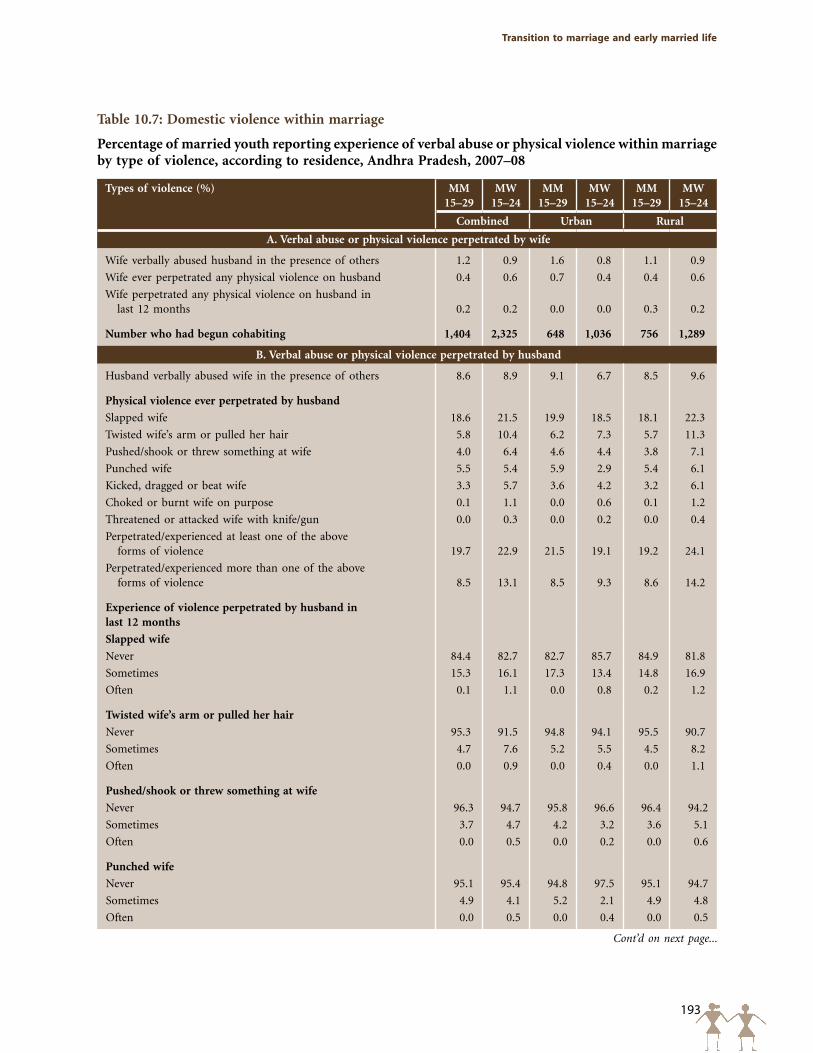
193
Transition to marriage and early married life
Table 10.7: Domestic violence within marriage
Percentage of married youth reporting experience of verbal abuse or physical violence within marriage by type of violence, according to residence, Andhra Pradesh, 2007–08
Types of violence (%) MM 15–29
MW 15–24
MM 15–29
MW 15–24
MM 15–29
MW 15–24
Combined Urban Rural
A. Verbal abuse or physical violence perpetrated by wife
Wife verbally abused husband in the presence of others 1.2 0.9 1.6 0.8 1.1 0.9
Wife ever perpetrated any physical violence on husband 0.4 0.6 0.7 0.4 0.4 0.6
Wife perpetrated any physical violence on husband in last 12 months 0.2 0.2 0.0 0.0 0.3 0.2
Number who had begun cohabiting 1,404 2,325 648 1,036 756 1,289
B. Verbal abuse or physical violence perpetrated by husband
Husband verbally abused wife in the presence of others 8.6 8.9 9.1 6.7 8.5 9.6
Physical violence ever perpetrated by husband
Slapped wife 18.6 21.5 19.9 18.5 18.1 22.3
Twisted wife’s arm or pulled her hair 5.8 10.4 6.2 7.3 5.7 11.3
Pushed/shook or threw something at wife 4.0 6.4 4.6 4.4 3.8 7.1
Punched wife 5.5 5.4 5.9 2.9 5.4 6.1
Kicked, dragged or beat wife 3.3 5.7 3.6 4.2 3.2 6.1
Choked or burnt wife on purpose 0.1 1.1 0.0 0.6 0.1 1.2
Threatened or attacked wife with knife/gun 0.0 0.3 0.0 0.2 0.0 0.4
Perpetrated/experienced at least one of the above forms of violence 19.7 22.9 21.5 19.1 19.2 24.1
Perpetrated/experienced more than one of the above forms of violence 8.5 13.1 8.5 9.3 8.6 14.2
Experience of violence perpetrated by husband in last 12 months
Slapped wife
Never 84.4 82.7 82.7 85.7 84.9 81.8
Sometimes 15.3 16.1 17.3 13.4 14.8 16.9
Often 0.1 1.1 0.0 0.8 0.2 1.2
Twisted wife’s arm or pulled her hair
Never 95.3 91.5 94.8 94.1 95.5 90.7
Sometimes 4.7 7.6 5.2 5.5 4.5 8.2
Often 0.0 0.9 0.0 0.4 0.0 1.1
Pushed/shook or threw something at wife
Never 96.3 94.7 95.8 96.6 96.4 94.2
Sometimes 3.7 4.7 4.2 3.2 3.6 5.1
Often 0.0 0.5 0.0 0.2 0.0 0.6
Punched wife
Never 95.1 95.4 94.8 97.5 95.1 94.7
Sometimes 4.9 4.1 5.2 2.1 4.9 4.8
Often 0.0 0.5 0.0 0.4 0.0 0.5
Cont’d on next page...
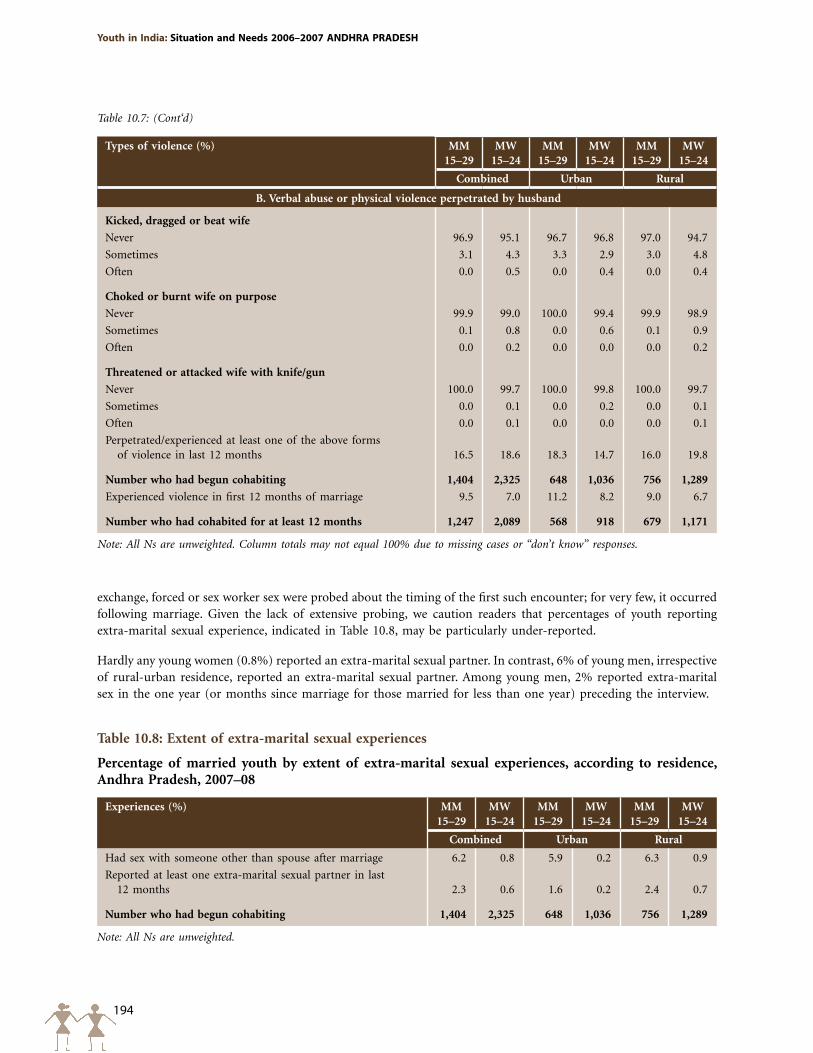
194
Youth in India: Situation and Needs 2006–2007 ANDHRA pRADESH
Types of violence (%) MM 15–29
MW 15–24
MM 15–29
MW 15–24
MM 15–29
MW 15–24
Combined Urban Rural
B. Verbal abuse or physical violence perpetrated by husband
Kicked, dragged or beat wife
Never 96.9 95.1 96.7 96.8 97.0 94.7
Sometimes 3.1 4.3 3.3 2.9 3.0 4.8
Often 0.0 0.5 0.0 0.4 0.0 0.4
Choked or burnt wife on purpose
Never 99.9 99.0 100.0 99.4 99.9 98.9
Sometimes 0.1 0.8 0.0 0.6 0.1 0.9
Often 0.0 0.2 0.0 0.0 0.0 0.2
Threatened or attacked wife with knife/gun
Never 100.0 99.7 100.0 99.8 100.0 99.7
Sometimes 0.0 0.1 0.0 0.2 0.0 0.1
Often 0.0 0.1 0.0 0.0 0.0 0.1
Perpetrated/experienced at least one of the above forms of violence in last 12 months 16.5 18.6 18.3 14.7 16.0 19.8
Number who had begun cohabiting 1,404 2,325 648 1,036 756 1,289
Experienced violence in first 12 months of marriage 9.5 7.0 11.2 8.2 9.0 6.7
Number who had cohabited for at least 12 months 1,247 2,089 568 918 679 1,171
Note: All Ns are unweighted. Column totals may not equal 100% due to missing cases or “don’t know” responses.
Table 10.7: (Cont‘d)
exchange, forced or sex worker sex were probed about the timing of the first such encounter; for very few, it occurred following marriage. Given the lack of extensive probing, we caution readers that percentages of youth reporting extra-marital sexual experience, indicated in Table 10.8, may be particularly under-reported.
Hardly any young women (0.8%) reported an extra-marital sexual partner. In contrast, 6% of young men, irrespective of rural-urban residence, reported an extra-marital sexual partner. Among young men, 2% reported extra-marital sex in the one year (or months since marriage for those married for less than one year) preceding the interview.
Table 10.8: Extent of extra-marital sexual experiences
Percentage of married youth by extent of extra-marital sexual experiences, according to residence, Andhra Pradesh, 2007–08
Experiences (%) MM 15–29
MW 15–24
MM 15–29
MW 15–24
MM 15–29
MW 15–24
Combined Urban Rural
Had sex with someone other than spouse after marriage 6.2 0.8 5.9 0.2 6.3 0.9
Reported at least one extra-marital sexual partner in last 12 months 2.3 0.6 1.6 0.2 2.4 0.7
Number who had begun cohabiting 1,404 2,325 648 1,036 756 1,289
Note: All Ns are unweighted.
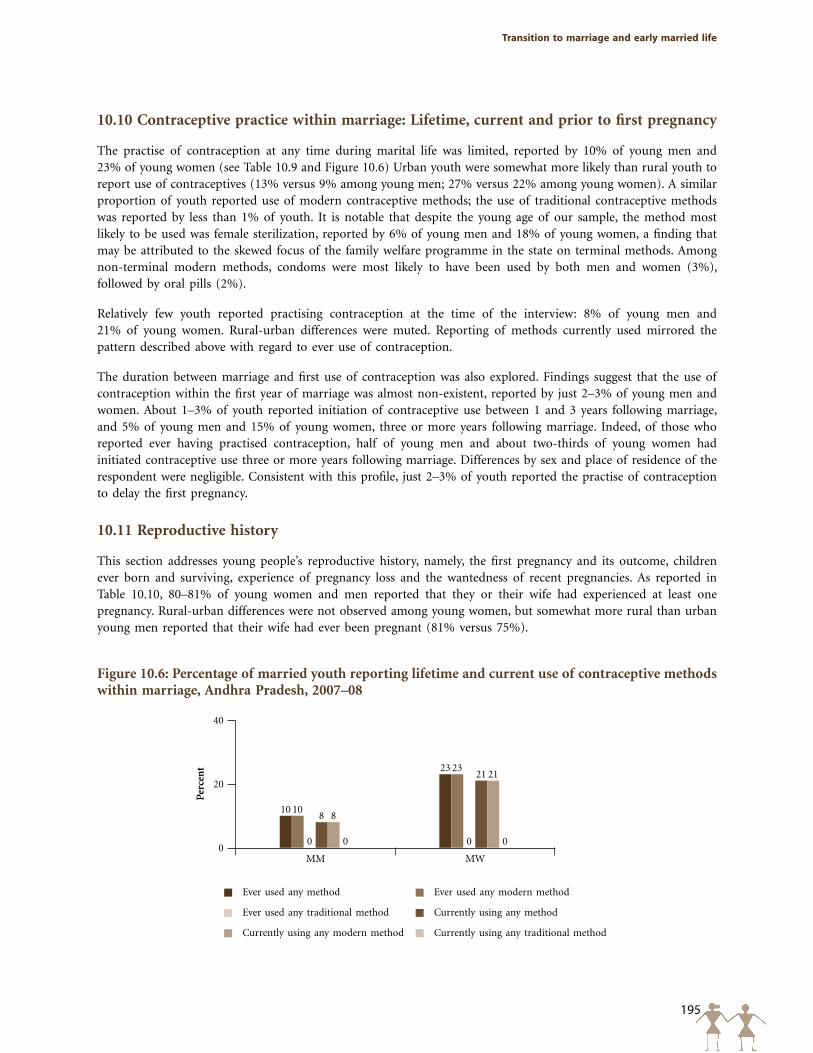
195
Transition to marriage and early married life
10.10 Contraceptive practice within marriage: Lifetime, current and prior to first pregnancy
The practise of contraception at any time during marital life was limited, reported by 10% of young men and 23% of young women (see Table 10.9 and Figure 10.6) Urban youth were somewhat more likely than rural youth to report use of contraceptives (13% versus 9% among young men; 27% versus 22% among young women). A similar proportion of youth reported use of modern contraceptive methods; the use of traditional contraceptive methods was reported by less than 1% of youth. It is notable that despite the young age of our sample, the method most likely to be used was female sterilization, reported by 6% of young men and 18% of young women, a finding that may be attributed to the skewed focus of the family welfare programme in the state on terminal methods. Among non-terminal modern methods, condoms were most likely to have been used by both men and women (3%), followed by oral pills (2%).
Relatively few youth reported practising contraception at the time of the interview: 8% of young men and 21% of young women. Rural-urban differences were muted. Reporting of methods currently used mirrored the pattern described above with regard to ever use of contraception.
The duration between marriage and first use of contraception was also explored. Findings suggest that the use of contraception within the first year of marriage was almost non-existent, reported by just 2–3% of young men and women. About 1–3% of youth reported initiation of contraceptive use between 1 and 3 years following marriage, and 5% of young men and 15% of young women, three or more years following marriage. Indeed, of those who reported ever having practised contraception, half of young men and about two-thirds of young women had initiated contraceptive use three or more years following marriage. Differences by sex and place of residence of the respondent were negligible. Consistent with this profile, just 2–3% of youth reported the practise of contraception to delay the first pregnancy.
10.11 Reproductive history
This section addresses young people’s reproductive history, namely, the first pregnancy and its outcome, children ever born and surviving, experience of pregnancy loss and the wantedness of recent pregnancies. As reported in Table 10.10, 80–81% of young women and men reported that they or their wife had experienced at least one pregnancy. Rural-urban differences were not observed among young women, but somewhat more rural than urban young men reported that their wife had ever been pregnant (81% versus 75%).
Figure 10.6: Percentage of married youth reporting lifetime and current use of contraceptive methods within marriage, Andhra Pradesh, 2007–08
Per
cen
t
40
20
0
10 10
0
8 8
0
23 23
0
21 21
0
MM MW
Ever used any method Ever used any modern method
Ever used any traditional method Currently using any method
Currently using any modern method Currently using any traditional method
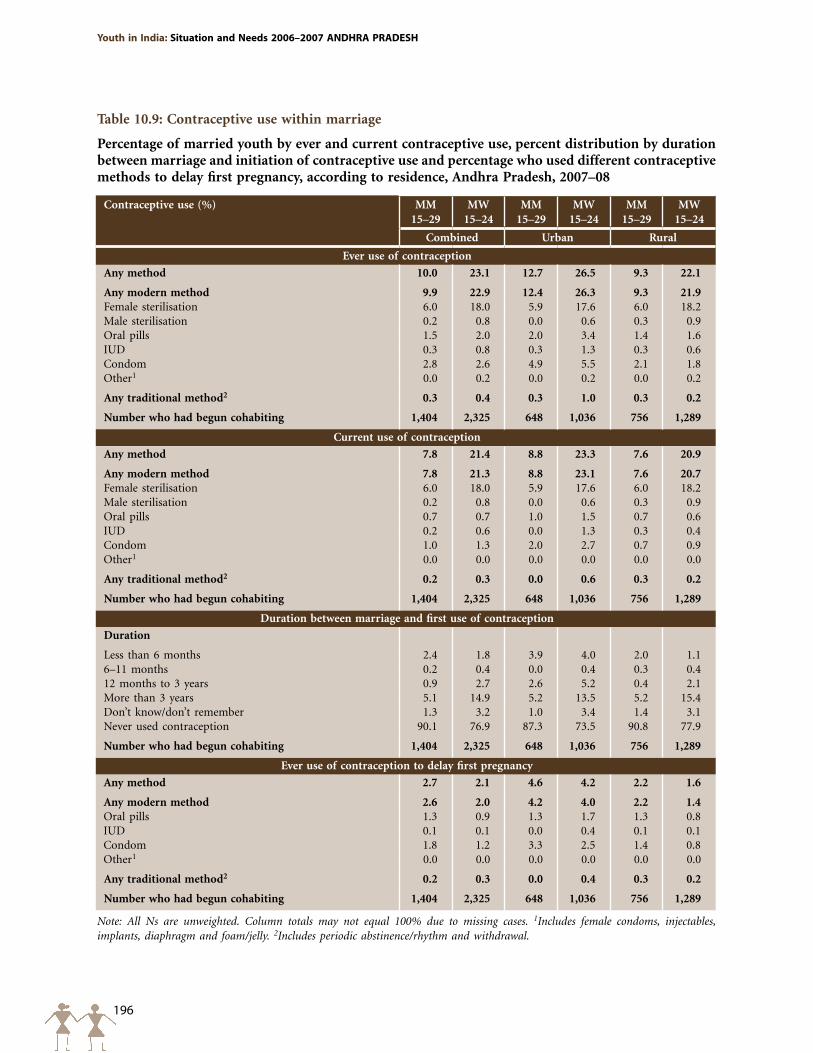
196
Youth in India: Situation and Needs 2006–2007 ANDHRA pRADESH
Table 10.9: Contraceptive use within marriage
Percentage of married youth by ever and current contraceptive use, percent distribution by duration between marriage and initiation of contraceptive use and percentage who used different contraceptive methods to delay first pregnancy, according to residence, Andhra Pradesh, 2007–08
Contraceptive use (%) MM 15–29
MW 15–24
MM 15–29
MW 15–24
MM 15–29
MW 15–24
Combined Urban Rural
Ever use of contraception
Any method 10.0 23.1 12.7 26.5 9.3 22.1
Any modern method 9.9 22.9 12.4 26.3 9.3 21.9Female sterilisation 6.0 18.0 5.9 17.6 6.0 18.2Male sterilisation 0.2 0.8 0.0 0.6 0.3 0.9Oral pills 1.5 2.0 2.0 3.4 1.4 1.6IUD 0.3 0.8 0.3 1.3 0.3 0.6Condom 2.8 2.6 4.9 5.5 2.1 1.8Other1 0.0 0.2 0.0 0.2 0.0 0.2
Any traditional method2 0.3 0.4 0.3 1.0 0.3 0.2
Number who had begun cohabiting 1,404 2,325 648 1,036 756 1,289
Current use of contraception
Any method 7.8 21.4 8.8 23.3 7.6 20.9
Any modern method 7.8 21.3 8.8 23.1 7.6 20.7Female sterilisation 6.0 18.0 5.9 17.6 6.0 18.2Male sterilisation 0.2 0.8 0.0 0.6 0.3 0.9Oral pills 0.7 0.7 1.0 1.5 0.7 0.6IUD 0.2 0.6 0.0 1.3 0.3 0.4Condom 1.0 1.3 2.0 2.7 0.7 0.9Other1 0.0 0.0 0.0 0.0 0.0 0.0
Any traditional method2 0.2 0.3 0.0 0.6 0.3 0.2
Number who had begun cohabiting 1,404 2,325 648 1,036 756 1,289
Duration between marriage and first use of contraception
Duration
Less than 6 months 2.4 1.8 3.9 4.0 2.0 1.16–11 months 0.2 0.4 0.0 0.4 0.3 0.412 months to 3 years 0.9 2.7 2.6 5.2 0.4 2.1More than 3 years 5.1 14.9 5.2 13.5 5.2 15.4Don’t know/don’t remember 1.3 3.2 1.0 3.4 1.4 3.1Never used contraception 90.1 76.9 87.3 73.5 90.8 77.9
Number who had begun cohabiting 1,404 2,325 648 1,036 756 1,289
Ever use of contraception to delay first pregnancy
Any method 2.7 2.1 4.6 4.2 2.2 1.6
Any modern method 2.6 2.0 4.2 4.0 2.2 1.4Oral pills 1.3 0.9 1.3 1.7 1.3 0.8IUD 0.1 0.1 0.0 0.4 0.1 0.1Condom 1.8 1.2 3.3 2.5 1.4 0.8Other1 0.0 0.0 0.0 0.0 0.0 0.0
Any traditional method2 0.2 0.3 0.0 0.4 0.3 0.2
Number who had begun cohabiting 1,404 2,325 648 1,036 756 1,289
Note: All Ns are unweighted. Column totals may not equal 100% due to missing cases. 1Includes female condoms, injectables, implants, diaphragm and foam/jelly. 2Includes periodic abstinence/rhythm and withdrawal.
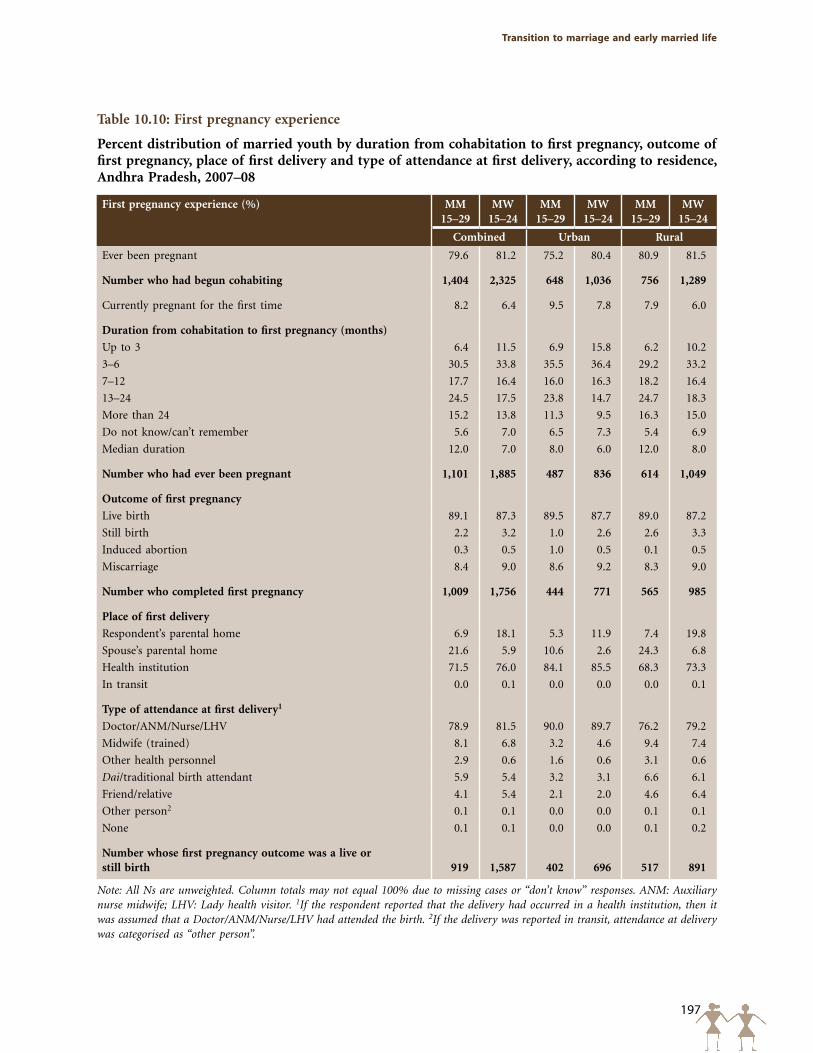
197
Transition to marriage and early married life
Table 10.10: First pregnancy experience
Percent distribution of married youth by duration from cohabitation to first pregnancy, outcome of first pregnancy, place of first delivery and type of attendance at first delivery, according to residence, Andhra Pradesh, 2007–08
First pregnancy experience (%) MM 15–29
MW 15–24
MM 15–29
MW 15–24
MM 15–29
MW 15–24
Combined Urban Rural
Ever been pregnant 79.6 81.2 75.2 80.4 80.9 81.5
Number who had begun cohabiting 1,404 2,325 648 1,036 756 1,289
Currently pregnant for the first time 8.2 6.4 9.5 7.8 7.9 6.0
Duration from cohabitation to first pregnancy (months)
Up to 3 6.4 11.5 6.9 15.8 6.2 10.2
3–6 30.5 33.8 35.5 36.4 29.2 33.2
7–12 17.7 16.4 16.0 16.3 18.2 16.4
13–24 24.5 17.5 23.8 14.7 24.7 18.3
More than 24 15.2 13.8 11.3 9.5 16.3 15.0
Do not know/can’t remember 5.6 7.0 6.5 7.3 5.4 6.9
Median duration 12.0 7.0 8.0 6.0 12.0 8.0
Number who had ever been pregnant 1,101 1,885 487 836 614 1,049
Outcome of first pregnancy
Live birth 89.1 87.3 89.5 87.7 89.0 87.2
Still birth 2.2 3.2 1.0 2.6 2.6 3.3
Induced abortion 0.3 0.5 1.0 0.5 0.1 0.5
Miscarriage 8.4 9.0 8.6 9.2 8.3 9.0
Number who completed first pregnancy 1,009 1,756 444 771 565 985
Place of first delivery
Respondent’s parental home 6.9 18.1 5.3 11.9 7.4 19.8
Spouse’s parental home 21.6 5.9 10.6 2.6 24.3 6.8
Health institution 71.5 76.0 84.1 85.5 68.3 73.3
In transit 0.0 0.1 0.0 0.0 0.0 0.1
Type of attendance at first delivery1
Doctor/ANM/Nurse/LHV 78.9 81.5 90.0 89.7 76.2 79.2
Midwife (trained) 8.1 6.8 3.2 4.6 9.4 7.4
Other health personnel 2.9 0.6 1.6 0.6 3.1 0.6
Dai/traditional birth attendant 5.9 5.4 3.2 3.1 6.6 6.1
Friend/relative 4.1 5.4 2.1 2.0 4.6 6.4
Other person2 0.1 0.1 0.0 0.0 0.1 0.1
None 0.1 0.1 0.0 0.0 0.1 0.2
Number whose first pregnancy outcome was a live or still birth 919 1,587 402 696 517 891
Note: All Ns are unweighted. Column totals may not equal 100% due to missing cases or “don’t know” responses. ANM: Auxiliary nurse midwife; LHV: Lady health visitor. 1If the respondent reported that the delivery had occurred in a health institution, then it was assumed that a Doctor/ANM/Nurse/LHV had attended the birth. 2If the delivery was reported in transit, attendance at delivery was categorised as “other person”.
198
Youth in India: Situation and Needs 2006–2007 ANDHRA pRADESH
10.11.1 First pregnancy experiences
Of those who reported that they or their wife had ever been pregnant, significant minorities reported a current first pregnancy (6% of young women and 8% of young men, respectively). Among those who had experienced at least one pregnancy, the first pregnancy had occurred within a year of marriage for over half of young men (55%) and three-fifths of young women (62%). Rural-urban differences suggest that the first pregnancy had occurred within a year of marriage for somewhat larger proportions of urban than rural youth (58–69% versus 54–60%). The median duration between marriage and first pregnancy was 12 months among young men and 7 months among young women, with rural youth reporting a somewhat longer median duration than their urban counterparts (8–12 months reported by rural youth compared to 6–8 months reported by urban youth).
Pregnancy outcomes were reported by all respondents who had completed their first pregnancy. The vast majority had experienced a live birth in every group, irrespective of sex or rural-urban residence. Among other outcomes, less than 1% had aborted their first pregnancy; for 2–3% the pregnancy had ended in a stillbirth and for 8–9% in a miscarriage. Differences by sex and rural-urban residence were negligible.
The large majority reported institutional delivery; even so, 24–29% reported that the first delivery had taken place at home. Rural-urban differences were pronounced: 84–86% of urban youth, compared to 68–73% of rural youth, reported an institutional delivery.
The vast majority of youth (89–90%) reported skilled attendance at first delivery. Rural-urban differences were evident; 95% of urban youth reported skilled attendance at delivery, compared to 87–89% of rural youth.
10.11.2 Children ever born and surviving
Findings, revealed in Table 10.11, show that youth had experienced an average of about 1.4–1.5 pregnancies and just over one live birth. Gender and rural-urban differences were negligible, although somewhat more urban than rural young men reported no live births (34% versus 29%).
Few youth reported an infant or child death. The distribution of respondents by number of surviving children resembles that of children ever born, reported above. Youth typically reported about as many daughters as sons.
Somewhat more youth reported the experience of pregnancy loss. For example, stillbirths were reported by 2–3% of youth, and disparities by respondents’ sex and residence were negligible. The situation was different in the case of miscarriage; 7% of young men and 11% of young women reported at least one miscarriage; the slight gender differences observed reflect perhaps the relatively limited communication between spouses on reproductive health matters. Finally, induced abortion was reported by less than 1% of young men and women, with little rural-urban variation.
Table 10.12 reports mean numbers of children ever born and surviving by respondents’ socio-demographic characteristics. As expected, age was positively associated with both fertility indicators. Religion- and caste-specific differences were narrow. The number of years of schooling completed was inversely associated with both fertility indicators, but was more consistently so among young women than young men, and the inverse association was observed, irrespective of rural-urban residence. Differentials in fertility indicators by work status and household economic status were narrow, although among young men in urban areas, an inverse association between household economic status and both fertility indicators was apparent. Patterns remained roughly similar in both urban and rural settings.
10.11.3 Wantedness of recent pregnancies
All youth who reported one or more pregnancies were asked about the wantedness of their last pregnancy or current pregnancy (for those currently pregnant). Findings, presented in Table 10.13, suggest substantial levels of unplanned pregnancy especially reported by young women. For example, among young men whose wife was not pregnant and young women who were not pregnant at the time of the interview, 15% of young men and 23% of young women
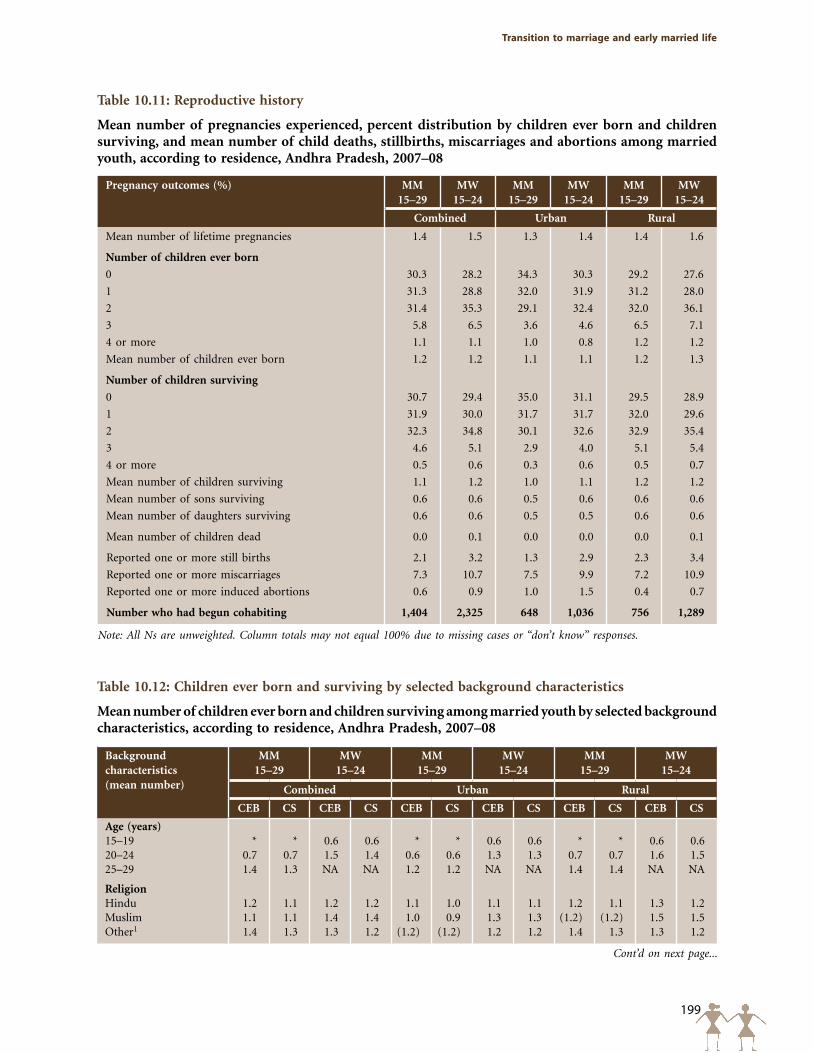
199
Transition to marriage and early married life
Table 10.12: Children ever born and surviving by selected background characteristics
Mean number of children ever born and children surviving among married youth by selected background characteristics, according to residence, Andhra Pradesh, 2007–08
Background characteristics (mean number)
MM15–29
MW15–24
MM15–29
MW15–24
MM15–29
MW15–24
Combined Urban Rural
CEB CS CEB CS CEB CS CEB CS CEB CS CEB CS
Age (years)15–19 * * 0.6 0.6 * * 0.6 0.6 * * 0.6 0.620–24 0.7 0.7 1.5 1.4 0.6 0.6 1.3 1.3 0.7 0.7 1.6 1.525–29 1.4 1.3 NA NA 1.2 1.2 NA NA 1.4 1.4 NA NA
Religion Hindu 1.2 1.1 1.2 1.2 1.1 1.0 1.1 1.1 1.2 1.1 1.3 1.2Muslim 1.1 1.1 1.4 1.4 1.0 0.9 1.3 1.3 (1.2) (1.2) 1.5 1.5Other1 1.4 1.3 1.3 1.2 (1.2) (1.2) 1.2 1.2 1.4 1.3 1.3 1.2
Table 10.11: Reproductive history
Mean number of pregnancies experienced, percent distribution by children ever born and children surviving, and mean number of child deaths, stillbirths, miscarriages and abortions among married youth, according to residence, Andhra Pradesh, 2007–08
Pregnancy outcomes (%) MM 15–29
MW 15–24
MM 15–29
MW 15–24
MM 15–29
MW 15–24
Combined Urban Rural
Mean number of lifetime pregnancies 1.4 1.5 1.3 1.4 1.4 1.6
Number of children ever born
0 30.3 28.2 34.3 30.3 29.2 27.6
1 31.3 28.8 32.0 31.9 31.2 28.0
2 31.4 35.3 29.1 32.4 32.0 36.1
3 5.8 6.5 3.6 4.6 6.5 7.1
4 or more 1.1 1.1 1.0 0.8 1.2 1.2
Mean number of children ever born 1.2 1.2 1.1 1.1 1.2 1.3
Number of children surviving
0 30.7 29.4 35.0 31.1 29.5 28.9
1 31.9 30.0 31.7 31.7 32.0 29.6
2 32.3 34.8 30.1 32.6 32.9 35.4
3 4.6 5.1 2.9 4.0 5.1 5.4
4 or more 0.5 0.6 0.3 0.6 0.5 0.7
Mean number of children surviving 1.1 1.2 1.0 1.1 1.2 1.2
Mean number of sons surviving 0.6 0.6 0.5 0.6 0.6 0.6
Mean number of daughters surviving 0.6 0.6 0.5 0.5 0.6 0.6
Mean number of children dead 0.0 0.1 0.0 0.0 0.0 0.1
Reported one or more still births 2.1 3.2 1.3 2.9 2.3 3.4
Reported one or more miscarriages 7.3 10.7 7.5 9.9 7.2 10.9
Reported one or more induced abortions 0.6 0.9 1.0 1.5 0.4 0.7
Number who had begun cohabiting 1,404 2,325 648 1,036 756 1,289
Note: All Ns are unweighted. Column totals may not equal 100% due to missing cases or “don’t know” responses.
Cont’d on next page...
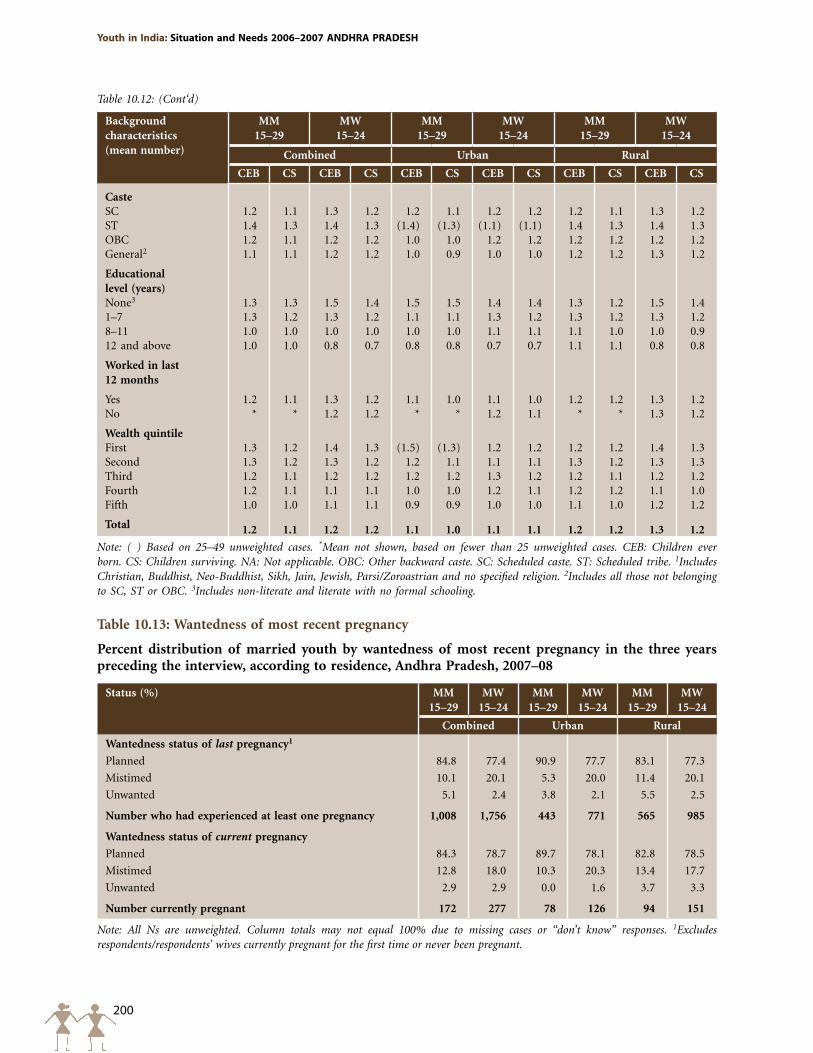
200
Youth in India: Situation and Needs 2006–2007 ANDHRA pRADESH
Background characteristics (mean number)
MM15–29
MW15–24
MM15–29
MW15–24
MM15–29
MW15–24
Combined Urban Rural
CEB CS CEB CS CEB CS CEB CS CEB CS CEB CS
CasteSC 1.2 1.1 1.3 1.2 1.2 1.1 1.2 1.2 1.2 1.1 1.3 1.2ST 1.4 1.3 1.4 1.3 (1.4) (1.3) (1.1) (1.1) 1.4 1.3 1.4 1.3OBC 1.2 1.1 1.2 1.2 1.0 1.0 1.2 1.2 1.2 1.2 1.2 1.2General2 1.1 1.1 1.2 1.2 1.0 0.9 1.0 1.0 1.2 1.2 1.3 1.2
Educational level (years)None3 1.3 1.3 1.5 1.4 1.5 1.5 1.4 1.4 1.3 1.2 1.5 1.41–7 1.3 1.2 1.3 1.2 1.1 1.1 1.3 1.2 1.3 1.2 1.3 1.28–11 1.0 1.0 1.0 1.0 1.0 1.0 1.1 1.1 1.1 1.0 1.0 0.912 and above 1.0 1.0 0.8 0.7 0.8 0.8 0.7 0.7 1.1 1.1 0.8 0.8
Worked in last 12 months
Yes 1.2 1.1 1.3 1.2 1.1 1.0 1.1 1.0 1.2 1.2 1.3 1.2No * * 1.2 1.2 * * 1.2 1.1 * * 1.3 1.2
Wealth quintileFirst 1.3 1.2 1.4 1.3 (1.5) (1.3) 1.2 1.2 1.2 1.2 1.4 1.3Second 1.3 1.2 1.3 1.2 1.2 1.1 1.1 1.1 1.3 1.2 1.3 1.3Third 1.2 1.1 1.2 1.2 1.2 1.2 1.3 1.2 1.2 1.1 1.2 1.2Fourth 1.2 1.1 1.1 1.1 1.0 1.0 1.2 1.1 1.2 1.2 1.1 1.0Fifth 1.0 1.0 1.1 1.1 0.9 0.9 1.0 1.0 1.1 1.0 1.2 1.2
Total 1.2 1.1 1.2 1.2 1.1 1.0 1.1 1.1 1.2 1.2 1.3 1.2
Note: ( ) Based on 25–49 unweighted cases. *Mean not shown, based on fewer than 25 unweighted cases. CEB: Children ever born. CS: Children surviving. NA: Not applicable. OBC: Other backward caste. SC: Scheduled caste. ST: Scheduled tribe. 1Includes Christian, Buddhist, Neo-Buddhist, Sikh, Jain, Jewish, Parsi/Zoroastrian and no specified religion. 2Includes all those not belonging to SC, ST or OBC. 3Includes non-literate and literate with no formal schooling.
Table 10.12: (Cont‘d)
Table 10.13: Wantedness of most recent pregnancy
Percent distribution of married youth by wantedness of most recent pregnancy in the three years preceding the interview, according to residence, Andhra Pradesh, 2007–08
Status (%) MM15–29
MW15–24
MM15–29
MW15–24
MM15–29
MW15–24
Combined Urban Rural
Wantedness status of last pregnancy1
Planned 84.8 77.4 90.9 77.7 83.1 77.3
Mistimed 10.1 20.1 5.3 20.0 11.4 20.1
Unwanted 5.1 2.4 3.8 2.1 5.5 2.5
Number who had experienced at least one pregnancy 1,008 1,756 443 771 565 985
Wantedness status of current pregnancy
Planned 84.3 78.7 89.7 78.1 82.8 78.5
Mistimed 12.8 18.0 10.3 20.3 13.4 17.7
Unwanted 2.9 2.9 0.0 1.6 3.7 3.3
Number currently pregnant 172 277 78 126 94 151
Note: All Ns are unweighted. Column totals may not equal 100% due to missing cases or “don’t know” responses. 1Excludes respondents/respondents’ wives currently pregnant for the first time or never been pregnant.
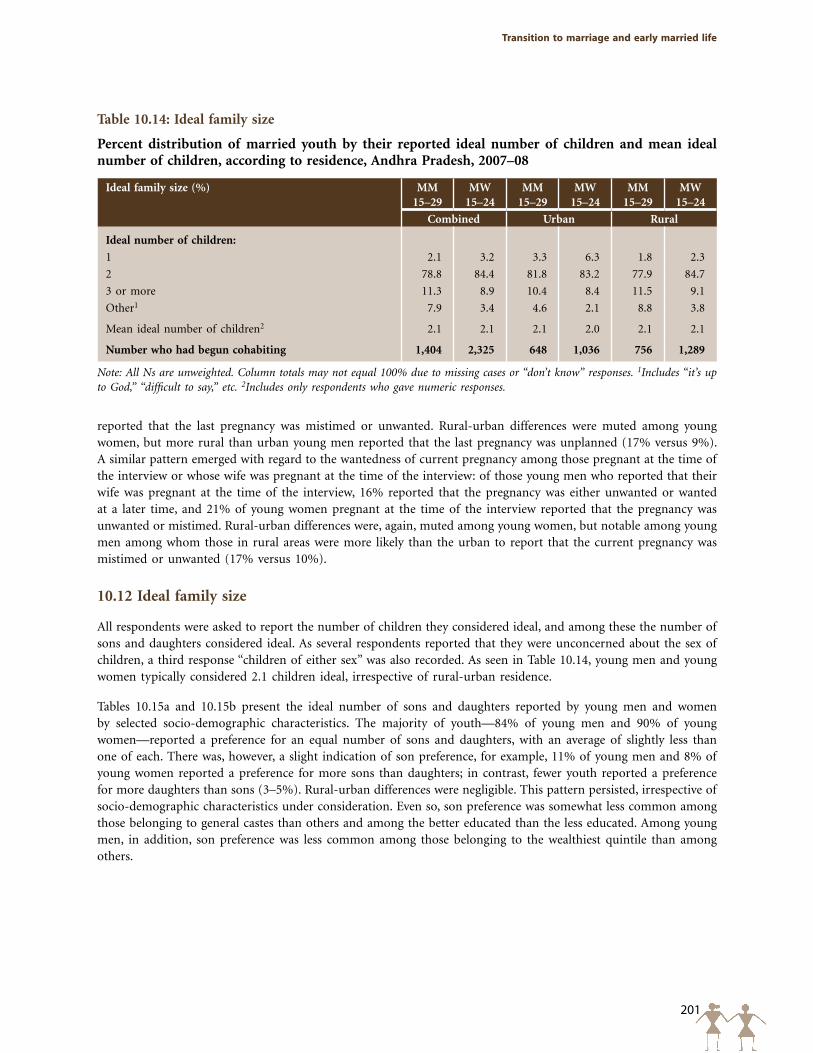
201
Transition to marriage and early married life
Table 10.14: Ideal family size
Percent distribution of married youth by their reported ideal number of children and mean ideal number of children, according to residence, Andhra Pradesh, 2007–08
Ideal family size (%) MM15–29
MW15–24
MM15–29
MW15–24
MM15–29
MW15–24
Combined Urban Rural
Ideal number of children:
1 2.1 3.2 3.3 6.3 1.8 2.3
2 78.8 84.4 81.8 83.2 77.9 84.7
3 or more 11.3 8.9 10.4 8.4 11.5 9.1
Other1 7.9 3.4 4.6 2.1 8.8 3.8
Mean ideal number of children2 2.1 2.1 2.1 2.0 2.1 2.1
Number who had begun cohabiting 1,404 2,325 648 1,036 756 1,289
Note: All Ns are unweighted. Column totals may not equal 100% due to missing cases or “don’t know” responses. 1Includes “it’s up to God,” “difficult to say,” etc. 2Includes only respondents who gave numeric responses.
reported that the last pregnancy was mistimed or unwanted. Rural-urban differences were muted among young women, but more rural than urban young men reported that the last pregnancy was unplanned (17% versus 9%). A similar pattern emerged with regard to the wantedness of current pregnancy among those pregnant at the time of the interview or whose wife was pregnant at the time of the interview: of those young men who reported that their wife was pregnant at the time of the interview, 16% reported that the pregnancy was either unwanted or wanted at a later time, and 21% of young women pregnant at the time of the interview reported that the pregnancy was unwanted or mistimed. Rural-urban differences were, again, muted among young women, but notable among young men among whom those in rural areas were more likely than the urban to report that the current pregnancy was mistimed or unwanted (17% versus 10%).
10.12 Ideal family size
All respondents were asked to report the number of children they considered ideal, and among these the number of sons and daughters considered ideal. As several respondents reported that they were unconcerned about the sex of children, a third response “children of either sex” was also recorded. As seen in Table 10.14, young men and young women typically considered 2.1 children ideal, irrespective of rural-urban residence.
Tables 10.15a and 10.15b present the ideal number of sons and daughters reported by young men and women by selected socio-demographic characteristics. The majority of youth—84% of young men and 90% of young women—reported a preference for an equal number of sons and daughters, with an average of slightly less than one of each. There was, however, a slight indication of son preference, for example, 11% of young men and 8% of young women reported a preference for more sons than daughters; in contrast, fewer youth reported a preference for more daughters than sons (3–5%). Rural-urban differences were negligible. This pattern persisted, irrespective of socio-demographic characteristics under consideration. Even so, son preference was somewhat less common among those belonging to general castes than others and among the better educated than the less educated. Among young men, in addition, son preference was less common among those belonging to the wealthiest quintile than among others.
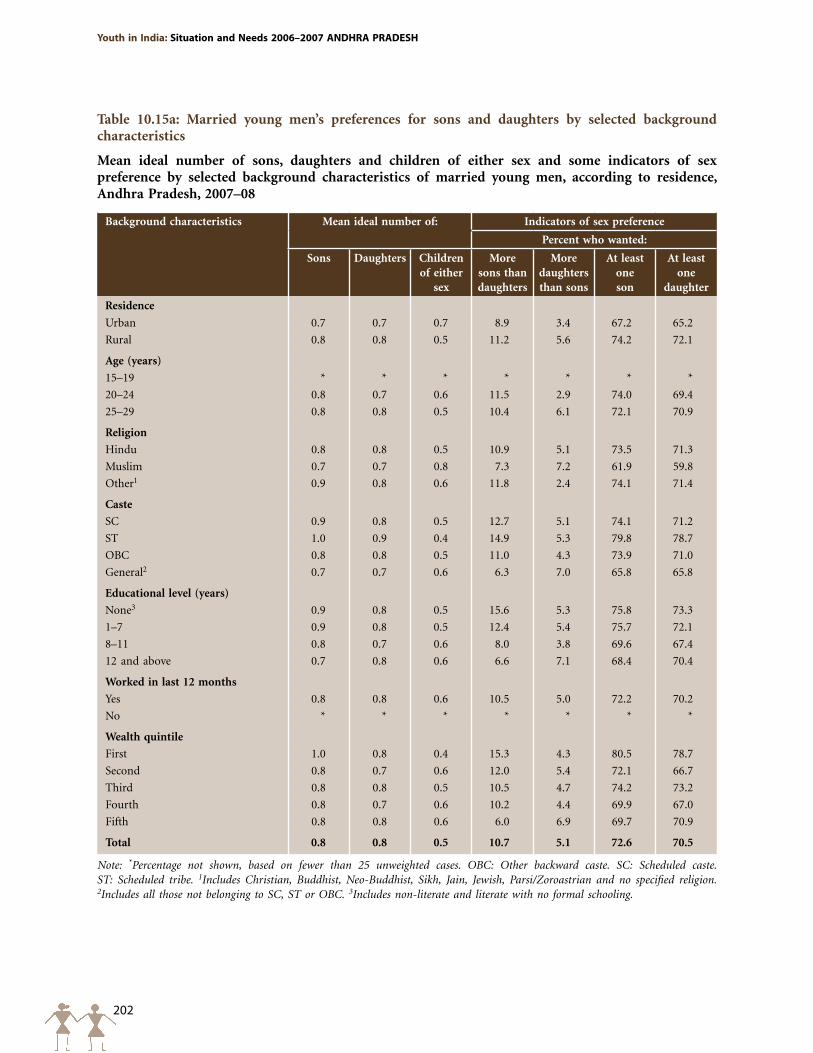
202
Youth in India: Situation and Needs 2006–2007 ANDHRA pRADESH
Table 10.15a: Married young men’s preferences for sons and daughters by selected background characteristics
Mean ideal number of sons, daughters and children of either sex and some indicators of sex preference by selected background characteristics of married young men, according to residence, Andhra Pradesh, 2007–08
Background characteristics Mean ideal number of: Indicators of sex preference
Percent who wanted:
Sons Daughters Children of either
sex
More sons than daughters
More daughters than sons
At least one son
At least one
daughter
Residence
Urban 0.7 0.7 0.7 8.9 3.4 67.2 65.2
Rural 0.8 0.8 0.5 11.2 5.6 74.2 72.1
Age (years)
15–19 * * * * * * *
20–24 0.8 0.7 0.6 11.5 2.9 74.0 69.4
25–29 0.8 0.8 0.5 10.4 6.1 72.1 70.9
Religion
Hindu 0.8 0.8 0.5 10.9 5.1 73.5 71.3
Muslim 0.7 0.7 0.8 7.3 7.2 61.9 59.8
Other1 0.9 0.8 0.6 11.8 2.4 74.1 71.4
Caste
SC 0.9 0.8 0.5 12.7 5.1 74.1 71.2
ST 1.0 0.9 0.4 14.9 5.3 79.8 78.7
OBC 0.8 0.8 0.5 11.0 4.3 73.9 71.0
General2 0.7 0.7 0.6 6.3 7.0 65.8 65.8
Educational level (years)
None3 0.9 0.8 0.5 15.6 5.3 75.8 73.3
1–7 0.9 0.8 0.5 12.4 5.4 75.7 72.1
8–11 0.8 0.7 0.6 8.0 3.8 69.6 67.4
12 and above 0.7 0.8 0.6 6.6 7.1 68.4 70.4
Worked in last 12 months
Yes 0.8 0.8 0.6 10.5 5.0 72.2 70.2
No * * * * * * *
Wealth quintile
First 1.0 0.8 0.4 15.3 4.3 80.5 78.7
Second 0.8 0.7 0.6 12.0 5.4 72.1 66.7
Third 0.8 0.8 0.5 10.5 4.7 74.2 73.2
Fourth 0.8 0.7 0.6 10.2 4.4 69.9 67.0
Fifth 0.8 0.8 0.6 6.0 6.9 69.7 70.9
Total 0.8 0.8 0.5 10.7 5.1 72.6 70.5
Note: *Percentage not shown, based on fewer than 25 unweighted cases. OBC: Other backward caste. SC: Scheduled caste. ST: Scheduled tribe. 1Includes Christian, Buddhist, Neo-Buddhist, Sikh, Jain, Jewish, Parsi/Zoroastrian and no specified religion. 2Includes all those not belonging to SC, ST or OBC. 3Includes non-literate and literate with no formal schooling.
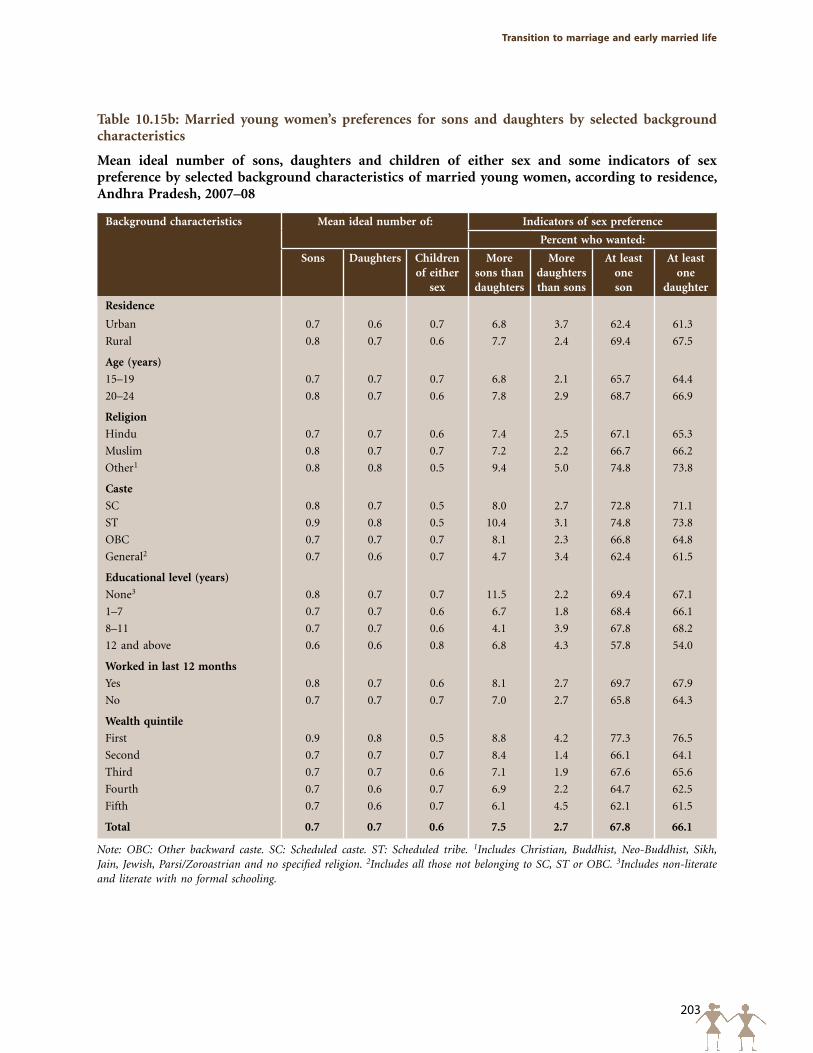
203
Transition to marriage and early married life
Table 10.15b: Married young women’s preferences for sons and daughters by selected background characteristics
Mean ideal number of sons, daughters and children of either sex and some indicators of sex preference by selected background characteristics of married young women, according to residence, Andhra Pradesh, 2007–08
Background characteristics Mean ideal number of: Indicators of sex preference
Percent who wanted:
Sons Daughters Children of either
sex
More sons than daughters
More daughters than sons
At least one son
At least one
daughter
Residence
Urban 0.7 0.6 0.7 6.8 3.7 62.4 61.3
Rural 0.8 0.7 0.6 7.7 2.4 69.4 67.5
Age (years)
15–19 0.7 0.7 0.7 6.8 2.1 65.7 64.4
20–24 0.8 0.7 0.6 7.8 2.9 68.7 66.9
Religion
Hindu 0.7 0.7 0.6 7.4 2.5 67.1 65.3
Muslim 0.8 0.7 0.7 7.2 2.2 66.7 66.2
Other1 0.8 0.8 0.5 9.4 5.0 74.8 73.8
Caste
SC 0.8 0.7 0.5 8.0 2.7 72.8 71.1
ST 0.9 0.8 0.5 10.4 3.1 74.8 73.8
OBC 0.7 0.7 0.7 8.1 2.3 66.8 64.8
General2 0.7 0.6 0.7 4.7 3.4 62.4 61.5
Educational level (years)
None3 0.8 0.7 0.7 11.5 2.2 69.4 67.1
1–7 0.7 0.7 0.6 6.7 1.8 68.4 66.1
8–11 0.7 0.7 0.6 4.1 3.9 67.8 68.2
12 and above 0.6 0.6 0.8 6.8 4.3 57.8 54.0
Worked in last 12 months
Yes 0.8 0.7 0.6 8.1 2.7 69.7 67.9
No 0.7 0.7 0.7 7.0 2.7 65.8 64.3
Wealth quintile
First 0.9 0.8 0.5 8.8 4.2 77.3 76.5
Second 0.7 0.7 0.7 8.4 1.4 66.1 64.1
Third 0.7 0.7 0.6 7.1 1.9 67.6 65.6
Fourth 0.7 0.6 0.7 6.9 2.2 64.7 62.5
Fifth 0.7 0.6 0.7 6.1 4.5 62.1 61.5
Total 0.7 0.7 0.6 7.5 2.7 67.8 66.1
Note: OBC: Other backward caste. SC: Scheduled caste. ST: Scheduled tribe. 1Includes Christian, Buddhist, Neo-Buddhist, Sikh, Jain, Jewish, Parsi/Zoroastrian and no specified religion. 2Includes all those not belonging to SC, ST or OBC. 3Includes non-literate and literate with no formal schooling.
204
Youth in India: Situation and Needs 2006–2007 ANDHRA pRADESH
10.13 Summary
Findings indicate that although most youth preferred to marry after age 18, early marriage continues to characterise the lives of many young women, and, to a certain extent, the lives of young men as well. Among young women aged 20–24 years, almost one in five young women (18%) was married before age 15, 54% before age 18 and almost three in four (72%) before age 20. Even though early marriage was less prevalent among young men, one in ten young men aged 20–24 years was married before age 20.
Almost all youth reported arranged marriages; it is notable, however, that 86–89% of youth were given an opportunity to participate in the decision on the choice of their spouse. At the same time, reported pre-marital acquaintance was limited. Just a little over one-quarter of young men and one-fifth of young women reported that they had ever had a chance to meet and interact alone with their spouse-to-be prior to marriage. Over two in five married youth reported that they had met their spouse for the first time on the wedding day. Compounding the lack of pre-marital acquaintance was the lack of awareness of what to expect of married life, reported by over two-thirds of young men and over four-fifths of young women.
Despite the existence of laws against the payment of dowry, this practice characterised the marriages of 81% of young men and 86% of young women. Findings also show that families of urban youth appeared as likely as their rural counterparts to conform to traditional practices, such as payment of dowry.
Reports of marital life suggest that married life was characterised by considerable inter-spousal communication on most topics, yet, just one in eight young men and one in three young women had ever discussed matters relating to contraception with their spouse, clearly undermining married young people’s ability to adopt protective actions.
Physical violence and forced sex within marriage were reported by sizeable proportions of youth. For example, a little less than one-quarter of young women reported that they had ever faced physical violence perpetrated by their husband and one-fifth of young men reported perpetrating violence on their wife. Recent violence was likewise reported by about one-sixth of young men and about one-fifth of young women. Sexual violence was also reported by significant minorities of youth. One in ten young women reported ever being forced to engage in sex by their husband; one in seven young men reported forcing their wife to engage in sex. Fewer youth (5%) reported recent sexual violence.
While the Youth Study did not explore extra-marital sexual experiences in detail, the available data indicate that 6% of young men reported an extra-marital sexual encounter. In contrast, less than 1% of young women reported an extra-marital sexual encounter.
Contraceptive use at any time within marriage was relatively limited, reported by 10% of young men and 23% of young women. Moreover, just 8% of young men and 21% of young women reported current use of contraception. Among contraceptive methods typically used, female sterilisation was mostly likely to be reported; indeed, over three-quarters of young men and over four-fifths of young women who were practising contraception at the time of the interview reported that their wife or they had been sterilised. Just 2–3% of young people practised contraception to delay the first birth. Not surprisingly, pregnancy typically occurred within a year of marriage for over three-fifths of young women and over half of young men who reported that they or their wife had been pregnant at least once. Moreover, substantial proportions of youth reported experiencing unintended pregnancy. For example, among young women who were not pregnant at the time of the interview and among young men whose wife was not pregnant at the time of the interview, 23% and 15%, respectively, reported that the last pregnancy was mistimed or unwanted.
Circumstances of the first birth suggest that the overwhelming majority of first births were delivered in a health care facility (72–76%) and 89–90% of first births were delivered by a skilled attendant.
Findings also show that most respondents wanted one child of each sex and just a small minority of young men and women expressed a preference for more sons than daughters.
205
Health and health seeking behaviour
This chapter focuses on young people’s patterns of substance use, health status and treatment-seeking for health problems experienced. The Youth Study probed alcohol, drug and tobacco use as well as, among those who reported substance use, consumption characteristics, including recent use and extent of use. The Study also included questions relating to the experience of problems in the areas of general, sexual and reproductive health and mental health. It also explored young people’s care seeking practices for general and sexual and reproductive health problems as well as their attitudes towards pre-marital HIV testing for boys and girls and the extent to which youth had undergone HIV testing. Where numbers are small, we present combined findings for rural and urban respondents.
11.1 Substance use
Research has shown that substance use can directly compromise young people’s health. For example, evidence suggests that the use of alcohol and drugs among youth is associated with physical fights, risky sexual activity, depression and suicide as well as irregular school or work attendance and other negative outcomes (DiClemente, 1992; Ellickson, Saner and McGuigan, 1997; Gruber et al., 1996; Lowry et al., 1994; Mohan, Sankara Sarma and Thankappan, 2005; Singh and Saini, 2007).
Youth Study findings on the extent of substance use among young people themselves suggest that hardly any young men and not a single young woman reported drug use (including, for example, ganja, charas, brown sugar, cocaine and bhang). While hardly any young women reported consumption of tobacco or alcohol, a substantial proportion of young men reported doing so (Table 11.1). For example, 20% of young men and less than 1% of young women had ever consumed tobacco products. Most of those young men who had ever consumed tobacco products reported that they had done so once a week or more frequently in the month prior to the interview. Married young men were far more likely than the unmarried to report having ever used tobacco products (42% and 15%, respectively) and recent tobacco use (37% and 13%, respectively). Rural-urban differences were negligible.
As far as alcohol consumption is concerned, just two percent of young women, including 1% of urban young women and 2% of rural young women, reported alcohol consumption. In contrast to young women, larger percentages of young men reported that they had ever consumed (27%) or had recently consumed (9%) alcohol. As in the case of tobacco use, married young men were far more likely to have ever consumed alcohol than the unmarried (49% and 23%, respectively). Recent alcohol use—once a week or more frequently in the month prior to the interview—was reported by many fewer: 22% and 6% of married and unmarried young men, respectively. Young men in urban settings—both the married and the unmarried—were more likely than their rural counterparts to report having ever consumed alcohol (61% and 28% among married and unmarried young men in urban settings, respectively, and 46% and 21% of married and unmarried young men in rural settings). The large majority of young men who had ever consumed alcohol reported that they usually consumed alcohol with peers (91% and 93% of the married and unmarried, respectively) and over two-fifths (42% and 44% of the married and unmarried, respectively) reported that they sometimes or often became drunk (not shown in tabular form).
Chapter 11
Health and health seeking behaviour
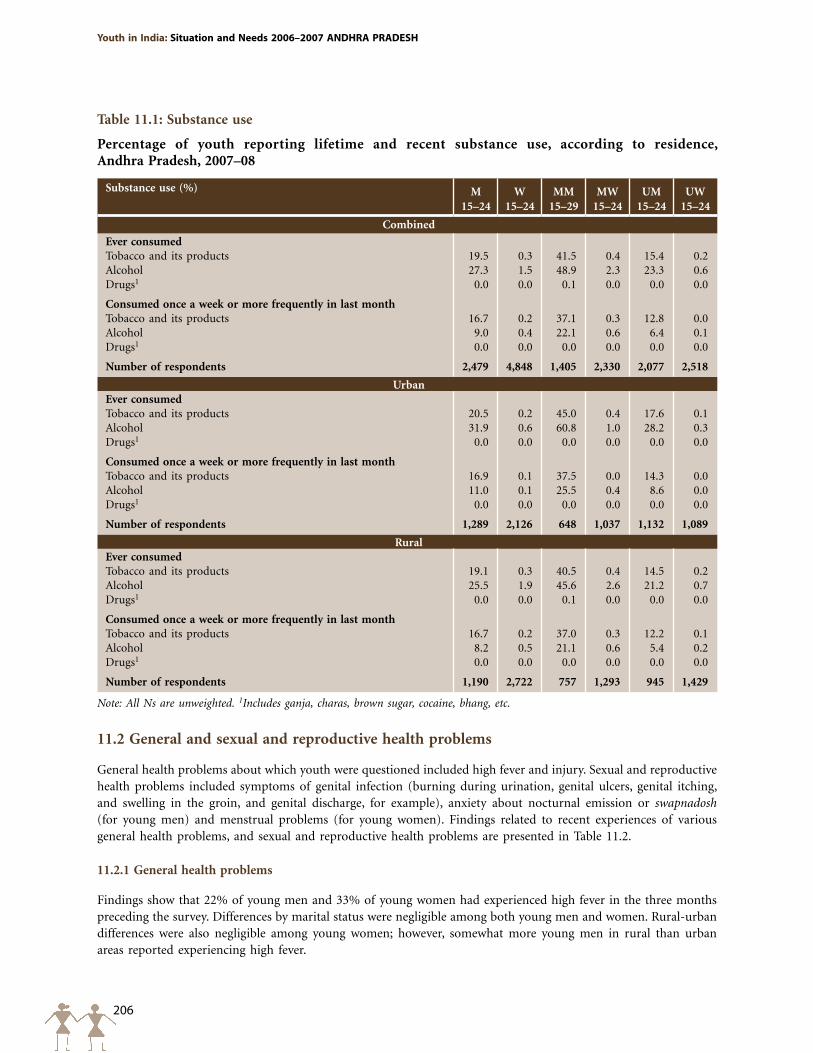
206
Youth in India: Situation and Needs 2006–2007 ANDHRA pRADESH
Table 11.1: Substance use
Percentage of youth reporting lifetime and recent substance use, according to residence, Andhra Pradesh, 2007–08
Substance use (%) M15–24
W15–24
MM15–29
MW15–24
UM15–24
UW15–24
Combined
Ever consumedTobacco and its products 19.5 0.3 41.5 0.4 15.4 0.2Alcohol 27.3 1.5 48.9 2.3 23.3 0.6Drugs1 0.0 0.0 0.1 0.0 0.0 0.0
Consumed once a week or more frequently in last monthTobacco and its products 16.7 0.2 37.1 0.3 12.8 0.0Alcohol 9.0 0.4 22.1 0.6 6.4 0.1Drugs1 0.0 0.0 0.0 0.0 0.0 0.0
Number of respondents 2,479 4,848 1,405 2,330 2,077 2,518
UrbanEver consumedTobacco and its products 20.5 0.2 45.0 0.4 17.6 0.1Alcohol 31.9 0.6 60.8 1.0 28.2 0.3Drugs1 0.0 0.0 0.0 0.0 0.0 0.0
Consumed once a week or more frequently in last monthTobacco and its products 16.9 0.1 37.5 0.0 14.3 0.0Alcohol 11.0 0.1 25.5 0.4 8.6 0.0Drugs1 0.0 0.0 0.0 0.0 0.0 0.0
Number of respondents 1,289 2,126 648 1,037 1,132 1,089
RuralEver consumedTobacco and its products 19.1 0.3 40.5 0.4 14.5 0.2Alcohol 25.5 1.9 45.6 2.6 21.2 0.7Drugs1 0.0 0.0 0.1 0.0 0.0 0.0
Consumed once a week or more frequently in last monthTobacco and its products 16.7 0.2 37.0 0.3 12.2 0.1Alcohol 8.2 0.5 21.1 0.6 5.4 0.2Drugs1 0.0 0.0 0.0 0.0 0.0 0.0
Number of respondents 1,190 2,722 757 1,293 945 1,429
Note: All Ns are unweighted. 1Includes ganja, charas, brown sugar, cocaine, bhang, etc.
11.2 General and sexual and reproductive health problems
General health problems about which youth were questioned included high fever and injury. Sexual and reproductive health problems included symptoms of genital infection (burning during urination, genital ulcers, genital itching, and swelling in the groin, and genital discharge, for example), anxiety about nocturnal emission or swapnadosh (for young men) and menstrual problems (for young women). Findings related to recent experiences of various general health problems, and sexual and reproductive health problems are presented in Table 11.2.
11.2.1 General health problems
Findings show that 22% of young men and 33% of young women had experienced high fever in the three months preceding the survey. Differences by marital status were negligible among both young men and women. Rural-urban differences were also negligible among young women; however, somewhat more young men in rural than urban areas reported experiencing high fever.
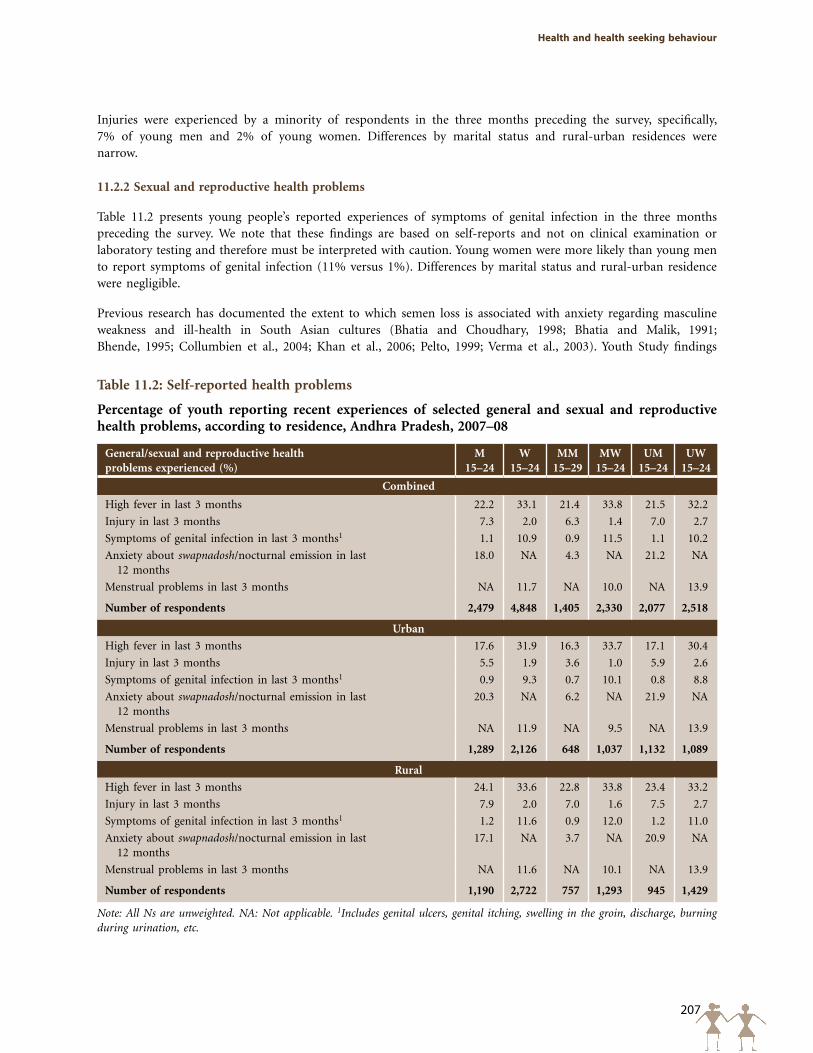
207
Health and health seeking behaviour
Table 11.2: Self-reported health problems
Percentage of youth reporting recent experiences of selected general and sexual and reproductive health problems, according to residence, Andhra Pradesh, 2007–08
General/sexual and reproductive health problems experienced (%)
M15–24
W15–24
MM15–29
MW15–24
UM15–24
UW15–24
Combined
High fever in last 3 months 22.2 33.1 21.4 33.8 21.5 32.2
Injury in last 3 months 7.3 2.0 6.3 1.4 7.0 2.7
Symptoms of genital infection in last 3 months1 1.1 10.9 0.9 11.5 1.1 10.2
Anxiety about swapnadosh/nocturnal emission in last 12 months
18.0 NA 4.3 NA 21.2 NA
Menstrual problems in last 3 months NA 11.7 NA 10.0 NA 13.9
Number of respondents 2,479 4,848 1,405 2,330 2,077 2,518
Urban
High fever in last 3 months 17.6 31.9 16.3 33.7 17.1 30.4
Injury in last 3 months 5.5 1.9 3.6 1.0 5.9 2.6
Symptoms of genital infection in last 3 months1 0.9 9.3 0.7 10.1 0.8 8.8
Anxiety about swapnadosh/nocturnal emission in last 12 months
20.3 NA 6.2 NA 21.9 NA
Menstrual problems in last 3 months NA 11.9 NA 9.5 NA 13.9
Number of respondents 1,289 2,126 648 1,037 1,132 1,089
Rural
High fever in last 3 months 24.1 33.6 22.8 33.8 23.4 33.2
Injury in last 3 months 7.9 2.0 7.0 1.6 7.5 2.7
Symptoms of genital infection in last 3 months1 1.2 11.6 0.9 12.0 1.2 11.0
Anxiety about swapnadosh/nocturnal emission in last 12 months
17.1 NA 3.7 NA 20.9 NA
Menstrual problems in last 3 months NA 11.6 NA 10.1 NA 13.9
Number of respondents 1,190 2,722 757 1,293 945 1,429
Note: All Ns are unweighted. NA: Not applicable. 1Includes genital ulcers, genital itching, swelling in the groin, discharge, burning during urination, etc.
Injuries were experienced by a minority of respondents in the three months preceding the survey, specifically, 7% of young men and 2% of young women. Differences by marital status and rural-urban residences were narrow.
11.2.2 Sexual and reproductive health problems
Table 11.2 presents young people’s reported experiences of symptoms of genital infection in the three months preceding the survey. We note that these findings are based on self-reports and not on clinical examination or laboratory testing and therefore must be interpreted with caution. Young women were more likely than young men to report symptoms of genital infection (11% versus 1%). Differences by marital status and rural-urban residence were negligible.
Previous research has documented the extent to which semen loss is associated with anxiety regarding masculine weakness and ill-health in South Asian cultures (Bhatia and Choudhary, 1998; Bhatia and Malik, 1991; Bhende, 1995; Collumbien et al., 2004; Khan et al., 2006; Pelto, 1999; Verma et al., 2003). Youth Study findings
208
Youth in India: Situation and Needs 2006–2007 ANDHRA pRADESH
suggest that 18% of young men had indeed experienced anxiety about swapnadosh or nocturnal emission in the 12 months preceding the interview. Vast differences were, however, observed by marital status: 4% of married men compared to 21% of unmarried young men reported anxiety about nocturnal emission. Differences by rural-urban residence were muted.
With regard to young women’s experience of other reproductive health problems in the three months preceding the interview, findings suggest that 12% of young women experienced menstrual problems. A somewhat larger percentage of unmarried than married young women experienced menstrual problem (14% versus 10%); rural-urban differences were, however, not evident.
11.3 Mental health disorders
The mental health status of young people was assessed based on their responses to the General Health Questionnaire (GHQ-12) (Goldberg, 1992; Patel and Andrew, 2001). This questionnaire, designed to identify the presence of possible mental health disorders, is based on 12 questions that assess the extent to which a respondent experienced, for example, happiness, depression, anxiety and sleep disturbance in the one month preceding the interview. Threshold scores of 2, 3, 4 or more have been variously used to identify the possible presence of common mental health disorders (Bashir et al., 1996; Donath, 2001; Jacob, Bhugra and Mann, 1997). Table 11.3 presents responses on each item of the GHQ-12, and a summary measure indicating the percentage who gave three or more responses suggestive of mental health disorders.
Relatively small proportions of young men and women reported responses suggestive of mental disorders on any of the 12 items and gender disparities in response patterns were narrow. Indeed, for the most part, fewer than 10% of young men and women reported responses likely to suggest mental health disorders. On just one item did more than 10% of young men and women report so: 12% of young men reported feeling that they were constantly under strain and 12% of young women reported feeling that they were incapable of making decisions. Differences by marital status and rural-urban residence were narrow although more married young men in rural than urban areas reported losing sleep over worry (12% versus 5%) and not feeling reasonably happy, all things considered (11% versus 5%).
Overall, 11% of young men and 10% young women reported three or more of the 12 symptoms/behaviours probed in the GHQ-12, indicative of mental disorders. Marital status differences and rural-urban differences were mild (see Figure 11.1). Even so, somewhat more married young men in rural than urban areas displayed scores indicative of mental health disorders (14% versus 7%).
11.4 Care and advice seeking
Young people who reported physical or sexual and reproductive health problems were probed about whether they had sought care or advice for the problem and the source of this care or advice. Findings are presented in Table 11.4 and suggest that care and advice seeking differed by the kind of problem experienced as well as, in several instances, sex and marital status of the respondent.
11.4.1 General health problems
According to findings presented in Table 11.4, almost all (93–96%) of young people experiencing high fever had sought treatment. Differences by marital status were negligible. Treatment was sought from a government health care facility or provider by a relatively small percentage of those who sought care: 24% of young men and 21% of young women. The majority of respondents reportedly sought care from private sector providers (60% of young men and 64% of young women), reflecting the pattern in health care seeking behaviour in India more generally. We note, however, that respondents may not always have been able to discern whether the private sector provider

209
Health and health seeking behaviour
Table 11.3: Reported symptoms or behaviours suggestive of mental health disorders
Percentage of youth reporting symptoms or behaviours suggestive of mental health disorders experienced in the month preceding the interview, according to residence, Andhra Pradesh, 2007–08
Symptoms/behaviours (%) M 15–24
W 15–24
MM 15–29
MW 15–24
UM 15–24
UW 15–24
Combined
Unable to concentrate on whatever he/she was doing 2.7 3.5 2.4 4.1 2.8 2.8Lost much sleep over worry 9.2 6.9 10.5 7.8 8.5 5.7Felt that he/she was not playing a useful role 3.1 3.6 2.8 4.1 3.2 2.9Felt incapable of making decisions 6.5 11.6 6.5 12.7 5.8 10.2Felt constantly under strain 11.6 7.1 12.4 8.2 11.3 5.7Felt that he/she could not overcome his/her difficulties 4.7 7.8 4.5 8.6 4.7 6.6Unable to enjoy normal day-to-day activities 6.2 5.0 6.7 5.9 5.6 3.9Unable to face up to his/her problems 7.2 7.8 5.6 8.4 7.5 6.9Been feeling unhappy and depressed 7.8 7.6 7.4 8.5 7.6 6.4Been losing confidence in himself/herself 6.0 4.4 5.8 5.1 5.8 3.5Been thinking of himself/herself as a worthless person 5.0 3.6 4.2 4.2 4.9 2.8Not feeling reasonably happy, all things considered 7.6 7.5 9.6 8.2 7.0 6.7
Three or more symptoms/behaviours 10.6 10.1 12.5 11.1 9.7 8.9
Number of respondents 2,479 4,848 1,405 2,330 2,077 2,518
Urban
Unable to concentrate on whatever he/she was doing 2.7 2.3 1.3 2.1 2.9 2.5Lost much sleep over worry 7.1 5.6 5.2 5.3 7.4 5.8Felt that he/she was not playing a useful role 2.8 2.1 2.3 2.3 2.9 2.0Felt incapable of making decisions 5.2 9.8 3.6 10.3 4.9 9.4Felt constantly under strain 11.5 5.8 9.2 6.5 11.6 5.2Felt that he/she could not overcome his/her difficulties 3.7 6.5 1.6 7.4 4.1 5.7Unable to enjoy normal day-to-day activities 5.8 2.8 5.2 2.5 5.1 3.2Unable to face up to his/her problems 5.8 7.3 3.9 8.0 6.0 6.6Been feeling unhappy and depressed 5.4 5.8 4.6 5.3 5.2 6.2Been losing confidence in himself/herself 3.5 3.0 2.6 3.4 3.2 2.8Been thinking of himself/herself as a worthless person 3.0 2.9 1.3 3.0 3.2 2.9Not feeling reasonably happy, all things considered 6.4 5.8 5.2 5.3 6.3 6.2
Three or more symptoms/behaviours 8.1 8.3 7.2 8.4 7.6 8.3
Number of respondents 1,289 2,126 648 1,037 1,132 1,089
Rural
Unable to concentrate on whatever he/she was doing 2.7 4.0 2.8 4.7 2.8 3.0Lost much sleep over worry 10.1 7.4 12.1 8.5 8.9 5.6Felt that he/she was not playing a useful role 3.2 4.2 2.8 4.7 3.4 3.5Felt incapable of making decisions 7.0 12.4 7.5 13.4 6.2 10.8Felt constantly under strain 11.7 7.6 13.3 8.6 11.1 5.9Felt that he/she could not overcome his/her difficulties 5.1 8.3 5.2 9.0 5.0 7.1Unable to enjoy normal day-to-day activities 6.3 5.9 7.1 6.9 5.8 4.2Unable to face up to his/her problems 7.8 8.0 6.1 8.5 8.2 7.1Been feeling unhappy and depressed 8.8 8.3 8.2 9.4 8.6 6.5Been losing confidence in himself/herself 7.0 5.0 6.6 5.7 6.9 3.9Been thinking of himself/herself as a worthless person 5.7 3.9 5.0 4.7 5.7 2.8Not feeling reasonably happy, all things considered 8.0 8.2 10.8 9.0 7.3 7.0
Three or more symptoms/behaviours 11.6 10.9 13.9 11.9 10.6 9.3
Number of respondents 1,190 2,722 757 1,293 945 1,429
Note: All Ns are unweighted.
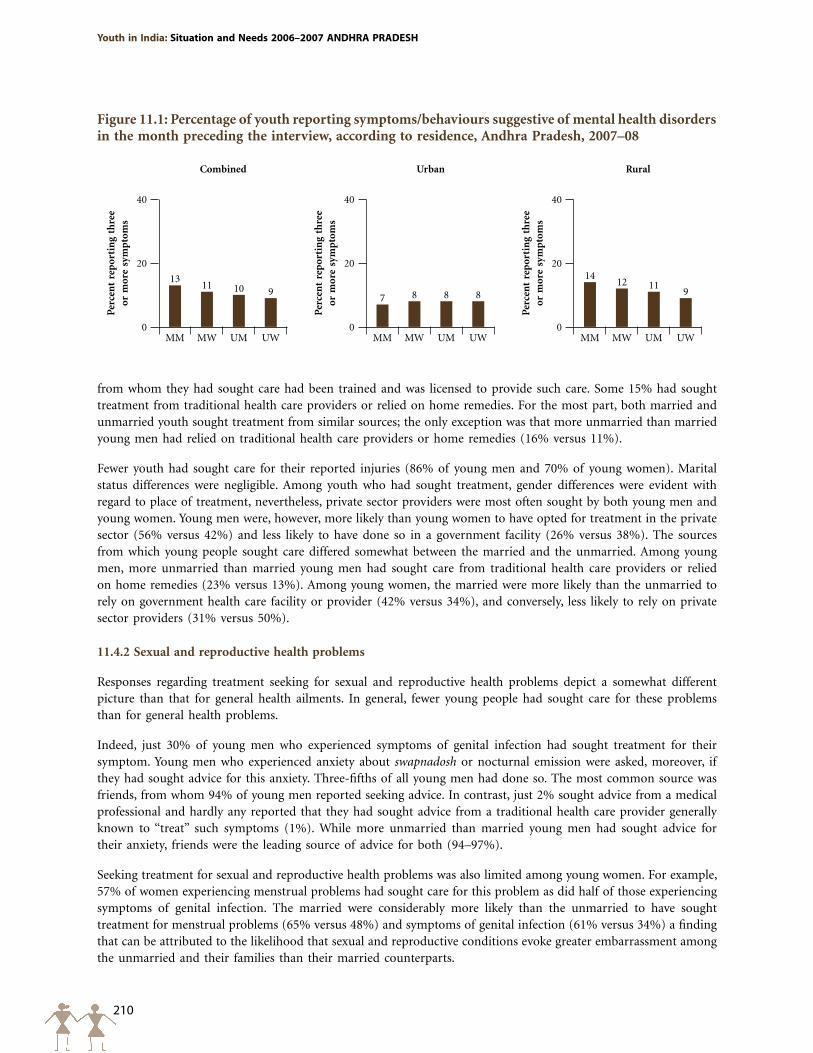
210
Youth in India: Situation and Needs 2006–2007 ANDHRA pRADESH
Figure 11.1: Percentage of youth reporting symptoms/behaviours suggestive of mental health disorders in the month preceding the interview, according to residence, Andhra Pradesh, 2007–08
Per
cen
t re
por
tin
g th
ree
or m
ore
sym
pto
ms
Per
cen
t re
por
tin
g th
ree
or m
ore
sym
pto
ms
Per
cen
t re
por
tin
g th
ree
or m
ore
sym
pto
ms
40
20
0
40
20
0
40
20
0
13
7
1411
812
108
119 8 9
MM MM MMMW MW MWUM UM UMUW UW UW
Combined Urban Rural
from whom they had sought care had been trained and was licensed to provide such care. Some 15% had sought treatment from traditional health care providers or relied on home remedies. For the most part, both married and unmarried youth sought treatment from similar sources; the only exception was that more unmarried than married young men had relied on traditional health care providers or home remedies (16% versus 11%).
Fewer youth had sought care for their reported injuries (86% of young men and 70% of young women). Marital status differences were negligible. Among youth who had sought treatment, gender differences were evident with regard to place of treatment, nevertheless, private sector providers were most often sought by both young men and young women. Young men were, however, more likely than young women to have opted for treatment in the private sector (56% versus 42%) and less likely to have done so in a government facility (26% versus 38%). The sources from which young people sought care differed somewhat between the married and the unmarried. Among young men, more unmarried than married young men had sought care from traditional health care providers or relied on home remedies (23% versus 13%). Among young women, the married were more likely than the unmarried to rely on government health care facility or provider (42% versus 34%), and conversely, less likely to rely on private sector providers (31% versus 50%).
11.4.2 Sexual and reproductive health problems
Responses regarding treatment seeking for sexual and reproductive health problems depict a somewhat different picture than that for general health ailments. In general, fewer young people had sought care for these problems than for general health problems.
Indeed, just 30% of young men who experienced symptoms of genital infection had sought treatment for their symptom. Young men who experienced anxiety about swapnadosh or nocturnal emission were asked, moreover, if they had sought advice for this anxiety. Three-fifths of all young men had done so. The most common source was friends, from whom 94% of young men reported seeking advice. In contrast, just 2% sought advice from a medical professional and hardly any reported that they had sought advice from a traditional health care provider generally known to “treat” such symptoms (1%). While more unmarried than married young men had sought advice for their anxiety, friends were the leading source of advice for both (94–97%).
Seeking treatment for sexual and reproductive health problems was also limited among young women. For example, 57% of women experiencing menstrual problems had sought care for this problem as did half of those experiencing symptoms of genital infection. The married were considerably more likely than the unmarried to have sought treatment for menstrual problems (65% versus 48%) and symptoms of genital infection (61% versus 34%) a finding that can be attributed to the likelihood that sexual and reproductive conditions evoke greater embarrassment among the unmarried and their families than their married counterparts.
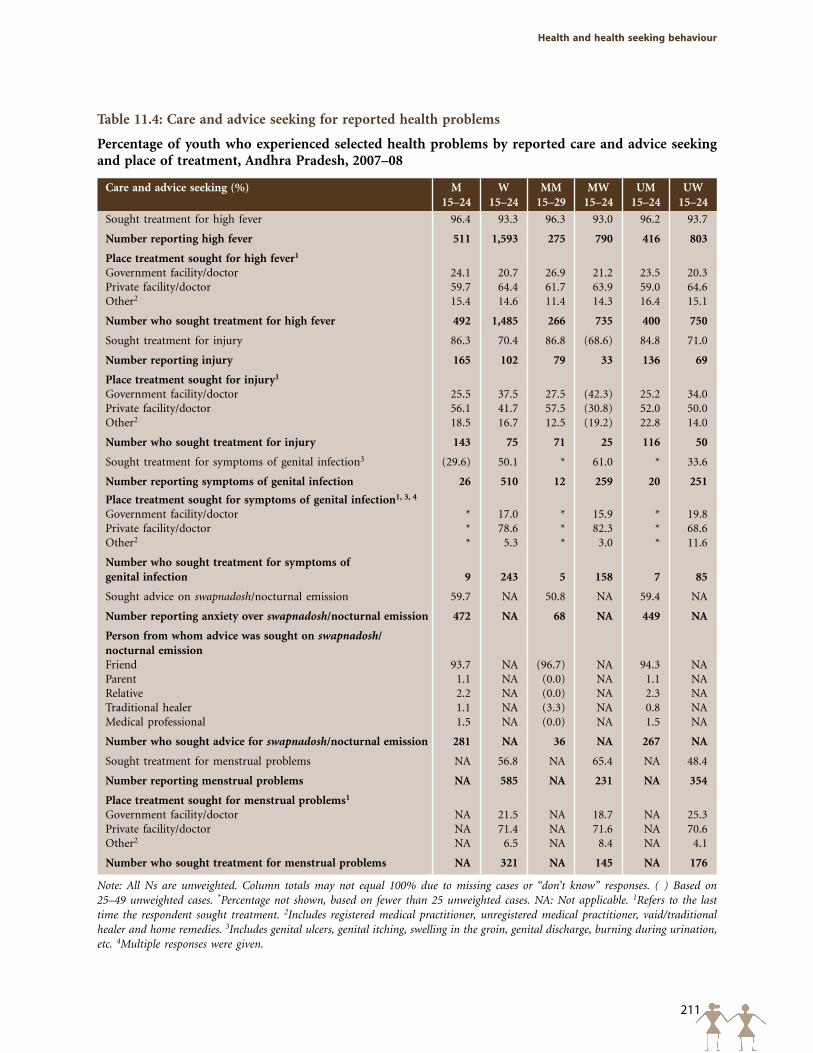
211
Health and health seeking behaviour
Table 11.4: Care and advice seeking for reported health problems
Percentage of youth who experienced selected health problems by reported care and advice seeking and place of treatment, Andhra Pradesh, 2007–08
Care and advice seeking (%) M 15–24
W 15–24
MM 15–29
MW 15–24
UM 15–24
UW 15–24
Sought treatment for high fever 96.4 93.3 96.3 93.0 96.2 93.7
Number reporting high fever 511 1,593 275 790 416 803
Place treatment sought for high fever1 Government facility/doctor 24.1 20.7 26.9 21.2 23.5 20.3Private facility/doctor 59.7 64.4 61.7 63.9 59.0 64.6Other2 15.4 14.6 11.4 14.3 16.4 15.1
Number who sought treatment for high fever 492 1,485 266 735 400 750
Sought treatment for injury 86.3 70.4 86.8 (68.6) 84.8 71.0
Number reporting injury 165 102 79 33 136 69
Place treatment sought for injury1
Government facility/doctor 25.5 37.5 27.5 (42.3) 25.2 34.0Private facility/doctor 56.1 41.7 57.5 (30.8) 52.0 50.0Other2 18.5 16.7 12.5 (19.2) 22.8 14.0
Number who sought treatment for injury 143 75 71 25 116 50
Sought treatment for symptoms of genital infection3 (29.6) 50.1 * 61.0 * 33.6
Number reporting symptoms of genital infection 26 510 12 259 20 251
Place treatment sought for symptoms of genital infection1, 3, 4
Government facility/doctor * 17.0 * 15.9 * 19.8Private facility/doctor * 78.6 * 82.3 * 68.6Other2 * 5.3 * 3.0 * 11.6
Number who sought treatment for symptoms of genital infection 9 243 5 158 7 85
Sought advice on swapnadosh/nocturnal emission 59.7 NA 50.8 NA 59.4 NA
Number reporting anxiety over swapnadosh/nocturnal emission 472 NA 68 NA 449 NA
Person from whom advice was sought on swapnadosh/ nocturnal emissionFriend 93.7 NA (96.7) NA 94.3 NAParent 1.1 NA (0.0) NA 1.1 NARelative 2.2 NA (0.0) NA 2.3 NATraditional healer 1.1 NA (3.3) NA 0.8 NAMedical professional 1.5 NA (0.0) NA 1.5 NA
Number who sought advice for swapnadosh/nocturnal emission 281 NA 36 NA 267 NA
Sought treatment for menstrual problems NA 56.8 NA 65.4 NA 48.4
Number reporting menstrual problems NA 585 NA 231 NA 354
Place treatment sought for menstrual problems1
Government facility/doctor NA 21.5 NA 18.7 NA 25.3Private facility/doctor NA 71.4 NA 71.6 NA 70.6Other2 NA 6.5 NA 8.4 NA 4.1
Number who sought treatment for menstrual problems NA 321 NA 145 NA 176
Note: All Ns are unweighted. Column totals may not equal 100% due to missing cases or “don’t know” responses. ( ) Based on 25–49 unweighted cases. *Percentage not shown, based on fewer than 25 unweighted cases. NA: Not applicable. 1Refers to the last time the respondent sought treatment. 2Includes registered medical practitioner, unregistered medical practitioner, vaid/traditional healer and home remedies. 3Includes genital ulcers, genital itching, swelling in the groin, genital discharge, burning during urination, etc. 4Multiple responses were given.
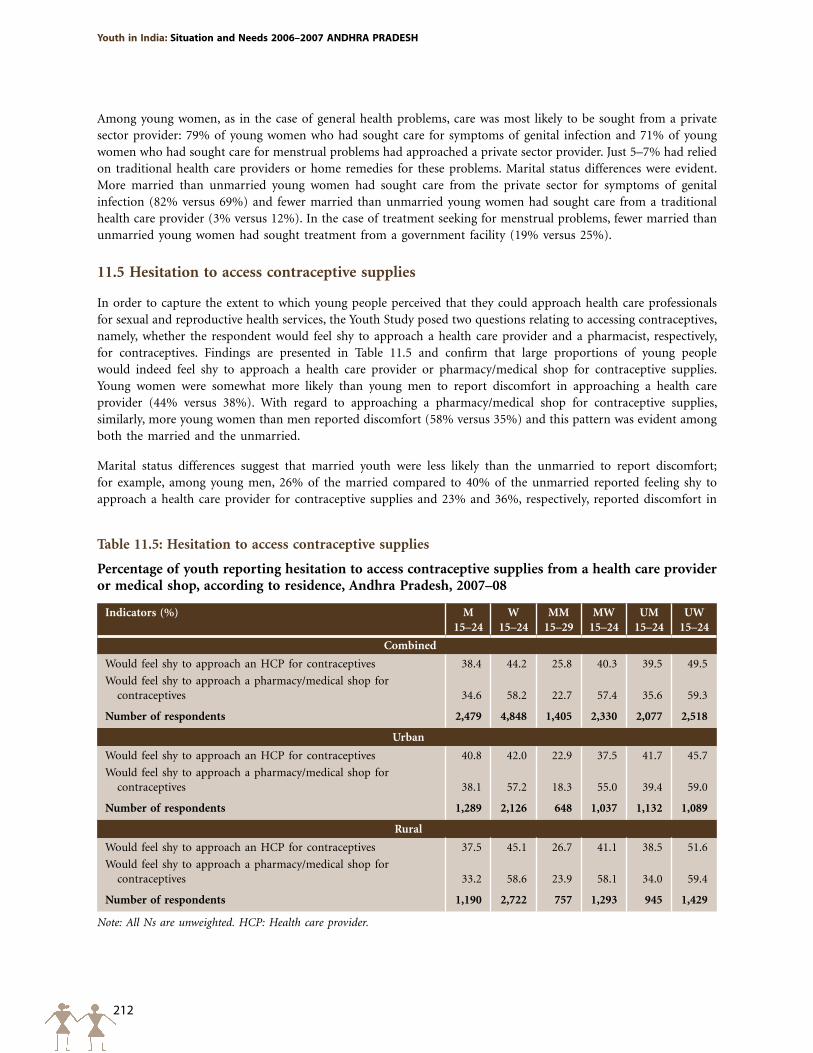
212
Youth in India: Situation and Needs 2006–2007 ANDHRA pRADESH
Among young women, as in the case of general health problems, care was most likely to be sought from a private sector provider: 79% of young women who had sought care for symptoms of genital infection and 71% of young women who had sought care for menstrual problems had approached a private sector provider. Just 5–7% had relied on traditional health care providers or home remedies for these problems. Marital status differences were evident. More married than unmarried young women had sought care from the private sector for symptoms of genital infection (82% versus 69%) and fewer married than unmarried young women had sought care from a traditional health care provider (3% versus 12%). In the case of treatment seeking for menstrual problems, fewer married than unmarried young women had sought treatment from a government facility (19% versus 25%).
11.5 Hesitation to access contraceptive supplies
In order to capture the extent to which young people perceived that they could approach health care professionals for sexual and reproductive health services, the Youth Study posed two questions relating to accessing contraceptives, namely, whether the respondent would feel shy to approach a health care provider and a pharmacist, respectively, for contraceptives. Findings are presented in Table 11.5 and confirm that large proportions of young people would indeed feel shy to approach a health care provider or pharmacy/medical shop for contraceptive supplies. Young women were somewhat more likely than young men to report discomfort in approaching a health care provider (44% versus 38%). With regard to approaching a pharmacy/medical shop for contraceptive supplies, similarly, more young women than men reported discomfort (58% versus 35%) and this pattern was evident among both the married and the unmarried.
Marital status differences suggest that married youth were less likely than the unmarried to report discomfort; for example, among young men, 26% of the married compared to 40% of the unmarried reported feeling shy to approach a health care provider for contraceptive supplies and 23% and 36%, respectively, reported discomfort in
Table 11.5: Hesitation to access contraceptive supplies
Percentage of youth reporting hesitation to access contraceptive supplies from a health care provider or medical shop, according to residence, Andhra Pradesh, 2007–08
Indicators (%) M 15–24
W 15–24
MM 15–29
MW 15–24
UM 15–24
UW 15–24
Combined
Would feel shy to approach an HCP for contraceptives 38.4 44.2 25.8 40.3 39.5 49.5
Would feel shy to approach a pharmacy/medical shop for contraceptives 34.6 58.2 22.7 57.4 35.6 59.3
Number of respondents 2,479 4,848 1,405 2,330 2,077 2,518
Urban
Would feel shy to approach an HCP for contraceptives 40.8 42.0 22.9 37.5 41.7 45.7
Would feel shy to approach a pharmacy/medical shop for contraceptives 38.1 57.2 18.3 55.0 39.4 59.0
Number of respondents 1,289 2,126 648 1,037 1,132 1,089
Rural
Would feel shy to approach an HCP for contraceptives 37.5 45.1 26.7 41.1 38.5 51.6
Would feel shy to approach a pharmacy/medical shop for contraceptives 33.2 58.6 23.9 58.1 34.0 59.4
Number of respondents 1,190 2,722 757 1,293 945 1,429
Note: All Ns are unweighted. HCP: Health care provider.
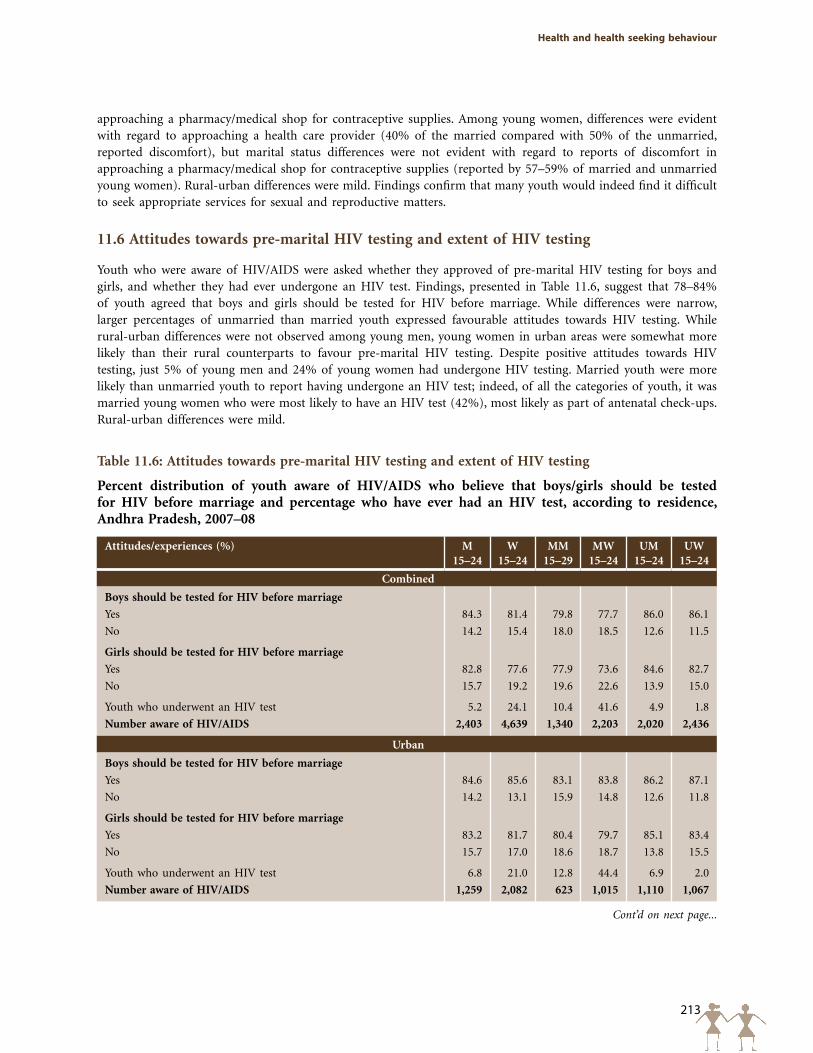
213
Health and health seeking behaviour
Table 11.6: Attitudes towards pre-marital HIV testing and extent of HIV testing
Percent distribution of youth aware of HIV/AIDS who believe that boys/girls should be tested for HIV before marriage and percentage who have ever had an HIV test, according to residence, Andhra Pradesh, 2007–08
Attitudes/experiences (%) M 15–24
W 15–24
MM 15–29
MW 15–24
UM 15–24
UW 15–24
Combined
Boys should be tested for HIV before marriage
Yes 84.3 81.4 79.8 77.7 86.0 86.1
No 14.2 15.4 18.0 18.5 12.6 11.5
Girls should be tested for HIV before marriage
Yes 82.8 77.6 77.9 73.6 84.6 82.7
No 15.7 19.2 19.6 22.6 13.9 15.0
Youth who underwent an HIV test 5.2 24.1 10.4 41.6 4.9 1.8
Number aware of HIV/AIDS 2,403 4,639 1,340 2,203 2,020 2,436
Urban
Boys should be tested for HIV before marriage
Yes 84.6 85.6 83.1 83.8 86.2 87.1
No 14.2 13.1 15.9 14.8 12.6 11.8
Girls should be tested for HIV before marriage
Yes 83.2 81.7 80.4 79.7 85.1 83.4
No 15.7 17.0 18.6 18.7 13.8 15.5
Youth who underwent an HIV test 6.8 21.0 12.8 44.4 6.9 2.0
Number aware of HIV/AIDS 1,259 2,082 623 1,015 1,110 1,067
approaching a pharmacy/medical shop for contraceptive supplies. Among young women, differences were evident with regard to approaching a health care provider (40% of the married compared with 50% of the unmarried, reported discomfort), but marital status differences were not evident with regard to reports of discomfort in approaching a pharmacy/medical shop for contraceptive supplies (reported by 57–59% of married and unmarried young women). Rural-urban differences were mild. Findings confirm that many youth would indeed find it difficult to seek appropriate services for sexual and reproductive matters.
11.6 Attitudes towards pre-marital HIV testing and extent of HIV testing
Youth who were aware of HIV/AIDS were asked whether they approved of pre-marital HIV testing for boys and girls, and whether they had ever undergone an HIV test. Findings, presented in Table 11.6, suggest that 78–84% of youth agreed that boys and girls should be tested for HIV before marriage. While differences were narrow, larger percentages of unmarried than married youth expressed favourable attitudes towards HIV testing. While rural-urban differences were not observed among young men, young women in urban areas were somewhat more likely than their rural counterparts to favour pre-marital HIV testing. Despite positive attitudes towards HIV testing, just 5% of young men and 24% of young women had undergone HIV testing. Married youth were more likely than unmarried youth to report having undergone an HIV test; indeed, of all the categories of youth, it was married young women who were most likely to have an HIV test (42%), most likely as part of antenatal check-ups. Rural-urban differences were mild.
Cont’d on next page...
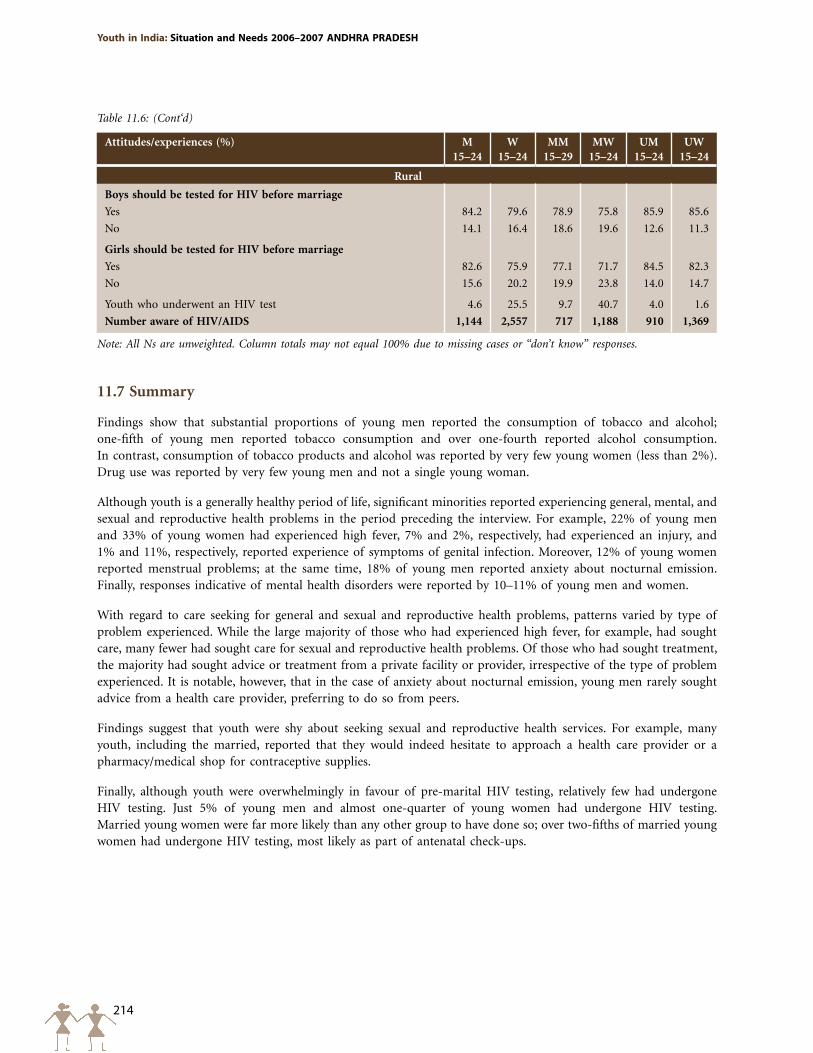
214
Youth in India: Situation and Needs 2006–2007 ANDHRA pRADESH
11.7 Summary
Findings show that substantial proportions of young men reported the consumption of tobacco and alcohol; one-fifth of young men reported tobacco consumption and over one-fourth reported alcohol consumption. In contrast, consumption of tobacco products and alcohol was reported by very few young women (less than 2%). Drug use was reported by very few young men and not a single young woman.
Although youth is a generally healthy period of life, significant minorities reported experiencing general, mental, and sexual and reproductive health problems in the period preceding the interview. For example, 22% of young men and 33% of young women had experienced high fever, 7% and 2%, respectively, had experienced an injury, and 1% and 11%, respectively, reported experience of symptoms of genital infection. Moreover, 12% of young women reported menstrual problems; at the same time, 18% of young men reported anxiety about nocturnal emission. Finally, responses indicative of mental health disorders were reported by 10–11% of young men and women.
With regard to care seeking for general and sexual and reproductive health problems, patterns varied by type of problem experienced. While the large majority of those who had experienced high fever, for example, had sought care, many fewer had sought care for sexual and reproductive health problems. Of those who had sought treatment, the majority had sought advice or treatment from a private facility or provider, irrespective of the type of problem experienced. It is notable, however, that in the case of anxiety about nocturnal emission, young men rarely sought advice from a health care provider, preferring to do so from peers.
Findings suggest that youth were shy about seeking sexual and reproductive health services. For example, many youth, including the married, reported that they would indeed hesitate to approach a health care provider or a pharmacy/medical shop for contraceptive supplies.
Finally, although youth were overwhelmingly in favour of pre-marital HIV testing, relatively few had undergone HIV testing. Just 5% of young men and almost one-quarter of young women had undergone HIV testing. Married young women were far more likely than any other group to have done so; over two-fifths of married young women had undergone HIV testing, most likely as part of antenatal check-ups.
Attitudes/experiences (%) M 15–24
W 15–24
MM 15–29
MW 15–24
UM 15–24
UW 15–24
Rural
Boys should be tested for HIV before marriage
Yes 84.2 79.6 78.9 75.8 85.9 85.6
No 14.1 16.4 18.6 19.6 12.6 11.3
Girls should be tested for HIV before marriage
Yes 82.6 75.9 77.1 71.7 84.5 82.3
No 15.6 20.2 19.9 23.8 14.0 14.7
Youth who underwent an HIV test 4.6 25.5 9.7 40.7 4.0 1.6
Number aware of HIV/AIDS 1,144 2,557 717 1,188 910 1,369
Note: All Ns are unweighted. Column totals may not equal 100% due to missing cases or “don’t know” responses.
Table 11.6: (Cont‘d)
215
participation in civil society and political life
The National Youth Policy 2003 has underscored the role of India’s youth in political decision-making and argued for greater representation of youth in appropriate bodies and more extensive youth participation in the design and implementation of programmes (Ministry of Youth Affairs and Sports, 2003). Indeed, there is a recognition that today’s youth, who have better access to skills and information than those of earlier generations, can play an important role in influencing political processes and the socio-economic development of the country.
This chapter presents a profile of youth involvement in government- and NGO-sponsored programmes, community activities and political processes. It also explores young people’s behaviours and attitudes towards individuals of different religions and caste groups, violence within their community and their own participation in such violence, and their perceptions about the most important problem facing youth in India.
12.1 Awareness of and participation in government- and NGO-sponsored programmes
Youth were asked whether they were aware of programmes in which youth could participate that had taken place in their village or urban neighbourhood in the three years preceding the interview. They were also asked whether they had participated in these programmes and whether these programmes had been organised by government agencies or NGOs. Findings are presented in Table 12.1.
Programme awareness was considerably more likely to be reported by young women than men: two-fifths of young men and two-thirds of young women reported awareness of one or more programmes that addressed youth needs organised in the three years prior to the interview (see also Figure 12.1). Differences by marital status were negligible, except that among young men, the unmarried were somewhat more likely than the married to be aware of one or more programmes (40% versus 35%). However, rural youth were considerably more likely than urban youth to be aware of one or more programmes (45% versus 25% of young men; 71% versus 48% of young women). It is evident, therefore, that community-level programmes were more likely to be directed toward young women than young men and more likely to be conducted in rural than urban settings.
Findings suggest a gender divide also in the kinds of programmes about which youth were aware. The leading programmes about which young men were aware related to health promotion (19%), leadership and life skills (14%) and employment (10%). In contrast, the largest proportions of young women were aware of self-help groups (43%), health promotion (19%) and leadership and life skills (14%) programmes. Marital status differences were negligible among young men; however, among young women, the unmarried were more likely than the married to be aware of leadership and life skills programmes (17% versus 12%), and less likely to be aware of self-help groups (38% versus 48%); unmarried young women in rural areas were also more likely than their married counterparts to report awareness of health promotion and literacy programmes (23% versus 18% and 16% versus 9%, respectively). Rural-urban differences were also apparent, with rural youth more aware of almost every type of programme than urban youth and these differences were more pronounced among young men than young women.
Chapter 12
participation in civil society and political life
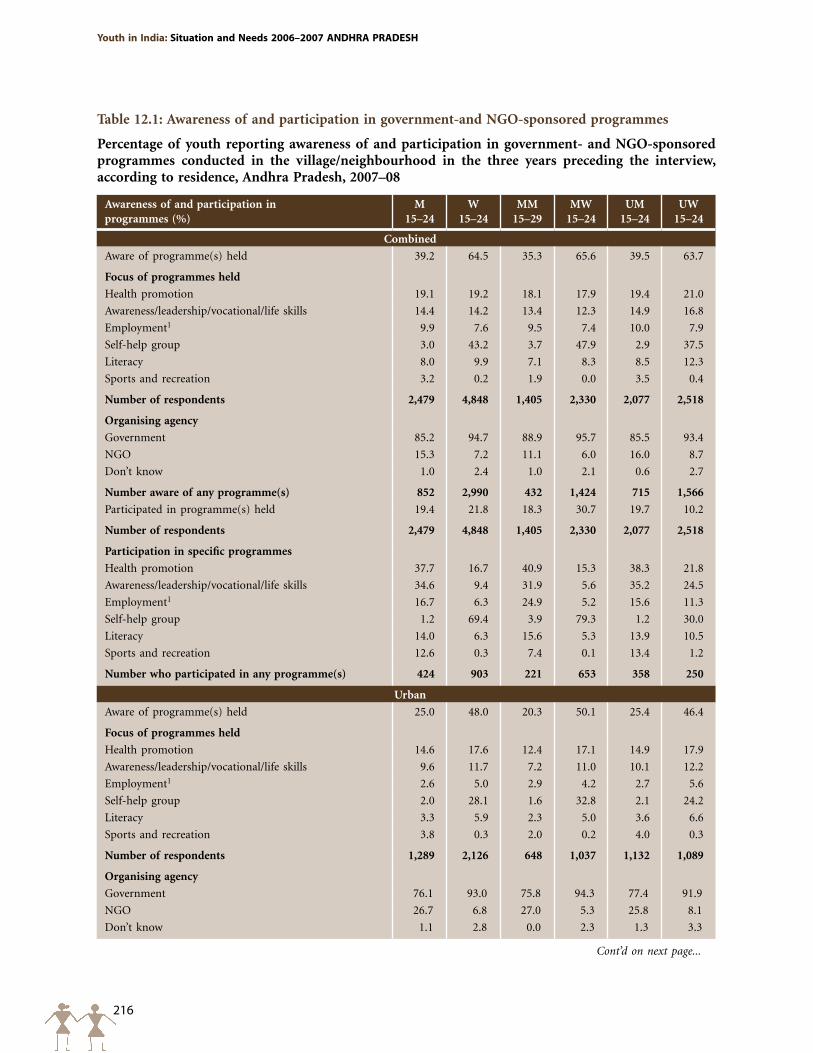
216
Youth in India: Situation and Needs 2006–2007 ANDHRA pRADESH
Table 12.1: Awareness of and participation in government-and NGO-sponsored programmes
Percentage of youth reporting awareness of and participation in government- and NGO-sponsored programmes conducted in the village/neighbourhood in the three years preceding the interview, according to residence, Andhra Pradesh, 2007–08
Awareness of and participation in programmes (%)
M 15–24
W 15–24
MM 15–29
MW 15–24
UM 15–24
UW 15–24
Combined
Aware of programme(s) held 39.2 64.5 35.3 65.6 39.5 63.7
Focus of programmes held
Health promotion 19.1 19.2 18.1 17.9 19.4 21.0
Awareness/leadership/vocational/life skills 14.4 14.2 13.4 12.3 14.9 16.8
Employment1 9.9 7.6 9.5 7.4 10.0 7.9
Self-help group 3.0 43.2 3.7 47.9 2.9 37.5
Literacy 8.0 9.9 7.1 8.3 8.5 12.3
Sports and recreation 3.2 0.2 1.9 0.0 3.5 0.4
Number of respondents 2,479 4,848 1,405 2,330 2,077 2,518
Organising agency
Government 85.2 94.7 88.9 95.7 85.5 93.4
NGO 15.3 7.2 11.1 6.0 16.0 8.7
Don’t know 1.0 2.4 1.0 2.1 0.6 2.7
Number aware of any programme(s) 852 2,990 432 1,424 715 1,566
Participated in programme(s) held 19.4 21.8 18.3 30.7 19.7 10.2
Number of respondents 2,479 4,848 1,405 2,330 2,077 2,518
Participation in specific programmes
Health promotion 37.7 16.7 40.9 15.3 38.3 21.8
Awareness/leadership/vocational/life skills 34.6 9.4 31.9 5.6 35.2 24.5
Employment1 16.7 6.3 24.9 5.2 15.6 11.3
Self-help group 1.2 69.4 3.9 79.3 1.2 30.0
Literacy 14.0 6.3 15.6 5.3 13.9 10.5
Sports and recreation 12.6 0.3 7.4 0.1 13.4 1.2
Number who participated in any programme(s) 424 903 221 653 358 250
Urban
Aware of programme(s) held 25.0 48.0 20.3 50.1 25.4 46.4
Focus of programmes held
Health promotion 14.6 17.6 12.4 17.1 14.9 17.9
Awareness/leadership/vocational/life skills 9.6 11.7 7.2 11.0 10.1 12.2
Employment1 2.6 5.0 2.9 4.2 2.7 5.6
Self-help group 2.0 28.1 1.6 32.8 2.1 24.2
Literacy 3.3 5.9 2.3 5.0 3.6 6.6
Sports and recreation 3.8 0.3 2.0 0.2 4.0 0.3
Number of respondents 1,289 2,126 648 1,037 1,132 1,089
Organising agency
Government 76.1 93.0 75.8 94.3 77.4 91.9
NGO 26.7 6.8 27.0 5.3 25.8 8.1
Don’t know 1.1 2.8 0.0 2.3 1.3 3.3
Cont’d on next page...
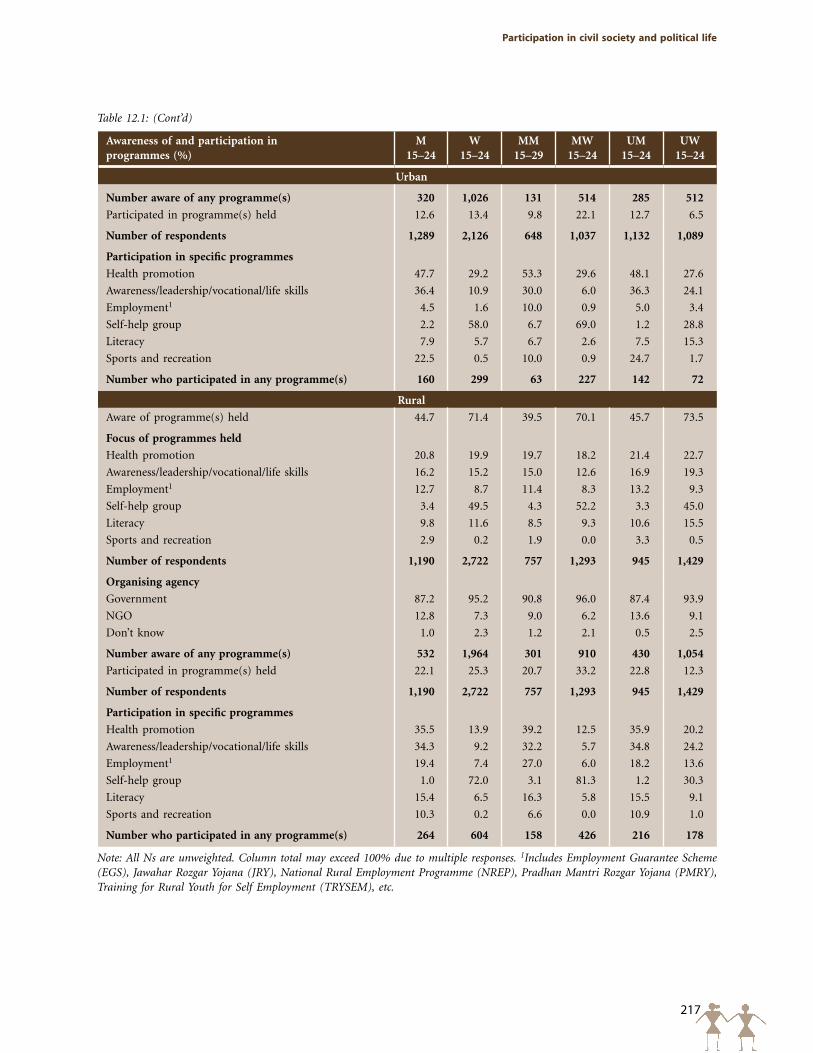
217
participation in civil society and political life
Awareness of and participation in programmes (%)
M 15–24
W 15–24
MM 15–29
MW 15–24
UM 15–24
UW 15–24
Urban
Number aware of any programme(s) 320 1,026 131 514 285 512
Participated in programme(s) held 12.6 13.4 9.8 22.1 12.7 6.5
Number of respondents 1,289 2,126 648 1,037 1,132 1,089
Participation in specific programmes
Health promotion 47.7 29.2 53.3 29.6 48.1 27.6
Awareness/leadership/vocational/life skills 36.4 10.9 30.0 6.0 36.3 24.1
Employment1 4.5 1.6 10.0 0.9 5.0 3.4
Self-help group 2.2 58.0 6.7 69.0 1.2 28.8
Literacy 7.9 5.7 6.7 2.6 7.5 15.3
Sports and recreation 22.5 0.5 10.0 0.9 24.7 1.7
Number who participated in any programme(s) 160 299 63 227 142 72
Rural
Aware of programme(s) held 44.7 71.4 39.5 70.1 45.7 73.5
Focus of programmes held
Health promotion 20.8 19.9 19.7 18.2 21.4 22.7
Awareness/leadership/vocational/life skills 16.2 15.2 15.0 12.6 16.9 19.3
Employment1 12.7 8.7 11.4 8.3 13.2 9.3
Self-help group 3.4 49.5 4.3 52.2 3.3 45.0
Literacy 9.8 11.6 8.5 9.3 10.6 15.5
Sports and recreation 2.9 0.2 1.9 0.0 3.3 0.5
Number of respondents 1,190 2,722 757 1,293 945 1,429
Organising agency
Government 87.2 95.2 90.8 96.0 87.4 93.9
NGO 12.8 7.3 9.0 6.2 13.6 9.1
Don’t know 1.0 2.3 1.2 2.1 0.5 2.5
Number aware of any programme(s) 532 1,964 301 910 430 1,054
Participated in programme(s) held 22.1 25.3 20.7 33.2 22.8 12.3
Number of respondents 1,190 2,722 757 1,293 945 1,429
Participation in specific programmes
Health promotion 35.5 13.9 39.2 12.5 35.9 20.2
Awareness/leadership/vocational/life skills 34.3 9.2 32.2 5.7 34.8 24.2
Employment1 19.4 7.4 27.0 6.0 18.2 13.6
Self-help group 1.0 72.0 3.1 81.3 1.2 30.3
Literacy 15.4 6.5 16.3 5.8 15.5 9.1
Sports and recreation 10.3 0.2 6.6 0.0 10.9 1.0
Number who participated in any programme(s) 264 604 158 426 216 178
Note: All Ns are unweighted. Column total may exceed 100% due to multiple responses. 1Includes Employment Guarantee Scheme (EGS), Jawahar Rozgar Yojana (JRY), National Rural Employment Programme (NREP), Pradhan Mantri Rozgar Yojana (PMRY), Training for Rural Youth for Self Employment (TRYSEM), etc.
Table 12.1: (Cont’d)
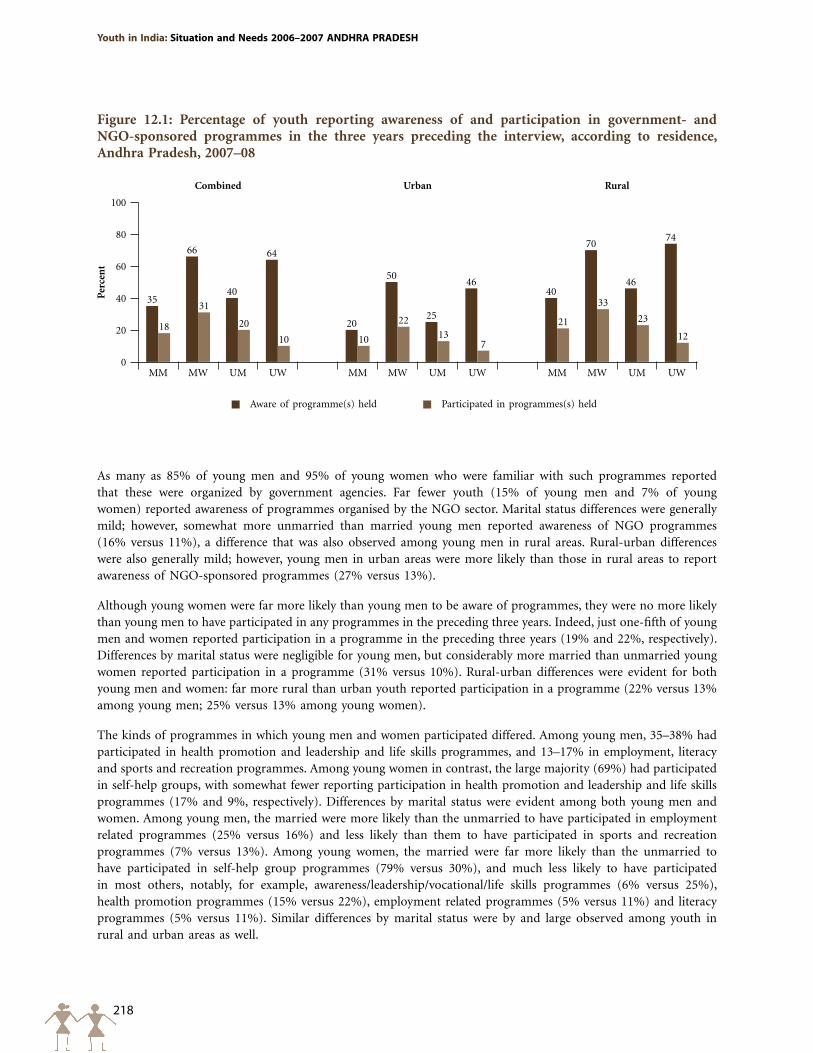
218
Youth in India: Situation and Needs 2006–2007 ANDHRA pRADESH
Figure 12.1: Percentage of youth reporting awareness of and participation in government- and NGO-sponsored programmes in the three years preceding the interview, according to residence, Andhra Pradesh, 2007–08
Per
cen
t
100
80
60
40
20
0
35
20
40
66
50
70
40
25
46
64
46
74
1810
21
31
22
33
2013
23
10 712
MM MM MMMW MW MWUM UM UMUW UW UW
Combined Urban Rural
Aware of programme(s) held Participated in programmes(s) held
As many as 85% of young men and 95% of young women who were familiar with such programmes reported that these were organized by government agencies. Far fewer youth (15% of young men and 7% of young women) reported awareness of programmes organised by the NGO sector. Marital status differences were generally mild; however, somewhat more unmarried than married young men reported awareness of NGO programmes (16% versus 11%), a difference that was also observed among young men in rural areas. Rural-urban differences were also generally mild; however, young men in urban areas were more likely than those in rural areas to report awareness of NGO-sponsored programmes (27% versus 13%).
Although young women were far more likely than young men to be aware of programmes, they were no more likely than young men to have participated in any programmes in the preceding three years. Indeed, just one-fifth of young men and women reported participation in a programme in the preceding three years (19% and 22%, respectively). Differences by marital status were negligible for young men, but considerably more married than unmarried young women reported participation in a programme (31% versus 10%). Rural-urban differences were evident for both young men and women: far more rural than urban youth reported participation in a programme (22% versus 13% among young men; 25% versus 13% among young women).
The kinds of programmes in which young men and women participated differed. Among young men, 35–38% had participated in health promotion and leadership and life skills programmes, and 13–17% in employment, literacy and sports and recreation programmes. Among young women in contrast, the large majority (69%) had participated in self-help groups, with somewhat fewer reporting participation in health promotion and leadership and life skills programmes (17% and 9%, respectively). Differences by marital status were evident among both young men and women. Among young men, the married were more likely than the unmarried to have participated in employment related programmes (25% versus 16%) and less likely than them to have participated in sports and recreation programmes (7% versus 13%). Among young women, the married were far more likely than the unmarried to have participated in self-help group programmes (79% versus 30%), and much less likely to have participated in most others, notably, for example, awareness/leadership/vocational/life skills programmes (6% versus 25%), health promotion programmes (15% versus 22%), employment related programmes (5% versus 11%) and literacy programmes (5% versus 11%). Similar differences by marital status were by and large observed among youth in rural and urban areas as well.
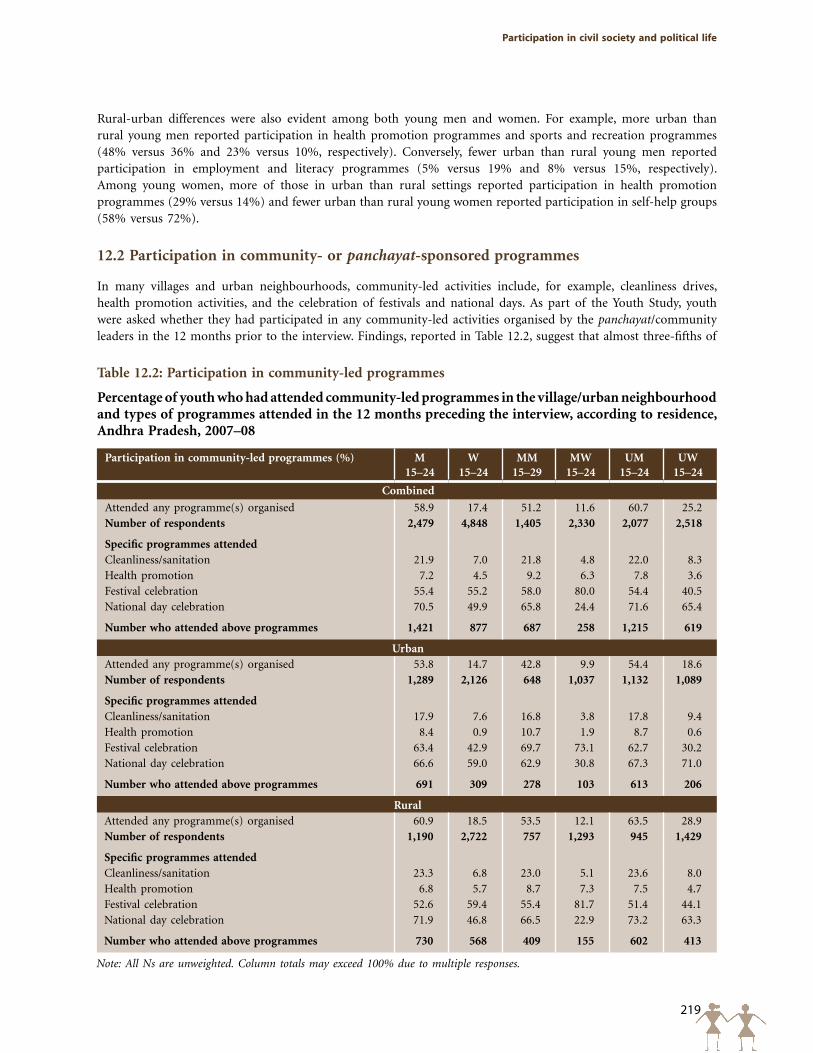
219
participation in civil society and political life
Table 12.2: Participation in community-led programmes
Percentage of youth who had attended community-led programmes in the village/urban neighbourhood and types of programmes attended in the 12 months preceding the interview, according to residence, Andhra Pradesh, 2007–08
Participation in community-led programmes (%) M 15–24
W 15–24
MM 15–29
MW 15–24
UM 15–24
UW 15–24
Combined
Attended any programme(s) organised 58.9 17.4 51.2 11.6 60.7 25.2Number of respondents 2,479 4,848 1,405 2,330 2,077 2,518
Specific programmes attended Cleanliness/sanitation 21.9 7.0 21.8 4.8 22.0 8.3Health promotion 7.2 4.5 9.2 6.3 7.8 3.6Festival celebration 55.4 55.2 58.0 80.0 54.4 40.5National day celebration 70.5 49.9 65.8 24.4 71.6 65.4
Number who attended above programmes 1,421 877 687 258 1,215 619
UrbanAttended any programme(s) organised 53.8 14.7 42.8 9.9 54.4 18.6Number of respondents 1,289 2,126 648 1,037 1,132 1,089
Specific programmes attended Cleanliness/sanitation 17.9 7.6 16.8 3.8 17.8 9.4Health promotion 8.4 0.9 10.7 1.9 8.7 0.6Festival celebration 63.4 42.9 69.7 73.1 62.7 30.2National day celebration 66.6 59.0 62.9 30.8 67.3 71.0
Number who attended above programmes 691 309 278 103 613 206
RuralAttended any programme(s) organised 60.9 18.5 53.5 12.1 63.5 28.9Number of respondents 1,190 2,722 757 1,293 945 1,429
Specific programmes attended Cleanliness/sanitation 23.3 6.8 23.0 5.1 23.6 8.0Health promotion 6.8 5.7 8.7 7.3 7.5 4.7Festival celebration 52.6 59.4 55.4 81.7 51.4 44.1National day celebration 71.9 46.8 66.5 22.9 73.2 63.3
Number who attended above programmes 730 568 409 155 602 413
Note: All Ns are unweighted. Column totals may exceed 100% due to multiple responses.
Rural-urban differences were also evident among both young men and women. For example, more urban than rural young men reported participation in health promotion programmes and sports and recreation programmes (48% versus 36% and 23% versus 10%, respectively). Conversely, fewer urban than rural young men reported participation in employment and literacy programmes (5% versus 19% and 8% versus 15%, respectively). Among young women, more of those in urban than rural settings reported participation in health promotion programmes (29% versus 14%) and fewer urban than rural young women reported participation in self-help groups (58% versus 72%).
12.2 Participation in community- or panchayat-sponsored programmes
In many villages and urban neighbourhoods, community-led activities include, for example, cleanliness drives, health promotion activities, and the celebration of festivals and national days. As part of the Youth Study, youth were asked whether they had participated in any community-led activities organised by the panchayat/community leaders in the 12 months prior to the interview. Findings, reported in Table 12.2, suggest that almost three-fifths of
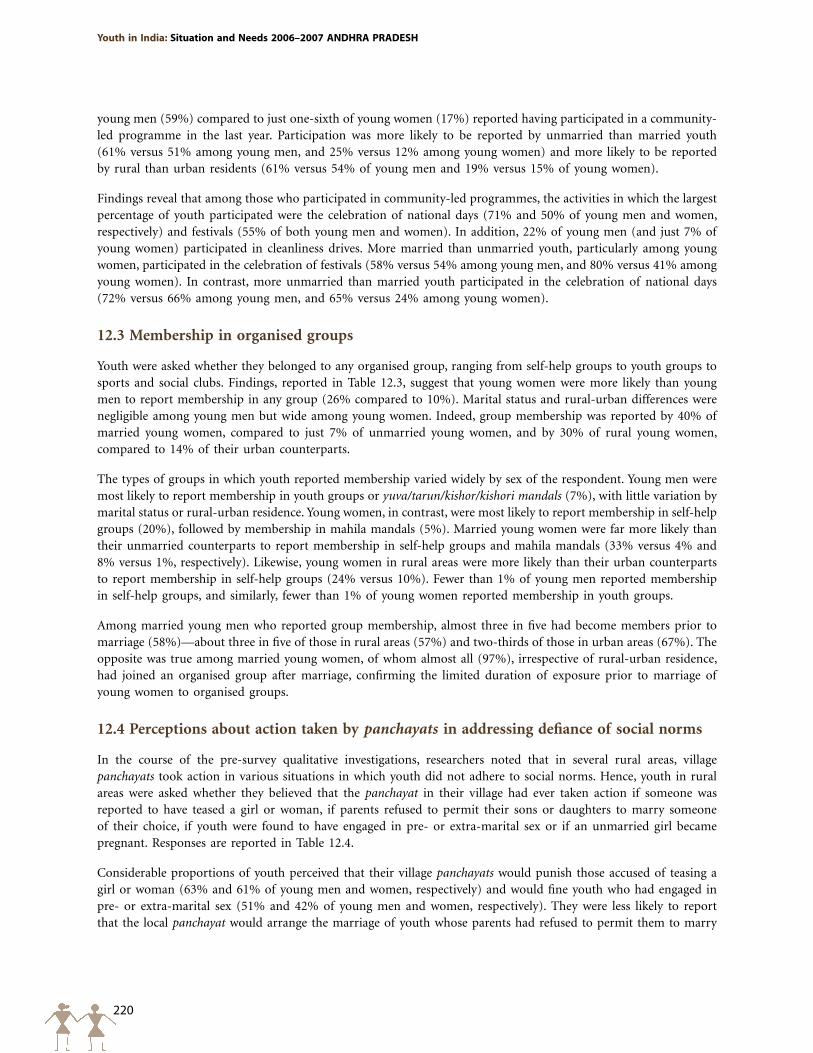
220
Youth in India: Situation and Needs 2006–2007 ANDHRA pRADESH
young men (59%) compared to just one-sixth of young women (17%) reported having participated in a community-led programme in the last year. Participation was more likely to be reported by unmarried than married youth (61% versus 51% among young men, and 25% versus 12% among young women) and more likely to be reported by rural than urban residents (61% versus 54% of young men and 19% versus 15% of young women).
Findings reveal that among those who participated in community-led programmes, the activities in which the largest percentage of youth participated were the celebration of national days (71% and 50% of young men and women, respectively) and festivals (55% of both young men and women). In addition, 22% of young men (and just 7% of young women) participated in cleanliness drives. More married than unmarried youth, particularly among young women, participated in the celebration of festivals (58% versus 54% among young men, and 80% versus 41% among young women). In contrast, more unmarried than married youth participated in the celebration of national days (72% versus 66% among young men, and 65% versus 24% among young women).
12.3 Membership in organised groups
Youth were asked whether they belonged to any organised group, ranging from self-help groups to youth groups to sports and social clubs. Findings, reported in Table 12.3, suggest that young women were more likely than young men to report membership in any group (26% compared to 10%). Marital status and rural-urban differences were negligible among young men but wide among young women. Indeed, group membership was reported by 40% of married young women, compared to just 7% of unmarried young women, and by 30% of rural young women, compared to 14% of their urban counterparts.
The types of groups in which youth reported membership varied widely by sex of the respondent. Young men were most likely to report membership in youth groups or yuva/tarun/kishor/kishori mandals (7%), with little variation by marital status or rural-urban residence. Young women, in contrast, were most likely to report membership in self-help groups (20%), followed by membership in mahila mandals (5%). Married young women were far more likely than their unmarried counterparts to report membership in self-help groups and mahila mandals (33% versus 4% and 8% versus 1%, respectively). Likewise, young women in rural areas were more likely than their urban counterparts to report membership in self-help groups (24% versus 10%). Fewer than 1% of young men reported membership in self-help groups, and similarly, fewer than 1% of young women reported membership in youth groups.
Among married young men who reported group membership, almost three in five had become members prior to marriage (58%)—about three in five of those in rural areas (57%) and two-thirds of those in urban areas (67%). The opposite was true among married young women, of whom almost all (97%), irrespective of rural-urban residence, had joined an organised group after marriage, confirming the limited duration of exposure prior to marriage of young women to organised groups.
12.4 Perceptions about action taken by panchayats in addressing defiance of social norms
In the course of the pre-survey qualitative investigations, researchers noted that in several rural areas, village panchayats took action in various situations in which youth did not adhere to social norms. Hence, youth in rural areas were asked whether they believed that the panchayat in their village had ever taken action if someone was reported to have teased a girl or woman, if parents refused to permit their sons or daughters to marry someone of their choice, if youth were found to have engaged in pre- or extra-marital sex or if an unmarried girl became pregnant. Responses are reported in Table 12.4.
Considerable proportions of youth perceived that their village panchayats would punish those accused of teasing a girl or woman (63% and 61% of young men and women, respectively) and would fine youth who had engaged in pre- or extra-marital sex (51% and 42% of young men and women, respectively). They were less likely to report that the local panchayat would arrange the marriage of youth whose parents had refused to permit them to marry
221
participation in civil society and political life
Table 12.3: Membership in organised groups
Percentage of youth reporting membership in organised groups, according to residence, Andhra Pradesh, 2007–08
Membership in organised groups (%) M 15–24
W 15–24
MM 15–29
MW 15–24
UM 15–24
UW 15–24
Combined
Member of an organised group 9.6 25.5 10.2 40.0 10.3 6.5Self-help group 0.3 20.2 1.3 32.6 0.3 4.0Mahila mandal NA 4.7 NA 7.6 NA 1.0Social or sports club 2.6 0.5 1.4 0.1 2.9 1.0Youth group/yuva/tarun/kishor/kishori mandal 6.7 0.4 7.6 0.2 7.0 0.6Number of respondents 2,479 4,848 1,405 2,330 2,077 2,518
Became member of an organised group1
Before marriage NA NA 58.3 2.7 NA NAAfter marriage NA NA 41.7 97.2 NA NA
Number reporting membership in an organised group NA NA 137 840 NA NA
Urban
Member of an organised group 8.6 13.9 7.2 26.7 9.5 3.7Self-help group 0.0 10.3 0.7 21.0 0.0 1.7Mahila mandal NA 3.1 NA 6.1 NA 0.6Social or sports club 2.3 0.6 2.0 0.0 2.5 1.0Youth group/yuva/tarun/kishor/kishori mandal 6.4 0.3 4.9 0.0 7.0 0.6Number of respondents 1,289 2,126 648 1,037 1,132 1,089
Became member of an organised group1
Before marriage NA NA (66.7) 5.8 NA NAAfter marriage NA NA (33.3) 94.2 NA NA
Number reporting membership in an organised group NA NA 45 272 NA NA
Rural
Member of an organised group 10.0 30.3 11.2 44.0 10.6 8.0Self-help group 0.4 24.3 1.5 36.0 0.4 5.3Mahila mandal NA 5.4 NA 8.0 NA 1.2Social or sports club 2.7 0.5 1.3 0.1 3.1 1.1Youth group/yuva/tarun/kishor/kishori mandal 6.9 0.4 8.4 0.3 7.1 0.6Number of respondents 1,190 2,722 757 1,293 945 1,429
Became member of an organised group1
Before marriage NA NA 57.0 2.1 NA NAAfter marriage NA NA 43.0 97.7 NA NA
Number reporting membership in an organised group NA NA 92 568 NA NA
Note: All Ns are unweighted. ( ) Based on 25–49 unweighted cases. NA: Not applicable. 1Column total may not equal 100% due to missing cases.
someone of their choice (39% and 34%, respectively) or that the panchayat would force a boy to marry a girl whom he had made pregnant (35% and 30% of young men and women, respectively). In most cases, young men were more likely than young women to perceive panchayat involvement. Differences by marital status were negligible, except that more married than unmarried young men perceived that the panchayat would force a boy to marry a girl whom he had made pregnant (39% versus 32%).
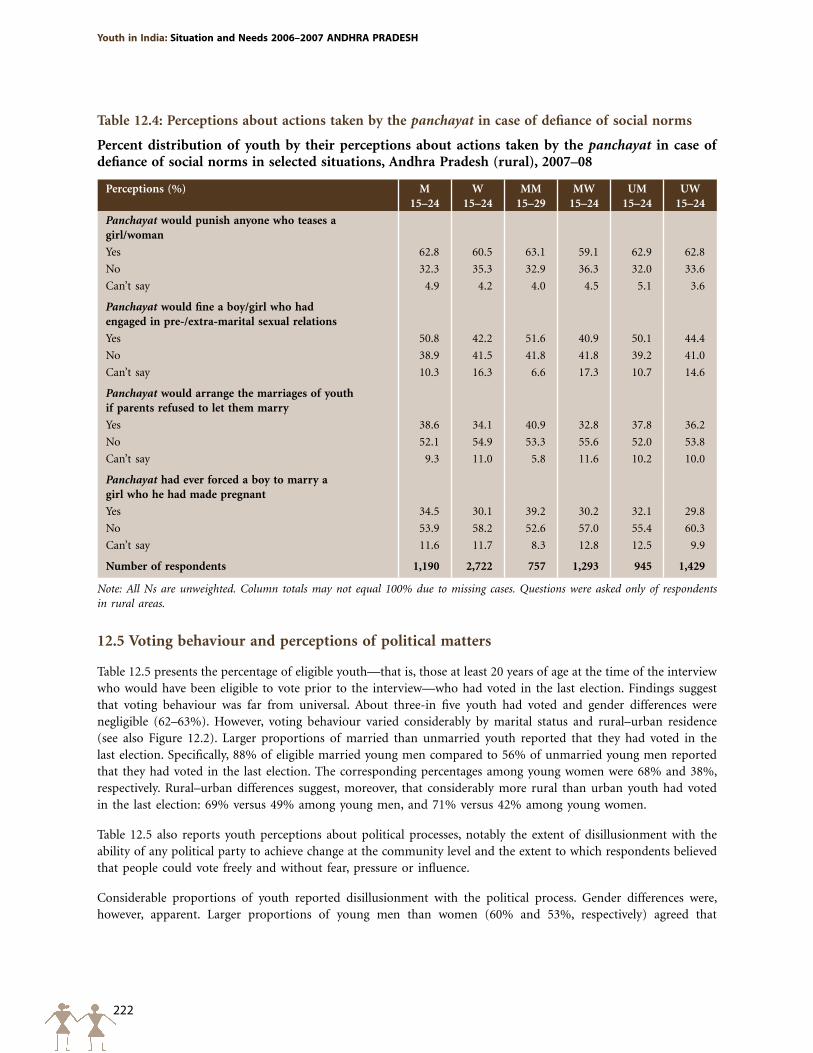
222
Youth in India: Situation and Needs 2006–2007 ANDHRA pRADESH
Table 12.4: Perceptions about actions taken by the panchayat in case of defiance of social norms
Percent distribution of youth by their perceptions about actions taken by the panchayat in case of defiance of social norms in selected situations, Andhra Pradesh (rural), 2007–08
Perceptions (%) M 15–24
W 15–24
MM 15–29
MW 15–24
UM 15–24
UW 15–24
Panchayat would punish anyone who teases a girl/woman
Yes 62.8 60.5 63.1 59.1 62.9 62.8
No 32.3 35.3 32.9 36.3 32.0 33.6
Can’t say 4.9 4.2 4.0 4.5 5.1 3.6
Panchayat would fine a boy/girl who had engaged in pre-/extra-marital sexual relations
Yes 50.8 42.2 51.6 40.9 50.1 44.4
No 38.9 41.5 41.8 41.8 39.2 41.0
Can’t say 10.3 16.3 6.6 17.3 10.7 14.6
Panchayat would arrange the marriages of youth if parents refused to let them marry
Yes 38.6 34.1 40.9 32.8 37.8 36.2
No 52.1 54.9 53.3 55.6 52.0 53.8
Can’t say 9.3 11.0 5.8 11.6 10.2 10.0
Panchayat had ever forced a boy to marry a girl who he had made pregnant
Yes 34.5 30.1 39.2 30.2 32.1 29.8
No 53.9 58.2 52.6 57.0 55.4 60.3
Can’t say 11.6 11.7 8.3 12.8 12.5 9.9
Number of respondents 1,190 2,722 757 1,293 945 1,429
Note: All Ns are unweighted. Column totals may not equal 100% due to missing cases. Questions were asked only of respondents in rural areas.
12.5 Voting behaviour and perceptions of political matters
Table 12.5 presents the percentage of eligible youth—that is, those at least 20 years of age at the time of the interview who would have been eligible to vote prior to the interview—who had voted in the last election. Findings suggest that voting behaviour was far from universal. About three-in five youth had voted and gender differences were negligible (62–63%). However, voting behaviour varied considerably by marital status and rural–urban residence (see also Figure 12.2). Larger proportions of married than unmarried youth reported that they had voted in the last election. Specifically, 88% of eligible married young men compared to 56% of unmarried young men reported that they had voted in the last election. The corresponding percentages among young women were 68% and 38%, respectively. Rural–urban differences suggest, moreover, that considerably more rural than urban youth had voted in the last election: 69% versus 49% among young men, and 71% versus 42% among young women.
Table 12.5 also reports youth perceptions about political processes, notably the extent of disillusionment with the ability of any political party to achieve change at the community level and the extent to which respondents believed that people could vote freely and without fear, pressure or influence.
Considerable proportions of youth reported disillusionment with the political process. Gender differences were, however, apparent. Larger proportions of young men than women (60% and 53%, respectively) agreed that
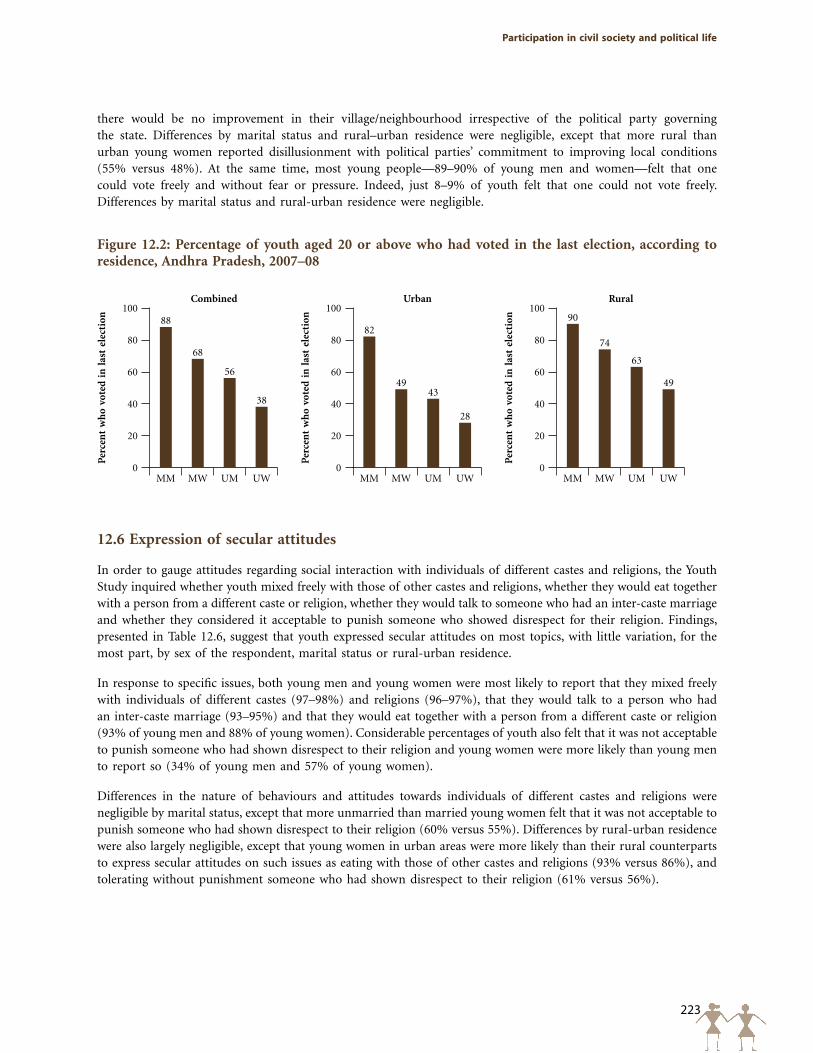
223
participation in civil society and political life
Figure 12.2: Percentage of youth aged 20 or above who had voted in the last election, according to residence, Andhra Pradesh, 2007–08
Per
cen
t w
ho
vote
d i
n l
ast
elec
tion
100
80
60
40
20
0
88
68
56
38
MM MW UM UW
CombinedP
erce
nt
wh
o vo
ted
in
las
t el
ecti
on100
80
60
40
20
0
82
4943
28
MM MW UM UW
Urban
Per
cen
t w
ho
vote
d i
n l
ast
elec
tion
100
80
60
40
20
0
90
74
63
49
MM MW UM UW
Rural
there would be no improvement in their village/neighbourhood irrespective of the political party governing the state. Differences by marital status and rural–urban residence were negligible, except that more rural than urban young women reported disillusionment with political parties’ commitment to improving local conditions (55% versus 48%). At the same time, most young people—89–90% of young men and women—felt that one could vote freely and without fear or pressure. Indeed, just 8–9% of youth felt that one could not vote freely. Differences by marital status and rural-urban residence were negligible.
12.6 Expression of secular attitudes
In order to gauge attitudes regarding social interaction with individuals of different castes and religions, the Youth Study inquired whether youth mixed freely with those of other castes and religions, whether they would eat together with a person from a different caste or religion, whether they would talk to someone who had an inter-caste marriage and whether they considered it acceptable to punish someone who showed disrespect for their religion. Findings, presented in Table 12.6, suggest that youth expressed secular attitudes on most topics, with little variation, for the most part, by sex of the respondent, marital status or rural-urban residence.
In response to specific issues, both young men and young women were most likely to report that they mixed freely with individuals of different castes (97–98%) and religions (96–97%), that they would talk to a person who had an inter-caste marriage (93–95%) and that they would eat together with a person from a different caste or religion (93% of young men and 88% of young women). Considerable percentages of youth also felt that it was not acceptable to punish someone who had shown disrespect to their religion and young women were more likely than young men to report so (34% of young men and 57% of young women).
Differences in the nature of behaviours and attitudes towards individuals of different castes and religions were negligible by marital status, except that more unmarried than married young women felt that it was not acceptable to punish someone who had shown disrespect to their religion (60% versus 55%). Differences by rural-urban residence were also largely negligible, except that young women in urban areas were more likely than their rural counterparts to express secular attitudes on such issues as eating with those of other castes and religions (93% versus 86%), and tolerating without punishment someone who had shown disrespect to their religion (61% versus 56%).
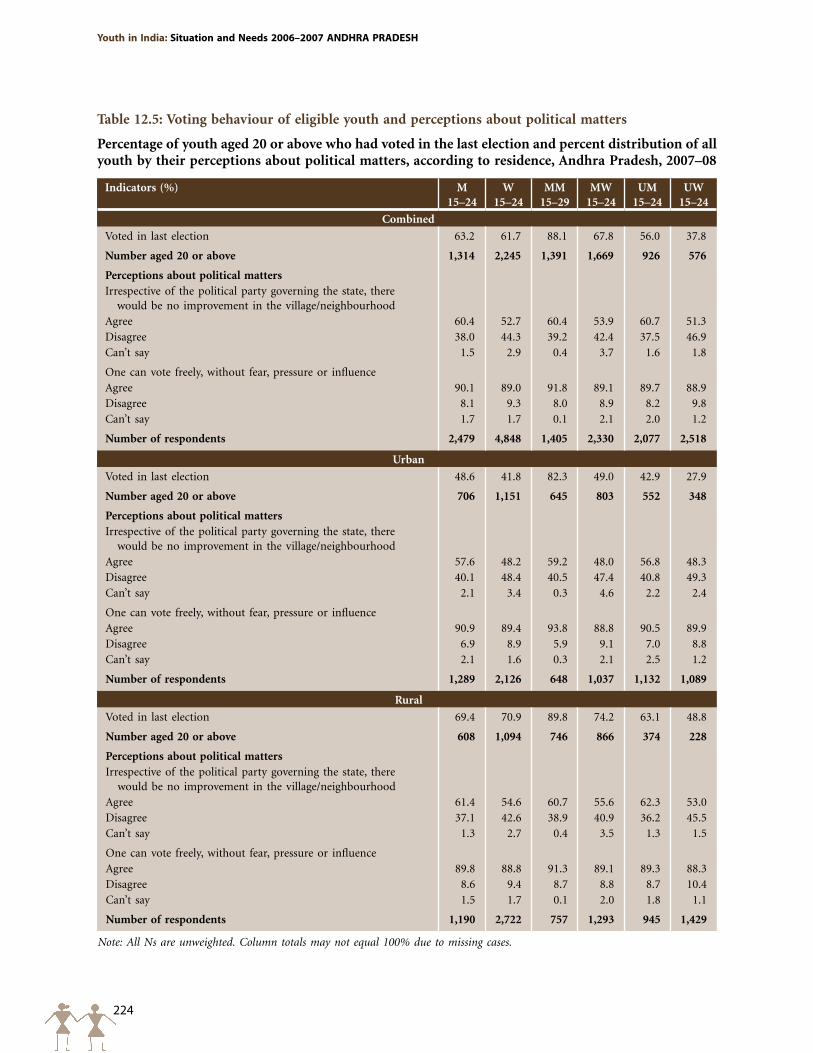
224
Youth in India: Situation and Needs 2006–2007 ANDHRA pRADESH
Table 12.5: Voting behaviour of eligible youth and perceptions about political matters
Percentage of youth aged 20 or above who had voted in the last election and percent distribution of all youth by their perceptions about political matters, according to residence, Andhra Pradesh, 2007–08
Indicators (%) M 15–24
W 15–24
MM 15–29
MW 15–24
UM 15–24
UW 15–24
Combined
Voted in last election 63.2 61.7 88.1 67.8 56.0 37.8
Number aged 20 or above 1,314 2,245 1,391 1,669 926 576
Perceptions about political mattersIrrespective of the political party governing the state, there
would be no improvement in the village/neighbourhood Agree 60.4 52.7 60.4 53.9 60.7 51.3Disagree 38.0 44.3 39.2 42.4 37.5 46.9Can’t say 1.5 2.9 0.4 3.7 1.6 1.8
One can vote freely, without fear, pressure or influence Agree 90.1 89.0 91.8 89.1 89.7 88.9Disagree 8.1 9.3 8.0 8.9 8.2 9.8Can’t say 1.7 1.7 0.1 2.1 2.0 1.2
Number of respondents 2,479 4,848 1,405 2,330 2,077 2,518
Urban
Voted in last election 48.6 41.8 82.3 49.0 42.9 27.9
Number aged 20 or above 706 1,151 645 803 552 348
Perceptions about political mattersIrrespective of the political party governing the state, there
would be no improvement in the village/neighbourhoodAgree 57.6 48.2 59.2 48.0 56.8 48.3Disagree 40.1 48.4 40.5 47.4 40.8 49.3Can’t say 2.1 3.4 0.3 4.6 2.2 2.4
One can vote freely, without fear, pressure or influence Agree 90.9 89.4 93.8 88.8 90.5 89.9Disagree 6.9 8.9 5.9 9.1 7.0 8.8Can’t say 2.1 1.6 0.3 2.1 2.5 1.2
Number of respondents 1,289 2,126 648 1,037 1,132 1,089
Rural
Voted in last election 69.4 70.9 89.8 74.2 63.1 48.8
Number aged 20 or above 608 1,094 746 866 374 228
Perceptions about political mattersIrrespective of the political party governing the state, there
would be no improvement in the village/neighbourhoodAgree 61.4 54.6 60.7 55.6 62.3 53.0Disagree 37.1 42.6 38.9 40.9 36.2 45.5Can’t say 1.3 2.7 0.4 3.5 1.3 1.5
One can vote freely, without fear, pressure or influence Agree 89.8 88.8 91.3 89.1 89.3 88.3Disagree 8.6 9.4 8.7 8.8 8.7 10.4Can’t say 1.5 1.7 0.1 2.0 1.8 1.1
Number of respondents 1,190 2,722 757 1,293 945 1,429
Note: All Ns are unweighted. Column totals may not equal 100% due to missing cases.
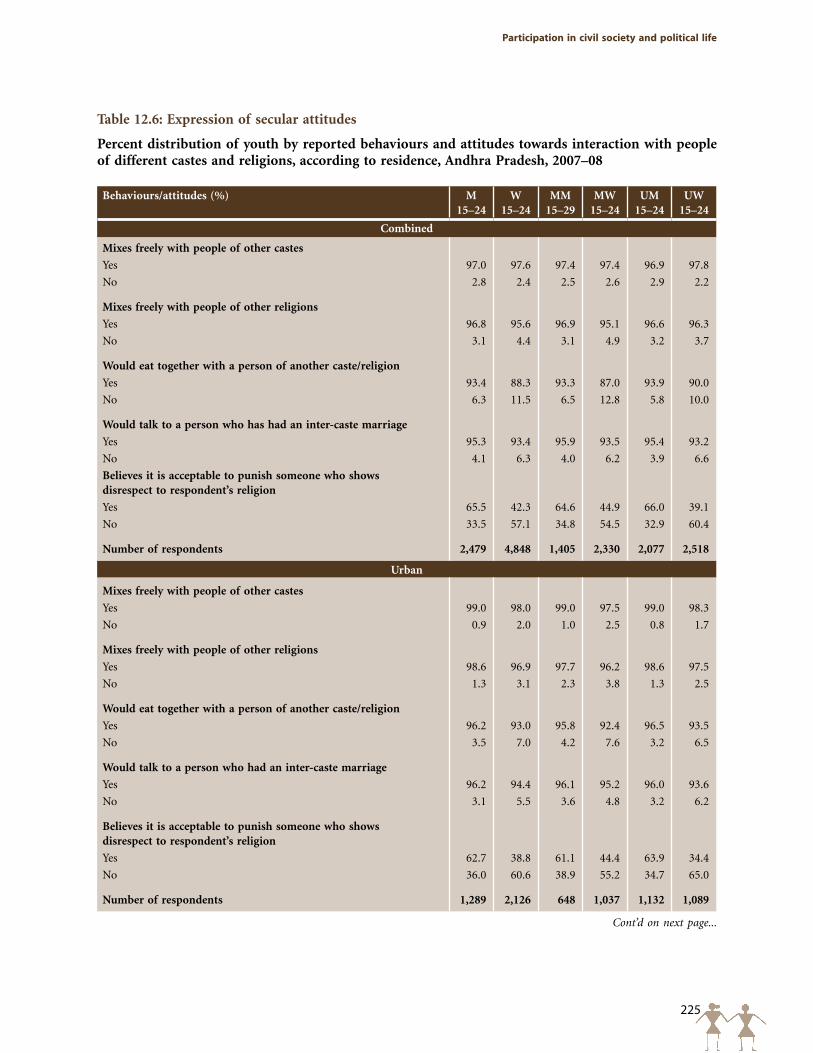
225
participation in civil society and political life
Table 12.6: Expression of secular attitudes
Percent distribution of youth by reported behaviours and attitudes towards interaction with people of different castes and religions, according to residence, Andhra Pradesh, 2007–08
Behaviours/attitudes (%) M 15–24
W 15–24
MM 15–29
MW 15–24
UM 15–24
UW 15–24
Combined
Mixes freely with people of other castes
Yes 97.0 97.6 97.4 97.4 96.9 97.8
No 2.8 2.4 2.5 2.6 2.9 2.2
Mixes freely with people of other religions
Yes 96.8 95.6 96.9 95.1 96.6 96.3
No 3.1 4.4 3.1 4.9 3.2 3.7
Would eat together with a person of another caste/religion
Yes 93.4 88.3 93.3 87.0 93.9 90.0
No 6.3 11.5 6.5 12.8 5.8 10.0
Would talk to a person who has had an inter-caste marriage
Yes 95.3 93.4 95.9 93.5 95.4 93.2
No 4.1 6.3 4.0 6.2 3.9 6.6
Believes it is acceptable to punish someone who shows disrespect to respondent’s religion
Yes 65.5 42.3 64.6 44.9 66.0 39.1
No 33.5 57.1 34.8 54.5 32.9 60.4
Number of respondents 2,479 4,848 1,405 2,330 2,077 2,518
Urban
Mixes freely with people of other castes
Yes 99.0 98.0 99.0 97.5 99.0 98.3
No 0.9 2.0 1.0 2.5 0.8 1.7
Mixes freely with people of other religions
Yes 98.6 96.9 97.7 96.2 98.6 97.5
No 1.3 3.1 2.3 3.8 1.3 2.5
Would eat together with a person of another caste/religion
Yes 96.2 93.0 95.8 92.4 96.5 93.5
No 3.5 7.0 4.2 7.6 3.2 6.5
Would talk to a person who had an inter-caste marriage
Yes 96.2 94.4 96.1 95.2 96.0 93.6
No 3.1 5.5 3.6 4.8 3.2 6.2
Believes it is acceptable to punish someone who shows disrespect to respondent’s religion
Yes 62.7 38.8 61.1 44.4 63.9 34.4
No 36.0 60.6 38.9 55.2 34.7 65.0
Number of respondents 1,289 2,126 648 1,037 1,132 1,089
Cont’d on next page...
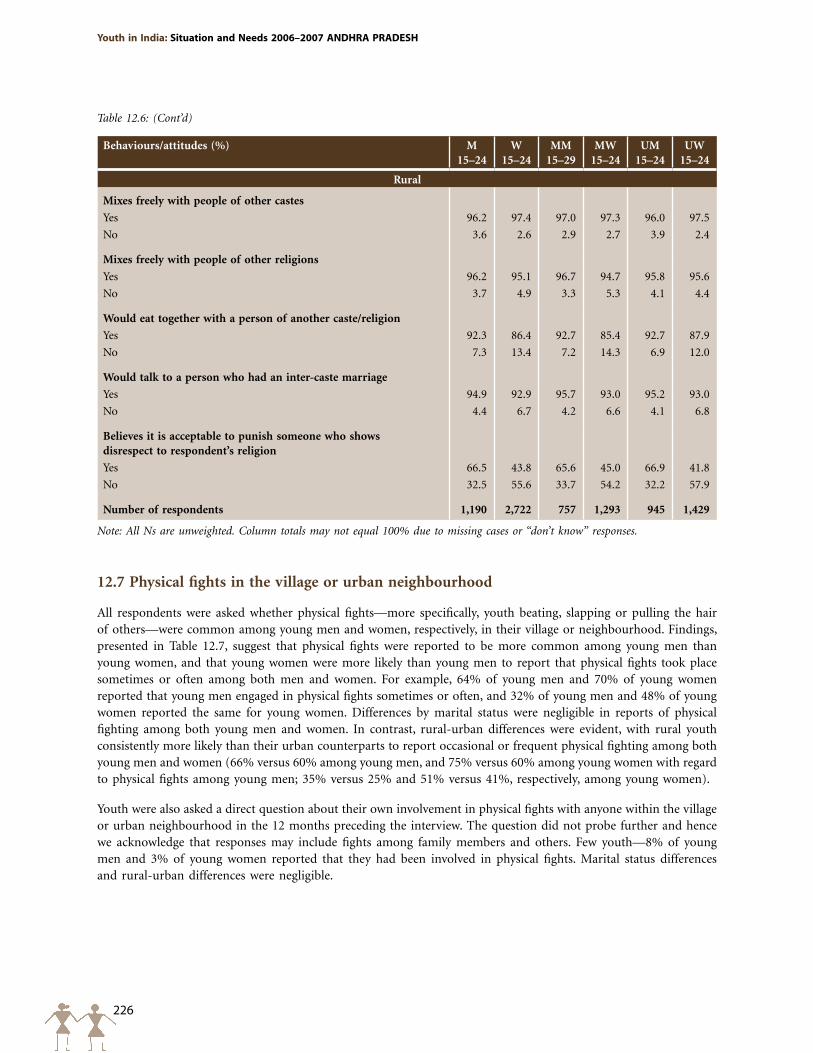
226
Youth in India: Situation and Needs 2006–2007 ANDHRA pRADESH
Behaviours/attitudes (%) M 15–24
W 15–24
MM 15–29
MW 15–24
UM 15–24
UW 15–24
Rural
Mixes freely with people of other castes
Yes 96.2 97.4 97.0 97.3 96.0 97.5
No 3.6 2.6 2.9 2.7 3.9 2.4
Mixes freely with people of other religions
Yes 96.2 95.1 96.7 94.7 95.8 95.6
No 3.7 4.9 3.3 5.3 4.1 4.4
Would eat together with a person of another caste/religion
Yes 92.3 86.4 92.7 85.4 92.7 87.9
No 7.3 13.4 7.2 14.3 6.9 12.0
Would talk to a person who had an inter-caste marriage
Yes 94.9 92.9 95.7 93.0 95.2 93.0
No 4.4 6.7 4.2 6.6 4.1 6.8
Believes it is acceptable to punish someone who shows disrespect to respondent’s religion
Yes 66.5 43.8 65.6 45.0 66.9 41.8
No 32.5 55.6 33.7 54.2 32.2 57.9
Number of respondents 1,190 2,722 757 1,293 945 1,429
Note: All Ns are unweighted. Column totals may not equal 100% due to missing cases or “don’t know” responses.
Table 12.6: (Cont’d)
12.7 Physical fights in the village or urban neighbourhood
All respondents were asked whether physical fights—more specifically, youth beating, slapping or pulling the hair of others—were common among young men and women, respectively, in their village or neighbourhood. Findings, presented in Table 12.7, suggest that physical fights were reported to be more common among young men than young women, and that young women were more likely than young men to report that physical fights took place sometimes or often among both men and women. For example, 64% of young men and 70% of young women reported that young men engaged in physical fights sometimes or often, and 32% of young men and 48% of young women reported the same for young women. Differences by marital status were negligible in reports of physical fighting among both young men and women. In contrast, rural-urban differences were evident, with rural youth consistently more likely than their urban counterparts to report occasional or frequent physical fighting among both young men and women (66% versus 60% among young men, and 75% versus 60% among young women with regard to physical fights among young men; 35% versus 25% and 51% versus 41%, respectively, among young women).
Youth were also asked a direct question about their own involvement in physical fights with anyone within the village or urban neighbourhood in the 12 months preceding the interview. The question did not probe further and hence we acknowledge that responses may include fights among family members and others. Few youth—8% of young men and 3% of young women reported that they had been involved in physical fights. Marital status differences and rural-urban differences were negligible.
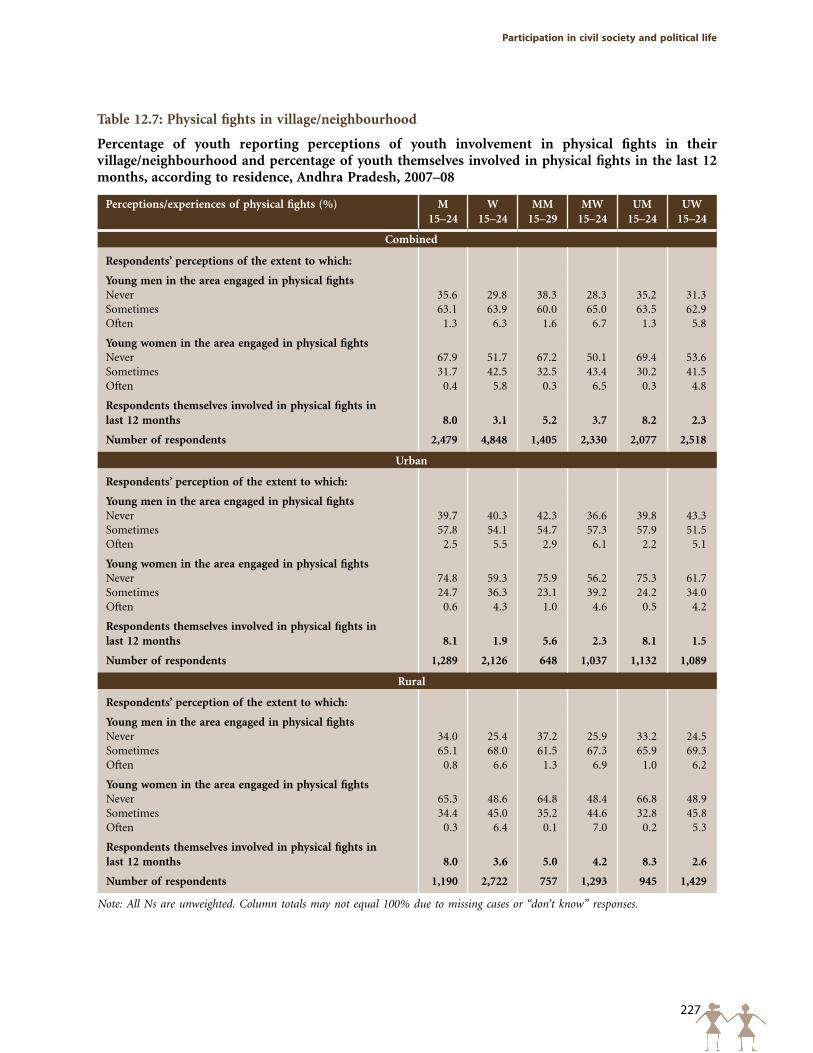
227
participation in civil society and political life
Table 12.7: Physical fights in village/neighbourhood
Percentage of youth reporting perceptions of youth involvement in physical fights in their village/neighbourhood and percentage of youth themselves involved in physical fights in the last 12 months, according to residence, Andhra Pradesh, 2007–08
Perceptions/experiences of physical fights (%) M 15–24
W 15–24
MM 15–29
MW 15–24
UM 15–24
UW 15–24
Combined
Respondents’ perceptions of the extent to which:
Young men in the area engaged in physical fightsNever 35.6 29.8 38.3 28.3 35.2 31.3Sometimes 63.1 63.9 60.0 65.0 63.5 62.9Often 1.3 6.3 1.6 6.7 1.3 5.8
Young women in the area engaged in physical fightsNever 67.9 51.7 67.2 50.1 69.4 53.6Sometimes 31.7 42.5 32.5 43.4 30.2 41.5Often 0.4 5.8 0.3 6.5 0.3 4.8
Respondents themselves involved in physical fights in last 12 months 8.0 3.1 5.2 3.7 8.2 2.3
Number of respondents 2,479 4,848 1,405 2,330 2,077 2,518
Urban
Respondents’ perception of the extent to which:
Young men in the area engaged in physical fightsNever 39.7 40.3 42.3 36.6 39.8 43.3Sometimes 57.8 54.1 54.7 57.3 57.9 51.5Often 2.5 5.5 2.9 6.1 2.2 5.1
Young women in the area engaged in physical fightsNever 74.8 59.3 75.9 56.2 75.3 61.7Sometimes 24.7 36.3 23.1 39.2 24.2 34.0Often 0.6 4.3 1.0 4.6 0.5 4.2
Respondents themselves involved in physical fights in last 12 months 8.1 1.9 5.6 2.3 8.1 1.5
Number of respondents 1,289 2,126 648 1,037 1,132 1,089
Rural
Respondents’ perception of the extent to which:
Young men in the area engaged in physical fightsNever 34.0 25.4 37.2 25.9 33.2 24.5Sometimes 65.1 68.0 61.5 67.3 65.9 69.3Often 0.8 6.6 1.3 6.9 1.0 6.2
Young women in the area engaged in physical fightsNever 65.3 48.6 64.8 48.4 66.8 48.9Sometimes 34.4 45.0 35.2 44.6 32.8 45.8Often 0.3 6.4 0.1 7.0 0.2 5.3
Respondents themselves involved in physical fights in last 12 months 8.0 3.6 5.0 4.2 8.3 2.6
Number of respondents 1,190 2,722 757 1,293 945 1,429
Note: All Ns are unweighted. Column totals may not equal 100% due to missing cases or “don’t know” responses.
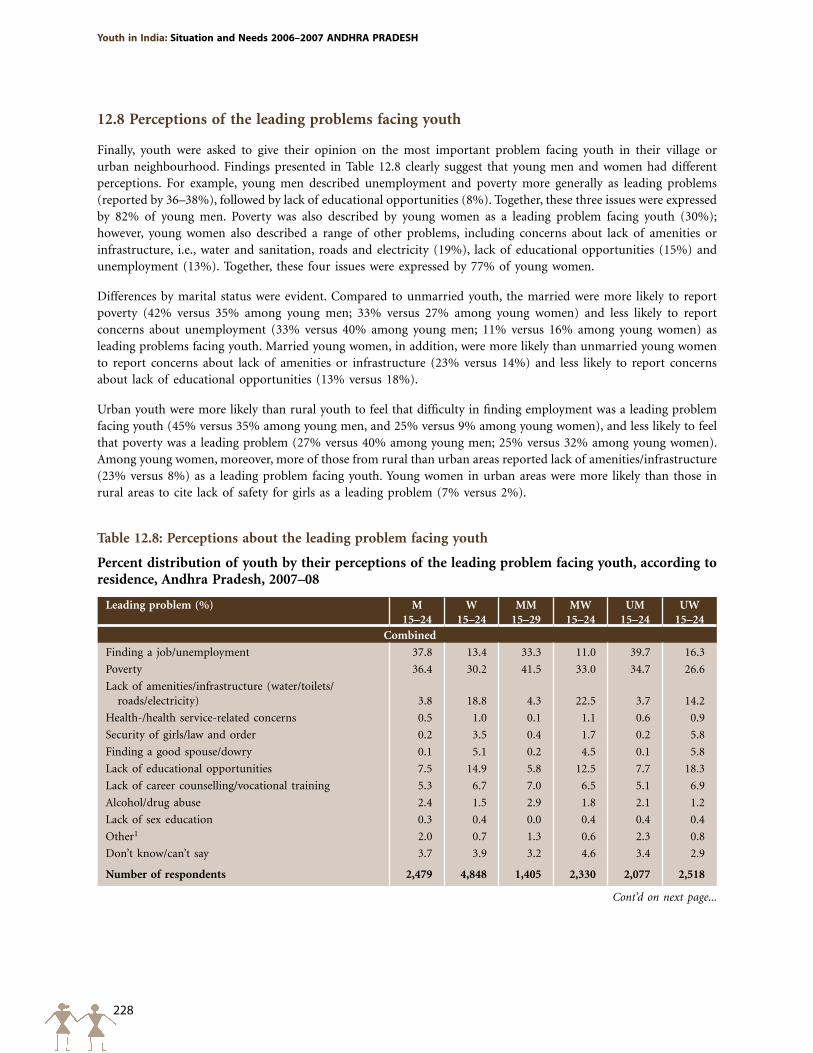
228
Youth in India: Situation and Needs 2006–2007 ANDHRA pRADESH
Table 12.8: Perceptions about the leading problem facing youth
Percent distribution of youth by their perceptions of the leading problem facing youth, according to residence, Andhra Pradesh, 2007–08
Leading problem (%) M 15–24
W 15–24
MM 15–29
MW 15–24
UM 15–24
UW 15–24
Combined
Finding a job/unemployment 37.8 13.4 33.3 11.0 39.7 16.3
Poverty 36.4 30.2 41.5 33.0 34.7 26.6
Lack of amenities/infrastructure (water/toilets/ roads/electricity) 3.8 18.8 4.3 22.5 3.7 14.2
Health-/health service-related concerns 0.5 1.0 0.1 1.1 0.6 0.9
Security of girls/law and order 0.2 3.5 0.4 1.7 0.2 5.8
Finding a good spouse/dowry 0.1 5.1 0.2 4.5 0.1 5.8
Lack of educational opportunities 7.5 14.9 5.8 12.5 7.7 18.3
Lack of career counselling/vocational training 5.3 6.7 7.0 6.5 5.1 6.9
Alcohol/drug abuse 2.4 1.5 2.9 1.8 2.1 1.2
Lack of sex education 0.3 0.4 0.0 0.4 0.4 0.4
Other1 2.0 0.7 1.3 0.6 2.3 0.8
Don’t know/can’t say 3.7 3.9 3.2 4.6 3.4 2.9
Number of respondents 2,479 4,848 1,405 2,330 2,077 2,518
12.8 Perceptions of the leading problems facing youth
Finally, youth were asked to give their opinion on the most important problem facing youth in their village or urban neighbourhood. Findings presented in Table 12.8 clearly suggest that young men and women had different perceptions. For example, young men described unemployment and poverty more generally as leading problems (reported by 36–38%), followed by lack of educational opportunities (8%). Together, these three issues were expressed by 82% of young men. Poverty was also described by young women as a leading problem facing youth (30%); however, young women also described a range of other problems, including concerns about lack of amenities or infrastructure, i.e., water and sanitation, roads and electricity (19%), lack of educational opportunities (15%) and unemployment (13%). Together, these four issues were expressed by 77% of young women.
Differences by marital status were evident. Compared to unmarried youth, the married were more likely to report poverty (42% versus 35% among young men; 33% versus 27% among young women) and less likely to report concerns about unemployment (33% versus 40% among young men; 11% versus 16% among young women) as leading problems facing youth. Married young women, in addition, were more likely than unmarried young women to report concerns about lack of amenities or infrastructure (23% versus 14%) and less likely to report concerns about lack of educational opportunities (13% versus 18%).
Urban youth were more likely than rural youth to feel that difficulty in finding employment was a leading problem facing youth (45% versus 35% among young men, and 25% versus 9% among young women), and less likely to feel that poverty was a leading problem (27% versus 40% among young men; 25% versus 32% among young women). Among young women, moreover, more of those from rural than urban areas reported lack of amenities/infrastructure (23% versus 8%) as a leading problem facing youth. Young women in urban areas were more likely than those in rural areas to cite lack of safety for girls as a leading problem (7% versus 2%).
Cont’d on next page...
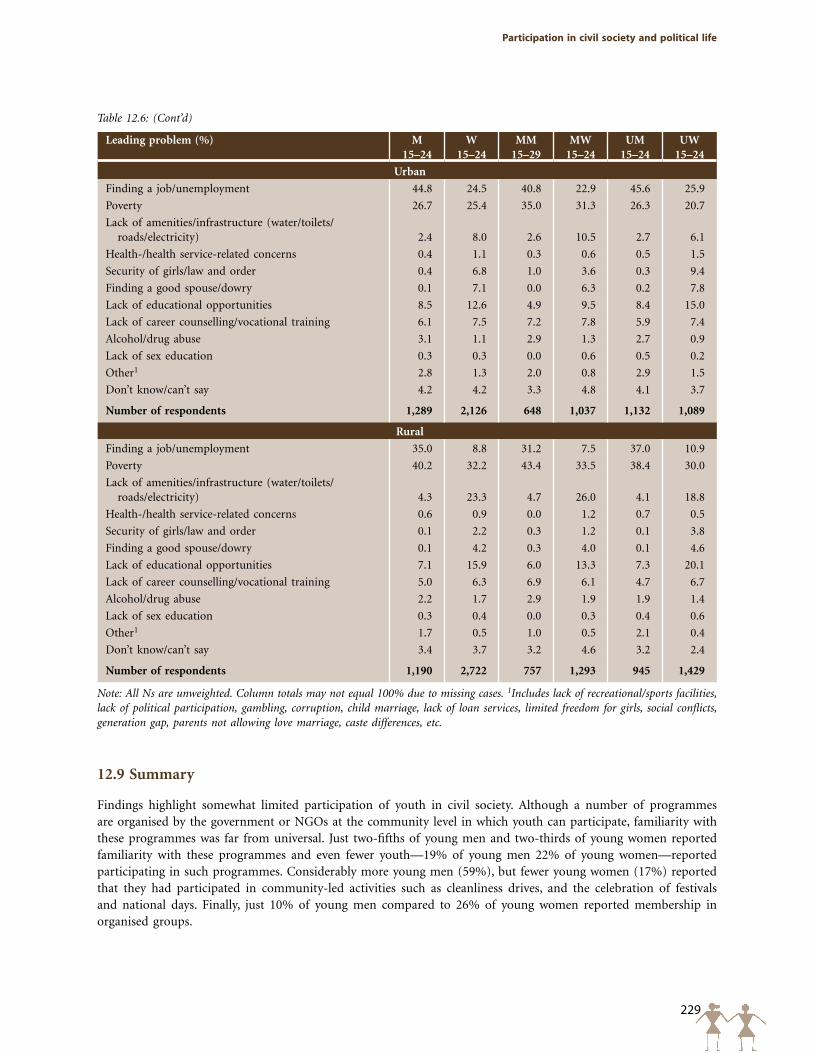
229
participation in civil society and political life
Leading problem (%) M 15–24
W 15–24
MM 15–29
MW 15–24
UM 15–24
UW 15–24
Urban
Finding a job/unemployment 44.8 24.5 40.8 22.9 45.6 25.9
Poverty 26.7 25.4 35.0 31.3 26.3 20.7
Lack of amenities/infrastructure (water/toilets/ roads/electricity) 2.4 8.0 2.6 10.5 2.7 6.1
Health-/health service-related concerns 0.4 1.1 0.3 0.6 0.5 1.5
Security of girls/law and order 0.4 6.8 1.0 3.6 0.3 9.4
Finding a good spouse/dowry 0.1 7.1 0.0 6.3 0.2 7.8
Lack of educational opportunities 8.5 12.6 4.9 9.5 8.4 15.0
Lack of career counselling/vocational training 6.1 7.5 7.2 7.8 5.9 7.4
Alcohol/drug abuse 3.1 1.1 2.9 1.3 2.7 0.9
Lack of sex education 0.3 0.3 0.0 0.6 0.5 0.2
Other1 2.8 1.3 2.0 0.8 2.9 1.5
Don’t know/can’t say 4.2 4.2 3.3 4.8 4.1 3.7
Number of respondents 1,289 2,126 648 1,037 1,132 1,089
Rural
Finding a job/unemployment 35.0 8.8 31.2 7.5 37.0 10.9
Poverty 40.2 32.2 43.4 33.5 38.4 30.0
Lack of amenities/infrastructure (water/toilets/ roads/electricity) 4.3 23.3 4.7 26.0 4.1 18.8
Health-/health service-related concerns 0.6 0.9 0.0 1.2 0.7 0.5
Security of girls/law and order 0.1 2.2 0.3 1.2 0.1 3.8
Finding a good spouse/dowry 0.1 4.2 0.3 4.0 0.1 4.6
Lack of educational opportunities 7.1 15.9 6.0 13.3 7.3 20.1
Lack of career counselling/vocational training 5.0 6.3 6.9 6.1 4.7 6.7
Alcohol/drug abuse 2.2 1.7 2.9 1.9 1.9 1.4
Lack of sex education 0.3 0.4 0.0 0.3 0.4 0.6
Other1 1.7 0.5 1.0 0.5 2.1 0.4
Don’t know/can’t say 3.4 3.7 3.2 4.6 3.2 2.4
Number of respondents 1,190 2,722 757 1,293 945 1,429
Note: All Ns are unweighted. Column totals may not equal 100% due to missing cases. 1Includes lack of recreational/sports facilities, lack of political participation, gambling, corruption, child marriage, lack of loan services, limited freedom for girls, social conflicts, generation gap, parents not allowing love marriage, caste differences, etc.
Table 12.6: (Cont’d)
12.9 Summary
Findings highlight somewhat limited participation of youth in civil society. Although a number of programmes are organised by the government or NGOs at the community level in which youth can participate, familiarity with these programmes was far from universal. Just two-fifths of young men and two-thirds of young women reported familiarity with these programmes and even fewer youth—19% of young men 22% of young women—reported participating in such programmes. Considerably more young men (59%), but fewer young women (17%) reported that they had participated in community-led activities such as cleanliness drives, and the celebration of festivals and national days. Finally, just 10% of young men compared to 26% of young women reported membership in organised groups.
230
Youth in India: Situation and Needs 2006–2007 ANDHRA pRADESH
Findings suggest that voting behaviour was far from universal. Among those eligible to vote, 62–63% of young men and women had cast their vote in the most recent election. Also of note is that while most youth (89–90%) perceived that one could vote freely and without fear and pressure, as many as 60% of young men and 53% of young women reported disillusionment with the commitment of political parties to work for change at the community level.
By and large, youth reported secular attitudes; 88–98% reported that they mixed freely and would eat together with individuals of different religions and castes, and that they would talk to a person who has had an inter-caste marriage. However, only one-third of young men and three-fifths of young women agreed that it was best to tolerate rather than punish someone who had shown disrespect to their religion.
Considerable proportions of young men and women acknowledged that physical fights among young men and also among young women did occur in their villages or urban neighbourhoods. However, few youth—8% of young men and 3% of young women—reported that they had been involved in a physical fight in the year preceding the interview.
Youth reported a number of leading problems facing youth and gender differences were evident. Among young men, the majority reported difficulty in finding employment and concerns about poverty more generally as leading problems. In contrast, leading problems expressed by young women were poverty and to a lesser extent, lack of amenities and infrastructure, lack of opportunities for education and difficulty in finding employment.
231
Looking forward
Findings of the Youth Study presented in earlier chapters highlight the situation of young men and women in Andhra Pradesh. They underscore the fact that youth are a heterogeneous group with correspondingly diverse needs, and identify numerous challenges youth face in making the transition to adulthood. Findings suggest several priority programmatic areas for action as well as several themes requiring research attention, which are highlighted in this chapter.
13.1 Recommendations for programmes
Findings suggest a number of key programme areas for intervention at the youth, family and service delivery levels.
Address obstacles to universal school enrolment and secondary school completion
Youth Study findings highlight that school enrolment was far from universal among young people in the state: indeed, one in twelve young men and one in five young women had never been enrolled in school. School completion rates were also relatively low, particularly among young women; just 52% of young men and 36% of young women had completed high school. The state government has articulated its commitment to improving schooling situation in the state, and what is required now, particularly if the state is to achieve the Millennium Development Goal of ensuring universal primary school completion, are actions to implement these commitments. While the achievement of universal primary school completion is a key goal, the importance of high school education in enabling youth to make a successful transition to adulthood underscores the need, at the same time, for efforts to overcome barriers to high school completion. The gender divide and rural-urban divide observed in school enrolment and completion call, moreover, for efforts that target female children and children in rural areas.
A number of factors have been identified in the Youth Study that inhibit school completion; leading among these were economic reasons; attitudes and perceptions; and, among young women, school-related reasons. Multiple activities are needed to address these barriers. Efforts must be made, for example, to address the economic pressures that dissuade parents from enrolling their children in school and from keeping them in school once enrolled. While a number of state government programmes are ongoing that aim to reduce the cost of education, additional inputs by way of conditional grants that encourage school completion among disadvantaged groups also need to be considered. Moreover, there is a need to ensure that ongoing government programmes do indeed reach the most disadvantaged groups. At the same time, activities are needed that raise awareness among parents about the importance of a secondary school education in expanding their children’s livelihood opportunities.
Activities must also address school-level barriers, notably, poor infrastructure, quality of education and academic failure, particularly among young women. There is a need to incorporate livelihoods skills building models within the school setting that will not only raise young people’s aspirations regarding their education and careers but also provide them opportunities to gain market-driven job skills. There is also a need to focus on providing better training and ensuring accountability for teachers—investments that are likely to improve the quality of the schooling experience for youth.
Chapter 13
Looking forward
232
Youth in India: Situation and Needs 2006–2007 ANDHRA pRADESH
Findings suggesting that married young men and women remain considerably disadvantaged call for interventions that give the married a second chance to continue their education. Likewise, evidence that rural youth, particularly young women, were more disadvantaged with regard to educational opportunities than their urban counterparts calls for efforts to provide those out of school an opportunity to complete their schooling.
Strengthen efforts to prevent child labour
Findings of the Youth Study that almost two in five young men and women had initiated work in childhood or in early adolescence (before age 15) reiterate the recommendation highlighted above regarding the need to provide conditional grants and targeted subsidies to disadvantaged groups, which would encourage parents to opt for schooling over work for their children. At the same time, it is important to vigorously enforce existing laws that prohibit child labour.
Enable opportunities for employment
Although unemployment rates were relatively low (7–10%) among youth, findings that unemployment rates were particularly high among the educated suggest a possible disconnect between youth skills and market needs. Indeed, few youth were aware of employment generation programmes and even fewer had availed of these or vocational skills training. It is notable that while considerable proportions of urban youth reported exposure to computer skills, English language skills and so on, rural youth tended to opt for relatively traditional vocational skills and may not have had the opportunity to learn about market needs or develop appropriate skills for which a demand exists. Formal mechanisms need to be developed that enable youth—and particularly rural youth—to acquire skills for which there is an established market demand, and that link eligible youth to market opportunities.
Build upon youth’s growing access to the internet
Findings suggesting that one quarter of young men and one in ten young women with five or more years of education—and considerably more in urban areas—had accessed the internet, highlight the role that this medium can play in building youth awareness of the world around them and the opportunities available to them. The development of youth-friendly web-sites in Telugu may be a useful way to convey such information to youth.
Promote agency and gender equitable norms among youth
Findings highlight the limited agency of young women and the persistence of gender double standards among youth. Young women were particularly disadvantaged in terms of school completion, mobility, opportunities to build peer networks, decision-making authority in matters relating to their own lives and control over resources. And although young women were more likely to express equitable gender role attitudes than young men, they were more likely than young men to express traditional attitudes concerning wife beating. These findings call for attention to promote life skills education programmes for young women, both unmarried and married, that will not only raise their awareness of new ideas and the world around them but also enable them to put information into practice, encourage them to question gender stereotypes, develop self-esteem and strengthen their skills in problem-solving, decision-making, communication and inter-personal relations and negotiation. Safe spaces should be identified in which young women can build social networks and find social support among peers.
Interventions intended to build life skills must also be inclusive of young men. Indeed, findings that inegalitarian gender role attitudes were expressed by many young men, on the one hand, and that considerable numbers of young men were not able to exercise agency in their everyday lives, on the other, call for programmes that build their life skills, promote new concepts of masculinity and femininity and at the same time, promote messages that build egalitarian relations between women and men.
233
Looking forward
Promoting gender equitable norms and practices requires active engagement with the community. It is essential that programmes for youth work with key community members, such as parents and political and religious leaders in the community, to critically examine prevailing gender norms and forces that perpetuate such norms.
An increasing number of intervention models to build agency and promote egalitarian gender role attitudes among young people have been tested in India. These models could be reviewed and replicated or scaled up as appropriate.
Provide opportunities for formal saving, especially for young women
Findings suggest that just one-quarter of young men and women had some savings and few youth owned a bank or post office account (just 19% of young men and 17% of young women). Despite the fact that young women were as likely as young men to report savings and to own a savings account, they were considerably less likely to operate the account independently. Programmes are needed that inculcate a savings orientation among young people, that offer savings products that are attractive and appropriate to the small and erratic savings patterns of young people and that enable young women in particular to overcome obstacles related to owning and controlling savings products.
Promote youth participation in civil society and political processes and reinforce secular attitudes
Findings have noted that large proportions of youth have exercised their right to vote, that the majority hold secular attitudes with regard to mixing with a person from another caste and religion, and few engage in community-level violence. Nevertheless, not all youth expressed secular attitudes—two thirds of young men and about two-fifths of young women reported that they would endorse violence against someone who showed disrespect to their religion. Moreover, relatively few had taken part in civil society, that is, government- or NGO-sponsored programmes or community-led activities. Programmes are needed—at the school, college and community levels, through national service programmes, sports and other non-formal mechanisms—that encourage civic participation, incorporate value building components and reinforce secular attitudes and values that espouse responsible citizenship.
Strengthen family life or sex education for those in school and out of school
Youth Study findings provide considerable evidence suggesting that family life or sex education is urgently needed among youth, both for those in school and those who have discontinued their education. Findings demonstrate a limited understanding of sexual and reproductive matters among young people, including the married. Misconceptions abound on most topics: sex and pregnancy, contraceptive methods including condoms, STIs and HIV/AIDS and the conditions under which abortion is legally available or restricted. Where awareness exists, it is superficial in many cases.
Youth themselves have called for family life or sex education. Findings highlight that large proportions of youth recognised the need for information and education on these issues, and indicated a preference for receiving this education from teachers, health care providers or other experts; many youth also indicated a preference for receiving this education from friends, and large proportions of young women, from parents. However, no more than one in three youth had been exposed to family life or sex education, notwithstanding the School AIDS Education Programme, the Red Ribbon Clubs and special programmes for out-of-school youth. Indeed, substantial proportions of married young women (and some young men) reported entering marriage completely unaware of what marriage entailed. At the same time, several young people had engaged in sexual risk taking.
As mentioned above, a number of state government programmes are ongoing that aim to impart sexual and reproductive health information to young people. What is needed is a strong commitment to ensuring that these programmes do indeed reach young people, both those in school and out-of-school, married and unmarried, and rural and urban. Moreover, there is a need to expand the contents of existing awareness raising programmes to include not just HIV-related information but broader sexual and reproductive topics. These programmes should
234
Youth in India: Situation and Needs 2006–2007 ANDHRA pRADESH
be designed not only to raise awareness among youth but also to enable young people to correctly understand and assess the risks they face and to adopt appropriate protective actions.
In addition, special attention needs to be paid to the training of trainers. It is important that teachers, health care providers and other experts undergo training that enables them to overcome their reluctance to communicate with youth on sensitive sexual and reproductive matters, dispels their misconceptions on these matters, and enhances their technical knowledge of these issues. Peers and, in the case of young women, parents have also been identified as acceptable sources of information and efforts must therefore be made that identify youth leaders and build networks of peer educators. Also needed are efforts to engage parents—providing them with accurate information and working with them to overcome inhibitions about imparting this information to their children, particularly their daughters.
Ensure that the transition to sexual life is safe and wanted
While for the vast majority of young women sexual activity is initiated within the context of marriage, findings show that small proportions of young men and women had engaged in sex before marriage. As documented in this report, many youth had initiated sexual activities uninformed, reiterating the need for providing family life or sex education to young people. Moreover, the finding that for many youth, pre-marital sexual experiences were unsafe, and for some unwanted, calls for programmes that focus on building sexual and reproductive health awareness among young people, and developing their skills in negotiating safe sex and communicating with their partners on sexual and reproductive health matters. At the same time, programmes must make available appropriate family planning and infection prevention services for both married and unmarried young men and women in a manner acceptable to them.
Intensify efforts to eliminate the practice of early marriage
Findings indicate that although most youth prefer to marry after age 18, the practice of early marriage is widespread among young women. These findings call for measures that go beyond information campaigns to address the underlying factors—social norms and economic constraints—driving early marriage in the state.
There is a need for a multi-pronged approach to eliminate the practice of early marriage. Strategies are needed that mobilise communities to help parents resist pressures that foster the practice of early marriage; that establish new norms and practices; as well as that initiate campaigns highlighting the adverse consequences of early marriage and how it is a violation of the rights of the child. Community mobilisation efforts must involve youth themselves, their families, as well as influential persons in the community, including religious and political leaders.
Equally important is to ensure greater commitment on the part of law enforcement agencies to enforce existing laws on the minimum age at marriage and the registration of marriages, and to levy penalties on violators. Allowing anonymous reporting, making law enforcement agencies and others aware that the practice of early marriage is not a minor violation, and making the guidelines for penalties clear to enforcement agencies and the wider community are possible steps in this direction.
Efforts to delay marriage also require providing girls with viable alternatives to marriage in the form of accessible and quality schooling and opportunities to build and use livelihood skills. Working with the education sector to make schooling for girls more accessible, and to make classrooms gender-sensitive and responsive to the needs of girls and the concerns of their parents is important. At the same time, it is necessary to provide livelihoods training within and outside the educational system.
Findings that most marriages were arranged with the participation of young people themselves are encouraging. However, the finding that few young people had an opportunity to meet their spouse-to-be prior to the wedding day call for actions to sensitise parents of the need to enable their children to interact with their prospective spouse
235
Looking forward
prior to the wedding day. Parents must also be made aware of the physical and mental health consequences of early marriage and the adverse experiences of many young women (and some young men) who were married early or who were unprepared for marriage.
Support newly-weds to postpone the first pregnancy
Findings show that the social pressure to bear children as soon as possible following marriage persists. Contraceptives were rarely used to postpone the first pregnancy and many young women experienced their first pregnancy soon after marriage. It would appear that numerous forces work against delaying the first pregnancy—young people’s lack of awareness of appropriate methods of contraception and access to supplies, their limited skills in countering social expectations and negotiating pregnancy postponement, overwhelming pressure from the family and the community to bear children as soon as possible after marriage, and the lack of attention from health care providers.
Programmes are needed that inform youth about their pregnancy postponement options and enable them to access appropriate contraception. At the same time, providers must be trained and charged with the responsibility of reaching married young women and men—including those who have not yet experienced pregnancy—with information regarding contraception and other reproductive health matters as well as contraceptive supplies. Many married young women lack the freedom of movement to seek health care, underscoring the need for health workers to reach these women—particularly those newly married and first time pregnant—in their homes.
Address power imbalances within marriage
Findings confirm that within marriage, large proportions reported communication and interaction with their spouse; nevertheless communication on sensitive matters such as contraception was limited for many. In addition, married life was marked by violence for many; for example, notable proportions of young women had suffered physical and sexual violence perpetrated by their husband.
Efforts are needed to encourage couple communication on sensitive issues (contraception, for example), negotiation and conflict management skills early in marriage. Efforts are also needed to inform married young women of their rights so that they have the opportunity to exercise control over their own lives; at the same time, efforts must be made to promote new concepts of masculinity and femininity and egalitarian couple relations among young men and women. Intervention models exist in India that have attempted to address these needs; these should be reviewed and up-scaled as appropriate.
Create a supportive family environment
Findings highlight the limited interaction and social distance between parents and young people while growing up and the gendered nature of perceptions regarding parental controls on youth behaviours. Efforts must be made to create a supportive environment for young people. While evidence on models that are effective in bridging the distance between parents and children or that enable parents to adopt more gender-egalitarian socialisation practices is not currently available, findings presented in this report call for programmes that address parental inhibitions about discussing sexual matters with their children, encourage greater openness and interaction between parents and children, and enable the adoption of gender-egalitarian child-rearing practices. Programmes that aim to encourage universal education or eliminate child marriage must, likewise, address parental concerns about the potential consequences of keeping daughters in school or delaying their marriage.
Reorient service provision to address the unique needs of unmarried and married young women and men
Although the RCH Programme has advocated special services for youth, including the unmarried, these services had not reached the youth in our survey. For example, relatively small percentages of young people have ever practised contraception and the method most likely to be adopted was sterilisation. Few had sought care for symptoms of
236
Youth in India: Situation and Needs 2006–2007 ANDHRA pRADESH
STI or gynaecological problems, and most youth who had sought care for the latter preferred private to public sector facilities. Lack of care seeking and the disconnect between the public health sector and youth underscores the need to sensitise health care providers about the special needs, heterogeneity and vulnerability of unmarried and married young women and men, and to orient them to the need for developing appropriate strategies to reach these diverse groups, including young newlyweds. It raises, at the same time, the need to explore the feasibility of implementing various financing strategies, for example, health insurance, competitive voucher schemes and community financing schemes, which will allow youth to have a wider choice of providers and enhance the possibility of obtaining quality care.
Programmes must be inclusive of unmarried as well as married young people and recognise their need and right to sexual and reproductive health and related information and services. Counselling and contraceptive services must be made available to all young people, including the unmarried, in a non-threatening, non-judgmental and confidential environment. Indeed, these findings call for the implementation of strategies outlined under the National Rural Health Mission’s RCH Programme.
Findings that one in ten young men and women reported symptoms suggestive of mental health disorders suggest that there is a need to establish systems that address young people’s mental health. Efforts are needed to screen young people—particularly the married among whom symptoms were more likely to be reported—for mental health disorders when they avail of other primary health services, including, for example, sexual and reproductive health services, and to refer youth with such symptoms to appropriate health facilities and providers.
13.2 Directions for future research
Findings presented in this report provide a broad picture of youth in Andhra Pradesh. At the same time, however, they have raised a number of issues that require further investigation, particularly with regard to the determinants and consequences of youth behaviours and practices during their transition to adulthood. While the Youth Study is indeed a rich source of data that will enable investigators to fill many of the information gaps identified, there are several gaps in knowledge that will require additional research efforts.
A general research recommendation is the urgent need for prospective or panel study designs that follow a cohort of adolescents at regular intervals up to age 24. Thus far, research has relied on cross-sectional data. While these data are valuable in describing the levels and trends in key markers of transitions to adulthood, they rarely capture the ways in which the situation and experiences of youth influence their life courses at later ages. Moreover, drawing causal inferences from cross-sectional surveys has several limitations.
Barriers to school completion
While evidence presented in this report sheds light on the reasons for school discontinuation, further research is needed that profiles youth at risk of discontinuation, that defines underlying obstacles to school continuation and that identifies strategies to mitigate these barriers. Moreover, even though sizeable proportions of young women reported early transition to marriage as a significant factor for school discontinuation, research is needed that explores whether it is early marriage that curtails schooling for young women or whether it is such reasons as poverty and school-related factors, including access and quality, that lead to school discontinuation and thereby perpetuate early marriage. In addition, operations research is required that evaluates the reach, effectiveness and feasibility of existing programmes, including those implemented by the Andhra Pradesh government, intended to address barriers to school continuation. Moreover, as suggested in the section on recommendations for programmes, a variety of interventions need to be implemented that address school quality issues, enhance parental involvement in children’s education, provide the out-of-school, and especially married young women, a second chance to continue their education, provide conditional grants to disadvantaged groups and impart livelihoods skills to young people in school; operations research is required to be in-built in these programmes to assess their effectiveness and reach.
237
Looking forward
Transition to work
Several questions related to transition to work remain unanswered. For example, the finding that unemployment rates were particularly high among the educated calls for further research to better understand the difficulties experienced by educated youth in finding suitable employment opportunities. Further research is needed that explores the links between education attained or vocational training acquired and work patterns. With regard to vocational skills building, research is needed that explores the factors underlying the findings that few young people received vocational skills training even though large proportions were in favour of receiving such training, and that despite the availability of a range of vocational skills training opportunities, many young women continued to opt for training in traditional vocational skills. Equally important is the need for operations research that will test models intended to enable youth to acquire skills for which there is an established market demand and link eligible youth to market opportunities.
Socialisation experiences, interaction with parents
Youth Study findings are mixed with respect to socialisation experiences and interaction with parents. For example, considerable proportions of young people reported that their parents did not discriminate between sons and daughters in terms of freedom of movement and expectations regarding housework. At the same time, findings suggest that parents were far more controlling of their daughter’s behaviours than those of their sons and that far more young women than young men were not allowed to visit locations within or outside the village or neighbourhood unescorted. Qualitative studies would help shed light on these socialisation experiences, and this observed disconnect.
Findings also suggest that parent-child interaction was limited on sensitive sexual and reproductive matters. Little is known, however, about the ways in which limited interaction may influence young people’s lives, for example, their sexual behaviours or their ability to exercise informed choices in their lives. Similarly, there is a dearth of research on parents’ perspectives on the socialisation of sons and daughters, the ways in which parents communicate sensitive matters to their adolescent children, and the factors inhibiting parents from adopting gender-egalitarian socialisation practices and communicating with their adolescent children on sexual and reproductive matters. As mentioned earlier, there is a need to design and test interventions intended to involve parents more meaningfully in young people’s transitions to adulthood in terms of educational attainment, work, marriage and entry into sexual relations.
Findings also suggested that large proportions of youth had witnessed or observed family violence. Research is needed that assesses whether and how these experiences of violence within the family while growing up affects young people’s transitions to adulthood.
Sexual risk behaviours
Research is needed that explores the correlates of behaviours that undermine healthy development among young people, for example, sexual risk behaviours and substance use, and the linkages between them. At the same time, it would be useful to identify the characteristics of youth who make the transition in a safe and healthy way, for example, practise consistent condom use and seek appropriate care.
The Youth Study has raised serious methodological concerns that need to be addressed. For example, despite the fact that the Youth Study did employ such methods as gradual sequencing of questions to include progressively more sensitive topics (with regard to romantic and sexual relationships), anonymous third-party reporting and anonymous sealed envelope reporting; as in many studies pre-marital sexual experience was far less likely to be reported by young women than young men. Moreover, sex worker, exchange, forced and same-sex relationships were rarely reported. Such findings emphasise the need to continue the search for appropriate methodologies to measure sensitive behaviours among youth; computer-assisted survey interviews are one such option. Indeed, methodological studies that compare estimates derived using different approaches could provide an insight into efforts to refine measures of reporting of sensitive behaviours among youth.
238
Youth in India: Situation and Needs 2006–2007 ANDHRA pRADESH
Early marriage and childbearing
Research is needed that explores the extent to which early marriage compromises young people’s lives. For example, does early marriage impede young women’s ability to exercise agency in the marital home? How prepared for marriage are those who marry early and how does preparedness or lack thereof influence married life?
Many youth reported that they had not used a contraceptive to delay the first pregnancy and consequently they or their wife had experienced pregnancy soon after marriage. Further research is needed that sheds light on the factors that undermine young people’s ability to delay the first pregnancy.
Several promising interventions have been implemented that are intended to address the social isolation experienced by married young women and/or their reproductive health needs, including delaying pregnancy or making pregnancy safe. Few of these interventions have been rigorously evaluated and there is a need for research that assesses the feasibility and possibility of scaling up such interventions.
Partner violence
Youth Study findings have documented physical and sexual violence perpetrated by young men on their wives, as well as forced sex experienced in romantic and non-romantic situations by a small number of young women prior to marriage. Findings call for research that explores the factors underlying these experiences of violence, documents their health and social consequences for young women and men and their children, and tests interventions that enable youth to prevent such violence, on the one hand, and to overcome obstacles to seeking prompt and appropriate care, on the other.
Family life or sex education
Findings suggest that in-depth awareness about sexual and reproductive matters was limited, posing an obstacle to the ability of youth to make informed choices. Research is needed that explores the extent to which young people’s awareness of sexual and reproductive matters and of sexual and reproductive rights varies according to the sources from which they derive their knowledge. Equally important are studies that examine the sexual and reproductive knowledge and technical competence of those from whom information is sought—including, for example, teachers, health care providers and parents—to communicate sensitive sexual matters to young people.
There has been reticence in several states of the country to impart school-based family life or sex education to youth on the assumption—disproved in some settings—that such education will encourage youth to engage in risky sexual behaviours. Research is needed that explores the extent to which exposure to school- or community-based family life or sex education does indeed enable youth to make informed decisions and adopt safe behaviours in the area of sexual and reproductive health. Research is also needed that explores whether the transition into married life is safer and healthier among those—particularly young women—who were exposed to such education. In addition, operations research is required that evaluates the reach, quality and effectiveness of existing programmes intended to impart sexual and reproductive health information to young people.
Agency and gender role attitudes
While findings confirm young women’s limited agency and gender inegalitarian attitudes held by youth, particularly young men but also young women, several gaps remain in our understanding of the ways in which these affect young people’s transitions to adulthood. Further research is needed, for example, that identifies the factors underlying the expression of unequal and equal gender role attitudes by young men and women, particularly the role of parents, teachers, peers and media and that explores the ways in which inegalitarian gender role attitudes and limited agency compromise youth development, including in the area of sexual and reproductive health.
239
Looking forward
Methodological issues also arise. There is a need to refine measures of agency as applicable to young men and women. The Youth Study has obtained data on multiple dimensions of agency among young men and women, the married and the unmarried and those from rural and urban areas. These data lend themselves to methodological exercises that measure agency among youth, that assess the extent to which key components of agency may differ across different categories of youth and that explore whether a single summary measure of youth agency can be developed.
Access to and control over resources
Findings that few youth, irrespective of sex, owned a savings account, and among those who did own an account, young women were far less likely than young men to operate the account independently, call for efforts to map savings and credit options available to youth. At the same time, research is needed that assesses the financial literacy skills of youth, their savings and spending patterns, barriers faced in accessing existing financial products, and ways in which these barriers can be overcome.
Mental health disorders
Findings suggest that one in 10 youth experienced symptoms suggestive of mental health disorders. Research is needed that explores young people’s mental health profile in greater depth and that assesses the linkages between sexual and reproductive health, on the one hand, and mental health, on the other.
Health seeking for sexual and reproductive health symptoms
Findings suggesting that health care seeking, particularly for sexual and reproductive matters, was limited, highlight the need for research that explores the factors inhibiting youth from seeking care. Youth Study data will enable, as a start, exploration of the factors distinguishing those who sought care from those who did not, in terms of both socio-economic factors as well as parental and peer interaction levels and youth inhibitions about seeking services relating to sexual matters. At the same time, research is needed that assesses the perspectives of providers with regard to the barriers they face in providing services to youth and ways to overcome these barriers.
In brief, the Youth Study has documented, for the first time, the multi-faceted situation of youth in Andhra Pradesh. The study highlights several positive aspects of young people’s lives but also alerts us to the many challenges confronting youth and their ability to make a successful transition to adulthood. It emphasises the heterogeneity of youth, not only in terms of their situation but also with regard to their stated needs and preferred mechanisms to address these needs. Programmes must recognise the heterogeneity of young people, and interventions and delivery mechanisms should be appropriately tailored to meet their special needs. Evidence presented here provides not only a blue-print for the programming needs of youth in Andhra Pradesh but also a base-line by which to measure the impact of programmes intended to address youth needs.
240
Youth in India: Situation and Needs 2006–2007 ANDHRA pRADESH
References
Abraham, L. 2001. “Redrawing the lakshman rekha: Gender differences and cultural constructions in youth sexuality in urban India,” South Asia 24:133–56.
Abraham, L. 2002. “Bhai-behen, true love, time pass: Friendships and sexual partnerships among youth in an Indian metropolis,” Culture, Health, and Sexuality 4(3):337–53.
Abraham, L. and K.A. Kumar. 1999. “Sexual experiences and their correlates among college students in Mumbai city, India,” International Family Planning Perspectives 25(3):139–46.
Alexander, M., L. Garda, S. Kanade et al. 2003. Formation of partnerships among young women and men in Pune district, Maharashtra; Survey Questionnaire, unpublished. New Delhi: Population Council.
Alexander, M., L. Garda, S. Kanade et al. 2006a. Formation of Partnerships among Young Women and Men in Pune District, Maharashtra. New Delhi: Population Council.
Alexander, M., L. Garda, S. Kanade et al. 2006b. “Romance and sex: Pre-marital partnership formation among young women and men, Pune district, India,” Reproductive Health Matters 14(28):144–55.
Andhra Pradesh State AIDS Control Society (APSACS). 2005. HIV/AIDS in Andhra Pradesh Situation and Response: A Report. Hyderabad: Government of Andhra Pradesh.
Andrew, G., V. Patel and J. Ramakrishna. 2003. “Sex, studies or strife? What to integrate in adolescent health services,” Reproductive Health Matters 11(21):120–29.
Awasthi, S., M. Nichter and V.K. Pande. 2000. “Developing an interactive STD prevention programme for youth: Lessons from a north Indian slum,” Studies in Family Planning 31(2):138–50.
Bashir, K., R. Blizard, R. Jenkins et al. 1996. “Validation of the 12-item General Health Questionnaire in British general practice,” Primary Care Psychiatry 2:4–7.
Bhat, P.N.M. and A.J.F. Zavier. 2007. “Factors influencing the use of prenatal diagnostic techniques and sex ratio at birth in India,” in Watering the Neighbour’s Garden: The Growing Demographic Female Deficit in Asia, eds. I. Attane and C.Z. Guilmoto. Paris: Committee for International Cooperation in National Research in Demography, pp. 131–60.
Bhatia, M.S. and S. Choudhary. 1998. “Dhat symptoms: A culture-bound sex neurosis,” Indian Journal of Medical Science 52:30–35.
Bhatia, M.S. and S.C. Malik. 1991. “Dhat syndrome: A useful diagnostic entity in Indian culture,” British Journal of Psychiatry 159:691–95.
Bhende, A.A. 1995. “Evolving a model for AIDS prevention education among underprivileged adolescent girls in urban India,” Women and AIDS Research Program Report, Series No. 5. Washington, DC: International Centre for Research on Women.
241
References
Bhuiya, I., U. Rob, M.E. Khan et al. 2003. “Reproductive health services for adolescents: Recent experiences from a pilot project in Bangladesh,” in Towards Adulthood: Exploring the Sexual and Reproductive Health of Adolescents in South Asia, eds. S. Bott, S.J. Jejeebhoy, I. Shah et al. Geneva: World Health Organisation, pp. 203–6.
Centre for Good Governance. 2007. Strategy for Girl Child Education for Andhra Pradesh. Accessed on 15 October, 2009 at <http://unpan1.un.org/intradoc/groups/public/documents/CGG/UNPAN027150.pdf>.
Chandrasekhar, C.P., J. Ghosh and A. Roychowdhury. 2006. “The ‘demographic dividend’ and young India’s economic future,” Economic and Political Weekly 41(49): 5055–63.
Cleland, J. 2001. “Illustrative questionnaire for interview-surveys with young people,” in Asking Young People about Sexual and Reproductive Behaviours: Illustrative Core Instruments, eds. J. Cleland, R. Ingham and N. Stone. Geneva: World Health Organisation, pp. 5–16.
Cochran, W.G. 1977. Sampling Techniques. New York: John Wiley & Sons.
Collumbien, M., N. Bohidar, R. Das et al. 2004. “Etic and emic categories in male sexual health: A case study from Orissa,” in Categories and Contexts: Anthropological and Historical Studies in Critical Demography, eds. S. Szreter, H. Sholkamy and A. Dharmalingam. New York: Oxford University Press, pp. 199–221.
Dagar, R. 2007. “Rethinking female foeticide: Perspective and issues,” in Sex-selective Abortion in India: Gender,Society and New Reproductive Technologies, ed. T. Patel. New Delhi: Sage Publications, pp. 91–134.
Demographic Research and Development Foundation, Inc. (DRDF) and University of the Philippines Population Institute (UPPI). 2002. Young Adult Fertility and Sexuality Study [Married Female] Questionnaire. Quezon City, Philippines: DRDF and UPPI.
Department of Women Development and Child Welfare, Government of Andhra Pradesh n.d. Adolescent Girls Scheme- Balika Mandals. Accessed on 15 October, 2009 at <http://anganwadi.ap.nic.in/icds_programs.html>.
DiClemente, R.J. 1992. “Psychosocial determinants of condom use among adolescents,” in Adolescents and AIDS: A Generation in Jeopardy, ed. R.J. DiClemente. Newbury Park, CA: Sage, pp. 34–51.
Donath, S. 2001. “The validity of the 12-item General Health Questionnaire in Australia: A comparison between three scoring methods,” Australian and New Zealand Journal of Psychiatry 35(2):231–35.
Ellickson, P., H. Saner and K.A. McGuigan. 1997. “Profiles of violent youth: Substance use and other concurrent problems,” American Journal of Public Health 87:985–91.
Goldberg, D. 1992. General Health Questionnaire (GHQ-12). Windsor: NFER-Nelson.
Government of Andhra Pradesh. 1997. Andhra Pradesh State Population Policy: A Statement and a Strategy. Hyderabad: Department of Health, Medical and Family Welfare, Government of Andhra Pradesh.
Government of Andhra Pradesh. 1999. Andhra Pradesh Vision 2020. Accessed on 18 February, 2007 at <www.aponline.gov.in/vision2020.html>.
Government of Andhra Pradesh. 2004. Guidelines and Prevention Education Programme (APEP) 2004–05. Hyderabad: Department of School Education, Government of Andhra Pradesh.
Government of Andhra Pradesh. 2006. State Programme Implementation Plan: Reproductive and Child Health, RCH II. Hyderabad: Department of Health, Medical and Family Welfare, Government of Andhra Pradesh.
242
Youth in India: Situation and Needs 2006–2007 ANDHRA pRADESH
Guttmacher Institute. 2004a. 2004 Ghana National Survey of Adolescents: Survey Questionnaire, unpublished. New York: Guttmacher Institute.
Guttmacher Institute. 2004b. 2004 Malawi National Survey of Adolescents: Survey Questionnaire, unpublished. New York: Guttmacher Institute.
Guttmacher Institute. 2004c. 2004 Uganda National Survey of Adolescents: Survey Questionnaire, unpublished. New York: Guttmacher Institute.
International Institute for Population Sciences (IIPS) and Macro International. 2007a. National Family Health Survey (NFHS-3), 2005–06: India, Volume 1. Mumbai: IIPS.
International Institute for Population Sciences (IIPS) and Macro International. 2007b. National Family Health Survey (NFHS-3), 2005–06: India, Volume II. Mumbai: IIPS.
International Institute for Population Sciences (IIPS) and Macro International. 2008. National Family Health Survey (NFHS-3), India: 2005–06: Andhra Pradesh. Mumbai: IIPS.
International Institute for Population Sciences (IIPS) and Population Council. 2002. First-time Parents project: Baseline Survey Questionnaire, unpublished. Mumbai: IIPS.
International Labour Organisation (ILO). 2006. Global Employment Trends for Youth. Geneva: ILO.
Jacob, K.S., D. Bhugra and A.H. Mann. 1997. “The validation of the 12-item General Health Questionnaire among ethnic Indian women living in the United Kingdom,” Psychological Medicine 27(5):1215–17.
Jejeebhoy, S.J. and M.P. Sebastian. 2003. “Actions that protect: Promoting sexual and reproductive health and choice among young people in India,” Regional Working Papers, No. 18. New Delhi: Population Council.
Jejeebhoy, S.J. and M.P. Sebastian. 2004. “Young people’s sexual and reproductive health,” in Looking Back, Looking Forward: A Profile of Sexual and Reproductive Health in India, ed. S.J. Jejeebhoy. New Delhi: Population Council, pp. 138–68.
Khan, S.I., N. Hudson-Rodd, S. Saggers et al. 2006. “Semen contains vitality and heredity, not germs’: Seminal discourse in the AIDS era,” Journal of Health, Population and Nutrition 24(4):426–37.
Kish, L. 1995. “Methods for design effects,” Journal of Official Statistics 11:55–77.
Laird, R.D., G.S. Pettit, K.A. Dodge et al. 2003. “Change in parents’ monitoring knowledge: Links with parenting, relationship quality, adolescent beliefs, and antisocial behaviour,” Social Development 12(3):401–19.
Lambert, H. and K. Wood. 2005. “A comparative analysis of communication about sex, health and sexual health in India and South Africa: Implications for HIV prevention,” Culture, Health and Sexuality 7(6):527–41.
Lowry, R., D. Holtzman, B.I. Truman et al. 1994. “Substance use and HIV-related sexual behaviours among US high school students: Are they related?” American Journal of Public Health 84:1116–20.
Marta, E. 1997. “Parent–adolescent interactions and psychosocial risk in adolescents: An analysis of communication, support and gender,” Journal of Adolescence 20(5):473–87.
Mehra, S., R. Savithri and L. Coutinho. 2002. “Sexual behaviour among unmarried adolescents in Delhi, India: Opportunities despite parental controls,” Paper presented at the IUSSP Regional Population Conference, Bangkok, June.
243
References
Mensch, B.S., D.N. Anh and W.H. Clark. 2000. Adolescents and Social Change in Vietnam: Preliminary Report. Hanoi: Population Council and Institute of Sociology.
Ministry of Finance. 2008. Economic Survey of India 2007–2008. New Delhi: Ministry of Finance, Government of India.
Ministry of Health and Family Welfare (MOHFW). 2000. National Population Policy 2000. New Delhi: Department of Family Welfare, MOHFW, Government of India.
Ministry of Health and Family Welfare (MOHFW). 2005. National Rural Health Mission: Meeting People’s Health Needs, Framework for Implementation 2005–2012. New Delhi: MOHFW, Government of India. Accessed on 1 January, 2008 at <www.mohfw.nic.in/NRHM/Documents/NRHM-Framework for Implementation.pdf>.
Ministry of Health and Family Welfare (MOHFW). 2006. RCH Phase II: National Programme Implementation Plan. New Delhi: MOHFW, Government of India.
Ministry of Human Resource Development (MHRD), National AIDS Control Organisation (NACO) and United Nations Children’s Fund (UNICEF). 2005. Adolescence Education: National Framework and State Action Plan (2005–06). New Delhi: MOHRD, NACO and UNICEF.
Ministry of Human Resource Development (MHRD). 2007. Selected Educational Statistics 2004–2005. New Delhi: Ministry of Human Resource Development, Government of India.
Ministry of Statistics and Programme Implementation. 2008. Statement: Gross State Domestic Product at Current Prices as on 28 February. Accessed 31 March 2009 at <http://mospi.nic.in/6_gsdp_cur_9394 ser.htm>.
Ministry of Youth Affairs and Sports. 2003. National Youth Policy 2003. New Delhi: Government of India.
Mohan, S., P. Sankara Sarma and K.R. Thankappan. 2005. “Access to pocket money and low educational performance predict tobacco use among adolescent boys in Kerala, India,” Preventive Medicine 41(2):685–92.
National Institute of Medical Statistics and National AIDS Control Organisation (NACO). 2008. National Behavioural Surveillance Survey (NBSS), 2006; Youth (15–24 Years). New Delhi: NACO, Ministry of Health and Family Welfare, Government of India. Accessed on 5 January, 2009 at <http://www.nacoonline.org/Quick_Links/Publication/ME_and_Research_Surveillance/Reports_and_Surveys/National_BSS_20062/>.
National Research Council and Institute of Medicine. 2005. Growing Up Global: The Changing Transition to Adulthood in Developing Countries. Washington, DC: National Academies Press.
National Sample Survey Organisation (NSSO). 2006. Employment and Unemployment Situation in India 2004–05, Part 1, NSS 61st Round. New Delhi: NSSO, Government of India.
Office of the Registrar General, India. 2003. Sample Registration System, Statistical Report, 2003. New Delhi: Office of the Registrar General, India.
Office of the Registrar General, India (RGI). 2008a. SRS Based Abridged Life Tables 2002–06. New Delhi: RGI.
Office of the Registrar General, India (RGI). 2008b. Sample Registration System, Statistical Report, 2007, Report No. 2 of 2008. New Delhi: RGI.
Office of the Registrar General and Census Commissioner. 2001a. Age Groups. Accessed on 27 November, 2008 at <http://www.censusindia.gov.in/Census_Data_2001/Census_Data_Online/Social_and_cultural/Age_Groups.aspx>.
244
Youth in India: Situation and Needs 2006–2007 ANDHRA pRADESH
Office of the Registrar General and Census Commissioner. 2001b. Primary Census Abstract, Total Population: Table A–5, Series 1. New Delhi: Office of the Registrar General and Census Commissioner.
Office of the Registrar General and Census Commissioner. 2001c. Religious Compositions. Accessed on 27 November, 2008 at <http://www.censusindia.gov.in/Census_Data_2001/Census_Data_Online/Social_and_cultural/Religion.aspx>.
Office of the Registrar General and Census Commissioner, 2001d. Duration of Residence for Migrants by Last Residence. Accessed on 27 November, 2008 at <http://www.censusindia.gov.in/Census_Data_2001/Census_Data_Online/Online_Migration/Duration_of_Residence_By_LastResidence.aspx>.
Office of the Registrar General and Census Commissioner. 2001e. Educational Level by Age and Sex for Population Aged 7 and Above, Table C–8. New Delhi: Office of the Registrar General and Census Commissioner.
Office of the Registrar General and Census Commissioner. 2006. Population Projections for India and States 2001–2026 (Revised December 2006). New Delhi: Office of the Registrar General and Census Commissioner.
Patel, V. and G. Andrew. 2001. “Gender, sexual abuse and risk behaviours: A survey of school-based adolescents in Goa,” National Medical Journal of India 14:263–67.
Pelto, P.J. 1999. “Sexuality and sexual behaviour: The current discourse,” in Implementing a Reproductive Health Agenda in India: The Beginning, ed. S. Pachauri. New Delhi: Population Council, pp. 539–86.
Planning Commission. 2002. Tenth Five Year Plan (2002–2007), Volume II, Sectoral Policies and Programmes. New Delhi: Government of India.
Planning Commission. 2006. Towards Faster and More Inclusive Growth: An Approach to the 11th Five Year Plan (2007–2012). New Delhi: Government of India.
Planning Commission. 2007. Poverty Estimates for 2004–05, Press release, March. New Delhi: Government of India.
Planning Department, Government of Andhra Pradesh. 2007. Socio Economic Survey 2006–07. Accessed on 27 November, 2008 at <http://www.aponline.gov.in/Apportal/SocioSurvery0607/economic_Survey.html>.
Ram, F., R.K. Sinha, S.K. Mohanty et al. 2006. Marriage and Motherhood: An Exploratory Study of the Social and Reproductive Health Status of Married Young Women in Gujarat and West Bengal, India. New Delhi: Population Council.
Rossier, C. 2003. “Estimating induced abortion rates: A review,” Studies in Family Planning 34(2):87–102.
Sachdev, P. 1998. “Sex on campus: A preliminary study of knowledge, attitudes and behaviour of university students in Delhi, India,” Journal of Biosocial Science 30:95–105.
Santhya, K.G. and S.J. Jejeebhoy. 2006. “Young women’s experience of forced sex within marriage: Evidence from India,” in Sex without Consent: Young People in Developing Countries, eds. S.J. Jejeebhoy, I. Shah and S. Thapa. London: Zed Books, pp. 59–73.
Santhya, K.G., N. Haberland, F. Ram et al. 2007. “Consent and coercion: Examining unwanted sex among married young women in India,” International Family Planning Perspectives 33(3):124–32.
Santhya, K.G. and S.J. Jejeebhoy. 2007. Young people’s sexual and reproductive health I India: Policies, programmes and realities. Regional Working Paper, No. 19, New Delhi, Population Council.
245
References
Santhya, K.G., S.J. Jejeebhoy and S. Ghosh. 2008. Early Marriage and Sexual and Reproductive Health Risks: Experiences of Young Women and Men in Andhra Pradesh and Madhya Pradesh, India. New Delhi: Population Council.
Sathar, Z.A., M. Haque, A. Faizunnissa et al. 2003. Adolescents and Youth in Pakistan, 2001–02. Islamabad: Population Council.
Sebastian, M.P., M. Grant and B. Mensch. 2005. Integrating Adolescent Livelihood Activities Within a Reproductive Health Programme for Urban Slum Dwellers in India. New Delhi: Population Council.
Sebastian, M.P., M. Grant, B. Mensch et al. 2003. Integrating adolescent livelihood activities within a reproductive health programme for urban slum dwellers in India, Survey Questionnaire, unpublished. New Delhi: Population Council.
Singh, S. and S. Saini. 2007. “HIV risk perception in relation to peer pressure and drug abuse behavior among adolescents,” Indian Journal of Sexually Transmitted Diseases 28:53–54.
Sroufe, J.W. 1991. “Assessment of parent-adolescent relationships: Implications for adolescent development,” Journal of Family Psychology 5(1):21–45.
Ul Haque, M. and A. Faizunnisa. 2003. “Access to reproductive health information in Punjab and Sindh, Pakistan: The perspectives of adolescents and parents,” in Towards Adulthood: Exploring the Sexual and Reproductive Health of Adolescents in South Asia, eds. S. Bott, S.J. Jejeebhoy, I. Shah et al. Geneva: World Health Organisation, pp. 153–55.
United Nations Development Programme (UNDP). 2000. Millennium Development Goals. United Nations website. Accessed on 8 January, 2008 at <http://www.un.org/millenniumgoals/goals.html>.
Verma, R.K., S. Sharma, R. Singh et al. 2003. “Beliefs concerning sexual health problems and treatment seeking among men in an Indian slum community,” Culture, Health and Sexuality 5(3):265–76.
Wolter, K.M. 1985. Introduction to Variance Estimation. New York: Springer.
246
Youth in India: Situation and Needs 2006–2007 ANDHRA pRADESH
Appendix A
principal investigators and authors
Usha Ram, Associate Professor, Department of Public Health and Mortality Studies, International Institute for Population Sciences, Mumbai
S.K. Mohanty, Reader, Department of Fertility Studies, International Institute for Population Sciences, Mumbai
Abhishek Singh, Assistant Professor, Department of Public Health and Mortality Studies, International Institute for Population Sciences, Mumbai
F. Ram, Director and Senior Professor, International Institute for Population Sciences, Mumbai
K.G. Santhya, Associate, Population Council, New Delhi
Shireen J. Jejeebhoy, Senior Associate, Population Council, New Delhi
Rajib Acharya, Senior Programme Officer, Population Council, New Delhi
247
Appendix A: Andhra pradesh study staff
Appendix A
Andhra pradesh study staff
Senior Research Officers
Shreeparna Ghosh
Research Officers
P. Ganesh K.S. Bharat Kumar S. Jareena C. Latha Himanshu Katyan Santosh Kumar Singh Abhishek Kumar Prashant Kumar Singh Rajesh Kumar
Assistant Research Officers
B. Sd. Imran E. Suneetha T. Pradeep Kumar
Finance Staff
Jeba Kumar Anil Paul
Administrative Staff
Nazrul Haque Ansari Avadhesh Prajapati Pranita Dalvi Shyam V. Rathod Namrata Ghadge Komal Saxena M.A. Jose Usha Sonavane
Editorial Staff
Shanti Menon
Data Entry Operators
Sumita D. Choudhary Aparna R Narvekar Sarika D. Dethe Sayali P. Shivalkar Manisha D. Esave Prasad Surve Sarita S. Mohane
248
Youth in India: Situation and Needs 2006–2007 ANDHRA pRADESH
Field Supervisor
S. K. Ameenasaheb B. Ravindranath S. K. Bhasha G. Ashok Reddy K. Narendra Kumar M. Srinivasulu Reddy S. Narayana Murthy T. Suresh C. Bala Ram P. Yadaiah S. Venkata Rao
Field Editor
P. Suresh Babu B. Aruna Kumari B. Bharthi M. Ratna Mala K. Chakrapani N. Govinda Reddy M. Dhanlakshmi M. Satish Reddy M. Gattaiah G. Sridevi N. Aruna Jyothi
Office Editors
Rakesh M. Pawar Shantanu G. Sawant
Household Listers and Mappers
P. Baskar Avvaru Pundari Kaksha R. Obularao Bukka Kundavaram Obaiah R. Chandrappa Hari Prasad Raju Doddi Chelli Raju Hemraj Daima S. Ramanjaneyulu M. Dalaiah Challa Ramana Dongari Govandhan A. Nagesgwar Rao Chavali Hemachandar Kiran Kumar Soma G. Hema Santosh Kumar A. Venu A. Dilip Kumar
Field Investigators
P. Satish Babu K. Roja Shiv Chandra V. Rajitha B. Laxmi Devi P. Rajesh G. Narsim Das G. Solomon Raju Chandrashekhar Goud N. Chandrashekhara Rao T. Grace T. Eswara Rao M. Gurudevi T. Rama Rao K.Hemalatha P. Rama Rao B. Hemavathi V. Sanyasi Rao R. Haritha T. Govinda Rao T. Jayamani R. Ramesh P. Geetha Kumari P. Ramesh V. Aravind Kumar G. Rukmini A. Lakshmi K. Sailaja
249
Appendix A: Andhra pradesh study staff
S. Malathi Latha P. Raja Shekhar V. Madhavi P. Simhachalam B. Uma Maheshwari V. Srinivas A. G. Manorama K. Sumanlatha Irshad Mohammad T. Sushma M. Nagaraju Y. Sujatha Ashok Nagilla S. Kumara Swamy A. Surya Narayana Nirmala Tandi M. Venkat Narayana P. Trimurthulu D. Sanyasi Naidu Preeti Devi Verma P. Nirmala V. Vani E. Paleena S. Venu G. Padma M. Yadiah V. Surya Prakash N. Yesuprema G. Kumar Raja P. Rajeswari Ch. Upendra Rao
250
Youth in India: Situation and Needs 2006–2007 ANDHRA pRADESH
Project Advisory Committee
Additional Secretary Ministry of Health and Family Welfare Government of India
Chief Director Ministry of Health and Family Welfare Government of India
Deputy Secretary Information, Education, Communication Ministry of Health and Family Welfare Government of India
Director Directorate of Health Services Government of Andhra Pradesh
Director Directorate of Health Services Government of Bihar
Director Directorate of Health Services Government of Jharkhand
Director Directorate of Health Services Government of Maharashtra
Director Directorate of Health Services Government of Rajasthan
Director Directorate of Health Services Government of Tamil Nadu
Appendix A
Advisory committees
Director Nehru Yuvak Kendra Sangatan Ministry of Sports and Youth Affairs Government of India
Director National Institute of Health and Family Welfare, New Delhi
Country Director (India) John D. and Catherine T. Mac Arthur Foundation, New Delhi
Country Programme Advisor (India) David and Lucile Packard Foundation, New Delhi
Director International Institute for Population Sciences, Mumbai
Regional Director Population Council, New Delhi
NFHS Coordinator International Institute for Population Sciences, Mumbai
Shalini Bharat Professor and Dean School of Health Systems Studies Tata Institute of Social Sciences, Mumbai
P.M. Kulkarni Professor Centre for the Study of Regional Development Jawaharlal Nehru University, New Delhi
251
Appendix A: Advisory committees
Arvind Pandey Director Institute for Research in Medical Statistics, New Delhi
G. Rama Rao Former Officiating Director International Institute for Population Sciences, Mumbai
T.K. Roy Former Director International Institute for Population Sciences, Mumbai
Leela Visaria National Professor Gujarat Institute of Development Research, Ahmedabad
Technical Advisory Committee
Shalini Bharat Professor and Dean School of Health Systems Studies Tata Institute of Social Sciences, Mumbai
Director International Institute for Population Sciences, Mumbai
P.M. Kulkarni Professor Centre for the Study of Regional Development Jawaharlal Nehru University, New Delhi
Arvind Pandey Director Institute for Research in Medical Statistics, New Delhi
Pertti J. Pelto Professor Emeritus Medical Anthropology University of Connecticut, USA
T.K. Roy Former Director International Institute for Population Sciences, Mumbai
Leela Visaria National Professor Gujarat Institute of Development Research, Ahmedabad
252
Youth in India: Situation and Needs 2006–2007 ANDHRA pRADESH
As in the case of any sample survey, estimates from the Youth Study in Andhra Pradesh, as presented in Chapters 1–12, are affected by two major sources of errors: non-sampling and sampling errors. Non-sampling errors are generally the result of procedural mistakes made during data collection and data processing, such as, the inability to locate and interview the correct household or individual, failure to conform to standard survey procedures laid out by the central office, misunderstanding of questions on the part of either the interviewer or the respondent, and data entry errors. At the same time, because of the inclusion of numerous sensitive issues, the Youth Study faced the risk of other non-sampling errors as well, such as, the deliberate skipping of sensitive questions by the interviewer or refusal to answer sensitive questions by the respondent. In order to minimise non-sampling errors, a number of precautions were taken during the implementation of the study, which are described in detail in Chapter 1. However, we acknowledge that despite these efforts, non-sampling errors are impossible to avoid; they are, moreover, extremely difficult to evaluate statistically.
Sampling errors, on the other hand, can be evaluated statistically. These errors, as the name suggests, result from the choice of the particular sample selected. The sample of respondents selected in the Youth Study is only one of many possible samples that could have been selected from the population of Andhra Pradesh, using the same design and expected sample size. Each of these samples would have yielded results that differed somewhat from the results of the sample selected. The sampling error is a measure of variability among all possible samples. Although the degree of variability may not be known exactly, it can be estimated from the survey results using standard statistical procedures.
A sampling error, usually measured in terms of the standard error for a particular statistic (mean, percentage, ratio, etc.), is the square root of the variance of that statistic. The standard error can be used to calculate confidence intervals within which the true value for the population can reasonably be assumed to fall. For example, for any given statistic calculated from the survey, the value of that statistic will fall within a range of plus or minus two times the standard error of that statistic in 95% of all possible samples of identical size and design.
If the sample of respondents had been selected as a simple random sample, it would have been possible to use straightforward formulae for calculating the variance of the statistic and consequently, sampling errors. However, the Youth Study sample is the result of a multi-stage stratified design, and consequently, it was necessary to use more complex formulae. The variance estimators that were used can be found in Cochran (1977) and Wolter (1985). The computer software used to calculate sampling errors for the Youth Study was programmed in STATA SE 8.2. This procedure uses the Taylor linearisation method for variance estimation for survey estimates that are means, proportions or ratios.
The Taylor linearisation method treats any percentage or average as a ratio estimate. Let r = y/x be our sample estimate of the population ratio (mean or percentage) denoted by R = Y/X, where y represents the total sample value for variable Y, and x represents the total number of sample cases in the group or sub-group under consideration.
Appendix B
Estimates of sampling errors
253
Appendix B: Estimates of sampling errors
Using first order Taylor expansion, it can be shown that the approximate variance of distribution of r (square root of which is the standard error) is as below:
in which zhi = yhi - rxhi and zh = yh - rxh
where h represents the sampling stratum which varies from 1 to L, nh is the number of PSUs selected in the hth stratum, yhi is the sum of the weighted values of variable Y in the ith PSU in the hth stratum, xhi is the sum of the weighted number of cases in the ith PSU in the hth stratum, f is the overall sampling fraction, which is so small that it is ignored.
In addition to the standard error, the design effect (DEFT) for each estimate was also computed, which is defined as the ratio between the standard error using the given sample design and the standard error that would result if a simple random sample had been used (Kish, 1995) represented by the following simple formula:
where Var(r) is a design-based estimate of variance for the parameter r, Varsrswr (rsrs) is an estimate of the variance for an estimator rsrs that would be obtained from a similar
hypothetical survey conducted using simple random sampling (srs) with replacement (wr).
A DEFT value of 1.0 indicates that the sample design is as efficient as a simple random sample, while a value greater than 1.0 indicates the increase in the sampling error due to the use of a more complex and less statistically efficient design. Relative standard error (SE/R) and 95% confidence limits for each estimate were also computed.
Sampling errors for the Youth Study were calculated for selected variables and results are presented in this appendix for each sex and marital status sub-group of respondents for the state as a whole, and for those in urban and rural areas, respectively. For each variable, the type of statistic (mean, proportion or ratio) and the base population are given in Table B.1. Table B.2 presents the value of the statistic (R), its standard error (SE), the number of unweighted (N) and weighted (WN) cases, the design effect (DEFT), the relative standard error (SE/R) and the 95% confidence limits, for each variable.
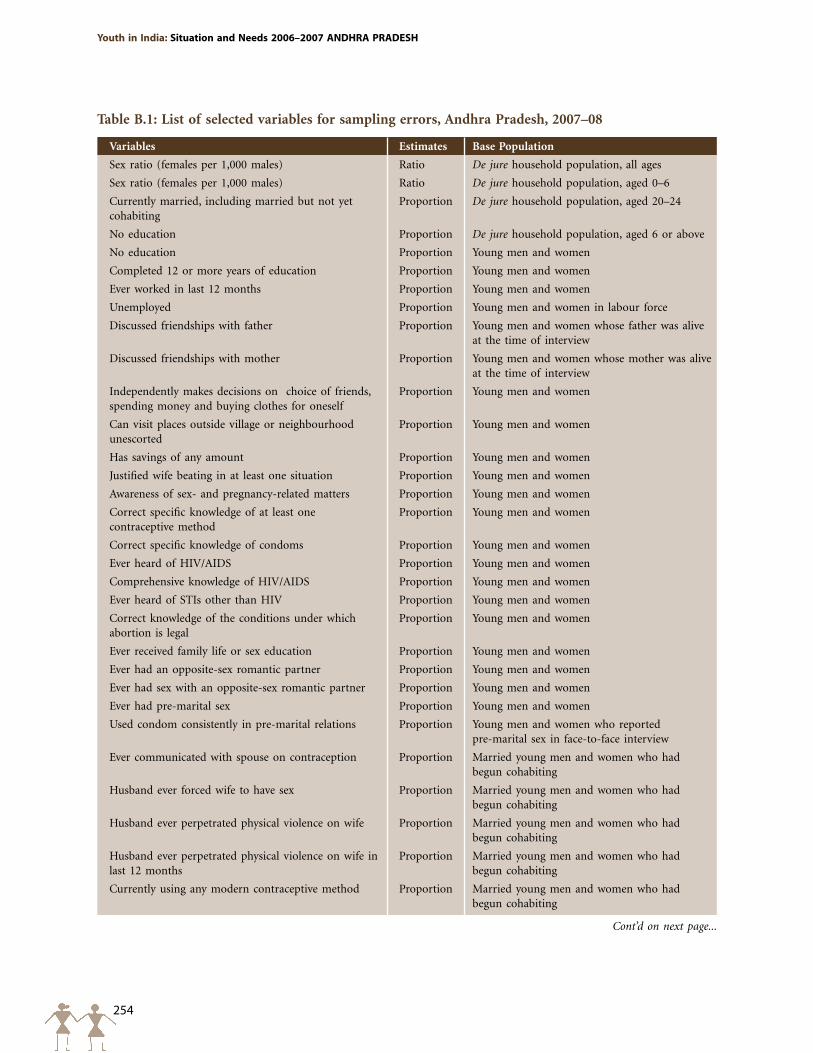
254
Youth in India: Situation and Needs 2006–2007 ANDHRA pRADESH
Cont’d on next page...
Table B.1: List of selected variables for sampling errors, Andhra Pradesh, 2007–08
Variables Estimates Base Population
Sex ratio (females per 1,000 males) Ratio De jure household population, all ages
Sex ratio (females per 1,000 males) Ratio De jure household population, aged 0–6
Currently married, including married but not yet cohabiting
Proportion De jure household population, aged 20–24
No education Proportion De jure household population, aged 6 or above
No education Proportion Young men and women
Completed 12 or more years of education Proportion Young men and women
Ever worked in last 12 months Proportion Young men and women
Unemployed Proportion Young men and women in labour force
Discussed friendships with father Proportion Young men and women whose father was alive at the time of interview
Discussed friendships with mother Proportion Young men and women whose mother was alive at the time of interview
Independently makes decisions on choice of friends, spending money and buying clothes for oneself
Proportion Young men and women
Can visit places outside village or neighbourhood unescorted
Proportion Young men and women
Has savings of any amount Proportion Young men and women
Justified wife beating in at least one situation Proportion Young men and women
Awareness of sex- and pregnancy-related matters Proportion Young men and women
Correct specific knowledge of at least one contraceptive method
Proportion Young men and women
Correct specific knowledge of condoms Proportion Young men and women
Ever heard of HIV/AIDS Proportion Young men and women
Comprehensive knowledge of HIV/AIDS Proportion Young men and women
Ever heard of STIs other than HIV Proportion Young men and women
Correct knowledge of the conditions under which abortion is legal
Proportion Young men and women
Ever received family life or sex education Proportion Young men and women
Ever had an opposite-sex romantic partner Proportion Young men and women
Ever had sex with an opposite-sex romantic partner Proportion Young men and women
Ever had pre-marital sex Proportion Young men and women
Used condom consistently in pre-marital relations Proportion Young men and women who reported pre-marital sex in face-to-face interview
Ever communicated with spouse on contraception Proportion Married young men and women who had begun cohabiting
Husband ever forced wife to have sex Proportion Married young men and women who had begun cohabiting
Husband ever perpetrated physical violence on wife Proportion Married young men and women who had begun cohabiting
Husband ever perpetrated physical violence on wife in last 12 months
Proportion Married young men and women who had begun cohabiting
Currently using any modern contraceptive method Proportion Married young men and women who had begun cohabiting
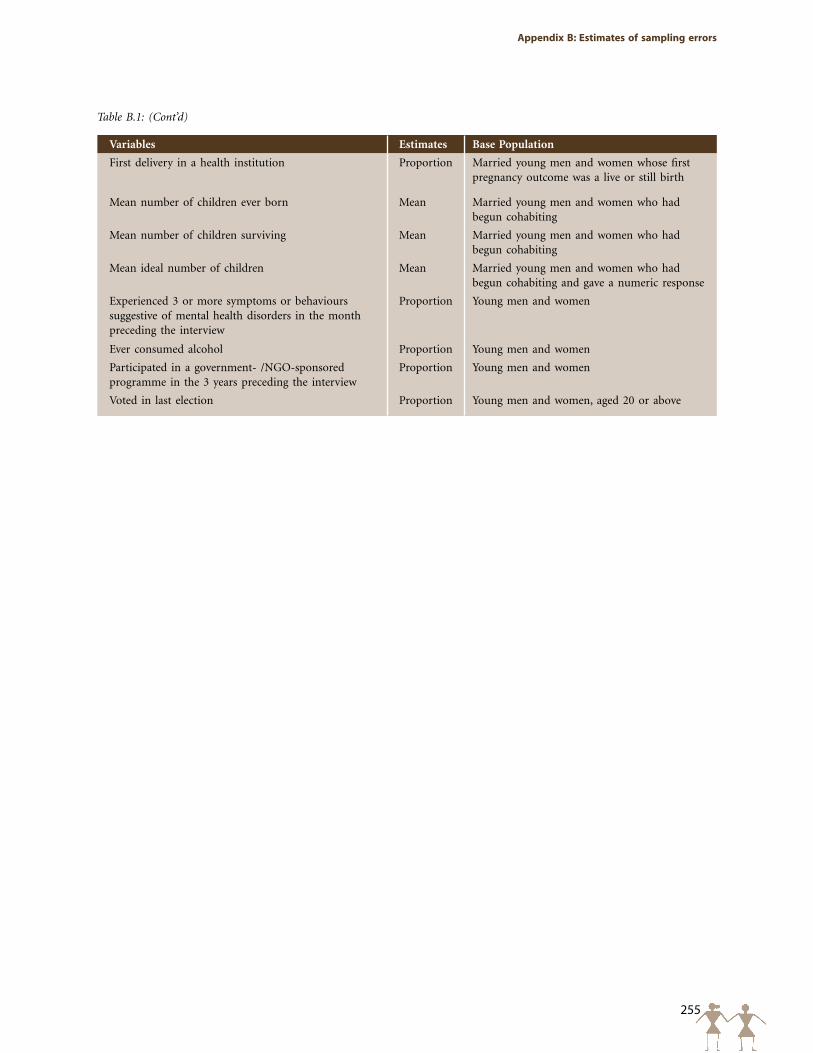
255
Appendix B: Estimates of sampling errors
Variables Estimates Base Population
First delivery in a health institution Proportion Married young men and women whose first pregnancy outcome was a live or still birth
Mean number of children ever born Mean Married young men and women who had begun cohabiting
Mean number of children surviving Mean Married young men and women who had begun cohabiting
Mean ideal number of children Mean Married young men and women who had begun cohabiting and gave a numeric response
Experienced 3 or more symptoms or behaviours suggestive of mental health disorders in the month preceding the interview
Proportion Young men and women
Ever consumed alcohol Proportion Young men and women
Participated in a government- /NGO-sponsored programme in the 3 years preceding the interview
Proportion Young men and women
Voted in last election Proportion Young men and women, aged 20 or above
Table B.1: (Cont’d)
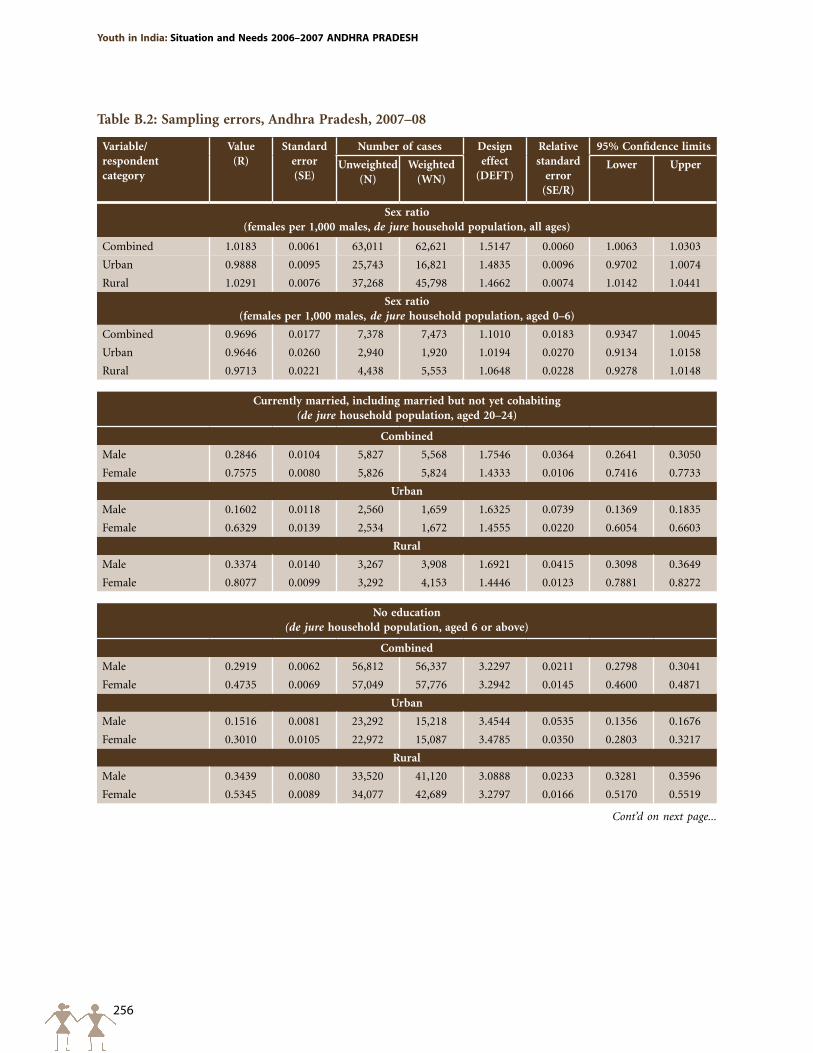
256
Youth in India: Situation and Needs 2006–2007 ANDHRA pRADESH
Table B.2: Sampling errors, Andhra Pradesh, 2007–08
Variable/ respondent category
Value (R)
Standard error (SE)
Number of cases Design effect
(DEFT)
Relative standard
error (SE/R)
95% Confidence limits
Unweighted(N)
Weighted(WN)
Lower Upper
Sex ratio (females per 1,000 males, de jure household population, all ages)
Combined 1.0183 0.0061 63,011 62,621 1.5147 0.0060 1.0063 1.0303
Urban 0.9888 0.0095 25,743 16,821 1.4835 0.0096 0.9702 1.0074
Rural 1.0291 0.0076 37,268 45,798 1.4662 0.0074 1.0142 1.0441
Sex ratio (females per 1,000 males, de jure household population, aged 0–6)
Combined 0.9696 0.0177 7,378 7,473 1.1010 0.0183 0.9347 1.0045
Urban 0.9646 0.0260 2,940 1,920 1.0194 0.0270 0.9134 1.0158
Rural 0.9713 0.0221 4,438 5,553 1.0648 0.0228 0.9278 1.0148
Currently married, including married but not yet cohabiting (de jure household population, aged 20–24)
Combined
Male 0.2846 0.0104 5,827 5,568 1.7546 0.0364 0.2641 0.3050
Female 0.7575 0.0080 5,826 5,824 1.4333 0.0106 0.7416 0.7733
Urban
Male 0.1602 0.0118 2,560 1,659 1.6325 0.0739 0.1369 0.1835
Female 0.6329 0.0139 2,534 1,672 1.4555 0.0220 0.6054 0.6603
Rural
Male 0.3374 0.0140 3,267 3,908 1.6921 0.0415 0.3098 0.3649
Female 0.8077 0.0099 3,292 4,153 1.4446 0.0123 0.7881 0.8272
No education (de jure household population, aged 6 or above)
Combined
Male 0.2919 0.0062 56,812 56,337 3.2297 0.0211 0.2798 0.3041
Female 0.4735 0.0069 57,049 57,776 3.2942 0.0145 0.4600 0.4871
Urban
Male 0.1516 0.0081 23,292 15,218 3.4544 0.0535 0.1356 0.1676
Female 0.3010 0.0105 22,972 15,087 3.4785 0.0350 0.2803 0.3217
Rural
Male 0.3439 0.0080 33,520 41,120 3.0888 0.0233 0.3281 0.3596
Female 0.5345 0.0089 34,077 42,689 3.2797 0.0166 0.5170 0.5519
Cont’d on next page...
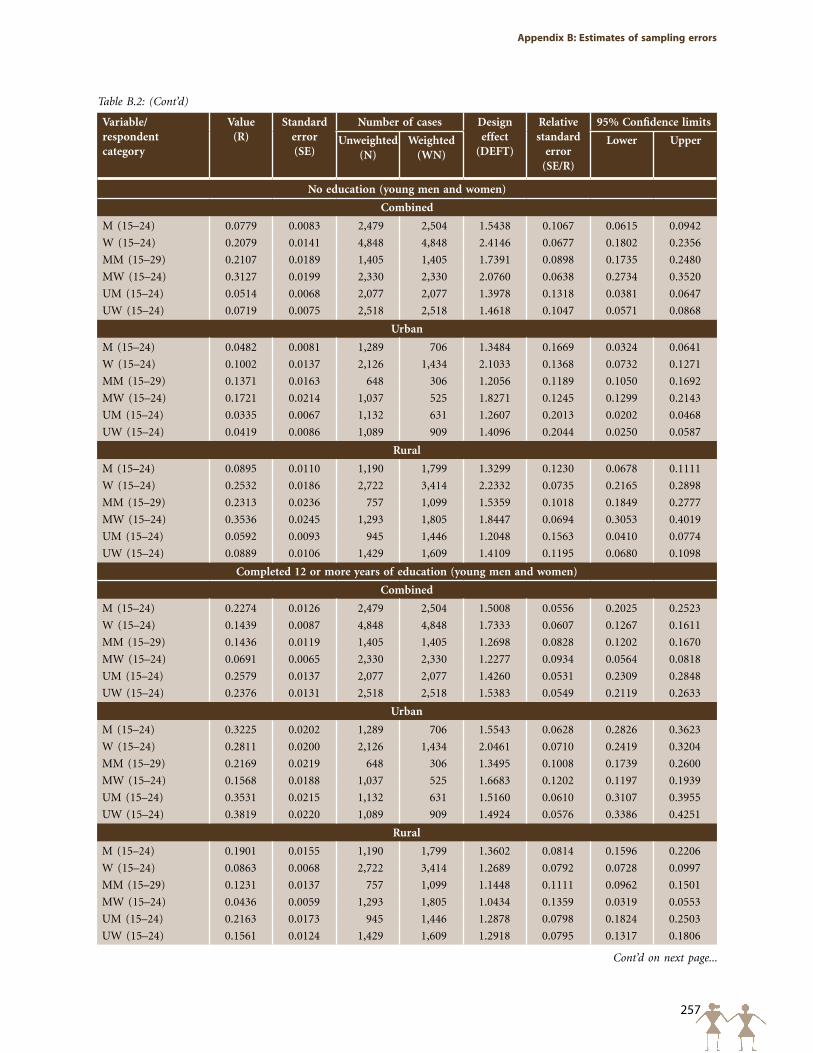
257
Appendix B: Estimates of sampling errors
Cont’d on next page...
Table B.2: (Cont’d)
Variable/ respondent category
Value (R)
Standard error (SE)
Number of cases Design effect
(DEFT)
Relative standard
error (SE/R)
95% Confidence limits
Unweighted(N)
Weighted(WN)
Lower Upper
No education (young men and women)
Combined
M (15–24) 0.0779 0.0083 2,479 2,504 1.5438 0.1067 0.0615 0.0942
W (15–24) 0.2079 0.0141 4,848 4,848 2.4146 0.0677 0.1802 0.2356
MM (15–29) 0.2107 0.0189 1,405 1,405 1.7391 0.0898 0.1735 0.2480
MW (15–24) 0.3127 0.0199 2,330 2,330 2.0760 0.0638 0.2734 0.3520
UM (15–24) 0.0514 0.0068 2,077 2,077 1.3978 0.1318 0.0381 0.0647
UW (15–24) 0.0719 0.0075 2,518 2,518 1.4618 0.1047 0.0571 0.0868
Urban
M (15–24) 0.0482 0.0081 1,289 706 1.3484 0.1669 0.0324 0.0641
W (15–24) 0.1002 0.0137 2,126 1,434 2.1033 0.1368 0.0732 0.1271
MM (15–29) 0.1371 0.0163 648 306 1.2056 0.1189 0.1050 0.1692
MW (15–24) 0.1721 0.0214 1,037 525 1.8271 0.1245 0.1299 0.2143
UM (15–24) 0.0335 0.0067 1,132 631 1.2607 0.2013 0.0202 0.0468
UW (15–24) 0.0419 0.0086 1,089 909 1.4096 0.2044 0.0250 0.0587
Rural
M (15–24) 0.0895 0.0110 1,190 1,799 1.3299 0.1230 0.0678 0.1111
W (15–24) 0.2532 0.0186 2,722 3,414 2.2332 0.0735 0.2165 0.2898
MM (15–29) 0.2313 0.0236 757 1,099 1.5359 0.1018 0.1849 0.2777
MW (15–24) 0.3536 0.0245 1,293 1,805 1.8447 0.0694 0.3053 0.4019
UM (15–24) 0.0592 0.0093 945 1,446 1.2048 0.1563 0.0410 0.0774
UW (15–24) 0.0889 0.0106 1,429 1,609 1.4109 0.1195 0.0680 0.1098
Completed 12 or more years of education (young men and women)
Combined
M (15–24) 0.2274 0.0126 2,479 2,504 1.5008 0.0556 0.2025 0.2523
W (15–24) 0.1439 0.0087 4,848 4,848 1.7333 0.0607 0.1267 0.1611
MM (15–29) 0.1436 0.0119 1,405 1,405 1.2698 0.0828 0.1202 0.1670
MW (15–24) 0.0691 0.0065 2,330 2,330 1.2277 0.0934 0.0564 0.0818
UM (15–24) 0.2579 0.0137 2,077 2,077 1.4260 0.0531 0.2309 0.2848
UW (15–24) 0.2376 0.0131 2,518 2,518 1.5383 0.0549 0.2119 0.2633
Urban
M (15–24) 0.3225 0.0202 1,289 706 1.5543 0.0628 0.2826 0.3623
W (15–24) 0.2811 0.0200 2,126 1,434 2.0461 0.0710 0.2419 0.3204
MM (15–29) 0.2169 0.0219 648 306 1.3495 0.1008 0.1739 0.2600
MW (15–24) 0.1568 0.0188 1,037 525 1.6683 0.1202 0.1197 0.1939
UM (15–24) 0.3531 0.0215 1,132 631 1.5160 0.0610 0.3107 0.3955
UW (15–24) 0.3819 0.0220 1,089 909 1.4924 0.0576 0.3386 0.4251
Rural
M (15–24) 0.1901 0.0155 1,190 1,799 1.3602 0.0814 0.1596 0.2206
W (15–24) 0.0863 0.0068 2,722 3,414 1.2689 0.0792 0.0728 0.0997
MM (15–29) 0.1231 0.0137 757 1,099 1.1448 0.1111 0.0962 0.1501
MW (15–24) 0.0436 0.0059 1,293 1,805 1.0434 0.1359 0.0319 0.0553
UM (15–24) 0.2163 0.0173 945 1,446 1.2878 0.0798 0.1824 0.2503
UW (15–24) 0.1561 0.0124 1,429 1,609 1.2918 0.0795 0.1317 0.1806
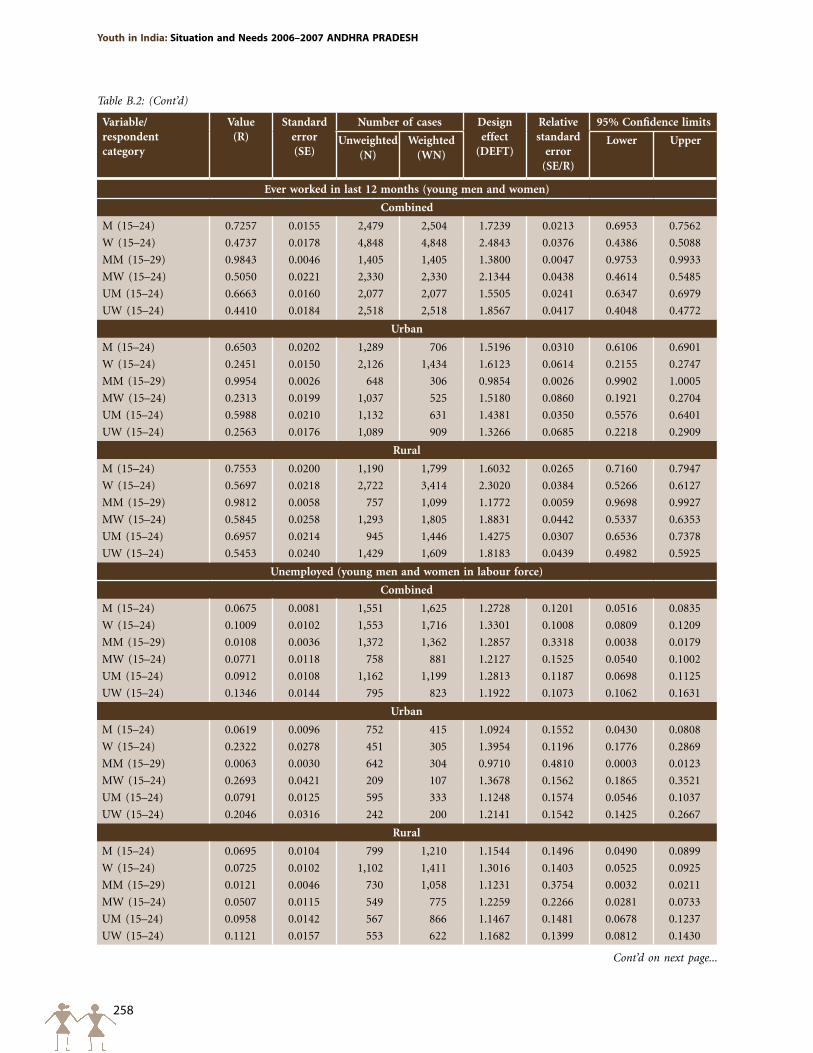
258
Youth in India: Situation and Needs 2006–2007 ANDHRA pRADESH
Cont’d on next page...
Table B.2: (Cont’d)
Variable/ respondent category
Value (R)
Standard error (SE)
Number of cases Design effect
(DEFT)
Relative standard
error (SE/R)
95% Confidence limits
Unweighted(N)
Weighted(WN)
Lower Upper
Ever worked in last 12 months (young men and women)
Combined
M (15–24) 0.7257 0.0155 2,479 2,504 1.7239 0.0213 0.6953 0.7562
W (15–24) 0.4737 0.0178 4,848 4,848 2.4843 0.0376 0.4386 0.5088
MM (15–29) 0.9843 0.0046 1,405 1,405 1.3800 0.0047 0.9753 0.9933
MW (15–24) 0.5050 0.0221 2,330 2,330 2.1344 0.0438 0.4614 0.5485
UM (15–24) 0.6663 0.0160 2,077 2,077 1.5505 0.0241 0.6347 0.6979
UW (15–24) 0.4410 0.0184 2,518 2,518 1.8567 0.0417 0.4048 0.4772
Urban
M (15–24) 0.6503 0.0202 1,289 706 1.5196 0.0310 0.6106 0.6901
W (15–24) 0.2451 0.0150 2,126 1,434 1.6123 0.0614 0.2155 0.2747
MM (15–29) 0.9954 0.0026 648 306 0.9854 0.0026 0.9902 1.0005
MW (15–24) 0.2313 0.0199 1,037 525 1.5180 0.0860 0.1921 0.2704
UM (15–24) 0.5988 0.0210 1,132 631 1.4381 0.0350 0.5576 0.6401
UW (15–24) 0.2563 0.0176 1,089 909 1.3266 0.0685 0.2218 0.2909
Rural
M (15–24) 0.7553 0.0200 1,190 1,799 1.6032 0.0265 0.7160 0.7947
W (15–24) 0.5697 0.0218 2,722 3,414 2.3020 0.0384 0.5266 0.6127
MM (15–29) 0.9812 0.0058 757 1,099 1.1772 0.0059 0.9698 0.9927
MW (15–24) 0.5845 0.0258 1,293 1,805 1.8831 0.0442 0.5337 0.6353
UM (15–24) 0.6957 0.0214 945 1,446 1.4275 0.0307 0.6536 0.7378
UW (15–24) 0.5453 0.0240 1,429 1,609 1.8183 0.0439 0.4982 0.5925
Unemployed (young men and women in labour force)
Combined
M (15–24) 0.0675 0.0081 1,551 1,625 1.2728 0.1201 0.0516 0.0835
W (15–24) 0.1009 0.0102 1,553 1,716 1.3301 0.1008 0.0809 0.1209
MM (15–29) 0.0108 0.0036 1,372 1,362 1.2857 0.3318 0.0038 0.0179
MW (15–24) 0.0771 0.0118 758 881 1.2127 0.1525 0.0540 0.1002
UM (15–24) 0.0912 0.0108 1,162 1,199 1.2813 0.1187 0.0698 0.1125
UW (15–24) 0.1346 0.0144 795 823 1.1922 0.1073 0.1062 0.1631
Urban
M (15–24) 0.0619 0.0096 752 415 1.0924 0.1552 0.0430 0.0808
W (15–24) 0.2322 0.0278 451 305 1.3954 0.1196 0.1776 0.2869
MM (15–29) 0.0063 0.0030 642 304 0.9710 0.4810 0.0003 0.0123
MW (15–24) 0.2693 0.0421 209 107 1.3678 0.1562 0.1865 0.3521
UM (15–24) 0.0791 0.0125 595 333 1.1248 0.1574 0.0546 0.1037
UW (15–24) 0.2046 0.0316 242 200 1.2141 0.1542 0.1425 0.2667
Rural
M (15–24) 0.0695 0.0104 799 1,210 1.1544 0.1496 0.0490 0.0899
W (15–24) 0.0725 0.0102 1,102 1,411 1.3016 0.1403 0.0525 0.0925
MM (15–29) 0.0121 0.0046 730 1,058 1.1231 0.3754 0.0032 0.0211
MW (15–24) 0.0507 0.0115 549 775 1.2259 0.2266 0.0281 0.0733
UM (15–24) 0.0958 0.0142 567 866 1.1467 0.1481 0.0678 0.1237
UW (15–24) 0.1121 0.0157 553 622 1.1682 0.1399 0.0812 0.1430
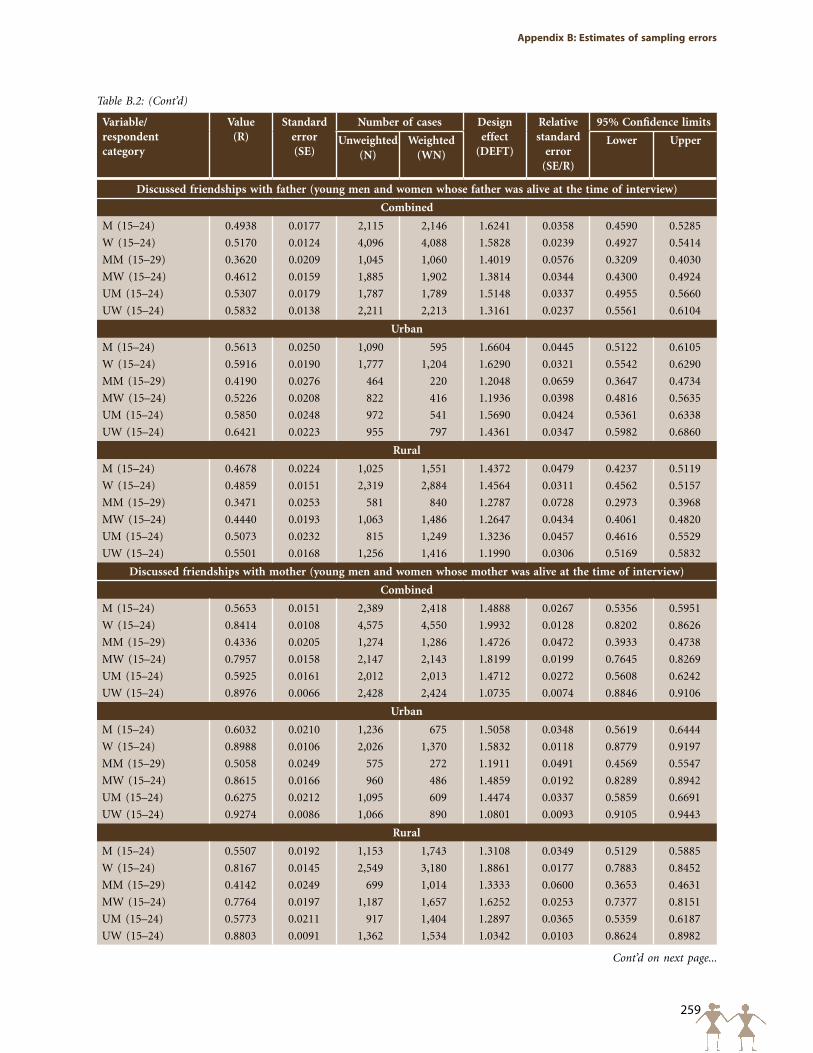
259
Appendix B: Estimates of sampling errors
Variable/ respondent category
Value (R)
Standard error (SE)
Number of cases Design effect
(DEFT)
Relative standard
error (SE/R)
95% Confidence limits
Unweighted(N)
Weighted(WN)
Lower Upper
Discussed friendships with father (young men and women whose father was alive at the time of interview)
Combined
M (15–24) 0.4938 0.0177 2,115 2,146 1.6241 0.0358 0.4590 0.5285
W (15–24) 0.5170 0.0124 4,096 4,088 1.5828 0.0239 0.4927 0.5414
MM (15–29) 0.3620 0.0209 1,045 1,060 1.4019 0.0576 0.3209 0.4030
MW (15–24) 0.4612 0.0159 1,885 1,902 1.3814 0.0344 0.4300 0.4924
UM (15–24) 0.5307 0.0179 1,787 1,789 1.5148 0.0337 0.4955 0.5660
UW (15–24) 0.5832 0.0138 2,211 2,213 1.3161 0.0237 0.5561 0.6104
Urban
M (15–24) 0.5613 0.0250 1,090 595 1.6604 0.0445 0.5122 0.6105
W (15–24) 0.5916 0.0190 1,777 1,204 1.6290 0.0321 0.5542 0.6290
MM (15–29) 0.4190 0.0276 464 220 1.2048 0.0659 0.3647 0.4734
MW (15–24) 0.5226 0.0208 822 416 1.1936 0.0398 0.4816 0.5635
UM (15–24) 0.5850 0.0248 972 541 1.5690 0.0424 0.5361 0.6338
UW (15–24) 0.6421 0.0223 955 797 1.4361 0.0347 0.5982 0.6860
Rural
M (15–24) 0.4678 0.0224 1,025 1,551 1.4372 0.0479 0.4237 0.5119
W (15–24) 0.4859 0.0151 2,319 2,884 1.4564 0.0311 0.4562 0.5157
MM (15–29) 0.3471 0.0253 581 840 1.2787 0.0728 0.2973 0.3968
MW (15–24) 0.4440 0.0193 1,063 1,486 1.2647 0.0434 0.4061 0.4820
UM (15–24) 0.5073 0.0232 815 1,249 1.3236 0.0457 0.4616 0.5529
UW (15–24) 0.5501 0.0168 1,256 1,416 1.1990 0.0306 0.5169 0.5832
Discussed friendships with mother (young men and women whose mother was alive at the time of interview)
Combined
M (15–24) 0.5653 0.0151 2,389 2,418 1.4888 0.0267 0.5356 0.5951
W (15–24) 0.8414 0.0108 4,575 4,550 1.9932 0.0128 0.8202 0.8626
MM (15–29) 0.4336 0.0205 1,274 1,286 1.4726 0.0472 0.3933 0.4738
MW (15–24) 0.7957 0.0158 2,147 2,143 1.8199 0.0199 0.7645 0.8269
UM (15–24) 0.5925 0.0161 2,012 2,013 1.4712 0.0272 0.5608 0.6242
UW (15–24) 0.8976 0.0066 2,428 2,424 1.0735 0.0074 0.8846 0.9106
Urban
M (15–24) 0.6032 0.0210 1,236 675 1.5058 0.0348 0.5619 0.6444
W (15–24) 0.8988 0.0106 2,026 1,370 1.5832 0.0118 0.8779 0.9197
MM (15–29) 0.5058 0.0249 575 272 1.1911 0.0491 0.4569 0.5547
MW (15–24) 0.8615 0.0166 960 486 1.4859 0.0192 0.8289 0.8942
UM (15–24) 0.6275 0.0212 1,095 609 1.4474 0.0337 0.5859 0.6691
UW (15–24) 0.9274 0.0086 1,066 890 1.0801 0.0093 0.9105 0.9443
Rural
M (15–24) 0.5507 0.0192 1,153 1,743 1.3108 0.0349 0.5129 0.5885
W (15–24) 0.8167 0.0145 2,549 3,180 1.8861 0.0177 0.7883 0.8452
MM (15–29) 0.4142 0.0249 699 1,014 1.3333 0.0600 0.3653 0.4631
MW (15–24) 0.7764 0.0197 1,187 1,657 1.6252 0.0253 0.7377 0.8151
UM (15–24) 0.5773 0.0211 917 1,404 1.2897 0.0365 0.5359 0.6187
UW (15–24) 0.8803 0.0091 1,362 1,534 1.0342 0.0103 0.8624 0.8982
Cont’d on next page...
Table B.2: (Cont’d)
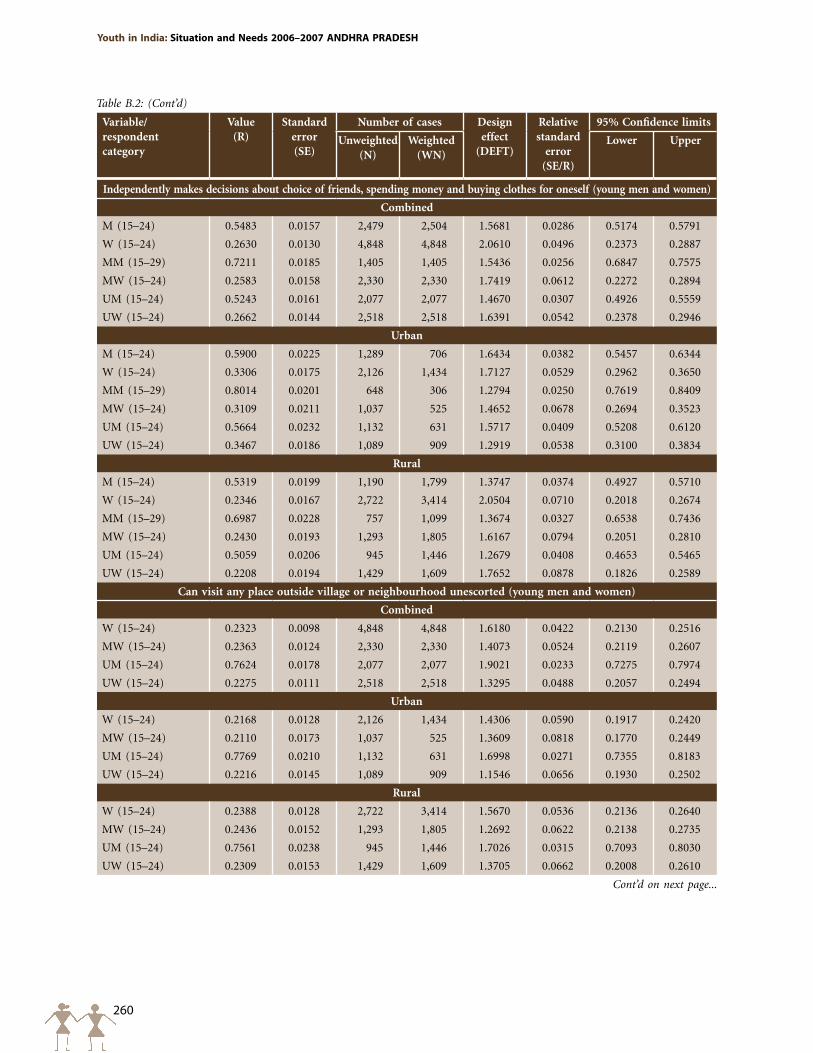
260
Youth in India: Situation and Needs 2006–2007 ANDHRA pRADESH
Variable/ respondent category
Value (R)
Standard error (SE)
Number of cases Design effect
(DEFT)
Relative standard
error (SE/R)
95% Confidence limits
Unweighted(N)
Weighted(WN)
Lower Upper
Independently makes decisions about choice of friends, spending money and buying clothes for oneself (young men and women)
Combined
M (15–24) 0.5483 0.0157 2,479 2,504 1.5681 0.0286 0.5174 0.5791
W (15–24) 0.2630 0.0130 4,848 4,848 2.0610 0.0496 0.2373 0.2887
MM (15–29) 0.7211 0.0185 1,405 1,405 1.5436 0.0256 0.6847 0.7575
MW (15–24) 0.2583 0.0158 2,330 2,330 1.7419 0.0612 0.2272 0.2894
UM (15–24) 0.5243 0.0161 2,077 2,077 1.4670 0.0307 0.4926 0.5559
UW (15–24) 0.2662 0.0144 2,518 2,518 1.6391 0.0542 0.2378 0.2946
Urban
M (15–24) 0.5900 0.0225 1,289 706 1.6434 0.0382 0.5457 0.6344
W (15–24) 0.3306 0.0175 2,126 1,434 1.7127 0.0529 0.2962 0.3650
MM (15–29) 0.8014 0.0201 648 306 1.2794 0.0250 0.7619 0.8409
MW (15–24) 0.3109 0.0211 1,037 525 1.4652 0.0678 0.2694 0.3523
UM (15–24) 0.5664 0.0232 1,132 631 1.5717 0.0409 0.5208 0.6120
UW (15–24) 0.3467 0.0186 1,089 909 1.2919 0.0538 0.3100 0.3834
Rural
M (15–24) 0.5319 0.0199 1,190 1,799 1.3747 0.0374 0.4927 0.5710
W (15–24) 0.2346 0.0167 2,722 3,414 2.0504 0.0710 0.2018 0.2674
MM (15–29) 0.6987 0.0228 757 1,099 1.3674 0.0327 0.6538 0.7436
MW (15–24) 0.2430 0.0193 1,293 1,805 1.6167 0.0794 0.2051 0.2810
UM (15–24) 0.5059 0.0206 945 1,446 1.2679 0.0408 0.4653 0.5465
UW (15–24) 0.2208 0.0194 1,429 1,609 1.7652 0.0878 0.1826 0.2589
Can visit any place outside village or neighbourhood unescorted (young men and women)
Combined
W (15–24) 0.2323 0.0098 4,848 4,848 1.6180 0.0422 0.2130 0.2516
MW (15–24) 0.2363 0.0124 2,330 2,330 1.4073 0.0524 0.2119 0.2607
UM (15–24) 0.7624 0.0178 2,077 2,077 1.9021 0.0233 0.7275 0.7974
UW (15–24) 0.2275 0.0111 2,518 2,518 1.3295 0.0488 0.2057 0.2494
Urban
W (15–24) 0.2168 0.0128 2,126 1,434 1.4306 0.0590 0.1917 0.2420
MW (15–24) 0.2110 0.0173 1,037 525 1.3609 0.0818 0.1770 0.2449
UM (15–24) 0.7769 0.0210 1,132 631 1.6998 0.0271 0.7355 0.8183
UW (15–24) 0.2216 0.0145 1,089 909 1.1546 0.0656 0.1930 0.2502
Rural
W (15–24) 0.2388 0.0128 2,722 3,414 1.5670 0.0536 0.2136 0.2640
MW (15–24) 0.2436 0.0152 1,293 1,805 1.2692 0.0622 0.2138 0.2735
UM (15–24) 0.7561 0.0238 945 1,446 1.7026 0.0315 0.7093 0.8030
UW (15–24) 0.2309 0.0153 1,429 1,609 1.3705 0.0662 0.2008 0.2610
Cont’d on next page...
Table B.2: (Cont’d)
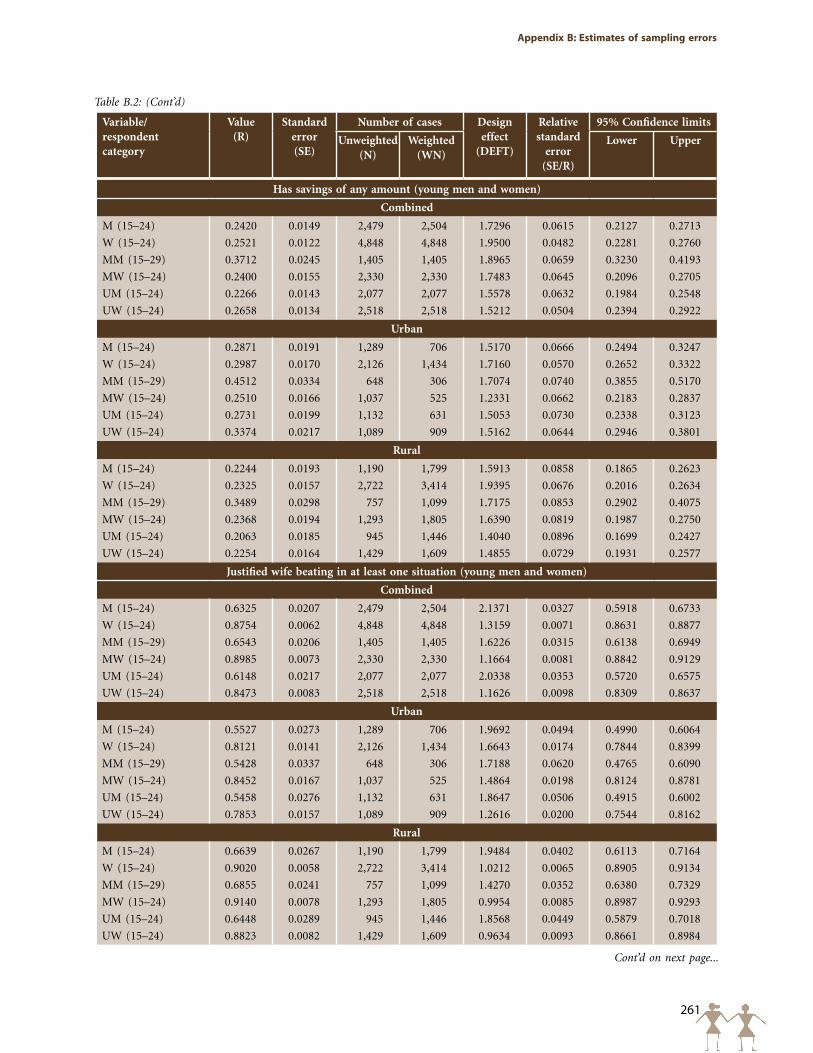
261
Appendix B: Estimates of sampling errors
Variable/ respondent category
Value (R)
Standard error (SE)
Number of cases Design effect
(DEFT)
Relative standard
error (SE/R)
95% Confidence limits
Unweighted(N)
Weighted(WN)
Lower Upper
Has savings of any amount (young men and women)
Combined
M (15–24) 0.2420 0.0149 2,479 2,504 1.7296 0.0615 0.2127 0.2713
W (15–24) 0.2521 0.0122 4,848 4,848 1.9500 0.0482 0.2281 0.2760
MM (15–29) 0.3712 0.0245 1,405 1,405 1.8965 0.0659 0.3230 0.4193
MW (15–24) 0.2400 0.0155 2,330 2,330 1.7483 0.0645 0.2096 0.2705
UM (15–24) 0.2266 0.0143 2,077 2,077 1.5578 0.0632 0.1984 0.2548
UW (15–24) 0.2658 0.0134 2,518 2,518 1.5212 0.0504 0.2394 0.2922
Urban
M (15–24) 0.2871 0.0191 1,289 706 1.5170 0.0666 0.2494 0.3247
W (15–24) 0.2987 0.0170 2,126 1,434 1.7160 0.0570 0.2652 0.3322
MM (15–29) 0.4512 0.0334 648 306 1.7074 0.0740 0.3855 0.5170
MW (15–24) 0.2510 0.0166 1,037 525 1.2331 0.0662 0.2183 0.2837
UM (15–24) 0.2731 0.0199 1,132 631 1.5053 0.0730 0.2338 0.3123
UW (15–24) 0.3374 0.0217 1,089 909 1.5162 0.0644 0.2946 0.3801
Rural
M (15–24) 0.2244 0.0193 1,190 1,799 1.5913 0.0858 0.1865 0.2623
W (15–24) 0.2325 0.0157 2,722 3,414 1.9395 0.0676 0.2016 0.2634
MM (15–29) 0.3489 0.0298 757 1,099 1.7175 0.0853 0.2902 0.4075
MW (15–24) 0.2368 0.0194 1,293 1,805 1.6390 0.0819 0.1987 0.2750
UM (15–24) 0.2063 0.0185 945 1,446 1.4040 0.0896 0.1699 0.2427
UW (15–24) 0.2254 0.0164 1,429 1,609 1.4855 0.0729 0.1931 0.2577
Justified wife beating in at least one situation (young men and women)
Combined
M (15–24) 0.6325 0.0207 2,479 2,504 2.1371 0.0327 0.5918 0.6733
W (15–24) 0.8754 0.0062 4,848 4,848 1.3159 0.0071 0.8631 0.8877
MM (15–29) 0.6543 0.0206 1,405 1,405 1.6226 0.0315 0.6138 0.6949
MW (15–24) 0.8985 0.0073 2,330 2,330 1.1664 0.0081 0.8842 0.9129
UM (15–24) 0.6148 0.0217 2,077 2,077 2.0338 0.0353 0.5720 0.6575
UW (15–24) 0.8473 0.0083 2,518 2,518 1.1626 0.0098 0.8309 0.8637
Urban
M (15–24) 0.5527 0.0273 1,289 706 1.9692 0.0494 0.4990 0.6064
W (15–24) 0.8121 0.0141 2,126 1,434 1.6643 0.0174 0.7844 0.8399
MM (15–29) 0.5428 0.0337 648 306 1.7188 0.0620 0.4765 0.6090
MW (15–24) 0.8452 0.0167 1,037 525 1.4864 0.0198 0.8124 0.8781
UM (15–24) 0.5458 0.0276 1,132 631 1.8647 0.0506 0.4915 0.6002
UW (15–24) 0.7853 0.0157 1,089 909 1.2616 0.0200 0.7544 0.8162
Rural
M (15–24) 0.6639 0.0267 1,190 1,799 1.9484 0.0402 0.6113 0.7164
W (15–24) 0.9020 0.0058 2,722 3,414 1.0212 0.0065 0.8905 0.9134
MM (15–29) 0.6855 0.0241 757 1,099 1.4270 0.0352 0.6380 0.7329
MW (15–24) 0.9140 0.0078 1,293 1,805 0.9954 0.0085 0.8987 0.9293
UM (15–24) 0.6448 0.0289 945 1,446 1.8568 0.0449 0.5879 0.7018
UW (15–24) 0.8823 0.0082 1,429 1,609 0.9634 0.0093 0.8661 0.8984
Cont’d on next page...
Table B.2: (Cont’d)
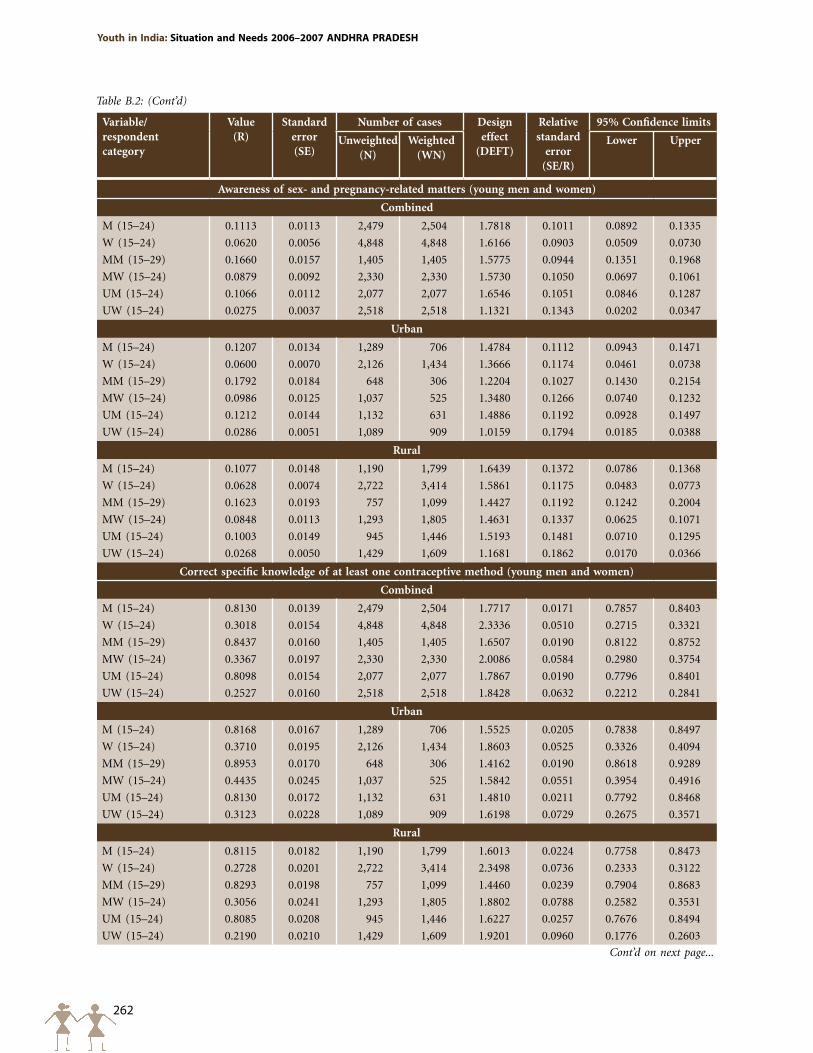
262
Youth in India: Situation and Needs 2006–2007 ANDHRA pRADESH
Variable/ respondent category
Value (R)
Standard error (SE)
Number of cases Design effect
(DEFT)
Relative standard
error (SE/R)
95% Confidence limits
Unweighted(N)
Weighted(WN)
Lower Upper
Awareness of sex- and pregnancy-related matters (young men and women)
Combined
M (15–24) 0.1113 0.0113 2,479 2,504 1.7818 0.1011 0.0892 0.1335
W (15–24) 0.0620 0.0056 4,848 4,848 1.6166 0.0903 0.0509 0.0730
MM (15–29) 0.1660 0.0157 1,405 1,405 1.5775 0.0944 0.1351 0.1968
MW (15–24) 0.0879 0.0092 2,330 2,330 1.5730 0.1050 0.0697 0.1061
UM (15–24) 0.1066 0.0112 2,077 2,077 1.6546 0.1051 0.0846 0.1287
UW (15–24) 0.0275 0.0037 2,518 2,518 1.1321 0.1343 0.0202 0.0347
Urban
M (15–24) 0.1207 0.0134 1,289 706 1.4784 0.1112 0.0943 0.1471
W (15–24) 0.0600 0.0070 2,126 1,434 1.3666 0.1174 0.0461 0.0738
MM (15–29) 0.1792 0.0184 648 306 1.2204 0.1027 0.1430 0.2154
MW (15–24) 0.0986 0.0125 1,037 525 1.3480 0.1266 0.0740 0.1232
UM (15–24) 0.1212 0.0144 1,132 631 1.4886 0.1192 0.0928 0.1497
UW (15–24) 0.0286 0.0051 1,089 909 1.0159 0.1794 0.0185 0.0388
Rural
M (15–24) 0.1077 0.0148 1,190 1,799 1.6439 0.1372 0.0786 0.1368
W (15–24) 0.0628 0.0074 2,722 3,414 1.5861 0.1175 0.0483 0.0773
MM (15–29) 0.1623 0.0193 757 1,099 1.4427 0.1192 0.1242 0.2004
MW (15–24) 0.0848 0.0113 1,293 1,805 1.4631 0.1337 0.0625 0.1071
UM (15–24) 0.1003 0.0149 945 1,446 1.5193 0.1481 0.0710 0.1295
UW (15–24) 0.0268 0.0050 1,429 1,609 1.1681 0.1862 0.0170 0.0366
Correct specific knowledge of at least one contraceptive method (young men and women)
Combined
M (15–24) 0.8130 0.0139 2,479 2,504 1.7717 0.0171 0.7857 0.8403
W (15–24) 0.3018 0.0154 4,848 4,848 2.3336 0.0510 0.2715 0.3321
MM (15–29) 0.8437 0.0160 1,405 1,405 1.6507 0.0190 0.8122 0.8752
MW (15–24) 0.3367 0.0197 2,330 2,330 2.0086 0.0584 0.2980 0.3754
UM (15–24) 0.8098 0.0154 2,077 2,077 1.7867 0.0190 0.7796 0.8401
UW (15–24) 0.2527 0.0160 2,518 2,518 1.8428 0.0632 0.2212 0.2841
Urban
M (15–24) 0.8168 0.0167 1,289 706 1.5525 0.0205 0.7838 0.8497
W (15–24) 0.3710 0.0195 2,126 1,434 1.8603 0.0525 0.3326 0.4094
MM (15–29) 0.8953 0.0170 648 306 1.4162 0.0190 0.8618 0.9289
MW (15–24) 0.4435 0.0245 1,037 525 1.5842 0.0551 0.3954 0.4916
UM (15–24) 0.8130 0.0172 1,132 631 1.4810 0.0211 0.7792 0.8468
UW (15–24) 0.3123 0.0228 1,089 909 1.6198 0.0729 0.2675 0.3571
Rural
M (15–24) 0.8115 0.0182 1,190 1,799 1.6013 0.0224 0.7758 0.8473
W (15–24) 0.2728 0.0201 2,722 3,414 2.3498 0.0736 0.2333 0.3122
MM (15–29) 0.8293 0.0198 757 1,099 1.4460 0.0239 0.7904 0.8683
MW (15–24) 0.3056 0.0241 1,293 1,805 1.8802 0.0788 0.2582 0.3531
UM (15–24) 0.8085 0.0208 945 1,446 1.6227 0.0257 0.7676 0.8494
UW (15–24) 0.2190 0.0210 1,429 1,609 1.9201 0.0960 0.1776 0.2603
Cont’d on next page...
Table B.2: (Cont’d)
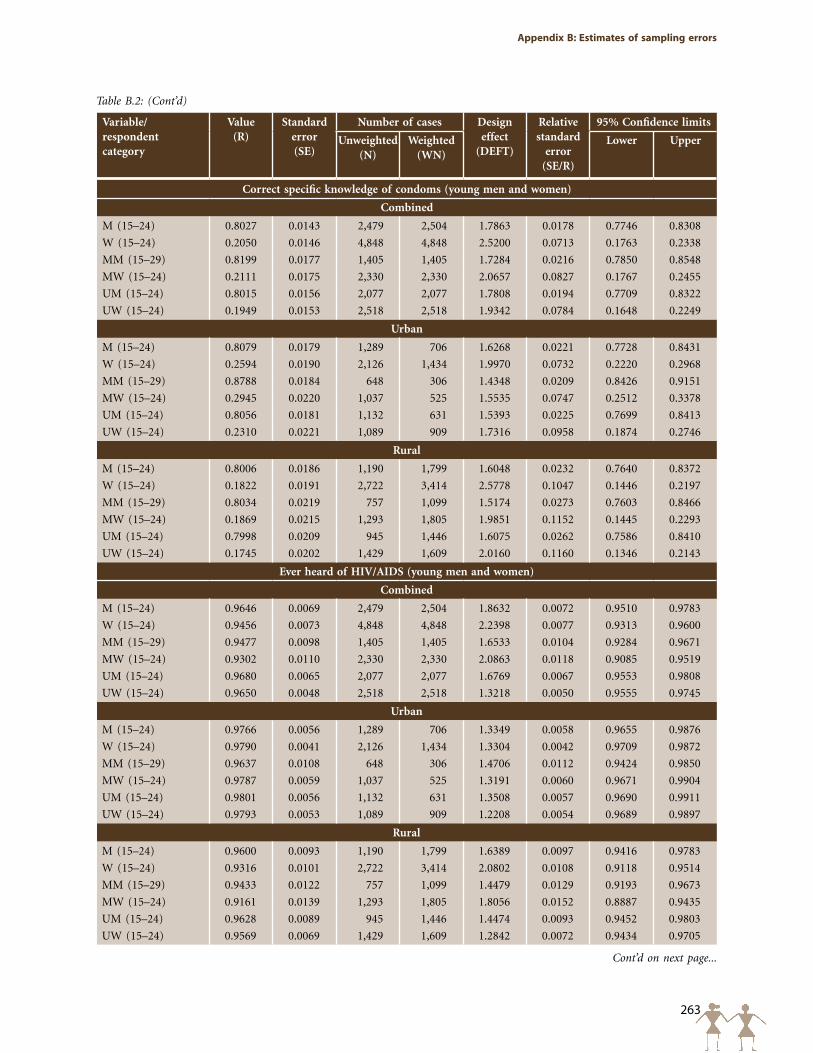
263
Appendix B: Estimates of sampling errors
Variable/ respondent category
Value (R)
Standard error (SE)
Number of cases Design effect
(DEFT)
Relative standard
error (SE/R)
95% Confidence limits
Unweighted(N)
Weighted(WN)
Lower Upper
Correct specific knowledge of condoms (young men and women)
Combined
M (15–24) 0.8027 0.0143 2,479 2,504 1.7863 0.0178 0.7746 0.8308
W (15–24) 0.2050 0.0146 4,848 4,848 2.5200 0.0713 0.1763 0.2338
MM (15–29) 0.8199 0.0177 1,405 1,405 1.7284 0.0216 0.7850 0.8548
MW (15–24) 0.2111 0.0175 2,330 2,330 2.0657 0.0827 0.1767 0.2455
UM (15–24) 0.8015 0.0156 2,077 2,077 1.7808 0.0194 0.7709 0.8322
UW (15–24) 0.1949 0.0153 2,518 2,518 1.9342 0.0784 0.1648 0.2249
Urban
M (15–24) 0.8079 0.0179 1,289 706 1.6268 0.0221 0.7728 0.8431
W (15–24) 0.2594 0.0190 2,126 1,434 1.9970 0.0732 0.2220 0.2968
MM (15–29) 0.8788 0.0184 648 306 1.4348 0.0209 0.8426 0.9151
MW (15–24) 0.2945 0.0220 1,037 525 1.5535 0.0747 0.2512 0.3378
UM (15–24) 0.8056 0.0181 1,132 631 1.5393 0.0225 0.7699 0.8413
UW (15–24) 0.2310 0.0221 1,089 909 1.7316 0.0958 0.1874 0.2746
Rural
M (15–24) 0.8006 0.0186 1,190 1,799 1.6048 0.0232 0.7640 0.8372
W (15–24) 0.1822 0.0191 2,722 3,414 2.5778 0.1047 0.1446 0.2197
MM (15–29) 0.8034 0.0219 757 1,099 1.5174 0.0273 0.7603 0.8466
MW (15–24) 0.1869 0.0215 1,293 1,805 1.9851 0.1152 0.1445 0.2293
UM (15–24) 0.7998 0.0209 945 1,446 1.6075 0.0262 0.7586 0.8410
UW (15–24) 0.1745 0.0202 1,429 1,609 2.0160 0.1160 0.1346 0.2143
Ever heard of HIV/AIDS (young men and women)
Combined
M (15–24) 0.9646 0.0069 2,479 2,504 1.8632 0.0072 0.9510 0.9783
W (15–24) 0.9456 0.0073 4,848 4,848 2.2398 0.0077 0.9313 0.9600
MM (15–29) 0.9477 0.0098 1,405 1,405 1.6533 0.0104 0.9284 0.9671
MW (15–24) 0.9302 0.0110 2,330 2,330 2.0863 0.0118 0.9085 0.9519
UM (15–24) 0.9680 0.0065 2,077 2,077 1.6769 0.0067 0.9553 0.9808
UW (15–24) 0.9650 0.0048 2,518 2,518 1.3218 0.0050 0.9555 0.9745
Urban
M (15–24) 0.9766 0.0056 1,289 706 1.3349 0.0058 0.9655 0.9876
W (15–24) 0.9790 0.0041 2,126 1,434 1.3304 0.0042 0.9709 0.9872
MM (15–29) 0.9637 0.0108 648 306 1.4706 0.0112 0.9424 0.9850
MW (15–24) 0.9787 0.0059 1,037 525 1.3191 0.0060 0.9671 0.9904
UM (15–24) 0.9801 0.0056 1,132 631 1.3508 0.0057 0.9690 0.9911
UW (15–24) 0.9793 0.0053 1,089 909 1.2208 0.0054 0.9689 0.9897
Rural
M (15–24) 0.9600 0.0093 1,190 1,799 1.6389 0.0097 0.9416 0.9783
W (15–24) 0.9316 0.0101 2,722 3,414 2.0802 0.0108 0.9118 0.9514
MM (15–29) 0.9433 0.0122 757 1,099 1.4479 0.0129 0.9193 0.9673
MW (15–24) 0.9161 0.0139 1,293 1,805 1.8056 0.0152 0.8887 0.9435
UM (15–24) 0.9628 0.0089 945 1,446 1.4474 0.0093 0.9452 0.9803
UW (15–24) 0.9569 0.0069 1,429 1,609 1.2842 0.0072 0.9434 0.9705
Cont’d on next page...
Table B.2: (Cont’d)
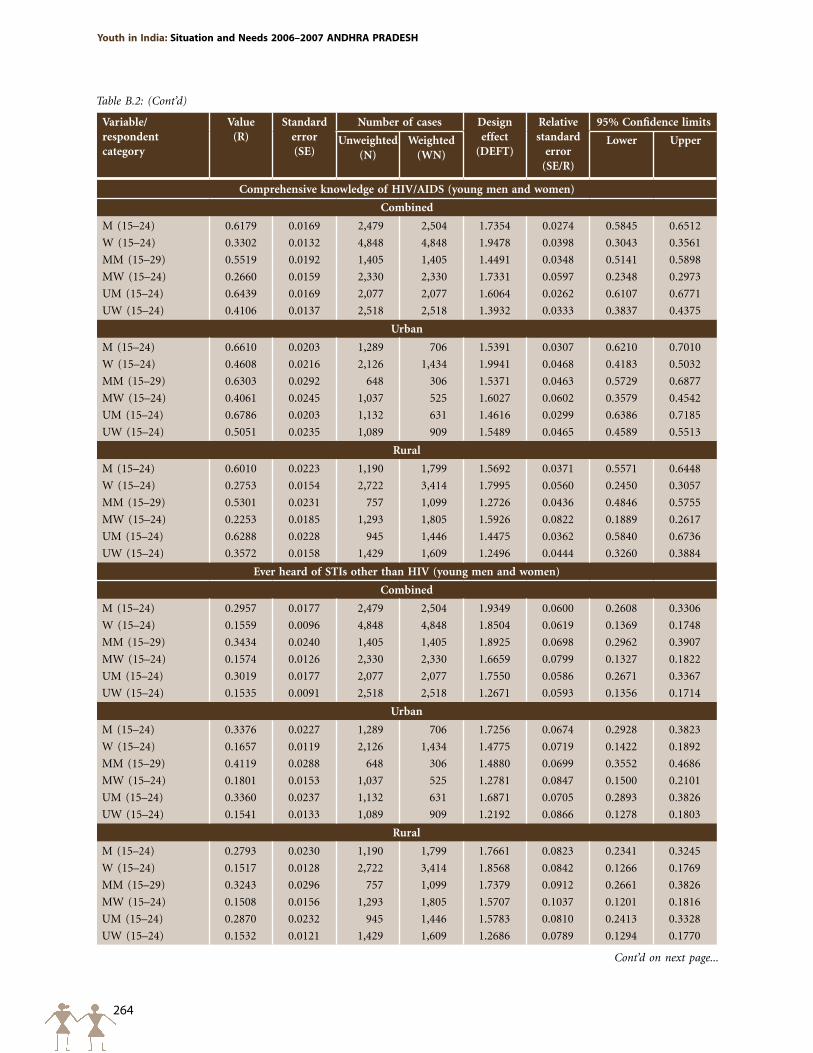
264
Youth in India: Situation and Needs 2006–2007 ANDHRA pRADESH
Variable/ respondent category
Value (R)
Standard error (SE)
Number of cases Design effect
(DEFT)
Relative standard
error (SE/R)
95% Confidence limits
Unweighted(N)
Weighted(WN)
Lower Upper
Comprehensive knowledge of HIV/AIDS (young men and women)
Combined
M (15–24) 0.6179 0.0169 2,479 2,504 1.7354 0.0274 0.5845 0.6512
W (15–24) 0.3302 0.0132 4,848 4,848 1.9478 0.0398 0.3043 0.3561
MM (15–29) 0.5519 0.0192 1,405 1,405 1.4491 0.0348 0.5141 0.5898
MW (15–24) 0.2660 0.0159 2,330 2,330 1.7331 0.0597 0.2348 0.2973
UM (15–24) 0.6439 0.0169 2,077 2,077 1.6064 0.0262 0.6107 0.6771
UW (15–24) 0.4106 0.0137 2,518 2,518 1.3932 0.0333 0.3837 0.4375
Urban
M (15–24) 0.6610 0.0203 1,289 706 1.5391 0.0307 0.6210 0.7010
W (15–24) 0.4608 0.0216 2,126 1,434 1.9941 0.0468 0.4183 0.5032
MM (15–29) 0.6303 0.0292 648 306 1.5371 0.0463 0.5729 0.6877
MW (15–24) 0.4061 0.0245 1,037 525 1.6027 0.0602 0.3579 0.4542
UM (15–24) 0.6786 0.0203 1,132 631 1.4616 0.0299 0.6386 0.7185
UW (15–24) 0.5051 0.0235 1,089 909 1.5489 0.0465 0.4589 0.5513
Rural
M (15–24) 0.6010 0.0223 1,190 1,799 1.5692 0.0371 0.5571 0.6448
W (15–24) 0.2753 0.0154 2,722 3,414 1.7995 0.0560 0.2450 0.3057
MM (15–29) 0.5301 0.0231 757 1,099 1.2726 0.0436 0.4846 0.5755
MW (15–24) 0.2253 0.0185 1,293 1,805 1.5926 0.0822 0.1889 0.2617
UM (15–24) 0.6288 0.0228 945 1,446 1.4475 0.0362 0.5840 0.6736
UW (15–24) 0.3572 0.0158 1,429 1,609 1.2496 0.0444 0.3260 0.3884
Ever heard of STIs other than HIV (young men and women)
Combined
M (15–24) 0.2957 0.0177 2,479 2,504 1.9349 0.0600 0.2608 0.3306
W (15–24) 0.1559 0.0096 4,848 4,848 1.8504 0.0619 0.1369 0.1748
MM (15–29) 0.3434 0.0240 1,405 1,405 1.8925 0.0698 0.2962 0.3907
MW (15–24) 0.1574 0.0126 2,330 2,330 1.6659 0.0799 0.1327 0.1822
UM (15–24) 0.3019 0.0177 2,077 2,077 1.7550 0.0586 0.2671 0.3367
UW (15–24) 0.1535 0.0091 2,518 2,518 1.2671 0.0593 0.1356 0.1714
Urban
M (15–24) 0.3376 0.0227 1,289 706 1.7256 0.0674 0.2928 0.3823
W (15–24) 0.1657 0.0119 2,126 1,434 1.4775 0.0719 0.1422 0.1892
MM (15–29) 0.4119 0.0288 648 306 1.4880 0.0699 0.3552 0.4686
MW (15–24) 0.1801 0.0153 1,037 525 1.2781 0.0847 0.1500 0.2101
UM (15–24) 0.3360 0.0237 1,132 631 1.6871 0.0705 0.2893 0.3826
UW (15–24) 0.1541 0.0133 1,089 909 1.2192 0.0866 0.1278 0.1803
Rural
M (15–24) 0.2793 0.0230 1,190 1,799 1.7661 0.0823 0.2341 0.3245
W (15–24) 0.1517 0.0128 2,722 3,414 1.8568 0.0842 0.1266 0.1769
MM (15–29) 0.3243 0.0296 757 1,099 1.7379 0.0912 0.2661 0.3826
MW (15–24) 0.1508 0.0156 1,293 1,805 1.5707 0.1037 0.1201 0.1816
UM (15–24) 0.2870 0.0232 945 1,446 1.5783 0.0810 0.2413 0.3328
UW (15–24) 0.1532 0.0121 1,429 1,609 1.2686 0.0789 0.1294 0.1770
Cont’d on next page...
Table B.2: (Cont’d)
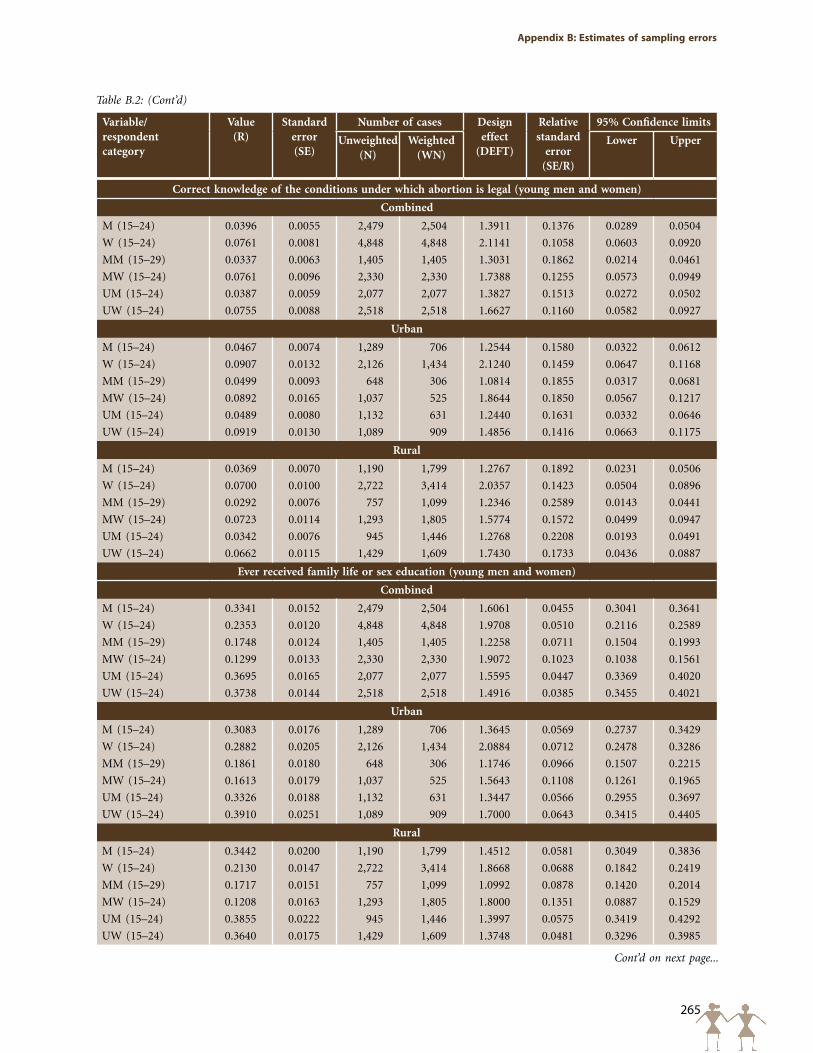
265
Appendix B: Estimates of sampling errors
Variable/ respondent category
Value (R)
Standard error (SE)
Number of cases Design effect
(DEFT)
Relative standard
error (SE/R)
95% Confidence limits
Unweighted(N)
Weighted(WN)
Lower Upper
Correct knowledge of the conditions under which abortion is legal (young men and women)
Combined
M (15–24) 0.0396 0.0055 2,479 2,504 1.3911 0.1376 0.0289 0.0504
W (15–24) 0.0761 0.0081 4,848 4,848 2.1141 0.1058 0.0603 0.0920
MM (15–29) 0.0337 0.0063 1,405 1,405 1.3031 0.1862 0.0214 0.0461
MW (15–24) 0.0761 0.0096 2,330 2,330 1.7388 0.1255 0.0573 0.0949
UM (15–24) 0.0387 0.0059 2,077 2,077 1.3827 0.1513 0.0272 0.0502
UW (15–24) 0.0755 0.0088 2,518 2,518 1.6627 0.1160 0.0582 0.0927
Urban
M (15–24) 0.0467 0.0074 1,289 706 1.2544 0.1580 0.0322 0.0612
W (15–24) 0.0907 0.0132 2,126 1,434 2.1240 0.1459 0.0647 0.1168
MM (15–29) 0.0499 0.0093 648 306 1.0814 0.1855 0.0317 0.0681
MW (15–24) 0.0892 0.0165 1,037 525 1.8644 0.1850 0.0567 0.1217
UM (15–24) 0.0489 0.0080 1,132 631 1.2440 0.1631 0.0332 0.0646
UW (15–24) 0.0919 0.0130 1,089 909 1.4856 0.1416 0.0663 0.1175
Rural
M (15–24) 0.0369 0.0070 1,190 1,799 1.2767 0.1892 0.0231 0.0506
W (15–24) 0.0700 0.0100 2,722 3,414 2.0357 0.1423 0.0504 0.0896
MM (15–29) 0.0292 0.0076 757 1,099 1.2346 0.2589 0.0143 0.0441
MW (15–24) 0.0723 0.0114 1,293 1,805 1.5774 0.1572 0.0499 0.0947
UM (15–24) 0.0342 0.0076 945 1,446 1.2768 0.2208 0.0193 0.0491
UW (15–24) 0.0662 0.0115 1,429 1,609 1.7430 0.1733 0.0436 0.0887
Ever received family life or sex education (young men and women)
Combined
M (15–24) 0.3341 0.0152 2,479 2,504 1.6061 0.0455 0.3041 0.3641
W (15–24) 0.2353 0.0120 4,848 4,848 1.9708 0.0510 0.2116 0.2589
MM (15–29) 0.1748 0.0124 1,405 1,405 1.2258 0.0711 0.1504 0.1993
MW (15–24) 0.1299 0.0133 2,330 2,330 1.9072 0.1023 0.1038 0.1561
UM (15–24) 0.3695 0.0165 2,077 2,077 1.5595 0.0447 0.3369 0.4020
UW (15–24) 0.3738 0.0144 2,518 2,518 1.4916 0.0385 0.3455 0.4021
Urban
M (15–24) 0.3083 0.0176 1,289 706 1.3645 0.0569 0.2737 0.3429
W (15–24) 0.2882 0.0205 2,126 1,434 2.0884 0.0712 0.2478 0.3286
MM (15–29) 0.1861 0.0180 648 306 1.1746 0.0966 0.1507 0.2215
MW (15–24) 0.1613 0.0179 1,037 525 1.5643 0.1108 0.1261 0.1965
UM (15–24) 0.3326 0.0188 1,132 631 1.3447 0.0566 0.2955 0.3697
UW (15–24) 0.3910 0.0251 1,089 909 1.7000 0.0643 0.3415 0.4405
Rural
M (15–24) 0.3442 0.0200 1,190 1,799 1.4512 0.0581 0.3049 0.3836
W (15–24) 0.2130 0.0147 2,722 3,414 1.8668 0.0688 0.1842 0.2419
MM (15–29) 0.1717 0.0151 757 1,099 1.0992 0.0878 0.1420 0.2014
MW (15–24) 0.1208 0.0163 1,293 1,805 1.8000 0.1351 0.0887 0.1529
UM (15–24) 0.3855 0.0222 945 1,446 1.3997 0.0575 0.3419 0.4292
UW (15–24) 0.3640 0.0175 1,429 1,609 1.3748 0.0481 0.3296 0.3985
Cont’d on next page...
Table B.2: (Cont’d)

266
Youth in India: Situation and Needs 2006–2007 ANDHRA pRADESH
Variable/ respondent category
Value (R)
Standard error (SE)
Number of cases Design effect
(DEFT)
Relative standard
error (SE/R)
95% Confidence limits
Unweighted(N)
Weighted(WN)
Lower Upper
Ever had an opposite-sex romantic partner (young men and women)
Combined
M (15–24) 0.1738 0.0119 2,479 2,504 1.5672 0.0687 0.1503 0.1972
W (15–24) 0.1047 0.0069 4,848 4,848 1.5616 0.0656 0.0912 0.1182
MM (15–29) 0.2051 0.0147 1,405 1,405 1.3661 0.0718 0.1761 0.2341
MW (15–24) 0.1073 0.0093 2,330 2,330 1.4565 0.0870 0.0889 0.1257
UM (15–24) 0.1629 0.0116 2,077 2,077 1.4320 0.0713 0.1400 0.1857
UW (15–24) 0.1007 0.0068 2,518 2,518 1.1335 0.0675 0.0873 0.1141
Urban
M (15–24) 0.1703 0.0115 1,289 706 1.0998 0.0676 0.1476 0.1930
W (15–24) 0.1245 0.0102 2,126 1,434 1.4293 0.0822 0.1044 0.1447
MM (15–29) 0.2311 0.0214 648 306 1.2934 0.0927 0.1889 0.2733
MW (15–24) 0.1505 0.0154 1,037 525 1.3820 0.1020 0.1203 0.1808
UM (15–24) 0.1504 0.0104 1,132 631 0.9746 0.0689 0.1300 0.1708
UW (15–24) 0.1034 0.0096 1,089 909 1.0347 0.0924 0.0846 0.1222
Rural
M (15–24) 0.1751 0.0160 1,190 1,799 1.4499 0.0913 0.1436 0.2066
W (15–24) 0.0964 0.0087 2,722 3,414 1.5392 0.0903 0.0793 0.1136
MM (15–29) 0.1979 0.0178 757 1,099 1.2313 0.0902 0.1627 0.2330
MW (15–24) 0.0947 0.0110 1,293 1,805 1.3557 0.1166 0.0730 0.1165
UM (15–24) 0.1683 0.0160 945 1,446 1.3174 0.0953 0.1367 0.1999
UW (15–24) 0.0991 0.0092 1,429 1,609 1.1591 0.0925 0.0811 0.1172
Ever had sex with an opposite-sex romantic partner (young men and women)
Combined
M (15–24) 0.0797 0.0083 2,479 2,504 1.5247 0.1041 0.0634 0.0960
W (15–24) 0.0470 0.0040 4,848 4,848 1.3161 0.0851 0.0391 0.0549
MM (15–29) 0.1293 0.0123 1,405 1,405 1.3722 0.0950 0.1051 0.1535
MW (15–24) 0.0517 0.0056 2,330 2,330 1.2105 0.1074 0.0408 0.0626
UM (15–24) 0.0672 0.0073 2,077 2,077 1.3311 0.1088 0.0528 0.0816
UW (15–24) 0.0409 0.0043 2,518 2,518 1.0833 0.1046 0.0325 0.0493
Urban
M (15–24) 0.0572 0.0082 1,289 706 1.2689 0.1435 0.0411 0.0734
W (15–24) 0.0474 0.0056 2,126 1,434 1.2148 0.1181 0.0364 0.0584
MM (15–29) 0.0993 0.0164 648 306 1.3957 0.1652 0.0670 0.1317
MW (15–24) 0.0636 0.0093 1,037 525 1.2240 0.1459 0.0454 0.0819
UM (15–24) 0.0468 0.0063 1,132 631 1.0099 0.1355 0.0343 0.0593
UW (15–24) 0.0343 0.0057 1,089 909 1.0273 0.1653 0.0231 0.0454
Rural
M (15–24) 0.0885 0.0111 1,190 1,799 1.3446 0.1251 0.0667 0.1103
W (15–24) 0.0468 0.0052 2,722 3,414 1.2767 0.1104 0.0367 0.0570
MM (15–29) 0.1377 0.0150 757 1,099 1.1969 0.1089 0.1082 0.1672
MW (15–24) 0.0482 0.0066 1,293 1,805 1.1080 0.1369 0.0352 0.0612
UM (15–24) 0.0761 0.0102 945 1,446 1.1792 0.1337 0.0560 0.0961
UW (15–24) 0.0446 0.0059 1,429 1,609 1.0719 0.1313 0.0331 0.0561
Cont’d on next page...
Table B.2: (Cont’d)
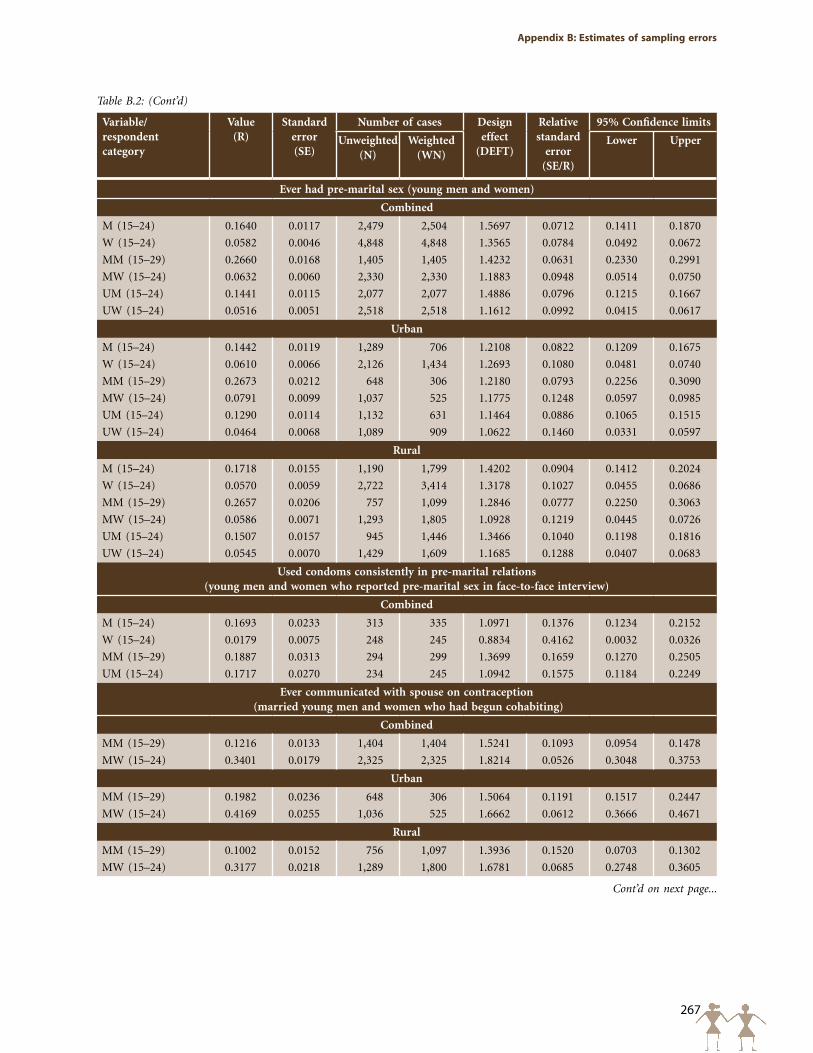
267
Appendix B: Estimates of sampling errors
Variable/ respondent category
Value (R)
Standard error (SE)
Number of cases Design effect
(DEFT)
Relative standard
error (SE/R)
95% Confidence limits
Unweighted(N)
Weighted(WN)
Lower Upper
Ever had pre-marital sex (young men and women)
Combined
M (15–24) 0.1640 0.0117 2,479 2,504 1.5697 0.0712 0.1411 0.1870
W (15–24) 0.0582 0.0046 4,848 4,848 1.3565 0.0784 0.0492 0.0672
MM (15–29) 0.2660 0.0168 1,405 1,405 1.4232 0.0631 0.2330 0.2991
MW (15–24) 0.0632 0.0060 2,330 2,330 1.1883 0.0948 0.0514 0.0750
UM (15–24) 0.1441 0.0115 2,077 2,077 1.4886 0.0796 0.1215 0.1667
UW (15–24) 0.0516 0.0051 2,518 2,518 1.1612 0.0992 0.0415 0.0617
Urban
M (15–24) 0.1442 0.0119 1,289 706 1.2108 0.0822 0.1209 0.1675
W (15–24) 0.0610 0.0066 2,126 1,434 1.2693 0.1080 0.0481 0.0740
MM (15–29) 0.2673 0.0212 648 306 1.2180 0.0793 0.2256 0.3090
MW (15–24) 0.0791 0.0099 1,037 525 1.1775 0.1248 0.0597 0.0985
UM (15–24) 0.1290 0.0114 1,132 631 1.1464 0.0886 0.1065 0.1515
UW (15–24) 0.0464 0.0068 1,089 909 1.0622 0.1460 0.0331 0.0597
Rural
M (15–24) 0.1718 0.0155 1,190 1,799 1.4202 0.0904 0.1412 0.2024
W (15–24) 0.0570 0.0059 2,722 3,414 1.3178 0.1027 0.0455 0.0686
MM (15–29) 0.2657 0.0206 757 1,099 1.2846 0.0777 0.2250 0.3063
MW (15–24) 0.0586 0.0071 1,293 1,805 1.0928 0.1219 0.0445 0.0726
UM (15–24) 0.1507 0.0157 945 1,446 1.3466 0.1040 0.1198 0.1816
UW (15–24) 0.0545 0.0070 1,429 1,609 1.1685 0.1288 0.0407 0.0683
Used condoms consistently in pre-marital relations(young men and women who reported pre-marital sex in face-to-face interview)
Combined
M (15–24) 0.1693 0.0233 313 335 1.0971 0.1376 0.1234 0.2152
W (15–24) 0.0179 0.0075 248 245 0.8834 0.4162 0.0032 0.0326
MM (15–29) 0.1887 0.0313 294 299 1.3699 0.1659 0.1270 0.2505
UM (15–24) 0.1717 0.0270 234 245 1.0942 0.1575 0.1184 0.2249
Ever communicated with spouse on contraception (married young men and women who had begun cohabiting)
Combined
MM (15–29) 0.1216 0.0133 1,404 1,404 1.5241 0.1093 0.0954 0.1478
MW (15–24) 0.3401 0.0179 2,325 2,325 1.8214 0.0526 0.3048 0.3753
Urban
MM (15–29) 0.1982 0.0236 648 306 1.5064 0.1191 0.1517 0.2447
MW (15–24) 0.4169 0.0255 1,036 525 1.6662 0.0612 0.3666 0.4671
Rural
MM (15–29) 0.1002 0.0152 756 1,097 1.3936 0.1520 0.0703 0.1302
MW (15–24) 0.3177 0.0218 1,289 1,800 1.6781 0.0685 0.2748 0.3605
Cont’d on next page...
Table B.2: (Cont’d)
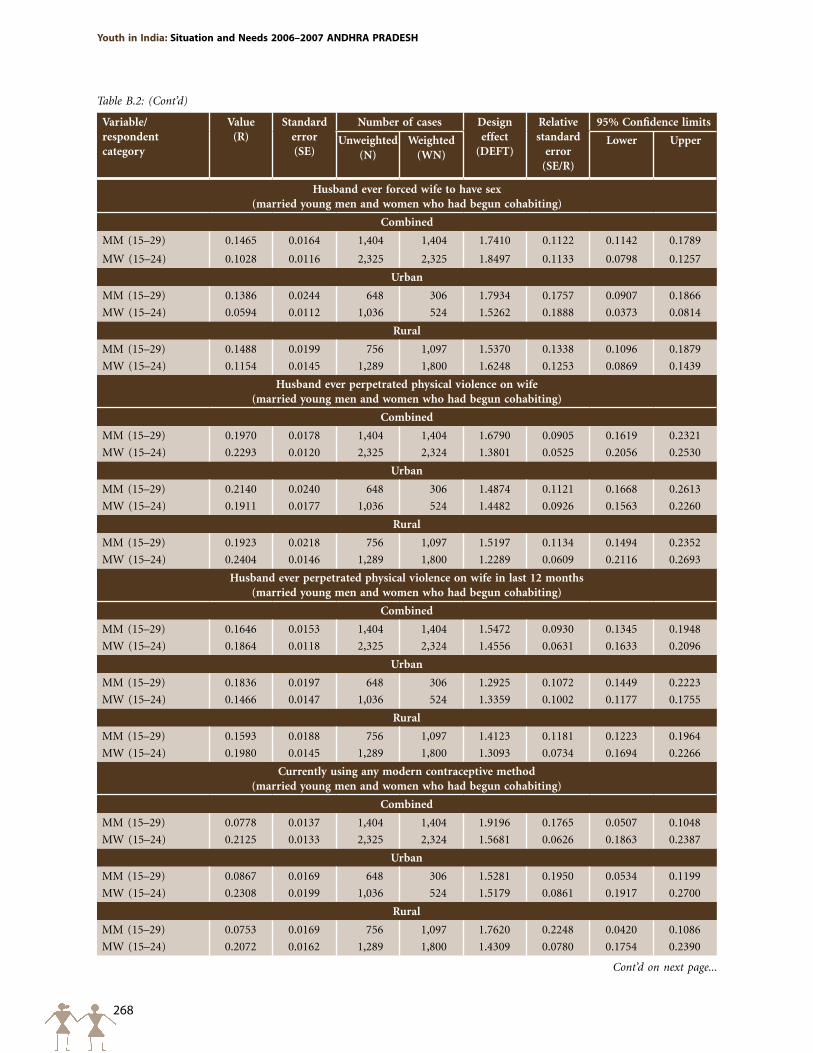
268
Youth in India: Situation and Needs 2006–2007 ANDHRA pRADESH
Variable/ respondent category
Value (R)
Standard error (SE)
Number of cases Design effect
(DEFT)
Relative standard
error (SE/R)
95% Confidence limits
Unweighted(N)
Weighted(WN)
Lower Upper
Husband ever forced wife to have sex (married young men and women who had begun cohabiting)
Combined
MM (15–29) 0.1465 0.0164 1,404 1,404 1.7410 0.1122 0.1142 0.1789
MW (15–24) 0.1028 0.0116 2,325 2,325 1.8497 0.1133 0.0798 0.1257
Urban
MM (15–29) 0.1386 0.0244 648 306 1.7934 0.1757 0.0907 0.1866
MW (15–24) 0.0594 0.0112 1,036 524 1.5262 0.1888 0.0373 0.0814
Rural
MM (15–29) 0.1488 0.0199 756 1,097 1.5370 0.1338 0.1096 0.1879
MW (15–24) 0.1154 0.0145 1,289 1,800 1.6248 0.1253 0.0869 0.1439
Husband ever perpetrated physical violence on wife(married young men and women who had begun cohabiting)
Combined
MM (15–29) 0.1970 0.0178 1,404 1,404 1.6790 0.0905 0.1619 0.2321
MW (15–24) 0.2293 0.0120 2,325 2,324 1.3801 0.0525 0.2056 0.2530
Urban
MM (15–29) 0.2140 0.0240 648 306 1.4874 0.1121 0.1668 0.2613
MW (15–24) 0.1911 0.0177 1,036 524 1.4482 0.0926 0.1563 0.2260
Rural
MM (15–29) 0.1923 0.0218 756 1,097 1.5197 0.1134 0.1494 0.2352
MW (15–24) 0.2404 0.0146 1,289 1,800 1.2289 0.0609 0.2116 0.2693
Husband ever perpetrated physical violence on wife in last 12 months(married young men and women who had begun cohabiting)
Combined
MM (15–29) 0.1646 0.0153 1,404 1,404 1.5472 0.0930 0.1345 0.1948
MW (15–24) 0.1864 0.0118 2,325 2,324 1.4556 0.0631 0.1633 0.2096
Urban
MM (15–29) 0.1836 0.0197 648 306 1.2925 0.1072 0.1449 0.2223
MW (15–24) 0.1466 0.0147 1,036 524 1.3359 0.1002 0.1177 0.1755
Rural
MM (15–29) 0.1593 0.0188 756 1,097 1.4123 0.1181 0.1223 0.1964
MW (15–24) 0.1980 0.0145 1,289 1,800 1.3093 0.0734 0.1694 0.2266
Currently using any modern contraceptive method(married young men and women who had begun cohabiting)
Combined
MM (15–29) 0.0778 0.0137 1,404 1,404 1.9196 0.1765 0.0507 0.1048
MW (15–24) 0.2125 0.0133 2,325 2,324 1.5681 0.0626 0.1863 0.2387
Urban
MM (15–29) 0.0867 0.0169 648 306 1.5281 0.1950 0.0534 0.1199
MW (15–24) 0.2308 0.0199 1,036 524 1.5179 0.0861 0.1917 0.2700
Rural
MM (15–29) 0.0753 0.0169 756 1,097 1.7620 0.2248 0.0420 0.1086
MW (15–24) 0.2072 0.0162 1,289 1,800 1.4309 0.0780 0.1754 0.2390
Cont’d on next page...
Table B.2: (Cont’d)
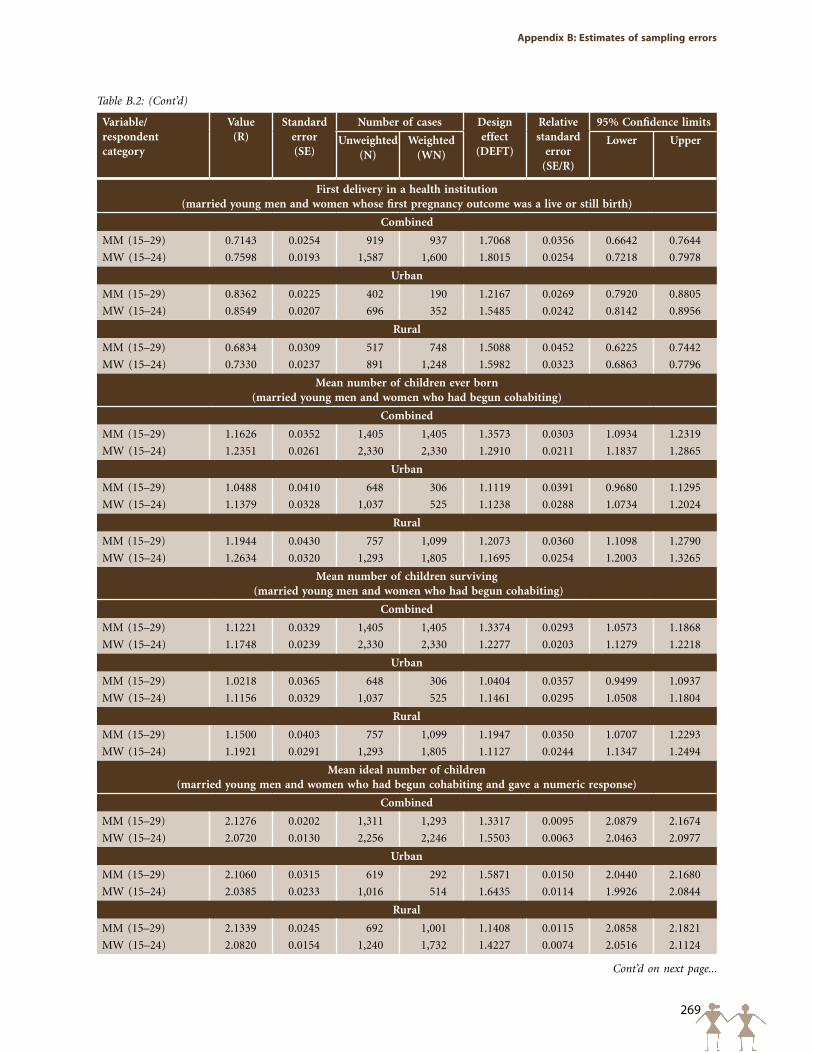
269
Appendix B: Estimates of sampling errors
Variable/ respondent category
Value (R)
Standard error (SE)
Number of cases Design effect
(DEFT)
Relative standard
error (SE/R)
95% Confidence limits
Unweighted(N)
Weighted(WN)
Lower Upper
First delivery in a health institution(married young men and women whose first pregnancy outcome was a live or still birth)
Combined
MM (15–29) 0.7143 0.0254 919 937 1.7068 0.0356 0.6642 0.7644
MW (15–24) 0.7598 0.0193 1,587 1,600 1.8015 0.0254 0.7218 0.7978
Urban
MM (15–29) 0.8362 0.0225 402 190 1.2167 0.0269 0.7920 0.8805
MW (15–24) 0.8549 0.0207 696 352 1.5485 0.0242 0.8142 0.8956
Rural
MM (15–29) 0.6834 0.0309 517 748 1.5088 0.0452 0.6225 0.7442
MW (15–24) 0.7330 0.0237 891 1,248 1.5982 0.0323 0.6863 0.7796
Mean number of children ever born(married young men and women who had begun cohabiting)
Combined
MM (15–29) 1.1626 0.0352 1,405 1,405 1.3573 0.0303 1.0934 1.2319
MW (15–24) 1.2351 0.0261 2,330 2,330 1.2910 0.0211 1.1837 1.2865
Urban
MM (15–29) 1.0488 0.0410 648 306 1.1119 0.0391 0.9680 1.1295
MW (15–24) 1.1379 0.0328 1,037 525 1.1238 0.0288 1.0734 1.2024
Rural
MM (15–29) 1.1944 0.0430 757 1,099 1.2073 0.0360 1.1098 1.2790
MW (15–24) 1.2634 0.0320 1,293 1,805 1.1695 0.0254 1.2003 1.3265
Mean number of children surviving (married young men and women who had begun cohabiting)
Combined
MM (15–29) 1.1221 0.0329 1,405 1,405 1.3374 0.0293 1.0573 1.1868
MW (15–24) 1.1748 0.0239 2,330 2,330 1.2277 0.0203 1.1279 1.2218
Urban
MM (15–29) 1.0218 0.0365 648 306 1.0404 0.0357 0.9499 1.0937
MW (15–24) 1.1156 0.0329 1,037 525 1.1461 0.0295 1.0508 1.1804
Rural
MM (15–29) 1.1500 0.0403 757 1,099 1.1947 0.0350 1.0707 1.2293
MW (15–24) 1.1921 0.0291 1,293 1,805 1.1127 0.0244 1.1347 1.2494
Mean ideal number of children(married young men and women who had begun cohabiting and gave a numeric response)
Combined
MM (15–29) 2.1276 0.0202 1,311 1,293 1.3317 0.0095 2.0879 2.1674
MW (15–24) 2.0720 0.0130 2,256 2,246 1.5503 0.0063 2.0463 2.0977
Urban
MM (15–29) 2.1060 0.0315 619 292 1.5871 0.0150 2.0440 2.1680
MW (15–24) 2.0385 0.0233 1,016 514 1.6435 0.0114 1.9926 2.0844
Rural
MM (15–29) 2.1339 0.0245 692 1,001 1.1408 0.0115 2.0858 2.1821
MW (15–24) 2.0820 0.0154 1,240 1,732 1.4227 0.0074 2.0516 2.1124
Cont’d on next page...
Table B.2: (Cont’d)
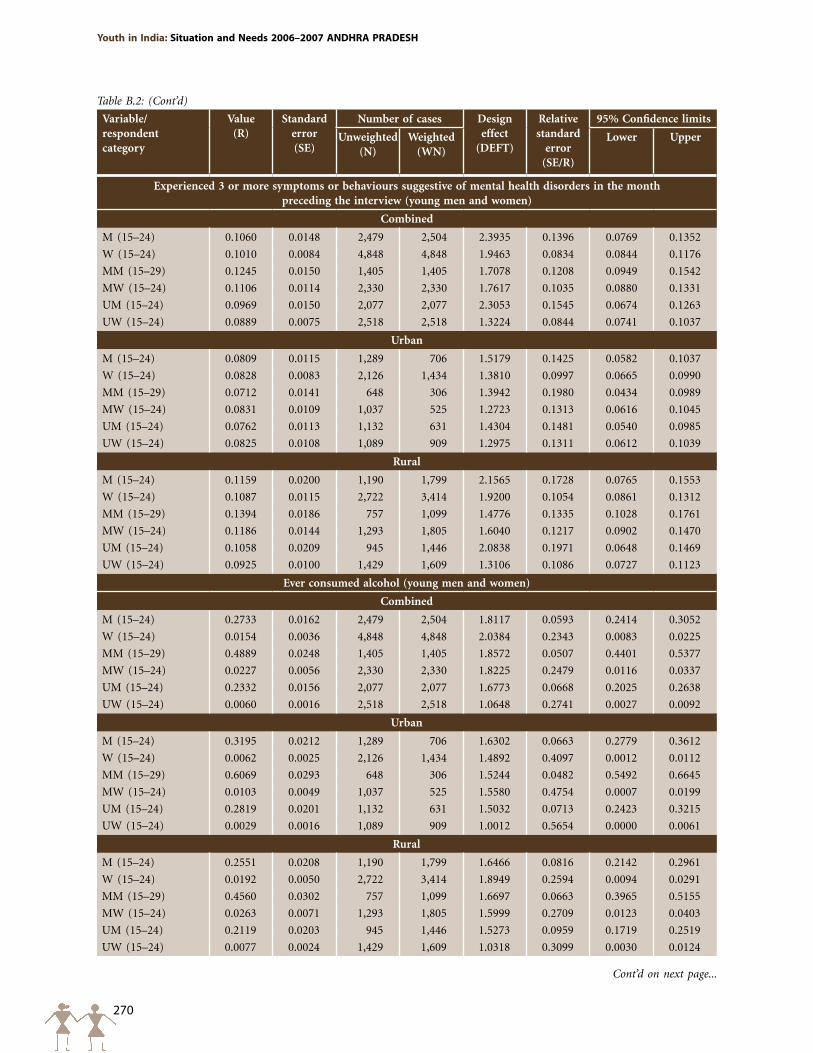
270
Youth in India: Situation and Needs 2006–2007 ANDHRA pRADESH
Variable/ respondent category
Value (R)
Standard error (SE)
Number of cases Design effect
(DEFT)
Relative standard
error (SE/R)
95% Confidence limits
Unweighted(N)
Weighted(WN)
Lower Upper
Experienced 3 or more symptoms or behaviours suggestive of mental health disorders in the month preceding the interview (young men and women)
Combined
M (15–24) 0.1060 0.0148 2,479 2,504 2.3935 0.1396 0.0769 0.1352
W (15–24) 0.1010 0.0084 4,848 4,848 1.9463 0.0834 0.0844 0.1176
MM (15–29) 0.1245 0.0150 1,405 1,405 1.7078 0.1208 0.0949 0.1542
MW (15–24) 0.1106 0.0114 2,330 2,330 1.7617 0.1035 0.0880 0.1331
UM (15–24) 0.0969 0.0150 2,077 2,077 2.3053 0.1545 0.0674 0.1263
UW (15–24) 0.0889 0.0075 2,518 2,518 1.3224 0.0844 0.0741 0.1037
Urban
M (15–24) 0.0809 0.0115 1,289 706 1.5179 0.1425 0.0582 0.1037
W (15–24) 0.0828 0.0083 2,126 1,434 1.3810 0.0997 0.0665 0.0990
MM (15–29) 0.0712 0.0141 648 306 1.3942 0.1980 0.0434 0.0989
MW (15–24) 0.0831 0.0109 1,037 525 1.2723 0.1313 0.0616 0.1045
UM (15–24) 0.0762 0.0113 1,132 631 1.4304 0.1481 0.0540 0.0985
UW (15–24) 0.0825 0.0108 1,089 909 1.2975 0.1311 0.0612 0.1039
Rural
M (15–24) 0.1159 0.0200 1,190 1,799 2.1565 0.1728 0.0765 0.1553
W (15–24) 0.1087 0.0115 2,722 3,414 1.9200 0.1054 0.0861 0.1312
MM (15–29) 0.1394 0.0186 757 1,099 1.4776 0.1335 0.1028 0.1761
MW (15–24) 0.1186 0.0144 1,293 1,805 1.6040 0.1217 0.0902 0.1470
UM (15–24) 0.1058 0.0209 945 1,446 2.0838 0.1971 0.0648 0.1469
UW (15–24) 0.0925 0.0100 1,429 1,609 1.3106 0.1086 0.0727 0.1123
Ever consumed alcohol (young men and women)
Combined
M (15–24) 0.2733 0.0162 2,479 2,504 1.8117 0.0593 0.2414 0.3052
W (15–24) 0.0154 0.0036 4,848 4,848 2.0384 0.2343 0.0083 0.0225
MM (15–29) 0.4889 0.0248 1,405 1,405 1.8572 0.0507 0.4401 0.5377
MW (15–24) 0.0227 0.0056 2,330 2,330 1.8225 0.2479 0.0116 0.0337
UM (15–24) 0.2332 0.0156 2,077 2,077 1.6773 0.0668 0.2025 0.2638
UW (15–24) 0.0060 0.0016 2,518 2,518 1.0648 0.2741 0.0027 0.0092
Urban
M (15–24) 0.3195 0.0212 1,289 706 1.6302 0.0663 0.2779 0.3612
W (15–24) 0.0062 0.0025 2,126 1,434 1.4892 0.4097 0.0012 0.0112
MM (15–29) 0.6069 0.0293 648 306 1.5244 0.0482 0.5492 0.6645
MW (15–24) 0.0103 0.0049 1,037 525 1.5580 0.4754 0.0007 0.0199
UM (15–24) 0.2819 0.0201 1,132 631 1.5032 0.0713 0.2423 0.3215
UW (15–24) 0.0029 0.0016 1,089 909 1.0012 0.5654 0.0000 0.0061
Rural
M (15–24) 0.2551 0.0208 1,190 1,799 1.6466 0.0816 0.2142 0.2961
W (15–24) 0.0192 0.0050 2,722 3,414 1.8949 0.2594 0.0094 0.0291
MM (15–29) 0.4560 0.0302 757 1,099 1.6697 0.0663 0.3965 0.5155
MW (15–24) 0.0263 0.0071 1,293 1,805 1.5999 0.2709 0.0123 0.0403
UM (15–24) 0.2119 0.0203 945 1,446 1.5273 0.0959 0.1719 0.2519
UW (15–24) 0.0077 0.0024 1,429 1,609 1.0318 0.3099 0.0030 0.0124
Cont’d on next page...
Table B.2: (Cont’d)
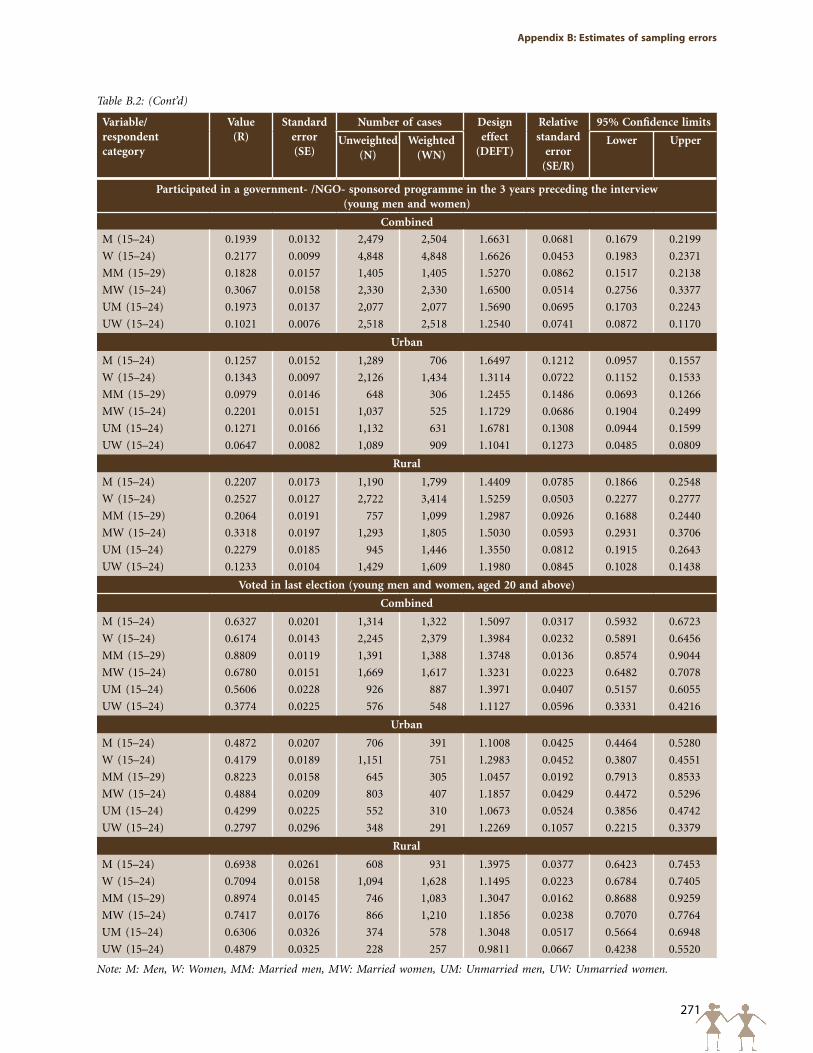
271
Appendix B: Estimates of sampling errors
Variable/ respondent category
Value (R)
Standard error (SE)
Number of cases Design effect
(DEFT)
Relative standard
error (SE/R)
95% Confidence limits
Unweighted(N)
Weighted(WN)
Lower Upper
Participated in a government- /NGO- sponsored programme in the 3 years preceding the interview (young men and women)
Combined
M (15–24) 0.1939 0.0132 2,479 2,504 1.6631 0.0681 0.1679 0.2199
W (15–24) 0.2177 0.0099 4,848 4,848 1.6626 0.0453 0.1983 0.2371
MM (15–29) 0.1828 0.0157 1,405 1,405 1.5270 0.0862 0.1517 0.2138
MW (15–24) 0.3067 0.0158 2,330 2,330 1.6500 0.0514 0.2756 0.3377
UM (15–24) 0.1973 0.0137 2,077 2,077 1.5690 0.0695 0.1703 0.2243
UW (15–24) 0.1021 0.0076 2,518 2,518 1.2540 0.0741 0.0872 0.1170
Urban
M (15–24) 0.1257 0.0152 1,289 706 1.6497 0.1212 0.0957 0.1557
W (15–24) 0.1343 0.0097 2,126 1,434 1.3114 0.0722 0.1152 0.1533
MM (15–29) 0.0979 0.0146 648 306 1.2455 0.1486 0.0693 0.1266
MW (15–24) 0.2201 0.0151 1,037 525 1.1729 0.0686 0.1904 0.2499
UM (15–24) 0.1271 0.0166 1,132 631 1.6781 0.1308 0.0944 0.1599
UW (15–24) 0.0647 0.0082 1,089 909 1.1041 0.1273 0.0485 0.0809
Rural
M (15–24) 0.2207 0.0173 1,190 1,799 1.4409 0.0785 0.1866 0.2548
W (15–24) 0.2527 0.0127 2,722 3,414 1.5259 0.0503 0.2277 0.2777
MM (15–29) 0.2064 0.0191 757 1,099 1.2987 0.0926 0.1688 0.2440
MW (15–24) 0.3318 0.0197 1,293 1,805 1.5030 0.0593 0.2931 0.3706
UM (15–24) 0.2279 0.0185 945 1,446 1.3550 0.0812 0.1915 0.2643
UW (15–24) 0.1233 0.0104 1,429 1,609 1.1980 0.0845 0.1028 0.1438
Voted in last election (young men and women, aged 20 and above)
Combined
M (15–24) 0.6327 0.0201 1,314 1,322 1.5097 0.0317 0.5932 0.6723
W (15–24) 0.6174 0.0143 2,245 2,379 1.3984 0.0232 0.5891 0.6456
MM (15–29) 0.8809 0.0119 1,391 1,388 1.3748 0.0136 0.8574 0.9044
MW (15–24) 0.6780 0.0151 1,669 1,617 1.3231 0.0223 0.6482 0.7078
UM (15–24) 0.5606 0.0228 926 887 1.3971 0.0407 0.5157 0.6055
UW (15–24) 0.3774 0.0225 576 548 1.1127 0.0596 0.3331 0.4216
Urban
M (15–24) 0.4872 0.0207 706 391 1.1008 0.0425 0.4464 0.5280
W (15–24) 0.4179 0.0189 1,151 751 1.2983 0.0452 0.3807 0.4551
MM (15–29) 0.8223 0.0158 645 305 1.0457 0.0192 0.7913 0.8533
MW (15–24) 0.4884 0.0209 803 407 1.1857 0.0429 0.4472 0.5296
UM (15–24) 0.4299 0.0225 552 310 1.0673 0.0524 0.3856 0.4742
UW (15–24) 0.2797 0.0296 348 291 1.2269 0.1057 0.2215 0.3379
Rural
M (15–24) 0.6938 0.0261 608 931 1.3975 0.0377 0.6423 0.7453
W (15–24) 0.7094 0.0158 1,094 1,628 1.1495 0.0223 0.6784 0.7405
MM (15–29) 0.8974 0.0145 746 1,083 1.3047 0.0162 0.8688 0.9259
MW (15–24) 0.7417 0.0176 866 1,210 1.1856 0.0238 0.7070 0.7764
UM (15–24) 0.6306 0.0326 374 578 1.3048 0.0517 0.5664 0.6948
UW (15–24) 0.4879 0.0325 228 257 0.9811 0.0667 0.4238 0.5520
Note: M: Men, W: Women, MM: Married men, MW: Married women, UM: Unmarried men, UW: Unmarried women.
Table B.2: (Cont’d)
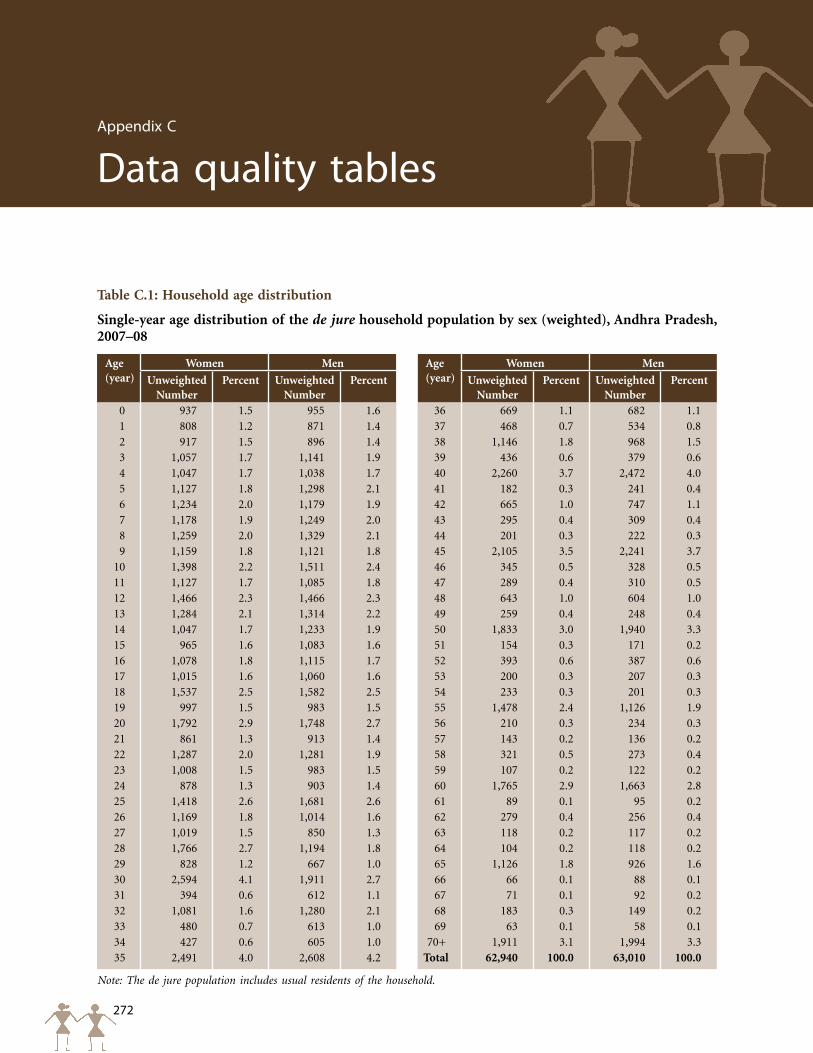
272
Youth in India: Situation and Needs 2006–2007 ANDHRA pRADESH
Appendix C
Data quality tables
Table C.1: Household age distribution
Single-year age distribution of the de jure household population by sex (weighted), Andhra Pradesh, 2007–08
Age (year)
Women Men Age (year)
Women Men
Unweighted Number
Percent Unweighted Number
Percent Unweighted Number
Percent Unweighted Number
Percent
0 937 1.5 955 1.6 36 669 1.1 682 1.11 808 1.2 871 1.4 37 468 0.7 534 0.82 917 1.5 896 1.4 38 1,146 1.8 968 1.53 1,057 1.7 1,141 1.9 39 436 0.6 379 0.64 1,047 1.7 1,038 1.7 40 2,260 3.7 2,472 4.05 1,127 1.8 1,298 2.1 41 182 0.3 241 0.46 1,234 2.0 1,179 1.9 42 665 1.0 747 1.17 1,178 1.9 1,249 2.0 43 295 0.4 309 0.48 1,259 2.0 1,329 2.1 44 201 0.3 222 0.39 1,159 1.8 1,121 1.8 45 2,105 3.5 2,241 3.7
10 1,398 2.2 1,511 2.4 46 345 0.5 328 0.511 1,127 1.7 1,085 1.8 47 289 0.4 310 0.512 1,466 2.3 1,466 2.3 48 643 1.0 604 1.013 1,284 2.1 1,314 2.2 49 259 0.4 248 0.414 1,047 1.7 1,233 1.9 50 1,833 3.0 1,940 3.315 965 1.6 1,083 1.6 51 154 0.3 171 0.216 1,078 1.8 1,115 1.7 52 393 0.6 387 0.617 1,015 1.6 1,060 1.6 53 200 0.3 207 0.318 1,537 2.5 1,582 2.5 54 233 0.3 201 0.319 997 1.5 983 1.5 55 1,478 2.4 1,126 1.920 1,792 2.9 1,748 2.7 56 210 0.3 234 0.321 861 1.3 913 1.4 57 143 0.2 136 0.222 1,287 2.0 1,281 1.9 58 321 0.5 273 0.423 1,008 1.5 983 1.5 59 107 0.2 122 0.224 878 1.3 903 1.4 60 1,765 2.9 1,663 2.825 1,418 2.6 1,681 2.6 61 89 0.1 95 0.226 1,169 1.8 1,014 1.6 62 279 0.4 256 0.427 1,019 1.5 850 1.3 63 118 0.2 117 0.228 1,766 2.7 1,194 1.8 64 104 0.2 118 0.229 828 1.2 667 1.0 65 1,126 1.8 926 1.630 2,594 4.1 1,911 2.7 66 66 0.1 88 0.131 394 0.6 612 1.1 67 71 0.1 92 0.232 1,081 1.6 1,280 2.1 68 183 0.3 149 0.233 480 0.7 613 1.0 69 63 0.1 58 0.134 427 0.6 605 1.0 70+ 1,911 3.1 1,994 3.335 2,491 4.0 2,608 4.2 Total 62,940 100.0 63,010 100.0
Note: The de jure population includes usual residents of the household.
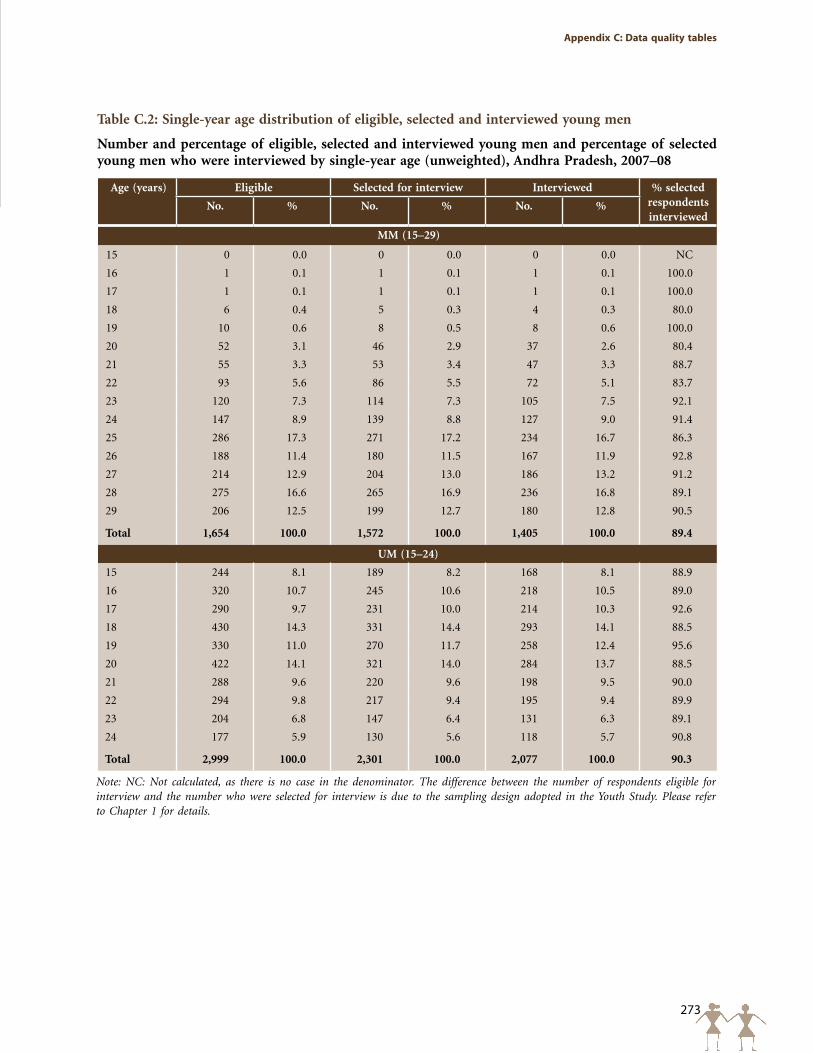
273
Appendix C: Data quality tables
Table C.2: Single-year age distribution of eligible, selected and interviewed young men
Number and percentage of eligible, selected and interviewed young men and percentage of selected young men who were interviewed by single-year age (unweighted), Andhra Pradesh, 2007–08
Age (years) Eligible Selected for interview Interviewed % selected respondents interviewed
No. % No. % No. %
MM (15–29)
15 0 0.0 0 0.0 0 0.0 NC
16 1 0.1 1 0.1 1 0.1 100.0
17 1 0.1 1 0.1 1 0.1 100.0
18 6 0.4 5 0.3 4 0.3 80.0
19 10 0.6 8 0.5 8 0.6 100.0
20 52 3.1 46 2.9 37 2.6 80.4
21 55 3.3 53 3.4 47 3.3 88.7
22 93 5.6 86 5.5 72 5.1 83.7
23 120 7.3 114 7.3 105 7.5 92.1
24 147 8.9 139 8.8 127 9.0 91.4
25 286 17.3 271 17.2 234 16.7 86.3
26 188 11.4 180 11.5 167 11.9 92.8
27 214 12.9 204 13.0 186 13.2 91.2
28 275 16.6 265 16.9 236 16.8 89.1
29 206 12.5 199 12.7 180 12.8 90.5
Total 1,654 100.0 1,572 100.0 1,405 100.0 89.4
UM (15–24)
15 244 8.1 189 8.2 168 8.1 88.9
16 320 10.7 245 10.6 218 10.5 89.0
17 290 9.7 231 10.0 214 10.3 92.6
18 430 14.3 331 14.4 293 14.1 88.5
19 330 11.0 270 11.7 258 12.4 95.6
20 422 14.1 321 14.0 284 13.7 88.5
21 288 9.6 220 9.6 198 9.5 90.0
22 294 9.8 217 9.4 195 9.4 89.9
23 204 6.8 147 6.4 131 6.3 89.1
24 177 5.9 130 5.6 118 5.7 90.8
Total 2,999 100.0 2,301 100.0 2,077 100.0 90.3
Note: NC: Not calculated, as there is no case in the denominator. The difference between the number of respondents eligible for interview and the number who were selected for interview is due to the sampling design adopted in the Youth Study. Please refer to Chapter 1 for details.
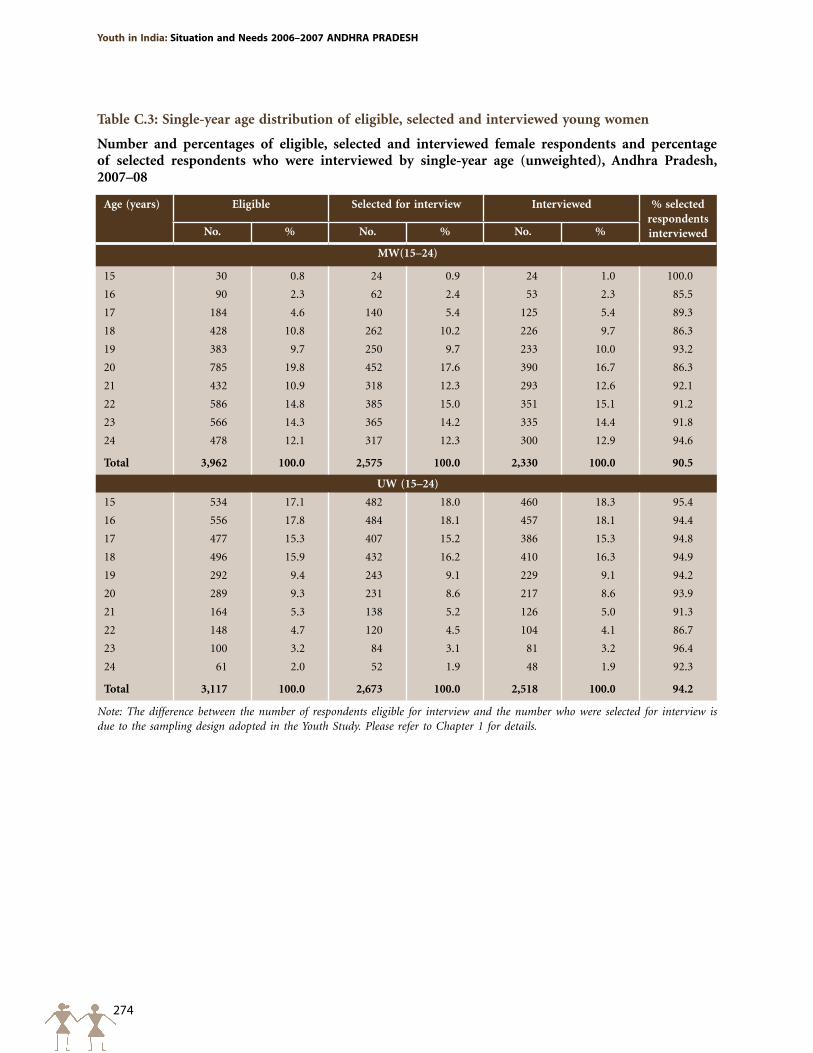
274
Youth in India: Situation and Needs 2006–2007 ANDHRA pRADESH
Table C.3: Single-year age distribution of eligible, selected and interviewed young women
Number and percentages of eligible, selected and interviewed female respondents and percentage of selected respondents who were interviewed by single-year age (unweighted), Andhra Pradesh, 2007–08
Age (years) Eligible Selected for interview Interviewed % selected respondents interviewedNo. % No. % No. %
MW(15–24)
15 30 0.8 24 0.9 24 1.0 100.0
16 90 2.3 62 2.4 53 2.3 85.5
17 184 4.6 140 5.4 125 5.4 89.3
18 428 10.8 262 10.2 226 9.7 86.3
19 383 9.7 250 9.7 233 10.0 93.2
20 785 19.8 452 17.6 390 16.7 86.3
21 432 10.9 318 12.3 293 12.6 92.1
22 586 14.8 385 15.0 351 15.1 91.2
23 566 14.3 365 14.2 335 14.4 91.8
24 478 12.1 317 12.3 300 12.9 94.6
Total 3,962 100.0 2,575 100.0 2,330 100.0 90.5
UW (15–24)
15 534 17.1 482 18.0 460 18.3 95.4
16 556 17.8 484 18.1 457 18.1 94.4
17 477 15.3 407 15.2 386 15.3 94.8
18 496 15.9 432 16.2 410 16.3 94.9
19 292 9.4 243 9.1 229 9.1 94.2
20 289 9.3 231 8.6 217 8.6 93.9
21 164 5.3 138 5.2 126 5.0 91.3
22 148 4.7 120 4.5 104 4.1 86.7
23 100 3.2 84 3.1 81 3.2 96.4
24 61 2.0 52 1.9 48 1.9 92.3
Total 3,117 100.0 2,673 100.0 2,518 100.0 94.2
Note: The difference between the number of respondents eligible for interview and the number who were selected for interview is due to the sampling design adopted in the Youth Study. Please refer to Chapter 1 for details.
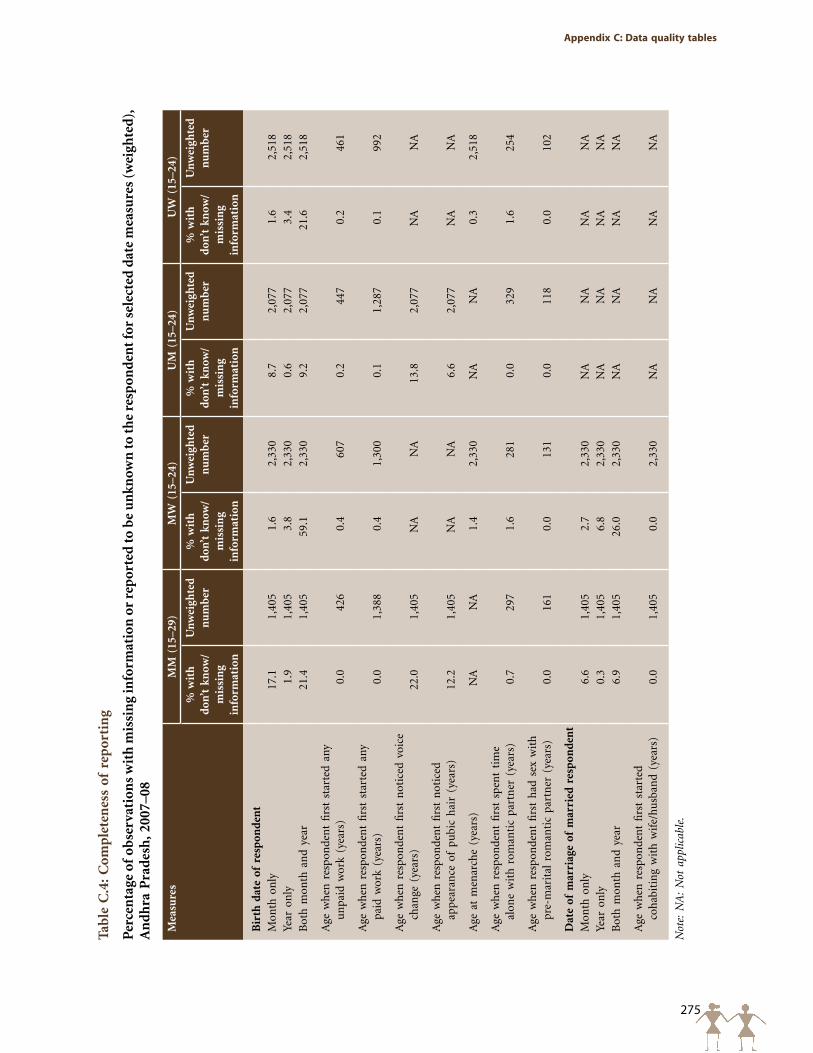
275
Appendix C: Data quality tables
Tabl
e C
.4: C
omp
lete
nes
s of
rep
orti
ng
Per
cen
tage
of
obse
rvat
ion
s w
ith
mis
sin
g in
form
atio
n o
r re
por
ted
to b
e u
nkn
own
to th
e re
spon
den
t for
sel
ecte
d d
ate
mea
sure
s (w
eigh
ted
),
An
dh
ra P
rad
esh
, 200
7–08
Mea
sure
sM
M (
15–2
9)M
W (
15–2
4)U
M (
15–2
4)U
W (
15–2
4)
% w
ith
do
n’t
know
/m
issi
ng
info
rmat
ion
Un
wei
ghte
d
nu
mb
er%
wit
h
don’
t kn
ow/
mis
sin
g in
form
atio
n
Un
wei
ghte
d
nu
mb
er%
wit
h
don’
t kn
ow/
mis
sin
g in
form
atio
n
Un
wei
ghte
d
nu
mb
er%
wit
h
don
’t k
now
/m
issi
ng
info
rmat
ion
Un
wei
ghte
d
nu
mb
er
Bir
th d
ate
of r
esp
ond
ent
Mon
th o
nly
17
.11,
405
1.6
2,33
08.
72,
077
1.6
2,51
8Ye
ar o
nly
1.9
1,40
53.
82,
330
0.6
2,07
73.
42,
518
Bot
h m
onth
an
d ye
ar21
.41,
405
59.1
2,33
09.
22,
077
21.6
2,51
8
Age
wh
en r
espo
nde
nt
firs
t st
arte
d an
y u
npa
id w
ork
(yea
rs)
0.0
426
0.4
607
0.2
447
0.2
461
Age
wh
en r
espo
nde
nt
firs
t st
arte
d an
y pa
id w
ork
(yea
rs)
0.0
1,38
80.
41,
300
0.1
1,28
70.
199
2
Age
wh
en r
espo
nde
nt
firs
t n
otic
ed v
oice
ch
ange
(ye
ars)
22.0
1,40
5N
AN
A13
.82,
077
NA
NA
Age
wh
en r
espo
nde
nt
firs
t n
otic
ed
app
eara
nce
of
pubi
c h
air
(yea
rs)
12.2
1,40
5N
AN
A6.
62,
077
NA
NA
Age
at
men
arch
e (y
ears
)N
AN
A1.
42,
330
NA
NA
0.3
2,51
8
Age
wh
en r
espo
nde
nt
firs
t sp
ent
tim
e al
one
wit
h r
oman
tic
part
ner
(ye
ars)
0.7
297
1.6
281
0.0
329
1.6
254
Age
wh
en r
espo
nde
nt
firs
t h
ad s
ex w
ith
pr
e-m
arit
al r
oman
tic
part
ner
(ye
ars)
0.0
161
0.0
131
0.0
118
0.0
102
Dat
e of
mar
riag
e of
mar
ried
res
pon
den
tM
onth
on
ly6.
61,
405
2.7
2,33
0N
AN
AN
AN
AYe
ar o
nly
0.3
1,40
56.
82,
330
NA
NA
NA
NA
Bot
h m
onth
an
d ye
ar6.
91,
405
26.0
2,33
0N
AN
AN
AN
A
Age
wh
en r
espo
nde
nt
firs
t st
arte
d co
hab
itin
g w
ith
wif
e/hu
sban
d (y
ears
)0.
01,
405
0.0
2,33
0N
AN
AN
AN
A
Not
e: N
A:
Not
app
licab
le.

This report is the result of a sub-national study undertaken by the International Institute for Population
Sciences, Mumbai and the Population Council, New Delhi, as part of a project to collect information
on key transitions experienced by youth in India, including those related to education, work force
participation, sexual activity, marriage, health and civic participation; the magnitude and patterns of
young people’s sexual and reproductive practices before, within and outside of marriage as well as related
knowledge, decision-making and attitudes. The project was implemented in six states of India, namely,
Andhra Pradesh, Bihar, Jharkhand, Maharashtra, Rajasthan and Tamil Nadu.
The International Institute for Population Sciences (IIPS) is a deemed university under administrative control
of Ministry of Health and Family Welfare, Government of India. The Institute engages in teaching and
research in population sciences, and has been actively involved in building the capacity of Population Research
Centres, and other state and central government offices that address population issues in the country and
in the Asia-Pacific region. It has a proven record in conducting national- and sub-national-level studies in
reproductive health, including the National Family Health Surveys and District Level Household and Facility
Survey under the Reproductive and Child Health programme.
The Population Council is an international, non-profit, non-governmental organisation that seeks to improve
the well-being and reproductive health of current and future generations around the world and to help
achieve a humane, equitable and sustainable balance between people and resources. The Council conducts
biomedical, social science and public health research, and helps build research capacities in developing
countries.
Copyright © 2010 International Institute for Population Sciences, Mumbai and Population Council, New Delhi
Suggested citation: International Institute for Population Sciences (IIPS) and Population Council. 2010.
Youth in India: Situation and Needs 2006–2007, Andhra Pradesh. Mumbai: IIPS.
For additional copies of this report please contact:
International Institute for Population Sciences Population CouncilGovandi Station Road, Deonar Zone 5-A, Ground FloorMumbai 400088 India Habitat CentreIndia Lodi RoadPhone: 022-42372400/42372518 New Delhi 110003email: [email protected] Phone: 011-2464 2901/02 Website: http://www.iipsindia.org email: [email protected] Website: http://www.popcouncil.org/asia/india.html
Youth in India: Situation and Needs 2006–2007
ANDHRA PRADESH
Hkkjr ljdkjLokLF; ,oa ifjokj dY;k.k ea=ky;fuekZ.k Hkou] ubZ fnYyh & 110011
GOVERNMENT OF INDIAMINISTRY OF HEALTH & FAMILY WELFARE
NIRMAN BHAWAN, NEW DELHI - 110011
Supported by:
International Institute for Population Sciences, Mumbai
Youth in India: Situation and Needs 2006–2007 A
ND
HR
A PR
AD
ESH
Related Documents


