Agence Française de Développement Direction de la Stratégie Département de la Recherche 5 rue Roland Barthes 75012 Paris - France www.afd.fr Working Paper October 2007 Département de la Recherche Agence Française de Développement 49 Youth and Labour Markets in Africa A critical review of literature DIAL (www.dial.prd.fr) Auteurs correspondants à DIAL : Jean-Pierre Cling ([email protected]), Flore Gubert, ([email protected]), Christophe J. Nordman ([email protected]), Anne-Sophie Robilliard ([email protected]) Contact AFD : Ewa Filipiak, département de la Recherche ([email protected])

Welcome message from author
This document is posted to help you gain knowledge. Please leave a comment to let me know what you think about it! Share it to your friends and learn new things together.
Transcript
Agence Française de DéveloppementDirection de la StratégieDépartement de la Recherche
5 rue Roland Barthes75012 Paris - Francewww.afd.fr
WorkingPaper
AgenceFrançaisedeDéveloppement
October 2007
Département de la Recherche
AgenceFrançaisedeDéveloppement
49
Youth and Labour Markets in AfricaA critical review of literature
DIAL (www.dial.prd.fr)
Auteurs correspondants à DIAL :Jean-Pierre Cling ([email protected]),Flore Gubert, ([email protected]),Christophe J. Nordman ([email protected]),Anne-Sophie Robilliard ([email protected])
Contact AFD :Ewa Filipiak, département de la Recherche ([email protected])

© AFD Working Paper N°49 • Youth and Labour Markets in Africa - A literature review
2
The contributors to this study include Thomas Bossuroy, Jean-Pierre Cling, Philippe De Vreyer, Marie-Hélène Durand, Flore
Gubert, Charlotte Guenard, Javier Herrera, Mathias Kuepie, Emmanuelle Lavallée, Sandrine Mesplé-Somps, Mohamed Ali
Marouani, Christophe J. Nordman, Anne-Sophie Robilliard, François Roubaud, Gilles Spielvogel and Constance Torelli.
Director of the publication: Jean-Michel SEVERINO
ISSN 1954-3131 - Dépôt légal: november 2007
© AFD 2007
Keyboarding/layout: Anne-Elizabeth COLOMBIER
Introduction 5
1. Facts and figures: what do we know (and do not know) about youth employment in Africa? 71.1 Youth employment in Africa 71.1.1 The challenge of monitoring youth employment 71.1.2 Youth labour force participation 101.1.3 Youth unemployment rates 111.1.4 Youth employment characteristics 141.2 What are the consequences? 161.2.1 Delayed social integration 161.2.2 Disruptive social behaviour and armed conflict 161.2.3 International migrations and brain drain 17
2. Causes of the youth labour market disadvantage: a supply-side perspective 192.1 Characteristics of the labour supply 202.1.1 Weight of the young generations in the population and its likely evolution 202.1.2 Rural-urban distribution of the young population 202.1.3 Education level of the workforce 202.2 Education, access to employment and returns to education and training 222.2.1 Education and access to employment 222.2.2 The private rate of returns to education (RORE) 232.2.3 Costs and benefits of vocational education and on-the-job training 262.2.4 Non-formal training and training in the informal sector 282.3 Access to other forms of capital 302.3.1 Social capital, ethnicity and access to employment 302.3.2 Access to land 322.3.3 Access to capital 33
3. Causes of the youth labour market disadvantage: a demand-side perspective 343.1 Labour demand and wage flexibility 343.1.1 Ability of wages to decline over time 353.1.2 Tendency for wages to adjust in the face of unemployment 353.1.3 Wage differentials between sectors and/or firms of different size 353.2 Labour standards in Africa 373.2.1 Enforcement and coverage of labour standards 373.2.2 Example of Francophone West Africa 40
© AFD Working Paper N°49 • Youth and Labour Markets in Africa - A literature review
3
Contents

4. Public and private responses 414.1 Active labour market policies in Africa 414.1.1 Public employment services 414.1.2 Schemes to provide direct employment 424.1.3 Schemes to provide employable skills 434.1.4 Schemes to promote self-employment 444.1.5 Other schemes 454.2 Evaluation 45
Conclusion 47
References 49
Statistical Appendix 57
Série Documents de travail / Working Papers Series 68
Contents
© AFD Working Paper N°49 • Youth and Labour Markets in Africa - A literature review
4
© AFD Working Paper N°49 • Youth and Labour Markets in Africa - A literature review
5
Young people in Africa are confronted with many difficulties
when it comes to their integration in the labour markets and
their research for decent and productive jobs. Youth unem-
ployment, which is substantially higher than global adult
unemployment, has been growing in the last decade (ILO,
2006). The situation is likely to keep deteriorating as the
total number of youth is expected to keep increasing rapid-
ly in the next ten years1. By defining a specific target
through the Millenium Development Goal concerning youth
employment (Target 16) the international community has
recognised the seriousness of the situation. However, in
spite of the dramatic economic, social and political conse-
quences (on poverty, social cohesion, migrations, etc.) of
youth employment problems, the literature on African
labour markets provides only very few studies focusing on
this population. Following international standards, we defi-
ne “youth” as people aged 15 to 24. This definition excludes
children and therefore child labour issues.
This survey of literature focuses mainly on economic
research done on Sub-Saharan Africa2, although some
references are reviewed for North Africa. It stresses that an
assessment of youth employment problems in African
countries requires a (still missing) clear diagnosis based on
hard data and analytical research on determinants of labour
market participation and unemployment. Research on the
links between formal education and on-the-job training and
their economic returns are especially crucial in understan-
ding inadequacy between labour supply and demand.
As shown by this research review, basic labour market indi-
cators are lacking or are at best incomplete due to data
availability and methodological problems. Worst, as illustra-
ted below, different sources lead to opposite diagnoses
concerning youth unemployment and its trends. In order to
contribute to this badly needed diagnosis, we present some
new evidence based on the 1-2-3 Surveys recently conduc-
ted in 10 African countries, which provides a consistent and
comparable picture of the situation of youth employment in
urban labour markets in these countries.
The literature survey also underlines the diversity of the
situation of youth employment on the continent (Southern
Africa vs. other African countries; Anglophone vs.
Francophone countries, etc.). It also shows the “urban bias”
in economic research on this subject, partly due to the lack
of data on rural areas.
Section two begins by pointing out the main difficulties of
monitoring youth employment given lack of data as well as
methodology discrepancies among different available
sources. Taking these difficulties into account, this section
is devoted to putting forward the main stylized facts concer-
ning youth employment in Africa, using both international
statistics and existing survey data.
Section three addresses the main causes of poor youth
employment performance by reviewing research done on
labour supply characteristics, in order to grasp changes in
labour force composition, and the extent of upgrades on
labour force education. The issue of returns to education
and training is discussed in detail. Research on the relative
disadvantage of youth in the labour market in terms of
access to social capital, land and capital is also reviewed.
Section four summarizes the main findings concerning the
role of labour demand in relation to institutions. We review
the research on the impact of labour standards and regula-
tions. While being an opportunity for creating higher quality
jobs, they are often considered to be, together with the lack
of economic growth and investment, one of the main obs-
tacles in creating more jobs in African countries.
Introduction
1 In 2005, 62 percent of the population was below age of 25 and the total number of the youth(aged 15-24) is forecast to grow by an additional 22 million between 2005 and 2015 (ILO,2006:1). By 2010, the share of youth in the population in Sub-Saharan Africa will reach about28 percent, making Africa the “youngest” region in the world (World Bank, 2006b: 2).2 Some sociological and political science studies are also reviewed.

A review of policies and practices is carried out in the fifth sec-
tion. African countries have been implementing several initia-
tives concerning employment for the last few years, some of
them addressing the particular issue of youth employment.
What can be said about the impact of these policies on impro-
ving labour market and income prospects for the youth? What
are the lessons drawn from their successes or failures?
Sections four and five are more concise as the youth
dimension is missing in most of the empirical literature rela-
ting to labour market institutions, growth and employment,
and employment policies.
Section six concludes.
Introduction
© AFD Working Paper N°49 • Youth and Labour Markets in Africa - A literature review
6
© AFD Working Paper N°49 • Youth and Labour Markets in Africa - A literature review
7
1. Facts and figures: what do we know (and do not know) about youthemployment in Africa?
Youth unemployment is a hot issue in the political agenda
of both developed and developing countries. In spite of this
common feature, existing empirical evidence and research
shows that the nature of the problem is quite different in
these two groups of countries. While in developed countries
the youth’s difficulties to get a job are related to lack of mini-
mum professional skills required in the context of sophisti-
cated production environments, in the case of developing
countries, unemployment is generally found to rise with
education levels. In the absence of unemployment insuran-
ce, only those with family (economic, social and demogra-
phic) resources can afford to wait in order to find a good
match between their level of qualification and their occupa-
tions in the labour market. Conversely, most unqualified
workers cannot afford to be unemployed and end up in the
informal sector where productivity and revenues are low.
What are the nature and the extent of the problems faced
by the young in Africa’s labour market? How have youth
labour market outcomes changed in recent years? To these
two questions, the picture provided by existing reports on
the labour market situation of youth in Africa does not
always provide clear answers. A noticeable exception
concerns a recent World Bank report which is specifically
devoted to this issue (World Bank, 2006b). Because
reliable figures are lacking, most reports exploring the
question of youth labour only focus on youth unemployment
rates. This is doubly regrettable insofar as (1) unemploy-
ment rates are “only the tip of the iceberg in terms of fully
explaining the multitude of employment-related problems
facing youth” (ILO, 2004) and (2) the absence of regular
data collections on employment and unemployment in
many developing countries makes it impossible to estimate
unemployment rates reliably. Notwithstanding these limita-
tions, we present here some more detailed results on youth
labour participation and labour characteristics stemming
from comparable sources on a number of francophone
Sub-Saharan countries. We also briefly review recent work
on the consequences of youth unemployment.
1.1 Youth employment in Africa
1.1.1 The challenge of monitoring youthemployment
Monitoring youth employment in Africa meets two kinds of
difficulties. First, there are conceptual issues relating to the
specificities of African economies and labour markets.
Labour markets in developing countries, and particularly in
SSA, strongly differ indeed from those in developed coun-
tries. In particular, it is widely acknowledged that there are
four types of labour markets, namely rural, public, private
formal and informal3. These markets each have their speci-
fic characteristics, such as job seasonality and uncertainty
about the level of demand, the nature of contracts and the
structure of wages and earnings (Adams, 1991; Schultz,
2004). Formal wage labour is far less important than infor-
mal self-employment. Besides, there is no unemployment
insurance and job search relies heavily on social and fami-
ly networks instead of formal institutions. Also, the frontiers
between activity and inactivity are fuzzy and this has an
incidence on the unemployed and economically active
population figures.
3 According to the definition of the ILO, the informal sector includes all enterprises which donot possess an administrative registration number and/or do not keep accounts.

All this means that standard ILO labour indicators and
methods should be adapted and complemented with other
indicators in order to grasp the specificities of African labour
conditions. For instance, according to the 1-2-3 Surveys
conducted in several West African francophone capital
cities, only 34.6 percent of occupied workers are, on avera-
ge, wage earners, the remaining 65.4 percent being self-
employed workers who created their own employment
(Brilleau, Roubaud and Torelli, 2005). Thus, most often,
searching a job in Africa amounts to relying on informal net-
works and/or gathering enough funds to establish as an
informal street vendor or open a small service business.
Moreover, rural wage labour markets are very thin: almost
all occupied workers are informal, self-occupied non paid
family workers. They are also subject to important seasonal
variations and short-term migration is not uncommon. This
means that using one-week recall periods may be well-sui-
ted in urban settings but is definitely ill-suited in rural areas.
More generally, analysis of labour markets has tended to
neglect rural Africa because of “an apparent lack of socio-
economic phenomena that corresponds to the labour eco-
nomists’ usual definitions of employment” (Leavy and
White, 1999).
Given the widespread importance of informal sector
employment, research on the economic returns to educa-
tion and, more generally, research focusing on wage inco-
me alone can only provide a partial and biased picture of
income-generating processes. Informal production units
(IPU) are characterized by not carrying accounts. As a
result, asking an informal worker how much he earned over
the last 30 days through simple one-question (as is usually
done in existing surveys) gives a much distorted figure of
his real labour income. Informal workers generally do not
know how much they earned over the last month. Part of
the reason they do not know is because intermediate pro-
ductive consumption and value added are concepts that are
difficult to define and to measure in the case of IPUs. Thus
special survey design, such as the one used in 1-2-3
Surveys, is needed in order to obtain a more accurate infor-
mal income measure (Razafindrakoto and Roubaud, 2003).
Apart from these conceptual issues, the lack of comprehen-
sive, integrated and centralized databases on youth labour
market and poverty outcomes in Africa remains a major bar-
rier for analysing employment-linked poverty outcomes in
the region. In the first place, it is important to recognize that
when centralized databases with information on labour
market outcomes exist, they usually contain stand-alone
indicators of employment, unemployment and labour force,
which do not allow a thorough analysis of youth labour mar-
ket outcomes and the determinants of these outcomes.
Moreover, one should be cautious with international compa-
risons, since data are generally comparable within coun-
tries but not necessarily across them (there is in particular
a strong diversity in the definition of “youth” and unemploy-
ment).
Many reports from international agencies such as the
United Nations (UN), the International Labour Organisation
(ILO) and the World Bank (WB) have attempted to draw
overall pictures of youth unemployment and underemploy-
ment in different parts of the world (ILO, 2006; UNECA,
2005; World Bank, 2006a; 2006b). In the case of Africa,
however, lack of adequate and reliable data makes it diffi-
cult to properly assess youth labour force participation,
youth unemployment and even more so youth underem-
ployment (see Box 1). As an illustration, ILO’s main databa-
se on labour statistics, namely ILO/LABORSTA, which sup-
posedly covers household income and expenditure statis-
tics, economically active population, employment and
unemployment by detailed occupational group and sex for
more than two hundreds countries and territories only has
data on youth unemployment for eleven African countries4,
among which only seven are in SSA. Similarly, the UN
Youth Employment Statistics section has data on youth
unemployment for only few countries. Given such a poor
geographical and temporal coverage of the African conti-
nent, few stylized facts emerge from this literature. In addi-
tion, the lack of reliability of the data often leads to contra-
dictory conclusions.
1. Facts and figures: what do we know (and do not know) about youth employment in Africa?
© AFD Working Paper N°49 • Youth and Labour Markets in Africa - A literature review
8
4 Algeria, Botswana, Burkina Faso, Egypt, Ethiopia, Madagascar, Mauritius, Morocco,Rwanda, South Africa and Tunisia.

Box 1 – Where do employment data come from?
Data used to measure unemployment, employment and underemployment are drawn from household surveys or population censuses.However, censuses in Africa are very infrequent (many African countries have not conducted a census for the last 20 years) which causeshigh sampling errors for household surveys.
1. Household surveys
Living Standards Measurement Surveys (LSMS). Promoted by the World Bank, these surveys have been an important tool in measuringand understanding poverty in developing countries for the last two decades. They collect data on many dimensions of household well-being,including consumption, income, savings, employment, health, education, fertility, nutrition, housing and migration. While the measurement ofconsumption is strongly emphasized in the questionnaires, the employment module is comparatively short and most questions have the lastweek as the reference period, which is not always adequate for rural work (CDPR, 2005). Because of the lack of other sources of informa-tion, these surveys are the most commonly used for employment analyses.
Labour Force Surveys (LFS). These surveys are standard household-based surveys of work-related statistics and should constitute as suchthe main source of employment data. However, they have been conducted on a very irregular basis and with substantial lags in many deve-loping countries. Less than 10 African countries have conducted one LFS since 1990 (CDPR, 2005).
The World Bank is putting a lot of efforts to collect and harmonise micro-datasets on SSA through its Survey-based Harmonised IndicatorsProject (SHIP). The SHIP will provide comparable and comprehensive socio-economic indicators for African countries.
1-2-3 Surveys. In the case of French-speaking African countries, for which available evidence on youth labour market is particularly poor,the 1-2-3 Surveys conducted recently in seven West-African economic capital cities (namely Abidjan, Bamako, Cotonou, Dakar, Lome,Niamey and Ouagadougou), in Madagascar (Antananarivo, where an annual series is available over more than ten years), in Cameroon andin the Democratic Republic of Congo are (to date) probably the most reliable data source providing harmonised labour market statistics inAfrica.5 Exploitation of the data has been undertaken by DIAL6 in collaboration with National Statistical Institutes (Brilleau et al. 2004) and abook entitled “Urban Labour Markets in Sub-Saharan Africa” is forthcoming.
2. International databases
International databases on employment use household surveys and census data when available. Such databases include the ILO databaseon Labour Statistics (LABORSTA), the World Development Indicators (WDI) computed by the World Bank, and the FAO labour statistics(FAOSTAT). Another problem with existing centralised databases is that information on youth outcomes is often incomplete for many Africancountries. For instance, the FAO database does not contain labour data by age group. And while the LABOURSTA and the WDI databasescontain specific indicators on youth employment and unemployment, these indicators are barely available for all countries in Africa and formore than a few years.
Besides the poor coverage of youth labour market outcomes, a further issue is that reported indicators of labour market outcomes are notalways consistent across databases. For instance, there are non-negligible discrepancies between FAO and WDI data on the one hand, andILO data on the other. This is probably due to the use of different data sources and methodology.
1. Facts and figures: what do we know (and do not know) about youth employment in Africa?
© AFD Working Paper N°49 • Youth and Labour Markets in Africa - A literature review
9
5 The first 1-2-3 Survey was conducted in Yaoundé, Cameroon in 1993. The methodology wasthen applied to Antananarivo, Madagascar in 1995 and extended to the seven main urbancentres of Madagascar in 2000 and 2001. Today, 1-2-3 Surveys have been conducted in manyparts of the world including Latin America (El Salvador, Bolivia, Colombia, Equator, Peru,Venezuela in 2002-2003), Africa (Morocco in 1999-2000, capital cities of the WAEMU in 2001-2003, and Madagascar in 1995-2006, Cameroon in 2005, Democratic Republic of Congo in2004-2005) and Asia (China and Bangladesh).6 DIAL is a research unit of the French Institute for Research on Development (IRD) and is inpartnership with the AFD: www.dial.prd.fr.

In fact, the main part of the problem is due to the lack of an
integrated statistical programme addressing labour market
issues on the continent. In most countries of the world, led
by developed countries, but also in the developing coun-
tries of Latin America, Asia, North Africa, etc., i.e. everyw-
here except SSA (with the noticeable exception of South
Africa), labour force surveys (LFSs) play a central role in
the system of statistical information on household. This dia-
gnosis formulated more than 15 years ago (Roubaud and
Séruzier, 1991) is still relevant today, in spite of a constant
advocacy to promote such a type of surveys
(Rakotomanana, Ramilison and Roubaud, 2003). This
continental exception, which can be explained by historical
reasons, is a surprising paradox, when one considers that
most Africans, especially the poor, derive their income (be
it in money or in kind) from work. One of the main objectives
of the 1-2-3 Survey is specifically to fill this gap. The recent
key focus of development policies on poverty alleviation is
a cogent argument for the inclusion of a permanent employ-
ment monitoring system, since access to paid and produc-
tive jobs is the best way of escaping poverty.
1.1.2 Youth labour force participation
Youth participation rates everywhere are found to be less
than those of the adult population. However, due to data
limitations, there is no definitive answer to the question of
whether youth participation rate in SSA has increased or
decreased over the recent period
According to ILO’s Global Employment Trends for Youth
2004, youth labour force participation rates decreased in the
world as a whole by almost four percentage points between
1993 and 2003 (Figure 1a). This trend is mainly the result
of an increasing number of young people attending school
and/or staying in the education system for longer periods of
time. In SSA, however, the youth labour force participation
rate is found to have increased over the period even though
it was already one of the highest in 1993. According to the
report, this increase could be the result of an overall trend
of women participating more in the labour market.
Existing evidence on such an increase in youth participation
rates for the African continent is rather weak, though. Table
1 in Appendix reports youth and adult labour market partici-
pation rates for some selected African countries computed
by the authors of the present report using the ILO/LABORS-
TA database. For most of the countries for which data are
available7, the youth (15-24) participation rate is actually
found to have decreased over time, while the adult (25-49)
participation rate is found to have generally increased.
Such a widening gap between youth and adult activity rates
could reflect either the delayed entry of young in the labour
market due to later school termination or an increasing
number of young people too discouraged by limited job
opportunities to even enter the labour force. Evidence on
the former point is given by Antoine, Razafindrakoto and
Roubaud (2001) in the capital cities of Cameroon,
Madagascar and Senegal.
On the other hand, what clearly emerges from the data is
the strong heterogeneity across African countries in both
youth and adult participation rates. For example, Burkina
Faso, Burundi and Rwanda have rather high labour force
participation rates while Botswana, Nigeria and Congo are
clear outliers on the low side (see Table 1 in Appendix).
However, the reasons for this variation are not immediately
apparent and merit more detailed investigation even though
we suspect that part of the differences between countries
may be due to the lack of comparability in labour market
definitions across surveys.
1. Facts and figures: what do we know (and do not know) about youth employment in Africa?
© AFD Working Paper N°49 • Youth and Labour Markets in Africa - A literature review
10
Figure 1a. Youth Labour Force Participation Rates by Region (1993 and2003)
Source: Global Employment Trends for Youth, ILO Annual Report 2004.
7 The list of included countries is: Algeria, Benin, Botswana, Burkina Faso, Burundi,Cameroon, Chad, Congo, Côte d’Ivoire, Egypt, Ethiopia, Gambia, Ghana, Libya, Madagascar,Mali, Mauritius, Morocco, Namibia, Nigeria, Rwanda, Senegal, Sudan, Tanzania, Tunisia andZimbabwe.
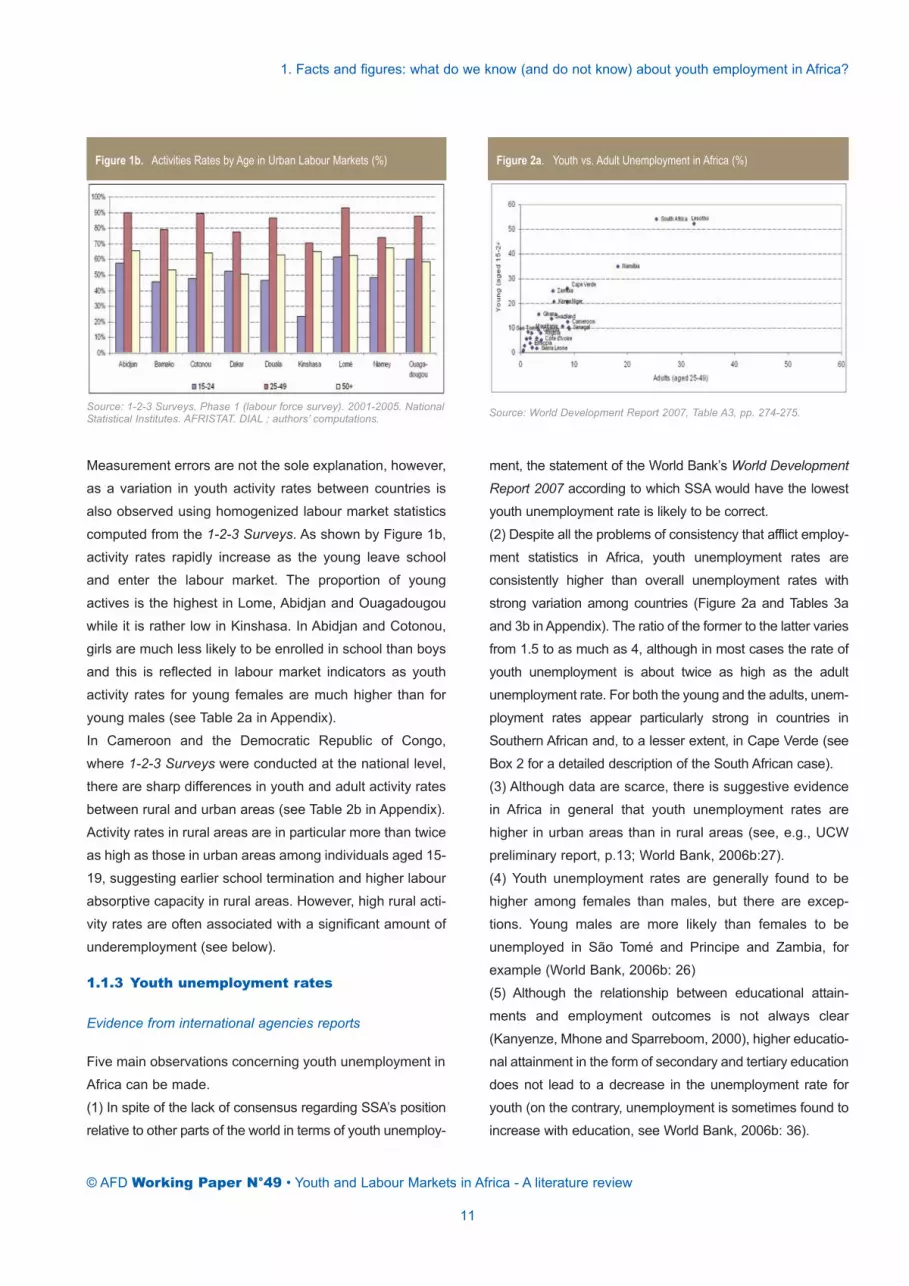
Measurement errors are not the sole explanation, however,
as a variation in youth activity rates between countries is
also observed using homogenized labour market statistics
computed from the 1-2-3 Surveys. As shown by Figure 1b,
activity rates rapidly increase as the young leave school
and enter the labour market. The proportion of young
actives is the highest in Lome, Abidjan and Ouagadougou
while it is rather low in Kinshasa. In Abidjan and Cotonou,
girls are much less likely to be enrolled in school than boys
and this is reflected in labour market indicators as youth
activity rates for young females are much higher than for
young males (see Table 2a in Appendix).
In Cameroon and the Democratic Republic of Congo,
where 1-2-3 Surveys were conducted at the national level,
there are sharp differences in youth and adult activity rates
between rural and urban areas (see Table 2b in Appendix).
Activity rates in rural areas are in particular more than twice
as high as those in urban areas among individuals aged 15-
19, suggesting earlier school termination and higher labour
absorptive capacity in rural areas. However, high rural acti-
vity rates are often associated with a significant amount of
underemployment (see below).
1.1.3 Youth unemployment rates
Evidence from international agencies reports
Five main observations concerning youth unemployment in
Africa can be made.
(1) In spite of the lack of consensus regarding SSA’s position
relative to other parts of the world in terms of youth unemploy-
ment, the statement of the World Bank’s World Development
Report 2007 according to which SSA would have the lowest
youth unemployment rate is likely to be correct.
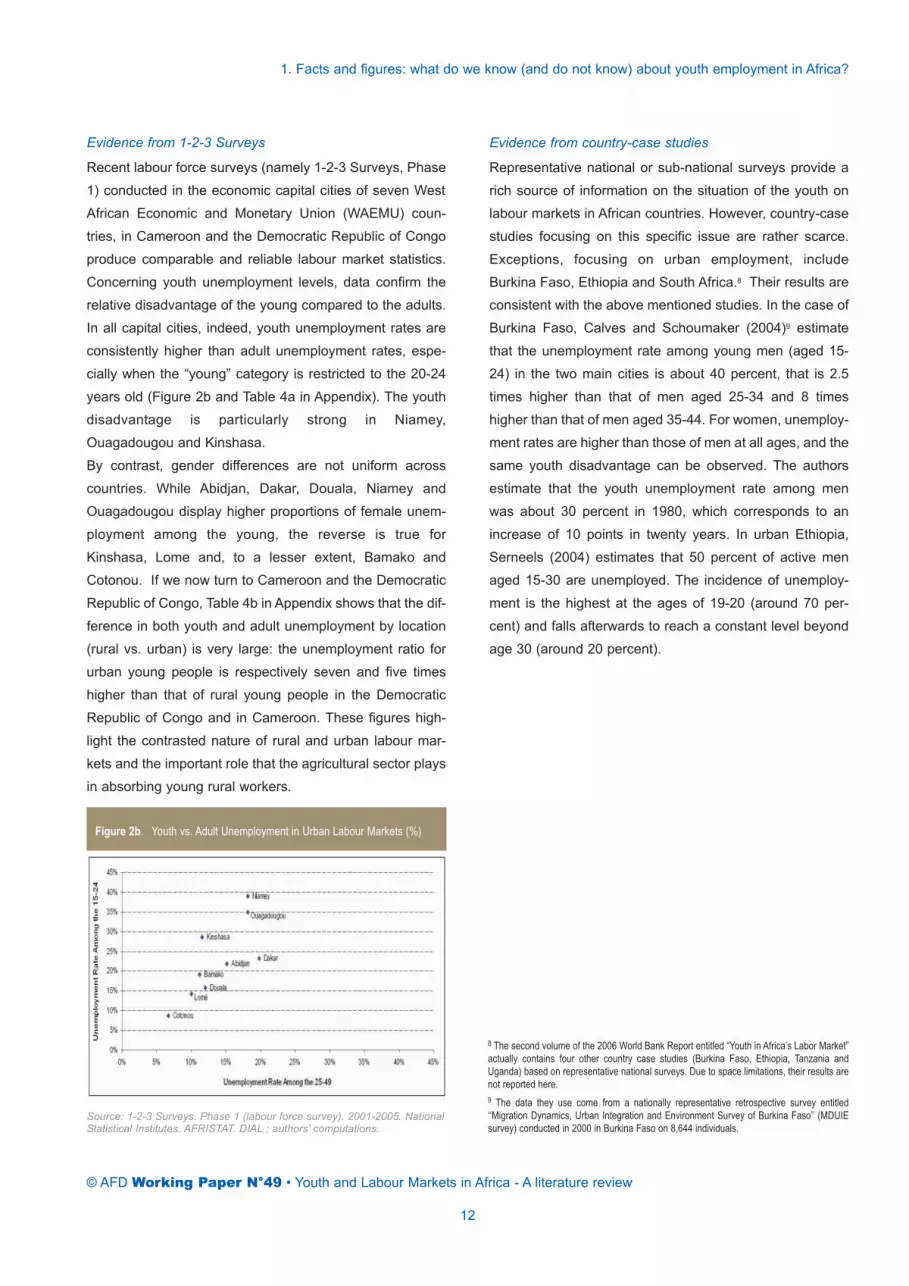
(2) Despite all the problems of consistency that afflict employ-
ment statistics in Africa, youth unemployment rates are
consistently higher than overall unemployment rates with
strong variation among countries (Figure 2a and Tables 3a
and 3b inAppendix). The ratio of the former to the latter varies
from 1.5 to as much as 4, although in most cases the rate of
youth unemployment is about twice as high as the adult
unemployment rate. For both the young and the adults, unem-
ployment rates appear particularly strong in countries in
Southern African and, to a lesser extent, in Cape Verde (see
Box 2 for a detailed description of the South African case).
(3) Although data are scarce, there is suggestive evidence
in Africa in general that youth unemployment rates are
higher in urban areas than in rural areas (see, e.g., UCW
preliminary report, p.13; World Bank, 2006b:27).
(4) Youth unemployment rates are generally found to be
higher among females than males, but there are excep-
tions. Young males are more likely than females to be
unemployed in São Tomé and Principe and Zambia, for
example (World Bank, 2006b: 26)
(5) Although the relationship between educational attain-
ments and employment outcomes is not always clear
(Kanyenze, Mhone and Sparreboom, 2000), higher educatio-
nal attainment in the form of secondary and tertiary education
does not lead to a decrease in the unemployment rate for
youth (on the contrary, unemployment is sometimes found to
increase with education, see World Bank, 2006b: 36).
1. Facts and figures: what do we know (and do not know) about youth employment in Africa?
© AFD Working Paper N°49 • Youth and Labour Markets in Africa - A literature review
11
Figure 1b. Activities Rates by Age in Urban Labour Markets (%) Figure 2a. Youth vs. Adult Unemployment in Africa (%)
Source: 1-2-3 Surveys. Phase 1 (labour force survey). 2001-2005. NationalStatistical Institutes. AFRISTAT. DIAL ; authors’ computations. Source: World Development Report 2007, Table A3, pp. 274-275.
Evidence from 1-2-3 Surveys
Recent labour force surveys (namely 1-2-3 Surveys, Phase
1) conducted in the economic capital cities of seven West
African Economic and Monetary Union (WAEMU) coun-
tries, in Cameroon and the Democratic Republic of Congo
produce comparable and reliable labour market statistics.
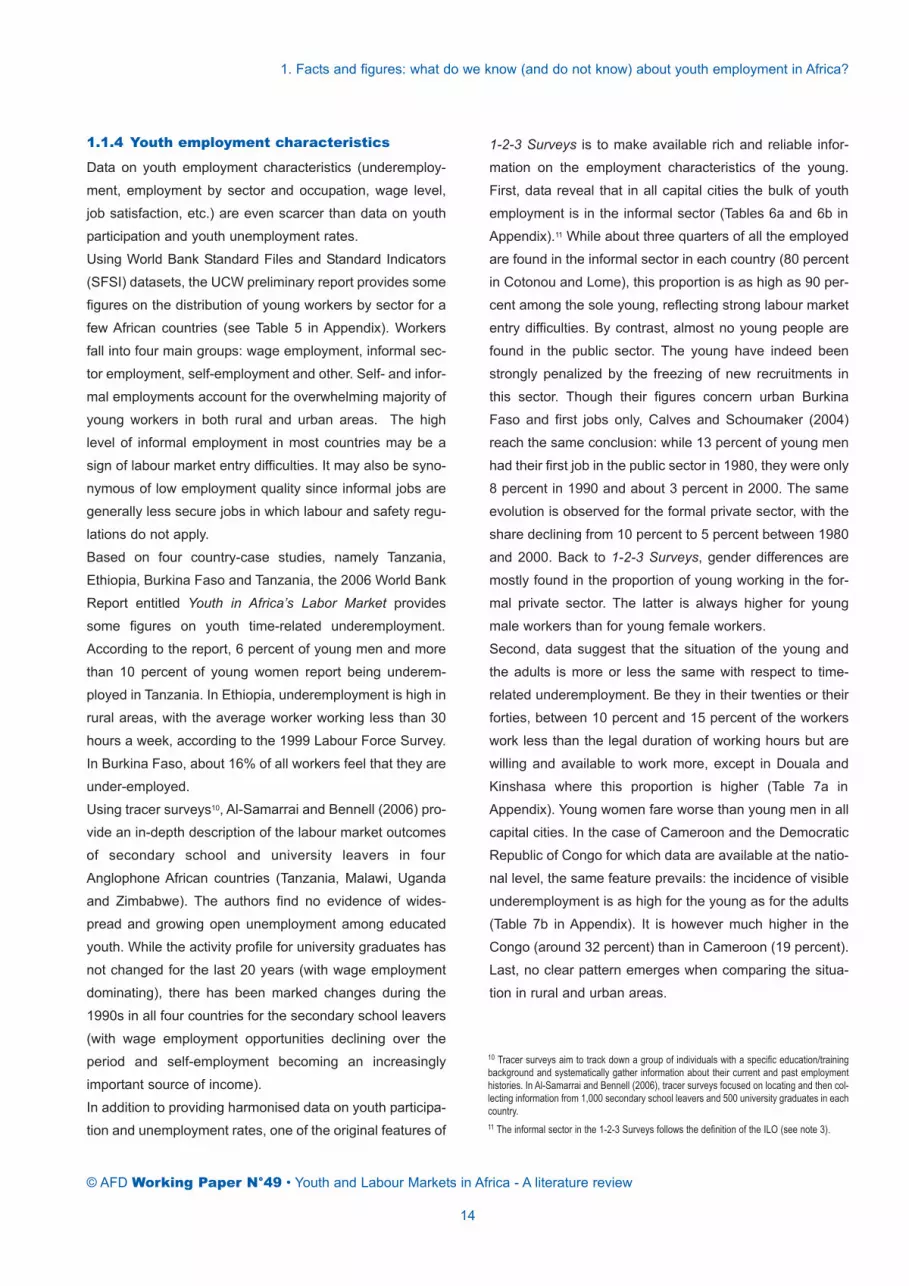
Concerning youth unemployment levels, data confirm the
relative disadvantage of the young compared to the adults.
In all capital cities, indeed, youth unemployment rates are
consistently higher than adult unemployment rates, espe-
cially when the “young” category is restricted to the 20-24
years old (Figure 2b and Table 4a in Appendix). The youth
disadvantage is particularly strong in Niamey,
Ouagadougou and Kinshasa.
By contrast, gender differences are not uniform across
countries. While Abidjan, Dakar, Douala, Niamey and
Ouagadougou display higher proportions of female unem-
ployment among the young, the reverse is true for
Kinshasa, Lome and, to a lesser extent, Bamako and
Cotonou. If we now turn to Cameroon and the Democratic
Republic of Congo, Table 4b in Appendix shows that the dif-
ference in both youth and adult unemployment by location
(rural vs. urban) is very large: the unemployment ratio for
urban young people is respectively seven and five times
higher than that of rural young people in the Democratic
Republic of Congo and in Cameroon. These figures high-
light the contrasted nature of rural and urban labour mar-
kets and the important role that the agricultural sector plays
in absorbing young rural workers.
Evidence from country-case studies
Representative national or sub-national surveys provide a
rich source of information on the situation of the youth on
labour markets in African countries. However, country-case
studies focusing on this specific issue are rather scarce.
Exceptions, focusing on urban employment, include
Burkina Faso, Ethiopia and South Africa.8 Their results are
consistent with the above mentioned studies. In the case of
Burkina Faso, Calves and Schoumaker (2004)9 estimate
that the unemployment rate among young men (aged 15-
24) in the two main cities is about 40 percent, that is 2.5
times higher than that of men aged 25-34 and 8 times
higher than that of men aged 35-44. For women, unemploy-
ment rates are higher than those of men at all ages, and the
same youth disadvantage can be observed. The authors
estimate that the youth unemployment rate among men
was about 30 percent in 1980, which corresponds to an
increase of 10 points in twenty years. In urban Ethiopia,
Serneels (2004) estimates that 50 percent of active men
aged 15-30 are unemployed. The incidence of unemploy-
ment is the highest at the ages of 19-20 (around 70 per-
cent) and falls afterwards to reach a constant level beyond
age 30 (around 20 percent).
1. Facts and figures: what do we know (and do not know) about youth employment in Africa?
© AFD Working Paper N°49 • Youth and Labour Markets in Africa - A literature review
12
Figure 2b. Youth vs. Adult Unemployment in Urban Labour Markets (%)
Source: 1-2-3 Surveys. Phase 1 (labour force survey). 2001-2005. NationalStatistical Institutes. AFRISTAT. DIAL ; authors’ computations.
8 The second volume of the 2006 World Bank Report entitled “Youth in Africa’s Labor Market”actually contains four other country case studies (Burkina Faso, Ethiopia, Tanzania andUganda) based on representative national surveys. Due to space limitations, their results arenot reported here.9 The data they use come from a nationally representative retrospective survey entitled‘‘Migration Dynamics, Urban Integration and Environment Survey of Burkina Faso’’ (MDUIEsurvey) conducted in 2000 in Burkina Faso on 8,644 individuals.
Box 2 – Youth and unemployment in South Africa
The characteristics of unemployment in South Africa have several main specificities, compared with the rest of SSA (Burger and Woolard,2005; Mlatsheni and Rospabe, 2002).
1/ The unemployment rate is extremely high (respectively 41 percent and 29 percent in 2002 according to the expanded or narrow defini-tions, among the highest worldwide), and the youth unemployment rate is even higher (70 percent using the expanded definition); the youthrepresent 76 percent of the unemployed. The very high unemployment rate indicates that the informal sector is not absorbing much surpluslabour; it is not fulfilling as elsewhere its role of “last resort employer”.
2/ The wide gap between the narrowly-defined unemployment rate and the “expanded” one is due to the very high percentage (around 12percent of the active population) of discouraged workers. Many of the non-searching unemployed live in remote areas with high unemploy-ment rates (Kingdon and Knight, 2000). A survey (see Kanyenze et al., 2000; du Toit, 2003) illustrates the discouragement of unemployedSouth African youth and the difficulties they face in searching for a job. The existence of a reservation wage is investigated by Nattrass(2002a) in two Cape Town townships.
3/ Indeed, the percentage of workers employed in the informal sector is relatively low (28 percent), which is much smaller than in many otherdeveloping countries especially in Africa. Since 1995, about one third of the newly created jobs have been in the informal sector where jobsare poorly paid and insecure, so that the quality of employment has deteriorated. These jobs have been mostly taken by African unskilledand semi-unskilled females (Casale and Posel, 2002).
4/ South African workers are mostly urbanised (less than 40 percent of the labour force reside in rural areas); the unemployment rate is muchhigher in rural than in urban areas (48 percent vs. 37 percent); it is especially high in areas previously classified as homelands; subsistenceagriculture plays a much less important role than in other developing countries, where unemployment is typically lower in rural than in urbanareas; the existence of rural unemployment (virtually inexistent in the rest of SSA) is made possible by social (such as old-age pensions) andurban migrants transfers.
5/ Most unemployed workers are unskilled (or semi-skilled); having completed secondary or some form of tertiary education substantiallyreduces the probability of being unemployed. The reverse is true elsewhere especially in WAEMU countries.
6/ Last of all, unemployment has a strong racial dimension; the unemployment rate for Africans (who have on average the lowest qualifica-tions) amounts to 48 percent, compared to only 10 percent for Whites, unemployment rates for Coloureds (32 percent) and Indians (25 per-cent) being in between.
These characteristics can be explained by the specificities of South Africa on the continent: development level, history and the heritage ofapartheid, etc. It seems that other Southern African countries (Lesotho, Swaziland, etc.), which are strongly integrated with the South Africaneconomy and labour market, share some of these characteristics.
The issue of the so-called rigidities on the labour market and their impact on the labour content of growth are strongly debated in South Africaas in the rest of Africa: have the existing labour regulations a negative impact on job creations, leading to youth unemployment? Some sur-veys rank South African laws among the most rigid (World Bank, 2006a). However, the causal relationship between these rigidities and thehigh unemployment rate has not been well established yet. (A more detailed discussion on labour market rigidities is provided in Section 4.2).
1. Facts and figures: what do we know (and do not know) about youth employment in Africa?
© AFD Working Paper N°49 • Youth and Labour Markets in Africa - A literature review
13
1.1.4 Youth employment characteristics
Data on youth employment characteristics (underemploy-
ment, employment by sector and occupation, wage level,
job satisfaction, etc.) are even scarcer than data on youth
participation and youth unemployment rates.
Using World Bank Standard Files and Standard Indicators
(SFSI) datasets, the UCW preliminary report provides some
figures on the distribution of young workers by sector for a
few African countries (see Table 5 in Appendix). Workers
fall into four main groups: wage employment, informal sec-
tor employment, self-employment and other. Self- and infor-
mal employments account for the overwhelming majority of
young workers in both rural and urban areas. The high
level of informal employment in most countries may be a
sign of labour market entry difficulties. It may also be syno-
nymous of low employment quality since informal jobs are
generally less secure jobs in which labour and safety regu-
lations do not apply.
Based on four country-case studies, namely Tanzania,
Ethiopia, Burkina Faso and Tanzania, the 2006 World Bank
Report entitled Youth in Africa’s Labor Market provides
some figures on youth time-related underemployment.
According to the report, 6 percent of young men and more
than 10 percent of young women report being underem-
ployed in Tanzania. In Ethiopia, underemployment is high in
rural areas, with the average worker working less than 30
hours a week, according to the 1999 Labour Force Survey.
In Burkina Faso, about 16% of all workers feel that they are
under-employed.
Using tracer surveys10, Al-Samarrai and Bennell (2006) pro-
vide an in-depth description of the labour market outcomes
of secondary school and university leavers in four
Anglophone African countries (Tanzania, Malawi, Uganda
and Zimbabwe). The authors find no evidence of wides-
pread and growing open unemployment among educated
youth. While the activity profile for university graduates has
not changed for the last 20 years (with wage employment
dominating), there has been marked changes during the
1990s in all four countries for the secondary school leavers
(with wage employment opportunities declining over the
period and self-employment becoming an increasingly
important source of income).
In addition to providing harmonised data on youth participa-
tion and unemployment rates, one of the original features of
1-2-3 Surveys is to make available rich and reliable infor-
mation on the employment characteristics of the young.
First, data reveal that in all capital cities the bulk of youth
employment is in the informal sector (Tables 6a and 6b in
Appendix).11 While about three quarters of all the employed
are found in the informal sector in each country (80 percent
in Cotonou and Lome), this proportion is as high as 90 per-
cent among the sole young, reflecting strong labour market
entry difficulties. By contrast, almost no young people are
found in the public sector. The young have indeed been
strongly penalized by the freezing of new recruitments in
this sector. Though their figures concern urban Burkina
Faso and first jobs only, Calves and Schoumaker (2004)
reach the same conclusion: while 13 percent of young men
had their first job in the public sector in 1980, they were only
8 percent in 1990 and about 3 percent in 2000. The same
evolution is observed for the formal private sector, with the
share declining from 10 percent to 5 percent between 1980
and 2000. Back to 1-2-3 Surveys, gender differences are
mostly found in the proportion of young working in the for-
mal private sector. The latter is always higher for young
male workers than for young female workers.
Second, data suggest that the situation of the young and
the adults is more or less the same with respect to time-
related underemployment. Be they in their twenties or their
forties, between 10 percent and 15 percent of the workers
work less than the legal duration of working hours but are
willing and available to work more, except in Douala and
Kinshasa where this proportion is higher (Table 7a in
Appendix). Young women fare worse than young men in all
capital cities. In the case of Cameroon and the Democratic
Republic of Congo for which data are available at the natio-
nal level, the same feature prevails: the incidence of visible
underemployment is as high for the young as for the adults
(Table 7b in Appendix). It is however much higher in the
Congo (around 32 percent) than in Cameroon (19 percent).
Last, no clear pattern emerges when comparing the situa-
tion in rural and urban areas.
1. Facts and figures: what do we know (and do not know) about youth employment in Africa?
© AFD Working Paper N°49 • Youth and Labour Markets in Africa - A literature review
14
10 Tracer surveys aim to track down a group of individuals with a specific education/trainingbackground and systematically gather information about their current and past employmenthistories. In Al-Samarrai and Bennell (2006), tracer surveys focused on locating and then col-lecting information from 1,000 secondary school leavers and 500 university graduates in eachcountry.11 The informal sector in the 1-2-3 Surveys follows the definition of the ILO (see note 3).

On the other hand, there are marked differences between
young and adults in terms of invisible underemployment
where invisible underemployment includes all workers ear-
ning less than the minimum hourly wage (Figure 3 and
Table 8a in Appendix). Despite variation in levels between
capital cities, the incidence of invisible underemployment
among the young is almost twice as high as that of adults
in most cities except Kinshasa where the difference is less
strong. It is thus very likely that the share of working poor is
higher among young people than among adults. As for
visible underemployment, young women are found to be
more concerned than young men. The cases of Cameroon
and the Democratic Republic of Congo finally suggest that
the incidence of invisible underemployment is higher in
rural areas than in urban ones (Table 8b in Appendix).
Third, being less experienced and working less hours than
older workers, young people are also found to earn signifi-
cantly less than their older counterparts (Figure 4 and
Tables 9a and 9b in Appendix). However, as noted by ILO’s
Global Employment Trends for Youth 2004, the question of
how much ‘less’ is acceptable and how much ‘less’ reflects
discrimination against young people is very hard to judge
and requires more detailed statistical analyses that are
beyond the scope of this report.
Last, 1-2-3 Surveys provide various indicators on youth and
adult job satisfaction that complete the picture of labour
market conditions for young people (Brilleau et al., 2005).
Among employed youth, 35 percent are satisfied with their
job and do not plan to look for another job in the near futu-
re. Surprisingly enough, this proportion does not significant-
ly vary between sectors: it amounts to 37 percent in the
public sector against 36 percent in the informal sector. On
the other hand, 51 percent of the employed young would
like to get a new job. This proportion decreases with age
and income in all capital cities. This means that pressure on
the labour market comes not only from the unemployed but
also, and in a substantial proportion, from those already
employed but dissatisfied with their job. Finally, the wishes
expressed by the young reveal a strong mismatch between
their preferences and real job opportunities. 27.2 percent of
the young would like to get a job in the public sector whe-
reas only 4 percent of new jobs were created in this sector
during the year preceding data collection. By contrast, the
informal sector appeals to only 48.4 percent of the young
even though 81.7 percent of new jobs were created in this
sector. The same kind of results is obtained by Serneels
(2004) in the case of Ethiopia. According to the author, half
of the young unemployed in urban Ethiopia are looking for
a job in the public sector, in spite of the lack of new recruit-
ments. These results suggest that strong disillusions
among the young are to come, that could well give rise to
severe political and social tensions.
1. Facts and figures: what do we know (and do not know) about youth employment in Africa?
© AFD Working Paper N°49 • Youth and Labour Markets in Africa - A literature review
15
Source: 1-2-3 Surveys. Phase 1 (labour force survey). 2001-2005. NationalStatistical Institutes. AFRISTAT. DIAL ; authors’ computations.
Figure 3. Incidence of Invisible Underemployment by Age (%)
Source: 1-2-3 Surveys. Phase 1 (labour force survey). 2001-2003. NationalStatistical Institutes. AFRISTAT. DIAL ; authors’ computations.
Figure 4. Mean Monthly Earnings by Age in PPA 1,000 CFA Francs (MainActivity)
The situation of youth on African labour markets has many
economic, social and political consequences: first of all, the
absence or weakness of labour income negatively affects
the welfare of the youth in a broad sense12, while their vul-
nerability to negative shocks increases their probability of
becoming or staying poor. According to ILO (2006), the
number of youth working poor in Africa (near 60 percent of
total youth employment) is increasing. However, this issue
does not seem to have been studied in depth yet in the eco-
nomic literature.
Other consequences include: a delayed social integration
and modification of their demographic behaviour; disruptive
social behaviour and participation to armed conflicts; migra-
tions, etc. We review hereafter existing evidence and stu-
dies on these three other types of consequences.
1.2.1 Delayed social integration
Several recent studies provide evidence on the relationship
between youth unemployment (or, more broadly, access to
employment) and social integration.
The problem of delayed social integration has been analy-
sed in the case of three African cities by Antoine et al.
(2001). Using biographical data from surveys of inhabitants
of Dakar, Yaoundé and Antananarivo, they show that social
integration has been delayed for urban young adults with
regard to three main events: access to the first job, marria-
ge, and residential autonomy. The researchers put forward
the hypothesis that difficult access to the first job and the
lengthening of studies lead young men to put off their mar-
riages by between 5-10 years. Because, contrary to many
European countries, residential autonomy is the last step to
be taken for young people before their independence, the
percentage of those who have left the parental household
at the age of 25 is falling sharply (only one fourth for the
younger generation in Dakar).
In South Africa, Klasen and Woolard (2005) provide some
evidence of similar mechanisms. Analysing household sur-
veys conducted in 1993, 1995 and 1998, they find that the
household formation response of the unemployed is the cri-
tical way by which the unemployed assure access to
resources. In particular, unemployment delays the setting
up of an individual household by young persons, in some
cases by decades. It also leads to the dissolution of existing
households and a return of constituent members to parents
and other relatives and friends.
In rural areas, some evidence also supports the finding of
delayed social autonomy for young adults. According to
Ayalew, Dercon and Krishnan (2000), young adults in rural
Ethiopia have more and more difficulties accessing to land.
As a result, they end up dependent on their families and
farm plots are subdivided into ever smaller parcels. In a vil-
lage of North-Western Rwanda, André and Platteau (1998)
also find that young adults have difficulties leaving their
parents and setting up their own households. More specifi-
cally, they find that, between 1988 and 1993, the proportion
of children in age of marriage (20 to 25 years old) but still
living with their parents has increased more than two fold.
1.2.2 Disruptive social behaviour and armedconflict
Social behaviours that have negative externalities on the
economy are also frequently cited as a consequence of the
situation of young people on the labour market.
The combination of poverty and reduced social contacts
faced by unemployed young people, especially urban
migrants, may lead them to engage in criminal activities,
drug addiction or prostitution.13 Apart from the fact that they
increase health hazard, these activities further take young
people away from the “normal” labour market. According to
Nattrass (2002b), crime and violence have been increasing
in many parts of SSA among unemployed young people.
Youth gangs typically satisfy the economic and social
needs of unemployed young people through violence.
1. Facts and figures: what do we know (and do not know) about youth employment in Africa?
© AFD Working Paper N°49 • Youth and Labour Markets in Africa - A literature review
16
1.2 What are the consequences?
12 UNAIDS (2004) argues that unemployed young people are at a much higher risk of contrac-ting HIV/AIDS than are employed young people. This is due to persistent behavioural risks,and lack of information, education and services. Young unemployed women are more vulne-rable to HIV infection than are young men. However, this issue does not seem to be well docu-mented yet.13 ILO (2005) reports that unemployment has driven many young women and girls into sexwork. The lack of job opportunities and their disadvantageous social role, both in terms ofassets (education and health) and cultural norms, make them more likely to end up as sexworkers. The demand for commercial sex workers from international tourism flows to Africa ison the rise.
Sustained unemployment could cause young people to be
hostile to the world of work and more receptive to drugs and
crime. This has also been documented in the case of
Rwanda before the civil war by Maton (1994).
While it would certainly be an exaggeration to claim that
youth unemployment is directly responsible for the high pre-
valence of civil conflicts on the African continent, it is likely
that the availability of young unemployed men, possibly
involved in criminal activities or addicted to drugs, fuels
these conflicts. In the context of the current age profile of
African populations, the quite widespread shortages of
opportunities for regular productive employment or self-
employment create conditions in which it is hardly surpri-
sing if many youths do not need to be coerced to join in civil
war (Austin, 1999). This fact has been mainly documented
in the academic discussion of the Liberian and the Sierra
Leonean wars which has focused on the role of the poor,
socially marginal young males (see for instance Peters and
Richards, 1998). In a recent study on Sierra Leone,
Richards, Bah and Vincent (2004) show that the conflict
was fought primarily by unemployed marginalized young
men coming mainly from rural areas.
In a relatively recent paper, Urdal (2004) empirically tests
the notion that “youth bulges” – historically large youth
cohorts relative to the total population – make countries
more susceptible to armed conflict. This assumption is tes-
ted in an event history statistical model covering a high
number of countries and politically dependent areas over
the period 1950-2000. The study provides support for the
hypothesis that youth bulges increase the risk of domestic
armed conflict, and that the combination of youth bulges
and poor economic performance can be explosive. The
authors also argue that the lack of support of the youth
bulge hypothesis in previous World Bank studies (Collier,
2000; Collier and Hoeffler, 2001) results from an empirical
misspecification of the youth bulge measure.
1.2.3 International migrations and brain drain
McKenzie (2006) shows that, generally, people around 20
years old have a higher propensity to migrate (in the case
of the United States, the distribution curve of male immi-
grants’ age peaks at 20); but that skill immigration criteria,
like those applied by Canada, tend to increase the age of
immigrants. Moreover, he finds that young people represent
a higher proportion of the flow of international migrants than
the stock. In other words, the average youth immigrant is
much more likely to have recently arrived in the host coun-
try than older migrants.
Narayan and Petesch (2006) show that, in Morocco, the dif-
ficulty of obtaining good jobs locally feeds emigration.
Facing poor job prospects, young men and women see
migration overseas as the best way to have a better life,
and regularly save money to emigrate legally or illegally
abroad. This positive view of migration is shared by adults
who consider migration as one of the main factors helping
the best-off households, and as a way out of poverty.
Based on two complementary databases made available
only recently on the stocks of international migrants in
OECD countries (Docquier and Marfouk, 2006; Dumont
and Dumaître, 2004), Gubert and Nordman (2006) provide
a detailed picture of the levels, trends, determinants and
prospects of migration from the Middle East and North
Africa (MENA) region to OECD countries. The authors
show that the expatriation rates of the most educated
migrants are the most reactive ones to the population den-
sity in the origin country. One interpretation of this finding is
that the brain drain is responsive to demographic pressure
in the origin country. In particular, the share of the young in
the origin population is found to exert a positive influence
on expatriation rates suggesting that migration flows are
predominantly composed of young people.
Finally, some authors argue that skilled migration may indu-
ce positive effects on developing countries under certain
conditions (Docquier, 2006; Docquier and Sekkat, 2006).
From some macroeconometric studies reviewed in
Docquier (2006), the author finds that the threshold emigra-
tion rate above which the brain drain becomes harmful for
development can be prudently estimated between 15 and
20 percent in low-income countries. The average optimal
emigration rate (which maximizes country gains) probably
lies between 5 and 10 percent. Docquier (2006) finally
observes that “unfortunately, many poor regions such as
Sub-Saharan Africa and Central America, are well above
that “optimal” threshold”.
1. Facts and figures: what do we know (and do not know) about youth employment in Africa?
© AFD Working Paper N°49 • Youth and Labour Markets in Africa - A literature review
17
Knowledge gaps:
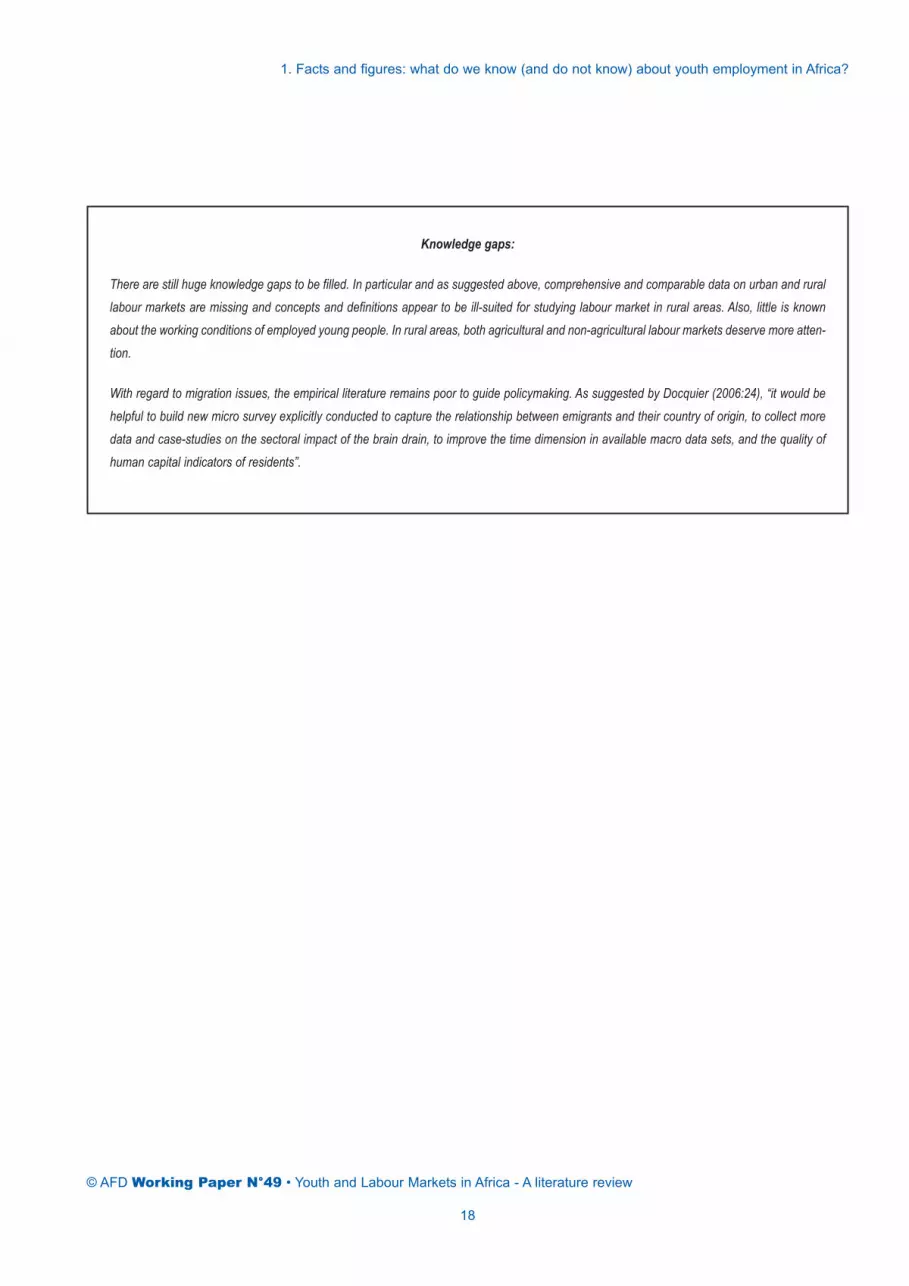
There are still huge knowledge gaps to be filled. In particular and as suggested above, comprehensive and comparable data on urban and rurallabour markets are missing and concepts and definitions appear to be ill-suited for studying labour market in rural areas. Also, little is knownabout the working conditions of employed young people. In rural areas, both agricultural and non-agricultural labour markets deserve more atten-tion.
With regard to migration issues, the empirical literature remains poor to guide policymaking. As suggested by Docquier (2006:24), “it would behelpful to build new micro survey explicitly conducted to capture the relationship between emigrants and their country of origin, to collect moredata and case-studies on the sectoral impact of the brain drain, to improve the time dimension in available macro data sets, and the quality ofhuman capital indicators of residents”.
1. Facts and figures: what do we know (and do not know) about youth employment in Africa?
© AFD Working Paper N°49 • Youth and Labour Markets in Africa - A literature review
18
© AFD Working Paper N°49 • Youth and Labour Markets in Africa - A literature review
19
2. Causes of the youth labour market disadvantage: a supply-sideperspective
In this section, we focus on the supply side of youth
employment. We describe the main characteristics of the
youth workforce (weight in total population, education, etc.)
and review the evidence on the link between human capital
(including on-the-job training) and access to employment
as well as returns to education. Indeed, young people are
often at the end of the job queue for the formal labour mar-
ket because they lack adequate skills and experience, as
well as efficient social networks (see Box 3). We also pre-
sent the results of studies on the individual impact on
employment of possessing some other forms of capital
(social capital, land and physical capital).
Box 3 – Why are youth unemployment rates higher than adult unemployment rates?
According to ILO (2006), there are many likely explanations14 (for the case of south-east Europe, see also Kolev and Saget, 2005),
- The last-in, first-out explanation. Youth are more vulnerable than adults in difficult economic times. They are likely to have less work expe-rience than adults. Assuming that employers seek employees with past experience, the youth who is entering the labour force for the firsttime will be at a disadvantage and have a harder time finding employment vis-à-vis an adult with a longer history of work experience. In timesof surplus labour competing for a limited amount of jobs, the youth will be the “last in”. Similarly, because a younger worker is likely to haveless tenure than an adult worker, less company funds invested in them for training purposes and to have a temporary contract, it will be consi-dered cheaper to let the younger worker go in times of economic downturns. Thus, young workers will be the “first out”.
- The lack of job search experience explanation. A young person often lacks both labour market information and job search experience. Inmany developing countries, it is only through informal placement methods – typically through family and friends – that a young person findswork. Beyond the word of mouth approach through families and friends, they simply might not know how and where to look for work. Adults,on the other hand, might have the possibility of finding future work through references from previous employers or colleagues and are morelikely to know the “right” people.
- The “shopping around” explanation. Another possibility is that youth might take longer to “shop around” for the right job, meaning they mightwait longer to find work that suits their requirements. This, however, implies that a support structure, such as the family, exists to economi-cally support them while they search for work. In low-income countries, this support structure does not exist for the majority of young peopleand as a result, a young person simply cannot afford to be unemployed and is likely to take whatever work becomes available, regardlessof working conditions or whether or not the job fits his/her education or skills-base.
The explanations given above are a mixture of demand-side causes and supply-side causes that are analysed in sections 3 and 4 togetherwith more general analyses of unemployment in Africa and offer-demand mismatch. The “shopping around” behaviour explains well in ourview (but not exclusively) the high unemployment rate of educated people.
14 We only refer here to the explanations which seem adequate for African countries.

2.1.1 Weight of the young generations in thepopulation and its likely evolution
In a macroeconomic perspective, the weight of the young
generations in the population is often invoked as one of the
causes for the difficult insertion of the new generations on
the labour market (UNECA, 2005).
The youth currently represents 21 percent of the African
population, compared to about 18-19 percent for other
developing regions (Asia and Latin America) and 14 per-
cent in Europe. Available country data indicate that some
African countries have fairly higher youth’s shares than
others.
While the share of the youth in the total population has star-
ted to decrease markedly in major developing regions and
in the world as a whole since the mid-eighties, this is not the
case in Africa, where the share of the youth can be estima-
ted to stop increasing around 2005 (see Figure 5)15. No
strong decline of the youth’s share in the labour force can
therefore be expected in the medium run.
According to ILO calculations, in SSA “the youth labour
force is expected to grow in pace with the adult labour force
at least until 2015 despite the HIV/AIDS pandemic which
seems to have a bigger impact on young people” (ILO
2004, p.3). There are however differences among African
countries: the share of the youth declined in Morocco bet-
ween 1995 and 2002, while it increased in Algeria during
1995-2000; over a comparable period, it rose sharply in
Benin but fell in Mauritius, etc. These national differences
are certainly worth investigating in conjunction with youth
labour market outcomes, since they could help clarify the
relative importance of this demographic factor as a cause of
the youth labour market disadvantage. In the case of
Ethiopia, Rosati (2006) finds that local labour markets with
the largest share of youth in the population have the highest
youth unemployment rates (see O’Higgins, 2003 for a study
on 32 developing and transition countries).
2.1.2 Rural-urban distribution of the youngpopulation
We have stressed above the differences between urban
and rural areas regarding the labour market situation of the
youth. In terms of demographic structure, it is a priori
unclear which have a higher youth share, and therefore
face a potential higher excess supply of young people: rural
areas because of higher fertility, or cities because of inter-
nal migration? Although there are exceptions, the youth’s
share is generally found to be higher in urban areas, indica-
ting that the challenges faced by urban labour markets
regarding the insertion of youth may be higher than in rural
areas. However, as we will see below, cities are also the
location of potentially more diverse and more dynamic
labour demand sources.
2.1.3 Education level of the workforce
Although education is the main factor of productivity, it
remains desperately rare in Africa, even if progress has
been made for the past 15 years. According to the EFA
Report 2002, while the net primary enrolment rate amoun-
ted to 83 percent worldwide, it was only 57 percent in SSA,
the lowest rate of any region. However, enormous progress
is being made. According to the World Bank (2006b), since
1990, eight of the developing world’s ten top performers in
annual increases in primary completion rates have been in
Africa (Benin, Eritrea, Ethiopia, Guinea, Mali, São Tomé
and Principe, Togo, and Malawi). Primary completion rates
in these countries have grown by more than 5 percent a
2. Causes of the youth labour market disadvantage: a supply-side perspective
© AFD Working Paper N°49 • Youth and Labour Markets in Africa - A literature review
20
2.1 Characteristics of the labour supply
Figure 5. Share of the youth (age 15-24) in the total population, 1975-2025,by region (%)
Source: UN World Population Prospects: The 2004 Revision. 15 Source: UN estimations and projections.
year, well above the low-income country average of 0.8 per-
cent a year. Obviously, this global trend hides enormous
national disparities with, on the one hand, countries like
Rwanda where primary education is practically universal
(NER of 97 percent) and on the other, Niger, where only 21
percent of children of primary school age are effectively in
school. In addition to having the lowest enrolment rates,
Africa is also the region in the world where the girl/boy dis-
parities are the highest, with an average gap of 20 points in
enrolment rates to the detriment of women.
However, enrolment rates alone cannot provide a clear pic-
ture of the stock of human capital available because, on the
one hand, knowledge gained from schooling (in this case
reading and writing) is only completely acquired once the
individual has achieved a minimum level of study (6 years
in primary school) and, on the other, it is vital to take into
account the total length of study. Figures from World Bank
(2006a) indicate that in many countries the minimum mas-
tery rate is lower than the net enrolment rate. It also shows
that less than a third of children in Malawi, Namibia and
Tanzania achieved minimum mastery in literacy by grades
4–6, even though the average net enrolment rate was
about 65 percent. In Ghana and Zambia, half or fewer of all
young women ages 15-24 can read a simple sentence after
even grade 6.
Kuepie, Nordman and Roubaud (2006) examine this ques-
tion using the 1-2-3 Surveys on seven main West African
cities (PARSTAT project). Their results indicate that even if
the average individuals’ level of education in each capital is
much higher than that found for the overall country, the
accumulation of education remains low in all seven cities:
the average number of years of completed schooling is only
about five years, and over half of the individuals aged 15
years or over (55 percent) either never attended school or
attended school but did not complete primary cycle. Yet
people are only considered to be literate as adults when
they have completed primary school. On this basis, they
estimate the proportion of literate individuals aged 15 and
over in the WAEMU cities in the early 2000s at 45 percent.
Moreover, these literate individuals’ level of education was
extremely modest since nearly half of them did not go
beyond the Secondary College (first four-year cycle of
secondary education), and less than a quarter completed
the second secondary cycle (total of seven years of secon-
dary education), with the possibility of enrolment in higher
education.
Kuepie et al. (2006) highlight the fact that the distribution of
individuals aged 15 and over by level of education in each
of the cities taken separately is pyramid-shaped with a
broad base and a very narrow summit. This is indicative of
a high level of illiteracy (at least 44 percent) and high drop-
out rates between and within the cycles. Possession of the
minimum human capital (i.e. at least completed primary
schooling) also varies markedly by gender. Women are lar-
gely disadvantaged in that nearly two-thirds (64 percent)
did not complete primary school (as opposed to 45 percent
of men). This rate rises to 68 percent in Dakar, Niamey and
Bamako. Even in the cities with the longest-standing and
most developed schooling (Cotonou and Lome), women
remain largely on the fringes: 59 percent did not complete
primary school.
When studied by generation, more under-35s (48 percent)
have the minimum level of schooling compared to their
elders aged 35 to 44 (44 percent) and especially those
aged 45 and over (34 percent). This configuration reflects
the steady development of the education system in the
African countries. Yet the schooling dynamic is not the
same everywhere. At one end of the scale, there are the
cities with a long tradition of schooling. At the other end of
the spectrum are those where the development of schoo-
ling has been stepped up more recently. The first group
comprises Lome, Abidjan and Cotonou where, even among
the individuals aged 45 to 59, a significant proportion (at
least 45 percent) has the minimum level of schooling. In the
second group (Bamako, Niamey and, to a certain extent,
Ouagadougou), over 60 percent of the over-35s do not
have the minimum level of schooling. Dakar stands out for
its stagnation (at around 60 percent) in the proportion of
individuals without the minimum grounding in education
across all generations (15 to 59 years old).
A last point worth mentioning about the educational land-
scape of the major WAEMU cities is the low weight of voca-
tional education, which never exceeds 2 percent of the
over-15s with the notable exception of Mali where it comes
to 6 percent. This is characteristic of an education system
in which vocational training is left by the wayside.
2. Causes of the youth labour market disadvantage: a supply-side perspective
© AFD Working Paper N°49 • Youth and Labour Markets in Africa - A literature review
21

In Africa, education is often seen as the main policy instru-
ment in the fight against poverty because it may help indi-
viduals access better jobs and thus raise their labour ear-
nings. However, in practice, although the value of education
is strongly reaffirmed as an intrinsic component of develop-
ment and of the well-being of populations (through the
Millennium Development Goals, the Education for All initia-
tive, etc.), its economic efficiency, on the contrary, is more
contested.
2.2.1 Education and access to employment
Does education help young people get a job? The shortanswer to this complex question is: much less now than in
the past. Before the era of structural adjustment, in a
context where average education levels were very low and
where the rising population and state involvement in active
development strategies implied a growing public sector,
diplomas were keys to obtain a job in this segment.
However, since the end of the 80’s, the economic crises
and the limitation of public expenditure in most African
countries have meant that these employment opportunities
for educated young people have greatly shrunk. In the case
of Burkina Faso, Calvès and Schoumaker (2004) compare
the employment outcomes of three successive birth cohorts
when they were aged 15-24.16 One of their results concerns
the nature of the first job held by young people. For unedu-
cated young men and women, the first job is almost always
in the informal sector (a bit more than 90 percent for men,
slightly less than 100 percent for women), with little change
across cohorts. In the case of the educated, however, stri-
king changes have taken place: while the share of informal
first jobs was respectively 56 percent and 74 percent for
young men and women of the oldest generation, this per-
centage has jumped to 91 percent of men and 94 percent
of women for the youngest cohort. This means that formal
education no longer makes a difference in terms of initial
access to modern sector employment. However, the subse-
quent experience of educated and uneducated individuals
does differ. In a recent work based on the 1-2-3 Surveys,
Kuepie et al. (2006) show that the involvement in the infor-
mal sector decreases as the education level rises.
Regarding unemployment, the available evidence is that
education does not have a protective effect. In Tunisia, the
unemployment rate for youth with higher education is 1.6
times higher than for those with primary education (40 per-
cent compared to 25 percent) (World Bank, 2003). In the
late 1990s and early 2000s, in Côte d’Ivoire, Rwanda, and
Senegal the unemployment rate for those with postsecon-
dary education was seven to eight times higher than that for
those with just primary education (World Bank, 2006a). In
WAEMU countries, Kuepie et al. (2006) find that unemploy-
ment levels generally increase with the level of education,
at least until the end of the secondary. This result is qualita-
tively similar to that of Serneels (2004) in the case of urban
Ethiopia in 1994. Focusing on young men aged 15-30, who
face an unemployment rate of 50 percent, he finds that the
probability of being unemployed increases with education
up to the senior secondary level, while the impact of tertia-
ry education is insignificant. Serneels provides an explana-
tion for this result: he shows that more educated young
people have higher aspirations and therefore are willing to
remain unemployed until they obtain the job they want, typi-
cally in the public sector. However, the World Bank (2006b)
points out that, over time, as youth gain initial experience,
higher education increases the employment incidence and
enhances occupational mobility. From the 2000/2001 ILFS
(Integrated Labor Force Survey) in Tanzania for instance,
controlling for experience, the incidence of employment
among urban men with the highest level of education is
estimated to be about 26 percentage points higher than
among men with no education.
2. Causes of the youth labour market disadvantage: a supply-side perspective
© AFD Working Paper N°49 • Youth and Labour Markets in Africa - A literature review
22
2.2 Education, access to employment and returns to education and training
16 The Calvès and Schoumaker (2004) study focus on the two main cities of the country,Ouagadougou and Bobo-Dioulasso. The first cohort are people born between 1955 and 1964and who were living in the two cities when they were 15-24 y.o., the second cohort was bornbetween 1965 and 1974 and the third cohort is made up of contemporary youth (born 1975-1984).

Knowledge gaps:
The role of education in access to employment, and more generally the link between human capital investment, informal sector participation, andwork trajectories are promising fields of research in the African context. Indeed, little is known on the complex mechanisms of over education forinstance which may give birth to high unemployment rates of the skilled labour force (in North Africa for instance). Moreover, knowledge is lac-king regarding possible gender specificities in access to employment, in particular in the informal sector.
2. Causes of the youth labour market disadvantage: a supply-side perspective
© AFD Working Paper N°49 • Youth and Labour Markets in Africa - A literature review
23
2.2.2 The private rate of returns to education(RORE)
Education policies can help reduce poverty by increasing
the earned income of the most educated workers. It is the-
refore useful to know the private rate of return to education
(RORE) for individuals with different living standards in dif-
ferent countries. If returns to education are high for indivi-
duals from poor families, poverty reduction policies desi-
gned to promote equal opportunities in access to schooling
would be appropriate.
According to the standard human capital theory, private
ROREs are thought to result from wage compensations for
workers’ different levels of human capital endowment. The
Mincer earnings model derives directly from the theory’s
assumption that individuals are paid based on their margi-
nal productivity. However, numerous objections and criti-
cisms have been made regarding the assumption that edu-
cation and productivity are the only determinants of diffe-
rences in individuals’ earnings. The premises of the human
capital model were based on developed countries (mainly
the United States). Yet many authors have demonstrated,
particularly in an African context, that the traditional human
capital theories postulating the levelling of income levels
between individuals with identical levels of human capital
endowments do not fit when markets are imperfect or seg-
mented.
General findings on the RORE in Africa
From the latest regional assessment on the economic
return to educational investments (Psacharopoulos and
Patrinos, 2002), it emerges that Africa is the continent in
which:� private and social returns to education are high: one
additional year of schooling provides an 11.7 percent
increase in individual earning in Africa against an avera-
ge of 9.7 percent for the rest of world;
� private and social returns to education are much higher
in primary than in secondary or tertiary education: social
returns amount to 25.4 percent in primary education
against 18.4 percent in secondary education and 11.3
percent in higher education.
In addition, from Psacharopoulos’ review, it emerges that
private returns tend to decrease when the level of education
improves (concave RORE) and that at a given level of edu-
cation, private returns decrease with the level of develop-
ment (and social returns follow the same trends).
However, many authors cast doubt on the validity of the
available estimates of the ROREs in Psacharopoulos and
Patrinos (2002) review. For instance, a recent study by
Schultz (2004) shows that in six countries of SSA, private
returns are higher in secondary and tertiary education.
While the surveys used in Schultz (2004) are representati-
ve of the population, this is not true for many countries in
Psacharopoulos and Patrinos (2002). In a critical review of
the RORE literature in SSA, Bennell (1996a) also points out
“empirical shortcomings which seriously undermine the cre-
dibility of aggregate RORE estimates for the continent as a
whole.” A number of other recent studies have estimated
the private RORE in SSA, using household level data or
population surveys17.
Other studies make use of firm level and matched worker-
firm data. Using panel data on manufacturing firms of
Cameroon, Ghana, Zambia, Kenya and Zimbabwe, Bigsten
et al. (2000) assess the importance of the returns to human
17 These include Mwabu and Schultz (1996, 2000), Siphambe and Thokweng-Bawena (2001),Michaud and Vencatachellum (2003), Kazianga (2004), Lassibille and Tan (2005), Girma andKedir (2005), Nordman and Roubaud (2005), Casero and Seshan (2006), Kuepie, Nordmanand Roubaud (2006), Ewoudou and Vencatachellum (2006), Dragoset and Vilhuber (2006)and Parent (2006).
capital relative to physical capital. They find that rates of
return on physical capital exceed 20 percent and are much
higher than the average return on human capital. Muller
and Nordman (2004, 2005, 2006a) estimate the ROREs in
Morocco and Tunisia using non-representative samples of
workers in manufacturing plants. They account for the effect
of the firms’ wage policy on earnings and find that this
affects the extent of the returns to human capital. More spe-
cifically, they show that accounting for within-firm human
capital externalities with matched worker-firm data signifi-
cantly reduces the extent of the ROREs in both countries.
Another interesting study that makes use of matched wor-
ker-firm data for eleven African countries is carried out by
Fafchamps, Söderbom and Benhassine (2006). Their
results indicate that the education wage gap (the difference
in earnings between workers at different levels of schoo-
ling) can be divided into three parts: sorting across firms,
sorting across occupations within firms, and the rest from
higher wages paid to better educated workers in the same
firm and occupation. On average across the 11 countries,
sorting across firms accounts for one fifth of education
wage gap while sorting across occupations accounts rough-
ly for one third. This suggests that most of the effect of
human capital on earnings operates through job selection.
Differing ROREs across sectors of employment
Many studies referring to the RORE in these countries over-
look the fact that the existence of different employment seg-
ments can have major implications as to the role of educa-
tion in labour market insertion18. Several recent studies esti-
mate the RORE in Africa with a cross-sector viewpoint:
Lassibille and Tan (2005) in Rwanda, Casero and Seshan
(2006) in Djibouti; Kazianga (2004) in the public and priva-
te formal sectors of Burkina Faso; in the last two papers,
ROREs are found to differ substantially between the priva-
te and public sectors and between men and women (the lat-
ter is estimated only in Burkina Faso).
Kuepie et al. (2006) contribute to this research issue by pro-
viding estimates for the informal or self-employed sector
(non-wage earners) in seven West African capitals and
control for the endogenous sector choice selection as well.
In five cities out of seven, the estimates show that the public
sector is the sector in which education is given the most
value. The modern private sector comes next (except in
Niamey and Lome where it is the most rewarding) and,
finally, the informal sector (with the exception of
Ouagadougou where the informal sector comes before the
formal private sector).
RORE in agriculture
Although there is little doubt that better educated workers
earn higher wages in the modern sector, whether education
raises farm productivity remains a debated issue. An often-
cited (although rather dated) study by Jamison and Lau
(1982) reviews the results of more than 35 studies that
measure returns to the education of farmers in developing
countries. Most of these studies suggest that education has
a positive effect on farm production, but the statistical signi-
ficance of this result is often weak. In particular, Jamison
and Lau’s review finds no support for the hypothesis that
there are any returns to education for farmers in Africa.
This result is supported by evidence from some studies
based on LSMS-type household surveys. One example is
Glewwe (1990) who finds that the impact of education is
rather weak in the rural areas of Côte d’Ivoire. The lack of
a significant effect of schooling on farm profit has often
been attributed to either the low technological level of pro-
duction or the absence of technological change in Africa.
Foster and Rosenzweig (1996) present evidence that tech-
nological change increases the returns to schooling. But
Deaton and Benjamin (1988) find no impact of education on
the use of modern inputs in cocoa and coffee production in
Côte d’Ivoire. Jolliffe (1998) examines the impact of cogni-
tive skills on the income of households in Ghana. His
results show that cognitive skills have a positive effect on
total and off-farm income but do not have a statistically
significant effect on farm income. More recently, Cogneau
et al. (2006), estimate farm income functions for Côte
d’Ivoire, Ghana, Guinea, Madagascar, and Uganda. Their
results indicate that the head of household’s level of educa-
tion only has a significant impact on agricultural productivi-
ty in Madagascar and Uganda, where it remains nonethe-
less limited.
2. Causes of the youth labour market disadvantage: a supply-side perspective
© AFD Working Paper N°49 • Youth and Labour Markets in Africa - A literature review
24
18 Vijverberg (1995) observes that some types of employment, such as self-employed work,cannot be linked to the individuals’ credentials, or to a pay scale of any sort, meaning that edu-cation can only play a minor role in explaining individual earnings levels. Bennell (1996a)notes that many studies on developing countries are based on data for formal-sectoremployees and do not take into account income in rural and informal sectors where returns toeducation are probably very low. Glewwe (1996) also reveals that the wage structures in theprivate sector reflects the impact of education on the workers’ productivity more than they doin the public sector.

Returns to general vs. vocational education
Although the debate over the returns to vocational versus
general education has become an important research issue
in education (Bennell and Sergerstrom, 1998), adequate
empirical work in Africa is still lacking. Kahyarara and Teal
(2006) add new evidence to this debate by comparing
returns to vocational and general education of workers in
Tanzanian manufacturing firms. Whereas most of the pre-
vious evidences are based on cross sectional data, their
paper provides a comparison of the returns to general and
vocational education using firm level panel data with infor-
mation that allows a control for time invariant firm attributes,
endogeneity of education and other worker-firm characte-
ristics. Findings are that general education is more rewar-
ding than vocational education and on-the-job training.
Concave, constant or convex ROREs?
Much of the comparative work on the ROREs across coun-
tries uses a linear specification of the earnings function
(e.g. Trostel, Walker and Woolley, 2002), implying that the
average equals the marginal return to education. However,
constant or decreasing ROREs are more and more challen-
ged in both developed and developing countries (Card,
1999) and non-linearities (mostly convexity) in the returns
to education have been put forward by some studies on
Africa (Bigsten et al., 2000; Schultz, 2004; Söderbom, Teal,
Wambugu and Kahyarara, 2006; Kuepie et al., 2006;
Nordman and Wolff, 2006).
For instance, in the seven above-mentioned main cities of
French speaking West Africa, Kuepie et al. (2006) find a
non-constant rate of returns to education, with a convex
profile. These convex marginal returns mean that education
has a growing impact on remunerations in these urban
labour markets. This result goes against the traditional
model of human capital accumulation whereby the marginal
return to education is assumed to be constant or even
decreasing. This convexity has also been observed in
English-speaking countries such as Kenya and Tanzania by
Söderbom et al. (2006) on samples of employees in manu-
facturing firms and in Ghana (Schultz, 2004).
These results are important because whereas traditional
theories assume constant or concave marginal returns to
education, which ensure immediate, high profitability from
the first years of schooling, current data in Africa (such as
the 1-2-3 Surveys) helped bring to light convex returns to
education. Recommendations for policies aimed at promo-
ting primary education in SSA were drawn up on the basis
of this premise. These results mean that stimulating access
to primary education is only effective in reducing poverty if
the individuals concerned by this type of initiative can conti-
nue their studies in order to take full advantage of the high
marginal returns related with long studies. However, this
poses the delicate question of managing the flows of stu-
dents leaving the general secondary and higher education
cycles, which could certainly benefit from an in-depth
review on the (too) general content of the schooling pro-
grammes, in order to readapt them to the labour market
demands. Convexity may also be part of the explanation as
to how rapid expansion of education in Africa has genera-
ted so little growth if expansion has been concentrated at
lower levels of education (Söderbom et al., 2006).
Does education still help young people earn more?
This question is of great importance to policy makers
because the ability to increase the demand for education
depends greatly on the households’ opinion on how profi-
table it is on the labour market, i.e. its ability to provide
attractive – well-paid – jobs. Yet, the results in the past few
years are ambiguous in this respect. The idea of a widening
education-job gap is widespread. Unemployment of quali-
fied workers, worsened by the lasting freeze in civil service
recruitment and the lack of vitality in the formal private sec-
tor, massive unemployment and an education system
unsuited to the needs of the informal sector, and more
generally the deterioration in the quality of public education
under pressure from drastic budget restrictions, are all fac-
tors that tend to undermine the value of investment in
schooling for young people.
Curiously, many studies do not take into account the fact
that considering young and old individuals in the same esti-
mates of the ROREs, or more generally individuals belon-
ging to different age cohorts, is problematic if these two
categories receive different rewards for their observed work
characteristics due to differentiated labour market condi-
tions at the time they got their job. Kuepie et al. (2006) defi-
ne as young people those below 30 years old. They find
that generation effects are not significant when looking at
the returns to education in three cases (Cotonou, Niamey
2. Causes of the youth labour market disadvantage: a supply-side perspective
© AFD Working Paper N°49 • Youth and Labour Markets in Africa - A literature review
25
and Lome). In the four other cases (Ouagadougou, Abidjan,
Bamako and Dakar), there are significant differences in the
earnings-education profiles across the two cohorts. More
specifically, in the cases of Bamako, Ouagadougou and
Abidjan, the convex earnings-education profile previously
observed is more acute for young workers than for their
elder counterparts. With the same definition of young wor-
kers, Söderbom et al. (2006) also find that, for both
Tanzania and Kenya, earnings profiles differ across the two
age groups.
2. Causes of the youth labour market disadvantage: a supply-side perspective
© AFD Working Paper N°49 • Youth and Labour Markets in Africa - A literature review
26
Knowledge gaps:
Despite the huge variability of the estimates across sectors, and countries, returns evaluated in each employment sector are scarce in the ove-rall literature on the ROREs in Africa. This may be explained by data limitation. More specifically, many studies do not attempt to estimate thereturns to schooling in the informal sector arguing that earnings data from this sector also incorporate returns to physical capital and to risk borneby individuals, which are difficult to disentangle from returns to education in the absence of specific information (Kazianga, 2004).
2.2.3 Costs and benefits of vocationaleducation and on-the-job training
Although vocational education and training (VET) was
developed in most countries as a means of resolving the
problem of access to employment of underachieving pupils
and school drop outs, the poor condition of many African
VET systems makes it difficult for young graduates to meet
the private sector skill demands19. This situation is due to
underinvestment in the system, given the low esteem given
to vocational training, the priority being given to the general
education systems. Many French speaking African coun-
tries have also inherited education and training systems
based on residential technical and vocational education
and with little flexibility. Also, many African systems find it
difficult to balance the dual purpose of the formal and infor-
mal sectors, i.e. to train high quality workers and to give
second chances to school dropouts.
More generally, mechanisms for closing the skill gap across
categories of workers in Africa have been articulated in
terms of supply-side reforms: improving the educational
system so that more young people become educated, and
helping existing workers to enhance skills through formal
learning, such as classes and accreditation services provi-
ded by vocational schools. However, such provision is often
believed to be so much subject to supplier capture (as sug-
gests the diversity of vocational schools and diplomas,
either private or public) that it does not respond to employer
needs. Quite recently, in developed countries, there is an
increasing recognition within policy makers circles that the
demand side of the skills equation also needs attention and
that more effort needs to be directed towards the develop-
ment of the skills of the existing workforce, in addition to
improving the educational outcomes of learners in schools,
colleges and higher education (Nordman, 2003). This view
is also shared by VET practioners in Africa for whom the
move towards a dual system of vocational learning for the
youth cannot be achieved without improving training access
of the adults (Walther, 2006h). Developing access to more
efficient formal on-the job training systems might then be of
crucial importance in Africa.
Despite the lack of relevant data, the World Bank has com-
missioned an important report on the issue of skill develop-
ment in SSA (Johanson and Adams, 2004). The main
conclusion to be drawn from this report is that the private
sector makes a far greater contribution than governments
to skills development in the labour force in most countries
in SSA. The skills developed in the labour force by the pri-
vate sector come from three different sources: companies,
private training providers and learning in the informal sec-
tor20. With respect to companies, they usually provide their
own job training schemes without help from the govern-
ment. The literature on training in developed countries
seems to suggest that the existence of factors such as
19 According to the 1-2-3 Surveys in seven WAEMU cities, the unemployment rates of indivi-duals aged 15 and over who followed vocational schools are the highest (22 percent on ave-rage).20 We get back to learning in the informal sector in the next section.

weaknesses in the capital market, the prevalence of small
enterprises and large numbers of unskilled workers
reduces the incentives for providing on-the-job training.
Most workers need training, but this training could be too
expensive for African firms. The weaknesses of the market
for on-the-job training could therefore be greater in Africa
than anywhere else in the world. Contrary to expectations,
however, African firms tend to provide their own job training
without support from the governments. In fact, trade libera-
lisation has resulted in growing competition in most coun-
tries in SSA.
Hence, a growing concern regarding the necessity to
enhance the benefits of vocational learning appears to be
the question of how to encourage employers in Africa to
express specific needs and then to train more workers,
while they are supposed – or sometimes required – to bear
the costs of such training. This important question relates to
the costs and the benefits of training in the workplace. The
standard human capital theory suggests that an individual’s
decision to invest in training is based upon an examination
of the net present value of the costs and benefits of such an
investment. Individuals are assumed to invest in training
during an initial period and receive returns to the investment
in subsequent periods through increased wages. Purely
general training – i.e. entirely transferable from one firm to
another – is financed by workers, and the workers receive
all of the returns to this training. On the other hand, if wor-
kers invest in entirely firm-specific on-the-job training, the
theory suggests that the firm and the workers should share
in the returns and the costs. Recent theoretical works have
suggested that alternatives to the traditional human capital
model should be considered. Empirically, in developed
countries, it is observed that a certain number of firms par-
ticipate in the financing of general training (Acemoglu and
Pischke, 1999).
There is undeniably a lack of empirical evidence on the
cost-sharing of training in African countries. This is due to
strong data limitations. Amongst the few empirical works
having examined these questions, Mengistae (2001), using
data from manufacturing firms in Ethiopia, argues that on-
the-job training is a significant source of individual wage
growth, although this effect is only inferred from the impact
of job tenure since on-the-job training itself is not explicitly
observed in his data. In Burkina Faso and Uganda, returns
to work experience are high for young workers and decline
with age. At 20 years old, one more year of working expe-
rience increases wage by 6 percent in Burkina Faso and by
more than 4 percent in Uganda. Returns drop to around 1.5
percent in both countries when workers reach 40 (World
Bank, 2006a).
Using the RPED (Regional Program on Enterprise
Development) surveys, Dabalen, Nielsen and Rosholm
(2003) explore the current on-the-job training by enterprises
in the manufacturing sectors of five African countries (Côte
d’Ivoire, Ghana, Kenya, Zambia, and Zimbabwe). Unlike
the predictions of the competitive models of training, they
find that enterprises pay for and provide general and speci-
fic training. In the context of imperfectly competitive mar-
kets, concerns about enterprises failing to invest in general
skills may then be over-emphasized. They also find that
firms that are foreign or large provide more training than
domestic and small firms. Among workers, those with more
education receive more training. These findings point to the
selectivity of access to training. This offers some guidance
to targeting of training access on equity grounds to non-tra-
dables and to workers with lower education levels. Finally,
the authors show that despite non-competitive nature of
labour markets, trained workers receive significant wage
premiums.
Muller and Nordman (2006b) also investigate the cost sha-
ring hypothesis in the case of manufacturing plants in
Tunisia. They find evidence that, for the workers of their
unrepresentative sample of garment and electronic firms,
acquired human capital across firms over time is entirely
general and is therefore transferable from one firm to ano-
ther. More specifically, they show evidence of positive
returns of past on-the-job training on wage growth as well
as negative returns to ongoing on-the-job training, which is
consistent with cost sharing between firm and workers. As
a consequence, their findings are consistent with standard
theory according to which workers bear the full cost of their
general training spell in accepting a lower wage during their
training period.
Another interesting study can be found in Frazer (2006).
The author explores the institution of apprenticeship in
Ghana and estimates a model where apprenticeship trai-
ning increases an individual’s productivity in the current
firm, but not in any other firm. Apprenticed workers remai-
2. Causes of the youth labour market disadvantage: a supply-side perspective
© AFD Working Paper N°49 • Youth and Labour Markets in Africa - A literature review
27

ning within the firm are more productive than apprenticed
workers from other firms. However, because their outside
option is no better than apprenticed workers from elsewhe-
re, their wages are not higher than apprenticed workers
from other firms. For this reason, the returns to apprentice-
ship are in self-employment, where a former apprentice
basically replicates both the technology and business prac-
tice of the apprenticeship firm. Indeed, apprentices are very
eager to enter self-employment, and are constrained only
by capital from becoming apprenticed entrepreneurs.
2.2.4 Non-formal training and training in theinformal sector
On-the-job training represents a major part of total training
received by workers during their life. While allowing the
completion of initial training in accordance with the precise
needs of firms, on-the-job training also enables firms to cor-
rect the insufficient initial training of the oldest cohorts of
workers or to adapt it when it becomes obsolete in a context
of technical or organisational change. However, the difficul-
ty in defining and measuring this type of training makes it
unclear how to determine its impacts or how to evaluate its
spread. Generally, within on-the-job training, we distinguish
formal training from informal training (or non-formal). But
the attempts aiming at measuring training provided by the
employers tend to focus only on formal training and to
neglect therefore the informal learning processes.21 Indeed,
formal training is relatively simple to measure since it is
clearly identifiable: it is generally provided for a determined
duration by a recognized trainer in a precise place. This is
not the case for informal training that appears indistingui-
shable from the employee’s productive activity. Informal
training can be described as an unconscious or conscious
process of knowledge acquisition when the worker ope-
rates in his (her) workplace and stimulates this learning
during the repeated exercise of his (her) professional acti-
vity.
Hence, it is not sufficient to measure formal training provi-
ded by employers for estimating in an adequate way the
whole training that they organise. The absence of assess-
ment of informal training leads not only to an incorrect eva-
luation of total training supplied by the productive system,
but also, it distorts international and intra-national compari-
sons since the combination of formal and informal training
differs across countries, sectors, branches of activity, size
of firms and occupations.
Some attempts have been made to assess the extent and
efficiency of on-the-job training in Africa. Because of the
overwhelming share of the youth in the informal sector
(more than 80 percent in Francophone West Africa, see
Table 6a and 6b in Appendix), studying on-the-job training
in this sector is naturally a priority. This is all the more
important given than public VET systems have generally
failed in providing young workers of the informal sector with
the necessary human capital to access stable and decent
jobs. Johanson and Adams (2004) show, that in SSA, trai-
ning by traditional learning is the most frequent form of
organised training in the informal sector. Traditional lear-
ning probably makes a far greater contribution to develo-
ping the workers’ skills than all the training providers taken
together. Training by traditional learning is not as well-deve-
loped in Eastern and Southern Africa as in Western Africa.
However, in all these countries, it is probably the largest
source of technical and professional training for informal
sector workers. In Ghana, for example, around 90 percent
of the initial training of skilled personnel comes from tradi-
tional learning in the informal sector. This learning takes
care of people who do not have the level of education requi-
red to do formal training and serves rural populations and
poor people in rural areas. However, it perpetuates traditio-
nal technologies and lacks norms and quality assurance
(see also Box 4).
2. Causes of the youth labour market disadvantage: a supply-side perspective
© AFD Working Paper N°49 • Youth and Labour Markets in Africa - A literature review
28
21 For France for instance, there are the surveys formation et qualification professionnelle, for-mation continue (cereq) or coûts de la main-d’œuvre et structure des salaires (insee) whichfocus only on the formal part of training.

Box 4 – The AFD study on job training in the informal sector
The Research Department of the Agence Française de Développement (AFD) launched a study programme on job training in the informalsector in 2006 (Walther, 2006a, 2006e, 2006h). The study includes field surveys in several African countries including Angola, Benin,Cameroon, Ethiopia, Morocco, Senegal and South Africa. Preliminary survey reports are already available (Walther, 2006b, 2006c, 2006d,2006f, 2006g).
On the subject of youth training, for young school-leavers this mainly consists of traditional learning taking place in small-scale workshopsand micro and small enterprises. Such systems are still predominant in all the Sub-Saharan countries. They are characterised by on-the-jobtraining that consists in acquiring, in a work situation, the basic techniques required to do a job. The different studies of the types of learningused show that the young people are confronted with two main difficulties (Walther, 2006a):
- the insufficient qualifications of the master craftsmen and their inability to explain the theory behind certain notions and techniques,
- the lack of organised progression in the teaching within the learning process, even though this may have distinct phases for assimilatingbehaviour, for the use of instruments and finally, for taking part in all the master craftsman’s tasks.
Despite these shortcomings, according to the AFD’s studies, traditional learning is a key factor in giving young people access to the job mar-ket. Recently, in countries that have set up technical assistance, particularly cooperation agreements with German cooperation, this has hel-ped make certain traditional learning systems evolve towards dual learning methods and rhythms. According to Walther (2006a), the key roleplayed by learning as a means of professional and social integration and its ability to change to a more organised means of training, arguein favour of giving it support and improving it with help from the local public authorities, but without the authorities including it in the formalsector regulations. Other recommendations can be found in Walther (2006h), some of them stressing the necessity to develop structuredprofessional organisations, pre-apprenticeship schemes for children who dropped out school, and appropriate and long term funding instru-ments, etc. As Walther (2006d) underlines, these systems, certain of which are considered as examples of what can be done in the informalsector as a whole, go beyond the stakes of small-scale craft enterprises.
2. Causes of the youth labour market disadvantage: a supply-side perspective
© AFD Working Paper N°49 • Youth and Labour Markets in Africa - A literature review
29
As for the evaluation of the impact of informal learning, eco-
nomic literature comes up against a major difficulty inherent
to the very elusive nature of training (Brown, 1990). An
essential aspect of on-the-job training concerns therefore
the analysis of the individual impacts of different processes
of human capital accumulation in the workplace. Why is it
important? It seems that formal and informal training could
not only affect the same category of workers differently, but
also, that each of them could play a very specific role in
employers’ training strategies: formal and informal training
can either be substitute or complementary schemes.
Moreover, one question remains: do formal and informal
learning provide the same kind of economic outcomes for
both workers and organisations that implement them?
Finally, from the few attempts aimed at measuring informal
training provided by firms (mostly in the United States), it
appears quite clearly that not taking into account the infor-
mal component of training would lead to a huge under-esti-
mation of the total amount of training provided to workers by
the productive system. For these purposes, indirect mea-
sures of training are also very helpful.22 For instance,
researches by Nordman (2000) and Destré and Nordman
(2002), using matched employer-employee data on France,
Mauritius, Morocco and Tunisia, have provided a means of
measuring the effects of informal training on earnings.
Using this approach, these studies were able to distinguish
between the relative contributions of informal learning from
observation and from experience (learning-by-doing).
22 This includes using structural models of workplace learning in order to assess the relativeimportance of different types of on-the-job training (learning by watching, learning by expe-rience, formal training, etc.).
Knowledge gaps:
The surveys carried out by the AFD in 2006 are a useful contribution as they help explore the systems that are being set up and organised inthe field of training and qualifications for master craftsmen and apprentices from traditional learning schemes in the informal sector in Africa.However, they fail in providing useful quantitative data of training beneficiaries. To date, there is very little data available to determine the advan-tages and shortcomings of these different learning systems and, above all, to determine their impact on the job trajectories of young people inthe labour market. Specific surveys on groups of beneficiaries of training programmes and initiatives should therefore be carried out. For Africa,the empirical literature is very meagre partly due to the lack of relevant data. In the field of enterprise training, finding comparable and homoge-nous indicators across countries is difficult because definitions and concepts of workplace training vary from one survey to another.
2. Causes of the youth labour market disadvantage: a supply-side perspective
© AFD Working Paper N°49 • Youth and Labour Markets in Africa - A literature review
30
2.3.1 Social capital, ethnicity and access toemployment
For developing countries, and the African countries in parti-
cular, we have found only two specific studies on the rela-
tionship between social capital and access to employment
(Collier and Garg, 1995; Krishnan and Sciubba, 2005).
Some work has also been done on the impact of ethnic
belonging in Africa, which is easier to identify and to mea-
sure.
In Africa, the system of extended families ensures a certain
form of solidarity but also leads to a number of reciprocal
obligations on a wider scale. Arranged marriages are also
part of networks of alliances and obligations. The dividing
line between family in the strictest sense, lineage, belon-
ging to a village or ethnic group is therefore vague, and
identifying the “family network” is a complex matter.
Urbanisation, demographic change and the impact of mor-
tality rates, particularly relating to HIV, lead to modifications
in the family structure and these networks of solidarity.
The study by Collier and Garg (1995) on Ghana concerns
the impact of belonging to traditional initiation groups, orga-
nised by age group, on youth employment in the modern
sector of the economy. This institution, which transcends
the strict family framework, is an example of the complexi-
ty of “parental relationships” in Africa. Belonging to an age
group is non-elective; its members are bound by a system
of sharing, of mutual aid and reciprocal obligations under
the threat of retaliation, of which exclusion is just one
example. The authors question the ability of this traditional
institution to introduce a system of preferences concerning
the access to employment in the modern sector of the eco-
nomy. Their results show first that the benefits received
from belonging to an age group depend on the size of this
group (locally dominant group), and second, that favouri-
tism only works in the public sector, but on a large scale,
and not in the private competitive sector. Krishnan and
Sciubba’s work is mainly theoretical. It stems from the lite-
rature on the formation of endogenous networks with an
application concerning the formation of work-sharing net-
works in rural areas in Ethiopia. No attention is paid to the
age of the members who belong to these work-sharing net-
works.
Apart from Collier and Garg’s work, economic literature on
social capital and access to employment for young people
is practically inexistent. The place of adolescents and
young adults in the family has not been studied to any great
extent, nor has the beneficial role of family structures for the
entry into active life and adult life. Studies made in econo-
mics on social mobility, inter-generational mobility or occu-
pational mobility partly cover this gap (Cogneau et al.,
2006), but do not address specifically the question of social
capital, which remains undefined and ignored in this
context.
On the contrary, research on family networks is more forth-
coming in demographics and sociology, as shown for ins-
tance by the proceedings of conferences on family transfor-
mations or on youth and employment (Pilon, Locoh,
Vignikin and Vimard., 1997; Le Bris and Chauveau, 1993).
It is also very abundant on the impact of the family or fami-
ly networks on health, education and child labour (under
2.3 Access to other forms of capital

15s), where the family has a direct, determining role.
Generally speaking, all the research that takes into account
the family framework focuses on the role of women (and
therefore health and education) and the well-being of chil-
dren and ignores the other members of the household, such
as young adolescents for example. It is possible that as far
as young adolescents and access to employment is concer-
ned, the role of the father could become decisive.
Although they do not directly concern the causal evaluation
of the relationship between social capital and employment,
there are a large number of studies on the more specific
issues of migrations, the family or inter-ethnic relationships
that take into account the impact of belonging to a group on
employment. Many young people migrate from rural to
urban areas expecting better opportunities there (Ogbu and
Ikiara, 1995; Linden, 1996; Sommers, 2003). This has
increased the urban population and the competition in the
urban labour market (Schoumaker and Beauchemin, 2002).
In a context where social relations are as crucial as qualifi-
cations, young urban migrants searching for a job face an
uphill struggle of “surviving” with limited social networks
(Lange and Martin, 1993). Increasingly, the informal sector
provides employment to young educated people, whose
access to modern sector employment is declining. With
lower literacy rates, rural young people are at a disadvanta-
ge relative to more educated urban young people.
If we examine the way young active workers have obtained
their employment, it can be seen that young people have
access to their first jobs by family or personal relationships
more than adults do. For young people, entering active life is
therefore more dependent on relational networks (Figure 6).
In this perspective, the fact that individuals belong to ethnic
groups is an important determinant of their ability to integra-
te and progress in the labour market. Indeed, the results of
the 1-2-3 Survey on seven capitals in West Africa show that
between 30 and 40 percent of the individuals interviewed
declare that they obtained their jobs through “personal rela-
tionships”. This is confirmed by a recent paper (Bossuroy,
2006), which shows empirically that the fact that a person
has obtained a job through “personal relationships” is stron-
gly and significantly correlated with the ethnicity weighting
for individuals in urban areas, as measured by a question in
the “Democracy” module. Studies based on Afrobarometer
data also found that ethnicity is mobilised more for jobs in
the modern labour market (Miguel and Posner, 2005) and
that this mobilisation of network relationships is greater for
individuals in highly competitive jobs (Bratton, Mattes and
Gyimah-Boadi, 2004). Nonetheless, the relation of ethnicity
to labour markets remains debated. In the case of
Cameroon, which is a highly ethnically polarized country,
Roubaud (1994a) finds neither an ethnic discrimination in
access to employment not in earnings.
2. Causes of the youth labour market disadvantage: a supply-side perspective
© AFD Working Paper N°49 • Youth and Labour Markets in Africa - A literature review
31
Figure 6. Percentage of Active Individuals Who Have Obtained TheirEmployment through Family or Personal Relationships (%)
Source: 1-2-3 Surveys. Phase 1 (labour force survey). 2001-2005. NationalStatistical Institutes. AFRISTAT. DIAL ; authors’ computations.
Knowledge gaps:
Although the social capital and correlatively the living area are widely recognised as a key to the first access to job for young people this is rare-ly investigated in developing countries. The reason may be that standard surveys do not capture the nature and range of these complex ties.The geographical mobility of young people or their inactivity in the waiting for better jobs are greatly facilitated by the solidarity acting trough fami-ly links, village membership or along ethnic lines. Studies focus on children well being and the relationships between young adults’ activities andenvironments are largely unknown. This quite new subject would deserve a better attention and specific surveys.
2.3.2 Access to land
In the rural villages of Africa, land is the central production
factor for agrarian households and, in most countries, is
mainly acquired through transmission from one generation
to the other. Since access to land determines to a large
extent the employment status of most youth in rural areas,
an assessment of youth access to labour in rural areas
should rely on an assessment of youth access to land. With
that in mind, this section will focus on three main questions:
� Do young people have access to land in rural areas?
� Has the situation deteriorated for the youth in terms of
access to land?
� If so, what factors could be responsible for this deterio-
ration?
Few studies explore the issue of access to land for young
people. While data on land holdings is available in most natio-
nally-representative household surveys, it is seldom presen-
ted and analysed, and even less so according to age catego-
ries. Data from the Enquête Permanente des Ménages that
was carried out in Madagascar in 1993 suggest that house-
hold with heads aged 15 to 24 operate land areas that are no
smaller that those of older generations. Nevertheless, the
most striking result is that only 3 percent of young people are
actually independent from their family. This implies that the
sample of young household heads – for which data on areas
operated are available – represents a very small share of their
age group and is bound not to be representative. Two other
features emerge. First, the difference in average land areas
bought across generations seems to support the life cycle
accumulation hypothesis. Second, figures on average land
areas inherited do not seem to indicate any significant trend.
While this type of data provides a picture of the situation at a
given point in time, it is difficult to conclude whether land
access is less favourable than is used to be for the rural youth
since the majority of them is still dependent.
More specific data is needed in order to assess the evolu-
tion of access to land for young adults. As mentioned
above, cross sectional data on land holdings is not enough
because land holdings are the subject of life cycle evolu-
tions. What is needed is either repeated cross sections at
different points in time, panel data or retrospective data
where a sample of farm households are asked about how
much land they inherited and how much land their parents
inherited.
A couple of country-level or regional-level studies explore
some features of land inheritance. Quisumbing, Estudillo
and Otsuka (2004) study the factors affecting land inheri-
tance and schooling across generations in the Philippines,
Indonesia, and Ghana. Their results indicate that the avera-
ge size of landholdings inherited by the respondents is
usually smaller than that inherited by their parents, although
that does not appear to be the case in Ghana. In the case
of Madagascar, Senne, Gubert and Robilliard (2006) provi-
de some evidence that, in some rural areas of the country,
average rice land holdings have decreased between cur-
rent and previous generations of farmers.
Another study by Ayalew et al. (2000) focuses on the case
of access to land in Ethiopia in the context of soldiers’
demobilization. Ethiopia’s land tenure system is characteri-
zed by a high degree of instability. Since the revolution of
1975, land has been state owned but a number of reforms
have been implemented since then, each time putting into
question the conditions of access to land. The authors
argue that current land tenure arrangements are flawed and
that they marginalize young adults. According to the
authors, younger generations cannot claim new fertile land
nor invest in land. As a consequence, young adults end up
dependent on their families and farm plots are subdivided
into ever smaller parcels.
In a village of North-western Rwanda, André and Platteau
(1998) also find that young adults have difficulties leaving
their parents and setting up their own households owing to
a lack of inheritable land and to insufficient opportunities of
acquiring additional land through the market. Over a five
year period, they find that the proportion of children in age
of marriage (20 to 25 years old) still living with their parents
has increased more than two fold.
Several factors could contribute to the worsening of the
situation for African youth with respect to access to land.
Two of these explanations are related to recent demogra-
phic trends. First, the well documented rapid population
growth in Africa has induced a transition from land-abun-
dant to land-scarce situations in many regions. Increased
population pressure on land resulting from this transition
could be expected to have resulted in a decrease in terms
of areas available for younger generations. Second, increa-
sed life expectancy could have resulted in latter access to
land for younger generations.
2. Causes of the youth labour market disadvantage: a supply-side perspective
© AFD Working Paper N°49 • Youth and Labour Markets in Africa - A literature review
32
The decline of farm sizes as a result of increasing land
scarcity over time is documented in some African countries
by Jayne et al. (2003). Their analysis is based on data com-
piled from nationally-representative household surveys car-
ried out between 1990 and 2000 in five countries: Ethiopia,
Kenya, Rwanda, Mozambique, and Zambia. Their results
indicate that farm sizes have declined and that land distri-
bution within the small-farm sector appears to become
more concentrated over time.
Other elements supporting the same stylized fact can be
found in recent literature that has been driven by increa-
sed awareness of economic and political importance of
land-related conflict in African countries. Examples inclu-
de Rwanda (André and Platteau, 1998), Cote d’Ivoire
(Chauveau, 2000), and Uganda (Deininger and
Castagnini, 2006). André and Platteau (1998) report the
findings of an in-depth study of a highly densely popula-
ted area in northwest Rwanda conducted during the per-
iod 1998-1993. They demonstrate that acute competition
for land has resulted in increasingly unequal land distri-
bution and rapid processes of land dispossession
through both operation of the land market and evolution
of indigenous tenure arrangements. In Cote d’Ivoire,
Chauveau (2000) relates land conflicts to the political
exploitation of the question of nationality surrounding the
presidential elections. In Uganda, Deininger and
Castagnini (2006) explore the incidence of land conflicts,
the impact of legal changes on their frequency, and their
impact on productivity. They argue that rapid expansion
of the population, combined with either limited opportuni-
ties for non-agricultural employment or increasing non-
agricultural demand for land, is a key factor that causes
land to appreciate, resulting in higher competition for a
limited or decreasing amount of land available.
2. Causes of the youth labour market disadvantage: a supply-side perspective
© AFD Working Paper N°49 • Youth and Labour Markets in Africa - A literature review
33
Knowledge gaps:
While some empirical evidence at the local level support the stylized fact of a more difficult access land holdings from younger generations, gene-ral data is lacking to estimate the magnitude and seriousness of these stylized facts at the level of the African continent and to give the full pic-ture on the transmission of land across generations in Africa. This lack is mainly related to the fact that land ownership systems in rural areasare complex and is further aggravated by the difficulty of measuring land plots, for both conceptual and technical reasons.
2.3.3 Access to capital
Given the size of informal and self-employment in most
African countries, access to start-up capital is an important
issue when dealing with the problem of youth employment.
Unfortunately, to the best of our knowledge, no study has
examined specifically the issue of youth access to start-up
capital in African countries. More general studies on access
to capital in some African countries do exist however (see
for instance Aryeetey, Baah-Nuakoh, Duggleby, Hettige and
Steel, 1994; Frazer, 1996). In Ghana, Aryeetey et al. (1994)
report the fact that credit for start-up is rare. Also in Ghana,
in a recent paper on apprenticeship, Frazer (2006) reports
that for former apprentices one of the principal constraints
is obtaining finance in order to start up their own business.
Knowledge gaps:
To the best of our knowledge no study has examined specifically the issue of youth access to capital in African countries.

© AFD Working Paper N°49 • Youth and Labour Markets in Africa - A literature review
34
3. Causes of the youth labour market disadvantage: a demand-sideperspective
In the context of economic stagnation and of rapid demo-
graphic growth that has characterized Africa on the whole
over the last decades, this section studies the elements
relating to labour demand and institutions that might
explain the employment situation of African youth. We
focus on the issue of wage flexibility and labour markets
rigidities. Economic theory suggests that rigidities might
be a cause of unemployment in the formal sector, but
there is no consensus on the importance of these so-cal-
led rigidities and on their impact in practice in Africa.
Although the issues addressed here are crucial for youth
employment, this section is shorter than the others
because of the small number of studies directly focusing
on youth. For the same reason, we do not deal here nei-
ther with the sources and patterns of economic growth
nor with the issue of the business climate, which are
usually put forward by most studies on African employ-
ment.
3.1 Labour demand and wage flexibility
The Harris-Todaro model (1970) of labour migration and
unemployment provides a way of addressing the issue of
employment in Africa. In this model, the labour market is
divided between the agricultural and the manufacturing
sectors. Wages are supposed to be relatively high and rigid
in the manufacturing sector, so that employment in this sec-
tor is determined by labour demand alone. Individuals in the
rural areas compare their actual income with their expected
income in the urban labour market, determined by the pro-
duct of the manufacturing sector wage and the probability
of employment, and migrate if the expected urban wage is
higher than actual agricultural earnings. The main conclu-
sion of this model is that any increase of the manufacturing
sector wage or demand increases the expected income,
therefore inducing more migration and more unemploy-
ment. This model can be adapted to reflect the duality of the
urban labour market, divided between the formal and infor-
mal sectors (Kingdon, Sandefur and Teal, 2005a) and pro-
vides us with the theoretical framework necessary to iden-
tify the mechanisms underlying the allocation of workers
between urban and rural areas and, in urban areas, bet-
ween the formal and informal sectors and unemployment.
Whether or not labour markets are flexible is an important
question to address when dealing with youth unemploy-
ment. Indeed, if wages in the formal and/or informal sec-
tors do not adjust in face of unemployment, then it is like-
ly that young workers will face a higher risk of being
unemployed because, since they have less experience
on the job, they have a lower productivity and because,
as firms adjust to macroeconomic shocks by varying their
labour demand, in times of recession the number of
recruitment reduces, and this affects young people more
strongly. Furthermore, when firms start redundancy pro-
cedures, it is cheaper to fire young workers rather than
older workers.
Kingdon et al. (2005a) provide a overview of labour market
flexibility in Africa. They identify three dimensions of flexibi-
lity: the ability of real wages to decline over time; the ten-
dency for wages to adjust in the face of unemployment; and
the extent of wage differentials between sectors and/or
firms of different size. Most of what follows in the next three
subsections is taken from their survey. We resume their fin-
dings and indicate how they shed light on the issue of youth
unemployment.

3.1.1 Ability of wages to decline over time
Evidence, based on data from Kenya, South Africa and
Ghana, suggests that in English speaking African countries,
real wages are flexible over time. Milne and Neizert (1994)
conclude that, in Kenya, real wages were quite flexible in
the modern sector through the two oil shocks, a severe
drought in 1984 and subsequent stabilization programmes.
In Ghana, Beaudry and Sowa (1994) note that sector
wages were quick to respond to demand shifts brought
about by structural adjustment during the 1980s and that
this “probably helped achieve the macroeconomic improve-
ments observed”. Casale, Muller and Posel (2004) find that,
even though unions are an important part of the wage set-
ting process in South Africa, real wages for Africans have
fallen between 1995 and 2003. However, a different picture
emerges from French speaking African countries. Rama
(2000a, 2000b), in his study of wage setting in CFA franc
economies, concludes that wages in these countries sho-
wed some evidence of real rigidity, in that they closely trac-
ked public sector wages and consumer price indices.
3.1.2 Tendency for wages to adjust in the faceof unemployment
The apparent lack of real wage flexibility in CFA franc eco-
nomies might let believe that real wages are unresponsive
to unemployment level in these countries. However, surpri-
singly, this is not the case. For Côte d’Ivoire, Hoddinott
(1996) finds a wage-unemployment elasticity of -0.1, a
result similar to that found in Canada and the United States.
Kingdon and Knight (1999) find the same result in South
Africa.
This evidence remains to be interpreted. In some countries,
it is possible that the apparent flexibility of real wages
results not from changes in nominal wages, but from mis-
takes being made by workers in negotiating their wage,
when they cannot accurately predict the rate of inflation.
This might be what happened in Ghana, since the declines
in real wages occurred in a period of a highly variable rate
of inflation. Côte d’Ivoire tells another story. The wage flexi-
bility found by Hoddinott cannot result from unexpected
high inflation, since the country is subject of the rule of the
Franc Zone (Collier and Gunning, 1999). Lavy and
Newman (1989) found that mean earnings figures, which
showed apparent rigidity, hide the fact that during the reces-
sion of the 1980s, newly hired and, therefore, low-wage
workers were the first to loose their jobs. In fact, the ear-
nings function had shifted down by around 25 percent over
a four years period.
3.1.3 Wage differentials between sectorsand/or firms of different size
Kingdon, Sandefur and Teal (2005a) review several sur-
veys that evaluate wage differences between the formal
and informal sectors in African countries, controlling for dif-
ferences in workers personal characteristics. In all reviewed
studies a sizeable formal sector earnings premium is found,
that ranges from 9.6 percent in Mali to 60.3 percent in
Cameroun (see Kindgon, Sandefur and Teal, ibid., for a
detailed list of countries and references). Other studies
have compared the wage of workers with similar characte-
ristics, but working in firms of different size. This has the
advantage of providing a clear base for comparison bet-
ween studies, since the definition of the formal and informal
sectors can be subject to variation amongst authors.
Looking at data from four Anglophone African countries,
Kindgon et al. (2005) find that firms that have 100
employees, when compared to firms with only 20
employees, offer a wage premium between 16 percent and
38 percent. Recent work in this area has investigated whe-
ther this size effect is due to heterogeneity in unobserved
skills of the workforce hired by firms of different size. Until
recently it was very difficult to answer this question due to
the lack of suitable data. The collection of matched worker-
firm panel data has made this possible. Söderbom, Teal
and Wambugu (2002) find that the size effect is only slight-
ly reduced when one holds account of unobserved skills.
While the firm size effect is not attributable to workers skills
differences (either observable or not), it is consistent with a
range of other possible explanations towards which we now
turn.
The “New Keynesian” economics insists on the importance
of imperfect information and/or imperfectly competitive
labour and goods markets to explain involuntary unemploy-
ment. According to the so-called “efficiency wage hypothe-
sis”, firms set wages higher than the market clearing level,
in response to asymmetrical information and in order to
reduce monitoring or labour turnover costs. Few studies
have examined the applicability of efficiency wage models
3. Causes of the youth labour market disadvantage: a demand-side perspective
© AFD Working Paper N°49 • Youth and Labour Markets in Africa - A literature review
35
in Africa. Fafchamps and Söderbom (2004a) use worker-
firm matched data across ten African countries from the
World Bank’s Africa Regional Program on Enterprise
Development (RPED) surveys to establish a connection
between firm size and wages. They show that worker effort
and productivity increase with both the level of supervision
and wages, which is consistent with the efficiency wage
hypothesis.
In rent-seeking models, wage differentials between large
and small firms result from imperfect competition on the
goods market and from the ability of workers to extract part
of the rent from the owners of capital. In the insiders-outsi-
ders theory of wage negotiation (see e.g. Lindbeck and
Snower, 1988), the number of employed workers (insiders)
has a negative effect on their average wage, so that the
hiring of previously unemployed workers (outsiders) contra-
dicts the interest of insiders. Evidence of rent-sharing
effects on wages has been found for a wide range of African
countries, including Ghana (Teal, 1996) and Zimbabwe
(Velenchik, 1997).
The power of unions in setting higher than market clearing
wages has been evaluated both in Francophone and
Anglophone African countries. Evidence is mixed. For
Francophone countries in the Franc Zone, Rama (2000a,
2000b) finds that “members [of unions] usually have lower
wages than similar, non-unionized workers, which probably
reflect the ‘subordinate’ nature of the labour movement”.
According to Alby, Azam and Rospabé (2005), this counte-
rintuitive result might be due to not taking into account
selectivity effects. On the contrary, in Anglophone countries,
several studies point to a positive premium paid to union
members (Kingdon et al., 2005a).
3. Causes of the youth labour market disadvantage: a demand-side perspective
© AFD Working Paper N°49 • Youth and Labour Markets in Africa - A literature review
36
Box 5 – The informalisation of urban employment following crisis and structural adjustment
The stabilisation, liberalisation and structural adjustment reforms introduced in all the African countries were aimed at reducing market dis-tortions and changing incentives (relative prices), in a view to redirecting production to the tradable sectors and diversifying these sectorsand the sources of growth. As the public sector and State-based organisations were seen as a source of inefficiency, their weight in the eco-nomy was to be reduced. In the private sector, the structural adjustment reforms were not only supposed to diversify and redirect activitiesto the tradable sectors, but were also designed to improve firms’ productivity and competitiveness. The challenge was to establish the rightconditions to favour the development of small and medium-sized enterprises capable of providing jobs not only for the labour force madeavailable by the re organisation of the major private and public formal companies but also for the newcomers to the labour market. Followingthe East Asian model, the overall objective was to promote labour intensive growth (World Bank, 1990).
Public employment
The public sector reforms were sequential in SSA. First, they undertook to reduce the number of public sector workers with voluntary redun-dancy programmes and freezes on civil service recruitment (end of 1980s). Next, public companies in the productive sectors were privati-sed. Companies in the public services such as water, electricity and transport were privatised later, during the second half of the 1990s. Allthese measures led to a sizeable reduction in public employment, concomitant with that of formal jobs due to re organisation in the majorformal companies.23 Since the adoption of the poverty reduction programmes and the new awareness that public intervention was needed towiden the provision of basic services to reach the most needy, public employment programmes have been launched, particularly for teachers.For example, in Madagascar, there were as many civil servants in 2000 as at the beginning of the 1980s (Razafindrakoto and Roubaud,2001). These new jobs that concern the young generations are, however, based on a revised status for civil servants, with the gradual intro-duction of contract workers, and new salary scales, often lower than the existing ones. The “under categorisation” of the new civil servantsposes the problem of the quality of their work and of the new recruits’ motivation.
23 For example, the share of public employment in Ethiopia fell from 4 percent in 1984 to 2.9percent in 1999; in Kenya the percentage fell drastically from 36 percent in 1990 to 11.4 per-cent in 2000 (UNECA, 2005, p.67).

Private formal employment
The RPED (Regional Program on Enterprise Development) surveys conducted by the World Bank during the 90’s reveal that at the begin-ning of the structural adjustment reforms, large enterprises (over 50 employees) reduced the number of jobs, even raising the question ofthe countries’ de-industrialisation. Although many small and medium-sized enterprises (between 10 and 49 employees) did increase theirnumbers of employees (Biggs and Srivastava, 1996), the total number of jobs created was not sufficient to reduce unemployment. In thesame surveys, but over a longer period from 1993 to 1998-1999, formal employment apparently even decreased in Ghana, Kenya andTanzania (Harding, Söderbom and Teal, 2004). Micro enterprises seem to have created very few salaried jobs during the 1990s. For example,these studies show that in Cameroon, Ghana, Kenya and Zimbabwe, the probability of micro enterprises becoming enterprises with over 10employees is practically nil (Biggs and Srivastava, 1996). This result is qualified by Marniesse (2000) who shows that about a third of microenterprises with 5 to 9 employees surveyed in Abidjan, Cotonou and Antananarivo between 1991-92 and 1995-96 had become small enter-prises with 10 to 30 employees. Moreover, she observed that the micro enterprises had increased their jobs, as most of them had gone fromthe category of 2 to 5 employees to that of 6 to 9 employees. It is difficult to conclude from the different perceptions resulting from the sur-veys carried out in English-speaking and French-speaking countries that adjustment policies have a different impact on the dynamics of microenterprises and of small and medium-sized enterprises. It would also be interesting to update these studies, as in many French-speakingcountries the reforms designed to deregulate the internal and external markets were, in practice, introduced relatively late in the day.
SMEs have not really emerged in most of the countries in black Africa. Although the structural reforms and the emergence of new businesssectors such as ICT and tourism have helped create some SMEs, they are still the exception.
Growth of the informal sector
The informal sector has absorbed the surplus of urban labour over the last decades. Time series data are generally missing on this subject.In the case of Burkina Faso, Grimm and Gunther (2006) consider that the share of informal sector in the total urban employment has notincreased, contrarily to what is usually claimed. Growth still has a strong but differentiated impact on informal sector dynamics. InMadagascar, where annual LFSs are available since 1995, Razafindrakoto and Roubaud (2003) show that the macroeconomic growth regis-tered during the second half of the 1990s was accompanied by a continuous reduction of the informal sector share in the urban labour force.On the contrary, the political and economic crisis of 2002 immediately reversed this positive trend, the informal sector “recolonizing” thelabour market. The case of Cameroon presents a different pattern. While the informal sector burst out during the phase of sharp recession(between 1987 and 1993; see Roubaud, 1994b), the renewed growth trend after the 1994 CFA Franc devaluation has provoked a simulta-neous light reduction of employment in the informal sector and a strong growth of informal employment on the whole. What seems to havehappened though is a massive informalisation of employment in the formal sector, that is to say a surge of employees without propercontracts or social protection.
3. Causes of the youth labour market disadvantage: a demand-side perspective
© AFD Working Paper N°49 • Youth and Labour Markets in Africa - A literature review
37
3.2 Labour standards in Africa
Labour regulations in Africa are considered to be the most
rigid in the world (World Bank, 2005 – see Table 10 in
Appendix; UNECA, 2005). According to World Bank (2005),
there is a strong correlation between youth unemployment
and rigid labour regulations, especially difficulties of hiring
(the World Bank takes the example of Burkina Faso, where
employers cannot write term contracts, women can work no
more than 8 hours a day, etc.): “With rigid regulation, com-
mon in developing countries, employers choose conserva-
tively. Some workers benefit – mostly men with years of
experience on the job. But young, female and low-skilled
workers often lose out, denied job opportunities”.
3.2.1 Enforcement and coverage of labourstandards
Most African countries have ratified the International Labour
Standard Conventions (abolition of child labour, right of
association, minimum wage, interdiction of discriminations,
of forced labour, etc.). But as noted by Alby et al. (2005),
there exists a substantial gap between the ratification of

ILOs conventions and national laws on the one hand and
between national laws and their enforcement in practice on
the other hand.
Even at the beginning of the 1990s, when the policies
aimed at reforming regulations for the labour market, forei-
gn exchange and the product markets had only just begun,
the manufacturing firms questioned in RPED surveys (1993
Burundi, Cameroon, Ghana, Kenya, Tanzania, Zambia,
Zimbabwe) did not consider that constraints relating to mar-
ket regulation were among the key constraints to their deve-
lopment (Biggs and Srivastava, 1996; Teals, 1996). The
lack of credit, infrastructures and services to support their
activities together with weak demand were far greater obs-
tacles in their view. It should be noted, however, that in cer-
tain countries such as Kenya and Zimbabwe labour legisla-
tion (minimum wage, redundancy regulations, and restric-
tions on definite term employment contracts) was given as
a constraint to the hiring of new workers by 15 to 30 percent
of the companies surveyed. However, the large companies
indicated that foreign exchange constraints, which were lif-
ted to a great extent by the stabilisation reforms, were far
more restrictive than those relating to labour market regula-
tions. Generally speaking, market regulation constraints
seem to affect larger companies more than smaller ones.24
According to UNECA (2005), labour regulations have not a
significant negative impact on employment creations, detri-
mental to youth employment, for the three following rea-
sons:
“- first, the effect of these regulations is limited to the formal
sector, which accounts for only a small share of the labour
force; for example, in the countries forming the
Communauté financière d’Afrique (CFA), only about 5 per-
cent of the labour force is effectively covered by labour
regulations, which are some of the most inflexible regula-
tions in Africa (Rama, 1998);
- second, even when the regulations are in place, they often
are not enforced; as a consequence of limited coverage
and poor enforcement, very few workers are effectively pro-
tected by labour regulations (…);
- third, some regulations provided by the labour code are
not binding; case in point: minimum wage in the formal sec-
tor; in many countries minimum wages are set at levels
below actual starting wages, which may explain why indivi-
dual as well as cross-country studies have found no signifi-
cant effect of the minimum wage on employment in Africa
(Saget, 2001; Teal, 2000)”.
Recent studies based on surveys on the investment clima-
te in seven African countries (Eritrea, Ethiopia, Kenya,
Mozambique, Nigeria, Uganda and Zambia) highlight the
fact that the low productivity rates and high production costs
in African firms compared with Asian countries, can only be
attributed to a small extent to labour costs. “Labour costs
account for a relatively small share of the total costs of
African firms” (Eifert and Ramachandran, 2004).
Furthermore, it is shown that real wages are relatively low:
“Competitiveness must come from increased productivity
and largely from lower non-labour costs and greater deve-
lopment of worker skills”.
Legislation on minimum wages does not appear to be the
main explanatory factor for high nominal wage costs or low
downward real-wage rigidity. Rama (2000a, 2000b)
believes that the public wage policies are a more convin-
cing reason for the observed wage gaps, together with the
obstacles to competition on the product market. In the
French-speaking countries he studied, private wages follow
the fluctuations in public wages, and few branches have a
competitive organisation; product prices are therefore set
by the dominant firms in the market at higher prices than if
there was competition. This low competition on the product
market is one of the elements that explain the low producti-
vity of firms in Africa and the small size of the formal seg-
ments of the economies.
The positive impact of foreign direct investment (FDI) on
employment (both directly and indirectly through “knock-on
effects”), wages and labour standards has often been
emphasized (Asiedu, 2004; Freeman, 2001). However,
Africa suffers from a lack of FDI, which is mostly concentra-
ted in the mining and oil sectors (except from in South
Africa). Export Processing Zones (EPZs), which corres-
pond to a particular model of FDI, have been a failure in
Africa with two exceptions: Mauritius and Madagascar.
3. Causes of the youth labour market disadvantage: a demand-side perspective
© AFD Working Paper N°49 • Youth and Labour Markets in Africa - A literature review
38
24 Due to the sampling method used for the RPED surveys, the authors of the report warnedagainst the possible under-representation of large enterprises, which could lead to an unde-restimate of the impact of the legislative constraints on the development of large companies.
EPZs are often considered as “sweatshops” which encou-
rage a “race to the bottom” in terms of labour standards and
create unskilled and low-paid jobs. In the case of
Madagascar, EPZs managed to create many jobs for the
youth while also contributing to improving labour standards
(see Box 6).
3. Causes of the youth labour market disadvantage: a demand-side perspective
© AFD Working Paper N°49 • Youth and Labour Markets in Africa - A literature review
39
Box 6 – Export processing zones in Africa, better job opportunities for youth?
Madagascar is one of the few “success stories” of export processing zones in Africa. The Zone Franche specializes in textile-clothing exportsto the US and UE markets, benefiting from trade preferences (African Growth and Opportunity Act, Everything but Arms initiative, etc.) onthese markets. It employs around 100,000 workers, mostly based in the capital Antananarivo.
Several studies have analysed the labour market impact of the Zone Franche, based on the urban labour force surveys (1-2-3 Surveys)implemented by the Malagasy national statistical office with the support of DIAL (Glick and Roubaud, 2006; Cling, Razafindrakoto andRoubaud, 2005). These studies show that on the one hand Madagascar conforms to several typical patterns of EPZs in developing coun-tries (see Madani, 1999): the prevalence of women (more than two thirds of the workforce); the use of a young, semi-skilled workforce whogets better paid than in alternative jobs. On the other hand, Zone Franche avoids the egregious patterns of discrimination against womenreported for some EPZs and its labour standards appear globally better than in the rest of the economy.
Zone Franche workers average 8 years of schooling, significantly less than other formal sector workers but more than private informal wageworkers (6 years) and the self-employed (6.6 years). Differences by gender within each sector are not large. Zone Franche workers are youn-ger on average (26 and 28 years old for male and female employees) than workers in all other sectors. This is similar to experiences withEPZs elsewhere. Most Zone Franche employees are in their first job, more than in any of the other wage sectors.
Also as seen in other contexts, Zone Franche employment represents a significant step up in pays (especially but not only) for women, thosewith low but not zero levels of schooling who would otherwise be found in very poorly remunerated informal sector work. Econometric esti-mates on individual data show that the remuneration paid by the Zone Franche companies is not significantly different, other things beingequal, to that paid by the other industrial firms in the formal private sector. Moreover, they do not find any statistically significant wage discri-mination for women, after controlling for worker characteristics (and no discrimination against married women and mothers as seen elsew-here).
By drawing women from the low wage informal sector (where the gender pay gap is very large) to the relatively well paid export processingjobs (where pay is not only higher but also similar for men and women with similar qualifications), Zone Franche has contributed to impro-ved gender equity in earnings in the urban economy.
Further, along many dimensions (except for the long working hours) – availability of paid leave and health care, access to union member-ship, etc. – jobs in the Zone Franche are “high quality” jobs, comparable to or even superior to other parts of the formal sector. To sum up,the poor image of EPZs in terms of labour issues (“sweatshops”) does not adequately apply to Madagascar.
The final dismantling of MFA customs quotas since January 1, 2005 (although some other quotas have almost immediately been reinstalledboth by the USA and the EU) has mainly benefited Asian countries and especially China. The remarkable growth of Zone Franche exportsand employment has stopped since then and its future is under threat. One of the main sources of employment opportunities in the formalsector for the youth might disappear, as it might be the case in other African countries (Kenya, Lesotho, Mauritius, etc.) which have also reliedon textile-clothing exports.

3.2.2 Example of Francophone West Africa
African francophone countries are considered be the most
rigid in the continent. The World Bank Doing Business
Report (World Bank, 2005) lists the ten countries where the
labour market is the most rigid and the most flexible, accor-
ding to four criteria: difficulty of hiring, difficulty of firing, rigi-
dity of hours, and rigidity of employment. Table 11 in
Appendix shows that six French-speaking African countries
are listed among the countries where hiring is the most dif-
ficult, two are listed among the countries where firing is the
most difficult, six among the countries where working hours
are the most rigid, and eight among the countries where
employment as a whole is the most rigid. On the contrary,
there are only four African countries in the list of countries
where labour markets are the least regulated: Mauritius (dif-
ficulties in hiring); Tunisia (rigidity of working hours);
Zambia and Uganda (rigidity of employment).
However, data from PARSTAT surveys on seven West
African capitals illustrates the argument of the UNECA
(2005) report regarding the low coverage and lack of appli-
cation of labour legislation:
� on average in all seven cities, only 13 percent of jobs
are in the formal private sector where labour legislation
applies;
� over a quarter of full time employees do not earn the
guaranteed minimum wage and the figure varies little
from one country to another; the percentage exceeds
half the employees in the informal sector and nearly 10
percent on average in the formal private sector. This
percentage is all the more surprising that, as remarked
by UNECA (2005), the level of the guaranteed minimum
wage is much lower than the starting salary in general,
given that this level has often not been upgraded for
several decades;� in the same way, whereas the weekly working hours are set
at 40, over half the labour force actually worksmore than 40
hours and this percentage exceeds three-quarters in the
informal sector (usually with no payment for overtime).
� the rate of activity of children under 14 (below the legal
minimum age for work) ranges between 9 percent
(Ouagadougou, Dakar) and 17 percent (Lome); most of
these children work in the informal sector.
3. Causes of the youth labour market disadvantage: a demand-side perspective
© AFD Working Paper N°49 • Youth and Labour Markets in Africa - A literature review
40
Knowledge gaps:
Evidence on real wage flexibility remains scarce and contradictory. Understanding the extent and the mechanisms of labour market adjustmentis important in assessing the effect of adjustment policies on the labour force. This is particularly the case for the youth, as they are likely to beamong those who directly bear the burden of adjustment, through lower levels of employment and/or lower wages. More research is needed toidentify the logic underlying the setting of high wages in African firms of the modern sector. The theoretical model presented at the beginning ofthis section suggests that, despite the small size of the formal sector, the hiring practices of firms in this sector have implications on the beha-viour of workers, either employed of unemployed, that go far beyond its limits. For young workers, the issue is important as they are more like-ly than others to be outsiders on the labour market and to have difficulties sending the good signal to future employers.
© AFD Working Paper N°49 • Youth and Labour Markets in Africa - A literature review
41
4. Public and private responses
Available evidence presented in this literature survey sug-
gests that the labour market conditions faced by the young
differ sufficiently from those faced by adults so that special
policies should be targeted at them.
Nonetheless, there are very few active labour market policies
on a significant scale in Africa except in South Africa and in
some North African countries like Tunisia where self-employ-
ment assistance (largely through micro-financing) and youth
training constitute the bulk of the active labour market pro-
grammes (Betcherman, Olivas and Dar, 2004). An analysis of
21 African Poverty Reduction Strategy Papers (PRSPs)
conducted by UNECA (2005) reveals that only half (11) have
a section analysing youth employment and 17 have specifi-
cally targeted employment creation for young people, mainly
through training and education, macroeconomic policies and
the development of the private sector. However, according to
UNECA, the actions planned in these fields are very general
and not well targeted (e.g., the educational skills required for
on-the-job training are not identified).
This section reviews recommendations, policies and prac-
tices, at the international and national levels, that have tried
to ease youth inclusion in the labour market, improve their
labour market and income prospects, as well as policies
that have supported the creation of more and better jobs.
These experiences (as well as experiences on other conti-
nents) could usefully enrich African PRSPs25.
4.1 Active labour market policies in Africa
UNECA (2005) deals with the issue of ALMPs in a study
conducted by the Poverty and Social Policy Team dealing
with “Youth, Education, Skills and Development”. Before
describing some local experiences, the study stresses that
ALMPs would be inefficient if they are designed to tackle
short term unemployment due to business cycle negative
trends. It also insists on the fact that the success of ALMPs
will also depend on other needed reforms to enhance grow-
th and remove labour market rigidities.
In response of governments to youth unemployment,
Livingstone (1989) distinguishes different types of policies
relying on changes in education and training system and
specific projects providing for direct employment. Our pre-
sentation of Programmes for Unemployed Youth in Africa
follows in part his classification which is also close to that in
Kanyenze et al. (2000). This categorization is made for ana-
lytical purposes, as in practice programmes may not be
mutually exclusive.
4.1.1 Public employment services
Public employment services have three major tasks: place-
ment, vocational information and guidance, and labour mar-
ket information. The results of surveys on discouraged wor-
kers (see Kanyenze et al., 2000) constitute a strong argu-
ment for developing job search assistance programmes
(writing job applications, preparation for interviews, etc.).
Employment services could build a strong link with the pri-
vate sector from which both sides would benefit. Vocational
guidance and individual counselling activities would com-
plete the picture of the modern public employment services.
As it stands, however, some available evidence suggests
25 We do not present here international initiatives such as the Youth Employment Network,sponsored by the United Nations. Of the 10 lead countries having adopted a National ActionPlan on youth employment, five are from Africa (UNECA, 2005). Though the actions plans arecountry specific, their main thrust is based on the four E’s: employability, equal opportunity,entrepreneurship and employment creation. We do not have information on their actual imple-mentation, which seems to be still at an early stage.

that very few countries provide reasonably good services
and that the target population is not fully aware of the avai-
lability of such services (see, e.g., Schultz and Klemmer
(1998) for a study on public employment services in
English-speaking African countries). Using data from the
1-2-3 Surveys, Figure 7 shows that the proportion of the
unemployed who are registered at the National
Employment Agency is particularly low among the young.
Furthermore, the main reason for not being registered
appears to be a lack of knowledge regarding the existence
of Employment Agencies (Figure 8).
4.1.2 Schemes to provide direct employment
Programmes to provide direct employment usually target uns-
killed young people and are often used as safety nets. The idea
is to provide short term employment to poor youth and contri-
bute to improving a country’s infrastructure at the same time.
In Senegal, the AGETIP (Agence d’Exécution des Travaux
d’Intérêt Public) programmes combine efforts to build public
infrastructure such as roads, buildings, and sanitation sys-
tems, with efforts to provide jobs and training for unem-
ployed youth. Construction firms that get the contracts also
agree to use relatively labour-intensive practices to use
local inexperienced youth who receive training funded by
AGETIP. After seven years, the number of engineering
firms more than tripled, the number of construction firms
increased fivefold and 35,000 person-years of employment
were generated (World Bank, 2006a). However, the main
criticism of theses programmes is their implementation in
urban areas only.
Kenya’s labour-intensive Rural Access Roads programmeis cited as an example of a successful scheme that produ-
ced concrete benefits in the form of infrastructural works
while also economising on scarce capital. Development
Works Corporation in Mauritius in 1970 is an example in
which public work construction has been combined with
vocational training in the basic trades. Another example is
the Revolutionary Youth Association (REYA) in Ethiopia,
which was created in 1980 by a small group of youth asso-
ciations and had three million members (out of nine million
young Ethiopians). REYA undertook a large number of
public works programmes and had a positive impact on pro-
moting schooling. However, the association had limited
importance as a means of reducing unemployment becau-
se of the situation of its members: they were young people
who were unemployed, but also under-employed or stu-
dents, and therefore occupied part time jobs.
South Africa, which allocates an estimated US$800 millionof its current budget to labour-intensive infrastructural pro-
grammes, has probably one of the best public works pro-
grammes anywhere. Its Community Based Public Works
Programme (CBPWP), launched in August 1994, was
regarded as surpassing anything that the ILO members of
an evaluation team had encountered in more than thirty
developing countries. Its broad aims are to reduce unem-
ployment, educate and train beneficiaries, create, rehabili-
tate and maintain physical assets, and build the capacity of
communities. The CBPWP comprises 599 projects, most of
which are situated in and providing employment opportuni-
ties to residents of some of the most impoverished areas in
the country. It has been difficult to assess with confidence
4. Public and private responses
© AFD Working Paper N°49 • Youth and Labour Markets in Africa - A literature review
42
Figure 7. Share of the unemployed who are registered at the NationalEmployment Agency (%)
Source: 1-2-3 Surveys. Phase 1 (labour force survey). 2001-2005. NationalStatistical Institutes. AFRISTAT. DIAL ; authors’ computations.
Figure 8. Reasons for not being registered (%)
Source: 1-2-3 Surveys. Phase 1 (labour force survey). 2001-2005. NationalStatistical Institutes. AFRISTAT. DIAL ; authors’ computations
the achievements of the project in terms of disbursements
and employment generated. Two different evaluations refer
to 2.5 million work-days created by July 1997, or to 1.4 mil-
lion. This divergence reflects the practical difficulties of
making accurate assessments of the socio-economic
effects of such programmes.
Egypt established also a public works programme in 1991which focused on generating jobs for youth in poor rural
areas. The projects cover productive infrastructure (irriga-
tion, drainage, protection of agricultural land); economic
infrastructure (roads, channels); social infrastructure (public
building restoration, potable water provision) and comple-
mentary projects (related to health and education). By 1997
(to 2000), slightly over 42,000 jobs were created, 90 per-
cent of which were temporary and workers were almost
exclusively young men.
4.1.3 Schemes to provide employable skills
Another category of scheme starts from the assumption
that in order to secure employment young people must be
equipped with specific employable skills of a blue-collar
nature.
This type of initiative was introduced in Kenya (village poly-technic programme in 1963), in Zambia (integration pro-
grammes through industrial qualifications, in particular), in
Botswana (the Brigade Movement in 1976-1984) in the buil-
ding sector, but also in Somalia and Mauritius. One of the
problems with these initiatives (noted in the case of
Mauritius) is the fact that no real preference can be noted
on the part of entrepreneurs to employ skilled people rather
than individuals with a general education. In the industries
in question, it takes very little time to train a young person
and the companies therefore recruit very few people who
are already qualified. The problem of youth unemployment
has been partly solved in Mauritius, particularly for women,
by the massive production of exportable products (textiles).
Among the programmes used to reduce the skills mismat-
ch problem in the African labour markets, Adams (1997)
and Godfrey (2003) cite the voucher system adopted by the
Kenyan Government. This programme called “training vou-cher for workers under the sun” targeted established firms
and workers in order to identify businesses with the most
promising potential. 37,666 vouchers were issued during
the 1997-2001 period. UNECA (2005) considers this pro-
gramme as a success even if its impact has not been
assessed.
Job training programmes are more likely to be successful if
they are part of a package that includes basic education,
employment services, and social services (World Bank,
2006b). Betcherman et al. (2004) show in a review of 19
training programmes targeting youth that in the absence of
such a package, training programmes rarely improve the
employment and earnings of young participants.
Among schemes promoting vocational skills, formal
apprenticeship schemes or traditional apprenticeships
could be a way to ensure that the skills offered fit the needs
of employers and as a result to enhance youth employment.
In Germany, France, the United Kingdom, and the United
States, formal apprenticeships are associated with an
increase in employment for young men, and on earnings for
young women. However, they are hardly applicable in Africa
because the small share of employment in the modern
wage sector, the slow growth of jobs for new apprentices,
and the weakness of institutions. Van Eekelen, de Luca and
Ismail (2001) show, studying the Mubarak-Kohl initiative
launched in 1995 in Egypt, the difficulty of introducing for-mal apprenticeship in African countries.
In order to better take into account economic demand,
recent reforms have been undertaken in countries such as
Tunisia, Morocco or Algeria. These reforms led to thecreation of strong partnerships with professional organisa-
tions and to the reorganisation of sectoral training centres
(Clement, Walther, Bougault and Filipiak, 2005). Initiatives
aiming at promoting life-long learning have also been car-
ried out in North Africa, such as the vocational tax for
employers in Morocco in 1997 whose purpose is to finance
continuous vocational training (CSF, Contrats Spéciaux de
Formation). A quantitative impact evaluation of the CSF
programme has recently been achieved and shows a signi-
ficant positive impact on the firms’ performance over the
period 1997-2003 (European Training Foundation, 2006).
In SSA, especially in the Western part, traditional apprenti-
ceships, in which a craftsman trains trainees in his work-
shop, are the most common way for youth to acquire skills
(see section 3.2.4). Atchoarena and Delluc (2001) find that
in Ghana, 80–90 percent of all basic skills training comesfrom traditional apprenticeships, compared with 5–10 per-
cent from public training institutions and 10–15 percent
4. Public and private responses
© AFD Working Paper N°49 • Youth and Labour Markets in Africa - A literature review
43

from nongovernmental sources. According to Haan and
Serriere (2002), in West Africa it is common to find more
apprentices than wage employees in the informal sector
firms.
The major strengths of traditional apprenticeships, while not
carefully evaluated, are their practical orientation, their rela-
tive independence from government funding and regula-
tions and their cost effectiveness. However, traditional
apprenticeships have three main drawbacks: they do not
reach young women and very poor young people and they
perpetuate traditional technologies (Johanson and Adams,
2004). Strengthening the pedagogical and technical skills of
master craftsmen is certainly a key step to improve the qua-
lity traditional apprenticeships. Evidences from Kenya’sinformal sector (“Jua Kali”), suggest that vouchers increa-
sed the access of master craftsmen to new technologies
and upgraded their skills, and as a result improve the qua-
lity and relevance of their training (Riley and Steel, 1999).
Another example of an attempt at linking education and trai-
ning and the workplace is the National OpenApprenticeship
Scheme in Nigeria (NOAS). Under this scheme, vocationaleducation and training is provided to unemployed youth in
over 100 occupations. Unemployed youth and school-lea-
vers are given an opportunity to train for a period of 6
months to 3 years under reputable Master Craftsmen. Since
its inception in 1987, nearly 600,000 unemployed youth
have received training in 80 different trades under the sche-
me. Around 400,000 of these started their own micro-enter-
prises, while an additional 32,000 unemployed youth are
currently undergoing training.
4.1.4 Schemes to promote self-employment
Nafukho (1998) studied the programmes designed to deve-
lop entrepreneurial talents that were introduced in many
African countries from the 1970s onwards. Following
unsuccessful attempts in the domain of professional trai-
ning, certain governments tried to absorb youth unemploy-
ment by promoting the creation of small enterprises, there-
by favouring entrepreneurial talents. The different initiatives
taken in Africa include:� the promotion of education targeted on technical or far-
ming techniques (Zimbabwe, Uganda, Kenya, Gambia),
� expert advice for young entrepreneurs (Nigeria,
Gambia, Malawi),
� assistance with project financing (Malawi, Swaziland),
� and even incentives to adopt a business spirit (Uganda,
Kenya).
The initiatives aimed at developing entrepreneurship gave
encouraging results, but these were insufficient to reduce
youth unemployment since, apart from political will, they
require educational, administrative, financial and legal
conditions and a favourable business climate that the
African countries find it hard to provide. Nafukho also men-
tions the importance of the content of the apprenticeship if
the entrepreneur is to succeed. The effectiveness of this
type of policy focusing on entrepreneurial talents is yet to be
proved.
Perhaps the most familiar initiatives that have been under-
taken in virtually all countries in Africa are those concerning
the promotion of micro-, small- and medium-scale enter-
prises (MSMEs), including informal sector development.
However, while almost every country in Africa has commit-
ted itself to the promotion of MSMEs, it is not always clear
to what extent these programmes cater to the needs of
unemployed youth.
The South African approach to the development and sup-port of small business is an example of a comprehensive,
integrated national strategy. It was born out of a national
consultative process, which started with the President’s
Conference on Small Business held in March 1995. Many
initiatives targeted at developing MSMEs with an interesting
approach based on the central role accorded stakeholder
participation and the fact that social partners contributed to
the financing of the job creation programmes. The public
sector in some countries provides financial support to
young entrepreneurs. In South Africa, the government crea-
ted the Umsobomvu Youth Fund so as to ease access to
information and public funding and to support skills deve-
lopment for people under age 35. Unfortunately, Kanyenze
et al. (2000) do not give any success appreciation because
all initiatives are still at an early stage of implementation.
Another example of support to young entrepreneurs is the
“Youth Business International helping young people beco-
me entrepreneurs” programme that was set up to help
young people overcome the barriers they can face in setting
their own business (Chambers and Lake, 2002). The two
African countries involved in the programme are Nigeriaand Mauritius. The authors consider this programme as a
4. Public and private responses
© AFD Working Paper N°49 • Youth and Labour Markets in Africa - A literature review
44

success, basing their assessment on the number of benefi-
ciaries.
The programmes and policies adopted to deal with youth
unemployment often reflect the particular diagnosis made
of its underlying causes (Livingstone, 1989). Where the
wrong attitudes of part of young population have been poin-
ted, back-to-the-land projects with re-education in agricultu-
ral values have been implemented like in Somalia, Zambia
and Malawi. Where the problem have been seen essential-
ly to be a lack of practical, employable skills, the emphasis
has been on craft training, like in Zambia, Botswana and
Kenya.
4.1.5 Other schemes
Somalia’s Agricultural Crash Programme (ACP) was laun-ched in 1970. Its aim was to promote the building of collec-
tivist farming cooperatives with technical production assis-
tants, replacing the former system of small, family-run sub-
sistence farms with elementary equipment. In 1979, seven
farms were operational, involving 7,254 young voluntary
settlers. The programme also provided for the presence of
qualified personnel: in 1979, 11,000 young farm technicians
had been trained, 20,000 in 1984. However, technical effi-
ciency and returns remained low: nearly all the State firms
were loss-making and weighed heavily on the State budget.
This policy was therefore not a total success.
National service has sometimes been used (Kenya,
Zambia) as a solution to the problem of youth unemploy-
ment. However, it remains a short-term solution as the leng-
th of national service is limited, generally to one year, and it
has many objectives (military preparation, patriotism, etc.).
The advantage highlighted in terms of the fight against
youth unemployment is that the young people learn discipli-
ne. Another argument in favour of national service is the
training it offers in terms of qualifications, as long as this fits
in with the individual’s previous training.
4. Public and private responses
© AFD Working Paper N°49 • Youth and Labour Markets in Africa - A literature review
45
4.2 Evaluation
The main issue examined in this section is whether active
labour market policies are effective or a waste of public
funds. Given the scarcity of public funds in Africa, this issue
is even more relevant in the policy debate than elsewhere.
The World Bank Social Protection Unit (Betcherman et al.,
2004) has realized a study to assess the impact of these
programmes in Developing and Transition Countries26. The
study focuses on seven categories of programmes namely
employment services, training for the unemployed, training
for workers in mass layoffs, training for youth, public works,
wage and employment subsidies and self-employment
assistance.
The conclusions of the study for the seven categories of
programmes is that there is very little evidence of an impact
in developing countries for employment services, training
for workers in mass layoffs, wage and employment subsi-
dies and public works. The effects of training for unem-
ployed seem to be not positive, but the authors note that
there are very few studies available. Training for youth
seems to have a positive impact, but the evaluations
concern exclusively Latin American countries. Finally, there
are not enough evaluations to determine the impact of self-
employment programmes on employment and earnings.
The World Bank (2006b) reviews several evaluation studies
of youth policies and programmes in Ethiopia, Burkina
Faso, Tanzania, and Uganda. The report shows that the
programmes are rarely targeted (they focus mainly on
urban unemployment, neglecting other challenges), and
that the quality of interventions is low. Several evaluation
studies of these interventions have been conducted, but
they report only outcomes, not impact. The World Bank
study shows that there is an urgent need for active labour
market policies evaluations in Africa. These evaluations can
be of two kinds:� ex ante evaluations which would stress the potential
benefits and risks of the different programmes before
their implementation; these evaluations need to be
conducted in a general equilibrium framework to allow
taking into account the direct effects of each policy on
the labour market and the Government budget but also
the indirect effects on the various actors and sectors of
the economy;
26 The sample of countries studied is not indicated in the paper, but it seems that very fewdeveloping countries are included, mainly Latin American and East Asian.
� ex post evaluations which would assess the cost-effec-
tiveness of the already implemented programmes;
these evaluations based on available surveys analysis
or experiments would help deciding whether these poli-
cies should be reinforced, pursued, reshaped or aban-
doned.
© AFD Working Paper N°49 • Youth and Labour Markets in Africa - A literature review
46
Knowledge gaps:
It is essential to stress the need for evaluations to have an objective assessment of the effectiveness of these programmes. Economic evalua-tions of employment policies in Africa using experimental or quasi-experimental techniques are badly needed. However, the cost-benefit analy-sis must not only focus on income. It should also take into account the potential negative impact of unemployment on health, violence, etc.
© AFD Working Paper N°49 • Youth and Labour Markets in Africa - A literature review
47
Conclusion
Although international institutions are beginning to pay
more attention to it, the subject of youth employment and,
more broadly, the integration of young people in African
society, is still widely neglected. In terms of research, our
review of the literature clearly highlights the knowledge
gaps. To a certain extent, these can be explained by the
lack of quality data on the labour market, a point which is
specific to Africa. The most elementary information is lac-
king. For example, what is the youth unemployment rate?
Has it increased or decreased in the past decade? The ans-
wers to these questions differ from one source or from one
author to another. As for policies, despite recurrent
attempts, actions in favour of the integration of young
people have only played a marginal role, probably due to
their limited scale. However, putting aside particular natio-
nal cases, the few stylised facts that emerge clearly show
that young people have been the main victims of the conti-
nent’s poor economic performances in recent decades.
They have paid a heavy price for weak (or even negative)
growth and the shortcomings of the labour market
(urban/rural segmentation; inappropriate legislation; lack of
wide-scale proactive policies). They have acted as adjust-
ment variables between an ever increasing labour supply –
despite progress in schooling rates and the beginnings of
demographic transition - and sluggish demand. The cut-
backs in the public sector have not been made up for by the
formal private sector, which suffers from poor levels of com-
petitiveness. This has left room for a prolific informal sector
with low average productivity rates and bad working condi-
tions, which young people have been obliged to turn to en
masse. This unfair treatment contains the seeds of a “clash
of generations”. Although, overall, this has not in fact taken
place, the lack of prospects has nonetheless encouraged
some of the younger generation to adopt high-risk or illegal
behaviour: taking part in the criminal economy, growing role
in armed conflicts, etc., whereas some see south-north
migration as a solution.
The recent awareness at the highest political levels of the
challenge posed by the integration of young people in Africa
should be a stimulus to acquiring better knowledge of the
situation and to more effective, sustained action in the
years to come. The results of this study offer a certain num-
ber of paths for research on this subject. First and foremost,
to cater for the need for pertinent, reliable, real-time data on
the labour market, it is absolutely vital to introduce a
durable system of employment surveys, to be included in
the National Statistical Systems (NSS), and thus put an end
to the “African exception” in this domain. In the meantime,
it is possible to take more advantage of the high analytical
potential of a secondary exploitation of the existing sources.
The example given in this study using the 1-2-3 Surveys
shows that it is possible, at a low cost, to clarify the situa-
tion and to extend the analysis by introducing the different
age groups. Theme-based programmes could by launched
rapidly in this direction. Finally, the probable extension of
employment policies in favour of young people should give
rise to the more systematic introduction of monitoring and
assessment mechanisms to gauge the impact of the poli-
cies, as these are still very scarce in Africa. Recent metho-
dological progress in this field of research, which has been
particularly fruitful in the past few years, could be applied
with great benefit in Africa.
Without listing all the knowledge gaps presented at the end
of the sections of this report, we would like to focus on a few
main lines of research that we consider being priorities. For
instance, we believe that it is a priority to make up for the
most glaring knowledge gaps in order to establish a true
picture of the major trends underway.
1.A special effort must be made in rural areas, for which theconcepts used to describe labour markets are generally

irrelevant (individual incomes, wages, number of hours wor-
ked on a weekly basis) and for which there is little data.
2. Less attention should be paid to unemployment, which isnot a very relevant indicator of the tensions in the labour
market in Africa, and more should be paid to under-employ-
ment and to the quality of jobs.
3. Given its importance, studies should focus on the informalsector, in order to gain a better understanding of how it works,
but also in a view to thinking up policies aimed at increasing
productivity whilst also protecting the people who work in the
sector. In this respect, the link between formal and informal
job training and professional trajectories is crucial.
4. Particular attention should be paid to the most vulnerablegroups, such as women, young and uneducated workers.
Understanding the roots of gender discrimination is a prere-
quisite if one wants to design efficient policies to counter
gender inequalities (Goal 3 of the MDGs). There is much to
learn about the discrimination practices of all kind, in
access to schooling for instance, but also about the
demand-side factors that may influence employers when
they make decisions concerning hiring and promotions or
use gender to predict future work commitment.
5. In order to understand why formal labour markets are notable to absorb the increased labour supply, most studies
focus mainly on the supply side, little attention being paid to
the links between supply and demand. In this objective,
systematic use of data linking information on production
units and their workers – matched employer-employee – is
essential.
6. In the same vein, the links between economic growth,labour demand and the quality of jobs being created remain
insufficiently investigated.
7. Alongside these badly needed micro-economic and sec-toral studies, we believe there is also a need for macro-eco-
nomic studies on issues such as the content of growth in
terms of youth employment, the impact of demographic
dynamics, the prospects of formal and informal education
systems and the distributive effects of policies.
Conclusion
© AFD Working Paper N°49 • Youth and Labour Markets in Africa - A literature review
48

© AFD Working Paper N°49 • Youth and Labour Markets in Africa - A literature review
49
References
Acemoglu, D. and J. S. Pischke (1999), “The Structure of Wages and Investment in General Training”, Journal of Political
Economy, 107, 539-572.
Adams, A.V. (1997), “Assessment of the Jua Kali Pilot Voucher Program”, mimeo, Washington, DC: The World Bank.
Adams, J. (1991), “The Rural Labour Market in Zimbabwe”, Development and Change, 22(2), 297320.
Alby, P., J.-P. Azam and S. Rospabé (2005), Labor Institutions, Labor-management Relations and Social Dialogue, German
Trust Fund Project “Job Creation, Core Labor Standards & Poverty Reduction in Africa”, Washington, DC: The World Bank.
Al-Samarrai, S. and P. Bennell (2006), “Where has All the Education Gone in Africa? Employment Outcomes Among
Secondary School and University Leavers”, MRPA Paper, 128, Munich: University Library of Munich.
André, C. and J.P. Platteau (1998), “Land Relations Under Unbearable Stress: Rwanda Caught in the Mathusian Trap”, Journal
of Economic Behavior and Organization, 43, 1-47.
Antoine, P., M. Razafindrakoto and F. Roubaud (2001), « Contraints de rester jeunes ? Evolution de l’insertion urbaine dans
trois capitales africaines : Dakar, Yaoundé, Antananarivo », in Les jeunes, hantise de l’espace public dans les sociétés du
Sud, Autrepart, 18, IRD-Editions/Editions de l’Aube.
Aryeetey, E., A. Baah-Nuakoh, H. Duggleby, H. Hettige and W.F. Steel (1994), “The Supply and Demand for Finance among
SMEs in Ghana”, Africa Technical Department Discussion Paper, 251, Washington, DC: The World Bank.
Atchoarena, D. and A.-M. Delluc (2001), “Revisiting Technical and Vocational Education in Sub-Saharan Africa: An Update on
Trends, Innovations, and Challenges”, IIEP/Prg.DA1.320, Paris: International Institute for Educational Planning.
Austin, G. (1999), “Background Note on Civil Strife and Poverty in Sub-Saharan Africa”, Background paper for the World
Development Report 2000/2001”, Washington, DC: The World Bank.
Ayalew, D., S. Dercon and P. Krishnan (2000), “Demobilisation, Land and Household Livelihoods: Lessons from Ethiopia”,
CSAE Working Paper, 2000-135, Oxford: Centre for the Study of African Economies.
Beaudry, P. and N. K. Sowa (1994), “Ghana”, in Susan Horton et al. (eds), Labor Markets in an Era of Adjustment, Vol. 2., EDI
Development Studies, Washington, DC: The World Bank.
Bennell, P. (1996a), “Rates of Return to Education: Does the Conventional Pattern Prevail in Sub-Saharan Africa?”, World
Development, 24, 183-199.
——————— (1996b), “Using and Abusing Rates of Return: A Critique of the World Bank’s 1995 Education Sector Review”,
International Journal of Educational Development, 16, 235-248.
Bennell, P. and J. Sergerstrom (1998), “Vocational education and training in developing countries: Has the World Bank got it
right?”, International Journal of Educational Development, 18, 271-87.
Betcherman, G., K. Olivas and A. Dar (2004), “Impact of Active Labor Market Programs: New Evidence from Evaluations with
Particular Attention to Developing and Transition Countries”, Social Protection Discussion Paper Series, 402, Washington,
DC: The World Bank.
Biggs, T. and P. Srivastava (1996), “Structural Aspects of Manufacturing in Sub-Saharan Africa: Findings from a Seven Country
Enterprise Survey”, Africa Technical Department Discussion Paper, 346, Washington, DC: The World Bank.
Bigsten, A., A. Isaksson, M. Soderbom, P. Collier, A. Zeufack, S. Dercon, M. Fafchamps, J.W. Gunning, F. Teal, S. Appleton,
B. Gauthier, A. Oduro, R. Oostendorp and C. Patillo (2000), “Rates of return on physical and human capital in Africa’s
manufacturing sector”, Economic Development and Cultural Change, 48, 801-827.
BIT (1985), Les programmes spéciaux d’emploi et de formation de la jeunesse. Une étude comparative du PECTA, Rapport
de synthèse, ILO : Addis Abada.
Bossuroy, T. (2006), « Déterminants de l’identification ethnique en Afrique de l’Ouest », Afrique Contemporaine, 220, forthco-
ming.
Bratton, M., R. Mattes, E. Gyimah-Boadi (2004), Public Opinion, Democracy and Market Reform in Africa, New-York:
Cambridge University Press.
Brilleau, A., F. Roubaud and C. Torelli (2005), « L’emploi, le chômage et les conditions d’activité, enquêtes 1-2-3 Phase 1 »,
Statéco, 99, 43-64.
Brown, C. (1990), “Empirical Evidence on Private Training”, Research in Labor Economics, 11, 97113.
Burger, R. and I. Woolard (2005), “The State of the Labour Market in South Africa after the First Decade of Democracy”, CSSR
Working Paper, 133, Cape Town: Centre for Social Science Research,.
Calvès, A.-E. and B. Schoumaker (2004), “Deteriorating Economic Context and Changing Patterns of Youth Employment in
Urban Burkina Faso: 1980–2000”, World Development, 32, 1341-1354.
Card, D. (1999), “The Causal Effect of Education on Earnings”, in O. Ashenfelter and D. Card (eds), Handbook of Labor
Economics, vol. 3A, pp. 1801-1863, Netherlands: Elsevier Science Publishers BV.
Casale, D. and D. Posel (2002), “The Continued Feminisation of the Labour Force in South Africa: an Analysis of Recent Data
and Trends”, South African Journal of Economics 70(1), 156-184.
Casale, D., C. Muller and D. Posel (2004), “Two Million Net New Jobs: A Reconsideration of the Rise in Employment in South
Africa?”, mimeo, Durban: University of KwaZulu-Natal.
Casero, P.A. and G. Seshan (2006), “Public-Private Sector Wage Differentials and Returns to Education in Djibouti”, World
Bank Policy Research Working Paper, 3923, Washington, DC: The World Bank.
CDPR (2005), Labour Supply, German Trust Fund Project “Job Creation, Core Labor Standards & Poverty Reduction in Africa”,
Paper 1, Washington, DC: The World Bank, Available at (www.worldbank.org/labormarkets).
Chambers, R. and A. Lake (2002), “Youth Business International: bridging the gap between unemployment and self-employ-
ment for disadvantaged youth”, ILO Skills Working Paper, 3, Geneva: ILO.
Chaveau, E. (2000), « Question foncière et construction nationale en Côte d’Ivoire », Politique africaine, 78, 94-125.
Clement S., R. Walther, H. Bougault et E. Filipiak,(2005), « Les mécanismes de financement de la formation professionnelle :
Algérie, Maroc, Sénégal, Tunisie », AFD Notes et Documents, N° 14, Paris : Agence Française de Développement.
Cling, J.-P., M. Razafindrakoto, F. Roubaud (eds) (2003), New International Poverty Reduction Strategies, London and New
York: Routledge.
Cling, J.-P., M. Razafindrakoto, F. Roubaud (2005), “Export Processing Zones in Madagascar: a Success Story under Threat?”,
World Development, 33 (5), 785-803.
Cogneau, D., T. Bossuroy, P. De Vreyer, C. Guénard, V. Hiller, P. Leite, S. Mesple-Somps, L. Pasquier-Doumer et C. Torelli
(2006), « Inégalités et équité en Afrique », AFD Notes et Documents, N° 31, Paris : Agence Française de Développement.
Collier, P. (2000), “Doing Well Out of War: An Economic Perspective”, in Mats Berdal and David M. Malone (eds), Greed and
Grievance: Economic Agendas in Civil Wars. Boulder, CO and London: Lynne Rienner, pp. 91–111.
Collier, P. and A. Garg (1995), “On Kin Groups and Employment in Africa”, CSAE Working Paper, 1995-16, Oxford: Centre for
the Study of African Economies.
Collier, P. and J. W. Gunning (1999), “Explaining African Economic Performance”, Journal of Economic Literature, XXXVII, 64-
111.
Collier, P. and A. Hoeffler (2001), “Greed and Grievance in Civil War”, Policy Research Working Paper Series, 2355,
Washington, DC: The World Bank.
References
© AFD Working Paper N°49 • Youth and Labour Markets in Africa - A literature review
50

Dabalen, A., H.S. Nielsen and M. Rosholm (2003), “Labor Markets and Enterprise Training in African Manufacturing”,
Background paper for a regional report, Washington, DC: The World Bank.
Deaton, A. and D. Benjamin (1988), “The Living Standards Survey and Price Policy Reform: a Study of Cocoa and Coffee
Production in Côte d’Ivoire”, LSMS Working Paper, 44, Washington, DC: The World Bank.
Deininger, K. and R. Castagnini (2006), “Incidence and Impact of Land Conflict in Uganda”, Journal of Economic Behavior and
Organization, 60, 321-345.
Destré, G. and C.J. Nordman (2002), “The Impacts of Informal Training on Earnings: Evidence from French, Moroccan and
Tunisian Employer-Employee Matched Data”, L’Actualité Économique, 78(2), 179-205.
Docquier, F. (2006), “Brain Drain and Inequality across Nations”, Paper presented at the EUDN-AFD conference on “Migration
and Development”, Paris, November 8, 2006.
Docquier, F. and A. Marfouk (2006), “International Migration by Educational Attainment (1990-2000)”, in Ozden, C. and M.
Schiff (eds), International Migration, Remittances and the Brain Drain, Chap 5, Palgrave-Macmillan.
Docquier, F. and K. Sekkat (2006), “The Brain Drain: What Do We Know?”, Research report prepared for the AFD, Paris.
Dumont, J-C. and G Dumaître. (2005), “Counting Immigrants and Expatriates in OECD Countries: a New Perspective”, OECD
Social, Employment and Migration Working Papers n°25, 39 p.
Du Toit, R. (2003), “Unemployment in South Africa: the Distressed Generation?”, Paper presented at the Minnesota
International Counselling Institute, 27 July - 1 August.
Dragoset, L. and L. Vilhuber (2006), “Schooling and Early Work Experience in Uganda”, in Youth in Africa’s Labor Market (Vol.
II Country Case Studies), Chapter 3, Washington, DC: The World Bank.
Eifert, B. and V. Ramachandran (2004), “Competitiveness and Private Sector Development in Africa, Cross Country Evidence
from the World Bank’s Investment Climate Data”, RPED, 33665, 53 p, Washington, DC: The World Bank.
European Training Foundation (2006), Impact Assessment Studies and Policy Learning, ETF Publication on CEVT Projects,
Turino: ETF, forthcoming.
Ewoudou, J. and D. Vencatachellum (2006), “An Empirical Analysis of the Rates of Returns to Education in Cameroon”,
Communication at the CSAE Conference 2006, Oxford.
Fafchamps, M., M. Söderbom and N. Benhassine (2006), “Job Sorting in African Labour Markets”, CSAE Working Paper,
2006-02, Oxford: Centre for the Study of African Economies.
Fafchamps, M. and M. Söderbom (2004a), “Wages and Labour Management in African Manufacturing”, CSAE Working Paper,
2004-02, Oxford: Centre for the Study of African Economies.
Fafchamps, M. and M. Söderbom (2004b), “Climate for Job Creation”, GPRG, Centre for the Study of African Economies,
University of Oxford.
Foster, A. and M. Rosenzweig (1996), “Technical Change and Human Capital Returns and Investments: Evidence from the
Green Revolution”, American Economic Review, 86(4), 931–53.
Fox, L. and M. Sekkel (2006), “Job Creation and the Quality of Growth in Africa”, Discussion draft, Poverty Reduction and
Economic Management Department, Washington, DC: The World Bank.
Frazer, G. (2006), “Learning the Master’s Trade: Apprenticeship and Human Capital in Ghana”, Journal of Development
Economics, forthcoming.
Girma, S. and A. Kedir (2005), “Heterogeneity in Returns to Schooling: Econometric Evidence from Ethiopia”, Journal of
Development Studies, 41(8), 1405-1416.
Glewwe, P. (1990), “Investigating the Determinants of Household Welfare in Cote d’Ivoire”, LSMS Working Paper, 71,
Washington, DC: The World Bank.
——————— (1996), “The Relevance of Standard Estimates of Rates of Return to Schooling for Education Policy: A Critical
Assessment”, Journal of Development Economics, 51, 267-290.
Glick, P. and F. Roubaud (2006), “Export Processing Zone Expansion in Madagascar: What are the Labour Market and Gender
References
© AFD Working Paper N°49 • Youth and Labour Markets in Africa - A literature review
51

Impacts?”, Journal of African Economies, forthcoming.
Godfrey, M. (2003), “Youth Employment Policy in Developing and Transition Countries – Prevention as Well as Cure”, World
Bank Social Protection Discussion Paper, 320, Washington, DC: The World Bank.
Grimm, M. and I. Gunther (2006), “Inter- and Intra-household Linkages between the Informal and Formal Sectors: A Case
Study for Urban Burkina Faso” in Guha-Khasnobis B. and Kanbur R., Informal Labour Markets and Development, London:
Palgrave.
Gubert, F., C.J. Nordman (2006), “Migration from MENA to OECD Countries: Trends, Determinants and Prospects”,
Background Paper for MENA Department, Washington, DC: The World Bank, 78 p.
Haan, H. C. and N. Serriere (2002), Training for Work in the Informal Sector: Fresh Evidence from West and Central Africa.
Turin: International Training Centre of the International Labour Organization.
Harding, A., M. Söderbom, F. Teal (2004), “Survival and Success among African Manufacturing Firms”, CSAE Working Paper,
2004-05, Oxford: Centre for the Study of African Economies.
Harris, J. and M. Todaro (1970), “Migration, Unemployment and Development: A Two-Sector Analysis”, American Economic
Review, 60(1), 126-142.
Hoddinott, J. (1996), “Wages and Unemployment in an Urban African Labor Market”, Economic Journal, 106, 1610-26.
ILO/JASPA (1986), “Youth Employment and Youth Employment Programmes in Anglophone African Countries. A Comparative
Sub-regional Study”, Synthesis report, Addis Abada: ILO.
ILO (2004), Global Employment Trends for Youth, Geneva: International Labour Office.
——- (2005), Youth: Pathways to Decent Work. Promoting Younth Employment-Tackling the Challenge, Geneva.
——- (2006), Global Employment Trends for Youth, Geneva: International Labour Office.
Jamison, D.T. and L.J. Lau (1982), Farmer Education and Farm Efficiency. Washington, DC: The World Bank.
Jayne, T.S., T. Yamano, M.T. Weber, D. Tshirley, R. Benfica, A. Chapoto, B. Zulu (2003), “Smallholder Income and Land
Distribution in Africa: Implications for Poverty Reduction Strategies”, Food Policy, 28, 253-275.
Johanson, R. K. and A. V. Adams (2004), Skills Development in Sub-Saharan Africa. Washington, DC: The World Bank.
Jolliffe, D. (1998), “Skills, Schooling, and Household Income in Ghana”, World Bank Economic Review, 12, 81-104.
Kahyarara, G. and F. Teal (2006), “General or Vocational Education? Evidences from the Returns to Education in Tanzanian
Manufacturing Firms”, mimeo, Oxford: Centre for the Study of African Economies.
Kanyenze, G., G.C.Z. Mhone and T. Sparreboom (2000), “Strategies to Combat Youth Unemployment and Marginalisation in
Anglophone Africa”, ILO/SAMAT Discussion Paper, 14, Harare: ILO.
Kazianga, H. (2004), “Schooling Returns for Wage Earners in Burkina Faso: Evidence from the 1994 and 1998 National
Surveys”, Economic Growth Center Discussion Paper, 892, New Haven: Yale University.
Kingdon, G. and J. Knight (1999), “Unemployment in South Africa: a spatial approach, Centre for the Study of African
Economies”, CSAE Working Paper, 1999-12, Oxford: Centre for the Study of African Economies.
———————————————— (2000), “Are Searching and Non-searching Unemployment Distinct States when
Unemployment is High? The Case of South Africa”, CSAE Working Paper, 2000-02, Oxford: Centre for the Study of African
Economies.
Kingdon G., J. Sandefur and F. Teal (2005a), “Labor Market Flexibility, Wages and Incomes in Sub-Saharan Africa in the
1990s”, GPRG-WPS-30, Centre for the Study of African Economies, University of Oxford.
——————————————————————- (2005b), “Patterns of Labor Demand in Sub-Saharan Africa: A Review
Paper”, GPRG, Centre for the Study of African Economies, University of Oxford.
Klasen, S. and I. Woolard (2005), “Surviving Unemployment Without State Support: Unemployment and Household Formation
in South Africa”, CSSR Working Paper, 129, Cape Town: University of Cape Town.
Kolev, A. and C. Saget (2005), “Understanding Youth Labour Market Disadvantages: Evidence from South-East Europe”,
International Labour Review, 144, 2.
References
© AFD Working Paper N°49 • Youth and Labour Markets in Africa - A literature review
52

Kondylis, F. and M. Manacordia (2006), “Youth in the Labor Market and the Transition from School to Work in Tanzania”, World
Bank Social Protection Discussion Paper, 0606, Washington, DC: The World Bank.
Krishnan, P. and E. Sciubba (2005), “Links and Architecture in Village Network”, Cambridge Working Paper in Economics, 462,
Cambridge: University of Cambridge.
Kuepie, M., C.J. Nordman and F. Roubaud (2006), “Education and Labour Market Outcomes in Sub-Saharan West Africa”,
DIAL Working Paper, 2006/16, Paris: DIAL.
Lange, M., et Y. Martin (1993), « La socialisation par l’éducation et le travail : l’itinéraire incertain », In B. Le Bris and F.
Chauveau (eds), Jeunes, ville, emploi. Quel avenir pour la jeunesse africaine ? Paris : ministère de la Coopération.
Lassibille, G. and J. Tan (2005), “The Returns to Education in Rwanda”, Journal of African Economies, 14(1), pp. 92–116.
Lavy, V. and J. L. Newman (1989), “Wage Rrigidity: Micro and Macro Evidence on Labor Market Aadjustment in the Modern
Sector”, World Bank Economic Review, 3(1), 97-117.
Leavy, J. and H. White (1999), “Rural Labour Markets and Poverty in Sub-Saharan Africa”, mimeo, University of Sussex: IDS.
Le Bris, E. et F. Chauveau (eds) (1993), Jeunes, ville, emploi, Quel avenir pour la jeunesse africaine ?, Paris : ministère de la
Coopération, 353 p.
Lindbeck, A. and D.J. Snower (1988), The Insider-Outsider Theory of Employment and Unemployment, Cambridge (Mass.):
The MIT Press.
Linden, E. (1996), “The Exploding Cities of the Developing World”, Foreign Affairs, 75, 1, 52–65.
Livingstone, I. (1989), “Unemployed Youth: Alternative Approaches to an African Crisis”, International Labour Review, 128,
389-407.
Madani, D. (1999), “A Review of the Role and Impact of Export Processing Zones”, World Bank Policy Research Working
Paper, 2238, Washington, DC: The World Bank.
Marniesse, S. et C. Morrisson (2000), « La dynamique des micro entreprises dans les pays en développement : de nouveaux
enseignements », Revue d’économie du développement, 4, 3-34.
Maton, J. (1994), « Développement économique et social au Rwanda entre 1980 et 1993. Le dixième décile face à l’apoca-
lypse », Department of Economics (University of Gent, Belgium).
McKenzie, D. J. (2006), “A Profile of the World’s Young Developing Country Migrants”, Background paper for the WDR 2007,
Washington, DC: The World Bank.
Mengistae, T. (2001), “Skill Formation and Job Matching Effects in Wage Growth in Ethiopia”, Journal of African Economies,
10(1), 1-36.
Michaud, P.-C. and D. Vencatachellum (2003), “Human Capital Externalities in South Africa”, Economic Development and
Cultural Change, 51(3), 603-628.
Miguel, E. and D. N. Posner (2005), “Sources of Ethnic Identification in Africa”, mimeo, Berkeley and Los Angeles: University
of California.
Milne, W. and M. Neitzert (1994), “Kenya”, in S. Horton et al. (eds), Labor Markets in an Era of Adjustment, Vol. 2. EDI
Development Studies, Washington, DC: The World Bank.
Mlatsheni, C. and S. Rospabé (2002), “Why is Youth Unemployment So High and Unequally Spread in South Africa?”,
Development Policy Research Unit Working Paper, 02/65, Washington, DC: The World Bank.
Muller, C. and C.J. Nordman (2004), “Which Human Capital Matters for Rich and Poor’s Wages? Evidence from Matched
Worker-Firm Data from Tunisia”, DIAL Working Paper, 2004/09, Paris: DIAL.
—————————————————— (2005), “Human Capital and Wages in Two Leading Industries of Tunisia: Evidence
from Matched Worker-Firm Data”, Brussels Economic Review, 48(1), 745-768.
—————————————————— (2006a), “Wages and Human Capital in Exporting Firms in Morocco”, DIAL Working
Paper, 2006/06, Paris: DIAL.
—————————————————- (2006b), “Sharing the Costs of On-the-Job Training in Tunisia”, mimeo, Paris: DIAL.
References
© AFD Working Paper N°49 • Youth and Labour Markets in Africa - A literature review
53

Mwabu, G. and T.P. Schultz (1996), “Education Returns across Quintiles of the Wage Function: Alternative Explanations for
Returns to Education in South Africa”, American Economic Review, 86(2), 335-339.
——————————————————— (2000), “Wage Premiums for Education and Location of South African Workers by
Gender and Race”, Economic Development and Cultural Change, 48(2), 307-334.
Nafukho, F.M. (1998), “Entrepreneurial Skills Development Programs for Unemployed Youth in Africa: A Second Look”, Journal
of Small Business Management, 36, 100-103.
Narayan, D. and P. Petesch (2006), “Moving out of Poverty: Some Preliminary Results”, World Bank, PRMPR. Washington,
DC Processed.
Nattrass, N. (2002a), “Unemployment, Employment and Labour-Force Participation in Khayelithsa/Mitchell’s Plain”, CSSR
Working Paper, 133, Cape Town: Centre for Social Science Research.
—————————- (2002b), “Should Youth Unemployment be Targeted as Part of a Comprehensive Welfare Policy in South
Africa?” Social Dynamics, 28(2), 207-236.
Nordman, C.J. (2000), “La formation sur le tas par diffusion du savoir : estimation sur données marocaines et mauriciennes”,
Revue d’Économie du Développement, 4, 79-103.
————————- (2003), “On-the-Job Training: a Critical Review of its Economic Features and Measures”, SKOPE Working
Paper, Oxford: University of Oxford. Report for the Learning and Skills Development Agency (LSDA), London.
Nordman, C.J. and F. Roubaud (2005), “Reassessing the Gender Wage Gap: Does Labour Force Attachment Really Matter?
Evidence from Matched Labour Force and Biographical Surveys in Madagascar”, DIAL Working Paper, 2005/06, Paris:
DIAL.
Nordman, C.J. and F.-C. Wolff (2006), “Is there a Glass Ceiling in Morocco? Evidence from Matched Worker-Firm Data”,
Communication at IZA/World Bank Conference 2006, Berlin.
O’Higgins, N. (2003), “Trends in the Youth Labor Market in Developing and Transition Countries”, Social Protection Discussion
Paper, 321, Washington, DC: The World Bank.
Ogbu, O. and Ikiara G. (1995), “The Crisis of Urbanization in Sub-Saharan Africa”, Courier, 149, 5259.
Parent, D. (2006), “Youth Labor Market in Burkina Faso: Recent Trends”, in Youth in Africa’s Labor Market (Vol. II Country
Case Studies), Chapter 4, Washington, DC: The World Bank.
Peters, K. and P. Richards (1998), “‘Why We Fight’: Voices of Youth Combatants in Sierra Leone”, Africa, 68(2), 183-210.
Pilon, M., T. Locoh, E. Vignikin and P. Vimard (1997), “Ménages et familles en Afrique, approches des dynamiques contempo-
raines”, Les Etudes du Ceped, 15, Paris : Ceped,.
Psacharopoulos, G. and H.A. Patrinos (2002), “Returns to Investment in Education: A further Update”, World Bank Research
Working Paper, 2881, Washington, DC: The World Bank.
Quisumbing, A. R., J. P. Estudillo and K. Otsuka (2004), Land and Schooling: Transferring Wealth across Generations.
Baltimore and London: The Johns Hopkins University Press.
Rakotomanana, F., E. Ramilison and F. Roubaud (2003), “The Creation of an Annual Employment Survey in Madagascar. An
Example for Sub-Saharan Africa”, InterStat 27, September, 35-58.
Rama, M. (1998), “Wage Misalignment in CFA countries: Are Labor market Policies to Blame?”, World Bank Policy Research
Working Paper, 1873, Washington, DC: The World Bank.
————— (2000a), “Déséquilibre salarial dans les pays de la zone CFA : les politiques de l’emploi sont-elles responsables ?”,
Revue d’économie du développement, 4, 35-78.
————- (2000b), “Wage Misalignment in CFA Countries: Are Labor Market Policies to Blame?”, Journal of African
Economies, 9(4), 475.511.
Razafindrakoto, M. and F. Roubaud (2001), “Vingt ans de réforme de la fonction publique à Madagascar”, Autrepart, 20, 43-60.
———————————————————————- (2003a), “Two Original Poverty Monitoring Tools: the 1-2-3 Surveys and
the Rural Observatories”, in J.-P. Cling, M. Razafindrakoto and F. Roubaud (eds), op. cit., chapitre XIII, pp. 313-339.
References
© AFD Working Paper N°49 • Youth and Labour Markets in Africa - A literature review
54

———————————————————————- (2003b), “Urban Poverty and Recession in Sub-Saharan Africa:
Elements for an Assessment”, in J.-P. Cling, M. Razafindrakoto and F. Roubaud (eds), op. cit., chapter IV, pp. 98-125.
Richards, P., K. Bah and J. Vincent (2004), “Social Capital and the Survival: Prospects for Community-Driven Development in
Post-Conflict Sierra Leone”, Social Development Papers, 12, Washington, DC: The World Bank.
Riley, T. and W. Steel (1999), “Kenya Voucher Program for Training and Business Development Services”, processed,
Washington, DC: The World Bank.
Rosati, F. (2006), “Child Labour and Youth Employment: Ethiopia Country Study”, In World Bank (ed), Youth in Africa’s Labor
Market. Washington, DC: The World Bank, forthcoming.
Roubaud, F. (1994a), « La question ethnique sur le marché du travail à Yaoundé : discrimination ou solidarité ? », DIAL
Working Paper, 1994/14, Paris : DIAL.
———————- (1994b), « Dynamique du marché du travail à Yaoundé 1983-1993 : la décennie perdue », Revue Tiers-
Monde, Tome XXXV, 140, 4ème trimestre, 751-778.
Roubaud, F. and M. Séruzier (1991), « Economie non enregistrée par la statistique et secteur informel dans les pays en déve-
loppement », Statéco, 68.
Saget, C. (2001), Is the Minimum Wage an Effective Tool to Promote Decent Work and Reduce Poverty? The Experience of
Selected Developing Countries, Geneva: ILO, Employment Strategy Department.
Schoumaker, B.C. et B.D. Beauchemin (2002), « Les migrations à Ouagadougou : tendances récentes (1990–2000) », Ouaga
Focus, 30, Ouagadougou : Unité d’enseignement et de recherche en démographie.
Schultz, T. P. (2004), “Evidence of Returns to Schooling in Africa from Household Surveys: Monitoring and Restructuring the
Market for Education”, Journal of African Economies, 13, 95-148.
Schultz, G. and B. Klemmer (1998), Public Employment Services in English-speaking Africa: Proposals for Re-Organisation.
Harare: African Regional Labour Administration Centre (ARLAC), ILO.
Senne, J.N., F. Gubert et A.S. Robilliard (2006), « Stratégies matrimoniales et legs à l’occasion du mariage : application au
cas des ménages ruraux malgaches », Paper presented at the “7èmes journées scientifiques du réseau AED de l’AUF”,
Paris, 7-8 September 2006.
Serneels, P. (2004), “The Nature of Unemployment in Urban Ethiopia”, CSAE Working Paper, 2004-18, Oxford: Centre for the
Study of African Economies.
Siphambe, H.K. and M. Thokweng-Bawena (2001), “The Wage Gap between Men and Women in Botswana’s Formal Labour
Market”, Journal of African Economies, 10(1), 127-142.
Söderbom, M., F. Teal, A. Wambugu and G. Kahyarara (2006), “Dynamics of Returns to Education in Kenyan and Tanzanian
Manufacturing”, Oxford Bulletin of Economics and Statistics, 68(3), 261-288.
Söderbom, M., F. Teal and A. Wambugu (2002), “Does Firm Size Really Affect Earnings?”, CSAE Working Paper, 2002-08,
Oxford: Centre for the Study of African Economies.
Sommers, M. (2003), Urbanization, War and Africa’s Youth at Risk: Towards Understanding and Addressing Future
Challenges, Washington, DC: United States Agency for International Development.
Teal, F. (1996), “The Size and Sources of Economic Rents in a Developing Country Manufacturing Labor Market”, Economic
Journal, 106, 963-76.
———— (2000), “Employment and Unemployment in Sub-Saharan Africa: An Overview”, mimeo, Oxford: Centre for the Study
of African Economies.
Trostel, P., I. Walker and P. Woolley (2002), “Estimates of the Economic Return to Schooling for 28 Countries”, Labour
Economics, 9, 1-16.
UCW (2005), School-to-Work Transitions in Sub-Saharan Africa, Preliminary Report, ILO, UNICEF and the World Bank, 56 p.
UNAIDS (2004), Report of the Global AIDS Epidemic, Geneva: United Nations Programme on HIV/AIDS.
UNESCO (2002), EFA Global Monitoring Report, 2002: Is the World on Track? UNESCO.
References
© AFD Working Paper N°49 • Youth and Labour Markets in Africa - A literature review
55

UNECA (2005), Economic Report on Africa 2005: Meeting the Challenges of Unemployment and Poverty in Africa, Addis
Ababa: UNECA.
Urdal, H. (2004), “The Devil in the Demographics: The Effect of Youth Bulges on Domestic Armed Conflict, 1950-2000”, Social
Development Paper, 14, Washington, DC: The World Bank.
Van Eekelen, W., de Luca, L. and Ismail, N. (2001) “Youth Employment in Egypt. InFocus Programme on Skills, Knowledge,
and Employability Skills”, Genève: International Labour Office.
Velenchik, A. (1997), “Market Power, Firm Performance and Real Wage Growth in Zimbabwean Manufacturing”, World
Development, 25(5), 749-762.
Vijverberg, W.P. (1995), “Returns to Schooling in Non-Farm Self-Employment: An Econometric Case Study of Ghana”, World
Development, 23(7), 1215-1227.
Walther, R. (2005), Financing Vocational Training: a Europe-Africa Comparison, AFD Notes et Documents, 13, Paris : Agence
Française de Développement.
——————— (2006a), « La formation professionnelle en secteur informel : Note de problématique »”, AFD Working Paper,
15, Paris : Agence Française de Développement.
——————— (2006b), « La formation professionnelle en secteur informel : Rapport sur l’enquête de terrain au Maroc »,
AFD Working Paper, 16, Paris : Agence Française de Développement.
——————— (2006c), « La formation professionnelle en secteur informel : Rapport sur l’enquête de terrain au Cameroun »,
AFD Working Paper, 17, Paris : Agence Française de Développement.
——————— (2006d), « La formation professionnelle en secteur informel : Rapport sur l’enquête de terrain au Bénin », AFD
Working Paper, 19, Paris: Agence Française de Développement.
——————— (2006e), « Les mécanismes du financement de la formation professionnelle : une comparaison Europe-
Afrique », AFD Working Paper, Paris : Agence Française de Développement.
——————— (2006f), « La formation professionnelle en secteur informel : Rapport sur l’enquête de terrain au Sénégal »,
AFD Working Paper, Paris : Agence Française de Développement.
——————— (2006g), « La formation professionnelle en secteur informel : Rapport sur l’enquête de terrain en Afrique du
Sud », AFD Working Paper, Paris : Agence Française de Développement.
——————— (2006h), « Conclusions provisoires de l’étude ‘formation professionnelle en secteur informel’ », AFD Working
Paper, Paris : Agence Française de Développement.
World Bank (1990), World Development Report 1990 : Poverty, Washington, DC: The World Bank.
——————— (2003), Republic of Tunisia: Employment Strategy. Report #25456-TUN. Washington, DC: The World Bank.
——————— (2005), Doing Business in 2006; Creating Jobs, Washington, DC: The World Bank.
——————— (2006a), Development and the Next Generation, World Development Report 2007, Washington, DC: The
World Bank.
——————— (2006b), Youth in Africa’s Labor Market, Vol. I and II., Draft for discussion, June 14, Washington, DC: The
World Bank.s
References
© AFD Working Paper N°49 • Youth and Labour Markets in Africa - A literature review
56
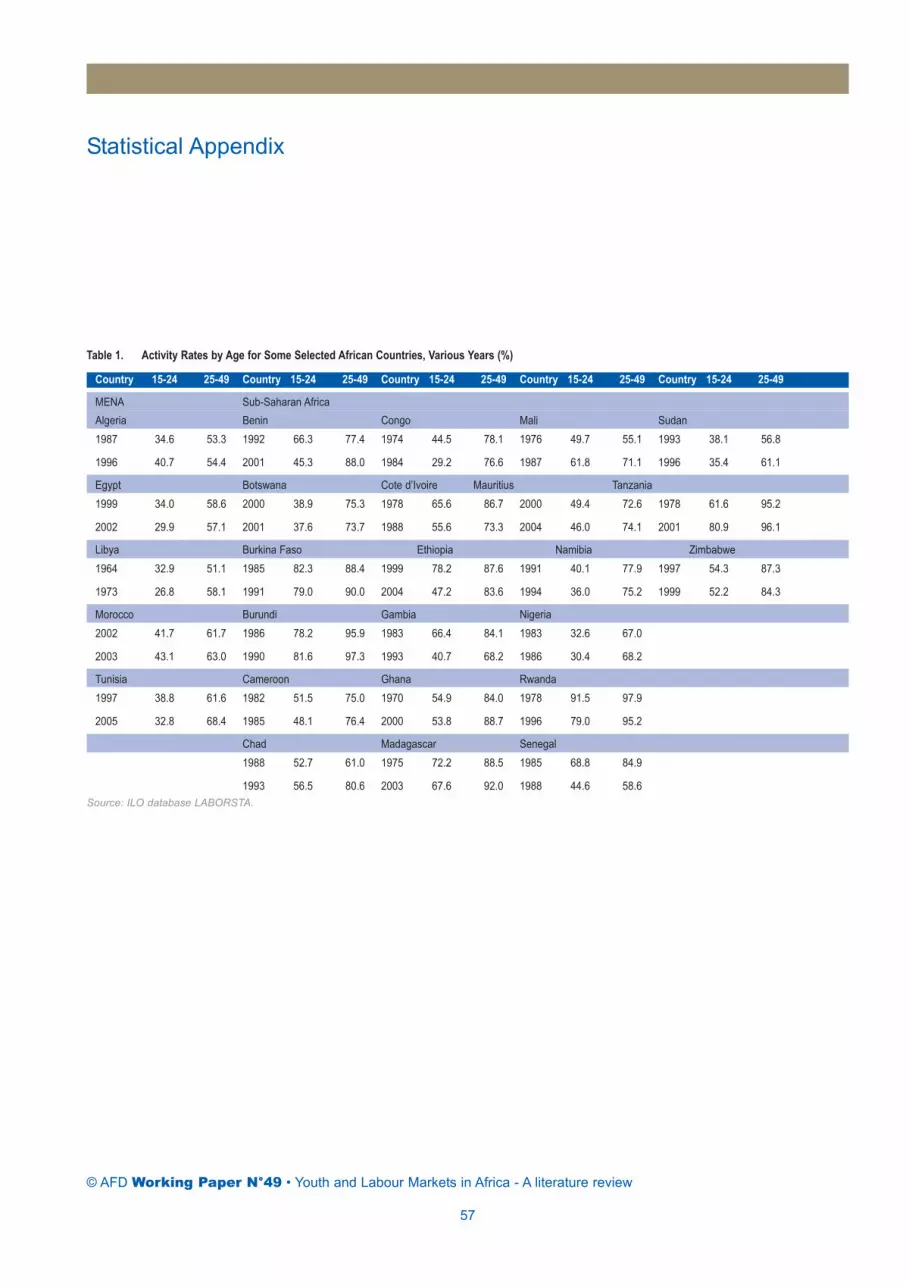
© AFD Working Paper N°49 • Youth and Labour Markets in Africa - A literature review
57
Statistical Appendix
Table 1. Activity Rates by Age for Some Selected African Countries, Various Years (%)
Country 15-24 25-49 Country 15-24 25-49 Country 15-24 25-49 Country 15-24 25-49 Country 15-24 25-49
MENA Sub-Saharan AfricaAlgeria Benin Congo Mali Sudan1987 34.6 53.3 1992 66.3 77.4 1974 44.5 78.1 1976 49.7 55.1 1993 38.1 56.8
1996 40.7 54.4 2001 45.3 88.0 1984 29.2 76.6 1987 61.8 71.1 1996 35.4 61.1
Egypt Botswana Cote d’Ivoire Mauritius Tanzania1999 34.0 58.6 2000 38.9 75.3 1978 65.6 86.7 2000 49.4 72.6 1978 61.6 95.2
2002 29.9 57.1 2001 37.6 73.7 1988 55.6 73.3 2004 46.0 74.1 2001 80.9 96.1
Libya Burkina Faso Ethiopia Namibia Zimbabwe1964 32.9 51.1 1985 82.3 88.4 1999 78.2 87.6 1991 40.1 77.9 1997 54.3 87.3
1973 26.8 58.1 1991 79.0 90.0 2004 47.2 83.6 1994 36.0 75.2 1999 52.2 84.3
Morocco Burundi Gambia Nigeria2002 41.7 61.7 1986 78.2 95.9 1983 66.4 84.1 1983 32.6 67.0
2003 43.1 63.0 1990 81.6 97.3 1993 40.7 68.2 1986 30.4 68.2
Tunisia Cameroon Ghana Rwanda1997 38.8 61.6 1982 51.5 75.0 1970 54.9 84.0 1978 91.5 97.9
2005 32.8 68.4 1985 48.1 76.4 2000 53.8 88.7 1996 79.0 95.2
Chad Madagascar Senegal1988 52.7 61.0 1975 72.2 88.5 1985 68.8 84.9
1993 56.5 80.6 2003 67.6 92.0 1988 44.6 58.6Source: ILO database LABORSTA.

Statistical Appendix
© AFD Working Paper N°49 • Youth and Labour Markets in Africa - A literature review
58
Table 2a. Activity Rates by Age and Sex (%)
Abidjan Bamako Cotonou Dakar Douala Kinshasa Lome Niamey Ouagadougou
Males15-19 37.1 37.8 26.9 48.2 34.1 17.9 41.1 48.9 51.8
20-24 69.2 56.6 57.5 72.4 72.3 40.2 72.6 70.1 74.7
25-49 95.7 88.3 93.7 89.4 95.3 82.4 95.1 90.7 94.0
50+ 70.7 60.7 61.7 57.1 70.3 75.6 66.5 77.1 68.4
Females15-19 53.2 40.4 43.5 37.6 28.6 9.7 56.7 34.7 48.4
20-24 65.6 53.9 64.5 55.0 47.6 30.9 74.0 46.7 69.6
25-49 83.0 70.6 85.3 66.3 76.1 59.2 90.7 58.1 80.8
50+ 58.3 42.8 66.2 43.8 53.6 52.5 59.0 53.6 46.7
All15-19 46.9 39.2 35.9 42.3 31.0 13.8 50.1 41.1 49.9
20-24 67.2 55.1 61.1 63.3 59.6 35.2 73.3 57.2 72.3
25-49 89.9 79.3 89.3 77.3 86.3 70.5 92.9 74.0 87.7
50+ 65.4 53.2 64.0 50.6 62.8 65.2 62.4 67.4 58.2Source: 1-2-3 Surveys. Phase 1 (Labour Force Survey). 2001-2005. National Statistical Institutes. AFRISTAT. DIAL; authors’ computations.
Table 2b. Activity Rates by Age and Sex in Congo (Dem. Rep.) and Cameroon 2005 (%)
Democratic Republic of Congo CameroonKinshasa Urban Rural National Douala Yaounde Urban Rural National
Males15-19 17.9 17.0 33.9 29.3 34.1 25.1 35.7 68.6 56.6
20-24 40.2 42.7 61.6 56.1 72.3 61.7 67.5 85.2 76.2
25-49 82.4 88.4 95.6 93.7 95.3 92.7 95.1 97.9 96.7
50+ 75.6 78.3 89.3 86.7 70.3 71.1 71.7 88.1 83.8
Females15-19 9.7 17.6 50.3 40.6 28.6 18.0 28.5 66.8 50.8
20-24 30.9 40.3 75.9 65.7 47.6 48.5 49.2 80.2 67.1
25-49 59.2 68.6 90.6 84.9 76.1 73.5 76.5 90.6 85.5
50+ 52.5 60.4 82.0 76.9 53.6 53.5 58.7 81.2 75.8
Al15-19 13.8 17.3 41.9 34.9 31.0 21.2 31.8 67.7 53.7
20-24 35.2 41.5 69.3 61.3 59.6 54.8 58.4 82.3 71.3
25-49 70.5 78.2 93.0 89.1 86.3 83.6 86.1 93.9 90.8
50+ 65.2 69.8 85.8 82.0 62.8 62.7 65.5 84.6 79.8Source: 1-2-3 Surveys. Phase 1 (Labour Force Survey). Kinshasa (2004). National (2005) and EESI 2005.Sample includes all individuals aged 15 or more.

Statistical Appendix
© AFD Working Paper N°49 • Youth and Labour Markets in Africa - A literature review
59
Table 3a. Youth and Overall Unemployment Rates in Selected Anglophone African Countries, Various Years
Total Youth age Youth Ratio of l % of youthCountry Year Labour No. unemployed %unemployed range (years) Labour No.unemployed%unemployed unemployment in labour force
force forc rates: Youth/overal
Botswana 1991 441.203 61.265 13.9 15-24 122.871 31.463 25.6 1.8 27.8
1993 21.6 15-24 41.2 1.9
1995 21.5 15-24 37.9 1.8
Egypt ? 17.118.000 1.768.000 10.3 15-30 5.992.000 1.652.000 27.6 2.7 35Mauritius 1990 5.6 20-24 11.3 2
1995 483.958 47.646 9.8 15-24 103.881 24.693 23.8 2.4 21.5Namibia 1991 479.780 91.765 19.1 15-24 118.730 45.200 38.1 2 24.7
1997 498.324 97.121 19.5 15-24 97.418 36.062 37.0 1.9 19.5
Nigeria 1998 3.9 15-24 15.5 4
Urban 1998 5.5 15-24 23.4 4.3Rural 1998 3.5 15-24 13.8 3.9
South Africa 1997 22.9 15-30 35.0 1.5Tanzania. U.R.1990 11.294.930 405.722 3.6 15-24 3.297.161 237.395 7.2 2 29.2
Uganda 1997 7.4 18-30Zambia 1990 2.296.000 285.000 12.4 12-24 868.000 181.000 20.9 1.7 37.8
1996 4.037.000 644.000 16 12-24 1.347.000 435.000 32.3 2 33.4Zimbabwe 1990 11.3 27.0 2.4
1992 3.501.798 764.199 21.8 1.164.973 516.083 44.3 2 33.3
Source: Table extracted from Kanyenze et al. (2000). “Strategies to Combat Youth Unemployment and Marginalisation in Anglophone Africa”. ILO/SAMATDiscussion Paper No.14. 54 p. Data come from the ILO/SAMAT database (ILO/SAMAT. 2000) for all countries except Egypt (ILO/NAMAT. 1999. Table 17).Nigeria and Uganda (Kanyenze tables).
Table 3b. Youth and Adult Unemployment Rates in selected African Countries, Various Years
Countries by Region Adult (25-49) Young (15-24) Year Countries by Region Adult (25-49) Young (15-24) Year
WAEMU countries SADC countriesBenin 3,0 5,9 2003 Angola 3,8 8,0 1999
Burkina Faso 1,8 3,8 2003 Lesotho 32,4 52,4 2002
Côte d’Ivoire 3,9 5,0 2002 Malawi 2,1 7,9 1997
Niger 8,7 20,8 2002 Mozambique 0,6 1,1 1996
Senegal 9,0 10,1 1995 Namibie 18,2 35,1 1993
Other West-African countries South Africa 25,4 54,1 2000Cape Verde 8,7 26,1 2000 Swaziland 5,8 13,8 2000
Gambia 3,4 9,2 1998 Tanzania 0,8 2,8 2000
Ghana 3,4 15,7 1998 Zambia 6,1 25,0 2002
Guinea 2,2 2,1 1994 East-African countries
Mauritania 7,9 10,8 2000 Burundi 0,5 0,4 1998
Nigeria 1,1 5,6 2003 Kenya 6,3 20,7 1997
Sao Tomé 1,4 8,5 2000 Rwanda 9,1 9,6 1997
Sierra Leone 3,0 1,8 2003 Uganda 1,8 6,0 2002
CAEMU countries OtherCameroon 8,8 12,6 2001 Ethiopia 1,8 3,9 2000
Source: World Development Report 2007, Table A3, pp. 274-275.

Statistical Appendix
© AFD Working Paper N°49 • Youth and Labour Markets in Africa - A literature review
60
Table 4a. Unemployment Rates (*) by Age and Sex (%)
Abidjan Bamako Cotonou Dakar Douala Kinshasa Lome Niamey Ouagadougou
Males15-19 15.8 16.2 4.9 11.7 8.7 29.1 12.5 35.6 24.0
20-24 22.2 18.3 10.1 16.4 14.6 34.6 20.4 31.5 31.7
25-49 13.5 7.4 6.9 13.4 9.6 13.9 10.4 11.5 13.5
50+ 8.4 5.9 8.0 12.6 13.2 10.8 17.7 15.6 9.5
Females15-19 18.7 14.9 4.7 30.8 18.1 25.6 8.7 43.3 35.6
20-24 26.4 27.3 12.4 34.7 20.4 22.7 14.5 47.9 47.0
25-49 17.4 15.9 6.5 27.8 15.5 8.6 9.6 28.0 24.2
50+ 10.3 9.5 3.7 10.4 2.2 0.7 4.2 19.5 7.3
All15-19 17.8 15.5 4.8 21.2 13.6 27.8 10.0 39.1 30.3
20-24 24.4 22.9 11.4 24.8 17.0 29.0 17.2 38.9 38.9
25-49 15.1 11.2 6.7 19.8 12.0 11.6 10.0 18.1 18.1
50+ 9.1 7.1 5.8 11.7 9.0 7.2 10.6 16.9 8.7Source: 1-2-3 Surveys. Phase 1 (Labour Force Survey). 2001-2005. National Statistical Institutes. AFRISTAT. DIAL; authors’ computations.(*) The unemployed are broadly defined as those individuals who had no employment during the reference week, were available for work, and had made speci-fic efforts to find employment. Discouraged workers who have lost a job, but do not make an effort to find a new job in a given week are also included.
Table 4b. Unemployment Rates (*) by Age and Sex in Congo (Dem. Rep.) and Cameroon (%)
Democratic Republic of Congo CameroonKinshasa Urban Rural National Douala Yaounde Urban Rural National
Males15-19 29.1 21.5 3.8 6.6 8.7 17.5 12.2 3.0 5.1
20-24 34.6 20.1 3.6 7.2 14.6 22.0 14.3 5.5 9.5
25-49 13.9 9.4 1.0 3.2 9.6 9.1 7.5 1.8 4.2
50+ 10.8 6.1 0.9 2.0 13.2 5.4 6.7 0.7 2.0
Females15-19 25.6 18.0 2.3 4.3 18.1 21.8 14.9 1.8 4.9
20-24 22.7 15.8 1.2 3.7 20.4 33.6 24.5 4.3 10.5
25-49 8.6 8.0 0.6 2.1 15.5 16.4 12.6 1.4 5.0
50+ 0.7 3.9 0.3 1.0 2.2 4.5 1.6 0.1 0.4
All15-19 27.8 19.7 2.9 5.3 13.6 19.5 13.6 2.4 5.0
20-24 29.0 17.9 2.2 5.2 17.0 27.4 18.6 4.8 10.0
25-49 11.6 8.8 0.8 2.7 12.0 12.2 9.7 1.5 4.6
50+ 7.2 5.2 0.6 1.5 9.0 5.0 4.6 0.4 1.2Source: 1-2-3 Surveys. Phase 1 (Labour Force Survey). Kinshasa (2004). National (2005) and EESI 2005(*) The unemployed are broadly defined as those individuals who had no employment during the reference week, were available for work, and had made speci-fic efforts to find employment. Discouraged workers who have lost a job, but do not make an effort to find a new job in a given week are also included.

Statistical Appendix
© AFD Working Paper N°49 • Youth and Labour Markets in Africa - A literature review
61
Table 5. Employment Characteristics of the Young (15-24), by Country
Rural UrbanCountry Wage Informal Self Other Wage Informal Self Other
Burkina Faso 0.4 94.8 4.8 0 27.9 57 14.4 0.7Burundi 1.8 83.3 14.8 0.1 31.3 19.6 43.3 5.8
Cameroon 6.3 18.1 68.8 6.8 15.3 56.9 22 5.9Ethiopia 55.6 24.8 16.2 3.4 16.2 38.2 23.3 22.3
Gambia 1.2 53.1 45 0.8 42.3 20.7 34.7 2.4Kenya 16.4 40 43.6 0 21.1 53.3 25.4 0.2
Madagascar 5.9 69.7 23.5 1 19.3 58.7 18.2 3.8Malawi 15 7.1 74.5 3.3 63.8 6.8 19.8 9.5
Mozambique 11.8 — 86.7 1.5 40.2 — 53.5 6.3Sao Tome 59.5 34.3 — 6.2 66.3 24.3 — 9.5
Zambia 3.1 60.4 36.1 0.4 40.9 9.6 46.1 3.5
Source: Table reproduced from “School-to-work transitions in Sub-Saharan Africa”. Preliminary Report. UCW project. Nov. 2005. Wage employees are workersin paid employment who are remunerated by wages and salaries. Workers employed in the informal sector are those employed in a semi-organised unit. Self-employed workers are those who perform some work for own or family business and who are remunerated either in cash or in kind. See UCW report for moredetails.
Table 6a. Distribution of Employed Young Workers (15-24 years old) by Institutional Sector (%)
Abidjan Bamako Cotonou Dakar Douala Kinshasa Lome Niamey Ouagadougou
MalesPublic Administration 0.5 1.5 1.9 0.8 0.3 1.9 0.5 2.7 2.0
State-Owned Enterprises 0.1 0.3 0.6 0.4 0.4 0 1.1 0.3 2.4
Formal Private Sector 15.0 13.7 6.0 9.9 31.1 7.8 12.6 14.5 12.7
Informal Private Sector 81.8 83.7 89.6 88.1 66.5 89.0 84.0 81.8 81.4
Non-Profit Organisations 2.5 0.8 1.9 0.8 1.7 1.4 1.9 0.8 1.4
Total 100.0 100.0 100.0 100.0 100.0 100.0 100.0 100.0 100.0
FemalesPublic Administration 0.0 0.3 0.6 0.7 0.0 0.6 0.2 3.8 1.3
State-Owned Enterprises 0.0 0.0 0.9 0.2 0.6 0.8 0.2 0.0 1.2
Formal Private Sector 4.7 2.0 3.7 6.0 13.6 7.4 9.3 5.9 4.4
Informal Private Sector 95.2 97.5 94.3 92.6 85.8 89.4 90.3 87.7 91.8
Non-Profit Organisations 0.1 0.2 0.5 0.5 0.0 1.8 0.0 2.7 1.4
Total 100.0 100.0 100.0 100.0 100.0 100.0 100.0 100.0 100.0
AllPublic Administration 0.2 0.9 1.1 0.8 0.1 1.3 0.3 3.1 1.7
State-Owned Enterprises 0.1 0.2 0.8 0.3 0.5 0.4 0.6 0.2 1.9
Formal Private Sector 9.0 7.5 4.6 8.2 23.7 7.6 10.6 11.0 9.0
Informal Private Sector 89.6 91.0 92.4 89.9 74.7 89.2 87.8 84.2 86.1
Non-Profit Organisations 1.1 0.5 1.1 0.7 1.0 1.6 0.8 1.6 1.4
Total 100.0 100.0 100.0 100.0 100.0 100.0 100.0 100.0 100.0
Source: 1-2-3 Surveys. Phase 1 (Labour Force Survey). 2001-2005. National Statistical Institutes. AFRISTAT. DIAL; authors’ computations.
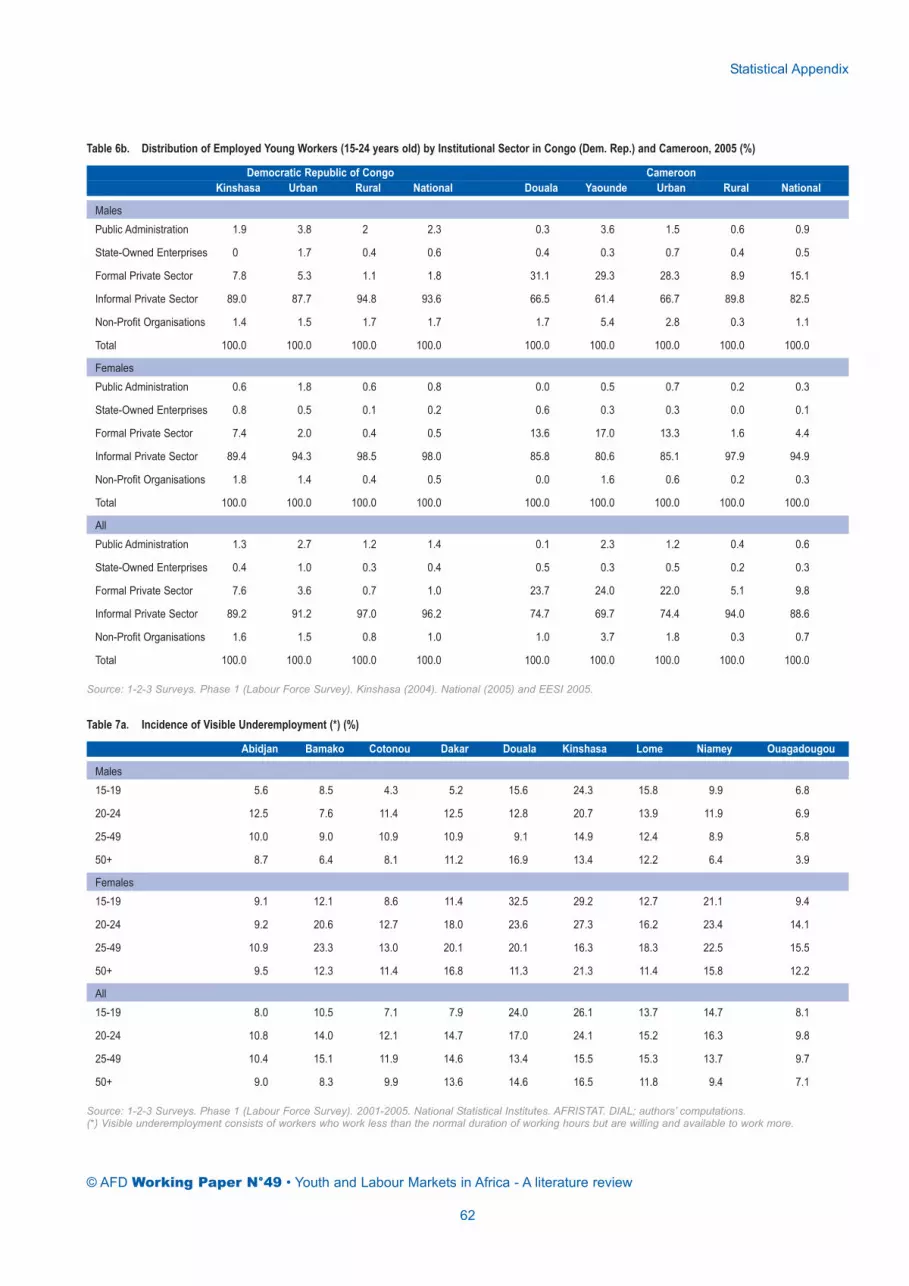
Statistical Appendix
© AFD Working Paper N°49 • Youth and Labour Markets in Africa - A literature review
62
Table 6b. Distribution of Employed Young Workers (15-24 years old) by Institutional Sector in Congo (Dem. Rep.) and Cameroon, 2005 (%)
Democratic Republic of Congo CameroonKinshasa Urban Rural National Douala Yaounde Urban Rural National
MalesPublic Administration 1.9 3.8 2 2.3 0.3 3.6 1.5 0.6 0.9
State-Owned Enterprises 0 1.7 0.4 0.6 0.4 0.3 0.7 0.4 0.5
Formal Private Sector 7.8 5.3 1.1 1.8 31.1 29.3 28.3 8.9 15.1
Informal Private Sector 89.0 87.7 94.8 93.6 66.5 61.4 66.7 89.8 82.5
Non-Profit Organisations 1.4 1.5 1.7 1.7 1.7 5.4 2.8 0.3 1.1
Total 100.0 100.0 100.0 100.0 100.0 100.0 100.0 100.0 100.0
FemalesPublic Administration 0.6 1.8 0.6 0.8 0.0 0.5 0.7 0.2 0.3
State-Owned Enterprises 0.8 0.5 0.1 0.2 0.6 0.3 0.3 0.0 0.1
Formal Private Sector 7.4 2.0 0.4 0.5 13.6 17.0 13.3 1.6 4.4
Informal Private Sector 89.4 94.3 98.5 98.0 85.8 80.6 85.1 97.9 94.9
Non-Profit Organisations 1.8 1.4 0.4 0.5 0.0 1.6 0.6 0.2 0.3
Total 100.0 100.0 100.0 100.0 100.0 100.0 100.0 100.0 100.0
AllPublic Administration 1.3 2.7 1.2 1.4 0.1 2.3 1.2 0.4 0.6
State-Owned Enterprises 0.4 1.0 0.3 0.4 0.5 0.3 0.5 0.2 0.3
Formal Private Sector 7.6 3.6 0.7 1.0 23.7 24.0 22.0 5.1 9.8
Informal Private Sector 89.2 91.2 97.0 96.2 74.7 69.7 74.4 94.0 88.6
Non-Profit Organisations 1.6 1.5 0.8 1.0 1.0 3.7 1.8 0.3 0.7
Total 100.0 100.0 100.0 100.0 100.0 100.0 100.0 100.0 100.0
Source: 1-2-3 Surveys. Phase 1 (Labour Force Survey). Kinshasa (2004). National (2005) and EESI 2005.
Table 7a. Incidence of Visible Underemployment (*) (%)
Abidjan Bamako Cotonou Dakar Douala Kinshasa Lome Niamey Ouagadougou
Males15-19 5.6 8.5 4.3 5.2 15.6 24.3 15.8 9.9 6.8
20-24 12.5 7.6 11.4 12.5 12.8 20.7 13.9 11.9 6.9
25-49 10.0 9.0 10.9 10.9 9.1 14.9 12.4 8.9 5.8
50+ 8.7 6.4 8.1 11.2 16.9 13.4 12.2 6.4 3.9
Females15-19 9.1 12.1 8.6 11.4 32.5 29.2 12.7 21.1 9.4
20-24 9.2 20.6 12.7 18.0 23.6 27.3 16.2 23.4 14.1
25-49 10.9 23.3 13.0 20.1 20.1 16.3 18.3 22.5 15.5
50+ 9.5 12.3 11.4 16.8 11.3 21.3 11.4 15.8 12.2
All15-19 8.0 10.5 7.1 7.9 24.0 26.1 13.7 14.7 8.1
20-24 10.8 14.0 12.1 14.7 17.0 24.1 15.2 16.3 9.8
25-49 10.4 15.1 11.9 14.6 13.4 15.5 15.3 13.7 9.7
50+ 9.0 8.3 9.9 13.6 14.6 16.5 11.8 9.4 7.1
Source: 1-2-3 Surveys. Phase 1 (Labour Force Survey). 2001-2005. National Statistical Institutes. AFRISTAT. DIAL; authors’ computations.(*) Visible underemployment consists of workers who work less than the normal duration of working hours but are willing and available to work more.

Statistical Appendix
© AFD Working Paper N°49 • Youth and Labour Markets in Africa - A literature review
63
Table 7b. Incidence of Visible Underemployment (*) in Congo (Dem. Rep.) and Cameroon (%)
Democratic Republic of Congo CameroonKinshasa Urban Rural National Douala Yaounde Urban Rural National
Males15-19 24.3 28.6 24.6 25.1 15.6 8.9 17.2 14.6 15.2
20-24 20.7 19.0 32.2 29.7 12.8 14.1 13.7 11.5 12.4
25-49 14.9 20.0 33.8 30.5 9.1 7.5 9.6 10.9 10.4
50+ 13.4 20.9 38.6 34.9 16.9 5.3 15.8 21.8 20.5
Females15-19 29.2 28.1 35.7 34.9 32.5 22.4 31.8 18.9 21.7
20-24 27.3 32.8 39.6 38.6 23.6 15.8 25.3 27.0 26.6
25-49 16.3 24.4 34.6 32.6 20.1 15.7 23.8 20.1 21.2
50+ 21.3 28.9 38.6 36.9 11.3 9.8 20.1 29.7 28.0
All15-19 26.1 28.3 31.2 30.8 24.0 15.0 24.1 16.7 18.2
20-24 24.1 26.3 36.6 34.9 17.0 14.8 18.2 20.3 19.6
25-49 15.5 22.0 34.2 31.6 13.4 10.7 15.5 15.8 15.7
50+ 16.5 24.2 38.6 35.8 14.6 7.1 17.7 25.7 24.1
Source: 1-2-3 Surveys. Phase 1 (Labour Force Survey). Kinshasa (2004). National (2005) and EESI 2005.(*) Visible underemployment consists of workers who work less than the normal duration of working hours but are willing and available to work more.
Table 8a. Incidence of Invisible Underemployment (*) (%)
Abidjan Bamako Cotonou Dakar Douala Kinshasa Lome Niamey Ouagadougou
Males15-19 77.0 66.8 74.7 81.3 72.7 63.5 65.2 76.9 88.0
20-24 51.0 59.2 60.1 59.8 47.8 52.1 49.5 54.8 79.5
25-49 25.0 21.5 32.5 32.5 19.7 34.7 25.8 30.4 41.4
50+ 17.8 16.6 22.6 25.7 22.1 31.7 22.2 23.5 40.2
Females15-19 90.1 80.2 88.8 85.9 80.5 55.4 84.4 79.1 95.4
20-24 72.2 66.7 80.7 74.8 72.2 59.8 68.5 64.5 84.8
25-49 58.2 47.3 64.0 59.1 39.5 47.1 58.9 48.8 66.1
50+ 61.2 54.0 64.6 58.3 41.7 60.3 53.7 61.9 82.2
All15-19 87.0 74.9 84.4 84.0 76.6 60.4 77.9 77.9 91.8
20-24 61.6 63.0 71.3 66.5 57.4 56.1 60.4 58.8 82.0
25-49 38.3 32.7 48.2 43.5 27.5 40.2 41.9 37.2 51.6
50+ 34.1 28.9 44.8 39.9 30.1 42.8 39.8 36.0 55.7
Source: 1-2-3 Surveys. Phase 1 (Labour Force Survey). 2001-2005. National Statistical Institutes. AFRISTAT. DIAL; authors’ computations.(*) Invisible underemployment consists of workers who earn less than the minimum hourly wage.

Statistical Appendix
© AFD Working Paper N°49 • Youth and Labour Markets in Africa - A literature review
64
Table 8b. Incidence of Invisible Underemployment (*) in Congo (Dem.Rep.) and Cameroon (%)
Democratic Republic of Congo CameroonKinshasa Urban Rural National Douala Yaounde Urban Rural National
Males
15-19 63.5 60.8 72.4 70.9 72.7 72.9 76.8 91.9 88.720-24 52.1 57.7 68.9 66.7 47.8 53.8 56.5 80.7 70.4
25-49 34.7 41.2 62.2 57.2 19.7 24.1 26.8 58.2 45.4
50+ 31.7 49.3 61.7 59.1 22.1 24.7 30.3 63.2 56.2
Females15-19 55.4 70.6 77.3 76.6 80.5 94.4 86.4 94.9 93.1
20-24 59.8 68.0 82.3 80.1 72.2 69.0 73.2 85.5 82.3
25-49 47.1 59.8 82.7 78.2 39.5 37.9 46.1 79.5 69.6
50+ 60.3 67.6 80.1 77.8 41.7 48.8 56.6 83.8 78.8
All15-19 60.4 66.1 75.3 74.2 76.6 82.6 81.3 93.3 90.8
20-24 56.1 63.2 76.8 74.5 57.4 60.3 63.0 83.4 76.4
25-49 40.2 49.6 72.8 67.8 27.5 29.6 34.9 69.6 57.4
50+ 42.8 56.9 70.1 67.5 30.1 34.5 41.8 73.2 67.0
Source: 1-2-3 Surveys. Phase 1 (Labour Force Survey). Kinshasa (2004). National (2005) and EESI 2005.(*) Invisible underemployment consists of workers who earn less than the minimum hourly wage.
Table 9a. Mean Monthly Earnings by Age in PPA 1,000 CFA Francs (Main Activity)
Abidjan Bamako Cotonou Dakar Lome Niamey Ouagadougou
Males15-19 28.3 26.6 20.5 29.8 15.3 18.3 18.0
20-24 43.8 57.1 33.7 42.5 24.1 33.2 27.9
25-49 104.0 86.8 69.4 93.6 51.3 75.1 68.1
50+ 193.9 102.5 114.1 122.5 70.4 77.7 85.8
All ages 101.9 80.8 70.3 85.7 48.0 68.1 61.9
Females15-19 15.5 13.2 17.3 19.1 10.0 12.2 10.9
20-24 29.3 17.2 21.4 27.4 15.8 20.5 16.9
25-49 55.7 37.0 32.2 48.3 24.9 43.1 37.4
50+ 83.8 33.7 32.1 47.3 25.1 31.4 27.5
All ages 47.6 30.3 29.9 41.2 22.1 36.0 30.3
All15-19 18.7 18.6 18.3 23.7 11.7 15.6 14.2
20-24 36.4 37.3 26.9 35.8 19.3 28.1 23.1
25-49 84.4 65.5 50.9 75.1 38.5 63.9 55.7
50+ 152.5 80.1 70.4 89.8 44.9 63.1 64.1
All ages 77.6 58.4 49.4 66.4 34.6 56.6 48.8
ource: 1-2-3 Surveys. Phase 1 (Labour Force Survey). 2001-2005. National Statistical Institutes. AFRISTAT. DIAL; authors’ computations.
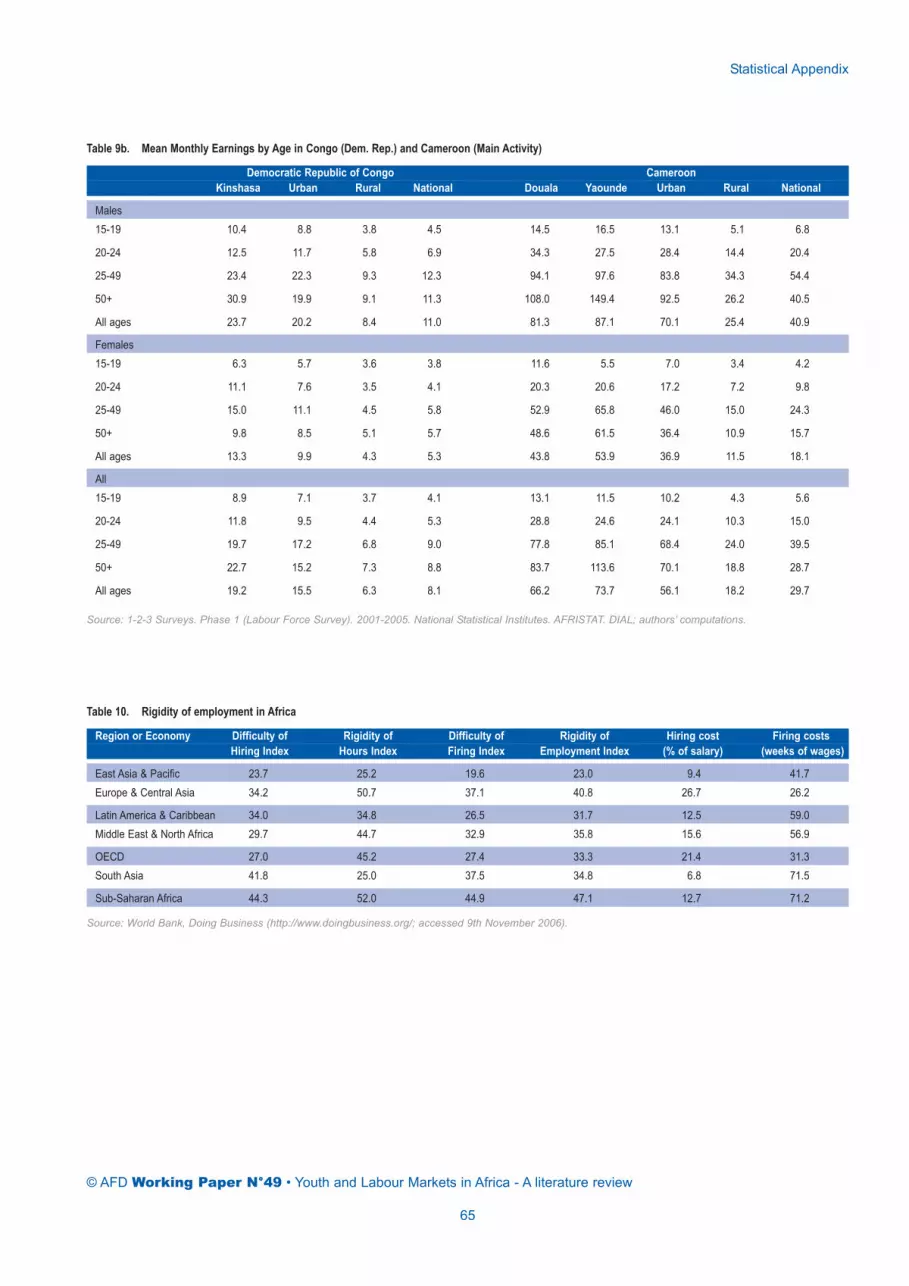
Statistical Appendix
© AFD Working Paper N°49 • Youth and Labour Markets in Africa - A literature review
65
Table 9b. Mean Monthly Earnings by Age in Congo (Dem. Rep.) and Cameroon (Main Activity)
Democratic Republic of Congo CameroonKinshasa Urban Rural National Douala Yaounde Urban Rural National
Males15-19 10.4 8.8 3.8 4.5 14.5 16.5 13.1 5.1 6.8
20-24 12.5 11.7 5.8 6.9 34.3 27.5 28.4 14.4 20.4
25-49 23.4 22.3 9.3 12.3 94.1 97.6 83.8 34.3 54.4
50+ 30.9 19.9 9.1 11.3 108.0 149.4 92.5 26.2 40.5
All ages 23.7 20.2 8.4 11.0 81.3 87.1 70.1 25.4 40.9
Females15-19 6.3 5.7 3.6 3.8 11.6 5.5 7.0 3.4 4.2
20-24 11.1 7.6 3.5 4.1 20.3 20.6 17.2 7.2 9.8
25-49 15.0 11.1 4.5 5.8 52.9 65.8 46.0 15.0 24.3
50+ 9.8 8.5 5.1 5.7 48.6 61.5 36.4 10.9 15.7
All ages 13.3 9.9 4.3 5.3 43.8 53.9 36.9 11.5 18.1
All15-19 8.9 7.1 3.7 4.1 13.1 11.5 10.2 4.3 5.6
20-24 11.8 9.5 4.4 5.3 28.8 24.6 24.1 10.3 15.0
25-49 19.7 17.2 6.8 9.0 77.8 85.1 68.4 24.0 39.5
50+ 22.7 15.2 7.3 8.8 83.7 113.6 70.1 18.8 28.7
All ages 19.2 15.5 6.3 8.1 66.2 73.7 56.1 18.2 29.7
Source: 1-2-3 Surveys. Phase 1 (Labour Force Survey). 2001-2005. National Statistical Institutes. AFRISTAT. DIAL; authors’ computations.
Table 10. Rigidity of employment in Africa
Region or Economy Difficulty of Rigidity of Difficulty of Rigidity of Hiring cost Firing costsHiring Index Hours Index Firing Index Employment Index (% of salary) (weeks of wages)
East Asia & Pacific 23.7 25.2 19.6 23.0 9.4 41.7Europe & Central Asia 34.2 50.7 37.1 40.8 26.7 26.2
Latin America & Caribbean 34.0 34.8 26.5 31.7 12.5 59.0Middle East & North Africa 29.7 44.7 32.9 35.8 15.6 56.9
OECD 27.0 45.2 27.4 33.3 21.4 31.3South Asia 41.8 25.0 37.5 34.8 6.8 71.5
Sub-Saharan Africa 44.3 52.0 44.9 47.1 12.7 71.2
Source: World Bank, Doing Business (http://www.doingbusiness.org/; accessed 9th November 2006).

Statistical Appendix
© AFD Working Paper N°49 • Youth and Labour Markets in Africa - A literature review
66
Table 11. Who regulates employment the least – and who regulates employment the most?
Difficulty of hiringLeast Most
Australia Iran
Georgia Burkina FasoHong Kong, China Mozambique
Israel Central African Rep.Malaysia Congo, Rep.
Mauritius Sierra LeoneNamibia Congo, Dem. Rep.
Russia MauritaniaSwitzerland Morocco
United States Niger
Rigidity of hoursLeast Most
Canada Chad
Hong Kong, China Congo, Rep.Jamaica Egypt
Lebanon MongoliaNew Zealand Niger
Serbia Montenegro BrazilSingapore Burkina Faso
Tunisia Congo, Dem. Rep.United States Moldova
Chile Guinea
Source: World Bank, Doing Business (http://www.doingbusiness.org/; accessed 9th November 2006).
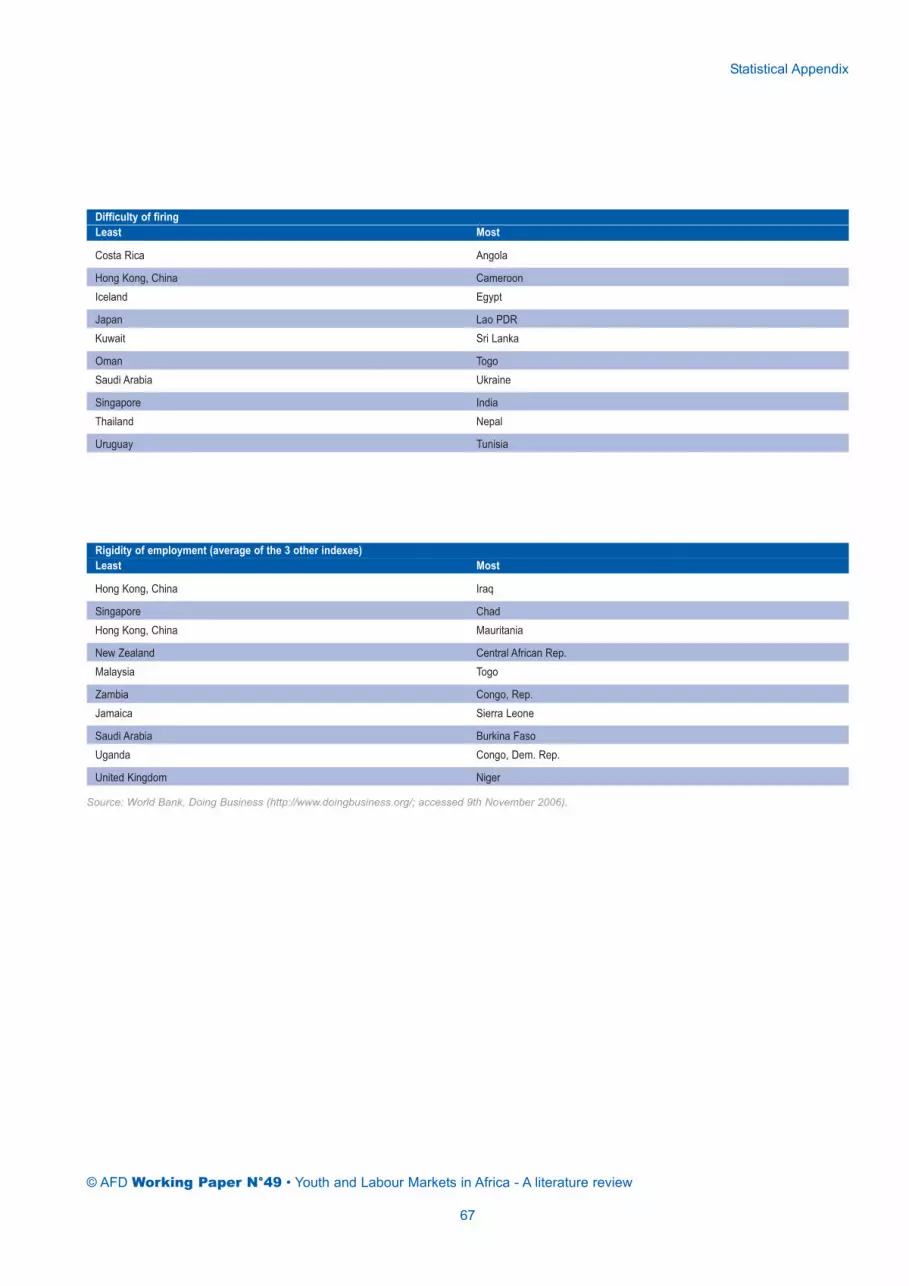
Statistical Appendix
© AFD Working Paper N°49 • Youth and Labour Markets in Africa - A literature review
67
Difficulty of firingLeast Most
Costa Rica Angola
Hong Kong, China CameroonIceland Egypt
Japan Lao PDRKuwait Sri Lanka
Oman TogoSaudi Arabia Ukraine
Singapore IndiaThailand Nepal
Uruguay Tunisia
Rigidity of employment (average of the 3 other indexes)Least Most
Hong Kong, China Iraq
Singapore ChadHong Kong, China Mauritania
New Zealand Central African Rep.Malaysia Togo
Zambia Congo, Rep.Jamaica Sierra Leone
Saudi Arabia Burkina FasoUganda Congo, Dem. Rep.
United Kingdom Niger
Source: World Bank, Doing Business (http://www.doingbusiness.org/; accessed 9th November 2006).

© AFD Working Paper N°49 • Youth and Labour Markets in Africa - A literature review
68
Série Documents de travail / Working Papers Series
N° 1 A Poverty Forecasting Tool: A Case-Study of Senegal
Thierry Latreille, AFD - Janvier 2005.
N° 2 Les OMD et l'aide de cinquième génération
Jean-David Naudet, AFD - Mai 2005.
N° 3 Biens publics mondiaux et développement : De nouveaux arbitrages pour l’aide ?
Sarah Marniesse, AFD - Septembre 2005.
N° 4 Agir en faveur des acteurs et des sociétés fragiles. Pour une vision renouvelée des enjeux de l’aide
au développement dans la prévention et la gestion des crises
Beyond the Fragile State: Taking Action to Assist Fragile Actors and Societies
Jean-Marc Châtaigner et François Gaulme, AFD - Septembre 2005.
N° 5 La filière riz au Mali : compétitivité et perspectives de marché
Pierre Baris, Jean Zaslavsky, Serge Perrin - Septembre 2005.
N° 6 Turquie : Risque systémique bancaire et vulnérabilités macro-financières
François-Xavier Bellocq et Vincent Caupin, AFD - Octobre 2005.
N° 7 La Tunisie et le marché euro-méditerranéen du tourisme
Jean-Raphaël Chaponnière, CEPN et AFD et Marc Lautier, CARE, Université de Rouen - Septembre 2005.
N° 8 Le développement, une question de chance ? A propos du rapport sur le développement dans le monde 2006
« Equité et Développement »
Development, a Question of Opportunity? A Critique of the 2006 World Development Report:
Equity and Development
Jean-Pierre Cling, Denis Cogneau, Jacques Loup, Jean-David Naudet, Mireille Razafindrakoto, François Roubaud,
DIAL - Septembre 2005.
N° 9 Aid Selectivity According to Augmented Criteria
Jacky Amprou, AFD, Patrick Guillaumont, Sylviane Guillaumont Jeanneney, CERDI - Novembre 2005.
N° 10 Le Cambodge rural face à la pauvreté : contribution à la réflexion sur les dynamiques agraires et le changement
social
Julien Calas, AFD Phnom-Penh - Janvier 2006.
N° 11 Vietnam : les vulnérabilités macro-financières associées au processus d’émergence.
Vietnam: Macro-Financial Vulnerabilities Associated with the Emergence Process
François-Xavier Bellocq et Jean-Raphaël Chaponnière, AFD - Janvier 2006.
N° 12 Chine : la croissance et ses déséquilibres
François-Xavier Bellocq et Jean-Raphaël Chaponnière, AFD - Janvier 2006.
N° 13 Legs colonial et gouvernance contemporaine (Note de synthèse)
Jean-François Bayart, Romain Bertrand, Thornike Gordadze, Béatrice Hibou et Françoise Mengin, FASOPO
(Fonds d'analyse des sociétés politiques) - Mars 2006.

N° 14 Apprendre pour vivre et travailler : contribution du GEFOP au Rapport sur le développement dans le monde 2007
de la Banque mondiale
Learning for Life and Work : GEFOP Contibution to the World Developement Report 2007
Réseau GEFOP (Synthèse rédigée par R. Walther) - Mars 2006.
N° 15 La formation professionnelle en secteur informel (Note de problématique)
Vocational Training in the Informal Sector - Issue Paper
Richard Walther, consultant ITG - Mars 2006.
N° 16 La formation professionnelle en secteur informel - Rapport sur l’enquête terrain au Maroc
Vocational Training in the Informal Sector - Report on the Morocco Field Survey
Richard Walther, consultant ITG - Juin 2006.
N° 17 La formation professionnelle en secteur informel - Rapport sur l’enquête terrain au Cameroun
Vocational Training in the Informal Sector - Report on the Cameroon Field Survey
Richard Walther, consultant ITG, avec le concours d’Ewa Filipiak et de Christine Uhder, AFD - Juillet 2006.
N° 18 Rapport sur le risque-pays du Maroc
Jérôme Sgard, Cepii et Université de Paris-Dauphine - Juin 2006.
N° 19 La formation professionnelle en secteur informel - Rapport sur l’enquête terrain au Bénin
Vocational Training in the Informal Sector - Report on the Benin Field Survey
Richard Walther, consultant ITG, avec le concours d’Ewa Filipiak et de Christine Uhder - Juillet 2006.
N° 20 Institutions, développement et pauvreté
Institutions, Development and Poverty
Alice Sindzingre, CNRS, EconomiX, Université Paris X-Nanterre ; School of Oriental and African Studies (SOAS),
Université de Londres - Juillet 2006.
N° 21 La formation professionnelle en secteur informel - Rapport sur l’enquête terrain au Sénégal
Vocational Training in the Informal Sector - Report on the Senegal Field Survey
Richard Walther, consultant ITG, avec le concours d’Ewa Filipiak et de Christine Uhder - Juillet 2006.
N° 22 Les fondations philanthropiques américaines, acteurs émergents de la mondialisation et piliers du dialogue trans-
atlantique.
American Philantropic Foundations: Emerging Actors of Globalization and Pillars of the Transatlantic Dialog
Benoît Chervalier, German Marshall Fund of the United States, et Joseph Zimet, AFD - Juillet 2006.
N° 23 L'AFD et ses partenaires : La dimension culturelle
Philippe d'Iribarne, CEREB - CNRS - Août 2006.
N° 24 Secteur de l'eau au Sénégal - Un partenariat équilibré entre acteurs publics et privés pour servir les plus
démunis ?
Aymeric Blanc, département de la Recherche, AFD, et Cédric Ghesquières, consultant junior, AFD - Août 2006.
N° 25 Décentralisation et politique de l'eau gratuite en Afrique du Sud: Quelle place pour le secteur privé ?
Vocational Training in the Informal Sector - Report on the Senegal Field Survey
Aymeric Blanc, département de la Recherche, AFD, et Cédric Ghesquières, consultant junior, AFD - Août 2006.
N° 26 L’intégration des programmes d’aide alimentaire aux politiques de développement du Niger : le cas de la crise ali-
mentaire 2004-2005.
The Integration of Food Aid Programmes in Niger's Development Policies: the 2004-2005 Food Crisis
Dorothée Chen et Nicolas Meisel, département de la Recherche, AFD, en partenariat avec DIAL - Septembre 2006.
N° 27 Proposition d’organisation des outils de gestion du risque de marché au bénéfice des filières cotonnières africaines
Jean Cordier, Agrocampus Rennes - Septembre 2006.
Série Documents de travail / Working Papers Series
© AFD Working Paper N°49 • Youth and Labour Markets in Africa - A literature review
69

N° 28 Les privatisations en zone franc – synthèse des travaux du groupe de travail MINEFI/AFD
Aymeric Blanc, département de la Recherche, AFD - Septembre 2006.
N° 29 Out of the financing trap? Financing post-conflict countries and LICUSs
Marc Raffinot, Université-Dauphine, et Christine Rosellini, DIAL, Paris - Octobre 2006.
N° 30 La formation professionnelle en secteur informel - Rapport sur l'enquête terrain en Afrique du Sud
Vocational Training in the Informal Sector - Report on the South Africa Field Survey
Richard Walther, ITG Consultant, Ewa Filipiak, département de la Recherche, AFD, et Christine Uhder, AFD -
Octobre 2006.
N° 31 The Brain Drain: What Do We Know?
Frédéric Docquier, FNRS and IRES, Université Catholique de Louvain and World Bank - Khalid Sekkat, DULBEA,
Université Libre de Bruxelles - Octobre 2006.
N° 32 Les délocalisations françaises vers la Turquie
Julien Gourdon, CERDI, Université d'Auvergne - Décembre 2006.
N° 33 Capital naturel et développement durable en Afrique
Natural Capital and Sustainable Development in Africa
Pierre-Noël Giraud, CERNA, Centre de recherche en économie industrielle, Ecole nationale supérieure des Mines
de Paris, Denis Loyer, AFD - Décembre 2006.
N° 34 La formation professionnelle en secteur informel Rapport sur l’enquête terrain en Ethiopie
Vocational Training in the Informal Sector - Report on the Ethiopia Field Survey
Richard Walther, Consultant ITG - Novembre 2006.
N° 35 La formation professionnelle en secteur informel Rapport sur l’enquête terrain en Angola
Vocational Training in the Informal Sector - Report on the Angola Field Survey
Richard Walther, Consultant ITG - Novembre 2006.
N° 36 Les accords de partenariat économique : des accompagnements nécessaires
Economic Partnerships Agreements: Accompanying Measures Are Needed
Anna Lipchitz, département de la Recherche, AFD - Janvier 2007.
N° 37 Energie du Mali, ou les paradoxes d’un « échec retentissant »
Béatrice Hibou, CNRS - CERI, Olivier Vallée, Consultant, AFD - Janvier 2007.
N° 38 Public Private Partnerships in Water and Electricity in Africa
Emmanuelle Auriol, ARQADE and IDEI Toulouse Sciences Economiques, Aymeric Blanc, département de la
Recherche, AFD - Janvier 2007.
N° 39 Economic Partnership Agreements and Regional Trade Flow Dynamics: The ECOWAS Case
Benoît Faivre Dupaigre, Vanessa Alby-Flores, Borgui Yerima, Ann Vourc’h, Anna Lipchitz, Philippe Chedanne - Mars
2007.
N° 40 La Régie des eaux de Phnom Penh : un modèle de gestion publique efficace
Aymeric Blanc et Alain Riès, département de la Recherche, AFD - Mai 2007.
N° 41 Répartition des gains dans les partenariats public-privé : effets comparés des modalités d’assiette d’une redevance
de concession
Olivier Ratheaux, AFD - Juin 2007.
N° 42 Potential Financial Frameworks for a Sustainable UNEO
Helle Husum, COWI, Erik Brander, COWI, Suzanne A.K. Steensen, COWI, et Emmanuelle Lachaussée, AFD - Juin
2007
Série Documents de travail / Working Papers Series
© AFD Working Paper N°49 • Youth and Labour Markets in Africa - A literature review
70
N° 43 La concession des aéroports de Madagascar : une privatisation en trompe-l’œil ?
Aymeric Blanc, département de la Recherche, AFD, et Olivier Gouirand, AFD - Août 2007.
N° 44 La concession du chemin de fer du Cameroun : les paradoxes d’une réussite impopulaire
Aymeric Blanc, département de la Recherche, AFD, et Olivier Gouirand, AFD - Août 2007.
N° 45 Analyse rétrospective de la crise alimentaire au Niger en 2005
Jean-Pierre Olivier de Sardan, LASDEL, avec la participation de M. Ali Bako, E. Guillermet, O. Hamani, Y. Issa,
M. Koné et M. Moha - Septembre 2007.
N° 46 Une nouvelle base de données institutionnelles : « Profils Institutionnels 2006 »
A new institutional database: « Institutional Profiles 2006 »
Nicolas Meisel, département de la Recherche, AFD et Jacques Ould Aoudia, DGTPE - Septembre 2007
N° 47 Governance of Renewable Natural Resources: Concepts, Methods and Tools
Sheila Wertz-Kanounnikoff, Institut du développement durable et des relations internationales (Iddri) et
Dominique Rojat, AFD - Septembre 2007.
N° 48 La crise de la filière coton : conséquences économiques et financières au Burkina Faso
François Xavier Bellocq et Arthur Silve, Département de la Recherche, AFD - Septembre 2007.
Série Documents de travail / Working Papers Series
© AFD Working Paper N°49 • Youth and Labour Markets in Africa - A literature review
71
Related Documents