Annual Report 2020 Your Trust Our Assurance

Welcome message from author
This document is posted to help you gain knowledge. Please leave a comment to let me know what you think about it! Share it to your friends and learn new things together.
Transcript
Annual Report 2020
Your TrustOur Assurance

• Century Insurance is a Lakson Group Company.• Operating since 1989, dealing in all areas of general
insurance business.• One of the premier general insurance companies of
Pakistan.• Rated “AA-” with a stable outlook by VIS Credit Rating
Co. Limited, signifying a ‘very high capacity to meet policyholders’ and contractual obligations’.
• Total equity in excess of Rs. 2.0 billion.• Twice awarded ‘Top 25 Companies Award’ by the Karachi
Stock Exchange.• Very strong reinsurance treaty arrangements with highly
rated international reinsurers.• Broad client base consisting of individuals as well as
some of the most prestigious local and multinational companies.
at a GlanceCentury Insurance

01 Vision and Mission
03 Corporate Information
04 Products and Services
10 Core Values
11 Code of Conduct
13 Notice of Annual General Meeting
17 Corporate Calendar
18 Access to Reports and Enquiries
19 Organisation Chart
20 Performance Highlights
21 DuPont Analysis
22 Horizontal and Vertical Analysis
24 Share Price & Volume Analysis
25 Statement of Value Addition
26 Chairman’s Review Report
33 Chairman’s Review Report (Urdu)
34 Directors’ Report
40 Directors’ Report (Urdu)
41 Board Committees
43 Management Committees
44 Pattern of Shareholding
46 Key Operating and Financial Data
48 Statement of Compliance with the Code of Corporate Governance
51 Independent Auditors’ Review Report on Statement of Compliance with the CCG for Insurers, 2016 & Listed Companies (CCG) Regulations, 2019
52 Shariah Advisor’s Review Report to the Board of Directors
53 Statement of Compliance with the Shariah Principles
54 Independent Reasonable Assurance Report on Compliance with the Shariah Principles
Financial Statements
58 Auditors’ Report to the Members on the Audit of the Financial Statements
64 Financial Statements
Window Takaful Operations - Financial Statements
120 Auditors’ Report to the Members on the Audit of the Financial Statements
123 Financial Statements
Form of Proxy
Contents

To be an organization known for integrity and ethical behavior and fully dedicated to its Clients, Business Partners, Shareholders and Employees, providing exceptional quality service and committed to achieving excellence in all areas of its operations.
Our Vision
• To become a company of choice for its valued Clients, Stockholders and Employees.
• To ensure continued growth of the financial strength and resilience of the company so that it may be able to withstand any unexpected shocks or cyclical economic downturns.
• The Company culture to be known for Integrity and Ethical behavior.
• The Company to be known as one of the best insurance companies of the country.
Our Mission
Century Insurance 1

Annual Report 20202
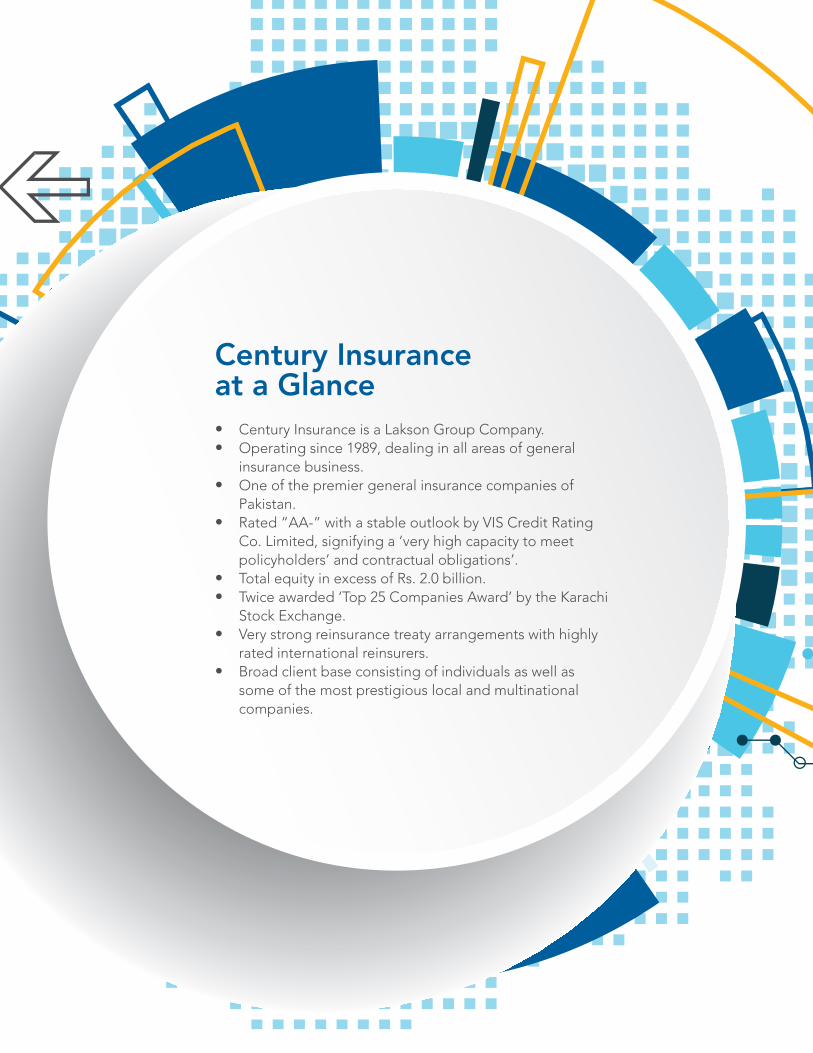
Board of DirectorsMr. Iqbal Ali Lakhani - ChairmanMr. Amin Mohammed LakhaniMs. Anushka LakhaniMr. Aftab AhmadMr. Sadrudin Ismail MohamedMr. Akber Dawood VazirMr. Mohammad Hussain Hirji - Chief Executive
AdvisorMr. Sultan Ali Lakhani
Chief Financial OfficerMr. Sabza Ali Pirani
Company SecretaryMr. Mansoor Ahmed
Audit CommitteeMr. Sadrudin Ismail Mohamed - ChairmanMr. Amin Mohammed LakhaniMr. Aftab Ahmad
Investment CommitteeMr. Iqbal Ali Lakhani - ChairmanMr. Aftab AhmadMr. Mohammad Hussain HirjiMr. Sabza Ali Pirani
Ethics, Human Resource & Remuneration CommitteeMr. Sadrudin Ismail Mohamed - ChairmanMr. Amin Mohammed Lakhani Mr. Akber Dawood VazirMr. Mohammad Hussain Hirji
External AuditorsM/s. KPMG Taseer Hadi & Co. Chartered Accountants
Shares RegistrarM/s. FAMCO Associates (Pvt.) Ltd.8-F, Near to Hotel Faran, Nursery,Block-6, P.E.C.H.S., Shahra-e-Faisal,Karachi.Tel: (021) 34380101-2Fax: (021) 34380106Email: [email protected]: www.famco.com.pk
BankersAl Baraka Bank (Pakistan) LimitedAskari Bank LimitedBank Alfalah LimitedBank Islami Pakistan LimitedDubai Islamic Bank Pakistan LimitedHabib Bank LimitedHabib Metropolitan Bank LimitedJS Bank LimitedMCB Islamic Bank LimitedMeezan Bank LimitedNRSP Microfinance Bank LimitedSilkbank LimitedSoneri Bank LimitedStandard Chartered Bank (Pakistan) LimitedTelenor Microfinance Bank LimitedU Microfinance Bank LimitedUnited Bank Limited
Registered & Corporate OfficeLakson Square, Building No. 2, Sarwar Shaheed Road, Karachi-74200.
Head Office11th Floor, Lakson Square, Building No. 3,Sarwar Shaheed Road, Karachi-74200.
Website: www.cicl.com.pkUAN: 111-111-717NTN: 0710008-6
Corporate Information
Century Insurance 3
Products &Services
Annual Report 20204
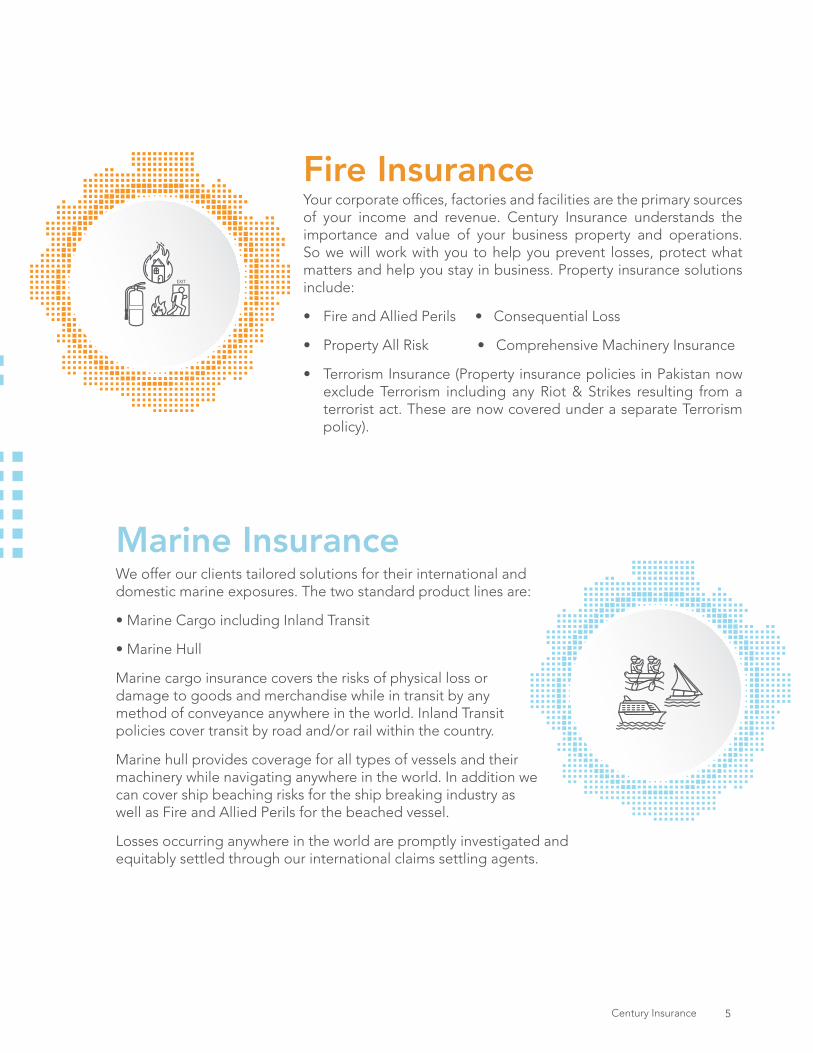
Your corporate offices, factories and facilities are the primary sources of your income and revenue. Century Insurance understands the importance and value of your business property and operations. So we will work with you to help you prevent losses, protect what matters and help you stay in business. Property insurance solutions include:
• Fire and Allied Perils • Consequential Loss
• Property All Risk • Comprehensive Machinery Insurance
• Terrorism Insurance (Property insurance policies in Pakistan now exclude Terrorism including any Riot & Strikes resulting from a terrorist act. These are now covered under a separate Terrorism policy).
Fire Insurance
We offer our clients tailored solutions for their international and domestic marine exposures. The two standard product lines are:
• Marine Cargo including Inland Transit
• Marine Hull
Marine cargo insurance covers the risks of physical loss or damage to goods and merchandise while in transit by any method of conveyance anywhere in the world. Inland Transit policies cover transit by road and/or rail within the country.
Marine hull provides coverage for all types of vessels and their machinery while navigating anywhere in the world. In addition we can cover ship beaching risks for the ship breaking industry as well as Fire and Allied Perils for the beached vessel.
Losses occurring anywhere in the world are promptly investigated and equitably settled through our international claims settling agents.
Marine Insurance
Century Insurance 5

People love their cars, but insuring them can be a chore. At Century Insurance, with fast, fair and convenient services and cover you can depend on, we’ll be there for you when it matters. We settle bills with a very wide network of repairers directly – so no waiting for that check in the mail. And because we don’t force you to use any particular repairer you are free to take your car to the workshop of your choice. You may opt for comprehensive coverage including own damage, theft and third party legal liability or just third party legal liability coverage to meet the requirements of law.
If you would like to have the added assurance of a good vehicle tracking service, substantial discounts are available on the premium you pay. Or if you would like us to arrange the tracking service for you we can do that too as a complimentary service at economical rates.
Private Car InsuranceMotor Insurance
Our qualified engineers can cater to all of your engineering insurance needs. At Century Insurance, we can help by sharing insights, insurance solutions and risk engineering services. From construction related insurances to erection of machinery to electronic equipment, we have the right solution for you. With us, you’ll work with specialized underwriting, risk engineering and claims professionals who understand the challenges you face and can deliver quality service when you need it.
Engineering insurance solutions include:• Contractor’s All Risk (CAR) insurance offers comprehensive
protection for contract works, construction plant and equipment as well as for Third Party claims.
• Contractor’s Plant & Equipment (CP&E).
• Erection All Risk (EAR) for plant and machinery in the course of erection.
• Machinery Breakdown covers sudden and unforeseen loss or damage to machinery.
• Advance Loss of Profits (ALOP) also known as Delayed Startup to cover loss of gross profits arising from a CAR or EAR loss.
• Electronic Equipment Insurance for computers and other electronic equipments.
• Deterioration of stock.
• Boiler and Pressure Vessels.
Engineering Insurance
Commercial Vehicle Insurance
Whatever your business, if you have your own commercial vehicles we know how important these vehicles are to your business. No matter how many commercial vehicles you have, we’ve got a plan to suit you. From fleets of trucks to just one or two pickups, we can tailor the right insurance package for you. If you are insuring many vehicles, our fleet policy can cover them all in a single policy.
Annual Report 20206

Whether you are travelling for business or pleasure, unfortunate surprises can occur either before or during your trip. Medical emergencies or accidents can result in costly trip cancellations or medical bills leaving the traveler stranded in an unfamiliar country. Children may be left unattended with perhaps no one to accompany them on their return back home. Loss of baggage or mere flight delay may also result in unexpected and unbudgeted expenses. Our 24 hour, 7days of the week hotline will be available to assist you no matter where you are or what language you are comfortable communicating in.
Century Insurance provides the best available travel insurance plans for you and your family, to suit every budget and need. We also have special plans available for senior citizens no matter
Travel Insurance
In today’s competitive marketplace, employers know that their true competitive advantage frequently lies in their human capital. A good employer will therefore always try to take care of its employees. One of the key variables in an employee’s benefit structure is the health insurance provided by the employer.
Century Insurance provides the best possible corporate health insurance packages available in the market. We care for your employees and make every effort to ensure that they receive the best possible care based on the benefits chosen for them by their employer. Whether they need expert advice and guidance related to medical admissions and treatment or whether they just want a better understanding of the benefits available under their policy, we provide service with a smile and a caring attitude. We liaise closely with the hospitals to ensure that your employees receive the care and treatment that they need in the most timely and efficient manner possible.
Accident & health Insurance
where in the world they may be planning to travel to. Claims can be paid directly to hospitals in most instances, anywhere in the world. So the next time you travel, give up your worries and get the best travel insurance solution from Century Insurance.
We also work closely with the Human Resource department of our clients to make sure that they are fully informed of developments involving major hospitalizations of their employees or of the dependents of their employees. We also pay extra attention to ensure that all paperwork, health cards, payments, etc are made correctly and on time. With all of the topmost hospitals on our panel we ensure a smooth and cashless service for your employees so that they are not made to fret and worry about these matters during the difficult time they may be facing on account of either their own hospitalization or that of a loved one.
Personal Accident provides 24/7 worldwide cover for accidental bodily injury to the insured person resulting in death or permanent disablement.
Century Insurance 7
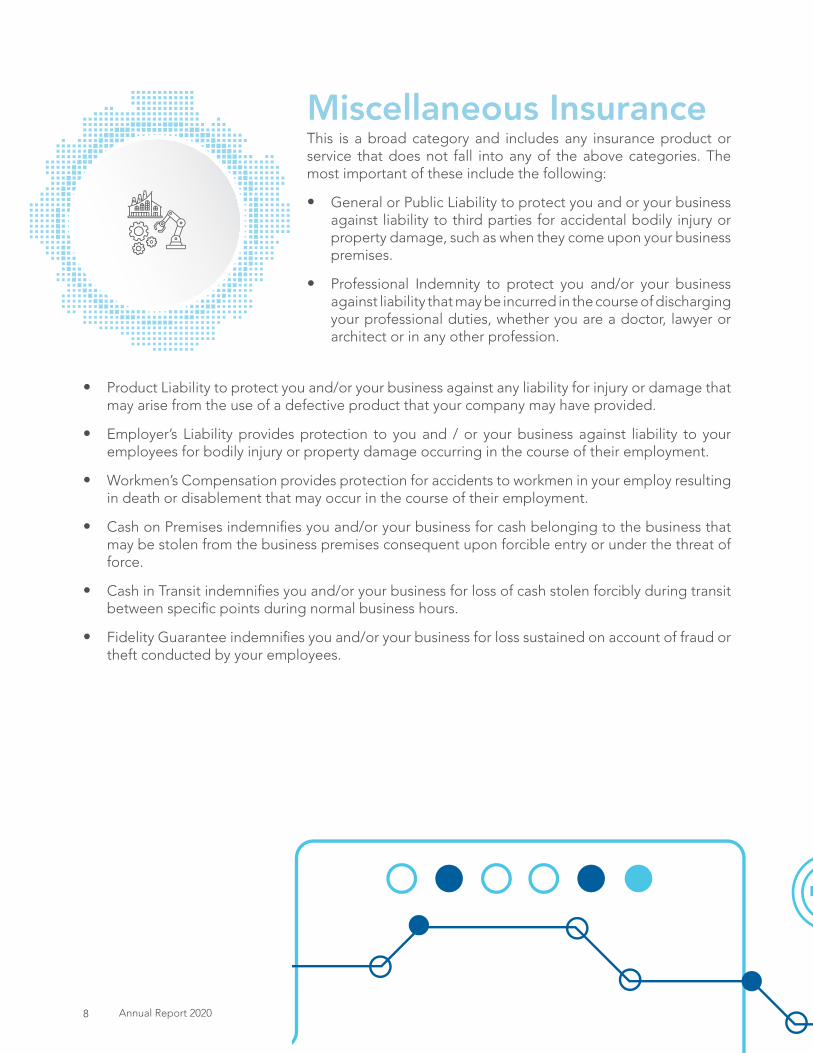
This is a broad category and includes any insurance product or service that does not fall into any of the above categories. The most important of these include the following:
• General or Public Liability to protect you and or your business against liability to third parties for accidental bodily injury or property damage, such as when they come upon your business premises.
• Professional Indemnity to protect you and/or your business against liability that may be incurred in the course of discharging your professional duties, whether you are a doctor, lawyer or architect or in any other profession.
Miscellaneous Insurance
• Product Liability to protect you and/or your business against any liability for injury or damage that may arise from the use of a defective product that your company may have provided.
• Employer’s Liability provides protection to you and / or your business against liability to your employees for bodily injury or property damage occurring in the course of their employment.
• Workmen’s Compensation provides protection for accidents to workmen in your employ resulting in death or disablement that may occur in the course of their employment.
• Cash on Premises indemnifies you and/or your business for cash belonging to the business that may be stolen from the business premises consequent upon forcible entry or under the threat of force.
• Cash in Transit indemnifies you and/or your business for loss of cash stolen forcibly during transit between specific points during normal business hours.
• Fidelity Guarantee indemnifies you and/or your business for loss sustained on account of fraud or theft conducted by your employees.
Annual Report 20208

For us, every customer claim is an opportunity to deliver when it matters and to differentiate the Century Insurance customer experience. As soon as you report a claim, our team will come into action, delivering swift and transparent claims assistance wherever you need it. Our team consists of experienced claims professionals dedicated to fairness and transparency in the handling of all claims.
Combining international experience and local knowledge, we will partner with you to give you the assistance you need while helping you to reduce your overall claim costs over time.
Claim Service
Working closely with you, our underwriters and risk engineers can identify and control risk in a broad range of environments, both in the manufacturing and service sectors. With Century Insurance’s specialized underwriting knowledge, experienced risk assessments and excellent claims handling, we’ll be there to support you should a claim occur.
Our Risk Engineers identify, assess and guide you to improve risks helping you reduce losses and the overall risk to your business.
Risk Management
Century Insurance 9
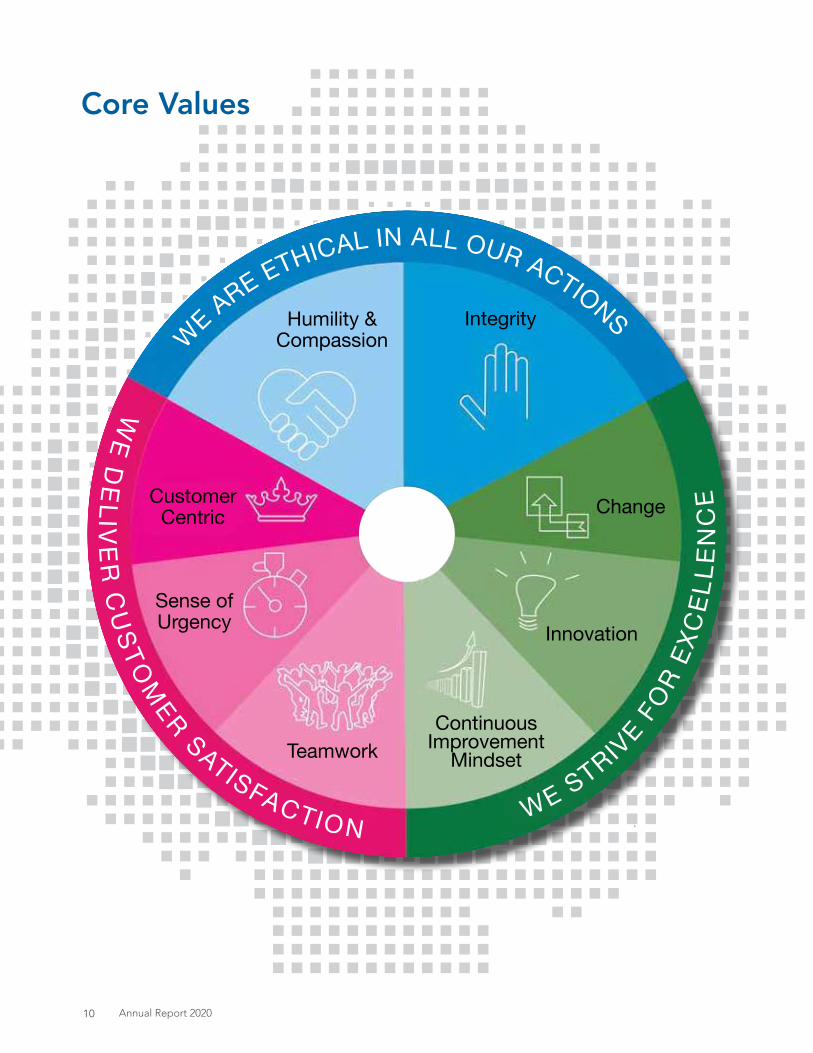
CustomerCentric
Sense ofUrgency
Teamwork
Innovation
Change
IntegrityHumility &Compassion
ContinuousImprovement
Mindset
WE ARE ETHICAL IN ALL OUR ACTIONS
WE D
ELIV
ER
CU
STOM
ER SATISFACTION WE STRIV
E FO
R EX
CEL
LEN
CE
Core Values
Annual Report 202010
1. RELATIONSHIP WITH EMPLOYEES
• Century Insurance Company Limited (CICL) takes pride in the strong personal commitment of its people towards the progress and success of the Company. CICL’s policy is to treat individuals in all aspects of employment solely on the basis of merit irrespective of race, religion, color, age, gender, and marital status. CICL believes in individual’s respect and their rights.
The Company is committed to the growth of its employees. This is achieved through building a culture of mutual trust, learning and motivation.
• CICL’s vision is based on inspiring and developing individuals as their success depends on their ability to make meaningful contributions to the progress of the Company.
2. RELATIONSHIP WITH COMPANY
• The employees of the Company strive to adhere to its guidelines and objectives and to give their best efforts to improve its performance. They recognize the trust placed by the Company in them and act with integrity and honesty in all situations - to preserve that trust and confidence. They avoid conflicts of interest and other situations that are potentially harmful to the progress of the Company.
• The employees of the Company use its assets, facilities and services only for lawful, proper and authorized purposes. They intend to make best use of the Company’s equipment, systems and technology in order to have fast and reliable communication and a strong MIS system to further the aims and objectives of the Company.
3. RELATIONSHIP WITH BUSINESS COMMUNITY
• Each employee is responsible for how he or she is perceived by clients and other business partners; it is essential that they maintain the Company’s reputation for honesty and fair dealing with these people and organizations.
• It is CICL’s policy to respect the trade secrets and proprietary information of others. This is particularly pertinent if one has knowledge of trade secrets and proprietary information of a former employer.
4. RELATIONSHIP WITH CLIENTS
• CICL’s reputation has been built upon the trust and quality service it is providing. Our commitment to excellence in quality of service and building strong client relationships is essential to the continued growth and success of the Company. Also, vital for success is to meet the challenges of the highly competitive market with our expertise, innovative and creative marketing.
CICL’s motto: “Customer satisfaction is management’s top priority”
5. RELATIONSHIP WITH GOVERNMENT AND THE LAW
• CICL supports free enterprise and a competitive market system. The Company’s policy is to comply fully with all applicable laws irrespective to the extent to which they are enforced. The Company cooperates fully with all government and regulatory bodies and is committed to high standards of corporate governance. Penalties for non-compliance can be severe and can involve criminal proceedings.
Code of Conduct
Century Insurance 11
• CICL’s financial policies for conducting business are based on trust, transparency, integrity, and following the principles of accounting and finance as approved by regulations and applicable accounting codes. Any unsupportive or false entry, infringement of accounts for individual or Company gain is contrary to our business codes and ethics.
6. RELATIONSHIP WITH SOCIETY
• CICL strives to operate as a responsible corporate citizen within both the local and global communities.
• CICL is an equal opportunity employer for all levels of employees irrespective of color, race, gender, age, ethnicity or religious beliefs.
• CICL provides a safe and healthy workplace, protecting human health and the environment.
• CICL pays its employees a remuneration that enables them to meet at least their basic needs, and provides employees the opportunity to improve their skills and capabilities.
• CICL respects employees’ freedom of association.
• CICL works with governments and the communities in which we do business to improve the educational, cultural, economic and social wellbeing of those communities.
7. RELATIONSHIP WITH THE ENVIRONMENT
• Protecting the world in which we live is a vital concern and a continuing commitment. CICL is dedicated to contributing to the overall quality of life. We recognize and constantly reaffirm the value of a healthy and clean environment.
8. RELATIONSHIP WITH THE SHAREHOLDERS
• CICL strives to serve the best interests of its shareholders to provide consistent growth and a fair rate of return on their investment and to maintain its position and reputation as one of the leading insurance companies, dedicated to protecting shareholders’ investments and providing full and timely information. By conducting our business in accordance with the principles of fairness, decency and integrity set forth here we help to build shareholders’ value.
9. RESPONSIBILITY FOR COMPLIANCE
• In accepting employment with the Company, each of us becomes accountable for compliance with these standards of conduct and with all laws and regulations. Managers are responsible for communicating these standards to employees to ensure that they understand and abide by them, and for creating a climate where employees can discuss ethical and legal issues freely.
Annual Report 202012
Notice of Annual General Meeting
NOTICE IS HEREBY GIVEN that the 35th Annual General Meeting of Century Insurance Company Limited will be held on Thursday, April 29, 2021 at 03:00 p.m. at the Registered Office of the Company at Lakson Square Building No.2, Sarwar Shaheed Road, Karachi through Video Conferencing to transact the following business:
ORDINARY BUSINESS1. To receive, consider and adopt the audited financial statements of the Company for the year ended
December 31, 2020 together with the Directors’ and Auditors’ reports thereon.
2. To declare final dividend in cash @ 20% i.e. Rs.2.00 per share of Rs.10 each as recommended by the Board of Directors.
3. To appoint Auditors and fix their remuneration.
The retiring auditors M/s. KPMG Taseer Hadi & Company, Chartered Accountants have been auditors of the Company for a period of four years. The Board, on the recommendation of the Audit Committee of the Company has proposed the appointment of M/s. EY Ford Rhodes, Chartered Accountants, as auditors for the year ending December 31, 2021.
SPECIAL BUSINESS
Special Resolutions4. To consider, and if thought fit, to pass with or without modification the following resolutions as Special
Resolution:
a) “RESOLVED that the transactions carried out in normal course of business with associated companies/related parties as disclosed in Note No.35 of the audited financial statements for the year ended December 31, 2020 be and are hereby ratified and approved.”
b) “FURTHER RESOLVED that the Chief Executive Officer, of the Company be and is hereby authorized to approve all the transactions carried out and to be carried out in normal course of business with associated companies/related parties during the ensuing year ending December 31, 2021 and in this connection the Chief Executive Officer be and is hereby also authorized to take any and all necessary actions and sign/execute any and all such documents/indentures as may be required in this regard on behalf of the Company.”
Statement under Section 134 of the Companies Act, 2017 in the above matter mentioned in item No.4 is annexed.
By Order of the Board
(MANSOOR AHMED) Karachi: March 29, 2021 Company Secretary
Century Insurance 13

Notes:1. The share transfer books of the Company will remain closed from April 23, 2021 to April 29, 2021 (both days
inclusive). Transfers received in order by the Shares Registrar of the Company, M/s. FAMCO Associates (Private) Limited, 8-F, Near Hotel Faran, Nursery, Block-6, P.E.C.H.S., Shahra-e-Faisal, Karachi up to the close of business on April 22, 2021 will be treated in time for entitlement of the dividend.
2. In view of the prevailing and worsening situation due to pandemic COVID-19 and in line with the directions issued to listed companies by the Securities & Exchange Commission of Pakistan, vide its Circular No.4 of 2021 dated February 15, 2021 and subsequent Circular No.6 of 2021 dated March 03, 2021, the Company has decided to hold Annual General Meeting (AGM) through electronic means.
The special arrangement for attending the AGM through electronic means will be as under:
1. AGM will be held through Zoom application – a video link facility.
2. Shareholders interested in attending the AGM through Zoom application are hereby requested to get themselves registered with the Company Secretary office by providing the following details at the earliest but not later than 48 hours before the time of AGM (i.e. before 3.00 p.m. on April 27, 2021) through following means:
a) Mobile/WhatsApp: 0315 5008228
b) E-mail: [email protected]
Shareholders are advised to mention Name, CNIC Number, Folio/CDC Account Number, cell number and email ID for identification.
Upon receipt of the above information from the interested shareholders, the Company will send the login credentials at their e-mail address. On the date of AGM, shareholders will be able to login and participate in the AGM proceedings through their smartphone / computer devices.
In view of the above, the Shareholders can also provide their comments/suggestions for the proposed agenda items of the AGM by using the aforesaid means.
3. A member entitled to attend and vote at the Annual General Meeting may appoint another member as his/her proxy to attend, speak and vote instead of him/her, and a proxy so appointed shall have such rights, as respects attending, speaking and voting at the meeting as are available to a member. A proxy must be a member of the Company. A corporate entity, being a member, may appoint any person, regardless whether they are a member or not, as its proxy. In case of corporate entities, a resolution of the Board of Directors/Power of Attorney with specimen signature of the person nominated to represent and vote on behalf of the corporate entity, shall be submitted to the Company along with a completed proxy form. The proxy holders are requested to produce their national CNICs or original passports at the time of the meeting.
4. Forms of proxy, in order to be valid must be properly filled-in/executed and received at the registered office of the Company situated at Lakson Square, Building No.2, Sarwar Shaheed Road, Karachi not later than 48 hours before the time of the meeting excluding holidays.
5. Members holding shares in physical form are requested to promptly notify Shares Registrar of the Company of any change in their addresses. Shareholders maintaining their shares in electronic form should have their address updated with their participant or CDC Investor Accounts Service.
6. Under the provisions of Section 242 of the Companies Act, 2017, it is mandatory for a listed Company to pay cash dividend to its shareholders only through electronic mode directly into bank account designated by the entitled shareholders.
In order to receive dividends directly into their bank account, shareholders are requested to fill in Electronic Credit Mandate Form available on Company’s website and send it duly signed along with a copy of CNIC to the registrar of the Company M/s. FAMCO Associates (Private) Limited, in case of physical shares.
Annual Report 202014

In case shares are held in CDC then Electronic Credit Mandate Form must be submitted directly to shareholder’s broker/participant/CDC account services. No further action is required if IBAN has already been incorporated/updated in the CDC account or physical folio of the shareholder.
7. Pursuant to Notification vide SRO.787(1)/2014 of September 08, 2014, SECP has directed to facilitate the members of the company receiving Annual Financial Statements and Notices through electronic mail system (e-mail). We are pleased to offer this facility to our members who desire to receive Annual Financial Statements and Notices of the Company through e-mail in future. In this respect members are hereby requested to convey their consent via e-mail on a standard request form which is available at the Company website i.e. www.cicl.com.pk. Please ensure that your e-mail has sufficient rights and space available to receive such e-mail which may be larger than 1 MB file in size. Further, it is the responsibility of the member to timely update the Shares Registrar of any change in the registered e-mail address.
8. (i) Pursuant to the provisions of the Finance Act, 2019 effective July 1, 2019, the rates of deduction of income tax from dividend payments under Section 150 of the Income Tax Ordinance, 2001 have been revised as follows:
1. Persons appearing in Active Tax Payers List (ATL) 15%
2. Persons not appearing in Active Tax Payers List (ATL) 30%
To enable the Company to make tax deduction on the amount of cash dividend @ 15% instead of 30%, shareholders whose names are not entered into the Active Taxpayers List (ATL) provided on the website of FBR, despite the fact that they are filers, are advised to make sure that their names are entered in ATL before the first day of book closure, otherwise tax on their cash dividend will be deducted @ 30% instead of 15%.
(ii) Withholding Tax exemption from the dividend income, shall only be allowed if copy of valid tax exemption certificate or stay order from a competent court of law is made available to FAMCO Associates (Private) Limited, by the first day of Book Closure.
(iii) Further, according to clarification received from Federal Board of Revenue (FBR), with-holding tax will be determined separately on ‘Filer/Non-Filer’ status of Principal shareholder as well as joint-holder(s) based on their shareholding proportions, in case of joint accounts.
In this regard all shareholders who hold shares jointly are requested to provide shareholding proportions of Principal shareholder and Joint-holder(s) in respect of shares held by them (only if not already provided) to our Shares Registrar, in writing as follows:
CompanyName
Folio/CDSAccount #
Total Shares
Principal Shareholder Joint Shareholder
Name and
CNIC #
ShareholdingProportion
(No. of Shares)
Name andCNIC #
ShareholdingProportion
(No. of Shares)
The required information must reach our Shares Registrar within 10 days of this notice; otherwise it will be assumed that the shares are equally held by Principal shareholder and Joint Holder(s).
(iv) For any query/problem/information, the investors may contact the Company Secretary at phone: 38400000 and email address: [email protected] and/or FAMCO Associates (Private) Limited at phone: 34380101-5 and email address: [email protected].
(v) Corporate shareholders having CDC accounts are required to have their National Tax Number (NTN) updated with their respective participants, whereas corporate physical shareholders should send a copy of their NTN certificate to the company or FAMCO Associates (Private) Limited. Shareholders while sending NTN or NTN certificates, as the case may be, must quote company name and their respective folio numbers. Without the NTN company would not be in a position to check filer status on the ATL and hence higher tax of 30% may be applied in such cases.
Century Insurance 15
9. Members can exercise their right to demand a poll subject to meeting requirements of Section 143 to Section 145 of the Companies Act, 2017 and applicable clauses of Companies (Postal Ballot) Regulation, 2018.
10. An updated list for unclaimed dividend/shares of the Company is available on the Company’s website www.cicl.com.pk. These are unclaimed dividend/shares which have remained unclaimed or unpaid for a period of three years from the date these have become due and payable.
11. Claims can be lodged by shareholders on Claim Forms as are available on the Company’s website. Claims Forms must be submitted to the Company’s Shares Registrar for receipt of dividend/shares.
12. Form of Proxy is enclosed.
STATEMENT OF MATERIAL FACTS CONCERNING SPECIAL BUSINESS PURSUANT TO SECTION 134 OF THE COMPANIES ACT, 2017This statement sets out the material facts concerning Special Business, given in agenda item No.4 of the Notice which will be considered to be passed by the members. The purpose of the Statement is to set forth the material facts concerning such Business.
1 - Agenda Item No.4(a) of the Notice – Transactions carried out with associated companies during the year ended December 31, 2020 to be passed as a Special Resolution.The transactions carried out in normal course of business with associated companies (Related parties) were being approved by the Board as recommended by the Audit Committee on quarterly basis pursuant to Clause 15 of Listed Companies (Code of Corporate Governance) Regulations, 2019.
During the Board Meeting it was pointed out by the Directors that as the majority of Company Directors were interested in these transactions due to their common directorship and holding of shares in the associated companies, the quorum of directors seemingly could not be formed for approval some of these transactions specifically, therefore, these transactions have to be approved by the shareholders in the General Meeting.
In view of the above, the transactions conducted during the financial year ended December 31, 2020 with associated companies/related parties shown in Note No.35 of the financial statements are being placed before the shareholders for their consideration and approval/ratification.
2 - Agenda Item No. 4(b) of the Notice – Authorization to the Chief Executive for the transactions carried out and to be carried out with associated companies/related parties during the ensuing year ending December 31, 2021 to be passed as a Special Resolution.The Company would be conducting transactions with associated companies in the normal course of business. The majority of Directors are interested in these transactions due to their common directorship and shareholding in the associated companies/related parties. Therefore, such transactions with associated companies have to be approved by the shareholders.
The shareholders may authorize the Chief Executive to approve transactions carried out and to be carried out in normal course of business with associated companies/related parties during the ensuing year December 31, 2021.
The Directors are interested in the above items to the extent of their common directorships and shareholding in the associated companies and the privileges attached thereto only.
Annual Report 202016

Corporate Calendar
27
26
28
27
28
28
28
29
10
25
Audit Committee meeting to consider
accounts of the Company for
the year ended December 31, 2019
February 27, 2020
Board of Directors’ meeting to consider
accounts of the Company for the half year ended June 30, 2020
August 26, 2020
Annual General Meeting of shareholders to consider accounts
of the Company for the year ended
December 31, 2019
May 29, 2020
Audit Committee meeting to consider
accounts of the Company for the
quarter ended March 31, 2020
April 28, 2020
Board of Directors’ meeting to consider
accounts of the Company for the
quarter ended September 30, 2020
October 28, 2020
Audit Committee meeting to consider
accounts of the Company for the half year ended June 30, 2020
August 25, 2020
Board of Directors’ meeting to consider
accounts of the Company for
the year ended December 31, 2019
February 28, 2020
Audit Committee meeting to consider
accounts of the Company for the
quarter ended September 30, 2020
October 27, 2020
Board of Directors’ meeting after
reconstitution of the Board to elect Chairman
of the Board, Chief Executive & form Board
Sub Committees
June 10, 2020
Board of Directors’ meeting to consider
accounts of the Company for the
quarter ended March 31, 2020
April 28, 2020
Century Insurance 17

Access to Reports and Enquiries
Annual ReportAnnual report 2020 may be downloaded from the Company’s website: www.cicl.com.pk or printed copies obtained by writing to:
The Company Secretary Century Insurance Company Limited Registered & Corporate Office Lakson Square Building No. 2, Sarwar Shaheed Road, Karachi 74200, Pakistan.
Quarterly ReportsThe Company publishes interim reports at the end of first, second and third quarters of the financial year. The interim reports for the year 2020 can be accessed from Century Insurance website: www.cicl.com.pk or printed copies can be obtained by writing to the Company Secretary.
Shareholders’ EnquiriesShareholders’ enquiries about their holding, dividends or share certificates should be directed either to Company’s registered office or shares registrar at the following address:
M/s. FAMCO Associates (Private) Limited8-F, Near Hotel Faran, Nursery, Block-6, P.E.C.H.S., Shahra-e-Faisal, Karachi.
Stock Exchange ListingShares of Century Insurance Company Limited are listed on Pakistan Stock Exchange Limited. The symbol code for dealing in shares of the Company is CENI.
Annual Report 202018
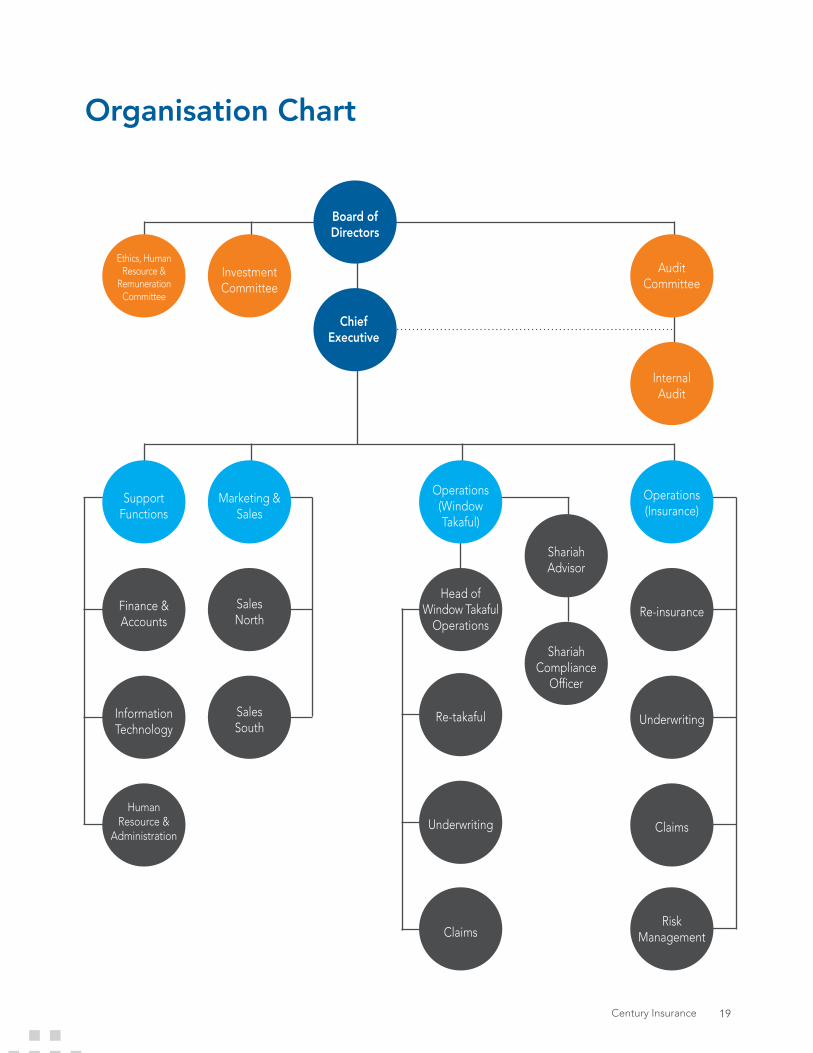
Board of Directors
Investment Committee
Chief Executive
Ethics, Human Resource &
RemunerationCommittee
InternalAudit
AuditCommittee
SupportFunctions
Marketing & Sales
Operations(Window Takaful)
Operations(Insurance)
Human Resource &
Administration
Finance & Accounts
InformationTechnology
Sales North
SalesSouth
Claims
Re-takaful
Shariah Advisor
Underwriting
ShariahCompliance
Officer
Claims
Risk Management
Re-insurance
Underwriting
Organisation Chart
Head of Window Takaful
Operations
Century Insurance 19
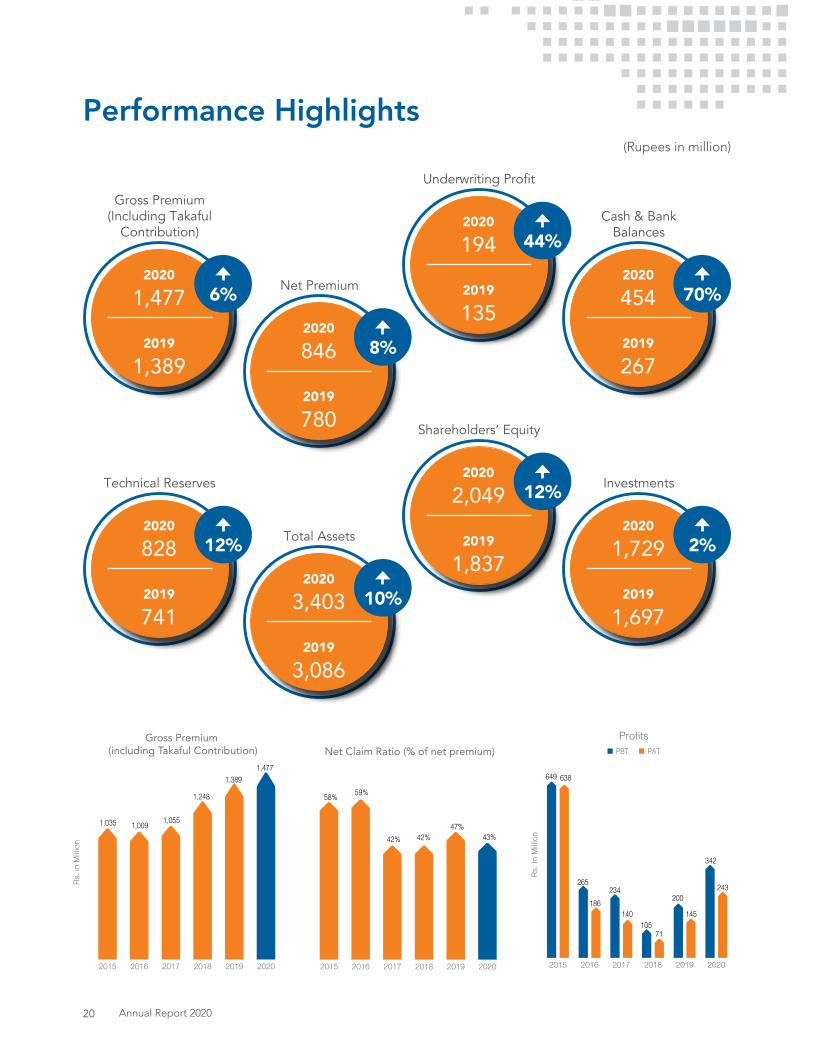
Performance Highlights(Rupees in million)
202020192018201720162015
Rs. i
n M
illion
Gross Premium (including Takaful Contribution)
1,035 1,009 1,055
1,248
1,3891,477
202020192018201720162015
Net Claim Ratio (% of net premium)
42%
58% 59%
42%47%
43%
202020192018201720162015
ProfitsPBT PAT
Rs. I
n M
illion
649
265 234
105
200
342
638
186 140
71
145
243
Gross Premium (Including Takaful
Contribution)
2019
1,389
2020
1,477 6%
Technical Reserves
2019
741
2020
828 12%
Underwriting Profit
2019
135
2020
194 44%
Shareholders’ Equity
2019
1,837
2020
2,049 12%
Net Premium
2019
780
2020
846 8%
Total Assets
2019
3,086
2020
3,403 10%
Cash & Bank Balances
2019
267
2020
454 70%
Investments
2019
1,697
2020
1,729 2%
Annual Report 202020
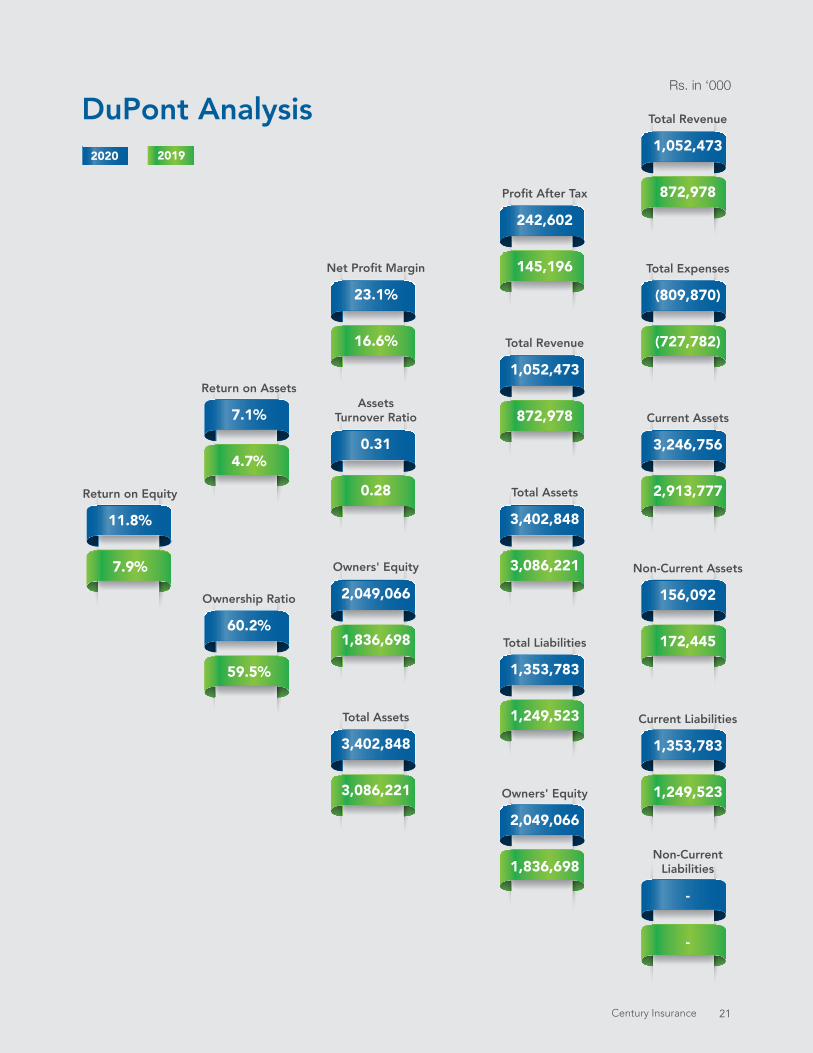
DuPont AnalysisRs. in ‘000
20192020
Total Revenue
Profit After Tax
Net Profit Margin Total Expenses
Total Revenue
Assets Turnover Ratio
Return on Assets
Current Assets
Total Assets
Owners' Equity
Ownership Ratio
Return on Equity
Non-Current Assets
Total Liabilities
Total Assets Current Liabilities
Owners' Equity
Non-Current Liabilities
1,052,473
242,602
23.1% (809,870)
1,052,473
0.31
7.1%
3,246,756
3,402,848
2,049,066
60.2%
11.8%
156,092
1,353,783
3,402,848 1,353,783
2,049,066
-
872,978
145,196
16.6% (727,782)
872,978
0.28
4.7%
2,913,777
3,086,221
1,836,698
59.5%
7.9%
172,445
1,249,523
3,086,221 1,249,523
1,836,698
-
Century Insurance 21
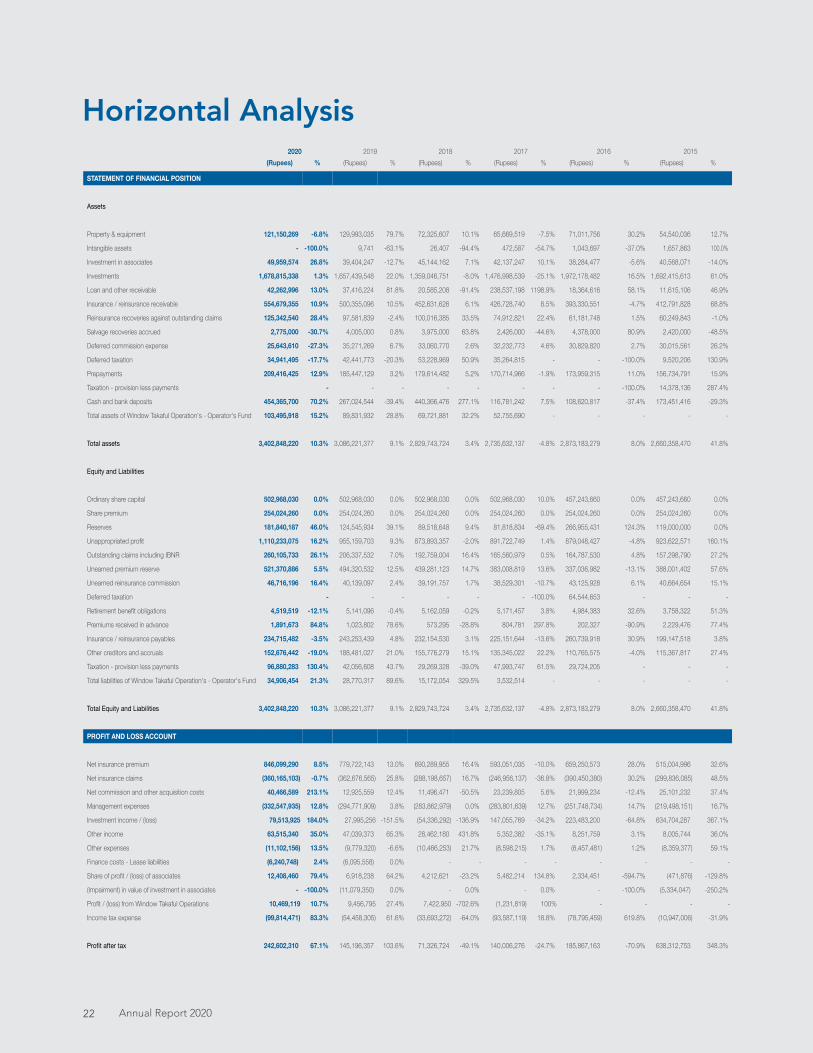
Horizontal Analysis2020 2019 2018 2017 2016 2015
(Rupees) % (Rupees) % (Rupees) % (Rupees) % (Rupees) % (Rupees) %
STATEMENT OF FINANCIAL POSITION
Assets
Property & equipment 121,150,269 -6.8% 129,993,035 79.7% 72,325,607 10.1% 65,669,519 -7.5% 71,011,756 30.2% 54,540,036 12.7%
Intangible assets - -100.0% 9,741 -63.1% 26,407 -94.4% 472,587 -54.7% 1,043,697 -37.0% 1,657,863 100.0%
Investment in associates 49,959,574 26.8% 39,404,247 -12.7% 45,144,162 7.1% 42,137,247 10.1% 38,284,477 -5.6% 40,568,071 -14.0%
Investments 1,678,815,338 1.3% 1,657,439,548 22.0% 1,359,046,751 -8.0% 1,476,998,539 -25.1% 1,972,178,482 16.5% 1,692,415,613 61.0%
Loan and other receivable 42,262,996 13.0% 37,416,224 81.8% 20,585,208 -91.4% 238,537,198 1198.9% 18,364,616 58.1% 11,615,106 46.9%
Insurance / reinsurance receivable 554,679,355 10.9% 500,355,096 10.5% 452,631,626 6.1% 426,728,740 8.5% 393,330,551 -4.7% 412,791,828 68.8%
Reinsurance recoveries against outstanding claims 125,342,540 28.4% 97,581,839 -2.4% 100,016,385 33.5% 74,912,821 22.4% 61,181,748 1.5% 60,249,843 -1.0%
Salvage recoveries accrued 2,775,000 -30.7% 4,005,000 0.8% 3,975,000 63.8% 2,426,000 -44.6% 4,378,000 80.9% 2,420,000 -48.5%
Deferred commission expense 25,643,610 -27.3% 35,271,269 6.7% 33,060,770 2.6% 32,232,773 4.6% 30,829,820 2.7% 30,015,561 26.2%
Deferred taxation 34,941,495 -17.7% 42,441,773 -20.3% 53,228,969 50.9% 35,264,815 - - -100.0% 9,520,206 130.9%
Prepayments 209,416,425 12.9% 185,447,129 3.2% 179,614,482 5.2% 170,714,966 -1.9% 173,959,315 11.0% 156,734,791 15.9%
Taxation - provision less payments - - - - - - - - -100.0% 14,378,136 287.4%
Cash and bank deposits 454,365,700 70.2% 267,024,544 -39.4% 440,366,476 277.1% 116,781,242 7.5% 108,620,817 -37.4% 173,451,416 -29.3%
Total assets of Window Takaful Operation's - Operator's Fund 103,495,918 15.2% 89,831,932 28.8% 69,721,881 32.2% 52,755,690 - - - - -
Total assets 3,402,848,220 10.3% 3,086,221,377 9.1% 2,829,743,724 3.4% 2,735,632,137 -4.8% 2,873,183,279 8.0% 2,660,358,470 41.8%
Equity and Liabilities
Ordinary share capital 502,968,030 0.0% 502,968,030 0.0% 502,968,030 0.0% 502,968,030 10.0% 457,243,660 0.0% 457,243,660 0.0%
Share premium 254,024,260 0.0% 254,024,260 0.0% 254,024,260 0.0% 254,024,260 0.0% 254,024,260 0.0% 254,024,260 0.0%
Reserves 181,840,187 46.0% 124,545,934 39.1% 89,518,648 9.4% 81,818,834 -69.4% 266,955,431 124.3% 119,000,000 0.0%
Unappropriated profit 1,110,233,075 16.2% 955,159,703 9.3% 873,893,357 -2.0% 891,722,749 1.4% 879,048,427 -4.8% 923,622,571 160.1%
Outstanding claims including IBNR 260,105,733 26.1% 206,337,532 7.0% 192,759,004 16.4% 165,560,979 0.5% 164,787,530 4.8% 157,298,790 27.2%
Unearned premium reserve 521,370,886 5.5% 494,320,532 12.5% 439,281,123 14.7% 383,008,819 13.6% 337,036,982 -13.1% 388,001,402 57.6%
Unearned reinsurance commission 46,716,196 16.4% 40,139,097 2.4% 39,191,757 1.7% 38,529,301 -10.7% 43,125,928 6.1% 40,664,654 15.1%
Deferred taxation - - - - - - -100.0% 64,544,653 - - -
Retirement benefit obligations 4,519,519 -12.1% 5,141,096 -0.4% 5,162,059 -0.2% 5,171,457 3.8% 4,984,383 32.6% 3,758,322 51.3%
Premiums received in advance 1,891,673 84.8% 1,023,802 78.6% 573,295 -28.8% 804,781 297.8% 202,327 -90.9% 2,229,476 77.4%
Insurance / reinsurance payables 234,715,482 -3.5% 243,253,439 4.8% 232,154,530 3.1% 225,151,644 -13.6% 260,739,918 30.9% 199,147,518 3.8%
Other creditors and accruals 152,676,442 -19.0% 188,481,027 21.0% 155,776,279 15.1% 135,345,022 22.2% 110,765,575 -4.0% 115,367,817 27.4%
Taxation - provision less payments 96,880,283 130.4% 42,056,608 43.7% 29,269,328 -39.0% 47,993,747 61.5% 29,724,205 - - -
Total liabilities of Window Takaful Operation's - Operator's Fund 34,906,454 21.3% 28,770,317 89.6% 15,172,054 329.5% 3,532,514 - - - - -
Total Equity and Liabilities 3,402,848,220 10.3% 3,086,221,377 9.1% 2,829,743,724 3.4% 2,735,632,137 -4.8% 2,873,183,279 8.0% 2,660,358,470 41.8%
PROFIT AND LOSS ACCOUNT
Net insurance premium 846,099,290 8.5% 779,722,143 13.0% 690,289,955 16.4% 593,051,035 -10.0% 659,250,573 28.0% 515,004,996 32.6%
Net insurance claims (360,165,103) -0.7% (362,676,565) 25.8% (288,198,657) 16.7% (246,956,137) -36.8% (390,450,380) 30.2% (299,836,085) 48.5%
Net commission and other acquisition costs 40,466,589 213.1% 12,925,559 12.4% 11,496,471 -50.5% 23,239,805 5.6% 21,999,234 -12.4% 25,101,232 37.4%
Management expenses (332,547,935) 12.8% (294,771,909) 3.8% (283,862,979) 0.0% (283,801,639) 12.7% (251,748,734) 14.7% (219,498,151) 16.7%
Investment income / (loss) 79,513,925 184.0% 27,995,256 -151.5% (54,336,292) -136.9% 147,055,769 -34.2% 223,483,200 -64.8% 634,704,287 367.1%
Other income 63,515,340 35.0% 47,039,373 65.3% 28,462,180 431.8% 5,352,382 -35.1% 8,251,759 3.1% 8,005,744 36.0%
Other expenses (11,102,156) 13.5% (9,779,320) -6.6% (10,466,253) 21.7% (8,598,215) 1.7% (8,457,481) 1.2% (8,359,377) 59.1%
Finance costs - Lease liabilities (6,240,748) 2.4% (6,095,558) 0.0% - - - - - - - -
Share of profit / (loss) of associates 12,408,460 79.4% 6,918,238 64.2% 4,212,621 -23.2% 5,482,214 134.8% 2,334,451 -594.7% (471,876) -129.8%
(Impairment) in value of investment in associates - -100.0% (11,079,350) 0.0% - 0.0% - 0.0% - -100.0% (5,334,047) -250.2%
Profit / (loss) from Window Takaful Operations 10,469,119 10.7% 9,456,795 27.4% 7,422,950 -702.6% (1,231,819) 100% - - - -
Income tax expense (99,814,471) 83.3% (54,458,305) 61.6% (33,693,272) -64.0% (93,587,119) 18.8% (78,795,459) 619.8% (10,947,006) -31.9%
Profit after tax 242,602,310 67.1% 145,196,357 103.6% 71,326,724 -49.1% 140,006,276 -24.7% 185,867,163 -70.9% 638,312,753 348.3%
Annual Report 202022

Vertical Analysis2020 2019 2018 2017 2016 2015
(Rupees) % (Rupees) % (Rupees) % (Rupees) % (Rupees) % (Rupees) %
STATEMENT OF FINANCIAL POSITION
Assets
Property & equipment 121,150,269 3.6% 129,993,035 4.2% 72,325,607 2.6% 65,669,519 2.4% 71,011,756 2.5% 54,540,036 2.1%
Intangible assets - 0.0% 9,741 0.0% 26,407 0.0% 472,587 0.0% 1,043,697 0.0% 1,657,863 0.1%
Investment in associates 49,959,574 1.5% 39,404,247 1.3% 45,144,162 1.6% 42,137,247 1.5% 38,284,477 1.3% 40,568,071 1.5%
Investments 1,678,815,338 49.3% 1,657,439,548 53.7% 1,359,046,751 48.0% 1,476,998,539 54.0% 1,972,178,482 68.6% 1,692,415,613 63.6%
Loan and other receivable 42,262,996 1.2% 37,416,224 1.2% 20,585,208 0.7% 238,537,198 8.7% 18,364,616 0.6% 11,615,106 0.4%
Insurance / reinsurance receivable 554,679,355 16.3% 500,355,096 16.2% 452,631,626 16.0% 426,728,740 15.6% 393,330,551 13.7% 412,791,828 15.5%
Reinsurance recoveries against outstanding claims 125,342,540 3.7% 97,581,839 3.2% 100,016,385 3.5% 74,912,821 2.7% 61,181,748 2.1% 60,249,843 2.3%
Salvage recoveries accrued 2,775,000 0.1% 4,005,000 0.1% 3,975,000 0.1% 2,426,000 0.1% 4,378,000 0.2% 2,420,000 0.1%
Deferred commission expense 25,643,610 0.8% 35,271,269 1.1% 33,060,770 1.2% 32,232,773 1.2% 30,829,820 1.1% 30,015,561 1.1%
Deferred taxation 34,941,495 1.0% 42,441,773 1.4% 53,228,969 1.9% 35,264,815 1.3% - 0.0% 9,520,206 0.4%
Prepayments 209,416,425 6.2% 185,447,129 6.0% 179,614,482 6.3% 170,714,966 6.2% 173,959,315 6.1% 156,734,791 5.9%
Taxation - provision less payments - 0.0% - 0.0% - 0.0% - 0.0% - 0.0% 14,378,136 0.5%
Cash and bank deposits 454,365,700 13.4% 267,024,544 8.7% 440,366,476 15.6% 116,781,242 4.3% 108,620,817 3.8% 173,451,416 6.5%
Total assets of Window Takaful Operation's - Operator's Fund 103,495,918 3.0% 89,831,932 2.9% 69,721,881 2.5% 52,755,690 1.9% - 0.0% - 0.0%
Total assets 3,402,848,220 100.0% 3,086,221,377 100.0% 2,829,743,724 100.0% 2,735,632,137 100.0% 2,873,183,279 100.0% 2,660,358,470 100.0%
Equity and Liabilities
Ordinary share capital 502,968,030 14.8% 502,968,030 16.3% 502,968,030 17.8% 502,968,030 18.4% 457,243,660 15.9% 457,243,660 17.2%
Share premium 254,024,260 7.5% 254,024,260 8.2% 254,024,260 9.0% 254,024,260 9.3% 254,024,260 8.8% 254,024,260 9.5%
Reserves 181,840,187 5.3% 124,545,934 4.0% 89,518,648 3.2% 81,818,834 3.0% 266,955,431 9.3% 119,000,000 4.5%
Unappropriated profit 1,110,233,075 32.6% 955,159,703 30.9% 873,893,357 30.9% 891,722,749 32.6% 879,048,427 30.6% 923,622,571 34.7%
Outstanding claims including IBNR 260,105,733 7.6% 206,337,532 6.7% 192,759,004 6.8% 165,560,979 6.1% 164,787,530 5.7% 157,298,790 5.9%
Unearned premium reserve 521,370,886 15.3% 494,320,532 16.0% 439,281,123 15.5% 383,008,819 14.0% 337,036,982 11.7% 388,001,402 14.6%
Unearned reinsurance commission 46,716,196 1.4% 40,139,097 1.3% 39,191,757 1.4% 38,529,301 1.4% 43,125,928 1.5% 40,664,654 1.5%
Deferred taxation - 0.0% - 0.0% - 0.0% - 0.0% 64,544,653 2.2% - 0.0%
Retirement benefit obligations 4,519,519 0.1% 5,141,096 0.2% 5,162,059 0.2% 5,171,457 0.2% 4,984,383 0.2% 3,758,322 0.1%
Premiums received in advance 1,891,673 0.1% 1,023,802 0.0% 573,295 0.0% 804,781 0.0% 202,327 0.0% 2,229,476 0.1%
Insurance / reinsurance payables 234,715,482 6.9% 243,253,439 7.9% 232,154,530 8.2% 225,151,644 8.2% 260,739,918 9.1% 199,147,518 7.5%
Other creditors and accruals 152,676,442 4.5% 188,481,027 6.1% 155,776,279 5.5% 135,345,022 4.9% 110,765,575 3.9% 115,367,817 4.3%
Taxation - provision less payments 96,880,283 2.8% 42,056,608 1.4% 29,269,328 1.0% 47,993,747 1.8% 29,724,205 1.0% - 0.0%
Total liabilities of Window Takaful Operation's - Operator's Fund 34,906,454 1.0% 28,770,317 0.9% 15,172,054 0.5% 3,532,514 0.1% - 0.0% - 0.0%
Total Equity and Liabilities 3,402,848,220 100.0% 3,086,221,377 100.0% 2,829,743,724 100.0% 2,735,632,137 100.0% 2,873,183,279 100.0% 2,660,358,470 100.0%
PROFIT AND LOSS ACCOUNT
Net insurance premium 846,099,290 100.0% 779,722,143 100.0% 690,289,955 100.0% 593,051,035 100.0% 659,250,573 100.0% 515,004,996 100.0%
Net insurance claims (360,165,103) -42.6% (362,676,565) -46.5% (288,198,657) -41.8% (246,956,137) -41.6% (390,450,380) -59.2% (299,836,085) -58.2%
Net commission and other acquisition costs 40,466,589 4.8% 12,925,559 1.7% 11,496,471 1.7% 23,239,805 3.9% 21,999,234 3.3% 25,101,232 4.9%
Management expenses (332,547,935) -39.3% (294,771,909) -37.8% (283,862,979) -41.1% (283,801,639) -47.9% (251,748,734) -38.2% (219,498,151) -42.6%
Investment income / (loss) 79,513,925 9.4% 27,995,256 3.6% (54,336,292) -7.9% 147,055,769 24.8% 223,483,200 33.9% 634,704,287 123.2%
Other income 63,515,340 7.5% 47,039,373 6.0% 28,462,180 4.1% 5,352,382 0.9% 8,251,759 1.3% 8,005,744 1.6%
Other expenses (11,102,156) -1.3% (9,779,320) -1.3% (10,466,253) -1.5% (8,598,215) -1.4% (8,457,481) -1.3% (8,359,377) -1.6%
Finance costs - Lease liabilities (6,240,748) -0.7% (6,095,558) -0.8% - 0.0% - 0.0% - 0.0% - 0.0%
Share of profit / (loss) of associates 12,408,460 1.5% 6,918,238 0.9% 4,212,621 0.6% 5,482,214 0.9% 2,334,451 0.4% (471,876) -0.1%
(Impairment) in value of investment in associates - 0.0% (11,079,350) -1.4% - 0.0% - 0.0% - 0.0% (5,334,047) -1.0%
Profit / (loss) from Window Takaful Operations 10,469,119 1.2% 9,456,795 1.2% 7,422,950 1.1% (1,231,819) -0.2% - 0.0% - 0.0%
Income tax expense (99,814,471) -11.8% (54,458,305) -7.0% (33,693,272) -4.9% (93,587,119) -15.8% (78,795,459) -12.0% (10,947,006) -2.1%
Profit after tax 242,602,310 28.7% 145,196,357 18.6% 71,326,724 10.3% 140,006,276 23.6% 185,867,163 28.2% 638,369,717 124.0%
Century Insurance 23
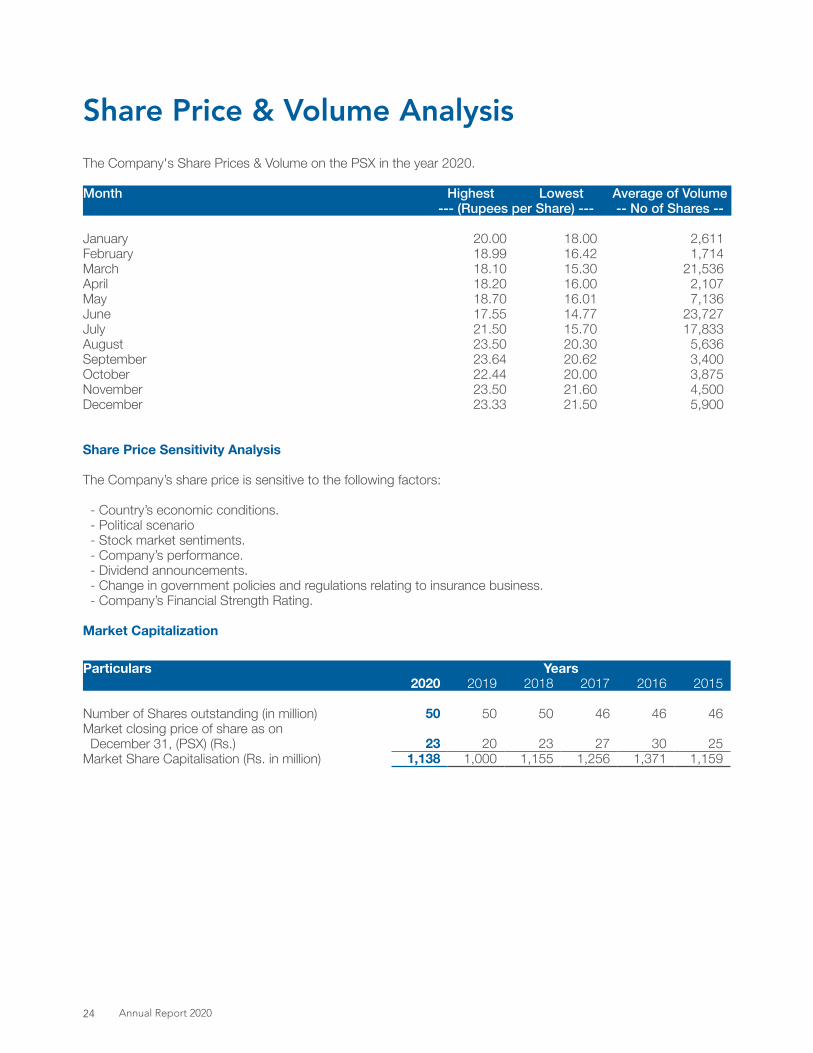
Share Price & Volume AnalysisThe Company's Share Prices & Volume on the PSX in the year 2020.
Month Highest Lowest Average of Volume --- (Rupees per Share) --- -- No of Shares --
January 20.00 18.00 2,611 February 18.99 16.42 1,714 March 18.10 15.30 21,536 April 18.20 16.00 2,107 May 18.70 16.01 7,136 June 17.55 14.77 23,727 July 21.50 15.70 17,833 August 23.50 20.30 5,636 September 23.64 20.62 3,400 October 22.44 20.00 3,875 November 23.50 21.60 4,500 December 23.33 21.50 5,900
Share Price Sensitivity Analysis
The Company’s share price is sensitive to the following factors:
- Country’s economic conditions.- Political scenario- Stock market sentiments.- Company’s performance.- Dividend announcements.- Change in government policies and regulations relating to insurance business.- Company’s Financial Strength Rating.
Market Capitalization
Particulars Years2020 2019 2018 2017 2016 2015
Number of Shares outstanding (in million) 50 50 50 46 46 46 Market closing price of share as on December 31, (PSX) (Rs.) 23 20 23 27 30 25 Market Share Capitalisation (Rs. in million) 1,138 1,000 1,155 1,256 1,371 1,159
Annual Report 202024
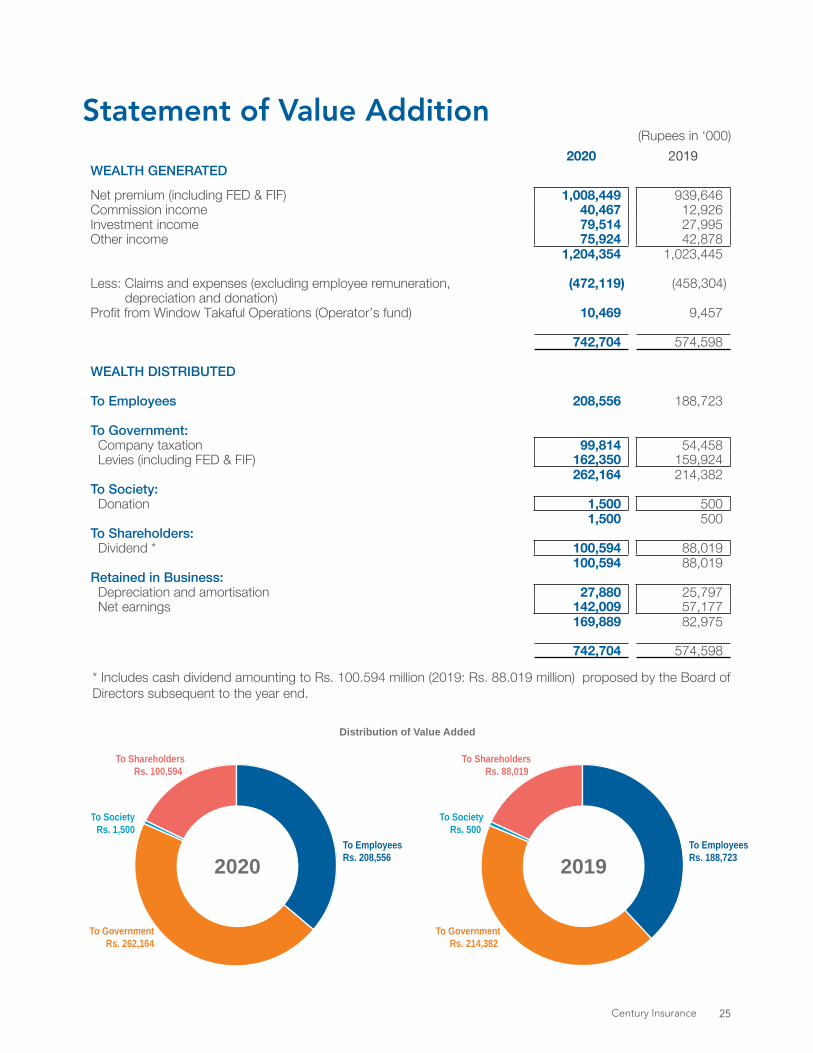
Statement of Value Addition2020 2019
WEALTH GENERATED
Net premium (including FED & FIF) 1,008,449 939,646Commission income 40,467 12,926 Investment income 79,514 27,995Other income 75,924 42,878
1,204,354 1,023,445
Less: Claims and expenses (excluding employee remuneration, (472,119) (458,304) depreciation and donation)Profit from Window Takaful Operations (Operator’s fund) 10,469 9,457
742,704 574,598
WEALTH DISTRIBUTED
To Employees 208,556 188,723
To Government:Company taxation 99,814 54,458Levies (including FED & FIF) 162,350 159,924
262,164 214,382To Society:
Donation 1,500 5001,500 500
To Shareholders:Dividend * 100,594 88,019
100,594 88,019 Retained in Business:
Depreciation and amortisation 27,880 25,797Net earnings 142,009 57,177
169,889 82,975
742,704 574,598
* Includes cash dividend amounting to Rs. 100.594 million (2019: Rs. 88.019 million) proposed by the Board of Directors subsequent to the year end.
(Rupees in ‘000)
Distribution of Value Added
To Employees Rs. 208,556
To GovernmentRs. 262,164
To Society Rs. 1,500
To ShareholdersRs. 100,594
2020To EmployeesRs. 188,723
To GovernmentRs. 214,382
To SocietyRs. 500
To ShareholdersRs. 88,019
2019
Century Insurance 25
Chairman’s Review
On behalf of the Board of Directors, it is my pleasure to present to you, the Annual Report and performance review of the Company for the year ended December 31, 2020.
Review of the EconomyThe IMF Extended Fund Facility program helped the economy stabilize during the first three quarters of FY20 and eased the transition to a market-based exchange rate system. However, the economy was hit hard in Q4-FY20 by the global emergence of the Covid-19 pandemic and the efforts to contain its spread. As a result, Pakistan’s GDP growth contracted by 0.4 percent in FY20 – the first year of negative economic growth since FY52. However, aggressive policy support to the manufacturing and service sectors as well as expansion of emergency cash payments to 12 million households coupled with an accommodating monetary policy of the State Bank of Pakistan helped the economy mitigate much of the negative impact of the pandemic. By the end of the first quarter of FY21, the country’s economy had started to regain its pre-Covid-19 trajectory.
According to the State Bank of Pakistan, the economy is on track to achieve the revised GDP growth target of 2.1 percent for FY21 set by the Ministry of Planning, Development and Special Initiatives. The industrial sector posted robust growth during Q1-FY21 as well as in the months of October and November 2020, especially in the petroleum, automobile, cement and steel industries. The services sector also performed well during this period, as evidenced by improvements in wholesale and retail trade as well as in transportation services, indicating a return to pre-Covid-19 levels. The agricultural sector, too, has performed well, despite a shortfall in cotton production due to decline in the area dedicated to cotton cultivation. The other Kharif crops such as rice, sugarcane and maize exceeded their production targets during Q1-FY21, thanks in part to the subsidies on fertilizer purchases as part of the government’s relief package for the agricultural sector.
The stabilization efforts of the government, including the introduction of a market-based exchange rate, were beginning to produce good result in terms of controlling the budget and current account deficits during the first eight months of FY20. Non-food and non-energy inflation were also under control and it appeared that the economy was well on the road to recovery. It was at this juncture that the impact of the Covid-19 pandemic and efforts to control its spread began to disrupt economic activity. The State Bank
of Pakistan responded quickly to this challenge by easing financial constraints on businesses through the introduction of concessional financing schemes to businesses that were committed to retaining their workers, introducing risk sharing mechanisms for SMEs and providing concessional credit to hospitals seeking to build facilities for the treatment of Covid-19 patients. By the end of FY20, over 1.3 million businesses had their principal payments deferred or restructured and roughly 2,784 businesses had received financing help to pay workers’ salaries. The Monetary Policy Committee (MPC) of the State Bank of Pakistan, leveraging the policy space created by a fall in inflation and a decline in international oil prices during the first eight months of FY20, cut interest rates by a cumulative 625 basis points over a three-month period. Inflation pressures further eased during Q2-FY21 as headline inflation decreased to 8.3 percent in November 2020 and still further to 8.0 percent in December 2020. In its September 2020 meeting and again in January 2021, the MPC decided to maintain the policy rate at 7 percent, thus continuing its accommodative stance to support the nascent recovery.
On the fiscal side, the country reported a primary (i.e. not including interest payments) balance surplus during the first nine months of FY20. The fiscal space created during this period enabled the government to aggressively extend support to businesses and households in Q4-FY20 to help them cope with the Covid-19 related lockdowns that resulted in mobility restrictions, supply-chain disruptions and an overall slowdown in economic activity. The government expanded the volume and outreach of its ongoing social uplift programs, enabling 12 million households to receive emergency cash transfers of up to Rs. 12,000 per family. By the end of Q1-FY21, fiscal indicators had resumed their pre-Covid-19 trajectory as tax collections improved with the resumption of economic activity and the primary balance turned into a surplus once again. The fiscal policy objective for FY21 is to strike a balance between containing the deficit and public debt while adequately providing for social protection and growth stimulus for the economy. The government has set an overall fiscal deficit target of 7 percent of GDP for FY21 as compared to the actual deficit of 8.1 percent last year.
On the external front, two concerns emerged during the initial Covid-19 period causing downward pressure on foreign exchange reserves; a fall in exports as international orders dried up and an outflow of capital from emerging market economies, including Pakistan. These concerns were mitigated
Annual Report 202026

by the following three factors: First, the market-based exchange rate acted as an effective shock absorber with the Pak Rupee depreciating 8.2 percent in an orderly fashion from March to June 2020. Second was a fall in international oil prices as well as a broad-based decline in imports. Third, there was a growth in workers’ remittances as inflows reached a record high in September 2020, exceeding US$ 2 billion for the fourth consecutive month. All of these factors resulted in the first quarterly current account surplus during Q1-FY21 in over five years, with the country’s FX reserves rising to US$ 19.4 billion by the end of September 2020.
The overall outlook for the economy remains mixed and much depends on the course taken by the Covid-19 pandemic and the availability and distribution of adequate and effective vaccines in Pakistan. After a surge in November and December 2020, new daily cases have begun to decline in January and February 2021. According to the projections of the State Bank of Pakistan, GDP growth during FY21 is projected to be between 1.5 and 2.5 percent with inflation estimated to come in at between 7.0 and 9.0 percent. The fiscal deficit for FY21 is projected to be between 6.5 and 7.5 percent of GDP while the current account deficit is projected to register between 0.5 and 1.5 percent of GDP.
Company Performance Highlights2020 has been a good year for Century Insurance Company Limited. All insurance classes of business showed growth and there was a marked increase in underwriting income. Investment & Other Income also increased as compared to last year on account of a prudent balance between equity and fixed income investments.
The comparative financial highlights for the years 2020 and 2019 are presented as follows:
Rs. In Millions (except as otherwise stated)
Description 2020 2019Increase / (Decrease)
Amount %Gross Written Premium (including Takaful Contribution) 1,477 1,389 88 6
Net Premium 846 780 66 8
Underwriting results 194 135 59 44
Investment & other income 155 71 84 118
Profit from Window Takaful Operations 10 9 1 11
Profit before tax 342 200 142 71
Profit after tax 243 145 98 68
Earnings per share (Rs. per share) 4.82 2.89 1.93 67
Total assets 3,403 3,086 317 10
Paid-up capital 503 503 - -
Total equity 2,049 1,837 212 12
During the year under review, gross premium (including Takaful Contribution) increased by 6% from Rs. 1,389.3 million in 2019 to Rs. 1,477.4 million in 2020. Net premium increased by 8% from Rs. 779.7 million last year to Rs. 846.1 million in 2020 whereas net claims decreased by 1% from Rs. 362.7 million last year to Rs. 360.2 million in 2020. The Underwriting result increased by 44% from Rs. 135.2 million in 2019 to Rs. 194 million in 2020.
Window Takaful OperationsThe overall Takaful performance was satisfactory.
Participant Takaful Fund (PTF) The Gross Written Contribution for FY2020 was Rs. 106.2 million as compared to Rs. 74.7 million last year. Net contribution revenue (including wakala expense) was Rs. 25.5 million as compared to Rs. 24.0 million last year and surplus for FY2020 was Rs. 4.4 million as compared to Rs. 9.2 million in the previous year.
Operator’s Fund (OPF)Gross Wakala Fee for FY2020 was Rs. 40.9 million whereas Net Wakala Fee was Rs. 34.6 million. Profit before tax was Rs. 10.5 million.
Century Insurance 27

Segments at a GlanceAll classes of business produced satisfactory results as given below:
Fire & Property DamageFire & Property Damage class of business accounted for 30% of the total premium portfolio. Gross premium underwritten (including Takaful contribution) during the year was Rs. 437.4 million as compared to Rs. 421.9 million in 2019, an increase of 4%. Net premium stood at Rs. 55.4 million as against Rs. 51.7 million in 2019, an increase of 7%. Net claim to net premium ratio for the year under review was 20%.
Marine, Aviation and TransportMarine, Aviation & Transport class of business accounted for 19% of the total premium portfolio. Gross premium underwritten (including Takaful contribution) during the year was Rs. 283.8 million as compared to Rs. 245.8 million in 2019, an increase of 15%. Net premium stood at Rs. 172.9 million as against Rs. 159.2 million in 2019, an increase of 9%. The net claim to net premium ratio for the year under review was 11%.
MotorMotor class of business accounted for 28% of the total premium portfolio. Gross premium underwritten (including Takaful contribution) during the year was Rs. 409.0 million as compared to Rs. 367.2 million in 2019, an increase of 11%. Net premium stood at Rs. 305.5 million as against Rs. 311.2 million in 2019, a decrease of 2%. The net claim to net premium ratio for the year under review was 32%.
Accident and HealthAccident and Health class of business accounted for 19% of the total premium portfolio. Gross premium underwritten (including Takaful contribution) during the year was Rs. 279.5 million as compared to Rs. 285.1 million in 2019, a decrease of 2%. Net premium stood at Rs. 293.7 million as against Rs. 243.3 million in 2019, an increase of 21%. The net claim to net premium ratio for the year under review was 74%.
MiscellaneousMiscellaneous class of business accounted for 5% of the total premium portfolio. Gross premium underwritten (including Takaful contribution) during the year was Rs. 67.8 million as compared to Rs. 69.2 million in 2019, a decrease of 2%. Net premium stood at Rs. 18.7 million as against Rs. 14.3 million in 2019, an increase of 31%. The net claim to net premium ratio for the year under review was 78%.
Investment & Other IncomeThe overall Investment and Other Income for the year under review was Rs. 155.4 million as against Rs. 70.9 million in 2019, an increase of 118%.
The realized gain from sale of shares, mutual funds and debt securities was Rs. 0.9 million, dividend income from shares was Rs. 13.5 million and returns earned on government & fixed income securities was Rs. 92.0 million. Other income, including interest on bank deposits was Rs. 63.5 million.
Management’s policy is to make diversified and secure investments while ensuring safety and a sound balance between risk and return.
Claim SettlementPrompt settlement of claims and customer satisfaction is the company’s highest priority as it helps build the trust of its valued clients and earns their goodwill.
Board Performance EvaluationFor the Financial year ended December 31, 2020, the Board’s overall performance and effectiveness has been assessed as satisfactory. Improvements are an ongoing process leading to action plans. The overall assessment is based on an evaluation of integral components, including vision, mission and value; engagement in Strategic planning; formulation of policies; monitoring the organization’s business activities; monitoring financial resource management; effective fiscal oversight; equitable treatment of all employees and efficiency in carrying out the Board’s responsibility.
ReinsuranceThe company has strong reinsurance arrangements with some of the best and most highly rated reinsurers in the international market who have full faith and confidence in its underwriting practices. We are thankful to all our reinsurers for their unwavering support and continued cooperation.
Insurer Financial Strength Rating (IFSR)VIS Credit Rating Company Limited (formerly JCR-VIS Credit Rating Company) has maintained the company’s rating to ‘AA-’ with a ‘Stable’ outlook, signifying very high capacity to meet contractual obligations.
Human Resource InitiativesThe management is of the firm belief that complete alignment of the human resource strategy with overall corporate goals is vital for the success and growth of any organization. In today’s competitive environment,
Annual Report 202028

we realize that it is important to place emphasis on recruiting new talent while retaining and developing existing staff and implementing effective performance reviews. During the year under review, your company has been successful in hiring quality professionals particularly in the area of business development. Our continued focus on creating a meritocratic work environment with equal opportunity for all and a clear career path go a long way in maintaining a pool of knowledgeable, experienced and motivated employees who remain our most valuable asset.
COVID – 19The pandemic outbreak Covid-19 globally poses lots of new challenges and learning especially in the corporate world. The company has formed a steering committee which was responsible to prepare a comprehensive plan, taking all relevant measures and SOPs for the safety and health of employees and to ensure uninterrupted services to clients. Majority of employees were operating from home during the lockdown period. Employees were required to keep the committee updated on a regular basis on their health and safety. The also committee ensures that all SOPs are followed through in true spirit by all employees.
AcknowledgmentsOn behalf of the directors of the company, I wish to place on record our appreciation of the efforts of all the employees of the company in enabling its growth and success. We are also grateful to our clients for their patronage, to the Securities & Exchange Commission of Pakistan (SECP) for its guidance as regulator of the Insurance Industry and to our Shareholders for their trust and confidence in the company.
Iqbal Ali Lakhani Chairman
Karachi: February 26, 2021
Note: To read urdu translation of the above Chairman’s review please refer page 30 to 33
Century Insurance 29
ی ئ
ادا� یم کل�
�ی ونکہ کی ہے ی ج
ر�ت
� ن اولی کی ادارے ان ن اطمی کا صارف اور ی
ئادا� فوری کی ر کل�یم�ن
ہے۔ ا ت د�ی مدد می کرنے حاصل خوشنودی کی ان اور اعتماد کا ن ین
صار�
رہ ن ئ
جا� کا کارکردگی بورڈ اور رکردگی کا مجموعی کی بورڈ لی کے 2020ء 31دسمبر راے �ج سال مالی ہے عمل والا رہنے جاری مستقل ا�ی ۔بہتری ہے �پائی رار
ت� بخش ان
ن اطمی ت افاد�یضروری رہ
ن ئجا� اہے۔مجموعی جا�ت ا بنا�ی ممکن کو وں بند�ی منصوبہ عملی سے مدد کی جس
اور ی�ن الع� ،نصب ش اند�ی دور می جن ہے منحصر پر رے
ن ئجا� انفرادی ءکے را ن ا�ج
جاری می کمپنی ، یش ت
� کی ر ی�ن یس� ،�پال� کردار می بنانے کے عملی ،حکمت اقدار نگرانی رملی
شمو� کی، انتظام کے وسائل اتی مالی ، نگرانی کی وں سرگرمی ی جار کارو�
بورڈ اور سلوک منصفانہ ساتھ کے ن ملازمی می کرنے پورا جارکو کارو� کے ،بورڈ ہے۔ امل
ش� ا کر�ن کو وں دار�ی ذمہ کی
انشورنس ری ری والے رکھنے ساکھ عمدہ می ٹ مارکی الاقوامی ن ی �ج اور ن بہتر�ی چند کمپنی کاری یمہ ج� � جنکا ۔ ہے رکھتی انتظامات انشورنس ری مضبوط ساتھ کے انشوررز تمام پر تعاون مسلسل اور مدد مستقل ہے۔ہم اعتماد اور ن ی
ت�ی مکمل پر عمل کے
۔ ی �ہ گزار شکر کے انشوررز ری
)IFSR( ن ٹ ر�ی ھ ت ن�
ی� اسٹر� فائنانشل انشورر کمپنی( ن ٹ ر�ی ڈٹ ٹ کر�ی JCR-VIS )سابقہ ڈ
ٹ ٹ لمی ن
ج یا� ن ٹ ر�ی ڈٹ ٹ کر�ی VIS
استحکام' می جس ، ہے رکھا رار ت
ر� �ج کو “-AA” پر بندی درجہ کی ادارے نے گنجائش ن بہتر�ی کی کرنے پورا کو وں دار�ی ذمہ اپنی تحت کے معاہدے جو ہے،
ہے۔ ا کر�ت ر ظا�ہ کو
منصوبے کے وسائل رادی ن
ا�اہداف مجموعی کے ادارے بھی کسی کہ ہے رکھتی کامل ن ی
ت�ی انتظامی کی ادارے
ہم مکمل سے عملی حکمت کی وسائل رادی ن
ا� لی کے حصول سے ابی کامی کے عملے موجودہ کہ ی سمجھتے�ہ ہم می ماحول مسابقتی کے آج ہے۔ ضروری آہنگی ہے۔ اہم ا کر�ن
شی �پ رے
ن ئجا� ر
شمؤ� کے کارکردگی و رقی
ت� اور رکھنا رار
تر� �ج کو
می شعبے کے ولپمنٹ ڈ�ی رنس ن �ج جالخصوص � نے ادارے کے آپ می سال مذکورہ
کا کام مبنی پر ی�ت ہل� ا� توجہ مسلسل اری �ہ ا۔ کی حاصل سے ابی کامی کو ن ر�ی ما�ہ اری معیاور ہوں مواقع اں �ی لی کے سج جہاں کہ ہے مرکوز پر کرنے یق نل�
�ت �
ماحول ر
ئ ر�ی کی لی کے رکھنے رار ت
ر� �ج کو مجموعے کے ن ملازمی ر ما�ہ اور کار تجربہ رک، ز�ی۔ ی �ہ اثہ ا�ش قدر قا�ج سے سج ارا �ہ وہ ونکہ کی ہو راستہ واضح کا
)COVID-19( 19-کووڈ می ا ی
ند� ٹ کارپور�ی پر طور خاص نے مرض جاءکے و� کی کووڈ-19 پر سطح عالمی
ا�ی نے کمپنی ہے۔ بنا جاعش � کا کےموقع ے ن یکھ� س� اور ر
نج� �
ی�ن یل� � �پنئے شمار بے
کی ن ملازمی ، کرنے ار یت
� منصوبہ جامع ا�ی ،جو ہے دی ی ش ت
� ٹ کمی ر�ن
ئ ی ٹاس
اور ارکرنے یت ن
ا� نر ی �پ او ا�ی اور اقدامات متعلقہ تمام لئے کے صحت اور حفاظت ڈاؤن لاک ہے۔ دار ذمہ لئے کے بنانے
نی
ت �ی کو ڈمات ن
� تعطل بلا کو کلائنٹ اپنی کو ن ملازمی تھے۔ رہے کر کام سے گھر ن ملازمی ر
ت� ادہ ز�ی می ی
ندورا� کے
رکھنے ٹ ڈ�ی اپ کو ٹ کمی پر ادوں ی
ن�ج مستقل می جارے � کے حفاظت اور صحت
نر ی �پ او ا�ی مکمل ن ملازمی تمام کہ ہے بناتی ن
یت �ی بھی �ی
ٹ کمی تھی۔ ت ھدا�ی کی ۔ کر�ی عمل ساتھ کے روح
ت یت
ح کی پراس
اعتراف کی ن ملازمی تمام لی کے بنانے ممکن کو ابی کامی اور رقی
ت� کی ادارے می
اپنے ہم ہوں۔ چاہتا سراہنا سے ج ن
جا� کی رز ٹ ر�ی
ئڈا� کمپنی ی
نا� پر کوششوں
سے ت یش حی کی ر ٹ ولی ر�ی می ڈسٹری ٹ ن
ا� انشورنس کلائنٹس، تمام پر رہنے انہ ش �ج انہ ش
�کمپنی اور )SECP( �پاکستان آف ن ش کمی ج ن پی ی ا� ڈ
ٹ ن ا�ی نر یٹ
ی�ور� سک� پر کرنے رہنمائی ۔ ی �ہ شکرگزار بھی کے ہولڈرز ر
ئ یش
� اپنے پر کرنے اعتماد و بھروسہ پر
لاکھانی علی اقبال ن رمی
ئ ی �پ
2021ء روری ن
� 26 کراچی:
Annual Report 202030
می 2019ء حصہ( تکافل )بشمول م ئ ی� یم� �
پر مجموعی می سال کے رے ن ئ
جا�ڈ ی
ن� 6 جو ہوا، روپے ن 1,477.4ملی کر ٹرھ �ج سے روپے ن 1,389.3ملیمی مقابلے کے روپے ن ملی 779.7 می ء 2019 م
ئ ی� یم� �پر خالص ہے۔ اضافہ
2020ءمی ر کل�یم�ن خالص ا۔ گی ہو روپے ن 846.1ملی ساتھ کے اضافے ڈ ین
� 8جو ہوۓ، کم �ت روپے ن ملی 360.2 می مقابلے کے روپے ن ملی 362.7ڈ ی
ن� 44 ج ی
ت ن� رائٹنگ ڈر ٹ ن
ا� ڈ۔ ین
� 1 ی ن یع� � ہے کمی کی روپے ن 2.5ملی کہ
194 می مقابلے کے روپے ن ملی 135.2 کے 2019ء ساتھ کے بہتری پہنچا۔ �ت روپے ن ملی
ن ش آپر�ی تکافل ڈو ٹ نو�
تھی۔ بخش ان ن اطمی کافی کارکردگی تکافل مجموعی
)PTF( فنڈ تکافل �ٹ ن پ� یس� ٹ� �پار�
می سال گزشتہ داری حصہ شدہ ر تحر�ی مجموعی لی کے سال2020ء مالی حصہ خالص تھی۔ روپے ن ملی 106.2 می مقابلے کے روپے ن 74.7ملیمقابلے کے روپے ن ملی 24.0 سال گزشتہ ) ی
ن� وکالہ )بعداز آمدنی داری
می سال گزشتہ لی کے سال2020ء مالی اور روپےتھی ن ملی 25.5 میتھا۔ روپے ن ملی 4.4 می مقابلے کے ن ملی 9.2 سرپلس
)OPF( فنڈ رز ٹ آپر�ی
وکالہ خالص اور روپے ن ملی 40.9 ی ن
� وکالہ کل لی کے 2020ء سال مالی تھا۔ روپے ن ملی 10.5 ی
ٹ� از قبل منافع تھی۔ روپے ن ملی 34.6 ی
ن�
نظر ا�ی پر جات شعبہ ہے۔ ذ�ی مندرجہ جوکہ کی
شی �پ کارکردگی ن بہتر�ی نے شعبوں تمام کے جار کارو�
پراپرٹی راور ئ
فا� نقصان/ کو املاک اور زنی آتش 30 کا و فولی پورٹ م
ئ ی� یم� �پر کل شعبہ کا نقصان کے املاک اور زنی آتش
کے 2019ء حصہ( تکافل )بشمول م ئ ی� یم� �
پر یمہ ج� �
ک می بھر سال رہا۔ ڈ ین
�ڈ ی
ن� 4 جو ، رہا روپے ن ملی 437.4 می مقابلے کے روپے ن ملی 421.9می مقابلے کے روپے ن ملی کے51.7 2019ء م
ئ ی� یم� �پر خالص ہے۔ اضافہ
لی کے سال کے رے ن ئ
جا� رہا۔ روپے ن ملی ساتھ55.4 کے اضافے ڈ ین
� 7تھا۔ ڈ ی
ن� 20 تناسج کا یم کل� خالص پر م
ئ ی� یم� �پر خالص
حمل و نقل اور جازی � ہوا بحری، 19 و فولی پورٹ م
ئ ی� یم� �پر کل کے شعبے جاری کارو� حمل و نقل اور جازی بحری،ہوا�
245.8 کے 2019ء حصہ( تکافل )بشمول م ئ ی� یم� �
پر یمہ ج� �
ک رہا۔ حصہ ڈ ین
� 15 ی
ن یع� � تھا، روپے ن ملی 283.8 می بھر سال می مقابلے کے روپے ن ملیمقابلے کے روپے ن ملی 159.2 کے 2019ء م
ئ ی� یم� �پر خالص اضافہ۔ ڈ ی
ن�
کے سال کے رے ن ئ
جا� ہے۔ اضافہ ڈ ین
� جو 9 رہا روپے ن ملی 172.9 می تھا۔ ڈ ی
ن� 11 تناسج کا یم کل� خالص پر م
ئ ی� یم� �پر خالص لی
موٹر یمہ ج� � کل ہے۔ ڈ ی
ن� 28 کا و فولی پورٹ م
ئ ی� یم� �پر کل شعبہ کا جار کارو� موٹر
مقابلے کے روپے ن ملی 367.2 کے 2019ء حصہ( تکافل )بشمول م ئ ی� یم� �
پرخالص ہے۔ اضافہ ڈ ی
ن� جو11 رہا، روپے ن ملی 409.0 می بھر سال می
مقابلے کے روپے ن ملی 311.2 کے 2019ء ساتھ کے کمی ڈ ین
� 2 م ئ ی� یم� �
پرخالص پر م
ئ ی� یم� �پر خالص می سال کے رے
ن ئجا� رہا۔ روپے ن ملی 305.5 می
تھا۔ ڈ ین
� تناسج 32 کا یم کل�
صحت اور ات حاد�شمشتمل پر ڈ ی
ن� 19 کے و فولی پورٹ م
ئ ی� یم� �پر کل شعبہ صحت و ات حاد�ش کا جار کارو�
ن ملی 279.5 می بھر سال حصہ( تکافل )بشمول م ئ ی� یم� �
پر یمہ ج� � کل ہے۔
ند�ی کمی ڈ ی
ن� ی 2
ن یع� � تھا روپے ن ملی 285.1 می 2019 ء جو رہا روپے می مقابلے کے روپے ن ملی 243.3 کے 2019ء م
ئ ی� یم� �پر خالص ملی۔ کو
می سال کے رے ن ئ
جا� ہے۔ اضافہ ڈ ین
� 21 ی ن یع� � رہا روپے ن 293.7ملی
تھا۔ ڈ ین
� 74 تناسج یم کل� خالص پر م ئ ی� یم� �
پر خالص
متفرق سال ہے۔ مشتمل پر ڈ ی
ن� 5 کے و فولی پورٹ م
ئ ی� یم� �پر کل حصہ متفرق کا جار کارو�
روپے ن ملی 69.2 می 2019 حصہ( تکافل )بشمول م ئ ی� یم� �
پر یمہ ج� � کل می بھر م
ئ ی� یم� �پر خالص تھا۔ روپے ن ملی ساتھ67.8 کے کمی ڈ ی
ن� 2 می مقابلے کے
مقابلے کے روپے ن ملی 14.3 کے 2019ء ساتھ کے اضافے ڈ ین
� 31خاص پر م
ئ ی� یم� �پر خالص لی کے سال کے رے
ن ئجا� رہا۔ روپے ن ملی 18.7 می
تھا۔ ڈ ین
� 78 تناسج یم کل�
آمدنی ر د�ی و کاری سرما�ی
155.4 می آمدنی ر د�ی اور کاری سرما�ی پر طور مجموعی لئے کے سال غور ر ز�یتھا۔جو روپےرہا ن ملی 70.9 می 2019ء ۔جبکہ ہواتھا منافع کا روپے ن ملی
ہے۔ اضافہ کا ڈ ین
� 118 کہ
سے حصص تھا، روپے ن ملی نفع0.9 سے ت نرو�
ن� کی فنڈز وچوئل می اور حصص
نر یٹ
ی�ور� سک� انکم شدہ طے و سرکاری اور تھی روپے ن ملی 13.5 آمدنی ڈ ٹ ن �ی ڈ ٹ و�ی ڈ�ی
ن ی �ج بشمول اں، ین
آمد� ر د�ی تھی۔ روپے ن ملی 92.0 آمدنی کردہ حاصل پر ۔ ی ر�ہ روپے ن ملی 63.5 سود، پر ڈ�پازٹس
توازن مستحکم اور محفوظ می جات منافع اور خطرات کہ ہے �پالی کی انتظامی - ی
ئجا� کی س
ٹ �ٹم�ن یس� �
انو محفوظ اور متنوع ہوئے بناتے ن
یت �ی
Century Insurance 31
�پانچ می ماہی سہ پہلی کی 2021ء سال مالی ج یت ن
� مجموعی کا عوامل تمام ان ۔ یئ
آ� زر ات رسیت
� کی ڈالرز امر�ی ارب 2 ے ن مہ�ی� چوتھے مسلسل می 2020ء ستمبر
ر ئ
ذخا� کے مبادلہ زر کے ملک �ت اختتام کے 2020ء ستمبر سے جس نکلا، می صورت کی جانے می سرپلس کے ٹ ناکاؤ� ٹ ن
کر� ماہی سہ جار � پہلی می سالوں پہنچے۔ جا �ت ڈالرز ارب 19.4
ڈا ی �پ می ج ی
ت ن� کے ی
ت ت� اور ابی ی
تدس کی ی�ن یکس� و� ر
شمؤ� اور مناسج می �پاکستان اور جا و� کی کووڈ-19 انحصار کا اس اور ہے ا �ج ملا بھی اب امہ منظر�ن معاشی مجموعی
کمی می تعداد کی ر یس�ن ک� نئے پر اد ین
�ج کی روزانہ می 2021ء روری ن
� اور جنوری بعد کے اضافے می 2020ء دسمبر اور نومبر ہے۔ پر حال صورت والی ہونے ڈ ی
ن� 9.0 سے 7.0 زر راط
نا� جبکہ ڈ ی
ن� 2.5 سے 1.5 نمو پی ڈی جی دوران کے 2021ء سال مالی مطابق کے اندازوں کے �پاکستان دولت ن ی �ج ہے۔ آئی
کے ڈ ین
� 1.5 سے 0.5 کے پی ڈی جی خسارہ ٹ ناکاؤ� ٹ ن
کر� جبکہ گا رہے ڈ ین
� 7.5 سے 6.5 کے پی ڈی جی خسارہ مالی لی کے 2021ء سال مالی ہوگی۔ ہے۔ متوقع ا ہو�ن ان درمی
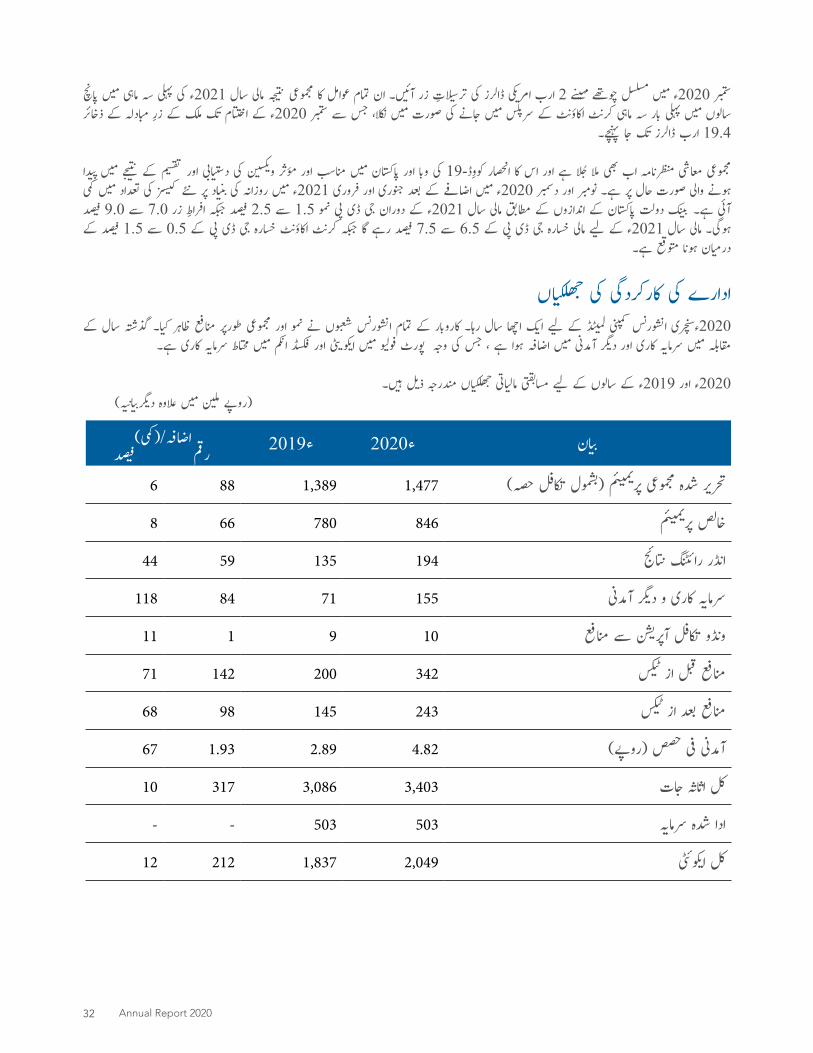
ی�اں جھلک� � کی کارکردگی کی ادارے کے سال گذشتہ ا۔ کی ر ظا�ہ منافع طورپر مجموعی اور نمو نے شعبوں انشورنس تمام کے جار کارو� رہا۔ سال اچھا ا�ی لی کے ڈ
ٹ ٹ لمی کمپنی انشورنس 2020ءسنچری ہے۔ کاری سرما�ی محتاط می انکم فکسڈ اور
ٹ و�ی ا�ی می و فولی پورٹ وجہ کی جس ، ہے ہوا اضافہ می آمدنی ر د�ی اور کاری سرما�ی می مقابلہ
۔ ی �ہ ذ�ی مندرجہ ی�اں جھلک� � اتی مالی مسابقتی لی کے سالوں کے 2019ء اور 2020ء ) ی ا�ن ی ر�ج د�ی علاوہ می ن ملی )روپے
ان ی اضافہ/)کمی(ء2019ء2020�جڈرقم ی
ن�
حصہ( تکافل )بشمول م ئ ی� یم� �
پر مجموعی شدہ ر 1,4771,389886 تحر�ی
مئ ی� یم� �
پر 846780668 خالص
نتائج رائٹنگ ڈر ٹ ن1941355944 ا�
آمدنی ر د�ی و کاری 1557184118 سرما�ی
منافع سے ن ش آپر�ی تکافل ڈو ٹ ن109111 و�
یٹ
� از قبل 34220014271 منافع
یٹ
� از بعد 2431459868منافع
)روپے( حصص فی 4.822.891.9367 آمدنی
جات اثہ ا�ش 3,4033,08631710 کل
سرما�ی شدہ --503503 ادا
وئٹی ا�ی 2,0491,83721212 کل
Annual Report 202032
رہن ئ
جا� کا ن رمیئ ی �پ
کی رز ٹ ر�ی
ئڈا� آف بورڈ لی کے سال والے ہونے ختم کو 2020ء دسمبر 31
رے می ا کر�ن ش
ی �پ رہ ن ئ
جا� کا کارکردگی کی ادارے اور رپورٹ سالانہ سے ج ن
جا�ہے۔ جاعش � کا خوشی لی
رہ ن ئ
جا� کا ت ش معین ی
ت� پہلی کی 2020ء سال مالی نے پروگرام ی
ٹ یسل� ف� فنڈ ڈڈ ٹ
��ی�ن
ٹ یکس� ا� ن ا�ی ا�ی آئی
اد ین
�ج کی ٹ مارکی اور دی مدد می کرنے مستحکم کو ت ش معی دوران کے وں ی ما�ہ سہ کی 2020ء سال مالی اہم �ت کی۔ راہم
ن� آسانی می کرنے ار ی
ت نا� تبادلہ شرح پر
کرنے محدود اسے اور ابھرنے کے جا و� عالمی کی کووڈ19- می ماہی سہ چوتھی مالی ت�ا ج� ی� ت�
ن� � ہوئی۔ ر ش
متا� طرح ری �ج ت ش معی سے کوششوں والی جانے کی لی کے ڈ ی
ن� 0.4 منفی پی( ڈی )جی ڈاوار ی �پ مقامی
ک کی �پاکستان می 2020ء سال
نمو معاشی می جس کہ تھا سال پہلا بعد کے 1952ء سال مالی �ی – ہوئی مدد کو شعبے کے سروسز اور پ�ر�ن یک� وف�
ن می نے �پالی جارحانہ البتہ گئی۔ می منفی ن ی �ج اور امداد مالی نقد ہنگامی کی گھرانوں ن ملی 12 ساتھ ساتھ کے کرنے راہم
ن�
می گھٹانے رات ش
ا� منفی کے جا و� کو ت ش معی نے �پالی اتی مالی کی �پاکستان دولت کی ملک �ت خاتمے کے ماہی سہ پہلی کی 2021ء سال مالی وں �ی دی۔ مدد گئی۔ ہو رن
نگام ج
نجا� کی حالات کے قبل سے کووڈ-19 پھر مرتبہ ا�ی ت ش معی
پی ڈی جی لی کے 2021ء سال مالی ت ش معی مطابق کے �پاکستان دولت ن ی �جہے، رن
نگام پر راہ کی کرنے حاصل ہدف شدہ انی نظر�ش کا نمو کی ڈ ی
ن� 2.1 می
تھا۔ ا کی مقرر نے جات منصوبہ خصوصی اور ات یت
ر�ت
� بندی، منصوبہ وزارت جو کے ء نومبر2020 اور ر اکتو�ج علاوہ کے ماہی سہ پہلی کی 2021ء سال مالی ، پٹرولی پر طور خاص ہے، کی ر ظا�ہ نمو ردست ز�ج نے شعبے صنعتی می �وں
ن مہ�ی�اس بھی نے شعبے کے سروسز نے۔ صنعت کی فولاد اور �ٹ
ن یم� س� جائل، آٹومو�کے تجارت خوردہ اور تھوک جو ہے، کی
شی �پ کارکردگی ن بہتر�ی می عرصے
سے جن ہے، آئی نظر می صورت کی بہتری می سروسز ن ش ٹرانسپور�ی علاوہ شعبے زرعی ہے۔ رہا مل ارہ
شا� کا واپسی ج
نجا� کی حالات کے پہلے سے کووڈ-19
می ڈاوار ی �پ کی کپاس سے وجہ کی ہونے کم علاقے ڈاواری ی �پ مخصوص بھی نے 2021ء سال مالی ہے۔ دکھائی کارکردگی اچھی جاوجود � کے کمی ر
ت� تمام والی آنے
بھی نے مکئی اور ا ن
گ چاول، مثلا فصلوں ر د�ی کی ن ر�ی
ن� می ماہی سہ پہلی کی
کی ڈی ٹ
جس� س� والی ملنے پر ڈاری ر�ین
� کی کھاد تحت کے �ج یک�ی پ� �یف یل� ر� کے حکومت
۔ کی پورے اہداف اپنے بدولت
معاشی می �وں ن مہ�ی� 8 ابتدائی کے 2020ء سال مالی سے ج
نجا� کی حکومت
بہتر لی کے کرنے قابو کو خساروں ٹ ناکاؤ� ٹ ن
کر� اور بجٹ ی ش ش
کو� کی استحکام بھی تبادلہ شرح پر اد ی
ن�ج کی ٹ مارکی می جن تھا، آغاز کا کرنے حاصل نتائج
تو ی� یکھ� �د کر ٹ �ہ سے شعبے کے ائی توا�ن اور نوش و خورد ائے ی
شا� ہے۔ امل
ش�
رن ن
گام ج ن
جا� کی بحالی ت ش معی کہ تھا لگتا ا ا�ی اور رہا می قابو بھی زر راط ن
ا�کوششوں کی کرنے قابو اسے اور گئی آ جا و� کی کووڈ-19 پر موقع اس ی�ن ع� ہے۔
ت رعا�ی نے �پاکستان دولت ن ی �ج ا۔ کی ر ش
متا� طرح ری �ج کو وں سرگرمی معاشی نے خواہاں کے رکھنے رار
تر� �ج کو کارکنوں اپنے کر کروا متعارف ی� یم� سک�
ا اتی مالیردعمل فوری پر ج
نی پ
� اس کے کر کم کو جاؤ د� مالی موجود پر اداروں جاری کارو�
رسک لی کے اداروں کے درجے انے درمی اور چھوٹے علاوہ کے اس ا، دکھا�یلی کے علاج کے وں
ن مر�ی کے کووڈ-19 اور کروائے متعارف رم ن ن
ا� می ر�ن ئ ی
ش�
مالی ا۔ کی راہم ن
� ڈٹ ٹ کر�ی ت رعا�ی لی کے ہسپتالوں خواہشمند کے بنانے ج�ات ص�ی�
ن ت� �ا �ی ر
شمؤ� ی�اں یگ� �
ئ ادا� کی اداروں جاری کارو� لاکھ 13 �ت اختتام کے 2020ء سال کو اداروں جاری کارو� 2,784 جا تقر�ی اور ی
ت� چکی جا کی طے سے سرے نئے
کی �پاکستان دولت ن ی �ج ملی۔ مدد مالی لی کے کرنے ادا ی تنخوا�ہ کی ن ملازمی2020ء سال مالی اور کمی می زر راط
نا� نے سی( پی )ا�ی
ٹ کمی �پالی ری ٹ ی
نما�
ڈا ی �پ سے گراوٹ می �وں ت یم� ق� الاقوامی ن ی �ج کی ی
ت� می �وں
ن مہ�ی� آٹھ ابتدائی کے طور مجموعی می سود شرح می �وں
ن مہ�ی� ن یت
� اور ا اٹھا�ی فائدہ کا خلا والے ہونے کی 2021ء سال مالی جاؤ د� کا زر راط
نا� کی۔ کمی کی پوائنٹس یسس ج� � 625 پر
زر راط ن
ا� ٹڈلائن ی �ہ می 2020ء نومبر اور ہوا ہلکا ڈ ر�ین
م می ماہی سہ دوسری ستمبر اپنے ڈ۔ ی
ن� 8.0 ڈ ر�ی
نم می 2020ء دسمبر اور ہوا کم ڈ ی
ن� 8.3
پی ا�ی پھر، مرتبہ ا�ی می 2021ء جنوری اور ، می اجلاس کے 2020ء ہوئی ٹرھتی �ج وں �ی ا، کی ی
ن� کا رکھنے رار
تر� �ج پر ڈ ی
ن� 7 کو ٹ ر�ی �پالی نے سی
رکھا۔ جاری کو رو�ی مددگار اپنا لی کے ن
د�ی سہارا کو بحالی
نے ملک دوران کے �وں ن مہ�ی� نو ابتدائی کے 2020ء سال مالی سے لحاظ مالی
اس ا۔ کی رپورٹ سرپلس می س ن
یل� ج� � ) ین
� امل ش
� ی ئ
ادا� کی سود ی ن یع� �( پرائمری
مالی وہ کہ ا بنا�ی ممکن لی کے ملک نے گنجائش مالی والی ہونے ڈا ی �پ می عرصے ٹرھ �ج کی گھرانوں اور اداروں جاری کارو� می ماہی سہ چوتھی کی 2020ء سال ہونے ڈا ی �پ ت�ا ج� ی� ت�
ن� � اور رات ش
ا� کے ڈاؤن لاک کووڈ-19 اکہ �ت کرے مدد کر ٹرھ �پوں سرگرمی معاشی اور رکاوٹ می ن ی �پ سپلائی �پابندی، پر حرکت و نقل والی بہبود سماجی اپنے نے حکومت ملے۔ مدد می نمٹنے سے روی سس�ت مجموعی می گھرانوں ن ملی 12 ٹرھائی، �ج بھی رسائی �ت ان اور حجم کا پروگراموں جاری کے 2021ء سال مالی �پائی۔ امداد نقد ہنگامی کی روپے 12,000 خاندان فی نے کے پہلے سے کووڈ-19 ار�ی
شا� اتی مالی تمام �ت اختتام کے ماہی سہ پہلی کی
سرگرمی معاشی می �ن ش یکس کل� ی
ٹ� ونکہ کی آئے نظر کرتے رخ کا بحالی کی حالات
آ می سرپلس پھر مرتبہ ا�ی س ن
یل� ج� � پرائمری اور آئی بہتری سے ہونے بحال سرکاری اور خسارے ہدف کا �پالی اتی مالی لی کے 2021ء سال مالی ا۔ گیکو ت ش معی اور تحفظ سماجی جبکہ ہے ا کر�ن قائم توازن ا�ی ان درمی کے رضوں
ت�
لی کے 2021ء سال مالی نے حکومت ہے۔ ا کر�ن متحر�ی کےلی ٹرھنے �ج آگے سال پچھلے جبکہ ہے رکھا کر طے ہدف کا خسارے مالی ڈ ی
ن� 7 کے پی ڈی جی
تھا۔ ڈ ین
� 8.1 خسارہ ت ی
تح
وجہ کی جن ابھرے ات ش
ڈ�ن
� دو پر محاذ رونی ی �ج می دنوں ابتدائی کے کووڈ-19 ا�ی ہوا؛ ڈا ی �پ رحجان کا زوال می ر
ئذخا� کے مبادلہ زر ملکی ر ی
ن� ارے �ہ سے
�پاکستان دوسرا اور آئی کمی می رآمدات �ج سے ہونے ختم آرڈرز الاقوامی ن ی �جکی ان ا۔ ہو�ن منتقل ملک رون ی �ج کا سرمائے سے وں
ٹ مارکی ہوئی ابھرتی ر د�ی ت سمیشرح پر اد ی
ن�ج کی ٹ مارکی اول، ہوئی: کم سے وجہ کی عوامل ذ�ی مندرجہ شدت
جون سے مارچ می جس ہوئی، ت ا�ج �ش ر نرار�ج ج ا�ی اک ش
� ر ش
مؤ� ا�ی راہمی ن
� کی تبادلہ دوم، آئی۔ کمی کی ڈ ی
ن� 8.2 می شرح کی روپے �پاکستانی دوران کے 2020ء
کمی پر انے ی �پ ٹرے �ج می درآمدات ساتھ ساتھ اور �وں ت یم� ق� الاقوامی ن ی �ج کی ی
ت�
ن�ا۔ ج� ی� جھ� �زر ات رسی
ت� ارڈ ر�ی سے ج
نجا� کی کارکنوں یم مق� ملک رون ی �ج سوم، ا۔ ہو�ن
Century Insurance 33
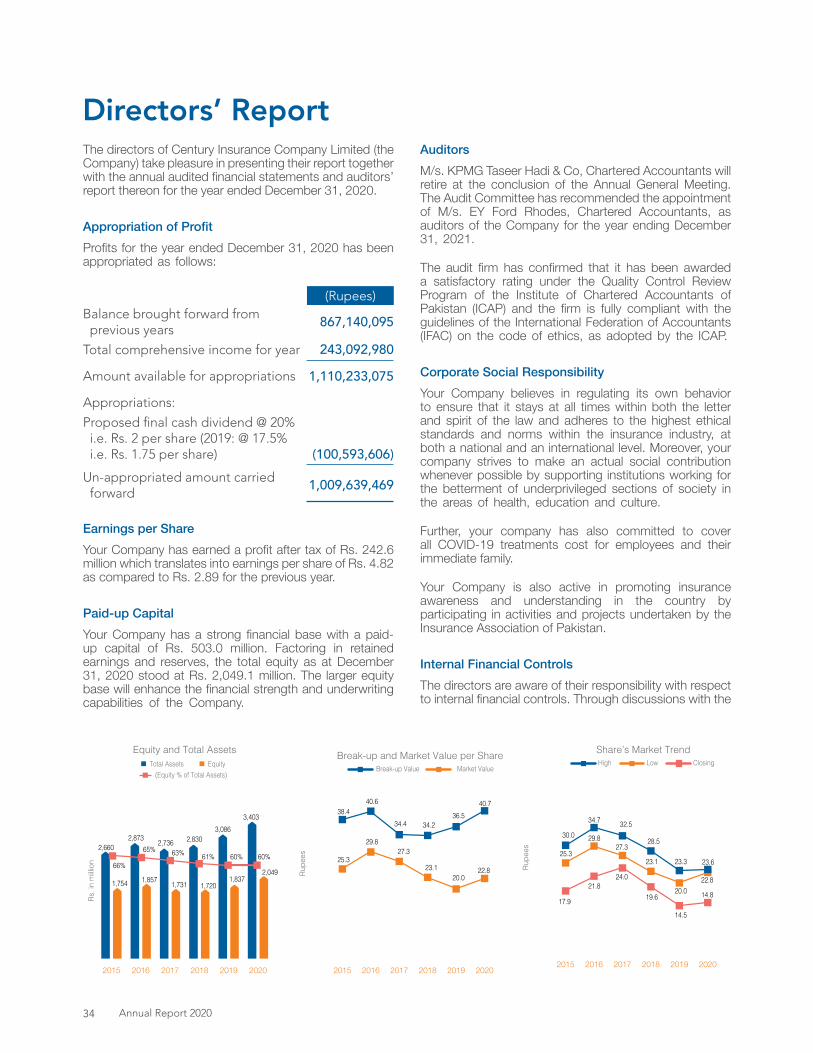
Directors’ ReportThe directors of Century Insurance Company Limited (the Company) take pleasure in presenting their report together with the annual audited financial statements and auditors’ report thereon for the year ended December 31, 2020.
Appropriation of ProfitProfits for the year ended December 31, 2020 has been appropriated as follows:
(Rupees)Balance brought forward from previous years
867,140,095
Total comprehensive income for year 243,092,980Amount available for appropriations 1,110,233,075Appropriations:
Proposed final cash dividend @ 20% i.e. Rs. 2 per share (2019: @ 17.5% i.e. Rs. 1.75 per share) (100,593,606)Un-appropriated amount carried forward
1,009,639,469
Earnings per Share Your Company has earned a profit after tax of Rs. 242.6 million which translates into earnings per share of Rs. 4.82 as compared to Rs. 2.89 for the previous year.
Paid-up Capital Your Company has a strong financial base with a paid-up capital of Rs. 503.0 million. Factoring in retained earnings and reserves, the total equity as at December 31, 2020 stood at Rs. 2,049.1 million. The larger equity base will enhance the financial strength and underwriting capabilities of the Company.
AuditorsM/s. KPMG Taseer Hadi & Co, Chartered Accountants will retire at the conclusion of the Annual General Meeting. The Audit Committee has recommended the appointment of M/s. EY Ford Rhodes, Chartered Accountants, as auditors of the Company for the year ending December 31, 2021.
The audit firm has confirmed that it has been awarded a satisfactory rating under the Quality Control Review Program of the Institute of Chartered Accountants of Pakistan (ICAP) and the firm is fully compliant with the guidelines of the International Federation of Accountants (IFAC) on the code of ethics, as adopted by the ICAP.
Corporate Social Responsibility Your Company believes in regulating its own behavior to ensure that it stays at all times within both the letter and spirit of the law and adheres to the highest ethical standards and norms within the insurance industry, at both a national and an international level. Moreover, your company strives to make an actual social contribution whenever possible by supporting institutions working for the betterment of underprivileged sections of society in the areas of health, education and culture.
Further, your company has also committed to cover all COVID-19 treatments cost for employees and their immediate family.
Your Company is also active in promoting insurance awareness and understanding in the country by participating in activities and projects undertaken by the Insurance Association of Pakistan.
Internal Financial Controls The directors are aware of their responsibility with respect to internal financial controls. Through discussions with the
202020192018201720162015
1,754 1,857 1,731
2,736 2,8303,086
1,7201,837
2,660
66%
65% 63% 61% 60% 60%
Equity and Total AssetsTotal Assets Equity
(Equity % of Total Assets)
2,873
Rs. i
n m
illion
3,403
2,049 Rupe
es
Break-up and Market Value per ShareMarket ValueBreak-up Value
202020192018201720162015
25.3
29.827.3
23.120.0
38.440.6
34.4 34.236.5
40.7
22.8 Rupe
es
Share’s Market TrendHigh Low Closing
202020192018201720162015
17.9
21.824.0
19.6
14.5
25.3
29.827.3
23.1
20.0
34.7 32.5
28.5
23.3
30.0
23.6
14.8
22.8
Annual Report 202034

management and auditors (both internal and external), they confirm that adequate controls have been implemented by the Company.
Contribution to National Exchequer Your Company contributed an amount of Rs. 286.3 million into the Government Treasury on account of taxes, levies and federal excise duty.
Principle Risks and UncertaintiesThe Company is exposed to certain risks and uncertainties. However, we consider the following as key areas of consideration:
• Political and economic uncertainties
• New channels of distribution
• Advancement in information technology
• Underwriting and credit risk
• Equity market and inherent rate risk
• Liquidity and cash flow risk
The Company works with internal and external entities to address the above.
Compliance with the Code of Corporate GovernanceThe Statement of Compliance with the Code of Corporate Governance is annexed with the report.
Composition of the BoardThe board consists of 6 male directors and 1 female director with following composition:
Independent Directors 2Non-executive Directors 4Executive Director 1Total number of Directors 7
Remuneration Policy of DirectorsThe fee of the Non-Executive and Independent Directors for attending the Board and Committee meetings of the Company is determined by the Board from time to time.
Board of Directors’ MeetingsFive board meetings were held during the year. The number of meetings attended by each Director is given hereunder:
Name of DirectorsNo. of
Meetings Attended
Mr. Iqbal Ali Lakhani (Chairman) 5
Mr. Amin Mohammed Lakhani 4
Ms. Anushka Lakhani 3
Mr. Tasleemuddin Ahmed Batlay (up to May 29, 2020) 2
Mr. Muhammad Hussain Hirji (Chief Executive) 5
Mr. Aftab Ahmad 5
Mr. Sadrudin Ismail Mohamed 5
Mr. Akber Dawood Vazir (from May 29, 2020) 3
Leave of absence was granted to directors who could not attend some of the Board meetings.
Chief Executive Officer (CEO) Performance ReviewThe Board of Directors has appointed the Mr. Muhammad Hussain Hirji as Chief Executive Officer for tenure of three years. The Ethics, Human Resource & Remuneration Committee of the Board sets operational, financial and strategic objectives to evaluate his performance and review and monitor it on an annual basis.
Board CommitteesDuring the year, four (04) meetings each of the Board Audit Committee and Investment Committee were held and one (01) meeting was held of Ethics, Human Resource & Remuneration Committee. The names of the members of the board committees and their terms of reference are given in the annexure to this report. The Chairman of the board Audit Committee and Ethics, Human Resource & Remuneration Committee is an independent director.
Management CommitteesThe Company has three management committees, which cover the core areas of business. The Committees’ names, number of meetings, names of members and terms of references are given in the annexure to this report.
Code of ConductThe Board has adopted a code of conduct for all employees, who have in turn been informed of this code. All employees understand that they are required to observe these rules of conduct at all times.
Statement of Directors’ ResponsibilitiesThe Directors are pleased to state that the Company is compliant with the financial reporting framework of the Code of Corporate Governance as required by the Securities & Exchange Commission of Pakistan (SECP).
Century Insurance 35
Following are the statements on Corporate and Financial Reporting Framework:
• The financial statements together with the notes thereon have been drawn up by the management in conformity with the Insurance Ordinance, 2000 and Companies Act, 2017. These Statements present fairly the Company’s state of affairs, the results of its operations, cash flow and changes in equity.
• Proper books of accounts have been maintained by the Company.
• Appropriate accounting policies have been consistently applied in the preparation of financial statements except those as disclosed in the financial statements. Accounting estimates are based on reasonable and prudent judgment.
• The International Accounting Standards, International Financial Reporting Standards and any other regulation or law as applicable in Pakistan, have been followed in the preparation of these financial statements.
• The system of internal control is sound in design. The system is being continuously monitored by an internal audit function and through other such monitoring procedures. The process of monitoring internal controls will continue as an ongoing process with the objective to further strengthen the controls and bring in improvements in the system.
• There are no doubts upon the Company’s ability to continue as a going concern.
• There has been no departure from the best practices of corporate governance.
• The key operating and financial data for the last six years is annexed.
• Information about taxes and levies is given in the notes to and forming part of financial statements.
• In accordance with the criteria specified in clause 19 of the Listed Companies (Code of Corporate Governance) Regulation, 2019, majority of Directors attended Director training program and the remaining Directors are exempted. The Board arranged an orientation course for its Directors during the year to apprise them of their duties and responsibilities and briefed the Directors regarding amendments in the Corporate Laws.
• The value of investments in respect of retirement benefit funds based on their respective accounts as on December 31, 2020 are as follows:
Provident Fund: Rs. 62.3 millionGratuity Fund: Rs. 50.7 million
Pattern of ShareholdingA statement showing pattern of shareholding of the Company and additional information as at December 31, 2020 is annexed with the report.
The Board has determined the threshold under clause xvi (I) of CCG-2012 in respect of trading of Company’s shares by executives and employees at an annual basic salary of Rs. 1 million or above.
There have been no transactions carried out by the Directors, Chief Executive, CFO, Company Secretary and/or their spouses and minor children in the shares of the Company during the year.
Subsequent EventsNo material changes and commitments effecting the financial position of the Company have occurred between the end of the financial year and the date of this report.
Future OutlookWe are optimistic about the future outlook of Century Insurance Company Limited. We aim to grow in terms of premium income and also in terms of market share. We will look to develop a full range of insurance products to cater to the commercial and retail segments and also develop micro-insurance and digital/internet based products.
Your company will continue to grow and train its field force, especially with respect to serving the corporate sector. Moreover, it will focus on developing new channels of digital distribution so as to effectively penetrate the retail and micro-insurance markets. It will also explore coordinating with banks and other entities to develop new and cost-effective distribution channels.
Your Company will monitor the equity markets so as to take advantage of attractive market returns but will always stress on research to maintain stability, diversification and security of the investment portfolio.
Mr. Iqbal Ali Lakhani Mr. Muhammad Hussain HirjiChairman Director & Chief Executive
Karachi: February 26, 2021
Note: To read urdu translation of the above Directors’ Report review please refer page 37 to 40
Annual Report 202036
امہ منظر�ن کا مستقبل جارے � کے امے منظر�ن کے مستقبل کے ڈ
ٹ ٹ لمی کمپنی انشورنس سنچری ادارہ کا آپ سے اعتبار کے ر
ئ یش
� ٹ مارکی علاوہ کے آمدنی م ئ ی� یم� �
پر ہدف ارا �ہ ہے۔ ڈ رامی �پ می ات ضرور�ی کی شعبوں ی
ٹ ر�ی اور کمرشل نظر�ی اری �ہ ہے۔ ٹرھنا �ج آگے بھی گی ہوں پر کرنے ار ی
ت� ج
ن یر� مکمل کی مصنوعات انشورنس لی کے کرنے پوری
مصنوعات رو-انشورنس یئ
ما� لی کے طبقات والے آمدنی کم کے معاشرے اور گے۔ کر�ی ار ی
ت� بھی
رکھے جاری اضافہ می وں ت
صلاحی اور ت ی ر�جت
� کی فورس ٹڈ ین
� اپنی ادارہ کا آپ اری �ہ رآں، �ج ڈ ر�ی
نم سے۔ حوالے کے ڈمات
ن� کی شعبے ٹ کارپور�ی جالخصوص � گا،
رو یئ
ما� اور ی ٹ ر�ی اکہ �ت ہوگی پر کرنے ار ی
ت� ل
�ی�ن �پ نئے کے ی ت ت
� ل ٹ ج�ی� � �ی
ڈ توجہ ی
ت ت� ر
شمؤ� اور نئے ہم ۔ سکی ہو داخل می انداز ر
شمؤ� می وں
ٹ مارکی انشورنس بھی کر مل ساتھ کے اداروں ر د�ی اور وں
ن ی �ج لی کے اری یت
� کی ل�وں �ی�ن �پ کاری گے۔ کر�ی تلاش ات امکا�ن
منافع ٹ مارکی پرکشش اکہ �ت کرےگا بھی نگرانی کی وں ٹ مارکی وئٹی ا�ی ادارہ کا آپ
لئے کے رکھنے رار ت
ر� �ج کو تنوع اور استحکام کی و فولی پورٹ ن لی سکی اٹھا فائدہ کا ۔
نزورد�ی پر یق �ق�
ت �
لاکھانی علی اقبال جناب ن رمی
ئ ی �پرجی ی �ہ ن محمدحسی جناب
وٹ ر�ی
ن ا�ی ن ی �پ و ر
ٹ ر�یئ
ڈا�
ء 2021 روری ن
� 26 کراچی:
Century Insurance 37

ا لی رہ ن ئ
جا� کا اس پر اد ین
�ج سالانہ کہ ا �ت ہے ا کی ی�ن ع�ت
� کا صد مقا مبنی پر عملی حکمت جاسکے۔ ا کی ر
ٹ ین
ما� اسے اور جاسکے
اں یٹ کمی بورڈ
دی اور )04( کے ٹ کمی انوسٹمنٹ اور
ٹ کمی آڈٹ بورڈ دوران کے سال ہوئے۔ منعقد اجلاس )01( کے
ٹ کمی ن ش ونر�ی ر�ی ڈ ٹ ن ا�ی ورس ر�ی ومن ی �ہ ھکس،
ت ی� �ا
م�یمے �ن کے رپورٹ رنس
نر�ی آف ر
نٹرم کے ان اور ام �ن کے ن اراکی کے
ٹ کمی بورڈ کے وں ی
ٹ کمی ن ش ونر�ی ر�ی ڈ ٹ ن ا�ی ورس ر�ی ومن ی �ہ اور آڈٹ بورڈ ۔ ی �ہ گئے د�ی می
۔ ی �ہ ر ٹ ر�ی
ئڈا� ٹ ن �ی ٹڈ ن پ �ی ڈ ٹ ن
ا� ا�ی ن رمیئ ی �پ
اں یٹ کمی
کرتی احاطہ کا شعبوں ری ن
مرک کے جار کارو� جو ہے ا ت
رکھ اں یٹ کمی انتظامی ن ی
ت� ادارہ
آف ر ن
ٹرم اور ام �ن کے ن اراکی تعداد، کی اجلاسوں ام، �ن کے وں یٹ کمی ان ۔ ی �ہ
۔ ی �ہ گئے د�ی می م�یمے �ن کے رپورٹ اس رنس
نر�ی
اخلاق ضابطہ جن کہ ہے رکھا کر ار ی
ت نا� اخلاق ضابطہ ا�ی لی کے ن ملازمی تمام نے بورڈ
ہمہ ی ن
ا� کہ ہے سمجھنا کا ن ملازمی تمام ہے۔ ا جا�ت رکھا مطلع سے ضابطے اس کو ہے۔ ضرورت کی کرنے روی ی �پ کی اخلاق ضابطہ اس ت ت
و�
ان ی �ج کا وں دار�ی ذمہ کی ر ٹ ر�ی
ئڈا�
�پاکستان آف ن ش کمی ڈ ٹ ن ا�ی نر ی
ٹور� سی ادارہ کہ ی �ہ کرتے ان ی �ج بخوشی رز
ٹ ر�یئ
ڈا�اتی مالی کے ضابطے کے گورننس ٹ کارپور�ی مطابق کے تقاضوں کے )SECP(
ہے۔ ا کر�ت روی ی �پ کی ڈھانچے رپورٹنگ
: ی �ہ ذ�ی مندرجہ ات ا�ن ی �ج پر ڈھانچے رپورٹنگ اتی مالی اور ٹ کارپور�ی
ن آرڈ�ی انشورنس ی
شحا� کے انتظامی موجود پر ان اور گوشوارے اتی مالی
گوشوارے �ی ۔ ی �ہ مطابق کے 2017ء ٹ ا�ی ر ی�ن � پ�ن کم�اور 2000ء
وئٹی ا�ی اور فلو ش کی نتائج، کے وں سرگرمی ، ی�ت یف� ک� کی امور کے ادارے
۔ ی �ہ کرتے عکاسی منصفانہ کی تبد�ی می
ہے۔ ا ت
رکھ رار ت
ر� �ج می انداز مناسج کھاتے اکاؤنٹس اپنے ادارہ
وں ی �پالی موزوں کی اکاؤنٹنگ می اری یت
� کی گوشواروں اتی مالی نے ادارے اس اور اظہارہے گوشواروںمی اتی مالی کا کےجن ان سوائے کی روی ی �پ کی
۔ ی �ہ مبنی پر اندازوں محتاط اور معقول اندازے اکاؤنٹنگ کے
اکاؤنٹنگ الاقوامی ن ی �ج لاگو می �پاکستان می اری یت
� کی گوشواروں اتی مالی ان کی /قانون �ن
ش یس ول� ر�ی ر د�ی اور ارات معی کے رپورٹنگ الاقوامی ن ی �ج ،ہے۔ گئی کی روی ی �پ
عمل آڈٹ انٹرنل ہے۔ مستحکم می ت نسا� اپنی نظام کا کنٹرول انٹرنل
نگرانی مستقل کی نظام اس ذر�ی کے کار ہائے ت
طر�ی ر د�ی کے نگرانی اور طور کے عمل مسلسل ا�ی عمل کا نگرانی کی کنٹرولز انٹرنل ہے۔ جاتی کی می نظام اور ا کر�ن مستحکم ڈ ر�ی
نم کو کنٹرولز مقصد کا جس کہ گا رہے جاری پر
ہے۔ ا لا�ن اں بہتر�ی
و شکوک کوئی می جارے � کے ت صلاحی کی رہنے دواں رواں ادارےکو ۔ ی �ہ ی
ن� شبہات
ن بہتر�ی کی گورننس ٹ کارپور�ی موجود سے یل فص�ت
� می ضوابط کے گ �ن
ٹ لس�گئی۔ کی ی
ن� تہی پہلو کوئی سے ات روا�ی
ہے۔ امنسلک ٹ ڈ�ی اتی مالی و جاری کارو� اہم کا سال چھ گزشتہ
اتی مالی اور ہے گئی دی می وں یش
حا� معلومات کی محصولات اور ی ٹ
�ہے۔ حصہ بھی کا گوشواروں
طےشدہ می )19( شق کی 2019، �نش یس ول� (ر�ی CCG( ر ی�ن � پ�ن کم�
ڈٹ
ٹ� لس�ن ن
ٹر�ی رز ٹ ر�ی
ئڈا� ت اکثر�ی کی رز
ٹ ر�یئ
ڈا� کے ادارے مطابق کے ارات معیی �ہ ی
ن ش� � اسےمس�ت رز ٹ ر�ی
ئڈا� جاقی � کے ادارے اور ی �ہ چکے کر مکمل پروگرام
کرنے آگاہ سے رائض ن
� اور وں دار�ی ذمہ اپنی کو رز ٹ ر�ی
ئڈا� اپنے نے ۔بورڈ
ٹ کارپور�ی ی ن
ا� اور ا کی انتظام کا کورس آگہی ا�ی سال اس لی کے ا۔ کی آگاہ سے رامی
ت� می ن ی
نقوا�
سرما�ی کی ان می فنڈز یف�ٹ �ن
� ج�ی � رمنٹ ئ
ا� ٹ ر�ی سے حساب کے کھاتوں اپنے ہے: وں �ی کچھ کو 2020ء دسمبر 31 قدر کی کاری
روپے ن ملی 62.3 فنڈ: ٹ نڈ� ٹ پروو�ی
روپے ن ملی 50.7 فنڈ: ٹ و�ی ج گر�ی
نمونہ کا ہولڈ�ن ر ئ ی
ش�
معلومات اضافی اور نمونے کے ہولڈ�ن ر ئ ی
ش� مطابق کے 2020ء دسمبر 31
ہے۔ منسلک ساتھ کے رپورٹ گوشوارہ ا�ی والا کرنے اندہی ش ن� کی
ادہ ز�ی سے اس ا �ی روپے لاکھ 10 سالانہ جو پر ن ملازمی اور و ٹ ر�ی
ن ا�ی ا�ی نے بورڈ حد کی ت ن
رو�ن
� و ڈ ر�ین
� کی رز ئ ی
ش� کے ادارے ، ی �ہ رہے کر وصول تنخواہ ادی ی
ن�ج
ہے۔ رکھی کر مقرر
ات حی شر�ی کے ان ا اور/�ی ری ٹ ر�ی سی کمپنی ،CFO و،
ٹ ر�ین ا�ی
ن ی �پ رز، ٹ ر�ی
ئڈا�
کی حصص کے ادارے دوران کے سال اس سے ج ن
جا� کی بچوں چھوٹے اور ا۔ گی ا کی ی
ن� ن د�ی ن لی کوئی می صورت
واقعات ہوئے رونما ازاں بعد اہم ا�ی کوئی دوران کے
ن یار� �ت کی رپورٹ اس اور اختتام کے سال اتی مالی
رانداز ش
ا� پر حالت اتی مالی کی ادارے جو ہوئے ی ن
� معاہدات اور اں ی تبد�ی۔ ہوسکی
Annual Report 202038
والے کرنے کام لئے کے بہتری کی معاشرے پسماندہ می شعبوں کے ثقافت ا کر�ت ڈوجہد �ج کی داری حصہ سماجی
ت یت
ح ہو ممکن بھی ج �ج کے کر مدد کی اداروں ہے۔
لئے کے خانہ اہل ج ر�یت
� کے ان اور ن ملازمی نے کمپنی کی آپ ، ساتھ اسکے ہے۔ ا کی عہد کا کرنے پورا کو راجات
نکےا� علاج کے 19 ڈ ٹ کوو�ی
می منصوبوں اور وں سرگرمی کی �پاکستان آف ن ش ا�ی وسی ا�ی انشورنس ادارہ کا آپ ہے۔ ا کر�ت اجاگر فہم اور شعور سے حوالے کے انشورنس کر لے حصہ
کنٹرول اتی مالی اندورنی واقف بخوبی سے داری ذمہ اپنی می سلسلے کنٹرول اتی مالی اندورنی رز
ٹ ر�یئ
ڈا�کے ت ی حپ جات � ساتھ (کے دونوں رنل
ٹ ا�ی اور رز)انٹرنل ٹ آڈ�ی اور امی
ت ۔ا�ن ی �ہمناسج سے طرف کی کمپنی کہ ی �ہ کرتے
تتصد�ی کی جات � اس ،وہ زر�ی
۔ ی گئے�ہ کی افذ �ن کنٹرول
داری حصہ می رانے ن ن� قومی
رانےمی ن ن� سرکاری می مد کی وٹی ڈ�ی ر
ن ئا� ا�ی ٹڈرل ی
ن� اور ر
ن و�ی لی ، یٹ
� ادارہ کا آپ ہے۔ چکا کر ادا روپے ن ملی 286.3
صورتحال ن
یت ر�ی ی
ن� اور خطرات ادی ی
ن�ج
ہم ، اہم �ت ہے۔ سامنا کا صورتحال ن
یت �ی ر ی
ن� اور رسک ٹ ن
ر� ی �ہ ان کچھ کو کمپنی : ی �ہ کرتے غور پر طور کے صورتحال
نی
ت �ی ر ین
� کو ذ�ی مندرجہ
صورتحال ن
یت �ی ر ی
ن� معاشی اور اسی �ی
ر ن
ل� �ی�ن �پ نئے کے ی ت ت
�
رقی ت
� می الوجی ن ی ٹ� ن ش انفارمی
رسک ڈٹ ٹ کر�ی اور ڈرورائٹنگ ٹ نا�
خطرہ کا ٹ ر�ی ٹ نر� ی
نا� اور ٹ مارکی
ٹ و�ی ا�ی
فلو ش کی اور
ٹ ڈ�ی ٹ یک�و�ی ل�
مل ساتھ کے اداروں رونی ی �ج اور اندرونی کمپنی لئے کے کرنے حل کو جالا � مذکورہ ہے۔ کرتی کام کر
یل عم�ت
� کی ضابطے کے گورننس ٹ کارپور�یمنسلک ساتھ کے رپورٹ گوشوارہ کا یل عم�
ت� کی ضابطے کے گورننس ٹ کارپور�ی
ہے۔
یش ت
� کی بورڈ ہے: مشتمل پر خاتون 1 اور 6حضرات ساتھ کے ی
ش ت� ذ�ی درج بورڈ
رٹ ر�ی
ئڈا� مختار 2خود
رزٹ ر�ی
ئی�وڈا� ٹ� یک� ر�
ن ا�ی ان �ن ر 4د�یر
ٹ ر�یئ
ی�وڈا� ٹ� یک� ر�ن 1ا�ی
تعداد مجموعی کی رز ٹ ر�ی
ئ� 7ڈا
لی �پا کی معاوضہ لئے کے رز ٹ ر�ی
ئڈا� ی�و ٹ� یک� ر�
ن ا�ی ان �نرز
ٹ ر�یئ
ڈا� ی�و ٹ� یک� ر�ن ا�ی ان �ن لئے کے شرکت می ر
نگ� �ن
ٹ � م�ی ٹ کمی اور بورڈ کے ادارہ
ا جا�ت ا کی فوقتا وقتا سے طرف کی بورڈ ی�ن ع�ت
� کا مشاھرے کے رز ٹ ر�ی
ئمختارڈا� خود
ہے۔
اجلاس کے رز ٹ ر�ی
ئڈا� آف بورڈ
اجلاسوں کی ر ٹ ر�ی
ئڈا� ر �ہ ہوئے۔ اجلاس )05( �پانچ کے بورڈ دوران کے سال
رہی: وں �ی کچھ حاضری می
ام �ن کے رز ٹ ر�ی
ئکردہ ڈا� شرکت
تعداد کی اجلاسوں ) ن رمی
ئ ی )�پ لاکھانی علی اقبال 5 جناب لاکھانی محمد ن امی 4 جناب
لاکھانی انوشکا 3 محترمہ )2020 مئی 29( جاٹلے � احمد ن الد�ی ی
ت� 2جناب
و(ٹ ر�ی
ن ا�ی ن ی )�پ رجی ی �ہ ن محمدحسی 5 جناب
احمد آفتاب 5جناب محمد یل اسمع� ن صدرالد�ی 5 جناب
سے( 2020 مئی ر)29 وز�ی ڈی اکبر 3جناب
رحاضری ین
� کی ان کرسکے ی ن
� شرکت می کےچنداجلاسوں بورڈ رزجو ٹ ر�ی
ئڈا�
۔ئ
گ کی منظور
رہن ئ
جا� کا کارکردگی کی ر ین
آ� و ٹ ر�ی
ن ا�ی ن ی �پ
و ٹ ر�ی
ن ا�ی ن ی �پ لی کے مدت سالہ ن ی
تکو� رجی ی �ہ ن محمدحسی نے ر
ٹ ر�یئ
ڈا� آف بورڈ ن ش ر�ی ی
نی�و� یم� ر� ڈ
ٹ ن ا�ی ورس ر�ی ومن ی �ہ ھکس، ت ی� �
ا کی ہے۔بورڈ کی تقرری کی ر ین
آ�اور اتی مالی عملی، لی کے جانچنے کو کارکردگی کی ر ی
نآ� و
ٹ ر�ین ا�ی
ن ی �پ نے ٹ کمی
Century Insurance 39
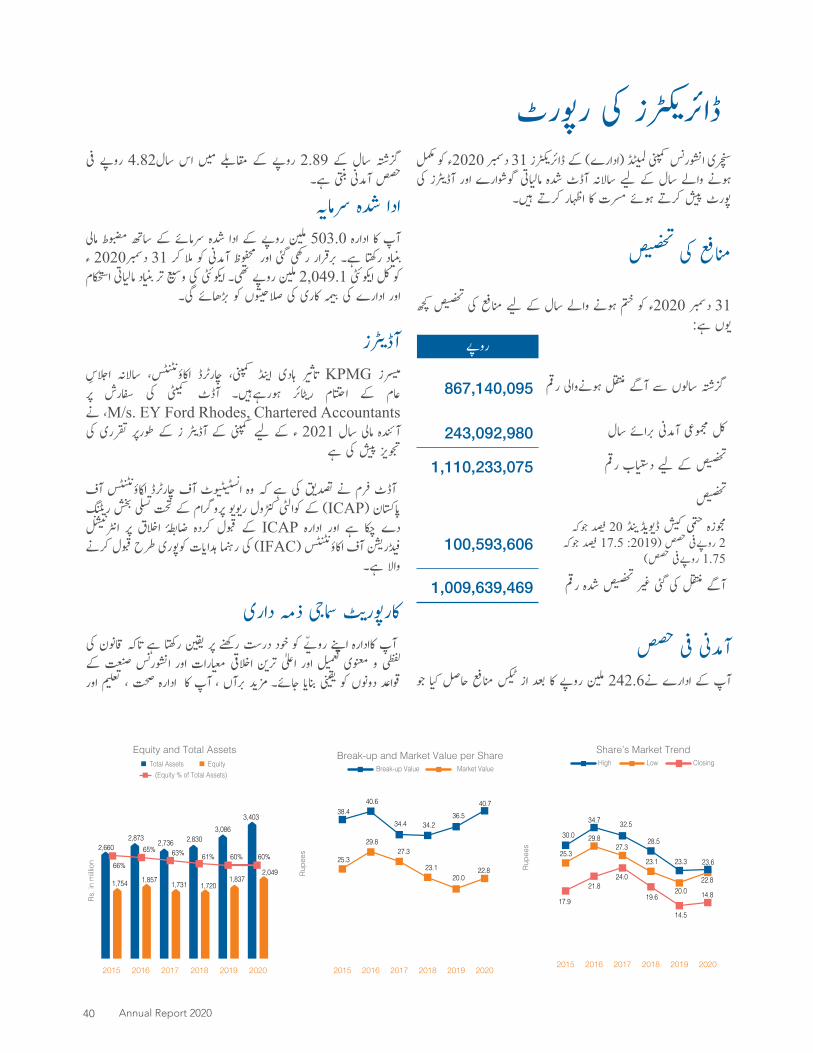
رپورٹ کی رز ٹ ر�ی
ئ ڈا�
مکمل کو 2020ء دسمبر 31 رز ٹ ر�ی
ئڈا� کے )ادارے( ڈ
ٹ ٹ لمی کمپنی انشورنس سنچری کی رز
ٹ آڈ�ی اور گوشوارے اتی مالی شدہ آڈٹ سالانہ لی کے سال والے ہونے ۔ ی �ہ کرتے اظہار کا مسرت ہوئے کرتے
شی �پ پورٹ
یص ص�ن
�ت �
کی منافع
کچھ یص ص�ن
�ت �
کی منافع لی کے سال والے ہونے ختم کو 2020ء دسمبر 31ہے: وں �ی
روپے
رقم ہونےوالی منتقل آگے سے سالوں 867,140,095 گزشتہ
سال رائے �ج آمدنی مجموعی 243,092,980 کل
رقم اب یت
دس لی کے یص ص�ن
�ت �
1,110,233,075
یص ص�ن
�ت �
جوکہ ڈ ین
� 20 ڈ ٹ ن �ی ڈ ٹ و�ی ڈ�ی
ش کی حتمی مجوزہ جوکہ ڈ ی
ن� 17.5 :2019( حصص روپےفی 2
حصص( روپےفی 1.75100,593,606
رقم شدہ یص ص�ن
�ت �
ر ین
� گئی کی منتقل 1,009,639,469آگے
حصص فی آمدنی جو ا کی حاصل منافع ی
ٹ� از بعد کا روپے ن ملی نے242.6 ادارے کے آپ
فی روپے سال4.82 اس می مقابلے کے روپے 2.89 کے سال گزشتہ ہے۔ بنتی آمدنی حصص
سرما�ی شدہ ادا مالی مضبوط ساتھ کے سرمائے شدہ ادا کے روپے ن ملی 503.0 ادارہ کا آپ
دسمبر2020 ء 31 کر ملا کو آمدنی محفوظ اور گئی رکھی رار ت
ر� �ج ہے۔ ا ت
رکھ اد ین
�جاستحکام اتی مالی اد ی
ن�ج ر
ت� وسی کی وئٹی ا�ی تھی۔ روپے ن ملی 2,049.1 وئٹی ا�ی کل کو
گی۔ ٹرھائے �ج کو وں ت
صلاحی کی کاری یمہ ج� � کی ادارے اور
رز ٹ آڈ�ی
اجلاس سالانہ س، ٹ �
�نٹ ن� اکاؤ� چارٹرڈ کمپنی، ڈ
ٹ ن ا�ی ہادی ر یش
ا� �ت KPMG یس�رز م�پر سفارش کی
ٹ کمی آڈٹ ۔ ی ہورہے�ہ ر ئ
ا� ٹ ر�ی ام ت ت
ا� کے عام نے ،M/s. EY Ford Rhodes, Chartered Accountantsکی تقرری طورپر کے ز ر
ٹ آڈ�ی کے کمپنی لی کے ء 2021 سال مالی آئندہ ہے کی
شی �پ ر
ن تجو�ی
آف س ٹ �
�نٹ ن� اکاؤ� چارٹرڈ آف ی�وٹ ٹ� � �ی
ٹ س�ن
ا� وہ کہ ہے کی ت
تصد�ی نے رم ن
� آڈٹ ن ٹ ر�ی بخش سلی
ت� تحت کے پروگرام و و�ی ر�ی کنٹرول کوالٹی کے )ICAP( �پاکستان
ن ش ی
نانٹر� پر اخلاق ئا ضا�ج کردہ قبول کے ICAP ادارہ اور ہے چکا دے
کرنے قبول طرح کوپوری ات ہدا�ی رہنما کی )IFAC( س ٹ �
�نٹ ن� اکاؤ� آف ن ش ٹڈر�ی ی
ن�
ہے۔ والا
داری ذمہ سماجی ٹ کارپور�یکی قانون اکہ �ت ہے ا
ترکھ ن ی
ت�ی پر رکھنے درست خود کو رو�ی اپنے کاادارہ آپ
کے صنعت انشورنس اور ارات معی اخلاقی ن ر�یت
� اعلی اور یل عم�ت
� معنوی و لفظی اور ی
ت� ، صحت ادارہ کا آپ ، رآں �ج ڈ ر�ی
نم جائے۔ ا بنا�ی
نی
ت �ی کو دونوں قواعد
202020192018201720162015
1,754 1,857 1,731
2,736 2,8303,086
1,7201,837
2,660
66%
65% 63% 61% 60% 60%
Equity and Total AssetsTotal Assets Equity
(Equity % of Total Assets)
2,873
Rs. i
n m
illion
3,403
2,049 Rupe
es
Break-up and Market Value per ShareMarket ValueBreak-up Value
202020192018201720162015
25.3
29.827.3
23.120.0
38.440.6
34.4 34.236.5
40.7
22.8 Rupe
es
Share’s Market TrendHigh Low Closing
202020192018201720162015
17.9
21.824.0
19.6
14.5
25.3
29.827.3
23.1
20.0
34.7 32.5
28.5
23.3
30.0
23.6
14.8
22.8
Annual Report 202040
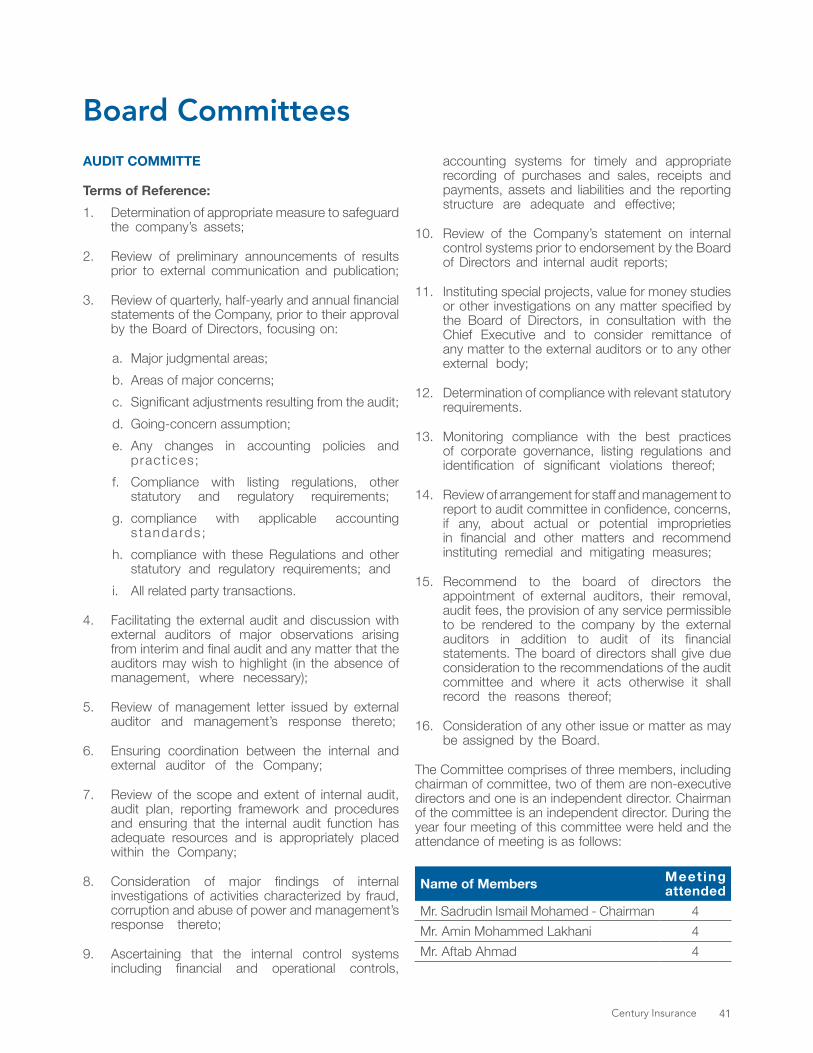
Board CommitteesAUDIT COMMITTE
Terms of Reference:1. Determination of appropriate measure to safeguard
the company’s assets;
2. Review of preliminary announcements of results prior to external communication and publication;
3. Review of quarterly, half-yearly and annual financial statements of the Company, prior to their approval by the Board of Directors, focusing on:
a. Major judgmental areas;b. Areas of major concerns;c. Significant adjustments resulting from the audit;d. Going-concern assumption;e. Any changes in accounting policies and
pract ices;f. Compliance with listing regulations, other
statutory and regulatory requirements;g. compliance with applicable accounting
s tandards ;h. compliance with these Regulations and other
statutory and regulatory requirements; andi. All related party transactions.
4. Facilitating the external audit and discussion with external auditors of major observations arising from interim and final audit and any matter that the auditors may wish to highlight (in the absence of management, where necessary);
5. Review of management letter issued by external auditor and management’s response thereto;
6. Ensuring coordination between the internal and external auditor of the Company;
7. Review of the scope and extent of internal audit, audit plan, reporting framework and procedures and ensuring that the internal audit function has adequate resources and is appropriately placed within the Company;
8. Consideration of major findings of internal investigations of activities characterized by fraud, corruption and abuse of power and management’s response thereto;
9. Ascertaining that the internal control systems including financial and operational controls,
accounting systems for timely and appropriate recording of purchases and sales, receipts and payments, assets and liabilities and the reporting structure are adequate and effective;
10. Review of the Company’s statement on internal control systems prior to endorsement by the Board of Directors and internal audit reports;
11. Instituting special projects, value for money studies or other investigations on any matter specified by the Board of Directors, in consultation with the Chief Executive and to consider remittance of any matter to the external auditors or to any other external body;
12. Determination of compliance with relevant statutory requirements.
13. Monitoring compliance with the best practices of corporate governance, listing regulations and identification of significant violations thereof;
14. Review of arrangement for staff and management to report to audit committee in confidence, concerns, if any, about actual or potential improprieties in financial and other matters and recommend instituting remedial and mitigating measures;
15. Recommend to the board of directors the appointment of external auditors, their removal, audit fees, the provision of any service permissible to be rendered to the company by the external auditors in addition to audit of its financial statements. The board of directors shall give due consideration to the recommendations of the audit committee and where it acts otherwise it shall record the reasons thereof;
16. Consideration of any other issue or matter as may be assigned by the Board.
The Committee comprises of three members, including chairman of committee, two of them are non-executive directors and one is an independent director. Chairman of the committee is an independent director. During the year four meeting of this committee were held and the attendance of meeting is as follows:
Name of Members Meet ing attended
Mr. Sadrudin Ismail Mohamed - Chairman 4Mr. Amin Mohammed Lakhani 4Mr. Aftab Ahmad 4
Century Insurance 41
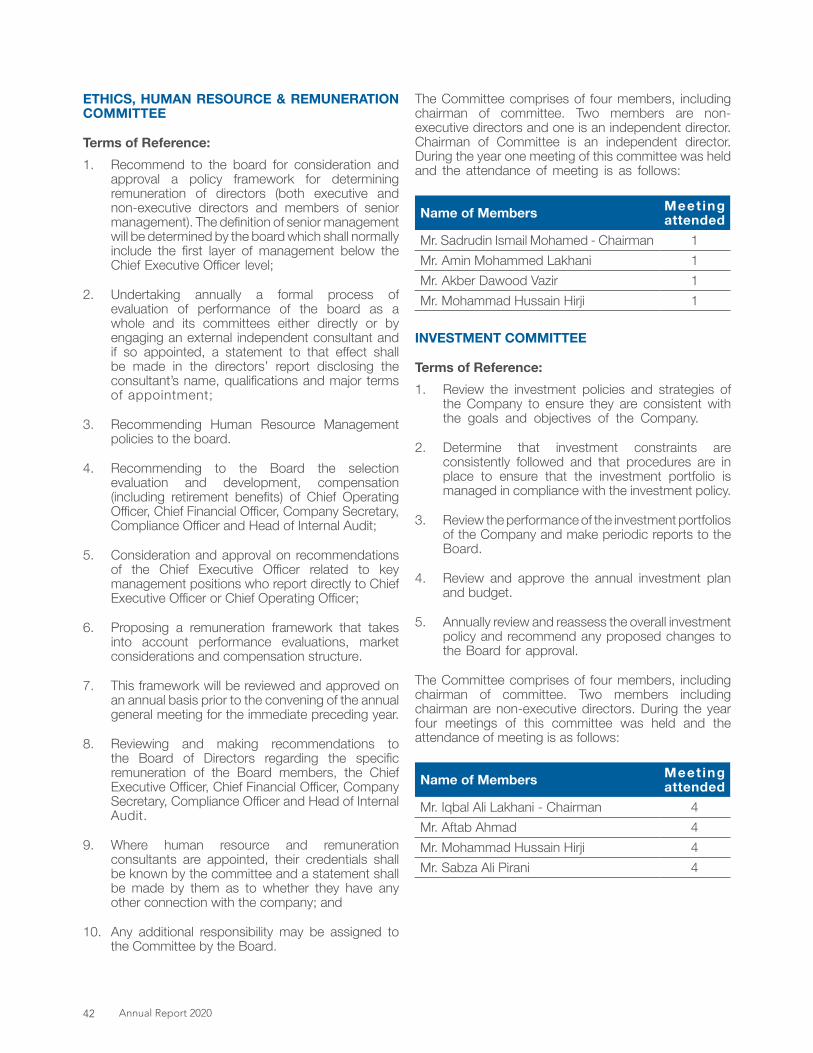
ETHICS, HUMAN RESOURCE & REMUNERATION COMMITTEE
Terms of Reference:1. Recommend to the board for consideration and
approval a policy framework for determining remuneration of directors (both executive and non-executive directors and members of senior management). The definition of senior management will be determined by the board which shall normally include the first layer of management below the Chief Executive Officer level;
2. Undertaking annually a formal process of evaluation of performance of the board as a whole and its committees either directly or by engaging an external independent consultant and if so appointed, a statement to that effect shall be made in the directors’ report disclosing the consultant’s name, qualifications and major terms of appointment;
3. Recommending Human Resource Management policies to the board.
4. Recommending to the Board the selection evaluation and development, compensation (including retirement benefits) of Chief Operating Officer, Chief Financial Officer, Company Secretary, Compliance Officer and Head of Internal Audit;
5. Consideration and approval on recommendations of the Chief Executive Officer related to key management positions who report directly to Chief Executive Officer or Chief Operating Officer;
6. Proposing a remuneration framework that takes into account performance evaluations, market considerations and compensation structure.
7. This framework will be reviewed and approved on an annual basis prior to the convening of the annual general meeting for the immediate preceding year.
8. Reviewing and making recommendations to the Board of Directors regarding the specific remuneration of the Board members, the Chief Executive Officer, Chief Financial Officer, Company Secretary, Compliance Officer and Head of Internal Audit.
9. Where human resource and remuneration consultants are appointed, their credentials shall be known by the committee and a statement shall be made by them as to whether they have any other connection with the company; and
10. Any additional responsibility may be assigned to the Committee by the Board.
The Committee comprises of four members, including chairman of committee. Two members are non-executive directors and one is an independent director. Chairman of Committee is an independent director. During the year one meeting of this committee was held and the attendance of meeting is as follows:
Name of Members Meet ing attended
Mr. Sadrudin Ismail Mohamed - Chairman 1Mr. Amin Mohammed Lakhani 1Mr. Akber Dawood Vazir 1Mr. Mohammad Hussain Hirji 1
INVESTMENT COMMITTEE
Terms of Reference:1. Review the investment policies and strategies of
the Company to ensure they are consistent with the goals and objectives of the Company.
2. Determine that investment constraints are consistently followed and that procedures are in place to ensure that the investment portfolio is managed in compliance with the investment policy.
3. Review the performance of the investment portfolios of the Company and make periodic reports to the Board.
4. Review and approve the annual investment plan and budget.
5. Annually review and reassess the overall investment policy and recommend any proposed changes to the Board for approval.
The Committee comprises of four members, including chairman of committee. Two members including chairman are non-executive directors. During the year four meetings of this committee was held and the attendance of meeting is as follows:
Name of Members Meet ing attended
Mr. Iqbal Ali Lakhani - Chairman 4Mr. Aftab Ahmad 4Mr. Mohammad Hussain Hirji 4Mr. Sabza Ali Pirani 4
Annual Report 202042
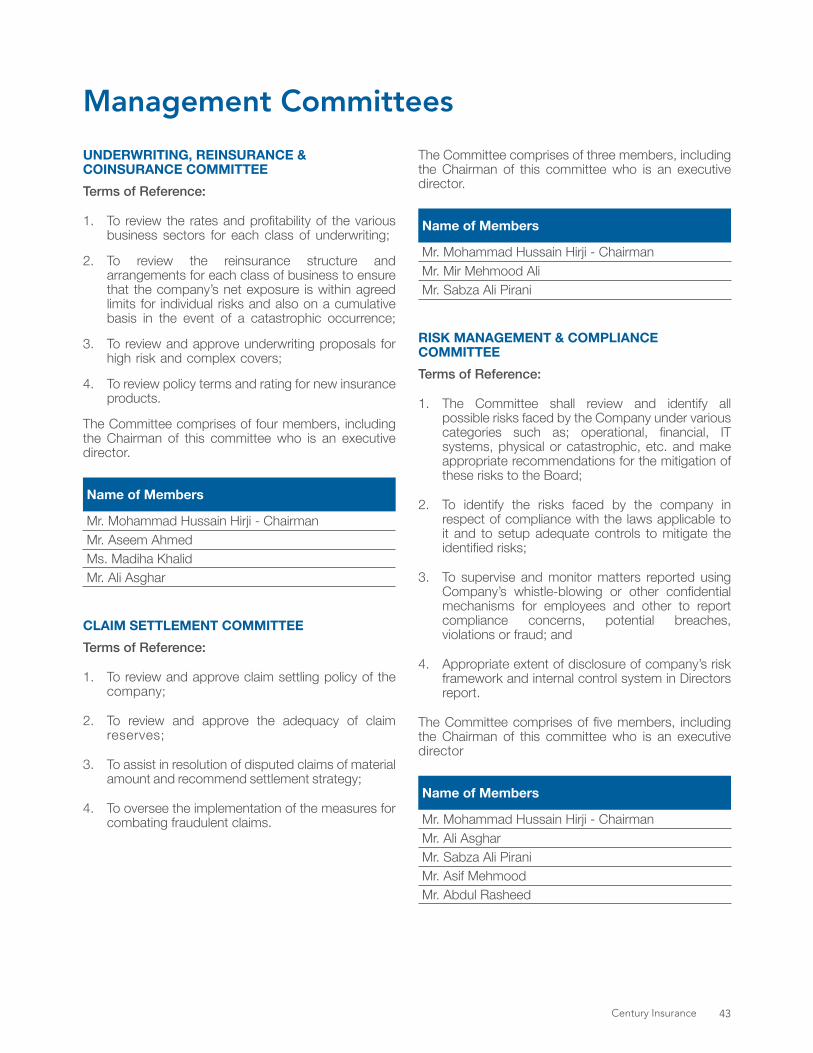
UNDERWRITING, REINSURANCE & COINSURANCE COMMITTEETerms of Reference:
1. To review the rates and profitability of the various business sectors for each class of underwriting;
2. To review the reinsurance structure and arrangements for each class of business to ensure that the company’s net exposure is within agreed limits for individual risks and also on a cumulative basis in the event of a catastrophic occurrence;
3. To review and approve underwriting proposals for high risk and complex covers;
4. To review policy terms and rating for new insurance products.
The Committee comprises of four members, including the Chairman of this committee who is an executive director.
Name of Members
Mr. Mohammad Hussain Hirji - Chairman Mr. Aseem Ahmed Ms. Madiha KhalidMr. Ali Asghar
CLAIM SETTLEMENT COMMITTEETerms of Reference:
1. To review and approve claim settling policy of the company;
2. To review and approve the adequacy of claim reserves;
3. To assist in resolution of disputed claims of material amount and recommend settlement strategy;
4. To oversee the implementation of the measures for combating fraudulent claims.
The Committee comprises of three members, including the Chairman of this committee who is an executive director.
Name of Members
Mr. Mohammad Hussain Hirji - Chairman Mr. Mir Mehmood AliMr. Sabza Ali Pirani
RISK MANAGEMENT & COMPLIANCE COMMITTEETerms of Reference:
1. The Committee shall review and identify all possible risks faced by the Company under various categories such as; operational, financial, IT systems, physical or catastrophic, etc. and make appropriate recommendations for the mitigation of these risks to the Board;
2. To identify the risks faced by the company in respect of compliance with the laws applicable to it and to setup adequate controls to mitigate the identified risks;
3. To supervise and monitor matters reported using Company’s whistle-blowing or other confidential mechanisms for employees and other to report compliance concerns, potential breaches, violations or fraud; and
4. Appropriate extent of disclosure of company’s risk framework and internal control system in Directors report.
The Committee comprises of five members, including the Chairman of this committee who is an executive director
Name of Members
Mr. Mohammad Hussain Hirji - Chairman Mr. Ali Asghar Mr. Sabza Ali PiraniMr. Asif MehmoodMr. Abdul Rasheed
Management Committees
Century Insurance 43
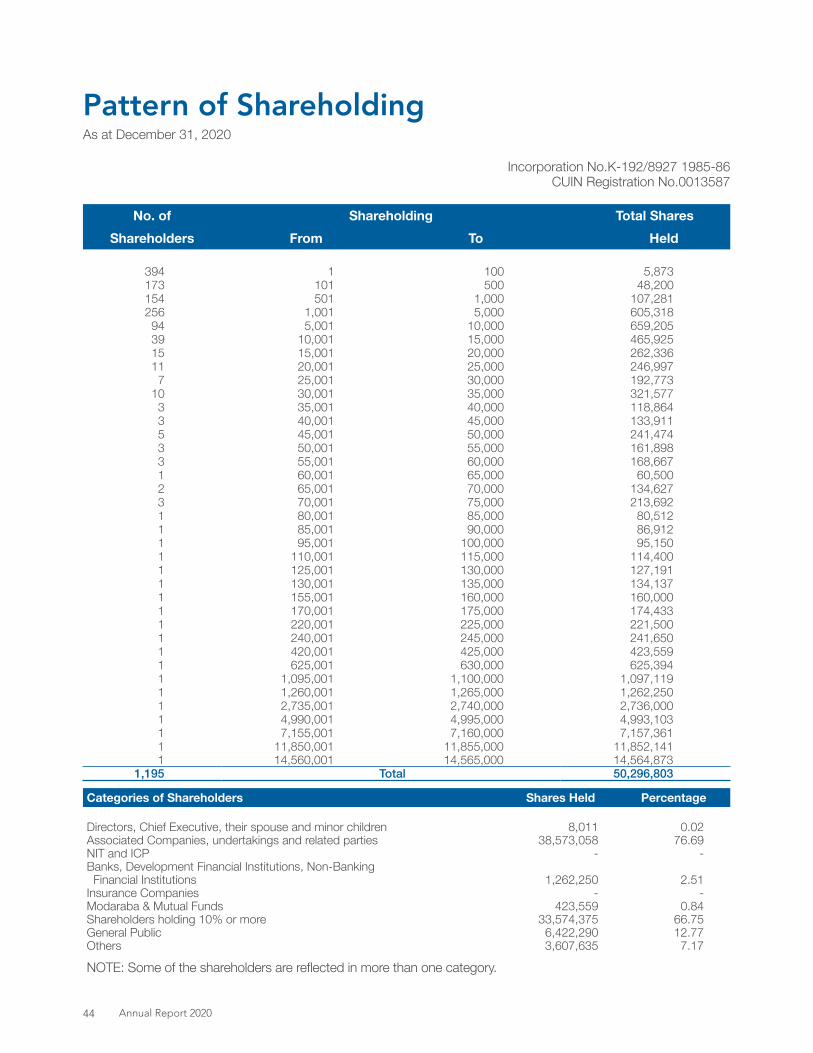
Pattern of Shareholding
Incorporation No.K-192/8927 1985-86CUIN Registration No.0013587
No. of Shareholding Total SharesShareholders From To Held
394 1 100 5,873 173 101 500 48,200 154 501 1,000 107,281 256 1,001 5,000 605,318 94 5,001 10,000 659,205 39 10,001 15,000 465,925 15 15,001 20,000 262,336 11 20,001 25,000 246,997 7 25,001 30,000 192,773
10 30,001 35,000 321,577 3 35,001 40,000 118,864 3 40,001 45,000 133,911 5 45,001 50,000 241,474 3 50,001 55,000 161,898 3 55,001 60,000 168,667 1 60,001 65,000 60,500 2 65,001 70,000 134,627 3 70,001 75,000 213,692 1 80,001 85,000 80,512 1 85,001 90,000 86,912 1 95,001 100,000 95,150 1 110,001 115,000 114,400 1 125,001 130,000 127,191 1 130,001 135,000 134,137 1 155,001 160,000 160,000 1 170,001 175,000 174,433 1 220,001 225,000 221,500 1 240,001 245,000 241,650 1 420,001 425,000 423,559 1 625,001 630,000 625,394 1 1,095,001 1,100,000 1,097,119 1 1,260,001 1,265,000 1,262,250 1 2,735,001 2,740,000 2,736,000 1 4,990,001 4,995,000 4,993,103 1 7,155,001 7,160,000 7,157,361 1 11,850,001 11,855,000 11,852,141 1 14,560,001 14,565,000 14,564,873
1,195 Total 50,296,803
As at December 31, 2020
Categories of Shareholders Shares Held Percentage
Directors, Chief Executive, their spouse and minor children 8,011 0.02Associated Companies, undertakings and related parties 38,573,058 76.69NIT and ICP - - Banks, Development Financial Institutions, Non-Banking Financial Institutions 1,262,250 2.51Insurance Companies - -Modaraba & Mutual Funds 423,559 0.84Shareholders holding 10% or more 33,574,375 66.75General Public 6,422,290 12.77Others 3,607,635 7.17
NOTE: Some of the shareholders are reflected in more than one category.
Annual Report 202044
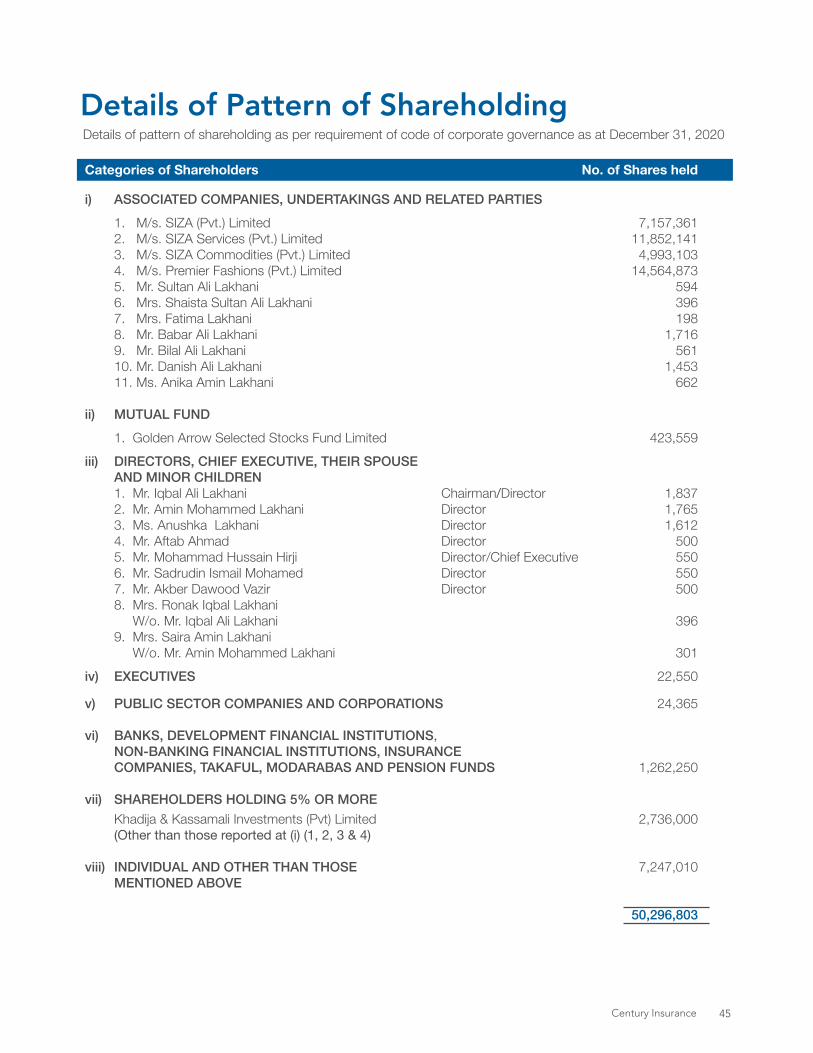
Categories of Shareholders No. of Shares held
i) ASSOCIATED COMPANIES, UNDERTAKINGS AND RELATED PARTIES 1. M/s. SIZA (Pvt.) Limited 7,157,361
2. M/s. SIZA Services (Pvt.) Limited 11,852,141 3. M/s. SIZA Commodities (Pvt.) Limited 4,993,103 4. M/s. Premier Fashions (Pvt.) Limited 14,564,873 5. Mr. Sultan Ali Lakhani 594 6. Mrs. Shaista Sultan Ali Lakhani 396 7. Mrs. Fatima Lakhani 198 8. Mr. Babar Ali Lakhani 1,716 9. Mr. Bilal Ali Lakhani 561 10. Mr. Danish Ali Lakhani 1,453 11. Ms. Anika Amin Lakhani 662
ii) MUTUAL FUND 1. Golden Arrow Selected Stocks Fund Limited 423,559
iii) DIRECTORS, CHIEF EXECUTIVE, THEIR SPOUSE AND MINOR CHILDREN 1. Mr. Iqbal Ali Lakhani Chairman/Director 1,837 2. Mr. Amin Mohammed Lakhani Director 1,765 3. Ms. Anushka Lakhani Director 1,612 4. Mr. Aftab Ahmad Director 500 5. Mr. Mohammad Hussain Hirji Director/Chief Executive 550 6. Mr. Sadrudin Ismail Mohamed Director 550 7. Mr. Akber Dawood Vazir Director 500 8. Mrs. Ronak Iqbal Lakhani W/o. Mr. Iqbal Ali Lakhani 396 9. Mrs. Saira Amin Lakhani W/o. Mr. Amin Mohammed Lakhani 301iv) EXECUTIVES 22,550
v) PUBLIC SECTOR COMPANIES AND CORPORATIONS 24,365 vi) BANKS, DEVELOPMENT FINANCIAL INSTITUTIONS, NON-BANKING FINANCIAL INSTITUTIONS, INSURANCE COMPANIES, TAKAFUL, MODARABAS AND PENSION FUNDS 1,262,250
vii) SHAREHOLDERS HOLDING 5% OR MORE Khadija & Kassamali Investments (Pvt) Limited 2,736,000 (Other than those reported at (i) (1, 2, 3 & 4) viii) INDIVIDUAL AND OTHER THAN THOSE 7,247,010 MENTIONED ABOVE
50,296,803
Details of Pattern of ShareholdingDetails of pattern of shareholding as per requirement of code of corporate governance as at December 31, 2020
Century Insurance 45
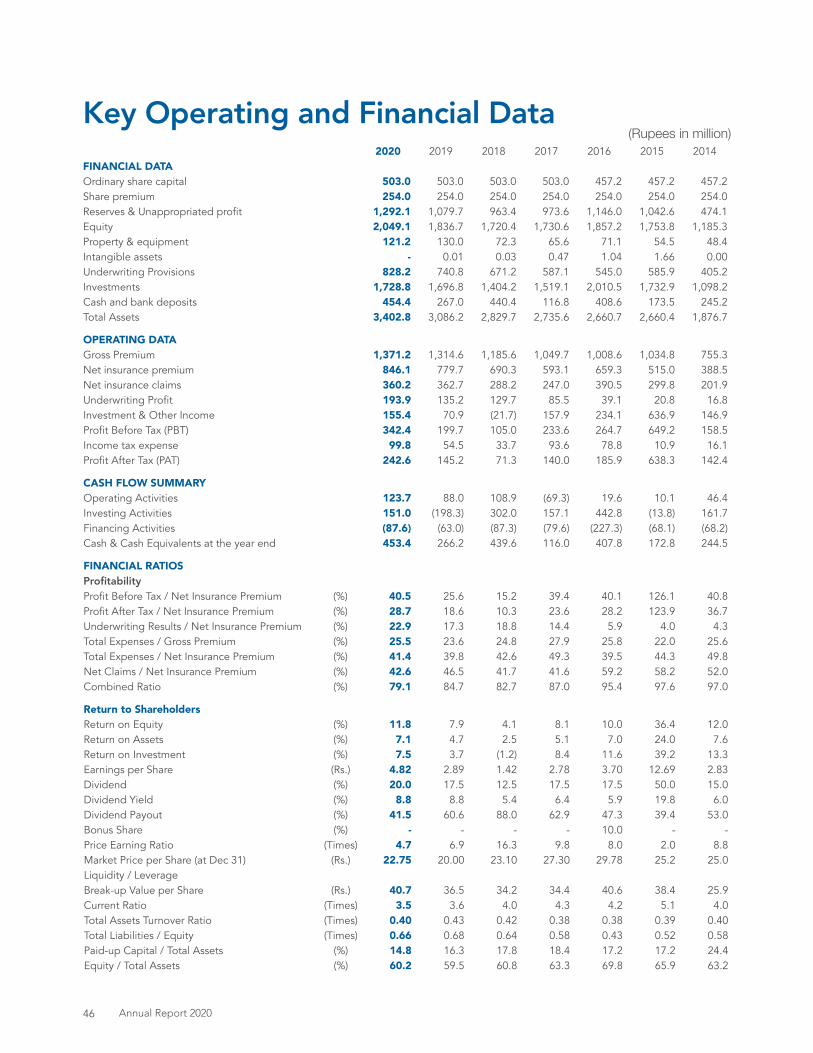
Key Operating and Financial Data2020 2019 2018 2017 2016 2015 2014
FINANCIAL DATAOrdinary share capital 503.0 503.0 503.0 503.0 457.2 457.2 457.2Share premium 254.0 254.0 254.0 254.0 254.0 254.0 254.0Reserves & Unappropriated profit 1,292.1 1,079.7 963.4 973.6 1,146.0 1,042.6 474.1Equity 2,049.1 1,836.7 1,720.4 1,730.6 1,857.2 1,753.8 1,185.3Property & equipment 121.2 130.0 72.3 65.6 71.1 54.5 48.4Intangible assets - 0.01 0.03 0.47 1.04 1.66 0.00Underwriting Provisions 828.2 740.8 671.2 587.1 545.0 585.9 405.2Investments 1,728.8 1,696.8 1,404.2 1,519.1 2,010.5 1,732.9 1,098.2Cash and bank deposits 454.4 267.0 440.4 116.8 408.6 173.5 245.2Total Assets 3,402.8 3,086.2 2,829.7 2,735.6 2,660.7 2,660.4 1,876.7
OPERATING DATAGross Premium 1,371.2 1,314.6 1,185.6 1,049.7 1,008.6 1,034.8 755.3Net insurance premium 846.1 779.7 690.3 593.1 659.3 515.0 388.5Net insurance claims 360.2 362.7 288.2 247.0 390.5 299.8 201.9Underwriting Profit 193.9 135.2 129.7 85.5 39.1 20.8 16.8Investment & Other Income 155.4 70.9 (21.7) 157.9 234.1 636.9 146.9Profit Before Tax (PBT) 342.4 199.7 105.0 233.6 264.7 649.2 158.5Income tax expense 99.8 54.5 33.7 93.6 78.8 10.9 16.1Profit After Tax (PAT) 242.6 145.2 71.3 140.0 185.9 638.3 142.4
CASH FLOW SUMMARYOperating Activities 123.7 88.0 108.9 (69.3) 19.6 10.1 46.4Investing Activities 151.0 (198.3) 302.0 157.1 442.8 (13.8) 161.7 Financing Activities (87.6) (63.0) (87.3) (79.6) (227.3) (68.1) (68.2)Cash & Cash Equivalents at the year end 453.4 266.2 439.6 116.0 407.8 172.8 244.5
FINANCIAL RATIOSProfitabilityProfit Before Tax / Net Insurance Premium (%) 40.5 25.6 15.2 39.4 40.1 126.1 40.8Profit After Tax / Net Insurance Premium (%) 28.7 18.6 10.3 23.6 28.2 123.9 36.7Underwriting Results / Net Insurance Premium (%) 22.9 17.3 18.8 14.4 5.9 4.0 4.3Total Expenses / Gross Premium (%) 25.5 23.6 24.8 27.9 25.8 22.0 25.6Total Expenses / Net Insurance Premium (%) 41.4 39.8 42.6 49.3 39.5 44.3 49.8Net Claims / Net Insurance Premium (%) 42.6 46.5 41.7 41.6 59.2 58.2 52.0Combined Ratio (%) 79.1 84.7 82.7 87.0 95.4 97.6 97.0
Return to ShareholdersReturn on Equity (%) 11.8 7.9 4.1 8.1 10.0 36.4 12.0 Return on Assets (%) 7.1 4.7 2.5 5.1 7.0 24.0 7.6 Return on Investment (%) 7.5 3.7 (1.2) 8.4 11.6 39.2 13.3 Earnings per Share (Rs.) 4.82 2.89 1.42 2.78 3.70 12.69 2.83Dividend (%) 20.0 17.5 12.5 17.5 17.5 50.0 15.0 Dividend Yield (%) 8.8 8.8 5.4 6.4 5.9 19.8 6.0Dividend Payout (%) 41.5 60.6 88.0 62.9 47.3 39.4 53.0Bonus Share (%) - - - - 10.0 - - Price Earning Ratio (Times) 4.7 6.9 16.3 9.8 8.0 2.0 8.8 Market Price per Share (at Dec 31) (Rs.) 22.75 20.00 23.10 27.30 29.78 25.2 25.0Liquidity / LeverageBreak-up Value per Share (Rs.) 40.7 36.5 34.2 34.4 40.6 38.4 25.9Current Ratio (Times) 3.5 3.6 4.0 4.3 4.2 5.1 4.0 Total Assets Turnover Ratio (Times) 0.40 0.43 0.42 0.38 0.38 0.39 0.40 Total Liabilities / Equity (Times) 0.66 0.68 0.64 0.58 0.43 0.52 0.58Paid-up Capital / Total Assets (%) 14.8 16.3 17.8 18.4 17.2 17.2 24.4 Equity / Total Assets (%) 60.2 59.5 60.8 63.3 69.8 65.9 63.2
(Rupees in million)
Annual Report 202046

Graphical Presentation
202020192018201720162015
202020192018201720162015
Rs. i
n m
illion
202020192018201720162015
228 260 292
1,0501,186
1,315
294 305
1,035
26%
28%
25% 25%23%
Total Expenses to Gross Premium Gross Premium Total Expenses
Total Expenses to G.P (%)
1,009
Rs. i
n m
illion
22%
593515
1,009 1,050
1,186
1,315
78069050%
56% 58% 59%
1,035
Gross Premium and Net Premium Gross Premium Net Premium
Net Premium to G.P (%)
Earnings per Share (EPS) and Price Earning (PE) RatioEPS (Rs.)PE (Times)
202020192018201720162015
Rs. i
n M
illion
Investments (Including cash and bank)
Gross Premium (Class wise)
1,636
Rs. i
n M
illion
Total Equity
1,7541,857
1,731 1,7201,837
1,906
2,119
1,8451,964
202020192018201720162015
Paid-up Capital & ReservesPaid-up Capital Reserves
457 457
1,2971,400
503 503
1,228 1217
503
1,334
Rs. I
n M
illion
202020192018201720162015
1.99
8.05
9.82
16.27
1.42
6.93
2.89
12.69
3.702.78
659
65%
4.82
4.72
1,371
84662%
1,371
344
503
1,546 2,183
2,049
Fire & Property 30%
Marine 20%
Motor 25%
Health 20%
Miscellaneous 5%
Century Insurance 47
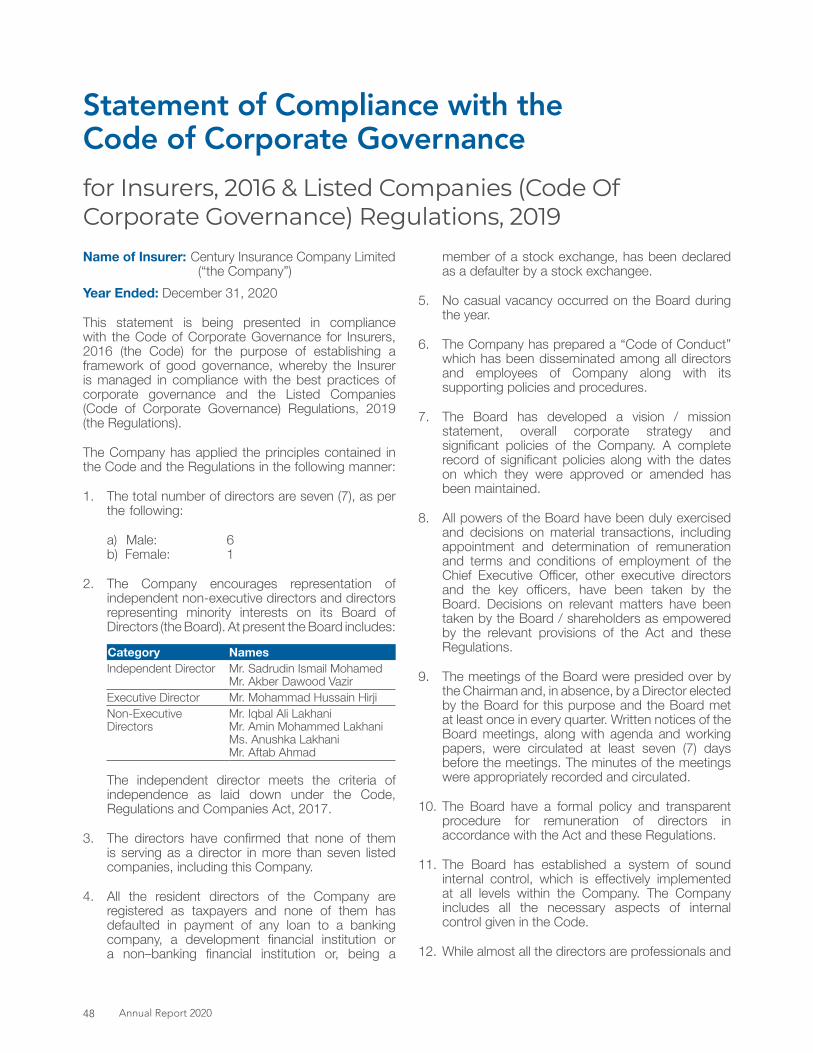
Statement of Compliance with the Code of Corporate Governance
Name of Insurer: Century Insurance Company Limited (“the Company”)Year Ended: December 31, 2020
This statement is being presented in compliance with the Code of Corporate Governance for Insurers, 2016 (the Code) for the purpose of establishing a framework of good governance, whereby the Insurer is managed in compliance with the best practices of corporate governance and the Listed Companies (Code of Corporate Governance) Regulations, 2019 (the Regulations).
The Company has applied the principles contained in the Code and the Regulations in the following manner:
1. The total number of directors are seven (7), as per the following:
a) Male: 6b) Female: 1
2. The Company encourages representation of independent non-executive directors and directors representing minority interests on its Board of Directors (the Board). At present the Board includes:
Category NamesIndependent Director Mr. Sadrudin Ismail Mohamed
Mr. Akber Dawood VazirExecutive Director Mr. Mohammad Hussain HirjiNon-Executive Directors
Mr. Iqbal Ali LakhaniMr. Amin Mohammed LakhaniMs. Anushka LakhaniMr. Aftab Ahmad
The independent director meets the criteria of independence as laid down under the Code, Regulations and Companies Act, 2017.
3. The directors have confirmed that none of them is serving as a director in more than seven listed companies, including this Company.
4. All the resident directors of the Company are registered as taxpayers and none of them has defaulted in payment of any loan to a banking company, a development financial institution or a non–banking financial institution or, being a
member of a stock exchange, has been declared as a defaulter by a stock exchangee.
5. No casual vacancy occurred on the Board during the year.
6. The Company has prepared a “Code of Conduct” which has been disseminated among all directors and employees of Company along with its supporting policies and procedures.
7. The Board has developed a vision / mission statement, overall corporate strategy and significant policies of the Company. A complete record of significant policies along with the dates on which they were approved or amended has been maintained.
8. All powers of the Board have been duly exercised and decisions on material transactions, including appointment and determination of remuneration and terms and conditions of employment of the Chief Executive Officer, other executive directors and the key officers, have been taken by the Board. Decisions on relevant matters have been taken by the Board / shareholders as empowered by the relevant provisions of the Act and these Regulations.
9. The meetings of the Board were presided over by the Chairman and, in absence, by a Director elected by the Board for this purpose and the Board met at least once in every quarter. Written notices of the Board meetings, along with agenda and working papers, were circulated at least seven (7) days before the meetings. The minutes of the meetings were appropriately recorded and circulated.
10. The Board have a formal policy and transparent procedure for remuneration of directors in accordance with the Act and these Regulations.
11. The Board has established a system of sound internal control, which is effectively implemented at all levels within the Company. The Company includes all the necessary aspects of internal control given in the Code.
12. While almost all the directors are professionals and
for Insurers, 2016 & Listed Companies (Code Of Corporate Governance) Regulations, 2019
Annual Report 202048

senior executives who possess wide experience of duties of directors, the Company apprises its directors of new laws and regulations and amendments in the existing ones. The Board has not arranged any Directors’ training program during the year ended December 31, 2020 as five directors have already attended the Directors’ training course in previous years.
13. There was no new appointment of Chief Financial Officer (CFO) or Company Secretary or Head of Internal Audit during the year. The Board has however, approved the remuneration of CFO and the Head of Internal Audit on the recommendation of Ethics, Human Resource & Remuneration Committee as determined by Chief Executive Officer. Mr. Mansoor Ahmed was assigned the responsibilities of the Company Secretary of Century Insurance Company Limited in addition to his responsibilities in other Group Companies.
14. The Directors’ report for this year has been prepared in compliance with the requirements of the Code and the Regulations and fully describes the salient matters required to be disclosed.
15. The financial statements of the Company were duly endorsed by Chief Executive Officer and Chief Financial Officer before approval of the Board.
16. The Directors, Chief Executive Officer and other executives do not hold any interest in the shares of the Company other than that disclosed in the pattern of shareholding.
17. The Company has complied with all the corporate and financial reporting requirements of the Code.
18. The Board has formed the following Management Committees:
a) Underwriting, Reinsurance and Co-insurance Committeee
Name of Member Category
Mr. Mohammad Hussain Hirji Chairman - Executive DirectorMr. Aseem Ahmed MemberMs. Madiha Khalid MemberMr. Ali Asghar Member
b) Claim Settlement CommitteeName of Member Category
Mr. Mohammad Hussain Hirji Chairman - Executive DirectorMr. Mir Mehmood Ali MemberMr. Sabza Ali Pirani Member
c) Risk Management & Compliance CommitteeName of Member Category
Mr. Mohammad Hussain Hirji Chairman - Executive DirectorMr. Ali Asghar MemberMr. Sabza Ali Pirani MemberMr. Asif Mehmood MemberMr. Abdul Rasheed Member
19. The Board has formed the following Board Committees comprising of members given below;
a) Ethics, Human Resource & Remuneration Committee
Name of Member Category
Mr. Sadrudin Ismail Mohamed Chairman – Independent DirectorMr. Amin Mohammed Lakhani Member – Non Executive DirectorMr. Akber Dawood Vazir Member – Independent DirectorMr. Mohammad Hussain Hirji Member – Executive Director
b) Investment Committee Name of Member Category
Mr. Iqbal Ali Lakhani Chairman – Non Executive DirectorMr. Mohammad Hussain Hirji Member – Executive DirectorMr. Aftab Ahmad Member – Non Executive DirectorMr. Sabza Ali Pirani Member
20. The Board has formed an Audit Committee. It comprises of three members, of whom one is independent Director and two are non-executive Directors. The Chairman of the Committee is an independent Director. The Composition of the Audit Committee is as follows:
Name of Member Category
Mr. Sadrudin Ismail Mohamed Chairman – Independent DirectorMr. Amin Mohammed Lakhani Member – Non Executive DirectorMr. Aftab Ahmad Member – Non Executive Director
21. The meetings of the Committees, except Ethics, Human Resource and Remuneration Committee, were held at least once every quarter prior to approval of interim and final results of the Company and as required by the Code. The terms of references of the Committees have been formed, documented and advised to the Committees for compliance.
22. The Board has set up an effective internal audit function comprising of personnel who are considered suitably qualified and experienced for the purpose and are conversant with the policies and procedures of the Company.
Century Insurance 49
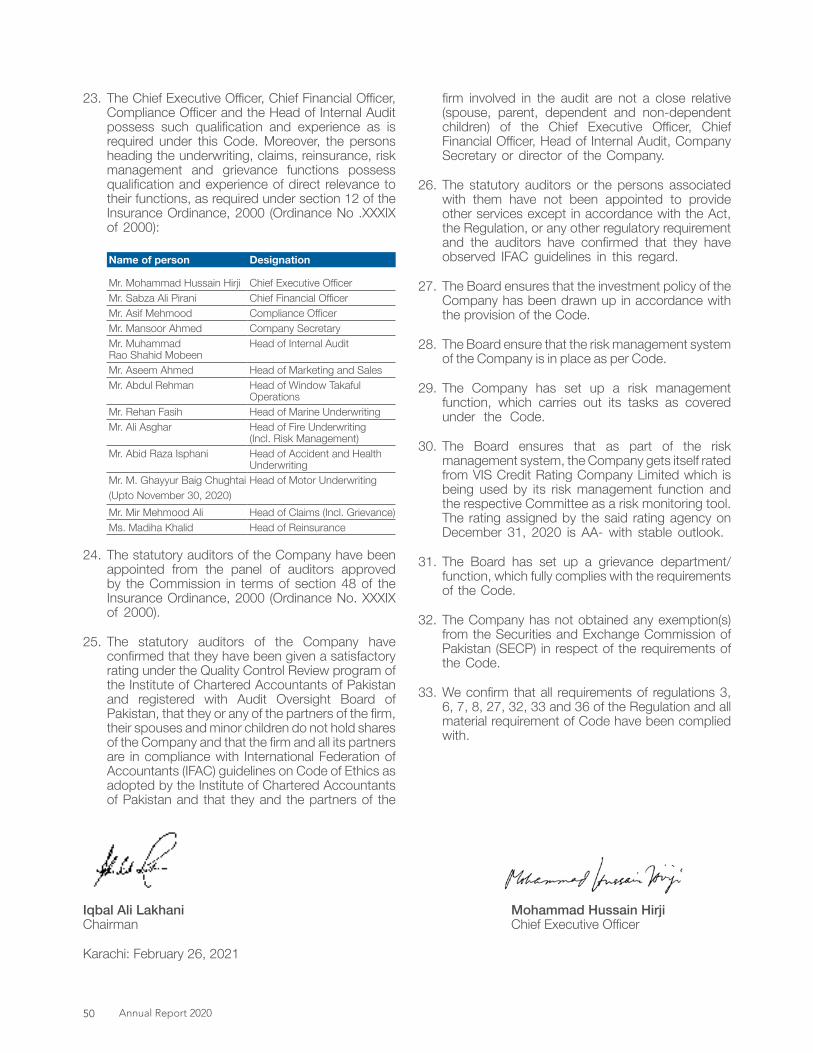
23. The Chief Executive Officer, Chief Financial Officer, Compliance Officer and the Head of Internal Audit possess such qualification and experience as is required under this Code. Moreover, the persons heading the underwriting, claims, reinsurance, risk management and grievance functions possess qualification and experience of direct relevance to their functions, as required under section 12 of the Insurance Ordinance, 2000 (Ordinance No .XXXIX of 2000):
Name of person Designation
Mr. Mohammad Hussain Hirji Chief Executive OfficerMr. Sabza Ali Pirani Chief Financial OfficerMr. Asif Mehmood Compliance Officer Mr. Mansoor Ahmed Company Secretary Mr. Muhammad Rao Shahid Mobeen
Head of Internal Audit
Mr. Aseem Ahmed Head of Marketing and SalesMr. Abdul Rehman Head of Window Takaful
OperationsMr. Rehan Fasih Head of Marine Underwriting Mr. Ali Asghar Head of Fire Underwriting
(Incl. Risk Management)Mr. Abid Raza Isphani Head of Accident and Health
UnderwritingMr. M. Ghayyur Baig Chughtai Head of Motor Underwriting(Upto November 30, 2020)Mr. Mir Mehmood Ali Head of Claims (Incl. Grievance)Ms. Madiha Khalid Head of Reinsurance
24. The statutory auditors of the Company have been appointed from the panel of auditors approved by the Commission in terms of section 48 of the Insurance Ordinance, 2000 (Ordinance No. XXXIX of 2000).
25. The statutory auditors of the Company have confirmed that they have been given a satisfactory rating under the Quality Control Review program of the Institute of Chartered Accountants of Pakistan and registered with Audit Oversight Board of Pakistan, that they or any of the partners of the firm, their spouses and minor children do not hold shares of the Company and that the firm and all its partners are in compliance with International Federation of Accountants (IFAC) guidelines on Code of Ethics as adopted by the Institute of Chartered Accountants of Pakistan and that they and the partners of the
firm involved in the audit are not a close relative (spouse, parent, dependent and non-dependent children) of the Chief Executive Officer, Chief Financial Officer, Head of Internal Audit, Company Secretary or director of the Company.
26. The statutory auditors or the persons associated with them have not been appointed to provide other services except in accordance with the Act, the Regulation, or any other regulatory requirement and the auditors have confirmed that they have observed IFAC guidelines in this regard.
27. The Board ensures that the investment policy of the Company has been drawn up in accordance with the provision of the Code.
28. The Board ensure that the risk management system of the Company is in place as per Code.
29. The Company has set up a risk management function, which carries out its tasks as covered under the Code.
30. The Board ensures that as part of the risk management system, the Company gets itself rated from VIS Credit Rating Company Limited which is being used by its risk management function and the respective Committee as a risk monitoring tool. The rating assigned by the said rating agency on December 31, 2020 is AA- with stable outlook.
31. The Board has set up a grievance department/function, which fully complies with the requirements of the Code.
32. The Company has not obtained any exemption(s) from the Securities and Exchange Commission of Pakistan (SECP) in respect of the requirements of the Code.
33. We confirm that all requirements of regulations 3, 6, 7, 8, 27, 32, 33 and 36 of the Regulation and all material requirement of Code have been complied with.
Iqbal Ali Lakhani Mohammad Hussain HirjiChairman Chief Executive Officer
Karachi: February 26, 2021
Annual Report 202050

Independent Auditor’s Review Report
KPMG Taseer Hadi & Co.Chartered AccountantsSheikh Sultan Trust Building No. 2, Beaumont RoadKarachi 75530 Pakistan +92 (21) 35685847, Fax +92 (21) 35685095
We have reviewed the enclosed Statement of Compliance with the Code of Corporate Governance for Insurer, 2016 and the Listed Companies (Code of Corporate Governance) Regulations, 2019 (combined called“ the Code”) prepared by the Board of Directors of Century Insurance Company Limited (“the Company”) for the year ended December 31, 2020 in accordance with the requirement of the Code.
The responsibility for compliance with the Code is that of the Board of Directors of the Company. Our responsibility is to review whether the Statement of Compliance reflects the status of the Company’s compliance with the provisions of the Code and report if it does not and to highlight any non-compliance with the requirements of the Code. A review is limited primarily to inquiries of the Company’s personnel and review of various documents prepared by the Company to comply with the Code.
As a part of our audit of the financial statements we are required to obtain an understanding of the accounting and internal control systems sufficient to plan the audit and develop an effective audit approach. We are not required to consider whether the Board of Directors’ statement on internal control covers all risks and controls or to form an opinion on the effectiveness of such internal controls, the Company’s corporate governance procedures and risks.
The Code requires the Company to place before the Audit Committee, and upon recommendation of the Audit Committee, place before the Board of Directors for their review and approval, its related party transactions. We are only required and have ensured compliance of this requirement to the extent of the approval of the related party transactions by the Board of Directors upon recommendation of the Audit Committee. We have not carried out procedures to assess and determine the Company’s process for identification of related parties and that whether the related party transactions were undertaken at arm’s length price or not.
Based on our review, nothing has come to our attention which causes us to believe that the Statement of Compliance does not appropriately reflect the Company’s compliance, in all material respects, with the requirements contained in the Code as applicable to the Company for the year ended December 31, 2020.
Date: March 18, 2021 KPMG Taseer Hadi & Co.Chartered Accountants
Karachi
To the members of Century Insurance Company Limited
Review of the Statement of compliance with the Code of Corporate Governance for Insurers, 2016 & Listed Companies (Code of Corporate Governance) Regulations, 2019 for the year ended December 31, 2020
KPMG Taseer Hadi & Co., a Partnership firm registered in Pakistan and a member firm of the KPMG global organizationof independent member firms affiliated with KPMG International Limited, a private English company limited by guarantee.
Century Insurance 51
Shariah Reveiw Report to theBoard of Directors
الامی النبی محمد ی�ن والمرسل� اء ی بن
الا� د سی علی والسلام والصلاۃ ی�ن لعلم�ا رب للہ الحمد
وبعد ، ی�ن بمع� �ا بہ وصح� آلہ وعلی
I have reviewed the principles, policies, contract and accompanying financial statements of Century Insurance Company Limited - Window Takaful Operations (hereafter referred to as “Takaful Operator”) for the year ended December 31, 2020 to form an opinion as to whether the company has complied with the Shariah principles and with the Shariah rulings, decisions and guidelines issued by the undersigned.
The management of the Century Insurance Company Limited - Window Takaful Operations is responsible to ensure that the institute conducts its business in accordance with Shariah Principles, rules, and guidelines. It is Shariah Advisor’s responsibility to form an independent opinion based on his review of the operations of Century Insurance Company Limited - Window Takaful Operations and report to the board of directors of the company.
During the year, different issues were presented to the undersigned for guidance, the solutions for which were duly implemented. On that basis, Shariah compliance at the Takaful Operator level is declared as being satisfactory.
I further have assessed the review carried out by the Shariah compliance officer which included examination, on sampling basis, each type of transaction performed by different business functions, the relevant documentation and procedure adopted by each said function. Moreover, I have reviewed all types of business concerns of the Takaful Operator and in my opinion, and to the best of my understanding based on the provided information and explanations:
i. Financial transactions and relevant documentations & procedures, undertaken by the Company for the year ended December 31, 2020 were in accordance with the issued Shariah guidelines.
ii. Shariah Screening Criteria has been fulfilled properly in all kind of investment & financial transactions.iii. No amount has been realized as non Shariah Compliant income which has to be credited to the relevant
charity account.iv. Consequently, I have found that the Window Takaful Operation is not against the Shariah principles with
respect to all transactions.
“And Allah Knows Best“
Mufti Muhammad Shakir SiddiquiShariah Advisor
Dated: February 22, 2021
for the year ended December 31 2020
Annual Report 202052
Statement of Compliance with theShariah PrinciplesThe financial arrangements, contracts and transactions, entered into by Century Insurance Company Limited - Window Takaful Operations (‘the Company’) for the year ended December 31, 2020 are in compliance with the Takaful Rules, 2012.
Further we confirmed that:
• The Company has developed and implemented all the policies and procedures in accordance with the Takaful Rules, 2012 and rulings of the Shariah Advisor along with a comprehensive mechanism to ensure compliance with such rulings and Takaful rules, 2012 in their overall operations. Further, the governance arrangements including the reporting of events and status to those charged with relevant responsibilities, such as the Audit Committee / Shariah Advisor and the Board of Directors have implemented;
• The Company has imparted trainings / orientations and ensured availability of all manuals / agreements approved by Shariah Advisor / Board of Directors to maintain the adequate level of awareness, capacity and sensitization of the staff, management;
• All the products and policies have been approved by Shariah Advisor and the financial arrangements including investments made, policies, contracts and transactions, entered into by Window Takaful Operations are in accordance with the polices approved by Shariah Advisor; and
• The assets and liabilities of Window Takaful Operations (Participants’ Takaful Fund and Operator’s Fund) are segregated from its other assets and liabilities, at all times in accordance with the provisions of the Takaful Rules, 2012.
This has been duly confirmed by the Shariah Advisor of the Company.
Mohammad Hussain Hirji(Director & Chief Executive) Dated: February 26, 2021
Century Insurance 53
KPMG Taseer Hadi & Co.Chartered AccountantsSheikh Sultan Trust Building No. 2, Beaumont RoadKarachi 75530 Pakistan +92 (21) 35685847, Fax +92 (21) 35685095
Independent Reasonable Assurance Report to the Board of Directors on the Statement of Management’s Assessment of Compliance with the Shariah Principles
We were engaged by the Board of Directors of Century Insurance Company Limited (“the Company”) to report on the management’s assessment of compliance of the Window Takaful Operations (“Takaful Operations”) of the Company, as set out in the annexed statement prepared by the management for the year ended December 31, 2020, with the Takaful Rules 2012, in the form of an independent reasonable assurance conclusion about whether the annexed statement presents fairly the status of compliance of the Takaful Operations with the Takaful Rules, 2012, in all material respects.
Applicable Criteria
The criteria against which the subject matter information (the Statement) is assessed comprise of the provisions of Takaful Rules, 2012.
Responsibilities of the Management
The Board of Directors / management of the Company are responsible for designing, implementing and maintaining internal controls relevant to the preparation of the annexed statement that is free from material misstatement, whether due to fraud or error. It also includes ensuring the overall compliance of the Takaful Operations with the Takaful Rules, 2012.
The Board of Directors / management of the Company are also responsible for preventing and detecting fraud and for identifying and ensuring that the Takaful Operations comply with laws and regulations applicable to its activities. They are also responsible for ensuring that the management, where appropriate, those charged with governance, and personnel involved with the Takaful Operations compliance with the Takaful Rules, 2012 are properly trained, systems are properly updated and that any changes in reporting encompass all significant business units.
Our Independence and Quality Control
We have complied with the independence and other ethical requirements of the Code of Ethics for Chartered Accountants issued by the Institute of Chartered Accountants of Pakistan, which is founded on fundamental principles of integrity, objectivity, professional competence and due care, confidentiality and professional behavior.
The firm applies International Standard on Quality Control 1 “Quality Control for Firms That Perform Audits and Reviews of Historical Financial Information, and Other Assurance and Related Services Engagements” and accordingly maintains a comprehensive system of quality control including documented policies and procedures regarding compliance with ethical requirements, professional standards and applicable legal and regulatory requirements.
KPMG Taseer Hadi & Co., a Partnership firm registered in Pakistan and a member firm of the KPMG global organizationof independent member firms affiliated with KPMG International Limited, a private English company limited by guarantee.
Annual Report 202054

KPMG Taseer Hadi & Co.
Our responsibilities
Our responsibility is to examine the annexed statement and to report thereon in the form of an independent reasonable assurance conclusion based on the evidence obtained. We conducted our engagement in accordance with International Standard on Assurance Engagements (ISAE) 3000, “Assurance Engagements Other Than Audits or Reviews of Historical Financial Information” issued by the International Auditing and Assurance Standards Board. That standard requires that we plan and perform our procedures to obtain reasonable assurance about whether the annexed statement presents fairly the status of compliance of the Takaful Operations with the Takaful Rules, 2012, in all material respects.
The procedures selected depend on our judgment, including the assessment of the risks of material non-compliances with the Takaful Rules, 2012, whether due to fraud or error. In making those risk assessments, we have considered internal control relevant to the Takaful Operations compliance with the Takaful Rules, 2012, in order to design assurance procedures that are appropriate in the circumstances, but not for the purposes of expressing a conclusion as to the effectiveness of the Company’s internal control over the Takaful Operations’ compliance with the Takaful Rules, 2012. Reasonable assurance is less than absolute assurance.
A system of internal control, because of its nature, may not prevent or detect all instances of non-compliance with Takaful Rules, 2012, and consequently cannot provide absolute assurance that the objective of compliance with Takaful Rules, 2012, will be met. Also, projection of any evaluation of effectiveness to future periods is subject to the risk that the controls may become inadequate or fail.
The procedures performed included:
- Evaluate the systems, procedures and practices in place with respect to the Takaful operations against the Takaful Rules, 2012 and Shariah advisor’s guidelines;
- Evaluating the governance arrangements including the reporting of events and status to those charged with relevant responsibilities, such as the Audit Committee / Shariah Advisor and the board of directors;
- Test for a sample of transactions relating to Takaful operations to ensure that these are carried out in accordance with the laid down procedures and practices including the regulations relating to Takaful operations as laid down in Takaful Rules, 2012; and
- Review the statement of management’s assessment of compliance of the Takaful transactions during the year ended December 31, 2020 with the Takaful Rules, 2012.
Conclusion
Our conclusion has been formed on the basis of, and is subject to, the matters outlined in this report. We believe that the evidence we have obtained is sufficient and appropriate to provide a basis for our conclusion.
In our opinion, the annexed statement, for the year ended December 31, 2020, presents fairly the status of compliance of the Takaful Operations with the Takaful Rules, 2012, in all material respects.
Date: March 18, 2021 KPMG Taseer Hadi & Co.Chartered Accountants
Karachi
Century Insurance 55
Financial Statements

KPMG Taseer Hadi & Co.Chartered AccountantsSheikh Sultan Trust Building No. 2, Beaumont RoadKarachi 75530 Pakistan +92 (21) 35685847, Fax +92 (21) 35685095
Independent Auditors’ ReportTo the members of Century Insurance Company Limited Report on the Audit of the Financial Statements
Opinion
We have audited the annexed financial statements of Century Insurance Company Limited (the “Company”), which comprise the statement of financial position as at December 31, 2020, the profit and loss account, the statement of comprehensive income, the statement of changes in equity and the statement of cash flows for the year then ended, and notes to the financial statements, including a summary of significant accounting policies and other explanatory information, and we state that we have obtained all the information and explanations which, to the best of our knowledge and belief, were necessary for the purposes of the audit.
In our opinion and to the best of our information and according to the explanations given to us, the statement of financial position, the profit and loss account, the statement of comprehensive income, the statement of changes in equity and the statement of cash flows together with the notes forming part thereof, conform with the accounting and reporting standards as applicable in Pakistan and give the information required by the Insurance Ordinance, 2000 and the Companies Act, 2017 (XIX of 2017), in the manner so required and respectively give a true and fair view of the state of Company’s affairs as at December 31, 2020 and of the profit, total comprehensive income, the changes in equity and its cash flows for the year then ended.
Basis for Opinion
We conducted our audit in accordance with International Standards on Auditing (ISAs) as applicable in Pakistan. Our responsibilities under those standards are further described in the Auditor’s Responsibilities for the Audit of the Financial Statements section of our report. We are independent of the Company in accordance with the International Ethics Standards Board for Accountants’ Code of Ethics for Professional Accountants as adopted by the Institute of Chartered Accountants of Pakistan (the Code) and we have fulfilled our other ethical responsibilities in accordance with the Code. We believe that the audit evidence we have obtained is sufficient and appropriate to provide a basis for our opinion.
Key Audit Matters
Key audit matters are those matters that, in our professional judgment, were of most significance in our audit of the financial statements for the current period. These matters were addressed in the context of our audit of the financial statements as a whole and in forming our opinion thereon, and we do not provide a separate opinion on these matters.
KPMG Taseer Hadi & Co., a Partnership firm registered in Pakistan and a member firm of the KPMG global organizationof independent member firms affiliated with KPMG International Limited, a private English company limited by guarantee.
Annual Report 202058
KPMG Taseer Hadi & Co.
Following are the key audit matters:
S. No. Key audit matter(s) How the matters were addressed in our audit 1. Valuation of Claim Liabilities
Refer notes 3.16 and 26 to the financial statements relating to claim liabilities.The Company’s claim liabilities represent 20% of its total liabilities. Valuation of these claim liabilities involves significant management judgment regarding uncertainty in the estimation of claim payments and assessment of frequency and severity of claims. Claim liabilities are recognized on intimation of the insured event based on management judgment and estimation. The Company maintains provision for claims incurred but not reported (IBNR) based on the advice of an independent actuary. The actuarial valuation process involves significant judgment and the use of actuarial assumptions.We have identified the valuation of claim liabilities as a key audit matter because estimation of claim liabilities involves a significant degree of judgment.
Our audit procedures in respect of this matter included the following:• Obtained an understanding, evaluated the
design and tested the controls over the process of capturing, processing and recording of information related to the claims;
• Assessed the appropriateness of the Company’s accounting policy for recording of claims in line with requirements of applicable accounting and reporting standards;
• Inspected significant arrangements with reinsurer to obtain an understanding of contracts terms and assessed that recoveries from reinsurance on account of claims reported has been accounted for based on terms and conditions;
• Assessed on a sample basis the reinsurer’s share of claims against the term of the reinsurance contracts and the related recorded liabilities; and
• Tested claims transactions on sample basis with underlying documentations to evaluate that whether the claims reported during the year are recorded in accordance with the requirements of the Company’s policy and insurance regulations;
• Tested specific claims transactions on sample basis recorded close to year end and subsequent to year end with underlying documentation to assess whether claims had been recognized in the appropriate accounting period;
• Tested on sample basis the completeness, accuracy and reliability of the underlying data utilized by the management, to support the actuarial valuation;
Century Insurance 59
S. No. Key audit matter(s) How the matters were addressed in our audit
• Involved independent actuarial expert to review the reasonableness of the assumptions used and adequacy of IBNR reserve; and
• Assessed the adequacy of Company’s disclosures within the financial statements as per the relevant accounting and reporting requirements.
2. Revenue Recognition RiskRefer notes 3.6, 3.12, 25 and 29 to the financial statements relating to revenue recognition.The Company receives its revenue primarily from two main sources namely; premiums and invest-ments income. Premiums from insurance policies comprise of 91% of the total revenue.We identified revenue recognition as a key audit matter as it is one of the key performance indica-tors of the Company and because of the potential risk that revenue transactions may not be recog-nized in the appropriate period.
Our audit procedures in respect of this matter included the following:• Obtained an understanding, evaluated the design
and tested the controls over the process of capturing, processing and recording of premium income;
• Assessed the appropriateness of the Company’s accounting policy for recording of premiums and investment income in line with requirements of applicable accounting and reporting standards;
• Tested the premium recorded on sample basis to test the accuracy from the underlying policies issued to insurance contract holders;
• Recalculated the unearned portion of premium income and ensured that appropriate amount has been recorded as unearned premium reserve;
• For a sample of investment income transactions, tested that investment income is recorded based on the effective interest method or where right to receive the dividend is established;
• Tested the policies on sample basis where premium was recorded close to year end and subsequent to year end, and evaluated that these were recorded in the appropriate accounting period; and
• Tested the investment income transaction on sample basis and subsequent to year end and evaluated that these were recorded in the appropriate period.
KPMG Taseer Hadi & Co.
Annual Report 202060
S. No. Key audit matter(s) How the matters were addressed in our audit 3. Valuation of insurance / reinsurance receivables
Refer notes 3.9 and 13 to the financial statements relating to valuation of insurance / reinsurance receivables.The Company’s insurance / reinsurance receivables represent 16% of its total assets. Valuation of these receivables involves significant judgment regarding uncertainty in determining impairment / provisions.We identified the valuation of insurance / reinsurance receivables as a key audit matter as the estimation involves a significant degree of judgment.
Our audit procedures in respect of this matter included the following:• Tested the accuracy of insurance / reinsurance
receivables aging report, on a sample basis, by comparing individual balances in the report with underlying documentation to evaluate that the balances appearing in the ageing report were classified within appropriate ageing bucket; and
• Assessed the appropriateness of assumptions and estimates made by the management for the provision for impairment by comparing, on a sample basis, past experience and historical trends of collection, actual write offs and receipts and settlement from / with customers and reinsurer subsequent to the financial year end.
4. Valuation and Impairment of InvestmentsRefer notes 3.13, 3.19, 8, 9, 10 and 11 to the financial statements relating to Valuation and Impairment of Investments.The Company’s investment portfolio comprises of government debt securities, equity securities including investment in associates, other fixed income securities and term deposits.We identified the valuation and impairment of investments as a key audit matter because of the significance of investments and management’s judgment involved in valuation and impairment.
Our audit procedures in respect of this matter included the following:• Obtained an understanding, evaluated the
design and tested the operating effectiveness of controls designed for valuation and impairment of investments classified as available for sale;
• Assessed the methodology used and for a sample of investments evaluated the valuation of debt securities using the market yield pricing methodology based on interpolation of relevant rates and valuation of equity securities by comparing the quoted prices of Mutual Fund Association of Pakistan (MUFAP) and Pakistan Stock Exchange respectively for the securities; and
• Involved our internal valuation specialist to assist us in evaluating the assumptions and judgments adopted by the valuer in calculation of fair value of unlisted equity investment; and
• Assessed the appropriateness of impairment in the value of available for sale securities held by the Company in accordance with accounting and reporting standards as applicable in Pakistan.
KPMG Taseer Hadi & Co.
Century Insurance 61
Information Other than the Financial Statements and Auditor’s Report Thereon
Management is responsible for the Other Information. The Other Information comprises the information included in the Company’s Annual Report but does not include the financial statements and our auditor’s report thereon.
Our opinion on the financial statements does not cover the Other Information and we do not express any form of assurance conclusion thereon.
In connection with our audit of the financial statements, our responsibility is to read the Other Information and, in doing so, consider whether the Other Information is materially inconsistent with the financial statements or our knowledge obtained in the audit, or otherwise appears to be materially misstated. If, based on the work we have performed, we conclude that there is a material misstatement of this Other Information, we are required to report that fact. We have nothing to report in this regard.
Responsibilities of Management and Board of Directors for the Financial Statements
Management is responsible for the preparation and fair presentation of the financial statements in accordance with accounting and reporting standards as applicable in Pakistan and the requirements of Insurance Ordinance, 2000 and, Companies Act, 2017 (XIX of 2017), and for such internal control as management determines is necessary to enable the preparation of financial statements that are free from material misstatement, whether due to fraud or error.
In preparing the financial statements, management is responsible for assessing the Company’s ability to continue as a going concern, disclosing, as applicable, matters related to going concern and using the going concern basis of accounting unless management either intends to liquidate the Company or to cease operations, or has no realistic alternative but to do so.
Board of directors are responsible for overseeing the Company’s financial reporting process.
Auditor’s Responsibilities for the Audit of the Financial Statements
Our objectives are to obtain reasonable assurance about whether the financial statements as a whole are free from material misstatement, whether due to fraud or error, and to issue an auditor’s report that includes our opinion. Reasonable assurance is a high level of assurance but is not a guarantee that an audit conducted in accordance with ISAs as applicable in Pakistan will always detect a material misstatement when it exists. Misstatements can arise from fraud or error and are considered material if, individually or in the aggregate, they could reasonably be expected to influence the economic decisions of users taken on the basis of these financial statements.
As part of an audit, in accordance with ISAs as applicable in Pakistan, we exercise professional judgment and maintain professional skepticism throughout the audit. We also:
• Identify and assess the risks of material misstatement of the financial statements, whether due to fraud or error, design and perform audit procedures responsive to those risks, and obtain audit evidence that is sufficient and appropriate to provide a basis for our opinion. The risk of not detecting a material misstatement resulting from fraud is higher than for one resulting from error, as fraud may involve collusion, forgery, intentional omissions, misrepresentations, or the override of internal control.
• Obtain an understanding of internal control relevant to the audit in order to design audit procedures that are appropriate in the circumstances, but not for the purpose of expressing an opinion on the effectiveness of the Company’s internal control.
• Evaluate the appropriateness of accounting policies used and the reasonableness of accounting estimates and related disclosures made by management.
KPMG Taseer Hadi & Co.
Annual Report 202062

• Conclude on the appropriateness of management’s use of the going concern basis of accounting and, based on the audit evidence obtained, whether a material uncertainty exists related to events or conditions that may cast significant doubt on the Company’s ability to continue as a going concern. If we conclude that a material uncertainty exists, we are required to draw attention in our auditor’s report to the related disclosures in the financial statements or, if such disclosures are inadequate, to modify our opinion. Our conclusions are based on the audit evidence obtained up to the date of our auditor’s report. However, future events or conditions may cause the Company to cease to continue as a going concern.
• Evaluate the overall presentation, structure and content of the financial statements, including the disclosures, and whether the financial statements represent the underlying transactions and events in a manner that achieves fair presentation.
We communicate with the board of directors regarding, among other matters, the planned scope and timing of the audit and significant audit findings, including any significant deficiencies in internal control that we identify during our audit.
We also provide the board of directors with a statement that we have complied with relevant ethical requirements regarding independence, and to communicate with them all relationships and other matters that may reasonably be thought to bear on our independence, and where applicable, related safeguards.
From the matters communicated with the board of directors, we determine those matters that were of most significance in the audit of the financial statements of the current period and are therefore the key audit matters. We describe these matters in our auditor’s report unless law or regulation precludes public disclosure about the matter or when, in extremely rare circumstances, we determine that a matter should not be communicated in our report because the adverse consequences of doing so would reasonably be expected to outweigh the public interest benefits of such communication.
Report on other legal and regulatory requirements
Based on our audit, we further report that in our opinion:
a) proper books of account have been kept by the Company as required by the Insurance Ordinance, 2000 and the Companies Act, 2017 (XIX of 2017);
b) the statement of financial position, the profit and loss account, the statement of comprehensive income, the statement of changes in equity and the statement of cash flows together with the notes thereon have been drawn up in conformity with the Insurance Ordinance, 2000, the Companies Act, 2017 (XXI of 2017), and are in agreement with the books of account;
c) investments made, expenditure incurred and guarantees extended during the year were for the purpose of the Company’s business; and
d) zakat deductible at source under the Zakat and Ushr Ordinance, 1980 (XVIII of 1980), was deducted by the Company and deposited in the Central Zakat Fund established under section 7 of that Ordinance.
The engagement partner on the audit resulting in this independent auditor’s report is Muhammad Taufiq.
KPMG Taseer Hadi & Co.
Date: March 18, 2021 KPMG Taseer Hadi & Co.Chartered Accountants
Karachi
Century Insurance 63
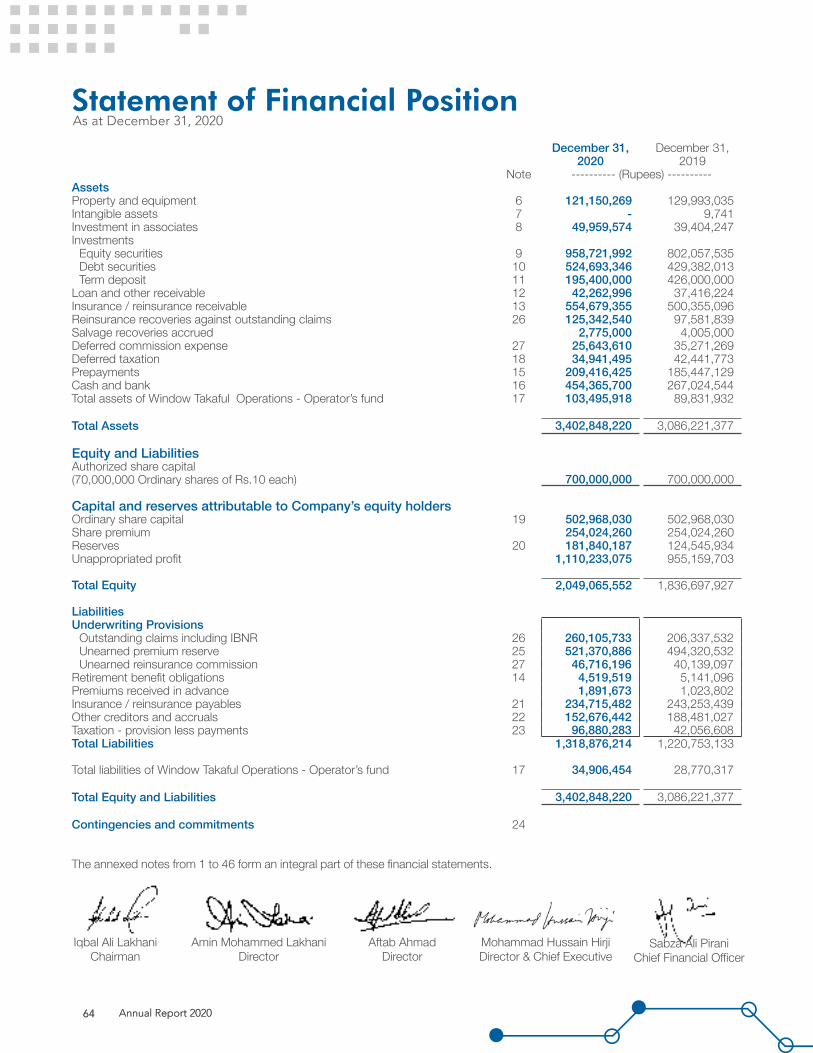
Statement of Financial Position As at December 31, 2020
December 31, December 31,2020 2019
Note ---------- (Rupees) ----------AssetsProperty and equipment 6 121,150,269 129,993,035 Intangible assets 7 - 9,741 Investment in associates 8 49,959,574 39,404,247 Investments
Equity securities 9 958,721,992 802,057,535 Debt securities 10 524,693,346 429,382,013 Term deposit 11 195,400,000 426,000,000
Loan and other receivable 12 42,262,996 37,416,224 Insurance / reinsurance receivable 13 554,679,355 500,355,096 Reinsurance recoveries against outstanding claims 26 125,342,540 97,581,839 Salvage recoveries accrued 2,775,000 4,005,000 Deferred commission expense 27 25,643,610 35,271,269 Deferred taxation 18 34,941,495 42,441,773 Prepayments 15 209,416,425 185,447,129 Cash and bank 16 454,365,700 267,024,544 Total assets of Window Takaful Operations - Operator’s fund 17 103,495,918 89,831,932
Total Assets 3,402,848,220 3,086,221,377
Equity and LiabilitiesAuthorized share capital(70,000,000 Ordinary shares of Rs.10 each) 700,000,000 700,000,000
Capital and reserves attributable to Company’s equity holdersOrdinary share capital 19 502,968,030 502,968,030 Share premium 254,024,260 254,024,260 Reserves 20 181,840,187 124,545,934 Unappropriated profit 1,110,233,075 955,159,703
Total Equity 2,049,065,552 1,836,697,927
LiabilitiesUnderwriting Provisions
Outstanding claims including IBNR 26 260,105,733 206,337,532 Unearned premium reserve 25 521,370,886 494,320,532 Unearned reinsurance commission 27 46,716,196 40,139,097
Retirement benefit obligations 14 4,519,519 5,141,096 Premiums received in advance 1,891,673 1,023,802 Insurance / reinsurance payables 21 234,715,482 243,253,439 Other creditors and accruals 22 152,676,442 188,481,027 Taxation - provision less payments 23 96,880,283 42,056,608 Total Liabilities 1,318,876,214 1,220,753,133
Total liabilities of Window Takaful Operations - Operator’s fund 17 34,906,454 28,770,317
Total Equity and Liabilities 3,402,848,220 3,086,221,377
Contingencies and commitments 24
The annexed notes from 1 to 46 form an integral part of these financial statements.
Iqbal Ali LakhaniChairman
Aftab AhmadDirector
Amin Mohammed LakhaniDirector
Sabza Ali PiraniChief Financial Officer
Mohammad Hussain HirjiDirector & Chief Executive
Annual Report 202064 Annual Report 202064
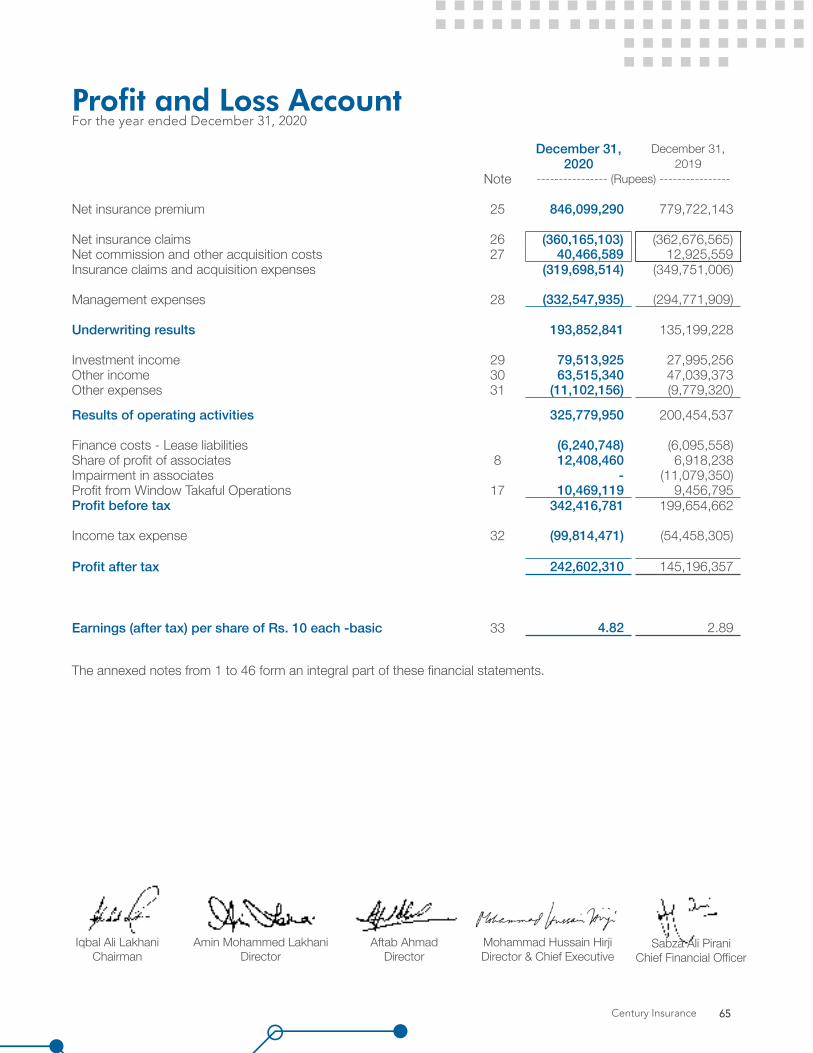
Profit and Loss AccountFor the year ended December 31, 2020
December 31, December 31,2020 2019
Note ---------------- (Rupees) ----------------
Net insurance premium 25 846,099,290 779,722,143
Net insurance claims 26 (360,165,103) (362,676,565)Net commission and other acquisition costs 27 40,466,589 12,925,559 Insurance claims and acquisition expenses (319,698,514) (349,751,006)
Management expenses 28 (332,547,935) (294,771,909)
Underwriting results 193,852,841 135,199,228
Investment income 29 79,513,925 27,995,256 Other income 30 63,515,340 47,039,373 Other expenses 31 (11,102,156) (9,779,320)
Results of operating activities 325,779,950 200,454,537
Finance costs - Lease liabilities (6,240,748) (6,095,558)Share of profit of associates 8 12,408,460 6,918,238 Impairment in associates - (11,079,350)Profit from Window Takaful Operations 17 10,469,119 9,456,795 Profit before tax 342,416,781 199,654,662
Income tax expense 32 (99,814,471) (54,458,305)
Profit after tax 242,602,310 145,196,357
Earnings (after tax) per share of Rs. 10 each -basic 33 4.82 2.89
The annexed notes from 1 to 46 form an integral part of these financial statements.
Iqbal Ali LakhaniChairman
Aftab AhmadDirector
Amin Mohammed LakhaniDirector
Sabza Ali PiraniChief Financial Officer
Mohammad Hussain HirjiDirector & Chief Executive
Century Insurance 6565

Statement of Comprehensive IncomeFor the year ended December 31, 2020
December 31, December 31,2020 2019
---------- (Rupees) ----------
Profit after tax 242,602,310 145,196,357
Other comprehensive income
Item that will never be reclassified to profit and loss account in subsequent year
Remeasurement of post retirement benefits obligation 425,924 (933,355)
Item to be reclassified to profit and loss account in subsequent period:
Unrealised appreciation ‘available for sale’ investments - net of tax 58,404,923 7,413,338
Reclassification adjustment for net (gain) / loss on available for sale investments included in profit and loss account - net of tax (1,205,445) 27,816,484
57,199,478 35,229,822 Other comprehensive income for the year
- Share in other comprehensive gain / (loss) of associates - net of tax 64,746 (125,492)
Unrealised appreciation / (diminution) on ‘available for sale’investments of Window Takaful Operations - net of tax 34,045 (60,730)
Reclassification adjustment for net loss / (gain) on available for sale investments included in profit and loss account of Window Takaful Operations - net of tax 60,730 (141,806)
94,775 (202,536)
Total comprehensive income for the year 300,387,233 179,164,796
The annexed notes from 1 to 46 form an integral part of these financial statements.
Iqbal Ali LakhaniChairman
Aftab AhmadDirector
Amin Mohammed LakhaniDirector
Sabza Ali PiraniChief Financial Officer
Mohammad Hussain HirjiDirector & Chief Executive
Annual Report 202066 Annual Report 202066
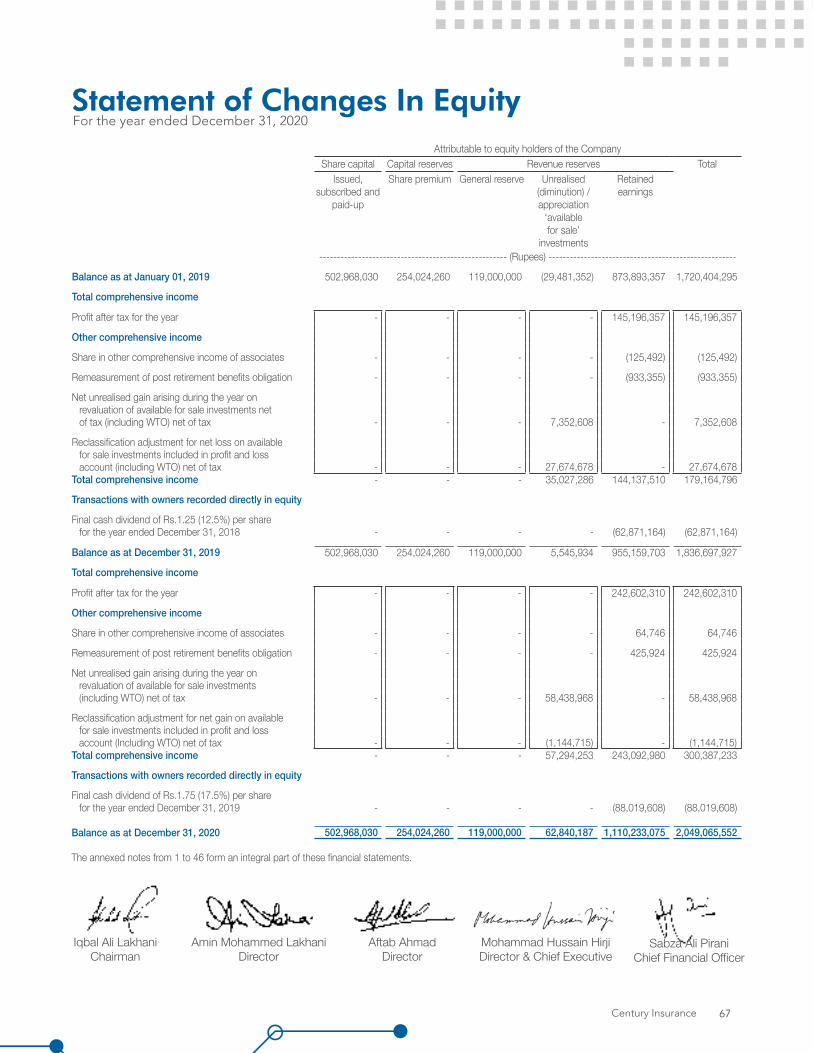
Statement of Changes In EquityFor the year ended December 31, 2020
Attributable to equity holders of the CompanyShare capital Capital reserves Revenue reserves Total
Issued, subscribed and
paid-up
Share premium General reserve Unrealised (diminution) / appreciation
‘available for sale’
investments
Retained earnings
----------------------------------------------------- (Rupees) -----------------------------------------------------
Balance as at January 01, 2019 502,968,030 254,024,260 119,000,000 (29,481,352) 873,893,357 1,720,404,295
Total comprehensive income
Profit after tax for the year - - - - 145,196,357 145,196,357
Other comprehensive income
Share in other comprehensive income of associates - - - - (125,492) (125,492)
Remeasurement of post retirement benefits obligation - - - - (933,355) (933,355)
Net unrealised gain arising during the year on revaluation of available for sale investments net of tax (including WTO) net of tax - - - 7,352,608 - 7,352,608
Reclassification adjustment for net loss on available for sale investments included in profit and loss account (including WTO) net of tax - - - 27,674,678 - 27,674,678
Total comprehensive income - - - 35,027,286 144,137,510 179,164,796
Transactions with owners recorded directly in equity
Final cash dividend of Rs.1.25 (12.5%) per share for the year ended December 31, 2018 - - - - (62,871,164) (62,871,164)
Balance as at December 31, 2019 502,968,030 254,024,260 119,000,000 5,545,934 955,159,703 1,836,697,927
Total comprehensive income
Profit after tax for the year - - - - 242,602,310 242,602,310
Other comprehensive income
Share in other comprehensive income of associates - - - - 64,746 64,746
Remeasurement of post retirement benefits obligation - - - - 425,924 425,924
Net unrealised gain arising during the year onrevaluation of available for sale investments (including WTO) net of tax - - - 58,438,968 - 58,438,968
Reclassification adjustment for net gain on available for sale investments included in profit and loss account (Including WTO) net of tax - - - (1,144,715) - (1,144,715)
Total comprehensive income - - - 57,294,253 243,092,980 300,387,233
Transactions with owners recorded directly in equity
Final cash dividend of Rs.1.75 (17.5%) per share for the year ended December 31, 2019 - - - - (88,019,608) (88,019,608)
Balance as at December 31, 2020 502,968,030 254,024,260 119,000,000 62,840,187 1,110,233,075 2,049,065,552
The annexed notes from 1 to 46 form an integral part of these financial statements.
Iqbal Ali LakhaniChairman
Aftab AhmadDirector
Amin Mohammed LakhaniDirector
Sabza Ali PiraniChief Financial Officer
Mohammad Hussain HirjiDirector & Chief Executive
Century Insurance 67
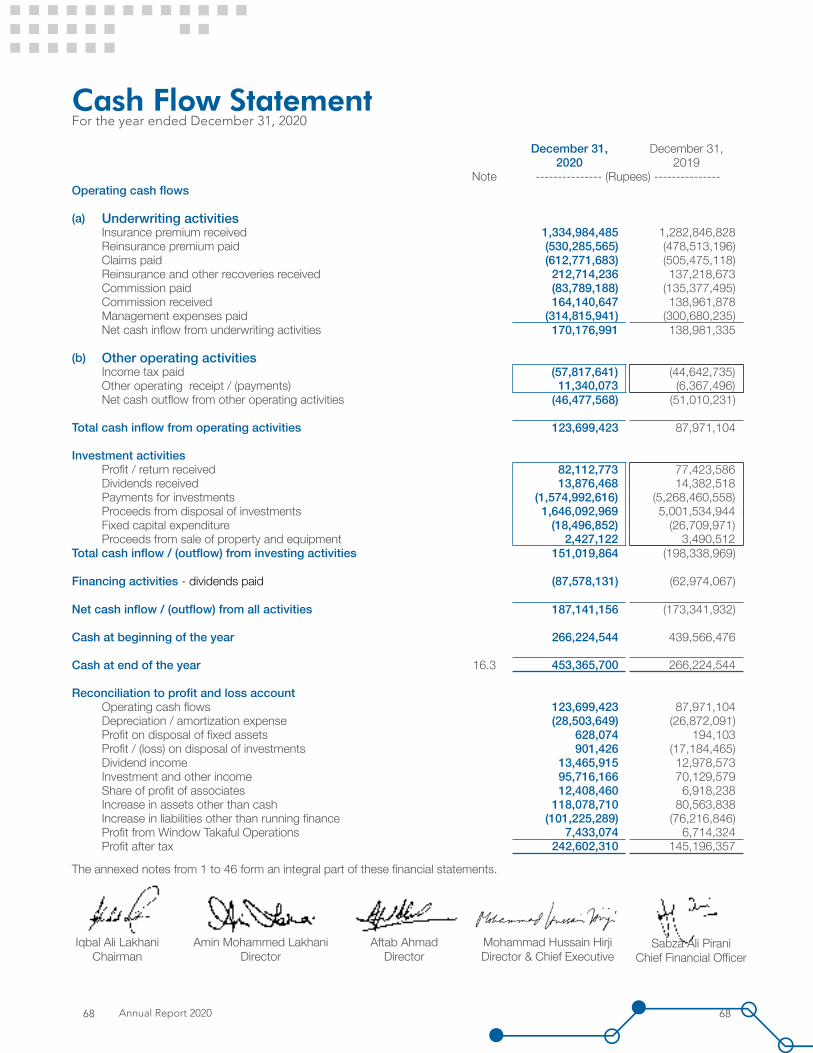
Cash Flow StatementFor the year ended December 31, 2020
December 31, December 31,2020 2019
Note --------------- (Rupees) ---------------Operating cash flows
(a) Underwriting activitiesInsurance premium received 1,334,984,485 1,282,846,828 Reinsurance premium paid (530,285,565) (478,513,196)Claims paid (612,771,683) (505,475,118)Reinsurance and other recoveries received 212,714,236 137,218,673 Commission paid (83,789,188) (135,377,495)Commission received 164,140,647 138,961,878 Management expenses paid (314,815,941) (300,680,235)Net cash inflow from underwriting activities 170,176,991 138,981,335
(b) Other operating activitiesIncome tax paid (57,817,641) (44,642,735)Other operating receipt / (payments) 11,340,073 (6,367,496)Net cash outflow from other operating activities (46,477,568) (51,010,231)
Total cash inflow from operating activities 123,699,423 87,971,104
Investment activitiesProfit / return received 82,112,773 77,423,586 Dividends received 13,876,468 14,382,518 Payments for investments (1,574,992,616) (5,268,460,558)Proceeds from disposal of investments 1,646,092,969 5,001,534,944 Fixed capital expenditure (18,496,852) (26,709,971)Proceeds from sale of property and equipment 2,427,122 3,490,512
Total cash inflow / (outflow) from investing activities 151,019,864 (198,338,969)
Financing activities - dividends paid (87,578,131) (62,974,067)
Net cash inflow / (outflow) from all activities 187,141,156 (173,341,932)
Cash at beginning of the year 266,224,544 439,566,476
Cash at end of the year 16.3 453,365,700 266,224,544
Reconciliation to profit and loss accountOperating cash flows 123,699,423 87,971,104 Depreciation / amortization expense (28,503,649) (26,872,091)Profit on disposal of fixed assets 628,074 194,103 Profit / (loss) on disposal of investments 901,426 (17,184,465)Dividend income 13,465,915 12,978,573 Investment and other income 95,716,166 70,129,579 Share of profit of associates 12,408,460 6,918,238 Increase in assets other than cash 118,078,710 80,563,838 Increase in liabilities other than running finance (101,225,289) (76,216,846)Profit from Window Takaful Operations 7,433,074 6,714,324 Profit after tax 242,602,310 145,196,357
The annexed notes from 1 to 46 form an integral part of these financial statements.
Iqbal Ali LakhaniChairman
Aftab AhmadDirector
Amin Mohammed LakhaniDirector
Sabza Ali PiraniChief Financial Officer
Mohammad Hussain HirjiDirector & Chief Executive
Annual Report 202068 68
Notes to and Forming part of the Financial StatementsFor the year ended December 31, 2020
1. LEGAL STATUS AND NATURE OF BUSINESS
Century Insurance Company Limited (the Company) is a public limited company incorporated in Pakistan on October 10, 1985 under the Companies Act 2017. The Company is listed on the Pakistan Stock Exchange Limited and is engaged in general insurance business. The registered office of the Company is situated at Lakson Square Building No. 2, Sarwar Shaheed Road, Karachi.
The Company was granted authorization on August 07, 2017 under Rule 6 of the Takaful Rules, 2012 to undertake Window Takaful Operations by Securities and Exchange Commission of Pakistan (SECP) and under Takaful Rules, 2012 to carry on general takaful operations in Pakistan. The Company has formed a Waqf for Participants’ Fund (“PTF”) by executing the Waqf deed dated August 17, 2017. The Company commenced its activities of Window Takaful Operations on August 18, 2017.
1.1 Impact of COVID-19 on the unconsolidated financial statements
During the year, the novel coronavirus (COVID-19) emerged and since then, the condition has continued to deteriorate. On January 30, 2020, the International Health Regulations Emergency Committee of the WHO declared the outbreak a “Public Health Emergency of International Concern”. The COVID-19 pandemic has significantly impacted the market around the world to date and may continue to do so in the coming months of 2020. The scale and duration of this outbreak remains uncertain and as it evolves globally in 2020, the Company based on its current assessment considered that there would be no significant impact that will adversely affect its business, result of operations and financial condition of the Company.
2. BASIS OF PREPARATION AND STATEMENT OF COMPLIANCE
These financial statements have been prepared in accordance with accounting and reporting standards as applicable in Pakistan. The accounting and reporting standards comprise of:
- International Financial Reporting Standards (IFRS) issued by the International Accounting Standard Board (IASB) as are notified under Companies Act, 2017; and
- Provision of and directive issued under the Companies Act, 2017 and Insurance Ordinance, 2000, Insurance Rules, 2017, Insurance Accounting Regulations, 2017 and Takaful Rules, 2012 and General Takaful Accounting Regulations 2019.
lncase requirements differ, the provisions or directives of the Companies Act, 2017, the Insurance Ordinance, 2000, the Insurance Rules, 2017, the Insurance Accounting Regulations, 2017 and Takaful Rules, 2012 and General Takaful Accounting Regulations 2019, shall prevail.
The Securities and Exchange Commission of Pakistan (SECP) vide its S.R.O 89 (1) /2017 dated February 09, 2017 has prescribed format of the presentation of annual financial statements for general insurance companies. These financial statements have been prepared in accordance with the format prescribed by the SECP.
Total assets, total liabilities and profit of the Window Takaful Operations of the Company referred to as the Operator’s Fund has been presented in these financial statements in accordance with the requirements of Circular 25 of 2015 dated July 09, 2015.
2.1 Basis of measurement
These financial statements have been prepared under historical cost convention except for certain investments which are stated at their fair values, staff gratuity and lease laibility which is stated at present value.
2.2 Functional and presentation currency
These financial statements are presented in Pak Rupees which is also the Company’s functional and presentation currency.
Century Insurance 69
2.3 Standards, interpretations and amendments to accounting and reporting standards as applicable in Pakistan that are not yet effective
The following International Financial Reporting Standards (IFRS Standards) as notified under the Companies Act, 2017 and the amendments and interpretations thereto will be effective for accounting periods beginning on or after January 01, 2021:
- COVID-19-Related Rent Concessions (Amendment to IFRS 16) – the International Accounting Standards Board (the Board) has issued amendments to IFRS 16 (the amendments) to provide practical relief for lessees in accounting for rent concessions. The amendments are effective for periods beginning on or after June 01, 2020, with earlier application permitted. Under the standard’s previous requirements, lessees assess whether rent concessions are lease modifications and, if so, apply the specific guidance on accounting for lease modifications. This generally involves remeasuring the lease liability using the revised lease payments and a revised discount rate. In light of the effects of the COVID-19 pandemic, and the fact that many lessees are applying the standard for the first time in their financial statements, the Board has provided an optional practical expedient for lessees. Under the practical expedient, lessees are not required to assess whether eligible rent concessions are lease modifications, and instead are permitted to account for them as if they were not lease modifications. Rent concessions are eligible for the practical expedient if they occur as a direct consequence of the COVID-19 pandemic and if all the following criteria are met:
- the change in lease payments results in revised consideration for the lease that is substantially the same as, or less than, the consideration for the lease immediately preceding the change;
- any reduction in lease payments affects only payments originally due on or before June 30, 2021; and
- there is no substantive change to the other terms and conditions of the lease.
- Interest Rate Benchmark Reform – Phase 2 which amended IFRS 9, IAS 39, IFRS 7, IFRS 4 and IFRS 16 is applicable for annual financial periods beginning on or after January 01, 2021, with earlier application permitted. The amendments introduce a practical expedient to account for modifications of financial assets or financial liabilities if a change results directly from IBOR reform and occurs on an ‘economically equivalent’ basis. In these cases, changes will be accounted for by updating the effective interest rate. A similar practical expedient will apply under IFRS 16 for lessees when accounting for lease modifications required by IBOR reform. The amendments also allow a series of exemptions from the regular, strict rules around hedge accounting for hedging relationships directly affected by the interest rate benchmark reforms. The amendments apply retrospectively with earlier application permitted. Hedging relationships previously discontinued solely because of changes resulting from the reform will be reinstated if certain conditions are met.
- Onerous Contracts – Cost of Fulfilling a Contract (Amendments to IAS 37) effective for the annual period beginning on or after January 01, 2022 amends IAS 1 by mainly adding paragraphs which clarifies what comprise the cost of fulfilling a contract, Cost of fulfilling a contract is relevant when determining whether a contract is onerous. An entity is required to apply the amendments to contracts for which it has not yet fulfilled all its obligations at the beginning of the annual reporting period in which it first applies the amendments (the date of initial application). Restatement of comparative information is not required, instead the amendments require an entity to recognize the cumulative effect of initially applying the amendments as an adjustment to the opening balance of retained earnings or other component of equity, as appropriate, at the date of initial application.
Notes to and Forming part of the Financial StatementsFor the year ended December 31, 2020
Annual Report 202070
- Annual Improvements to IFRS standards 2018-2020:
The following annual improvements to IFRS standards 2018-2020 are effective for annual reporting periods beginning on or after January 01, 2022.
- IFRS 9 – The amendment clarifies that an entity includes only fees paid or received between the entity (the borrower) and the lender, including fees paid or received by either the entity or the lender on the other’s behalf, when it applies the ‘10 per cent’ test in paragraph B3.3.6 of IFRS 9 in assessing whether to derecognize a financial liability.
- IFRS 16 – The amendment partially amends Illustrative Example 13 accompanying IFRS 16 by excluding the illustration of reimbursement of leasehold improvements by the lessor. The objective of the amendment is to resolve any potential confusion that might arise in lease incentives.
- Classification of liabilities as current or non-current (Amendments to IAS 1) effective for the annual period beginning on or after January 01, 2022. These amendments in the standards have been added to further clarify when a liability is classified as current. The standard also amends the aspect of classification of liability as non-current by requiring the assessment of the entity’s right at the end of the reporting period to defer the settlement of liability for at least twelve months after the reporting period. An entity shall apply those amendments retrospectively in accordance with IAS 8.
- Sale or Contribution of Assets between an Investor and its Associate or Joint Venture (Amendments to IFRS 10 and IAS 28) – The amendment amends accounting treatment on loss of control of business or assets. The amendments also introduce new accounting for less frequent transaction that involves neither cost nor full step-up of certain retained interests in assets that are not businesses. The effective date for these changes has been deferred indefinitely until the completion of a broader review.
- Standards effective during the year
- Amendment to IFRS 3 ‘Business Combinations’ – Definition of a Business (effective for business combinations for which the acquisition date is on or after the beginning of annual period beginning on or after January 01, 2020). The Board has issued amendments aiming to resolve the difficulties that arise when an entity determines whether it has acquired a business or a group of assets. The amendments clarify that to be considered a business, an acquired set of activities and assets must include, at a minimum, an input and a substantive process that together significantly contribute to the ability to create outputs. The amendments include an election to use a concentration test.
- Amendments to IAS 1 Presentation of Financial Statements and IAS 8 Accounting Policies, Changes in Accounting Estimates and Errors (effective for annual periods beginning on or after January 01, 2020). The amendments are intended to make the definition of material in IAS 1 easier to understand and are not intended to alter the underlying concept of materiality in IFRS Standards. In addition, the Board has also issued guidance on how to make materiality judgments when preparing their general purpose financial statements in accordance with IFRS Standards.
- On March 29, 2018, the Board has issued a revised Conceptual Framework for Financial Reporting which is applicable immediately contains changes that will set a new direction for IFRS in the future. The Conceptual Framework primarily serves as a tool for the Board to develop standards and to assist the IFRS Interpretations Committee in interpreting them. It does not override the requirements of individual IFRSs and any inconsistencies with the revised Framework will be subject to the usual due process – this means that the overall impact on standard setting may take some time to crystallize. The companies may use the Framework as a reference for selecting their accounting policies in the absence of specific IFRS requirements. In these cases, companies should review those policies and apply the new guidance retrospectively as of January 01, 2020, unless the new guidance contains specific scope outs.
Century Insurance 71
Notes to and Forming part of the Financial StatementsFor the year ended December 31, 2020
- Interest Rate Benchmark Reform which amended IFRS 9, IAS 39 and IFRS 7 is applicable for annual financial periods beginning on or after January 01, 2020. The G20 asked the Financial Stability Board (FSB) to undertake a fundamental review of major interest rate benchmarks. Following the review, the FSB published a report setting out its recommended reforms of some major interest rate benchmarks such as IBORs. Public authorities in many jurisdictions have since taken steps to implement those recommendations. This has in turn led to uncertainty about the long-term viability of some interest rate benchmarks. In these amendments, the term ‘interest rate benchmark reform’ refers to the market-wide reform of an interest rate benchmark including its replacement with an alternative benchmark rate, such as that resulting from the FSB’s recommendations set out in its July 2014 report ‘Reforming Major Interest Rate Benchmarks’ (the reform). The amendments made provide relief from the potential effects of the uncertainty caused by the reform. A company shall apply the exceptions to all hedging relationships directly affected by interest rate benchmark reform.
3. SUMMARY OF SIGNIFICANT ACCOUNTING POLICIES
The principal accounting policies applied in the preparation of these financial statements have been consistently applied to all periods presented.
3.1 Property and Equipment
3.1.1 Tangibles
These are stated at cost less accumulated depreciation and impairment loss, if any. Depreciation is charged over the estimated useful life of the asset on a systematic basis to income applying the straight line method at the rates specified in note 6.1 to the financial statements, after taking into account residual value.
Depreciation on additions is charged from the month in which the asset is put to use whereas no depreciation is charged from the month the asset is disposed off.
Subsequent costs are included in the assets’ carrying amount or recognised as a separate asset, as appropriate, only when it is possible that the future economic benefits associated with the items will flow to the company and the cost of the item can be measured reliably. Maintenance and normal repairs are charged to profit and loss account currently.
An item of tangible asset is derecognised upon disposal or when no future economic benefits are expected from its use or disposal. Any gain or loss arising on derecognition of the asset (calculated as the difference between the net disposal proceeds and the carrying amount of the asset) is included in the profit and loss in the year the asset is derecognised.
Depreciation methods, useful lives and residual values that is significant in relation to the total cost of the asset are reviewed, and adjusted if appropriate, at each reporting date.
3.1.2 Capital work-in-progress
Capital work-in-progress including advances made for capital expenditure is stated at cost less impairment, if any.
3.2 Intangibles
An intangible asset is recognised as an asset if it is probable that future economic benefits attributable to the asset will flow to the entity and the cost of such asset can be measured reliably.
Costs directly associated with identifiable software that will have probable economic benefits exceeding costs beyond one year, are recognised as an intangible asset.
Annual Report 202072

Indefinite Intangible
These are stated at cost less impairment, if any.
Definite Intangible
a) These are stated at cost less accumulated amortization and impairment, if any.
b) Intangible assets are amortized on straight line basis over its estimated useful life(s) (refer note 7).
c) Amortization on additions is charged from month in which the asset is put to use, whereas no amortization is charged from the month the assets is disposed off.
The carrying amounts are reviewed at each reporting date to assess whether these are recorded in excess of their recoverable amounts, and where carrying values exceed estimated recoverable amount, assets’ are written down to their estimated recoverable amounts.
3.3 Leases
A contract is, or contains a lease if the contract conveys a right to control the use of an identified asset for a period of time in exchange for consideration. The Company mainly leases properties for its operations. The Company recognizes a right-of-use asset and lease liability at the lease commencement date. The right-of-use asset is initially measured at cost, and subsequently at cost less any accumulated depreciation and impairment losses, and adjusted for certain remeasurements of the lease liability. The right-of-use asset is depreciated using the straight line method from the commencement date to the earlier of end of the useful life of right-of-use asset or end of the lease term. The estimated useful lives of assets are determined on the same basis as that for owned assets. In addition, the right-of-use asset is periodically reduced by impairment losses, if any.
The lease liability is initially measured at the present value of the lease payments that are not paid at the commencement date, discounted using the interest rate implicit in the lease or, if that rate cannot be readily determined, the Company’s incremental borrowing rate. The lease liability is subsequently increased by the interest cost on the lease liability and decreased by lease payments made. It is re-measured when there is a change in future lease payments arising from a change in an index or rate, a change in assessment of whether extension option is reasonably certain to be exercised or a termination option is reasonably certain not to be exercised.
The Company has elected not to recognize right-of-use assets and lease liabilities for short term and low value assets. The lease payments associated with these leases are recognized as an expenses on a straight line basis over the lease term. The right-of-use assets are presented in the same line items as it presents underlying assets of the same nature that it owns.
3.4 Insurance contracts
Insurance contracts represent contracts with policy holders and reinsurers.
Those contracts where the Company (the insurer) has accepted significant insurance risk from another party (the policy holders) by agreeing to compensate the policy holders if a specified uncertain future event (the insured event) adversely affects the policy holders are insurance policy contracts. The Company enters into fire and property damage, marine, motor, health, burglary, loss of cash in transit, travel, personal accident, money, engineering losses and other insurance contracts with group companies, corporate clients and individuals residing or located in Pakistan.
Century Insurance 73
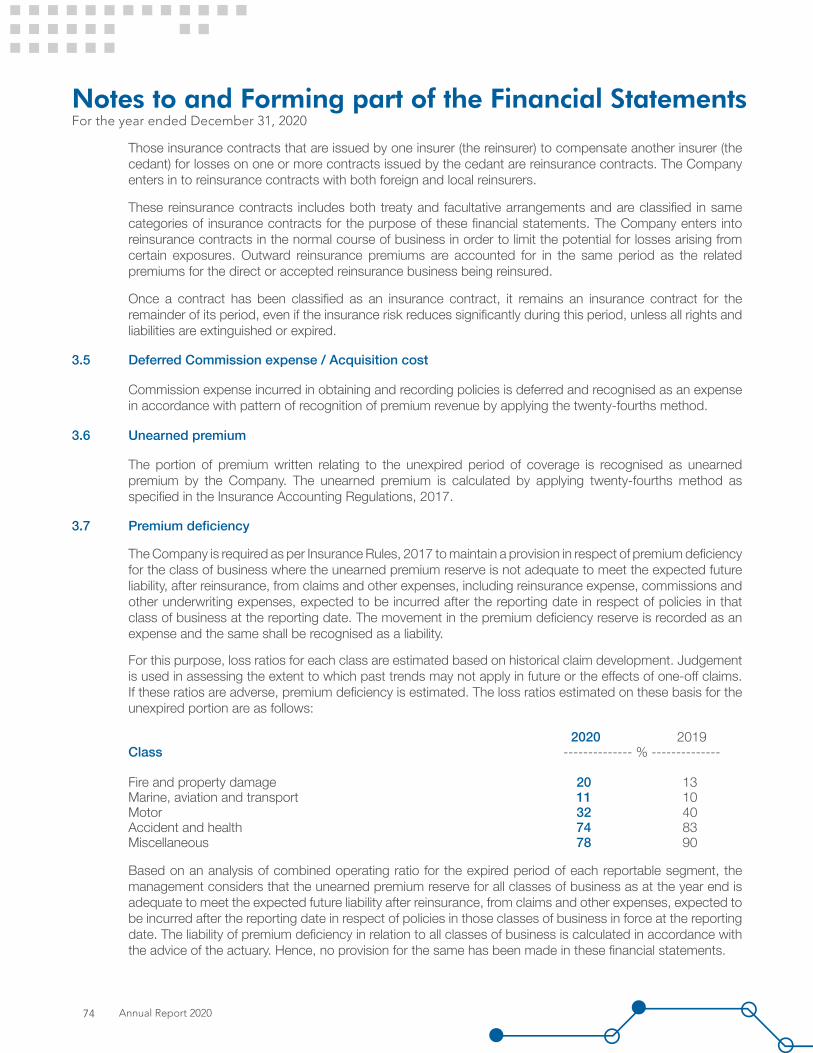
Notes to and Forming part of the Financial StatementsFor the year ended December 31, 2020
Those insurance contracts that are issued by one insurer (the reinsurer) to compensate another insurer (the cedant) for losses on one or more contracts issued by the cedant are reinsurance contracts. The Company enters in to reinsurance contracts with both foreign and local reinsurers.
These reinsurance contracts includes both treaty and facultative arrangements and are classified in same categories of insurance contracts for the purpose of these financial statements. The Company enters into reinsurance contracts in the normal course of business in order to limit the potential for losses arising from certain exposures. Outward reinsurance premiums are accounted for in the same period as the related premiums for the direct or accepted reinsurance business being reinsured.
Once a contract has been classified as an insurance contract, it remains an insurance contract for the remainder of its period, even if the insurance risk reduces significantly during this period, unless all rights and liabilities are extinguished or expired.
3.5 Deferred Commission expense / Acquisition cost
Commission expense incurred in obtaining and recording policies is deferred and recognised as an expense in accordance with pattern of recognition of premium revenue by applying the twenty-fourths method.
3.6 Unearned premium
The portion of premium written relating to the unexpired period of coverage is recognised as unearned premium by the Company. The unearned premium is calculated by applying twenty-fourths method as specified in the Insurance Accounting Regulations, 2017.
3.7 Premium deficiency
The Company is required as per Insurance Rules, 2017 to maintain a provision in respect of premium deficiency for the class of business where the unearned premium reserve is not adequate to meet the expected future liability, after reinsurance, from claims and other expenses, including reinsurance expense, commissions and other underwriting expenses, expected to be incurred after the reporting date in respect of policies in that class of business at the reporting date. The movement in the premium deficiency reserve is recorded as an expense and the same shall be recognised as a liability.
For this purpose, loss ratios for each class are estimated based on historical claim development. Judgement is used in assessing the extent to which past trends may not apply in future or the effects of one-off claims. If these ratios are adverse, premium deficiency is estimated. The loss ratios estimated on these basis for the unexpired portion are as follows:
2020 2019Class -------------- % --------------
Fire and property damage 20 13Marine, aviation and transport 11 10Motor 32 40Accident and health 74 83Miscellaneous 78 90
Based on an analysis of combined operating ratio for the expired period of each reportable segment, the management considers that the unearned premium reserve for all classes of business as at the year end is adequate to meet the expected future liability after reinsurance, from claims and other expenses, expected to be incurred after the reporting date in respect of policies in those classes of business in force at the reporting date. The liability of premium deficiency in relation to all classes of business is calculated in accordance with the advice of the actuary. Hence, no provision for the same has been made in these financial statements.
Annual Report 202074
3.8 Reinsurance contracts held
Reinsurance liabilities represent balances due to reinsurance companies. Balances payable are estimated in a manner consistent with the related reinsurance contract. Reinsurance assets represent balances due from reinsurance companies. Amounts recoverable from reinsurers are estimated in a manner consistent with the provision for outstanding claims or settled claims associated with the reinsurance policies and are in accordance with the related reinsurance contract.
Reinsurance assets are not offset against related insurance liabilities. Income or expenses from reinsurance contract are not offset against expenses or income from related insurance assets as required by Insurance Ordinance, 2000. Reinsurance assets or liabilities are derecognised when the contractual rights are extinguished or expired.
The Company assesses its reinsurance assets for impairment on reporting date. If there is an objective evidence that the reinsurance asset is impaired, the Company reduces the carrying amount of the reinsurance asset to its recoverable amount and recognises it as impairment loss.
3.9 Receivables and payables related to insurance contracts
Receivables including premium due but unpaid, relating to insurance contracts are recognised when due. The claim payable is recorded when intimation is received. These are recognized at cost, which is the fair value of the consideration given less provision for impairment, if any. Premium received in advance is recognised as liability till the time of issuance of insurance contract thereagainst.
If there is an objective evidence that any premium due but unpaid is impaired, the Company reduces the carrying amount of that insurance receivable and recognizes the loss in profit and loss account.
3.10 Segment reporting
An operating segment is a component of the Company that engages in business activities from which it may earn revenues and incur expenses including revenues and expenses that relate to transactions with any of the Company’s other components. All operating segments’ results are reviewed regularly by the Company’s chief operating decision maker to make decisions about resources to be allocated to the segment and assess its performance, and for which discrete financial information is available.
The Company presents segments reporting of operating results using the classes of business as specified under the Insurance Ordinance, 2000 and the Insurance Rule, 2017. The reported operating segments are also consistent with the internal reporting provided to Board of Directors which are responsible for allocating resources and assessing performance of the operating segments. The performance of segments is evaluated on the basis of underwriting results of each segment.
The Company has five primary business segments for reporting purposes namely fire, marine, motor, accident & health and miscellaneous.
The perils covered under fire insurance include damages caused by fire, riot and strike, explosion, earthquake, atmospheric damage, flood, electric fluctuation and terrorism.
Marine insurance provides coverage against cargo risk, war risk and damages occurring in inland transit.
Motor insurance provides comprehensive car coverage and indemnity against third party loss.
Accident and health insurance provides cover to compensate personal accident, hospitalisation and outpatient medical coverage to the insured.
Miscellaneous insurance provides cover against burglary, loss of cash in safe and cash in transit, travel, money, engineering losses and other covers.
Century Insurance 75
Notes to and Forming part of the Financial StatementsFor the year ended December 31, 2020
Financing, investment and income taxes are managed on an overall basis and are therefore, not allocated to any segment.
Assets, liabilities and capital expenditures that are directly attributable to segments have been assigned to them. Those assets and liabilities which cannot be allocated to a particular segment on a reasonable basis are reported as unallocated corporate assets and liabilities. Management expenses are allocated to a particular segment on the basis of premium written.
3.11 Cash and cash equivalents
Cash and cash equivalents for cash flow purposes include cash in hand, policy stamps, bank balances and the term deposit receipts having a maturity of not more than twelve months and are subject to insignificant risk of change in value.
3.12 Revenue Recognition
a) Premiums
Premiums under a policy are recognised as revenue at the time of issuance of insurance policy / cover note. Where the pattern of incidence of risk varies over the period of the policy, premium is recognised as revenue in accordance with the pattern of the incidence of risk. Administrative surcharge is recognised as revenue at the time of issuance of insurance policy.
b) Commission Income
Commission income from reinsurers is recognised at the time of issuance of the underlying insurance policy by the Company. This income is deferred and brought to account as revenue in accordance with the pattern of recognition of the reinsurance premium to which it relates. Profit / commission, if any, under the terms of reinsurance arrangements, is recognised when the Company’s right to receive the same is established.
c) Investment income
- Income from held to maturity investments is recognised on a time proportion basis taking into account the effective yield on the investments. The difference between the redemption value and the purchase price of the held to maturity investments is amortized and taken to the profit and loss account over the term of the investment.
- Dividend income from investments, other than those which are accounted for under the equity method is recognised when the Company’s right to receive the payment is established.
- Gain or loss on sale of investment is included in income currently.
- Return on bank deposits is recognised on a time proportionate basis taking into account the effective yield.
- Return on fixed income securities is recognised on a time proportion basis taking into account the effective yield on the investments.
3.13 Investments
3.13.1 Classification and Recognition
All investments are initially recognised at cost, being the fair value of the consideration given and include transaction costs, except for held for trading in which case transaction costs are charged to the profit and loss account. These are recognized and classified as follows:
Annual Report 202076

- Held for trading- Held to maturity- Available-for-sale
The classification depends on the purpose for which the financial assets were acquired.
3.13.2 Measurement
3.13.2.1 Held for trading
Investments which are acquired principally for the purposes of generating profit from short-term fluctuation in market price or are part of the portfolio in which there is recent actual pattern of short term profit taking are classified as held for trading.
Investments which are designated as held for trading upon initial recognition.
Subsequent to initial recognition, these investments are remeasured at fair market value. Gains or losses on investments on remeasurement of these investments are recognised in profit and loss account.
3.13.2.2 Held to maturity
Investments with fixed maturity, where management has both the intent and the ability to hold to maturity, are classified as held to maturity.
Subsequently, these are measured at amortized cost less provision for impairment, if any. Any premium paid or discount availed on acquisition of held to maturity investment is deferred and amortised over the term of investment using the effective yield.
3.13.2.3 Available-for-sale
Investments which are not eligible to be classified as “held for trading” or “held to maturity” are classified as ‘available-for-sale’. These investments are intended to be held for an indefinite period of time which may be sold in response to the need for liquidity, changes in interest rates, equity prices or exchange rates are classified as available-for-sale.
Subsequent to initial recognition, these investments are remeasured at fair value. Gains or losses on investments on remeasurement of these investments are recognised in statement of comprehensive income.
3.13.2.4 Fair / market value measurements
For investments in Government securities, fair / market value is determined by reference to quotations obtained from MUFAP page (PKRV) where applicable. For investments in quoted marketable securities, other than Term Finance Certificates, fair / market value is determined by reference to Stock Exchange quoted market price at the close of business on reporting date. The fair market value of Term Finance Certificates is as per the rates issued by the Mutual Funds Association of Pakistan (MUFAP).
3.13.2.5 Investment in associates - equity method
Investments in associates, where the Company has significant influence but not control, are accounted for by using the equity method of accounting. These investments are initially recognised at cost, thereafter the Company’s share of the changes in the net assets of the associates are accounted for at the end of each reporting period less impairment loss, if any. Share of profit and loss of associate is accounted for in the Company’s profit and loss account, whereas changes in the associate’s equity which has not been recognised in the associates profit and loss account, are recognised directly in equity of the Company. The goodwill relating to an associate arising on the acquisition of the investment is included in the carrying value of the investments.
Century Insurance 77

Notes to and Forming part of the Financial StatementsFor the year ended December 31, 2020
After the application of equity method including recognising the associates losses, the Company determines whether it is necessary to recognise any additional impairment loss with respect to its net investment in associate by comparing the entire carrying amount including goodwill with its recoverable amount i.e. the higher of value in use or fair market price less cost to sell. An impairment loss is reversed if there has been a change in estimates used to determine the recoverable amount but limited to the extent of carrying amount that would have been determined if no impairment loss had been recognized. A reversal of impairment loss is recognized in the profit and loss account.
3.13.2.6 Date of recognition
Regular way purchases and sales of investments that require delivery within the time frame established by regulations or market convention are recognised at the trade date. Trade date is the date on which the Company commits to purchase or sell the investment.
3.14 Offsetting of financial assets and liabilities
Financial assets and financial liabilities are only offset and the net amount reported in the financial statements when there is a legally enforceable right to set off the recognised amount and the Company intends to either settle on a net basis, or to realise the asset and settle the liability simultaneously.
3.15 Creditors, accruals and provisions
Liabilities for creditors and other amounts payable are carried at cost which is the fair value of the consideration to be paid in the future for the services received, whether or not billed to the Company.
Provisions are recognised when the Company has a present legal or constructive obligation as a result of past events, it is probable that an outflow of resources embodying economic benefits will be required to settle the obligation and a reliable estimate of the amount can be made. Provisions are reviewed at each reporting date and adjusted to reflect the current best estimate.
3.16 Claims expense and Provision for outstanding claims including Incurred But Not Reported (IBNR)
Insurance claims include all claims occurred, whether reported or not. Internal and external claims handling costs that are directly related to the processing and settlement of claims, a reduction for the value of salvage and other recoveries, and any adjustments to claims outstanding from previous years.
Provision for outstanding claims include amounts in relation to unpaid reported claims, claims incurred but not reported (IBNR) and expected claims settlement costs.
Outstanding claims
The amount of claims that have been reported and are yet unpaid or partially unpaid at the end of reporting year for a given accident year.
A liability for outstanding claims (claim incurred) is recognized for all claims incurred which represents the estimates of the claims intimated or assessed before the end of the reporting period and measured at the undiscounted value of expected future payments. The claims are considered to be incurred at the time of the incident giving rise to the claim except as otherwise expressly indicated in an insurance contract. Provision for liability in respect of unpaid reported claims is made on the basis of individual case estimates while taking into consideration the past claims settlement experience including handling costs and the Company’s reserving policy. Where applicable, deductions are made for salvage and their recoveries.
Reinsurance recoveries against outstanding claims and salvage recoveries are recognized as an asset and measured at the amount expected to be received.
Annual Report 202078
Incurred But Not Reported (IBNR) Claims
The losses that have incurred or are in the occurrence period at the end of reporting year and have not been intimated to the Company by that end of reporting year, or if reported, complete details are not available to the Company, so as to ascertain the amount of loss for that claim as claims outstanding.
The Company is required, as per SECP circular no. 9 of 2016 dated March 09, 2016 “Guidelines for Estimation of Incurred but not reported claims reserve, 2016” to estimate and maintain the provision for claims incurred but not reported for each class of business by using prescribed Method “Chain Ladder Method” and other alternate method as allowed under the provisions of the Guidelines. The actuarial valuation as at December 31, 2020 has been carried out by independent firm of actuaries for determination of IBNR for each class of business.
3.17 Taxation
Income tax expense comprises current and deferred tax including Window Takaful Operations. Income tax expense is recognised in the profit and loss account, except to the extent that it relates to items recognised directly in equity or in other comprehensive income, in which case it is recognised in equity or in other comprehensive income respectively. In making the estimates for income taxes currently payable by the Company, the management considers the current income tax law and the decisions of appellate authorities on certain issues in the past.
Current
Current tax is the expected tax payable or receivable on the taxable income or loss for the year, using tax rates enacted or substantively enacted at the reporting date, and any adjustment to tax payable in respect of previous years.
Provisions for current taxation is based on taxability of certain income streams of the Company under presumptive / final tax regime at the applicable tax rates and remaining income streams chargeable at current rate of taxation under the normal tax regime and / or minimum tax liability, as applicable, after taking into account tax credits and tax rebates available, if any.
Deferred
Deferred tax is recognised using balance sheet liability method, providing for temporary difference between the carrying amounts of assets and liabilities for financial reporting purposes and the amounts used for taxation purposes. The amount of deferred tax provided is based on the expected manner of realisation or settlement of the carrying amount of assets and liabilities, using the tax rates enacted or substantively enacted at the reporting date.
The Company recognises a deferred tax asset to the extent of taxable timing differences or it is probable that taxable profits for the foreseeable future will be available against which the assets can be utilised. Deferred tax assets are reduced to the extent that it is no longer probable that the related tax benefit will be realised.
3.18 Staff Retirement benefits
3.18.1 Defined benefit plan
The Company operates an approved and funded gratuity scheme for all permanent employees who attain the minimum qualification period for entitlement to gratuity. The liability / asset recognized in the balance sheet is the present value of defined benefit obligation at the reporting date less fair value of plan assets. The defined benefit obligation is calculated annually using Projected Unit Credit Method. Remeasurements which comprise actuarial gains and losses and the return on plan assets (excluding interest) are recognized immediately in other comprehensive income.
Century Insurance 79

Notes to and Forming part of the Financial StatementsFor the year ended December 31, 2020
The Company determines the net interest expense (income) on the net defined benefit liability (asset) for the period by applying the discount rate used to measure the defined benefit obligation at the beginning of the annual period to the then-net defined benefit liability (asset), taking into account any changes in the net defined benefit liability (asset) during the period as a result of contribution and benefit payments. Net interest expense and current service cost are recognized in profit and loss account and actuarial gains / loss are recognised in other comprehensive income as they occur and are not reclassified to profit or loss in subsequent periods.
The last actuarial valuation of the Company’s defined benefit plan was carried on as of December 31, 2020.
3.18.2 Defined contribution plan
The Company contributes to a provident fund scheme which covers all permanent employees. Equal contributions are made both by the Company and the employees to the fund at the rate of 10 percent of basic salary plus cost of living allowance.
3.18.3 Employees’ compensated absences
The Company accounts for the liability in respect of eligible employees’ compensated absences in the period in which they are earned.
3.19 Impairment of assets
The carrying amount of assets other than deferred tax asset are reviewed at each reporting date to determine whether there is any indication of impairment of any asset or group of assets. If such indication exists, the recoverable amount of the asset is estimated. An impairment loss is recognised whenever the carrying amount of an asset exceeds its recoverable amount. Impairment losses are recognised in profit and loss account. An impairment loss is reversed if the reversal can be objectively related to an event occurring after the impairment loss was recognised. Impairment is recognised based on management’s assessment of objective evidence of impairment as a result of one or more events that may have an impact on the estimated future cash flows of the investments. A significant or prolonged decline in fair value of an equity investments classified as available-for-sale below its cost is also considered an objective evidence of impairment. Impairment losses are reversed when there is an indication that impairment loss may no longer exist and there has been a change in the estimate used to determine the recoverable amount. However, in case of equity securities classified as available for sale the decrease in impairment loss is not reversed.
3.20 Dividend distribution and reserve appropriation
Dividend distribution and reserve appropriations are recognized when approved.
3.21 Management expenses
These are allocated to various classes of business in proportion to the respective gross premium written during the year. Expenses not allocable to the underwriting business are charged as other expenses.
3.22 Foreign currency translation
Foreign currency transactions during the period are recorded at the exchange rates approximating those ruling on the date of the transaction. Monetary assets and liabilities in foreign currencies are translated at the rates of exchange which approximate those prevailing on the reporting date. Gains and losses on translation are taken to income currently. Non-monetary items that are measured in terms of historical cost in a foreign currency are translated using the exchange rates as at the dates of the initial transactions. Non-monetary items measured at fair value in a foreign currency are translated using the exchange rates at the date when the fair value was determined.
Annual Report 202080
3.23 Financial instruments
Financial instruments carried on the reporting date include cash and bank, premiums due but unpaid, amount due from other insurers / reinsurers, accrued investment income, reinsurance recoveries against outstanding claims, sundry receivables, amount due to other insurers / reinsurers, accrued expenses, other creditors and accruals, deposits and other payables and unclaimed dividends.
All the financial assets and financial liabilities are recognised at the time when the Company becomes a party to the contractual provisions of the instrument and derecognized when the Company losses control of contractual rights that comprises the financial assets and in the case of financial liabilities when the obligation specified in the contract is discharged, cancelled or expired. At the time of initial recognition all financial assets and financial liabilities are measured at cost, which is the fair value of the consideration given or received for it. Any gain or loss on derecognition of financial assets and financial liabilities is taken to income currently.
3.24 Transaction with related parties
All the transaction involving related parties arising in the normal course of business are conducted at agreed / commercial terms and condition.
3.25 Window Takaful Operations
The accounting policies followed by Window Takaful Operations are stated in the annexed financial statements of Window Takaful Operations for the year ended December 31, 2020.
4. CRITICAL ACCOUNTING ESTIMATES AND JUDGEMENTS
4.1 Use of estimates and judgements
In preparing these financial statements, management has made judgement, estimates and assumptions that affect the application of the Company’s accounting policies and reported amounts of assets, liabilities, income and expenses. Actual results may differ from the estimates. Estimates and underlying assumptions are reviewed on an ongoing basis. Revision to estimates are recognised prospectively.
Information about judgements made in applying accounting policies that have the most significant effects on the amount recognised in the financial statements and assumptions and estimation uncertainties that have a significant risk of resulting in a material adjustment in the subsequent years are included in following notes:
a) residual values and useful lives of fixed assets (note 3.1 and 3.2);b) premium deficiency reserve (note 3.7);c) provision for premium due but unpaid and amount due from other insurers / reinsurers (note 3.9);d) provision for outstanding claims (including IBNR) (note 3.16);e) taxation (note 3.17);f) staff retirement benefits (note 3.18);andg) impairment (note 3.19).
Century Insurance 81

Notes to and Forming part of the Financial StatementsFor the year ended December 31, 2020
5. DISCLOSURES RELATED TO TEMPORARY EXEMPTION FROM IFRS 9
To determine the appropriate classification of financial assets under IFRS 9, an entity would need to assess the contractual cash flows characteristics of any financial asset. Indeed, the contractual terms of the financial asset give rise on specified dates to cash flows that are solely payments of principal and interest on the principal amount outstanding (SPPI) i.e. cash flows that are consistent with a basic lending arrangement. In a basic lending arrangement consideration for the time value of money and credit risk are typically the most significant elements of interest. IFRS 9 defines the terms principal as being the fair value of the financial asset at initial recognition and the interest as being compensation for (i) the time value of money and (ii) the credit risk associated with the principal amount outstanding during a particular period of time.
The debt instruments accounted for fair value through other comprehensive income under IAS 39 are potentially eligible to SPPI test whereas it is not applicable for the debt instruments accounted for fair value through profit or loss.
The tables below set out the fair values on gross basis as at the end of reporting period and the amount of change in the fair value during that period for the following two groups of financial assets separately.
a) financial assets with contractual terms that give rise on specified dates to cash flows that are solely payments of principal and interest (SPPI) on the principal amount outstanding excluding any financial asset that meets the definition of held for trading in IFRS 9, or that is managed and whose performance is evaluated on a fair value basis, and
b) all other financial assets.
December 31, 2020Fail the SPPI Test Pass the SPPI Test
Fair value
Change in Unrealized
gain or (loss) during
the year
Carrying Value
Cost less impairment
Change in Unrealized
gain or (loss) during
the year------------------------------- (Rupees) -------------------------------
Financial assetsInvestment in associate 162,055,359 - - - - Investments- Equity securities - Available for Sale 857,141,405 82,140,722 - - - - Equity securities - Held for trading 101,580,587 6,398,704 - - - - Debt securities - Held for trading - - 86,989,977 - 393,967 - Debt securities - Available for sale - - 310,075,958 - 6,318,632 - Debt securities - Held to maturity - - 127,627,411 - - - Term Deposit - - 195,400,000 - - Insurance / reinsurance receivable* 554,679,355 - - - - Loan and other receivables* 42,262,996 - - - Reinsurance recoveries against outstanding claims* 125,342,540 - - - - Cash and Bank 454,365,700 - - - - Total assets of Window Takaful Operations 103,495,918TOTAL 2,400,923,860 88,539,426 720,093,346 - 6,712,599
* The carrying amount of these financial assets measured applying IAS 39 are a reasonable approximation of the fair values.
Annual Report 202082

Gross Carrying amount of debt instruments that pass the SPPI testAA A+ A Unrated Total
-------------------------------------- (Rupees) --------------------------------------Investment in debt securitiesHeld for trading - - - 86,989,977 86,989,977 Available for sale 34,386,233 24,827,575 20,000,000 230,862,150 310,075,958 Held to Maturity - - - 127,627,411 127,627,411 Term Deposit - - 195,400,000 - 195,400,000
34,386,233 24,827,575 215,400,000 445,479,538 720,093,346
December 31, December 31,6. PROPERTY AND EQUIPMENT 2020 2019
Note ---------- (Rupees) ----------
Operating assets 6.1 70,599,800 77,172,381 Right to use assets 6.2 38,925,248 48,887,433 Capital work in progress 6.3 11,625,221 3,933,221
121,150,269 129,993,035
6.1 Operating assetsDecember 31, 2020
Cost Depreciation Written downvalue as at
December 31,2020
Depreciationrate%
As atJanuary 01,
2020
Additions Disposals As atDecember 31,
2020
As atJanuary 01,
2020
For theyear
Disposals As atDecember 31,
2020
--------------------------------------------------------------------------- (Rupees) ---------------------------------------------------------------------------Office improvement 19,763,414 - - 19,763,414 15,138,303 888,109 - 16,026,412 3,737,002 10 Furniture and fixtures 16,723,543 52,000 - 16,775,543 10,245,636 1,157,369 - 11,403,005 5,372,538 10 Office equipment 14,950,159 870,152 701,709 15,118,602 10,812,894 1,732,314 641,200 11,904,008 3,214,594 10 - 33Computer and related accessories 8,325,826 1,799,800 569,605 9,556,021 7,627,274 731,419 524,771 7,833,922 1,722,099 33 Motor vehicles 95,157,458 8,082,900 4,542,593 98,697,765 33,923,912 11,067,040 2,846,754 42,144,198 56,553,567 20
154,920,400 10,804,852 5,813,907 159,911,345 77,748,019 15,576,251 4,012,725 89,311,545 70,599,800
December 31, 2019Cost Depreciation Written down
value as atDecember 31,
2019
Depreciationrate%
As atJanuary 01,
2019
Additions Disposals As atDecember 31,
2019
As atJanuary 01,
2019
For theyear
Disposals As atDecember 31,
2019
--------------------------------------------------------------------------- (Rupees) ---------------------------------------------------------------------------
Office improvement 18,347,027 1,416,387 - 19,763,414 14,310,432 827,871 - 15,138,303 4,625,111 10 Furniture and fixtures 14,326,769 2,396,774 - 16,723,543 9,191,433 1,054,203 - 10,245,636 6,477,907 10 Office equipment 13,971,284 1,292,240 313,365 14,950,159 9,079,485 2,023,012 289,603 10,812,894 4,137,265 10 - 33Computer and related accessories 7,850,726 494,600 19,500 8,325,826 7,192,227 453,017 17,970 7,627,274 698,552 33 Motor vehicles 81,196,809 21,983,249 8,022,600 95,157,458 28,399,931 10,275,464 4,751,483 33,923,912 61,233,546 20
135,692,615 27,583,250 8,355,465 154,920,400 68,173,508 14,633,567 5,059,056 77,748,019 77,172,381
Century Insurance 83
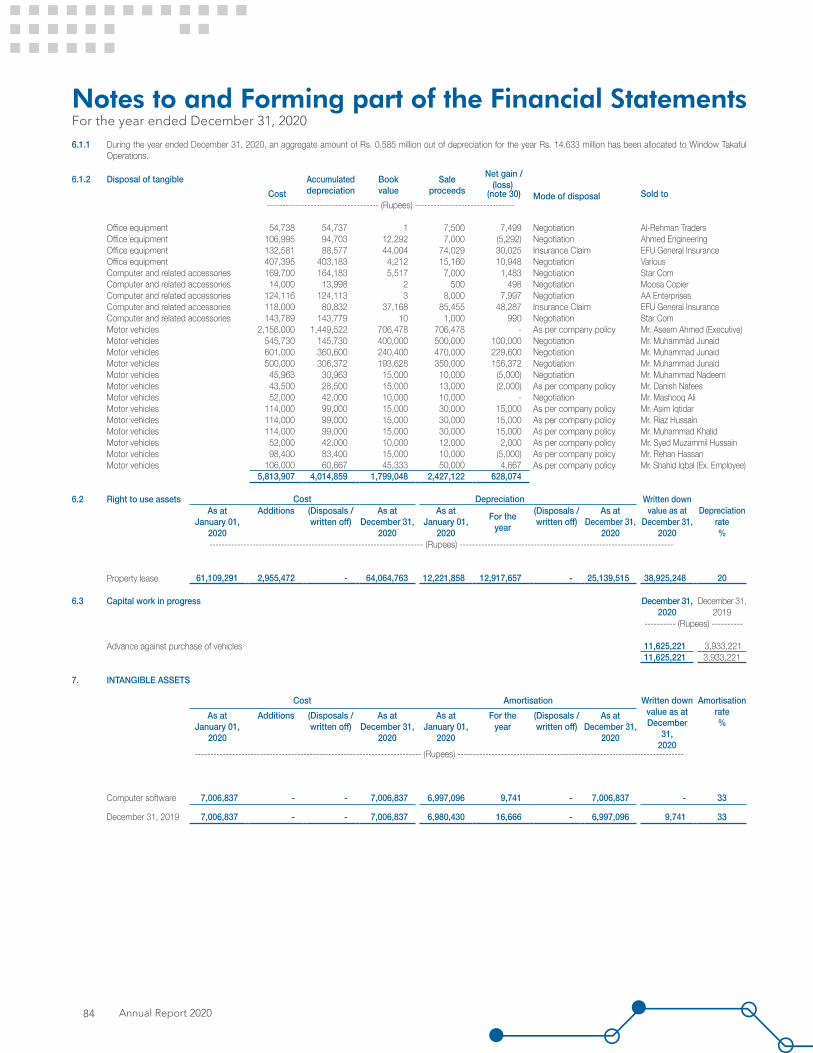
Notes to and Forming part of the Financial StatementsFor the year ended December 31, 2020
6.1.1 During the year ended December 31, 2020, an aggregate amount of Rs. 0.585 million out of depreciation for the year Rs. 14.633 million has been allocated to Window Takaful Operations.
6.1.2 Disposal of tangible Accumulated depreciation
Book value
Sale proceeds
Net gain / (loss)
Mode of disposal Cost (note 30) Sold to ------------------------------------ (Rupees) --------------------------------
Office equipment 54,738 54,737 1 7,500 7,499 Negotiation Al-Rehman TradersOffice equipment 106,995 94,703 12,292 7,000 (5,292) Negotiation Ahmed EngineeringOffice equipment 132,581 88,577 44,004 74,029 30,025 Insurance Claim EFU General InsuranceOffice equipment 407,395 403,183 4,212 15,160 10,948 Negotiation VariousComputer and related accessories 169,700 164,183 5,517 7,000 1,483 Negotiation Star ComComputer and related accessories 14,000 13,998 2 500 498 Negotiation Moosa CopierComputer and related accessories 124,116 124,113 3 8,000 7,997 Negotiation AA EnterprisesComputer and related accessories 118,000 80,832 37,168 85,455 48,287 Insurance Claim EFU General InsuranceComputer and related accessories 143,789 143,779 10 1,000 990 Negotiation Star ComMotor vehicles 2,156,000 1,449,522 706,478 706,478 - As per company policy Mr. Aseem Ahmed (Executive)Motor vehicles 545,730 145,730 400,000 500,000 100,000 Negotiation Mr. Muhammad JunaidMotor vehicles 601,000 360,600 240,400 470,000 229,600 Negotiation Mr. Muhammad JunaidMotor vehicles 500,000 306,372 193,628 350,000 156,372 Negotiation Mr. Muhammad JunaidMotor vehicles 45,963 30,963 15,000 10,000 (5,000) Negotiation Mr. Muhammad NadeemMotor vehicles 43,500 28,500 15,000 13,000 (2,000) As per company policy Mr. Danish NafeesMotor vehicles 52,000 42,000 10,000 10,000 - Negotiation Mr. Mashooq AliMotor vehicles 114,000 99,000 15,000 30,000 15,000 As per company policy Mr. Asim IqtidarMotor vehicles 114,000 99,000 15,000 30,000 15,000 As per company policy Mr. Riaz HussainMotor vehicles 114,000 99,000 15,000 30,000 15,000 As per company policy Mr. Muhammad KhalidMotor vehicles 52,000 42,000 10,000 12,000 2,000 As per company policy Mr. Syed Muzammil HussainMotor vehicles 98,400 83,400 15,000 10,000 (5,000) As per company policy Mr. Rehan HassanMotor vehicles 106,000 60,667 45,333 50,000 4,667 As per company policy Mr. Shahid Iqbal (Ex. Employee)
5,813,907 4,014,859 1,799,048 2,427,122 628,074
6.2 Right to use assets Cost Depreciation Written downAs at Additions (Disposals / As at As at For the
year
(Disposals / As at value as at DepreciationJanuary 01, written off) December 31, January 01, written off) December 31, December 31, rate
2020 2020 2020 2020 2020 %--------------------------------------------------------------------- (Rupees) ---------------------------------------------------------------------
Property lease 61,109,291 2,955,472 - 64,064,763 12,221,858 12,917,657 - 25,139,515 38,925,248 20
6.3 Capital work in progress December 31, December 31,2020 2019
---------- (Rupees) ----------
Advance against purchase of vehicles 11,625,221 3,933,221 11,625,221 3,933,221
7. INTANGIBLE ASSETS
Cost Amortisation Written downvalue as atDecember
31,2020
Amortisationrate%
As atJanuary 01,
2020
Additions (Disposals /written off)
As atDecember 31,
2020
As atJanuary 01,
2020
For the year
(Disposals /written off)
As atDecember 31,
2020------------------------------------------------------------------------- (Rupees) -------------------------------------------------------------------------
Computer software 7,006,837 - - 7,006,837 6,997,096 9,741 - 7,006,837 - 33
December 31, 2019 7,006,837 - - 7,006,837 6,980,430 16,666 - 6,997,096 9,741 33
Annual Report 202084

8.1 Movement of investment in equity accounted investees is as follows:
December 31, 2020Colgate Century Paper Total
Palmolive & Board Mills(Pakistan) Limited
Limited---------------------- (Rupees) ----------------------
Opening balance as at January 01, 2020 10,992,804 28,411,443 39,404,247 Share of profit 1,963,571 10,444,889 12,408,460 Share of equity (14,835) 79,581 64,746 Dividend received (973,636) (944,243) (1,917,879)Closing balance as at December 31, 2020 11,967,904 37,991,670 49,959,574
December 31, 2019Colgate Century Paper Total
Palmolive & Board Mills(Pakistan) LimitedLimited
---------------------- (Rupees) ----------------------
Opening balance as at January 01, 2019 10,264,695 34,879,467 45,144,162 Share of profit 1,510,639 5,407,599 6,918,238 Share of equity (9,971) (166,778) (176,749)Dividend received (772,559) (629,495) (1,402,054)Provision for impairment - (11,079,350) (11,079,350)Closing balance as at December 31, 2019 10,992,804 28,411,443 39,404,247
8. INVESTMENT IN ASSOCIATES
2020 2019 Face value December 31, December 31,per share 2020 2019
---(Number of shares)--- (Rupees) Quoted Note ------------ (Rupees) -------------
23,282 21,166 10 Colgate Palmolive 8.1 11,967,904 10,992,804 (Pakistan) Limited (CPPL)(Incorporated in Pakistan)
755,394 629,495 10 Century Paper & Board 8.1 37,991,670 28,411,443 Mills Limited (CPBML) (Incorporated in Pakistan)
49,959,574 39,404,247
Century Insurance 85
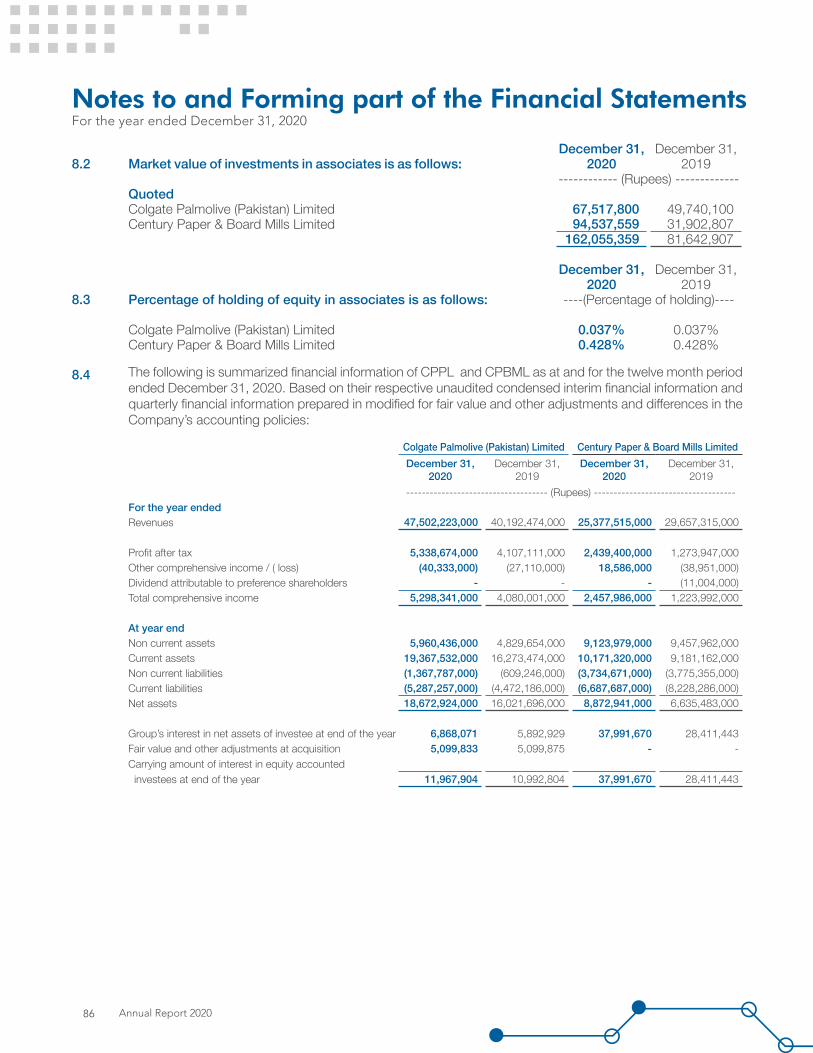
Notes to and Forming part of the Financial StatementsFor the year ended December 31, 2020
December 31, December 31,8.2 Market value of investments in associates is as follows: 2020 2019
------------ (Rupees) -------------Quoted Colgate Palmolive (Pakistan) Limited 67,517,800 49,740,100 Century Paper & Board Mills Limited 94,537,559 31,902,807
162,055,359 81,642,907
December 31, December 31,2020 2019
8.3 Percentage of holding of equity in associates is as follows: ----(Percentage of holding)----
Colgate Palmolive (Pakistan) Limited 0.037% 0.037%Century Paper & Board Mills Limited 0.428% 0.428%
8.4 The following is summarized financial information of CPPL and CPBML as at and for the twelve month period ended December 31, 2020. Based on their respective unaudited condensed interim financial information and quarterly financial information prepared in modified for fair value and other adjustments and differences in the Company’s accounting policies:
Colgate Palmolive (Pakistan) Limited Century Paper & Board Mills LimitedDecember 31,
2020December 31,
2019December 31,
2020December 31,
2019------------------------------------ (Rupees) ------------------------------------
For the year endedRevenues 47,502,223,000 40,192,474,000 25,377,515,000 29,657,315,000
Profit after tax 5,338,674,000 4,107,111,000 2,439,400,000 1,273,947,000 Other comprehensive income / ( loss) (40,333,000) (27,110,000) 18,586,000 (38,951,000)Dividend attributable to preference shareholders - - - (11,004,000)Total comprehensive income 5,298,341,000 4,080,001,000 2,457,986,000 1,223,992,000
At year endNon current assets 5,960,436,000 4,829,654,000 9,123,979,000 9,457,962,000 Current assets 19,367,532,000 16,273,474,000 10,171,320,000 9,181,162,000 Non current liabilities (1,367,787,000) (609,246,000) (3,734,671,000) (3,775,355,000)Current liabilities (5,287,257,000) (4,472,186,000) (6,687,687,000) (8,228,286,000)Net assets 18,672,924,000 16,021,696,000 8,872,941,000 6,635,483,000
Group’s interest in net assets of investee at end of the year 6,868,071 5,892,929 37,991,670 28,411,443 Fair value and other adjustments at acquisition 5,099,833 5,099,875 - - Carrying amount of interest in equity accounted investees at end of the year 11,967,904 10,992,804 37,991,670 28,411,443
Annual Report 202086
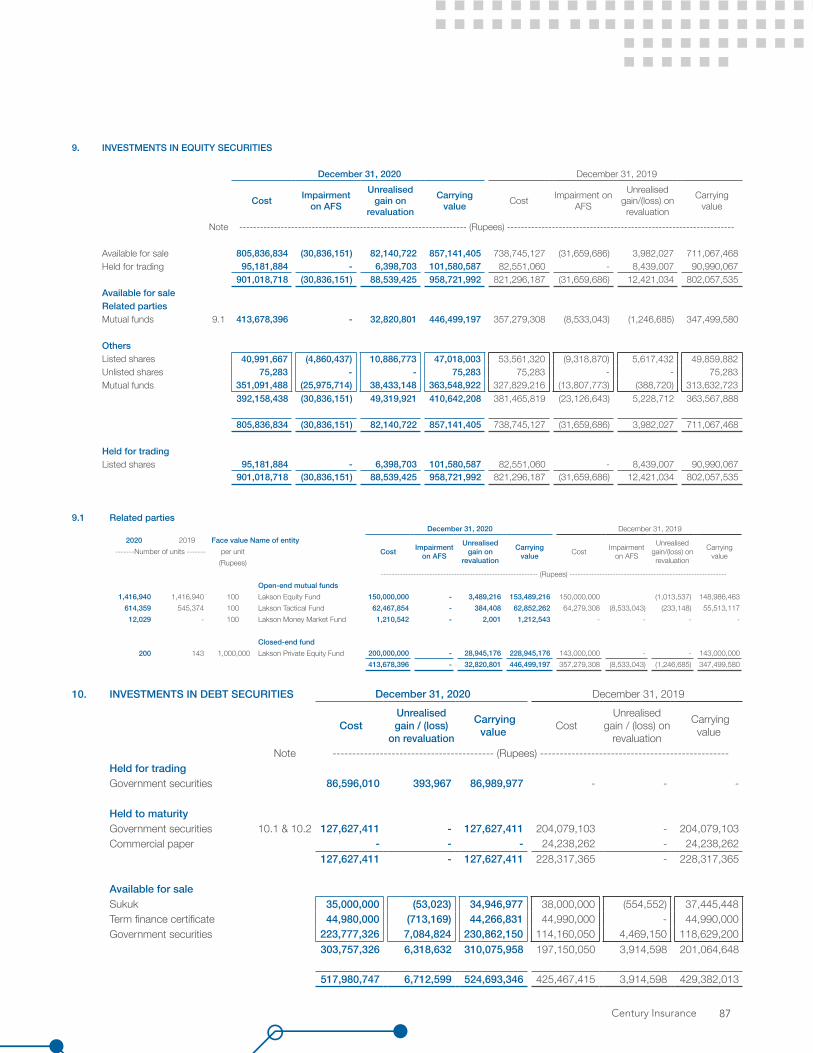
9. INVESTMENTS IN EQUITY SECURITIES
December 31, 2020 December 31, 2019
Cost Impairment on AFS
Unrealised gain on
revaluation
Carrying value Cost Impairment on
AFS
Unrealised gain/(loss) on revaluation
Carrying value
Note ------------------------------------------------------------------ (Rupees) ------------------------------------------------------------------
Available for sale 805,836,834 (30,836,151) 82,140,722 857,141,405 738,745,127 (31,659,686) 3,982,027 711,067,468 Held for trading 95,181,884 - 6,398,703 101,580,587 82,551,060 - 8,439,007 90,990,067
901,018,718 (30,836,151) 88,539,425 958,721,992 821,296,187 (31,659,686) 12,421,034 802,057,535 Available for sale Related partiesMutual funds 9.1 413,678,396 - 32,820,801 446,499,197 357,279,308 (8,533,043) (1,246,685) 347,499,580
OthersListed shares 40,991,667 (4,860,437) 10,886,773 47,018,003 53,561,320 (9,318,870) 5,617,432 49,859,882 Unlisted shares 75,283 - - 75,283 75,283 - - 75,283 Mutual funds 351,091,488 (25,975,714) 38,433,148 363,548,922 327,829,216 (13,807,773) (388,720) 313,632,723
392,158,438 (30,836,151) 49,319,921 410,642,208 381,465,819 (23,126,643) 5,228,712 363,567,888
805,836,834 (30,836,151) 82,140,722 857,141,405 738,745,127 (31,659,686) 3,982,027 711,067,468
Held for tradingListed shares 95,181,884 - 6,398,703 101,580,587 82,551,060 - 8,439,007 90,990,067
901,018,718 (30,836,151) 88,539,425 958,721,992 821,296,187 (31,659,686) 12,421,034 802,057,535
9.1 Related parties December 31, 2020 December 31, 2019
2020 2019 Face value Name of entityCost Impairment
on AFS
Unrealised gain on
revaluation
Carrying value Cost Impairment
on AFS
Unrealised gain/(loss) on revaluation
Carrying value-------Number of units ------- per unit
(Rupees)---------------------------------------------------------- (Rupees) ----------------------------------------------------------
Open-end mutual funds 1,416,940 1,416,940 100 Lakson Equity Fund 150,000,000 - 3,489,216 153,489,216 150,000,000 (1,013,537) 148,986,463
614,359 545,374 100 Lakson Tactical Fund 62,467,854 - 384,408 62,852,262 64,279,308 (8,533,043) (233,148) 55,513,117 12,029 - 100 Lakson Money Market Fund 1,210,542 - 2,001 1,212,543 - - - -
Closed-end fund 200 143 1,000,000 Lakson Private Equity Fund 200,000,000 - 28,945,176 228,945,176 143,000,000 - - 143,000,000
413,678,396 - 32,820,801 446,499,197 357,279,308 (8,533,043) (1,246,685) 347,499,580
10. INVESTMENTS IN DEBT SECURITIES December 31, 2020 December 31, 2019
Cost Unrealised gain / (loss)
on revaluation
Carrying value Cost
Unrealised gain / (loss) on
revaluation
Carrying value
Note ----------------------------------------- (Rupees) ------------------------------------------------ Held for tradingGovernment securities 86,596,010 393,967 86,989,977 - - -
Held to maturityGovernment securities 10.1 & 10.2 127,627,411 - 127,627,411 204,079,103 - 204,079,103 Commercial paper - - - 24,238,262 - 24,238,262
127,627,411 - 127,627,411 228,317,365 - 228,317,365
Available for sale Sukuk 35,000,000 (53,023) 34,946,977 38,000,000 (554,552) 37,445,448 Term finance certificate 44,980,000 (713,169) 44,266,831 44,990,000 - 44,990,000 Government securities 223,777,326 7,084,824 230,862,150 114,160,050 4,469,150 118,629,200
303,757,326 6,318,632 310,075,958 197,150,050 3,914,598 201,064,648
517,980,747 6,712,599 524,693,346 425,467,415 3,914,598 429,382,013
Century Insurance 87

10.1 These securities are placed with State Bank of Pakistan as statutory deposit in accordance with the requirement of clause (a) of sub section 2 of section 29 of the Insurance Ordinance, 2000.
10.2 The market value of held to maturity debt securities is Rs. 129.772 million (2019: Rs. 204.804 million).
10.3 Impairment loss on available for sale investments
As at March 31, 2020, an impairment loss for the period amounting to Rs. 30.3 million (net of tax) was assessed in accordance with the Company’s impairment criterion. The Securities Exchange Commission of Pakistan (SECP) vide its circular S.R.O. 414 (I)/2020 dated May 11, 2020 provided relief from the requirements contained in IAS 39 in relation to Available for Sale (AFS) equity instruments according to which the Company may charge the impairment loss for the period ended March 31, 2020 in the Statement of Changes in Equity. The amount so charged, adjusted with the fair value change during the period from April 01, 2020 to June 30, 2020, shall be considered for impairment in accordance with the requirements of IAS 39.
Accordingly, the Company opted to avail the relaxation under the aforementioned circular and recognized the impairment loss for the period ended March 31, 2020 in statement of changes in equity amounting to Rs. 30.3 million (net of tax). During the current period from April 01, 2020 to June 30, 2020, Rs. 6.7 million has been reversed due to fair value changes and impairment loss Rs. 23.6 million has been recognised in the profit and loss account in December 31, 2020.
Notes to and Forming part of the Financial StatementsFor the year ended December 31, 2020
11. INVESTMENT IN TERM DEPOSIT December 31, December 31,2020 2019
Note --------------- (Rupees) ----------------
Deposit maturing within 12 months 195,400,000 426,000,000 195,400,000 426,000,000
12. LOAN AND OTHER RECEIVABLE
Accrued investment income 26,231,956 14,415,360 Security deposits 6,529,043 6,457,003 Advance to employees 3,856,474 3,216,452 Advance against expenses 1,104,909 1,309,375 Advance against purchase of shares 686 - Window Takaful Operations 3,392,738 10,302,222 Others 1,147,190 1,715,812
42,262,996 37,416,224
13. INSURANCE / RE-INSURANCE RECEIVABLE
Due from insurance contract holders 13.1 395,106,061 379,458,808 Amounts due from other insurers / reinsurers 13.4 45,758,485 52,655,032 Reinsurance recoveries due but unpaid 113,814,809 68,241,256
554,679,355 500,355,096
13.1 Due from insurance contract holders
UnsecuredConsidered good 13.2 395,106,061 379,458,808 Considered doubtful 26,920,482 11,511,332
422,026,543 390,970,140
Provision for doubtful balances 13.3 (26,920,482) (11,511,332) 395,106,061 379,458,808
Annual Report 202088

13.2 This includes a sum of Rs. 289.716 million (December 31, 2019: Rs. 225.964 million) due from related parties.
13.3 Provision for doubtful balances December 31, December 31,2020 2019
--------------- (Rupees) ----------------
Balance as at January 01 11,511,332 9,896,940
Provision made during the year 15,772,035 1,692,340 Recoveries during the year (362,885) (77,948)
15,409,150 1,614,392
Balance as at December 31 26,920,482 11,511,332
13.4 Amounts due from other insurers / reinsurers
Unsecured
Considered goodForeign reinsurers 168,437 168,437 Local reinsurers 51,924,539 53,092,905 Co-insurers 39,677,991 43,884,307
91,770,967 97,145,649
Provision for doubtful balances (46,012,482) (44,490,617) 45,758,485 52,655,032
14. STAFF RETIREMENT BENEFITS
Defined benefit plan - gratuity scheme
The actuarial valuations are carried out annually and contributions are made accordingly. Following were the significant assumptions used for valuation of the scheme:
- Discount rate 10.25% (December 31, 2019: 11.75%) per annum.- Expected rate of increase in the salaries of the employees 10.25% (December 31, 2019: 11.75%) per annum.- Expected interest rate on plan assets of the scheme 10.25% (December 31, 2019: 11.75%) per annum.- Average length of service of the employees 8.68 years (December 31, 2019: 7.93 years).
14.1 Liability in statement of financial position December 31, December 31,2020 2019
--------------- (Rupees) ----------------
Present value of defined benefit obligations 55,264,597 44,767,110 Fair value of plan assets (50,745,078) (39,626,014)
4,519,519 5,141,096
14.2 Movement in liability during the year
Balance as at January 01 5,141,096 5,162,059 Charge to profit and loss account 4,945,443 4,207,741 Charged to other comprehensive income (425,924) 933,355 Contributions to the fund during the year (5,141,096) (5,162,059)Balance as at December 31 4,519,519 5,141,096
Century Insurance 89
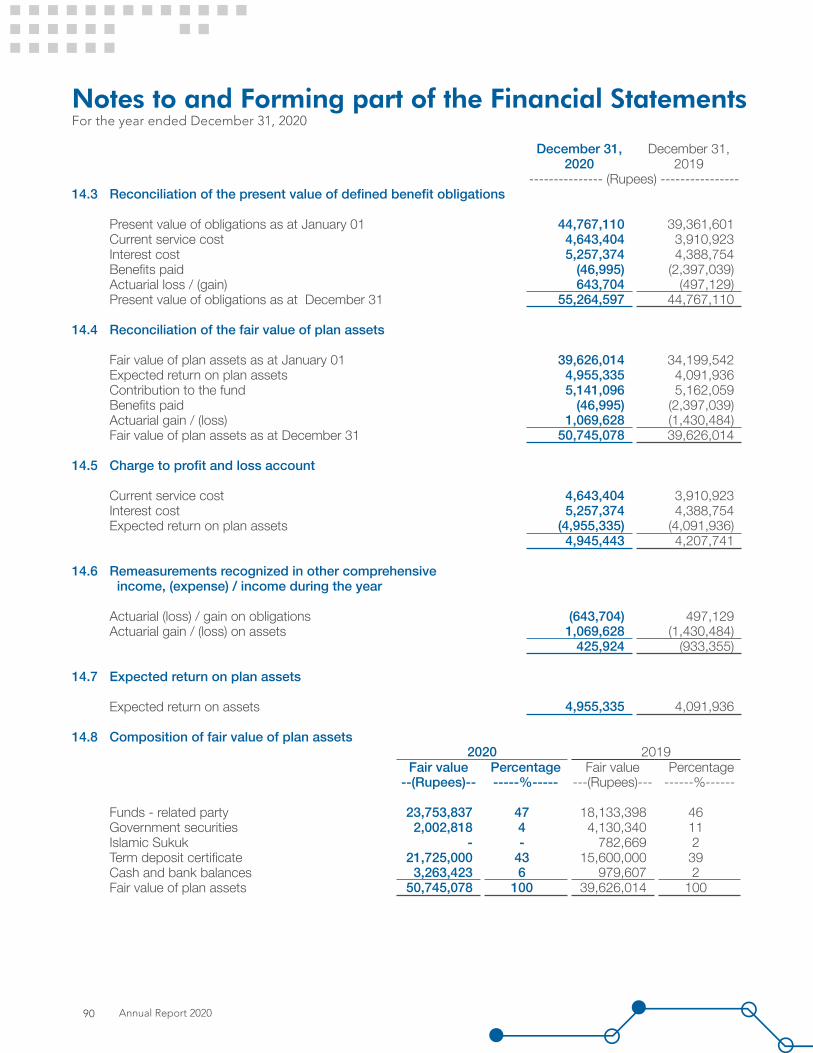
Notes to and Forming part of the Financial StatementsFor the year ended December 31, 2020
December 31, December 31,2020 2019
--------------- (Rupees) ----------------14.3 Reconciliation of the present value of defined benefit obligations
Present value of obligations as at January 01 44,767,110 39,361,601 Current service cost 4,643,404 3,910,923 Interest cost 5,257,374 4,388,754 Benefits paid (46,995) (2,397,039)Actuarial loss / (gain) 643,704 (497,129)Present value of obligations as at December 31 55,264,597 44,767,110
14.4 Reconciliation of the fair value of plan assets
Fair value of plan assets as at January 01 39,626,014 34,199,542 Expected return on plan assets 4,955,335 4,091,936 Contribution to the fund 5,141,096 5,162,059 Benefits paid (46,995) (2,397,039)Actuarial gain / (loss) 1,069,628 (1,430,484)Fair value of plan assets as at December 31 50,745,078 39,626,014
14.5 Charge to profit and loss account
Current service cost 4,643,404 3,910,923 Interest cost 5,257,374 4,388,754 Expected return on plan assets (4,955,335) (4,091,936)
4,945,443 4,207,741
14.6 Remeasurements recognized in other comprehensive income, (expense) / income during the year
Actuarial (loss) / gain on obligations (643,704) 497,129 Actuarial gain / (loss) on assets 1,069,628 (1,430,484)
425,924 (933,355)
14.7 Expected return on plan assets
Expected return on assets 4,955,335 4,091,936
14.8 Composition of fair value of plan assets2020 2019
Fair value Percentage Fair value Percentage --(Rupees)-- -----%----- ---(Rupees)--- ------%------
Funds - related party 23,753,837 47 18,133,398 46Government securities 2,002,818 4 4,130,340 11Islamic Sukuk - - 782,669 2Term deposit certificate 21,725,000 43 15,600,000 39Cash and bank balances 3,263,423 6 979,607 2Fair value of plan assets 50,745,078 100 39,626,014 100
Annual Report 202090
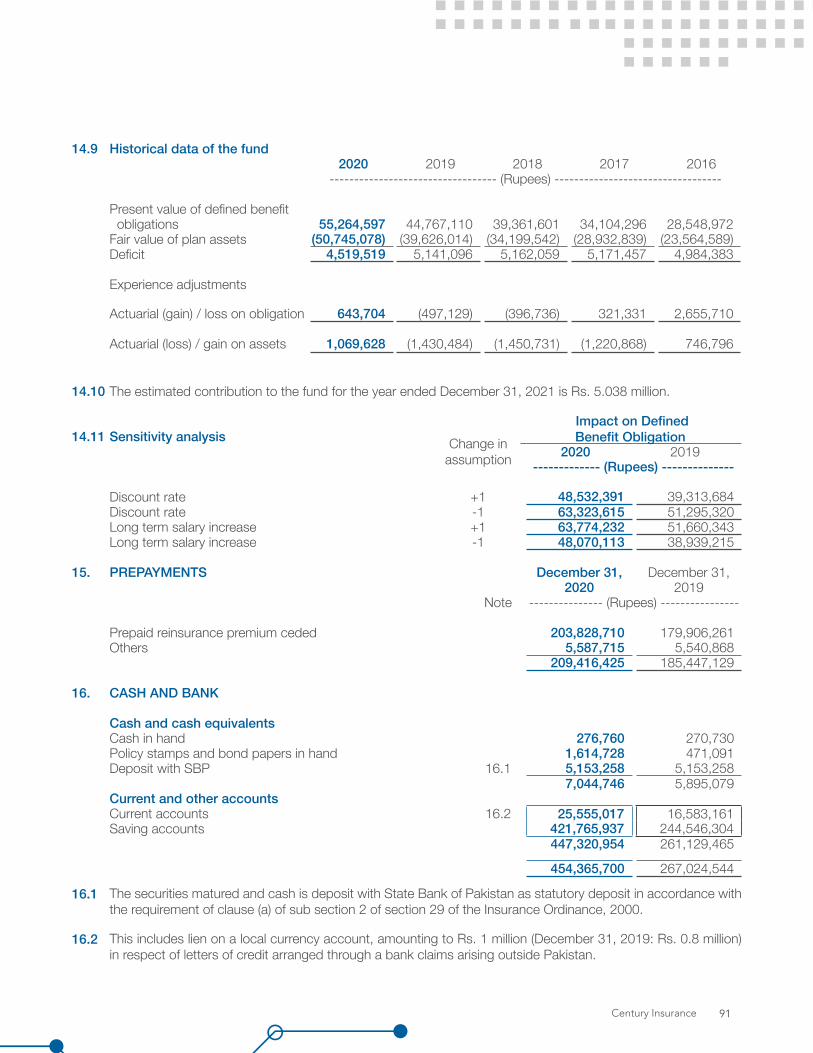
14.9 Historical data of the fund 2020 2019 2018 2017 2016
---------------------------------- (Rupees) ----------------------------------
Present value of defined benefit obligations 55,264,597 44,767,110 39,361,601 34,104,296 28,548,972 Fair value of plan assets (50,745,078) (39,626,014) (34,199,542) (28,932,839) (23,564,589)Deficit 4,519,519 5,141,096 5,162,059 5,171,457 4,984,383
Experience adjustments
Actuarial (gain) / loss on obligation 643,704 (497,129) (396,736) 321,331 2,655,710
Actuarial (loss) / gain on assets 1,069,628 (1,430,484) (1,450,731) (1,220,868) 746,796
14.10 The estimated contribution to the fund for the year ended December 31, 2021 is Rs. 5.038 million.
Impact on Defined Benefit Obligation 14.11 Sensitivity analysis Change in
assumption 2020 2019------------- (Rupees) --------------
Discount rate +1 48,532,391 39,313,684 Discount rate -1 63,323,615 51,295,320 Long term salary increase +1 63,774,232 51,660,343 Long term salary increase -1 48,070,113 38,939,215
15. PREPAYMENTS December 31, December 31,2020 2019
Note --------------- (Rupees) ----------------
Prepaid reinsurance premium ceded 203,828,710 179,906,261 Others 5,587,715 5,540,868
209,416,425 185,447,129
16. CASH AND BANK
Cash and cash equivalentsCash in hand 276,760 270,730 Policy stamps and bond papers in hand 1,614,728 471,091 Deposit with SBP 16.1 5,153,258 5,153,258
7,044,746 5,895,079 Current and other accountsCurrent accounts 16.2 25,555,017 16,583,161 Saving accounts 421,765,937 244,546,304
447,320,954 261,129,465
454,365,700 267,024,544
16.1 The securities matured and cash is deposit with State Bank of Pakistan as statutory deposit in accordance with the requirement of clause (a) of sub section 2 of section 29 of the Insurance Ordinance, 2000.
16.2 This includes lien on a local currency account, amounting to Rs. 1 million (December 31, 2019: Rs. 0.8 million) in respect of letters of credit arranged through a bank claims arising outside Pakistan.
Century Insurance 91

Notes to and Forming part of the Financial StatementsFor the year ended December 31, 2020
16.3 Cash includes the following for the purposes of the Statement of Cash Flows:
December 31, December 31,2020 2019
--------------- (Rupees) ----------------
Cash and Balance 454,365,700 267,024,544 Less: local currency account with a lien 1,000,000 800,000
453,365,700 266,224,544
17. WINDOW TAKAFUL OPERATIONS
AssetsInvestments 6,968,219 62,081,477 Cash and bank deposits 82,593,412 1,326,746 Current assets - others 13,934,287 26,423,709 Total assets 103,495,918 89,831,932
Total liabilities - current 34,906,454 28,770,317
Profit before tax for the year 10,469,119 9,456,795
Details of assets and liabilities and segment disclosures of Window Takaful Operations are stated in annexed financial statements for the year ended December 31, 2020.
18. DEFERRED TAXATION - NET December 31, December 31,2020 2019
--------------- (Rupees) ----------------Deferred tax assest / (liability) arising in respect of:Accelerated depreciation on operating fixed assets 900,864 (121,189)Net liability of IFRS 16 1,406,576 136,005 Unrealised gain on remeasurement of securities at held for trading - net (1,969,875) (2,447,312)Provision for claims incurred but not reported (IBNR) 3,926,025 1,979,767 Provision for compensated absences 2,503,827 2,148,690 Share of profit from associates (3,585,820) (524,775)Provision against receivables 21,150,560 16,240,565 Provision for impairment on available for sale investments 36,157,239 27,214,755
60,489,396 44,626,506
Unrealised appreciation ‘available for sale’ investments (25,653,213) (2,290,045)Share in associates’ reserves 105,312 105,312
34,941,495 42,441,773
Annual Report 202092
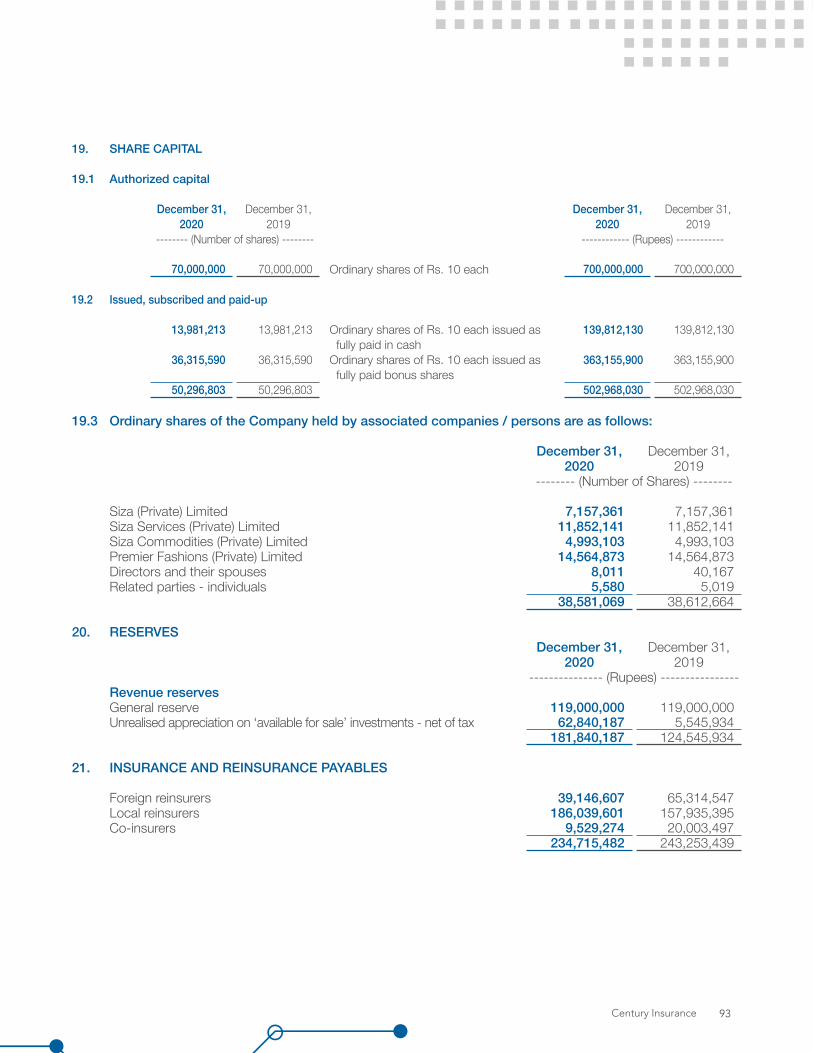
19. SHARE CAPITAL
19.1 Authorized capital
December 31, December 31, December 31, December 31,2020 2019 2020 2019
-------- (Number of shares) -------- ------------ (Rupees) ------------
70,000,000 70,000,000 Ordinary shares of Rs. 10 each 700,000,000 700,000,000
19.2 Issued, subscribed and paid-up
13,981,213 13,981,213 Ordinary shares of Rs. 10 each issued as 139,812,130 139,812,130 fully paid in cash
36,315,590 36,315,590 Ordinary shares of Rs. 10 each issued as 363,155,900 363,155,900 fully paid bonus shares
50,296,803 50,296,803 502,968,030 502,968,030
19.3 Ordinary shares of the Company held by associated companies / persons are as follows:
December 31, December 31,2020 2019
-------- (Number of Shares) --------
Siza (Private) Limited 7,157,361 7,157,361 Siza Services (Private) Limited 11,852,141 11,852,141 Siza Commodities (Private) Limited 4,993,103 4,993,103 Premier Fashions (Private) Limited 14,564,873 14,564,873 Directors and their spouses 8,011 40,167 Related parties - individuals 5,580 5,019
38,581,069 38,612,664
20. RESERVESDecember 31, December 31,
2020 2019--------------- (Rupees) ----------------
Revenue reservesGeneral reserve 119,000,000 119,000,000 Unrealised appreciation on ‘available for sale’ investments - net of tax 62,840,187 5,545,934
181,840,187 124,545,934
21. INSURANCE AND REINSURANCE PAYABLES
Foreign reinsurers 39,146,607 65,314,547 Local reinsurers 186,039,601 157,935,395 Co-insurers 9,529,274 20,003,497
234,715,482 243,253,439
Century Insurance 93
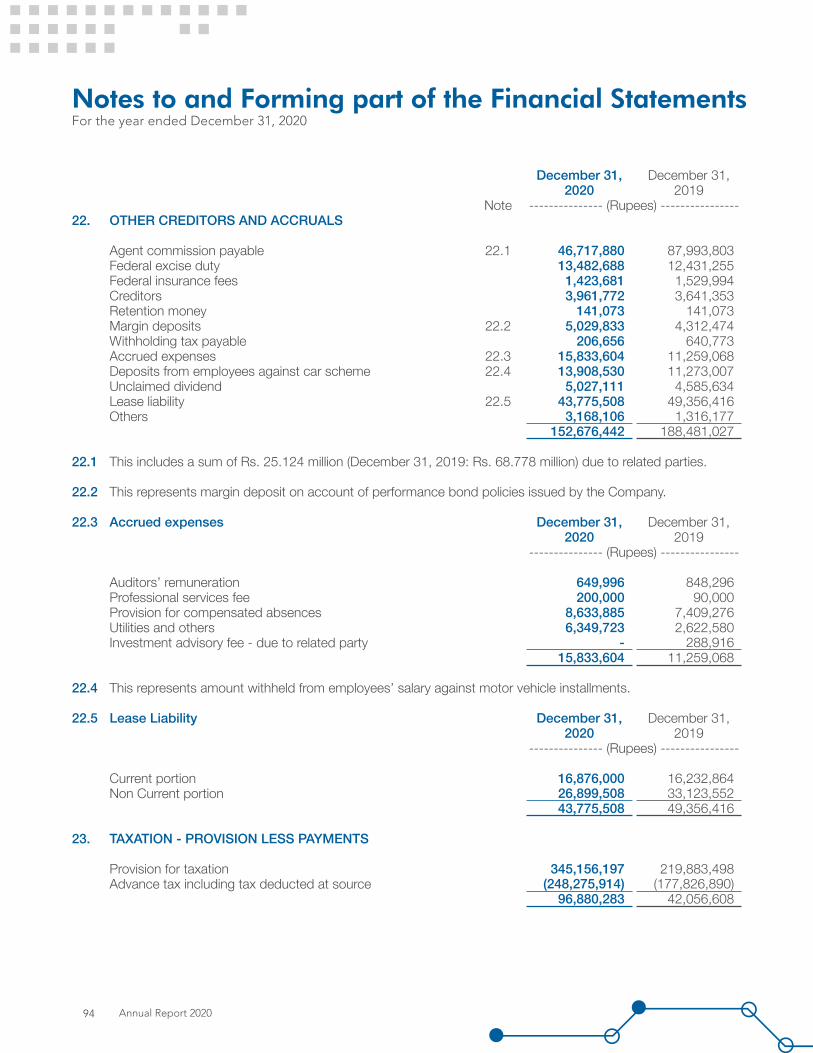
Notes to and Forming part of the Financial StatementsFor the year ended December 31, 2020
December 31, December 31,2020 2019
Note --------------- (Rupees) ----------------22. OTHER CREDITORS AND ACCRUALS
Agent commission payable 22.1 46,717,880 87,993,803 Federal excise duty 13,482,688 12,431,255 Federal insurance fees 1,423,681 1,529,994 Creditors 3,961,772 3,641,353 Retention money 141,073 141,073 Margin deposits 22.2 5,029,833 4,312,474 Withholding tax payable 206,656 640,773 Accrued expenses 22.3 15,833,604 11,259,068 Deposits from employees against car scheme 22.4 13,908,530 11,273,007 Unclaimed dividend 5,027,111 4,585,634 Lease liability 22.5 43,775,508 49,356,416 Others 3,168,106 1,316,177
152,676,442 188,481,027
22.1 This includes a sum of Rs. 25.124 million (December 31, 2019: Rs. 68.778 million) due to related parties.
22.2 This represents margin deposit on account of performance bond policies issued by the Company.
22.3 Accrued expenses December 31, December 31,2020 2019
--------------- (Rupees) ----------------
Auditors’ remuneration 649,996 848,296 Professional services fee 200,000 90,000 Provision for compensated absences 8,633,885 7,409,276 Utilities and others 6,349,723 2,622,580 Investment advisory fee - due to related party - 288,916
15,833,604 11,259,068
22.4 This represents amount withheld from employees’ salary against motor vehicle installments.
22.5 Lease Liability December 31, December 31,2020 2019
--------------- (Rupees) ----------------
Current portion 16,876,000 16,232,864 Non Current portion 26,899,508 33,123,552
43,775,508 49,356,416
23. TAXATION - PROVISION LESS PAYMENTS
Provision for taxation 345,156,197 219,883,498 Advance tax including tax deducted at source (248,275,914) (177,826,890)
96,880,283 42,056,608
Annual Report 202094
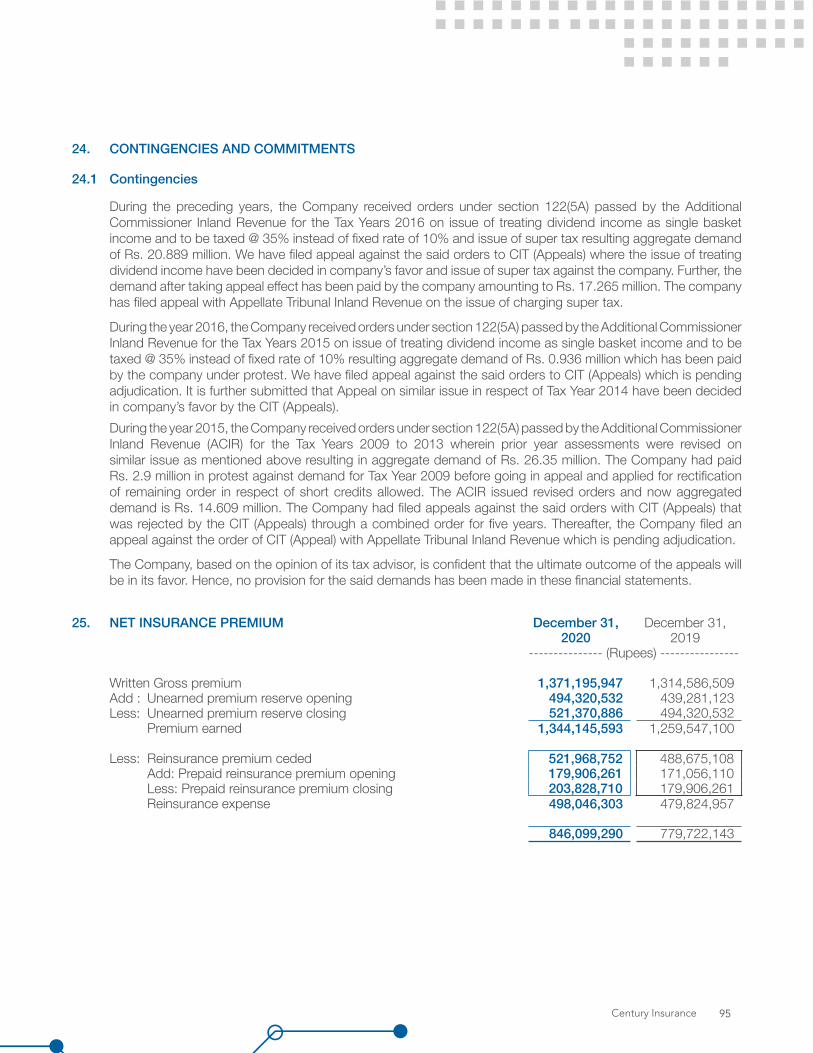
24. CONTINGENCIES AND COMMITMENTS
24.1 Contingencies
During the preceding years, the Company received orders under section 122(5A) passed by the Additional Commissioner Inland Revenue for the Tax Years 2016 on issue of treating dividend income as single basket income and to be taxed @ 35% instead of fixed rate of 10% and issue of super tax resulting aggregate demand of Rs. 20.889 million. We have filed appeal against the said orders to CIT (Appeals) where the issue of treating dividend income have been decided in company’s favor and issue of super tax against the company. Further, the demand after taking appeal effect has been paid by the company amounting to Rs. 17.265 million. The company has filed appeal with Appellate Tribunal Inland Revenue on the issue of charging super tax.
During the year 2016, the Company received orders under section 122(5A) passed by the Additional Commissioner Inland Revenue for the Tax Years 2015 on issue of treating dividend income as single basket income and to be taxed @ 35% instead of fixed rate of 10% resulting aggregate demand of Rs. 0.936 million which has been paid by the company under protest. We have filed appeal against the said orders to CIT (Appeals) which is pending adjudication. It is further submitted that Appeal on similar issue in respect of Tax Year 2014 have been decided in company’s favor by the CIT (Appeals).During the year 2015, the Company received orders under section 122(5A) passed by the Additional Commissioner Inland Revenue (ACIR) for the Tax Years 2009 to 2013 wherein prior year assessments were revised on similar issue as mentioned above resulting in aggregate demand of Rs. 26.35 million. The Company had paid Rs. 2.9 million in protest against demand for Tax Year 2009 before going in appeal and applied for rectification of remaining order in respect of short credits allowed. The ACIR issued revised orders and now aggregated demand is Rs. 14.609 million. The Company had filed appeals against the said orders with CIT (Appeals) that was rejected by the CIT (Appeals) through a combined order for five years. Thereafter, the Company filed an appeal against the order of CIT (Appeal) with Appellate Tribunal Inland Revenue which is pending adjudication.
The Company, based on the opinion of its tax advisor, is confident that the ultimate outcome of the appeals will be in its favor. Hence, no provision for the said demands has been made in these financial statements.
25. NET INSURANCE PREMIUM December 31, December 31,2020 2019
--------------- (Rupees) ----------------
Written Gross premium 1,371,195,947 1,314,586,509 Add : Unearned premium reserve opening 494,320,532 439,281,123 Less: Unearned premium reserve closing 521,370,886 494,320,532
Premium earned 1,344,145,593 1,259,547,100
Less: Reinsurance premium ceded 521,968,752 488,675,108 Add: Prepaid reinsurance premium opening 179,906,261 171,056,110 Less: Prepaid reinsurance premium closing 203,828,710 179,906,261 Reinsurance expense 498,046,303 479,824,957
846,099,290 779,722,143
Century Insurance 95

Notes to and Forming part of the Financial StatementsFor the year ended December 31, 2020Notes to and Forming part of the Financial StatementsFor the year ended December 31, 2020
26. NET INSURANCE CLAIMS EXPENSE December 31, December 31,2020 2019
--------------- (Rupees) ----------------
Claim paid 612,771,683 505,475,118 Add : Outstanding claims including IBNR closing 260,105,733 206,337,532 Less: Outstanding claims including IBNR opening 206,337,532 192,759,004
Claims expense 666,539,884 519,053,646
Less: Reinsurance and others recoveries received 278,614,080 158,811,627 Add: Reinsurance and others recoveries in respect of outstanding claims closing 125,342,540 97,581,839Less: Reinsurance and others recoveries in respect of outstanding claims opening 97,581,839 100,016,385Reinsurance and other recoveries revenue 306,374,781 156,377,081
360,165,103 362,676,565
Accident year 2015 and 2016 2017 2018 2019 2020 Totalprior (including IBNR)
---------------------------------------------------------------- (Rupees) ----------------------------------------------------------------Gross estimate of ultimate claims cost:- At end of accident 465,704,082 438,802,110 361,911,977 463,812,210 515,439,091 643,040,416 - One year later 513,577,102 434,336,754 377,155,134 457,137,965 546,114,902 - - Two year later 514,632,063 433,569,849 377,930,518 456,131,630 - - - Three year later 514,737,210 435,094,101 377,970,005 - - - - Four year later 518,647,393 434,871,306 - - - - - Five year later 519,487,476 - - - - - Current estimate of cumulative claims 519,487,476 434,871,306 377,970,005 456,131,630 546,114,902 643,040,416 2,977,615,735
Cumulative payment to date (486,645,800) (432,590,979) (372,472,677) (448,981,733) (522,415,460) (454,403,353) (2,717,510,002)
Liability recognised in statement of financial position 32,841,676 2,280,327 5,497,328 7,149,897 23,699,442 188,637,063 260,105,733
26.1 Claim development table
The Company maintains adequate reserves in respect of its insurance business in order to protect against adverse future claims experience and developments. The uncertainties about the amount and timing of claim payments are normally resolved within one year. The following table shows the development of the claims over a period of time. All amounts are presented in gross numbers before reinsurance.
Annual Report 202096
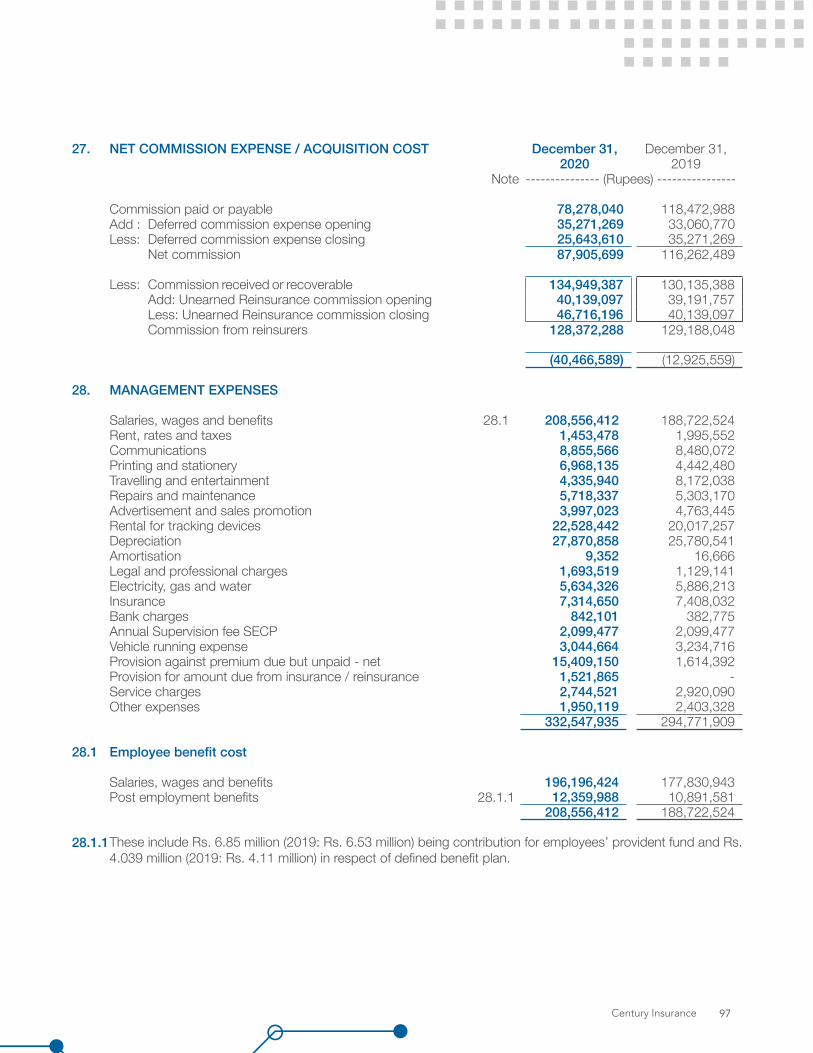
27. NET COMMISSION EXPENSE / ACQUISITION COST December 31, December 31,2020 2019
Note --------------- (Rupees) ----------------
Commission paid or payable 78,278,040 118,472,988 Add : Deferred commission expense opening 35,271,269 33,060,770 Less: Deferred commission expense closing 25,643,610 35,271,269
Net commission 87,905,699 116,262,489
Less: Commission received or recoverable 134,949,387 130,135,388 Add: Unearned Reinsurance commission opening 40,139,097 39,191,757 Less: Unearned Reinsurance commission closing 46,716,196 40,139,097 Commission from reinsurers 128,372,288 129,188,048
(40,466,589) (12,925,559)
28. MANAGEMENT EXPENSES
Salaries, wages and benefits 28.1 208,556,412 188,722,524 Rent, rates and taxes 1,453,478 1,995,552 Communications 8,855,566 8,480,072 Printing and stationery 6,968,135 4,442,480 Travelling and entertainment 4,335,940 8,172,038 Repairs and maintenance 5,718,337 5,303,170 Advertisement and sales promotion 3,997,023 4,763,445 Rental for tracking devices 22,528,442 20,017,257 Depreciation 27,870,858 25,780,541 Amortisation 9,352 16,666 Legal and professional charges 1,693,519 1,129,141 Electricity, gas and water 5,634,326 5,886,213 Insurance 7,314,650 7,408,032 Bank charges 842,101 382,775 Annual Supervision fee SECP 2,099,477 2,099,477 Vehicle running expense 3,044,664 3,234,716 Provision against premium due but unpaid - net 15,409,150 1,614,392 Provision for amount due from insurance / reinsurance 1,521,865 - Service charges 2,744,521 2,920,090 Other expenses 1,950,119 2,403,328
332,547,935 294,771,909
28.1 Employee benefit cost
Salaries, wages and benefits 196,196,424 177,830,943 Post employment benefits 28.1.1 12,359,988 10,891,581
208,556,412 188,722,524
28.1.1These include Rs. 6.85 million (2019: Rs. 6.53 million) being contribution for employees’ provident fund and Rs. 4.039 million (2019: Rs. 4.11 million) in respect of defined benefit plan.
Century Insurance 97

Notes to and Forming part of the Financial StatementsFor the year ended December 31, 2020
29. INVESTMENT INCOME December 31, December 31,2020 2019
Note --------------- (Rupees) ----------------
Income from equity securitiesAvailable-for-sale- Dividend income 10,061,186 8,433,661
Held for trading- Dividend income 3,404,729 4,544,912
Income from debt securitiesHeld to maturity - Return on government securities 14,249,255 28,277,148 - Return on other fixed income securities and deposits 2,802,730 1,002,795
17,051,985 29,279,943 Available-for-sale- Return on government securities 21,159,446 7,329,700 - Return on other fixed income securities and deposits 9,557,846 11,356,820
30,717,292 18,686,520 Held for trading- Return on government securities 22,370,006 1,721,233
Income from term deposits- Return on term deposits 21,899,154 8,205,065
105,504,352 70,871,334 Net realised gains on investmentsAvailable for sale- Gain / (loss) on sale of equity securities 5,306,132 (35,238,572)
Held for trading- Loss on sale of equity securities (5,585,675) (8,805,243)- Gain on sale of debt securities 1,180,969 26,859,350
(4,404,706) 18,054,107
Net unrealised gain on investments at held for trading- Equity securities 6,398,704 8,439,007 - Debt securities 393,967 -
6,792,671 8,439,007
Total investment income 113,198,449 62,125,876
Add : Reversal of impairment in debt securities - Held for trading - 4,583 Less: Impairment in value of available for sale securities (30,836,151) (31,659,686)Less: Investment related expenses (2,848,373) (2,475,517)Investment income 79,513,925 27,995,256
30. OTHER INCOME-
Return on bank balances 28,115,176 46,536,847 Gain on sale of fixed assets 628,074 194,103 Others 88,819 308,423 Liabilities no longer to payable 34,683,271 -
63,515,340 47,039,373
Annual Report 202098

31. OTHER EXPENSE December 31, December 31,2020 2019
Note --------------- (Rupees) ----------------
Rate and taxes 542,786 712,179 Fees and subscription 3,930,900 3,340,285 Legal and professional charges 941,154 1,153,991 Auditors’ remuneration 31.1 1,281,624 1,803,171 Donation 31.2 1,500,000 500,000 Security charges 1,943,535 2,013,274 Other expenses 862,157 256,420 Penalty 100,000 -
11,102,156 9,779,320
31.1 Auditors’ remuneration
Statutory audit fee 340,000 340,000 Half year review 218,300 218,300 Review of code of corporate governance 120,000 120,000 Special reports and other certifications 311,900 892,201
990,200 1,570,501
Sindh sales tax 109,624 118,605 Out of pocket expenses 181,800 114,065
1,281,624 1,803,171
31.2 This includes sum of Rs. 0.5 million (December 31, 2019: Rs. 0.5 million ) paid to Layton Rahmatulla Benevolent Trust in which the chairman of the Company, Mr. Iqbal Ali Lakhani, is a trustee.
32. TAXATION - NET December 31, December 31,2020 2019
--------------- (Rupees) ----------------
Current 115,677,361 60,219,308 Prior - (2,789,293)Deferred (15,862,890) (2,971,710)
99,814,471 54,458,305
32.1 The Company has filed returns upto tax year 2020. The returns filed for tax years upto 2017 has been finalized.
32.2 The Board of Directors of the Company has proposed to distribute sufficient cash dividend / bonus shares for the year ended December 31, 2020 (refer note 43) to comply with the requirements of Section 5A of the Income Tax Ordinance, 2001 (Tax on Undistributed Profits). Accordingly, no provision for tax on undistributed profits has been recognised in these financial statements for the year ended December 31, 2020.
Century Insurance 99
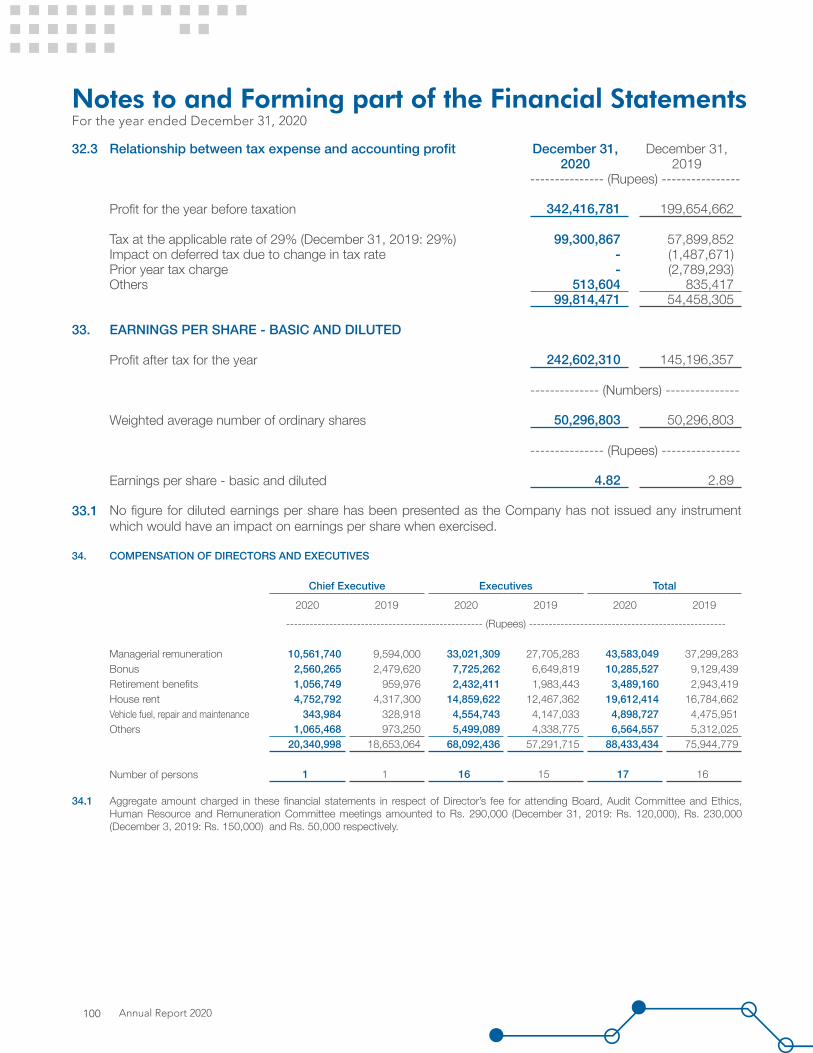
Notes to and Forming part of the Financial StatementsFor the year ended December 31, 2020
32.3 Relationship between tax expense and accounting profit December 31, December 31,2020 2019
--------------- (Rupees) ----------------
Profit for the year before taxation 342,416,781 199,654,662
Tax at the applicable rate of 29% (December 31, 2019: 29%) 99,300,867 57,899,852 Impact on deferred tax due to change in tax rate - (1,487,671)Prior year tax charge - (2,789,293)Others 513,604 835,417
99,814,471 54,458,305
33. EARNINGS PER SHARE - BASIC AND DILUTED
Profit after tax for the year 242,602,310 145,196,357
-------------- (Numbers) ---------------
Weighted average number of ordinary shares 50,296,803 50,296,803
--------------- (Rupees) ----------------
Earnings per share - basic and diluted 4.82 2.89
33.1 No figure for diluted earnings per share has been presented as the Company has not issued any instrument which would have an impact on earnings per share when exercised.
34. COMPENSATION OF DIRECTORS AND EXECUTIVES
Chief Executive Executives Total
2020 2019 2020 2019 2020 2019-------------------------------------------------- (Rupees) --------------------------------------------------
Managerial remuneration 10,561,740 9,594,000 33,021,309 27,705,283 43,583,049 37,299,283 Bonus 2,560,265 2,479,620 7,725,262 6,649,819 10,285,527 9,129,439 Retirement benefits 1,056,749 959,976 2,432,411 1,983,443 3,489,160 2,943,419 House rent 4,752,792 4,317,300 14,859,622 12,467,362 19,612,414 16,784,662 Vehicle fuel, repair and maintenance 343,984 328,918 4,554,743 4,147,033 4,898,727 4,475,951Others 1,065,468 973,250 5,499,089 4,338,775 6,564,557 5,312,025
20,340,998 18,653,064 68,092,436 57,291,715 88,433,434 75,944,779
Number of persons 1 1 16 15 17 16
34.1 Aggregate amount charged in these financial statements in respect of Director’s fee for attending Board, Audit Committee and Ethics, Human Resource and Remuneration Committee meetings amounted to Rs. 290,000 (December 31, 2019: Rs. 120,000), Rs. 230,000 (December 3, 2019: Rs. 150,000) and Rs. 50,000 respectively.
Annual Report 2020100
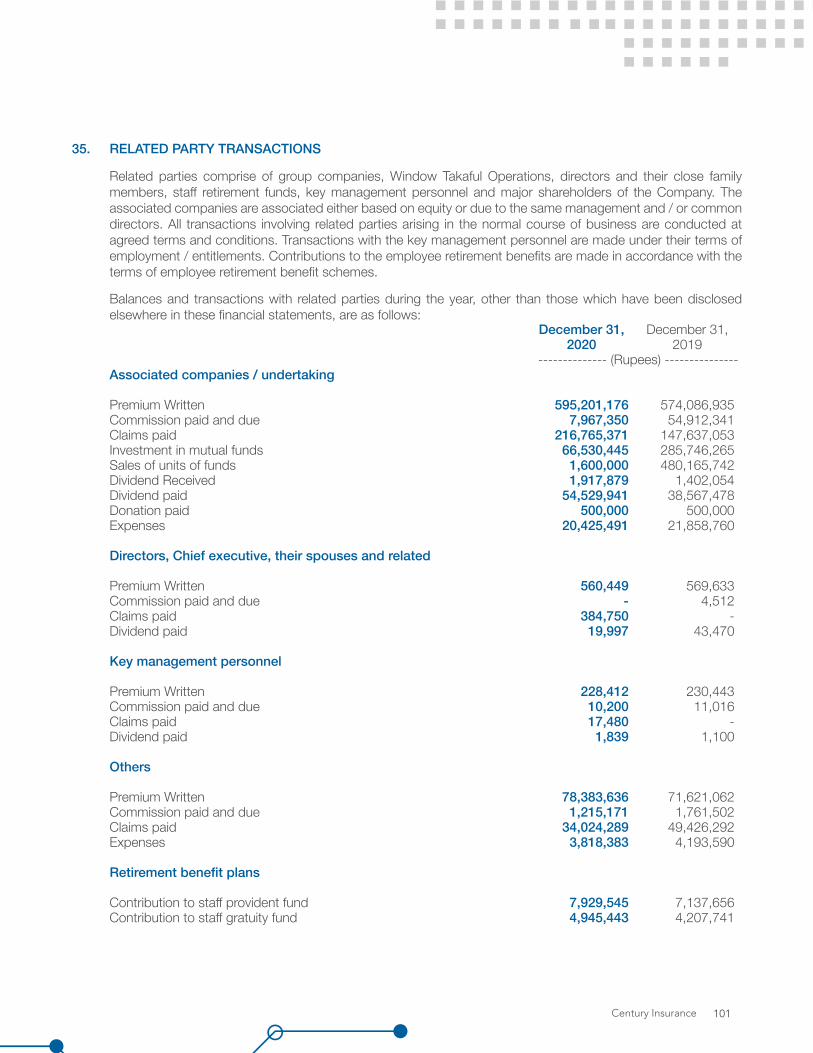
35. RELATED PARTY TRANSACTIONS
Related parties comprise of group companies, Window Takaful Operations, directors and their close family members, staff retirement funds, key management personnel and major shareholders of the Company. The associated companies are associated either based on equity or due to the same management and / or common directors. All transactions involving related parties arising in the normal course of business are conducted at agreed terms and conditions. Transactions with the key management personnel are made under their terms of employment / entitlements. Contributions to the employee retirement benefits are made in accordance with the terms of employee retirement benefit schemes.
Balances and transactions with related parties during the year, other than those which have been disclosed elsewhere in these financial statements, are as follows:
December 31, December 31,2020 2019
-------------- (Rupees) ---------------Associated companies / undertaking
Premium Written 595,201,176 574,086,935 Commission paid and due 7,967,350 54,912,341 Claims paid 216,765,371 147,637,053 Investment in mutual funds 66,530,445 285,746,265 Sales of units of funds 1,600,000 480,165,742 Dividend Received 1,917,879 1,402,054 Dividend paid 54,529,941 38,567,478 Donation paid 500,000 500,000 Expenses 20,425,491 21,858,760
Directors, Chief executive, their spouses and related
Premium Written 560,449 569,633 Commission paid and due - 4,512 Claims paid 384,750 -Dividend paid 19,997 43,470
Key management personnel
Premium Written 228,412 230,443 Commission paid and due 10,200 11,016 Claims paid 17,480 - Dividend paid 1,839 1,100
Others
Premium Written 78,383,636 71,621,062 Commission paid and due 1,215,171 1,761,502 Claims paid 34,024,289 49,426,292 Expenses 3,818,383 4,193,590
Retirement benefit plans
Contribution to staff provident fund 7,929,545 7,137,656 Contribution to staff gratuity fund 4,945,443 4,207,741
Century Insurance 101

Notes to and Forming part of the Financial StatementsFor the year ended December 31, 2020
36. SEGMENT INFORMATIONDecember 31, 2020
Fire and property damage
Marine, aviation and
transportMotor Accident
& Health Miscellaneous Aggregate
---------------------------------------------------- (Rupees) ----------------------------------------------------Premium received / receivable (inclusive of Sales tax / Federal Excise Duty, Federal Insurance Fee and Administrative Surcharge) 476,989,818 327,920,981 388,426,969 282,683,133 70,732,152 1,546,753,053
Less: - Federal Excise Duty / Sales Tax 57,689,924 35,806,196 46,002,266 339,591 8,665,873 148,503,850
- Federal Insurance Fee 4,166,764 2,752,557 3,401,315 2,911,647 613,807 13,846,090
- Others 68,500 14,329,624 413,240 11,570 72,400 14,895,334
Facultative inward premium 856,125 - 324,131 - 507,912 1,688,168 Gross written premium (inclusive of Administrative Surcharge) 415,920,755 275,032,604 338,934,279 279,420,325 61,887,984 1,371,195,947
- Gross direct premium 413,337,920 268,446,875 321,227,592 279,114,235 60,699,065 1,342,825,687
- Facultative inward premium 856,125 - 324,131 - 507,912 1,688,168
- Administrative surcharge 1,726,710 6,585,729 17,382,556 306,090 681,007 26,682,092
415,920,755 275,032,604 338,934,279 279,420,325 61,887,984 1,371,195,947
Insurance premium earned 402,644,426 271,200,003 311,773,332 294,287,738 64,240,094 1,344,145,593
Insurance premium ceded to reinsurers (347,239,231) (98,263,739) (6,322,034) (626,917) (45,594,382) (498,046,303)
Net Insurance premium 55,405,195 172,936,264 305,451,298 293,660,821 18,645,712 846,099,290
Commission income 75,630,441 39,589,039 134,762 182,057 12,835,989 128,372,288
Net underwriting income 131,035,636 212,525,303 305,586,060 293,842,878 31,481,701 974,471,578
Insurance claims (212,727,905) (34,544,340) (120,157,730) (218,076,270) (81,033,639) (666,539,884)
Insurance claims recovered from reinsurers 201,465,704 16,313,125 22,149,649 - 66,446,303 306,374,781
Net claims (11,262,201) (18,231,215) (98,008,081) (218,076,270) (14,587,336) (360,165,103)
Commission expense (40,093,068) (19,138,999) (21,467,461) (4,911,973) (2,294,198) (87,905,699)
Management expense (100,870,768) (66,702,009) (82,199,699) (67,766,137) (15,009,322) (332,547,935)
Net insurance claims and expenses (152,226,037) (104,072,223) (201,675,241) (290,754,380) (31,890,856) (780,618,737)
Underwriting results (21,190,401) 108,453,080 103,910,819 3,088,498 (409,155) 193,852,841
Investment income 79,513,925 Other income 63,515,340 Other expense (11,102,156)Finance costs - Lease liabilities (6,240,748)Share of profit of associates 12,408,460 Profit from Window Takaful Operations 10,469,119 Profit before tax for the year 342,416,781
Segment assets 435,184,308 133,595,354 152,439,484 116,574,215 83,592,416 921,385,777
Unallocated corporate assets 2,377,966,525 Unallocated assets of Window Takaful Operation - Operator’s Fund 103,495,918 Total assets 3,402,848,220
Segment liabilities 385,382,699 93,571,378 265,445,583 228,048,628 92,351,682 1,064,799,970
Unallocated corporate liabilities 254,076,244 Unallocated liabilities of Window Takaful Operation - Operator’s Fund 34,906,454 Total liabilities 1,353,782,668
Annual Report 2020102
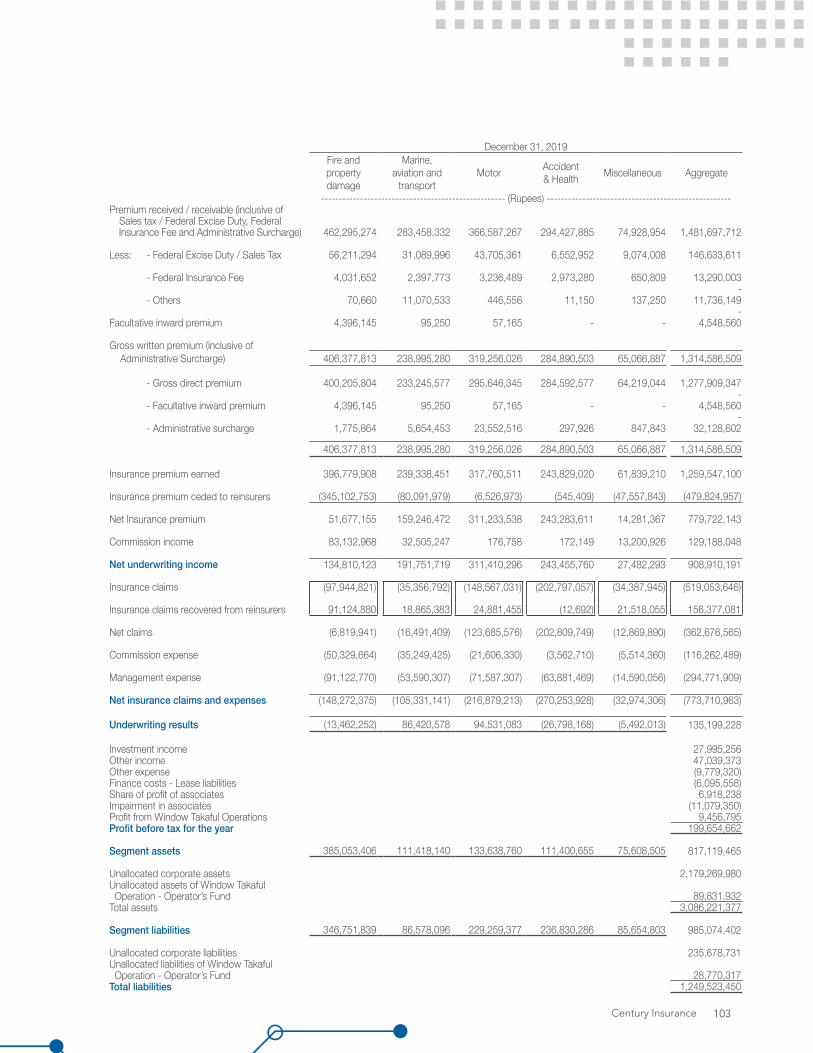
December 31, 2019Fire and property damage
Marine, aviation and
transportMotor Accident
& Health Miscellaneous Aggregate
---------------------------------------------------- (Rupees) ----------------------------------------------------Premium received / receivable (inclusive of Sales tax / Federal Excise Duty, Federal Insurance Fee and Administrative Surcharge) 462,295,274 283,458,332 366,587,267 294,427,885 74,928,954 1,481,697,712
Less: - Federal Excise Duty / Sales Tax 56,211,294 31,089,996 43,705,361 6,552,952 9,074,008 146,633,611
- Federal Insurance Fee 4,031,652 2,397,773 3,236,489 2,973,280 650,809 13,290,003 -
- Others 70,660 11,070,533 446,556 11,150 137,250 11,736,149 -
Facultative inward premium 4,396,145 95,250 57,165 - - 4,548,560
Gross written premium (inclusive of Administrative Surcharge) 406,377,813 238,995,280 319,256,026 284,890,503 65,066,887 1,314,586,509
- Gross direct premium 400,205,804 233,245,577 295,646,345 284,592,577 64,219,044 1,277,909,347 -
- Facultative inward premium 4,396,145 95,250 57,165 - - 4,548,560 -
- Administrative surcharge 1,775,864 5,654,453 23,552,516 297,926 847,843 32,128,602
406,377,813 238,995,280 319,256,026 284,890,503 65,066,887 1,314,586,509
Insurance premium earned 396,779,908 239,338,451 317,760,511 243,829,020 61,839,210 1,259,547,100
Insurance premium ceded to reinsurers (345,102,753) (80,091,979) (6,526,973) (545,409) (47,557,843) (479,824,957)
Net Insurance premium 51,677,155 159,246,472 311,233,538 243,283,611 14,281,367 779,722,143
Commission income 83,132,968 32,505,247 176,758 172,149 13,200,926 129,188,048
Net underwriting income 134,810,123 191,751,719 311,410,296 243,455,760 27,482,293 908,910,191
Insurance claims (97,944,821) (35,356,792) (148,567,031) (202,797,057) (34,387,945) (519,053,646)
Insurance claims recovered from reinsurers 91,124,880 18,865,383 24,881,455 (12,692) 21,518,055 156,377,081
Net claims (6,819,941) (16,491,409) (123,685,576) (202,809,749) (12,869,890) (362,676,565)
Commission expense (50,329,664) (35,249,425) (21,606,330) (3,562,710) (5,514,360) (116,262,489)
Management expense (91,122,770) (53,590,307) (71,587,307) (63,881,469) (14,590,056) (294,771,909)
Net insurance claims and expenses (148,272,375) (105,331,141) (216,879,213) (270,253,928) (32,974,306) (773,710,963)
Underwriting results (13,462,252) 86,420,578 94,531,083 (26,798,168) (5,492,013) 135,199,228
Investment income 27,995,256 Other income 47,039,373 Other expense (9,779,320)Finance costs - Lease liabilities (6,095,558)Share of profit of associates 6,918,238 Impairment in associates (11,079,350)Profit from Window Takaful Operations 9,456,795 Profit before tax for the year 199,654,662
Segment assets 385,053,406 111,418,140 133,638,760 111,400,655 75,608,505 817,119,465
Unallocated corporate assets 2,179,269,980 Unallocated assets of Window Takaful Operation - Operator’s Fund 89,831,932 Total assets 3,086,221,377
Segment liabilities 346,751,839 86,578,096 229,259,377 236,830,286 85,654,803 985,074,402
Unallocated corporate liabilities 235,678,731 Unallocated liabilities of Window Takaful Operation - Operator’s Fund 28,770,317 Total liabilities 1,249,523,450
Century Insurance 103

Notes to and Forming part of the Financial StatementsFor the year ended December 31, 2020
38. MANAGEMENT OF INSURANCE RISK AND FINANCIAL RISK
38.1 Insurance Risk
The risk under any one insurance contract is the possibility that the insured event occurs and the uncertainty of the amount of the resulting claim. By the very nature of an insurance contract, this risk is random and therefore unpredictable. The principal risk that the Company faces under its insurance contracts is that the actual claims exceed the carrying amount of the insurance liabilities. This could occur because the frequency or severity of claims is greater than estimated. Insurance events are random, and the actual number and amount of claims will vary from year to year from the level established.
The Company generally deals in short tail insurance contracts (maximum for one year). Experience shows that the larger the portfolio of similar insurance contracts, the smaller the relative variability about the expected outcome will be. In addition, a more diversified portfolio is less likely to be affected by a change in any subset of the portfolio. The Company has developed its insurance underwriting strategy to diversify the type of insurance risks accepted and within each of these categories to achieve a sufficiently large population of risks to reduce the variability of the expected outcome.
The Company accepts insurance through issuance of general insurance contracts. For these general insurance contracts the most significant risks arise from fire, atmospheric disturbance, earthquake, terrorist activities and other catastrophes. For health insurance contracts, significant risks arise from epidemics.
The Company’s risk exposure is mitigated by employing a comprehensive framework to identify, assess, manage and monitor risk. This framework includes implementation of underwriting strategies which aim to ensure that the underwritten risks are well diversified in terms of type and amount of the risk. Adequate reinsurance is arranged to mitigate the effect of the potential loss to the Company from individual to large or catastrophic insured events. Further, the Company adopts strict claim review policies including active management and prompt pursuing of the claims, regular detailed review of claim handling procedures and frequent investigation of possible false claims to reduce the insurance risk.
37. MOVEMENT IN INVESTMENTS Held to Available Held for Totalmaturity for sale trading
--------------------------------------- (Rupees) ---------------------------------------
At beginning of previous year 176,997,072 1,086,047,071 96,002,608 1,359,046,751 Additions 1,538,731,367 884,788,318 2,844,874,415 5,268,394,100 Disposals (sales and redemptions) (1,067,060,850) (1,040,844,999) (2,876,380,070) (4,984,285,919)Fair value net (loss) / gains (Excluding net realised gains) - (35,238,572) 18,054,107 (17,184,465)Designated at available for sale upon initial recognition - 49,039,984 - 49,039,984 Unrealized gain on investments classified as held for trading - - 8,439,007 8,439,007 Amortisation of discount 5,649,776 - - 5,649,776 Impairment losses - (31,659,686) - (31,659,686)
At beginning of current year 654,317,365 912,132,116 90,990,067 1,657,439,548
Additions 291,342,659 364,375,880 919,274,077 1,574,992,616Disposals (sales and redemptions) (633,505,000) (174,166,096) (838,421,873) (1,646,092,969)Fair value net gains / (loss) (Excluding net realised gains) - 5,306,132 (4,404,706) 901,426Designated at available for sale upon initial recognition - 83,134,256 - 83,134,256Unrealized gain on investments classified as held for trading - - 6,792,671 6,792,671 Amortisation of discount 10,872,387 7,271,226 14,340,328 32,483,941Impairment losses - (30,836,151) - (30,836,151)
323,027,411 1,167,217,363 188,570,564 1,678,815,338
Annual Report 2020104

(a) Frequency and severity of claims
Political, environmental, economical and climatic changes give rise to more frequent and severe extreme events (for example, fire, theft, steal, riot and strike, explosion, earthquake, atmospheric damage, hurricanes, typhoons, river flooding, electric fluctuation, terrorism, war risk, damages occurring in inland transit, burglary, loss of cash in safe and cash in transit, travel and personal accident, money losses, engineering losses and other events) and their consequences (for example, subsidence claims). For certain contracts, the Company has also limited the number of claims that can be paid in any policy year or introduced a maximum amount payable for claims in any policy year.
Insurance contracts which is divided into direct and facultative arrangements are further subdivided into five segments: fire, marine, motor, accident and health and miscellaneous. The insurance risk arising from these contracts is concentrated in the territories in which the Company operates, and there is a balance between commercial and personal properties / assets in the overall portfolio of insured properties / assets. The Company underwrites insurance contract in Pakistan. The Company manages these risks through its underwriting strategy, adequate reinsurance arrangements and proactive claims handling.
- The underwriting strategy attempts to ensure that the underwritten risks are well diversified in terms of type and amount of risk, industry and geography. The Company has the right to re-price the risk on renewal. It also has the ability to impose deductibles and reject fraudulent claims. Insurance contracts also entitle the Company to pursue third parties for payment of some or all costs (for example, subrogation). The claims payments are limited to the extent of sum insured on occurrence of the insured event.
- The Company has entered into reinsurance cover / arrangements, with local and foreign reinsurers having good credit rating by reputable rating agencies, to reduce its exposure to risks and resulting claims. Keeping in view the maximum exposure in respect of key zone aggregates, a number of proportional and non-proportional facultative reinsurance arrangements are in place to protect the net account in case of a major catastrophe. The effect of such reinsurance arrangements is that the Company recovers the share of claims from reinsurers thereby reducing its exposure to risk. Apart from the adequate event limit which is a multiple of the treaty capacity or the primary recovery from the proportional reinsurance arrangements, any loss over and above the said limit would be recovered under non-proportional treaty which is very much in line with the risk management philosophy of the Company.
In compliance of the regulatory requirement, the reinsurance agreements are duly approved by Securities and Exchange Commission of Pakistan (SECP) on an annual basis.
- The Company has claims department dealing with the mitigation of risks surrounding claims incurred whether reported or not. This department investigates and settles all claims based on surveyor’s report / assessment. The unsettled claims are reviewed individually at least semi-annually and adjusted to reflect the latest information on the underlying facts, contractual terms and conditions, and other factors. The Company actively manages and pursues early settlements of claims to reduce its exposure to unpredictable developments.
(b) Sources of uncertainty in the estimation of future claims payments
Claims reported and otherwise are analysed separately. The development of large losses / catastrophes is analysed separately. The shorter settlement period for claims allows the Company to achieve a higher degree of certainty about the estimated cost of claims including IBNR. However, the longer time needed to assess the emergence of a subsidence claim makes the estimation process more uncertain for these claims.
The estimated cost of claims includes direct expenses to be incurred in settling claims, net of the expected subrogation value, reinsurance and other recoveries. The Company takes all reasonable steps uncertainty in establishing claims provisions, it is likely that the final outcome may be different from the original liability established. The liability comprises amount in relations to unpaid reported claims, claims incurred but not reported (IBNR), expected claims settlement costs and a provision for unexpired risks at the end of the reporting period.
Century Insurance 105
Notes to and Forming part of the Financial StatementsFor the year ended December 31, 2020
Liability in respect of outstanding claims is based on the best estimate of the claims intimated or assessed. In calculating the estimated costs of unpaid claims (both reported and non reported), the Company estimation technique is based upon actual claims experience using predetermined basis where greater weight is given to actual claims experience as time passes.
In estimating the liability for the costs of reported claims not yet paid, the Company considers any information available from surveyor’s assessment and information on the cost of settling claims with similar characteristics in previous periods. Claims are assessed on a case-by-case basis separately.
(c) Process used to decide on assumptions
The principal assumption underlying the liability estimation of IBNR end Premium Deficiency Reserves is that the Company’s future claim development will follow similar historical pattern for occurrence end reporting. The management uses qualitative judgment to assess the extent to which past occurrence and reporting pattern will not apply in future. The judgment includes external factors e.g. treatment of one-off occurrence claims, changes in market factors, economic conditions, etc. The internal factors such as portfolio mix, policy conditions and claim handling procedures are further used in this regard.
During the year actuarial valuation is carried out for the determination of IBNR which is based on a range of standard actuarial claim projection techniques, based on empirical data and current assumptions that may include a margin for adverse deviation as required/ allowed by the circular 9 of 2016. IBNR is determined by using Chain Ladder Method for all class of business. The claims outstanding and claims paid till date are deducted from the ultimate claim payments for that particular year to derive an IBNR estimate for that year. IBNR triangles are made on a yearly basis for each class of business. The methods used, and the estimates made, are reviewed regularly.
The actuary determines adequacy of liability of premium deficiency by carrying out analysis of its loss ratio of expired periods of the contracts. For this purpose average loss ratio of last three years inclusive of claim settlement cost are taken into consideration to determine ultimate loss ratio to be applied on unearned premium.
(d) Changes in assumptions
The Company did not change its assumptions as disclosed in (b) and (c) above.
Sensitivity Analysis
The analysis of exposure described in paragraph (c) above is also used to test the sensitivity of the selected assumptions to changes in the key underlying factors. Assumptions of different levels have been used to assess the relative severity of subsidence claims given past experience. The key material factor in the Company’s exposure to subsidence claims is the risk of more permanent changes in geographical location in which Company is exposed.
The risks associated with the insurance contracts are complex and subject to a number of variables techniques based on past claims development experience. This includes indications such as average claims cost, ultimate claims numbers and expected loss ratios. The Company considers that the liability for insurance claims recognised in the balance sheet is adequate as the Company generally deals in short tail insurance contracts. However, actual experience will differ from the expected outcome.
As the Company enters into short term insurance contracts, it does not assume any significant impact of changes in market conditions on unexpired risks. However, results of sensitivity testing assuming 10% change in the claim incidence net of recoveries showing effect on underwriting results and shareholders’ equity is set out below.
Annual Report 2020106
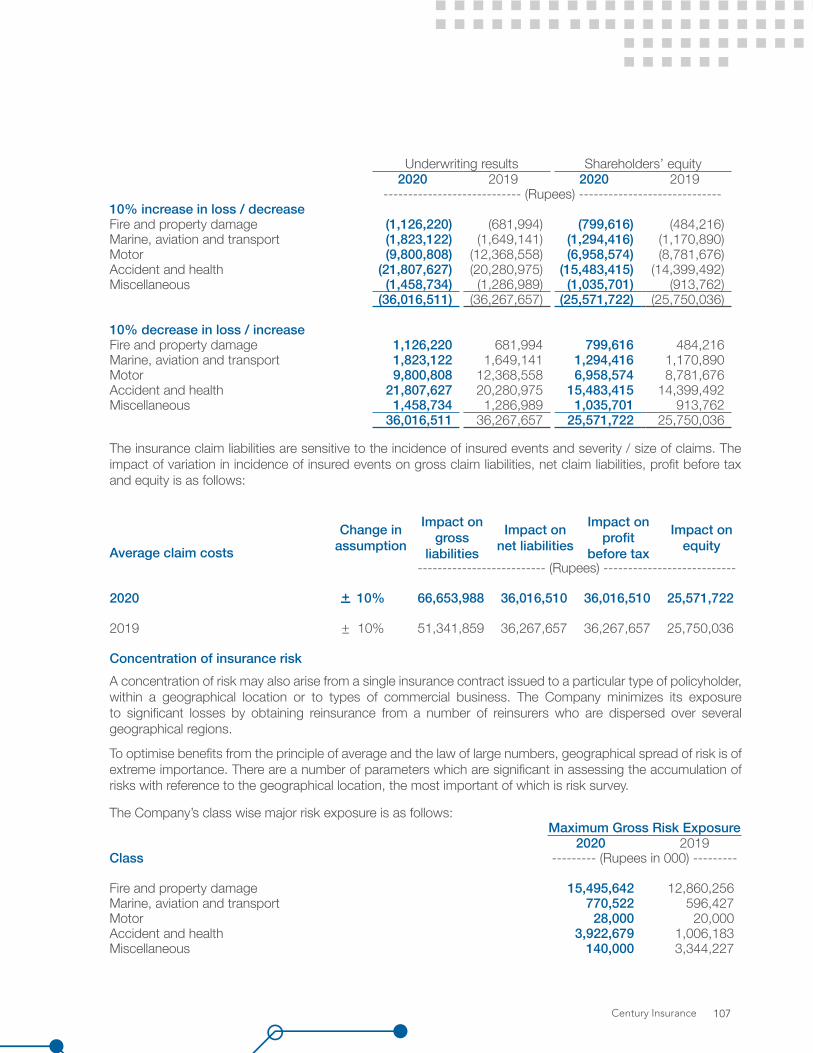
Underwriting results Shareholders’ equity2020 2019 2020 2019
---------------------------- (Rupees) -----------------------------10% increase in loss / decreaseFire and property damage (1,126,220) (681,994) (799,616) (484,216)Marine, aviation and transport (1,823,122) (1,649,141) (1,294,416) (1,170,890)Motor (9,800,808) (12,368,558) (6,958,574) (8,781,676)Accident and health (21,807,627) (20,280,975) (15,483,415) (14,399,492)Miscellaneous (1,458,734) (1,286,989) (1,035,701) (913,762)
(36,016,511) (36,267,657) (25,571,722) (25,750,036)
10% decrease in loss / increaseFire and property damage 1,126,220 681,994 799,616 484,216 Marine, aviation and transport 1,823,122 1,649,141 1,294,416 1,170,890 Motor 9,800,808 12,368,558 6,958,574 8,781,676 Accident and health 21,807,627 20,280,975 15,483,415 14,399,492 Miscellaneous 1,458,734 1,286,989 1,035,701 913,762
36,016,511 36,267,657 25,571,722 25,750,036
A concentration of risk may also arise from a single insurance contract issued to a particular type of policyholder, within a geographical location or to types of commercial business. The Company minimizes its exposure to significant losses by obtaining reinsurance from a number of reinsurers who are dispersed over several geographical regions.
To optimise benefits from the principle of average and the law of large numbers, geographical spread of risk is of extreme importance. There are a number of parameters which are significant in assessing the accumulation of risks with reference to the geographical location, the most important of which is risk survey.
The Company’s class wise major risk exposure is as follows:Maximum Gross Risk Exposure
2020 2019Class --------- (Rupees in 000) ---------
Fire and property damage 15,495,642 12,860,256 Marine, aviation and transport 770,522 596,427 Motor 28,000 20,000 Accident and health 3,922,679 1,006,183 Miscellaneous 140,000 3,344,227
The insurance claim liabilities are sensitive to the incidence of insured events and severity / size of claims. The impact of variation in incidence of insured events on gross claim liabilities, net claim liabilities, profit before tax and equity is as follows:
Change in assumption
Impact on gross
liabilities
Impact on net liabilities
Impact on profit
before tax
Impact on equityAverage claim costs
-------------------------- (Rupees) ---------------------------
2020 10% 66,653,988 36,016,510 36,016,510 25,571,722
2019 10% 51,341,859 36,267,657 36,267,657 25,750,036
Concentration of insurance risk
Century Insurance 107
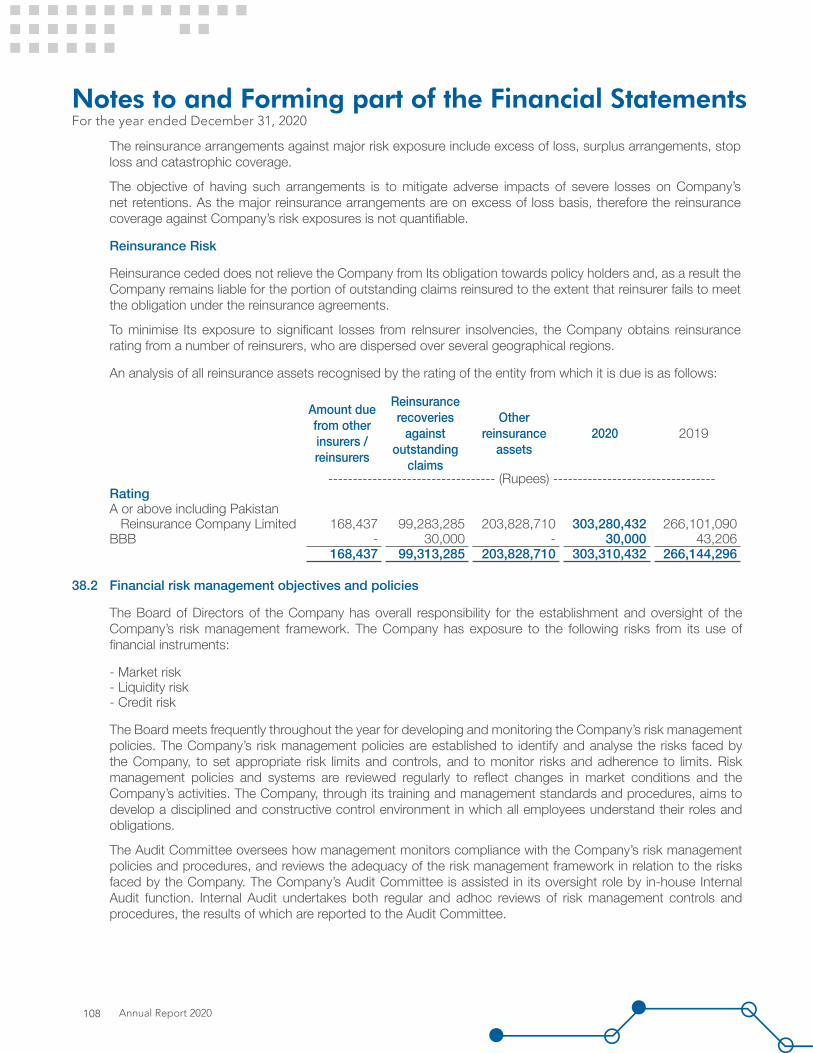
Notes to and Forming part of the Financial StatementsFor the year ended December 31, 2020
The reinsurance arrangements against major risk exposure include excess of loss, surplus arrangements, stop loss and catastrophic coverage.
The objective of having such arrangements is to mitigate adverse impacts of severe losses on Company’s net retentions. As the major reinsurance arrangements are on excess of loss basis, therefore the reinsurance coverage against Company’s risk exposures is not quantifiable.
Reinsurance Risk
Reinsurance ceded does not relieve the Company from Its obligation towards policy holders and, as a result the Company remains liable for the portion of outstanding claims reinsured to the extent that reinsurer fails to meet the obligation under the reinsurance agreements.
To minimise Its exposure to significant losses from relnsurer insolvencies, the Company obtains reinsurance rating from a number of reinsurers, who are dispersed over several geographical regions.
An analysis of all reinsurance assets recognised by the rating of the entity from which it is due is as follows:
Amount due from other insurers / reinsurers
Reinsurance recoveries
against outstanding
claims
Other reinsurance
assets2020 2019
---------------------------------- (Rupees) ---------------------------------RatingA or above including Pakistan Reinsurance Company Limited 168,437 99,283,285 203,828,710 303,280,432 266,101,090 BBB - 30,000 - 30,000 43,206
168,437 99,313,285 203,828,710 303,310,432 266,144,296
38.2 Financial risk management objectives and policies
The Board of Directors of the Company has overall responsibility for the establishment and oversight of the Company’s risk management framework. The Company has exposure to the following risks from its use of financial instruments:
- Market risk- Liquidity risk- Credit risk
The Board meets frequently throughout the year for developing and monitoring the Company’s risk management policies. The Company’s risk management policies are established to identify and analyse the risks faced by the Company, to set appropriate risk limits and controls, and to monitor risks and adherence to limits. Risk management policies and systems are reviewed regularly to reflect changes in market conditions and the Company’s activities. The Company, through its training and management standards and procedures, aims to develop a disciplined and constructive control environment in which all employees understand their roles and obligations.
The Audit Committee oversees how management monitors compliance with the Company’s risk management policies and procedures, and reviews the adequacy of the risk management framework in relation to the risks faced by the Company. The Company’s Audit Committee is assisted in its oversight role by in-house Internal Audit function. Internal Audit undertakes both regular and adhoc reviews of risk management controls and procedures, the results of which are reported to the Audit Committee.
Annual Report 2020108
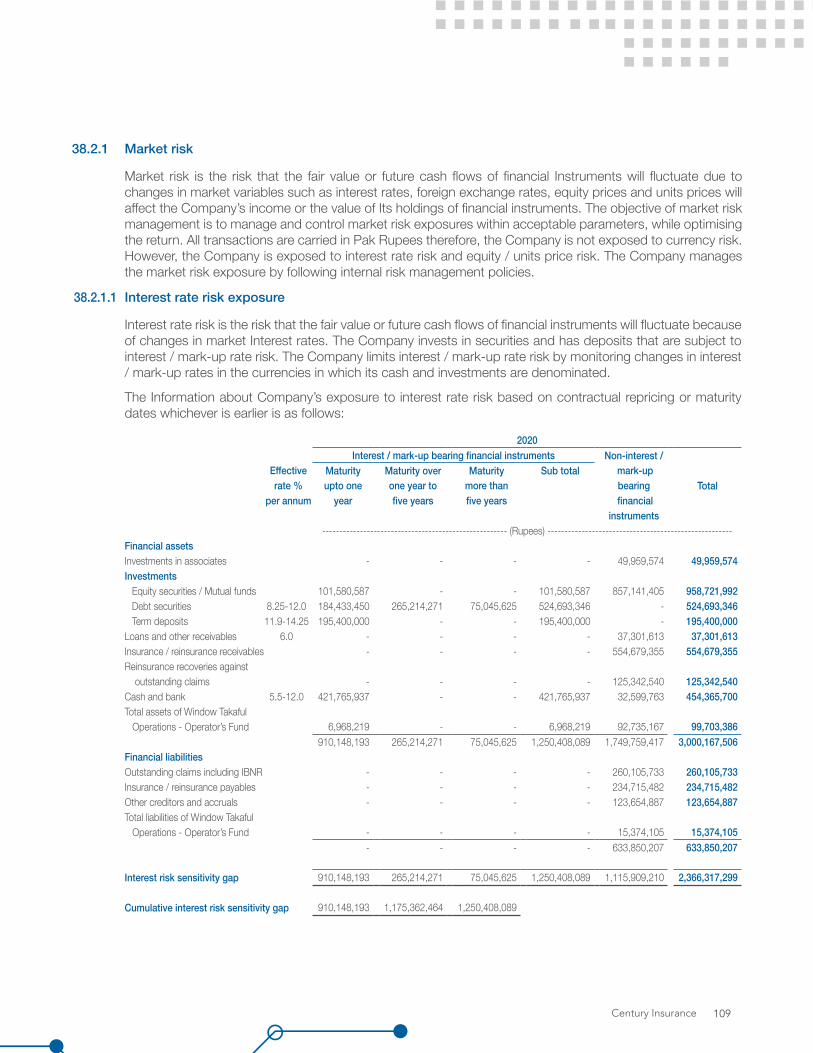
38.2.1 Market risk
Market risk is the risk that the fair value or future cash flows of financial Instruments will fluctuate due to changes in market variables such as interest rates, foreign exchange rates, equity prices and units prices will affect the Company’s income or the value of Its holdings of financial instruments. The objective of market risk management is to manage and control market risk exposures within acceptable parameters, while optimising the return. All transactions are carried in Pak Rupees therefore, the Company is not exposed to currency risk. However, the Company is exposed to interest rate risk and equity / units price risk. The Company manages the market risk exposure by following internal risk management policies.
38.2.1.1 Interest rate risk exposure
Interest rate risk is the risk that the fair value or future cash flows of financial instruments will fluctuate because of changes in market Interest rates. The Company invests in securities and has deposits that are subject to interest / mark-up rate risk. The Company limits interest / mark-up rate risk by monitoring changes in interest / mark-up rates in the currencies in which its cash and investments are denominated.
The Information about Company’s exposure to interest rate risk based on contractual repricing or maturity dates whichever is earlier is as follows:
2020Interest / mark-up bearing financial instruments Non-interest /
TotalEffective Maturity Maturity over Maturity Sub total mark-up rate % upto one one year to more than bearing
per annum year five years five years financial instruments
------------------------------------------------------ (Rupees) ------------------------------------------------------Financial assetsInvestments in associates - - - - 49,959,574 49,959,574 Investments
Equity securities / Mutual funds 101,580,587 - - 101,580,587 857,141,405 958,721,992 Debt securities 8.25-12.0 184,433,450 265,214,271 75,045,625 524,693,346 - 524,693,346 Term deposits 11.9-14.25 195,400,000 - - 195,400,000 - 195,400,000
Loans and other receivables 6.0 - - - - 37,301,613 37,301,613 Insurance / reinsurance receivables - - - - 554,679,355 554,679,355 Reinsurance recoveries against outstanding claims - - - - 125,342,540 125,342,540 Cash and bank 5.5-12.0 421,765,937 - - 421,765,937 32,599,763 454,365,700 Total assets of Window Takaful Operations - Operator’s Fund 6,968,219 - - 6,968,219 92,735,167 99,703,386
910,148,193 265,214,271 75,045,625 1,250,408,089 1,749,759,417 3,000,167,506 Financial liabilitiesOutstanding claims including IBNR - - - - 260,105,733 260,105,733 Insurance / reinsurance payables - - - - 234,715,482 234,715,482 Other creditors and accruals - - - - 123,654,887 123,654,887 Total liabilities of Window Takaful Operations - Operator’s Fund - - - - 15,374,105 15,374,105
- - - - 633,850,207 633,850,207
Interest risk sensitivity gap 910,148,193 265,214,271 75,045,625 1,250,408,089 1,115,909,210 2,366,317,299
Cumulative interest risk sensitivity gap 910,148,193 1,175,362,464 1,250,408,089
Century Insurance 109

2019Interest / mark-up bearing financial instruments Non-interest / Total
Effective Maturity Maturity over Maturity Sub total
mark-up rate % upto one one year to more than bearing
per annum year five years five years financial instruments
------------------------------------------------------ (Rupees) ------------------------------------------------------Financial assetsInvestments in associates - - - - 39,404,247 39,404,247 Investments
Equity securities - - - - 802,057,535 802,057,535 Debt securities 7.25-15.23 174,129,602 156,106,391 99,146,020 429,382,013 - 429,382,013 Term deposits 14.25-14.45 326,000,000 100,000,000 - 426,000,000 - 426,000,000
Loans and other receivables 6.0 - - - - 32,890,397 32,890,397 Insurance / reinsurance receivables - - - - 500,355,096 500,355,096 Reinsurance recoveries against outstanding claims - - - - 97,581,839 97,581,839 Cash and bank 8.5-12.0 244,546,304 - - 244,546,304 22,478,240 267,024,544 Total assets of Window Takaful Operations - Operator’s Fund 1,316,746 - - 1,316,746 85,276,019 86,592,765
745,992,652 256,106,391 99,146,020 1,101,245,063 1,580,043,373 2,681,288,436 Financial liabilitiesOutstanding claims including IBNR - - - - 206,337,532 206,337,532 Insurance / reinsurance payables - - - - 243,253,439 243,253,439 Other creditors and accruals - - - - 162,605,998 162,605,998 Total liabilities of Window Takaful Operations - Operator’s Fund - - - - 15,374,105 15,374,105
- - - - 627,571,074 627,571,074
Interest risk sensitivity gap 745,992,652 256,106,391 99,146,020 1,101,245,063 952,472,299 2,053,717,362
Cumulative interest risk sensitivity gap 745,992,652 1,002,099,043 1,101,245,063
Cash flow sensitivity analysis of variable rate instruments
The following table demonstrates the sensitivity to a reasonably possible change in interest rates, with all other variables held constant, of the Company’s profit before tax and equity based upon average balances and rates:
Increase / Effect on profit before tax Effect on equity(decrease) in
basis points ------------- (Rupees) -------------
December 31, 2020 100 11,208,938 7,958,346 (100) (11,208,938) (7,958,346)
December 31, 2019 100 8,827,600 6,267,596 (100) (8,827,600) (6,267,596)
Fair value sensitivity analysis for fixed rate instruments
The Company does not account for fixed rate financial assets at held for trading. Therefore, a change in interest rates at the reporting date would not affect profit and loss account and equity of the Company.
Notes to and Forming part of the Financial StatementsFor the year ended December 31, 2020
Annual Report 2020110
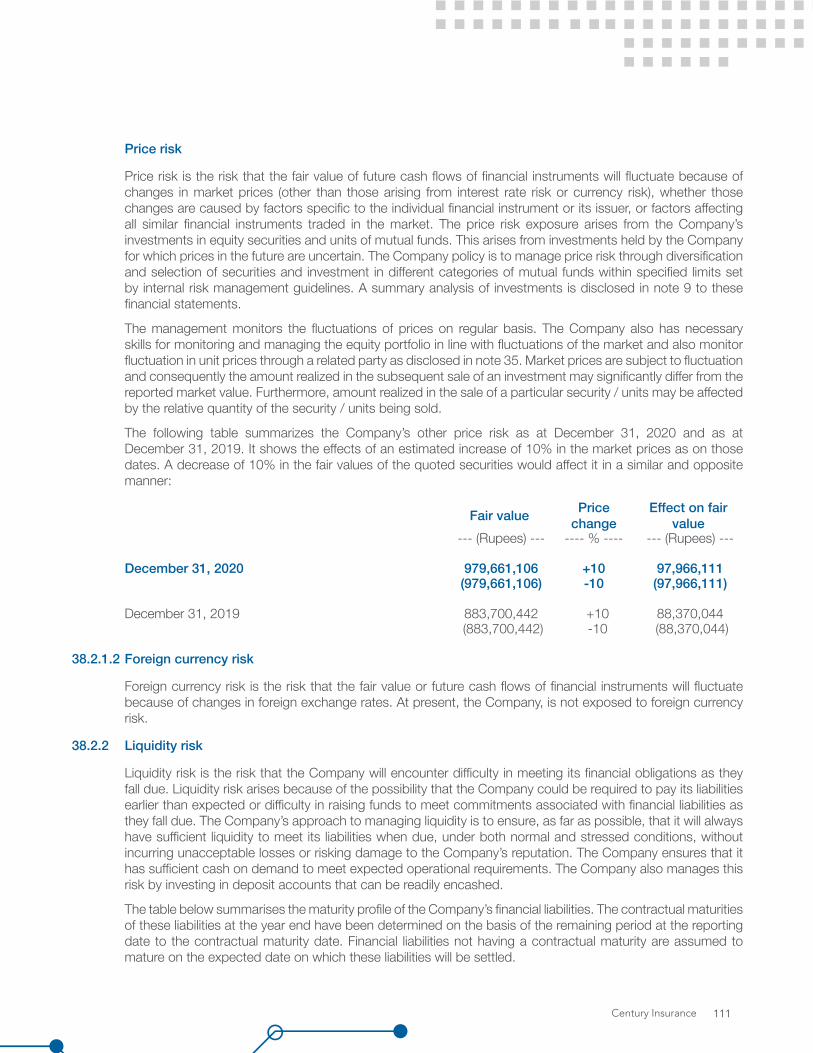
Price risk
Price risk is the risk that the fair value of future cash flows of financial instruments will fluctuate because of changes in market prices (other than those arising from interest rate risk or currency risk), whether those changes are caused by factors specific to the individual financial instrument or its issuer, or factors affecting all similar financial instruments traded in the market. The price risk exposure arises from the Company’s investments in equity securities and units of mutual funds. This arises from investments held by the Company for which prices in the future are uncertain. The Company policy is to manage price risk through diversification and selection of securities and investment in different categories of mutual funds within specified limits set by internal risk management guidelines. A summary analysis of investments is disclosed in note 9 to these financial statements.
The management monitors the fluctuations of prices on regular basis. The Company also has necessary skills for monitoring and managing the equity portfolio in line with fluctuations of the market and also monitor fluctuation in unit prices through a related party as disclosed in note 35. Market prices are subject to fluctuation and consequently the amount realized in the subsequent sale of an investment may significantly differ from the reported market value. Furthermore, amount realized in the sale of a particular security / units may be affected by the relative quantity of the security / units being sold.
The following table summarizes the Company’s other price risk as at December 31, 2020 and as at December 31, 2019. It shows the effects of an estimated increase of 10% in the market prices as on those dates. A decrease of 10% in the fair values of the quoted securities would affect it in a similar and opposite manner:
Fair value Price change
Effect on fair value
--- (Rupees) --- ---- % ---- --- (Rupees) ---
December 31, 2020 979,661,106 +10 97,966,111 (979,661,106) -10 (97,966,111)
December 31, 2019 883,700,442 +10 88,370,044 (883,700,442) -10 (88,370,044)
38.2.1.2 Foreign currency risk
Foreign currency risk is the risk that the fair value or future cash flows of financial instruments will fluctuate because of changes in foreign exchange rates. At present, the Company, is not exposed to foreign currency risk.
38.2.2 Liquidity risk
Liquidity risk is the risk that the Company will encounter difficulty in meeting its financial obligations as they fall due. Liquidity risk arises because of the possibility that the Company could be required to pay its liabilities earlier than expected or difficulty in raising funds to meet commitments associated with financial liabilities as they fall due. The Company’s approach to managing liquidity is to ensure, as far as possible, that it will always have sufficient liquidity to meet its liabilities when due, under both normal and stressed conditions, without incurring unacceptable losses or risking damage to the Company’s reputation. The Company ensures that it has sufficient cash on demand to meet expected operational requirements. The Company also manages this risk by investing in deposit accounts that can be readily encashed.
The table below summarises the maturity profile of the Company’s financial liabilities. The contractual maturities of these liabilities at the year end have been determined on the basis of the remaining period at the reporting date to the contractual maturity date. Financial liabilities not having a contractual maturity are assumed to mature on the expected date on which these liabilities will be settled.
Century Insurance 111
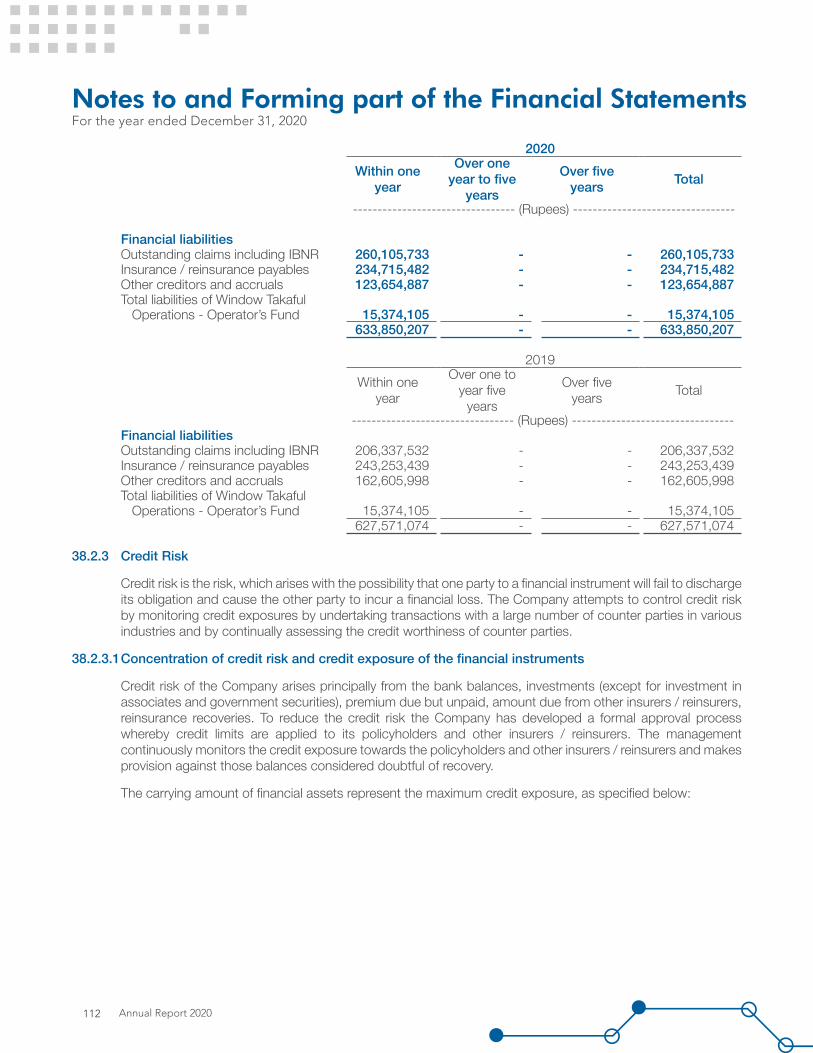
2020Within one
year
Over one year to five
years
Over five years Total
--------------------------------- (Rupees) ---------------------------------
Financial liabilities Outstanding claims including IBNR 260,105,733 - - 260,105,733 Insurance / reinsurance payables 234,715,482 - - 234,715,482 Other creditors and accruals 123,654,887 - - 123,654,887 Total liabilities of Window Takaful Operations - Operator’s Fund 15,374,105 - - 15,374,105
633,850,207 - - 633,850,207
2019Within one
year
Over one to year five
years
Over five years Total
--------------------------------- (Rupees) ---------------------------------Financial liabilities Outstanding claims including IBNR 206,337,532 - - 206,337,532 Insurance / reinsurance payables 243,253,439 - - 243,253,439 Other creditors and accruals 162,605,998 - - 162,605,998 Total liabilities of Window Takaful Operations - Operator’s Fund 15,374,105 - - 15,374,105
627,571,074 - - 627,571,074
38.2.3 Credit Risk
Credit risk is the risk, which arises with the possibility that one party to a financial instrument will fail to discharge its obligation and cause the other party to incur a financial loss. The Company attempts to control credit risk by monitoring credit exposures by undertaking transactions with a large number of counter parties in various industries and by continually assessing the credit worthiness of counter parties.
38.2.3.1Concentration of credit risk and credit exposure of the financial instruments
Credit risk of the Company arises principally from the bank balances, investments (except for investment in associates and government securities), premium due but unpaid, amount due from other insurers / reinsurers, reinsurance recoveries. To reduce the credit risk the Company has developed a formal approval process whereby credit limits are applied to its policyholders and other insurers / reinsurers. The management continuously monitors the credit exposure towards the policyholders and other insurers / reinsurers and makes provision against those balances considered doubtful of recovery.
The carrying amount of financial assets represent the maximum credit exposure, as specified below:
Notes to and Forming part of the Financial StatementsFor the year ended December 31, 2020
Annual Report 2020112
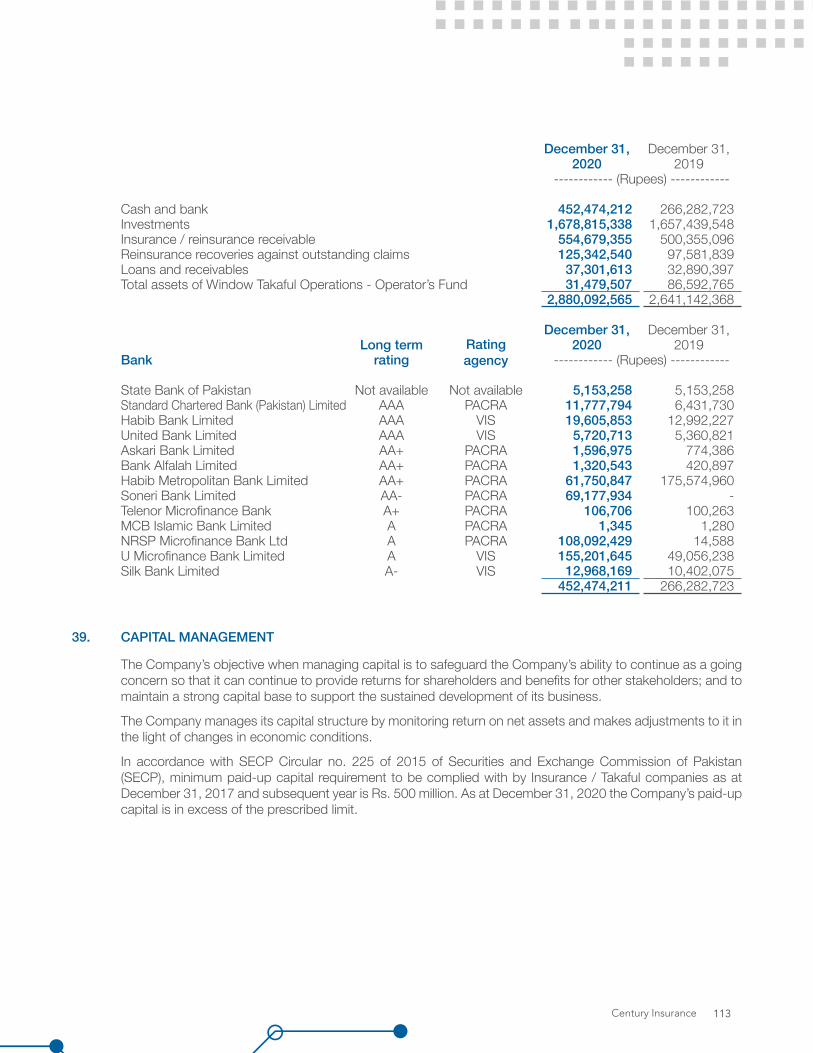
December 31, December 31,2020 2019
------------ (Rupees) ------------
Cash and bank 452,474,212 266,282,723 Investments 1,678,815,338 1,657,439,548 Insurance / reinsurance receivable 554,679,355 500,355,096 Reinsurance recoveries against outstanding claims 125,342,540 97,581,839 Loans and receivables 37,301,613 32,890,397 Total assets of Window Takaful Operations - Operator’s Fund 31,479,507 86,592,765
2,880,092,565 2,641,142,368
December 31, December 31,Long term Rating
agency2020 2019
Bank rating ------------ (Rupees) ------------
State Bank of Pakistan Not available Not available 5,153,258 5,153,258 Standard Chartered Bank (Pakistan) Limited AAA PACRA 11,777,794 6,431,730 Habib Bank Limited AAA VIS 19,605,853 12,992,227 United Bank Limited AAA VIS 5,720,713 5,360,821 Askari Bank Limited AA+ PACRA 1,596,975 774,386 Bank Alfalah Limited AA+ PACRA 1,320,543 420,897 Habib Metropolitan Bank Limited AA+ PACRA 61,750,847 175,574,960 Soneri Bank Limited AA- PACRA 69,177,934 - Telenor Microfinance Bank A+ PACRA 106,706 100,263 MCB Islamic Bank Limited A PACRA 1,345 1,280 NRSP Microfinance Bank Ltd A PACRA 108,092,429 14,588 U Microfinance Bank Limited A VIS 155,201,645 49,056,238 Silk Bank Limited A- VIS 12,968,169 10,402,075
452,474,211 266,282,723
39. CAPITAL MANAGEMENT
The Company’s objective when managing capital is to safeguard the Company’s ability to continue as a going concern so that it can continue to provide returns for shareholders and benefits for other stakeholders; and to maintain a strong capital base to support the sustained development of its business.
The Company manages its capital structure by monitoring return on net assets and makes adjustments to it in the light of changes in economic conditions.
In accordance with SECP Circular no. 225 of 2015 of Securities and Exchange Commission of Pakistan (SECP), minimum paid-up capital requirement to be complied with by Insurance / Takaful companies as at December 31, 2017 and subsequent year is Rs. 500 million. As at December 31, 2020 the Company’s paid-up capital is in excess of the prescribed limit.
Century Insurance 113

40. STATEMENT OF SOLVENCY December 31, December 31,2020 2019
Assets ------------ (Rupees) ------------
Property and equipment 121,150,269 129,993,035 Intangible assets - 9,741 Investment in associates 49,959,574 39,404,247 Investments Equity securities 958,721,992 802,057,535 Debt securities 524,693,346 429,382,013 Term deposits 195,400,000 426,000,000 Loan and other receivable 42,262,996 37,416,224 Insurance / reinsurance receivable 554,679,355 500,355,096 Reinsurance recoveries against outstanding claims 125,342,540 97,581,839 Salvage recoveries accrued 2,775,000 4,005,000 Deferred commission expense 25,643,610 35,271,269 Deferred taxation 34,941,495 42,441,773 Prepayments 209,416,425 185,447,129 Cash and bank 454,365,700 267,024,544 Total assets of Window Takaful Operations - Operator’s fund 103,495,918 89,831,932 Total assets (A) 3,402,848,220 3,086,221,377
In-admissible assets as per following clauses section 32(2) of Insurance Ordinance 2000.Property and equipment 121,150,269 129,993,035 Intangible assets - 9,741 Investments 496,458,770 386,903,827 Loan and other receivable 3,856,474 - Insurance / reinsurance receivable 343,978,774 287,859,870 Security deposits against bond insurance 6,029,833 5,112,474 Deferred taxation 34,941,495 42,441,773 Total assets of Window Takaful Operations - Operator’s Fund - 24,805 Total of In-admissible assets 1,006,415,615 852,345,525
LiabilitiesUnderwriting Provisions Outstanding claims including IBNR 260,105,733 206,337,532 Unearned premium reserve 521,370,886 494,320,532 Unearned reinsurance commission 46,716,196 40,139,097 Retirement benefit obligations 4,519,519 5,141,096 Premiums received in advance 1,891,673 1,023,802 Insurance / reinsurance payables 234,715,482 243,253,439 Other creditors and accruals 152,676,442 188,481,027 Taxation - provision less payments 96,880,283 42,056,608 Total liabilities of Window Takaful Operations - Operator’s Fund 34,906,454 28,770,317 Total liabilities 1,353,782,668 1,249,523,450
Total Net Admissible Assets 1,042,649,937 984,352,402
Minimum solvency requirement (higher of following) 181,232,599 155,944,429
- Method A - U/s 36(3)(a) 150,000,000 - Method B - U/s 36(3)(b) 181,232,599 - Method C - U/s 36(3)(c) 101,075,992
Excess in Net Admissible Assets over minimum requirement 861,417,338 828,407,973
Notes to and Forming part of the Financial StatementsFor the year ended December 31, 2020
Annual Report 2020114
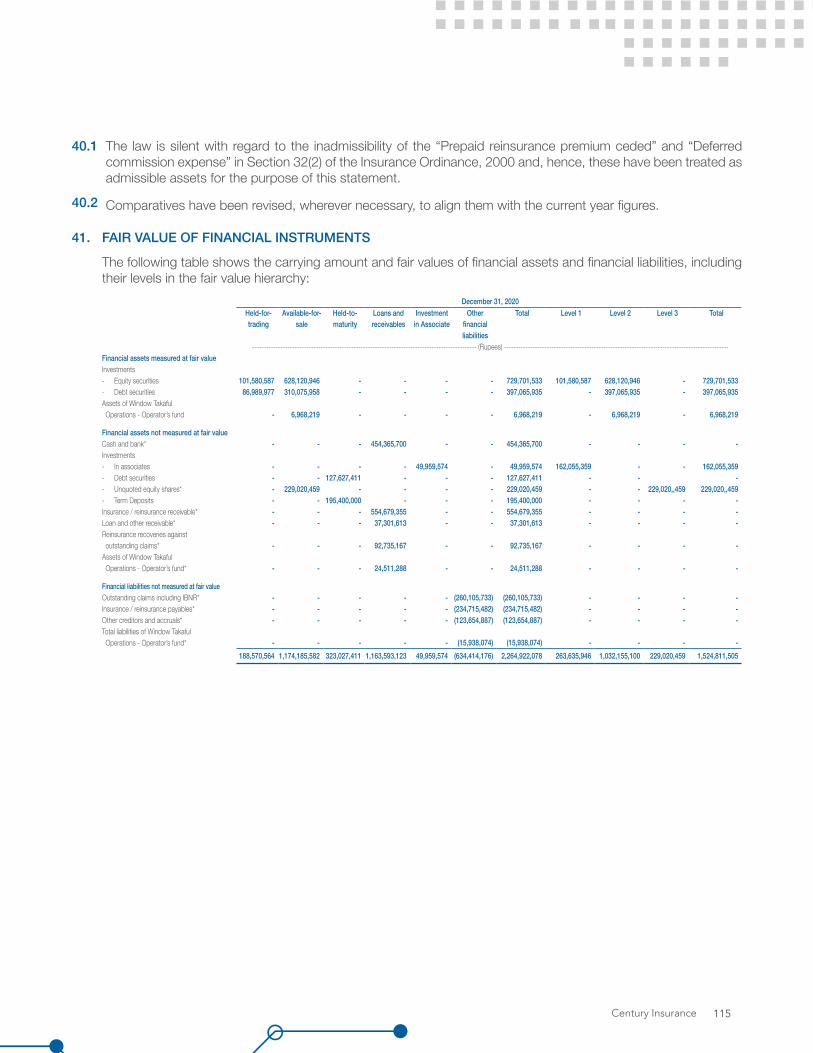
41. FAIR VALUE OF FINANCIAL INSTRUMENTS
The following table shows the carrying amount and fair values of financial assets and financial liabilities, including their levels in the fair value hierarchy:
December 31, 2020 Held-for- Available-for- Held-to- Loans and Investment Other Total Level 1 Level 2 Level 3 Total trading sale maturity receivables in Associate financial
liabilities ----------------------------------------------------------------------------------------------- (Rupees) -----------------------------------------------------------------------------------------------
Financial assets measured at fair valueInvestments- Equity securities 101,580,587 628,120,946 - - - - 729,701,533 101,580,587 628,120,946 - 729,701,533 - Debt securities 86,989,977 310,075,958 - - - - 397,065,935 - 397,065,935 - 397,065,935 Assets of Window Takaful Operations - Operator’s fund - 6,968,219 - - - - 6,968,219 - 6,968,219 - 6,968,219
Financial assets not measured at fair valueCash and bank* - - - 454,365,700 - - 454,365,700 - - - - Investments- In associates - - - - 49,959,574 - 49,959,574 162,055,359 - - 162,055,359 - Debt securities - - 127,627,411 - - - 127,627,411 - - - - Unquoted equity shares* - 229,020,459 - - - - 229,020,459 - - 229,020,,459 229,020,,459- Term Deposits - - 195,400,000 - - - 195,400,000 - - - - Insurance / reinsurance receivable* - - - 554,679,355 - - 554,679,355 - - - - Loan and other receivable* - - - 37,301,613 - - 37,301,613 - - - - Reinsurance recoveries against outstanding claims* - - - 92,735,167 - - 92,735,167 - - - - Assets of Window Takaful Operations - Operator’s fund* - - - 24,511,288 - - 24,511,288 - - - -
Financial liabilities not measured at fair valueOutstanding claims including IBNR* - - - - - (260,105,733) (260,105,733) - - - - Insurance / reinsurance payables* - - - - - (234,715,482) (234,715,482) - - - - Other creditors and accruals* - - - - - (123,654,887) (123,654,887) - - - - Total liabilities of Window Takaful Operations - Operator’s fund* - - - - - (15,938,074) (15,938,074) - - - -
188,570,564 1,174,185,582 323,027,411 1,163,593,123 49,959,574 (634,414,176) 2,264,922,078 263,635,946 1,032,155,100 229,020,459 1,524,811,505
40.1 The law is silent with regard to the inadmissibility of the “Prepaid reinsurance premium ceded” and “Deferred commission expense” in Section 32(2) of the Insurance Ordinance, 2000 and, hence, these have been treated as admissible assets for the purpose of this statement.
40.2 Comparatives have been revised, wherever necessary, to align them with the current year figures.
Century Insurance 115

Notes to and Forming part of the Financial StatementsFor the year ended December 31, 2020
December 31, 2019 Held-for- trading
Available-for- sale
Held-to- maturity
Loans and receivables
Investment in
Associate
Other financial liabilities
Total Level 1 Level 2 Level 3 Total
Financial assets measured at fair value ----------------------------------------------------------------------------------- (Rupees) -----------------------------------------------------------------------------------Investments- Equity securities 90,990,067 567,992,185 - - - - 658,982,252 140,849,949 518,132,303 - 658,982,252 - Debt securities - 201,064,648 - - - - 201,064,648 - 201,064,648 - 201,064,648 Assets of Window Takaful Operations - Operator’s fund - 62,081,477 - - - - 62,081,477 - 62,081,477 - 62,081,477
Financial assets not measured at fair valueCash and bank* - - - 267,024,544 - - 267,024,544 - - -Investments- In associates - - - - 39,404,247 - 39,404,247 81,642,907 - - 81,642,907 - Debt securities - - 228,317,365 - - - 228,317,365 - 204,803,500 - 204,803,500 - Unquoted equity shares* - 143,075,283 - - - - 143,075,283 - - 143,075,283 143,075,283- Term Deposits - - 426,000,000 - - - 426,000,000 - - - - Insurance / reinsurance receivable* - - - 500,355,096 - - 500,355,096 - - - - Loan and other receivables - - - 32,890,397 - - 32,890,397 - - - - Reinsurance recoveries against outstanding claims* - - - 97,581,839 - - 97,581,839 - - - - Total assets of Window Takaful Operator’s fund - - - 24,511,288 - - 24,511,288 - - - -
Financial liabilities not measured at fair valueOutstanding claims including IBNR - - - - - (206,337,532) (206,337,532) - - - - Insurance / reinsurance payables* - - - - - (243,253,439) (243,253,439) - - - - Other creditors and accruals* - - - - - (162,605,998) (162,605,998) - - - - Total liabilities of Window Takaful Operations - Operator’s fund - - - - - (15,374,105) (15,374,105) - - - -
90,990,067 974,213,593 654,317,365 922,363,164 39,404,247 (627,571,074) 2,053,717,362 222,492,856 986,081,928 143,075,283 1,351,650,067
* The Company has not disclosed the fair value of these items because their carrying amounts are a reasonable approximation of fair value.
41.1 Fair value is an amount for which an asset could be exchanged, or a liability settled, between knowledgeable willing parties in an arm’s length transaction. Consequently, differences may arise between the carrying values and the fair values estimates.
The Company measures fair values using the following fair value hierarchy that reflects the significance of the inputs used in making the measurements:
Level 1: Fair value measurements using quoted prices (unadjusted) in active markets for identical assets or liabilities.
Level 2: Fair value measurements using inputs other than quoted prices included within Level 1 that are observable for the asset or liability, either directly (i.e. as prices) or Indirectly (i.e. derived from prices).
Level 3: Fair value measurements using inputs for the asset or liability that are not based on observable market data (i.e. unobservable Inputs).
Annual Report 2020116
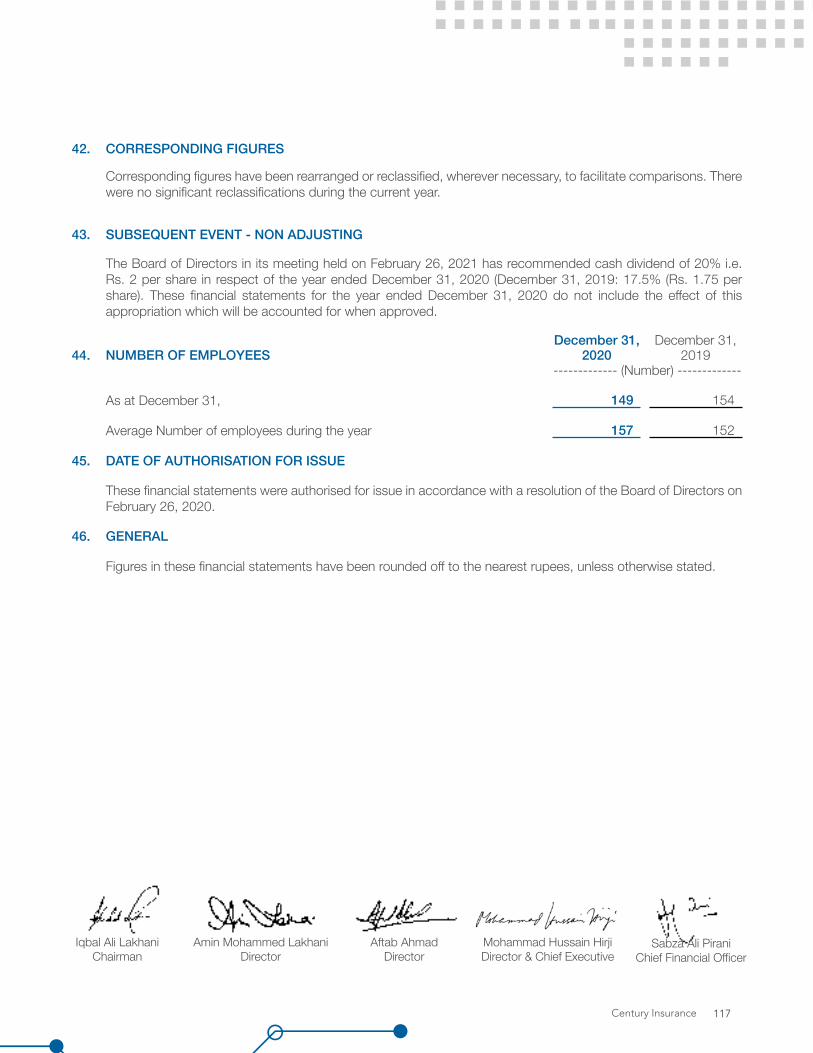
42. CORRESPONDING FIGURES
Corresponding figures have been rearranged or reclassified, wherever necessary, to facilitate comparisons. There were no significant reclassifications during the current year.
43. SUBSEQUENT EVENT - NON ADJUSTING
The Board of Directors in its meeting held on February 26, 2021 has recommended cash dividend of 20% i.e. Rs. 2 per share in respect of the year ended December 31, 2020 (December 31, 2019: 17.5% (Rs. 1.75 per share). These financial statements for the year ended December 31, 2020 do not include the effect of this appropriation which will be accounted for when approved.
December 31, December 31,44. NUMBER OF EMPLOYEES 2020 2019
------------- (Number) -------------
As at December 31, 149 154
Average Number of employees during the year 157 152
45. DATE OF AUTHORISATION FOR ISSUE
These financial statements were authorised for issue in accordance with a resolution of the Board of Directors on February 26, 2020.
46. GENERAL
Figures in these financial statements have been rounded off to the nearest rupees, unless otherwise stated.
Iqbal Ali LakhaniChairman
Aftab AhmadDirector
Amin Mohammed LakhaniDirector
Sabza Ali PiraniChief Financial Officer
Mohammad Hussain HirjiDirector & Chief Executive
Century Insurance 117

Window Takaful
OperationsFinancial
Statements
KPMG Taseer Hadi & Co.Chartered AccountantsSheikh Sultan Trust Building No. 2, Beaumont RoadKarachi 75530 Pakistan +92 (21) 35685847, Fax +92 (21) 35685095
Independent Auditors’ ReportTo the members of Century Insurance Company Limited – Window Takaful OperationsReport on the Audit of the Financial Statements
KPMG Taseer Hadi & Co., a Partnership firm registered in Pakistan and a member firm of the KPMG global organizationof independent member firms affiliated with KPMG International Limited, a private English company limited by guarantee.
Opinion
We have audited the annexed financial statements of Century Insurance Company Limited - Window Takaful Operations (“the Operator”), which comprise the statement of financial position as at December 31, 2020, the profit and loss account, the statement of comprehensive income, the statement of changes in fund and the statement of cash flows for the year then ended, and notes to the financial statements, including a summary of significant accounting policies and other explanatory information, and we state that we have obtained all the information and explanations which, to the best of our knowledge and belief, were necessary for the purposes of the audit.
In our opinion and to the best of our information and according to the explanations given to us, the statement of financial position, the profit and loss account, the statement of comprehensive income, the statement of changes in fund and the statement of cash flows together with the notes forming part thereof, conform with the accounting and reporting standards as applicable in Pakistan and give the information required by the Insurance Ordinance, 2000 and the Companies Act, 2017 (XIX of 2017), in the manner so required and respectively give a true and fair view of the state of Operator’s affairs as at December 31, 2020 and of the profit, total comprehensive income, the changes in fund and its cash flows for the year then ended.
Basis for Opinion
We conducted our audit in accordance with International Standards on Auditing (ISAs) as applicable in Pakistan. Our responsibilities under those standards are further described in the Auditor’s Responsibilities for the Audit of the Financial Statements section of our report. We are independent of the Operator in accordance with the International Ethics Standards Board for Accountants’ Code of Ethics for Professional Accountants as adopted by the Institute of Chartered Accountants of Pakistan (the Code) and we have fulfilled our other ethical responsibilities in accordance with the Code. We believe that the audit evidence we have obtained is sufficient and appropriate to provide a basis for our opinion.
Information Other than the Financial Statements and Auditor’s Report Thereon
Management is responsible for the Other Information. The Other Information comprises the information included in the Annual Report but does not include the financial statements and our auditor’s report thereon.
Our opinion on the financial statements does not cover the Other Information and we do not express any form of assurance conclusion thereon.
In connection with our audit of the financial statements, our responsibility is to read the Other Information and, in doing so, consider whether the Other Information is materially inconsistent with the financial statements or our knowledge
Annual Report 2020120
KPMG Taseer Hadi & Co.
obtained in the audit, or otherwise appears to be materially misstated. If, based on the work we have performed, we conclude that there is a material misstatement of this Other Information, we are required to report that fact. We have nothing to report in this regard.
Responsibilities of Management and Board of Directors for the Financial Statements
Management is responsible for the preparation and fair presentation of the financial statements in accordance with accounting and reporting standards as applicable in Pakistan and the requirements of Insurance Ordinance, 2000 and, Companies Act, 2017 (XIX of 2017), and for such internal control as management determines is necessary to enable the preparation of the financial statements that are free from material misstatement, whether due to fraud or error.
In preparing the financial statements, management is responsible for assessing the Operator’s ability to continue as a going concern, disclosing, as applicable, matters related to going concern and using the going concern basis of accounting unless management either intends to liquidate the Operator or to cease operations, or has no realistic alternative but to do so.
Board of directors are responsible for overseeing the Operator’s financial reporting process.
Auditor’s Responsibilities for the Audit of the Financial Statements
Our objectives are to obtain reasonable assurance about whether the financial statements as a whole are free from material misstatement, whether due to fraud or error, and to issue an auditor’s report that includes our opinion. Reasonable assurance is a high level of assurance, but is not a guarantee that an audit conducted in accordance with ISAs as applicable in Pakistan will always detect a material misstatement when it exists. Misstatements can arise from fraud or error and are considered material if, individually or in the aggregate, they could reasonably be expected to influence the economic decisions of users taken on the basis of these financial statements.
As part of an audit, in accordance with ISAs as applicable in Pakistan, we exercise professional judgment and maintain professional skepticism throughout the audit. We also:
• Identify and assess the risks of material misstatement of the financial statements, whether due to fraud or error, design and perform audit procedures responsive to those risks, and obtain audit evidence that is sufficient and appropriate to provide a basis for our opinion. The risk of not detecting a material misstatement resulting from fraud is higher than for one resulting from error, as fraud may involve collusion, forgery, intentional omissions, misrepresentations, or the override of internal control.
• Obtain an understanding of internal control relevant to the audit in order to design audit procedures that are appropriate in the circumstances, but not for the purpose of expressing an opinion on the effectiveness of the Operator’s internal control.
• Evaluate the appropriateness of accounting policies used and the reasonableness of accounting estimates and related disclosures made by management.
• Conclude on the appropriateness of management’s use of the going concern basis of accounting and, based on the audit evidence obtained, whether a material uncertainty exists related to events or conditions that may cast significant doubt on the Operator’s ability to continue as a going concern. If we conclude that a material uncertainty exists, we are required to draw attention in our auditor’s report to the related disclosures in the financial statements or, if such disclosures are inadequate, to modify our opinion. Our conclusions are based on the audit evidence obtained up to the date of our auditor’s report. However, future events or conditions may cause the Operator to cease to continue as a going concern.
Century Insurance 121
• Evaluate the overall presentation, structure and content of the financial statements, including the disclosures, and whether the financial statements represent the underlying transactions and events in a manner that achieves fair presentation.
We communicate with the board of directors regarding, among other matters, the planned scope and timing of the audit and significant audit findings, including any significant deficiencies in internal control that we identify during our audit.
Report on other legal and regulatory requirements
Based on our audit, we further report that in our opinion:
a) proper books of account have been kept by the Operator as required by the Insurance Ordinance, 2000 and the Companies Act, 2017 (XIX of 2017);
b) the statement of financial position, the profit and loss account, the statement of comprehensive income, the statement of changes in fund and the statement of cash flows together with the notes thereon have been drawn up in conformity with the Insurance Ordinance, 2000, the Companies Act, 2017 (XXI of 2017), and are in agreement with the books of account;
c) investments made, expenditure incurred and guarantees extended during the year were for the purpose of the Operator’s business; and
d) no zakat was deductible at source under the Zakat and Ushr Ordinance, 1980 (XVIII of 1980).
The engagement partner on the audit resulting in this independent auditor’s report is Muhammad Taufiq.
KPMG Taseer Hadi & Co.
Date: March 18, 2021 KPMG Taseer Hadi & Co.Chartered Accountants
Karachi
Annual Report 2020122

Statement of Financial Position As at December 31, 2020
Operator’s Fund Participants’ Takaful FundDecember 31,
2020December 31,
2019December 31,
2020December 31,
2019Note ---------------------------------------- (Rupees) -----------------------------------------
Assets
InvestmentsEquity securities / mutual funds 6 6,968,219 62,081,477 - - Debt securities 7 - - 500,000 500,000
Loans and other receivables 8 44,550 60,907 533,901 452,811 Takaful / retakaful receivables 9 - - 45,421,012 31,222,562 Retakaful recoveries against outstanding claims 18 - - 15,778,359 5,735,733 Deferred commission expense / acquisition cost 21 3,792,532 3,239,167 - - Receivable from PTF 13 10,097,205 23,098,830 - - Deferred wakala fee 20 - - 17,669,203 11,310,448 Deferred taxation 14 - 24,805 - - Prepaid retakaful contribution ceded 17 - - 11,947,160 8,104,293 Cash and bank 11 82,593,412 1,326,746 45,227,837 43,817,054 Total Assets 103,495,918 89,831,932 137,077,472 101,142,901
Funds and Liabilities
Funds attributable to:
Operator’s FundStatutory fund 50,000,000 50,000,000 - - Reserves 34,045 (60,730) - - Accumulated gain 18,555,419 11,122,345 - -
Participants’ Takaful FundCeded Money - - 500,000 500,000 Accumulated surplus - - 13,723,262 9,304,881 Total Funds 68,589,464 61,061,615 14,223,262 9,804,881 LiabilitiesPTF underwriting provisionsOutstanding claims including IBNR 18 - - 36,298,886 19,802,329 Unearned contribution reserves 17 - - 44,501,222 30,202,824 Unearned re-takaful rebate 19 - - 1,751,801 1,134,344
- - 82,551,909 51,139,497
Unearned Wakala fee 20 17,669,203 11,310,448 - - Payable to OPF 13 - - 10,097,205 23,098,830 Deferred taxation 14 13,906 - - - Contribution received in advance - - 1,387,347 384,481 Takaful / Re-takaful payables 12 - - 27,412,918 15,881,047 Other creditors and accruals 15 15,968,201 15,378,719 1,404,831 834,165 Taxation - provision less payment 10 1,255,144 2,081,150 - -
34,906,454 28,770,317 40,302,301 40,198,523
Total Liabilities 34,906,454 28,770,317 122,854,210 91,338,020
Total Funds and Liabilities 103,495,918 89,831,932 137,077,472 101,142,901
Contingency and Commitment 16
The annexed notes from 1 to 37 form an integral part of these financial statements.
Iqbal Ali LakhaniChairman
Aftab AhmadDirector
Amin Mohammed LakhaniDirector
Sabza Ali PiraniChief Financial Officer
Mohammad Hussain HirjiDirector & Chief Executive
Century Insurance 123

December 31, December 31,2020 2019
Note ------------ (Rupees) ------------Participants’ Takaful Fund - (PTF) Revenue accountContribution earned 17 57,345,787 45,493,364 Less: Contribution ceded to retakaful (31,854,548) (21,447,389)Net contribution revenue 25,491,239 24,045,975
Retakaful rebate earned 19 4,548,171 2,978,552 Net underwriting income 30,039,410 27,024,527
Net claims - reported / settled 18 (26,813,570) (19,779,960)Direct expenses 23 (1,275,915) (622,111)
Surplus before investment income 1,949,925 6,622,456
Investment income 24 1,132,617 1,826,952 Other Income 25 1,952,953 1,412,844 Less: Mudarib’s share of investment income 26 (617,114) (647,959)Surplus for the year 4,418,381 9,214,293
Operator’s Fund - (OPF) Revenue account
Wakala fee 20 34,572,468 26,125,135 Commission expense 21 (8,993,498) (7,015,918)General, administration and management expenses 22 (20,633,562) (15,383,010)
4,945,408 3,726,207
Mudarib’s share of PTF investment income 26 617,114 647,959 Investment income 24 5,142,669 5,235,989 Other income 25 286,042 477,786 Other expenses 27 (522,114) (631,146)Profit before tax 10,469,119 9,456,795
Income tax expense 28 (3,036,045) (2,742,471)
Profit after tax 7,433,074 6,714,324
The annexed notes from 1 to 37 form an integral part of these financial statements.
Profit and Loss AccountFor the year ended December 31, 2020
Iqbal Ali LakhaniChairman
Aftab AhmadDirector
Amin Mohammed LakhaniDirector
Sabza Ali PiraniChief Financial Officer
Mohammad Hussain HirjiDirector & Chief Executive
Annual Report 2020124

Statement of Comprehensive IncomeFor the year ended December 31, 2020
December 31, December 31,2020 2019
------------- (Rupees) -------------
Participants’ Takaful Fund - (PTF) Revenue account
Surplus for the year 4,418,381 9,214,293
Other Comprehensive Income for the year
- Unrealized gain on available for sale investments - - - Reclassification adjustment for net (gain) on available for sale investments included in profit and loss account - (7,771)
Total Comprehensive Income for the year 4,418,381 9,206,522
Operator’s Fund - (OPF) Revenue account
Profit after tax 7,433,074 6,714,324
Other Comprehensive Income for the year
Items that will be reclassified to profit and loss account
- Unrealized gain / (loss) on available for sale investments - net of tax 34,045 (60,730)- Reclassification adjustment for net loss / (gain) on available for sale investments included in profit and loss account - net of tax 60,730 (141,806)
Other comprehensive income / (loss) for the year 94,775 (202,536)
Total comprehensive income for the year 7,527,849 6,511,788
The annexed notes from 1 to 37 form an integral part of these financial statements.
Iqbal Ali LakhaniChairman
Aftab AhmadDirector
Amin Mohammed LakhaniDirector
Sabza Ali PiraniChief Financial Officer
Mohammad Hussain HirjiDirector & Chief Executive
Century Insurance 125
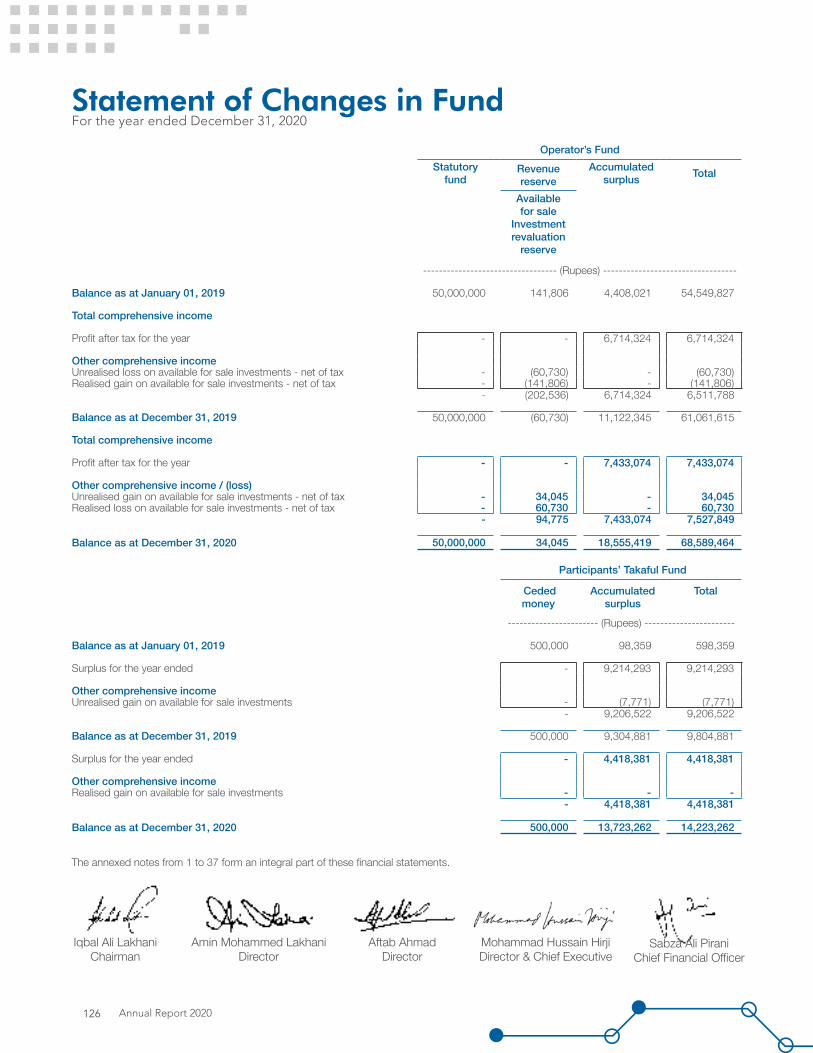
Statement of Changes in FundFor the year ended December 31, 2020
Operator’s FundStatutory
fundRevenue reserve
Accumulated surplus Total
Available for sale
Investment revaluation
reserve
---------------------------------- (Rupees) ----------------------------------
Balance as at January 01, 2019 50,000,000 141,806 4,408,021 54,549,827
Total comprehensive income
Profit after tax for the year - - 6,714,324 6,714,324
Other comprehensive incomeUnrealised loss on available for sale investments - net of tax - (60,730) - (60,730)Realised gain on available for sale investments - net of tax - (141,806) - (141,806)
- (202,536) 6,714,324 6,511,788
Balance as at December 31, 2019 50,000,000 (60,730) 11,122,345 61,061,615
Total comprehensive income
Profit after tax for the year - - 7,433,074 7,433,074
Other comprehensive income / (loss) Unrealised gain on available for sale investments - net of tax - 34,045 - 34,045 Realised loss on available for sale investments - net of tax - 60,730 - 60,730
- 94,775 7,433,074 7,527,849
Balance as at December 31, 2020 50,000,000 34,045 18,555,419 68,589,464
Participants’ Takaful Fund
Ceded money
Accumulated surplus
Total
----------------------- (Rupees) -----------------------
Balance as at January 01, 2019 500,000 98,359 598,359
Surplus for the year ended - 9,214,293 9,214,293
Other comprehensive incomeUnrealised gain on available for sale investments - (7,771) (7,771)
- 9,206,522 9,206,522
Balance as at December 31, 2019 500,000 9,304,881 9,804,881
Surplus for the year ended - 4,418,381 4,418,381
Other comprehensive incomeRealised gain on available for sale investments - - -
- 4,418,381 4,418,381
Balance as at December 31, 2020 500,000 13,723,262 14,223,262
The annexed notes from 1 to 37 form an integral part of these financial statements.
Iqbal Ali LakhaniChairman
Aftab AhmadDirector
Amin Mohammed LakhaniDirector
Sabza Ali PiraniChief Financial Officer
Mohammad Hussain HirjiDirector & Chief Executive
Annual Report 2020126
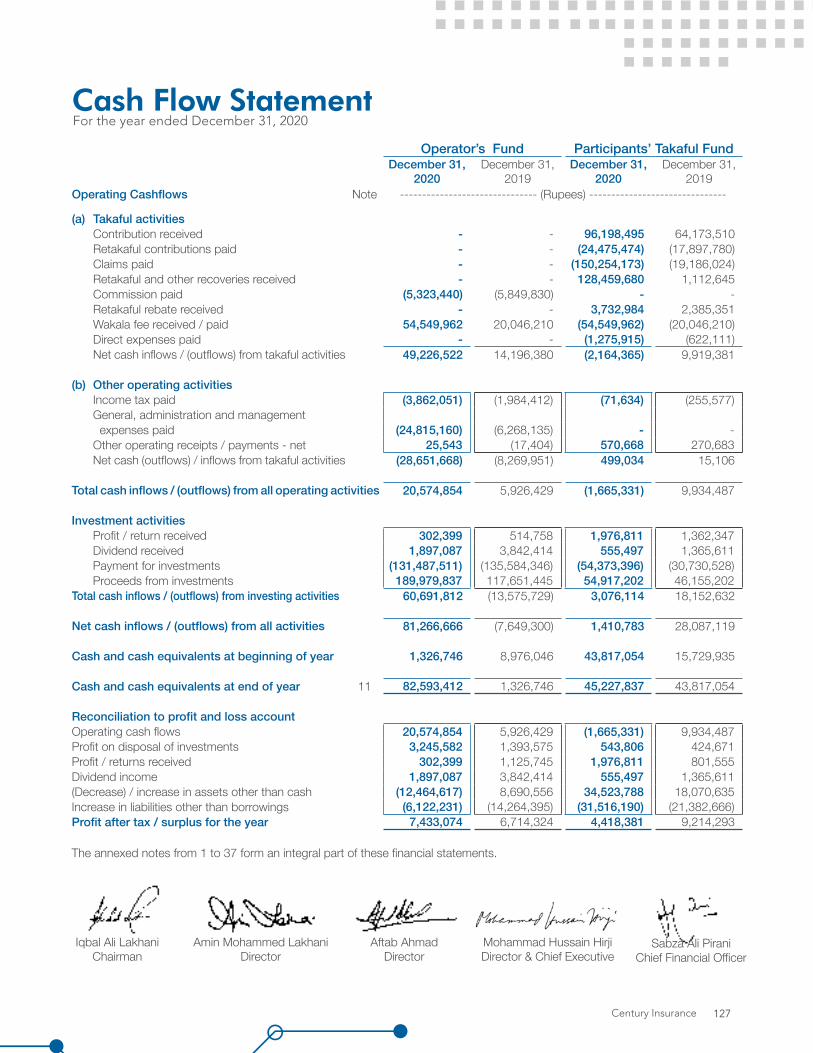
Operator’s Fund Participants’ Takaful FundDecember 31,
2020December 31,
2019December 31,
2020December 31,
2019Operating Cashflows Note ------------------------------- (Rupees) -------------------------------
(a) Takaful activitiesContribution received - - 96,198,495 64,173,510 Retakaful contributions paid - - (24,475,474) (17,897,780)Claims paid - - (150,254,173) (19,186,024)Retakaful and other recoveries received - - 128,459,680 1,112,645 Commission paid (5,323,440) (5,849,830) - - Retakaful rebate received - - 3,732,984 2,385,351 Wakala fee received / paid 54,549,962 20,046,210 (54,549,962) (20,046,210)Direct expenses paid - - (1,275,915) (622,111)Net cash inflows / (outflows) from takaful activities 49,226,522 14,196,380 (2,164,365) 9,919,381
(b) Other operating activitiesIncome tax paid (3,862,051) (1,984,412) (71,634) (255,577)General, administration and management expenses paid (24,815,160) (6,268,135) - - Other operating receipts / payments - net 25,543 (17,404) 570,668 270,683 Net cash (outflows) / inflows from takaful activities (28,651,668) (8,269,951) 499,034 15,106
Total cash inflows / (outflows) from all operating activities 20,574,854 5,926,429 (1,665,331) 9,934,487
Investment activitiesProfit / return received 302,399 514,758 1,976,811 1,362,347 Dividend received 1,897,087 3,842,414 555,497 1,365,611 Payment for investments (131,487,511) (135,584,346) (54,373,396) (30,730,528)Proceeds from investments 189,979,837 117,651,445 54,917,202 46,155,202
Total cash inflows / (outflows) from investing activities 60,691,812 (13,575,729) 3,076,114 18,152,632
Net cash inflows / (outflows) from all activities 81,266,666 (7,649,300) 1,410,783 28,087,119
Cash and cash equivalents at beginning of year 1,326,746 8,976,046 43,817,054 15,729,935
Cash and cash equivalents at end of year 11 82,593,412 1,326,746 45,227,837 43,817,054
Reconciliation to profit and loss accountOperating cash flows 20,574,854 5,926,429 (1,665,331) 9,934,487 Profit on disposal of investments 3,245,582 1,393,575 543,806 424,671 Profit / returns received 302,399 1,125,745 1,976,811 801,555 Dividend income 1,897,087 3,842,414 555,497 1,365,611 (Decrease) / increase in assets other than cash (12,464,617) 8,690,556 34,523,788 18,070,635 Increase in liabilities other than borrowings (6,122,231) (14,264,395) (31,516,190) (21,382,666)Profit after tax / surplus for the year 7,433,074 6,714,324 4,418,381 9,214,293
The annexed notes from 1 to 37 form an integral part of these financial statements.
Cash Flow Statement For the year ended December 31, 2020
Iqbal Ali LakhaniChairman
Aftab AhmadDirector
Amin Mohammed LakhaniDirector
Sabza Ali PiraniChief Financial Officer
Mohammad Hussain HirjiDirector & Chief Executive
Century Insurance 127

Notes to and Forming Part of the Financial StatementsFor the year ended December 31, 2020
1. LEGAL STATUS AND NATURE OF BUSINESS
Century Insurance Company Limited (“the Operator”) is a public limited company incorporated in Pakistan under the repealed Companies Ordinance, 1984 (now Companies Act 2017) on October 10, 1985. The Operator is listed on Pakistan Stock Exchange and is engaged in general insurance business. The registered office of the Operator is situated at Lakson Square Building No. 2, Sarwar Shaheed Road, Karachi.
The Operator was granted authorisation on August 07, 2017 under Rule 6 of the Takaful Rules, 2012 to undertake Window Takaful Operations (“the Operations”) by Securities and Exchange Commission of Pakistan (“SECP”) under Takaful Rules, 2012, General Takaful accounting regulation 2019 to carry on general takaful operations in Pakistan.
The Operator transferred statutory fund of Rs. 50 million in a separate bank account for the Operations as per the requirement of circular 8 of 2014. Thereafter, the Operator has formed a Waqf for Participants’ Fund (“PTF”) by executing the Waqf deed dated August 17, 2017 by investing a ceded money of Rs. 0.5 million. The ceded money is required to be invested in shariah compliant investments and any profit thereon can be utilized only to pay benefits to Participants’ or defray PTF expenses. Waqf Deed governs the relationship of Operator and participants for management of takaful operations, investments of participants’ funds and investments of the Operator’s funds approved by the shariah advisor of the Operator. The Operator commenced activities of the Operations on August 18, 2017.
1.1 Impact of COVID-19 on the unconsolidated financial statements
During the year, the novel coronavirus (COVID-19) emerged and since then, the condition has continued to deteriorate. On January 30, 2020, the International Health Regulations Emergency Committee of the WHO declared the outbreak a “Public Health Emergency of International Concern”. The COVID-19 pandemic has significantly impacted the market around the world to date and may continue to do so in the coming months of 2020. The scale and duration of this outbreak remains uncertain and as it evolves globally in 2020, the Company based on its current assessment considered that there would be no significant impact that will adversely affect its business, result of operations and financial condition of the Company.
2. BASIS OF PREPARATION AND STATEMENT OF COMPLIANCE
These financial statements have been prepared in accordance with accounting and reporting standards as applicable in Pakistan. The accounting and reporting standards comprise of:
- International Financial Reporting Standards (IFRS) issued by the International Accounting Standard Board (IASB) as are notified under Companies Act, 2017; and
- Provision of and directive issued under the Companies Act, 2017 and Insurance Ordinance, 2000, Insurance Rules, 2017, Insurance Accounting Regulations, 2017 and Takaful Rules, 2012, General Takaful Accounting Regualtion 2019.
In case requirements differ, the provisions or directives of the Companies Act, 2017, the Insurance Ordinance, 2000, the Insurance Rules, 2017, the Insurance Accounting Regulations, 2017 and Takaful Rules, 2012, General Takaful Accounting Regulation 2019 shall prevail.
The Securities and Exchange Commission of Pakistan (“SECP”) vide its S.R.O 1416 (I)/2019 dated November 20, 2019 has prescribed format of the presentation of annual financial statements for general takaful operators. These financial statements have been prepared in accordance with the format prescribed by the SECP.
These financial statements reflect the financial position and results of operations of both the Operator’s Fund and Participants’ Takaful Fund in a manner that the assets, liabilities, income and expenses of the Operator’s Fund and PTF remain separately identifiable.
Annual Report 2020128
2.1 Basis of measurement
These financial statements have been prepared under the historical cost convention except for certain investments which are stated at their fair values.
2.2 Functional and presentation currency
These financial statements are presented in Pakistan Rupees which is the Operations’ functional currency.
2.3 Standards, interpretations and amendments to accounting and reporting standards as applicable in Pakistan that are not yet effective
The following International Financial Reporting Standards (IFRS Standards) as notified under the Companies Act, 2017 and the amendments and interpretations thereto will be effective for accounting periods beginning on or after January 01, 2021:
- COVID-19-Related Rent Concessions (Amendment to IFRS 16) – the International Accounting Standards Board (the Board) has issued amendments to IFRS 16 (the amendments) to provide practical relief for lessees in accounting for rent concessions. The amendments are effective for periods beginning on or after June 01, 2020, with earlier application permitted. Under the standard’s previous requirements, lessees assess whether rent concessions are lease modifications and, if so, apply the specific guidance on accounting for lease modifications. This generally involves remeasuring the lease liability using the revised lease payments and a revised discount rate. In light of the effects of the COVID-19 pandemic, and the fact that many lessees are applying the standard for the first time in their financial statements, the Board has provided an optional practical expedient for lessees. Under the practical expedient, lessees are not required to assess whether eligible rent concessions are lease modifications, and instead are permitted to account for them as if they were not lease modifications. Rent concessions are eligible for the practical expedient if they occur as a direct consequence of the COVID-19 pandemic and if all the following criteria are met:
- the change in lease payments results in revised consideration for the lease that is substantially the same as, or less than, the consideration for the lease immediately preceding the change;
- any reduction in lease payments affects only payments originally due on or before June 30, 2021; and
- there is no substantive change to the other terms and conditions of the lease.
- Interest Rate Benchmark Reform – Phase 2 which amended IFRS 9, IAS 39, IFRS 7, IFRS 4 and IFRS 16 is applicable for annual financial periods beginning on or after January 01, 2021, with earlier application permitted. The amendments introduce a practical expedient to account for modifications of financial assets or financial liabilities if a change results directly from IBOR reform and occurs on an ‘economically equivalent’ basis. In these cases, changes will be accounted for by updating the effective interest rate. A similar practical expedient will apply under IFRS 16 for lessees when accounting for lease modifications required by IBOR reform. The amendments also allow a series of exemptions from the regular, strict rules around hedge accounting for hedging relationships directly affected by the interest rate benchmark reforms. The amendments apply retrospectively with earlier application permitted. Hedging relationships previously discontinued solely because of changes resulting from the reform will be reinstated if certain conditions are met.
Century Insurance 129
- Onerous Contracts – Cost of Fulfilling a Contract (Amendments to IAS 37) effective for the annual period beginning on or after January 01, 2022 amends IAS 1 by mainly adding paragraphs which clarifies what comprise the cost of fulfilling a contract, Cost of fulfilling a contract is relevant when determining whether a contract is onerous. An entity is required to apply the amendments to contracts for which it has not yet fulfilled all its obligations at the beginning of the annual reporting period in which it first applies the amendments (the date of initial application). Restatement of comparative information is not required, instead the amendments require an entity to recognize the cumulative effect of initially applying the amendments as an adjustment to the opening balance of retained earnings or other component of equity, as appropriate, at the date of initial application.
- Annual Improvements to IFRS standards 2018-2020:
The following annual improvements to IFRS standards 2018-2020 are effective for annual reporting periods beginning on or after January 01, 2022.
- IFRS 9 – The amendment clarifies that an entity includes only fees paid or received between the entity (the borrower) and the lender, including fees paid or received by either the entity or the lender on the other’s behalf, when it applies the ‘10 per cent’ test in paragraph B3.3.6 of IFRS 9 in assessing whether to derecognize a financial liability.
- IFRS 16 – The amendment partially amends Illustrative Example 13 accompanying IFRS 16 by excluding the illustration of reimbursement of leasehold improvements by the lessor. The objective of the amendment is to resolve any potential confusion that might arise in lease incentives.
- Classification of liabilities as current or non-current (Amendments to IAS 1) effective for the annual period beginning on or after January 01, 2022. These amendments in the standards have been added to further clarify when a liability is classified as current. The standard also amends the aspect of classification of liability as non-current by requiring the assessment of the entity’s right at the end of the reporting period to defer the settlement of liability for at least twelve months after the reporting period. An entity shall apply those amendments retrospectively in accordance with IAS 8.
- Sale or Contribution of Assets between an Investor and its Associate or Joint Venture (Amendments to IFRS 10 and IAS 28) – The amendment amends accounting treatment on loss of control of business or assets. The amendments also introduce new accounting for less frequent transaction that involves neither cost nor full step-up of certain retained interests in assets that are not businesses. The effective date for these changes has been deferred indefinitely until the completion of a broader review.
- Standards effective during the year
- Amendment to IFRS 3 ‘Business Combinations’ – Definition of a Business (effective for business combinations for which the acquisition date is on or after the beginning of annual period beginning on or after January 01, 2020). The Board has issued amendments aiming to resolve the difficulties that arise when an entity determines whether it has acquired a business or a group of assets. The amendments clarify that to be considered a business, an acquired set of activities and assets must include, at a minimum, an input and a substantive process that together significantly contribute to the ability to create outputs. The amendments include an election to use a concentration test.
- Amendments to IAS 1 Presentation of Financial Statements and IAS 8 Accounting Policies, Changes in Accounting Estimates and Errors (effective for annual periods beginning on or after 1 January 2020). The amendments are intended to make the definition of material in IAS 1 easier to understand and are not intended to alter the underlying concept of materiality in IFRS Standards. In addition, the Board has also issued guidance on how to make materiality judgments when preparing their general purpose financial statements in accordance with IFRS Standards.
Notes to and Forming Part of the Financial StatementsFor the year ended December 31, 2020
Annual Report 2020130
- On March 29, 2018, the Board has issued a revised Conceptual Framework for Financial Reporting which is applicable immediately contains changes that will set a new direction for IFRS in the future. The Conceptual Framework primarily serves as a tool for the Board to develop standards and to assist the IFRS Interpretations Committee in interpreting them. It does not override the requirements of individual IFRSs and any inconsistencies with the revised Framework will be subject to the usual due process – this means that the overall impact on standard setting may take some time to crystallize. The companies may use the Framework as a reference for selecting their accounting policies in the absence of specific IFRS requirements. In these cases, companies should review those policies and apply the new guidance retrospectively as of January 01, 2020, unless the new guidance contains specific scope outs.
- Interest Rate Benchmark Reform which amended IFRS 9, IAS 39 and IFRS 7 is applicable for annual financial periods beginning on or after January 01, 2020. The G20 asked the Financial Stability Board (FSB) to undertake a fundamental review of major interest rate benchmarks. Following the review, the FSB published a report setting out its recommended reforms of some major interest rate benchmarks such as IBORs. Public authorities in many jurisdictions have since taken steps to implement those recommendations. This has in turn led to uncertainty about the long-term viability of some interest rate benchmarks. In these amendments, the term ‘interest rate benchmark reform’ refers to the market-wide reform of an interest rate benchmark including its replacement with an alternative benchmark rate, such as that resulting from the FSB’s recommendations set out in its July 2014 report ‘Reforming Major Interest Rate Benchmarks’ (the reform). The amendments made provide relief from the potential effects of the uncertainty caused by the reform. A company shall apply the exceptions to all hedging relationships directly affected by interest rate benchmark reform.
3. SUMMARY OF SIGNIFICANT ACCOUNTING POLICIES
The principal accounting policies applied in the preparation of these financial statements have been consistently applied to all periods presented. A number of other new standards are effective from January 01, 2020 but they do not have a material effect on the Operations’s financial statements.
3.1 Takaful contracts
The takaful contracts are based on the principles of Wakala. The takaful contracts so agreed usually inspire concept of tabarru (to donate for benefit of others) and mutual sharing of losses with the overall objective of eliminating the element of uncertainty.
Contracts under which the Participant Takaful Fund (PTF) accepts significant takaful risk from another party (the participant) by agreeing to compensate the participant if a specified uncertain future event (the takaful event) adversely affects the participant are classified as takaful contracts. Takaful risk is significant if a takaful event could cause the PTF to pay significant benefits due to the happening of the takaful event compared to its non happening. Once a contract has been classified as a takaful contract, it remains a takaful contract for the remainder of its lifetime, even if the takaful risk reduces significantly during this period, unless all rights and obligations are extinguished or expired.
The Operations underwrites non-life takaful contracts that can be categorised into following main categories:
a) Fire and property
Fire and property takaful contracts mainly compensate the Participants’ for damage suffered to their properties or for the value of property lost. Participants’ who undertake commercial activities on their premises could also receive compensation for the loss of earnings caused by the inability to use the insured properties in their business activities. These contracts are generally one year contracts except some contracts that are of three months period.
Century Insurance 131
b) Marine, aviation and transport
Marine takaful covers the loss or damage of vessels, cargo, terminals, and any transport or property by which cargo is transferred, acquired, or held between the points of origin and final destination. These contracts are generally for three months period.
c) Motor
Motor takaful provides protection against losses incurred as a result of theft, traffic accidents and against third party liability that could be incurred in an accident. These contracts are generally one year contracts.
d) Accident and health
Accident and health takaful contract mainly compensate hospitalisation and outpatient medical coverage to the participant. These contracts are generally one year contracts.
e) Miscellaneous
All other various types of takaful contracts are classified in miscellaneous category which includes mainly engineering, terrorism, personal accident, workmen compensation, travel and products of financial institutions etc. These contracts are normally one year takaful contracts except some engineering takaful contracts that are of more than one year period, whereas, normally travel takaful contracts expire within one month time.
These takaful contracts are provided to all types of customers based on assessment of takaful risk by the Operator. Normally personal takaful contracts e.g. vehicle, travel, personal accident, etc. are provided to individual customers, whereas, takaful contracts of fire and property, marine, aviation and transport, accident and health and other commercial line products are provided to commercial organizations.
3.2 Deferred Commission expense / Acquisition cost
Commission expense incurred in obtaining and recording policies is deferred and recognised in Operator’s Fund as an expense in accordance with pattern of recognition of contribution revenue.
3.3 Unearned contribution
The unearned portion of contribution is calculated by applying twenty-fourths method, as prescribed by General Takaful Accounting Regulation 2019.
3.4 Contribution deficiency
The Operations is required as per General Takaful Accounting Regulation 2019 to maintain a provision in respect of contribution deficiency for the class of business where the unearned contribution reserve is not adequate to meet the expected future liability, after re-takaful, from claims and other expenses, including re-takaful expense, commissions and other underwriting expenses, expected to be incurred after the reporting date in respect of policies in that class of business at the reporting date. The movement in the contribution deficiency reserve is recorded as an expense and the same shall be recognised as a liability.
For this purpose, loss ratios for each class are estimated based on historical claim development. Judgement is used in assessing the extent to which past trends may not apply in future or the effects of one-off claims. If these ratios are adverse, contribution deficiency is estimated. The loss ratios estimated on these basis for the unexpired portion are as follows:
Notes to and Forming Part of the Financial StatementsFor the year ended December 31, 2020
Annual Report 2020132

2020 2019--------- (%) ---------
Fire and property damage 83 16Marine, aviation and transport 10 2Motor 43 41Miscellaneous 112 120
Based on an analysis of combined operating ratio for the expired period of each reportable segment, the management considers that the unearned contribution reserve for all classes of business as at the year end is adequate to meet the expected future liability after re-takaful, from claims and other expenses, expected to be incurred after the reporting date in respect of policies in those classes of business in force at the reporting date and therefore no provision for the same has been made in these financial statements.
3.5 Re-takaful contracts held
These are contracts entered into by the Operation with re-takaful operators for compensation of losses suffered on takaful contracts issued. These re-takaful contracts include both facultative and treaty arrangement contracts and are classified in same categories of takaful contracts for the purpose of these financial statements. The PTF recognise the entitled benefits under the contracts as various retakaful assets. Re-takaful contribution is recognised as an expense when retakaful is ceded. Re-takaful assets and liabilities are derecognised when contractual right are extinguished or expired.
The deferred portion of re-takaful contribution is recognized as a prepayment in PTF. The deferred portion of re-takaful contribution ceded is calculated by using twenty-fourths method.
3.6 Receivables and payables related to takaful contracts
Receivables including contribution due but unpaid relating to takaful contracts are recognized when due. The claim payable is recorded when intimation is received. These are recognized at cost, which is the fair value of the consideration given less provision for impairment, if any. Contribution received in advance is recognised as liability till the time of issuance of takaful contract there against.
If there is an objective evidence that any contribution due but unpaid is impaired, the Operations reduces the carrying amount of that contribution receivable and recognizes the loss in profit and loss account.
3.7 Segment reporting
An operating segment is a component of the Operations that engages in business activities from which it may earn revenues and incur expenses including revenues and expenses that relate to transactions with any of the Operator’s other components. All operating segments’ results are reviewed regularly by the Operator’s chief operating decision maker to make decisions about resources to be allocated to the segment and assess its performance, and for which discrete financial information is available.
The Operator presents segments reporting of operating results using the classes of business as specified under the Insurance Ordinance, 2000 and General Takaful Accounting Regulation 2019. The reported operating segments are also consistent with the internal reporting process of the Operator for allocating resources and assessing performance of the operating segments. The performance of segments is evaluated on the basis of underwriting results of each segment. All the Operator’s business segments operate in Pakistan only.
Based on its classification of takaful contracts issued, the Operations has four primary business segments for reporting purposes namely fire, marine, motor and miscellaneous. The nature and business activities of these segments are disclosed in note 3.1.
Century Insurance 133
Assets and liabilities are allocated to particular segments on the basis of contribution earned. Those assets and liabilities which cannot be allocated to a particular segment on a reasonable basis are reported as unallocated corporate assets and liabilities. Management expenses are allocated to a particular segment on the basis of contribution written.
3.8 Cash and cash equivalents
Cash and cash equivalents for cash flow purposes include cash in hand, policy stamps, bank balances and the term deposit receipts having maturity of not more than twelve months and are subject to insignificant risk of change in value.
3.9 Revenue recognition
a) Contribution
Contribution under a policy are recognised as revenue at the time of issuance of takaful policy / cover note. Where the pattern of incidence of risk varies over the period of the policy / cover note, contribution is recognised as revenue in accordance with the pattern of the incidence of risk. The portion of contribution written relating to the unexpired period of coverage is recognised as unearned contribution by the Operator. The unearned contribution is calculated by applying twenty-fourths method as specified in the General Takaful Accounting Regulation 2019. Administrative surcharge are recognised as revenue at the time of issuance of takaful policy / cover note.
Re-takaful ceded is recognised as expense after taking into account the proportion of deferred re-takaful contribution expense which is calculated using twenty-fourths method. The deferred portion of re-takaful contribution expense is recognised as a prepayment.
b) Re-takaful rebate
Rebate and other forms of revenue (apart from recoveries) from re-takaful operators are deferred and recognised as liability and recognised in the profit and loss account as revenue of PTF in accordance with the pattern of recognition of the re-takaful contributions.
c) Investment income
- Profit on bank deposits is recognised on a time proportion basis taking into account the effective yield.
- Income from held to maturity investments is recognised on a time proportion basis taking into account the effective yield on the investments. The difference between the redemption value and the purchase price of the held to maturity investments is amortised and taken to the profit and loss account over the term of the investment.
- Dividend income is recognised when the Operations’ right to receive the payment is established.
- Return on fixed income securities classified as available for sale is recognised on a time proportion basis taking into account the effective yield on the investments.
- Gain / loss on sale of investments is included in income currently.
3.10 Investments
3.10.1 Classification and recognition
All investments are initially recognized at cost, being the fair value of the consideration given and include transaction costs, except for investment held for trading in which case transaction costs are charged to the profit and loss account. These are recognized and classified as follows:
Notes to and Forming Part of the Financial StatementsFor the year ended December 31, 2020
Annual Report 2020134
- Held for trading- Held to maturity- Available-for-sale
The classification depends on the purpose for which the financial assets were acquired.
3.10.2 Measurement
3.10.2.1 Held for trading
- Investments which are acquired principally for the purposes of generating profit from short term fluctuation in price or are part of the portfolio in which there is recent actual pattern of short term profit taking are classified as held for trading.
- Investments which are designated as held for trading upon initial recognition.
Subsequent to initial recognition, these investments are premeasured at fair value. Gains or losses on remeasurement of these investments are recognised in profit and loss account.
3.10.2.2 Held to maturity
Investments with fixed determinable payments and fixed maturity, where Operations has both the intent and the ability to hold to maturity, are classified as held to maturity.
Subsequently, these are measured at amortised cost less provision for impairment, if any.
Any premium paid or discount availed on government securities and term finance certificates is deferred and amortised over the period to maturity of investment using the effective yield.
3.10.2.3 Available-for-sale
Investments which are not eligible to be classified as “held for trading” or “held to maturity” are classified as ‘available-for-sale’. These investments are intended to be held for an indefinite period of time which may be sold in response to the need for liquidity, changes in interest rates, equity prices or exchange rates are classified as available-for-sale.
Subsequent to initial recognition, these investments are remeasured at fair value. Gains or losses on remeasurement of these investments are recognised in other comprehensive income.
3.10.2.4 Fair / market value measurements
For investments in quoted mutual funds, fair / market value is determined by reference to rates quoted by Mutual Fund Association of Pakistan (MUFAP).
3.10.2.5 Date of recognition
Regular way purchases and sales of investments that require delivery within the time frame established by regulations or market convention are recognised at the trade date. Trade date is the date on which the Operator commits to purchase or sell the investment.
3.11 Offsetting of financial assets and liabilities
Financial assets and financial liabilities are only offset and the net amount reported in the balance sheet when there is a legally enforceable right to set off the recognised amount and the Operator intends to either settle on a net basis, or to realise the asset and settle the liability simultaneously.
Century Insurance 135
3.12 Provisions
Provisions are recognized when the Operations has a present legal or constructive obligation as a result of past events, it is probable that an outflow of resources embodying economic benefits will be required to settle the obligation and a reliable estimate of the amount can be made. Provisions are reviewed at each reporting date and adjusted to reflect the current best estimate.
3.13 Provision for outstanding claims including Incurred But Not Reported (IBNR)
Provision for outstanding claims include amounts in relation to unpaid reported claims, claims incurred but not reported (IBNR) and expected claims settlement costs.
Outstanding claims
The amount of claims that have been reported and are yet unpaid or partially unpaid at the end of reporting year for a given accident year.
A liability for outstanding claims (claim incurred) is recognized for all claims incurred which represents the estimates of the claims intimated or assessed before the end of the reporting period and measured at the undiscounted value of expected future payments. Provision for liability in respect of unpaid reported claims is made on the basis of individual case estimates while taking into consideration the past claims settlement experience including handling costs and the Operation’s reserving policy. Where applicable, deductions are made for salvage and their recoveries.
Retakaful recoveries against outstanding claims and salvage recoveries are recognized as an asset and measured at the amount expected to be received.
Incurred But Not Reported (IBNR) Claims
The losses that have incurred or are in the occurrence period at the end of reporting year and have not been intimated to the Operator by that end of reporting year, or if reported, complete details are not available to the Operator, so as to ascertain the amount of loss for that claim as claims outstanding.
The Operations is required, as per SECP circular no. 9 of 2016 dated March 09, 2016 “Guidelines for Estimation of Incurred but not reported claims reserve, 2016” to estimate and maintain the provision for claims incurred but not reported for each class of business by using prescribed Method “Chain Ladder Method” and other alternate method as allowed under the provisions of the Guidelines. The actuarial valuation as at December 31, 2020 has been carried out by independent firm of actuaries for determination of IBNR for each class of business.
3.14 Taxation
Income tax expense comprises current and deferred tax. Income tax expense is recognised in the Operator’s profit and loss account in accordance with Rule 12 of Takaful Rule 2012, except to the extent that it relates to items recognised directly in equity or in other comprehensive income, in which case it is recognised in equity or in other comprehensive income respectively. In making the estimates for income taxes currently payable by the Operator, the management considers the current income tax law and the decisions of appellate authorities on certain issues in the past.
Current tax
Current tax is the expected tax payable or receivable on the taxable income or loss for the year of the Operator’s Fund, using tax rates enacted or substantively enacted at the reporting date, and any adjustment to tax payable if any in respect of previous years.
Notes to and Forming Part of the Financial StatementsFor the year ended December 31, 2020
Annual Report 2020136
Provisions for current taxation is based on taxability of certain income streams of the Operator’s Fund under presumptive / final tax regime at the applicable tax rates and remaining income streams chargeable at current rate of taxation under the normal tax regime and / or minimum tax liability, as applicable, after taking into account tax credits and tax rebates available, if any.
Deferred tax
Deferred tax is recognised using balance sheet liability method, providing for temporary difference between the carrying amounts of assets and liabilities for financial reporting purposes and the amounts used for taxation purposes. The amount of deferred tax provided is based on the expected manner of realisation or settlement of the carrying amount of assets and liabilities, using the tax rates enacted or substantively enacted at the reporting date.
The Operator recognises a deferred tax asset to the extent of taxable timing differences or it is probable that taxable profits for the foreseeable future will be available against which the assets can be utilised. Deferred tax assets are reduced to the extent that it is no longer probable that the related tax benefit will be realised.
The taxation of the Operator’s Fund is calculated by including in the Operation’s results as a whole and accordingly taxation has been recorded.
3.15 Impairment of assets
The carrying amount of assets are reviewed at each reporting date to determine whether there is any indication of impairment of any asset or group of assets. If such indication exists, the recoverable amount of the asset is estimated. An impairment loss is recognised whenever the carrying amount of an asset exceeds its recoverable amount. The recoverable amount is the higher of an assets fair value less cost to sell and value in use. Impairment losses are recognised in profit and loss account.
Impairment is recognised based on management’s assessment of objective evidence of impairment as a result of one or more events that may have an impact on the estimated future cash flows of the investments. A significant or prolonged decline in fair value of an equity investments classified as available-for-sale below its cost is also considered an objective evidence of impairment. Impairment losses are reversed when there is an indication that impairment loss may no longer exist and there has been a change in the estimate used to determine the recoverable amount. However, in case of equity securities classified as available for sale the decrease in impairment loss is not reversed.
3.16 Management expenses
Expenses of management have been allocated to various classes of business as deemed equitable by the Operator. Expenses not allocable to the underwriting business are charged under other expenses.
3.17 Financial instruments
Financial instruments carried on the reporting date include cash and bank, contribution due but unpaid, amount due from other takaful / re-takaful operators, accrued investment income, retakaful recoveries against outstanding claims, amount due to other takaful / re-takaful operators, other creditors and accruals.
All the financial assets and financial liabilities are recognised at the time when the Operations becomes a party to the contractual provisions of the instrument and derecognized when the Operations losses control of contractual rights that comprises the financial assets and in the case of financial liabilities when the obligation specified in the contract is discharged, cancelled or expired. At the time of initial recognition all financial assets and financial liabilities are measured at cost, which is the fair value of the consideration given or received for it. Any gain or loss on derecognition of financial assets and financial liabilities is taken to profit and loss account of the period in which financial instrument is derecognised.
Century Insurance 137

3.18 Takaful surplus
Takaful surplus attributable to the Participants’ is calculated after charging all direct cost and setting aside various reserves. Allocation to Participants’, if applicable, is made after adjustment of claims paid to them during the period.
3.19 Wakala fee
The Operator manages the general takaful operations for the Participants’ and charges wakala fee to PTF on gross contributions recognized for each class of business to meet the general and administrative expenses of the Operator including commissions to agents at following rates:
Class Percentage------ (%) ------
Fire and property damage 30Marine, aviation and transport 30Motor 40 - 58Health 20Miscellaneous 35
Wakala fee is recognised as income in Operator’s Fund on the same basis on which the related contribution revenue is recognized. Unearned portion of wakala fee is recognised as a liability of Operator’s Fund and an asset of Participants’ Fund.
3.20 Mudarib’s fee
The Operator also manages the participants’ investment as Mudarib and charges 20 percent of the investment income and profits on bank deposits earned by the PTF as Mudarib’s fee. It is recognized on the same basis on which related revenue is recognised.
3.21 Qard-e-Hasna
Qard-e-Hasna is provided by Operator’s Fund to PTF in case of deficit or to fulfil cash flow requirements.
4. CRITICAL ACCOUNTING ESTIMATES AND JUDGEMENTS
4.1 Use of estimates and judgements
In preparing these financial statement, management has made judgement, estimates and assumptions that affect the application of the Operations’ accounting policies and reported amounts of assets, liabilities, Income and expenses. Actual results may differ from the estimates. Estimates and underlying assumptions are reviewed on an ongoing basis. Revision to estimates are recognised prospectively.
Information about judgements made in applying accounting policies that have the most significant effects on the amount recognised in the financial statements and assumptions and estimation uncertainties that have a significant risk of resulting in a material adjustment in the subsequent years are included in following notes:
a) provision for unearned contribution (note 3.3);b) contribution deficiency reserve (note 3.4);c) provision for contribution due but unpaid and amount due from other takaful / re-takaful operators; (note 3.6)d) segment reporting (note 3.7);e) classification of investments (note 3.10);f) provision for outstanding claims including IBNR and re-takaful recoveries there against (note 3.13);g) taxation (note 3.14);h) impairment (note 3.15)
Notes to and Forming Part of the Financial StatementsFor the year ended December 31, 2020
Annual Report 2020138
i) allocation of management expenses (note 3.16); andj) provision for unearned wakala fee (note 3.19).
5. DISCLOSURES RELATED TO TEMPORARY EXEMPTION FROM IFRS 9
To determine the appropriate classification of financial assets under IFRS 9, an entity would need to assess the contractual cash flows characteristics of any financial asset. Indeed, the contractual terms of the financial asset give rise on specified dates to cash flows that are solely payments of principal and interest on the principal amount outstanding (SPPI) i.e. cash flows that are consistent with a basic lending arrangement. In a basic lending arrangement consideration for the time value of money and credit risk are typically the most significant elements of interest. IFRS 9 defines the terms principal as being the fair value of the financial asset at initial recognition and the interest as being compensation for (i) the time value of money and (ii) the credit risk associated with the principal amount outstanding during a particular period of time.
The debt instruments accounted for fair value through other comprehensive income under IAS 39 are potentially eligible to SPPI test whereas it is not applicable for the debt instruments accounted for fair value through profit or loss.
The tables below set out the fair values on gross basis as at the end of reporting period and the amount of change in the fair value during that period for the following two groups of financial assets separately.
a) financial assets with contractual terms that give rise on specified dates to cash flows that are solely payments of principal and interest (SPPI) on the principal amount outstanding excluding any financial asset that meets the definition of held for trading in IFRS 9, or that is managed and whose performance is evaluated on a fair value basis, and
b) all other financial assets.
Operator’s FundDecember 31, 2020
Fail the SPPI Test Pass the SPPI Test
Fair value
Change in Unrealized gain during
the year
Carrying Value
Cost less impairment
Change in Unrealized
gain or (loss) during
the year------------------------------- (Rupees) -------------------------------
Financial assets
Investments- Equity securities - Available for Sale 6,968,219 47,951 - - -
Participants’ Takaful Fund
Investments- Debt securities - held to maturity - - 500,000 - -
Gross Carrying amount of debt instruments that pass the SPPI testInvestment in debt securities
AA+--(Rupees)--
Held to Maturity 500,000
* The carrying amount of these financial assets measured applying IAS 39 are a reasonable approximation of the fair values.
Century Insurance 139
6. INVESTMENTS IN EQUITY SECURITIES - Available for sale
December 31, 2020 December 31, 2019
Cost Carryingvalue Cost Carrying
valueNote ------------------------- (Rupees) ------------------------
Operator’s FundMutual funds 6.1 6,920,268 6,968,219 62,167,012 62,081,477
6.1 Mutual Funds - OPFNumber of units December 31, 2020 December 31, 2019
2020 2019 Cost Carryingvalue Cost Carrying
value------------------------- (Rupees) ------------------------
Other than related parties
Open - end mutual fundsFirst Habib Islamic Income Fund 69,107 154,960 6,920,268 6,968,219 15,667,012 15,522,676 HBL Islamic Income Fund - 144,635 - - 15,500,000 15,505,280 NBP Islamic Mahana Amdani Fund - 1,471,105 - - 15,500,000 15,528,392 Meezan Islamic Income Fund - 284,583 - - 15,500,000 15,525,129
69,107 2,055,283 6,920,268 6,968,219 62,167,012 62,081,477
7. INVESTMENTS IN DEBT SECURITIES - Held to Maturity
December 31, 2020 December 31, 2019
Cost Carryingvalue Cost Carrying
valueNote ------------------------- (Rupees) ------------------------
Other than related parties
Participants’ FundCertificate of Islamic Investment 7.1 500,000 500,000 500,000 500,000
7.1 This represents Certificate of Islamic Investment carrying expected profit rate ranging from 5.42% to 10.25% in 2020 (2019: 4.90% to 10.25%).
8. LOANS AND OTHER RECEIVABLES - Considered good
Operator’s Fund Participants’ Takaful Fund December 31, December 31, December 31, December 31,
2020 2019 2020 2019------------------------- (Rupees) ------------------------
Accrued investment income 44,550 60,907 206,690 197,234 Advance tax - - 327,211 255,577
44,550 60,907 533,901 452,811
9. TAKAFUL / RE-TAKAFUL RECEIVABLES - PTF - Unsecured and considered good
December 31, December 31, 2020 2019
Note ------------ (Rupees) ------------
Due from Takaful contract holders 11,525,617 7,060,403 Due from other Takaful / Re-takaful operators 9.1 & 9.2 28,997,046 23,086,087 Re-takaful recoveries due but unpaid 4,898,349 1,076,072
45,421,012 31,222,562
Notes to and Forming Part of the Financial StatementsFor the year ended December 31, 2020
Annual Report 2020140
9.1 This includes Rs. 0.1 million (2019: Rs. Nil) receivable from operator. The amount is not over due/impaired as at December 31, 2020.
9.2 The maximum aggregate amount due from operator at end of any month during the year was Rs. 0.1 million (2019: Rs. Nil).
10. TAXATION - PROVISION LESS PAYMENTS December 31, December 31,
2020 2019 ------------ (Rupees) ------------
Provision for taxation 1,236,045 2,742,471 Less: Taxes paid / deducted at source 19,099 (661,321)
1,255,144 2,081,150
11. CASH AND BANKOperator’s Fund Participants’ Takaful Fund
December 31, December 31, December 31, December 31, 2020 2019 2020 2019
Note ------------------------- (Rupees) ------------------------Cash and cash equivalentCash in hand 10,000 10,000 - -
Cash at bankSavings accounts 11.1 82,583,412 1,316,746 45,227,837 43,817,054
82,593,412 1,326,746 45,227,837 43,817,054
11.1 Savings accounts carry expected profit rates ranging from 2.75% to 6.00% (2019: 5.30% to 7.21%) per annum.
December 31, December 31, 2020 2019
12. TAKAFUL / RE-TAKAFUL PAYABLES - PTF Note -------- (Rupees) ---------
Due to other takaful / re-takaful operators 12.1 27,412,918 15,881,047
12.1 This includes Rs. Nil (2019: Rs. 4.1 million) payable to operator. The amount is not over due / impaired as at December 31, 2020.
13. RECEIVABLE / PAYABLE (Between OPF and PTF)
Operator’s Fund Participants’ Takaful Fund December 31, December 31, December 31, December 31,
2020 2019 2020 2019------------------------- (Rupees) ------------------------
Wakala fee 9,912,365 22,913,872 9,912,365 22,913,872 Modaraba fee 184,840 184,958 184,840 184,958
10,097,205 23,098,830 10,097,205 23,098,830
Century Insurance 141

14. DEFERRED TAXATIONOperator’s Fund
December 31, December 31, 2020 2019
----------- (Rupees) -------------
Deferred credit arising in respect of Unrealized gain on available for sale investments 13,906 -
Deferred debit arising in respect of Unrealized loss on available for sale investments - 24,805
15. OTHER CREDITORS AND ACCRUALS
Operator’s Fund Participants’ Takaful Fund December 31, December 31, December 31, December 31,
2020 2019 2020 2019------------------------------------- (Rupees) -------------------------------------
Agents’ Commission payable 8,870,306 4,646,883 - - Federal excise duty / sales tax - - 1,254,515 752,139 Federal takaful fee - 109,145 67,243 Accrued expenses 6,792,738 10,452,222 - - Audit fee payable 275,000 275,000 - - Tax deducted at source 30,157 4,614 41,171 14,783
15,968,201 15,378,719 1,404,831 834,165
16. CONTINGENCY AND COMMITMENT
There is no contingency and commitment as at December 31, 2020 (December 31, 2019: Nil).
17. NET TAKAFUL CONTRIBUTION - PTF December 31, December 31, 2020 2019
----------- (Rupees) -------------
Written Gross contribution 106,216,653 74,725,110 Less: Wakala Fee (34,572,468) (26,125,135)Contribution Net of Wakala Fee 71,644,185 48,599,975
Add: Unearned contribution reserve opening 30,202,824 27,096,213 Less: Unearned contribution reserve closing (44,501,222) (30,202,824)Contribution earned 57,345,787 45,493,364
Less:Re-takaful Contribution ceded 35,697,415 24,592,685 Add: Prepaid re-takaful contribution ceded opening 8,104,293 4,958,997 Less: Prepaid re-takaful contribution ceded closing (11,947,160) (8,104,293)Re-takaful expense 31,854,548 21,447,389
25,491,239 24,045,975
Notes to and Forming Part of the Financial StatementsFor the year ended December 31, 2020
Annual Report 2020142
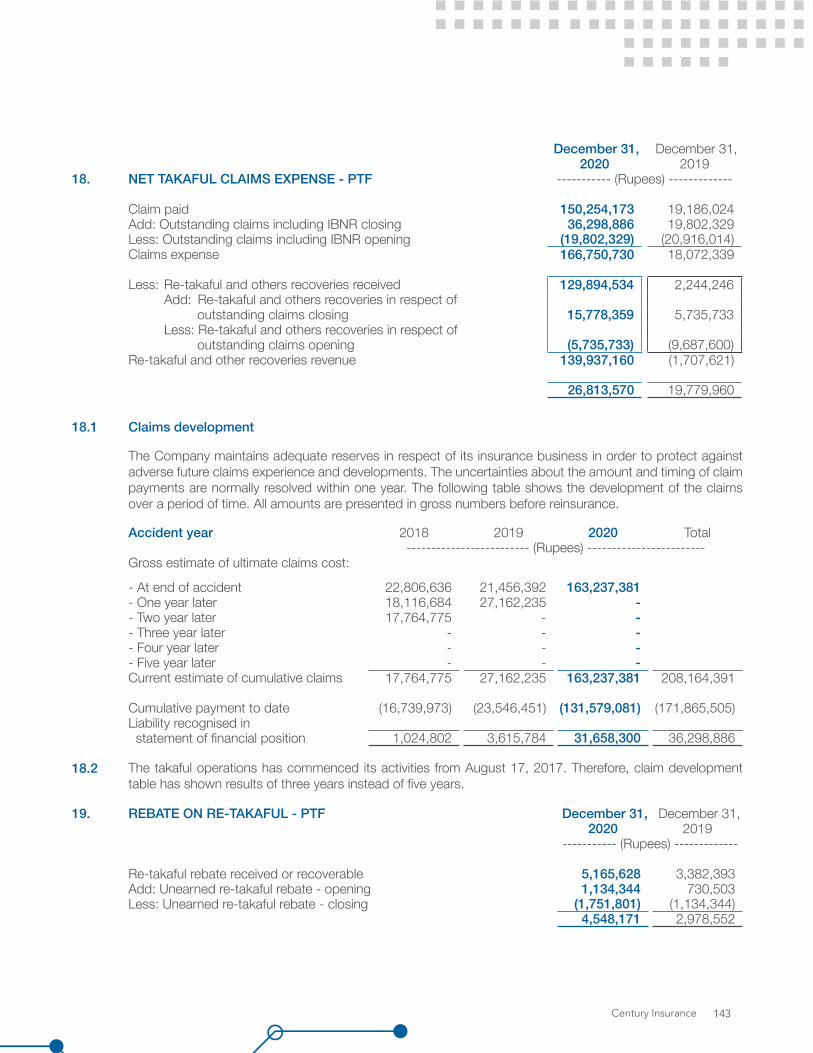
December 31, December 31, 2020 2019
18. NET TAKAFUL CLAIMS EXPENSE - PTF ----------- (Rupees) -------------
Claim paid 150,254,173 19,186,024 Add: Outstanding claims including IBNR closing 36,298,886 19,802,329 Less: Outstanding claims including IBNR opening (19,802,329) (20,916,014)Claims expense 166,750,730 18,072,339
Less: Re-takaful and others recoveries received 129,894,534 2,244,246 Add: Re-takaful and others recoveries in respect of outstanding claims closing 15,778,359 5,735,733 Less: Re-takaful and others recoveries in respect of outstanding claims opening (5,735,733) (9,687,600)
Re-takaful and other recoveries revenue 139,937,160 (1,707,621)
26,813,570 19,779,960
18.1 Claims development
The Company maintains adequate reserves in respect of its insurance business in order to protect against adverse future claims experience and developments. The uncertainties about the amount and timing of claim payments are normally resolved within one year. The following table shows the development of the claims over a period of time. All amounts are presented in gross numbers before reinsurance.
Accident year 2018 2019 2020 Total------------------------- (Rupees) ------------------------
Gross estimate of ultimate claims cost:
- At end of accident 22,806,636 21,456,392 163,237,381 - One year later 18,116,684 27,162,235 - - Two year later 17,764,775 - - - Three year later - - - - Four year later - - - - Five year later - - - Current estimate of cumulative claims 17,764,775 27,162,235 163,237,381 208,164,391
Cumulative payment to date (16,739,973) (23,546,451) (131,579,081) (171,865,505)Liability recognised in statement of financial position 1,024,802 3,615,784 31,658,300 36,298,886
18.2 The takaful operations has commenced its activities from August 17, 2017. Therefore, claim development table has shown results of three years instead of five years.
19. REBATE ON RE-TAKAFUL - PTF December 31, December 31, 2020 2019
----------- (Rupees) -------------
Re-takaful rebate received or recoverable 5,165,628 3,382,393 Add: Unearned re-takaful rebate - opening 1,134,344 730,503 Less: Unearned re-takaful rebate - closing (1,751,801) (1,134,344)
4,548,171 2,978,552
Century Insurance 143
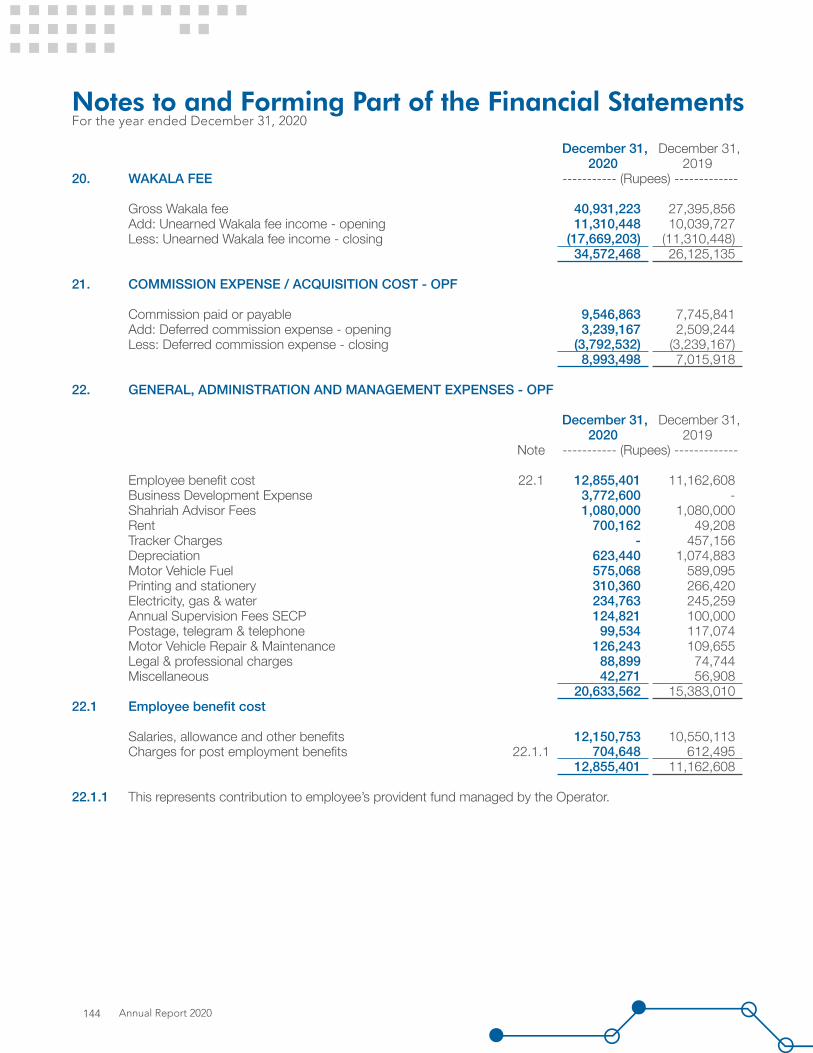
December 31, December 31, 2020 2019
20. WAKALA FEE ----------- (Rupees) -------------
Gross Wakala fee 40,931,223 27,395,856 Add: Unearned Wakala fee income - opening 11,310,448 10,039,727 Less: Unearned Wakala fee income - closing (17,669,203) (11,310,448)
34,572,468 26,125,135
21. COMMISSION EXPENSE / ACQUISITION COST - OPF
Commission paid or payable 9,546,863 7,745,841 Add: Deferred commission expense - opening 3,239,167 2,509,244 Less: Deferred commission expense - closing (3,792,532) (3,239,167)
8,993,498 7,015,918
22. GENERAL, ADMINISTRATION AND MANAGEMENT EXPENSES - OPF
December 31, December 31, 2020 2019
Note ----------- (Rupees) -------------
Employee benefit cost 22.1 12,855,401 11,162,608 Business Development Expense 3,772,600 - Shahriah Advisor Fees 1,080,000 1,080,000 Rent 700,162 49,208 Tracker Charges - 457,156 Depreciation 623,440 1,074,883 Motor Vehicle Fuel 575,068 589,095 Printing and stationery 310,360 266,420 Electricity, gas & water 234,763 245,259 Annual Supervision Fees SECP 124,821 100,000 Postage, telegram & telephone 99,534 117,074 Motor Vehicle Repair & Maintenance 126,243 109,655 Legal & professional charges 88,899 74,744 Miscellaneous 42,271 56,908
20,633,562 15,383,010 22.1 Employee benefit cost
Salaries, allowance and other benefits 12,150,753 10,550,113 Charges for post employment benefits 22.1.1 704,648 612,495
12,855,401 11,162,608
22.1.1 This represents contribution to employee’s provident fund managed by the Operator.
Notes to and Forming Part of the Financial StatementsFor the year ended December 31, 2020
Annual Report 2020144
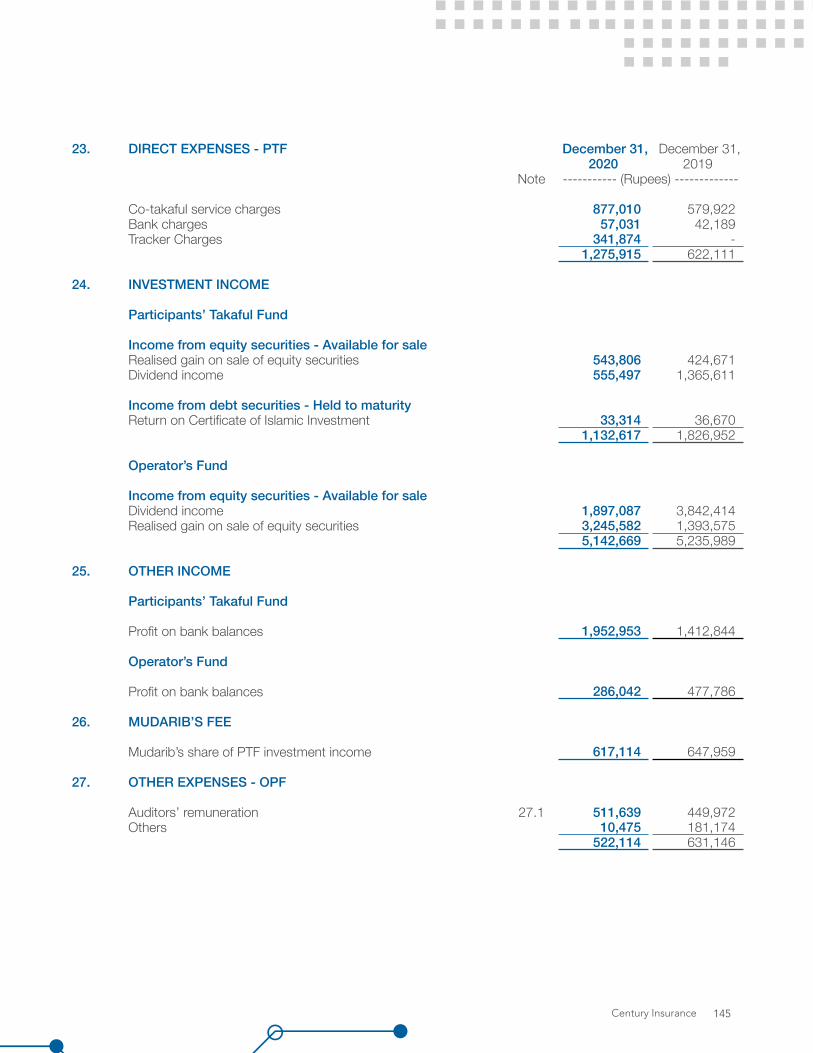
23. DIRECT EXPENSES - PTF December 31, December 31, 2020 2019
Note ----------- (Rupees) -------------
Co-takaful service charges 877,010 579,922 Bank charges 57,031 42,189 Tracker Charges 341,874 -
1,275,915 622,111
24. INVESTMENT INCOME
Participants’ Takaful Fund
Income from equity securities - Available for saleRealised gain on sale of equity securities 543,806 424,671 Dividend income 555,497 1,365,611
Income from debt securities - Held to maturityReturn on Certificate of Islamic Investment 33,314 36,670
1,132,617 1,826,952
Operator’s Fund
Income from equity securities - Available for saleDividend income 1,897,087 3,842,414 Realised gain on sale of equity securities 3,245,582 1,393,575
5,142,669 5,235,989
25. OTHER INCOME
Participants’ Takaful Fund
Profit on bank balances 1,952,953 1,412,844
Operator’s Fund
Profit on bank balances 286,042 477,786
26. MUDARIB’S FEE
Mudarib’s share of PTF investment income 617,114 647,959
27. OTHER EXPENSES - OPF
Auditors’ remuneration 27.1 511,639 449,972 Others 10,475 181,174
522,114 631,146
Century Insurance 145
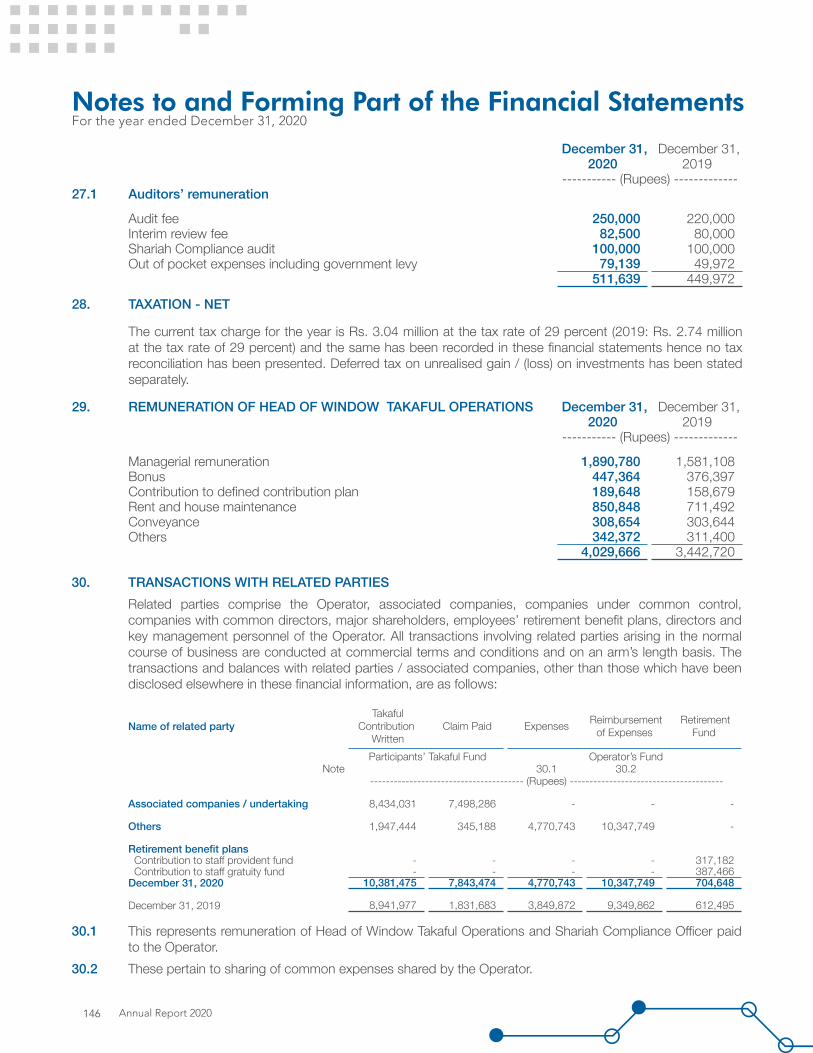
December 31, December 31, 2020 2019
----------- (Rupees) -------------27.1 Auditors’ remuneration
Audit fee 250,000 220,000 Interim review fee 82,500 80,000 Shariah Compliance audit 100,000 100,000 Out of pocket expenses including government levy 79,139 49,972
511,639 449,972
28. TAXATION - NET
The current tax charge for the year is Rs. 3.04 million at the tax rate of 29 percent (2019: Rs. 2.74 million at the tax rate of 29 percent) and the same has been recorded in these financial statements hence no tax reconciliation has been presented. Deferred tax on unrealised gain / (loss) on investments has been stated separately.
29. REMUNERATION OF HEAD OF WINDOW TAKAFUL OPERATIONS December 31, December 31, 2020 2019
----------- (Rupees) -------------
Managerial remuneration 1,890,780 1,581,108 Bonus 447,364 376,397 Contribution to defined contribution plan 189,648 158,679 Rent and house maintenance 850,848 711,492 Conveyance 308,654 303,644 Others 342,372 311,400
4,029,666 3,442,720
30. TRANSACTIONS WITH RELATED PARTIESRelated parties comprise the Operator, associated companies, companies under common control, companies with common directors, major shareholders, employees’ retirement benefit plans, directors and key management personnel of the Operator. All transactions involving related parties arising in the normal course of business are conducted at commercial terms and conditions and on an arm’s length basis. The transactions and balances with related parties / associated companies, other than those which have been disclosed elsewhere in these financial information, are as follows:
Name of related party Takaful
Contribution Written
Claim Paid Expenses Reimbursement of Expenses
Retirement Fund
Participants’ Takaful Fund Operator’s Fund Note 30.1 30.2
--------------------------------------- (Rupees) ---------------------------------------
Associated companies / undertaking 8,434,031 7,498,286 - - -
Others 1,947,444 345,188 4,770,743 10,347,749 -
Retirement benefit plans Contribution to staff provident fund - - - - 317,182 Contribution to staff gratuity fund - - - - 387,466 December 31, 2020 10,381,475 7,843,474 4,770,743 10,347,749 704,648
December 31, 2019 8,941,977 1,831,683 3,849,872 9,349,862 612,495
30.1 This represents remuneration of Head of Window Takaful Operations and Shariah Compliance Officer paid to the Operator.
30.2 These pertain to sharing of common expenses shared by the Operator.
Notes to and Forming Part of the Financial StatementsFor the year ended December 31, 2020
Annual Report 2020146
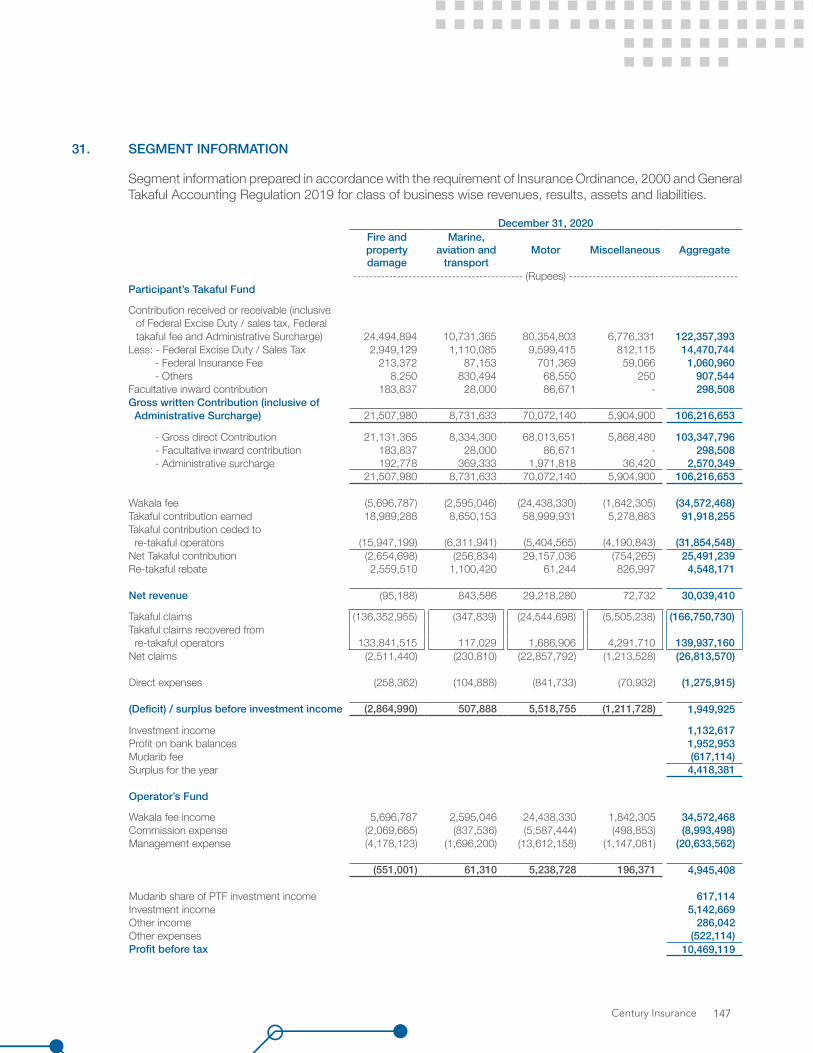
31. SEGMENT INFORMATION
Segment information prepared in accordance with the requirement of Insurance Ordinance, 2000 and General Takaful Accounting Regulation 2019 for class of business wise revenues, results, assets and liabilities.
December 31, 2020Fire and property damage
Marine, aviation and
transportMotor Miscellaneous Aggregate
------------------------------------------- (Rupees) -------------------------------------------Participant’s Takaful Fund
Contribution received or receivable (inclusive of Federal Excise Duty / sales tax, Federal takaful fee and Administrative Surcharge) 24,494,894 10,731,365 80,354,803 6,776,331 122,357,393
Less: - Federal Excise Duty / Sales Tax 2,949,129 1,110,085 9,599,415 812,115 14,470,744 - Federal Insurance Fee 213,372 87,153 701,369 59,066 1,060,960 - Others 8,250 830,494 68,550 250 907,544 Facultative inward contribution 183,837 28,000 86,671 - 298,508 Gross written Contribution (inclusive of Administrative Surcharge) 21,507,980 8,731,633 70,072,140 5,904,900 106,216,653
- Gross direct Contribution 21,131,365 8,334,300 68,013,651 5,868,480 103,347,796 - Facultative inward contribution 183,837 28,000 86,671 - 298,508 - Administrative surcharge 192,778 369,333 1,971,818 36,420 2,570,349
21,507,980 8,731,633 70,072,140 5,904,900 106,216,653
Wakala fee (5,696,787) (2,595,046) (24,438,330) (1,842,305) (34,572,468)Takaful contribution earned 18,989,288 8,650,153 58,999,931 5,278,883 91,918,255 Takaful contribution ceded to re-takaful operators (15,947,199) (6,311,941) (5,404,565) (4,190,843) (31,854,548)Net Takaful contribution (2,654,698) (256,834) 29,157,036 (754,265) 25,491,239 Re-takaful rebate 2,559,510 1,100,420 61,244 826,997 4,548,171
Net revenue (95,188) 843,586 29,218,280 72,732 30,039,410
Takaful claims (136,352,955) (347,839) (24,544,698) (5,505,238) (166,750,730)Takaful claims recovered from re-takaful operators 133,841,515 117,029 1,686,906 4,291,710 139,937,160 Net claims (2,511,440) (230,810) (22,857,792) (1,213,528) (26,813,570)
Direct expenses (258,362) (104,888) (841,733) (70,932) (1,275,915)
(Deficit) / surplus before investment income (2,864,990) 507,888 5,518,755 (1,211,728) 1,949,925
Investment income 1,132,617 Profit on bank balances 1,952,953 Mudarib fee (617,114)Surplus for the year 4,418,381
Operator’s Fund
Wakala fee income 5,696,787 2,595,046 24,438,330 1,842,305 34,572,468 Commission expense (2,069,665) (837,536) (5,587,444) (498,853) (8,993,498)Management expense (4,178,123) (1,696,200) (13,612,158) (1,147,081) (20,633,562)
(551,001) 61,310 5,238,728 196,371 4,945,408
Mudarib share of PTF investment income 617,114 Investment income 5,142,669 Other income 286,042 Other expenses (522,114)Profit before tax 10,469,119
Century Insurance 147
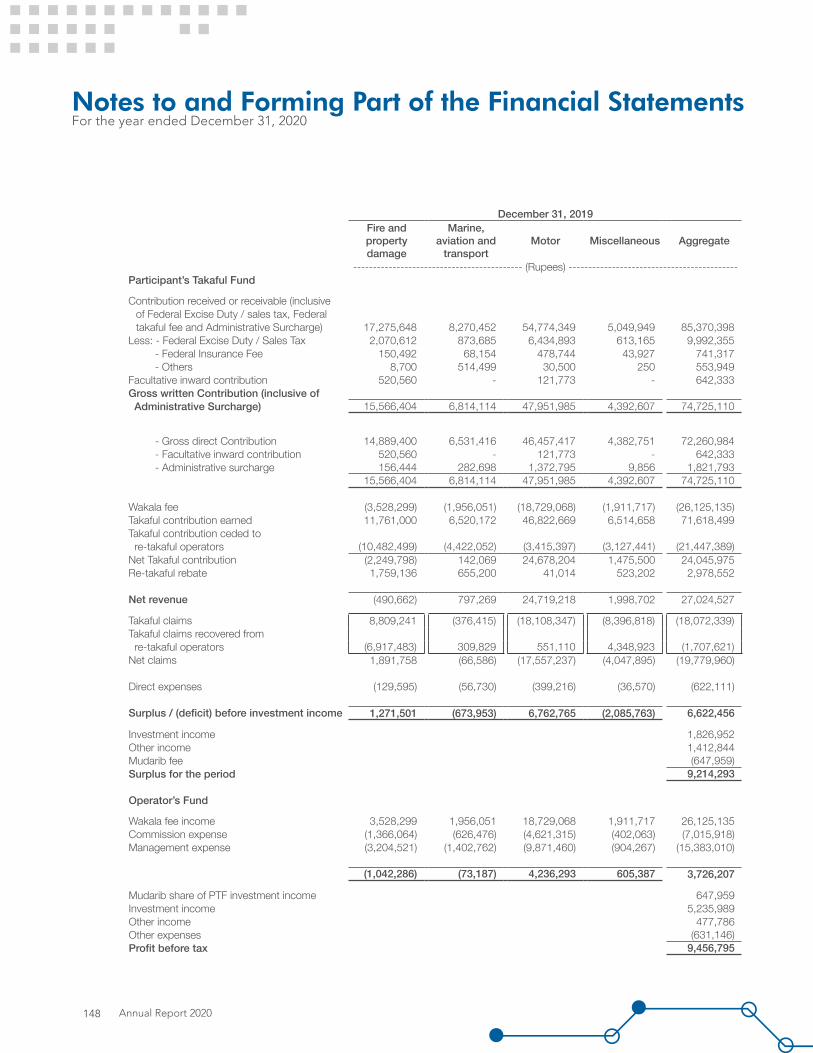
December 31, 2019Fire and property damage
Marine, aviation and
transportMotor Miscellaneous Aggregate
------------------------------------------- (Rupees) -------------------------------------------Participant’s Takaful Fund
Contribution received or receivable (inclusive of Federal Excise Duty / sales tax, Federal takaful fee and Administrative Surcharge) 17,275,648 8,270,452 54,774,349 5,049,949 85,370,398
Less: - Federal Excise Duty / Sales Tax 2,070,612 873,685 6,434,893 613,165 9,992,355 - Federal Insurance Fee 150,492 68,154 478,744 43,927 741,317 - Others 8,700 514,499 30,500 250 553,949 Facultative inward contribution 520,560 - 121,773 - 642,333 Gross written Contribution (inclusive of Administrative Surcharge) 15,566,404 6,814,114 47,951,985 4,392,607 74,725,110
- Gross direct Contribution 14,889,400 6,531,416 46,457,417 4,382,751 72,260,984 - Facultative inward contribution 520,560 - 121,773 - 642,333 - Administrative surcharge 156,444 282,698 1,372,795 9,856 1,821,793
15,566,404 6,814,114 47,951,985 4,392,607 74,725,110
Wakala fee (3,528,299) (1,956,051) (18,729,068) (1,911,717) (26,125,135)Takaful contribution earned 11,761,000 6,520,172 46,822,669 6,514,658 71,618,499 Takaful contribution ceded to re-takaful operators (10,482,499) (4,422,052) (3,415,397) (3,127,441) (21,447,389)Net Takaful contribution (2,249,798) 142,069 24,678,204 1,475,500 24,045,975 Re-takaful rebate 1,759,136 655,200 41,014 523,202 2,978,552
Net revenue (490,662) 797,269 24,719,218 1,998,702 27,024,527
Takaful claims 8,809,241 (376,415) (18,108,347) (8,396,818) (18,072,339)Takaful claims recovered from re-takaful operators (6,917,483) 309,829 551,110 4,348,923 (1,707,621)Net claims 1,891,758 (66,586) (17,557,237) (4,047,895) (19,779,960)
Direct expenses (129,595) (56,730) (399,216) (36,570) (622,111)
Surplus / (deficit) before investment income 1,271,501 (673,953) 6,762,765 (2,085,763) 6,622,456
Investment income 1,826,952 Other income 1,412,844 Mudarib fee (647,959)Surplus for the period 9,214,293
Operator’s Fund
Wakala fee income 3,528,299 1,956,051 18,729,068 1,911,717 26,125,135 Commission expense (1,366,064) (626,476) (4,621,315) (402,063) (7,015,918)Management expense (3,204,521) (1,402,762) (9,871,460) (904,267) (15,383,010)
(1,042,286) (73,187) 4,236,293 605,387 3,726,207
Mudarib share of PTF investment income 647,959 Investment income 5,235,989 Other income 477,786 Other expenses (631,146)Profit before tax 9,456,795
Notes to and Forming Part of the Financial StatementsFor the year ended December 31, 2020
Annual Report 2020148
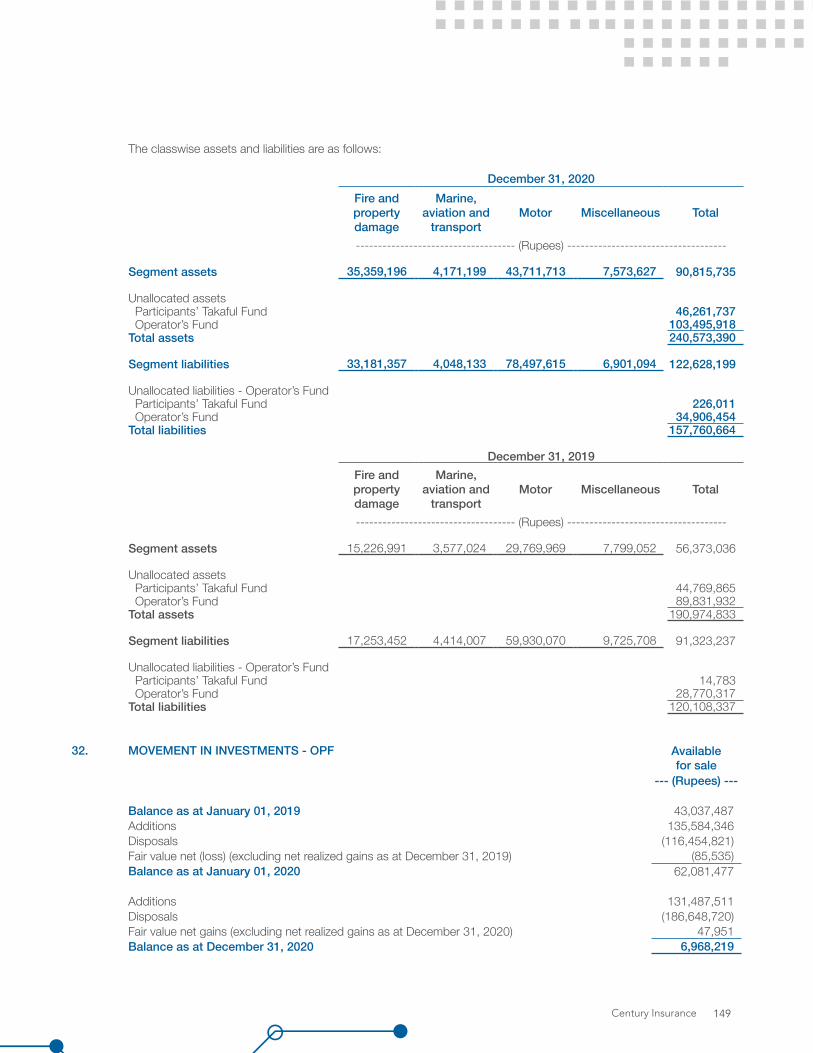
32. MOVEMENT IN INVESTMENTS - OPF Available for sale
--- (Rupees) ---
Balance as at January 01, 2019 43,037,487 Additions 135,584,346 Disposals (116,454,821)Fair value net (loss) (excluding net realized gains as at December 31, 2019) (85,535)Balance as at January 01, 2020 62,081,477
Additions 131,487,511 Disposals (186,648,720)Fair value net gains (excluding net realized gains as at December 31, 2020) 47,951 Balance as at December 31, 2020 6,968,219
The classwise assets and liabilities are as follows:
December 31, 2020Fire and property damage
Marine, aviation and
transportMotor Miscellaneous Total
------------------------------------ (Rupees) ------------------------------------
Segment assets 35,359,196 4,171,199 43,711,713 7,573,627 90,815,735
Unallocated assets Participants’ Takaful Fund 46,261,737 Operator’s Fund 103,495,918 Total assets 240,573,390
Segment liabilities 33,181,357 4,048,133 78,497,615 6,901,094 122,628,199
Unallocated liabilities - Operator’s Fund Participants’ Takaful Fund 226,011 Operator’s Fund 34,906,454 Total liabilities 157,760,664
December 31, 2019Fire and property damage
Marine, aviation and
transportMotor Miscellaneous Total
------------------------------------ (Rupees) ------------------------------------
Segment assets 15,226,991 3,577,024 29,769,969 7,799,052 56,373,036
Unallocated assets Participants’ Takaful Fund 44,769,865 Operator’s Fund 89,831,932 Total assets 190,974,833
Segment liabilities 17,253,452 4,414,007 59,930,070 9,725,708 91,323,237
Unallocated liabilities - Operator’s Fund Participants’ Takaful Fund 14,783 Operator’s Fund 28,770,317 Total liabilities 120,108,337
Century Insurance 149
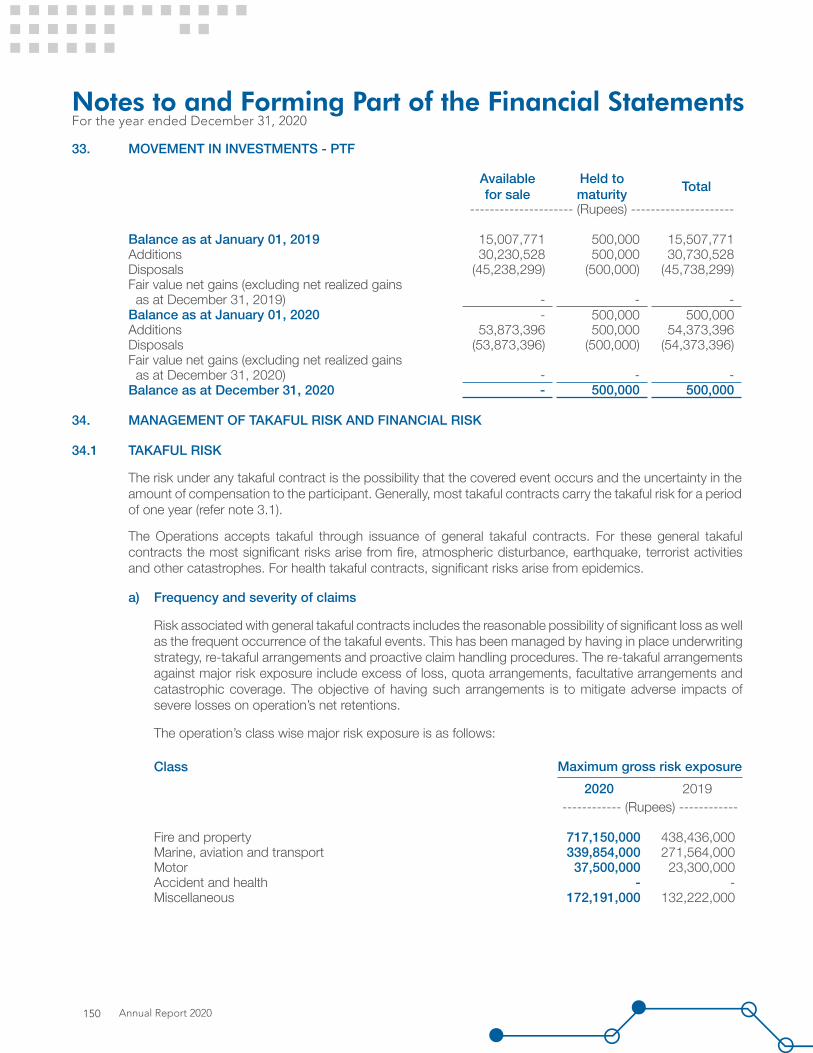
33. MOVEMENT IN INVESTMENTS - PTF
Available for sale
Held to maturity Total
--------------------- (Rupees) ---------------------
Balance as at January 01, 2019 15,007,771 500,000 15,507,771 Additions 30,230,528 500,000 30,730,528 Disposals (45,238,299) (500,000) (45,738,299)Fair value net gains (excluding net realized gains as at December 31, 2019) - - - Balance as at January 01, 2020 - 500,000 500,000 Additions 53,873,396 500,000 54,373,396 Disposals (53,873,396) (500,000) (54,373,396)Fair value net gains (excluding net realized gains as at December 31, 2020) - - - Balance as at December 31, 2020 - 500,000 500,000
34. MANAGEMENT OF TAKAFUL RISK AND FINANCIAL RISK
34.1 TAKAFUL RISK
The risk under any takaful contract is the possibility that the covered event occurs and the uncertainty in the amount of compensation to the participant. Generally, most takaful contracts carry the takaful risk for a period of one year (refer note 3.1).
The Operations accepts takaful through issuance of general takaful contracts. For these general takaful contracts the most significant risks arise from fire, atmospheric disturbance, earthquake, terrorist activities and other catastrophes. For health takaful contracts, significant risks arise from epidemics.
a) Frequency and severity of claims
Risk associated with general takaful contracts includes the reasonable possibility of significant loss as well as the frequent occurrence of the takaful events. This has been managed by having in place underwriting strategy, re-takaful arrangements and proactive claim handling procedures. The re-takaful arrangements against major risk exposure include excess of loss, quota arrangements, facultative arrangements and catastrophic coverage. The objective of having such arrangements is to mitigate adverse impacts of severe losses on operation’s net retentions.
The operation’s class wise major risk exposure is as follows:
Class Maximum gross risk exposure2020 2019
------------ (Rupees) ------------
Fire and property 717,150,000 438,436,000 Marine, aviation and transport 339,854,000 271,564,000 Motor 37,500,000 23,300,000 Accident and health - - Miscellaneous 172,191,000 132,222,000
Notes to and Forming Part of the Financial StatementsFor the year ended December 31, 2020
Annual Report 2020150

The re-takaful arrangements against major risk exposure include excess of loss, quota arrangements, facultative arrangements and catastrophic coverage. The objective of having such arrangements is to mitigate adverse impacts of severe losses on operation’s net retentions. As the major re-takaful arrangements are on excess of loss basis, therefore the re-takaful coverage against PTF’s risk exposures is not quantifiable. In compliance of regulatory, re-takaful agreement are duly approved by Securities and Exchange Commission of Pakistan (SECP) on an annual basis.
b) Sources of Uncertainty in the estimation of future claims payments
Claims on general takaful contracts are payable on a claim occurrence basis. The PTF is liable for all covered events that occur during the term of the takaful contract including the event reported after the expiry of the takaful contract term.
An estimated amount of the claim is recorded immediately on the intimation to the operations. The estimation of the amount is based on operator’s judgment or preliminary assessment by the independent surveyor appointed for this purpose. The initial estimates include expected settlement cost of the claims.
There are several variable factors which affect the amount and timing of recognized claim liabilities. The operations takes all reasonable measures to mitigate the factors affecting the amount and timing of claim settlements. However, uncertainty prevails with estimated claim liabilities and it is likely that final settlement of these liabilities may be significantly different from initial recognized amount.
c) Process used to decide on assumptions
The principal assumption underlying the liability estimation of IBNR and Contribution Deficiency Reserves is that the Operation’s future claim development will follow similar historical pattern for occurrence and reporting. The management uses qualitative judgment to assess the extent to which past occurrence and reporting pattern will not apply in future. The judgment includes external factors e.g. treatment of one-off occurrence claims, changes in market factors, economic conditions, etc. The internal factors such as portfolio mix, policy conditions and claim handling procedures are further used in this regard.
During the year actuarial valuation is carried out for the determination of IBNR which is based on a range of standard actuarial claim projection techniques, based on empirical data and current assumptions that may include a margin for adverse deviation as required / allowed by the circular 9 of 2016. IBNR is determined by using Chain Ladder Method for all class of business. The claims outstanding and claims paid till date are deducted from the ultimate claim payments for that particular year to derive an IBNR estimate for that year. IBNR triangles are made on a yearly basis for each class of business. The methods used, and the estimates made, are reviewed regularly.
The actuary determines adequacy of liability of contribution deficiency by carrying out analysis of its loss ratio of expired periods of the contracts. For this purpose average loss ratio of last four years inclusive of claim settlement cost are taken into consideration to determine ultimate loss ratio to be applied on unearned contribution.
d) Changes in assumptions
The Operator did not change its assumptions as disclosed in (b) and (c) above .
e) Sensitivity Analysis
The takaful claim liabilities are sensitive to the incidence of insured events and severity / size of claims. The impact of variation in incidence of insured events on gross claim liabilities, net claim liabilities, profit before tax and equity is as follows:
Century Insurance 151

Change in assumption
Impact on gross liabilities
Impact on net liabilities
Impact on surplus /
deficit
Impact on FundAverage claim costs
------------------------------- (Rupees ) -------------------------------
2020 10% 16,675,073 2,681,357 2,681,357 2,681,357
2019 10% 1,807,234 1,977,996 1,977,996 1,977,996
Statement of Age-wise Breakup of Unclaimed Takaful Benefits
Statement of age-wise breakup of unclaimed takaful benefits is not presented as there are no unclaimed takaful benefits.
Re-takaful risk
Re-takaful ceded does not relieve the PTF from its obligation towards participants and, as a result, the PTF remains liable for the portion of outstanding claims covered through re-takaful to the extent that re-takaful operators fails to meet the obligation under the re-takaful agreements.
To minimise its exposure to significant losses from re-takaful operators’ insolvencies, the operations obtain re-takaful rating from a number of re-takaful operators, who are dispersed over several geographical regions.
An analysis of all retakaful assets recognised by the rating of the entity from which it is due is as follows:
Amount due from
other takaful /
re-takaful holders
Re-takaful recoveries
against outstanding
claims
Other re-takaful
assets
December 31, 2020
December 31, 2019
------------------------------------- (Rupees) -------------------------------------
Rating
A or above includingPakistan ReinsuranceCompany Limited 28,997,046 15,015,815 11,947,160 55,960,021 36,866,613
B+ - 762,544 - 762,544 59,500
28,997,046 15,778,359 11,947,160 56,722,565 36,926,113
34.2 Financial risk management objectives and policies
The operations has exposure to the following risks from its use of financial instruments:
- Market risk- Liquidity risk- Credit risk
Notes to and Forming Part of the Financial StatementsFor the year ended December 31, 2020
Annual Report 2020152
34.2.1 Market risk
Market risk is the risk that the fair value of future cash flows of a financial instrument will fluctuate because of changes in market prices. Market risk comprise of interest rate risk, foreign currency risk and other price risk. The objective of market risk management is to manage and control market risk exposures within an acceptable range.
34.2.1.1 Profit rate risk
Profit rate risk is the risk that the value of a financial instrument will fluctuate due to change in the market profit rate.
The information about the Operation’s exposure to profit rate risk based on contractual repricing or maturity dates whichever is earlier is as follows:
All financial assets of the operations are non profit bearing except for cash and bank deposits ranging profit from 2.75% to 6.00% (2019: 5.30% to 7.21%) and certificate of islamic investment ranging from 5.42% to 10.25% (2019: 4.90% to 10.25%).
34.2.1.2 Foreign Currency risk
Foreign currency risk is the risk that the fair value or future cash flows of financial instruments will fluctuate because of changes in foreign exchange rates. The Operations, at present, is not materially exposed to currency risk as majority of the transactions are carried out in Pak Rupees.
34.2.1.3 Other price risk
Other price risk is the risk that the fair value of future cash flows of financial instruments will fluctuate because of changes in market prices (other than those arising from interest rate risk or currency risk), whether those changes are caused by factors specific to the individual financial instrument or its issuer, or factors affecting all similar financial instruments traded in the market. The Operations at present, is not materially exposed to other price risk.
Sensitivity analysis of investments as at the reporting date is as follows:
For available-for-sale investments in case of 10% increase / decrease in prices at the reporting date, the profit and loss account and Operator’s Fund would have been higher / lower by Rs. 0.697 million.
For available-for-sale investments in case of 10% increase / decrease in prices at the reporting date, the surplus / (deficit) and Participant’s Fund would have been higher / lower by Rs. Nil.
34.2.2 Liquidity risk
Liquidity risk is the risk that the Operations will not be able to meet its financial obligations as they fall due. The Operations approach to managing liquidity is to ensure, as far as possible, that it will always have sufficient liquidity to meet its liabilities when due, under both normal and stressed conditions, without incurring unacceptable losses or risking damage to the operation’s reputation. The following are the contractual maturities of financial liabilities based on the remaining period at the reporting date to maturity date.
The table below summaries the maturity profile of the financial liabilities. The contractual maturities of these liabilities at the year end have been determined on the basis of the remaining period at the reporting date to the contractual maturity date. Financial liabilities not having a contractual maturity are assumed to mature on the expected date on which these liabilities will be settled.
Century Insurance 153
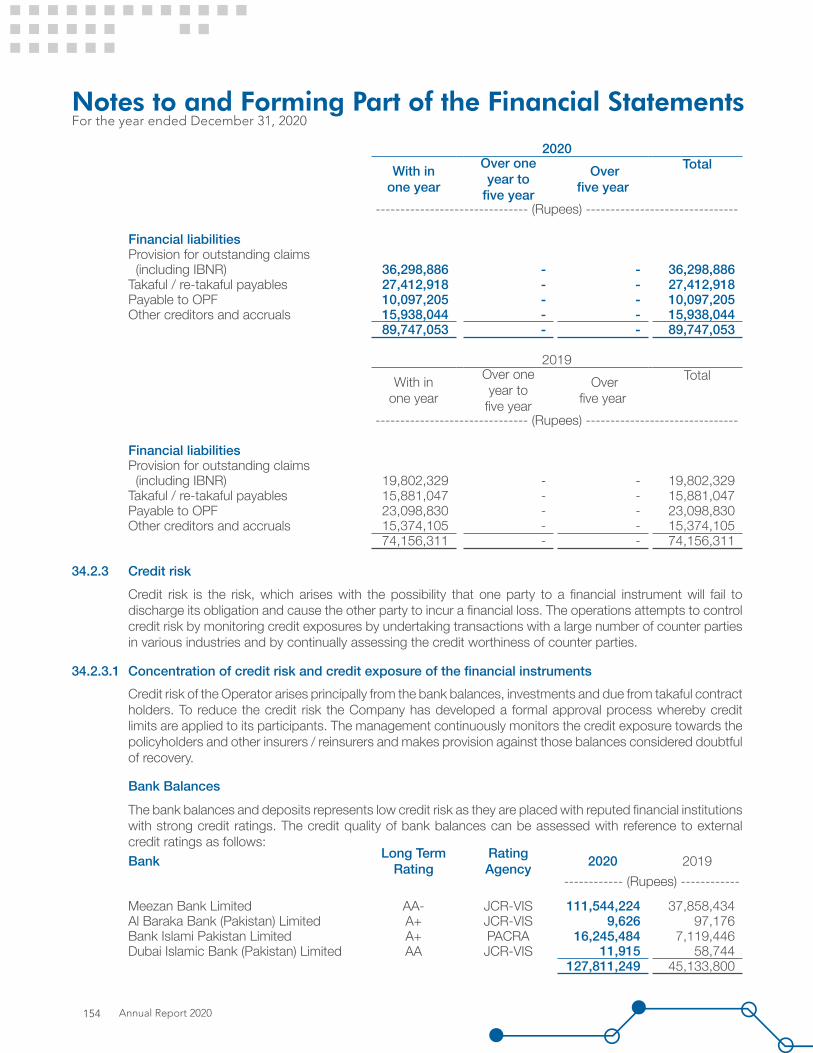
2020With in
one year
Over one year to
five year
Over five year
Total
------------------------------- (Rupees) -------------------------------
Financial liabilitiesProvision for outstanding claims (including IBNR) 36,298,886 - - 36,298,886 Takaful / re-takaful payables 27,412,918 - - 27,412,918 Payable to OPF 10,097,205 - - 10,097,205 Other creditors and accruals 15,938,044 - - 15,938,044
89,747,053 - - 89,747,053
2019With in
one year
Over one year to
five year
Over five year
Total
------------------------------- (Rupees) -------------------------------
Financial liabilitiesProvision for outstanding claims (including IBNR) 19,802,329 - - 19,802,329 Takaful / re-takaful payables 15,881,047 - - 15,881,047 Payable to OPF 23,098,830 - - 23,098,830 Other creditors and accruals 15,374,105 - - 15,374,105
74,156,311 - - 74,156,311
34.2.3 Credit riskCredit risk is the risk, which arises with the possibility that one party to a financial instrument will fail to discharge its obligation and cause the other party to incur a financial loss. The operations attempts to control credit risk by monitoring credit exposures by undertaking transactions with a large number of counter parties in various industries and by continually assessing the credit worthiness of counter parties.
34.2.3.1 Concentration of credit risk and credit exposure of the financial instrumentsCredit risk of the Operator arises principally from the bank balances, investments and due from takaful contract holders. To reduce the credit risk the Company has developed a formal approval process whereby credit limits are applied to its participants. The management continuously monitors the credit exposure towards the policyholders and other insurers / reinsurers and makes provision against those balances considered doubtful of recovery.
Bank BalancesThe bank balances and deposits represents low credit risk as they are placed with reputed financial institutions with strong credit ratings. The credit quality of bank balances can be assessed with reference to external credit ratings as follows:Bank Long Term
RatingRating Agency 2020 2019
------------ (Rupees) ------------
Meezan Bank Limited AA- JCR-VIS 111,544,224 37,858,434Al Baraka Bank (Pakistan) Limited A+ JCR-VIS 9,626 97,176 Bank Islami Pakistan Limited A+ PACRA 16,245,484 7,119,446 Dubai Islamic Bank (Pakistan) Limited AA JCR-VIS 11,915 58,744
127,811,249 45,133,800
Notes to and Forming Part of the Financial StatementsFor the year ended December 31, 2020
Annual Report 2020154

Investments
The Operator’s investments are in open end mutual funds which can be liquidate by encashment of units at the counter of mutual funds.
The credit quality of all the mutual funds is A or above.
Due from takaful contract holders
Concentration of credit risk arises when a number of counter parties have a similar type of business activities. As a result any change in economic, political or other conditions would affect their ability to meet contractual obligations in a similar manner. The Operator manages concentration of credit risk through diversification of activities among individuals, groups and industry segment.
The management monitors exposure to credit risk in contribution receivable from group companies and corporate clients through regular review of credit exposure and prudent estimates of provision for doubtful balances. The age analysis of due from takaful contract holders at the reporting date is as follows:
2020 2019 Gross Impairment Gross Impairment
--------------------------------- (Rupees) ---------------------------------
Upto 1 year 11,525,617 - 7,061,075 - 1-2 years - - 351 - 2-3 years - - (1,023) - Over 3 years - - - -
11,525,617 - 7,060,403 -
December 31, 2020Carrying amount Fair value
Available-for-sale
Held to maturity
Loans and
receivables
Other financial liabilities
Total Level 1 Level 2 Level 3 Total
-------------------------------------------------------------------- (Rupees) --------------------------------------------------------------------Financial assets measured at fair valueInvestments in mutual funds 6,968,219 - - - 6,968,219 - 6.968,219 - 6.968,219
Financial assets not measured at fair valueInvestments in debt securities - 500,000 - - 500,000 - - - - Loans and receivables* - - 251,240 - 251,240 - - - - Takaful / Re-takaful receivables* - - 45,421,012 - 45,421,012 - - - - Re-takaful recoveries against outstanding claims* - - 15,778,359 - 15,778,359 - - - - Receivable from PTF* - - 10,097,205 - 10,097,205 - - - - Cash and bank* - - 127,821,249 - 127,821,249 - - - -
6,968,219 500,000 199,369,065 - 206,837,284 - 6.968,219 - 6.968,219
Financial liabilities not measured at fair valueProvision for outstanding claims (including IBNR)* - - - (36,298,886) (36,298,886) - - - - Payable to OPF* - - - (10,097,205) (10,097,205) - - - - Takaful / Retakaful payables* - - - (27,412,918) (27,412,918) - - - - Other creditors and accruals* - - - (15,938,044) (15,938,044) - - - -
- - - (89,747,053) (89,747,053) - - - -
35. FAIR VALUE OF FINANCIAL INSTRUMENTS
The following table shows the carrying amounts and fair values of financial assets and financial liabilities, including their levels in the fair value hierarchy.
Century Insurance 155
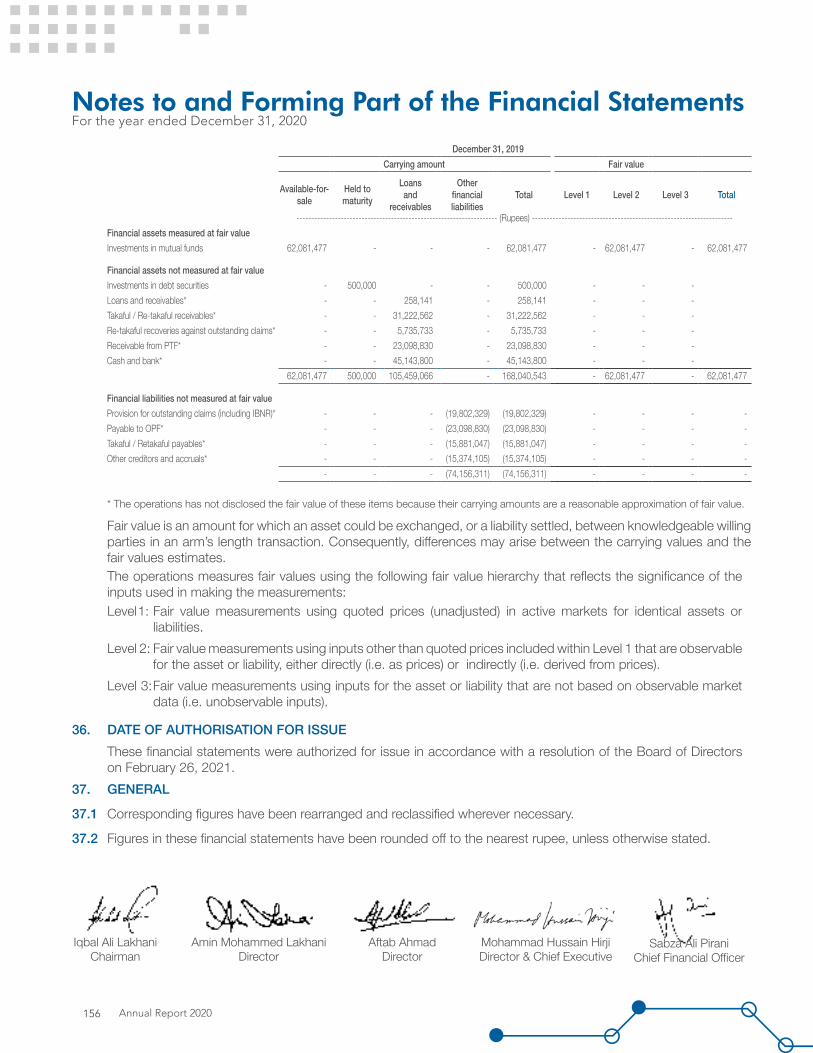
December 31, 2019Carrying amount Fair value
Available-for-sale
Held to maturity
Loans and
receivables
Other financial liabilities
Total Level 1 Level 2 Level 3 Total
-------------------------------------------------------------------- (Rupees) --------------------------------------------------------------------Financial assets measured at fair valueInvestments in mutual funds 62,081,477 - - - 62,081,477 - 62,081,477 - 62,081,477
Financial assets not measured at fair valueInvestments in debt securities - 500,000 - - 500,000 - - - Loans and receivables* - - 258,141 - 258,141 - - - Takaful / Re-takaful receivables* - - 31,222,562 - 31,222,562 - - - Re-takaful recoveries against outstanding claims* - - 5,735,733 - 5,735,733 - - - Receivable from PTF* - - 23,098,830 - 23,098,830 - - - Cash and bank* - - 45,143,800 - 45,143,800 - - -
62,081,477 500,000 105,459,066 - 168,040,543 - 62,081,477 - 62,081,477
Financial liabilities not measured at fair valueProvision for outstanding claims (including IBNR)* - - - (19,802,329) (19,802,329) - - - - Payable to OPF* - - - (23,098,830) (23,098,830) - - - - Takaful / Retakaful payables* - - - (15,881,047) (15,881,047) - - - - Other creditors and accruals* - - - (15,374,105) (15,374,105) - - - -
- - - (74,156,311) (74,156,311) - - - -
* The operations has not disclosed the fair value of these items because their carrying amounts are a reasonable approximation of fair value.
Fair value is an amount for which an asset could be exchanged, or a liability settled, between knowledgeable willing parties in an arm’s length transaction. Consequently, differences may arise between the carrying values and the fair values estimates.
36. DATE OF AUTHORISATION FOR ISSUEThese financial statements were authorized for issue in accordance with a resolution of the Board of Directors on February 26, 2021.
37. GENERAL
37.1 Corresponding figures have been rearranged and reclassified wherever necessary.
37.2 Figures in these financial statements have been rounded off to the nearest rupee, unless otherwise stated.
The operations measures fair values using the following fair value hierarchy that reflects the significance of the inputs used in making the measurements:Level 1: Fair value measurements using quoted prices (unadjusted) in active markets for identical assets or liabilities.Level 2: Fair value measurements using inputs other than quoted prices included within Level 1 that are observable for the asset or liability, either directly (i.e. as prices) or indirectly (i.e. derived from prices).Level 3: Fair value measurements using inputs for the asset or liability that are not based on observable market data (i.e. unobservable inputs).
Iqbal Ali LakhaniChairman
Aftab AhmadDirector
Amin Mohammed LakhaniDirector
Sabza Ali PiraniChief Financial Officer
Mohammad Hussain HirjiDirector & Chief Executive
Notes to and Forming Part of the Financial StatementsFor the year ended December 31, 2020
Annual Report 2020156
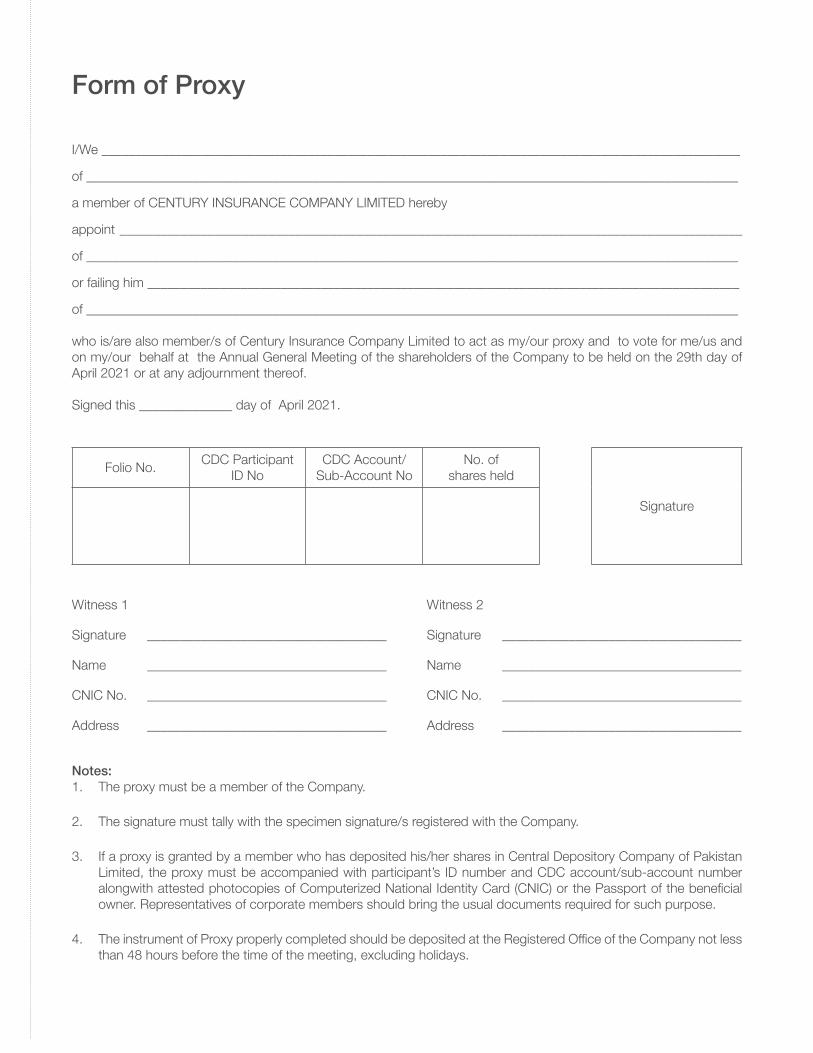
Form of Proxy
I/We ________________________________________________________________________________________________
of __________________________________________________________________________________________________
a member of CENTURY INSURANCE COMPANY LIMITED hereby
appoint ____________________________________________________________________________________________
of __________________________________________________________________________________________________
or failing him _________________________________________________________________________________________
of __________________________________________________________________________________________________
who is/are also member/s of Century Insurance Company Limited to act as my/our proxy and to vote for me/us and on my/our behalf at the Annual General Meeting of the shareholders of the Company to be held on the 29th day of April 2021 or at any adjournment thereof.
Signed this ______________ day of April 2021.
Folio No. CDC Participant ID No
CDC Account/Sub-Account No
No. of shares held
Signature
Witness 1 Witness 2
Signature ____________________________________ Signature ____________________________________
Name ____________________________________ Name ____________________________________
CNIC No. ____________________________________ CNIC No. ____________________________________
Address ____________________________________ Address ____________________________________
Notes:1. The proxy must be a member of the Company.
2. The signature must tally with the specimen signature/s registered with the Company.
3. If a proxy is granted by a member who has deposited his/her shares in Central Depository Company of Pakistan Limited, the proxy must be accompanied with participant’s ID number and CDC account/sub-account number alongwith attested photocopies of Computerized National Identity Card (CNIC) or the Passport of the beneficial owner. Representatives of corporate members should bring the usual documents required for such purpose.
4. The instrument of Proxy properly completed should be deposited at the Registered Office of the Company not less than 48 hours before the time of the meeting, excluding holidays.

۲۹
۲۰۲
۲۰۲ ا���
ا���
NetworkRegistered and Corporate OfficeLakson Square, Building # 2, Sarwar Shaheed Road,Karachi-74200.Tel: (021) 38400000 Fax: (021) 35683410
Karachi Lakson Square Office10th Floor, Lakson Square, Building # 3,Sarwar Shaheed Road, Karachi-74200.Tel: (021) 111-111-717 Fax: (021) 35689518
Shahrah e Faisal Office:Ebrahim Estates, 2nd Floor,D/1 Union Commercial Area,Block 7 & 8, Shahrah e Faisal, Karachi.Tel: (021) 34529155-7, 34310723-4Fax: (021) 34310725
Lahore Regional Office1st Floor, 14 Ali Block, New Garden Town, Lahore.UAN: (042) 111-111-717 Fax: (042) 35911176
Faisalabad Office2nd Floor, Legacy Tower, Kohinoor City,Faisalabad.UAN: (041) 111-111-717 Fax: (041) 8554453
Multan OfficeOffice # 55-57, 1st Floor, Business City Plaza,Bosan Road, Multan.Tel: (061) 6211241-43 Fax: (061) 6211244
Head Office11th Floor, Lakson Square, Building # 3,Sarwar Shaheed Road, Karachi-74200.UAN: (021) 111-111-717 Fax: (021) 35671665Email: [email protected]
Karachi Clifton OfficeOffice # 504-505, 5th Floor, Marine Point,DC 1, Block-9, Clifton, Karachi.Tel: (021) 35309234-36 Fax: (021) 35309237
Islamabad OfficeOffice # 6, Kashmir Plaza, Jinnah Avenue,Blue Area, Islamabad.UAN: (051) 111-111-717 Fax: (051) 2870228
Sialkot Office1st Floor, Karim Plaza, Iqbal Town,Defence Road, Sialkot.UAN: (052) 111-111-717 Fax: (052) 3241703
Gujranwala Office2nd Floor, Gujranwala Business Centre,Opp. Gujranwala Chamber of Commercial &Industry Trust Plaza, Gujranwala.Tel: (055) 3840034-35
Website: www.cicl.com.pk
UAN: 111-111-717Website: www.cicl.com.pk
Related Documents