Your Real-Time Ving Analytics PART ONE: Analytics Overview

Welcome message from author
This document is posted to help you gain knowledge. Please leave a comment to let me know what you think about it! Share it to your friends and learn new things together.
Transcript

Your Real-Time Ving AnalyticsPART ONE: Analytics Overview

Part OneFamiliarizing yourself with the key areas of your Ving analytics. 1. Home 2. Dashboard3. Component Details4. Contact Details

Ving Homepage
Your Ving homepage provides you with: all of your active Vings, the date created and the last activity date. Each column on the homepage is sortable.
3

Homepage Analytics
● Blue Star - you have activity that you have not seen yet.
● Invited - the number of people you have sent a Ving invitation to for that version of your Ving.
● Views - the number people who have viewed your Ving
● Completed - the number of people who have completed your Ving.
4

Ving Dashboard
This is your Ving analytics screen. We will review each section to show you the insights that you gain from each are.
5

Contact Graph
This graph shows who has viewed, not viewed and people that have bounced. Hovering over each color will provide you with more specific detail. 6
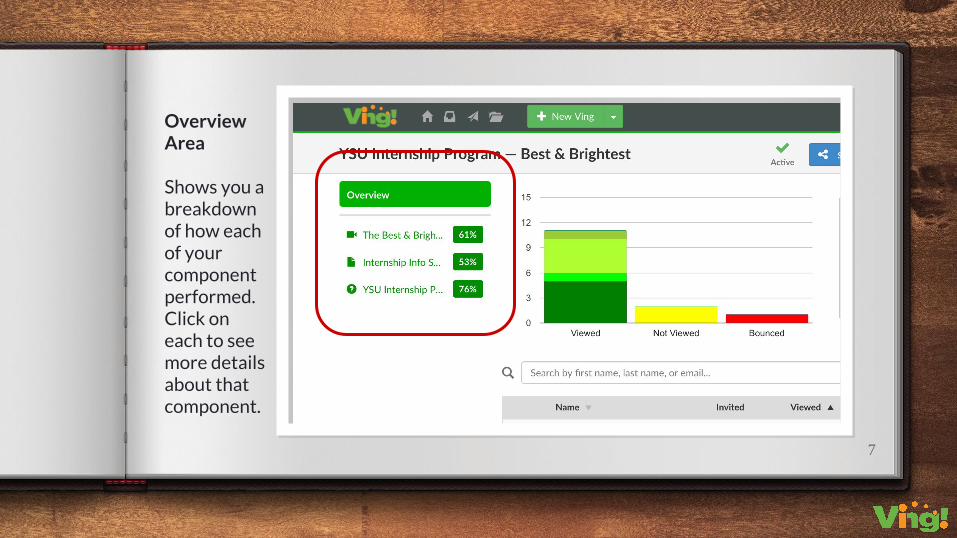
OverviewArea
Shows you a breakdown of how each of your component performed. Click on each to see more details about that component.
7

Contact Details
Shows you a detailed list of the people who you have invited and/or have interacted with your Ving.
8

The name field tells you the name and email of the person you invited to view your Ving.
The viewed field tells you what date and time the person last viewed your Ving.
The invited field tells you when you the invitation was delivered.
9

The visits field is the number of times a person has viewed your Ving.
The green checkmark in the progress field means a person has completed that area 100%.
The progress field tells you what percentage of your Ving a person has viewed.
10

The completed field tells you the first time a person completed (viewed every component) your Ving.
This icon means someone was logged in when they accessed your Ving.
This icon means someone accessed your Ving from an email invitation.
11

Part Two
Make the most out of your analytics and start making data driven decisions.
“Hi! I am VingMan. Click me to log into Ving and explore your analytics now.”
Related Documents