Young children’s hand contact activities: An observational study via videotaping in primarily outdoor residential settings WILLA AUYEUNG a , ROBERT A. CANALES b , PALOMA BEAMER a , ALESIA C. FERGUSON c AND JAMES O. LECKIE a a Department of Civil and Environmental Engineering, Stanford University, Stanford, CA, USA b Harvard School of Public Health, Landmark Center, Boston, MA, USA c Department of Environmental and Occupational Health, College of Public Health, University of Arkansas for Medical Sciences, Little Rock, Arkansas, USA Microlevel activity time series (MLATS) data were gathered on hand contact activities of 38 children (1–6 years old) by videotaping in primarily outdoor residential environments. The videotape recordings were then translated into text files using a specialized software called VirtualTimingDevicet. Contact frequency (contacts/h), duration per contact (s/contact), and hourly contact duration (min/h) were summarized for outdoor hand contacts with 15 distinct object/surface categories (‘‘Animal’’, ‘‘Body’’, ‘‘Clothes/Towels’’, ‘‘Fabric’’, ‘‘Floor’’, ‘‘Food’’, ‘‘Footwear’’, ‘‘Metal’’, ‘‘Non-dietary Water’’, ‘‘Paper/Wrapper’’, ‘‘Plastic’’, ‘‘Rock/Brick’’, ‘‘Toys’’, ‘‘Vegetation/Grass’’, and ‘‘Wood’’) and two aggregate object/surface categories (‘‘Non-dietary objects/surfaces’’ and ‘‘Total objects/surfaces’’). For outdoor both hand contacts with ‘‘Total objects/surfaces’’, contact frequencies ranged from 229.9 to 1517.7 contacts/h, median durations/contact ranged from o1 to 5 s, and hourly contact durations ranged from 42.6 to 102.2 m/h. The data were analyzed for significant differences in hand contact activities as a function of (1) age, (2) location, (3) gender, and (4) hand. Significant differences (Pp0.05) were found for all four factors analyzed. Hourly contact durations with ‘‘Non-dietary objects/surfaces’’ and ‘‘Total objects/ surfaces’’ increased with age (P ¼ 0.01, r s ¼ 0.42 and P ¼ 0.005, r s ¼ 0.46, respectively), while contact frequencies and hourly contact durations with ‘‘Wood’’ decreased with age (P ¼ 0.02, r s ¼0.38 and P ¼ 0.05, r s ¼0.32, respectively). Location was found to affect contact frequencies and hourly contact durations with certain objects/surfaces. For example, contact frequencies and hourly contact durations with ‘‘Fabric’’ were higher indoors (P ¼ 0.02 for both), while contact frequencies and hourly contact durations with ‘‘Vegetation/Grass’’ were higher outdoors (P ¼ 0.02 and P ¼ 0.04, respectively). Girls had longer hourly contact durations with ‘‘Footwear’’ (P ¼ 0.02), ‘‘Non-dietary objects/surfaces’’ (P ¼ 0.03), and ‘‘Total objects/ surfaces’’ (P ¼ 0.01) than boys. The right hand had longer hourly contact durations with objects that are often manipulated with the hand (e.g., ‘‘Toys’’ (P ¼ 0.0002)), while the left hand had longer hourly contact durations with passively touched objects/surfaces (e.g., ‘‘Clothes/Towels’’ (P ¼ 0.003) and ‘‘Floor’’ (P ¼ 0.04)). Journal of Exposure Science and Environmental Epidemiology (2006) 16, 434–446. doi:10.1038/sj.jes.7500480; published online 22 March 2006 Keywords: dermal exposure, non-dietary exposure, activity pattern, hand contact behavior, microlevel activity. Introduction Information about hand contact activities can help research- ers understand how contaminants load onto the surface of the hands. These chemicals may then enter the body via dermal absorption or non-dietary ingestion. Microlevel activity time series (MLATS) data capture the sequence and duration of contact events and allow contact frequency to be calculated (Ferguson et al., 2005). MLATS data can be combined with environmental concentrations to create sequential time exposure profiles that help researchers determine contact activities that lead to peak exposure (Ferguson, 2003; Riley et al., 2004). Microlevel activity data are currently used in physical– stochastic models which can account for temporal variability in human exposure (Zartarian and Leckie, 1998). Models include the Stochastic Human Exposure and Dose Simula- tion (SHEDS) model developed at the United States Environmental Protection Agency (USEPA) (Zartarian et al., 2000), as well as the Dermal Exposure Reduction Model (DERM) (Zartarian, 1996) and the Cumulative and Aggregate Simulation of Exposure (CASE) model developed at Stanford University (Canales, 2004). Despite their usefulness, microlevel activity data are time- and labor-intensive to collect. Thus, only a small number of published studies on the collection and analysis of hand microlevel activity data are available (Zartarian et al., 1997a; Reed et al., 1999; Freeman et al., 2001, 2005). Furthermore, previous studies collected data in primarily indoor environ- Received 19 August 2005; accepted 21 February 2006; published online 22 March 2006 1. Address all correspondence to: W AuYeung, Department of Civil and Environmental Engineering, Stanford University, Stanford, P.O.Box 11226, Stanford, California 94309, USA. Tel.: þ 1 415 205 3337. Fax: þ 1 650 725 3164. E-mail: [email protected] Journal of Exposure Science and Environmental Epidemiology (2006) 16, 434–446 r 2006 Nature Publishing Group All rights reserved 1559-0631/06/$30.00 www.nature.com/jes

Welcome message from author
This document is posted to help you gain knowledge. Please leave a comment to let me know what you think about it! Share it to your friends and learn new things together.
Transcript
Young children’s hand contact activities: An observational study via
videotaping in primarily outdoor residential settings
WILLA AUYEUNGa, ROBERT A. CANALESb, PALOMA BEAMERa, ALESIA C. FERGUSONc AND
JAMES O. LECKIEa
aDepartment of Civil and Environmental Engineering, Stanford University, Stanford, CA, USAbHarvard School of Public Health, Landmark Center, Boston, MA, USAcDepartment of Environmental and Occupational Health, College of Public Health, University of Arkansas for Medical Sciences, Little Rock,
Arkansas, USA
Microlevel activity time series (MLATS) data were gathered on hand contact activities of 38 children (1–6 years old) by videotaping in primarily outdoor
residential environments. The videotape recordings were then translated into text files using a specialized software called VirtualTimingDevicet. Contact
frequency (contacts/h), duration per contact (s/contact), and hourly contact duration (min/h) were summarized for outdoor hand contacts with 15
distinct object/surface categories (‘‘Animal’’, ‘‘Body’’, ‘‘Clothes/Towels’’, ‘‘Fabric’’, ‘‘Floor’’, ‘‘Food’’, ‘‘Footwear’’, ‘‘Metal’’, ‘‘Non-dietary Water’’,
‘‘Paper/Wrapper’’, ‘‘Plastic’’, ‘‘Rock/Brick’’, ‘‘Toys’’, ‘‘Vegetation/Grass’’, and ‘‘Wood’’) and two aggregate object/surface categories (‘‘Non-dietary
objects/surfaces’’ and ‘‘Total objects/surfaces’’). For outdoor both hand contacts with ‘‘Total objects/surfaces’’, contact frequencies ranged from 229.9 to
1517.7 contacts/h, median durations/contact ranged from o1 to 5 s, and hourly contact durations ranged from 42.6 to 102.2m/h.
The data were analyzed for significant differences in hand contact activities as a function of (1) age, (2) location, (3) gender, and (4) hand. Significant
differences (Pp0.05) were found for all four factors analyzed. Hourly contact durations with ‘‘Non-dietary objects/surfaces’’ and ‘‘Total objects/
surfaces’’ increased with age (P¼ 0.01, rs¼ 0.42 and P¼ 0.005, rs¼ 0.46, respectively), while contact frequencies and hourly contact durations with
‘‘Wood’’ decreased with age (P¼ 0.02, rs¼�0.38 and P¼ 0.05, rs¼�0.32, respectively). Location was found to affect contact frequencies and hourly
contact durations with certain objects/surfaces. For example, contact frequencies and hourly contact durations with ‘‘Fabric’’ were higher indoors
(P¼ 0.02 for both), while contact frequencies and hourly contact durations with ‘‘Vegetation/Grass’’ were higher outdoors (P¼ 0.02 and P¼ 0.04,
respectively). Girls had longer hourly contact durations with ‘‘Footwear’’ (P¼ 0.02), ‘‘Non-dietary objects/surfaces’’ (P¼ 0.03), and ‘‘Total objects/
surfaces’’ (P¼ 0.01) than boys. The right hand had longer hourly contact durations with objects that are often manipulated with the hand (e.g., ‘‘Toys’’
(P¼ 0.0002)), while the left hand had longer hourly contact durations with passively touched objects/surfaces (e.g., ‘‘Clothes/Towels’’ (P¼ 0.003) and
‘‘Floor’’ (P¼ 0.04)).
Journal of Exposure Science and Environmental Epidemiology (2006) 16, 434–446. doi:10.1038/sj.jes.7500480; published online 22 March 2006
Keywords: dermal exposure, non-dietary exposure, activity pattern, hand contact behavior, microlevel activity.
Introduction
Information about hand contact activities can help research-
ers understand how contaminants load onto the surface of
the hands. These chemicals may then enter the body via
dermal absorption or non-dietary ingestion. Microlevel
activity time series (MLATS) data capture the sequence
and duration of contact events and allow contact frequency
to be calculated (Ferguson et al., 2005). MLATS data can be
combined with environmental concentrations to create
sequential time exposure profiles that help researchers
determine contact activities that lead to peak exposure
(Ferguson, 2003; Riley et al., 2004).
Microlevel activity data are currently used in physical–
stochastic models which can account for temporal variability
in human exposure (Zartarian and Leckie, 1998). Models
include the Stochastic Human Exposure and Dose Simula-
tion (SHEDS) model developed at the United States
Environmental Protection Agency (USEPA) (Zartarian
et al., 2000), as well as the Dermal Exposure Reduction
Model (DERM) (Zartarian, 1996) and the Cumulative and
Aggregate Simulation of Exposure (CASE) model developed
at Stanford University (Canales, 2004).
Despite their usefulness, microlevel activity data are time-
and labor-intensive to collect. Thus, only a small number of
published studies on the collection and analysis of hand
microlevel activity data are available (Zartarian et al., 1997a;
Reed et al., 1999; Freeman et al., 2001, 2005). Furthermore,
previous studies collected data in primarily indoor environ-Received 19 August 2005; accepted 21 February 2006; published online 22
March 2006
1. Address all correspondence to: W AuYeung, Department of Civil and
Environmental Engineering, Stanford University, Stanford, P.O.Box
11226, Stanford, California 94309, USA. Tel.: þ 1 415 205 3337.
Fax: þ 1 650 725 3164. E-mail: [email protected]
Journal of Exposure Science and Environmental Epidemiology (2006) 16, 434–446
r 2006 Nature Publishing Group All rights reserved 1559-0631/06/$30.00
www.nature.com/jes
ments. This study aims to contribute to the field of exposure
assessment by providing an analysis of hand MLATS data
collected in primarily outdoor environments. This informa-
tion may be useful in assessing children’s exposure to
contaminants in outdoor environments. Statistical tests
were applied to analyze whether hand contact activities
differed by age, gender, indoor/outdoor environments, and
left/right hands. Similar analyses of hand-to-mouth and
other mouthing contacts can be found in AuYeung et al.
(2004).
Methods
Recruitment of SubjectsSubjects were recruited from the southern region of the San
Francisco Bay peninsula by calling telephone numbers
randomly extracted from the Pacific Bell residential telephone
directory for a 300–400 square mile region associated with
Redwood City, Menlo Park, and Palo Alto. To screen for
middle-class children, a phone survey was administered, and
families with children between 1 and 6 years of age who lived
in a residence with a lawn and whose annual household
income was greater than $35,000 were invited to participate
in the studies.
VideotapingStanford University’s Exposure Research Group videotaped
the 38 children between August 1998 and May 1999. The
subjects were videotaped only on days with fair weather (i.e.,
no rain). Parents were asked to keep their child outdoors for
the duration of the videotaping session (2 h) and videotape
data were collected for each child during ‘‘natural play’’ (i.e.,
unstructured play). In most cases, only one child was
videotaped during each session. In rare cases where two
children from the same household participated in the study,
two teams of researchers collected videotaping data in the
same session. Outdoor locations where videotaping occurred
include parks, playgrounds, and outdoor areas of the
children’s homes (e.g., back yard, front yard, patio).
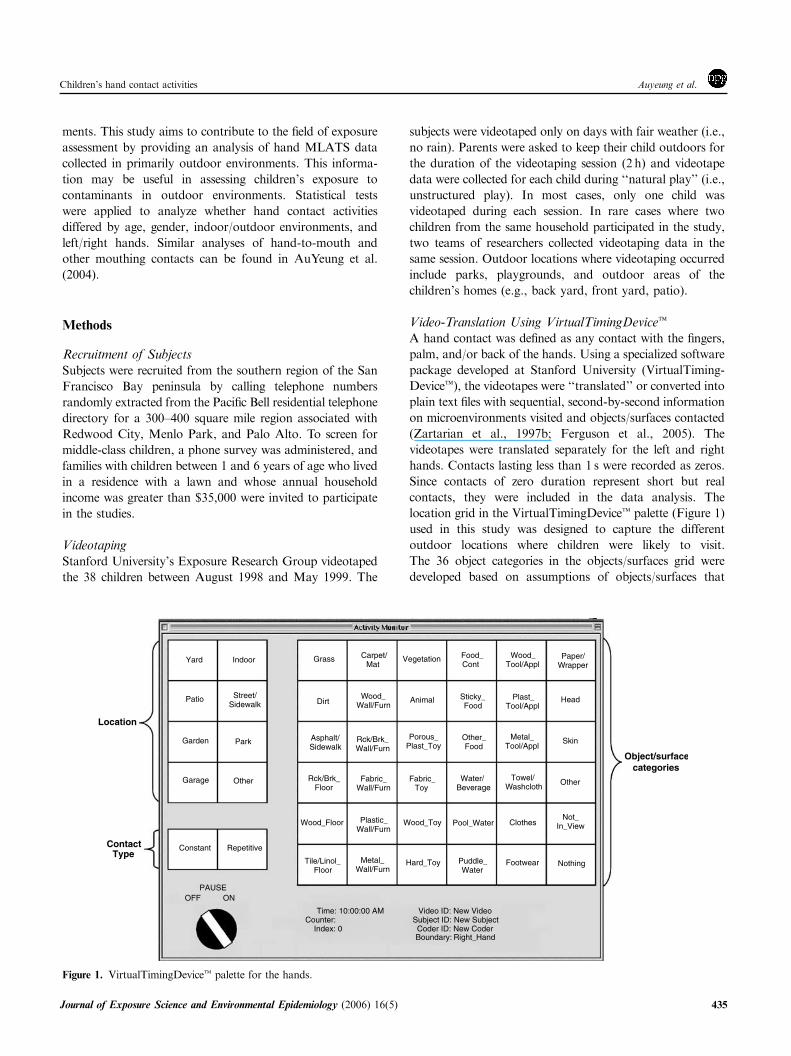
Video-Translation Using VirtualTimingDevicetA hand contact was defined as any contact with the fingers,
palm, and/or back of the hands. Using a specialized software
package developed at Stanford University (VirtualTiming-
Devicet), the videotapes were ‘‘translated’’ or converted into
plain text files with sequential, second-by-second information
on microenvironments visited and objects/surfaces contacted
(Zartarian et al., 1997b; Ferguson et al., 2005). The
videotapes were translated separately for the left and right
hands. Contacts lasting less than 1 s were recorded as zeros.
Since contacts of zero duration represent short but real
contacts, they were included in the data analysis. The
location grid in the VirtualTimingDevicet palette (Figure 1)
used in this study was designed to capture the different
outdoor locations where children were likely to visit.
The 36 object categories in the objects/surfaces grid were
developed based on assumptions of objects/surfaces that
Location
Contact Type
Object/surfacecategories
RepetitiveConstant
Garage Other
ParkGarden
Patio Street/ Sidewalk
Yard Indoor
Head
Other
Grass Carpet/ Mat
Vegetation Food_ Cont
Wood_ Tool/Appl
Paper/ Wrapper
DirtWood_
Wall/FurnAnimal Sticky_
Food Plast_
Tool/Appl
Rck/Brk_ Wall/Furn
Porous_ Plast_Toy
Other_ Food
Metal_ Tool/Appl
Skin
Rck/Brk_ Floor
Fabric_ Wall/Furn
Fabric_ Toy
Water/ Beverage
Towel/ Washcloth
Wood_Floor Plastic_ Wall/Furn
Wood_Toy Pool_Water Clothes Not_
In_View
Tile/Linol_ Floor
Metal_ Wall/Furn
Hard_Toy Puddle_ Water
Footwear Nothing
Asphalt/ Sidewalk
Time: 10:00:00 AM Video ID: New Video Counter: Subject ID: New Subject
Index: 0 Coder ID: New CoderBoundary: Right_Hand
PAUSE OFF ON
Figure 1. VirtualTimingDevicet palette for the hands.
Children’s hand contact activities Auyeung et al.
Journal of Exposure Science and Environmental Epidemiology (2006) 16(5) 435
children most commonly come into contact with in outdoor
environments. The contact type grid allowed researchers to
designate contacts as either constant (e.g., holding a ball) or
repetitive (e.g., bouncing a ball). The ‘‘Repetitive’’ cell was
selected when contacts with an object/surface occurred at a
high rate.
Quality Control of Video-TranslationRigorous training and quality control protocols were applied
to ensure high quality data (Ferguson et al., 2005). Between
5 and 10% of the total number of translated files were
randomly selected to be checked by an experienced researcher
for agreement in object and location designations. In general,
if the two files had greater than 10% difference in total
duration with different object/location combinations, then
the translator had to retranslate the videotape segment. If
systemic errors were made (e.g., errors in the categorizations
of locations and objects/surfaces), then all segments where
the errors occurred were retranslated. The quality control
process reiterated until the retranslated segments met the
quality control standard.
In addition, as part of a separate study, researchers
rewatched the videotapes to assign contact configurations for
all hand contacts. Each recorded hand contact was examined
and a contact configuration (e.g., open hand grip, palm only
contact, etc.) was assigned to the contact. During this
process, any additional errors in location and object/surface
designations found in the activity files were corrected.
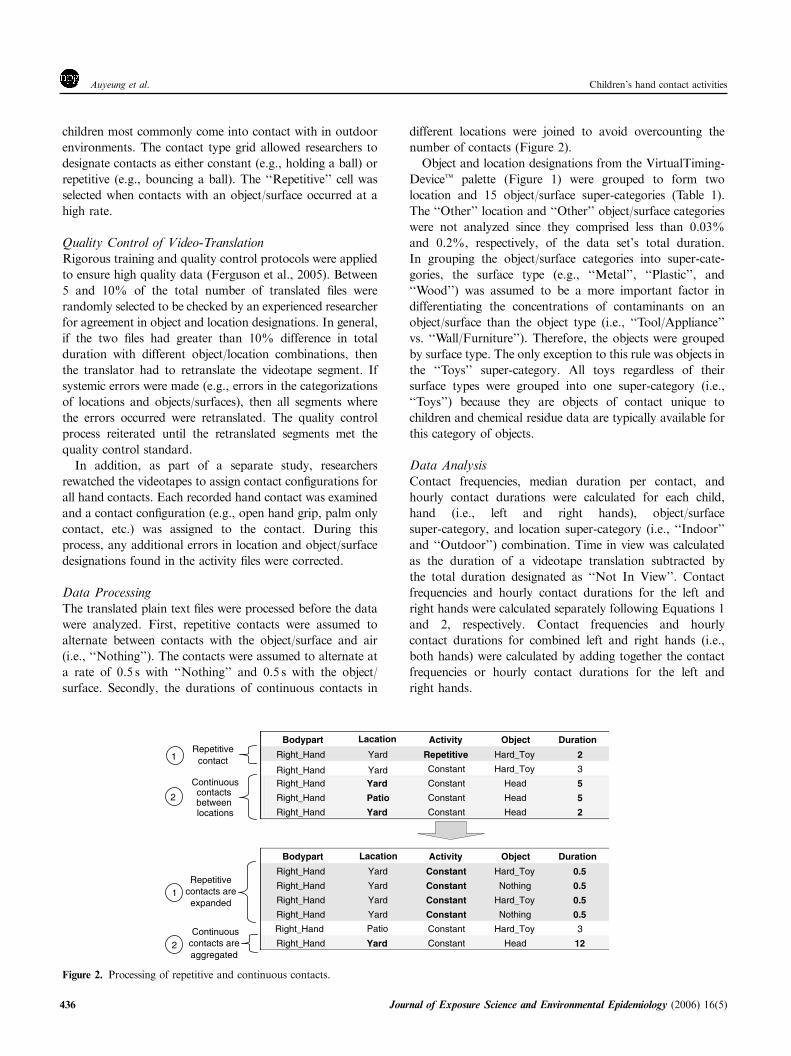
Data ProcessingThe translated plain text files were processed before the data
were analyzed. First, repetitive contacts were assumed to
alternate between contacts with the object/surface and air
(i.e., ‘‘Nothing’’). The contacts were assumed to alternate at
a rate of 0.5 s with ‘‘Nothing’’ and 0.5 s with the object/
surface. Secondly, the durations of continuous contacts in
different locations were joined to avoid overcounting the
number of contacts (Figure 2).
Object and location designations from the VirtualTiming-
Devicet palette (Figure 1) were grouped to form two
location and 15 object/surface super-categories (Table 1).
The ‘‘Other’’ location and ‘‘Other’’ object/surface categories
were not analyzed since they comprised less than 0.03%
and 0.2%, respectively, of the data set’s total duration.
In grouping the object/surface categories into super-cate-
gories, the surface type (e.g., ‘‘Metal’’, ‘‘Plastic’’, and
‘‘Wood’’) was assumed to be a more important factor in
differentiating the concentrations of contaminants on an
object/surface than the object type (i.e., ‘‘Tool/Appliance’’
vs. ‘‘Wall/Furniture’’). Therefore, the objects were grouped
by surface type. The only exception to this rule was objects in
the ‘‘Toys’’ super-category. All toys regardless of their
surface types were grouped into one super-category (i.e.,
‘‘Toys’’) because they are objects of contact unique to
children and chemical residue data are typically available for
this category of objects.
Data AnalysisContact frequencies, median duration per contact, and
hourly contact durations were calculated for each child,
hand (i.e., left and right hands), object/surface
super-category, and location super-category (i.e., ‘‘Indoor’’
and ‘‘Outdoor’’) combination. Time in view was calculated
as the duration of a videotape translation subtracted by
the total duration designated as ‘‘Not In View’’. Contact
frequencies and hourly contact durations for the left and
right hands were calculated separately following Equations 1
and 2, respectively. Contact frequencies and hourly
contact durations for combined left and right hands (i.e.,
both hands) were calculated by adding together the contact
frequencies or hourly contact durations for the left and
right hands.
Bodypart Activity Object Duration
Right_Hand Yard
Right_Hand Yard
Repetitive Hard_Toy 2
Constant Hard_Toy 3
Right_Hand Yard Constant Head 5
Right_Hand Patio Constant Head 5
Right_Hand Yard Constant Head 2
Bodypart Activity Object Duration
Right_Hand Yard Constant Hard_Toy 0.5
Right_Hand Yard Constant Nothing 0.5
Right_Hand Yard Constant Hard_Toy 0.5
Right_Hand Yard Constant Nothing 0.5
Right_Hand Constant Hard_Toy 3
Right_Hand Yard Constant Head 12
1
1
2
2
Repetitive contact
Continuouscontacts between locations
Repetitive contacts are expanded
Continuouscontacts are aggregated
Patio
Lacation
Lacation
Figure 2. Processing of repetitive and continuous contacts.
Children’s hand contact activitiesAuyeung et al.
436 Journal of Exposure Science and Environmental Epidemiology (2006) 16(5)
Equation 1. Contact frequency for left and right hands
Contact frequency ðchild; hand; objectÞcontacts
hour
� �
¼Number of contactsðchild; hand; objectÞ
Time in viewðchild;handÞ
Equation 2. Hourly contact duration for left and right
hands
Hourly contact duration ðchild; hand; objectÞminutes
hour
� �
¼P
Duration per contactðchild;hand;objectÞTime in viewðchild; handÞ
Contact frequency, median duration per contact, and
hourly contact duration were analyzed for significant
differences between age, gender, right/left hands, and
indoor/outdoor locations. Tree analysis was applied in S-
PLUS to test whether the data should be grouped by age and
non-parametric tests were used for all statistical analyses. The
two-tailed Wilcoxon rank sum test was applied to analyze
differences between male and female subjects, while the two-
tailed Wilcoxon signed rank test for matched pairs was
applied to test for differences between the right/left hands and
between indoor/outdoor environments (Rice, 1995). Spear-
man’s rank correlation coefficient was calculated to test for
correlations between hand contact activities and age (in
months). Only outdoor data were included in the statistical
analysis of differences in hand contact activities as a function
of age, gender, and left/right hands on hand contact
activities. Except when the data were analyzed for differences
between the left and right hands, all statistical tests were
applied only on data for both hands combined.
Results
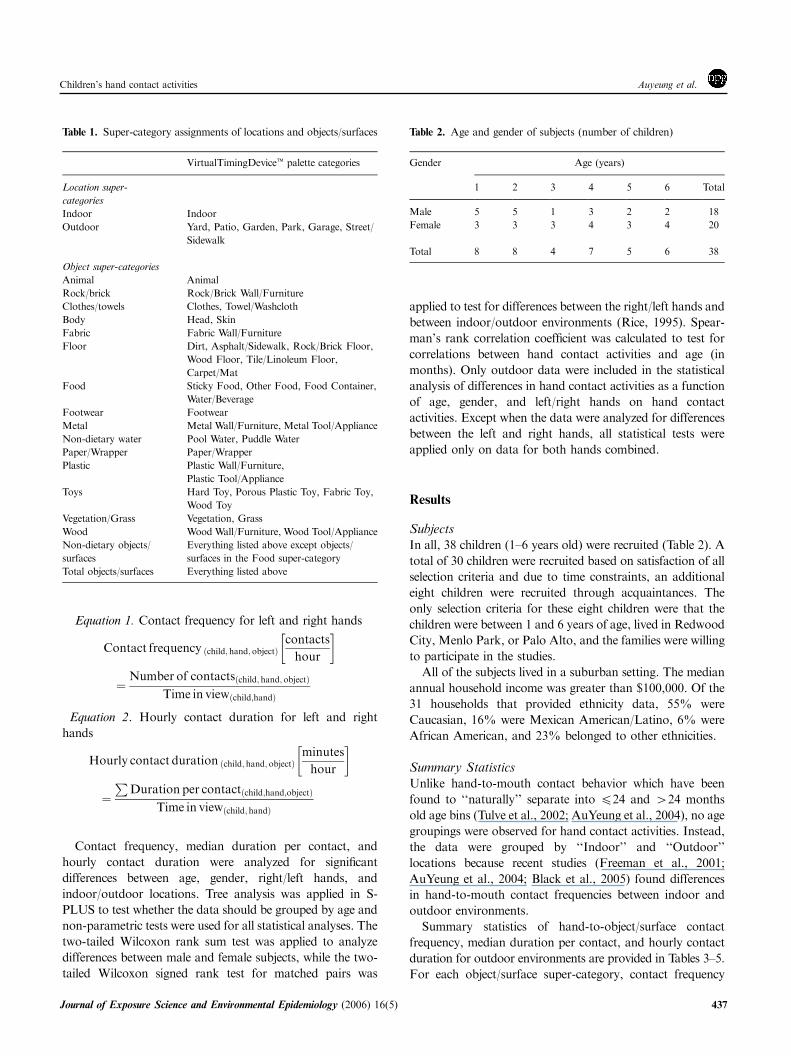
SubjectsIn all, 38 children (1–6 years old) were recruited (Table 2). A
total of 30 children were recruited based on satisfaction of all
selection criteria and due to time constraints, an additional
eight children were recruited through acquaintances. The
only selection criteria for these eight children were that the
children were between 1 and 6 years of age, lived in Redwood
City, Menlo Park, or Palo Alto, and the families were willing
to participate in the studies.
All of the subjects lived in a suburban setting. The median
annual household income was greater than $100,000. Of the
31 households that provided ethnicity data, 55% were
Caucasian, 16% were Mexican American/Latino, 6% were
African American, and 23% belonged to other ethnicities.
Summary StatisticsUnlike hand-to-mouth contact behavior which have been
found to ‘‘naturally’’ separate into p24 and 424 months
old age bins (Tulve et al., 2002; AuYeung et al., 2004), no age
groupings were observed for hand contact activities. Instead,
the data were grouped by ‘‘Indoor’’ and ‘‘Outdoor’’
locations because recent studies (Freeman et al., 2001;
AuYeung et al., 2004; Black et al., 2005) found differences
in hand-to-mouth contact frequencies between indoor and
outdoor environments.
Summary statistics of hand-to-object/surface contact
frequency, median duration per contact, and hourly contact
duration for outdoor environments are provided in Tables 3–5.
For each object/surface super-category, contact frequency
Table 1. Super-category assignments of locations and objects/surfaces
VirtualTimingDevicet palette categories
Location super-
categories
Indoor Indoor
Outdoor Yard, Patio, Garden, Park, Garage, Street/
Sidewalk
Object super-categories
Animal Animal
Rock/brick Rock/Brick Wall/Furniture
Clothes/towels Clothes, Towel/Washcloth
Body Head, Skin
Fabric Fabric Wall/Furniture
Floor Dirt, Asphalt/Sidewalk, Rock/Brick Floor,
Wood Floor, Tile/Linoleum Floor,
Carpet/Mat
Food Sticky Food, Other Food, Food Container,
Water/Beverage
Footwear Footwear
Metal Metal Wall/Furniture, Metal Tool/Appliance
Non-dietary water Pool Water, Puddle Water
Paper/Wrapper Paper/Wrapper
Plastic Plastic Wall/Furniture,
Plastic Tool/Appliance
Toys Hard Toy, Porous Plastic Toy, Fabric Toy,
Wood Toy
Vegetation/Grass Vegetation, Grass
Wood Wood Wall/Furniture, Wood Tool/Appliance
Non-dietary objects/
surfaces
Everything listed above except objects/
surfaces in the Food super-category
Total objects/surfaces Everything listed above
Table 2. Age and gender of subjects (number of children)
Gender Age (years)
1 2 3 4 5 6 Total
Male 5 5 1 3 2 2 18
Female 3 3 3 4 3 4 20
Total 8 8 4 7 5 6 38
Children’s hand contact activities Auyeung et al.
Journal of Exposure Science and Environmental Epidemiology (2006) 16(5) 437
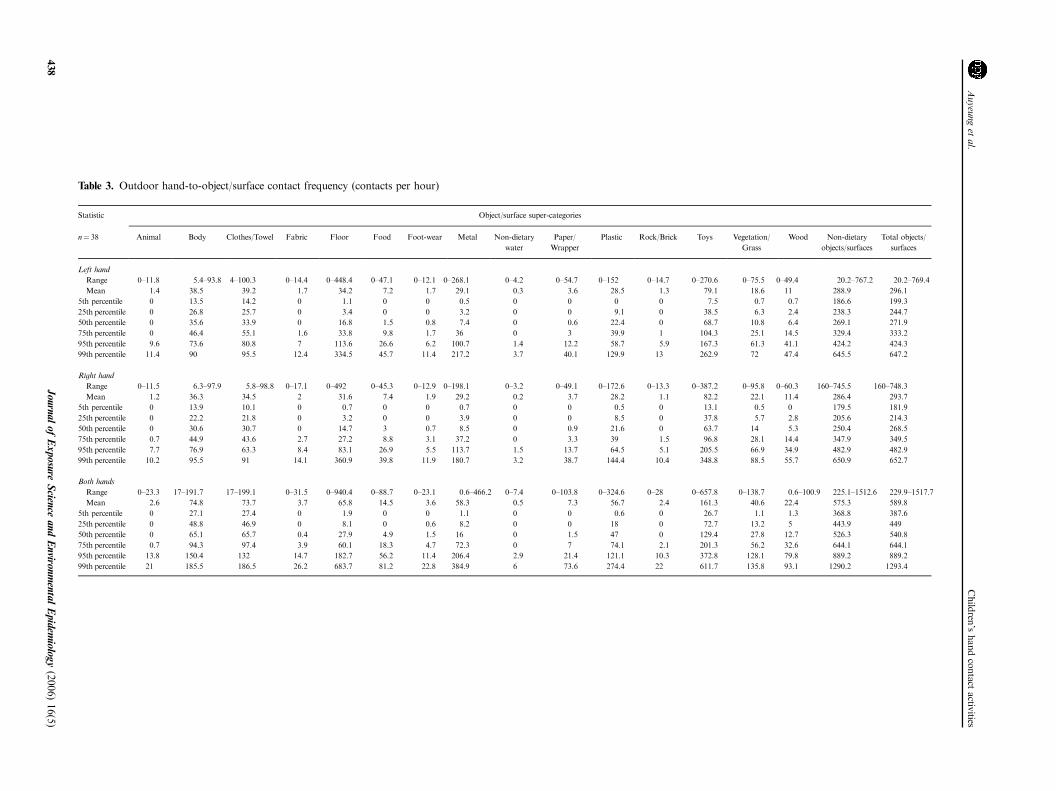
Table 3. Outdoor hand-to-object/surface contact frequency (contacts per hour)
Statistic Object/surface super-categories
n¼ 38 Animal Body Clothes/Towel Fabric Floor Food Foot-wear Metal Non-dietary
water
Paper/
Wrapper
Plastic Rock/Brick Toys Vegetation/
Grass
Wood Non-dietary
objects/surfaces
Total objects/
surfaces
Left hand
Range 0–11.8 5.4–93.8 4–100.3 0–14.4 0–448.4 0–47.1 0–12.1 0–268.1 0–4.2 0–54.7 0–152 0–14.7 0–270.6 0–75.5 0–49.4 20.2–767.2 20.2–769.4
Mean 1.4 38.5 39.2 1.7 34.2 7.2 1.7 29.1 0.3 3.6 28.5 1.3 79.1 18.6 11 288.9 296.1
5th percentile 0 13.5 14.2 0 1.1 0 0 0.5 0 0 0 0 7.5 0.7 0.7 186.6 199.3
25th percentile 0 26.8 25.7 0 3.4 0 0 3.2 0 0 9.1 0 38.5 6.3 2.4 238.3 244.7
50th percentile 0 35.6 33.9 0 16.8 1.5 0.8 7.4 0 0.6 22.4 0 68.7 10.8 6.4 269.1 271.9
75th percentile 0 46.4 55.1 1.6 33.8 9.8 1.7 36 0 3 39.9 1 104.3 25.1 14.5 329.4 333.2
95th percentile 9.6 73.6 80.8 7 113.6 26.6 6.2 100.7 1.4 12.2 58.7 5.9 167.3 61.3 41.1 424.2 424.3
99th percentile 11.4 90 95.5 12.4 334.5 45.7 11.4 217.2 3.7 40.1 129.9 13 262.9 72 47.4 645.5 647.2
Right hand
Range 0–11.5 6.3–97.9 5.8–98.8 0–17.1 0–492 0–45.3 0–12.9 0–198.1 0–3.2 0–49.1 0–172.6 0–13.3 0–387.2 0–95.8 0–60.3 160–745.5 160–748.3
Mean 1.2 36.3 34.5 2 31.6 7.4 1.9 29.2 0.2 3.7 28.2 1.1 82.2 22.1 11.4 286.4 293.7
5th percentile 0 13.9 10.1 0 0.7 0 0 0.7 0 0 0.5 0 13.1 0.5 0 179.5 181.9
25th percentile 0 22.2 21.8 0 3.2 0 0 3.9 0 0 8.5 0 37.8 5.7 2.8 205.6 214.3
50th percentile 0 30.6 30.7 0 14.7 3 0.7 8.5 0 0.9 21.6 0 63.7 14 5.3 250.4 268.5
75th percentile 0.7 44.9 43.6 2.7 27.2 8.8 3.1 37.2 0 3.3 39 1.5 96.8 28.1 14.4 347.9 349.5
95th percentile 7.7 76.9 63.3 8.4 83.1 26.9 5.5 113.7 1.5 13.7 64.5 5.1 205.5 66.9 34.9 482.9 482.9
99th percentile 10.2 95.5 91 14.1 360.9 39.8 11.9 180.7 3.2 38.7 144.4 10.4 348.8 88.5 55.7 650.9 652.7
Both hands
Range 0–23.3 17–191.7 17–199.1 0–31.5 0–940.4 0–88.7 0–23.1 0.6–466.2 0–7.4 0–103.8 0–324.6 0–28 0–657.8 0–138.7 0.6–100.9 225.1–1512.6 229.9–1517.7
Mean 2.6 74.8 73.7 3.7 65.8 14.5 3.6 58.3 0.5 7.3 56.7 2.4 161.3 40.6 22.4 575.3 589.8
5th percentile 0 27.1 27.4 0 1.9 0 0 1.1 0 0 0.6 0 26.7 1.1 1.3 368.8 387.6
25th percentile 0 48.8 46.9 0 8.1 0 0.6 8.2 0 0 18 0 72.7 13.2 5 443.9 449
50th percentile 0 65.1 65.7 0.4 27.9 4.9 1.5 16 0 1.5 47 0 129.4 27.8 12.7 526.3 540.8
75th percentile 0.7 94.3 97.4 3.9 60.1 18.3 4.7 72.3 0 7 74.1 2.1 201.3 56.2 32.6 644.1 644.1
95th percentile 13.8 150.4 132 14.7 182.7 56.2 11.4 206.4 2.9 21.4 121.1 10.3 372.8 128.1 79.8 889.2 889.2
99th percentile 21 185.5 186.5 26.2 683.7 81.2 22.8 384.9 6 73.6 274.4 22 611.7 135.8 93.1 1290.2 1293.4
Child
ren’shan
dcontact
activities
Auyeung
etal.
438
Journal
ofExposure
Science
andEnvironm
entalEpidem
iology(2006)16(5)
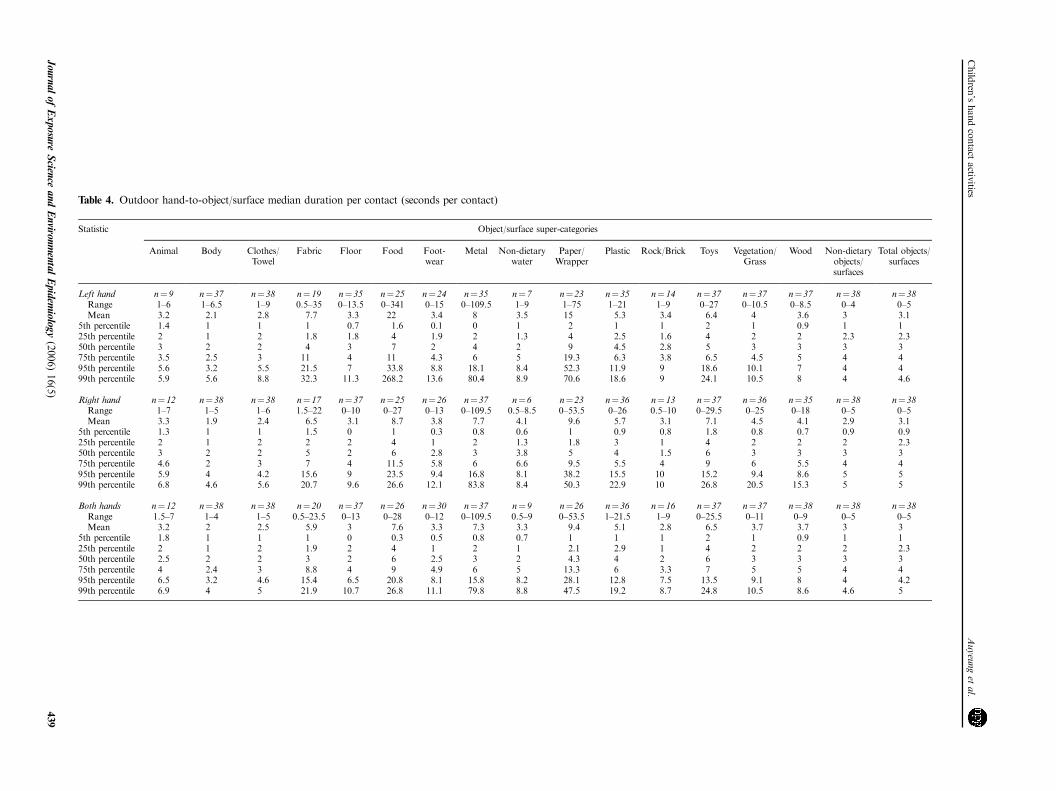
Table 4. Outdoor hand-to-object/surface median duration per contact (seconds per contact)
Statistic Object/surface super-categories
Animal Body Clothes/Towel
Fabric Floor Food Foot-wear
Metal Non-dietarywater
Paper/Wrapper
Plastic Rock/Brick Toys Vegetation/Grass
Wood Non-dietaryobjects/surfaces
Total objects/surfaces
Left hand n¼ 9 n¼ 37 n¼ 38 n¼ 19 n¼ 35 n¼ 25 n¼ 24 n¼ 35 n¼ 7 n¼ 23 n¼ 35 n¼ 14 n¼ 37 n¼ 37 n¼ 37 n¼ 38 n¼ 38Range 1–6 1–6.5 1–9 0.5–35 0–13.5 0–341 0–15 0–109.5 1–9 1–75 1–21 1–9 0–27 0–10.5 0–8.5 0–4 0–5Mean 3.2 2.1 2.8 7.7 3.3 22 3.4 8 3.5 15 5.3 3.4 6.4 4 3.6 3 3.1
5th percentile 1.4 1 1 1 0.7 1.6 0.1 0 1 2 1 1 2 1 0.9 1 125th percentile 2 1 2 1.8 1.8 4 1.9 2 1.3 4 2.5 1.6 4 2 2 2.3 2.350th percentile 3 2 2 4 3 7 2 4 2 9 4.5 2.8 5 3 3 3 375th percentile 3.5 2.5 3 11 4 11 4.3 6 5 19.3 6.3 3.8 6.5 4.5 5 4 495th percentile 5.6 3.2 5.5 21.5 7 33.8 8.8 18.1 8.4 52.3 11.9 9 18.6 10.1 7 4 499th percentile 5.9 5.6 8.8 32.3 11.3 268.2 13.6 80.4 8.9 70.6 18.6 9 24.1 10.5 8 4 4.6
Right hand n¼ 12 n¼ 38 n¼ 38 n¼ 17 n¼ 37 n¼ 25 n¼ 26 n¼ 37 n¼ 6 n¼ 23 n¼ 36 n¼ 13 n¼ 37 n¼ 36 n¼ 35 n¼ 38 n¼ 38Range 1–7 1–5 1–6 1.5–22 0–10 0–27 0–13 0–109.5 0.5–8.5 0–53.5 0–26 0.5–10 0–29.5 0–25 0–18 0–5 0–5Mean 3.3 1.9 2.4 6.5 3.1 8.7 3.8 7.7 4.1 9.6 5.7 3.1 7.1 4.5 4.1 2.9 3.1
5th percentile 1.3 1 1 1.5 0 1 0.3 0.8 0.6 1 0.9 0.8 1.8 0.8 0.7 0.9 0.925th percentile 2 1 2 2 2 4 1 2 1.3 1.8 3 1 4 2 2 2 2.350th percentile 3 2 2 5 2 6 2.8 3 3.8 5 4 1.5 6 3 3 3 375th percentile 4.6 2 3 7 4 11.5 5.8 6 6.6 9.5 5.5 4 9 6 5.5 4 495th percentile 5.9 4 4.2 15.6 9 23.5 9.4 16.8 8.1 38.2 15.5 10 15.2 9.4 8.6 5 599th percentile 6.8 4.6 5.6 20.7 9.6 26.6 12.1 83.8 8.4 50.3 22.9 10 26.8 20.5 15.3 5 5
Both hands n¼ 12 n¼ 38 n¼ 38 n¼ 20 n¼ 37 n¼ 26 n¼ 30 n¼ 37 n¼ 9 n¼ 26 n¼ 36 n¼ 16 n¼ 37 n¼ 37 n¼ 38 n¼ 38 n¼ 38Range 1.5–7 1–4 1–5 0.5–23.5 0–13 0–28 0–12 0–109.5 0.5–9 0–53.5 1–21.5 1–9 0–25.5 0–11 0–9 0–5 0–5Mean 3.2 2 2.5 5.9 3 7.6 3.3 7.3 3.3 9.4 5.1 2.8 6.5 3.7 3.7 3 3
5th percentile 1.8 1 1 1 0 0.3 0.5 0.8 0.7 1 1 1 2 1 0.9 1 125th percentile 2 1 2 1.9 2 4 1 2 1 2.1 2.9 1 4 2 2 2 2.350th percentile 2.5 2 2 3 2 6 2.5 3 2 4.3 4 2 6 3 3 3 375th percentile 4 2.4 3 8.8 4 9 4.9 6 5 13.3 6 3.3 7 5 5 4 495th percentile 6.5 3.2 4.6 15.4 6.5 20.8 8.1 15.8 8.2 28.1 12.8 7.5 13.5 9.1 8 4 4.299th percentile 6.9 4 5 21.9 10.7 26.8 11.1 79.8 8.8 47.5 19.2 8.7 24.8 10.5 8.6 4.6 5
Child
ren’shandcontact
activities
Auyeung
etal.
Journal
ofExposure
Science
andEnvironm
entalEpidem
iology(2006)16(5)
439
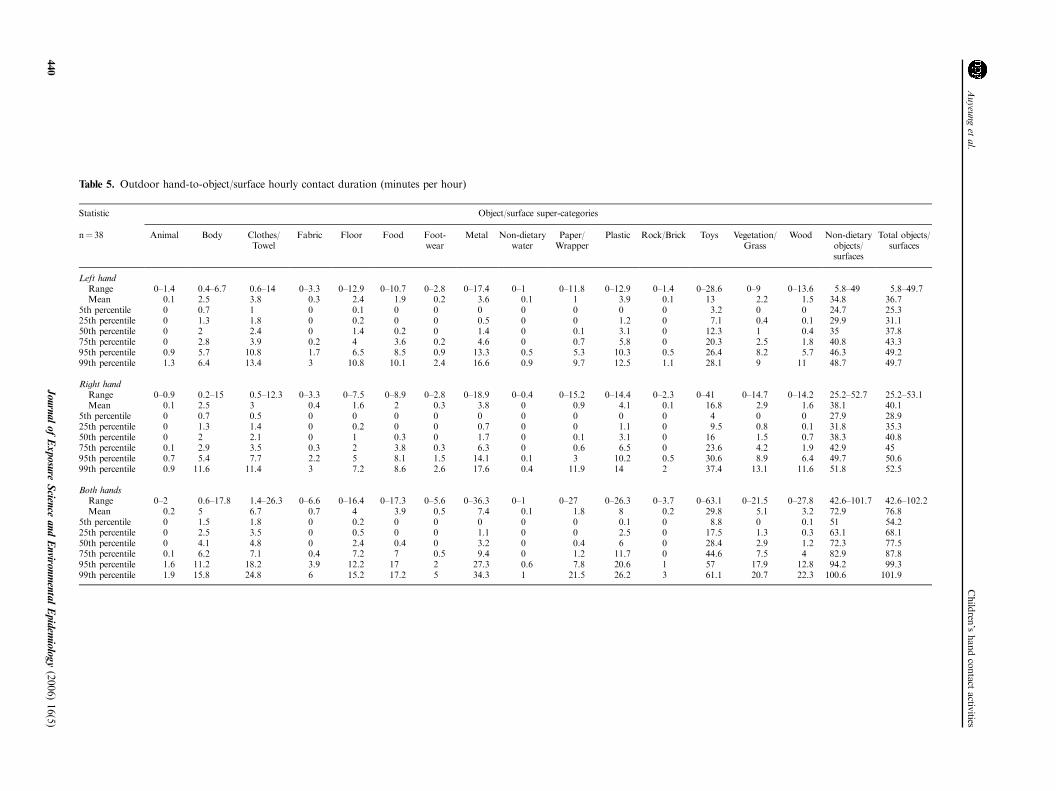
Table 5. Outdoor hand-to-object/surface hourly contact duration (minutes per hour)
Statistic Object/surface super-categories
n¼ 38 Animal Body Clothes/Towel
Fabric Floor Food Foot-wear
Metal Non-dietarywater
Paper/Wrapper
Plastic Rock/Brick Toys Vegetation/Grass
Wood Non-dietaryobjects/surfaces
Total objects/surfaces
Left handRange 0–1.4 0.4–6.7 0.6–14 0–3.3 0–12.9 0–10.7 0–2.8 0–17.4 0–1 0–11.8 0–12.9 0–1.4 0–28.6 0–9 0–13.6 5.8–49 5.8–49.7Mean 0.1 2.5 3.8 0.3 2.4 1.9 0.2 3.6 0.1 1 3.9 0.1 13 2.2 1.5 34.8 36.7
5th percentile 0 0.7 1 0 0.1 0 0 0 0 0 0 0 3.2 0 0 24.7 25.325th percentile 0 1.3 1.8 0 0.2 0 0 0.5 0 0 1.2 0 7.1 0.4 0.1 29.9 31.150th percentile 0 2 2.4 0 1.4 0.2 0 1.4 0 0.1 3.1 0 12.3 1 0.4 35 37.875th percentile 0 2.8 3.9 0.2 4 3.6 0.2 4.6 0 0.7 5.8 0 20.3 2.5 1.8 40.8 43.395th percentile 0.9 5.7 10.8 1.7 6.5 8.5 0.9 13.3 0.5 5.3 10.3 0.5 26.4 8.2 5.7 46.3 49.299th percentile 1.3 6.4 13.4 3 10.8 10.1 2.4 16.6 0.9 9.7 12.5 1.1 28.1 9 11 48.7 49.7
Right handRange 0–0.9 0.2–15 0.5–12.3 0–3.3 0–7.5 0–8.9 0–2.8 0–18.9 0–0.4 0–15.2 0–14.4 0–2.3 0–41 0–14.7 0–14.2 25.2–52.7 25.2–53.1Mean 0.1 2.5 3 0.4 1.6 2 0.3 3.8 0 0.9 4.1 0.1 16.8 2.9 1.6 38.1 40.1
5th percentile 0 0.7 0.5 0 0 0 0 0 0 0 0 0 4 0 0 27.9 28.925th percentile 0 1.3 1.4 0 0.2 0 0 0.7 0 0 1.1 0 9.5 0.8 0.1 31.8 35.350th percentile 0 2 2.1 0 1 0.3 0 1.7 0 0.1 3.1 0 16 1.5 0.7 38.3 40.875th percentile 0.1 2.9 3.5 0.3 2 3.8 0.3 6.3 0 0.6 6.5 0 23.6 4.2 1.9 42.9 4595th percentile 0.7 5.4 7.7 2.2 5 8.1 1.5 14.1 0.1 3 10.2 0.5 30.6 8.9 6.4 49.7 50.699th percentile 0.9 11.6 11.4 3 7.2 8.6 2.6 17.6 0.4 11.9 14 2 37.4 13.1 11.6 51.8 52.5
Both handsRange 0–2 0.6–17.8 1.4–26.3 0–6.6 0–16.4 0–17.3 0–5.6 0–36.3 0–1 0–27 0–26.3 0–3.7 0–63.1 0–21.5 0–27.8 42.6–101.7 42.6–102.2Mean 0.2 5 6.7 0.7 4 3.9 0.5 7.4 0.1 1.8 8 0.2 29.8 5.1 3.2 72.9 76.8
5th percentile 0 1.5 1.8 0 0.2 0 0 0 0 0 0.1 0 8.8 0 0.1 51 54.225th percentile 0 2.5 3.5 0 0.5 0 0 1.1 0 0 2.5 0 17.5 1.3 0.3 63.1 68.150th percentile 0 4.1 4.8 0 2.4 0.4 0 3.2 0 0.4 6 0 28.4 2.9 1.2 72.3 77.575th percentile 0.1 6.2 7.1 0.4 7.2 7 0.5 9.4 0 1.2 11.7 0 44.6 7.5 4 82.9 87.895th percentile 1.6 11.2 18.2 3.9 12.2 17 2 27.3 0.6 7.8 20.6 1 57 17.9 12.8 94.2 99.399th percentile 1.9 15.8 24.8 6 15.2 17.2 5 34.3 1 21.5 26.2 3 61.1 20.7 22.3 100.6 101.9
Child
ren’shan
dcontact
activities
Auyeung
etal.
440
Journal
ofExposure
Science
andEnvironm
entalEpidem
iology(2006)16(5)
(Table 3) and hourly contact duration (Table 5) were
calculated for all children (n¼ 38), while median duration
per contact (Table 4) could only be calculated for those
children who had contacts with that object/surface.
For the data analyses, the median time in view was 1 h and
40min for outdoor environments and 23min for indoor
environments. As this study focused on collecting outdoor
hand contact activities, only nine children in the data set
spent 15 or more minutes in view indoors. All indoor data
analysis were performed using only data from these nine
children, six of whom were between 4 and 6 years of age, and
three of whom were between 1 and 2 years of age.
Significant DifferencesContact frequencies, median contact durations, and hourly
contact durations were analyzed for significant differences as
a function of (1) age, (2) location, (3) gender, and (4) hand.
No significant differences or correlations (Pp0.05) in
median contact durations were found for any of the four
factors analyzed. However, significant findings were observed
for contact frequencies and hourly contact durations for all
four factors analyzed.
AgeAge (in months) was found to have significant correlations
with hand contact activity. Hourly contact duration increased
with age for contacts with ‘‘Non-dietary objects/surfaces’’
(P¼ 0.01, rs¼ 0.42) and ‘‘Total objects/surfaces’’ (P¼ 0.005,
rs¼ 0.46), but decreased with age for contacts with ‘‘Wood’’
(P¼ 0.05, rs¼�0.32). Contact frequency also decreased with
age for contacts with ‘‘Wood’’ (P¼ 0.02, rs¼�0.38).
LocationDifferences between indoor/outdoor environments were
examined using only data from the nine children who spent
more than 15min indoors. Differences between locations in
contact frequencies for both hands combined were found for
contacts with ‘‘Body’’, ‘‘Fabric’’, ‘‘Food’’, ‘‘Paper/Wrap-
per’’, ‘‘Vegetation/Grass’’, and ‘‘Wood’’. Differences be-
tween locations in hourly contact duration for both hands
combined were observed for contacts with ‘‘Body’’, ‘‘Fab-
ric’’, ‘‘Food’’, ‘‘Vegetation/Grass’’, and ‘‘Wood’’ (Table 6).
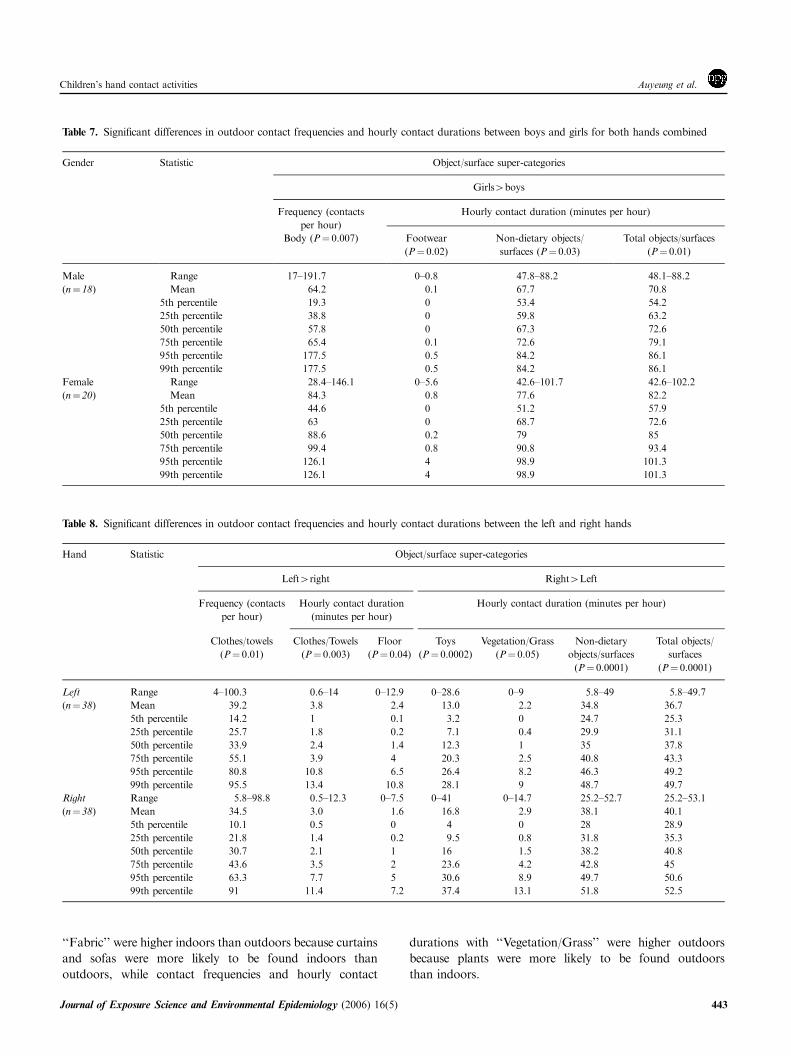
GenderDifferences between the genders were found for both hand
outdoor contact frequencies with ‘‘Body’’ and both
hand outdoor hourly contact durations with ‘‘Footwear’’,
‘‘Non-dietary objects/surfaces’’, and ‘‘Total objects/surfaces’’
(Table 7).
HandDifferences between the left and right hands were found for
outdoor contact frequencies with ‘‘Clothes/Towels’’ and
outdoor hourly contact durations with ‘‘Clothes/Towels’’,
‘‘Floor’’, ‘‘Toys’’, ‘‘Vegetation/Grass’’, ‘‘Non-dietary
objects/surfaces’’, and ‘‘Total objects/surfaces’’ (Table 8).
Discussion
MethodsThe videotaping and video-translation methods were used to
collect microlevel activity data because the duration of most
hand contacts is very short (on the order of a few seconds)
(Zartarian et al., 1997a; Freeman et al., 2005), and events of
such short duration may not be accurately captured via other
direct observational techniques like parental observation or
record-keeping (Timmer et al., 1985). Furthermore, the video-
taping and video-translation methods allow researchers to
retain a permanent record of the raw data, which can be used
for further analysis should future needs arise. It also allows
researchers to retranslate videotape segments and compare the
translated files in order to ensure high quality data.
Summary StatisticsFor both hand contacts with ‘‘Total objects/surfaces’’,
contact frequencies and hourly contact durations were very
high (229.9–1517.7 contacts per hour and 42.6–102.2min/h,
respectively), while the median durations per contact were
very short (o1 to 5 s/contact). Thus, children have a large
number of short contacts. The highest median contact
frequencies were with ‘‘Toys’’ (129.4 contacts/h for both
hands combined) followed by ‘‘Clothes/Towels’’ (65.7
contacts/h for both hands combined) and ‘‘Body’’ (65.1
contacts/h for both hands combined). This is not surprising
since nearly all of the children played with some type of toy
during the time they were videotaped and certain play
activities involving toys (e.g., bouncing a ball or tossing a
frisbee) involved high contact frequencies with the hands.
Contact frequencies with ‘‘Body’’ and ‘‘Clothes/Towels’’
were also high since all children had opportunities to contact
these objects/surfaces at all times.
Significant FindingsAs this study collected hand contact data mainly from
outdoor environments, some of the significant findings
regarding indoor/outdoor differences may be biased
due to the limited amount of indoor data collected. For
example, in this study, the children spent a large proportion
of their observed indoor time engaging in eating/
drinking events as a break from their outdoor activities.
Therefore, the significant differences in hand-to-food contact
behaviors between indoor/outdoor locations may be an
artefact of this bias towards recording an unusually high
frequency of indoor eating events. Despite the limitation just
mentioned, other significant differences between indoors/
outdoors environments seemed to make intuitive sense. That
is, contact frequencies and hourly contact durations with
Children’s hand contact activities Auyeung et al.
Journal of Exposure Science and Environmental Epidemiology (2006) 16(5) 441
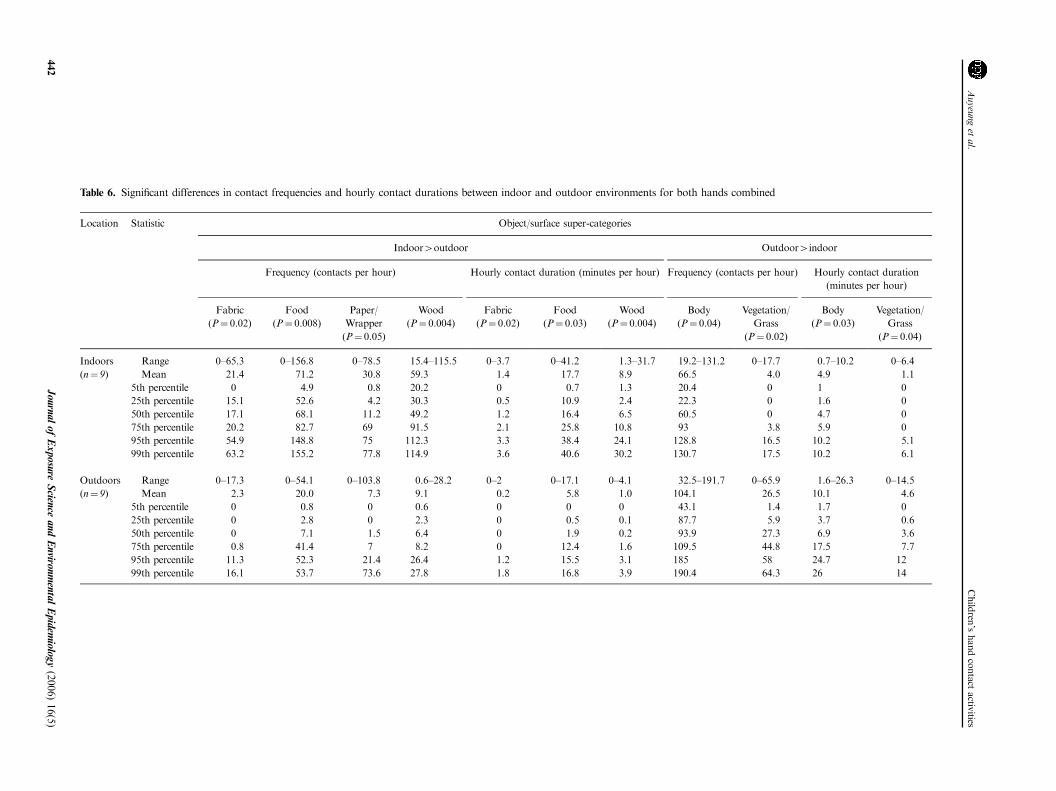
Table 6. Significant differences in contact frequencies and hourly contact durations between indoor and outdoor environments for both hands combined
Location Statistic Object/surface super-categories
Indoor4outdoor Outdoor4indoor
Frequency (contacts per hour) Hourly contact duration (minutes per hour) Frequency (contacts per hour) Hourly contact duration
(minutes per hour)
Fabric
(P¼ 0.02)
Food
(P¼ 0.008)
Paper/
Wrapper
(P¼ 0.05)
Wood
(P¼ 0.004)
Fabric
(P¼ 0.02)
Food
(P¼ 0.03)
Wood
(P¼ 0.004)
Body
(P¼ 0.04)
Vegetation/
Grass
(P¼ 0.02)
Body
(P¼ 0.03)
Vegetation/
Grass
(P¼ 0.04)
Indoors Range 0–65.3 0–156.8 0–78.5 15.4–115.5 0–3.7 0–41.2 1.3–31.7 19.2–131.2 0–17.7 0.7–10.2 0–6.4
(n¼ 9) Mean 21.4 71.2 30.8 59.3 1.4 17.7 8.9 66.5 4.0 4.9 1.1
5th percentile 0 4.9 0.8 20.2 0 0.7 1.3 20.4 0 1 0
25th percentile 15.1 52.6 4.2 30.3 0.5 10.9 2.4 22.3 0 1.6 0
50th percentile 17.1 68.1 11.2 49.2 1.2 16.4 6.5 60.5 0 4.7 0
75th percentile 20.2 82.7 69 91.5 2.1 25.8 10.8 93 3.8 5.9 0
95th percentile 54.9 148.8 75 112.3 3.3 38.4 24.1 128.8 16.5 10.2 5.1
99th percentile 63.2 155.2 77.8 114.9 3.6 40.6 30.2 130.7 17.5 10.2 6.1
Outdoors Range 0–17.3 0–54.1 0–103.8 0.6–28.2 0–2 0–17.1 0–4.1 32.5–191.7 0–65.9 1.6–26.3 0–14.5
(n¼ 9) Mean 2.3 20.0 7.3 9.1 0.2 5.8 1.0 104.1 26.5 10.1 4.6
5th percentile 0 0.8 0 0.6 0 0 0 43.1 1.4 1.7 0
25th percentile 0 2.8 0 2.3 0 0.5 0.1 87.7 5.9 3.7 0.6
50th percentile 0 7.1 1.5 6.4 0 1.9 0.2 93.9 27.3 6.9 3.6
75th percentile 0.8 41.4 7 8.2 0 12.4 1.6 109.5 44.8 17.5 7.7
95th percentile 11.3 52.3 21.4 26.4 1.2 15.5 3.1 185 58 24.7 12
99th percentile 16.1 53.7 73.6 27.8 1.8 16.8 3.9 190.4 64.3 26 14
Child
ren’shan
dcontact
activities
Auyeung
etal.
442
Journal
ofExposure
Science
andEnvironm
entalEpidem
iology(2006)16(5)
‘‘Fabric’’ were higher indoors than outdoors because curtains
and sofas were more likely to be found indoors than
outdoors, while contact frequencies and hourly contact
durations with ‘‘Vegetation/Grass’’ were higher outdoors
because plants were more likely to be found outdoors
than indoors.
Table 7. Significant differences in outdoor contact frequencies and hourly contact durations between boys and girls for both hands combined
Gender Statistic Object/surface super-categories
Girls4boys
Frequency (contacts
per hour)
Hourly contact duration (minutes per hour)
Body (P¼ 0.007) Footwear
(P¼ 0.02)
Non-dietary objects/
surfaces (P¼ 0.03)
Total objects/surfaces
(P¼ 0.01)
Male Range 17–191.7 0–0.8 47.8–88.2 48.1–88.2
(n¼ 18) Mean 64.2 0.1 67.7 70.8
5th percentile 19.3 0 53.4 54.2
25th percentile 38.8 0 59.8 63.2
50th percentile 57.8 0 67.3 72.6
75th percentile 65.4 0.1 72.6 79.1
95th percentile 177.5 0.5 84.2 86.1
99th percentile 177.5 0.5 84.2 86.1
Female Range 28.4–146.1 0–5.6 42.6–101.7 42.6–102.2
(n¼ 20) Mean 84.3 0.8 77.6 82.2
5th percentile 44.6 0 51.2 57.9
25th percentile 63 0 68.7 72.6
50th percentile 88.6 0.2 79 85
75th percentile 99.4 0.8 90.8 93.4
95th percentile 126.1 4 98.9 101.3
99th percentile 126.1 4 98.9 101.3
Table 8. Significant differences in outdoor contact frequencies and hourly contact durations between the left and right hands
Hand Statistic Object/surface super-categories
Left4right Right4Left
Frequency (contacts
per hour)
Hourly contact duration
(minutes per hour)
Hourly contact duration (minutes per hour)
Clothes/towels
(P¼ 0.01)
Clothes/Towels
(P¼ 0.003)
Floor
(P¼ 0.04)
Toys
(P¼ 0.0002)
Vegetation/Grass
(P¼ 0.05)
Non-dietary
objects/surfaces
(P¼ 0.0001)
Total objects/
surfaces
(P¼ 0.0001)
Left Range 4–100.3 0.6–14 0–12.9 0–28.6 0–9 5.8–49 5.8–49.7
(n¼ 38) Mean 39.2 3.8 2.4 13.0 2.2 34.8 36.7
5th percentile 14.2 1 0.1 3.2 0 24.7 25.3
25th percentile 25.7 1.8 0.2 7.1 0.4 29.9 31.1
50th percentile 33.9 2.4 1.4 12.3 1 35 37.8
75th percentile 55.1 3.9 4 20.3 2.5 40.8 43.3
95th percentile 80.8 10.8 6.5 26.4 8.2 46.3 49.2
99th percentile 95.5 13.4 10.8 28.1 9 48.7 49.7
Right Range 5.8–98.8 0.5–12.3 0–7.5 0–41 0–14.7 25.2–52.7 25.2–53.1
(n¼ 38) Mean 34.5 3.0 1.6 16.8 2.9 38.1 40.1
5th percentile 10.1 0.5 0 4 0 28 28.9
25th percentile 21.8 1.4 0.2 9.5 0.8 31.8 35.3
50th percentile 30.7 2.1 1 16 1.5 38.2 40.8
75th percentile 43.6 3.5 2 23.6 4.2 42.8 45
95th percentile 63.3 7.7 5 30.6 8.9 49.7 50.6
99th percentile 91 11.4 7.2 37.4 13.1 51.8 52.5
Children’s hand contact activities Auyeung et al.
Journal of Exposure Science and Environmental Epidemiology (2006) 16(5) 443
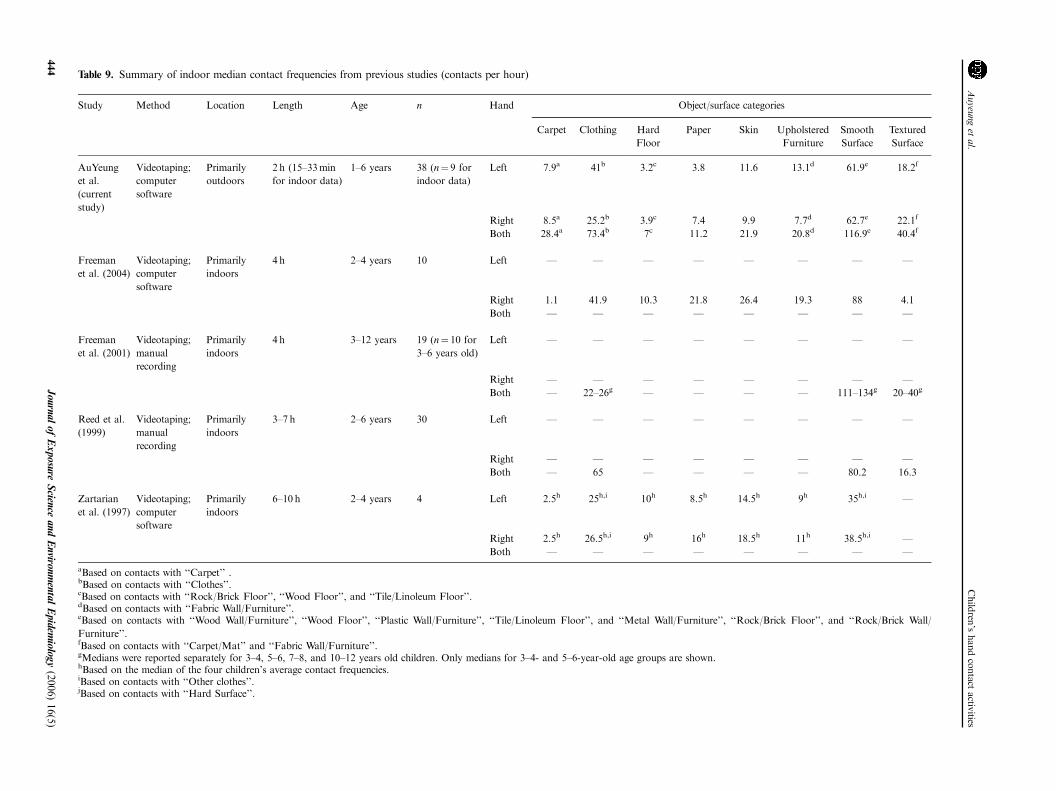
Table 9. Summary of indoor median contact frequencies from previous studies (contacts per hour)
Study Method Location Length Age n Hand Object/surface categories
Carpet Clothing Hard
Floor
Paper Skin Upholstered
Furniture
Smooth
Surface
Textured
Surface
AuYeung
et al.
(current
study)
Videotaping;
computer
software
Primarily
outdoors
2 h (15–33min
for indoor data)
1–6 years 38 (n¼ 9 for
indoor data)
Left 7.9a 41b 3.2c 3.8 11.6 13.1d 61.9e 18.2f
Right 8.5a 25.2b 3.9c 7.4 9.9 7.7d 62.7e 22.1f
Both 28.4a 73.4b 7c 11.2 21.9 20.8d 116.9e 40.4f
Freeman
et al. (2004)
Videotaping;
computer
software
Primarily
indoors
4 h 2–4 years 10 Left F F F F F F F F
Right 1.1 41.9 10.3 21.8 26.4 19.3 88 4.1
Both F F F F F F F F
Freeman
et al. (2001)
Videotaping;
manual
recording
Primarily
indoors
4 h 3–12 years 19 (n¼ 10 for
3–6 years old)
Left F F F F F F F F
Right F F F F F F F FBoth F 22–26g F F F F 111–134g 20–40g
Reed et al.
(1999)
Videotaping;
manual
recording
Primarily
indoors
3–7 h 2–6 years 30 Left F F F F F F F F
Right F F F F F F F FBoth F 65 F F F F 80.2 16.3
Zartarian
et al. (1997)
Videotaping;
computer
software
Primarily
indoors
6–10 h 2–4 years 4 Left 2.5h 25h,i 10h 8.5h 14.5h 9h 35h,i F
Right 2.5h 26.5h,i 9h 16h 18.5h 11h 38.5h,i FBoth F F F F F F F F
aBased on contacts with ‘‘Carpet’’ .bBased on contacts with ‘‘Clothes’’.cBased on contacts with ‘‘Rock/Brick Floor’’, ‘‘Wood Floor’’, and ‘‘Tile/Linoleum Floor’’.dBased on contacts with ‘‘Fabric Wall/Furniture’’.eBased on contacts with ‘‘Wood Wall/Furniture’’, ‘‘Wood Floor’’, ‘‘Plastic Wall/Furniture’’, ‘‘Tile/Linoleum Floor’’, and ‘‘Metal Wall/Furniture’’, ‘‘Rock/Brick Floor’’, and ‘‘Rock/Brick Wall/
Furniture’’.fBased on contacts with ‘‘Carpet/Mat’’ and ‘‘Fabric Wall/Furniture’’.gMedians were reported separately for 3–4, 5–6, 7–8, and 10–12 years old children. Only medians for 3–4- and 5–6-year-old age groups are shown.hBased on the median of the four children’s average contact frequencies.iBased on contacts with ‘‘Other clothes’’.jBased on contacts with ‘‘Hard Surface’’.
Child
ren’shan
dcontact
activities
Auyeung
etal.
444
Journal
ofExposure
Science
andEnvironm
entalEpidem
iology(2006)16(5)
The right hand was found to have longer hourly contact
durations with objects that are often manipulated with the
hand (i.e., ‘‘Toys’’). On the other hand, the left hand had
longer hourly contact durations with objects/surfaces that did
not need to be manipulated (e.g., ‘‘Clothes/Towels’’ and
‘‘Floor’’). An explanation for this is that even though the
left hand was not used as often as the right hand to
manipulate objects, this did not mean that the left hand
did not touch objects/surfaces. The left hands of the
children were often observed to rest on or touch objects/
surfaces such as a table, clothes, the floor, etc. Occasionally,
the left hand was involved with object manipulation as well
(e.g., carrying a big ball). It is important to study the two
hands separately because differences in contact behaviors
between the left and right hands may lead to differences in
contaminant loadings between the hands. This in turn may
affect estimations of non-dietary ingestion exposure from
hand-to-mouth contacts if young children preferentially
mouth one of their hands.
Comparisons with Previous StudiesTable 9 compares results from this study with results from
previous studies. As all previous studies focused on indoor
environments, only the indoor data from the nine children
who spent more than 15min in view indoors are presented in
the table. It is worth noting that due to a number of factors
such as differences in data collection methods, object/surface
categorizations, as well as the subpopulations studied (both
in terms of the ages of the children studied and the regions/
locations where these studies were conducted), it is difficult to
compare results from different studies.
Zartarian et al. (1997a) collected hand-to-surface contact
frequency and duration data in the Salinas Valley of
California by videotaping four children in a primarily indoor
home environment and then transcribing the videotapes with
the VirtualTimingDevicet software (previously known as
VideoTraq). Reed et al. (1999) videotaped a total of 30
children aged 2–6 years in either a day-care center or a
residence in New Brunswick, New Jersey. Hand-to-surface
contact frequencies were then collected by manually record-
ing the frequency over 5-min intervals. Freeman et al. (2001)
employed the same data collection method as Reed and
collected data from 19 children in the residential home
environment. Freeman et al. (2005) videotaped 10 children
for approximately 4 h each in a primarily indoor home
environment and translated the videotapes using the
VirtualTimingDevicet software.
Despite the fact that only nine children were included for
indoor data analysis, indoor results from this study seemed to
agree well with those from previous studies. Contact
frequencies calculated from this study were systematically
higher than those reported by Reed et al. (1999) and
Freeman et al. (2001), but systematically lower than those
reported by Freeman et al. (2005) (except for ‘‘Carpet’’ and
‘‘Textured Surface’’). A possible explanation for the lower
contact frequency reported by Freeman et al. (2005) for
‘‘Textured Surface’’ is that their ‘‘Textured Surface’’ category
did not include contacts with ‘‘Carpet’’ or ‘‘Upholstered
Furniture’’, while contacts with these objects/surfaces were
included as ‘‘Textured Surface’’ for this study as well as the
studies by Reed et al. (1999) and Freeman et al. (2001).
Flooring type may have contributed in part to differences in
contact frequencies with ‘‘Hard Floor’’ and ‘‘Carpet’’
between this study and the study conducted by Zartarian
et al. (1997a). That is, contact frequency with ‘‘Hard Floor’’
from this study is similar to contact frequency with ‘‘Carpet’’
reported by Zartarian et al. (1997a) and vice versa.
Future StudiesSince the children in this study were videotaped for only 2 h
each and they were told by their parents to play outdoors for
the duration of the videotaping session, their activities may
not be entirely representative of how children spend time
outdoors. However, the data collected from this study
provides a rough description of children’s hand-to-object/
surface contacts in outdoor residential environments. In a
future study, the videotapes of the 38 children will be
rewatched and descriptions of general play activities will be
added to the MLATS file. Then, the MLATS data will
reanalyzed on an activity-specific basis (e.g., playing on
playground structure, riding bicycle, gardening) to further
refine information on children’s hand-to-object/surface con-
tacts in outdoor residential environments.
ConclusionThe results of this study suggest that in outdoor residential
settings, young children have a large number (median
frequency is 4500 contacts/h for both hands combined) of
short contacts (o5 s) with objects/surfaces. Differences in
hand contact activities were found for all four factors studied:
age (in months), gender, left/right hands, and indoor/
outdoor environments. Besides providing an account of
factors that affect hand contact activities, this study may also
help improve outdoor exposure assessments by providing
detailed summaries of hand-to-object/surface microlevel
activity data collected from outdoor environments.
Acknowledgements
The authors specially thank Kelly Naylor, Nolan Cabrera,
Sandy Robertson, Kevin Lee, Amy Munninghoff, Veronica
Vieira, Jessica Ramirez, and Angela Lin for their invaluable
help in collecting the data presented in this paper. This
project was supported by EPA STAR grant #R82936201,
ORETF Study #ORF018, USEPA Contract #QT-RT-99-
001182, and UPS Foundation grant #2DDA103. This
research has not been subject to federal peer and policy
Children’s hand contact activities Auyeung et al.
Journal of Exposure Science and Environmental Epidemiology (2006) 16(5) 445
review and therefore does not necessarily reflect the views of
the funding agencies. No official endorsement should be
inferred.
References
AuYeung W., Canales R.A., Beamer P., Ferguson A., and Leckie J.O. Young
children’s mouthing behavior: an observational study via videotaping in a
primarily outdoor residential setting. J Children’s Health 2004: 2(3–4): 271–295.
Black K., Shalat S.L., Freeman N.C.G., Jimenez M., Donnelly K.C., and Calvin
J.A. Children’s mouthing and food-handling behavior in an agricultural
community on the US/Mexico border. J Expos Anal Environ Epidemiol 2005:
15(3): 244–251.
Canales R.A. The cumulative and aggregate simulation of exposure framework.
Ph.D. Thesis Dissertation, Stanford University, 2004.
Ferguson A.C. Estimating percutaneous absorption using micro-level activity time
series (MLATS). Ph.D. Thesis Dissertation, Stanford University, 2003.
Ferguson A.C., Canales R.A., Paloma B., AuYeung W., Key M., Munninghoff
A., Lee K.T., Robertson A., and Leckie J.O. Collecting children’s activity
patterns using videotaping and video-translation. J Expos Anal Environ
Epidemiol 2005 (advance online publication) October 12, 2005.
Freeman N.C.G., Hore P., Black K., JimenezM., Sheldon L., Tulve N., and Lioy P.J.
Contributions of children’s activities to pesticide hand loadings following residential
pesticide application. J Expos Anal Environ Epidemiol 2005: 15(1): 81–88.
Freeman N.C.G., Jimenez M., Reed K.J., Gurunathan S., Edwards R.D., and
Lioy P.J. Quantitative analysis of children’s micro activity patterns: The
Minnesota Children’s Pesticide Exposure Study. J Expos Anal Environ
Epidemiol 2001: 11(6): 501–509.
Reed K.J., Jimenez M., Freeman N.C., and Lioy P.J. Quantification of children’s
hand and mouthing activities through a videotaping methodology. J Expos
Anal Environ Epidemiol 1999: 9(5): 513–520.
Rice J. Mathematical Statistics and Data Analysis, 2nd edn. Wadsworth, Belmont,
CA, 1995.
Riley W.J., McKone T.E., and Cohen Hubal EA Estimating contaminant dose for
intermittent dermal contact: Model development, testing, and application.
Risk Anal 2004: 24(1): 73–85.
Timmer S.G., Eccles J., and O’Brien K. How children use time. In:
Juster F.T., and Stafford F.P. (Eds.). Times, Goods, and Well-Being. Survey
Research Center, Institute for Social Research. Survey Research
Center, Institute for Social Research, University of Michigan, Ann Arbor,
MI, 1985.
Tulve N.D., Suggs J.C., McCurdy T., Cohen Hubal E.A., and Moya J.
Frequency of mouthing behavior in young children. J Expos Anal Environ
Epidemiol 2002: 12(4): 259–264.
Zartarian V.G., Ferguson A.C., and Leckie J.O. Quantified dermal activity data
from a four-child pilot field study. J Expos Anal Environ Epidemiol 1997a:
7(4): 543–552.
Zartarian V.G., Ferguson A.C., Ong C.G., and Leckie J.O. Quantifying
videotaped activity patterns: Video translation software and training
methodologies. J Expos Anal Environ Epidemiol 1997b: 7(4): 535–542.
Zartarian V.G., and Leckie J.O. Dermal exposure: the missing link. Environ Sci
Technol 1998: 32(5): 134A–137A.
Zartarian V.G., Ozkaynak H., Burke J.M., Zufall M.J., Rigas M.L., and Furtaw
E.J. A modeling framework for estimating children’s residential exposure and
dose to chlorpyrifos via dermal residue contact and non-dietary ingestion.
Environ Health Perspect 2000: 108(6): 505–514.
Zartarian V.G. A physical-stochastic model for understanding dermal exposure to
chemicals. Ph.D. Thesis Dissertation, Stanford University, 1996.
Children’s hand contact activitiesAuyeung et al.
446 Journal of Exposure Science and Environmental Epidemiology (2006) 16(5)
Related Documents