1 You Are the Only Possible Oracle: Effective Test Selection for End Users of Interactive Machine Learning Systems Alex Groce[1], Todd Kulesza[1], Chaoqiang Zhang[1], Shalini Shamasunder[1], Margaret Burnett[1], Weng-Keen Wong[1], Simone Stumpf[2], Shubhomoy Das[1], Amber Shinsel[1], Forrest Bice[1], Kevin McIntosh[1] [1] School of Electrical Engineering and Computer Science Oregon State University Corvallis, Oregon 97331-3202 alex,kuleszto,zhangch,burnett,wong,[email protected] [email protected], [email protected], [email protected], [email protected] [2] Centre for HCI Design, School of Informatics City University London London EC1V 0HB, United Kingdom [email protected] Abstract—How do you test a program when only a single user, with no expertise in software testing, is able to determine if the program is performing correctly? Such programs are common today in the form of machine-learned classifiers. We consider the problem of testing this common kind of machine-generated program when the only oracle is an end user : e.g., only you can determine if your email is properly filed. We present test selection methods that provide very good failure rates even for small test suites, and show that these methods work in both large-scale random experiments using a “gold standard” and in studies with real users. Our methods are inexpensive and largely algorithm-independent. Key to our methods is an exploitation of properties of classifiers that is not possible in traditional software testing. Our results suggest that it is plausible for time-pressured end users to interactively detect failures—even very hard-to-find failures—without wading through a large number of successful (and thus less useful) tests. We additionally show that some methods are able to find the arguably most difficult-to-detect faults of classifiers: cases where machine learning algorithms have high confidence in an incorrect result. Index Terms—machine learning; end-user testing; test suite size; ✦ 1 I NTRODUCTION Machine learning powers a variety of interactive ap- plications, such as product recommenders that learn a user’s tastes based on their past purchases, “aging in place” systems that learn a user’s normal physical activity patterns and monitor for deviations, and in- terruptibility detectors on smart phones to decide if a particular incoming message should interrupt the user. In these settings, a machine learning algorithm takes as input a set of labeled training instances and produces as output a classifier. This classifier is the machine-generated output of a hand-written program, and is also a program in its own right. This machine-generated program, like a human- written program, produces outputs for inputs that are provided to it. For example, a classifier on a user’s smart phone might take an incoming message and the user’s history and personal calendar as inputs and output a reason to interrupt or not (“work-critical interruption”). Such classifiers, like other software artifacts, may be more or less reliable—raising the possibility that they are not reliable enough for their intended purposes. A classifier can mislabel an input (fail) even if the algorithm that generated the classifier is correctly implemented. Failures occur for a variety of reasons such as noise in the training data, overfitting due to a limited amount of training data, underfitting because the classifier’s decision boundaries are not expressive enough to correctly capture the concept to be learned, and sample selection bias, where training instances are biased towards inputs uncommonly seen in real- world usage. Further, many machine learning systems are interactive and continually learn from their users’ behavior. An interactive machine learning system may apply different output labels to the same input from one week to the next, based on how its user has recently interacted with the system. Therefore the problem of systematic, efficient, and

Welcome message from author
This document is posted to help you gain knowledge. Please leave a comment to let me know what you think about it! Share it to your friends and learn new things together.
Transcript

1
You Are the Only Possible Oracle:Effective Test Selection for End Users ofInteractive Machine Learning Systems
Alex Groce[1], Todd Kulesza[1], Chaoqiang Zhang[1], Shalini Shamasunder[1], Margaret Burnett[1],Weng-Keen Wong[1], Simone Stumpf[2], Shubhomoy Das[1], Amber Shinsel[1], Forrest Bice[1],
Kevin McIntosh[1][1] School of Electrical Engineering and Computer Science
Oregon State UniversityCorvallis, Oregon 97331-3202
alex,kuleszto,zhangch,burnett,wong,[email protected]@gmail.com, [email protected], [email protected], [email protected]
[2] Centre for HCI Design, School of InformaticsCity University London
London EC1V 0HB, United [email protected]
Abstract—How do you test a program when only a single user, with no expertise in software testing, is able to determine if theprogram is performing correctly? Such programs are common today in the form of machine-learned classifiers. We consider theproblem of testing this common kind of machine-generated program when the only oracle is an end user : e.g., only you candetermine if your email is properly filed. We present test selection methods that provide very good failure rates even for small testsuites, and show that these methods work in both large-scale random experiments using a “gold standard” and in studies withreal users. Our methods are inexpensive and largely algorithm-independent. Key to our methods is an exploitation of propertiesof classifiers that is not possible in traditional software testing. Our results suggest that it is plausible for time-pressured endusers to interactively detect failures—even very hard-to-find failures—without wading through a large number of successful (andthus less useful) tests. We additionally show that some methods are able to find the arguably most difficult-to-detect faults ofclassifiers: cases where machine learning algorithms have high confidence in an incorrect result.
Index Terms—machine learning; end-user testing; test suite size;
F
1 INTRODUCTION
Machine learning powers a variety of interactive ap-plications, such as product recommenders that learna user’s tastes based on their past purchases, “agingin place” systems that learn a user’s normal physicalactivity patterns and monitor for deviations, and in-terruptibility detectors on smart phones to decide ifa particular incoming message should interrupt theuser. In these settings, a machine learning algorithmtakes as input a set of labeled training instances andproduces as output a classifier. This classifier is themachine-generated output of a hand-written program,and is also a program in its own right.
This machine-generated program, like a human-written program, produces outputs for inputs that areprovided to it. For example, a classifier on a user’ssmart phone might take an incoming message andthe user’s history and personal calendar as inputsand output a reason to interrupt or not (“work-critical
interruption”). Such classifiers, like other softwareartifacts, may be more or less reliable—raising thepossibility that they are not reliable enough for theirintended purposes.
A classifier can mislabel an input (fail) even ifthe algorithm that generated the classifier is correctlyimplemented. Failures occur for a variety of reasonssuch as noise in the training data, overfitting due to alimited amount of training data, underfitting becausethe classifier’s decision boundaries are not expressiveenough to correctly capture the concept to be learned,and sample selection bias, where training instancesare biased towards inputs uncommonly seen in real-world usage. Further, many machine learning systemsare interactive and continually learn from their users’behavior. An interactive machine learning system mayapply different output labels to the same input fromone week to the next, based on how its user hasrecently interacted with the system.
Therefore the problem of systematic, efficient, and

2
effective testing of classifiers arises. That classifiers arecreated indirectly by another program, rather thandirectly by humans, does not obviate the need fortesting, or remove the problem from the domain ofsoftware testing, but does affect who is in a positionto test the system. Deployed classifiers can often betested only by end users—sometimes, in fact, by onlyone end user. For example, only you know whichmessages should interrupt you during a particularactivity. Unfortunately, this means that for many clas-sifiers a unique situation arises: no individual withsoftware development knowledge, or even a rudimen-tary understanding of testing, is in a position to testthe system.
Given this problem, two issues arise: how to au-tomatically choose “good” test cases, and how tointeract with end users while testing. This paperpresents underlying algorithms for test case selectionand data about how these methods perform, both ex-perimentally (by comparison with statistical samplingand hypothetical end user methods), and empiricallywith actual end users in a prototype interface (Figure1). This paper adopts the distinction between experi-mental and empirical results described by Harman et al.[24], and considers large-scale automated evaluationswith benchmark data to be synthetic experiments andresults with users and a concrete implementation andinterface to be more empirical in nature (though alsocontrolled experiments in a laboratory setting).
End-user testing of machine-generated classifiers isdifferent from both machine learning’s “active learn-ing” (see Figure 2) [53] and from conventional soft-ware testing. The three main differences are depictedin Figure 2: (1) with active learning, the classifierinitiates the process, whereas with end-user testing,the user initiates the process; (2) with active learning,
Fig. 1. A user interface to allow end users to test aclassifier [32]. This classifier takes a message (input)and produces a topic label (output). The pie chartdepicts the classifier’s confidence that the messagebelongs in the red category (Cars), the blue category(Motorcycles), etc. A user can mark any message’stopic label as right or wrong; these marked messagesare the test cases.
Active Learning Classifier Testing
Fig. 2. Active learning vs. classifier testing. The meth-ods differ in 1) whether the classifier or the user drivesinteraction, 2) the aim of instance selection (maxi-mize learning or maximize bug-detection) and 3) theoutcome of the process (a better classifier, or userknowledge of classifier quality).
learning is being optimized, whereas with end-usertesting, failure detection is being optimized; and (3)with active learning, the intended outcome is a betterclassifier, whereas with end-user testing, the intendedoutcome is better user insight into where the classifierworks correctly and where it does not.
End-user testing of classifiers also differs from con-ventional software testing: end users’ expertise at,and patience for, testing are likely lower than withprofessional programmers. Moreover, the software be-ing tested is different than conventional software inimportant ways, such as the structure of its (machine-generated) “source code” and the context in which itresides. Although these differences present challenges,they also provide opportunities unusual in testing(e.g., classifiers are often able to predict their ownaccuracy). We discuss the implications of these dif-ferences in detail in the next sections.
While the focus of this paper is on traditional end-user testing, where users are assumed to lack softwareengineering skills, the problem of testing with humanoracles is also relevant to the enterprise of softwareengineering itself. Recently, in work including infor-mation retrieval-based bug localization [50] and testgeneration [22], [25], the use of artificial intelligenceand machine learning (ML) techniques has becomea popular research topic, and a major aspect of en-deavors to deal with increasing software complexity[23]. For example, fuzzer taming or bug clustering[11], [16] uses ML algorithms for ranking, clustering,and classification to decide when test cases result fromthe same underlying fault. Unfortunately, debuggingsuch tamers is not currently addressed, due to thedifficulty of letting software devevelopers test anddebug when each “test case” is a query of the form:“do these two test cases expose the same underlyingfault?”, a question which requires human expertiseand considerable effort to answer. While users of “ML

3
for SE” (Machine Learning for Software Engineering)systems are obviously far more expert at softwaredevelopment and testing than traditional end-users,they are still unlikely to be machine learning expertsor have the patience or time to serve as oracles for alarge set of test cases [52]. The methods introduced inthis paper are therefore potentially important to thefuture of software engineering itself.
This paper encapsulates our previous work, whichintroduced a user interface (WYSIWYT/ML) [32] tosupport end users testing classifiers, and makes thefollowing additional contributions:
• Formally frames a test selection problem.• Proposes and formally defines three test selection
methods for this domain.• Proposes a methodology for experimentally eval-
uating classifier testing methods for humans as afiltering process before costly user studies.
• Investigates our test selection methods in large-scale automated experiments, over a larger vari-ety of benchmarks than possible with humans
• Evaluates which found failures are unexpected,making them both especially challenging andimportant to detect, a problem difficult to explorein human studies.
Our experimental results show that our best testselection methods can produce very small test suites(5-25 instances) in which 80% of test cases fail (andthus expose faults), even when the tested classifier is80% accurate. Our best methods find at least threetimes as many failures as random testing. Further,our results indicate that the high efficiency of our testmethods is not attributable to finding many redun-dant failures identifying the same fault. Two of ourmethods are even able to find “surprise failures”, inwhich a classifier fails despite having high confidencein its results. These methods also produce effectiveincreases in the ability of end users to test a classifierin a short amount of time, with the ranking of meth-ods in basic agreement with our experimental results,suggesting that the experimental methods may bevalid for exploring other approaches to the problem.
2 PROBLEM DEFINITION
We first define the notion of end-user testing formachine-learned classifiers, loosely following the ap-proach taken by Rothermel et al. for end-user testingof spreadsheets [48].
The program to be tested is a classifier C, a black boxfunction i→ `, where i ∈ I , the set of input instances,and ` ∈ L, the set of all labels1. Classifiers decomposethe instances in I into features (e.g., text strings suchas words) in a multi-dimensional space. A test case forclassifier C is a tuple (i, `), where i ∈ I is the input (in
1. If we modify C (e.g., retrain) we consider it a new programC′ and assume no relationship between tests for C and C′.
this paper, a text message) and ` ∈ L is the label thatclassifier C assigns to i. A test is an explicit decisionby the user that `’s value is correct or incorrect for i.A failure of C is any test for which the user indicatesthat the label is incorrect.
2.1 The Test Selection ProblemTwo common approaches to testing are test casegeneration and test selection. Test case generation(an algorithm producing inputs to test) is necessarywhen the creation of complex inputs (e.g., sequencesof method calls) is required. In our setting, however,numerous inputs are often readily available: end usersoften have a large set of unlabeled instances in Iavailable for testing, e.g., the set of all unfiled emailsin an inbox. Unlabeled instances can be converted totest cases simply by applying C to i to produce `.Therefore, the problem is usually one of selecting testcases to execute from a finite set of existing potentialtest cases. The expected use case of test selectionis in an interface that brings to the user’s attentioninstances to test, whether in a stand-alone interface,or in the context of a “host” interface, e.g., messagesin an email client.
2.2 What Is a Fault?The IEEE Standard [1] defines a fault to be “an in-correct step, process, or data definition in a computerprogram.” This definition clearly applies to classifiersthat mislabel outputs: from the user’s view, it hasmade a mistake. However, most of the literatureassumes that a fault has a program location and socan be localized and fixed. This assumption is not soobviously true for a classifier, since faults are oftentied to the training data itself, rather than to the linesof code that process training data.
Therefore the notion of a fault, if we require thatit can be somehow localized and corrected, must begeneralized—it must be parametrized with respect tothe fault-correction method(s) available to the user.Users are not usually allowed to directly change code,but they are often allowed to add or relabel trainingdata, after which a new classifier is automaticallygenerated (e.g., marking SPAM in an inbox). In thesecircumstances, a fault does not need to be localized toan area of code or training data—it is corrected simplyby providing “enough” new training data. (This caseis the primary target of active learning.) However,other fault-correction methods for classifiers are alsopossible. Some emerging approaches allow users to“debug” a classifier by pointing out features thatare particularly important, by adding new featuresto the classifier’s feature set, or evaluating multiplemodels that emphasize different features [15], [30],[33], [60]. In such cases, a fault could be localized toa feature that is missing or weighted too low, andfixed by adding the feature or weighting it more

4
heavily. Another approach is to allow users to addexplicit rules to a classifier, such as with whitelists inspam identification—thus a fault can be localized toa missing or incorrect rule.
Thus, the definition of a “localizable” fault dependson the correction method: in traditional software test-ing, it is missing or incorrect code, while in classifiersit can be missing or incorrect training set data, featurelabels, or rules, depending on the available debuggingmethods. Since the test selection methods in this paperare agnostic to the fault-correction method parameter,they do not attempt to localize the faults they reveal,but focus solely on detecting failures.
For simplicity, we will consider all failed test casesto be of equal cost. In some applications, such as insurveillance, false positives have a different cost thanfalse negatives. We plan to incorporate these costs intoour analysis in future work.
3 SOLUTION REQUIREMENTS
Because the problem of end users testing the clas-sifiers they have interactively customized has notbeen addressed in the literature, we offer a set ofrequirements for viability in this domain, used toformulate an evaluation process for candidate testselection methods.
3.1 Requirements for ViabilityEnd-user testing of classifiers has a number of dif-ferences from conventional software testing. In thissection, we discuss how three of these differencesimpose non-traditional requirements.
The first difference is the nature of the software (aclassifier) itself. Traditional code coverage approachesto testing are unsatisfying because a classifier’s “code”contains only a small portion of the classifier’s logic:the behavior is generally driven by parameters (data)derived from the training set. Further, improved al-gorithms and underlying mathematical bases are fre-quently introduced; thus, even if a “code+data” cover-age approach could be customized for one algorithmicapproach (e.g., decision trees), it would be likelyto be completely unsuited to another (e.g., supportvector machines). These issues suggest an algorithm-independent approach: Requirement: A testing methodfor a classifier should be agnostic to the machine learningalgorithm that performs the classification.
Second, the software infrastructure hosting an enduser’s classifier is usually highly interactive, pro-viding immediate feedback even if the classifierchanges—e.g., a spam filter may change every timenew email arrives, and classify spam slightly dif-ferently from one moment to the next. Hence thefollowing: Requirement: The testing method must be fastenough to run in the interactive environment the user isaccustomed to using (e.g., if the classifier sorts email,then the testing method would run in an email client).
Third, the end-user-as-oracle situation points out acrucial limitation: the user’s patience, and thus thenumber of test cases that users will be willing to judgein testing the classifier. Prior work with spreadsheetusers’ testing practices suggests that end users arewilling to judge only a small number of test cases,perhaps fewer than 10. Panko explains this low rateby pointing out that low levels of testing can be self-reinforcing [45]: by not carefully testing, users canperceive benefits by saving time and avoiding onerouswork. Further, when they do catch errors informally,these errors can further convince users of their efficacyin error correction without the need for more rigor.Even scientific users are unlikely to find testing morethan a few tens of instances a worthwhile use of theirtime [52]. Therefore, we impose: Requirement: Effectivefailure detection must be achieved with a small test suite,one or more orders of magnitude smaller than in regulartesting practice.
This third requirement has an interesting nuancebecause, as with human-created software systems, itis not the case that all failures (and faults) are equallyimportant. In more traditional software developmentefforts, “bug triage” can be a problem, both in the de-velopment of tests (in order to focus on finding criticalfaults) and after failures are found. With classifiers,where it is expected that even the highest quality clas-sifiers will sometimes fail to correctly classify someinstances, this is perhaps an even more importantaspect of the testing.
To see why, consider the following. Although mostclassifiers “know” when they lack enough informa-tion to be certain of the label for an instance—a traitwe use to our advantage in our test selection methods,as discussed in the next section—this ability to self re-flect may sometimes be misleading. A classifier mightcorrectly point out a possible failure when the proba-bility assigned to the chosen label is low (perhaps dueto a lack of training data similar to that instance, orambiguity between two classes). However, a classifiermay also have misplaced confidence in output labelsthat are wrong. Cases in which the classifier hashigh confidence in an incorrect labeling ` may beof particular importance in testing; they may be theprime targets for hand debugging [60], or reveal largerproblems with the training set or with assumptionsmade by the classifier. These failures are a surprisegiven the classifier’s high confidence—hence we callthem surprise failures.
To satisfy the requirements for algorithm agnosti-cism and low computational cost, we applied bothrequirements when identifying candidate test selec-tion methods. We then empirically investigated thesemethods’ ability to satisfy the third requirement, fail-ure detection efficiency.

5
3.2 Research QuestionsOur overall research question is simple: “How do youfind the most failures made by a classifier while exam-ining the fewest outputs?”. We explored this questionin two parts—first via an experimental study using awide range of classifiers, data sets, and test set sizes,and then via an empirical user study to discover if thesame experimental findings hold when we introduceend users into the loop. These two objectives werebroken down into seven research questions:
• RQ1 (Efficiency): Which proposed testing meth-ods produce effective test suites for a user?
• RQ2 (Accuracy variation): Does test method ef-fectiveness vary with classifier accuracy? (i.e., Dowe need different testing methods for accurate vs.inaccurate classifiers?)
• RQ3 (Algorithm variation): Do the most effectivetest methods generalize across multiple learningalgorithms and data sets?
• RQ4 (Surprise failure detection): Are “surprisefailures” (failures that the learning algorithm wasconfident were correct) identified by the same testmethods used to identify non-surprise failures, orare different test methods required for this classof failures?
• RQ5 (User Efficacy): Will end users, when pro-vided with efficient testing methods, find morefailures than via ad hoc testing?
• RQ6 (User Efficiency): Can a test coverage mea-sure help end users to test more efficiently thanad hoc testing?
• RQ7 (User Satisfaction): What are end users’attitudes toward systematic testing as comparedto ad hoc testing?
4 TEST SELECTION AND COVERAGE METH-ODS
Our methods include both test case prioritizations [14]and coverage metrics. A prioritization strategy, givena set of test cases, orders them according to somecriterion. We can then select a test suite of size nby taking the top n ranked test cases. Thus, evenif users do not evaluate the full suite, they are atleast testing the items with the highest priority (wherepriority depends on the purpose of the test suite,e.g., finding common failures, or finding surprisingfailures). A coverage measure evaluates a test suitebased on some measure: e.g., branches taken, partitionelements input, or mutants killed.
The first three test case selection methods wedescribe, CONFIDENCE, COS-DIST, and LEAST-RELEVANT, are the methods we had reason topropose (pre-evaluation) as potential candidates foractual use. In addition, we describe three “base-line” methods, MOST-RELEVANT, CANONICAL,and RANDOM, to provide a context for understand-ing the performance of the proposed methods. We also
propose a test coverage metric based upon the COS-DIST selection method.
Our general problem statement makes no assump-tions on the structure of instances i, labels `, or classi-fiers C, but our methods assume that it is possible tomeasure a distance (measure of similarity) betweentwo instances, d(i1, i2) and that a classifier can pro-duce, in addition to a labeling for an instance, aconfidence (estimated probability that a label is correct),so that a test case becomes a tuple (i, `, p), where pis the classifier’s estimate of P (` correct for i). Wealso assume that we can compute information gain onfeatures. These requirements generally hold for mostcommonly used classification algorithms.
4.1 Determining Test CoverageOur proposed method for determining test cover-age of a machine-generated classifier is rooted inthe notion of similarity. Because classifiers attempt tocategorize similar inputs together (where “similar”is defined by the specific features the classifier usesfor categorization), inputs that are similar to manyitems in the training set are likely to be correctly cat-egorized. Conversely, inputs that are unlike anythingin the training set are likely to pose a problem forthe classifier—it may not know how to categorizesuch items because it has never seen anything likethem before. Once a user had indicated that an inputwas correctly classified, it may be possible to assumethat sufficiently similar inputs will also be correctlyclassified.
Thus, we propose that test coverage in this domainis a function of how similar each test case is to theuntested inputs. For example, take a classifier that hasmade 10 predictions, nine of which involve inputs thatare very similar to one another (and are all predictedto have Label A), and one input which is unlike anyof the others (and is predicted to have Label B). Ifa user were to test any one of the first nine inputsand found it to be correct, we can hypothesize thatthe remaining eight are also correct—the classifieris likely using the same reasoning to classify all ofthem. However, this tells us nothing about the tenthinput, because its categorization may be informed bydifferent reasoning within the classifier (e.g., rulesgeneralized from different training instances). Thus,our user’s test coverage would be 90%. Conversely, ifshe tested only the tenth item, her test coverage wouldbe 10%. Via this metric, a user would need to test atleast one item from each cluster of similar items toachieve 100% test coverage.
An additional wrinkle in our test coverage metricis that perhaps the classifier has assigned differentoutput labels to inputs that our distance measureconsiders sufficiently similar. To return to the exampleabove, consider that eight of the nine similar inputswere categorized as Label A, but the ninth was cate-gorized as Label B. If the user indicates that Label B

6
is incorrect for the ninth item, it does not necessarilytell us anything about the other eight inputs. Thus,we propose that for a user’s test of input i1 to alsocover input i2, i1 and i2 must be sufficiently similar(as defined by some distance measure d(i1, i2)) andshare the same output label `.
4.2 Proposed Test Selection Methods
CONFIDENCE Prioritization:From a software testing perspective, CONFI-
DENCE, a method based on prioritizing test cases inascending order of p in (i, `, p) (such that cases wherethe label has the lowest probability are tested first),is analogous to asking the software’s original pro-grammer to prioritize testing code most likely to fail—but in our case, the “programmer” is also software.Thus, the CONFIDENCE approach is a prioritizationmethod that capitalizes on the ability of classifiers to“find their own bugs” by selecting cases where theyhave low confidence.
Confidence can be measured in a variety of ways.We compute confidence as the magnitude of theprobability assigned to the most likely labeling, andprioritize test cases according to those with the lowestprobabilities2. CONFIDENCE selects ambiguous testinstances—instances that fall on or close to decisionboundaries. Most machine learning algorithms cancompute this measure of confidence in some form;most commonly, it is the conditional probability ofthe label ` given the instance i’s features.
Thus, CONFIDENCE largely satisfies the require-ment that methods be algorithm-agnostic (Section 3.1).Computing confidence is also computationally inex-pensive, as it is “built-in” to most classifiers. However,this prioritization method also requires time at leastlinear in the size of the test instance universe; thiscan be reduced in the case of unusually large sets byrandom sampling.
Despite the apparently high potential of thismethod, one problem with this approach concerns thequality of confidence estimates. For example, can clas-sifiers with low accuracy evaluate their own spheresof competence? Even highly accurate classifiers maynot have well-calibrated confidence measures. A sec-ond problem is that the CONFIDENCE method will—almost by definition—fail to find surprise failures.
COS-DIST Prioritization:COS-DIST prioritizes tests in descending order of
their average cosine distance d(i, t) to all members t
2. We also evaluated a similar prioritization based on uncertaintysampling, but omit the results as this method generally performedslightly worse than CONFIDENCE.
of the training set3. Instances most distant from thetraining set are tested first. From a software testingperspective, COS-DIST is analogous to prioritizingtest cases that might fail because they are “unusual”.The underlying assumption is that test cases mostunlike the training set are likely to fail.
In principle, the idea of prioritizing test cases basedon distance could apply to many software systems.What is unusual is (1) the existence of the trainingset, to provide a baseline notion of “typical” casesfor which the software is expected not to fail, and (2)a continuity and statistically based form of behaviorthat gives us hope that simple, easily computabledistance metrics on inputs will be relevant to behavior.In more typical testing, computing useful distancesbetween test cases is problematic: two API calls mayinvoke very different software behavior despite dif-fering only slightly.
This testing method is clearly algorithm-agnostic,since it rests solely on the contents of the training set.Computing distances between large training sets andlarge test sets takes time proportional to the productof the sizes of the sets, but as with CONFIDENCE,random sampling can be used for approximate results.
Regarding our third requirement (effective failuredetection with small test suites), COS-DIST avoidstwo of the potential shortfalls of CONFIDENCE be-cause it does not use a classifier’s opinion of itsown competence. However, this method shares withCONFIDENCE the potential problem that focusing onfinding likely-to-fail test cases seems unlikely to revealsurprise failures.
LEAST-RELEVANT Prioritization:The two methods above are potentially heavily bi-
ased against surprise failures. The LEAST-RELEVANTmethod attempts to solve that problem. From a soft-ware testing perspective, LEAST-RELEVANT is analo-gous to selecting test cases that might fail because theydon’t take any of the most common paths through thecode. Its key motivation is the premise that failuremay be more likely for instances lacking the “mostimportant” features.
Suppose an enumeration is available of the k fea-tures (e.g., words in the input documents) most rel-evant to making classifications. In our experiments,we use information gain (over the entire universeof instances) to measure feature relevance; anotherpossibility is for the user to tell the classifier whichfeatures are most relevant [35]. Given this set, LEAST-RELEVANT ranks a test case (i, `) by the absence ofthese key features in the instance (fewer key featuresresults in higher prioritization). Because the set may
3. Cosine distance, commonly used in information retrieval sys-tems [5], is based on the cosines of angles between points in a mul-tidimensional feature space based on co-occurrences of features—in our case, words in documents. We also investigated a distance-metric prioritization approach using Euclidean distance rather thancosine distance, which gave almost identical results.

7
be user-provided, we have limited our results to con-sidering k=20 features. In a sense, LEAST-RELEVANTshares the same goals as COS-DIST, but hopes toavoid over-selecting for outlier instances by using acoarse binary distinction, balancing failure detectionwith the ability to find surprise failures.
LEAST-RELEVANT is agnostic to the underlyingmachine learning algorithm, but may become imprac-tical for classification problems with a small numberof features. In such a case, it may be more usefulto prioritize tests based on a lack of discriminativefeature values (e.g., a scalar feature may be discrim-inative if its value is less than 10, but ambiguousotherwise) rather than a lack of discriminative fea-tures themselves. LEAST-RELEVANT also features acomputation cost proportional to the test suite size.
Regarding the third requirement, identifying fail-ures with an extremely small test set, our premiseis that the degree to which an input lacks relevantfeatures may correlate with its chance of failure. Forsurprise failures, we predict that LEAST-RELEVANTwill be less biased against surprise failures thanconfidence-based and distance-based methods.
4.3 Baseline Test Selection MethodsTo experimentally evaluate our proposed testingmethods, we needed baseline methods that might beintuitively attractive to end users in the absence ofmore systematic prioritizations. In evaluations withactual users, user behavior in the absence of assistanceserved as a true baseline.
MOST-RELEVANT Coverage:The MOST-RELEVANT coverage metric (the in-
verse of LEAST-RELEVANT) is based on the notion of“covering” features that are most relevant to classifica-tion. We include it because users might want to focuson features that matter most to them. In traditionalsoftware testing terms, this seems somewhat analo-gous to testing “usual” cases. Ranking is determinedas in LEAST-RELEVANT, but increases with presenceof the most relevant features, rather than with theirabsence.
CANONICAL Prioritization:If attempting to test “systematically” without guid-
ance from a testing system, a user might test anarchetypal example (or examples) for each label. Wesimulate this notion of canonicity by grouping in-stances according to their true label and then calcu-lating the centroid of each set. For each set, we takethe instances closest to the centroid as canonical. Wetest canonical instances for each class in proportionto the appearances of that class (classes with manyinstances contribute more instances). In traditionaltesting terms, this method is similar to choosing testcases for each specification of desired output.
RANDOM:
RANDOM testing is potentially a competitive base-line method. Although once considered to be some-thing of a strawman, in recent years the effectivenessof random testing has been shown to be competi-tive with more systematic methods when it can beapplied to software testing [3]. Further, its statisticalheritage is an excellent match for the statistical natureof classifiers, suggesting special suitability to thisdomain. Even if we expect systematic methods toimprove on random testing in terms of effectiveness,random testing lacks the dangerous potential biasagainst finding surprise failures that is a disadvantagefor our proposed methods above. Random testing is(statistically) guaranteed to find such failures at a rateroughly equivalent to their actual prevalence.
5 EXPERIMENTAL EVALUATION
5.1 Methodology5.1.1 Procedures and DataWe evaluated our test selection methods over classi-fiers based on randomly chosen training sets rangingfrom 100 to 2,000 instances, in increments of 100.For each training set size, we generated 20 trainingsets and produced classifiers for each training set,reserving all items not used in training as potentialtest case instances; thus I is the set of all data setinstances not used to train C, the classifier to betested. Varying training set size is an indirect methodof controlling classifier accuracy; larger training setsusually produce more accurate classifiers. Finally, weapplied each test selection method to each classifier,selecting test cases from I , for test suite sizes rangingfrom 5 to 25 instances, in increments of 5 (recall ourrequirement of very small test suites). For LEAST-RELEVANT, MOST-RELEVANT, and RANDOM, wegenerated five test suites for each training set (LEASTand MOST relevant result in many ranking ties, whichwe settled randomly). For more fine-grained priority-based methods, we needed only one test suite foreach training set, as the results were deterministic. Theoriginal labeled data sets served as test oracles: ` wascorrect when it matched the label for i in the originaldata set.
To produce multiple classifiers C to test, we traineda Naive Bayes (NB) classifier [40] and a SupportVector Machine (SVM) [12] on each training set. Thesetwo types of classifiers were chosen because they arecommonly used machine learning algorithms for textdata. We used the Mallet framework [41] and LIBSVM[8] to produce classifiers and to perform distance,information gain, and confidence calculations. ForSVM classifiers, confidence is computed based on thesecond method proposed by Wu et al. [61], the defaultapproach in LIBSVM.
The data sets we used to create the training setsand test suites are widely studied in the machinelearning literature on text classification. These sets

8
were: “20 Newsgroups” [36], “Reuters-21578” [4], andthe “Enron data set” [55]. For 20 Newsgroups data weused the set which contains 11,293 newsgroup docu-ments divided into 20 categories. The Reuters dataset contains 5,485 news stories, labeled by subject; weused only the 8 most common categories. The Enronset (for user farmer) consists of 3,672 emails dividedinto 25 categories.
5.1.2 Evaluation MeasuresTo answer Research Questions 1–3, we report eachmethod’s efficiency: the number of failures divided bythe total number of tests.
To answer Research Question 4, (determining whichmethods are most likely to find the most surprisingfailures), we use a sliding surprise threshold to re-port each method’s detection of incorrect results inwhich the classifier’s confidence exceeded a certainthreshold. The sliding threshold avoids an arbitrarychoice, allowing us to consider all values above 0.5to be potential definitions of the “surprise” level.(Below 0.5, the classifier is saying it has at least a50/50 chance of being wrong—hardly constituting asurprising failure.)
5.2 Results5.2.1 Testing EfficiencyOur three proposed testing methods were all sig-nificantly more efficient than RANDOM in all ex-perimental configurations. (We show only RANDOMin comparison to our proposed methods, as it out-performed the other baseline methods.) The CONFI-DENCE method performed best in five of the six con-figurations, with COS-DIST second best in those five.(CONFIDENCE and COS-DIST switched places in thesixth configuration.) LEAST-RELEVANT showed theleast improvement over the RANDOM baseline. Fig-ure 3 graphs these differences: the efficiencies shownare averages of rates over all suites (whose sizesranged from 5 to 25 test cases) and all classifiers ateach training set size. For all but the smallest trainingsets (200–500 instances), differences between all pairsof methods, except where data points coincide, aresignificant at the 95% confidence level.4 Figure 3(g)shows 95% confidence intervals at three training setsizes of Figure 3(a)’s configuration5.
As the Figure 3 illustrates, the best methods werevery efficient at identifying failures. For example,consider the RANDOM line in Figure 3(c). RANDOMis statistically guaranteed to detect failures at the ratethey occur, and thus is also a statistical representativeof the classifier’s accuracy. This indicator shows that
4. Confidence intervals were computed over all runs for eachtraining set size, in standard statistical practice [59].
5. Other sizes were similar but omitted for readability; some ofthe intervals are so tight that they are almost occluded by the datapoints.
0 1000 20000.0
0.5
1.0
(a: SVM-20NG)
Fai
lure
s /
Tes
t C
ases
0 1000 20000.0
0.5
1.0
(b: NB-20NG)
0 1000 20000.0
0.5
1.0
(c: SVM-R8)
Fai
lure
s /
Tes
t C
ases
0 1000 20000.0
0.5
1.0
(d: NB-R8)
0 1000 20000.0
0.5
1.0
(e: SVM-Enron)
Fai
lure
s /
Tes
t C
ases
0 1000 20000.0
0.5
1.0
(f: NB-Enron)
0 1000 20000.0
0.5
1.0
(g: SVM-20NG-C.I.)
Fai
lure
s /
Tes
t C
ases
0 100020000.0
0.5
1.0
CONFIDENCE
COS-DIST
LEAST-RELEVANT
RANDOM
Training Set Size (controls accuracy)
Fig. 3. Failure detection effectiveness in different clas-sifiers: All three methods outperformed RANDOM, withCONFIDENCE usually in the lead except for (f). (a-b):20 Newsgroups by SVM (a) and Naive Bayes (b). (c-d): Reuters by SVM and Naive Bayes. (e-f): Enron bySVM and Naive Bayes. (g): SVM-20NG’s confidenceintervals at three training set sizes (200, 1000, and2000).
the Reuters SVM classifier was extremely accuratewhen trained on 2,000 instances (the rightmost pointon the x-axis), with a failure rate of only 3.5%. Evengiven this extremely accurate classifier, 63% of theCONFIDENCE-generated test cases detected failures.
Classifiers with reasonably high accuracy posethe most interesting testing challenge—any approachmight find failures in programs that are “riddledwith bugs”. An accuracy of about 80-90% is con-sidered reasonably good for most machine learningalgorithms on the datasets we use in this paper (e.g.,[28]). The performance of CONFIDENCE held up to

9
this challenge—it performed almost as well with veryaccurate classifiers (rightmost x-values in Figure 3) aswith very inaccurate classifiers (leftmost x-values).
The data sets and algorithms across these experi-ments cover three very different situations classifiersface. The 20 Newsgroups data set (Figure 3(a-b)) pro-duced classifiers challenged by ambiguity, due largelyto the “Miscellaneous” newsgroups. The Reuters dataset (Figure 3(c-d)), with only a few classes, producedclassifiers under a nearly ideal setting with many sam-ples from each class. The Enron configuration (Figure3(e-f)) produced classifiers challenged by the problemof class imbalance, with folders ranging in size fromabout 10 to over 1,000. Despite these differences, theranks of the methods were identical except for theCONFIDENCE/COS-DIST swap in Figure 3(f).
In contrast to the three proposed methods, themethods we believe match what users might “in-tuitively” do (CANONICAL and MOST-RELEVANT)did not usually perform better than RANDOM (Fig-ure 4), and sometimes performed significantly worse.The reason for this inefficiency is that the “most typ-ical” instances and those containing the most usefulkeywords for classification are precisely the instanceseven poor classifiers are most likely to label correctly.Thus, the “intuitive” methods cannot fulfill our thirdrequirement.
In these experiments, differences in size of our smalltest suites (5 vs. 10 vs. ... 25 test cases) rarely seemedto matter; thus we do not provide data for each sizebecause the results were so similar. The two highestperforming methods (CONFIDENCE and COS-DIST)did show a mild degradation in efficiency as suitesize increased, further evidence of the effectivenessof prioritization in those two methods.
By the standards of the software testing literature,where popular methods such as branch coverageare only weakly correlated with fault detection [17],[18], all three are effective testing methods, especiallyCONFIDENCE and COS-DIST. In software testing,strategies strongly correlated with suite effectiveness(independent of suite size) tend to be very expensiveto evaluate and less useful as test generation or selec-tion methods (e.g., mutation testing or all-uses testing[18]). In contrast, our approaches are computationallyinexpensive and effective for selecting even very smalltest suites.
5.2.2 Surprise Failures
Identifying surprise failures—cases in which the clas-sifier is confident in its erroneous labeling—causedthe relative order of our methods’ performance tochange. Figure 5 illustrates how methods run intodifficulty as the degree of a failure’s “surprisingness”(confidence) increases along the x-axis. The x-axisbegins at no surprisingness at all (confidence at zero).As noted, we do not consider failures at confidence
0 1000 20000.0
0.5
1.0
(a: SVM-20NG)
Fai
lure
s /
Tes
t C
ases
0 1000 20000.0
0.5
1.0
(b: NB-20NG)
0 1000 20000.0
0.5
1.0
(c: SVM-R8)
Fai
lure
s /
Tes
t C
ases
0 1000 20000.0
0.5
1.0
(d: NB-R8)
0 1000 20000.0
0.5
1.0
(e: SVM-Enron)
Fai
lure
s /
Tes
t C
ases
0 1000 20000.0
0.5
1.0
(f: NB-Enron)
RANDOM
MOST-RELEVANT
CANONICAL
Training Set Size (controls accuracy)
Fig. 4. Failure detection effectiveness of the base-line techniques. Both “intuitive” baseline methods per-formed worse than RANDOM. The classifiers shownare (a-b): 20 Newsgroups by SVM (a) and Naive Bayes(b). (c-d): Reuters by SVM and Naive Bayes. (e-f):Enron by SVM and Naive Bayes.
below 0.5 to be surprising, thus surprises are on theright side of these graphs.
The graphs shown are for the most accurate clas-sifiers (i.e., those trained on 2,000 instances), becausefailures in cases of high confidence by these accurateclassifiers constitute the most surprising of all failures.Classifiers trained on smaller trainings sets showedsimilar results.
As Figure 5 shows, CONFIDENCE, though highlyefficient at low levels of classifier confidence, lost alleffectiveness by the right half of the graphs. The dropoccurred earlier in SVM than in Naive Bayes, possiblybecause of Naive Bayes’s propensity toward over-confidence [63]. We expected the baseline CANON-ICAL and MOST-RELEVANT methods to do well atfinding surprise failures because they tend to selecthigh-confidence labelings, but they performed poorly;perhaps their poor ability to detect failures overallprevented success at detecting this kind of failure.
In contrast to these methods’ lack of success, COS-DIST usually performed well on surprise failures, of-

10
0.0 0.5 1.00.0
0.5
1.0
(a: SVM-20NG)
Fai
lure
s /
Tes
t C
ases
0.0 0.5 1.00.0
0.5
1.0
(b: NB-20NG)
0.0 0.5 1.00.0
0.5
1.0
(c: SVM-R8)
Fai
lure
s /
Tes
t C
ases
0.0 0.5 1.00.0
0.5
1.0
(d: NB-R8)
0.0 0.5 1.00.0
0.5
1.0
(e: SVM-Enron)
Fai
lure
s /
Tes
t C
ases
0.0 0.5 1.00.0
0.5
1.0
(f: NB-Enron)
Confidence Threshold
Fig. 5. Failure detection with confidence thresholds,at training set size 2,000 (the x-axis is the confidencelevel of the classifier). CONFIDENCE performed poorlyas the confidence threshold increased, but COS-DISTand LEAST-RELEVANT outperformed RANDOM. (a-b): 20 Newsgroups by SVM (a) and Naive Bayes (b).(c-d): Reuters by SVM and Naive Bayes. (e-f): Enronby SVM and Naive Bayes. (Legend is same as Figure3.)
ten identifying them at a significantly higher rate thanthey actually occurred (as represented by the RAN-DOM line). Its superiority held over a range of levelsof surprise (i.e., the right half of the x-axis). Figure5(b)’s 20 Newsgroups data set with Naive Bayes wasthe only configuration where COS-DIST performedpoorly. We hypothesize that its poor performancein this case was due to the overlap in newsgroupcontents, which caused most of the failures to be dueto ambiguity and thus lie near decision boundaries.Data instances that are very far away from the trainingset (according to COS-DIST) may be well inside adecision boundary and thus correctly classified.
At all thresholds for surprise (thresholds from 0.5to 0.9), COS-DIST found surprise failures significantlybetter than RANDOM in three configurations (Fig-ure 5(a), (c), and (f)), with significance calculated asin Section 5.2.1. LEAST-RELEVANT significantly im-proved on RANDOM at some surprise thresholds inconfigurations (b) and (f). Differences between COS-DIST and LEAST-RELEVANT were also significant in
0.0
0.5
1.0
0 1000 2000
Fai
lure
s / T
est C
ases
Training Set Size (controls accuracy)
CONFIDENCECOS-DIST
LEAST-RELEVANTRANDOM
Fig. 6. After removing items that might expose “thesame fault” (by distance), CONFIDENCE and COS-DIST approaches still performed very well.
configurations (a), (b), (c), and (f), with COS-DISTbetter in all but the aforementioned (b) case.
We are encouraged and surprised that any testingmethods performed well for surprise failures in anyof the classifiers, because the methods that succeededoverall (recall Figure 3) all work by seeking outliers—the very instances for which a classifier should exhibitlow confidence. We attribute the success of COS-DIST and LEAST-RELEVANT to their focus on findingunusual rather than ambiguous instances (as foundby CONFIDENCE). It appears that using COS-DISTprovides a good balance between finding a highquantity of failures and finding the elusive surprisefailures, and may be the testing method of choicewhen considering both the quality and quantity offailures found.
5.2.3 Regarding Test Coverage, and Grouping Fail-ures by SimilarityA potential explanation for our best methods’ per-formance could have been that they selected manysimilar test cases that all expose “the same fault”(under many correction methods). To check for thispossibility, given that it is not possible to define“faults” without all the necessary parameters (Section2.2), we considered the following assumption: failinginstances that are similar (by distance metric thresh-old) to each other are more likely to expose the samefault. We tested this assumption for both SVM andNaive Bayes as follows: we added failing instances(with correct labels `) to the training set, generatednew classifiers, and examined the changes.
The results supported our assumption. For bothSVM and Naive Bayes, items similar to the failingtest’s instance, when compared to randomly selectedinstances, were, after retraining: (1) more likely tochange classification, (2) less likely to change to anincorrect labeling, and (3) roughly twice as likelyto change from an incorrect to a correct labeling.This indicates that the notion of using distance as asurrogate for “exposes same fault” likelihood is notunreasonable.
Using this assumption, we re-ran our experiments,pruning test suites by retaining only the most highly

11
prioritized item for each set of similar items (thus,in most cases, testing many lower-priority items thanin the original results). The resulting failure detectionefficiency for our best methods was at worst onlymoderately degraded, and sometimes marginally im-proved: Figure 6 shows the results for an SVM on the20 Newsgroups dataset, and is typical of other classi-fiers and datasets. This suggests that the effectivenessof our methods is not a result of detecting multipleinstances of the same fault.
The above results also support our hypothesis thatclassifier test coverage can be reliably determined byassuming the classifier will treat similar items in asimilar manner; we will further investigate the utilityof this metric in the next section.
6 USER STUDY
The results in Section 5 suggest that systematic testingof machine-generated classifiers can be done effec-tively and efficiently, but will actual users behave insuch an ideal manner? To find out, we designed aframework (initially presented in [32]) to support end-user testing of an interactive machine learning system,and studied how end users worked with it.
6.1 What You See is What You TestOur framework was loosely inspired by the What-You-See-Is-What-You-Test (WYSIWYT) approach ofRothermel et al. [48]; we thus dubbed it WYSI-WYT/ML (ML for machine learning). Like the origi-nal WYSIWYT system, our framework performs fourfunctions: (1) it advises (prioritizes) which predictionsto test, (2) it contributes tests, (3) it measures coverage,and (4) it monitors for coverage changes. How itachieves this functionally, however, is unique to thedomain of interactive machine learning.
WYSIWYT/ML supports two cases of users inter-acting with a classifier. In use case UC-1, can a userinitially rely on the classifier to behave as expected?For example, will a new email client correctly identifyjunk mail while leaving important messages in yourinbox? By prioritizing tests, WYSIWYT/ML can helpa user quickly identify which messages are most likelyto be misclassified, and by contributing tests (via thecoverage metric), it keeps the number of test cases auser must manually examine low. The coverage metricalso informs the user how well-tested the classifier is,allowing him or her to determine how closely it needsto be monitored for mistakes (e.g., important emailending up in the junk mail folder).
In use case UC-2, a user wants to know if his or herclassifier is still reliable. Because interactive machinelearning systems continue to learn post-deployment,there is no guarantee that a system that was reliablein the past will continue to perform as expected in thefuture. Thus, WYSIWYT/ML’s fourth function: mon-itoring for coverage changes. Coverage may change
because new inputs arrive that are unlike anything theuser has yet tested, or the classifier’s reasoning maychange, causing items the user previously indicatedto be correctly classified to now have a new (andincorrect) output label.
6.2 Instantiating WYSIWYT/ML
We prototyped WYSIWYT/ML as part of a text-classifying intelligent agent. This agent took news-group messages and classified them by topic (a screen-shot is shown in Figure 1). Thus, testing this agentinvolved determining whether or not it had classifiedeach message correctly.
6.2.1 Advising Which Predictions to Test
Our prototype prioritizes the classifier’s topic pre-dictions that are most likely to be wrong, and com-municates these prioritizations using saturated greensquares to draw a user’s eye (e.g., Figure 1, fourthmessage). The prioritizations may not be perfect, butthey are only intended to be advisory; users are freeto test any messages they want, not just ones thesystem suggests. We created three variants of theWYSIWYT/ML prototype, each using one of the pri-oritization criteria identified in Section 4.2: CONFI-DENCE, COS-DIST, and LEAST-RELEVANT.
WYSIWYT/ML’s implementation of the CONFI-DENCE selection criteria displays classifier confidenceto the user (and allows the user to sort on confidence).The higher the uncertainty, the more saturated agreen square (Figure 1, Confidence column). Withinthe square, WYSIWYT/ML “explains” CONFIDENCEprioritizations using a pie chart (Figure 7, left). Eachpie slice represents the probability that the messagebelongs to that slice’s topic: a pie with evenly sizedslices means the classifier thinks each topic is equallyprobable (thus, testing it is a high priority).
The COS-DIST method is implemented via a “fish-bowl” that explains this method’s priority, with theamount of “water” in the fishbowl representing howunique the message is compared to messages onwhich the classifier trained (Figure 7, middle). A fullfishbowl means the message is very unique (com-pared to the classifier’s training set), and thus highpriority.
The LEAST-RELEVANT method uses the number ofrelevant words (0 to 20) to explain the reason for themessage’s priority (Figure 7, right), with the lowestnumbers receiving the highest priorities.
Fig. 7. The CONFIDENCE (left), COS-DIST (middle),and LEAST-RELEVANT (right) visualizations.

12
6.2.2 Contributing Tests and Measuring CoverageWhen a user wants to assess the classifier, he or shecan pick a message and judge (i.e., test) whether thepredicted topic is correct. Users can pick any message:one of WYSIWYT/ML’s suggestions, or some differentmessage if he or she prefers. The user communicatesthis judgment by clicking a 3 if it is correct or a 7 ifit is incorrect, as in Figure 8 (smaller 3 and 7 markswere available to indicate “maybe right” and “maybewrong”, respectively). If a topic prediction is wrong,the user has the option of selecting the correct topic—our prototype treats this as a shortcut for marking theexisting topic as “wrong”, making the topic change,and then marking the new topic as “right”.
WYSIWYT/ML then contributes to the user’s testingeffort: after each user test, WYSWYT/ML automati-cally infers the same judgment upon similar messages.These automated judgments constitute inferred tests.
To contribute these inferred tests, our approachcomputes the cosine similarity of the tested messagewith each untested message sharing the same pre-dicted topic. WYSWYT/ML then marks very simi-lar messages (i.e., scoring above a cosine similaritythreshold of 0.05, a value established during pilottests) as approved or disapproved by the prototype. Theautomatically inferred assessments are shown withgray 3 and 7 marks in the Correctness column (Figure9, top), allowing users to differentiate their own ex-plicit judgments from those automatically inferred byWYSIWYT/ML. Of course, users are free to review(and if necessary, fix) any inferred assessments—infact, most of our study’s participants started out doingexactly this.
WYSIWYT/ML’s third functionality is measuringtest coverage: how many of the classifier’s predictionshave been tested by Adam and the inferred teststogether. A test coverage bar (Figure 9, bottom) keepsusers informed of this measure, helping them decidehow much more testing may be warranted.
6.2.3 Monitoring CoverageWhenever a user tests one of the classifier’s predic-tions or new content arrives for the prototype toclassify, the system immediately updates all of itsinformation. This includes the classifier’s predictions(except for those a user has “locked down” by explic-itly approving them), all testing priorities, all inferredtests, and the test coverage bar. Thus, users can always
Fig. 8. A user can mark a predicted topic wrong,maybe wrong, maybe right, or right (or “?” to revert tountested). Prior research found these four choices tobe useful in spreadsheet testing [21].
see how “tested” the classifier is at any given moment.If a user decides that more testing is warranted, he orshe can quickly tell which predictions WYSIWYT/MLthinks are the weakest (UC-1) and which predictionsare not covered by prior tests (UC-2).
6.3 Experimental Methodology
We conducted a user study to investigate use-caseUC-1, the user’s initial assessment of a classifier. Thisstudy was designed to investigate Research Questions5, 6, and 7.
We used three systematic testing treatments, onefor each prioritization method (CONFIDENCE, COS-DIST, and LEAST-RELEVANT). We also included afourth treatment (CONTROL) to represent ad hoc test-ing. Participants in all treatments could test (via 3, 7,and label changes) and sort messages by any columnin the prototype. See Figure 1 for a screenshot ofthe CONFIDENCE prototype; COS-DIST and LEAST-RELEVANT looked similar, save for their respectiveprioritization methods and visualizations (Figure 7).CONTROL supported the same testing and sortingactions, but lacked prioritization visualizations or in-ferred tests, and thus did not need priority/inferredtest history columns. CONTROL replaces our hypoth-esized CANONICAL and MOST-RELEVANT meth-ods, as well as RANDOM, in that it represents actualuser behavior in the absence of an automated selec-tion/prioritization method.
The experiment design was within-subject (i.e., allparticipants experienced all treatments). We randomlyselected 48 participants (23 males and 25 females)from respondents to a university-wide request. Noneof our participants were Computer Science majors,nor had any taken Computer Science classes be-yond the introductory course. Participants workedwith messages from four newsgroups of the 20Newsgroups dataset [31]: cars, motorcycles, computers,
Fig. 9. (Top): The user tested three of the messages(the dark 3 and 7 marks), so they no longer show apriority. Then the computer inferred the third messageto be correct (light gray 3). Because the user’s lasttest caused the computer to infer new information,the History column shows the prior values of whatchanged. (These values move right with each newchange, until they are pushed off the screen.) (Bot-tom): A test coverage bar informs users how manytopic predictions have been judged (by the user or thecomputer) to be correct (3) or incorrect (7).

13
and religion (the original rec.autos, rec.motorcycles,comp.os.ms-windows.misc, and soc.religion.christiannewsgroups, respectively).
We randomly selected 120 messages (30 per topic)to train a support vector machine [8]. We randomlyselected a further 1,000 messages over a variety ofdates (250 per topic) and divided them into five datasets: one tutorial set (to familiarize our participantswith the testing task) and four test sets to use in thestudy main tasks. Our classifier was 85% accuratewhen initially classifying each of these sets. We useda Latin Square design to counterbalance treatmentorderings and randomized how each participant’s testdata sets were assigned to the treatments.
Participants answered a background questionnaire,then took a tutorial to learn one prototype’s userinterface and to experience the kinds of messagesand topics they would be seeing during the study.Using the tutorial set, participants practiced testingand finding the classifier’s mistakes in that prototype.For their first task, participants used the prototypeto test and look for mistakes in a 200-message testset. They then filled out a Likert-scale questionnairewith their opinions of their success, the task difficulty,and their opinions of the prototype. They then tookanother brief tutorial explaining the changes in thenext prototype variant, practiced, and performed themain task using the next assigned data set and treat-ment. Finally, participants answered a questionnairecovering their overall opinions of the four prototypesand comprehension. Each testing task lasted only 10minutes.
6.4 Experimental Results6.4.1 RQ5 (User Efficacy): Finding FailuresTo investigate how well participants managed to finda classifier’s mistakes using WYSIWYT/ML, we com-pared failures they found using the WYSIWYT/MLtreatments to failures they found with the CONTROLtreatment. An ANOVA contrast against CONTROLshowed a significant difference between treatmentmeans (Table 1). For example, participants foundnearly twice as many failures using the frontrunner,CONFIDENCE, than using the CONTROL version.
Not only did participants find more failures withWYSIWYT/ML, the more tests participants per-formed using WYSIWYT/ML, the more failures theyfound (linear regression, F(1,46)=14.34, R2=.24, b=0.08,p<.001), a relationship for which there was noevidence in the Control variant (linear regression,F(1,45)=1.56, R2=.03, b=0.03, p=.218). Systematic test-ing using WYSIWYT/ML yielded significantly betterresults for finding failures than ad-hoc testing.
Our formative offline oracle experiments revealedtypes of failures that would be hard for some ofour methods to target as high-priority tests. (Recallthat, offline, LEAST-RELEVANT and COS-DIST were
better than CONFIDENCE in this respect.) In orderto evaluate our methods with real users, we tooka close look at Bug 20635, which was one of thehardest failures for our participants to find (one ofthe five least frequently identified). The message topicshould have been Religion but was instead predictedto be Computers, perhaps in part because Bug 20635’smessage was very short and required domain-specificinformation to understand (which was also true of theother hardest-to-find failures):
Subject: Mission Aviation FellowshipHi, Does anyone know anything about thisgroup and what they do? Any info would beappreciated. Thanks!
As Table 2 shows, nearly all participants who hadthis failure in their test set found it with the LEAST-RELEVANT treatment, but a much lower fractionfound it using the other treatments. As the table’s Pri-oritization column shows, LEAST-RELEVANT rankedthe message as very high priority because it did notcontain any useful words, unlike CONFIDENCE (theclassifier was very confident in its prediction), andunlike COS-DIST (the message was fairly similar toother Computer messages). Given this complemen-tarity among the different methods, we hope in thefuture to evaluate a combination (e.g., a weightedaverage or voting scheme) of prioritization methods,thus enabling users to quickly find a wider variety offailures than they could using any one method alone.
6.4.2 RQ6 (User Efficiency): The Partnership’s TestCoverageUsing WYSIYWT/ML, our participants were able tomore than double their test coverage. Together withthe computer-oracle-as-partner, participants’ mean of55 test actions using WYSIWYT/ML covered a meanof 117 (60%) of the messages—thus, participantsgained 62 inferred tests “for free”. Table 3 shows theraw counts. With the help of their computer partners,two participants even reached 100% test coverage,covering all 200 messages within their 10-minute timelimit.
Further, coverage scaled well. In an offline experi-ment, we tried our participants’ explicit tests on theentire set of Newsgroup messages from the dates andtopics we had sampled for the experiment—a data setcontaining 1,448 messages. (These were tests partici-pants explicitly entered using either WYSIWYT/MLor CONTROL, a mean of 55 test actions per ses-sion.) Using participants’ explicit tests, the computerinferred a mean of 568 additional tests per participant,for a total coverage of 623 tests (mean) from only 10minutes of work—a 10-fold leveraging of the user’sinvested effort.
As Table 3 shows, participants approved more mes-sages than they disapproved. When participants ap-proved a message, their topic choice matched the 20-Newsgroup “gold standard” (the original newsgroup
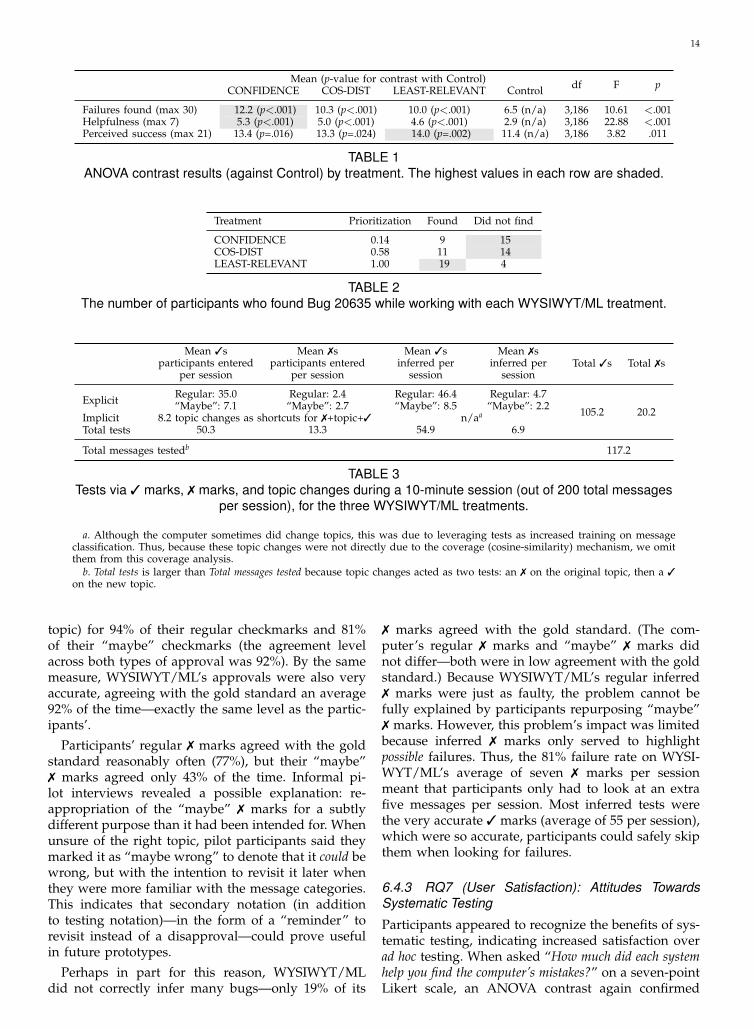
14
Mean (p-value for contrast with Control) df F pCONFIDENCE COS-DIST LEAST-RELEVANT Control
Failures found (max 30) 12.2 (p<.001) 10.3 (p<.001) 10.0 (p<.001) 6.5 (n/a) 3,186 10.61 <.001Helpfulness (max 7) 5.3 (p<.001) 5.0 (p<.001) 4.6 (p<.001) 2.9 (n/a) 3,186 22.88 <.001Perceived success (max 21) 13.4 (p=.016) 13.3 (p=.024) 14.0 (p=.002) 11.4 (n/a) 3,186 3.82 .011
TABLE 1ANOVA contrast results (against Control) by treatment. The highest values in each row are shaded.
Treatment Prioritization Found Did not find
CONFIDENCE 0.14 9 15COS-DIST 0.58 11 14LEAST-RELEVANT 1.00 19 4
TABLE 2The number of participants who found Bug 20635 while working with each WYSIWYT/ML treatment.
Mean 3sparticipants entered
per session
Mean 7sparticipants entered
per session
Mean 3sinferred per
session
Mean 7sinferred per
sessionTotal 3s Total 7s
Explicit Regular: 35.0“Maybe”: 7.1
Regular: 2.4“Maybe”: 2.7
Regular: 46.4“Maybe”: 8.5
Regular: 4.7“Maybe”: 2.2 105.2 20.2Implicit 8.2 topic changes as shortcuts for 7+topic+3 n/aa
Total tests 50.3 13.3 54.9 6.9
Total messages testedb 117.2
TABLE 3Tests via 3 marks, 7 marks, and topic changes during a 10-minute session (out of 200 total messages
per session), for the three WYSIWYT/ML treatments.
a. Although the computer sometimes did change topics, this was due to leveraging tests as increased training on messageclassification. Thus, because these topic changes were not directly due to the coverage (cosine-similarity) mechanism, we omitthem from this coverage analysis.
b. Total tests is larger than Total messages tested because topic changes acted as two tests: an 7 on the original topic, then a 3on the new topic.
topic) for 94% of their regular checkmarks and 81%of their “maybe” checkmarks (the agreement levelacross both types of approval was 92%). By the samemeasure, WYSIWYT/ML’s approvals were also veryaccurate, agreeing with the gold standard an average92% of the time—exactly the same level as the partic-ipants’.
Participants’ regular 7 marks agreed with the goldstandard reasonably often (77%), but their “maybe”7 marks agreed only 43% of the time. Informal pi-lot interviews revealed a possible explanation: re-appropriation of the “maybe” 7 marks for a subtlydifferent purpose than it had been intended for. Whenunsure of the right topic, pilot participants said theymarked it as “maybe wrong” to denote that it could bewrong, but with the intention to revisit it later whenthey were more familiar with the message categories.This indicates that secondary notation (in additionto testing notation)—in the form of a “reminder” torevisit instead of a disapproval—could prove usefulin future prototypes.
Perhaps in part for this reason, WYSIWYT/MLdid not correctly infer many bugs—only 19% of its
7 marks agreed with the gold standard. (The com-puter’s regular 7 marks and “maybe” 7 marks didnot differ—both were in low agreement with the goldstandard.) Because WYSIWYT/ML’s regular inferred7 marks were just as faulty, the problem cannot befully explained by participants repurposing “maybe”7 marks. However, this problem’s impact was limitedbecause inferred 7 marks only served to highlightpossible failures. Thus, the 81% failure rate on WYSI-WYT/ML’s average of seven 7 marks per sessionmeant that participants only had to look at an extrafive messages per session. Most inferred tests werethe very accurate 3 marks (average of 55 per session),which were so accurate, participants could safely skipthem when looking for failures.
6.4.3 RQ7 (User Satisfaction): Attitudes TowardsSystematic Testing
Participants appeared to recognize the benefits of sys-tematic testing, indicating increased satisfaction overad hoc testing. When asked “How much did each systemhelp you find the computer’s mistakes?” on a seven-pointLikert scale, an ANOVA contrast again confirmed

15
that responses differed between treatments (Table 1,row 2), with WYSIWYT/ML treatments rated morehelpful than Control. Table 1’s 3rd row shows thatparticipant responses to the NASA-TLX questionnaire[26] triangulate this result. Together, these results areencouraging from the perspective of the AttentionInvestment Model [6]—they suggest that end userscan be apprised of the benefits (so as to accuratelyweigh the costs) of testing a classifier that does workimportant to them.
7 DISCUSSIONWe emphasize that finding (not fixing) failures isWYSIWYT/ML’s primary contribution toward debug-ging. Although WYSIWYT/ML leverages user tests asadditional training data, simply adding training datais not an efficient method for debugging classifiers. Toillustrate, our participants’ testing labeled, on average,55 messages, which increased average accuracy by3%. In contrast, participants in another study that alsoused a subset of the 20 Newsgroup dataset spent their10 minutes debugging by specifying words/phrasesassociated with a label [60]. They entered only about32 words/phrases but averaged almost twice as muchof an accuracy increase (5%) in their 10 minutes.Other researchers have similarly reported that allow-ing users to debug by labeling a word/phrase is up tofive times more efficient than simply labeling trainingmessages [46].
Thus, rather than attempting to replace the de-bugging approaches emerging for interactive ma-chine learning systems (e.g., [33], [35], [57]), WYSI-WYT/ML’s bug-finding complements them. For ex-ample, WYSIWYT/ML may help a user realize thatan e-mail classifier often mistakenly labels messagesabout social networks (e.g., friend requests, statusupdates) as SPAM; the user could then use a featurelabeling approach (e.g., [60]) to adjust the classifier’sreasoning. After such feedback, WYSIWYT/ML helpsthe user understand whether the classifier’s mistakeshave been corrected, as well as whether new mis-takes have been introduced. WYSIWYT/ML providesa missing testing component to interactive machinelearning systems; it suggests where important bugshave emerged and when those bugs have been erad-icated, so that end users need not debug blindly.
Our empirical evaluation showed that systemati-cally testing with WYSIWYT/ML resulted in a signif-icant improvement over ad hoc methods in end users’abilities to assess their classifiers: our participantsfound almost twice as many failures with our bestWYSIWYT/ML variant as they did while testing adhoc. Further, the approach scaled: participants covered117 messages in the 200-message data set (over twiceas many as they explicitly tested) and 623 messages inthe 1448-message data set (over 10 times as many asthey explicitly tested)—all at a cost of only 10 minuteswork.
Thus, systematic assessment of machine-generatedclassifiers was not only effective at finding failures—it also helped ordinary end users assess a reason-able fraction of an classifier’s work in a matter ofminutes. These findings strongly support the via-bility of bringing systematic testing to this domain,empowering end users to judge whether and whento rely on interactive machine learning systems thatsupport critical tasks. These results also validate ourexperimental evaluations, in that they suggest thatour proposed methodology can predict the relativeperformance of methods for actual users. However,the absolute performance differences between meth-ods were considerably smaller with human subjectsthan when performing purely automated testing. Ifthe advantages of the non-CONFIDENCE methodsfor finding surprise faults carry over to the WYSI-WYT/ML setting (which we cannot currently claimto have statistically validated, due to the rarity ofsurprise faults in reasonable-sized test sets), the argu-ment for preferring other methods to CONFIDENCEmay be stronger than our experimental evaluationwould suggest.
8 THREATS TO VALIDITY
We conducted experiments using two types of ma-chine learning classifiers (naive Bayes and a SupportVector Machine) and three datasets. However, thereare many different machine learning techniques, andsome operate quite differently than the classifiers weevaluated (e.g., decision trees, neural networks). Fur-ther, the three datasets we used in our evaluation maynot be representative of all types of text-based classi-fication, and certainly do not tell us anything abouttesting machine learning systems on non-textual data(e.g., image recognition).
Our experimental evaluation used training set sizesof up to 2,000, but the datasets we explored containedmany more items than that (up to 11,293). Thus, adifferent sample of training items may have resultedin different classifiers, and thus different failures. Thisis especially applicable at small training set sizes(e.g., 100 items), where variance between classifierstrained on different samples from a larger populationis known to be high [7].
The participants in our user study were recruitedfrom a collegiate campus, and thus may not be rep-resentative of a larger population (only eight partici-pants were not enrolled as students at the time of thestudy). The task these participants performed (testingclassification of newsgroup messages) is unlikely to beone they would undertake on their own—people maybe more or less motivated to test classifiers they use ona daily basis, and this may impact the amount of effortthey are willing to expend on the task. Additionally,classification of newsgroup messages is subjective;participants’ perception of correct classification may

16
not match that of the messages’ original authors.Relatedly, the messages participants tested were from1994 and contained dated references to people, things,and events; younger adults may have been uncertainhow to classify some messages because they were lessfamiliar with the context from which these messagesoriginated.
The primary real limitations here are simply thatsome of the most interesting possible applications fortesting classifiers may not match our settings. Forexample, while much of the information in softwareengineering classification problems may be textual,it is also often structured information with complexsemantics, and the availability of a gold standardmay often be a difficult problem for experimentalefforts. Our studies also cannot capture the empiricalaspects of a constantly evolving classifier tuned tothe idiosyncratic needs of a single user well, eitherfor “simple” applications such as email classificationor hypothetical expert users, e.g. software developersinterested in personalized defect detection [29].
9 RELATED WORK
Until now, there has been no work on systematictesting of classifiers by end users, therefore relegatingwhatever testing users do to strictly ad hoc methods.If an interesting instance happens to appear and theuser happens to notice it, the user may be allowed tovalidate or reject the “test case”, and at the same timemay form an opinion of the classifier’s reliability.
For machine learning specialists (rather than endusers), statistical evaluation of classifier reliability iscommon (see, e.g., Chapter 7 of Hastie et al. [27]).Statistical evaluation of classifiers requires a large setof labeled data—a cheap oracle. Our setting is quitedifferent in that end users generally do not have ac-cess to a large, labeled set of data other than a trainingset. Testing classifiers is challenging even for expertsin cases where no test oracle is available [43]. Testingwithout an oracle has been studied in depth by Chenet al. [9]. One approach relies on metamorphic test-ing [10], exploiting continuity or other mathematicalproperties to produce new test cases with predictableoutcomes given results for other inputs [44], [62]. Thisapproach unfortunately is seldom applicable for endusers; even experts may find it difficult to discovermetamorphic properties.
This paper’s testing-oriented approach is differentfrom traditional machine learning research, includingactive learning [53], although it can make partial useof some of the techniques [37], [53]. As explained inthe introduction, there are at least three fundamentaldifferences: (1) who controls the process (classifier ver-sus user), (2) what is being optimized (learning versusbug detection), and (3) the target that improves as anoutcome (classifier accuracy versus a user’s ability toevaluate when to rely on the classifier). Recall Figure
2 for a schematic of these differences. Two advantagesof our approach’s testing emphasis are its direct tie tothe development of human trust in machine-learnedclassifiers and its ability to contribute directly to newdebugging approaches for classifiers (e.g., end-userfeature labeling [60] and crowd-sourcing [56]).
Rothermel et al. were the first to propose systematictesting by end users (of spreadsheets) [48]. That workdescribed four classes of differences between endusers testing spreadsheets and traditional testing ofimperative programs. The first two classes of differ-ences relate to specifics about the programming modelof spreadsheets. In many cases the spirit of thesedifferences inspired our work: e.g., the insight thatcriteria should be independent of the details of theevaluation engine is analogous to our independenceof machine learning algorithms. The third and fourthclasses of differences, deriving from the target audi-ence of end users, include the importance of the userinterface and the absence of formal testing training.Our work therefore focuses on approaches that are(1) inexpensive enough to be integrated into a varietyof potential user interfaces, and (2) do not dependon any formal training in software testing. One majordifference of our work from previous work on end-user testing of spreadsheets is that in our case, the“programs” were not generated by a user (in fact, theywere not even generated by a human).
This paper focuses on very small test suites. Testsuite size usually has an effect on fault detection [49].It is also known that coverage metrics can be corre-lated with fault detection [17], [20]. However, few ofthe possibly effective approaches that are useful forgeneration or selection of tests are easily applicableto classifiers, or algorithm independent. In contrast,our goal is computationally inexpensive, learning-algorithm-independent methods for selecting efficienttest suites for classifiers, even for small test suites.Thus, comparison to results on traditional human-created software is of only limited value. One inter-esting comparison is with the approach of Dickinsonet al., which has some high-level similarities in thatit selects interesting test cases from a large suite ofunknown value by looking for “different” executions[13].
Statistical outlier finding has been used in end-user programming settings for assessment, such asdetecting errors in text editing macros [42], inferringformats from a set of unlabeled examples [51], andto monitor on-line data feeds in web-based appli-cations for erroneous inputs [47]. These approachesuse statistical analysis and interactive techniques todirect end-user programmers’ attention to potentiallyproblematic values, helping them find places in theirprograms to fix.
To support end users’ interactions with machinelearning systems, recent work has explored meth-ods for explaining the reasons underlying a classi-

17
fier’s predictions. Such explanations have taken formsas diverse as why... and why not... descriptions ofthe classifier’s logic [34], [39], visual depictions ofthe classifier’s known correct predictions versus itsknown failures [15], [30], [54], and electronic “doortags” displaying predictions of worker interruptibilitywith the reasons (e.g., “talking detected”) [58]. Asa basis for creating explanations, researchers havealso investigated the types of information users wantbefore assessing the trustworthiness of a classifier [19],[33]. Work by Lim and Dey has resulted in a toolkitfor applications to generate explanations for popularmachine learning systems [38], and a few systems adddebugging capabilities to explanations [2], [33], [34].Our approach for supporting systematic assessmentof intelligent assistants is intended as a complementto explanation and debugging approaches like these.
More generally, our work falls into the increasinguse of machine learning and AI techniques in softwareengineering [23], with the interesting unusual featurethat we are not only using ML-based methods for asoftware engineering task, but are applying this to theengineering of ML-based systems. The growing bodyof work on using ML techniques in software engineer-ing, e.g. for bug report based fault localization [50]or search-based testing [25], is therefore also relevant,both because it contains similar efforts to apply MLto software engineering problems and because suchwork could likely benefit from the methods presentedin this paper.
10 CONCLUSIONAfter a well-tested intelligent application arrives on auser’s personal computer or smart phone, it may en-counter inputs it has never seen before, or learn newrules of behavior as a user personalizes it—in eachcase, the user needs to know what the applicationcan do reliably well, and where it may fail. Framingthis situation as a test selection problem reveals sev-eral challenging requirements for viability: (1) relativeindependence from the underlying machine learningalgorithm for general applicability, (2) computationalefficiency so that the method can be used in interac-tive environments, and (3) test efficiency even withvery small test suites, for consistency with end users’willingness to test.
Our experimental evaluations serve two purposes:first, establishing a methodology for predicting testselection efficiency allowed us to evaluate methods foruse in a more costly human experiment, over a muchlarger range of data sets and classifiers than would bepractical with human subjects. Second, it allowed usto investigate the problem of “surprise” faults, whichis not easily included in human experiments due tothe rarity of such faults in real data.
Together with the findings from our study of realend users’ behavior, our results suggest that system-atic testing of classifiers by end users is not only
viable, but significantly more effective than users’ ex-isting ad hoc methods. The ability of our best selectionmethods to produce test suites of very small size,where most tests reveal failures even for very accurateclassifiers, translated into the ability of users to findnearly twice as many failures as they could withoutassistance. Our methods are aimed at traditional endusers, but the growing importance of machine learn-ing to software engineering itself [23] suggests thatsoon many software developers will also be placed inthe role of end users of ML systems, and themselvesneed effective test-selection methods.
11 ACKNOWLEDGEMENTS
We thank our participants, the anonymous reviewersof this paper, Marc Fisher II, Travis Moore, JeremyGoodrich, Nicole Usselman, and Kathleen Shaw. Thiswork was supported in part by NSF 0803487.
REFERENCES[1] IEEE Std. Glossary Software Eng. Terminology. IEEE Press, 1990.[2] S. Amershi, J. Fogarty, and D. Weld. Regroup: interactive
machine learning for on-demand group creation in socialnetworks. In CHI ’12: Proceedings of the SIGCHI Conferenceon Human Factors in Computing Systems, pages 21–30. ACMRequest Permissions, May 2012.
[3] A. Arcuri, M. Iqbal, and L. Briand. Formal analysis of theeffectiveness and predictability of random testing. In Intl.Symp. Software Testing and Analysis, pages 219–230, 2010.
[4] A. Asuncion and D. Newman. UCI machine learning reposi-tory, 2007.
[5] R. Baeza-Yates and B. Ribeiro-Neto. Modern Information Re-trieval. 1999.
[6] A. Blackwell. First steps in programming: A rationale forattention investment models. In IEEE Conf. Human-CentricComputing, pages 2–10, 2002.
[7] D. Brain and G. Webb. On the effect of data set size onbias and variance in classification learning. In D. Richards,G. Beydoun, A. Hoffmann, and P. Compton, editors, Proc. of theFourth Australian Knowledge Acquisition Workshop, pages 117–128. 1999.
[8] C.-C. Chang and C.-J. Lin. LIBSVM: a library for support vectormachines, 2001. http://www.csie.ntu.edu.tw/∼cjlin/libsvm.
[9] T. Chen, T. Tse, and Z. Quan Zhou. Fault-based testing withoutthe need of oracles. Information and Software Technology, 45(1):1–9, 2003.
[10] T. Y. Chen, S. C. Cheung, and S. Yiu. Metamorphic testing: anew appraoch for generating next test cases. Technical ReportHKUST-CS98-01, Hong Kong Univ. Sci. Tech., 1998.
[11] Y. Chen, A. Groce, C. Zhang, W.-K. Wong, X. Fern, E. Eide,and J. Regehr. Taming compiler fuzzers. In ACM SIGPLANConference on Programming Language Design and Implementation,pages 197–208, 2013.
[12] C. Cortes and V. Vapnik. Support vector networks. MachineLearning, 20:273–297, 1995.
[13] W. Dickinson, D. Leon, and A. Podgurski. Pursuing failure:The distribution of program failures in a profile space. InEuropean Software Eng. Conf., pages 246–255, 2001.
[14] S. Elbaum, A. Malishevsky, and G. Rothermel. Test caseprioritization: a family of empirical studies. IEEE Trans.Software Eng., 28, 2002.
[15] J. Fogarty, D. Tan, A. Kapoor, and S. Winder. CueFlik: interac-tive concept learning in image search. In CHI ’08: Proceedings ofthe SIGCHI Conference on Human Factors in Computing Systems,pages 29–38. ACM Request Permissions, Apr. 2008.
[16] P. Francis, D. Leon, M. Minch, and A. Podgurski. Tree-basedmethods for classifying software failures. In InternationalSymposium on Software Reliability Engineering, pages 451–462,2004.

18
[17] P. Frankl and S. Weiss. An experimental comparison of theeffectiveness of branch testing and data flow testing. IEEETrans. Software Eng., 19(3):202–213, 1993.
[18] P. Frankl, S. Weiss, and C. Hu. All-uses vs mutation testing:An experimental comparison of effectivness. J. Systems andSoftware, 38(3):235–253, 1997.
[19] A. Glass, D. McGuinness, and M. Wolverton. Toward estab-lishing trust in adaptive agents. In Proc. IUI, pages 227—236,2008.
[20] M. Gligoric, A. Groce, C. Zhang, R. Sharma, A. Alipour,and D. Marinov. Comparing non-adequate test suites usingcoverage criteria. In International Symposium on Software Testingand Analysis, pages 302–313, 2013.
[21] V. Grigoreanu, J. Cao, T. Kulesza, C. Bogart, K. Rector, M. Bur-nett, and S. Wiedenbeck. Can feature design reduce the gendergap in end-user software development environments? In IEEEConf. VL/HCC, pages 149–156, 2008.
[22] A. Groce, A. Fern, J. Pinto, T. Bauer, A. Alipour, M. Erwig, andC. Lopez. Lightweight automated testing with adaptation-based programming. In IEEE International Symposium onSoftware Reliability Engineering, pages 161–170, 2012.
[23] M. Harman. The role of artificial intelligence in software en-gineering. In First International Workshop on Realizing ArtificialIntelligence Synergies in Software Engineering, pages 1–6, 2012.
[24] M. Harman, E. Burke, J. Clark, and X. Yao. Dynamic adaptivesearch based software engineering. In ACM/IEEE InternationalSymposium on Empirical Software Engineering and Measurement,pages 1–8, 2012.
[25] M. Harman and P. McMinn. A theoretical and empiricalstudy of search-based testing: Local, global, and hybrid search.volume 36, pages 226–247, 2010.
[26] S. Hart and L. Staveland. Development of a nasa-tlx (taskload index): Results of empirical and theoretical research. InP. Hancock and N. Meshkati, editors, Human Mental Workload,pages 139–183. 1988.
[27] T. Hastie, R. Tibshirani, and J. H. Friedman. The Elements ofStatistical Learning. Springer, 2003.
[28] D. Isa, L. Lee, V. Kallimani, and R. RajKumar. Text documentpreprocessing with the bayes formula for classification usingthe support vector machine. IEEE Trans. Knowledge and DataEng., 20:1264–1272, 2008.
[29] T. Jiang, L. Tan, and S. Kim. Personalized defect prediction.In ACM Conf. Automated Software Eng., pages 279–289, 2013.
[30] A. Kapoor, B. Lee, D. Tan, and E. Horvitz. Interactive opti-mization for steering machine classification. Proc. CHI, pages1343–1352, 2010.
[31] G. Kniesel and T. Rho. Newsgroup data set http://www.ai.mit.edu/jrennie/20newsgroups, 2005.
[32] T. Kulesza, M. Burnett, S. Stumpf, W.-K. Wong, S. Das,A. Groce, A. Shinsel, F. Bice, and K. McIntosh. Where are myintelligent assistant’s mistakes? a systematic testing approach.In Intl. Symp. End-User Development, pages 171–186, 2011.
[33] T. Kulesza, S. Stumpf, M. Burnett, W.-K. Wong, Y. Riche,T. Moore, I. Oberst, A. Shinsel, and K. McIntosh. Explana-tory debugging: Supporting end-user debugging of machine-learned programs. In IEEE Symp. Visual Languages and Human-Centric Computing, pages 41–48, 2010.
[34] T. Kulesza, S. Stumpf, W.-K. Wong, M. Burnett, S. Perona,A. Ko, and I. Obsert. Why-Oriented End-User Debuggingof Naive Bayes Text Classification. ACM Transactions onInteractive Intelligent Systems, 1(1), Oct. 2011.
[35] T. Kulesza, W.-K. Wong, S. Stumpf, S. Perona, R. White,M. Burnett, I. Oberst, and A. Ko. Fixing the program mycomputer learned: Barriers for end users, challenges for themachine. In ACM Intl. Conf. Intelligent User Interfaces, pages187–196, 2009.
[36] K. Lang. Newsweeder: Learning to filter netnews. In Intl.Conf. Machine Learning, pages 331–339, 1995.
[37] D. Lewis and W. Gale. A sequential algorithm for trainingtext classifiers. In ACM Conf. Research and Development inInformation Retrieval, pages 3–12, 1994.
[38] B. Lim and A. Dey. Toolkit to support intelligibility in context-aware applications. In Proc. Int. Conf. Ubiquitous Computing,pages 13–22, 2010.
[39] B. Lim, A. Dey, and D. Avrahami. Why and why not expla-nations improve the intelligibility of context-aware intelligent
systems. In ACM Conf. Human Factors in Computing Systems,pages 2119–2128, 2009.
[40] M. E. Maron. Automatic indexing: An experimental inquiry.J. ACM, 8(3):404–417, 1961.
[41] A. McCallum. Mallet: A machine learning for language toolkit.2002. URL http://mallet. cs. umass. edu.
[42] R. Miller and B. Myers. Outlier finding: Focusing user atten-tion on possible errors. In Proc. UIST, pages 81–90, 2001.
[43] C. Murphy, G. Kaiser, and M. Arias. An approach to softwaretesting of machine learning applications. In Intl. Conf. SoftwareEng. and Knowledge Eng., pages 167–172, 2007.
[44] C. Murphy, K. Shen, and G. Kaiser. Automatic system testingof programs without test oracles. In Intl. Symp. Software Testingand Analysis, pages 189–200, 2009.
[45] R. Panko. What we know about spreadsheet er-rors http://reference.kfupm.edu.sa/content/w/h/what weknow about spreadsheet errors 72956.pdf. Retreived Aug.2010. Expanded version of article in J. End User Computing19(2), Spring 1998, pp. 15-21.
[46] H. Raghavan, O. Madani, and R. Jones. Active learning withfeedback on both features and instances. JMLR, 7:1655–1686,2006.
[47] O. Raz, P. Koopman, and M. Shaw. Semantic anomaly de-tection in online data sources. In Proc. ICSE, pages 302–312,2002.
[48] G. Rothermel, M. Burnett, L. Li, C. DuPois, and A. Sheretov.A methodology for testing spreadsheets. ACM Trans. SoftwareEng. and Methodology, 10(1):110–147, 2001.
[49] G. Rothermel, M. J. Harrold, J. Ostrin, and C. Hong. Anempirical study of the effects of minimization on the faultdetection capabilities of test suites. In Intl. Conf. SoftwareMaintenance, 1998.
[50] R. K. Saha, M. Lease, S. Khurshid, and D. E. Perry. Improvingbug localization using structured information retrieval. InACM Conf. Automated Software Eng., pages 345–355, 2013.
[51] C. Scaffidi. Unsupervised inference of data formats in human-readable notation. In Proc. Int. Conf. Enterprise IntegrationSystems, pages 236–241, 2007.
[52] J. Segal. Some problems of professional end user developers.In IEEE Symp. Visual Languages and Human-Centric Computing,2007.
[53] B. Settles. Active learning literature survey. Technical ReportTech. Rpt. 1648, Univ. Wisc., Jan. 2010. http://pages.cs.wisc.edu/∼bsettles/pub/settles.activelearning.pdf.
[54] J. Shen and T. Dietterich. Active em to reduce noise in activityrecognition. In Proc. IUI, pages 132–140, 2007.
[55] J. Shetty and J. Adibi. The Enron email dataset databaseschema and brief statistical report. Tech. Rpt., Univ. S. Calif.,2004.
[56] A. Shinsel, T. Kulesza, M. M. Burnett, W. Curan, A. Groce,S. Stumpf, and W.-K. Wong. Mini-crowdsourcing end-user as-sessment of intelligent assistants: A cost-benefit study. In IEEESymposium on Visual Languages and Human-Centric Computing,pages 47–54, 2011.
[57] J. Talbot, B. Lee, A. Kapoor, and D. Tan. Ensemblematrix:Interactive visualization to support machine learning withmultiple classifiers. In Proc. CHI, pages 1283–1292, 2009.
[58] J. Tullio, A. Dey, J. Chalecki, and J. Fogarty. How it works:A field study of non-technical users interacting with an in-telligent system. In ACM Conf. Human Factors in ComputingSystems, pages 31–40, 2007.
[59] L. Wasserman. All of Statistics. Springer, 2004.[60] W.-K. Wong, I. Oberst, S. Das, T. Moore, S. Stumpf, K. McIn-
tosh, and M. Burnett. End-user feature labeling: A locally-weighted regression approach. In Intl. Conf. Intell. User Inter-faces, pages 115–124, 2011.
[61] T.-F. Wu, C.-J. Lin, and R. C. Weng. Probability estimatesfor multi-class classification by pairwise coupling. J. MachineLearning Research, 5:975–1005, 2004.
[62] X. Xie, J. Ho, C. Murphy, B. Xu, and T. Y. Chen. Applicationof metamorphic testing to supervised classifiers. In Intl. Conf.Quality Software, pages 135–144, 2009.
[63] B. Zadrozny and C. Elkan. Obtaining calibrated probabilityestimates from decision trees and naive bayesian classifiers.pages 609–616, 2001.

19
Alex Groce is an assistant professor of Com-puter Science at Oregon State University.His research interests are in software engi-neering, particularly (random) testing, modelchecking, code analysis, debugging, and er-ror explanation. He focuses on software en-gineering as the art and science of buildingprograms with a desired set of executions.He received his PhD in Computer Sciencefrom Carnegie Mellon University in 2005.Before joining the OSU faculty in 2009, he
was a core member of the Laboratory for Reliable Software atNASAs Jet Propulsion Laboratory, and taught classes on softwaretesting at the California Institute of Technology. At JPL he was leaddeveloper and designer for test automation for the Curiosity MarsRover mission’s internal flight software test team, and led file systemtesting for other space missions. He received an NSF CAREERAward in 2011, is a member of the steering committee for theInternational Workshop on Dynamic Analysis (WODA), and serveson ACM and IEEE program committees on software engineering,testing, and verification, including the International Symposium onSoftware Testing and Analysis (ISSTA) for 2014.
Todd Kulesza Todd Kulesza is a ComputerScience PhD candidate at Oregon State Uni-versity. His research interests are in humaninteractions with intelligent systems, with afocus on enabling end users to control suchsystems efficiently and effectively. He was aco-organizer of ACM IUI 2013 Workshop onInteractive Machine Learning, and his workin this area has received an ACM CHI Hon-orable Mention in 2012.
Chaoqiang Zhang Chaoqiang Zhang is agraduate student in the School of ElectricalEngineering and Computer Science at Ore-gon State University. He received the BE de-gree from Shaanxi University of Science andTechnology in 2001 and the MS degree fromFudan University in 2004. His research inter-ests include the development of techniquesand tools for improving software reliabilityand dependability.
Shalini Shamasunder Shalini Shamasun-der has extensive experience in softwaretesting and building automation frameworksfor various applications. She is currentlyworking as a software test engineer atSymantec in Mountain View, California. Shecompleted her MS in computer science atOregon State University specializing in soft-ware testing. She is passionate about learn-ing new technologies and keeping herself upto date with rapid technological advances in
software product development.
Margaret Burnett is a professor in OregonState Universitys School of Electrical Engi-neering and Computer Science. Her currentresearch focuses on end-user programming,end-user software engineering, informationforaging theory as applied to programming,and gender differences in those contexts.She is also the principal architect of theForms/3 and the FAR visual programminglanguages and, together with Gregg Rother-mel, of the WYSIWYT testing methodology
for end-user programmers. She was the founding project director ofthe EUSES Consortium, is currently on the Editorial Board of ACMTrans. Interactive Intelligent Systems and of IEEE Trans. SoftwareEngineering, is on the ACM/IEEE ICSE’14 (International Confer-ence on Software Engineering) Program Board and the ACM DIS’14 (ACM Conference on Designing Interactive Systems) ProgramCommittee, and has in prior years served on a variety of other ACMand IEEE conference program committees, chairing a few of them.She also co-chairs the Academic Alliance of the National Center forWomen In Technology (NCWIT).
Weng-Keen Wong Weng-Keen Wong is anAssociate Professor in Computer Scienceat Oregon State University. He receivedhis Ph.D. (2004) and M.S. (2001) in Com-puter Science at Carnegie Mellon University,and his B.Sc. (1997) from the University ofBritish Columbia. His research areas are indata mining and machine learning, with spe-cific interests in human-in-the-loop learning,anomaly detection and Ecosystem Informat-ics.
Simone Stumpf is a Senior Lecturer (As-sociate Professor) in the Centre for Human-Computer Interaction Design at City Univer-sity London, UK. She received her Ph.D. inComputer Science (2001) and her B.Sc. inComputer Science with Cognitive Science(1996) from University College London. Herresearch interests focus on end-user pro-gramming and end-user development of in-telligent systems, information systems, andphysical prototypes. She is particularly in-
terested in explanations, control, and trust as issues in end-userinteractions. She is a member of the End Users Shaping EffectiveSoftware (EUSES) consortium, an international collaboration to de-velop and investigate technologies that support end-users to directlyinfluence software behaviour. Dr. Stumpf also has professional in-dustry experience as a User Experience Architect.
Shubhomoy Das Shubhomoy Das is a Ph.D.student in Computer Science at OregonState University. His research area is Ma-chine Learning. After receiving his Bache-lors in Electrical Engineering (2000) fromGovernment Engineering College, Jabalpur,India, he worked in the IT industry acrossmultiple domains (Media/Publishing, Ship-ping and Logistics, Retail.)

20
Amber Shinsel Amber Shinsel graduatedfrom Oregon State University with a de-gree in Computer Science in 2011. She nowworks in a research lab in Intel’s Softwareand Services Group. Her research interestsinclude human computer interaction and userexperience.
Forrest Bice Forrest Bice is wrapping uphis undergraduate degree in Computer Sci-ence at Northeastern University. His inter-ests include software engineering, human-computer interaction, and most recently per-sonal health informatics.
Kevin McIntosh After graduating from Ore-gon State University in 2011 with a B.Sc.in Computer Science, Kevin McIntosh be-came employed as a Graphics ValidationEngineer at Intel in Folsom, California spe-cializing in development of internal hard-ware validation tools. In addition to his ex-tensive work in shader validation and buildmanagement, he is one of the Folsom siteleads for Intel’s LGBT Employee ResourceGroup. His projects have ranged from Intel’s
It Gets Better video to developing and supporting continuous inte-gration/build/release software to large customer bases.
Related Documents


