Yosemite Valley: Hydrologic Regime, Soils, Pre-Settlement Vegetation, Disturbance, and Concepts for Restoration 1899 1961 2006 David J. Cooper, Ph.D. and Evan C. Wolf, M.S. Department of Forest, Rangeland and Watershed Stewardship Colorado State University, Fort Collins, CO 80523 September 2008

Welcome message from author
This document is posted to help you gain knowledge. Please leave a comment to let me know what you think about it! Share it to your friends and learn new things together.
Transcript

Yosemite Valley: Hydrologic Regime, Soils, Pre-Settlement Vegetation,
Disturbance, and Concepts for Restoration
1899 1961
2006
David J. Cooper, Ph.D. and Evan C. Wolf, M.S. Department of Forest, Rangeland and Watershed Stewardship
Colorado State University, Fort Collins, CO 80523 September 2008

Introduction
Restoration of ecosystems that have been altered by human activity has emerged as a
fundamental challenge for contemporary ecologists and land managers. Successful
restoration requires understanding the characteristics and functioning of ecosystems that
occurred prior to disturbance, the physical drivers that supported them, and the range and
intensity of impacts that may have disturbed the site. It is also critical to understand the
feedbacks that may potentially inhibit the restoration of desired conditions (Suding et al.
2004).
Anthropogenic alteration of hydrologic processes is one of the most common impacts
to wetland and riparian ecosystems, and includes the damming of rivers (Collier et al. 1999),
water diversions (Chimner and Cooper 2003), ground water pumping (Cooper et al. 2002;
Cooper and Wolf 2006), ditching to lower water tables (Cooper et al. 1998, Patterson and
Cooper 2007), and irrigation to artificially wet dry areas. These impacts could be purposeful,
such as ditching a meadow to dry it out for hay production or forestry, or inadvertent, such as
the installation of a sewer line or road fill that blocks or diverts surface or ground water flow
from hydrologically connected ecosystems (Patterson and Cooper 2007). These hydrologic
effects can cascade down gradient lowering ground water levels, reducing the duration of soil
saturation and anoxic conditions, and altering soil forming processes and vegetation
composition (Merritt and Cooper 2000). Indirect feedbacks also may change land uses that
influence human use of floodplains and stream bank stability. Consequently, the restoration
of degraded ecosystems may require mitigating indirect as well as direct effects of the initial
impacts.
1

Restoration Concepts
Restoration includes the set of actions that bring an ecosystem back to its former
condition (van der Valk 2006). This can be accomplished only if a complete understanding of
the pre-existing ecosystems can be developed, impacts to these ecosystems can be removed,
and the climate and environmental conditions will still support those ecosystems (Williams
and Jackson 2007). Setting restoration goals in a national park must begins with the mission
of the land management agency. The National Park Service mission is to restore natural
processes. The earliest time for which natural processes are documented for Yosemite
National Park is the middle to late 1800s. This period is well-documented because the area
has a rich history of mapping and photography since the time of settlement.
Research is necessary to determine the characteristics of pre-settlement ecosystems
and the cumulative impacts created by settlement in Yosemite Valley. The bulk of this report
details our analyses of hydrologic processes, soils, and vegetation that provide indicators of
the pre-settlement conditions and the ecosystems they likely supported. From the maps and
photographs, perspectives of presettlement hydrologic regimes and vegetation can be
developed and formulated into a valley wide concept for restoration. As is commonly the
case in the restoration of degraded systems recovery may require mitigating secondary effects
as well as reversing the direct effects of the original stressor.
2

Study Sites
The restoration area includes parts of Upper and Lower River, and Upper and North
Pines Campgrounds. The study area extended north and south of the campground area to
allow hydrologic, soils and vegetation analyses that extended from valley wall to valley wall
in the region of these campgrounds. Meadows not included in the campground restoration
were uses as reference sites, including Ahwahnee, Stoneman, Sentinel, Bridalveil, Cooks and
El Capitan (Figures 1, 2). A number of oak and pine forest reference sites, and riparian
reference sites were also analyzed. These reference sites were selected in areas that, to the
best of park staff knowledge, have been minimally impacted by human activities. In the case
of forested reference areas, efforts were to locate stands that are little disturbed since
European American settlement.
Methods
Historical Analysis
The earliest records of Yosemite Valley are written reports from Clark (1855, cited by
Gibbens and Heady 1964). Several maps of valley landforms and vegetation along with
ownership plats were created in the 1860s (Kind and Gardner 1865, Hoffmann 1867, Whitney
1868) (Figures 3, 4, 5). Photographs of the valley date from the 1850s and were sold as
tourist souvenirs. Relatively few early photos show the landscape well enough to make
conclusive decisions about the vegetation, stream channel width, or hydrologic processes, but
several excellent photos are available (Figures 7, 8).
3

Hydrology
A total of 127 ground water monitoring wells were installed in transects across the
study area and in reference meadows (Figure 12). The location of wells in the campground
area is shown in Figure 13a. Additional wells were installed in other meadows that were used
as reference areas, ie. Liedig and Sentinel (Figure 13b), El Capitan (Figure 13c), and
Bridalveil (Figure 13d). Ground water monitoring wells were installed either into a pit
excavated with a backhoe (campground wells) or in hand augered holes. Wells were cased
with 3.175 cm (1¼ in) inside diameter, hand slotted, schedule 40 PVC pipe. Holes were
backfilled with native soil. Wells were installed deep enough to allow the water table to be
measured at any season. Wells were monitored weekly using an electronic tape during the
growing seasons of 2004, 2005, and 2006. During 2004 well installation and monitoring
occurred late in the summer, therefore data are available for only that later part of the growing
season. All wells were topographically surveyed for location and elevation to the nearest cm.
Soils
Soil morphology and organic matter content provide an important long-term
perspective of site hydrologic regime. Soil stratigraphy at each monitoring well was recorded
by horizon, noting soil texture, mottles, oxidized root channels, depleted matrix colors, and
other indicators of a persistently high water table, and the development of a hydric soil. A
soil sample collected from the upper 20 cm of each soil profile was analyzed for % organic
matter present by loss on ignition (Ball 1964).
4

The age of four buried logs was analyzing using 14C methods. The analyses were
performed by Beta Analytic, Miami, Florida. The goal of these analyses was to provide a
minimum age for the deposition of valley sediments that covered the logs.
Vegetation
Modern Vegetation
The vegetation composition and canopy cover by species was recorded for one 20 m2
plot centered on each monitoring well or soil pit. Vegetation data were analyzed using
indirect ordination with Detrended Correspondence Analysis (DCA) to identify the overall
structure and major vegetation gradients in the data set (Jongman et al. 1995). This analysis
was used to identify stands with similar vegetation composition, and to determine whether
stands with similar vegetation also had similar soils and water table depths. The DCA axes are
in SD (standard deviation) units. A change of 200 - 300 SD units along a DCA axis indicates
a complete change in species composition. For example, an axis with a gradient length of 600
units includes two complete changes in species composition.
Conifer Tree Age in Campgrounds
The point-quarter method was used to select 100 conifer trees in the campground area
for the collection of increment cores. Points were the monitoring wells, and the nearest tree in
each cardinal direction was cored. The goal of this analysis was to determine the approximate
timing of tree establishment. Cores were collected from as low on the bole as possible, but
represent minimum ages for each tree. There was no minimum size for trees to be included in
this sample. Cores were mounted on wooden blocks, sanded and the rings counted.
5

Results
Historical Analysis
Maps
Maps illustrating the characteristics of upper Yosemite Valley were created by
Whitney (1868), Hoffmann (1867), and King and Gardner (1865) (Figures 3, 4 and 5) and all
indicate that meadow and marsh complexes dominated the valley bottom. Trees, which likely
are Quercus kelloggii, were abundant on the valley margins. In addition, scattered trees are
drawn along the Merced River corridor, and likely are Populus trichocarpa (black
cottonwood) and/or Salix spp. (willows) with scattered Quercus and likely some Pinus
ponderosa. The maps clearly illustrate the broad extent of herbaceous dominated vegetation,
and the marsh symbols on the Whitney and King and Gardner maps indicate that wetland
conditions occurred.
From these maps and additional reports the area of wet meadows in Yosemite Valley has
been estimated six times between 1868 and 1982. A polynomial equation of meadow acreage
over time shows a significant (R2 = 0.9928) decline from approximately 800 to <350 acres (Figure
6), with most of the loss occurring between 1880 and 1930. Articles documenting “vanishing
meadows” in Yosemite Valley were published as early as 1943 by Ernst (1949).
Ground Photographs
Historical ground photographs, matched in recent years, provide an excellent overview
of the types and spatial extent of vegetation changes that occurred during the past 100+ years
in Yosemite Valley. The photos from Columbia Point show a tremendous increase in conifer
tree cover (largely Pinus ponderosa) from 1899 to 2006 (cover and Figure 7). Large expanses
6

of meadow, with scattered Quercus and what appear to be Populus trees can be seen in the
early photograph. However in 2006 only Cooks and Sentinel meadows are visible as
remnants of the formerly large meadow area. Drainage ditches and roads are prominently
seen on the 1899 photo, and conifer invasion, apparent by the numerous small trees, was
occurring. However, by 1899 considerable meadow invasion by conifers have already
occurred, and Galen Clark, the state’s first “Yosemite Grant guardian” reported that during
his first visit to the valley in 1855 the area of “clear open meadow ground” was at least four
times as large as at the present time, 1894 (Gibbens and Heady 1964). Therefore, the photo
record, and the data on meadow extent provides only a minimum estimate of the area of
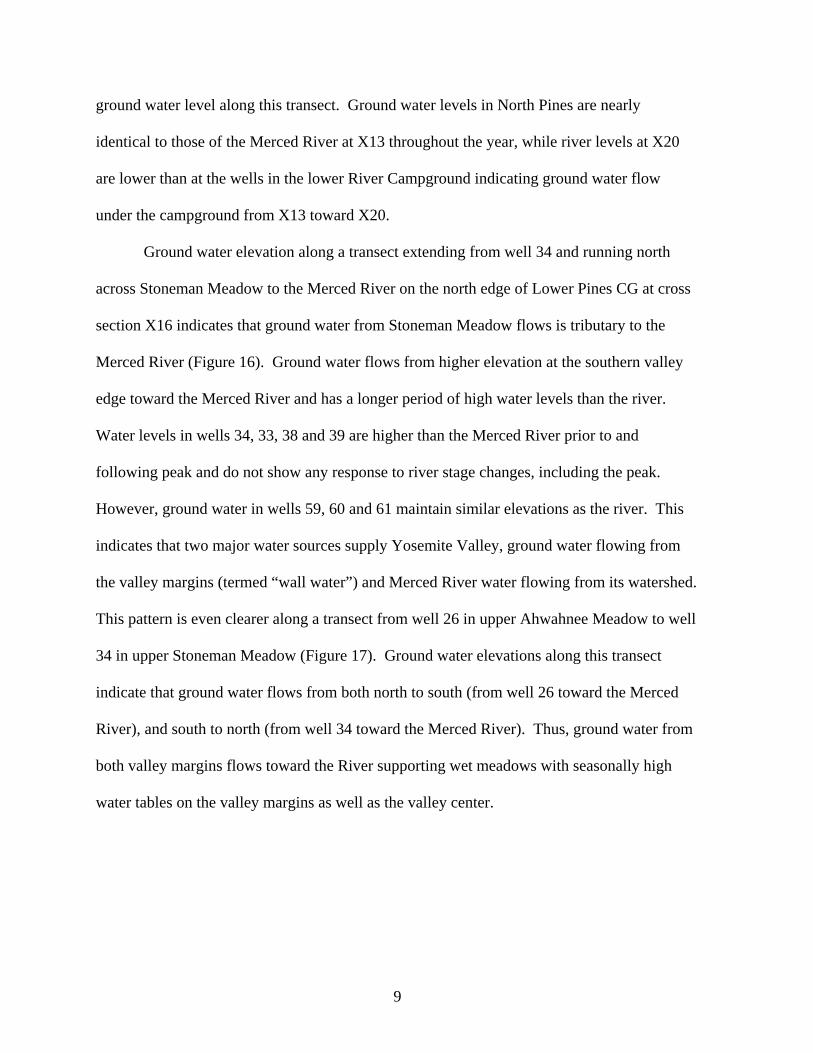
meadows that existed in the middle 1800s. The photos of Grizzly Peak and Glacier Point
(Figure 8) show the loss of riparian Populus and Salix species, loss of undercut banks and a deep
channel, and an increase in Pinus resulting in a taller canopy.
Hydrology
Merced River Flows
The Merced River is a snowmelt driven stream that is periodically influenced by rain
on snow flood events. Winter snow accumulation and normal spring melting produce annual
instantaneous peak flows of 5,000 ft3/s to 12,000 ft3/s (Figures 9 and10), which typically
occur in May. Rain on snow events have produced the largest floods with flows exceeding
20,000 ft3/s in 1937, 1950, 1955, and 1997 at the Pohono Bridge gauge, all during winter
months. Late summer flows, from late July through October are very low, because the dry
and hot summers produce little precipitation (Figure 11).
7

During the study period, 2004 had a low snowpack winter, with the lowest peak flows
since 1994 (Figures 9, 10, 11). Even lower flows occurred in 2007, after this study was
concluded. Very large spring snowmelt driven stream flows occurred in 2005 and 2006
(Figures 10, 11), with 2005 having one of the two largest spring flows on record at the Happy
Isles gauge, and 2006 being only slightly lower.
Variation in ground water table depth and duration across the valley
The location of wells in the campground area is shown in Figures 12 and 13 (a-d).
Water table elevation along a transect through the former Upper and Lower River
campgrounds from well 3 to well 11 indicates that ground water at these wells is
hydrologically connected to the flow and stage of the Merced River (Figure 14) as measured
at river cross section 28 (X28). The nearly identical pattern and magnitude of river stage and
ground water rise and fall indicates that stream water is flowing through the coarse gravels of
this floodplain area. At peak stage in late May 2005, wells 1, 2 and 3 have higher water levels
than the Merced River at X28, but during the rest of the year, the ground water is lower than
river stage on the downstream end of the cross section. This suggests that at high river stage,
water is flowing from well 3 through the bar, likely recharged by the Merced River near X20
on the upstream portion of this transect. During most of the summer, the Merced River at the
downstream end of this transect has a higher elevation than ground water and the river is
supplying water to the ground water system at all times.
A transect from wells 73, 70 and 69 in North Pines campground through wells 46, 55,
60, and 63 in Lower Pines campground illustrates similar hydrologic processes (Figure 15).
Stream stage at cross sections X13 and X20 controls the elevation and seasonal pattern of
8
ground water level along this transect. Ground water levels in North Pines are nearly
identical to those of the Merced River at X13 throughout the year, while river levels at X20
are lower than at the wells in the lower River Campground indicating ground water flow
under the campground from X13 toward X20.
Ground water elevation along a transect extending from well 34 and running north
across Stoneman Meadow to the Merced River on the north edge of Lower Pines CG at cross
section X16 indicates that ground water from Stoneman Meadow flows is tributary to the
Merced River (Figure 16). Ground water flows from higher elevation at the southern valley
edge toward the Merced River and has a longer period of high water levels than the river.
Water levels in wells 34, 33, 38 and 39 are higher than the Merced River prior to and
following peak and do not show any response to river stage changes, including the peak.
However, ground water in wells 59, 60 and 61 maintain similar elevations as the river. This
indicates that two major water sources supply Yosemite Valley, ground water flowing from
the valley margins (termed “wall water”) and Merced River water flowing from its watershed.
This pattern is even clearer along a transect from well 26 in upper Ahwahnee Meadow to well
34 in upper Stoneman Meadow (Figure 17). Ground water elevations along this transect
indicate that ground water flows from both north to south (from well 26 toward the Merced
River), and south to north (from well 34 toward the Merced River). Thus, ground water from
both valley margins flows toward the River supporting wet meadows with seasonally high
water tables on the valley margins as well as the valley center.
9

Water Table Profiles
The ground surface and water table elevation profile across the Rivers Campgrounds
(Figure 18) indicates that the elevation of Merced River stage at X20 is always higher than
ground water and the river is strongly losing into the ground water system. The downstream
river cross section X28 also has a higher stage than adjacent ground water monitoring wells
10 and 11 at all times. Thus, this reach is also losing. We would expect that ground water
flowing from X20 under the Rivers Campground would be higher than the river at X28 and
flow into it. Because the Merced River is losing on both the upstream and downstream
portion of this transect it suggests that drain(s) may exist in the campground area.
The water table elevation profile from well 34 through Stoneman Meadow and across
Lower Pines campground to river cross section X16 shows river elevation is higher at peak
stage in May 2005 and 2006 than wells 59, 60 and 61. Thus, the river is losing water to
ground in the northern portion of the campground (Figure 19). However, ground water levels
in upper Stoneman Meadow (wells 34 and 33) are always higher than water in other wells and
ground water flows from Stoneman Meadow toward the Merced River. Wells 34, 33, 38, 39,
40 and 41 are supported by ground water flowing down Stoneman Meadow during the late
summer, while wells 59, 60 and 61 appear connected to and approximately the same elevation
as the Merced River.
The water elevation profile across the valley from well 26 to 34 (Figure 20) clearly
shows ground water supported areas on both sides of the valley and an area connected to the
Merced River in the valley center (X20, wells 7, 1, 6). Thus, both ground water supported,
and stream water supported areas occur in the valley.
10

Water Table Maps
Water tables elevations and flow directions are more easily visualized as contour
maps. The maps provide a broad view of water table gradients and overall flow directions
than is possible from examining individual profiles or well hydrographs. Data presented in
Figures 22-25 support the concepts developed using well hydrographs and water table
profiles; that multiple flow paths occur, including those from the south and north valley walls,
and these enter a third system in the valley center that is supported by and connected to the
Merced River. The ground water gradient from valley edge to valley center is steep in the
early summer as illustrated by the 17 May 2006 water table map (Figure 22). Ground water
contours in lower Pines campground bend where ground water from Stoneman Meadow
meets ground water flow system supported by the Merced River. However by mid to late
summer, river stage declines more than floodplain ground water levels (Figure 25), and the
gradient from meadows toward the Merced River increases. The importance of ground water
flow from the valley walls increases as the summer progresses, supporting meadow water
tables throughout the valley.
Soils
Several soil features were used to identify the long-term hydrologic regime and
vegetation of the study area. Long-term saturation and anoxic condition are indicated by the
presence of mottles, low chroma colors, depleted soil matrices, and the formation of oxidized
root channels in mineral soils (US Army Corps of Engineers 2008) (Figures 26, 27). These
features were identified in the upper parts of many soils, and the depth to mottling at each
monitoring well was used to produce a map (Figure 28). Many study area soils had been
11

heavily disturbed by plowing, drainage, and other activities in the past and some hydric soil
features may have been obscured or destroyed. A second character of seasonally or
perennially wet soils is the preservation of soil organic matter or soil carbon (Figure 26a). It
takes a very long time to accumulate organic matter in soils, for example, peat soils in
montane wetlands occurs at a mean rate of ~20 cm/1000 years (Chimner and Cooper 2003).
High organic content wet meadow soils also indicates great antiquity, as do mottles and
gleying. In temperate climates soils do not form or change rapidly, thus the presence of hydric
features in the upper soil profiles indicates that the study area soils were saturated regularly and
for long duration for many centuries.
Most of Ahwahnee and Stoneman Meadows have hydric soil features in the upper
parts of their soils. Only the area near Curry Village, the Ahwahnee Hotel, and areas along
the Merced River lack hydric soil features. This suggests that historically soils in most of the
study area were saturated for long duration during the growing season.
Percent soil organic matter is another excellent indicator of past hydrologic regimes.
Saturated soil conditions inhibit decomposition of organic matter, which results in high soil
organic matter content. Frequent, low intensity fires, like those set by Native Americans
within the valley, typically burn off dry above-ground plant matter and are not hot enough to
burn off soil carbon or belowground biomass. Because organic matter deposited on the
ground surface is exposed to air (thus decomposing rapidly) and fire, the primary process by
which organic matter reaches high levels in soils is through belowground biomass additions
(root growth) (Chimner and Cooper 2002). Grasses, sedges, and meadow plants produce high
belowground biomass and increase soil carbon by introducing this organic matter directly into
wet soil conditions where it remains largely undecomposed. Most farm soils have 3 to 4 %
organic matter, and tall grass prairie on the American Great Plains has 3 to 7 % (Weaver
12

1954). Conifer forest soils in summer dry climate zones like the Sierra Nevada, and riparian
forests on newly formed soils have low organic matter content. Fens, have >24 % organic
matter content (USDA 2005).
Reference meadows in Yosemite Valley (including wet and dry meadows) averaged
12.5 % organic matter, oak forests 7.0 %, mixed conifer forest 2.9 %, and riparian areas 1.8 %
(Figure 29). The Upper River, Lower River, Lower Pines and North Pines campgrounds had
mean organic contents of 8.4, 6.1, 4.6, and 7.0 %, respectively. Of the 36 campground sites, 9
have soil OM similar to meadows, 18 similar to oak forest and meadow margins, and 9 pine
forest or riparian soils.
Much of Ahwahnee and Stoneman Meadows have organic content > 6 to 8 % (Figure
30) reflecting values that would be anticipated in oak forests and meadows. In addition, large
areas of Upper and Lower River CGs and part of North Pines CG also have high organic
content. The high organic content indicates that these areas historically were meadows and
oak savannahs. Much of Lower Pines CG has lower organic content (mean of 4.6 %). This
area is repeatedly disturbed by floods, and has thick recent fluvial deposits of sand and gravel.
Age of Buried Wood
One sample buried 220 cm below the surface was found at well 22, in the
southwestern corner of Ahwahnee Meadow (Figure 31). This site is close to the Merced
River. The sample was 520 ±40 years BP (Beta 205422). A second buried sample collected
from 250 cm depth had a radiocarbon age of 650 ±40 years BP (205423). One sample
collected from 240 cm depth at well 66 in the lower portion of Lower River Campground had
a radiocarbon age of 5000 ±40 years BP (205424). This site is also close to the Merced River.
13

The last sample, collected from well 86 at 140 cm depth had a radiocarbon age of 1980 ±40
years BP 205425). The three samples that range from 500-650 years BP indicate a period of
floodplain building occurred at that time. These sites (well 22 and 66) are both close to the
Merced River, and likely were point bars at the time of deposition since the wood was
deposited in a large gravel matrix, and more than two meters below the current landscape
surface.
The sample from well 86 was found on the northeastern side of Stoneman Meadow in
a layer of coarse sand and gravel with cobbles. The gravel and cobbles in this site extend to
within 60 cm of the soil surface. Above that the soils are a dark brown sandy loam. This
sample indicates that the lower soils in this part of Stoneman Meadow are much older, nearly
two thousand years, and has allowed sufficient time for the development of an organic rich
meadow soil above it.
Vegetation
Conifer Tree Establishment
Most conifer trees in our sample established in the period from the late 1860’s through
the early 1930’s (Figure 32). By 1900 conifers were abundant in the campground area and
growing large enough to have an impact on site visual characters, litter quality, sunlight
reaching the ground and understory vegetation. The timing of conifer invasion matches the
comparative photos, particularly the photo from Columbia point from 1899 (Figure 6) that
shows conifer trees on the Merced River floodplain.
14

Location of Quercus kelloggii trees in the campgrounds
In Yosemite Valley the current habitat of Quercus kelloggii includes meadow edges
and talus fields on valley margins. The distribution of older trees (greater than ~125 years
old) in the study area can indicate the location of historic meadow margins (Figure 33). Most
Q. kelloggii mapped are large, likely >125 years old, and occur below taller Pinus ponderosa
and Calocedrus decumbens trees. Individual Q. kelloggii are scattered throughout the
campgrounds, suggesting that these areas historically were not conifer forests, and likely were
riparian areas, wet meadow margins, or Quercus savannahs.
Vegetation of Yosemite Valley
DCA analysis of vegetation stand floristic composition data indicates that a wide
range of vegetation types occur in the study area (Figure 34). The DCA axes have a gradient
length of 600 SD units along both axes 1 and 2 indicating high species turnover within the
ordination space. The left side of the ordination space is occupied by conifer forest stands
dominated by Pinus ponderosa and Calocedrus decurrens with varying understory
composition, but dominated by Bromus tectorum and Conyza canadensis. The top portion of
the ordination space is occupied by riparian stands dominated by Alnus rhombifolia, Populus
trichocarpa and Salix spp. as well as monocultures of Carex vesicaria, a sedge species that
occupies deeply flooded ox bow ponds and other basins. The bottom left portion of the
ordination space is occupied by stands of Quercus kelloggii that occur on wet meadow
margins. The central portion of the ordination space is occupied by wet meadows with
floristic composition varying from sites with deep summer water tables and supporting Poa
15

pratensis, Agrostis stolonifera, and Leymus triticoides to sites with seasonally saturated soils
dominated by Carex lanuginosa. The bottom right portion of the ordination space is occupied
by stands dominated by the wettest meadow stands, particularly those dominated by Carex
senta and which occur in Bridalveil and Cooks Meadows.
DCA Axis 1 stand axis scores are negatively correlated with August water table depth
and soil mottle depth, indicating that sites with seasonally high water tables occur on the right
side of the ordination space, and those with deeper water tables on the left. These correlations
are not strong, suggesting that the vegetation does not reflect the current hydrologic
conditions of the valley. Thus, conifer forests may occupy sites that are hydrologically
similar to Quercus dominated savannahs and some meadows. The current vegetation patterns
are due to the lack of fire over the past 150 years, and a somewhat lower water table under the
forest stands. The main vegetation types are illustrated in Figure 35 (a-d). In addition, there
is no correlation of DCA Axis 1 with stand % soil organic matter indicating that highly
organic soils can occur under both wet meadows and conifer forest stands.
Percent soil organic matter for each stand plotted using DCA axis 1 and 2 scores
indicates that highly organic soils occur in many vegetation types, including wet meadows
and conifer forests (Figure 36). Riparian areas generally have low soil organic matter content.
The presence of high organic content in conifer forests indicates that these forests formed in
former meadows.
Depth of soil mottles plotted using stand DCA axis 1 and 2 scores indicates that
meadows all have mottles near the soil surface (Figure 37). Conifer forest stands have both
deep and high mottles, suggesting that stands with high mottles have formed in former
meadows.
16

Discussion, Synthesis and Restoration Options:
Water sources, hydrologic regimes and potential natural vegetation of the
campground area
Two main water sources supply the eastern portion of Yosemite Valley, ground water
flowing from the north and south valley walls toward the Merced River, and Merced River
water that supplies the floodplain ground water flow system. Based upon the 2005 Merced
River water year, we have identified portions of the study area that are (a) largely ground
water fed during large water years, such as 2005 and 2006, and (b) areas that are
hydrologically connected to the Merced River (Figures 38, 39). Ground water driven areas
with seasonally or perennially high water tables are wet meadows, and have high soil organic
matter content. Using hydrologic patterns and processes observed during the study period we
have divided the study area into a riparian zone, supported by periodic Merced River over
bank floods and ground water recharged and controlled by the River, and meadow zones
supported primarily by ground water from hillslope sources.
The potential vegetation of the riparian zone includes woody plant species present in
historic photographs and that are still present in small populations in the study area. These
include species that establish on bare and wet mineral soil, such as black cottonwood
(Populus trichocarpa), alder (Alnus rhombifolia), and willow (Salix exigua) (Figure 34D).
Stands of Quercus kelloggii also were abundant historically, and still occur on meadow and
valley margins. Many individual Q. kelloggii trees are present beneath the Pinus and
Calocedrus dominated canopy in the Upper and Lower River and Lower and North Pines
17

campgrounds (Figure 34B) and areas with high density of large Quercus trees likely
supported wet meadow and Quercus dominated stands in a mosaic with other community
types.
Several wet meadow community types occur in the study area, dominated by Carex
senta, C. lanuginosa, Agrostis stolonifera and Poa pratensis (Figure 34A). Areas suitable for
each community type are determined by the long-term summer maximum water table depth
and its duration. A typical hydrograph for five major wet meadow and Quercus communities
is shown in Figure 40, illustrating important differences in early and late summer water table
depth.
Hydrographs for reference community types can be used to set hydrologic restoration
goals for portions of the study area that contain organic rich soils but have deep summer water
tables today and/or support conifer vegetation. A key aspect of hydrologic restoration is the
systematic removal of alternations to natural surface and ground water flow processes in the
study area. Stoneman Meadow (Figure 41) south of the road has a longer duration high water
table than areas north of the road, indicating that the road or any below ground utilities may
blocks or capture water flow. A hiking trail and channel on the south side also interfere with
natural flows. Buried drains may be present in and around Curry Village, particularly near
buildings, roads, and the parking lot that surrounds the apple orchard.
A large area of fill is present in the southwestern corner of Ahwahnee Meadow. In
addition a sewer line bisects the meadow, a ditch runs the meadow length, and drains or pipes
occur in the northeastern corner of the meadow (Figures 42, 43). Surface water draining
toward Ahwahnee Meadow from the northwest is captured in ditches and drained west before
18

it reaches the meadow. The effects of these hydrologic impacts could be prioritized and
addressed in restoration planning (Patterson and Cooper 2007).
The campground areas have experienced extensive Merced River bank trampling,
bridge construction which altered surface water flow, and paving and utility placement over
campground area soils. Our backhoe pit excavations, as well as borings by Jones and Stokes
(2002) indicate that very little fill has been placed into the campground areas. Ground water
profiles indicate that the Merced River loses groundwater to the Upper and Lower River
Campgrounds. This may be due to the presence of a sewer line or other below ground
structures that divert groundwater. Tree invasion likely has occurred due to hydrologic
alterations, as little conifer invasion occurs in the natural portions of Stoneman, Ahwahnee,
Cooks, Sentinel, Bridal Veil and other meadows in the study area.
An important factor to research in the future is how the Merced River channel width
has changed during the past 150 years (Madej et al. 1994). A wider river channel would
produce lower river stage for any flow, and reduce ground water levels under the
campgrounds and overbank flood frequency. These factors could have dried the campground
soils sufficiently to allow conifer invasion. Reports of the removal of boulders from a El
Capitan terminal moraine downstream from El Capitan Meadow have documented a potential
river stage reduction extending several miles upstream from the moraine, but not reaching the
area of the campgrounds (Milestone 1978).
19

Summary and Synthesis
Two water sources produce different ecosystem types on the floor of Yosemite Valley.
Ground water from valley walls, including water from bedrock and talus slopes recharged by
rain and snowmelt and small streams that flow from above the valley rim and lose their water
into valley margin alluvial fans, flow toward the valley center supporting seasonally high and
stable water tables. This hydrologic regime supports wet meadows which have formed highly
organic soils, and in one case a fen (Happy Isles). The second water source is the Merced
River, fed by its large watershed, and daily discharges that over the year vary by several
hundred-fold. Merced River overbank floods occur periodically from winter rain-on-snow
events, such as occurred in 1997 (Figure 11), and large spring snowmelt driven flows as
occurred in 2005 and 2006. Overbank floods may deposit sediment onto the floodplain, erode
banks, and rework point bars.
Understanding, characterizing and distinguishing portions of the valley supported by
these two types of these flow systems is a critical component of identifying the restoration
potential for any portion of Yosemite Valley. Some portions of the valley are riparian
ecosystems that are hydrologically and geomorphically connected to and influenced by the
Merced River. However, a larger portion of the valley is supported by ground water flowing
toward the Merced River, and historically supported wet meadow ecosystems (Figures 4, 5, 6,
10). Areas with predominantly riparian or wet meadow hydrologic regimes, based upon
measured hydrologic regimes, soils and vegetation, are identified in Figure 37. The
restoration goals for these two areas should be distinctly different, as described below.
The hydrologic restoration goal for wet meadows should be a water table near the soil
surface from April through mid July of most years (see Figure 40), with the water table depth
20

slowly declining during the summer. The water table goal for any area should be decided
based upon the soil organic matter content, landscape position, and current hydrologic regime
compared with suitable reference areas. The interannual frequency and duration of soil
saturation and inundation driven by the water table as well as the late summer water table
depth influence the floristic composition of meadow communities (Allen-Diaz 1991). In
Yosemite Valley a gradient of wet meadow communities occurs, as shown in Figure 34. The
wettest meadows are saturated to the surface for most of the summer and are dominated by
the tussock forming Carex senta. Meadows that are saturated to the surface on many years,
but have deeper water tables by mid summer are dominated by Carex lanuginosa. Meadows
that are saturated to the surface only in wet years and regularly have deeper water tables
during the summer are dominated by exotic grasses Agrostis stolonifera and Poa pratensis
with many herbaceous species present. The restoration of wet meadows is critical in
Yosemite Valley because the drying of soils is leading to the loss of soil carbon and the soil
seed bank, which will make restoration in the future increasingly difficult.
The existing portions of Stoneman and Ahwahnee Meadows represent less than 50%
of the meadow area that existed in the upper Yosemite Valley in the middle to late 1800’s.
The remaining area is now influenced by resort development or supports conifer forest.
Conifer forests support relatively low herbaceous species cover, yet much of the herbaceous
cover and biodiversity in Yosemite Valley has been and continues to be in the wet meadows.
Conifer trees likely colonized former meadows due to several reasons: (1) hydrologic changes
such as drains and water diversions lowered the summer water table making the sites suitable
for trees, or widening of the Merced River, (2) the cessation of burning by Native Americans
allowed fire sensitive species to persist (Anderson et al. 1991), (3) disturbance of the
21

meadows by plowing and planting of hay crops and the development of apple orchards
allowed conifer to invade the bare soils after the rhizomatous meadow species were
destroyed, and (4) fill placed to raise the ground elevation allowed upland species to invade.
Meadow restoration should begin with removal of all known impacts to surface and
ground water flow. Over the past 100+ years Yosemite Valley has experienced numerous
alterations of water flow. Restoration should be a step by step process, with one project to fill
a ditch or eroded channel, remove fill, with follow up monitoring to determine the effects of
each action. Our work, as well as that by Jones and Stokes (2002) evaluating soils in the
Rivers and Pines campground complex showed that few areas have been filled, and fill is only
a few cm thick where it has been placed. Thus, filling is not a major cause of landscape
change, other than in the southwestern corner of Ahwahnee Meadow. The role of fire in
killing conifers invading meadows cannot be replicated through resources management
activities, however periodic removal of invading conifers might be desirable in some
circumstances. Conifer removal will be necessary in areas where water tables are effectively
raised because the high water table could destabilize the tree root systems. This will also
prepare areas for the planting of Carex and other meadow species once natural water table
dynamics are restored.
Riparian areas have periodic been flooded by the Merced River, creating largely sand
and gravel soils and a water table controlled by river stage. These areas naturally support a
relatively broad (see Figure 7, historic photo), and diverse woody community dominated by
species of Populus, Alnus and Salix mixed with Quercus kelloggii and a few conifer trees.
These native riparian species require full sun for seedlings to establish from wind and water
dispersed seed. However, there are too few Populus present to promote seedling
22

establishment, and too much trampling of potential seed beds on river point bars, intermittent
channels, and islands by summer visitors to allow seedlings to survive. Riparian areas could
be restored through direct plantings of dormant stems, rooted stems, and nursery grown
material. However, these restoration areas would require limited public access for several
years to eliminate trampling induced mortality. The area that could accommodate riparian
restoration is outlined in Figures 37 and 38. Many campground areas with deep water tables
may easily be restored to Quercus kelloggii forests which were part of the riparian zone stand
types in the 1800’s.
Acknowledgements
This research was funded by Yosemite National Park. We thank Sue Beatty, Lisa
Acree, Marty Acree, Victor Goldman, Jim Roche, Sue Fritzke, Russell Galipeau, Niki
Nicholas, Sarah Grove, Brenda Hanley, Denise Della Santina, Rachel Stanton, Monica
Buhler, Judi Weaser, and Louise Johnson all of the National Park Service for their assistance
in initiating and completing this work. We thank Joel Wagner of the NPS water resources
division for his assistance in many aspects of this work, and critical reviews by Joel Wagner,
Jim Roche, Peggy Moore and Jan van Wagtendonk. Field work by Colorado State University
staff was accomplished by the authors and Lisa Jeffs, Christopher Hazen, Jeremy Shaw, and
Edward Gage.
23

Literature Cited
Allen-Diaz, B. 1991. Water table and plant species relationships in Sierra Nevada meadows.
Am. Midl. Nat. 126: 30-42.
Ball, D.F. 1964. Loss-on-ignition as an estimate of organic matter and organic carbon in non-
calcareous soils. J. Soil Sci. 15:84–91.
Chimner, R.A., D.J. Cooper and W. J. Parton. 2002. Modeling carbon accumulation in Rocky
Mountain fens. Wetlands 22:100-110.
Chimner, R.A. and, D.J. Cooper. 2003. Carbon balances of pristine and hydrologically
modified southern Rocky Mountain fens. Canadian Journal of Botany 81:477-491.
Collier, M., J. Schmidt, R. Webb. 1999. Dams and rivers, a primer on the downstream effects
of dams. USGS circular 1126.
Cooper, D.J., L.H. MacDonald, S.K. Wenger, S. Woods. 1998. Hydrologic restoration of a
fen in Rocky Mt. National Park, Colorado. Wetlands 18: 335-345.
Cooper, D.J., D. D’Amico and M.L. Scott. 2003. Physiological and morphological response
patterns of Populus deltoides to alluvial groundwater pumping. Environmental
Management 31:215-226.
Cooper, D. J. and E. C. Wolf. 2006. The Influence of Ground Water Pumping On Wetlands
in Crane Flat, Yosemite National Park, California. Unpublished report to Yosemite
National Park, CA.
Ernst, E. F. 1949. Vanishing meadows in Yosemite Valley. Yosemite Nature Notes XXVIII,
pages 34-40.
Gibbens, R. P. and H. F. Heady. 1964. The influence of modern man on the vegetation of
Yosemite Valley. California Agricultural Experiment Station, Manual 36, University of
24

California, Berkeley, California.
Hoffmann 1867. MAP reproduced in Whitney 1868.
Jones & Stokes. 2002. Soil and topography evaluation of Upper Pines, Lower Rivers, Lower
Pines, and parts of the North pines campgrounds, Yosemite National Park.
Jongman, R. H., C. ter Braak, O van Tongeren. 1995. Data analysis in community and
landscape ecology. Cambridge University Press, Cambridge. 299 p.
Konen, M.E., P.M. Jacobs, C.L. Burras, B.J. Talaga, and J.A. Mason. 2002. Equations for
predicting soil organic carbon using loss-on-ignition for North Central U.S. soils. Soil
Science Society of America Journal. 66:1878-1881.
Madej, M.A., W.E. Weaver, and D.K. Hagans. 1994. Analysis of bank erosion on the Merced
River, Yosemite Valley, Yosemite National Park, California, USA. Environmental
Management 18: 235-250.
Merritt, D. M. and D.J. Cooper. 2000. Riparian vegetation and channel change in response to
river regulation: A comparative study of regulated and unregulated streams in the Green
River Basin, USA. Regulated Rivers: Research and Management 16: 543-564.
Milestone, J. F. 1978. The influence of modern man on the stream system of Yosemite
Valley. Master's thesis. San Francisco State University, San Francisco, California, 227 pp.
Patterson, L.S., D.J. Cooper. 2007. On-site and off-site hydrologic regimes influence
mountain fen restoration, Cascade Range, California. Wetlands 27: 290-304.
Suding, K. K. Gross, D. Housman. 2004. Alternative states and positive feedbacks in
restoration ecology. Trends in Ecology and Evolution 19: 46-53.
25

26
U.S. Army Corps of Engineers. 2008. Interim Regional Supplement to the Corps of Engineers
Wetland Delineation Manual: Western Mountains, Valleys, and Coast Region. J. S.
Wakeley, R. W. Lichvar, and C. V. Noble, eds., ERDC/EL TR-??-??, U.S. Army Engineer
Research and Development Center, Vicksburg, MS.
USDA. Natural Resources Conservation Service. 1999. Soil Taxonomy.
Van Der Valk, A. 2006. The biology of freshwater wetlands. Oxford University Press,
Oxford. 173p.
Weaver, J. E. 1954. North America prairie. Johnsen Publishing Company, Lincoln, NE.
Whitney, J. D. 1868. The Yosemite book. New York. Reproduced by the Bancroft Library,
Berkeley, CA.
Williams, J. W. and S. Jackson. 2007. Novel climates, no-analog communities and ecologic
surprises: past and future. Frontiers in Ecology and Environment 5: 475-482.

Figure 1. Aerial image of the Yosemite Valley study area. Reference meadows are identified, as well as the flooded campground restoration area.
Ahwahnee Meadow
Campground Restoration Area
Cooks Meadow
Leidig Meadow
SentinelMeadow
StonemanMeadow
El Capitan Meadow
Bridalveil Meadow
27

Figure 2. Aerial image of the campground study area. Shown are Ahwahnee Meadow (top center) and Stoneman Meadow (bottom right) and the Merced River.
North Pines CG
Stoneman Meadow
Lower Pines CG Upper
River CG
Lower River CG
28
Ahwahnee Meadow

Figure 3. Map of Yosemite Valley by J. C. Whitney, 1868. This map shows the valley to be covered primarily by wet meadows and scattered Quercus kelloggii woodland on the valley margins.
29

Figure 4. Plat of Yosemite Valley by C. Hoffmann, 1867. This map shows the valley to be largely wet meadows, with orchards shown in the area of Curry Village (A) and upper Pines (B).
B
A
30

Figure 5. Map of Yosemite Valley by King and Gardner, 1865. Scattered trees are shown, along with the same orchards illustrated in Figure 4.
31

Figure 6. Acres of meadow in Yosemite Valley from the 1860’s through 1980’s. Data from 1878 Wheeler, 1922 Russell, 1937 from Ernst published in 1949, 1960 from Gibbens&Heady published in 1964, amd NPS 1982.
y = 0.0752x2 - 295x + 289441R2 = 0.9928
0
100
200
300
400
500
600
700
800
900
1870 1890 1910 1930 1950 1970 1990
Mea
dow
Acr
eage
32

Figure 7. Photo looking east toward Half Dome from Columbia Point, 1899 and 2006. An increase in conifers and a decrease in Quercus and meadows are apparent. Also see report cover.
33
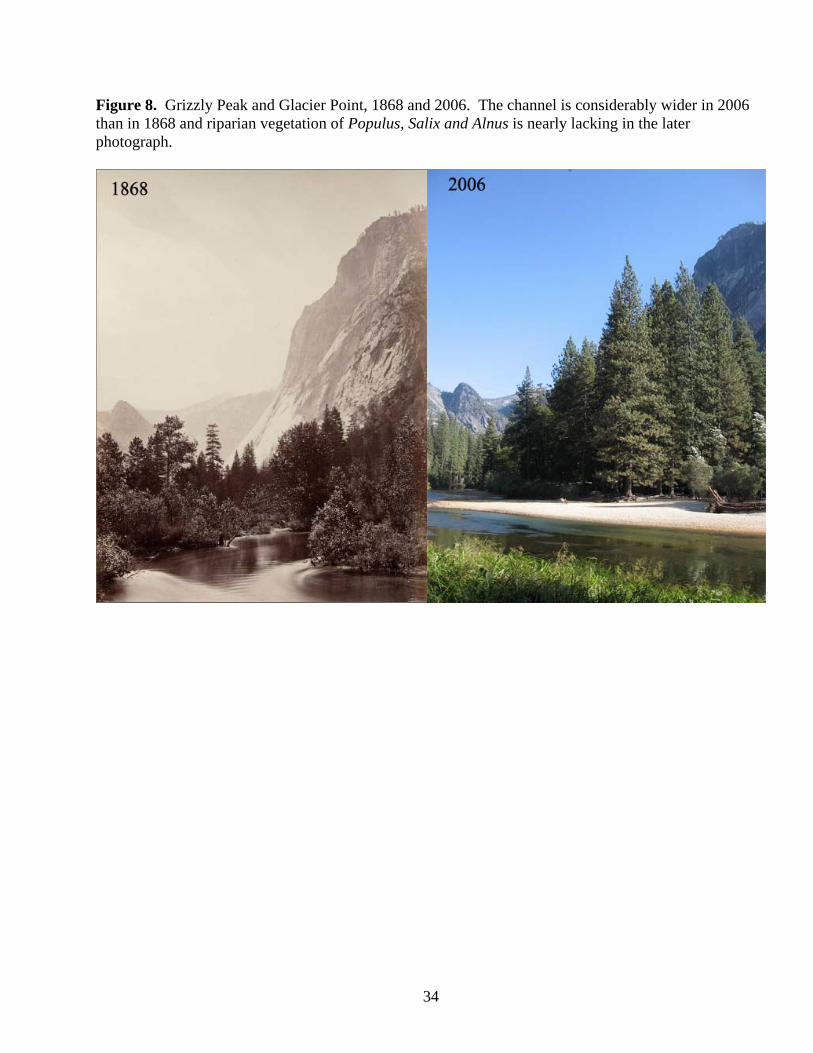
Figure 8. Grizzly Peak and Glacier Point, 1868 and 2006. The channel is considerably wider in 2006 than in 1868 and riparian vegetation of Populus, Salix and Alnus is nearly lacking in the later photograph.
34

Figure 9. Annual instantaneous peak stream flow for the Pohono Bridge and Happy Isles Bridge gauges along the Merced River.
1920 1930 1940 1950 1960 1970 1980 1990 2000
Pea
k Fl
ow ft
3 /s
0
5000
10000
15000
20000
25000
1920 1930 1940 1950 1960 1970 1980 1990 2000
Peak
Flo
w ft
3 /s
0
2000
4000
6000
8000
10000
Pohono
Happy Isles Bridge
Bridge
35
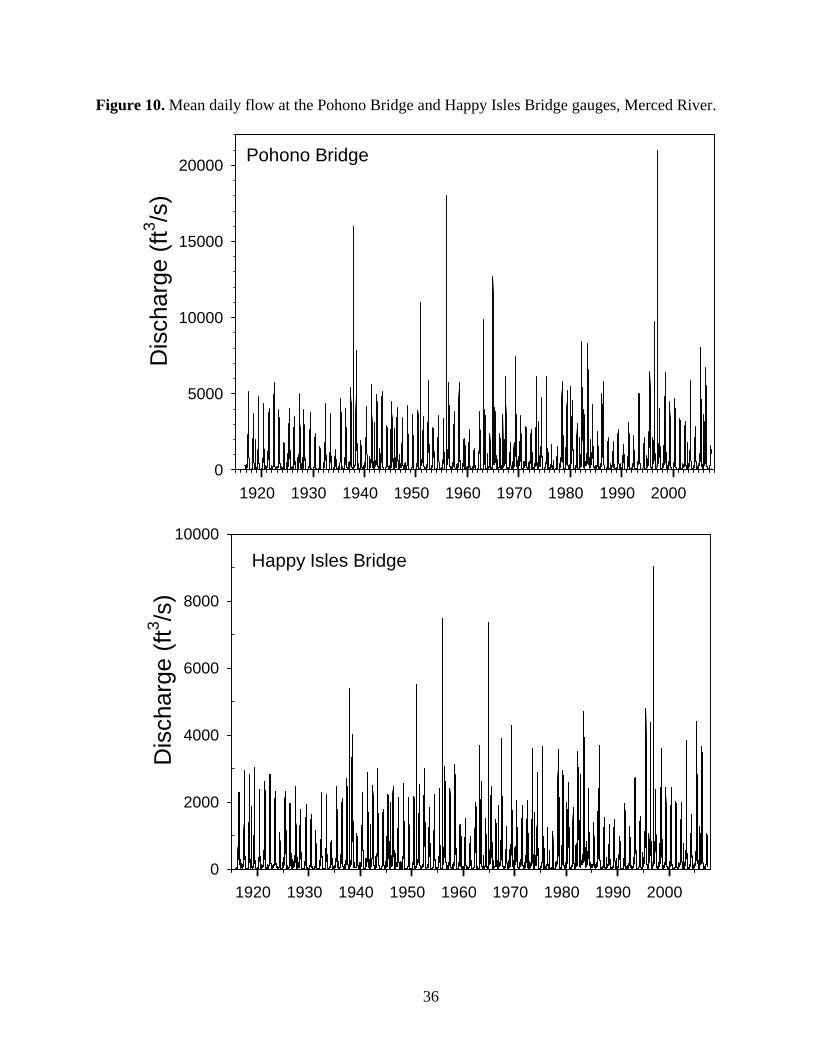
Figure 10. Mean daily flow at the Pohono Bridge and Happy Isles Bridge gauges, Merced River.
1920 1930 1940 1950 1960 1970 1980 1990 2000
Dis
char
ge (f
t3 /s)
0
5000
10000
15000
20000 Pohono Bridge
1920 1930 1940 1950 1960 1970 1980 1990 2000
Dis
char
ge (f
t3 /s)
0
2000
4000
6000
8000
10000
Happy Isles Bridge
36

Figure 11. Mean daily flow at the Pohono gauge during 2004, 2005 and 2006.
Jan Apr Jul Oct Jan Apr Jul Oct Jan Apr Jul Oct
Mea
n D
aily
Flo
w (f
t3 /s)
0
2000
4000
6000
8000
2004 20062005
37

Figure 12. Location of all monitoring wells in the study area, shown as red dots, reference sites in green, and USGS river gauges in blue.
38

Figure 13a. Location of monitoring wells, staff gauges (x), and profile lines (yellow, orange, and purple with figure references) in the campground study area.
39
Figure 13b. Location of monitoring wells in the Liedig and Sentinel Meadows study areas.
40

Figure 13c. Location of monitoring wells in the El Capitan Meadow study area.
41

Figure 13d. Location of monitoring wells in the Bridalveil Meadow study area.
42

Figure 14. Ground water elevation in wells 1, 2, 3, 9, 10, 11 in Upper and Lower River Campgrounds and surface water elevation at cross sections 20 and 28.
Ele
vatio
n (m
)
1205
1206
1207
1208
1209
1210
1211
32191011x28x20
Aug Sep Oct
2004Apr May Jun Jul Aug Sep
2005Apr May Jun Jul Aug Sep
2006
43

Figure 15. Ground water elevation in wells 46, 55, 60, 63, 69, 72 and 73 in Upper and Lower Pines Campgrounds and surface water elevation at cross sections 13 and 20.
Ele
vatio
n (m
)
1206
1207
1208
1209
1210
1211
1212
73726946556063x13x20
Aug Sep Oct
2004Apr May Jun Jul Aug Sep
2005Apr May Jun Jul Aug Sep
2006
44

Figure 16. Ground water elevation in wells 33, 34, 38, 39, 40, 41, 59, 60, 61 and 77 in Stoneman Meadow and Lower Pines Campground and surface water elevation at cross section 16.
Ele
vatio
n (m
)
1207
1208
1209
1210
1211
1212
1213
34333839404160596177x16
Aug Sep Oct
2004Apr May Jun Jul Aug Sep
2005Apr May Jun Jul Aug Sep
2006
45
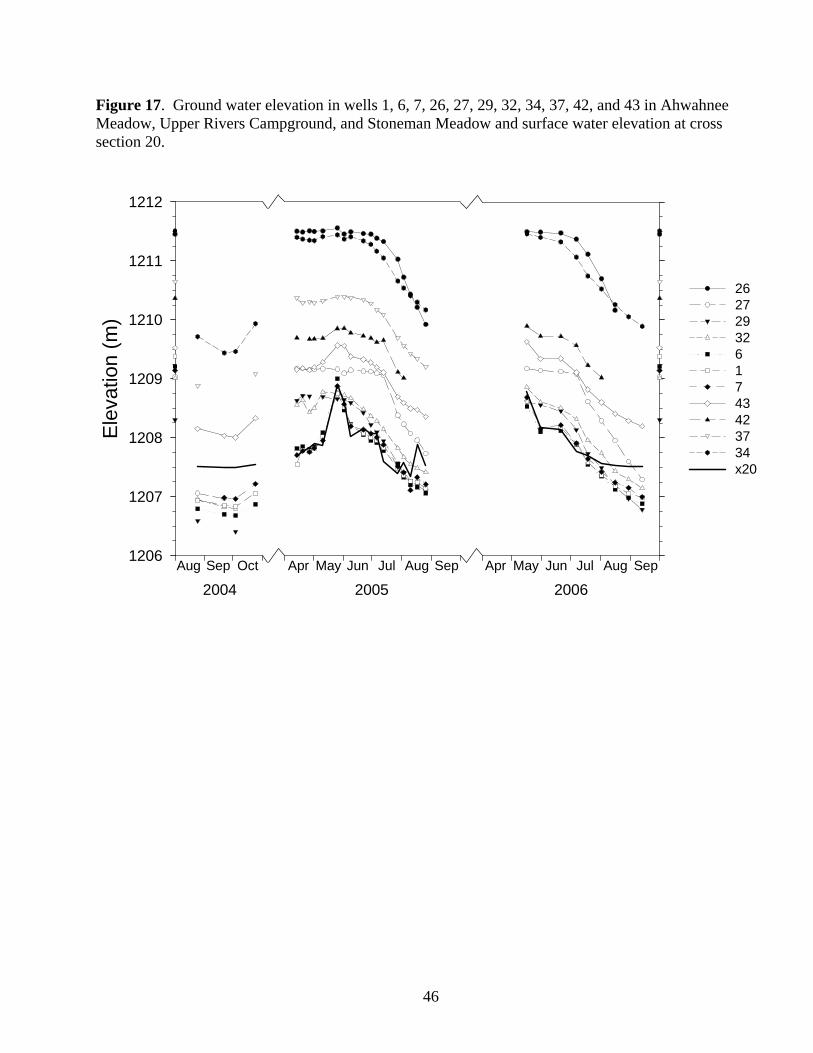
Figure 17. Ground water elevation in wells 1, 6, 7, 26, 27, 29, 32, 34, 37, 42, and 43 in Ahwahnee Meadow, Upper Rivers Campground, and Stoneman Meadow and surface water elevation at cross section 20.
Ele
vatio
n (m
)
1206
1207
1208
1209
1210
1211
1212
26272932617 43423734x20
Aug Sep Oct
2004Apr May Jun Jul Aug Sep
2005Apr May Jun Jul Aug Sep
2006
46

Figure 18. Ground surface, ground water and land surface elevation at wells 1, 2, 3, 10, 11 and surface water elevation at cross sections 20 and 28 for typical dates in May and August in 2004, 2005 and 2006.
Transect distance (m)0 100 200 300 400 500 600
Ele
vatio
n (m
)
1205
1206
1207
1208
1209
1210
water table 2004 water table 2005water table 2006ground surface
May
August
x20 3 2 1
10 11
x28
100x vertical exaggeration
June
47

Figure 19. Ground surface, ground water and land surface elevation at wells 34, 33, 38, 39, 40, 41, 60, 59, 61, and 77 and surface water elevation at cross section 16 for typical dates in May and August in 2004, 2005 and 2006.
Transect distance (m)0 100 200 300 400 500 600 700
Ele
vatio
n (m
)
1207
1208
1209
1210
1211
1212
1213
ground surface200420052006
May
August
33
34
38 39
40
59
100X vertical exaggeration
41
60
77
x16
61
Road
48

Figure 20. Ground surface, ground water and land surface elevation at wells 26, 27, 29, 32, 6, 1, 7, 43, 42, 37 and 34 and surface water elevation at cross section 20 for typical dates in May and August in 2004, 2005 and 2006.
Transect distance (m)0 200 400 600 800 1000 1200 1400
Ele
vatio
n (m
)
1206
1207
1208
1209
1210
1211water table 2004 water table 2005 water table 2006 ground surface
May
August
27
26
2932
6x22
160x vertical exaggeration
1 7
3437
42
43
49

Figure 21. Ground surface, ground water and land surface elevation at wells 95, 74, 69, 45, 55, 60, 64, 1, 16, and 15 and surface water elevation at cross sections 13, 20, and 28 for typical dates in May and August in 2004, 2005 and 2006.
Transect distance (m)0 200 400 600 800 1000 1200
Ele
vatio
n (m
)
1205
1206
1207
1208
1209
1210
1211
1212
water table 2004 water table 2005 water table 2006 ground surface
May
August
749569
x1345
x20
120x vertical exaggeration
55
60
15
16
164
x28
50

Figure 22. Water table elevation contour map for 17 May 2006. Contour interval is 0.5 m.
#Y
#Y
#Y
#Y#Y
#Y
#Y
#Y
#Y
#Y
#Y
#Y
#Y
#Y
#Y
#Y
#Y
#Y
#Y
#Y
#Y
#Y
#Y
#Y
#Y
#Y
#Y
#Y
#Y
#Y
#Y
#Y
#Y
#Y
#Y#Y
#Y
#Y
#Y
#Y
#Y
#Y
#Y
#Y#Y
#Y
#Y
#Y
#Y
#Y
#Y
#Y
#Y
#Y #Y
#Y#Y
#Y#Y
#Y
#Y
#Y
#Y
#Y
#Y
#Y
#Y
#Y
#Y#Y
#Y
#Y
#Y
#Y#Y
#Y
#Y
#Y#Y
Ahwahnee Meadow Ahwahnee Hotel
Stoneman Meadow
Curry Village
North Pines
Campground
Lower Pines
Campground
Rivers CampgroundsHousekeeping
1208
1212
1210
17 May 2006
100 0 100 200 300 Meters
N
Wells and staff gauges#Y
0.5 meter water table contoursMerced RiverRoad
51

Figure 23. Water table elevation contour map for 22 June 2005. Contour interval is 0.5 m.
52

Figure 24. Water table elevation contour map for 19 July 2006. Contour interval is 0.5 m.
#Y
#Y
#Y
#Y#Y
#Y
#Y
#Y
#Y
#Y
#Y
#Y
#Y
#Y
#Y
#Y
#Y
#Y
#Y
#Y
#Y
#Y
#Y
#Y
#Y
#Y
#Y
#Y
#Y
#Y
#Y#Y
#Y
#Y
#Y#Y
#Y
#Y
#Y
#Y
#Y
#Y
#Y
#Y#Y
#Y
#Y
#Y
#Y
#Y
#Y
#Y
#Y
#Y #Y
#Y#Y
#Y#Y
#Y
#Y
#Y
#Y
#Y
#Y
#Y
#Y
#Y
#Y#Y
#Y
#Y
#Y
#Y#Y
#Y
#Y
#Y#Y
1209
1211
1207
Housekeeping
Rivers Campgrounds
Lower Pines
CampgroundNorth Pines
Campground
Curry Village
Stoneman Meadow
Ahwahnee HotelAhwahnee Meadow
19 July 2006N
100 0 100 200 300 Meters
Wells and staff gauges#Y
0.5 meter water table contoursMerced RiverRoad
53

Figure 25. Water table elevation contour map for 16 August 2006. Contour interval is 0.5 m.
#Y
#Y
#Y
#Y#Y
#Y
#Y
#Y
#Y
#Y
#Y
#Y
#Y
#Y
#Y
#Y
#Y
#Y
#Y
#Y
#Y
#Y
#Y
#Y
#Y
#Y
#Y
#Y
#Y
#Y
#Y
#Y#Y
#Y
#Y#Y
#Y
#Y
#Y
#Y
#Y
#Y
#Y
#Y#Y
#Y
#Y
#Y
#Y
#Y
#Y
#Y
#Y
#Y
#Y #Y
#Y#Y
#Y#Y
#Y
#Y
#Y
#Y
#Y
#Y
#Y
#Y
#Y
#Y#Y
#Y
#Y
#Y
#Y#Y
#Y
#Y
#Y#Y
Ahwahnee Meadow Ahwahnee Hotel
Stoneman Meadow
Curry Village
North Pines
Campground
Lower Pines
Campground
Rivers CampgroundsHousekeeping
1206
1210
1208
Wells and staff gauges#Y
0.5 meter water table contoursMerced RiverRoad
100 0 100 200 300 Meters
N
16 Aug 2006
54

Figure 26. Three soil profiles in backhoe pits. A shows a very dark, organic rich soil (below dashed line) with some sandy layers above. B shows a dark surface horizon, a sandy buried soil, and a dark buried soil below the sand. C shows a cobble soil.
B
C
A
55

Figure 27. Examples of bright (A) and faint mottles (B) in study area soils.
A
B
56
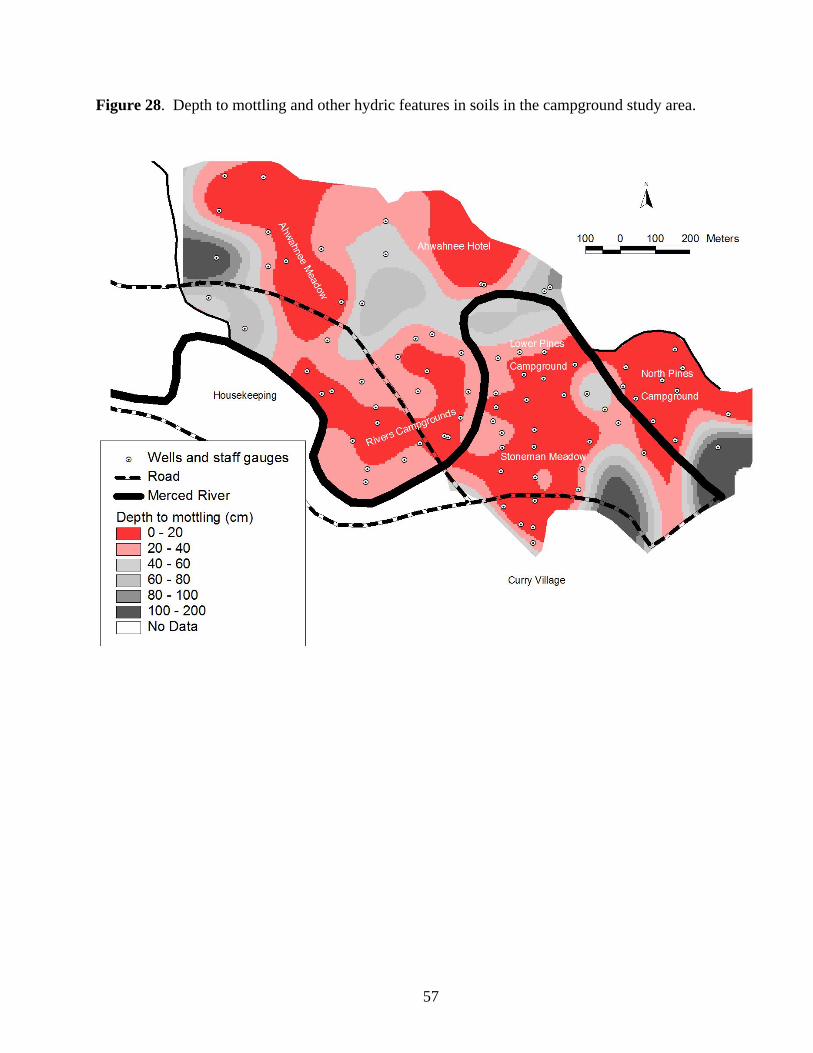
Figure 28. Depth to mottling and other hydric features in soils in the campground study area.
57

Figure 29. Percent organic matter in soils. A. Box plots showing mean ± 1se, plus extremes for reference areas and campgrounds. B. % OM for campground wells. Boundaries for %OM indicate the range of meadow, oak forest/meadow margins, pine and riparian areas. Sites with different lower case letters are statistically significantly different.
Mead Oak Pine Ripar URiv LRiv LPine NPine
% O
rgan
ic M
atte
r
0
5
10
15
Reference Sites Campgrounds
aab
bcc
d
c
c c
URiv LRiv LPineW LPineE NPine
% O
rgan
ic M
atte
r
0
2
4
6
8
10
12
14
Meadow
Oak/Meadow Edge
Pine &Ripar
A
LRiv URiv
B
58

Figure 30. Percent organic matter in soils in the campground study area.
59

Figure 31. Locations for buried conifer logs aged using 14C analysis.
60

Figure 32. Number of conifer trees in 10 year age classes in the campground study area.
2004
-199
519
94-1
985
1984
-197
519
74-1
965
1964
-195
519
54-1
945
1944
-193
519
34-1
925
1924
-191
519
14-1
905
1904
-189
518
94-1
885
1884
-187
518
74-1
865
Num
ber o
f Tre
es
0
2
4
6
8
10
12
14
16
18
61

Figure 33. Distribution of Quercus kelloggii trees in River and Lower Pines Campgrounds.
62
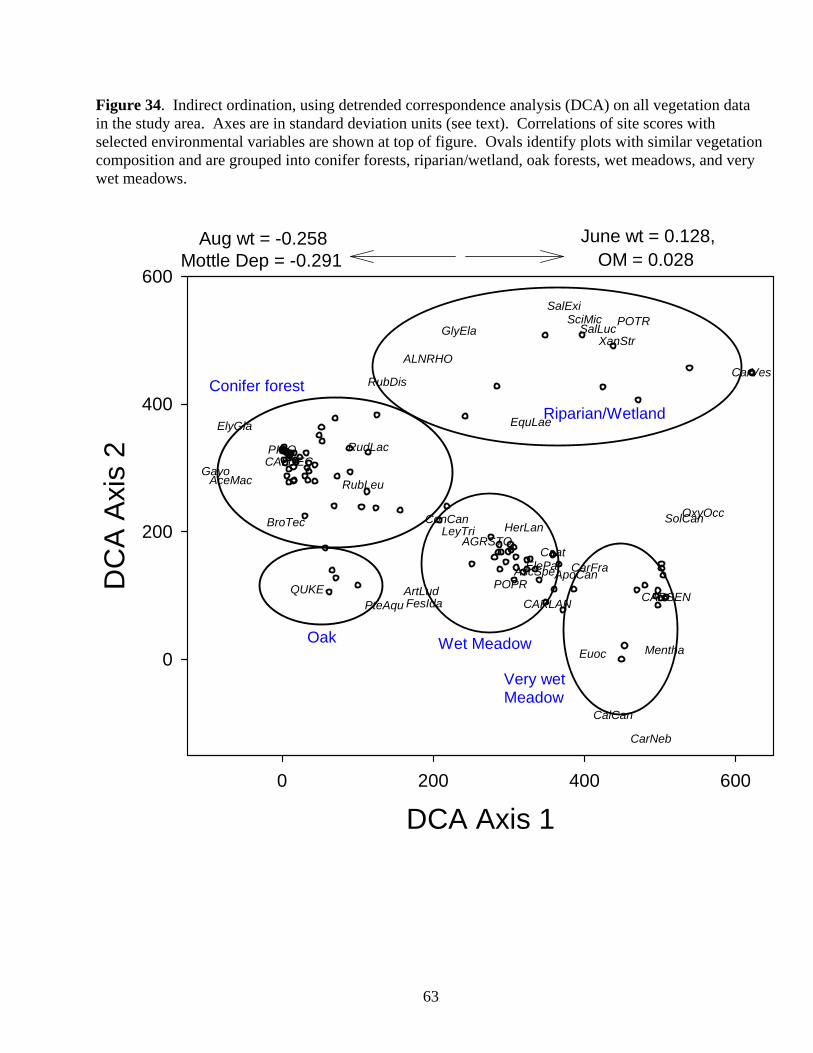
Figure 34. Indirect ordination, using detrended correspondence analysis (DCA) on all vegetation data in the study area. Axes are in standard deviation units (see text). Correlations of site scores with selected environmental variables are shown at top of figure. Ovals identify plots with similar vegetation composition and are grouped into conifer forests, riparian/wetland, oak forests, wet meadows, and very wet meadows.
DCA Axis 10 200 400 600
DC
A A
xis
2
0
200
400
600
AceMac
AGRSTO
ALNRHO
ApoCanArtLud
AscSpe
BroTec
CalCan
CALDEC
CaatCarFra
CARLAN
CarNeb
CARSEN
CarVes
ConCan
ElePal
ElyGla
Euoc
FesIda
Gayo
GlyEla
HerLan
EquLae
LeyTri
Mentha
OxyOcc
PIPO
POPR
POTR
PteAquQUKE
RubDis
RubLeu
RudLac
SalExi
SalLucSciMic
SolCan
XanStr
OM = 0.028June wt = 0.128, Aug wt = -0.258
Mottle Dep = -0.291
Riparian/Wetland
Conifer forest
Oak Wet Meadow
Very wet Meadow
63
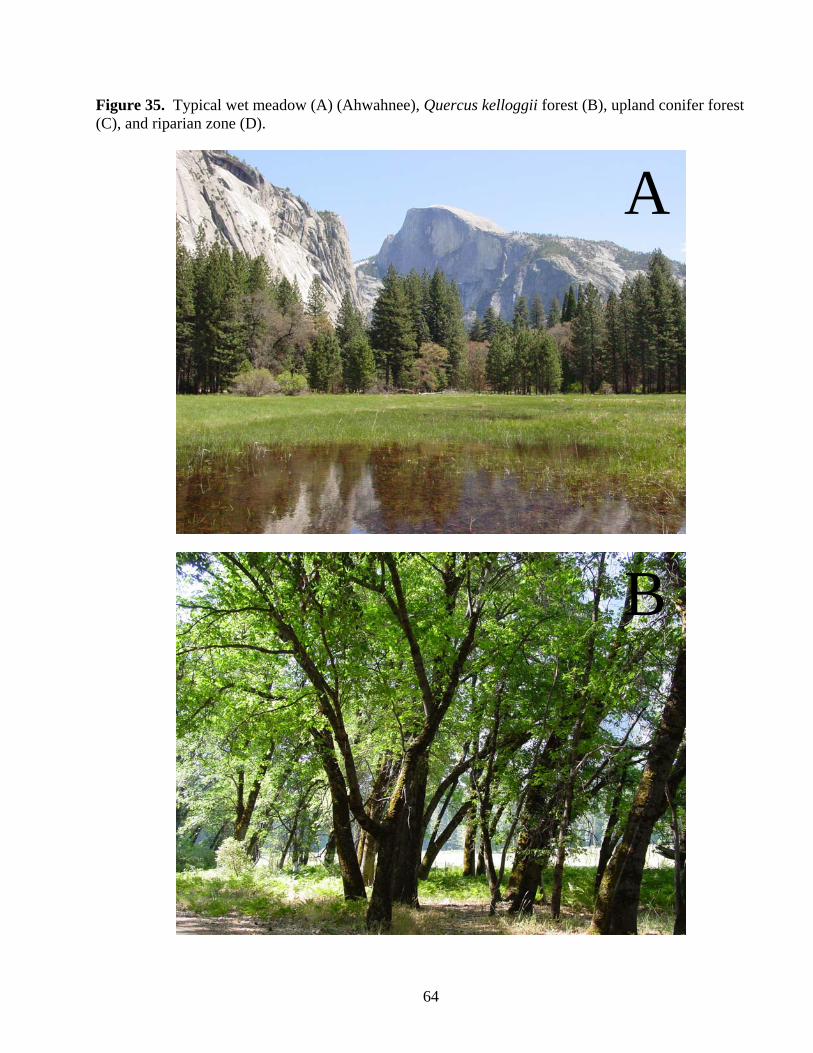
Figure 35. Typical wet meadow (A) (Ahwahnee), Quercus kelloggii forest (B), upland conifer forest (C), and riparian zone (D).
A
B
64

Figure 34 (cont.)
C
D
65

Figure 36. DCA output showing the soil organic matter (SOM) content for each plot. High is >8% SOM indicating soils that formed under wet meadow conditions, M is 4-8% organic matter, indicating soils that formed under oak forest and wet meadow margins, and D are soils with 0-4 % organic matter, and having formed in upland mixed conifer forest, riparian zone with new soils, or highly disturbed conditions. Ovals indicate the same communities illustrated in Figure 33.
DCA Axis 10 100 200 300 400 500 600 700
DC
A A
xis
2
0
100
200
300
400
500
600
MMM
MHH MM
LHM
HM
M
M
LMM
M
H
MM
M
HM
H
H
M
HH
H
HHHHH
H HM
L
M
MMMMMMLL
MMMLLLH MMML
H
M
LM
HM MMM
ML
H
M
M
H
HH
H
HH
H
H
HH H
H
HM
H
M
H
M
LL
LL L
MM
H M
H
H
HH
H
H
M
MM
H
H
H
LL
L
H = >8%M = 4-8%L = <4%
66

Figure 37. DCA output showing the soil depth at which hydric soil characteristics are evident for each plot. High is within the upper 20 cm of soil, M is 20-40 cm depth, and D is > 40 cm depth. These depths reflect sites that have had or still have a predominantly wetland hydrologic regime with water tables near the soil surface for extended periods during the summer of many years. Ovals indicate the same communities illustrated in Figure 33.
DCA Axis 10 100 200 300 400 500 600 700
DC
A A
xis
2
0
100
200
300
400
500
600
HHH
MHH HH
HHH
HH
H
H
HHH
H
H
DD
H
HH
H
H
H
HH
H
HHHHH
H HH
D
M
HHMHDMHH
HHHHHHH HHHD
H
H
HH
HH HDH
MD
H
H
D
H
HH
H
HH
H
H
HH H
D
MD
H
M
D
D
DD
HH H
MH
H H
H
H
HH
H
H
M
MM
H
H
M
HH
H
H = 0-20 cmM = 20-40 cmD = >40 cm
67

Figure 38. Portions of the study area that were connected to the Merced riparian flow system during 2005 and 2006 occur inside the dashed green lines. The area within the dotted green lines likely is supported largely by stream recharged ground water. Those supported primarily or entirely by ground water from the valley walls are north or south of the green lines. The main direction of ground water flow is shown with blue lines for the three zones.
Groundwater
Groundwater
Riparian
68

Figure 39. Potential natural vegetation of the study area. Area with diagonal lines can support a riparian/meadow complex, while the dotted areas could support a wet meadow/Quercus Kelloggii mosaic.
69

Figure 40. Typical summer water table depths during 2005 and 2006 for Carex lanuginosa (Car lan), Poa pratensis (Poa prat), Agrostis stolonifera (Agr stol), Carex senta (Car senta), and Quercus kelloggii (Que kel) dominated stands in the study area.
70
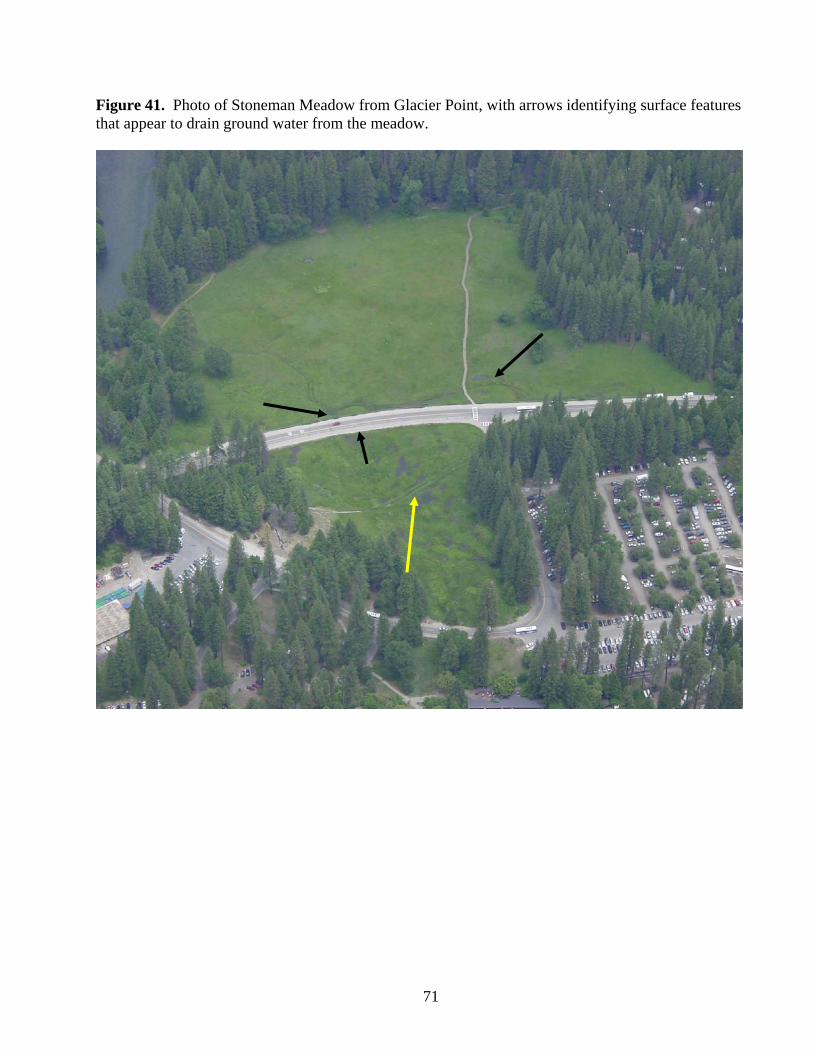
Figure 41. Photo of Stoneman Meadow from Glacier Point, with arrows identifying surface features that appear to drain ground water from the meadow.
71

Figure 42. Photo of Ahwahnee Meadow from Glacier Point with arrows showing the location of possible drains, ditches and fill.
72

Figure 43. Air photo of Ahwahnee Meadow showing the location of ditches, fill and other impacts.
Ditches
Fill
73
Related Documents