YORK UNIVERSITY ROOFTOP GARDEN STORMWATER QUANTITY AND QUALITY PERFORMANCE MONITORING REPORT Glenn MacMillan Toronto and Region Conservation Authority Abstract In Toronto, there is ongoing effort to evaluate the effectiveness of greenroof infrastructure as a technique to reduce the quantity and improve the quality of stormwater runoff in Toronto’s Remedial Action Plan (RAP) Area of Concern. In 2003, a research site was chosen on the York University computer science building where measurements of climate, soil, and runoff data are being taken to quantify the benefit of roof gardens for stormwater quality and quantity management in urban areas. Lessons learned in 2003 suggest that: 1) the garden is effective in reducing the total runoff volume and peak flow of rainfall runoff. 2) Performance varies depending on soil moisture and rainfall intensity, however, most of the time the loadings and concentrations are far less than Provincial and Canadian water quality standards. Introduction Research has shown that significant environmental benefits can be achieved from rooftop gardens in terms of stormwater runoff quantity and quality control. For example, at a greenroof site in Hannover-Herrenhausen, Germany it was determined that 5 to 10 cm soil layers retained approximately 65-70% of precipitation runoff during the summer and approximately 50% during the winter (6). Kennedy and Gadd (4) reported improvements in the quality of effluent from gardens relative to galvanized roofs, which can contain high concentrations of zinc and other metals. The water quality of Lake Ontario reflects the health of the rivers and creeks that drain into it. The City of Toronto (the City) has experienced a significant loss of its permeable (i.e. naturally vegetated) surfaces to urban development. In Toronto, tree canopy and natural coverage is approximately 20%, whereas an ideal target for a city is 30% to 35% (7;2;5). While the City has been relatively successful in protecting natural areas, restoring the natural landscape displaced by development is more difficult. To date, rooftops cover as much as 30% to 35% of the land

Welcome message from author
This document is posted to help you gain knowledge. Please leave a comment to let me know what you think about it! Share it to your friends and learn new things together.
Transcript

YORK UNIVERSITY ROOFTOP GARDEN STORMWATER QUANTITY AND QUALITY PERFORMANCE MONITORING REPORT
Glenn MacMillan
Toronto and Region Conservation Authority
Abstract
In Toronto, there is ongoing effort to evaluate the effectiveness of greenroof infrastructure as a
technique to reduce the quantity and improve the quality of stormwater runoff in Toronto’s
Remedial Action Plan (RAP) Area of Concern. In 2003, a research site was chosen on the York
University computer science building where measurements of climate, soil, and runoff data are
being taken to quantify the benefit of roof gardens for stormwater quality and quantity
management in urban areas. Lessons learned in 2003 suggest that: 1) the garden is effective in
reducing the total runoff volume and peak flow of rainfall runoff. 2) Performance varies
depending on soil moisture and rainfall intensity, however, most of the time the loadings and
concentrations are far less than Provincial and Canadian water quality standards.
Introduction
Research has shown that significant environmental benefits can be achieved from rooftop
gardens in terms of stormwater runoff quantity and quality control. For example, at a greenroof
site in Hannover-Herrenhausen, Germany it was determined that 5 to 10 cm soil layers retained
approximately 65-70% of precipitation runoff during the summer and approximately 50% during
the winter (6). Kennedy and Gadd (4) reported improvements in the quality of effluent from
gardens relative to galvanized roofs, which can contain high concentrations of zinc and other
metals.
The water quality of Lake Ontario reflects the health of the rivers and creeks that drain into it.
The City of Toronto (the City) has experienced a significant loss of its permeable (i.e. naturally
vegetated) surfaces to urban development. In Toronto, tree canopy and natural coverage is
approximately 20%, whereas an ideal target for a city is 30% to 35% (7;2;5). While the City has
been relatively successful in protecting natural areas, restoring the natural landscape displaced
by development is more difficult. To date, rooftops cover as much as 30% to 35% of the land

2
surface including exsisting and proposed developments (7). By greening rooftops, the total
impervious coverage in Toronto can be reduced and new green spaces can be created.
Currently, there is an ongoing effort to evaluate the effectiveness of greenroof infrastructure as
a technique to reduce the quantity and improve the quality of stormwater runoff in Toronto’s
Remedial Action Plan Area of Concern (3). The City’s involvement in greenroofs is one of the
many storm water management recommendations in the City of Toronto Wet Weather Flow
Management Master Plan (1). The potential implementation would consist of retrofitting existing
structures and/or incorporating designs into new developments.
Study Area
A research site was chosen on the new York University computer science building where
measurements of climate, soil, and runoff quantity and quality data are being taken to quantify
stormwater the benefit of roof gardens in urban areas. The roof is covered by two surfaces:
shingles (control roof) and a garden both of which have a 10% slope (Figure 1).
Figure 1: York University, Computer Science Building, Greenroof.
The control roof is approximately half the size of the garden measuring 131 m2 and 241 m2
respectively and drains into a storage tank. The tank is used to reduce peak flow discharges to
the existing municipal storm drainage system (Figure 2).
The garden consists of a 140mm substrate and is vegetated with wildflowers. Since April 2003,
both roofs are being continuously monitored for rainfall, runoff quantity and event runoff quality,

3
air temperature, soil temperature, humidity, and soil moisture. To prevent freezing during cold
weather, all monitoring equipment was wrapped with both insulation and heat tracing cable to
take measurements of snowmelt. All of the monitoring devices excluding the water samplers
have been networked to a single logger and network that statistically calculates and
communicates measured data via the internet. The internet connection also provides real-time
measurements of activities (e.g. rainfall) that can be accessed from anywhere in the world.
Methodology
The automated data collection system uses a web-based monitoring system for real-time
monitoring and archived data of all climate and hydrometric parameters. The system logs all
sensor measurements in one minute intervals and the data are stored and reported through a
specially designed website (www.sustainabletechnologies.ca). The website provides the means
to view the ongoing progress as well as facilitate the remote operation of the equipment.
Archived logs are uploaded to a central web server at Seneca College for long term storage and
automatic processing of point values into user selectable report formats.
4
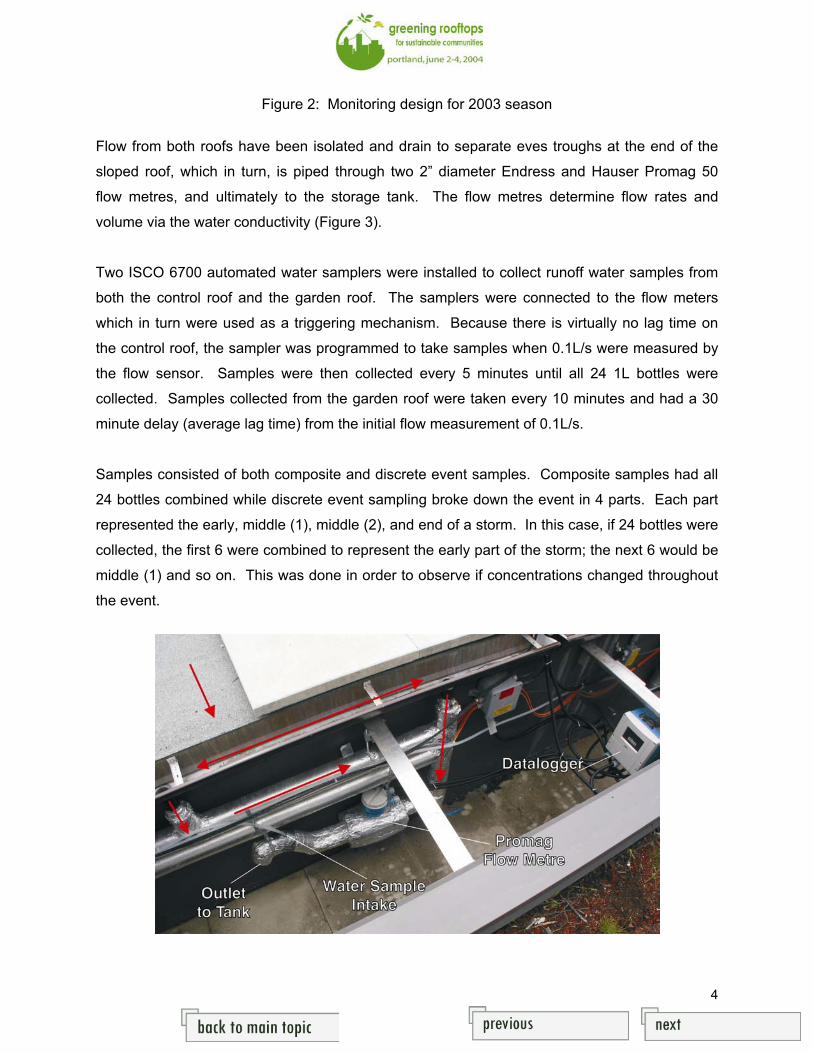
Figure 2: Monitoring design for 2003 season
Flow from both roofs have been isolated and drain to separate eves troughs at the end of the
sloped roof, which in turn, is piped through two 2” diameter Endress and Hauser Promag 50
flow metres, and ultimately to the storage tank. The flow metres determine flow rates and
volume via the water conductivity (Figure 3).
Two ISCO 6700 automated water samplers were installed to collect runoff water samples from
both the control roof and the garden roof. The samplers were connected to the flow meters
which in turn were used as a triggering mechanism. Because there is virtually no lag time on
the control roof, the sampler was programmed to take samples when 0.1L/s were measured by
the flow sensor. Samples were then collected every 5 minutes until all 24 1L bottles were
collected. Samples collected from the garden roof were taken every 10 minutes and had a 30
minute delay (average lag time) from the initial flow measurement of 0.1L/s.
Samples consisted of both composite and discrete event samples. Composite samples had all
24 bottles combined while discrete event sampling broke down the event in 4 parts. Each part
represented the early, middle (1), middle (2), and end of a storm. In this case, if 24 bottles were
collected, the first 6 were combined to represent the early part of the storm; the next 6 would be
middle (1) and so on. This was done in order to observe if concentrations changed throughout
the event.

5
Figure 3: Flow collection and metering design.
One Hydrological Services tipping bucket raingauge has been installed on site. It has a bucket
measurement of 0.2mm, with a measuring range of 0 to 500mm/hr and an accuracy of ±2% at
100mm/hr. Backup measurements are being taken by two separate gauges owned by the
TRCA and York University and are located within 5 km from the study area. Precipitation was
collected into an open Teflon bag lining a bucket with a diameter of 48cm. All precipitation
samples were submitted to the lab as composites. Samples were analyzed for similar
parameters to directly compare pollutant concentrations and loads in precipitation and roof
runoff. Because precipitation is relatively clean, samples could only be analyzed for certain
parameters. These parameters include:
Metals Cations Anions CODs BODsNutrients Chloride PAHs Suspended solids pHConductivity Turbidity Bacteria Alkalinity Phenolics
All samples were submitted to the Ontario Ministry of the Environment (MOE) for testing.
Treatment efficiency was determined on the basis of pollutant mass differences. Load-based
median efficiency was calculated as:
LE = (Vin x EMCin - (Vout x EMCout) / Vin x EMCin) x 100
Where:LE = Load Efficiency V = Volume EMC = Event Median Concentration
Measurements are also being taken to characterize both the micro climate and garden soil
attributes. The climate was monitored for relative humidity (RH), air temperature, and rainfall
and the garden was monitored for soil moisture and soil temperature. Two sensors were
positioned at the high and low points in the garden soil. From the flow metres, the high point
was near the top of the 10% slope. Measurements are being collected to assist in calculating
the residual water content that is being stored in the soil, the antecedent soil moisture condition,
and to assess potential improvements to the system. Measurements will provide valuable
information for the final water balance and analyzing the performance of the garden area in
terms of moisture retention and storage capacity.A Veris Industries digital RH, air and soil
n
1 =1
6
temperature sensor was installed with a measurement accuracy of ±2% and ±0.25%
respectively. Soil temperature measurements are being collected at the centre of the garden.
They will be used to assess the potential evapotranspiration in the final water balance. Similar
to soil temperature, air temperature measurements were taken as a control for future efficiency
calculations. Relative humidity was measured for two reasons: to confirm storm event
occurrences and for future use in a water balance modelling analysis.
The roof flow balance was determined by calculating the percent difference between the
volumes of precipitation that fell on both roofs against the volume measured at the control and
garden roof downspouts. In order to quantify the extent to which greenroofs may reduce the
amount of stormwater runoff, a water balance model will be developed. The model will reflect
the following:
Precipitation - Evapotranspiration ± Storage - Runoff = 0
For this study, evaporation is defined as occurring from soil, plant, and impervious surfaces.
While storage is water held as soil moisture and plant uptake, as well as, water that is stored in
the runoff storage tank. By monitoring all of the previously mentioned parameters,
evapotranspiration can be determined as the residual in the water balance equation. It is
expected that the water balance will be calculated at the end of the monitoring program.
2003 Monitoring Results
Water Quantity
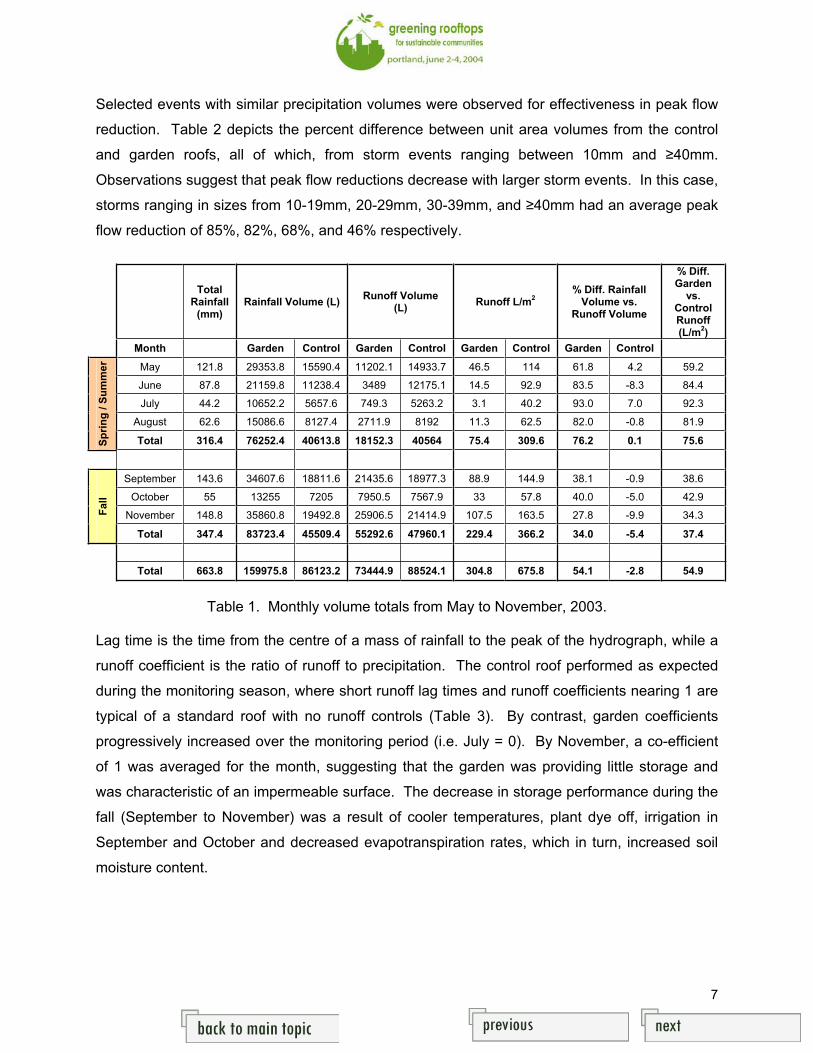
Over the monitoring season (May to November), the garden reduced the total runoff volume per
area (m2) by approximately 55% and peak flow rates by up to 85% for storm events 10mm.
During the spring/summer months, the garden reduced runoff volume by 76% and by 37% in the
fall. This suggests that garden performance is affected by seasonality (Table 1 and 2). On
June 25, 2003 the garden irrigation system was activated by York University. Connected to a
timer, the system was activated daily for 118 days from 5:30am to 6:00am until October 20,
2003. The total runoff volume for each day of watering was subtracted from the event flow and
was not included in the flow balance. However, observations suggest that the continuous
saturation of the garden soils decreased the storage capability and therefore garden
performance.
7
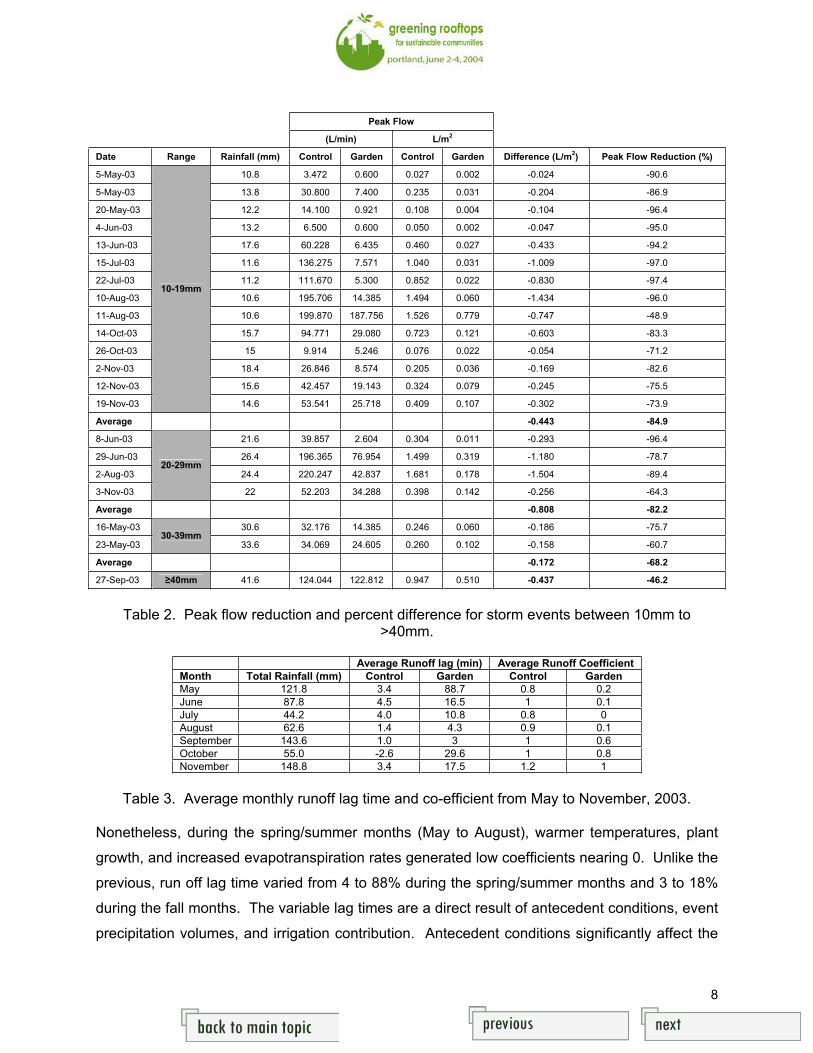
Selected events with similar precipitation volumes were observed for effectiveness in peak flow
reduction. Table 2 depicts the percent difference between unit area volumes from the control
and garden roofs, all of which, from storm events ranging between 10mm and 40mm.
Observations suggest that peak flow reductions decrease with larger storm events. In this case,
storms ranging in sizes from 10-19mm, 20-29mm, 30-39mm, and 40mm had an average peak
flow reduction of 85%, 82%, 68%, and 46% respectively.
TotalRainfall
(mm)Rainfall Volume (L)
Runoff Volume (L)
Runoff L/m2
% Diff. Rainfall Volume vs.
Runoff Volume
% Diff. Garden
vs. ControlRunoff(L/m
2)
Month Garden Control Garden Control Garden Control Garden Control
May 121.8 29353.8 15590.4 11202.1 14933.7 46.5 114 61.8 4.2 59.2
June 87.8 21159.8 11238.4 3489 12175.1 14.5 92.9 83.5 -8.3 84.4
July 44.2 10652.2 5657.6 749.3 5263.2 3.1 40.2 93.0 7.0 92.3
August 62.6 15086.6 8127.4 2711.9 8192 11.3 62.5 82.0 -0.8 81.9
Sp
rin
g /
Su
mm
er
Total 316.4 76252.4 40613.8 18152.3 40564 75.4 309.6 76.2 0.1 75.6
September 143.6 34607.6 18811.6 21435.6 18977.3 88.9 144.9 38.1 -0.9 38.6
October 55 13255 7205 7950.5 7567.9 33 57.8 40.0 -5.0 42.9
November 148.8 35860.8 19492.8 25906.5 21414.9 107.5 163.5 27.8 -9.9 34.3 Fall
Total 347.4 83723.4 45509.4 55292.6 47960.1 229.4 366.2 34.0 -5.4 37.4
Total 663.8 159975.8 86123.2 73444.9 88524.1 304.8 675.8 54.1 -2.8 54.9
Table 1. Monthly volume totals from May to November, 2003.
Lag time is the time from the centre of a mass of rainfall to the peak of the hydrograph, while a
runoff coefficient is the ratio of runoff to precipitation. The control roof performed as expected
during the monitoring season, where short runoff lag times and runoff coefficients nearing 1 are
typical of a standard roof with no runoff controls (Table 3). By contrast, garden coefficients
progressively increased over the monitoring period (i.e. July = 0). By November, a co-efficient
of 1 was averaged for the month, suggesting that the garden was providing little storage and
was characteristic of an impermeable surface. The decrease in storage performance during the
fall (September to November) was a result of cooler temperatures, plant dye off, irrigation in
September and October and decreased evapotranspiration rates, which in turn, increased soil
moisture content.
8
Peak Flow
(L/min) L/m2
Date Range Rainfall (mm) Control Garden Control Garden Difference (L/m2) Peak Flow Reduction (%)
5-May-03 10.8 3.472 0.600 0.027 0.002 -0.024 -90.6
5-May-03 13.8 30.800 7.400 0.235 0.031 -0.204 -86.9
20-May-03 12.2 14.100 0.921 0.108 0.004 -0.104 -96.4
4-Jun-03 13.2 6.500 0.600 0.050 0.002 -0.047 -95.0
13-Jun-03 17.6 60.228 6.435 0.460 0.027 -0.433 -94.2
15-Jul-03 11.6 136.275 7.571 1.040 0.031 -1.009 -97.0
22-Jul-03 11.2 111.670 5.300 0.852 0.022 -0.830 -97.4
10-Aug-03 10.6 195.706 14.385 1.494 0.060 -1.434 -96.0
11-Aug-03 10.6 199.870 187.756 1.526 0.779 -0.747 -48.9
14-Oct-03 15.7 94.771 29.080 0.723 0.121 -0.603 -83.3
26-Oct-03 15 9.914 5.246 0.076 0.022 -0.054 -71.2
2-Nov-03 18.4 26.846 8.574 0.205 0.036 -0.169 -82.6
12-Nov-03 15.6 42.457 19.143 0.324 0.079 -0.245 -75.5
19-Nov-03
10-19mm
14.6 53.541 25.718 0.409 0.107 -0.302 -73.9
Average -0.443 -84.9
8-Jun-03 21.6 39.857 2.604 0.304 0.011 -0.293 -96.4
29-Jun-03 26.4 196.365 76.954 1.499 0.319 -1.180 -78.7
2-Aug-03 24.4 220.247 42.837 1.681 0.178 -1.504 -89.4
3-Nov-03
20-29mm
22 52.203 34.288 0.398 0.142 -0.256 -64.3
Average -0.808 -82.2
16-May-03 30.6 32.176 14.385 0.246 0.060 -0.186 -75.7
23-May-03 30-39mm
33.6 34.069 24.605 0.260 0.102 -0.158 -60.7
Average -0.172 -68.2
27-Sep-03 40mm 41.6 124.044 122.812 0.947 0.510 -0.437 -46.2
Table 2. Peak flow reduction and percent difference for storm events between 10mm to >40mm.
Average Runoff lag (min) Average Runoff Coefficient
Month Total Rainfall (mm) Control Garden Control Garden
May 121.8 3.4 88.7 0.8 0.2
June 87.8 4.5 16.5 1 0.1
July 44.2 4.0 10.8 0.8 0
August 62.6 1.4 4.3 0.9 0.1
September 143.6 1.0 3 1 0.6
October 55.0 -2.6 29.6 1 0.8
November 148.8 3.4 17.5 1.2 1
Table 3. Average monthly runoff lag time and co-efficient from May to November, 2003.
Nonetheless, during the spring/summer months (May to August), warmer temperatures, plant
growth, and increased evapotranspiration rates generated low coefficients nearing 0. Unlike the
previous, run off lag time varied from 4 to 88% during the spring/summer months and 3 to 18%
during the fall months. The variable lag times are a direct result of antecedent conditions, event
precipitation volumes, and irrigation contribution. Antecedent conditions significantly affect the
9
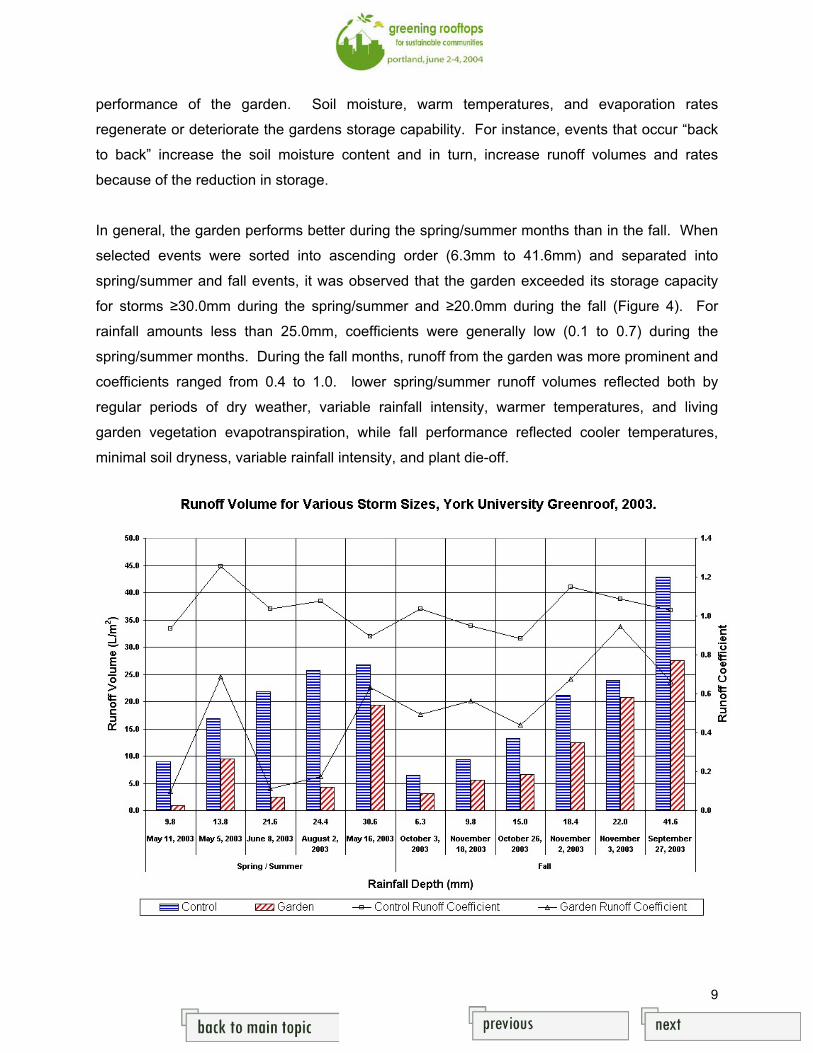
performance of the garden. Soil moisture, warm temperatures, and evaporation rates
regenerate or deteriorate the gardens storage capability. For instance, events that occur “back
to back” increase the soil moisture content and in turn, increase runoff volumes and rates
because of the reduction in storage.
In general, the garden performs better during the spring/summer months than in the fall. When
selected events were sorted into ascending order (6.3mm to 41.6mm) and separated into
spring/summer and fall events, it was observed that the garden exceeded its storage capacity
for storms 30.0mm during the spring/summer and 20.0mm during the fall (Figure 4). For
rainfall amounts less than 25.0mm, coefficients were generally low (0.1 to 0.7) during the
spring/summer months. During the fall months, runoff from the garden was more prominent and
coefficients ranged from 0.4 to 1.0. lower spring/summer runoff volumes reflected both by
regular periods of dry weather, variable rainfall intensity, warmer temperatures, and living
garden vegetation evapotranspiration, while fall performance reflected cooler temperatures,
minimal soil dryness, variable rainfall intensity, and plant die-off.

10
Figure 4. Event performance for various sized storms. Chart is arranged by events from smallest to largest and by season.
During the spring/summer months, warmer temperatures, decreased rainfall, and increased
evaporation rates dried the soil and decreased soil moisture content. The increase in soil void
space availability allowed the garden to absorb more precipitation during an event and in turn
generated low runoff volumes during this time. It was observed that when soil moisture reached
33% or greater, runoff from the garden in most cases, would equal or exceed the control runoff.
In this case, little retention and storage was provided by the garden.
Water Quality
For this study, events collected on September 15, 22, 27, October 14, and 18 were used.
Results from several other events were not available at the time of writing. Generally, garden
runoff had higher concentrations than both the control roof and rainfall. Of the 60 water quality
parameters monitored most concentrations met PWQO and CWQG guidelines. However, the
garden had 7 parameters exceed PWQO concentrations and 3 exceeded CWQGs. These
parameters included: phenolics, total phosphorous, Ecoli, cadmium (both guidelines), copper
(both guidelines), lead (both guidelines), and fluoranthene. Generally, the garden increased
concentrations for most metals, cations, anions, bacteria, and several nutrients. Surprisingly,
rainfall exceeded PWQO and CWQG guidelines for pH (5.3), lead (4.6 µg/L), and copper (6.8
µg/L), however, for all other parameters rainfall concentrations were well below guidelines.
Typically, the garden had larger pollutant loadings. Compared to the control roof, the garden
had larger loadings for phosphate (97%), total phosphorous (95%) most metals, cations, anions,
and COD (91%). However, the garden was effective in reducing loadings of suspended solids
(172%), nitrogen complexes such as ammonia/ammonium, nitrite, and nitrite/nitrate (852%,
79%, and 212% respectively), aluminium (26%), copper (147%), BOD (93%), manganese
(224%) and most PAHs.
It should be noted that irrigation from municipal waterworks may have influenced some
parameters by diluting or increasing concentrations and loadings. Furthermore, hardness
values were much larger from the garden than the control roof. This could contribute to a
reduction in the toxicity of metals in garden runoff.

11
Climate and Garden Soil
In all cases, the maximum monthly soil temperature was less than the maximum monthly air
temperature. On the other hand, minimum soil temperature observations suggested that soil
temperatures were higher than minimum air temperature values. This is most likely because of
the increased density and insulation characteristic of the garden soil. In several cases mean
temperatures for soil exceeded air temperature, the lower values were a result of slower
temperature fluctuations in the soil, and larger, more rapid changes in the air temperature
(Table 3). During July, and most of the spring/summer, air temperature was consistently greater
than the soil temperature, suggesting that the soil acted as an insulator during night and
daytime temperatures. The garden also typically generated a temperature inversion lag which
saw air temperatures changing more rapidly than soil temperatures.
Soil moisture was collected from May to August, 2003. Sensor malfunction made data collected
between September and November unreliable. Observations suggest that because of the
sloped roof, water collected in the lower 1/3 of the garden (sensor 2). In almost all cases,
percent moisture for sensor 2 was greater than sensor 1. Mean relative humidity suggested that
humidity gradually increased between spring/summer and fall. During the spring/summer
months, warmer temperatures, decreased rainfall, and increased evaporation rates dried the
soil and decreased soil moisture content. The increase in soil void space availability allowed
the garden to absorb more precipitation during an event and in turn generated low volumes
during this time. It was observed that when soil moisture reached 33% or greater, runoff from
the garden in most cases, would equal or exceed the control runoff. In this case, little retention
and storage was provided by the garden.
Air Temperature (ºC) Soil Temperature (ºC) Soil Moisture 1 (%) Soil Moisture 2 (%) Relative Humidity (%)
MAX MIN MEAN MAX MIN MEAN MAX MIN MEAN MAX MIN MEAN MAX MIN MEAN
May 28.2 5.3 14.6 24.2 9.1 14.3 33.7 29.2 24.5 42.6 29.9 38.3 98.7 8.7 66.1
June 38.6 6.3 21.1 36.3 11.2 21.2 32.4 6.2 21.6 36.7 8.4 25.8 95.7 19.2 61.6
July 37.1 13.3 24.0 35.3 16.7 25.2 20.0 6.8 10.7 33.1 18.0 26.4 94.7 22.7 63.1
August 36.5 12.4 24.2 30.4 15.3 23.7 23.9 6.5 16.9 41.4 21.2 32.2 98.7 20.6 68.4
September 33.3 6.2 19.3 25.4 8.2 18.0 - - - - - - 99.4 25.8 70.5
October 30.6 1.5 11.3 19.0 2.4 8.7 - - - - - - 100.3 32.4 74.6
November 19.0 -4.2 6.7 12.7 0.2 4.4 - - - - - - 100.4 39.0 81.7
Table 3. Monthly maximums, minimums, and means for soil moisture, temperature, and relative humidity, for 2003.

12
Conclusions and Recommendations
The key findings of the monitoring to date are:
Overall, the garden resulted in a 55% reduction in runoff volume from May to November,
2003.
Seasonality did affect the performance of the garden. During the spring/summer
months, the garden reduced the total runoff volume by 76% and by 37% in the fall.
Typically, storm events 30mm had reduced flow and volume during the spring/summer
months, while in the fall it was approximately 20mm.
Antecedent conditions (i.e. % soil moisture and dry weather) can degrade or improve
garden performance by adjusting storage capabilities (Appendix B).
The performance of the garden at reducing peak flow rates varied from 85% reduction
for storm events up to 10mm, to 46% reduction for 40mm storm events.
Irrigation significantly reduced the performance of the garden by continually saturating
the soil and increased plant die-off rates.
The garden provided no quantity control benefit when soil moisture reached 33% or
greater.
Of the 60 water quality parameters monitored most concentrations from the garden met
PWQO and CWQG guidelines. However, the garden had 7 parameters exceed PWQO
concentrations and 3 exceeded CWQGs. These parameters included: phenolics, total
phosphorous, Ecoli, cadmium (both guidelines), copper (both guidelines), lead (both
guidelines), and fluoranthene. Generally, the garden increased concentrations for most
metals, cations, anions, bacteria, and several nutrients.
Typically, the garden had larger pollutant loadings. Compared to the control roof, the
garden had larger loadings for phosphate (97%), total phosphorous (95%) most metals,
cations, anions, and COD (91%). However, the garden was effective in reducing
loadings of suspended solids (172%), nitrogen complexes such as ammonia/ammonium,
nitrite, and nitrite/nitrate (852%, 79%, and 212% respectively), aluminium (26%), copper
(147%), BOD (93%), manganese (224%) and most PAHs.
The following outlines the recommendations for the 2004 monitoring period.

13
The irrigation system should be regulated by soil moisture sensors that trigger the
system only when necessary. Over watering not only decreased the performance of the
garden, but it contributed to increased plant dye off.
Testing of chemical makeup of all contact surfaces (i.e. garden soil, eves trough
plumbing) to determine the magnitude these surfaces are contributing to runoff quality
changes.
Complete a full water balance for 2003 and 2004 seasons.
Undertake hydrologic modelling analysis using monitored data to calibrate model.
Evaluate benefits of vegetation versus substrate.
References
1.The City of Toronto Wet Weather Flow Master Plan (WWFMMP). 2002. The City of Toronto Wet Weather Flow Master Plan (WWFMMP): October 2002. The City of Toronto.
2. Fahrig, L. 1998. When does fragmentation of breeding habitat affect population survival?Ecological Modelling, 105:273-292.
3. International Joint Commission (IJC). 2000. Clean Waters, Clear Choices—Recommendations for Action. Toronto and Region Remedial Action Plan.
4. Kennedy, Paul and Jennifer Gadd, 2001. House Roof Runoff: Is it as clear as we think ? Second South Pacific Stormwater Conference 2001, Kingett Mitchell and Associates, Auckland.
5. Lee, M., L. Fahrig, K. Freemark, and D. J. Currie. 2002. Importance of patch scale verses landscape scale on selected forest birds. Oikos 96 (1):110-118.
6. Moran, A., Hunt, B. and G. Jennings, 2003. A North Carolina Field Study to evaluate greenroof runoff quantity, runoff quality, and plant growth. ASAE Paper No. 032303. St. Joseph, Michigan: ASAE.
7. Toronto and Region Conservation Authority (TRCA). 2003. Geographic Information Systems Division.
Author
Glenn MacMillan is the Manager of the Resource Science Section within the Watershed
Management Division at The Toronto & Region Conservation Authority. He is responsible for
managing a team of technical experts in the fields of stormwater management, floodplain
management, hydrogeology, terrestrial and aquatic habitat management. He joined the Toronto
& Region Conservation Authority in 1989 after spending 4 years in consulting working on a
variety of water resource engineering related projects. He graduated from Ryerson
Polytechnical Institute's Civil Engineering Program in 1985.

Related Documents