YORK SCHOOL DISTRICT ONE YORK COUNTY, SOUTH CAROLINA Comprehensive Annual Financial Report Year Ended June 30, 2016 BUILDING THE FOUNDATION FOR TOMORROW BY SPARKING POTENTIAL AND INSPIRING SUCCESS.

Welcome message from author
This document is posted to help you gain knowledge. Please leave a comment to let me know what you think about it! Share it to your friends and learn new things together.
Transcript

YORK SCHOOL DISTRICT ONE
YORK COUNTY, SOUTH CAROLINA
Comprehensive Annual Financial Report Year Ended June 30, 2016
BUILDING THE FOUNDATION FOR TOMORROW BY SPARKING POTENTIAL AND INSPIRING SUCCESS.

YYOORRKK SSCCHHOOOOLL DDIISSTTRRIICCTT OONNEE York, South Carolina
COMPREHENSIVE ANNUAL FINANCIAL REPORT
YEAR ENDED JUNE 30, 2016
Prepared By:
York School District One Office of Finance
Amy Hagner, Assistant Superintendent for Finance & Operations

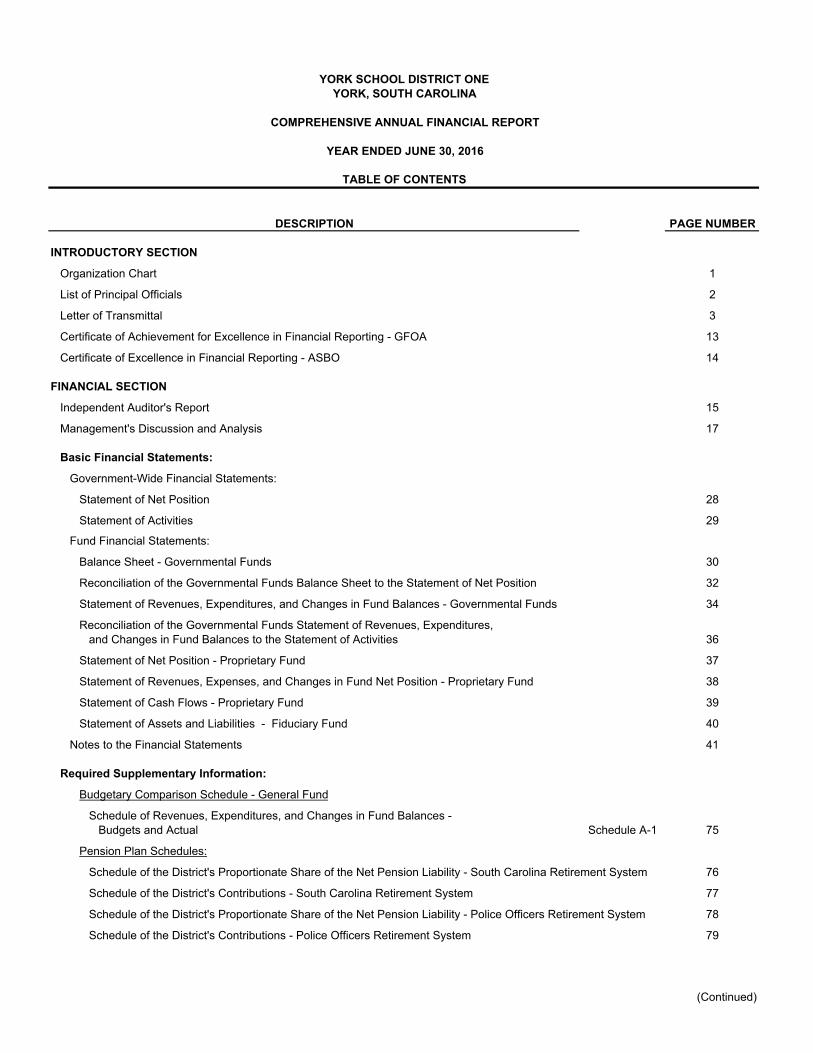
DESCRIPTION PAGE NUMBER
INTRODUCTORY SECTION
Organization Chart 1
List of Principal Officials 2
Letter of Transmittal 3
Certificate of Achievement for Excellence in Financial Reporting - GFOA 13
Certificate of Excellence in Financial Reporting - ASBO 14
FINANCIAL SECTION
Independent Auditor's Report 15
Management's Discussion and Analysis 17
Basic Financial Statements:
Government-Wide Financial Statements:
Statement of Net Position 28
Statement of Activities 29
Fund Financial Statements:
Balance Sheet - Governmental Funds 30
Reconciliation of the Governmental Funds Balance Sheet to the Statement of Net Position 32
Statement of Revenues, Expenditures, and Changes in Fund Balances - Governmental Funds 34
Reconciliation of the Governmental Funds Statement of Revenues, Expenditures,and Changes in Fund Balances to the Statement of Activities 36
Statement of Net Position - Proprietary Fund 37
Statement of Revenues, Expenses, and Changes in Fund Net Position - Proprietary Fund 38
Statement of Cash Flows - Proprietary Fund 39
Statement of Assets and Liabilities - Fiduciary Fund 40
Notes to the Financial Statements 41
Required Supplementary Information:
Budgetary Comparison Schedule - General Fund
Schedule of Revenues, Expenditures, and Changes in Fund Balances - Budgets and Actual Schedule A-1 75
Pension Plan Schedules:
Schedule of the District's Proportionate Share of the Net Pension Liability - South Carolina Retirement System 76
Schedule of the District's Contributions - South Carolina Retirement System 77
Schedule of the District's Proportionate Share of the Net Pension Liability - Police Officers Retirement System 78
Schedule of the District's Contributions - Police Officers Retirement System 79
(Continued)
YORK SCHOOL DISTRICT ONEYORK, SOUTH CAROLINA
COMPREHENSIVE ANNUAL FINANCIAL REPORT
YEAR ENDED JUNE 30, 2016
TABLE OF CONTENTS

DESCRIPTION PAGE NUMBER
YORK SCHOOL DISTRICT ONEYORK, SOUTH CAROLINA
COMPREHENSIVE ANNUAL FINANCIAL REPORT
YEAR ENDED JUNE 30, 2016
TABLE OF CONTENTS
FINANCIAL SECTION (CONTINUED)
Supplementary Information:
Combining and Individual Fund Financial Schedules:
General Fund
Schedule of Revenues, Expenditures, and Changes in Fund Balances - Revised Budget and Actual Schedule A-2 83
Special Revenue Fund
Schedule of Revenues, Expenditures, and Changes in Fund Balances Schedule B-1 92
Supplemental Listing of LEA Subfund Codes and Titles Schedule B-2 104
Summary Schedule for Other Designated Restricted State Grants Schedule B-3 105
Education Improvement Act
Combining Schedule of Revenues, Expenditures, and Changes in Fund Balance - All Programs Schedule B-4 106
Summary Schedule by Program Schedule B-5 110
Other Schedules
Detailed Schedule of Due to State Department of Education/Federal Government Schedule B-6 111
Debt Service Fund
Schedule of Revenues, Expenditures, and Changes in Fund Balance Schedule C-1 115
Capital Projects Fund
Schedule of Revenues, Expenditures, and Changes in Fund Balance Schedule D-1 119
Proprietary Fund - Enterprise Fund - Food Service Fund
Schedule of Revenues, Expenses, and Changes in Fund Net Position Schedule E-1 123
Fiduciary Fund - Agency - Pupil Activity Fund
Schedule of Receipts, Disbursements, and Changes in Due to Student Organizations Schedule F-1 127
Schedule of Changes in Assets and Liabilities in Due to Student Organizations Schedule F-2 128
Supplemental Schedule:
Supplemental State Department of Education Schedules
Location Reconciliation Schedule 129
Financial Trends Information
Net Position by Component - Last Ten Fiscal Years - Accrual Basis of Accounting Table 1 133
Changes in Net Position - Last Ten Fiscal Years - Accrual Basis of Accounting Table 2 134
Fund Balances of Governmental Funds - Last Ten Fiscal Years - Modified Accrual Basis of Accounting Table 3 136
Changes in Fund Balances of Governmental Funds - Last Ten Fiscal Years - Modified Accrual Basis of Accounting Table 4 137
(Continued)
STATISTICAL SECTION (UNAUDITED)

DESCRIPTION PAGE NUMBER
YORK SCHOOL DISTRICT ONEYORK, SOUTH CAROLINA
COMPREHENSIVE ANNUAL FINANCIAL REPORT
YEAR ENDED JUNE 30, 2016
TABLE OF CONTENTS
Revenue Capacity Information
Assessed Value and Estimated Actual Value of Taxable Property - Last Ten Fiscal Years Table 5 139
Property Tax Rates - Direct and Overlapping Governments - Last Ten Fiscal Years Table 6 140
Principal Property Taxpayers - Current and Nine Years Ago Table 7 141
Property Tax Levies and Collections - Last Ten Fiscal Years Table 8 142
Debt Capacity Information
Ratios of Outstanding Debt by Type - Last Ten Fiscal Years Table 9 143
Ratios of General Bonded Debt Outstanding - Last Ten Fiscal Years Table 10 144
Direct and Overlapping Governmental Activities Debt - As of June 30, 2016 Table 11 145
Legal Debt Margin Information - Last Ten Fiscal Years Table 12 146
Demographic and Economic Information
Demographic and Economic Statistics - Last Ten Fiscal Years Table 13 147
Principal Employers - Current Year and Nine Years Ago Table 14 148
Schedule of Operating Information
Full-Time Equivalent York School District One Employees by Function -Last Ten Fiscal Years Table 15 149
Operating Indicators by Function - Last Ten Fiscal Years Table 16 150
Capital Asset Statistics by Function - Last Ten Fiscal Years Table 17 151
COMPLIANCE SECTION
Schedule of Expenditures of Federal Awards 153
Notes to the Schedule of Expenditures of Federal Awards 154
Independent Auditor's Report - Report on Internal Control Over Financial Reporting and on Compliance and Other Matters Based on an Audit of Financial Statements Performed in Accordance with Government Auditing Standards 155
Independent Auditor's Report - Report on Compliance for Each Major Federal Program and Report on Internal Control over Compliance Required by the Uniform Guidance 157
Summary Schedule of Prior Audit Findings 159
Schedule of Findings and Questioned Costs 160
STATISTICAL SECTION (UNAUDITED) (CONTINUED)

People
of
York
School D
istr
ict O
ne
Board
of T
ruste
es
Superinte
ndent
Assis
tant S
uperi
nte
ndent fo
r
Instr
uction a
nd A
dm
inis
tration
Assis
t S
uperi
nte
ndent fo
r
Fin
ance a
nd O
pera
tions
Pri
ncip
als
Technolo
gy C
ente
r D
irecto
r
Dir
ecto
r of
Ele
menta
ry
Pro
gra
ms
Coord
inato
rof
Accounta
bility
and Instr
uctional
Technolo
gy
Dir
ecto
r o
f
Specia
l S
erv
ices
Nurs
es
Psycholo
gis
ts
Socia
l Work
ers
Testing
Coord
inato
r
Benefits
Dir
ecto
r of
Opera
tions
Tra
nsport
ation
Superv
isor
Dir
ecto
r of
Technolo
gy
Busin
ess
Manager
Main
t. T
echnic
ians
Custo
dia
l
Superv
isor
Custo
dia
ns
Payro
ll A
ccounts
Payable
Cle
rkCoord
inato
r of
Specia
l P
roje
cts
Bus D
rivers
IT T
echnic
ians
Stu
dent
Info
rmation
Stu
dent
Accounta
bility
Cle
rk
Cafe
teri
a
Managers
Cafe
teri
a S
taff
Dir
ecto
r of H
um
an R
esourc
es
and T
eacher
Quality
Dir
ecto
r of P
upil
Serv
ices
Gifte
d E
ducation
ES
OL
Pare
nt E
ducation
Public Info
rmation O
ffic
er
Dir
ecto
r of F
ood
Serv
ice
1
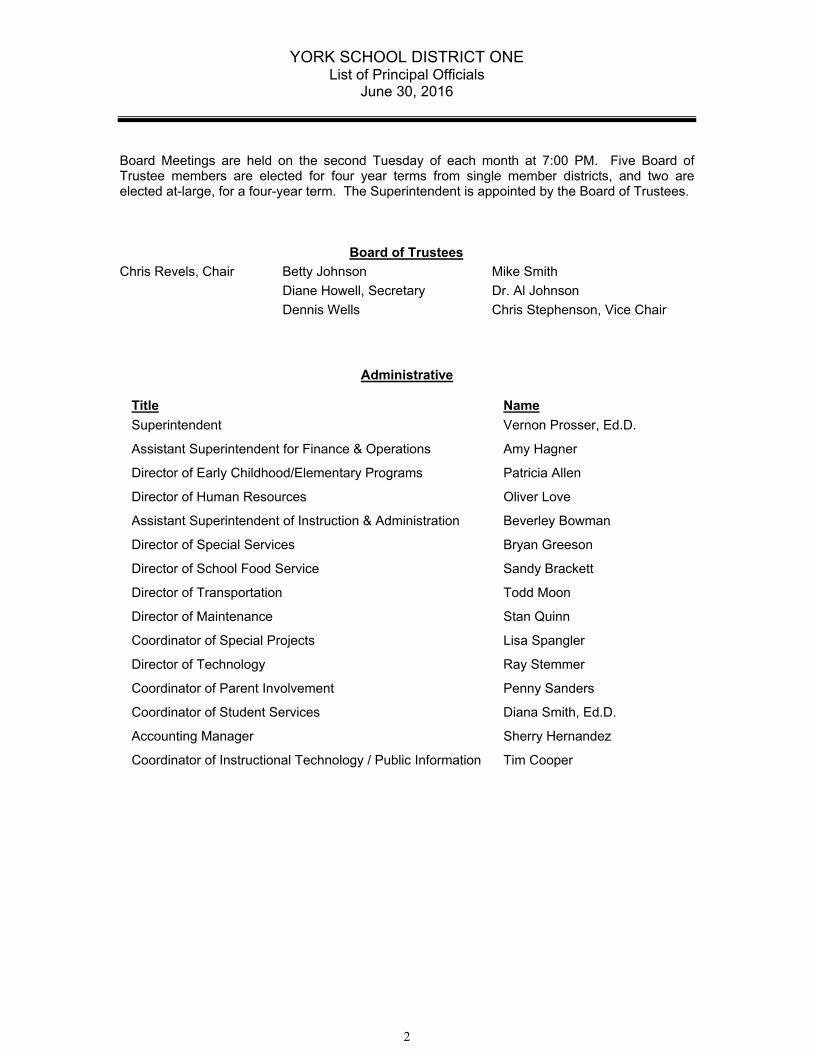
YORK SCHOOL DISTRICT ONE List of Principal Officials
June 30, 2016
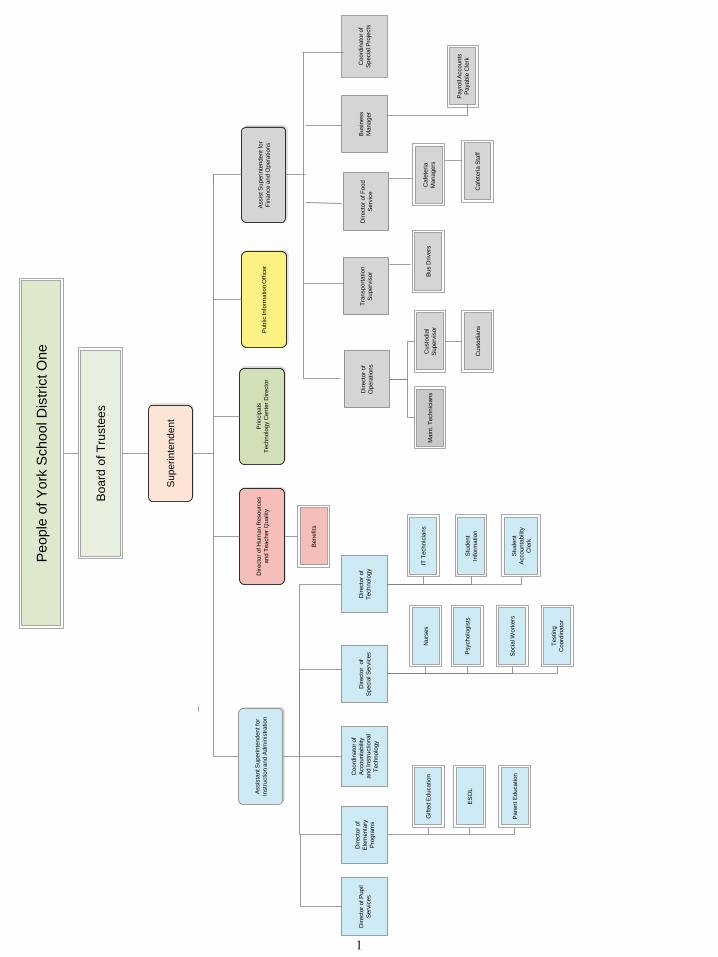
Board Meetings are held on the second Tuesday of each month at 7:00 PM. Five Board of Trustee members are elected for four year terms from single member districts, and two are elected at-large, for a four-year term. The Superintendent is appointed by the Board of Trustees.
Board of Trustees
Chris Revels, Chair Betty Johnson Mike Smith
Diane Howell, Secretary Dr. Al Johnson
Dennis Wells Chris Stephenson, Vice Chair
Administrative
Title Name
Superintendent Vernon Prosser, Ed.D.
Assistant Superintendent for Finance & Operations Amy Hagner
Director of Early Childhood/Elementary Programs Patricia Allen
Director of Human Resources Oliver Love
Assistant Superintendent of Instruction & Administration Beverley Bowman
Director of Special Services Bryan Greeson
Director of School Food Service Sandy Brackett
Director of Transportation Todd Moon
Director of Maintenance Stan Quinn
Coordinator of Special Projects Lisa Spangler
Director of Technology Ray Stemmer
Coordinator of Parent Involvement Penny Sanders
Coordinator of Student Services Diana Smith, Ed.D.
Accounting Manager Sherry Hernandez
Coordinator of Instructional Technology / Public Information Tim Cooper
2
Vernon Prosser Amy Hagner Superintendent Assistant Superintendent
York School District One 1475 East Liberty Street P.O. Box 770 York, SC 29745 Telephone (803) 684-9916 Fax (803) 684-1903 www.york.k12.sc.us
September 27, 2016
To the Citizens of York School District One:
We are pleased to submit to you the Comprehensive Annual Financial Report (“CAFR”) of York School District One (“District”) for the fiscal year ended June 30, 2016. State law requires that all school districts publish within five months of the close of each fiscal year a complete set of financial statements. This report has been prepared in conformity with generally accepted accounting principles (“GAAP”) as set forth by the Governmental Accounting Standards Board (“GASB”) and other recognized authoritative sources.
This report consists of management’s representations concerning the finances of the District. Consequently, management assumes full responsibility for the completeness and reliability of all of the information presented in this report. To provide a reasonable basis for making these representations, management of the District has established a comprehensive internal control framework that is designed both to protect the District’s assets from loss, theft, or misuse, and to compile sufficient reliable information for the preparation of the District’s financial statements in conformity with GAAP. Because the cost of internal controls should not outweigh their benefits, the District’s comprehensive framework of internal controls has been designed to provide reasonable rather than absolute assurance that the financial statements will be free from material misstatement. As management, we assert that, to the best of our knowledge and belief, this financial report is complete and reliable in all material respects. We also believe that all disclosures necessary to enable the reader to gain an understanding of the District’s financial activities have been included.
The District’s financial statements have been audited by Greene, Finney & Horton, LLP. The goal of the independent audit was to provide reasonable assurance that the financial statements of the District for the fiscal year ended June 30, 2016 are free of material misstatement. The independent audit involved examining, on a test basis, evidence supporting the amounts and disclosures in the financial statements; assessing the accounting principles used and significant estimates made by management; and evaluating the overall financial statement presentation. The independent auditor concluded that there was a reasonable basis for rendering an unmodified opinion that the District’s financial statements for the year ended June 30, 2016 are fairly presented in conformity with GAAP. The independent auditor’s report is presented as the first component of the financial section of this report.
3

The independent audit of the financial statements of the District was part of a broader, federally mandated “Single Audit” designed to meet the special needs of federal grantor agencies. The standards governing Single Audit engagements require the independent auditor to report not only on the fair presentation of the financial statements, but also on the audited government’s internal controls and compliance with legal requirements, with special emphasis on internal controls and legal requirements involving the administration of federal awards. These reports are available in the compliance section of this comprehensive annual financial report. GAAP requires that management provide a narrative introduction, overview, and analysis to accompany the financial statements in the form of Management’s Discussion & Analysis (“MD&A”). This letter of transmittal is designed to complement MD&A and should be read in conjunction with the MD&A, which can be found immediately following the report of the independent auditor. REPORTING ENTITY The District defines its reporting entity by applying the criteria set forth in GASB #14 and GASB #39 to potential component units. Briefly, a component unit is an organization for which the District is financially accountable or other organizations that, because of the nature or significance of their relationship with the District, would cause the District’s financial statements to be misleading or incomplete if they were omitted from the reporting entity. These criteria are discussed in more detail in Note 1 to the financial statements. Using these criteria, management has determined that the District has no component units, nor is it a component unit of any other organization. GENERAL INFORMATION, LOCAL ECONOMIC CONDITION AND OUTLOOK The District is one of four K-12 school districts within York County, and is located in the southwestern region of the County. The District encompasses the entire City of York, and several smaller municipalities located on the western border of York County. Geographically, the District is the largest of the four districts and encompasses approximately 40% of the land use in the County, but only makes up approximately 10% of the County’s total assessed value, which was $101,487,984 for tax year 2015. The District was created in 1954 by the consolidation of seven school districts within the County. The District has approximately 4,946 students in 2015-2016. For the 2016-2017 fiscal year, the district is projecting enrollment to remain about the same. The district currently operates ten schools: Hunter Street Elementary School (K-4), Jefferson Elementary School (K-4), Cotton Belt Elementary (K-4), Hickory Grove Sharon Elementary (K-6), Harold C Johnson Elementary (K-4), York Intermediate School (5-6), York Middle School (7-8), York Comprehensive High School (9-12), Floyd D Johnson Technology Center (9-12), and York One Academy – Alternative School (5-12). The District also hosts a Family Resource Center with parenting education resources and a free medical clinic.
4
The age of active school buildings in the School District range from 1974 to 2012 and can be found in Table 17 of the statistical section of this report. The School District continues to monitor the long-term capital needs and maintenance needs of facilities throughout the District.
The District has established and maintains strong collaborative relationships with higher education institutions in the area including Winthrop University, York Technical College and the University of South Carolina at Lancaster for dual credit course offerings and professional development for staff. Additionally, the District partners with local businesses through the Greater York Chamber of Commerce to provide School to Work opportunities for students. Through collaborations with local health and human service agencies to include Catawba Mental Health, Keystone Substance Abuse Services, The Early Learning Partnership of York County, York County First Steps, York County All on Board, and Dental Access Carolina, among others, the district is able to provide needed services and support to students.
The District received District-level accreditation through the Southern Association of Colleges and Schools and the Council on Accreditation and School Improvement (SACS CASI). District accreditation is a national protocol for school districts committed to systemic, systematic, and sustainable improvement. When a district earns accreditation, all schools in the district must meet the AdvancED Accreditation standards for quality school systems, engage in continuous improvement, and demonstrate quality assurance through internal and external review. Accreditation standards a district must demonstrate are:
Vision and Purpose Governance and Leadership Teaching and Learning Documenting and Using Results Resources and Support Systems Stakeholder Communications and Relationships Commitment to Continuous Improvement
The School Board of Trustees is made up of seven members elected by the qualified electors of the District. Five of the members are elected from a single member district, and two members are elected at large. The Board meets the second Tuesday of each month except for July. The Superintendent is appointed by the Board of Trustees and is responsible to the Board for the operation of all phases of the District’s activities.
York County is located in the Piedmont section of South Carolina and is bordered on the north by North Carolina. The county has a land area of 685 square miles and had a population of 251,195 in 2015. This figure represents an approximate 11% increase in population over the 2010 census of 226,073. The District encompasses approximately 316 square miles of the County. The County’s per capita income was $37,903 in 2014. The County’s unemployment rate was 5.4% at June 30, 2016, which is slightly lower than the rate at June 30, 2015, which was 6.0%. The County is served by two major interstates: Interstate 85 and Interstate 77, which provide access to the larger metropolitan area of Charlotte, North Carolina. The City of York is the County seat of York County, and had a population of approximately 7,883 in 2012.
5
While industrial and manufacturing plants are still a major source of employment for York County residents, a broader, more diversified base of employment also exists in the County, with Duke Energy Corporation, Wells Fargo Home Mortgage, the County of York, Winthrop University, Paramount Parks-Carowinds, and all 4 of the County’s school districts being in the list of top 25 employers in the County. MAJOR INITIATIVES The following are initiatives the District focused on during the 2015-2016 fiscal year: Academic Resources:
The elementary schools operated Girls on the Run programs, providing curriculum that combines character education focused on building self esteem with a physical education component, leading ultimately to participants running 5k events.
The District purchased APEX licensing, enabling students to participate in online courses currently not offered in the traditional high school setting.
Through a grant to Keystone Substance Abuse Services, the District participated on an advisory board which planned and implemented parent information sessions in each district in the county. The RAP (Raising Awareness for Parents) sessions were held throughout the year and ranged by topics from bullying to mental health issues facing students.
The District has an Academic Reinforcement Center (ARC) which is a comprehensive approach for students to earn credits that otherwise would have been lost due to poor grades, absenteeism or other factors.
Through continued collaborative efforts with York County Early Learning Partnership and York County First Steps, the free medical clinic offered within the Parenting Partnerships Family Resource Center offers services of a family nurse practitioner in addition to a pediatrician and nurse. They provide prevention and treatment for uninsured and underinsured children in the district.
Summer Reading Camp, implemented through funding through the SDE, served third grade students reading significantly below grade level through an intensive six week summer program.
The District continues to partner with York Technical College to expand our ability to bring dual credit opportunities to our students. York Tech has made it possible for the district to administer the COMPASS college placement test to targeted juniors/seniors. These test scores will be used as the main qualifying criteria for admittance into dual credit courses offered at York Comprehensive High School through York Technical College.
The District continued with the Middle College program with a joint partnership with York Technical College. The program is a non-traditional high school program designed for juniors and seniors with a high aptitude and potential for college success. The long term goal of the Middle College is to promote a college going culture by engaging students in relevant learning while providing them an opportunity to graduate. Students participate in the course on the campus of York Technical College.
6
The District continued our partnership with York Technical College for an Early College program targeting high achieving 8th grade students. These students have the opportunity to earn a University Studies Certificate over the course of their high school career, the equivalent of 31 hours of college transferrable courses. This program is the first of its kind in York County.
Through an At Risk Student Innovation Grant, the district offered after school and summer intercession programs to 150 at risk students at York Intermediate School, Jefferson Elementary School, and Harold C Johnson Elementary School.
The District is a partner with Winthrop University’s NetScope (Network of Sustained, Collaborative, Ongoing Preparation for Educators) grant. Through this partnership, schools in the district who are identified as partner schools or professional development schools participate in extensive based professional development to improve preservice and inservice training.
Through a partnership with York County First Steps, at risk 4 year olds participate in a Count Down to Kindergarten summer program prior to entering kindergarten during which they receive educational home visits to prepare them with skills which promote school readiness.
Literacy: The District continues to partner with the Early Learning Partnership of York
County and York County First Steps and through local fundraising efforts in the Imagination Library with over 400 children ages birth to five years. This program encourages reading by mailing a developmentally appropriate book to each participant’s home monthly.
Schools in the District continued to implement reading programs in order to promote literacy and prevent regressions of reading and comprehension skills.
Technology: The District has a Technology Coach that provides professional development
and training to all employees in the district. The District did a complete computer replacement at the high school, purchased
devices for individual schools and implemented a complete disaster recovery plan.
The District completed a complete wireless overlay and we now have wireless access throughout the district.
Construction:
Most of the construction work during the year related to enhancing safety and security features at all of the district facilities.
District-Wide Accomplishments for FY 2015-2016 were as follows:
The District had thirteen teachers that were awarded Family Trust Grants. The grants fund projects that encourage unique and creative learning opportunities or enrich regular classroom activities.
York Comprehensive High School continued with the Alive at 25 course. This 4 ½ course focuses on the behaviors, decision-making and risks facing young drivers every time they get behind the wheel.
7

Five schools received Palmetto Gold and Silver Awards from the South Carolina Department of Education. The award program I s designed to recognize and rewards schools for attaining high levels of absolute performance, for attaining high rates of growth, and for making substantial progress in closing the achievement gap between disaggregated groups. Cotton Belt Elementary, York Comprehensive High School, Jefferson Elementary, York Intermediate School and Floyd D Johnson Technology Center received the awards.
York Comprehensive High School Principal, Mr. Christopher Black, was named the State 4A Principal of the Year by the South Carolina High School League.
York Comprehensive High School Athletic Director, Mr. Steve Boyd, was named State 4A Athletic Director of the Year by the South Carolina High School League.
Three students from York Comprehensive High School raised $1,265.22 in the districts second “Bigger than Bullying 5K.” The students developed the idea for a DECA project that would involve students, staff and the entire community in the awareness of bullying and the school districts efforts to prevent bullying.
The District was awarded six Nation School Lunch Program Assistance grants in the amount of $97,289. The grant allowed the District to purchase much needed equipment for kitchens of six schools in the district.
The District was awarded a grant from the South Carolina Department of Education to offer an extension to the regular Summer Reading Camp program. This program provided enhancement opportunities for children through collaboration with community groups including Kings Mountain National Military Park, York County Cultural and Heritage Museum and Bricks 4 Kids. The grant totaled $45,000.
The District continued the Olweus Bullying Prevention Program throughout the district and planned and implemented activities in conjunction with National Unity Day to prevent bullying. Students in the DECA program at Floyd D Johnson Technology Center, planned and implemented a 5K race as a community service project.
The District, in collaboration with community partners including Winthrop University, S2TEM Center, Catawba Region Education Consortium, York County Culture and Heritage Museums, and Chester School District received the second round of funding through the Math Science Partnership Grant. The grant, totaling $282,543 for year 3 of 3 years, provided professional development focusing on Math, Science, Engineering, and Technology for over 100 teachers in the form of graduate courses, summer institutes, summer immersion experience and externships with local businesses and industry.
The District received an additional Math Science Partnership Grant to support Science, Technology, Engineering, and/or Mathematics (STEM) professional development at the middle school level. The district will provide professional development focused on technology and partner with Winthrop University and Discovery Place Education. The one year grant total is $142,562.
The District received two At Risk Student Innovation Grants in the amount of $147,906 (total). The grant provides funding for an after school enrichment programs and a summer intercessions for at risk students at Jefferson Elementary School, Harold C Johnson Elementary School and York Intermediate School. The grant also provided curriculum supplies and materials for implementation of Positive Action.
8
The District participated in the York County Summer Feeding Program. Our students received nutritionally balanced meals at Jefferson Elementary, York Intermediate School, York Middle School, York Comprehensive High School, and York One through a partnership with the York County Summer Feeding Program. In addition, other students not participating in summer programs will also be able to receive meals through community feeding sites.
The District received a grant for the fourth year in the amount of $20,802 from the Developmental Disabilities Council. Through the grant, the district continued implementation of a job coach program designed to offer job shadowing and internship experiences for high school students with disabilities in order to prepare them for employment upon completion of high school.
Using Title III funds, the district initiated a two day per week after school program at Harold C. Johnson Elementary School for students with limited English Proficiency.
The District continues to work in collaboration with the Second Harvest Food Bank of Metrolina in the “backpack” program for students in our district who are in need of food in their homes over the weekends.
The after school dinner program continued to offer meals to student athletes at York Middle School and York Comprehensive High School in conjunction with tutoring and homework assistance. This program is coordinated by the district’s food service department and funded by the DSS Dinner program.
FINANCIAL INFORMATION Budgetary Control The District’s budget process is developed using, as a foundation, the District’s Vision Statement, Mission Statement, and Beliefs. District’s Vision Statement Building the foundation for tomorrow by sparking potential and inspiring success. District’s Mission Statement Working with the community, we will provide a diverse, innovative education in a safe environment enabling students to become responsible citizens in a global society. District’s Beliefs
Learning is a life-long, ever-changing process. Each child is unique and should have the opportunity to reach his/her full
potential. A safe, orderly and nurturing environment is essential for learning. Education is a cooperative effort between schools and the community. Technology enhances teaching and learning and should be current.
9
The District exercises budgetary controls. The objective of these budgetary controls is to ensure compliance with the provisions set forth in the annual appropriations adopted by the Board of Trustees. Beginning in February, the Superintendent, Assistant Superintendent, Director of Finance, Director of Human Resources, and the Maintenance Director visit each location to discuss capital and personnel needs with the building level administrator. With direction from these meetings, and the Superintendent, the Director of Finance prepares a proposed budget to be presented to the Board of Trustees. The Board of Trustees annually adopts and approves the General Fund budget by June 30th. The District maintains the modified accrual system for all governmental funds, and uses encumbrance accounting to accomplish budgetary controls at the function level. District policies allow funds to be transferred between function and object amounts as long as the total spending does not exceed the approved budget. Board approval is needed for supplemental appropriations that are additions to the budget. Encumbrances are utilized to assist in budgetary control and encumbrances lapse at fiscal year-end. The Board of Trustees is given a budget status report on a monthly basis, and is reviewed by the members of the Board. Special revenue fund budgets are controlled in conformance with the specific requirements of that fund, and budgets are not legally adopted. Budgets are not adopted for the Capital Projects Fund or the Debt Service Fund. Debt Service expenditures are set in accordance to the bond issue requirements, with revenues needed to pay the debt service requirements levied by the County Auditor. Subsequent to the adoption of the budget by the Board, the Assistant Superintendent certifies to the County Auditor the amount of millage required to raise sufficient funds to defray the cost of operating the District and to pay the bonded indebtedness incurred by the District. Pursuant to Act No. 449 enacted during the 1975 Session of the General Assembly of the State of South Carolina, the General Assembly provided for the levying of school taxes for the District. Part III, Section 6 of Act No. 449 empowers the Board of the District to levy taxes to provide funds for school operating expenses provided such levy may not be increased more than four mills in any year over that levied for a preceding year without the approval of the qualified electors of the District voting in a referendum. Act No. 744 enacted at the 1990 Session of the General Assembly of South Carolina increased this limitation from four to six mills. Since 1969, a county-wide millage has been levied for the operation of the four school districts of York County pursuant to Act No. 1663 of the Acts and Joint Resolutions of the General Assembly for the year 1968. Beginning with the 1981-82 school year and continuing through the 1986-87 school year, the proceeds of the county levy were distributed on a per pupil (average daily membership) basis to the four districts within the County. However, pursuant to the provisions of Act No. 292 passed by the General Assembly in 1987, authorization was provided to distribute the receipts from one mill levied under the countywide school levy to the school district with the lowest assessed value. Pursuant to the provisions of Act No. 744 enacted during the 1990 Session of the General Assembly of the State of South Carolina, the countywide levy was raised to thirty-three mills and the authorization to distribute the receipts from one mill to the district with the lower assessed value was continued. After reappraisal of all property in calendar year in 2005, the total of countywide mills was reduced to thirty. The District has the lowest assessed value in the County.
10
Long Term Financial Planning The two major focus areas for the District are technology and facilities. During the 2014-2015 year, the District continued to spend money for technology needs throughout the district and the bond proceeds on capital needs. In addition, capital projects are another main area of focus of the district’s long-term financial planning component. The issuance of over $85 million in bonds demonstrates the district’s commitment to safe, secure, quality educational facilities. The District evaluates facilities on an ongoing basis in order to provide additional instructional space prior to the existing space becoming overcrowded. The unassigned fund balance in the general fund at year end was $8,385,819. The District feels a positive fund balance is sound financial management. A positive fund balance serves several purposes. The first is to ensure that the instructional process is not interrupted by unforeseen budgetary constraints such as state budget cuts which we have seen over the last couple of years. Secondly, the District is able to reduce short term borrowing by having cash available in the later months of the year. The third purpose is to maintain a positive bond rating. The fund balance will allow the District not only to maintain its ability to handle any major shortfalls due to the economic decline but also to handle the increase in operating costs. OTHER INFORMATION Independent Audit State statutes require an annual audit by independent certified public accountants. The accounting firm of Greene, Finney, and Horton, LLP, was selected by the District’s Board of Trustees to perform the Districts' annual audit for the fiscal years ending 2002 through 2016. In addition, the audit was designed to meet the requirements of the Single Audit Act Amendments of 1996 and the provisions of OMB Circular A-133. The auditor's report on the financial statements is included in the Financial Section of this report, and the auditor's report related specifically to the single audit are included in the Compliance Section of this report. Awards Our Comprehensive Annual Financial Report for fiscal year ended June 30, 2015 was a recipient of the prestigious awards of excellence, from both the Government Finance Officers Association (“GFOA”) with their Certificate of Achievement for Excellence in Financial Reporting, and from the Association of School Business Officials (“ASBO”) with their Certificate of Excellence in Financial This is the fourteenth consecutive year that the government has achieved these prestigious awards. These two awards are made only to governmental units that publish a comprehensive annual financial report that is easily readable, efficiently organized, and conform to program standards, as well as satisfy generally accepted accounting principles and applicable legal requirements.
11
These awards are valid for a period of one year only. We believe that our current comprehensive annual financial report continues to meet each program’s requirements and we are submitting it to the GFOA and to ASBO to determine its eligibility for another certificate. Acknowledgements The completion of this comprehensive annual financial report is attributed to the hard work and professional dedication of the entire Finance Department. Their dedication and efficient services have made the timely preparation of this report possible. I would like to acknowledge the cooperation and assistance of the District’s school and departmental administration throughout the year in the efficient management of the District’s financial operations. I would also like to thank our audit firm Greene, Finney, & Horton LLP for their professional services in auditing the information contained within this document and their invaluable assistance with the compiling and printing of this financial report. The administration would also like to thank the entire School Board of Trustees for their continued support of excellence in financial reporting and fiscal integrity. Without their help, we would not be able to maintain the exceptional staff needed to assure such a high level of competency. This report reflects the District’s commitment to the citizens of York School District One and the financial community to provide information in conformance with the highest standards of financial accountability. Respectfully Submitted, Amy Hagner Assistant Superintendent Finance and Operations
12
Government Finance Officers Association
Certificate of Achievement for Excellence
in Financial Reporting
Presented to
York School District One
South Carolina
For its Comprehensive Annual Financial Report
for the Fiscal Year Ended
June 30, 2015
Executive Director/CEO
13
The Certificate of Excellence in Financial Reporting Award is presented to
York School District One
for its Comprehensive Annual Financial Report (CAFR) for the Fiscal Year Ended June 30, 2015
The CAFR has been reviewed and met or exceeded
ASBO International’s Certificate of Excellence standards
Brenda R. Burkett, CPA, CSBA, SFO John D. Musso, CAE, RSBA President Executive Director
14

www.gfhllp.com Greenville Mauldin Mount Pleasant
(864) 451-7381 (864) 232-5204 (843) 735-5805
INDEPENDENT AUDITOR’S REPORT The Board of Trustees York School District One York, South Carolina Report on the Financial Statements We have audited the accompanying financial statements of the governmental activities, the business-type activities, each major fund, and the aggregate remaining fund information of York School District One, South Carolina (the “District”), as of and for the year ended June 30, 2016, and the related notes to the financial statements, which collectively comprise the District’s basic financial statements as listed in the table of contents. Management’s Responsibility for the Financial Statements Management is responsible for the preparation and fair presentation of these financial statements in accordance with accounting principles generally accepted in the United States of America; this includes the design, implementation, and maintenance of internal control relevant to the preparation and fair presentation of financial statements that are free from material misstatement, whether due to fraud or error. Auditor’s Responsibility Our responsibility is to express opinions on these financial statements based on our audit. We conducted our audit in accordance with auditing standards generally accepted in the United States of America and the standards applicable to financial audits contained in Government Auditing Standards, issued by the Comptroller General of the United States. Those standards require that we plan and perform the audit to obtain reasonable assurance about whether the financial statements are free from material misstatement. An audit involves performing procedures to obtain audit evidence about the amounts and disclosures in the financial statements. The procedures selected depend on the auditor’s judgment, including the assessment of the risks of material misstatement of the financial statements, whether due to fraud or error. In making those risk assessments, the auditor considers internal control relevant to the entity’s preparation and fair presentation of the financial statements in order to design audit procedures that are appropriate in the circumstances, but not for the purpose of expressing an opinion on the effectiveness of the entity’s internal control. Accordingly, we express no such opinion. An audit also includes evaluating the appropriateness of accounting policies used and the reasonableness of significant accounting estimates made by management, as well as evaluating the overall presentation of the financial statements. We believe that the audit evidence we have obtained is sufficient and appropriate to provide a basis for our audit opinions. Opinions In our opinion, the financial statements referred to above present fairly, in all material respects, the respective financial position of the governmental activities, the business-type activities, each major fund, and the aggregate remaining fund information of York School District One, South Carolina, as of June 30, 2016, and the respective changes in financial position and, where applicable, cash flows thereof for the year then ended in accordance with accounting principles generally accepted in the United States of America.
15
Other Matters
Required Supplementary Information
Accounting principles generally accepted in the United States of America require that the management’s discussion and analysis, the budgetary comparison schedule for the General Fund and the pension plan schedules, as listed in the table of contents, be presented to supplement the basic financial statements. Such information, although not a part of the basic financial statements, is required by the Governmental Accounting Standards Board who considers it to be an essential part of financial reporting for placing the basic financial statements in an appropriate operational, economic, or historical context. We have applied certain limited procedures to the required supplementary information in accordance with auditing standards generally accepted in the United States of America, which consisted of inquiries of management about the methods of preparing the information and comparing the information for consistency with management’s responses to our inquiries, the basic financial statements, and other knowledge we obtained during our audit of the basic financial statements. We do not express an opinion or provide any assurance on the information because the limited procedures do not provide us with sufficient evidence to express an opinion or provide any assurance.
Supplementary and Other Information
Our audit was conducted for the purpose of forming opinions on the financial statements that collectively comprise the District’s basic financial statements. The supplementary information, the schedule of expenditures of federal awards, as required by Title 2 U.S. Code of Federal Regulations Part 200, Uniform Administrative Requirements, Cost Principles, and Audit Requirements for Federal Awards, the introductory section and the statistical section, as listed in the table of contents, are presented for purposes of additional analysis and are not a required part of the basic financial statements.
The supplementary information and the schedule of expenditures of federal awards are the responsibility of management and were derived from and relate directly to the underlying accounting and other records used to prepare the basic financial statements. Such information has been subjected to the auditing procedures applied in the audit of the basic financial statements and certain additional procedures, including comparing and reconciling such information directly to the underlying accounting and other records used to prepare the basic financial statements or to the basic financial statements themselves, and other additional procedures in accordance with auditing standards generally accepted in the United States of America. In our opinion, the supplementary information and the schedule of expenditures of federal awards are fairly stated, in all material respects, in relation to the basic financial statements as a whole.
The introductory section and the statistical section have not been subjected to the auditing procedures applied in the audit of the basic financial statements, and accordingly, we do not express an opinion or provide any assurance on them.
Other Reporting Required by Government Auditing Standards
In accordance with Government Auditing Standards, we have also issued our report dated September 27, 2016 on our consideration of the District’s internal control over financial reporting and on our tests of its compliance with certain provisions of laws, regulations, contracts, and grant agreements and other matters. The purpose of that report is to describe the scope of our testing of internal control over financial reporting and compliance and the results of that testing, and not to provide an opinion on internal control over financial reporting or on compliance. That report is an integral part of an audit performed in accordance with Government Auditing Standards in considering the District’s internal control over financial reporting and compliance.
Greene, Finney & Horton, LLP Mauldin, South Carolina September 27, 2016
16
YORK SCHOOL DISTRICT ONE YORK, SOUTH CAROLINA
MANAGEMENT’S DISCUSSION & ANALYSIS
YEAR ENDED JUNE 30, 2016
INTRODUCTION
This discussion and analysis of York County School District One’s (the “District”) financial performance provides an overview of the District's financial activities for the fiscal year ended June 30, 2016. The intent of this discussion and analysis is to look at the District’s financial performance as a whole; readers should also review the transmittal letter, financial statements, and the notes to the financial statements to enhance their understanding of the District’s financial performance.
FINANCIAL HIGHLIGHTS
Key financial highlights for fiscal year 2016 are as follows:
The liabilities and deferred inflows of resources of the District exceeded its assets and deferred outflows ofresources at the close of the most recent fiscal year yielding a net deficit of approximately $24.2 million. Ofthis amount, approximately $37.4 million was the District’s unrestricted net deficit.
The District’s total net position decreased by approximately $3.2 million compared to a $0.9 milliondecrease in the prior year. The change compared to the prior year is primarily attributable to a loss fromrefunding recognized fully in fiscal year 2016.
As of the close of the current fiscal year, the District’s governmental funds reported combined ending fundbalances of approximately $18.5 million. The District had an increase of approximately $1.9 million in thecurrent year compared to an increase of approximately $1.2 million in the prior year. The changecompared to the prior year is primarily attributable to increased revenues.
At the end of the current fiscal year, total fund balance for the General Fund was approximately $8.4million, which is approximately 21% percent of total General Fund expenditures. The entire amount isunassigned.
The District’s total capital assets decreased approximately $5.4 million (5%) during the current fiscal year.The key factor was depreciation expense of approximately $5.7 million, offset by various additions.
The District’s total gross debt decreased by approximately $6.5 million (7%) during the current fiscal yearwhich was due to regularly scheduled principal payments of approximately $2.5 million. The remainder ofthe decrease was due to the 2016 refunding activity.
During the fiscal year 2016, the District’s governmental fund type revenues were approximately $57.6million compared to approximately $55.9 million in the prior year. This increase was primarily due to higherlocal and state revenues.
The District had approximately $61.6 million in expenses related to governmental activities; approximately$27.6 million of these expenses were offset by program specific charges for services, grants orcontributions. General revenues (primarily taxes) and transfers in combined were approximately $30.5million and provided the remaining funding.
OVERVIEW OF THE FINANCIAL STATEMENTS
This annual report consists of a series of financial statements and notes to those statements. The financial statements include two kinds of statements, (the government-wide financial statements and the fund financial statements) that present different views of the District. The government-wide statements are intended to give the reader both an aggregate view of the District’s finances and a longer-term view of those finances. The fund financial statements are intended to provide a more detailed look at specific financial activities.
Reporting the District as a Whole - Government-Wide Financial Statements
The first two statements are government-wide financial statements that provide a broad overview of the District’s overall financial status, in a manner similar to a private-sector enterprise. These statements report information about the District as a whole.
17
YORK SCHOOL DISTRICT ONE YORK, SOUTH CAROLINA
MANAGEMENT’S DISCUSSION & ANALYSIS
YEAR ENDED JUNE 30, 2016
OVERVIEW OF THE FINANCIAL STATEMENTS (CONTINUED) Reporting the District as a Whole - Government-Wide Financial Statements (Continued) Statement of Net Position The Statement of Net Position presents information on all of the District’s assets and deferred outflows and liabilities and deferred inflows of resources, with the difference between these items reported as net position. Over time, increases or decreases in net position may serve as a useful indicator of whether the financial position of the District is improving or deteriorating. To assess the District’s overall health, other non-financial factors, such as the District’s property tax base, the condition and age of school buildings, as well as other physical assets, should be considered. Statement of Activities The Statement of Activities presents information showing how the government’s net position changed during the most recent fiscal year. All changes in net position are reported as soon as the underlying event giving rise to the change occurs, regardless of the timing of related cash flows. Thus, for some items, revenues and expenses are reported in this statement that will only result in cash flows in future fiscal periods (e.g., uncollected taxes and earned but unused vacation leave). Both of the government-wide financial statements distinguish functions of the District that are principally supported by taxes and intergovernmental revenues (governmental activities) from other functions that are intended to recover all or a significant portion of their costs through user fees and charges (business-type activities). The District’s activities are divided into two categories in the government-wide statements:
Governmental activities: Most of the District’s basic services are included here, such as regular and special education, transportation, and administration. Local, state, and federal funds finance most of these activities.
Business-type activities: The District charges fees to help cover the cost of certain services that it provides. Included within this activity is the food service program.
The government-wide financial statements can be found as listed in the table of contents of this report. Reporting the District’s Major Funds - Fund Financial Statements The remaining financial statements are fund financial statements that focus on individual parts of the District, and not the District as a whole. The fund financial statements report the District’s operations in more detail than the government-wide statements, and focus on the District’s most significant or “major” funds. A fund is a grouping of related accounts that is used to maintain control over resources that have been segregated for specific activities or objectives. The District, like other state and local governments, uses fund accounting to ensure and demonstrate compliance with finance-related requirements. All of the funds of the District can be divided into three categories: governmental funds, proprietary funds, and fiduciary funds. Governmental Funds Governmental Funds are used to account for essentially the same functions reported as governmental activities in the government-wide financial statements. Most of the District’s basic services are included within the governmental funds. The governmental funds generally focus on two things-how cash and other assets can readily be converted to cash flow in and out, and the balances left at year-end that are available for spending.
18
YORK SCHOOL DISTRICT ONE YORK, SOUTH CAROLINA
MANAGEMENT’S DISCUSSION & ANALYSIS
YEAR ENDED JUNE 30, 2016
OVERVIEW OF THE FINANCIAL STATEMENTS (CONTINUED) Reporting the District’s Major Funds - Fund Financial Statements (Continued) Because the focus of governmental funds is narrower than that of the government-wide financial statements, it is useful to compare the information presented for governmental funds with similar information presented for governmental activities in the government-wide financial statements. The governmental fund statements provide a more detailed short-term view that helps determine whether there are more or fewer financial resources that can be spent in the near future to finance the district’s programs. However the governmental fund statements do not encompass the additional long-term focus as that of the government-wide financial statements, and as a result additional information at the end of the governmental fund statements, in the form of reconciliation, explains the relationship (or differences) between the governmental fund statements and the government-wide statements. The District maintains five individual governmental funds. Information is presented separately in the governmental fund balance sheet and in the governmental funds statement of revenues, expenditures, and changes in fund balances for the General Fund, Special Revenue Fund, Special Revenue - EIA Fund, Debt Service Fund and Capital Projects Fund, all of which are considered to be major funds. The governmental fund financial statements can be found as listed in the table of contents of this report. Proprietary Fund The District maintains one type of proprietary fund. Enterprise funds are used to report the same functions presented as business-type activities in the government-wide financial statements. The District uses an enterprise fund to account for its food service operation. Proprietary funds provide the same type of information as the government-wide financial statements, only in more detail; therefore, the proprietary fund financial statements provide more detailed information for the food service operation, which is considered a major fund of the District. The proprietary fund financial statements can be found as listed in the table of contents of this report. Fiduciary Funds Fiduciary funds are used to account for resources held for the benefit of parties outside the government. Fiduciary funds are not reflected in the government-wide financial statement because the resources of those funds are not available to support the District’s own programs. The District is the trustee, or fiduciary, for the pupil activity of the schools and accounts for this activity in an agency fund. The fiduciary fund financial statement can be found as listed in the table of contents of this report. Notes to the Financial Statements The notes provide additional information that is essential to a full understanding of the data provided in the government-wide and fund financial statements. The notes to the financial statements can be found as listed in the table of contents of this report. Other Information The combining and individual fund financial schedules referred to earlier in connection with governmental funds can be found as listed in the table of contents of this report. The District adopts an annual appropriated budget only for its General Fund. A budgetary comparison schedule has been provided as required supplementary information for this fund to demonstrate compliance with the budgets. This schedule can be found as listed in the table of contents of this report.
19
YORK SCHOOL DISTRICT ONE YORK, SOUTH CAROLINA
MANAGEMENT’S DISCUSSION & ANALYSIS
YEAR ENDED JUNE 30, 2016
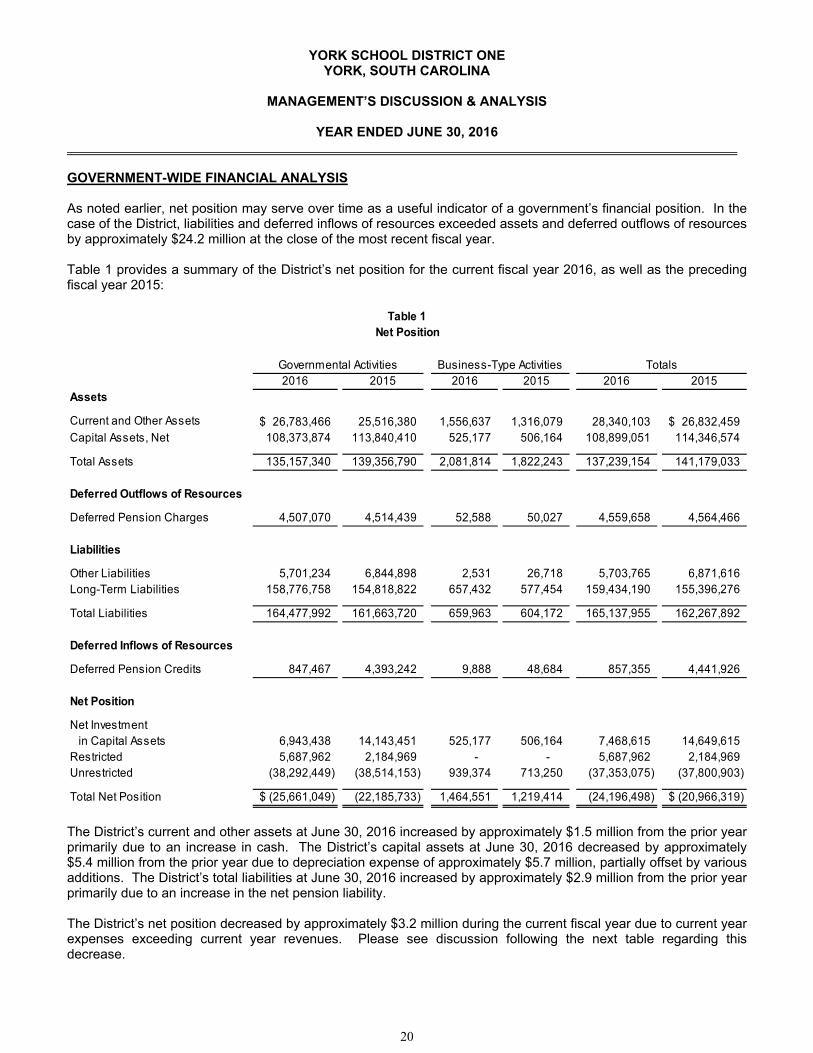
GOVERNMENT-WIDE FINANCIAL ANALYSIS As noted earlier, net position may serve over time as a useful indicator of a government’s financial position. In the case of the District, liabilities and deferred inflows of resources exceeded assets and deferred outflows of resources by approximately $24.2 million at the close of the most recent fiscal year. Table 1 provides a summary of the District’s net position for the current fiscal year 2016, as well as the preceding fiscal year 2015:
2016 2015 2016 2015 2016 2015Assets
Current and Other Assets 26,783,466$ 25,516,380 1,556,637 1,316,079 28,340,103 26,832,459$ Capital Assets, Net 108,373,874 113,840,410 525,177 506,164 108,899,051 114,346,574
Total Assets 135,157,340 139,356,790 2,081,814 1,822,243 137,239,154 141,179,033
Deferred Outflows of Resources
Deferred Pension Charges 4,507,070 4,514,439 52,588 50,027 4,559,658 4,564,466
Liabilities
Other Liabilities 5,701,234 6,844,898 2,531 26,718 5,703,765 6,871,616 Long-Term Liabilities 158,776,758 154,818,822 657,432 577,454 159,434,190 155,396,276
Total Liabilities 164,477,992 161,663,720 659,963 604,172 165,137,955 162,267,892
Deferred Inflows of Resources
Deferred Pension Credits 847,467 4,393,242 9,888 48,684 857,355 4,441,926
Net Position
Net Investmentin Capital Assets 6,943,438 14,143,451 525,177 506,164 7,468,615 14,649,615
Restricted 5,687,962 2,184,969 - - 5,687,962 2,184,969 Unrestricted (38,292,449) (38,514,153) 939,374 713,250 (37,353,075) (37,800,903)
Total Net Position (25,661,049)$ (22,185,733) 1,464,551 1,219,414 (24,196,498) (20,966,319)$
Table 1Net Position
Governmental Activities Business-Type Activities Totals
The District’s current and other assets at June 30, 2016 increased by approximately $1.5 million from the prior year primarily due to an increase in cash. The District’s capital assets at June 30, 2016 decreased by approximately $5.4 million from the prior year due to depreciation expense of approximately $5.7 million, partially offset by various additions. The District’s total liabilities at June 30, 2016 increased by approximately $2.9 million from the prior year primarily due to an increase in the net pension liability. The District’s net position decreased by approximately $3.2 million during the current fiscal year due to current year expenses exceeding current year revenues. Please see discussion following the next table regarding this decrease.
20
YORK SCHOOL DISTRICT ONE YORK, SOUTH CAROLINA
MANAGEMENT’S DISCUSSION & ANALYSIS
YEAR ENDED JUNE 30, 2016
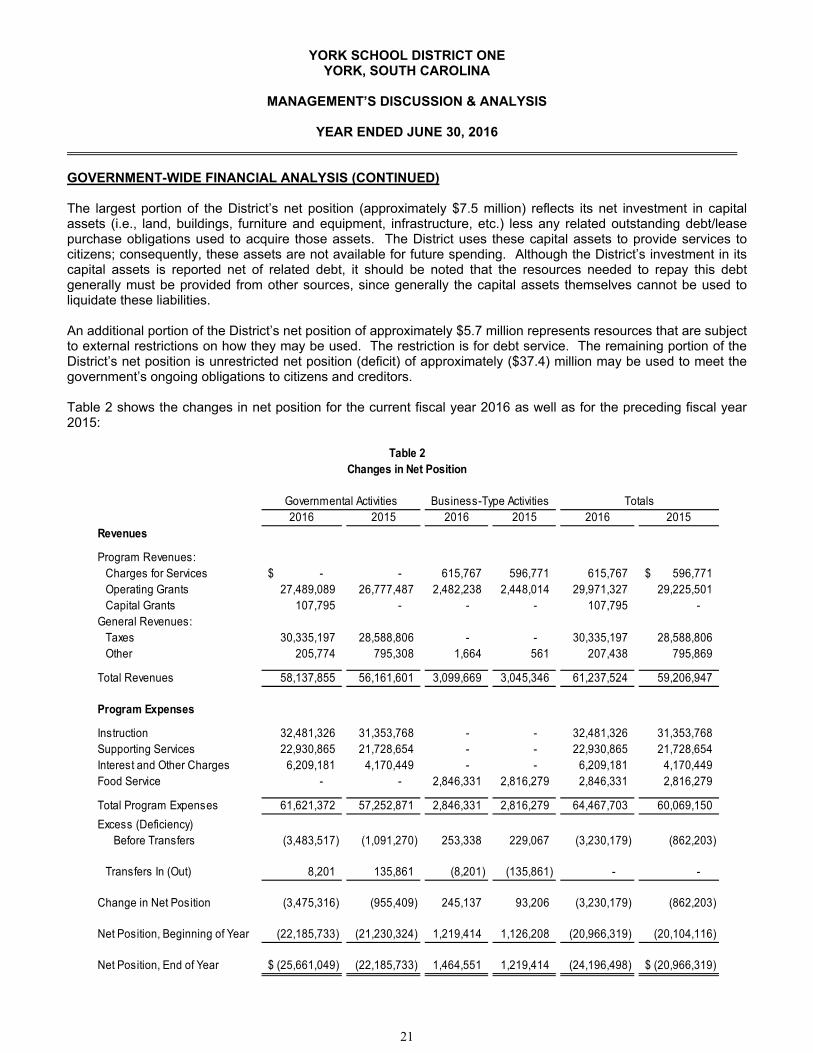
GOVERNMENT-WIDE FINANCIAL ANALYSIS (CONTINUED) The largest portion of the District’s net position (approximately $7.5 million) reflects its net investment in capital assets (i.e., land, buildings, furniture and equipment, infrastructure, etc.) less any related outstanding debt/lease purchase obligations used to acquire those assets. The District uses these capital assets to provide services to citizens; consequently, these assets are not available for future spending. Although the District’s investment in its capital assets is reported net of related debt, it should be noted that the resources needed to repay this debt generally must be provided from other sources, since generally the capital assets themselves cannot be used to liquidate these liabilities. An additional portion of the District’s net position of approximately $5.7 million represents resources that are subject to external restrictions on how they may be used. The restriction is for debt service. The remaining portion of the District’s net position is unrestricted net position (deficit) of approximately ($37.4) million may be used to meet the government’s ongoing obligations to citizens and creditors. Table 2 shows the changes in net position for the current fiscal year 2016 as well as for the preceding fiscal year 2015:
2016 2015 2016 2015 2016 2015Revenues
Program Revenues:Charges for Services -$ - 615,767 596,771 615,767 596,771$ Operating Grants 27,489,089 26,777,487 2,482,238 2,448,014 29,971,327 29,225,501 Capital Grants 107,795 - - - 107,795 -
General Revenues:Taxes 30,335,197 28,588,806 - - 30,335,197 28,588,806 Other 205,774 795,308 1,664 561 207,438 795,869
Total Revenues 58,137,855 56,161,601 3,099,669 3,045,346 61,237,524 59,206,947
Program Expenses
Instruction 32,481,326 31,353,768 - - 32,481,326 31,353,768 Supporting Services 22,930,865 21,728,654 - - 22,930,865 21,728,654 Interest and Other Charges 6,209,181 4,170,449 - - 6,209,181 4,170,449 Food Service - - 2,846,331 2,816,279 2,846,331 2,816,279
Total Program Expenses 61,621,372 57,252,871 2,846,331 2,816,279 64,467,703 60,069,150
Excess (Deficiency)Before Transfers (3,483,517) (1,091,270) 253,338 229,067 (3,230,179) (862,203)
Transfers In (Out) 8,201 135,861 (8,201) (135,861) - -
Change in Net Position (3,475,316) (955,409) 245,137 93,206 (3,230,179) (862,203)
Net Position, Beginning of Year (22,185,733) (21,230,324) 1,219,414 1,126,208 (20,966,319) (20,104,116)
Net Position, End of Year (25,661,049)$ (22,185,733) 1,464,551 1,219,414 (24,196,498) (20,966,319)$
Table 2Changes in Net Position
Governmental Activities Business-Type Activities Totals
21
YORK SCHOOL DISTRICT ONE YORK, SOUTH CAROLINA
MANAGEMENT’S DISCUSSION & ANALYSIS
YEAR ENDED JUNE 30, 2016
GOVERNMENT-WIDE FINANCIAL ANALYSIS (CONTINUED) Governmental Activities The District's governmental activities net position decreased approximately $3.5 million in 2016 compared to a decrease of approximately $1.0 million in the prior year. This decrease was more than in the prior year primarily due to an increase in the net pension liability and a loss on the 2016 refunding recognized entirely in the current fiscal year. Depreciation expense of approximately $5.7 million was a significant reason for the decrease in the District’s governmental activities net position. Business-Type Activities The District’s business-type activities increased net position in 2016 by approximately $0.2 million, compared to an increase of approximately $0.1 million in the prior year, primarily due to a more beneficial agreement with the District’s food service provider (the District changed providers for fiscal year 2016). FUND ANALYSIS Governmental Funds The analysis of governmental funds serves the purpose of looking at what resources came into the funds, how they were spent and what is available for future expenditures. Did the government generate enough revenue to pay for current obligations? What is available for spending at the end of the year? For the year ended June 30, 2016, the District’s governmental funds reported a combined fund balance of approximately $18.5 million as compared to approximately $16.6 million for the prior year. In particular, unassigned fund balance may serve as a useful measure of a government’s net resources available for spending at the end of the fiscal year. At June 30, 2016, the District’s unassigned fund balance for all governmental funds was approximately $8.4 million which solely represents the General Fund. Of the remainder, approximately $0.7 million and $3.5 million is restricted and assigned for capital projects, respectively, and approximately $5.9 million is restricted for debt service. The General Fund is the chief operating fund of the District. At the end of the current fiscal year, total fund balance of the General Fund was approximately $8.4 million which was all unassigned. The District’s General Fund balance increased approximately 11% from the prior year. The fund balance in the General Fund is approximately 21% of General Fund expenditures. The District’s Major Funds include General Fund, as described above, Special Revenue Fund, Special Revenue-EIA Fund, Debt Service Fund, and Capital Projects Fund. The District’s Special Revenue Fund and Special Revenue – EIA Fund, are used to account for revenues derived from the State of South Carolina and the Federal Government. Special Revenue funds generally do not have fund balances as revenues should be expended, unearned, or returned to the grantor. The Debt Service Fund is shown in the accompanying financial statements of the District. This fund is used to account for the accumulation of funds for debt retirement. The District’s debt millage rate remained at 78 mills. The fund balance in the Debt Service Fund increased approximately $3.4 million in 2016 due to a transfer from the capital projects fund. The fund balance for the Debt Service Fund at June 30, 2016 is approximately $5.9 million which is restricted for the payment of debt service. Revenues decreased over the prior year by approximately $0.4 million, or 5%, primarily due to a decrease in federal sources. Regularly scheduled debt service payments decreased over the prior year by approximately $1.2 million due to decreased principal and interest payments. The Capital Projects Fund is utilized to account for the District’s major capital project expenditures. The District’s Capital Projects Fund balance decreased by approximately $2.3 million in 2016 to approximately $4.3 million at June 30, 2016. The primary reason is due to a transfer to the Debt Service Fund of approximately $3.0 million.
22
YORK SCHOOL DISTRICT ONE YORK, SOUTH CAROLINA
MANAGEMENT’S DISCUSSION & ANALYSIS
YEAR ENDED JUNE 30, 2016
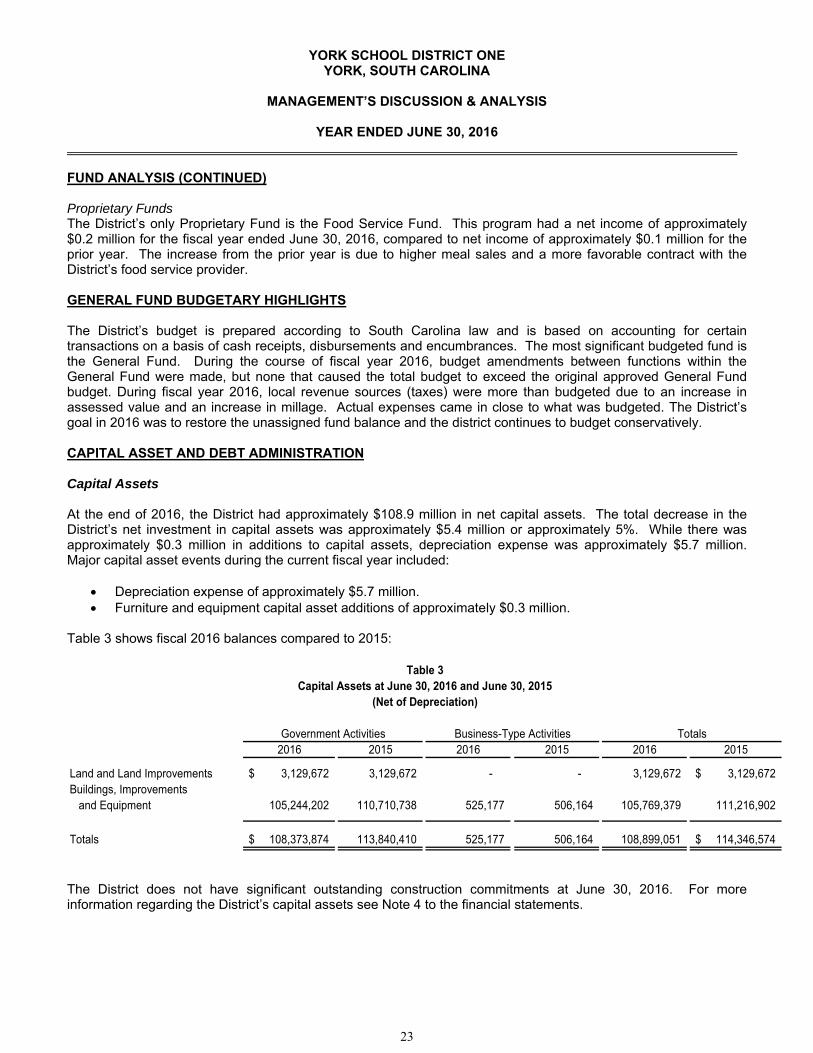
FUND ANALYSIS (CONTINUED) Proprietary Funds The District’s only Proprietary Fund is the Food Service Fund. This program had a net income of approximately $0.2 million for the fiscal year ended June 30, 2016, compared to net income of approximately $0.1 million for the prior year. The increase from the prior year is due to higher meal sales and a more favorable contract with the District’s food service provider. GENERAL FUND BUDGETARY HIGHLIGHTS The District’s budget is prepared according to South Carolina law and is based on accounting for certain transactions on a basis of cash receipts, disbursements and encumbrances. The most significant budgeted fund is the General Fund. During the course of fiscal year 2016, budget amendments between functions within the General Fund were made, but none that caused the total budget to exceed the original approved General Fund budget. During fiscal year 2016, local revenue sources (taxes) were more than budgeted due to an increase in assessed value and an increase in millage. Actual expenses came in close to what was budgeted. The District’s goal in 2016 was to restore the unassigned fund balance and the district continues to budget conservatively. CAPITAL ASSET AND DEBT ADMINISTRATION Capital Assets At the end of 2016, the District had approximately $108.9 million in net capital assets. The total decrease in the District’s net investment in capital assets was approximately $5.4 million or approximately 5%. While there was approximately $0.3 million in additions to capital assets, depreciation expense was approximately $5.7 million. Major capital asset events during the current fiscal year included:
Depreciation expense of approximately $5.7 million. Furniture and equipment capital asset additions of approximately $0.3 million.
Table 3 shows fiscal 2016 balances compared to 2015:
2016 2015 2016 2015 2016 2015
Land and Land Improvements 3,129,672$ 3,129,672 - - 3,129,672 3,129,672$ Buildings, Improvements
and Equipment 105,244,202 110,710,738 525,177 506,164 105,769,379 111,216,902
Totals 108,373,874$ 113,840,410 525,177 506,164 108,899,051 114,346,574$
Government Activities Business-Type Activities Totals
Table 3Capital Assets at June 30, 2016 and June 30, 2015
(Net of Depreciation)
The District does not have significant outstanding construction commitments at June 30, 2016. For more information regarding the District’s capital assets see Note 4 to the financial statements.
23
YORK SCHOOL DISTRICT ONE YORK, SOUTH CAROLINA
MANAGEMENT’S DISCUSSION & ANALYSIS
YEAR ENDED JUNE 30, 2016
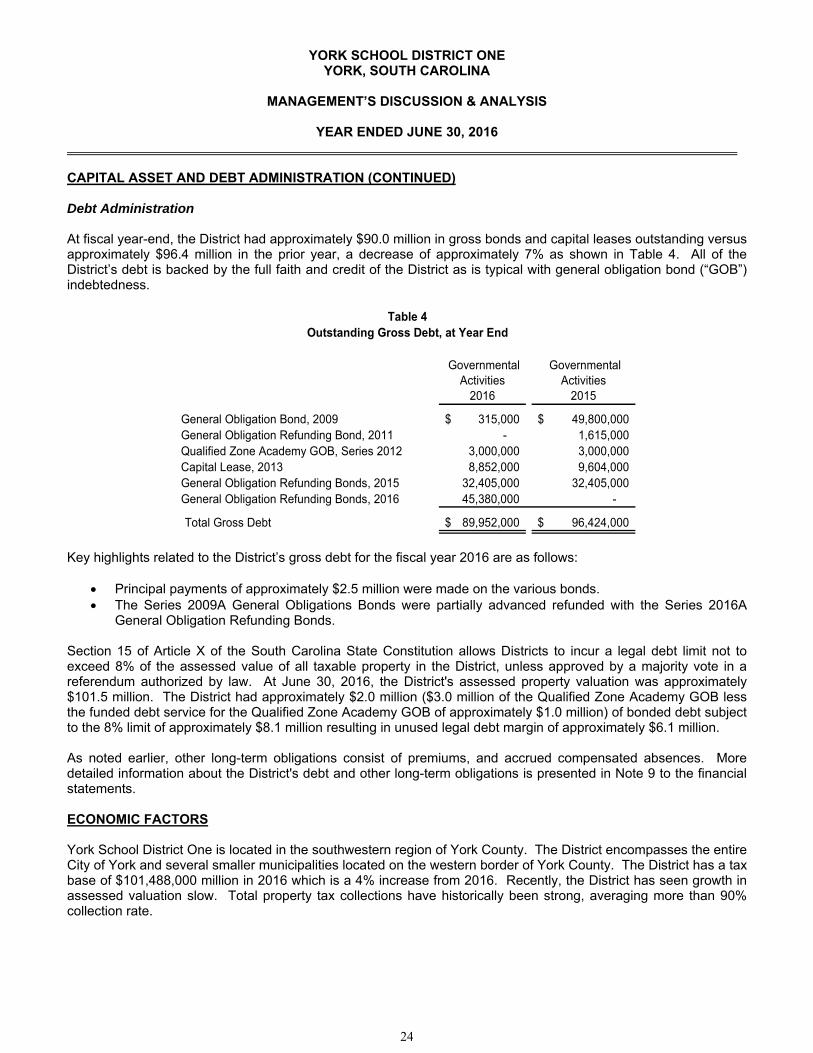
CAPITAL ASSET AND DEBT ADMINISTRATION (CONTINUED) Debt Administration At fiscal year-end, the District had approximately $90.0 million in gross bonds and capital leases outstanding versus approximately $96.4 million in the prior year, a decrease of approximately 7% as shown in Table 4. All of the District’s debt is backed by the full faith and credit of the District as is typical with general obligation bond (“GOB”) indebtedness.
Governmental Activities
2016
Governmental Activities
2015
General Obligation Bond, 2009 315,000$ 49,800,000$ General Obligation Refunding Bond, 2011 - 1,615,000 Qualified Zone Academy GOB, Series 2012 3,000,000 3,000,000 Capital Lease, 2013 8,852,000 9,604,000 General Obligation Refunding Bonds, 2015 32,405,000 32,405,000 General Obligation Refunding Bonds, 2016 45,380,000 -
Total Gross Debt 89,952,000$ 96,424,000$
Table 4Outstanding Gross Debt, at Year End
Key highlights related to the District’s gross debt for the fiscal year 2016 are as follows:
Principal payments of approximately $2.5 million were made on the various bonds. The Series 2009A General Obligations Bonds were partially advanced refunded with the Series 2016A
General Obligation Refunding Bonds. Section 15 of Article X of the South Carolina State Constitution allows Districts to incur a legal debt limit not to exceed 8% of the assessed value of all taxable property in the District, unless approved by a majority vote in a referendum authorized by law. At June 30, 2016, the District's assessed property valuation was approximately $101.5 million. The District had approximately $2.0 million ($3.0 million of the Qualified Zone Academy GOB less the funded debt service for the Qualified Zone Academy GOB of approximately $1.0 million) of bonded debt subject to the 8% limit of approximately $8.1 million resulting in unused legal debt margin of approximately $6.1 million. As noted earlier, other long-term obligations consist of premiums, and accrued compensated absences. More detailed information about the District's debt and other long-term obligations is presented in Note 9 to the financial statements. ECONOMIC FACTORS York School District One is located in the southwestern region of York County. The District encompasses the entire City of York and several smaller municipalities located on the western border of York County. The District has a tax base of $101,488,000 million in 2016 which is a 4% increase from 2016. Recently, the District has seen growth in assessed valuation slow. Total property tax collections have historically been strong, averaging more than 90% collection rate.
24
YORK SCHOOL DISTRICT ONE YORK, SOUTH CAROLINA
MANAGEMENT’S DISCUSSION & ANALYSIS
YEAR ENDED JUNE 30, 2016
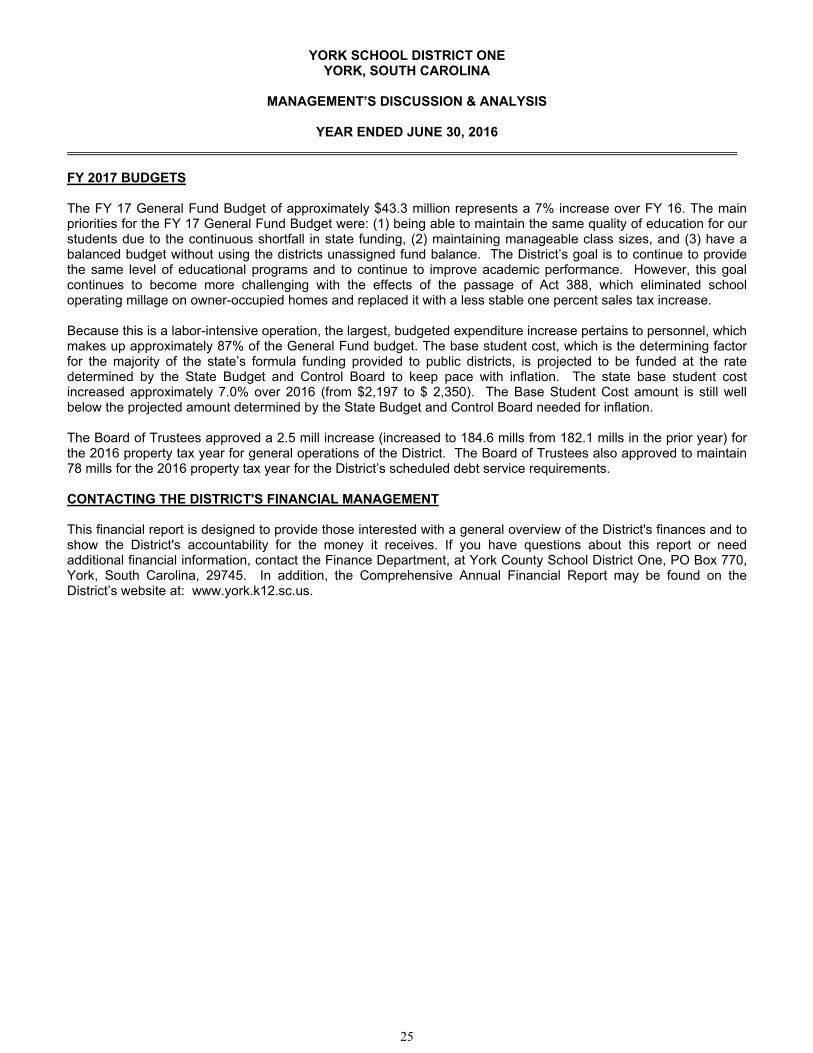
FY 2017 BUDGETS
The FY 17 General Fund Budget of approximately $43.3 million represents a 7% increase over FY 16. The main priorities for the FY 17 General Fund Budget were: (1) being able to maintain the same quality of education for our students due to the continuous shortfall in state funding, (2) maintaining manageable class sizes, and (3) have a balanced budget without using the districts unassigned fund balance. The District’s goal is to continue to provide the same level of educational programs and to continue to improve academic performance. However, this goal continues to become more challenging with the effects of the passage of Act 388, which eliminated school operating millage on owner-occupied homes and replaced it with a less stable one percent sales tax increase. Because this is a labor-intensive operation, the largest, budgeted expenditure increase pertains to personnel, which makes up approximately 87% of the General Fund budget. The base student cost, which is the determining factor for the majority of the state’s formula funding provided to public districts, is projected to be funded at the rate determined by the State Budget and Control Board to keep pace with inflation. The state base student cost increased approximately 7.0% over 2016 (from $2,197 to $ 2,350). The Base Student Cost amount is still well below the projected amount determined by the State Budget and Control Board needed for inflation. The Board of Trustees approved a 2.5 mill increase (increased to 184.6 mills from 182.1 mills in the prior year) for the 2016 property tax year for general operations of the District. The Board of Trustees also approved to maintain 78 mills for the 2016 property tax year for the District’s scheduled debt service requirements. CONTACTING THE DISTRICT'S FINANCIAL MANAGEMENT This financial report is designed to provide those interested with a general overview of the District's finances and to show the District's accountability for the money it receives. If you have questions about this report or need additional financial information, contact the Finance Department, at York County School District One, PO Box 770, York, South Carolina, 29745. In addition, the Comprehensive Annual Financial Report may be found on the District’s website at: www.york.k12.sc.us.
25

26
BASIC FINANCIAL STATEMENTS
27
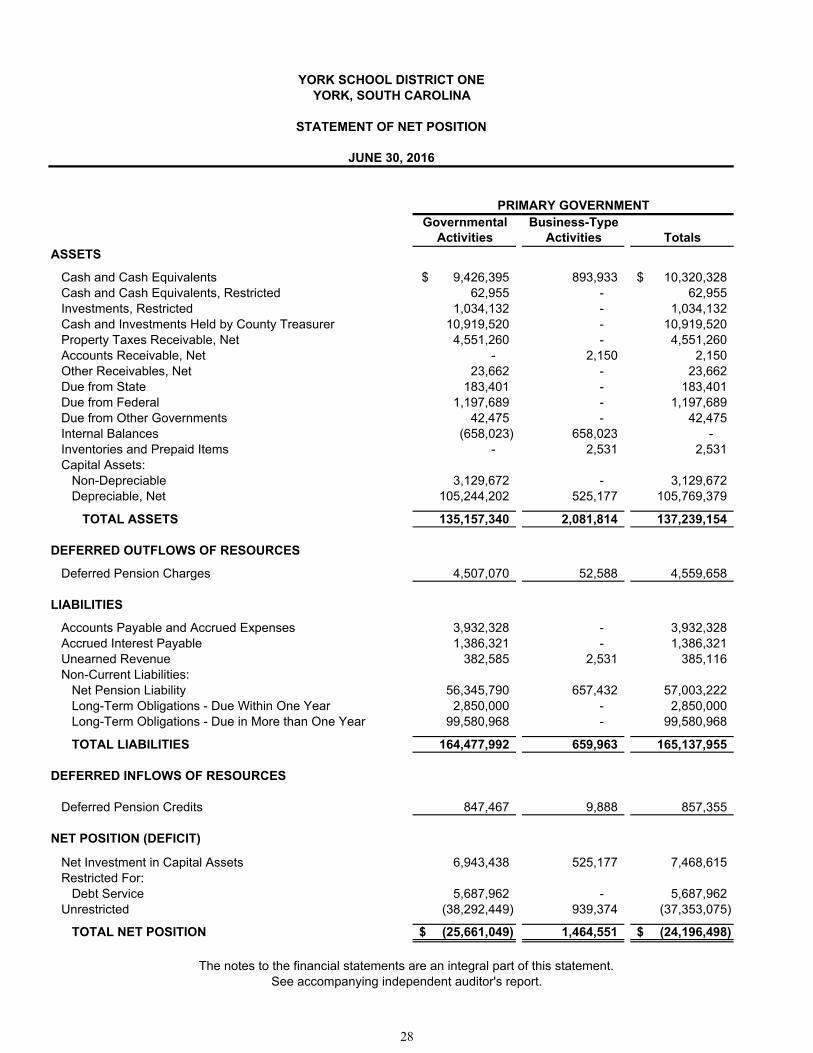
Governmental Business-TypeActivities Activities Totals
ASSETS
Cash and Cash Equivalents 9,426,395$ 893,933 10,320,328$ Cash and Cash Equivalents, Restricted 62,955 - 62,955 Investments, Restricted 1,034,132 - 1,034,132 Cash and Investments Held by County Treasurer 10,919,520 - 10,919,520 Property Taxes Receivable, Net 4,551,260 - 4,551,260 Accounts Receivable, Net - 2,150 2,150 Other Receivables, Net 23,662 - 23,662 Due from State 183,401 - 183,401 Due from Federal 1,197,689 - 1,197,689 Due from Other Governments 42,475 - 42,475 Internal Balances (658,023) 658,023 - Inventories and Prepaid Items - 2,531 2,531 Capital Assets:
Non-Depreciable 3,129,672 - 3,129,672 Depreciable, Net 105,244,202 525,177 105,769,379
TOTAL ASSETS 135,157,340 2,081,814 137,239,154
DEFERRED OUTFLOWS OF RESOURCES
Deferred Pension Charges 4,507,070 52,588 4,559,658
LIABILITIES
Accounts Payable and Accrued Expenses 3,932,328 - 3,932,328 Accrued Interest Payable 1,386,321 - 1,386,321 Unearned Revenue 382,585 2,531 385,116 Non-Current Liabilities:
Net Pension Liability 56,345,790 657,432 57,003,222 Long-Term Obligations - Due Within One Year 2,850,000 - 2,850,000 Long-Term Obligations - Due in More than One Year 99,580,968 - 99,580,968
TOTAL LIABILITIES 164,477,992 659,963 165,137,955
DEFERRED INFLOWS OF RESOURCES
Deferred Pension Credits 847,467 9,888 857,355
NET POSITION (DEFICIT)
Net Investment in Capital Assets 6,943,438 525,177 7,468,615 Restricted For:
Debt Service 5,687,962 - 5,687,962 Unrestricted (38,292,449) 939,374 (37,353,075)
TOTAL NET POSITION (25,661,049)$ 1,464,551 (24,196,498)$
PRIMARY GOVERNMENT
YORK SCHOOL DISTRICT ONEYORK, SOUTH CAROLINA
STATEMENT OF NET POSITION
JUNE 30, 2016
The notes to the financial statements are an integral part of this statement. See accompanying independent auditor's report.
28
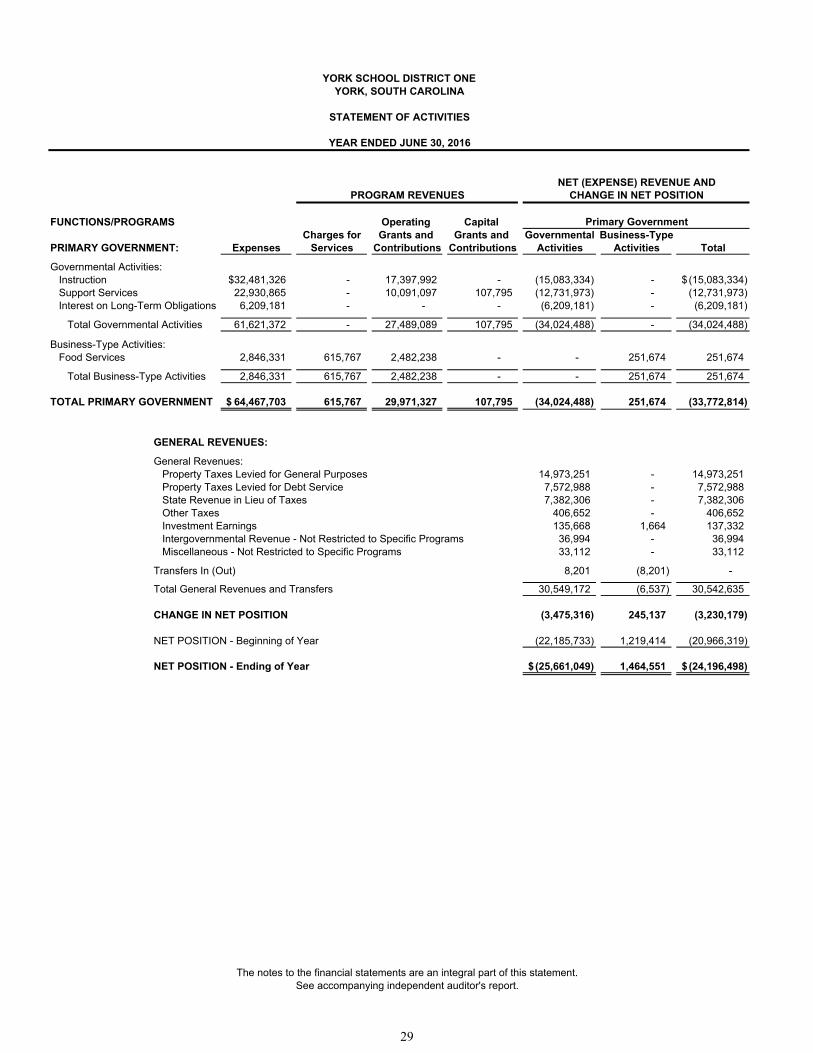
FUNCTIONS/PROGRAMS Operating Capital Charges for Grants and Grants and Governmental Business-Type
PRIMARY GOVERNMENT: Expenses Services Contributions Contributions Activities Activities Total
Governmental Activities:Instruction 32,481,326$ - 17,397,992 - (15,083,334) - (15,083,334)$ Support Services 22,930,865 - 10,091,097 107,795 (12,731,973) - (12,731,973) Interest on Long-Term Obligations 6,209,181 - - - (6,209,181) - (6,209,181)
Total Governmental Activities 61,621,372 - 27,489,089 107,795 (34,024,488) - (34,024,488)
Business-Type Activities:Food Services 2,846,331 615,767 2,482,238 - - 251,674 251,674
Total Business-Type Activities 2,846,331 615,767 2,482,238 - - 251,674 251,674
TOTAL PRIMARY GOVERNMENT 64,467,703$ 615,767 29,971,327 107,795 (34,024,488) 251,674 (33,772,814)
GENERAL REVENUES:
General Revenues:Property Taxes Levied for General Purposes 14,973,251 - 14,973,251 Property Taxes Levied for Debt Service 7,572,988 - 7,572,988 State Revenue in Lieu of Taxes 7,382,306 - 7,382,306 Other Taxes 406,652 - 406,652 Investment Earnings 135,668 1,664 137,332 Intergovernmental Revenue - Not Restricted to Specific Programs 36,994 - 36,994 Miscellaneous - Not Restricted to Specific Programs 33,112 - 33,112
Transfers In (Out) 8,201 (8,201) -
Total General Revenues and Transfers 30,549,172 (6,537) 30,542,635
CHANGE IN NET POSITION (3,475,316) 245,137 (3,230,179)
NET POSITION - Beginning of Year (22,185,733) 1,219,414 (20,966,319)
NET POSITION - Ending of Year (25,661,049)$ 1,464,551 (24,196,498)$
CHANGE IN NET POSITION
YEAR ENDED JUNE 30, 2016
PROGRAM REVENUES
YORK SCHOOL DISTRICT ONEYORK, SOUTH CAROLINA
STATEMENT OF ACTIVITIES
Primary Government
NET (EXPENSE) REVENUE AND
The notes to the financial statements are an integral part of this statement. See accompanying independent auditor's report.
29
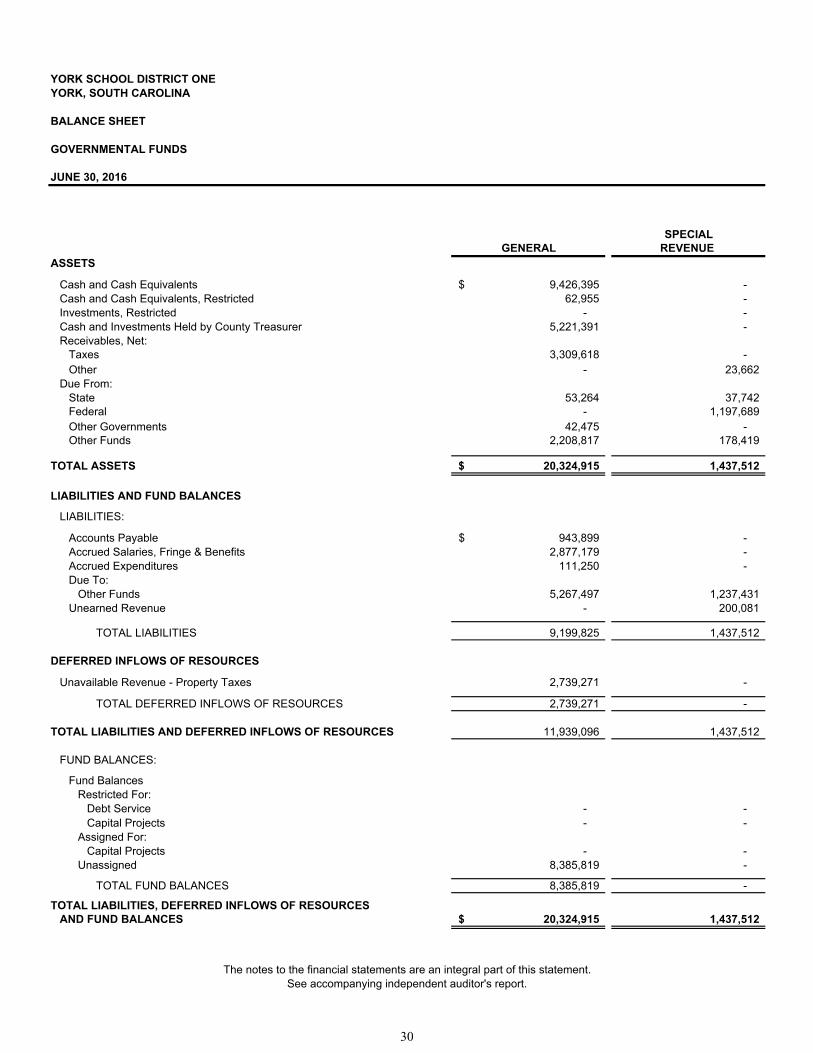
YORK SCHOOL DISTRICT ONEYORK, SOUTH CAROLINA
BALANCE SHEET
GOVERNMENTAL FUNDS
JUNE 30, 2016
SPECIAL
GENERAL REVENUE ASSETS
Cash and Cash Equivalents 9,426,395$ - Cash and Cash Equivalents, Restricted 62,955 - Investments, Restricted - - Cash and Investments Held by County Treasurer 5,221,391 - Receivables, Net:
Taxes 3,309,618 - Other - 23,662
Due From:State 53,264 37,742 Federal - 1,197,689 Other Governments 42,475 - Other Funds 2,208,817 178,419
TOTAL ASSETS 20,324,915$ 1,437,512
LIABILITIES AND FUND BALANCES
LIABILITIES:
Accounts Payable 943,899$ - Accrued Salaries, Fringe & Benefits 2,877,179 - Accrued Expenditures 111,250 - Due To:
Other Funds 5,267,497 1,237,431 Unearned Revenue - 200,081
TOTAL LIABILITIES 9,199,825 1,437,512
DEFERRED INFLOWS OF RESOURCES
Unavailable Revenue - Property Taxes 2,739,271 -
TOTAL DEFERRED INFLOWS OF RESOURCES 2,739,271 -
TOTAL LIABILITIES AND DEFERRED INFLOWS OF RESOURCES 11,939,096 1,437,512
FUND BALANCES:
Fund BalancesRestricted For:
Debt Service - - Capital Projects - -
Assigned For:Capital Projects - -
Unassigned 8,385,819 -
TOTAL FUND BALANCES 8,385,819 -
TOTAL LIABILITIES, DEFERRED INFLOWS OF RESOURCES AND FUND BALANCES 20,324,915$ 1,437,512
The notes to the financial statements are an integral part of this statement. See accompanying independent auditor's report.
30
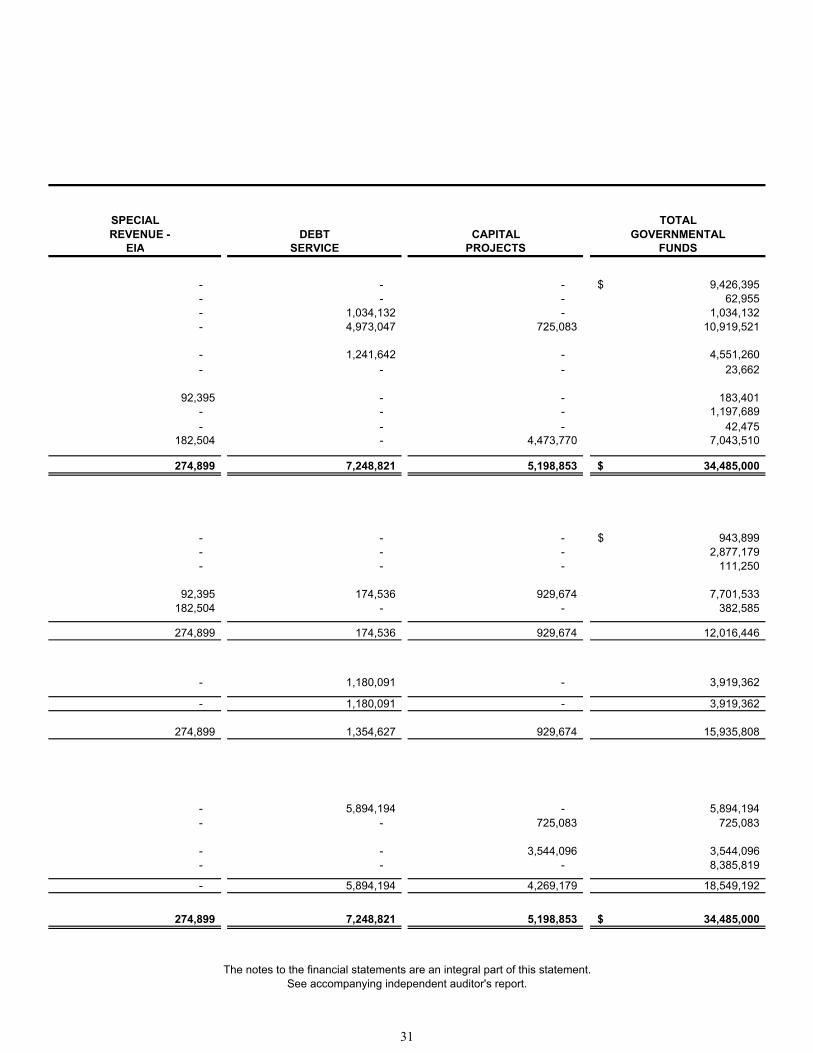
SPECIAL TOTAL REVENUE - DEBT CAPITAL GOVERNMENTAL
EIA SERVICE PROJECTS FUNDS
- - - 9,426,395$ - - - 62,955 - 1,034,132 - 1,034,132 - 4,973,047 725,083 10,919,521
- 1,241,642 - 4,551,260 - - - 23,662
92,395 - - 183,401 - - - 1,197,689 - - - 42,475
182,504 - 4,473,770 7,043,510
274,899 7,248,821 5,198,853 34,485,000$
- - - 943,899$ - - - 2,877,179 - - - 111,250
92,395 174,536 929,674 7,701,533 182,504 - - 382,585
274,899 174,536 929,674 12,016,446
- 1,180,091 - 3,919,362
- 1,180,091 - 3,919,362
274,899 1,354,627 929,674 15,935,808
- 5,894,194 - 5,894,194 - - 725,083 725,083
- - 3,544,096 3,544,096 - - - 8,385,819
- 5,894,194 4,269,179 18,549,192
274,899 7,248,821 5,198,853 34,485,000$
The notes to the financial statements are an integral part of this statement. See accompanying independent auditor's report.
31
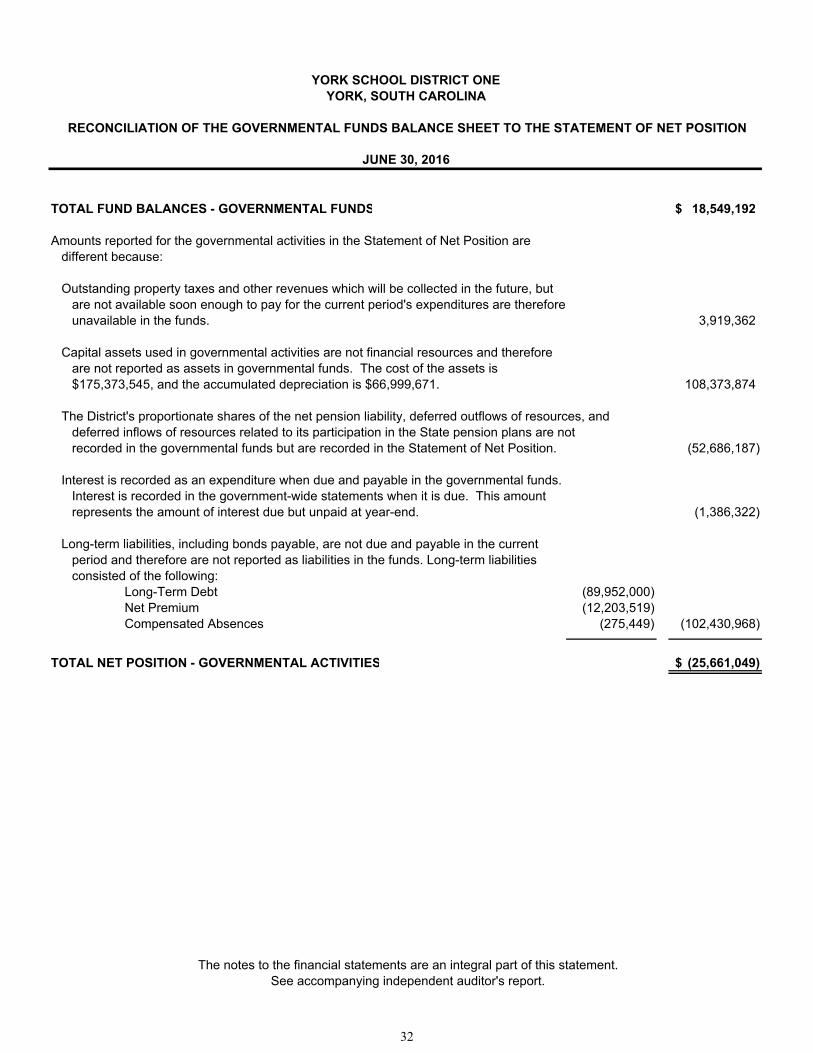
TOTAL FUND BALANCES - GOVERNMENTAL FUNDS 18,549,192$
Amounts reported for the governmental activities in the Statement of Net Position aredifferent because:
Outstanding property taxes and other revenues which will be collected in the future, butare not available soon enough to pay for the current period's expenditures are thereforeunavailable in the funds. 3,919,362
Capital assets used in governmental activities are not financial resources and therefore are not reported as assets in governmental funds. The cost of the assets is $175,373,545, and the accumulated depreciation is $66,999,671. 108,373,874
The District's proportionate shares of the net pension liability, deferred outflows of resources, and deferred inflows of resources related to its participation in the State pension plans are not recorded in the governmental funds but are recorded in the Statement of Net Position. (52,686,187)
Interest is recorded as an expenditure when due and payable in the governmental funds.Interest is recorded in the government-wide statements when it is due. This amountrepresents the amount of interest due but unpaid at year-end. (1,386,322)
Long-term liabilities, including bonds payable, are not due and payable in the current period and therefore are not reported as liabilities in the funds. Long-term liabilities consisted of the following:
Long-Term Debt (89,952,000) Net Premium (12,203,519) Compensated Absences (275,449) (102,430,968)
TOTAL NET POSITION - GOVERNMENTAL ACTIVITIES (25,661,049)$
YORK SCHOOL DISTRICT ONE
RECONCILIATION OF THE GOVERNMENTAL FUNDS BALANCE SHEET TO THE STATEMENT OF NET POSITION
JUNE 30, 2016
YORK, SOUTH CAROLINA
The notes to the financial statements are an integral part of this statement. See accompanying independent auditor's report.
32

33
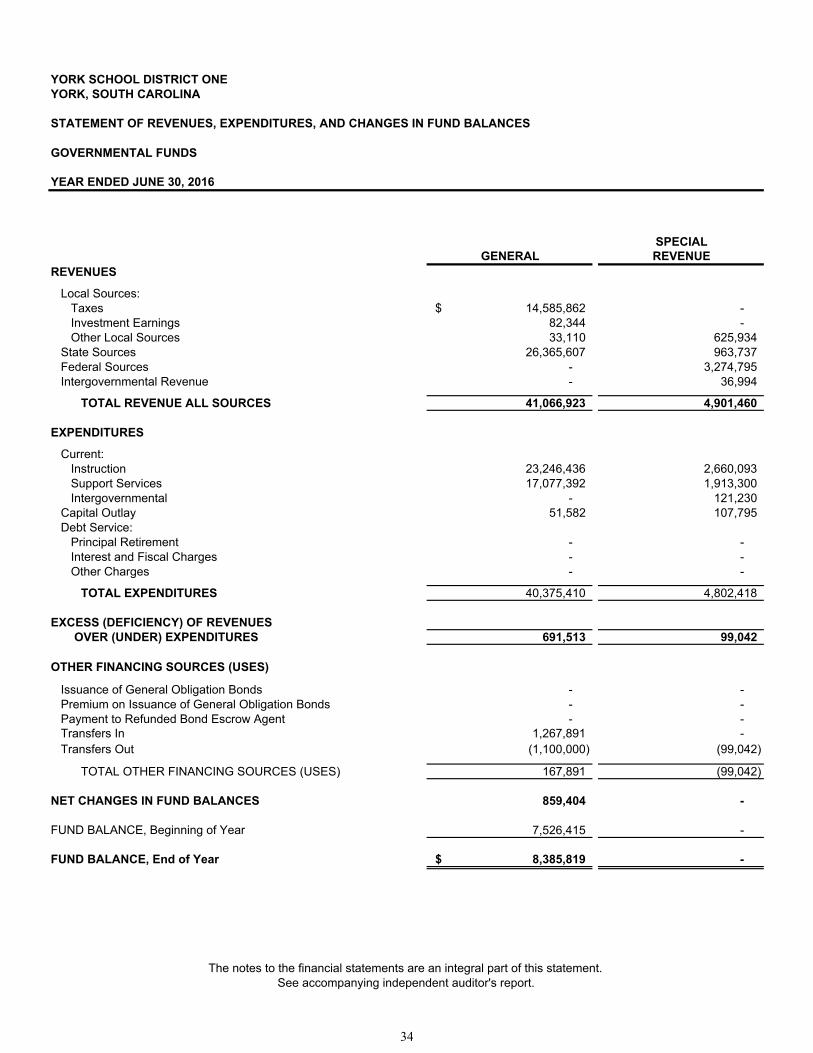
YORK SCHOOL DISTRICT ONEYORK, SOUTH CAROLINA
GOVERNMENTAL FUNDS
YEAR ENDED JUNE 30, 2016
SPECIALGENERAL REVENUE
REVENUES
Local Sources:Taxes 14,585,862$ - Investment Earnings 82,344 - Other Local Sources 33,110 625,934
State Sources 26,365,607 963,737 Federal Sources - 3,274,795 Intergovernmental Revenue - 36,994
TOTAL REVENUE ALL SOURCES 41,066,923 4,901,460
EXPENDITURES
Current:Instruction 23,246,436 2,660,093 Support Services 17,077,392 1,913,300 Intergovernmental - 121,230
Capital Outlay 51,582 107,795 Debt Service:
Principal Retirement - -Interest and Fiscal Charges - -Other Charges - -
TOTAL EXPENDITURES 40,375,410 4,802,418
EXCESS (DEFICIENCY) OF REVENUES OVER (UNDER) EXPENDITURES 691,513 99,042
OTHER FINANCING SOURCES (USES)
Issuance of General Obligation Bonds - -Premium on Issuance of General Obligation Bonds - -Payment to Refunded Bond Escrow Agent - -Transfers In 1,267,891 - Transfers Out (1,100,000) (99,042)
167,891 (99,042)
859,404 -
7,526,415 -
TOTAL OTHER FINANCING SOURCES (USES)
NET CHANGES IN FUND BALANCES
FUND BALANCE, Beginning of Year
FUND BALANCE, End of Year 8,385,819$ -
STATEMENT OF REVENUES, EXPENDITURES, AND CHANGES IN FUND BALANCES
The notes to the financial statements are an integral part of this statement. See accompanying independent auditor's report.
34
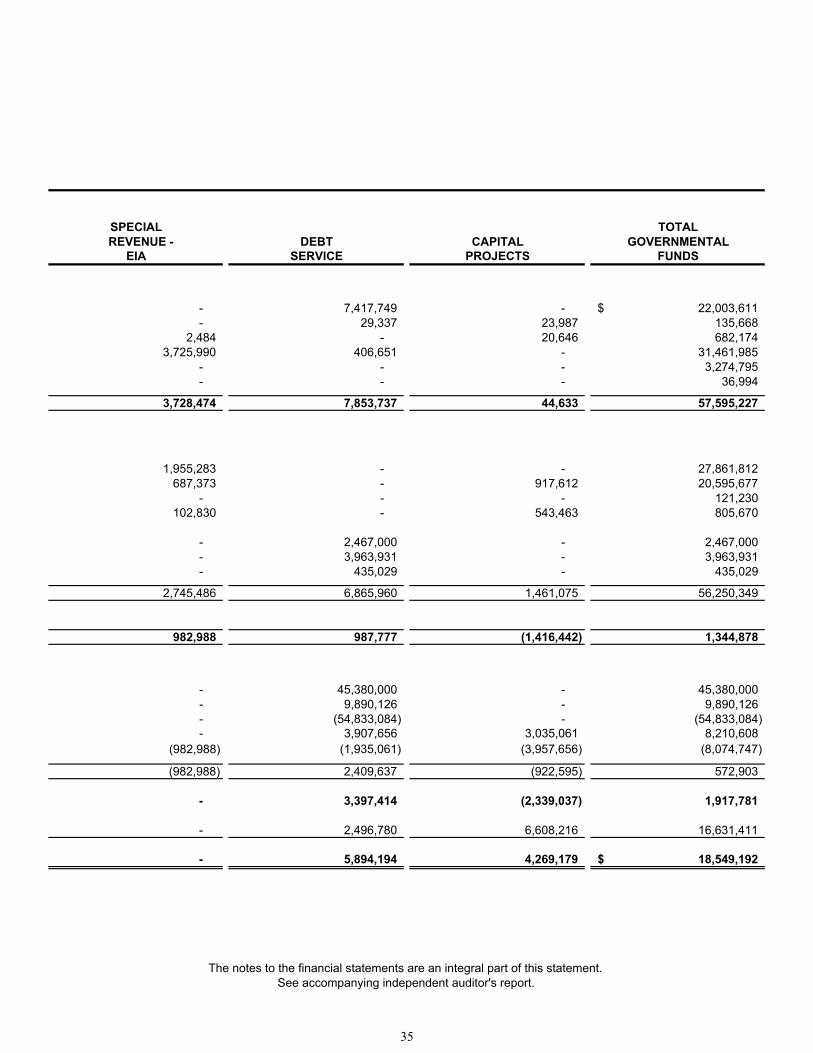
SPECIAL TOTAL REVENUE - DEBT CAPITAL GOVERNMENTAL
EIA SERVICE PROJECTS FUNDS
- 7,417,749 - 22,003,611$ - 29,337 23,987 135,668
2,484 - 20,646 682,174 3,725,990 406,651 - 31,461,985
- - - 3,274,795 - - - 36,994
3,728,474 7,853,737 44,633 57,595,227
1,955,283 - - 27,861,812 687,373 - 917,612 20,595,677
- - - 121,230 102,830 - 543,463 805,670
- 2,467,000 - 2,467,000 - 3,963,931 - 3,963,931 - 435,029 - 435,029
2,745,486 6,865,960 1,461,075 56,250,349
982,988 987,777 (1,416,442) 1,344,878
- 45,380,000 - 45,380,000 - 9,890,126 - 9,890,126 - (54,833,084) - (54,833,084) - 3,907,656 3,035,061 8,210,608
(982,988) (1,935,061) (3,957,656) (8,074,747)
(982,988) 2,409,637 (922,595) 572,903
- 3,397,414 (2,339,037) 1,917,781
- 2,496,780 6,608,216 16,631,411
- 5,894,194 4,269,179 18,549,192$
The notes to the financial statements are an integral part of this statement. See accompanying independent auditor's report.
35
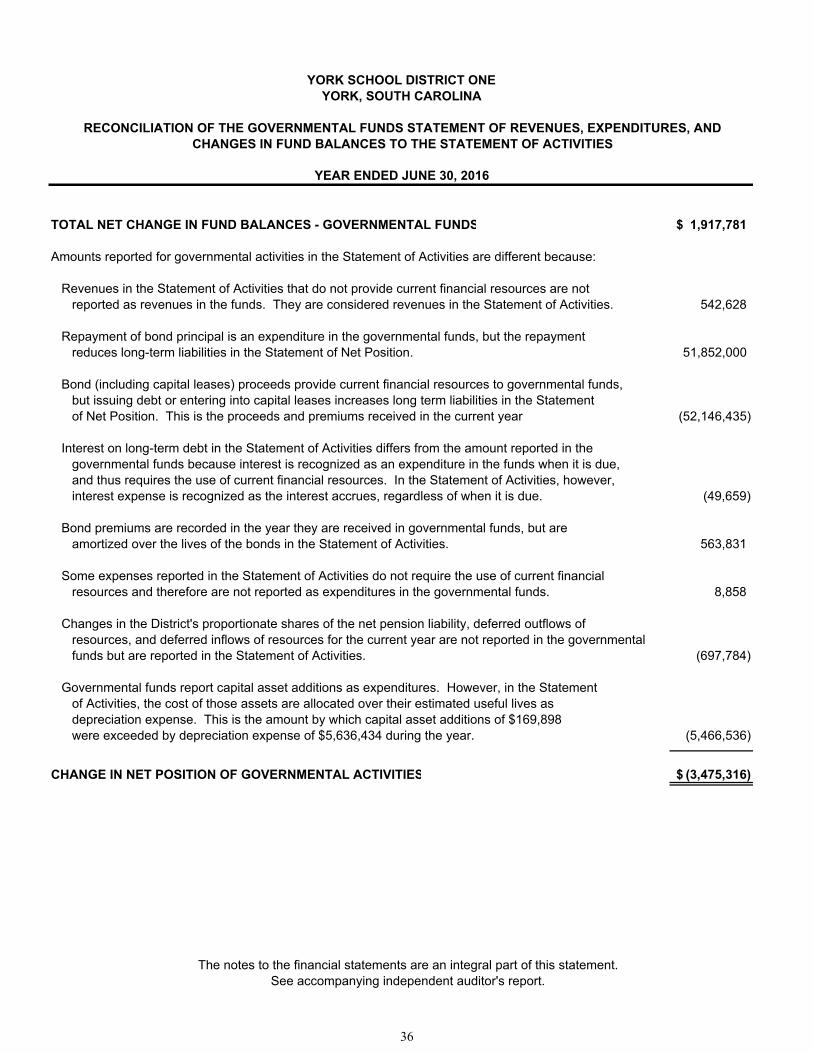
TOTAL NET CHANGE IN FUND BALANCES - GOVERNMENTAL FUNDS 1,917,781$
Amounts reported for governmental activities in the Statement of Activities are different because:
Revenues in the Statement of Activities that do not provide current financial resources are not reported as revenues in the funds. They are considered revenues in the Statement of Activities. 542,628
Repayment of bond principal is an expenditure in the governmental funds, but the repaymentreduces long-term liabilities in the Statement of Net Position. 51,852,000
Bond (including capital leases) proceeds provide current financial resources to governmental funds,but issuing debt or entering into capital leases increases long term liabilities in the Statementof Net Position. This is the proceeds and premiums received in the current year (52,146,435)
Interest on long-term debt in the Statement of Activities differs from the amount reported in the governmental funds because interest is recognized as an expenditure in the funds when it is due,and thus requires the use of current financial resources. In the Statement of Activities, however, interest expense is recognized as the interest accrues, regardless of when it is due. (49,659)
Bond premiums are recorded in the year they are received in governmental funds, but areamortized over the lives of the bonds in the Statement of Activities. 563,831
Some expenses reported in the Statement of Activities do not require the use of current financialresources and therefore are not reported as expenditures in the governmental funds. 8,858
Changes in the District's proportionate shares of the net pension liability, deferred outflows ofresources, and deferred inflows of resources for the current year are not reported in the governmental funds but are reported in the Statement of Activities. (697,784)
Governmental funds report capital asset additions as expenditures. However, in the Statementof Activities, the cost of those assets are allocated over their estimated useful lives as depreciation expense. This is the amount by which capital asset additions of $169,898were exceeded by depreciation expense of $5,636,434 during the year. (5,466,536)
CHANGE IN NET POSITION OF GOVERNMENTAL ACTIVITIES (3,475,316)$
YEAR ENDED JUNE 30, 2016
YORK SCHOOL DISTRICT ONEYORK, SOUTH CAROLINA
RECONCILIATION OF THE GOVERNMENTAL FUNDS STATEMENT OF REVENUES, EXPENDITURES, ANDCHANGES IN FUND BALANCES TO THE STATEMENT OF ACTIVITIES
The notes to the financial statements are an integral part of this statement. See accompanying independent auditor's report.
36
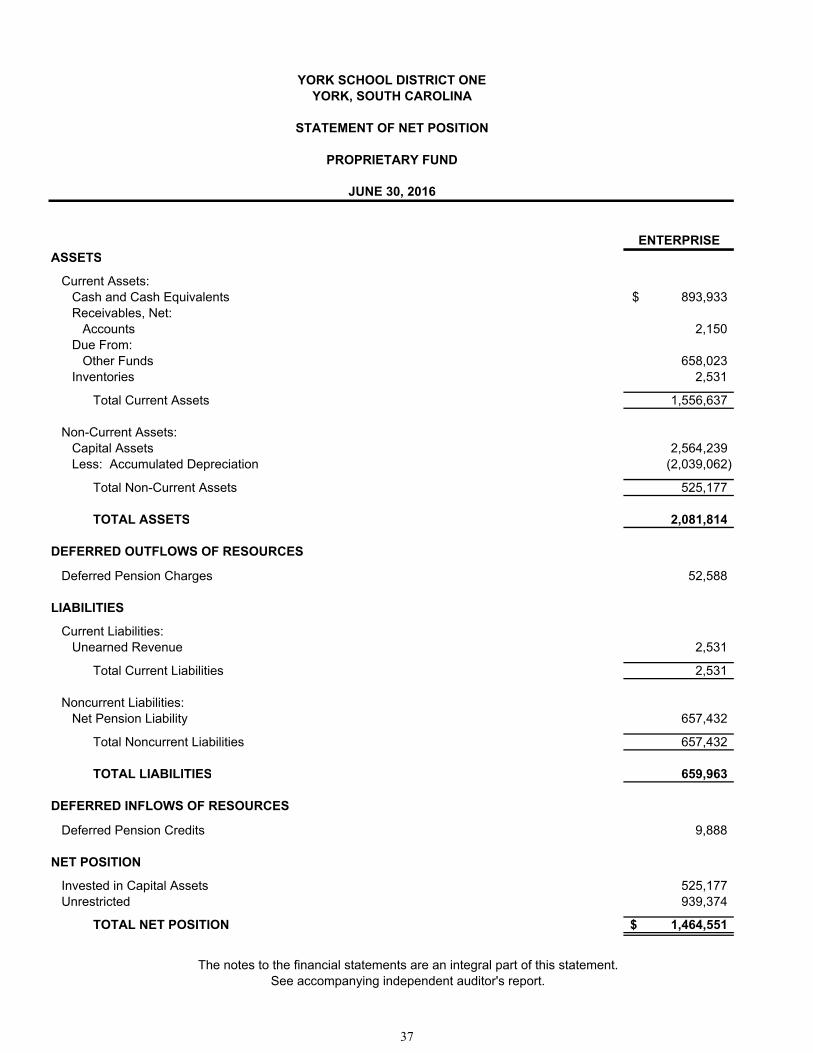
ENTERPRISEASSETS
Current Assets:Cash and Cash Equivalents 893,933$ Receivables, Net:
Accounts 2,150 Due From:
Other Funds 658,023 Inventories 2,531
Total Current Assets 1,556,637
Non-Current Assets:Capital Assets 2,564,239 Less: Accumulated Depreciation (2,039,062)
Total Non-Current Assets 525,177
TOTAL ASSETS 2,081,814
DEFERRED OUTFLOWS OF RESOURCES
Deferred Pension Charges 52,588
LIABILITIES
Current Liabilities:Unearned Revenue 2,531
Total Current Liabilities 2,531
Noncurrent Liabilities:Net Pension Liability 657,432
Total Noncurrent Liabilities 657,432
TOTAL LIABILITIES 659,963
DEFERRED INFLOWS OF RESOURCES
Deferred Pension Credits 9,888
NET POSITION
Invested in Capital Assets 525,177 Unrestricted 939,374
TOTAL NET POSITION 1,464,551$
JUNE 30, 2016
YORK SCHOOL DISTRICT ONEYORK, SOUTH CAROLINA
STATEMENT OF NET POSITION
PROPRIETARY FUND
The notes to the financial statements are an integral part of this statement. See accompanying independent auditor's report.
37
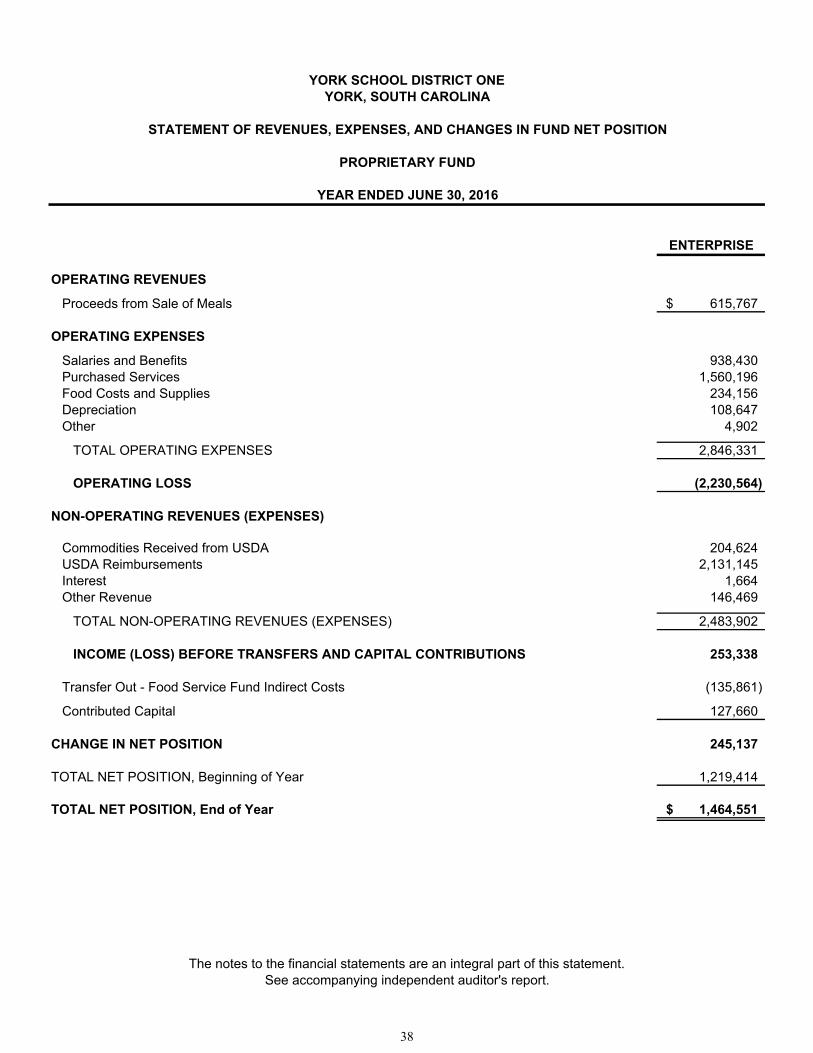
ENTERPRISE
OPERATING REVENUES
Proceeds from Sale of Meals 615,767$
OPERATING EXPENSES
Salaries and Benefits 938,430Purchased Services 1,560,196Food Costs and Supplies 234,156Depreciation 108,647Other 4,902
TOTAL OPERATING EXPENSES 2,846,331
OPERATING LOSS (2,230,564)
NON-OPERATING REVENUES (EXPENSES)
Commodities Received from USDA 204,624 USDA Reimbursements 2,131,145 Interest 1,664Other Revenue 146,469
TOTAL NON-OPERATING REVENUES (EXPENSES) 2,483,902
INCOME (LOSS) BEFORE TRANSFERS AND CAPITAL CONTRIBUTIONS 253,338
Transfer Out - Food Service Fund Indirect Costs (135,861)
Contributed Capital 127,660
CHANGE IN NET POSITION 245,137
TOTAL NET POSITION, Beginning of Year 1,219,414
TOTAL NET POSITION, End of Year 1,464,551$
YEAR ENDED JUNE 30, 2016
YORK SCHOOL DISTRICT ONEYORK, SOUTH CAROLINA
STATEMENT OF REVENUES, EXPENSES, AND CHANGES IN FUND NET POSITION
PROPRIETARY FUND
The notes to the financial statements are an integral part of this statement. See accompanying independent auditor's report.
38
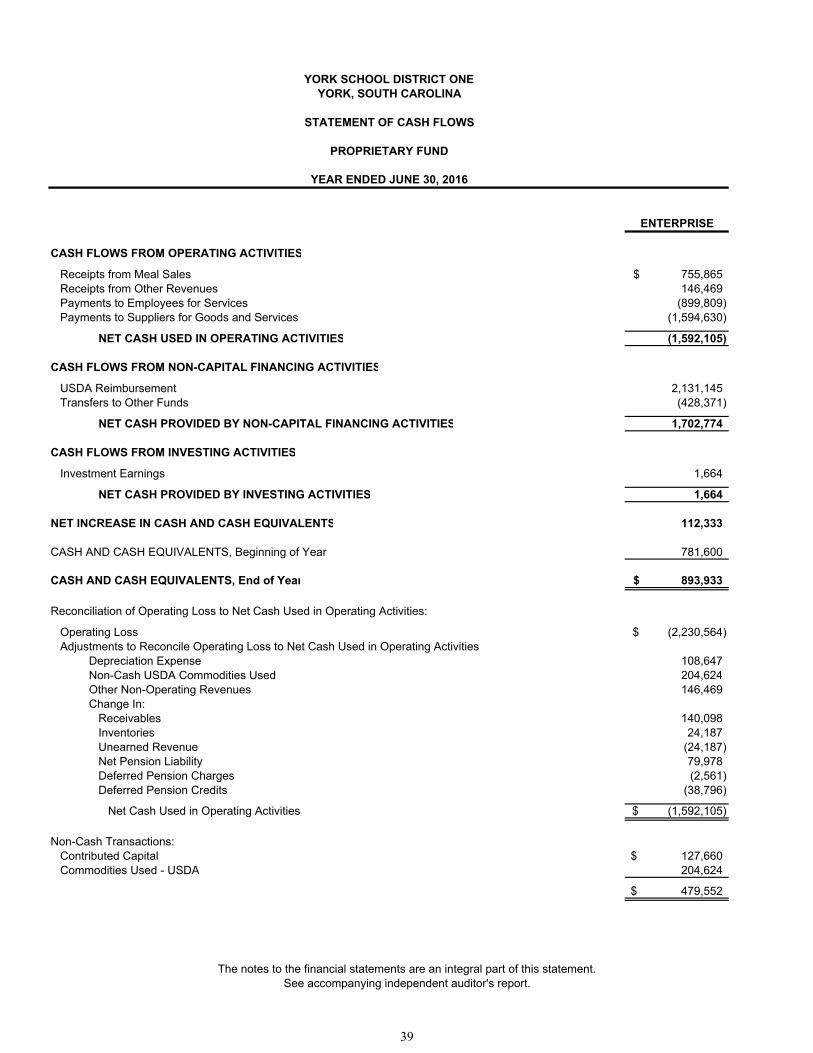
ENTERPRISE
CASH FLOWS FROM OPERATING ACTIVITIES
Receipts from Meal Sales 755,865$ Receipts from Other Revenues 146,469 Payments to Employees for Services (899,809) Payments to Suppliers for Goods and Services (1,594,630)
NET CASH USED IN OPERATING ACTIVITIES (1,592,105)
CASH FLOWS FROM NON-CAPITAL FINANCING ACTIVITIES
USDA Reimbursement 2,131,145 Transfers to Other Funds (428,371)
NET CASH PROVIDED BY NON-CAPITAL FINANCING ACTIVITIES 1,702,774
CASH FLOWS FROM INVESTING ACTIVITIES
Investment Earnings 1,664
NET CASH PROVIDED BY INVESTING ACTIVITIES 1,664
NET INCREASE IN CASH AND CASH EQUIVALENTS 112,333
CASH AND CASH EQUIVALENTS, Beginning of Year 781,600
CASH AND CASH EQUIVALENTS, End of Year 893,933$
Reconciliation of Operating Loss to Net Cash Used in Operating Activities:
Operating Loss (2,230,564)$ Adjustments to Reconcile Operating Loss to Net Cash Used in Operating Activities
Depreciation Expense 108,647 Non-Cash USDA Commodities Used 204,624 Other Non-Operating Revenues 146,469 Change In:
Receivables 140,098 Inventories 24,187 Unearned Revenue (24,187) Net Pension Liability 79,978 Deferred Pension Charges (2,561) Deferred Pension Credits (38,796)
Net Cash Used in Operating Activities (1,592,105)$
Non-Cash Transactions:Contributed Capital 127,660$ Commodities Used - USDA 204,624
479,552$
YEAR ENDED JUNE 30, 2016
YORK SCHOOL DISTRICT ONEYORK, SOUTH CAROLINA
PROPRIETARY FUND
STATEMENT OF CASH FLOWS
The notes to the financial statements are an integral part of this statement. See accompanying independent auditor's report.
39
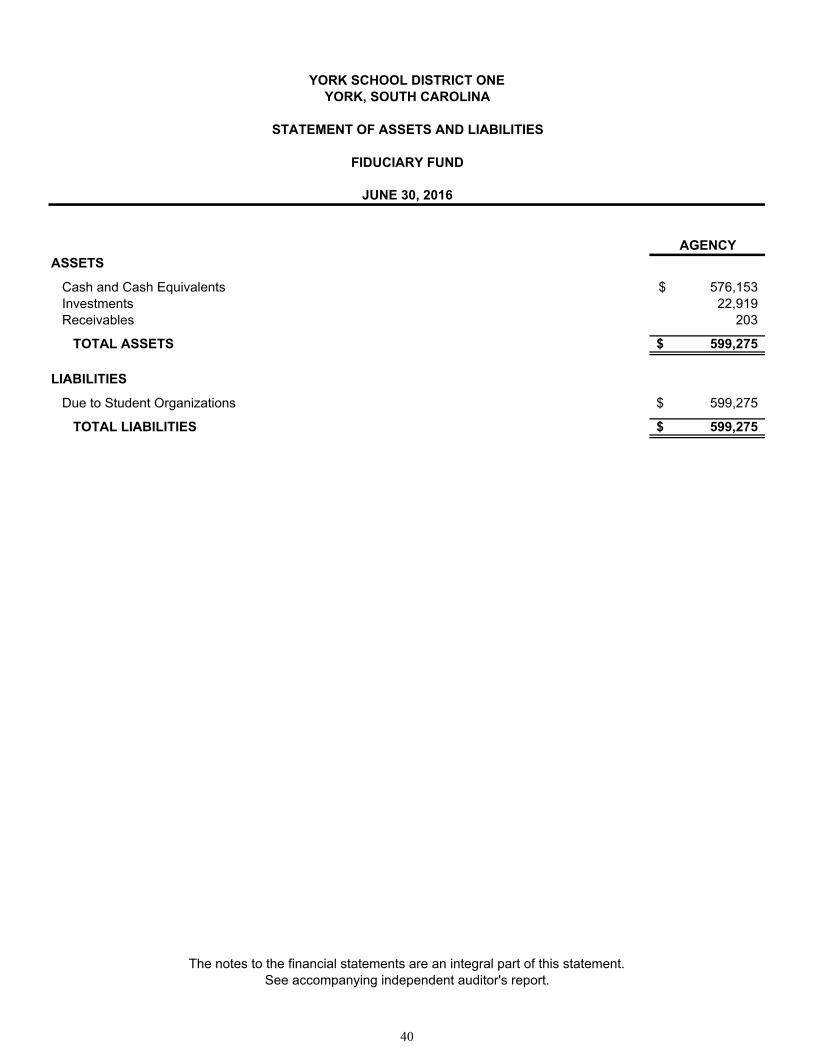
AGENCYASSETS
Cash and Cash Equivalents 576,153$ Investments 22,919 Receivables 203
TOTAL ASSETS 599,275$
LIABILITIES
Due to Student Organizations 599,275$
TOTAL LIABILITIES 599,275$
JUNE 30, 2016
YORK SCHOOL DISTRICT ONEYORK, SOUTH CAROLINA
STATEMENT OF ASSETS AND LIABILITIES
FIDUCIARY FUND
The notes to the financial statements are an integral part of this statement. See accompanying independent auditor's report.
40

YORK SCHOOL DISTRICT ONE YORK, SOUTH CAROLINA
NOTES TO THE FINANCIAL STATEMENTS
YEAR ENDED JUNE 30, 2016
Note 1-Summary of Significant Accounting Policies A) Reporting Entity
York School District One, South Carolina (the “District”), established in 1954, is controlled by a Board of Trustees (the “Board”), which has oversight responsibility over the public school education activities in the District. The District receives funding from local, state and federal government sources and must comply with the related requirements of these funding source entities. The District is governed by a seven member Board. The financial statements of the District have been prepared in conformity with accounting principles generally accepted in the United States of America as applied to governmental units. The Government Accounting Standards Board (“GASB”) is the accepted standard-setting body for establishing governmental accounting and financial reporting principles. The more significant of the District’s accounting policies are described below. As required by GAAP, the financial statements must present the District’s financial information with any of its component units. The primary criterion for determining inclusion or exclusion of a legally separate entity (component unit) is financial accountability, which is presumed to exist if the District both appoints a voting majority of the entity’s governing body, and either 1) the District is able to impose its will on the entity or, 2) there is a potential for the entity to provide specific financial benefits to, or impose specific financial burdens on the District. If either or both of the foregoing conditions are not met, the entity could still be considered a component unit if it is fiscally dependent on the District and there is a potential that the entity could either provide specific financial benefits to, or to impose specific financial burdens on the District. In order to be considered fiscally independent, an entity must have the authority to do all of the following: (a) determine its budget without the District having the authority to approve or modify that budget; (b) levy taxes or set rates or charges without approval by the District; and (c) issue bonded debt without approval by the District. An entity has a financial benefit or burden relationship with the District if, for example, any one of the following conditions exists: (a) the District is legally entitled to or can otherwise access the entity’s resources, (b) the District is legally obligated or has otherwise assumed the obligation to finance the deficits or, or provide financial support to, the entity, or (c) the District is obligated in some manner for the debt of the entity. Finally, an entity could be a component unit even if it met all the conditions described above if excluding it would cause the District’s financial statements to be misleading. Blended component units, although legally separate entities, are in substance, part of the government's operations and data from these units are combined with data of the primary government in the fund financial statements. Discretely presented component units, on the other hand, are reported in a separate column in the government-wide financial statements to emphasize they are legally separate from the District. Based on the criteria above, the District does not have any component units.
B) Government-Wide and Fund Financial Statements
The government-wide financial statements (i.e., the Statement of Net Position and the Statement of Activities) report information on all of the non-fiduciary activities of the District (the “Primary Government”). For the most part, the effect of interfund activity (except for interfund services provided and used between functions) has been removed from these statements.
Governmental activities, which normally are supported by taxes and intergovernmental revenues, are reported separately from business-type activities, which rely, to a significant extent, on fees and charges for support.
41
YORK SCHOOL DISTRICT ONE YORK, SOUTH CAROLINA
NOTES TO THE FINANCIAL STATEMENTS
YEAR ENDED JUNE 30, 2016
Note 1-Summary of Significant Accounting Policies (Continued)
B) Government-Wide and Fund Financial Statements (Continued)
The Statement of Activities demonstrates the degree to which the direct expenses of a given function or segment are offset by program revenues. Direct expenses are those that are clearly identifiable with a specific function or segment. Program revenues include 1) charges to customers or applicants who purchase, use, or directly benefit from goods, services or privileges provided by a given function or segment and 2) grants and contributions that are restricted to meeting the operational or capital requirements of a particular function or segment. Taxes and other items not properly included among program revenues are reported instead as general revenues. The comparison of direct expenses with program revenues identifies the extent to which each business segment or governmental function is self-financing or draws from the general revenues of the District.
C) Measurement Focus, Basis of Accounting, and Basis of Presentation
The government-wide financial statements are reported using the economic resources measurement focus and the accrual basis of accounting, as is the Proprietary Fund financial statements. The Fiduciary Fund financial statements are presented using the accrual basis of accounting. Under the accrual basis of accounting, revenues are recorded when earned and expenses are recorded when a liability is incurred, regardless of the timing of related cash flows. Property taxes are recognized as revenues in the year for which they are levied. Grants and similar items are recognized as revenue as soon as all eligibility requirements imposed by the provider have been met. The government-wide statements are prepared using a different measurement focus from the manner in which governmental fund financial statements are prepared (see further detail below). Governmental fund financial statements therefore, include reconciliation with brief explanations to better identify the relationship between the government-wide statements and the statements for governmental funds. Governmental fund financial statements are reported using the current financial resources measurement focus and the modified accrual basis of accounting. Revenues are recognized as soon as they are both measurable and available. Revenues are considered to be available when they are collectible within the current period or soon enough thereafter to pay liabilities of the current period. For this purpose, the government considers revenues to be available if they are collected within 60 days of the end of the current fiscal period. Expenditures generally are recorded when a liability is incurred, as under accrual accounting.
However, debt service expenditures, as well as expenditures related to compensated absences and claims and judgments, are recorded only when payment is due. Property taxes, federal and state grant programs, and interest associated with the current fiscal period are all considered to be susceptible to accrual and so have been recognized as revenues of the current fiscal period. All other revenue items are considered to be measurable and available only when cash has been received by the government. Fund financial statements report detailed information about the District. The focus of Governmental and Enterprise Fund financial statements is on major funds rather than reporting funds by type. Each major fund is presented in a separate column. Non-major funds are aggregated and presented in a single column. Fiduciary Funds are reported by fund type. When both restricted and unrestricted resources are available for use, it is the District’s practice to use restricted resources first, then unrestricted resources as they are needed.
42
YORK SCHOOL DISTRICT ONE YORK, SOUTH CAROLINA
NOTES TO THE FINANCIAL STATEMENTS
YEAR ENDED JUNE 30, 2016
Note 1-Summary of Significant Accounting Policies (Continued) C) Measurement Focus, Basis of Accounting, and Basis of Presentation (Continued)
The accounts of the government are organized and operated on the basis of funds. A fund is an independent fiscal and accounting entity with a self-balancing set of accounts. Fund accounting segregates funds according to their intended purpose and is used to aid management in demonstrating compliance with finance-related legal and contractual provisions. There are a minimum number of funds maintained to keep the accounts consistent with legal and managerial requirements. The following major funds and fund types are used by the District. Governmental Fund Types are those through which most governmental functions of the District are financed. The District's expendable financial resources and related assets and liabilities (except for those accounted for in the Proprietary Funds) are accounted for through governmental funds. Governmental funds are accounted for using a current financial resources measurement focus and the modified accrual basis of accounting. The following are the District's major and non-major governmental fund types:
The General Fund, a major fund and a budgeted fund, is the general operating fund of the District and accounts for all revenues and expenditures of the District except those required to be accounted for in another fund. All general tax revenues and other receipts that (a) are not allocated by law or contractual agreement to other funds or (b) that have not been restricted, committed, or assigned to other funds are accounted for in the General Fund. General operating expenditures and the capital improvement costs that are not paid through other funds are paid from the General Fund.
Special Revenue Funds are used to account for and report the proceeds of specific revenue sources (that are expected to continue to comprise a substantial portion of the inflows of the fund) that are restricted or committed to expenditures for specified purposes other than debt service or capital projects. The District has the following major Special Revenue Funds:
i) The Special Revenue Fund, a major fund and an unbudgeted fund, is used to account for
and report financial resources provided by federal, state, and local projects and grants that are restricted, committed or assigned for special education programs.
ii) The Education Improvement Act (“EIA”) Fund, a major fund and an unbudgeted fund, is
used to account for and report the restricted revenues from the South Carolina Education Improvement Act of 1984 (which is legally required by the state to be accounted for as a specific revenue source) which are restricted for specific programs authorized or mandated by the EIA.
The Debt Service Fund, a major fund and an unbudgeted fund, is used to account for the accumulation of financial resources that are restricted, committed, or assigned for the payment of all long-term debt principal, interest and related costs for the District.
The Capital Projects Fund, a major fund and an unbudgeted fund, is used to account for and report financial resources that are restricted, committed, or assigned for expenditures of capital outlay related to site acquisitions, construction, equipment, and renovation of all major capital facilities except for those financed in the Enterprise Fund.
43
YORK SCHOOL DISTRICT ONE YORK, SOUTH CAROLINA
NOTES TO THE FINANCIAL STATEMENTS
YEAR ENDED JUNE 30, 2016
Note 1-Summary of Significant Accounting Policies (Continued) C) Measurement Focus, Basis of Accounting, and Basis of Presentation (Continued)
Proprietary Fund Types are accounted for based on the flow of economic resources measurement focus and the accrual basis of accounting. Under this method, revenues are recorded when earned and expenses are recorded at the time liabilities are incurred.
Proprietary funds distinguish operating revenues and expenses from non-operating items. Operating revenues and expenses generally result from providing services and producing and delivering goods in connection with a proprietary fund’s principal ongoing operations. The principal operating revenues of the Enterprise Fund are charges to students and teachers for breakfast, lunch and special sales. Operating expenses for the Enterprise Fund include the cost of sales, administrative expenses, and depreciation of capital assets. All revenues and expenses not meeting this definition are reported as non-operating revenues and expenses.
Proprietary Fund types include the following fund:
The Enterprise Fund, a major fund and an unbudgeted fund, is used to account for those operations that are financed and operated in a manner similar to private business enterprises or where the District has decided that periodic determination of revenues earned, expenses incurred, and/or net income is necessary for management accountability. The Food Service Fund is the District's only Enterprise Fund and is used to account for the United States Department of Agriculture's (“USDA”) approved school breakfast and lunch programs.
Fiduciary Fund Types are used to account for expendable assets held by the District in a trustee capacity or as an agent for individuals, private organizations, other governmental units and/or other funds and include Agency Funds. Fiduciary Fund Types include the following:
The Agency Fund, an unbudgeted fund, accounts for the receipt and disbursement of monies to and from student activity organizations. These funds have no equity (assets are equal to liabilities) and do not include revenues and expenditures for general operation of the District. This accounting reflects the agency relationship of the District with the student activity organizations.
Change in Accounting Principle
The District implemented GASB Statement No. 72 “Fair Value Measurement and Application” (“GASB #72” or “Statement”) for the year ended June 30, 2016. The primary objective of this Statement was to address accounting and financial reporting issues related to fair value measurements. This Statement provides guidance for determining fair value measurement for financial reporting purposes. This Statement also provides guidance for applying fair value to certain investments and disclosures related to all fair value measurements.
The adoption of this Statement had no impact on the District’s financial statements but did result in expanded note disclosures. See Note 2 for more information regarding the District’s fair value disclosures. 44

YORK SCHOOL DISTRICT ONE YORK, SOUTH CAROLINA
NOTES TO THE FINANCIAL STATEMENTS
YEAR ENDED JUNE 30, 2016
Note 1-Summary of Significant Accounting Policies (Continued) D) Budgetary Data
Formal budgetary accounting is employed as a management tool for the District. Each budget is presented on the modified accrual basis of accounting, which is consistent with accounting principles generally accepted in the United State of America. Prior to July 1 of each fiscal year, the York District Board of Trustees legally adopts an operating budget for the General Fund only. The budget is a legal document that establishes total expenditure limits with the same basis of accounting being used to reflect actual revenues and expenditures under accounting principles generally accepted in the United States of America. Budgetary control is established at the departmental level or by projects. The Director of Finance is authorized to transfer budgeted amounts within and among departments; however, the Board of Trustees must approve any revisions that alter total expenditures. The legal level of control is at the fund level. All appropriations lapse at fiscal year-end. While budgets were transferred between function and object, there were no supplemental appropriations for the fiscal year that changed the total amount of the budget.
E) Encumbrances
Encumbrance accounting is utilized to assist in budgetary control through the use of purchase orders, which are recorded in order to reserve the portion of the applicable appropriation during the year. Encumbrances open at year-end lapse, and are subject to reappropriation in the budget of the subsequent year and are not carried forward.
F) Prepaid Items and Inventories
Prepaid items in the governmental funds are accounted for using the purchase method (expensed when paid). Inventories in the Food Service Fund consist of purchased goods, supplies and United States Department of Agriculture (USDA) commodities, which are stated at values assigned by the USDA. Under the system for accounting for inventories, materials and supplies are carried in an inventory account at cost, using the first-in, first-out method of accounting, and are subsequently charged to expenditures/expenses when consumed.
G) Cash, Cash Equivalents, and Investments
Cash and Cash Equivalents
The District considers all highly liquid investments (including restricted assets) with original maturities of three months or less when purchased and investments in the South Carolina Pooled Investment Fund (“Pool”) to be cash equivalents. Securities with an initial maturity of more than three months (from when initially purchased) that are not purchased from the pool are reported as investments.
Investments
The District’s investment policy is designed to operate within existing statutes (which are identical for all funds, fund types and component units within the State of South Carolina) that authorize the District to invest in the following:
(a) Obligations of the United States and its agencies, the principal and interest of which is fully
guaranteed by the United States.
45

YORK SCHOOL DISTRICT ONE YORK, SOUTH CAROLINA
NOTES TO THE FINANCIAL STATEMENTS
YEAR ENDED JUNE 30, 2016
Note 1-Summary of Significant Accounting Policies (Continued) G) Cash, Cash Equivalents, and Investments (Continued)
Investments (Continued)
(b) Obligations issued by the Federal Financing Bank, Federal Farm Credit Bank, the Bank of Cooperatives, the Federal Intermediate Credit Bank, the Federal Land Banks, the Federal Home Loan Banks, the Federal Home Loan Mortgage Corporation, the Federal National Mortgage Association, the Government National Mortgage Association, the Federal Housing Administration, and the Farmers Home Administration, if, at the time of investment, the obligor has a long-term, unenhanced, unsecured debt rating in one of the top two ratings categories, without regard to a refinement or gradation of rating category by numerical modifier or otherwise, issued by at least two nationally recognized credit rating organizations.
(c) (i) General obligations of the State of South Carolina or any of its political units; or (ii) revenue
obligations of the State of South Carolina or its political units, if at the time of investment, the obligor has a long-term, unenhanced, unsecured debt rating in one of the top two ratings categories, without regard to a refinement or gradation of rating category by numerical modifier or otherwise, issued by at least two nationally recognized credit rating organizations.
(d) Savings and Loan Associations to the extent that the same are insured by an agency of the
federal government.
(e) Certificates of deposit where the certificates are collaterally secured by securities of the type described in (a) and b) above held by a third party as escrow agent or custodian, of a market value not less than the amount of the certificates of deposit so secured, including interest; provided, however, such collateral shall not be required to the extent the same are insured by an agency of the federal government.
(f) Repurchase agreements when collateralized by securities as set forth in this section. (g) No load open-end or closed-end management type investment companies or investment trusts
registered under the Investment Company Act of 1940, as amended, where the investment is made by a bank or trust company or savings and loan association or other financial institution when acting as trustee or agent for a bond or other debt issue of that local government unit, political subdivision, or county treasurer if the particular portfolio of the investment company or investment trust in which the investment is made (i) is limited to obligations described in items (a), (b), (c), and (f) of this subsection, and (ii) has among its objectives the attempt to maintain a constant net asset value of one dollar a share and to that end, value its assets by the amortized cost method.
The District’s cash investment objectives are preservation of capital, liquidity, and yield. The District reports its cash and investments at fair value which is normally determined by quoted market prices.
The District currently or in the past year has used the following investments:
Cash and Investments held by the County Treasurer which are property taxes collected by the
District’s fiscal agent that have not been remitted to the District. The County Treasurer invests these funds in investments authorized by state statute as outlined above. All interest and other earnings gained are added back to the fund and are paid out by the County Treasurer to the respective governments on a periodic basis.
46
YORK SCHOOL DISTRICT ONE YORK, SOUTH CAROLINA
NOTES TO THE FINANCIAL STATEMENTS
YEAR ENDED JUNE 30, 2016
Note 1-Summary of Significant Accounting Policies (Continued) G) Cash, Cash Equivalents, and Investments (Continued)
Investments (Continued)
Local Government Investment Pool (“Pool”) investments are invested with the South Carolina
State Treasurer’s Office, which established the South Carolina Pool pursuant to Section 6-6-10 of the South Carolina Code. The Pool is an investment trust fund, in which public monies in excess of current needs, which are under the custody of any city treasurer or any governing body of a political subdivision of the State, may be deposited. The Pool is a 2a 7-like pool which is not registered with the Securities and Exchange Commission (“SEC”) as an investment company, but has a policy that it will operate in a manner consistent with the SEC’s Rule 2a 7 of the Investment Company Act of 1940. In accordance with GASB Statement No. 31, “Accounting and Financial Reporting for Certain Investments and for External Investment Pools”, investments are carried at fair value determined annually based upon quoted market prices. The total fair value of the Pool is apportioned to the entities with funds invested on an equal basis for each share owned, which are acquired at a cost of $1.00.
Treasury bills are negotiable debt obligations issued by the U.S. government and backed by its
full faith and credit, having a maturity of one year or less and are exempt from state and local taxes.
H) Interfund Receivables and Payables
Transactions between funds that are representative of reimbursement arrangements outstanding at the end of the fiscal year are referred to as "due to/from other funds." On fund financial statements, receivables and payables resulting from short-term interfund loans are classified as “interfund receivables/payables.” These amounts are eliminated in the governmental and business-type activities columns of the Statement of Net Position, except for the net residual amounts due between governmental and business-type activities, which are presented as “internal balances.” All trade and property taxes receivable are shown net of an allowance for uncollectibles.
I) Compensated Absences
District employees are granted vacation and sick leave in varying amounts. Upon termination of employment, an employee is reimbursed for accumulated vacation days not to exceed 20 days. Unused sick leave is not reimbursed and therefore is not reported in the financial statements. The District reports compensated absences in accordance with the provisions of GASB Statement No. 16, “Accounting for Compensated Absences.” The entire compensated absence liability and expense is reported on the government-wide financial statements. Governmental funds will only recognize compensated absences liability if they have matured, for example, as a result of employee resignations or retirements.
47
YORK SCHOOL DISTRICT ONE YORK, SOUTH CAROLINA
NOTES TO THE FINANCIAL STATEMENTS
YEAR ENDED JUNE 30, 2016
Note 1-Summary of Significant Accounting Policies (Continued)
J) Fund Balance GASB #54 establishes fund balance classifications that comprise a hierarchy based primarily on the extent to which a government is bound to observe constraints imposed upon the use of the resources reported in the governmental funds. The District classifies governmental fund balances as follows:
Nonspendable – includes amounts that inherently cannot be spent either because it is not in spendable form (i.e. prepaids, inventories, etc.) or because of legal or contractual requirements (i.e. principal on an endowment, etc.). Restricted – includes amounts that are constrained by specific purposes which are externally imposed by (a) other governments through laws and regulations, (b) grantors or contributions through agreements, (c) creditors through debt covenants or other contracts, or (d) imposed by law through constitutional provisions or enabling legislation. Committed – includes amounts that are constrained for specific purposes that are internally imposed by the government through formal action made by the highest level of decision making authority (The Board) before the end of the reporting period. Those committed amounts cannot be used for any other purpose unless the government removes or changes the specified use by taking the same type of action it employed to previously commit those amounts. Committed amounts for the District consist of amounts approved by a majority vote, through an ordinance, of the Board Members in subsequent requests made throughout the year. Assigned – includes amounts that are intended to be used for specific purposes that are neither considered restricted or committed and that such assignments are made before the report issuance date. The Board adopted a policy that grants the Superintendent and the Finance Director the right to make assignments of fund balance for the District. Unassigned – includes amounts that do not qualify to be accounted for and reported in any of the other fund balance categories. This classification represents the amount of fund balance that has not been assigned to other funds and that has not been restricted, committed, or assigned to specific purposes within the General Fund. The General Fund should be the only fund that reports a positive unassigned fund balance amount. In other governmental funds, if expenditures incurred for specific purposes exceeded the amounts of restricted, committed, or assigned to those purposes, it may be necessary to report a negative unassigned fund balance.
The District generally uses restricted amounts to be spent first when both restricted and unrestricted (committed, assigned, and unassigned) fund balance is available unless there are legal documents, contracts, or agreements that prohibit doing such. Additionally, the District generally would first use committed, then assigned, and lastly unassigned amounts of unrestricted fund balance when expenditures are made. The District does not have a formally approved minimum fund balance policy, but generally attempts to keep its unassigned fund balance in the General Fund to be approximately two months of General Fund operating expenditures.
48
YORK SCHOOL DISTRICT ONE YORK, SOUTH CAROLINA
NOTES TO THE FINANCIAL STATEMENTS
YEAR ENDED JUNE 30, 2016
Note 1-Summary of Significant Accounting Policies (Continued) K) Net Position
Net position represents the difference between assets and deferred outflows of resources and liabilities and deferred inflows of resources in the Statement of Net Position. Net position is classified as net investment in capital assets; restricted; and unrestricted. Net investment in capital assets consists of capital assets, net of accumulated depreciation, reduced by the outstanding balances of any borrowings used for the acquisition, construction or improvement of those assets. Outstanding debt which has not been spent is included in the same net position component as the unspent proceeds. Net position is reported as restricted when there are limitations imposed on their use either through enabling legislation or through external restrictions imposed by creditors, grantors, contributors, or laws or regulations of other governments.
L) Use of Estimates The preparation of the financial statements in conformity with accounting principles generally accepted in the United States of America as applicable to governmental units requires management to make estimates and assumptions that affect the reported amounts of assets and liabilities and disclosures of contingent assets and liabilities at the date of the financial statements. Estimates also affect the reported amounts of revenue, expenditures or expenses during the reporting period. Actual results could differ from those estimates.
M) Accrued Liabilities and Long-Term Obligations
All payables, accrued liabilities and long-term obligations are reported in the government-wide financial statements, and all payables, accrued liabilities and long-term obligations payable from proprietary funds are reported on the Proprietary Fund financial statements.
N) Fair Value
The fair value measurement and disclosure framework provides for a three-tier fair value hierarchy that gives highest priority to quoted prices in active markets for identical assets or liabilities (Level 1 measurements) and the lowest priority to unobservable inputs (Level 3 measurements). The three levels of the fair value hierarchy are described below:
Level 1 – Inputs to the valuation methodology are unadjusted quoted prices for identical assets or liabilities in active markets that the District can access at the measurement date.
Level 2 – Inputs to the valuation methodology, other than quoted prices included in Level 1 that are observable for an asset or liability either directly or indirectly and include:
Quoted prices for similar assets and liabilities in active markets. Quoted prices for identical or similar assets or liabilities in inactive markets. Inputs other than quoted market prices that are observable for the asset or liability. Inputs that are derived principally from or corroborated by observable market data by correlation or other means.
Level 3 – Inputs to the valuation methodology that are unobservable for an asset or liability and include:
Fair value is often based on developed models in which there are few, if any, observable inputs. The asset’s or liability’s fair value measurement level within the fair value hierarchy is based on the lowest level of any input that is significant to the fair value measurement. Valuation techniques used maximize the use of observable inputs and minimize the use of unobservable inputs.
49
YORK SCHOOL DISTRICT ONE YORK, SOUTH CAROLINA
NOTES TO THE FINANCIAL STATEMENTS
YEAR ENDED JUNE 30, 2016
Note 1-Summary of Significant Accounting Policies (Continued) N) Fair Value (Continued)
The valuation methodologies described above may produce a fair value calculation that may not be indicative of future net realizable values or reflective of future fair values. The District believes that the valuation methods used are appropriate and consistent with GAAP. The use of different methodologies or assumptions to determine the fair value of certain financial instruments could result in a different fair value measurement at the reporting date. There have been no significant changes from the prior year in the methodologies used to measure fair value.
O) Accrued Liabilities and Long-Term Obligations
In general, payables and accrued liabilities that will be paid from governmental funds are reported on the governmental fund financial statements regardless of whether they will be liquidated with current resources. However, claims and judgments, non-current portion of capital leases, compensated absences, contractually required pension contributions and special termination benefits that will be paid from governmental funds are reported as a liability in the fund financial statements only to the extent that they will be paid with current, expendable, available financial resources. In general, payments made within sixty days after year-end are considered to have been made with current available financial resources. Bonds and other long-term obligations that will be paid from governmental funds are not recognized as a liability in the fund financial statements until due. In the government-wide financial statements long-term debt and other long-term obligations are reported as liabilities on the Statement of Net Position. Bond premiums and discounts (if any) are deferred and amortized over the life of the bonds using the straight-line method that approximates the effective interest method. Bonds payable are reported net of the applicable bond premiums or discount. In the fund financial statements, governmental fund types recognize bond premiums and discounts during the current period. The face amount of debt issued is reported as other financing sources. Premiums received on debt issuances are reported as other financing sources while discounts on debt issuances are reported as other financing uses. Issuance costs, whether or not withheld from the actual debt proceeds received, are reported as debt service expenditures.
P) Deferred Outflows/Inflows of Resources In addition to assets, the statement of Net Position and the Balance Sheet will sometimes report a separate section for deferred outflows of resources. This separate financial statement element, deferred outflows of resources, represents a consumption of net position that applies to a future period(s) and so will not be recognized as an outflow of resources (expense/expenditure) until then. The District currently has one type of deferred outflows of resources. The District reports deferred pension charges in its government-wide statement of net position in connection with its net pension liability for its participation in the South Carolina Retirement System and the South Carolina Police Officers Retirement System. These deferred pension charges are either (a) recognized in the subsequent period as a reduction of the net pension liability (which includes pension contributions made after the measurement date) or (b) amortized in a systematic and rational method as pension expense in future periods in accordance with GAAP. In addition to liabilities, the Statement of Net Position and the Balance Sheet will sometimes report a separate section for deferred inflows of resources. This separate financial statement element, deferred inflows of resources, represents an acquisition of net position that applies to a future period(s) and so will not be recognized as an inflow of resources (revenue) until that time. 50
YORK SCHOOL DISTRICT ONE YORK, SOUTH CAROLINA
NOTES TO THE FINANCIAL STATEMENTS
YEAR ENDED JUNE 30, 2016
Note 1-Summary of Significant Accounting Policies (Continued)
P) Deferred Outflows/Inflows of Resources (Continued) The District currently has two types of deferred inflows of resources: (1) The District reports unavailable revenue – property taxes only in the governmental funds Balance Sheet; it is deferred and recognized as an inflow of resources (property tax revenues) in the period the amounts become available. (2) The District also reports deferred pension credits in its Statements of Net Position in connection with its participation in the South Carolina Retirement System and South Carolina Police Officers’ Retirement System. These deferred pension credits are amortized in a systematic and rational method and recognized as a reduction of pension expense in future periods in accordance with GAAP.
Q) Capital Assets
General capital assets are those assets not specifically related to activities reported in the Proprietary Funds. These assets generally result from expenditures in the governmental funds. These assets are reported in the governmental activities column of the government-wide Statement of Net Position, but are not reported in the fund financial statements. Capital assets utilized by the Proprietary Funds are reported both in the business-type activities column of the government-wide Statement of Net Position and in the respective fund financial statements.
All capital assets are capitalized at cost (or estimated historical cost) and updated for additions and retirements during the year. Donated capital assets are recorded at estimated acquisition value (as estimated by the District) at the date of donation.
The District maintains a capitalization threshold as follows:
Asset Category Capitalization Limits Land/non-depreciable land improvements (produce permanent benefits, i.e. filling and excavation costs) All land will be capitalized Depreciable land improvements (deteriorate with the use or passage of time, i.e. fencing, landscaping, lighting, paving) $100,000 Buildings, Building Improvements (must add square footage to asset and extend the useful life) $100,000 Intangible Assets $100,000 Equipment $5,000
The District’s infrastructure assets have been reported with the buildings and improvements. The costs of normal maintenance and repairs that do not add to the value of the asset or materially extend an asset’s life are not capitalized. Interest incurred during the construction of capital assets is not capitalized for governmental activities as allowed by GAAP. The District does not maintain ownership of any public domain (“infrastructure”) general capital assets.
All reported capital assets except land and construction in progress are depreciated. Construction projects begin being depreciated once they are completed and placed in service, at which time the complete costs of the project are transferred to the appropriate capital asset category.
51
YORK SCHOOL DISTRICT ONE YORK, SOUTH CAROLINA
NOTES TO THE FINANCIAL STATEMENTS
YEAR ENDED JUNE 30, 2016
Note 1-Summary of Significant Accounting Policies (Continued) Q) Capital Assets (Continued)
Improvements are depreciated over the remaining useful lives of the related capital assets. Depreciation is computed using the straight-line method over the following useful lives:
Asset Category Useful Life Range
Land (not depreciated) not applicable Land improvements 20–50 years Buildings and improvements 10–50 years Furniture and equipment 3–12 years
Vehicles 3–10 years Construction in progress (not depreciated) not applicable
R) Pensions
In government-wide financial statements, pensions are required to be recognized and disclosed using the accrual basis of accounting, regardless of the amount recognized as pension expenditures on the modified accrual basis of accounting. See Note 10.A and the required supplementary information immediately following the notes to the financial statements for more information. The District recognizes a net pension liability for each qualified pension plan in which it participates, which represents the excess of the total pension liability over the fiduciary net position of the qualified pension plan, or the District’s proportionate share thereof in the case of a cost-sharing multiple-employer plan, measured as of the District’s fiscal year-end. Changes in the net pension liability during the period are recorded as pension expense, or as deferred outflows or inflows of resources depending on the nature of the change, in the period incurred. Those changes in net pension liability that are recorded as deferred outflows or inflows of resources that arise from changes in actuarial assumptions or other inputs and differences between expected or actual experience are amortized over the weighted average remaining service life of all participants in the respective qualified pension plan and recorded as a component of pension expense beginning with the period in which they are incurred. Projected earnings on qualified pension plan investments are recognized as a component of pension expense. Differences between projected and actual investment earnings are reported as deferred outflows or inflows of resources and amortized as a component of pension expense on a closed basis over a five-year period beginning with the period in which the difference occurred.
S) Other Postemployment Benefits Other Postemployment Benefits (“OPEB”) cost for retiree healthcare and similar, non-pension retiree benefits, is required to be measured and disclosed using the accrual basis of accounting (see Note 10.B), regardless of the amount recognized as OPEB expense on the modified accrual basis of accounting. Annual OPEB cost is equal to the annual required contributions to the OPEB Plan, calculated in accordance with GAAP.
Note 2-Deposits and Investments
Deposits Custodial Credit Risk for Deposits: Custodial credit risk for deposits is the risk that, in the event of a bank failure, the District’s deposits might not be recovered. The District does not have a deposit policy for custodial credit risk but follows the investment policy statutes of the State of South Carolina. As of June 30, 2016, none of the District’s bank balances (including fiduciary funds) of approximately $4,378,000 (book balance of approximately $2,214,000) was exposed to custodial credit risk.
52
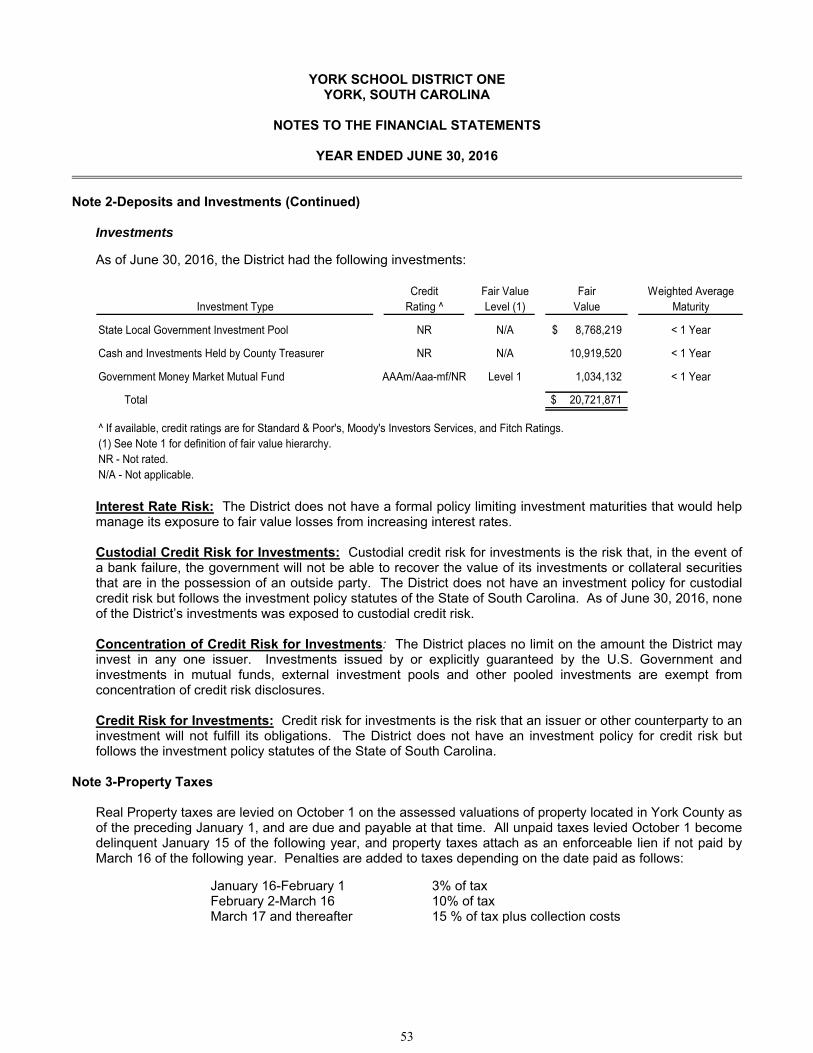
YORK SCHOOL DISTRICT ONE YORK, SOUTH CAROLINA
NOTES TO THE FINANCIAL STATEMENTS
YEAR ENDED JUNE 30, 2016
Note 2-Deposits and Investments (Continued)
Investments As of June 30, 2016, the District had the following investments:
Credit Fair Value Fair Weighted AverageInvestment Type Rating ^ Level (1) Value Maturity
State Local Government Investment Pool NR N/A 8,768,219$ < 1 Year
Cash and Investments Held by County Treasurer NR N/A 10,919,520 < 1 Year
Government Money Market Mutual Fund AAAm/Aaa-mf/NR Level 1 1,034,132 < 1 Year
Total 20,721,871$
^ If available, credit ratings are for Standard & Poor's, Moody's Investors Services, and Fitch Ratings.(1) See Note 1 for definition of fair value hierarchy.NR - Not rated.N/A - Not applicable.
Interest Rate Risk: The District does not have a formal policy limiting investment maturities that would help manage its exposure to fair value losses from increasing interest rates. Custodial Credit Risk for Investments: Custodial credit risk for investments is the risk that, in the event of a bank failure, the government will not be able to recover the value of its investments or collateral securities that are in the possession of an outside party. The District does not have an investment policy for custodial credit risk but follows the investment policy statutes of the State of South Carolina. As of June 30, 2016, none of the District’s investments was exposed to custodial credit risk. Concentration of Credit Risk for Investments: The District places no limit on the amount the District may invest in any one issuer. Investments issued by or explicitly guaranteed by the U.S. Government and investments in mutual funds, external investment pools and other pooled investments are exempt from concentration of credit risk disclosures. Credit Risk for Investments: Credit risk for investments is the risk that an issuer or other counterparty to an investment will not fulfill its obligations. The District does not have an investment policy for credit risk but follows the investment policy statutes of the State of South Carolina.
Note 3-Property Taxes
Real Property taxes are levied on October 1 on the assessed valuations of property located in York County as of the preceding January 1, and are due and payable at that time. All unpaid taxes levied October 1 become delinquent January 15 of the following year, and property taxes attach as an enforceable lien if not paid by March 16 of the following year. Penalties are added to taxes depending on the date paid as follows:
January 16-February 1 3% of tax February 2-March 16 10% of tax March 17 and thereafter 15 % of tax plus collection costs
53
YORK SCHOOL DISTRICT ONE YORK, SOUTH CAROLINA
NOTES TO THE FINANCIAL STATEMENTS
YEAR ENDED JUNE 30, 2016
Note 3-Property Taxes (Continued)
Motor vehicle taxes are levied on the first day of the month in which the motor vehicle license expires and is due by the end of the month. Property taxes are billed and collected by York County. Property tax revenue is recognized when collected and deposited to the District's account by the County Treasurer's Office. Real property taxes collected within 60 days after fiscal year end are also recognized as revenue for the year. Assessed values for real estate are established annually by the York County Tax Assessor at 4% of market value for legal residence and 6% of market value for rental and other real property. For the year ended June 30, 2016, millage was set at 182.1 mills (179.6 mills in the prior year) to cover the District’s general operating services and uses. The millage remained at 78.0 mills to cover the District’s scheduled debt service requirements. In addition, the District receives a prorated share, based on pupil attendance, of the County-wide 32 mill levy for school operations that is divided between the four Districts within the County, and an additional County-wide special 1 mill levy for school operations for the District having the lowest assessed valuation in the County, which is York School District One.
The records of the York County Treasurer’s Office reported uncollected delinquent property taxes at June 30, 2016 of approximately $2,817,000 for the General Fund (net of allowance for uncollectible portion of approximately $117,000) and $1,242,000 for the Debt Service Fund (net of allowance for uncollectible portion of $52,000). In addition, there is approximately $493,000 included in the General Fund’s property tax receivable amount at June 30, 2016 that is revenue in lieu of taxes related to Property Tax Relief (Act 388).
Of these amounts, approximately $2,739,000 and $1,180,000, respectively, have been recorded as unavailable property taxes because they were not collected within sixty days after the year end and are not considered susceptible to accrual. Allowances for uncollectibles were not necessary for the other receivable accounts. Included in property taxes receivable is approximately $77,000 in the General Fund, and approximately $62,000 in the Debt Service Fund, that has been recognized as revenue at June 30, 2016 because it was collected within sixty days after year end and is considered measurable and available. Also included in the General Fund’s property tax receivable is approximately $493,000 of revenue in lieu of taxes related to Property Tax Relief (Act 388) that has been recognized as revenue at June 30, 2016 because it was measurable and available.
54

YORK SCHOOL DISTRICT ONE YORK, SOUTH CAROLINA
NOTES TO THE FINANCIAL STATEMENTS
YEAR ENDED JUNE 30, 2016
Note 4-Capital Assets
Capital asset activity for the District for the year ended June 30, 2016, was as follows:
Beginning Ending
Governmental Activities: Balance Increases Decreases Balance
Capital Assets, Not Being Depreciated:
Land 3,129,672$ - - 3,129,672$
Total Capital Assets, Not Being Depreciated 3,129,672 - - 3,129,672
Capital Assets, Being Depreciated:
Buildings and Improvements 167,429,618 - - 167,429,618
Furniture and Equipment 2,731,876 169,898 - 2,901,774
Improvements Other than Buildings 1,912,481 - - 1,912,481
Total Capital Assets Being Depreciated 172,073,975 169,898 - 172,243,873
Less: Accumulated Depreciation for:
Buildings and Improvements 57,096,165 5,496,952 - 62,593,117
Furniture and Equipment 2,417,584 131,760 - 2,549,344
Improvements Other than Buildings 1,849,488 7,722 - 1,857,210
Total Accumulated Depreciation 61,363,237 5,636,434 - 66,999,671
Total Capital Assets, Being Depreciated, Net 110,710,738 (5,466,536) - 105,244,202
Total Governmental Activities Capital Assets, Net 113,840,410$ (5,466,536) - 108,373,874$
Business-Type Activities:
Capital Assets, Being Depreciated:
Furniture and Equipment 2,436,579$ 127,660 - 2,564,239$
Less: Accumulated Depreciation 1,930,415 108,647 - 2,039,062
Total Business-Type Activities Capital Assets, Net 506,164$ 19,013 - 525,177$
55
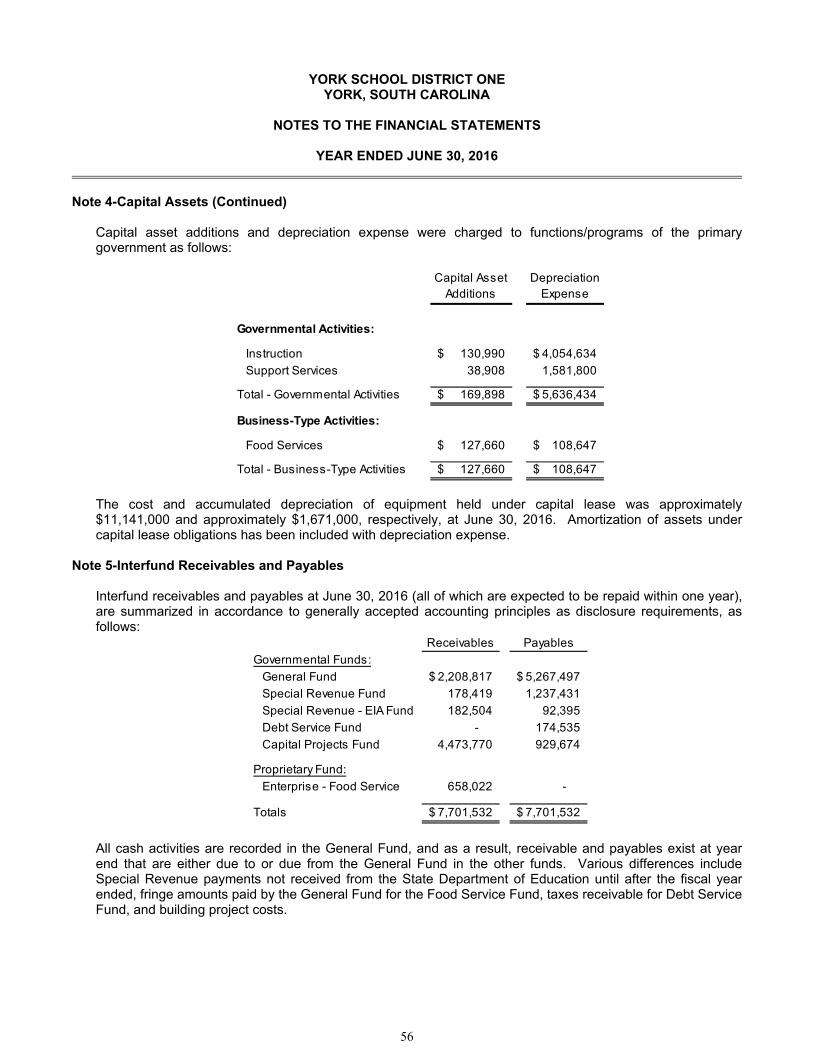
YORK SCHOOL DISTRICT ONE YORK, SOUTH CAROLINA
NOTES TO THE FINANCIAL STATEMENTS
YEAR ENDED JUNE 30, 2016
Note 4-Capital Assets (Continued)
Capital asset additions and depreciation expense were charged to functions/programs of the primary government as follows:
Capital Asset Additions
Depreciation Expense
Governmental Activities:
Instruction 130,990$ 4,054,634$
Support Services 38,908 1,581,800
Total - Governmental Activities 169,898$ 5,636,434$
Business-Type Activities:
Food Services 127,660$ 108,647$
Total - Business-Type Activities 127,660$ 108,647$
The cost and accumulated depreciation of equipment held under capital lease was approximately $11,141,000 and approximately $1,671,000, respectively, at June 30, 2016. Amortization of assets under capital lease obligations has been included with depreciation expense.
Note 5-Interfund Receivables and Payables
Interfund receivables and payables at June 30, 2016 (all of which are expected to be repaid within one year), are summarized in accordance to generally accepted accounting principles as disclosure requirements, as follows:
Receivables Payables
Governmental Funds:
General Fund 2,208,817$ 5,267,497$
Special Revenue Fund 178,419 1,237,431
Special Revenue - EIA Fund 182,504 92,395
Debt Service Fund - 174,535
Capital Projects Fund 4,473,770 929,674
Proprietary Fund:
Enterprise - Food Service 658,022 -
Totals 7,701,532$ 7,701,532$
All cash activities are recorded in the General Fund, and as a result, receivable and payables exist at year end that are either due to or due from the General Fund in the other funds. Various differences include Special Revenue payments not received from the State Department of Education until after the fiscal year ended, fringe amounts paid by the General Fund for the Food Service Fund, taxes receivable for Debt Service Fund, and building project costs.
56
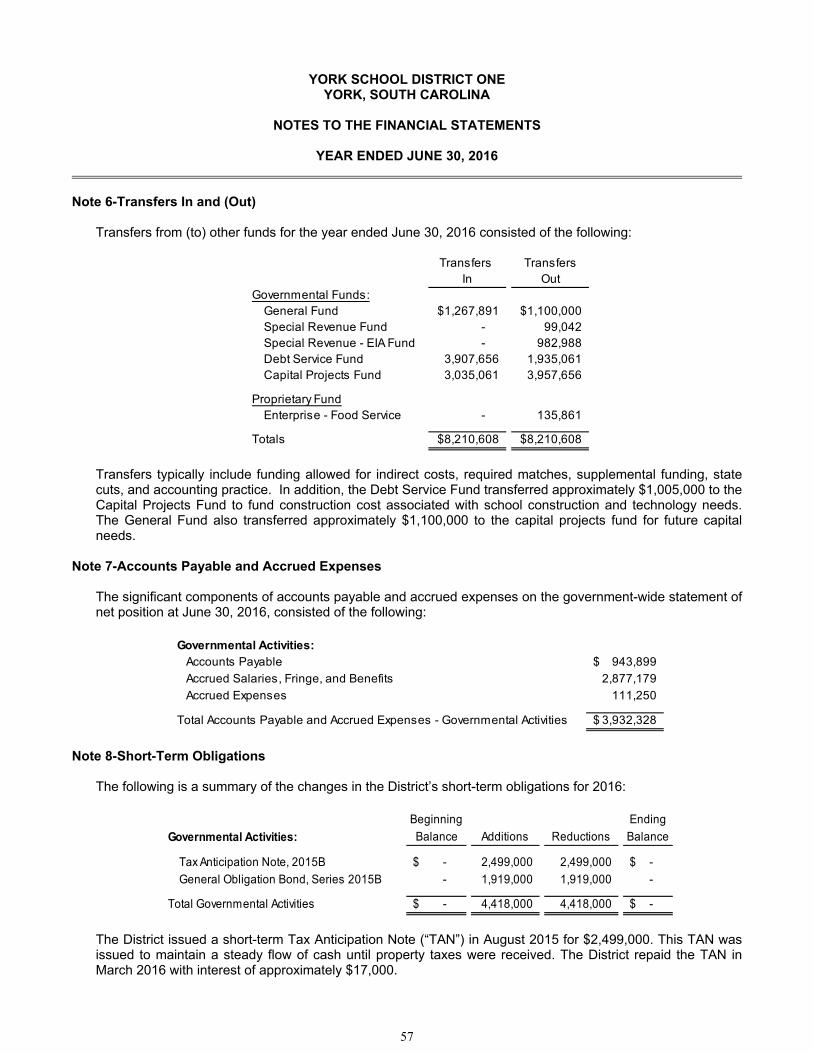
YORK SCHOOL DISTRICT ONE YORK, SOUTH CAROLINA
NOTES TO THE FINANCIAL STATEMENTS
YEAR ENDED JUNE 30, 2016
Note 6-Transfers In and (Out)
Transfers from (to) other funds for the year ended June 30, 2016 consisted of the following:
Transfers TransfersIn Out
Governmental Funds:General Fund 1,267,891$ 1,100,000$ Special Revenue Fund - 99,042 Special Revenue - EIA Fund - 982,988 Debt Service Fund 3,907,656 1,935,061 Capital Projects Fund 3,035,061 3,957,656
Proprietary FundEnterprise - Food Service - 135,861
Totals 8,210,608$ 8,210,608$
Transfers typically include funding allowed for indirect costs, required matches, supplemental funding, state cuts, and accounting practice. In addition, the Debt Service Fund transferred approximately $1,005,000 to the Capital Projects Fund to fund construction cost associated with school construction and technology needs. The General Fund also transferred approximately $1,100,000 to the capital projects fund for future capital needs.
Note 7-Accounts Payable and Accrued Expenses
The significant components of accounts payable and accrued expenses on the government-wide statement of net position at June 30, 2016, consisted of the following:
Governmental Activities:Accounts Payable 943,899$
Accrued Salaries, Fringe, and Benefits 2,877,179
Accrued Expenses 111,250
Total Accounts Payable and Accrued Expenses - Governmental Activities 3,932,328$
Note 8-Short-Term Obligations
The following is a summary of the changes in the District’s short-term obligations for 2016:
Beginning Ending
Governmental Activities: Balance Additions Reductions Balance
Tax Anticipation Note, 2015B -$ 2,499,000 2,499,000 -$
General Obligation Bond, Series 2015B - 1,919,000 1,919,000 -
Total Governmental Activities -$ 4,418,000 4,418,000 -$
The District issued a short-term Tax Anticipation Note (“TAN”) in August 2015 for $2,499,000. This TAN was issued to maintain a steady flow of cash until property taxes were received. The District repaid the TAN in March 2016 with interest of approximately $17,000.
57
YORK SCHOOL DISTRICT ONE YORK, SOUTH CAROLINA
NOTES TO THE FINANCIAL STATEMENTS
YEAR ENDED JUNE 30, 2016
Note 8-Short-Term Obligations (Continued) The District issued a short-term General Obligation Bond (“Bond”) in September 2015 for $1,919,000. This bond was issued to make a payment on the equipment capital lease and for various capital improvements throughout the District. The District repaid the Bond in March 2016 with interest of approximately $17,000.
Note 9-Long-Term Obligations
Long-term obligations consist of general obligation bonds (including bond premiums), capital leases, and the liability for compensated absences. Principal and interest payments on the District’s bonded debt are secured solely by ad valorem property taxes. Payments for the general obligation bonds are funded and recorded in the Debt Service Fund. Resources from the General Fund have been used to fund the capital lease and compensated absence liabilities.
On May 15, 2007, voters of the District approved a referendum authorizing the issuance of general obligation bonds in an amount not to exceed $85,000,000, the proceeds of which will be used for the purpose of paying the capital costs for the following projects (collectively known as the “Referendum Projects”): (i) the construction of a new high school and technology center, and (ii) the construction of additions, renovations, and safety and security upgrades and improvements needed to enhance the general conditions and adequacy of existing facilities, including the conversion of an existing middle school to an additional elementary school, the conversion of the existing high school to a junior high school, and additional renovations to the alternative school and three elementary schools.
The uses of the proceeds of the general obligation bonds (“GOB”) and capital lease issued by the District and outstanding at year end are as follows:
In March 2009, the District entered into a Capital Lease in the amount of $11,206,000 for the purchase of HVAC equipment for the new York Comprehensive High School and Technology Center. During fiscal year 2013, the District paid an immaterial fee and was able to reduce the interest rate from 4.68% to 1.85%.
In September 2009, the District issued $50,000,000 in General Obligation Bonds, maturing in March 2028. This issue was used to repay the $50,000,000 General Obligation Bond Anticipation Notes that were issued in September 2008. A portion of this debt was advanced refunded in January 2016.
In April 2012, the District issued $3,000,000 in General Obligation Qualified Zone Academy Bonds for technology and capital improvements.
In March 2015, the District issued $32,405,000 in General Obligation Refunding Bonds to refund all of the remaining principal amount of the Build America Bonds, 2009.
In January 2016, the District issued its Series 2016A General Obligation Advanced Refunding Bonds (“Series 2016A GORB”) in the amount of $45,380,000 (par value), receiving a premium of approximately $9,890,000, to provide funds to advance refund a portion of the outstanding Series 2009A GOB in the amount of $49,385,000. The portion of the 2009A GOB not defeased was $415,000, for which the District will make annual payments through March 2019. As a result of the refunding, the Series 2009A GOB (excluding the portion not defeased) are considered to be defeased until redemption in March 2016. Accordingly, the liability for the Series 2009A GOB has been removed from the governmental activities column in the Statement of Net Position, with the exception of the non-defeased portion. The District incurred approximately $437,000 in issuance costs associated with the new debt. The reacquisition price exceeded the net carrying amount of the old debt by approximately $2,470,000. This amount will be recognized as an expense on the government wide financial statements in 2016 due to immateriality. This refunding was undertaken to take advantage of lower interest rates, with a reduction in the effective interest rate from 4.15% to 1.93%. The refunding also reduced total debt service payments over the next 12 years by approximately $6,534,000 and resulted in an economic gain of approximately $5,736,000.
58
YORK SCHOOL DISTRICT ONE YORK, SOUTH CAROLINA
NOTES TO THE FINANCIAL STATEMENTS
YEAR ENDED JUNE 30, 2016
Note 9-Long-Term Obligations (Continued) The District does not anticipate positive arbitrage on any of its indebtedness as of June 30, 2016.
Details of the District’s outstanding debt (which includes capital leases) at June 30, 2016 are comprised of the following issues:
Original Issue Date of Date of Interest OutstandingDescription of Issue Amount Issue Maturity Rate Balance
Gross Debt:Capital Lease, 2013 11,206,000$ 3/5/2009 12/1/2018 1.85% 8,852,000$ General Obligation Bond, 2009 50,000,000 9/4/2009 3/1/2028 3.0-5.25% 315,000 Qualified Zone Academy GOB, 2012 3,000,000 4/12/2012 3/1/2022 0.00% 3,000,000 General Obligation Refunding Bonds, 2015 32,405,000 3/18/2015 9/1/2032 3.25-4.00% 32,405,000 General Obligation Refunding Bonds, 2016 45,380,000 1/27/2016 3/1/2028 3.0-5.0% 45,380,000
Total Gross Debt 148,301,000$ 89,952,000$
The following table represents debt service requirements on all outstanding bond obligations through maturity for the governmental activities of the District as of June 30, 2016:
Year EndedJune 30, Principal Interest Total
2017 100,000$ 3,667,873 3,767,873$ 2018 105,000 3,460,113 3,565,113 2019 110,000 3,455,913 3,565,913 2020 3,620,000 3,451,513 7,071,513 2021 3,965,000 3,270,513 7,235,513
2022-2026 29,345,000 12,923,563 42,268,563 2027-2031 35,620,000 6,035,125 41,655,125
2032 8,235,000 329,400 8,564,400
Totals 81,100,000$ 36,594,010 117,694,010$
Bonds Payable
The following table represents debt service requirements on all outstanding capital leases through maturity for the governmental activities of the District as of June 30, 2016:
Year Ended
June 30, Principal Interest Total
2017 2,546,000$ 163,762 2,709,762$
2018 3,009,000 116,661 3,125,661
2019 3,297,000 60,995 3,357,995
Totals 8,852,000$ 341,418 9,193,418$
Capital Leases Payable
59
YORK SCHOOL DISTRICT ONE YORK, SOUTH CAROLINA
NOTES TO THE FINANCIAL STATEMENTS
YEAR ENDED JUNE 30, 2016
Note 9-Long-Term Obligations (Continued)
Section 15 of Article X of the South Carolina State Constitution allows Districts to incur a legal debt limit not to exceed 8% of the assessed value of all taxable property in the District, unless approved by a majority vote in a referendum authorized by law. At June 30, 2016, the District's assessed property valuation was approximately $101,488,000. The District had approximately $1,966,000 ($3,000,000 of the 2012 QZAB GOB less the funded debt service fund for the QZAB of approximately $1,034,000) of bonded debt subject to the 8% limit of approximately $8,119,000, resulting in unused legal debt margin of approximately $6,153,000.
A summary of changes in long-term obligations for the year ended June 30, 2016 is as follows:
Beginning Ending Due Within
Balance Additions Reductions Balance One Year
Gross Debt:
49,800,000$ - 49,485,000 315,000 100,000$
9,604,000 - 752,000 8,852,000 2,546,000
1,615,000 - 1,615,000 - -
3,000,000 - - 3,000,000 - 32,405,000 - - 32,405,000 -
GOB, 2009 Capital Lease, 2013 GORB, 2011 QZAB, 2012 GORB, 2015 GORB, 2016 - 45,380,000 - 45,380,000 -
Total Gross Debt 96,424,000 45,380,000 51,852,000 89,952,000 2,646,000
Plus (Less) Deferred Amounts:
Premium on GOB 2011 54,257 - 54,257 - -
Premium on GORB Series 2016 - 9,890,126 341,039 9,549,087 -
Premium on GOB Series 2009 3,123,691 - 3,123,691 - -
Premium on GORB Series 2015 2,822,968 - 168,536 2,654,432 -
Total Net Debt 102,424,916 55,270,126 55,539,523 102,155,518 2,646,000
Compensated Absences 284,307 194,674 203,532 275,449 204,000 Total Governmental Activities 102,709,223$ 55,464,800 55,743,056 102,430,967 2,850,000$
Note 10-Retirement Plan
A) Retirement Plan
The District participates in the State of South Carolina’s retirement plans, which are administered by theSouth Carolina Public Employee Benefit Authority (“PEBA”), which was created on July 1, 2012 andadministers the various retirement systems and retirement programs managed by its Retirement Division.PEBA has an 11-member Board of Directors (“PEBA Board”), appointed by the Governor and GeneralAssembly leadership, which serves as co-trustee and co-fiduciary of the systems and the trust funds. By law,the Budget and Control Board (State Fiscal Accountability Authority effective July 1, 2015), which consists offive elected officials, also reviews certain PEBA Board decisions regarding the funding of the South CarolinaRetirement Systems (“Systems”) and serves as a co-trustee of the Systems in conducting that review.
60
YORK SCHOOL DISTRICT ONE YORK, SOUTH CAROLINA
NOTES TO THE FINANCIAL STATEMENTS
YEAR ENDED JUNE 30, 2016
Note 10-Retirement Plan (Continued) A) Retirement Plan (Continued)
The PEBA issues a Comprehensive Annual Financial Report (“CAFR”) containing financial statements and required supplementary information for the System’ Pension Trust Funds. The CAFR is publicly available through the Retirement Benefits’ link on the PEBA’s website at www.peba.sc.gov, or a copy may be obtained by submitting a request to PEBA, PO Box 11960, Columbia, SC 29211-1960. The PEBA is considered a division of the primary government of the State of South Carolina and therefore, retirement trust fund financial information is also included in the comprehensive annual financial report of the state.
Plan Description
The South Carolina Retirement System (“SCRS”), a cost–sharing multiple-employer defined benefit pension plan, was established effective July 1, 1945, pursuant to the provisions of Section 9-1-20 of the South Carolina Code of Laws for the purpose of providing retirement allowances and other benefits for employees of the state, its public school districts, and political subdivisions. The State Optional Retirement Program (“ORP”) is a defined contribution plan that is offered as an alternative to certain newly hired state, public school, and higher education employees. State ORP participants direct the investment of their funds into a plan administered by one of four investment providers. The South Carolina Police Officers Retirement System (“PORS”), a cost–sharing multiple-employer defined benefit pension plan, was established effective July 1, 1962, pursuant to the provisions of Section 9-11-20 of the South Carolina Code of Laws for the purpose of providing retirement allowances and other benefits for police officers and firemen of the state and its political subdivisions.
Plan Membership Membership requirements are prescribed in Title 9 of the South Carolina Code of Laws. A brief summary of the requirements under each system is presented below.
SCRS - Generally, all employees of covered employers are required to participate in and contribute to the system as a condition of employment. This plan covers general employees and teachers and individuals newly elected to the South Carolina General Assembly beginning with the November 2012 general election. An employee member of the system with an effective date of membership prior to July 1, 2012, is a Class Two member. An employee member of the system with an effective date of membership on or after July 1, 2012, is a Class Three member.
State ORP - As an alternative to membership in SCRS, newly hired state, public school, and higher
education employees and individuals newly elected to the S.C. General Assembly beginning with the November 2012 general election have the option to participate in the State Optional Retirement Program (State ORP), which is a defined contribution plan. State ORP participants direct the investment of their funds into a plan administered by one of four investment providers. PEBA assumes no liability for State ORP benefits. Rather, the benefits are the liability of the investment providers. For this reason, State ORP programs are not considered part of the retirement systems for financial statement purposes. Employee and Employer contributions to the State ORP are at the same rates as SCRS. A direct remittance is required from the employers to the member’s account with investment providers for the employee contribution (8.16%) and a portion of the employer contribution (5%). A direct remittance is also required to SCRS for the remaining portion of the employer contribution (5.91%) and an incidental death benefit contribution (0.15%), if applicable, which is retained by SCRS.
61
YORK SCHOOL DISTRICT ONE YORK, SOUTH CAROLINA
NOTES TO THE FINANCIAL STATEMENTS
YEAR ENDED JUNE 30, 2016
Note 10-Retirement Plan (Continued) A) Retirement Plan (Continued)
Plan Membership (Continued)
PORS - To be eligible for PORS membership, an employee must be required by the terms of his
employment, by election or appointment, to preserve public order, protect life and property, and detect crimes in the state; to prevent and control property destruction by fire; or to serve as a peace officer employed by the Department of Corrections, the Department of Juvenile Justice, or the Department of Mental Health. Probate judges and coroners may elect membership in PORS. Magistrates are required to participate in PORS for service as a magistrate. PORS members, other than magistrates and probate judges, must also earn at least $2,000 per year and devote at least 1,600 hours per year to this work, unless exempted by statute. An employee member of the system with an effective date of membership prior to July 1, 2012, is a Class Two member. An employee member of the system with an effective date of membership on or after July 1, 2012, is a Class Three member.
Plan Benefits Benefit terms are prescribed in Title 9 of the South Carolina Code of Laws. PEBA does not have the authority to establish or amend benefit terms without a legislative change in the code of laws. Key elements of the benefit calculation include the benefit multiplier, years of service, and average final compensation. A brief summary of benefit terms for each system is presented below.
SCRS - A Class Two member who has separated from service with at least five or more years of
earned service is eligible for a monthly pension at age 65 or with 28 years credited service regardless of age. A member may elect early retirement with reduced pension benefits payable at age 55 with 25 years of service credit. A Class Three member who has separated from service with at least eight or more years of earned service is eligible for a monthly pension upon satisfying the Rule of 90 requirement that the total of the member’s age and the member’s creditable service equals at least 90 years. Both Class Two and Class Three members are eligible to receive a reduced deferred annuity at age 60 if they satisfy the five- or eight-year earned service requirement, respectively. An incidental death benefit is also available to beneficiaries of active and retired members of employers who participate in the death benefit program. The annual retirement allowance of eligible retirees or their surviving annuitants is increased by the lesser of one percent or five hundred dollars every July 1. Only those annuitants in receipt of a benefit on July 1 of the preceding year are eligible to receive the increase. Members who retire under the early retirement provisions at age 55 with 25 years of service are not eligible for the benefit adjustment until the second July 1 after reaching age 60 or the second July 1 after the date they would have had 28 years of service credit had they not retired.
62
YORK SCHOOL DISTRICT ONE YORK, SOUTH CAROLINA
NOTES TO THE FINANCIAL STATEMENTS
YEAR ENDED JUNE 30, 2016
Note 10-Retirement Plan (Continued) A) Retirement Plan (Continued)
Plan Benefits (Continued)
PORS - A Class Two member who has separated from service with at least five or more years of
earned service is eligible for a monthly pension at age 55 or with 25 years of service regardless of age. A Class Three member who has separated from service with at least eight or more years of earned service is eligible for a monthly pension at age 55 or with 27 years of service regardless of age. Both Class Two and Class Three members are eligible to receive a deferred annuity at age 55 with five or eight years of earned service, respectively. An incidental death benefit is also available to beneficiaries of active and retired members of employers who participate in the death benefit program. Accidental death benefits are also provided upon the death of an active member working for a covered employer whose death was a natural and proximate result of an injury incurred while in the performance of duty.
The retirement allowance of eligible retirees or their surviving annuitants is increased by the lesser of one percent or five hundred dollars every July 1. Only those annuitants in receipt of a benefit on July 1 of the preceding year are eligible to receive the increase.
Plan Contributions Contributions are prescribed in Title 9 of the South Carolina Code of Laws. Upon recommendation by the actuary in the annual actuarial valuation, the PEBA Board may adopt and present to the Budget and Control Board for approval an increase in the SCRS and PORS employer and employee contribution rates, but any such increase may not result in a differential between the employee and total employer contribution rate that exceeds 2.9 percent of earnable compensation for the SCRS and 5 percent for the PORS. An increase in the contribution rates adopted by the PEBA Board may not provide for an increase of more than one-half of one percent in any one year. If the scheduled employee and employer contributions provided in statute or the rates last adopted by the PEBA Board are insufficient to maintain a thirty year amortization schedule of the unfunded liabilities of the plans, the PEBA Board shall increase the contribution rates in equal percentage amounts for the employer and employee as necessary to maintain the thirty-year amortization period; and, this increase is not limited to one-half of one percent per year.
63

YORK SCHOOL DISTRICT ONE YORK, SOUTH CAROLINA
NOTES TO THE FINANCIAL STATEMENTS
YEAR ENDED JUNE 30, 2016
Note 10-Retirement Plan (Continued) A) Retirement Plan (Continued)
Plan Contributions (Continued) As noted earlier, both employees and the District are required to contribute to the Plans at rates established and as amended by the PEBA. The District’s contributions are actuarially determined but are communicated to and paid by the District as a percentage of the employees’ annual eligible compensation as follows for the past three years: Required employer and employee contribution rates for the past three years were as follows:
2014 2015 2016 2014 2015 2016
Employer Rate:^
Retirement * 10.45% 10.75% 10.91% 12.44% 13.01% 13.34%
Incidental Death Benefit 0.15% 0.15% 0.15% 0.20% 0.20% 0.20%
Accidental Death Contributions 0.00% 0.00% 0.00% 0.20% 0.20% 0.20%
10.60% 10.90% 11.06% 12.84% 13.41% 13.74%
Employee Rate 7.50% 8.00% 8.16% 7.84% 8.41% 8.74%
SCRS and State ORP Rates PORS Rates
* Of the rate for the State ORP Plan, 5% of earnable compensation must be remitted by the employer directly to the ORPvendor to be allocated to the member's account w ith the remainder of the employer contribution remitted to the SCRS.
^ Calculated on earnable compensation as defined in Title 9 of the South Carolina Code of Law s.
The required contributions and percentages of amounts contributed by the District to the Plans for the past three years were as follows:
Required % Contributed Required % Contributed Required % Contributed
2016 3,007,647$ 100% 157,707 100% -$ 100%2015 2,946,503 100% 125,036 100% - 100%2014 2,837,302$ 100% 107,648 100% 58$ 100%
SCRS Contributions PORS ContributionsYear Ended June 30,
State ORP Contributions
Eligible payrolls of the District covered under the Plans for the past three years were as follows:
TotalSCRS Payroll State ORP Payroll PORS Payroll Payroll
2016 27,193,914$ 2,602,430 - 29,796,344$ 2015 27,032,135 2,119,252 - 29,151,387 2014 26,767,002$ 1,922,288 451 28,689,741$
Year Ended June 30,
64

YORK SCHOOL DISTRICT ONE YORK, SOUTH CAROLINA
NOTES TO THE FINANCIAL STATEMENTS
YEAR ENDED JUNE 30, 2016
Note 10-Retirement Plan (Continued) A) Retirement Plan (Continued)
Actuarial Assumptions and Methods
Actuarial valuations involve estimates of the reported amounts and assumptions about the probability of occurrence of events far into the future. Examples include assumptions about future employment, mortality, and future salary increases. Actuarial assumptions and methods used during the annual valuation process are subject to periodic revision, typically with an experience study, as actual results over an extended period of time are compared with past expectations and new estimates are made about the future. South Carolina state statute requires than an actuarial experience study be completed at least once in each five-year period. The last experience study was performed on data through June 30, 2010, and the next experience study, performed on data through June 30, 2015, is currently underway. The June 30, 2015 total pension liability, net pension liability, and sensitivity information were determined by the PEBA’s consulting actuary, Gabriel, Roeder, Smith and Company (“GRS”) and are based on the July 1, 2014 actuarial valuations as adopted by the PEBA Board and Budget and Control Board which utilized membership data as of July 1, 2014. The total pension liability was rolled-forward from the valuation date to the plan’s fiscal year ended June 30, 2015 using generally accepted actuarial principles. Information included in the following schedules is based on the certification provided by GRS. The following table provides a summary of the actuarial assumptions and methods used in the July 1, 2014, valuations for the SCRS and PORS.
SCRS PORS
Actuarial Cost Method Entry Age Normal Entry Age NormalActuarial Assumptions:
Investment Rate of Return* 7.50% 7.50%Projected Salary Increases* 3.5% to 12.5% (varies by service) 4.0% to 10.0% (varies by service)Benefit Adjustments Lesser of 1% or $500 annually Lesser of 1% or $500 annually
* Includes inflation at 2.75%.
The post-retiree mortality assumption is dependent upon the member’s job category and gender. This assumption includes base rates which are automatically adjusted for future improvement in mortality using published Scale AA projected from the year 2000. Assumptions used in the July 1, 2014 valuations for the SCRS and PORS are as follows:
Former Job Class Males Females
Educators
RP-2000 Males (with White Collar
adjustment) multiplied by 110%
RP-2000 Females (with White Collar
adjustment) multiplied by 95%
General Employees and Members of the General Assembly
RP-2000 Males multiplied by
100%
RP-2000 Females multiplied by 90%
Public Safety and Firefighters
RP-2000 Males (with Blue Collar adjustment) multiplied by 115%
RP-2000 Females (with Blue Collar adjustment) multiplied by 115%
65
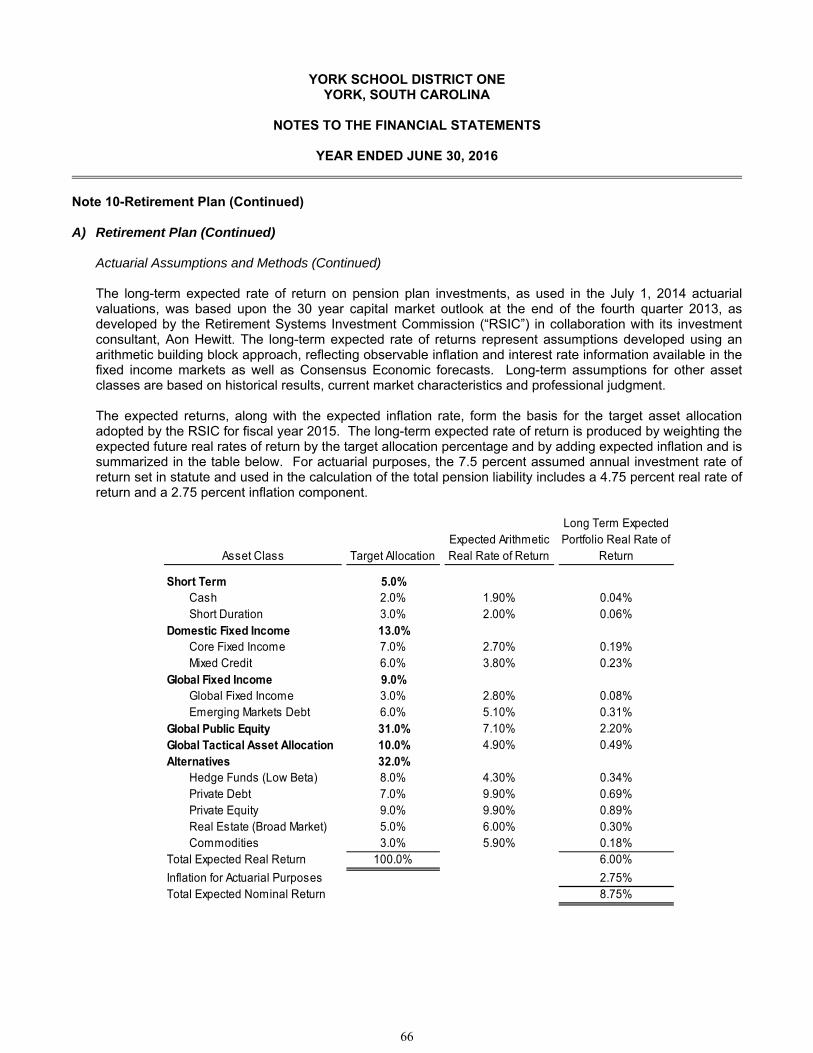
YORK SCHOOL DISTRICT ONE YORK, SOUTH CAROLINA
NOTES TO THE FINANCIAL STATEMENTS
YEAR ENDED JUNE 30, 2016
Note 10-Retirement Plan (Continued) A) Retirement Plan (Continued)
Actuarial Assumptions and Methods (Continued) The long-term expected rate of return on pension plan investments, as used in the July 1, 2014 actuarial valuations, was based upon the 30 year capital market outlook at the end of the fourth quarter 2013, as developed by the Retirement Systems Investment Commission (“RSIC”) in collaboration with its investment consultant, Aon Hewitt. The long-term expected rate of returns represent assumptions developed using an arithmetic building block approach, reflecting observable inflation and interest rate information available in the fixed income markets as well as Consensus Economic forecasts. Long-term assumptions for other asset classes are based on historical results, current market characteristics and professional judgment. The expected returns, along with the expected inflation rate, form the basis for the target asset allocation adopted by the RSIC for fiscal year 2015. The long-term expected rate of return is produced by weighting the expected future real rates of return by the target allocation percentage and by adding expected inflation and is summarized in the table below. For actuarial purposes, the 7.5 percent assumed annual investment rate of return set in statute and used in the calculation of the total pension liability includes a 4.75 percent real rate of return and a 2.75 percent inflation component.
Asset Class Target AllocationExpected Arithmetic Real Rate of Return
Long Term Expected Portfolio Real Rate of
Return
Short Term 5.0%Cash 2.0% 1.90% 0.04%Short Duration 3.0% 2.00% 0.06%
Domestic Fixed Income 13.0%Core Fixed Income 7.0% 2.70% 0.19%Mixed Credit 6.0% 3.80% 0.23%
Global Fixed Income 9.0%Global Fixed Income 3.0% 2.80% 0.08%Emerging Markets Debt 6.0% 5.10% 0.31%
Global Public Equity 31.0% 7.10% 2.20%Global Tactical Asset Allocation 10.0% 4.90% 0.49%Alternatives 32.0%
Hedge Funds (Low Beta) 8.0% 4.30% 0.34%Private Debt 7.0% 9.90% 0.69%Private Equity 9.0% 9.90% 0.89%Real Estate (Broad Market) 5.0% 6.00% 0.30%Commodities 3.0% 5.90% 0.18%
Total Expected Real Return 100.0% 6.00%
Inflation for Actuarial Purposes 2.75%Total Expected Nominal Return 8.75%
66
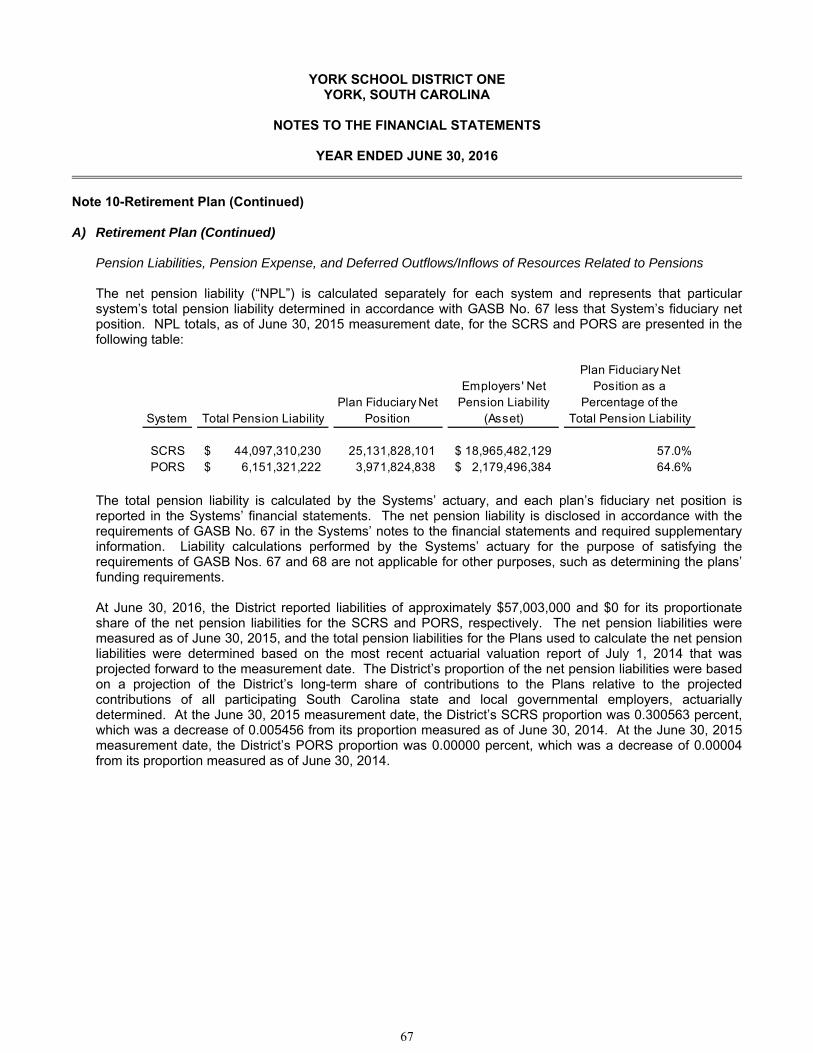
YORK SCHOOL DISTRICT ONE YORK, SOUTH CAROLINA
NOTES TO THE FINANCIAL STATEMENTS
YEAR ENDED JUNE 30, 2016
Note 10-Retirement Plan (Continued) A) Retirement Plan (Continued)
Pension Liabilities, Pension Expense, and Deferred Outflows/Inflows of Resources Related to Pensions
The net pension liability (“NPL”) is calculated separately for each system and represents that particular system’s total pension liability determined in accordance with GASB No. 67 less that System’s fiduciary net position. NPL totals, as of June 30, 2015 measurement date, for the SCRS and PORS are presented in the following table:
System Total Pension LiabilityPlan Fiduciary Net
Position
Employers' Net Pension Liability
(Asset)
Plan Fiduciary Net Position as a
Percentage of the Total Pension Liability
SCRS 44,097,310,230$ 25,131,828,101 18,965,482,129$ 57.0%PORS 6,151,321,222$ 3,971,824,838 2,179,496,384$ 64.6%
The total pension liability is calculated by the Systems’ actuary, and each plan’s fiduciary net position is reported in the Systems’ financial statements. The net pension liability is disclosed in accordance with the requirements of GASB No. 67 in the Systems’ notes to the financial statements and required supplementary information. Liability calculations performed by the Systems’ actuary for the purpose of satisfying the requirements of GASB Nos. 67 and 68 are not applicable for other purposes, such as determining the plans’ funding requirements.
At June 30, 2016, the District reported liabilities of approximately $57,003,000 and $0 for its proportionate share of the net pension liabilities for the SCRS and PORS, respectively. The net pension liabilities were measured as of June 30, 2015, and the total pension liabilities for the Plans used to calculate the net pension liabilities were determined based on the most recent actuarial valuation report of July 1, 2014 that was projected forward to the measurement date. The District’s proportion of the net pension liabilities were based on a projection of the District’s long-term share of contributions to the Plans relative to the projected contributions of all participating South Carolina state and local governmental employers, actuarially determined. At the June 30, 2015 measurement date, the District’s SCRS proportion was 0.300563 percent, which was a decrease of 0.005456 from its proportion measured as of June 30, 2014. At the June 30, 2015 measurement date, the District’s PORS proportion was 0.00000 percent, which was a decrease of 0.00004 from its proportion measured as of June 30, 2014.
67
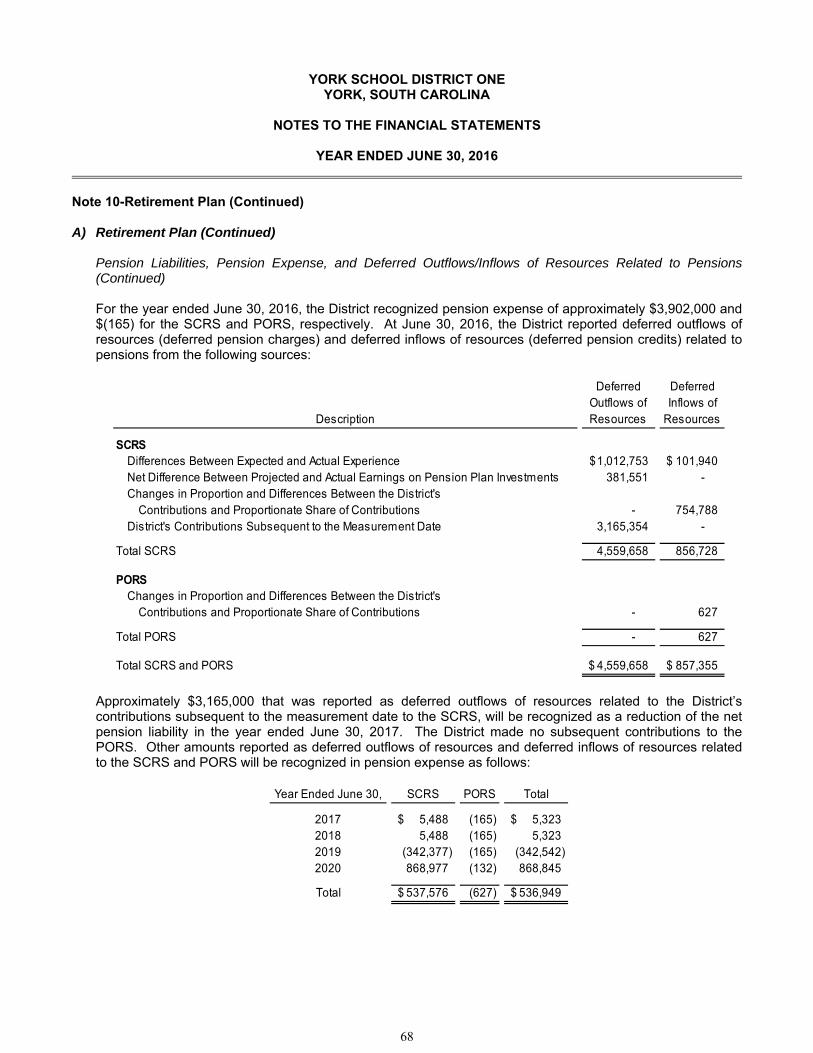
YORK SCHOOL DISTRICT ONE YORK, SOUTH CAROLINA
NOTES TO THE FINANCIAL STATEMENTS
YEAR ENDED JUNE 30, 2016
Note 10-Retirement Plan (Continued) A) Retirement Plan (Continued)
Pension Liabilities, Pension Expense, and Deferred Outflows/Inflows of Resources Related to Pensions (Continued) For the year ended June 30, 2016, the District recognized pension expense of approximately $3,902,000 and $(165) for the SCRS and PORS, respectively. At June 30, 2016, the District reported deferred outflows of resources (deferred pension charges) and deferred inflows of resources (deferred pension credits) related to pensions from the following sources:
Description
Deferred Outflows of Resources
Deferred Inflows of
Resources
SCRSDifferences Between Expected and Actual Experience 1,012,753$ 101,940$ Net Difference Between Projected and Actual Earnings on Pension Plan Investments 381,551 - Changes in Proportion and Differences Between the District's
Contributions and Proportionate Share of Contributions - 754,788 District's Contributions Subsequent to the Measurement Date 3,165,354 -
Total SCRS 4,559,658 856,728
PORSChanges in Proportion and Differences Between the District's
Contributions and Proportionate Share of Contributions - 627
Total PORS - 627
Total SCRS and PORS 4,559,658$ 857,355$
Approximately $3,165,000 that was reported as deferred outflows of resources related to the District’s contributions subsequent to the measurement date to the SCRS, will be recognized as a reduction of the net pension liability in the year ended June 30, 2017. The District made no subsequent contributions to the PORS. Other amounts reported as deferred outflows of resources and deferred inflows of resources related to the SCRS and PORS will be recognized in pension expense as follows:
Year Ended June 30, SCRS PORS Total
2017 5,488$ (165) 5,323$ 2018 5,488 (165) 5,323 2019 (342,377) (165) (342,542) 2020 868,977 (132) 868,845
Total 537,576$ (627) 536,949$
68
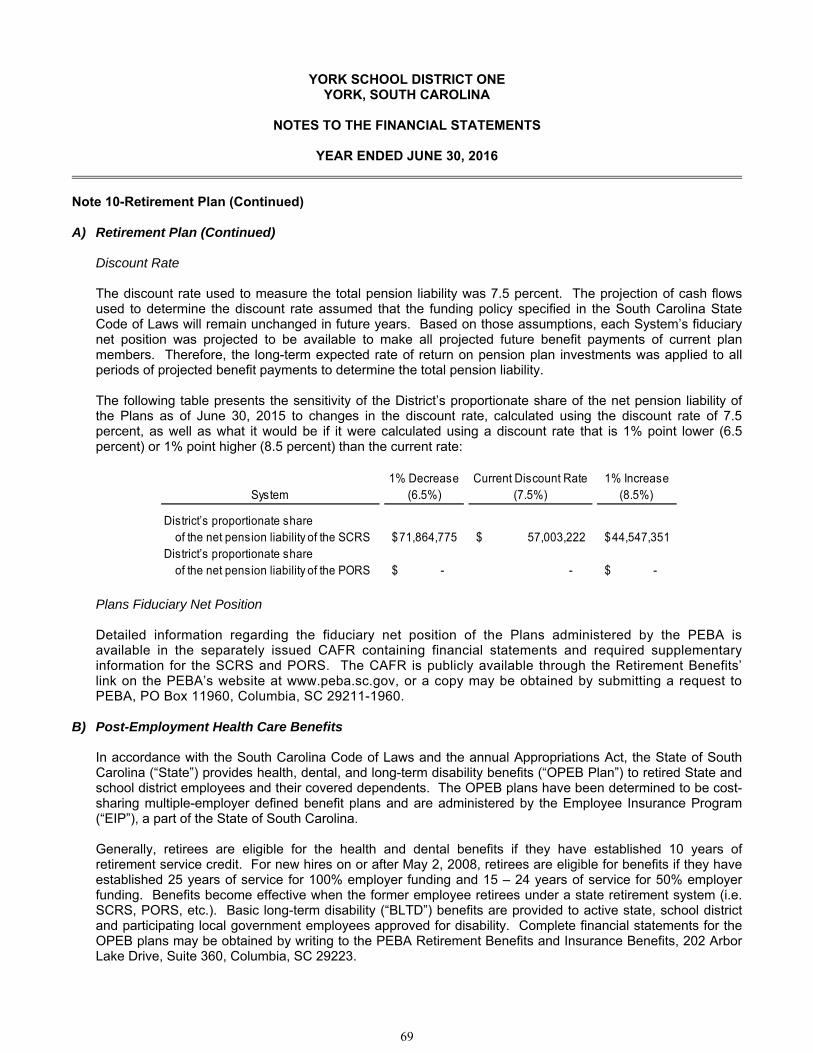
YORK SCHOOL DISTRICT ONE YORK, SOUTH CAROLINA
NOTES TO THE FINANCIAL STATEMENTS
YEAR ENDED JUNE 30, 2016
Note 10-Retirement Plan (Continued)
A) Retirement Plan (Continued)
Discount Rate
The discount rate used to measure the total pension liability was 7.5 percent. The projection of cash flowsused to determine the discount rate assumed that the funding policy specified in the South Carolina StateCode of Laws will remain unchanged in future years. Based on those assumptions, each System’s fiduciarynet position was projected to be available to make all projected future benefit payments of current planmembers. Therefore, the long-term expected rate of return on pension plan investments was applied to allperiods of projected benefit payments to determine the total pension liability.
The following table presents the sensitivity of the District’s proportionate share of the net pension liability ofthe Plans as of June 30, 2015 to changes in the discount rate, calculated using the discount rate of 7.5percent, as well as what it would be if it were calculated using a discount rate that is 1% point lower (6.5percent) or 1% point higher (8.5 percent) than the current rate:
1% Decrease Current Discount Rate 1% IncreaseSystem (6.5%) (7.5%) (8.5%)
District’s proportionate share of the net pension liability of the SCRS 71,864,775$ 57,003,222$ 44,547,351$
District’s proportionate share of the net pension liability of the PORS -$ - -$
Plans Fiduciary Net Position
Detailed information regarding the fiduciary net position of the Plans administered by the PEBA isavailable in the separately issued CAFR containing financial statements and required supplementary information for the SCRS and PORS. The CAFR is publicly available through the Retirement Benefits’link on the PEBA’s website at www.peba.sc.gov, or a copy may be obtained by submitting a request toPEBA, PO Box 11960, Columbia, SC 29211-1960.
B) Post-Employment Health Care Benefits
In accordance with the South Carolina Code of Laws and the annual Appropriations Act, the State of SouthCarolina (“State”) provides health, dental, and long-term disability benefits (“OPEB Plan”) to retired State andschool district employees and their covered dependents. The OPEB plans have been determined to be cost-sharing multiple-employer defined benefit plans and are administered by the Employee Insurance Program(“EIP”), a part of the State of South Carolina.
Generally, retirees are eligible for the health and dental benefits if they have established 10 years ofretirement service credit. For new hires on or after May 2, 2008, retirees are eligible for benefits if they haveestablished 25 years of service for 100% employer funding and 15 – 24 years of service for 50% employerfunding. Benefits become effective when the former employee retirees under a state retirement system (i.e.SCRS, PORS, etc.). Basic long-term disability (“BLTD”) benefits are provided to active state, school districtand participating local government employees approved for disability. Complete financial statements for theOPEB plans may be obtained by writing to the PEBA Retirement Benefits and Insurance Benefits, 202 ArborLake Drive, Suite 360, Columbia, SC 29223.
69
YORK SCHOOL DISTRICT ONE YORK, SOUTH CAROLINA
NOTES TO THE FINANCIAL STATEMENTS
YEAR ENDED JUNE 30, 2016
Note 10-Retirement Plan (Continued)
B) Post-Employment Health Care Benefits (Continued)
The Code of Laws of the State, as amended, requires these post-employment healthcare and long-termdisability benefits be funded through annual appropriation by the General Assembly for active employees tothe EIP and participating retirees to the State of South Carolina except for the portion funded through the pension surcharge (retiree surcharge) who are not funded by State General Fund appropriations. Employers participating in the healthcare plan are mandated by State statute to contribute at a rate assessed each year by the Office of the State Budget. The EIP sets the employer contribution rate based on a pay-as-you-gobasis. The District has no liability beyond the payment of monthly contributions.
The required employer contribution surcharge percentages were 5.33%, 5.00%, and 4.92% for the years ended June 30, 2016, 2015, and 2014, respectively. The actual required employer contribution surchargeamounts were approximately $1,588,000, $1,457,000, and $1,412,000 for the years ended June 30, 2016,2015, and 2014, respectively. The actual contribution rates and amounts were 100% of the required employer contribution surcharge percentages and amounts for the OPEB Plan for all years presented.
Note 11-Risk Management
The District is exposed to various risks of loss related to torts, theft of damage to, and destruction of assets,errors or omissions, injuries to employees, and natural disasters. The District has property and casualty insurance with Surry Insurance and workers compensation insurance with Arthur J. Gallagher & Co. Risk Management Services, Inc. Through Surry Insurance, the District maintains general liability protection of $1 million per occurrence, property coverage up to $220 million per occurrence, $5 million earthquake, $5 millionflood zone and $1 million newly acquired buildings, automobile coverage to $1 million per occurrence, school board legal liability of $1 million per occurrence and activity bus accidents coverage to $60,000 per occurrence.
The District pays annual premiums for its workers’ compensation and property liability insurance coverage based upon the total payroll of the school district for each plan year. The annual premiums paid for the fiscal year ended June 30, 2016, totaled approximately $214,000 for workers’ compensation and $156,000 for property coverage. The District maintains workers' compensation benefits coverage up to statutory limitsthrough the Arthur J. Gallagher. There have been no significant reductions in insurance coverage as compared to the previous year. Insurance settlements did not exceed insurance coverage for the years ended June 30, 2016, 2015, and 2014.
The District also participates in the State Health Plan through the South Carolina State Budget and Control Board Office of Insurance Services, a self-insured medical plan trust administered by the State Board. Through the Plan, permanent full time employees are eligible to receive health benefits up to a $1 million lifetime limit. In addition, employees have the option of receiving health care benefits through health maintenance organizations and insurance carriers.
Note 12-Contigencies
There is a significant tax payer in the District that is currently appealing their assessed values. The South Carolina Department of Revenue had an outside appraiser value the taxpayer’s current assessed value. At this time the final outcome has not been determined thus the District has not accrued a liability.
70
YORK SCHOOL DISTRICT ONE YORK, SOUTH CAROLINA
NOTES TO THE FINANCIAL STATEMENTS
YEAR ENDED JUNE 30, 2016
Note 13-Subsequent Events
A) Debt Issuance – Subsequent to June 30, 2016, the District issued approximately $3.9 million in General Obligation Bonds at a coupon rate of 2.00%. The bonds are scheduled to mature in March 2017. These bonds will be used for capital improvements in the District related to the capital improvement plan and to make payments on the capital lease.
B) Millage Increase – The Board of Trustees approved a 2.5 mill increase (increased to 184.6 mills from 182.1 mills) for the 2017 property tax year for the District’s general operations of the District.
71

72

REQUIRED SUPPLEMENTARY INFORMATION
73
York School District One York, South Carolina
Comprehensive Annual Financial Report
General Fund
The General Fund, a major fund and a budgeted fund, is the general operating fund of the District and accounts for all revenues and expenditures of the District except those required to be accounted for in another fund. All general tax revenues and other receipts that (a) are not allocated by law or contractual agreement to other funds or (b) that have not been restricted, committed, or assigned to other funds are accounted for in the General Fund. General operating expenditures and the capital improvement costs that are not paid through other funds are paid from the General Fund.
74
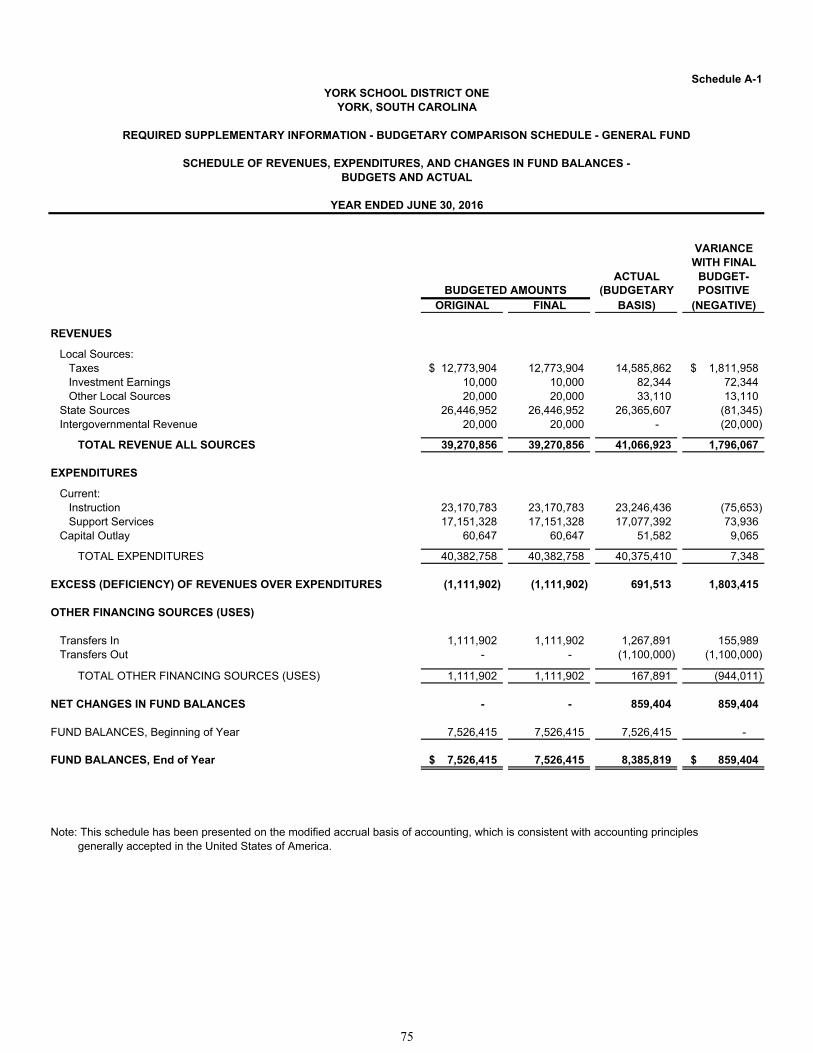
Schedule A-1
VARIANCEWITH FINAL
ACTUAL BUDGET-(BUDGETARY POSITIVE
ORIGINAL FINAL BASIS) (NEGATIVE)
REVENUES
Local Sources:Taxes 12,773,904$ 12,773,904 14,585,862 1,811,958$ Investment Earnings 10,000 10,000 82,344 72,344 Other Local Sources 20,000 20,000 33,110 13,110
State Sources 26,446,952 26,446,952 26,365,607 (81,345) Intergovernmental Revenue 20,000 20,000 - (20,000)
TOTAL REVENUE ALL SOURCES 39,270,856 39,270,856 41,066,923 1,796,067
EXPENDITURES
Current:Instruction 23,170,783 23,170,783 23,246,436 (75,653) Support Services 17,151,328 17,151,328 17,077,392 73,936
Capital Outlay 60,647 60,647 51,582 9,065
TOTAL EXPENDITURES 40,382,758 40,382,758 40,375,410 7,348
EXCESS (DEFICIENCY) OF REVENUES OVER EXPENDITURES (1,111,902) (1,111,902) 691,513 1,803,415
OTHER FINANCING SOURCES (USES)
Transfers In 1,111,902 1,111,902 1,267,891 155,989 Transfers Out - - (1,100,000) (1,100,000)
TOTAL OTHER FINANCING SOURCES (USES) 1,111,902 1,111,902 167,891 (944,011)
NET CHANGES IN FUND BALANCES - - 859,404 859,404
FUND BALANCES, Beginning of Year 7,526,415 7,526,415 7,526,415 -
FUND BALANCES, End of Year 7,526,415$ 7,526,415 8,385,819 859,404$
Note: This schedule has been presented on the modified accrual basis of accounting, which is consistent with accounting principlesgenerally accepted in the United States of America.
BUDGETED AMOUNTS
YORK SCHOOL DISTRICT ONE
REQUIRED SUPPLEMENTARY INFORMATION - BUDGETARY COMPARISON SCHEDULE - GENERAL FUND
SCHEDULE OF REVENUES, EXPENDITURES, AND CHANGES IN FUND BALANCES -BUDGETS AND ACTUAL
YEAR ENDED JUNE 30, 2016
YORK, SOUTH CAROLINA
75
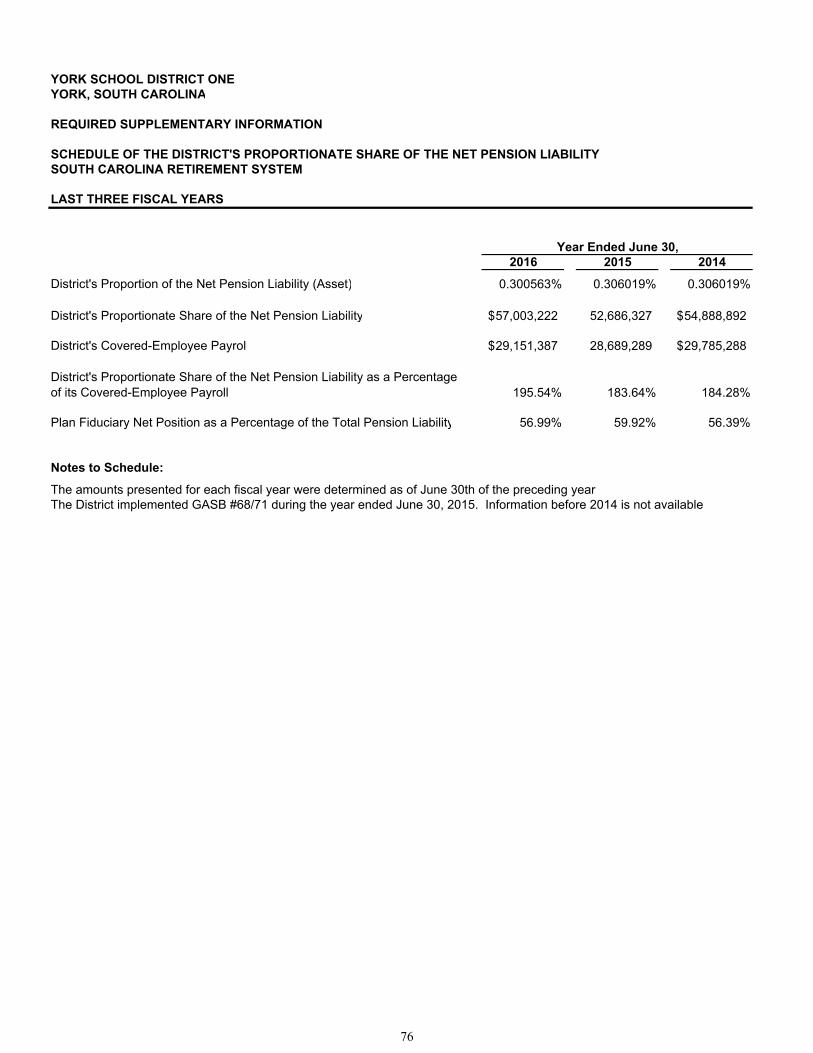
YORK SCHOOL DISTRICT ONEYORK, SOUTH CAROLINA
REQUIRED SUPPLEMENTARY INFORMATION
SCHEDULE OF THE DISTRICT'S PROPORTIONATE SHARE OF THE NET PENSION LIABILITY SOUTH CAROLINA RETIREMENT SYSTEM
LAST THREE FISCAL YEARS
2016 2015 2014
District's Proportion of the Net Pension Liability (Asset) 0.300563% 0.306019% 0.306019%
District's Proportionate Share of the Net Pension Liability 57,003,222$ 52,686,327 54,888,892$
District's Covered-Employee Payroll 29,151,387$ 28,689,289 29,785,288$
District's Proportionate Share of the Net Pension Liability as a Percentage of its Covered-Employee Payroll 195.54% 183.64% 184.28%
Plan Fiduciary Net Position as a Percentage of the Total Pension Liability 56.99% 59.92% 56.39%
Notes to Schedule:
The amounts presented for each fiscal year were determined as of June 30th of the preceding year.The District implemented GASB #68/71 during the year ended June 30, 2015. Information before 2014 is not available
Year Ended June 30,
76
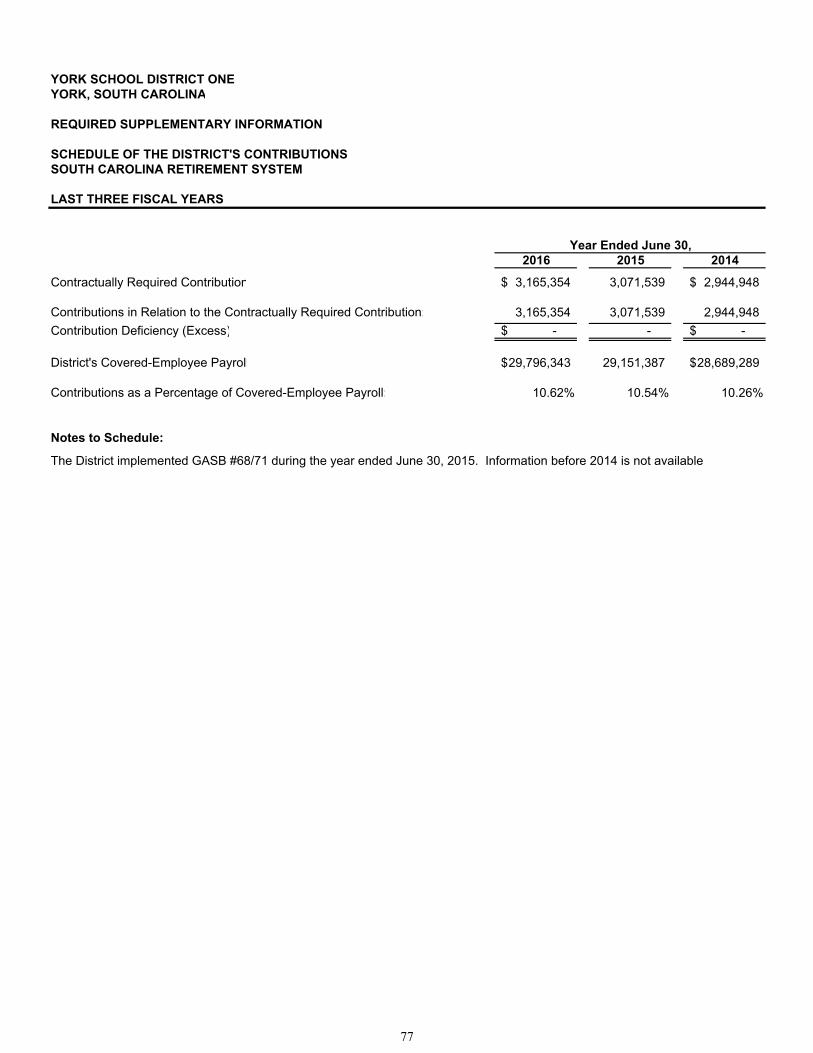
YORK SCHOOL DISTRICT ONEYORK, SOUTH CAROLINA
REQUIRED SUPPLEMENTARY INFORMATION
SCHEDULE OF THE DISTRICT'S CONTRIBUTIONS SOUTH CAROLINA RETIREMENT SYSTEM
LAST THREE FISCAL YEARS
2016 2015 2014
Contractually Required Contribution 3,165,354$ 3,071,539 2,944,948$
Contributions in Relation to the Contractually Required Contribution: 3,165,354 3,071,539 2,944,948
Contribution Deficiency (Excess) -$ - -$
District's Covered-Employee Payroll 29,796,343$ 29,151,387 28,689,289$
Contributions as a Percentage of Covered-Employee Payroll: 10.62% 10.54% 10.26%
Notes to Schedule:
The District implemented GASB #68/71 during the year ended June 30, 2015. Information before 2014 is not available
Year Ended June 30,
77

YORK SCHOOL DISTRICT ONEYORK, SOUTH CAROLINA
REQUIRED SUPPLEMENTARY INFORMATION
SCHEDULE OF THE DISTRICT'S PROPORTIONATE SHARE OF THE NET PENSION LIABILITY POLICE OFFICERS RETIREMENT SYSTEM
LAST THREE FISCAL YEARS
2016 2015 2014
District's Proportion of the Net Pension Liability (Asset) 0.00000% 0.00004% 0.00004%
District's Proportionate Share of the Net Pension Liability -$ 727 788$
District's Covered-Employee Payroll -$ 451 26,658$
District's Proportionate Share of the Net Pension Liability as a Percentage of its Covered-Employee Payroll 0.00% 161.03% 2.96%
Plan Fiduciary Net Position as a Percentage of the Total Pension Liability 64.57% 67.55% 62.98%
Notes to Schedule:
The amounts presented for each fiscal year were determined as of June 30th of the preceding year.The District implemented GASB #68/71 during the year ended June 30, 2015. Information before 2014 is not available
Year Ended June 30,
78

YORK SCHOOL DISTRICT ONEYORK, SOUTH CAROLINA
REQUIRED SUPPLEMENTARY INFORMATION
SCHEDULE OF THE DISTRICT'S CONTRIBUTIONS POLICE OFFICERS RETIREMENT SYSTEM
LAST THREE FISCAL YEARS
2016 2015 2014
Contractually Required Contribution -$ - 58$
Contributions in Relation to the Contractually Required Contribution: - - 58
Contribution Deficiency (Excess) -$ - -$
District's Covered-Employee Payroll -$ - 451$
Contributions as a Percentage of Covered-Employee Payroll: 0.00% 0.00% 12.85%
Notes to Schedule:
The District implemented GASB #68/71 during the year ended June 30, 2015. Information before 2014 is not available
Year Ended June 30,
79

80
SUPPLEMENTARY INFORMATION
81

82

Schedule A-2
REVISEDBUDGET ACTUAL VARIANCE
REVENUES
1000 Revenues from Local Sources:1100 Taxes:
1110 Ad Valorem Taxes-Including Delinquent (Independent) 9,656,404$ 10,317,211 660,807$ 1140 Penalties & Interest on Taxes (Independent) - 899,102 899,102
1200 Revenue from Local Governmental Units Other than LEAs:1210 Ad Valorem Taxes-Including Delinquent (Dependent) 3,117,500 3,229,986 112,486 1240 Penalties & Interest on Taxes (Dependent) - 139,563 139,563
1500 Earnings on Investments:1510 Interest on Investments 10,000 82,344 72,344
1900 Other Revenue from Local Sources:1910 Rentals - 4,620 4,620 1999 Revenue from Other Local Sources 20,000 28,490 8,490
Total Revenue from Local Sources 12,803,904 14,701,316 1,897,412
2000 Intergovernmental Revenue:2100 Payments from Other Governmental Units 20,000 - (20,000)
Total Intergovernmental Revenue 20,000 - (20,000)
3000 Revenue from State Sources:3100 Restricted State Funding:
3130 Special Programs:3131 Handicapped Transportation - 1,248 1,248
3160 School Bus Driver's Salary (Includes Hazardous Condition Transportation) 320,156 330,480 10,324
3161 EAA Bus Driver Salary - 1,127 1,127 3162 Transportation Workers' Compensation - 28,114 28,114
3180 Fringe Benefits Employer Contributions (No Carryover Provision) 5,107,117 5,391,399 284,282
3181 Retiree Insurance (No Carryover Provision) 1,155,638 1,048,473 (107,165)
3300 Education Finance Act:3310 Full-Time Programs:
3311 Kindergarten 652,113 567,103 (85,010) 3312 Primary 1,630,108 1,691,900 61,792 3313 Elementary 2,962,513 2,797,460 (165,053) 3314 High School 1,219,359 1,295,744 76,385 3315 Trainable Mentally Handicapped 54,598 46,030 (8,568) 3316 Speech Handicapped (Part-Time Program) 765,800 737,814 (27,986) 3317 Homebound 11,147$ 7,255 (3,892)$
(Continued)
YORK SCHOOL DISTRICT ONEYORK, SOUTH CAROLINA
GENERAL FUND
SCHEDULE OF REVENUES, EXPENDITURES, AND CHANGES IN FUND BALANCES -REVISED BUDGET AND ACTUAL
YEAR ENDED JUNE 30, 2016
83
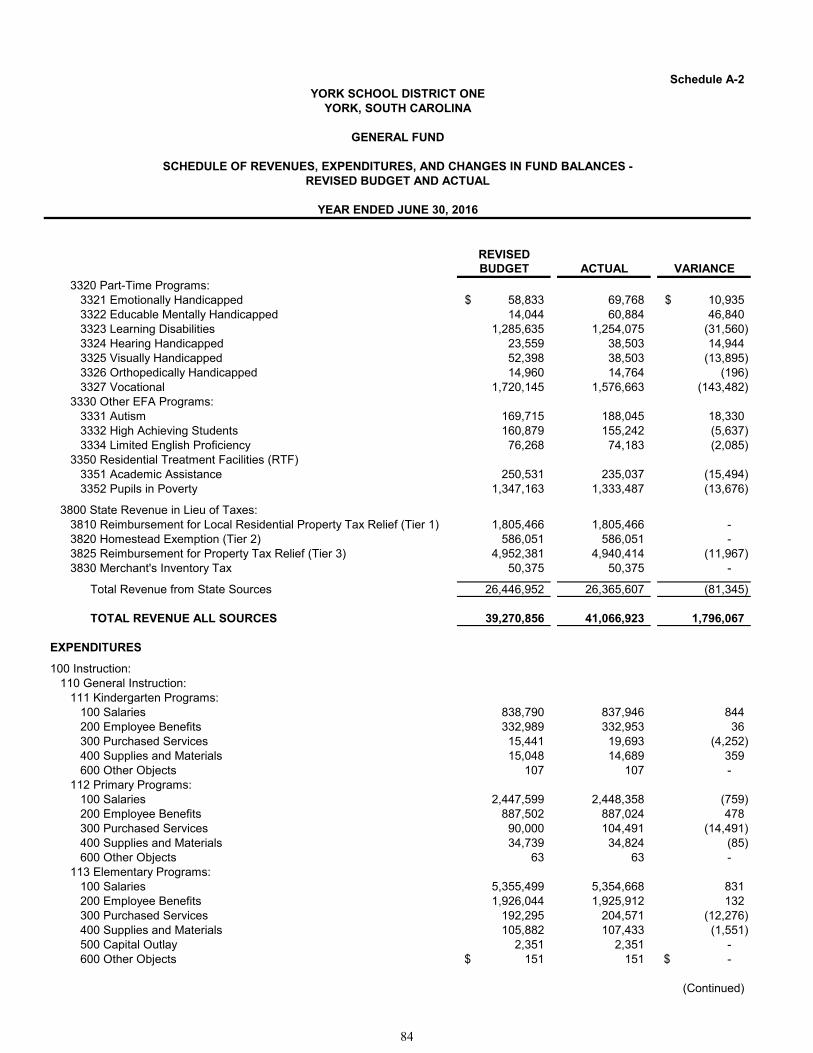
Schedule A-2
REVISEDBUDGET ACTUAL VARIANCE
YORK SCHOOL DISTRICT ONEYORK, SOUTH CAROLINA
GENERAL FUND
SCHEDULE OF REVENUES, EXPENDITURES, AND CHANGES IN FUND BALANCES -REVISED BUDGET AND ACTUAL
YEAR ENDED JUNE 30, 2016
3320 Part-Time Programs:3321 Emotionally Handicapped 58,833$ 69,768 10,935$ 3322 Educable Mentally Handicapped 14,044 60,884 46,840 3323 Learning Disabilities 1,285,635 1,254,075 (31,560) 3324 Hearing Handicapped 23,559 38,503 14,944 3325 Visually Handicapped 52,398 38,503 (13,895) 3326 Orthopedically Handicapped 14,960 14,764 (196) 3327 Vocational 1,720,145 1,576,663 (143,482)
3330 Other EFA Programs:3331 Autism 169,715 188,045 18,330 3332 High Achieving Students 160,879 155,242 (5,637) 3334 Limited English Proficiency 76,268 74,183 (2,085)
3350 Residential Treatment Facilities (RTF)3351 Academic Assistance 250,531 235,037 (15,494) 3352 Pupils in Poverty 1,347,163 1,333,487 (13,676)
3800 State Revenue in Lieu of Taxes:3810 Reimbursement for Local Residential Property Tax Relief (Tier 1) 1,805,466 1,805,466 - 3820 Homestead Exemption (Tier 2) 586,051 586,051 - 3825 Reimbursement for Property Tax Relief (Tier 3) 4,952,381 4,940,414 (11,967) 3830 Merchant's Inventory Tax 50,375 50,375 -
Total Revenue from State Sources 26,446,952 26,365,607 (81,345)
TOTAL REVENUE ALL SOURCES 39,270,856 41,066,923 1,796,067
EXPENDITURES
100 Instruction:110 General Instruction:
111 Kindergarten Programs:100 Salaries 838,790 837,946 844 200 Employee Benefits 332,989 332,953 36 300 Purchased Services 15,441 19,693 (4,252) 400 Supplies and Materials 15,048 14,689 359 600 Other Objects 107 107 -
112 Primary Programs:100 Salaries 2,447,599 2,448,358 (759) 200 Employee Benefits 887,502 887,024 478 300 Purchased Services 90,000 104,491 (14,491) 400 Supplies and Materials 34,739 34,824 (85) 600 Other Objects 63 63 -
113 Elementary Programs:100 Salaries 5,355,499 5,354,668 831 200 Employee Benefits 1,926,044 1,925,912 132 300 Purchased Services 192,295 204,571 (12,276) 400 Supplies and Materials 105,882 107,433 (1,551) 500 Capital Outlay 2,351 2,351 - 600 Other Objects 151$ 151 -$
(Continued)
84
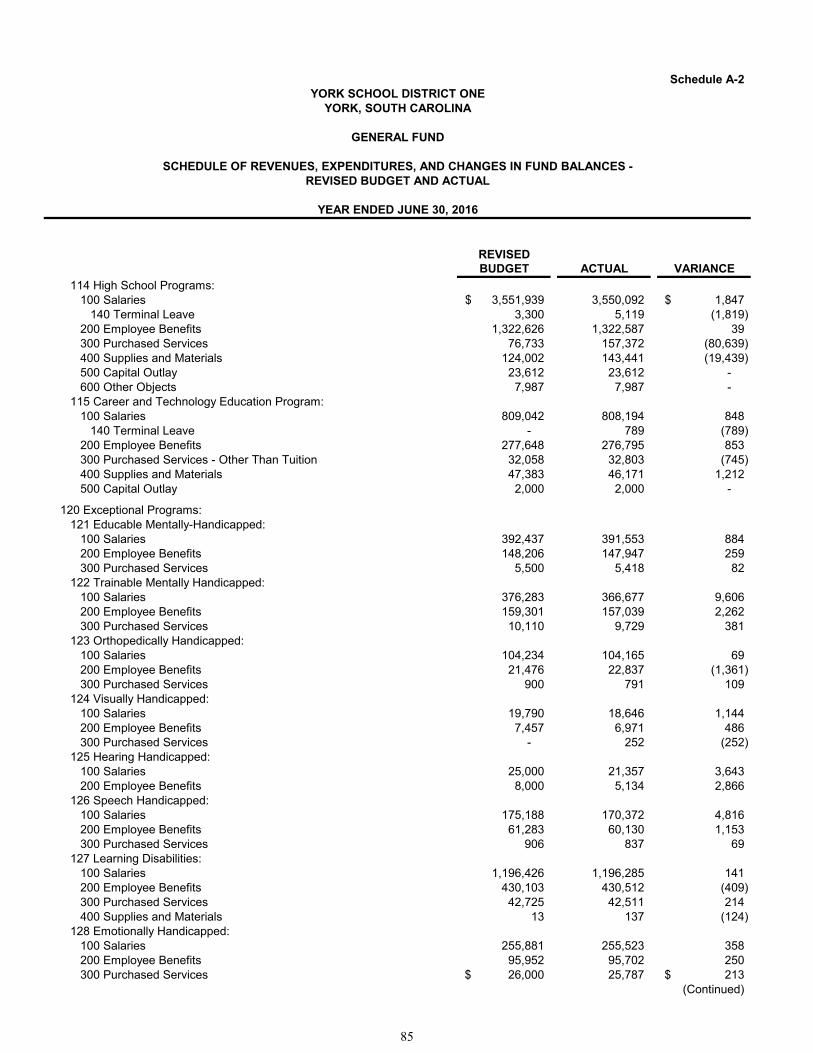
Schedule A-2
REVISEDBUDGET ACTUAL VARIANCE
YORK SCHOOL DISTRICT ONEYORK, SOUTH CAROLINA
GENERAL FUND
SCHEDULE OF REVENUES, EXPENDITURES, AND CHANGES IN FUND BALANCES -REVISED BUDGET AND ACTUAL
YEAR ENDED JUNE 30, 2016
114 High School Programs:100 Salaries 3,551,939$ 3,550,092 1,847$
140 Terminal Leave 3,300 5,119 (1,819) 200 Employee Benefits 1,322,626 1,322,587 39 300 Purchased Services 76,733 157,372 (80,639) 400 Supplies and Materials 124,002 143,441 (19,439) 500 Capital Outlay 23,612 23,612 - 600 Other Objects 7,987 7,987 -
115 Career and Technology Education Program:100 Salaries 809,042 808,194 848
140 Terminal Leave - 789 (789) 200 Employee Benefits 277,648 276,795 853 300 Purchased Services - Other Than Tuition 32,058 32,803 (745) 400 Supplies and Materials 47,383 46,171 1,212 500 Capital Outlay 2,000 2,000 -
120 Exceptional Programs:121 Educable Mentally-Handicapped:
100 Salaries 392,437 391,553 884 200 Employee Benefits 148,206 147,947 259 300 Purchased Services 5,500 5,418 82
122 Trainable Mentally Handicapped:100 Salaries 376,283 366,677 9,606 200 Employee Benefits 159,301 157,039 2,262 300 Purchased Services 10,110 9,729 381
123 Orthopedically Handicapped:100 Salaries 104,234 104,165 69 200 Employee Benefits 21,476 22,837 (1,361) 300 Purchased Services 900 791 109
124 Visually Handicapped:100 Salaries 19,790 18,646 1,144 200 Employee Benefits 7,457 6,971 486 300 Purchased Services - 252 (252)
125 Hearing Handicapped:100 Salaries 25,000 21,357 3,643 200 Employee Benefits 8,000 5,134 2,866
126 Speech Handicapped:100 Salaries 175,188 170,372 4,816 200 Employee Benefits 61,283 60,130 1,153 300 Purchased Services 906 837 69
127 Learning Disabilities:100 Salaries 1,196,426 1,196,285 141 200 Employee Benefits 430,103 430,512 (409) 300 Purchased Services 42,725 42,511 214 400 Supplies and Materials 13 137 (124)
128 Emotionally Handicapped:100 Salaries 255,881 255,523 358 200 Employee Benefits 95,952 95,702 250 300 Purchased Services 26,000$ 25,787 213$
(Continued)
85
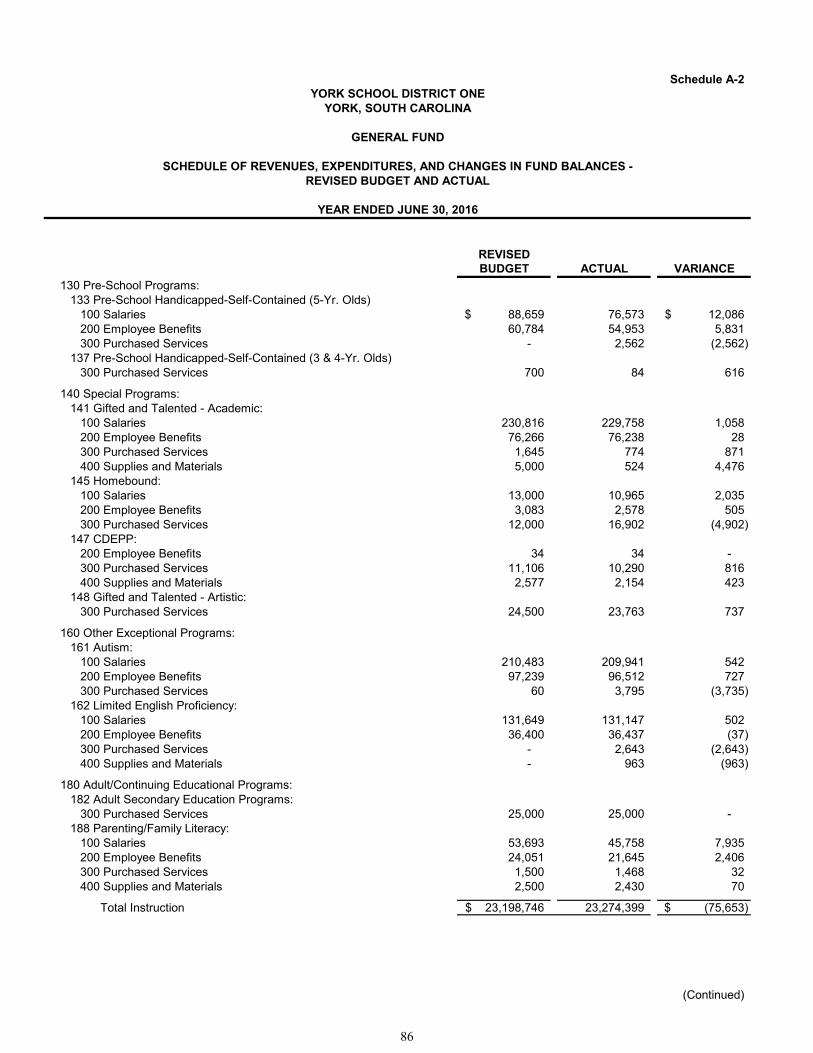
Schedule A-2
REVISEDBUDGET ACTUAL VARIANCE
YORK SCHOOL DISTRICT ONEYORK, SOUTH CAROLINA
GENERAL FUND
SCHEDULE OF REVENUES, EXPENDITURES, AND CHANGES IN FUND BALANCES -REVISED BUDGET AND ACTUAL
YEAR ENDED JUNE 30, 2016
130 Pre-School Programs:133 Pre-School Handicapped-Self-Contained (5-Yr. Olds)
100 Salaries 88,659$ 76,573 12,086$ 200 Employee Benefits 60,784 54,953 5,831 300 Purchased Services - 2,562 (2,562)
137 Pre-School Handicapped-Self-Contained (3 & 4-Yr. Olds)300 Purchased Services 700 84 616
140 Special Programs:141 Gifted and Talented - Academic:
100 Salaries 230,816 229,758 1,058 200 Employee Benefits 76,266 76,238 28 300 Purchased Services 1,645 774 871 400 Supplies and Materials 5,000 524 4,476
145 Homebound:100 Salaries 13,000 10,965 2,035 200 Employee Benefits 3,083 2,578 505 300 Purchased Services 12,000 16,902 (4,902)
147 CDEPP:200 Employee Benefits 34 34 - 300 Purchased Services 11,106 10,290 816 400 Supplies and Materials 2,577 2,154 423
148 Gifted and Talented - Artistic:300 Purchased Services 24,500 23,763 737
160 Other Exceptional Programs:161 Autism:
100 Salaries 210,483 209,941 542 200 Employee Benefits 97,239 96,512 727 300 Purchased Services 60 3,795 (3,735)
162 Limited English Proficiency:100 Salaries 131,649 131,147 502 200 Employee Benefits 36,400 36,437 (37) 300 Purchased Services - 2,643 (2,643) 400 Supplies and Materials - 963 (963)
180 Adult/Continuing Educational Programs:182 Adult Secondary Education Programs:
300 Purchased Services 25,000 25,000 - 188 Parenting/Family Literacy:
100 Salaries 53,693 45,758 7,935 200 Employee Benefits 24,051 21,645 2,406 300 Purchased Services 1,500 1,468 32 400 Supplies and Materials 2,500 2,430 70
Total Instruction 23,198,746$ 23,274,399 (75,653)$
(Continued)
86

Schedule A-2
REVISEDBUDGET ACTUAL VARIANCE
YORK SCHOOL DISTRICT ONEYORK, SOUTH CAROLINA
GENERAL FUND
SCHEDULE OF REVENUES, EXPENDITURES, AND CHANGES IN FUND BALANCES -REVISED BUDGET AND ACTUAL
YEAR ENDED JUNE 30, 2016
200 Support Services:210 Pupil Services:
211 Attendance and Social Work Services:100 Salaries 108,093$ 108,091 2$ 200 Employee Benefits 36,217 34,551 1,666 300 Purchased Services 3,004 3,004 - 400 Supplies and Materials 292 292 -
212 Guidance Services:100 Salaries 702,391 702,328 63 200 Employee Benefits 276,083 276,439 (356) 300 Purchased Services 563 835 (272) 400 Supplies and Materials 6,757 6,507 250
213 Health Services:100 Salaries 35,952 35,377 575 200 Employee Benefits 22,626 22,610 16 300 Purchased Services 1,365 1,365 - 400 Supplies and Materials 7,237 7,398 (161)
214 Psychological Services:100 Salaries 187,103 187,202 (99) 200 Employee Benefits 63,544 62,094 1,450 300 Purchased Services 2,383 7,625 (5,242) 400 Supplies and Materials 23 23 -
215 Exceptional Program Services:100 Salaries 35,360 35,354 6 200 Employee Benefits 15,283 15,248 35
220 Instructional Staff Services:221 Improvement of Instruction-Curriculum Development:
100 Salaries 536,572 535,245 1,327 140 Terminal Leave - 10,177 (10,177)
200 Employee Benefits 173,877 173,149 728 300 Purchased Services 20,895 27,798 (6,903) 400 Supplies and Materials 34,939 25,433 9,506
222 Library and Media Services:100 Salaries 540,145 539,590 555 200 Employee Benefits 204,782 204,758 24 300 Purchased Services 906 7,889 (6,983) 400 Supplies and Materials 61,073 59,967 1,106
223 Supervision of Special Programs:100 Salaries 26,264 26,411 (147) 200 Employee Benefits 14,268 14,442 (174)
224 Improvement of Instruction-Inservice and Staff Training:100 Salaries 13,000 12,433 567 200 Employee Benefits 8,000$ 7,966 34$
(Continued)
87
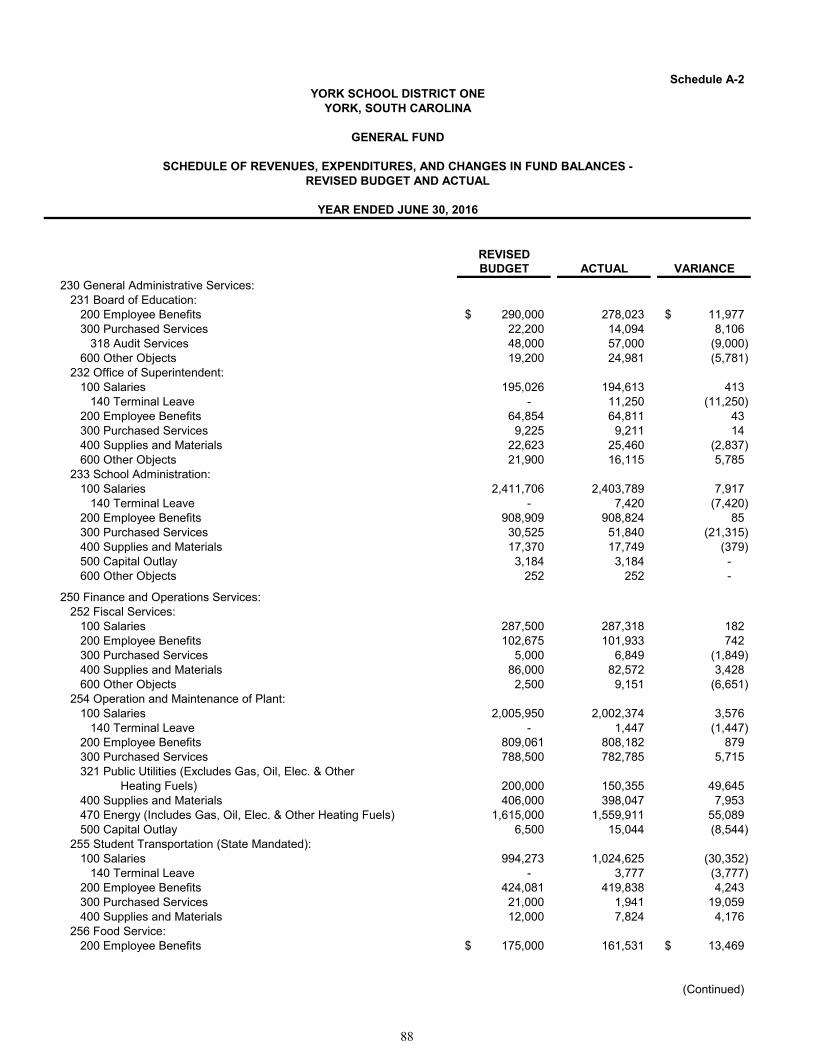
Schedule A-2
REVISEDBUDGET ACTUAL VARIANCE
YORK SCHOOL DISTRICT ONEYORK, SOUTH CAROLINA
GENERAL FUND
SCHEDULE OF REVENUES, EXPENDITURES, AND CHANGES IN FUND BALANCES -REVISED BUDGET AND ACTUAL
YEAR ENDED JUNE 30, 2016
230 General Administrative Services:231 Board of Education:
200 Employee Benefits 290,000$ 278,023 11,977$ 300 Purchased Services 22,200 14,094 8,106
318 Audit Services 48,000 57,000 (9,000) 600 Other Objects 19,200 24,981 (5,781)
232 Office of Superintendent:100 Salaries 195,026 194,613 413
140 Terminal Leave - 11,250 (11,250) 200 Employee Benefits 64,854 64,811 43 300 Purchased Services 9,225 9,211 14 400 Supplies and Materials 22,623 25,460 (2,837) 600 Other Objects 21,900 16,115 5,785
233 School Administration:100 Salaries 2,411,706 2,403,789 7,917
140 Terminal Leave - 7,420 (7,420) 200 Employee Benefits 908,909 908,824 85 300 Purchased Services 30,525 51,840 (21,315) 400 Supplies and Materials 17,370 17,749 (379) 500 Capital Outlay 3,184 3,184 - 600 Other Objects 252 252 -
250 Finance and Operations Services:252 Fiscal Services:
100 Salaries 287,500 287,318 182 200 Employee Benefits 102,675 101,933 742 300 Purchased Services 5,000 6,849 (1,849) 400 Supplies and Materials 86,000 82,572 3,428 600 Other Objects 2,500 9,151 (6,651)
254 Operation and Maintenance of Plant:100 Salaries 2,005,950 2,002,374 3,576
140 Terminal Leave - 1,447 (1,447) 200 Employee Benefits 809,061 808,182 879 300 Purchased Services 788,500 782,785 5,715 321 Public Utilities (Excludes Gas, Oil, Elec. & Other
Heating Fuels) 200,000 150,355 49,645 400 Supplies and Materials 406,000 398,047 7,953 470 Energy (Includes Gas, Oil, Elec. & Other Heating Fuels) 1,615,000 1,559,911 55,089 500 Capital Outlay 6,500 15,044 (8,544)
255 Student Transportation (State Mandated):100 Salaries 994,273 1,024,625 (30,352)
140 Terminal Leave - 3,777 (3,777) 200 Employee Benefits 424,081 419,838 4,243 300 Purchased Services 21,000 1,941 19,059 400 Supplies and Materials 12,000 7,824 4,176
256 Food Service:200 Employee Benefits 175,000$ 161,531 13,469$
(Continued)
88
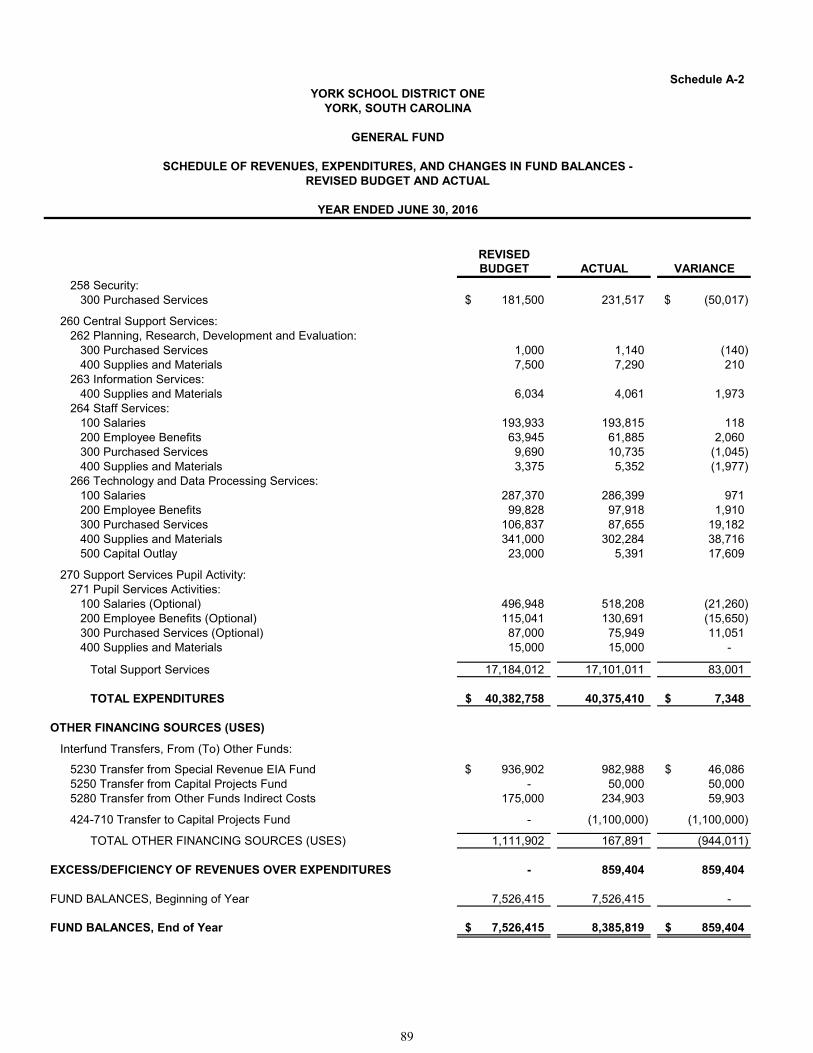
Schedule A-2
REVISEDBUDGET ACTUAL VARIANCE
YORK SCHOOL DISTRICT ONEYORK, SOUTH CAROLINA
GENERAL FUND
SCHEDULE OF REVENUES, EXPENDITURES, AND CHANGES IN FUND BALANCES -REVISED BUDGET AND ACTUAL
YEAR ENDED JUNE 30, 2016
258 Security:300 Purchased Services 181,500$ 231,517 (50,017)$
260 Central Support Services:262 Planning, Research, Development and Evaluation:
300 Purchased Services 1,000 1,140 (140) 400 Supplies and Materials 7,500 7,290 210
263 Information Services:400 Supplies and Materials 6,034 4,061 1,973
264 Staff Services:100 Salaries 193,933 193,815 118 200 Employee Benefits 63,945 61,885 2,060 300 Purchased Services 9,690 10,735 (1,045) 400 Supplies and Materials 3,375 5,352 (1,977)
266 Technology and Data Processing Services:100 Salaries 287,370 286,399 971 200 Employee Benefits 99,828 97,918 1,910 300 Purchased Services 106,837 87,655 19,182 400 Supplies and Materials 341,000 302,284 38,716 500 Capital Outlay 23,000 5,391 17,609
270 Support Services Pupil Activity:271 Pupil Services Activities:
100 Salaries (Optional) 496,948 518,208 (21,260) 200 Employee Benefits (Optional) 115,041 130,691 (15,650) 300 Purchased Services (Optional) 87,000 75,949 11,051 400 Supplies and Materials 15,000 15,000 -
Total Support Services 17,184,012 17,101,011 83,001
TOTAL EXPENDITURES 40,382,758$ 40,375,410 7,348$
OTHER FINANCING SOURCES (USES)
Interfund Transfers, From (To) Other Funds:
5230 Transfer from Special Revenue EIA Fund 936,902$ 982,988 46,086$ 5250 Transfer from Capital Projects Fund - 50,000 50,000 5280 Transfer from Other Funds Indirect Costs 175,000 234,903 59,903
424-710 Transfer to Capital Projects Fund - (1,100,000) (1,100,000)
TOTAL OTHER FINANCING SOURCES (USES) 1,111,902 167,891 (944,011)
EXCESS/DEFICIENCY OF REVENUES OVER EXPENDITURES - 859,404 859,404
FUND BALANCES, Beginning of Year 7,526,415 7,526,415 -
FUND BALANCES, End of Year 7,526,415$ 8,385,819 859,404$
89

90
York School District One York, South Carolina
Comprehensive Annual Financial Report
Special Revenue Funds
Special Revenue Funds are used to account for and report the proceeds of specific revenue sources (that are expected to continue to comprise a substantial portion of the inflows of the fund) that are restricted or committed to expenditures for specified purposes other than debt service or capital projects. The District has the following major Special Revenue Funds: i) The Special Revenue Fund, a major fund and an unbudgeted fund, is
used to account for and report financial resources provided by federal, state, and local projects and grants that are restricted, committed or assigned for special education programs.
ii) The Education Improvement Act (“EIA”) Fund, a major fund and an
unbudgeted fund, is used to account for and report the restricted revenues from the South Carolina Education Improvement Act of 1984 (which is legally required by the state to be accounted for as a specific revenue source) which are restricted for specific programs authorized or mandated by the EIA.
91
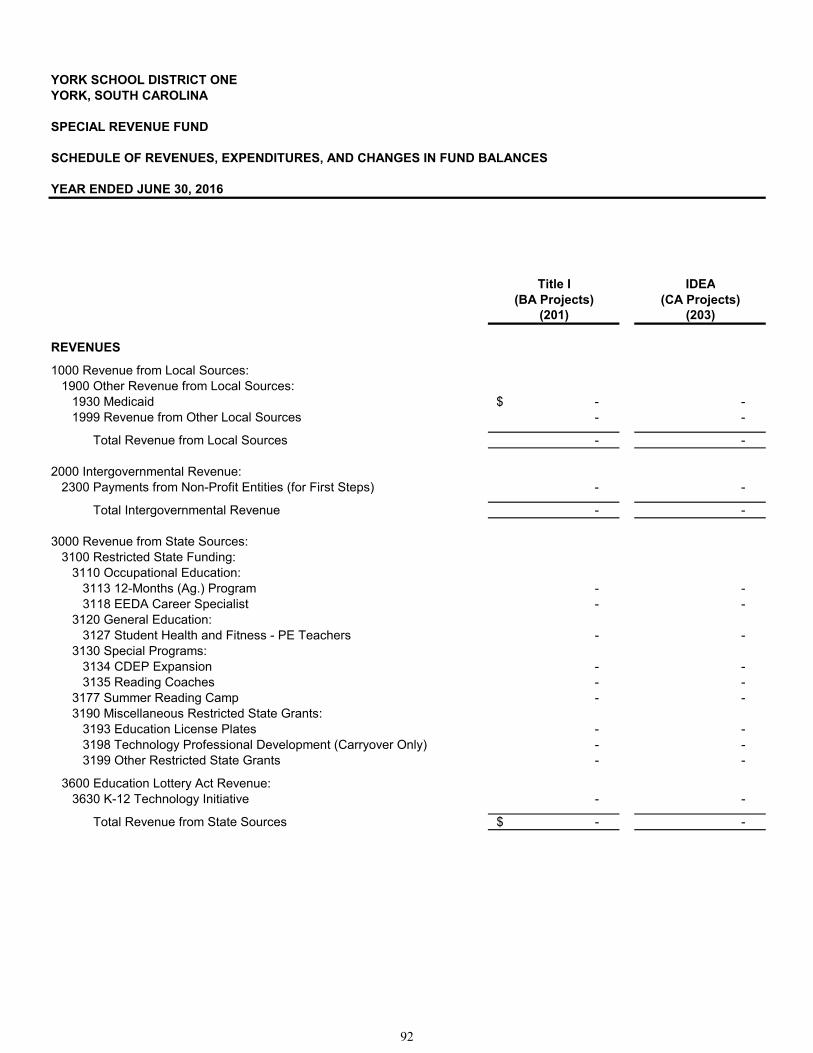
YORK SCHOOL DISTRICT ONEYORK, SOUTH CAROLINA
SPECIAL REVENUE FUND
YEAR ENDED JUNE 30, 2016
Title I IDEA(BA Projects) (CA Projects)
(201) (203)
REVENUES
1000 Revenue from Local Sources:1900 Other Revenue from Local Sources:
1930 Medicaid -$ - 1999 Revenue from Other Local Sources - -
Total Revenue from Local Sources - -
2000 Intergovernmental Revenue:2300 Payments from Non-Profit Entities (for First Steps) - -
Total Intergovernmental Revenue - -
3000 Revenue from State Sources:3100 Restricted State Funding:
3110 Occupational Education:3113 12-Months (Ag.) Program - - 3118 EEDA Career Specialist - -
3120 General Education:3127 Student Health and Fitness - PE Teachers - -
3130 Special Programs:3134 CDEP Expansion - - 3135 Reading Coaches - -
3177 Summer Reading Camp - - 3190 Miscellaneous Restricted State Grants:
3193 Education License Plates - - 3198 Technology Professional Development (Carryover Only) - - 3199 Other Restricted State Grants - -
3600 Education Lottery Act Revenue:3630 K-12 Technology Initiative - -
Total Revenue from State Sources -$ -
SCHEDULE OF REVENUES, EXPENDITURES, AND CHANGES IN FUND BALANCES
92
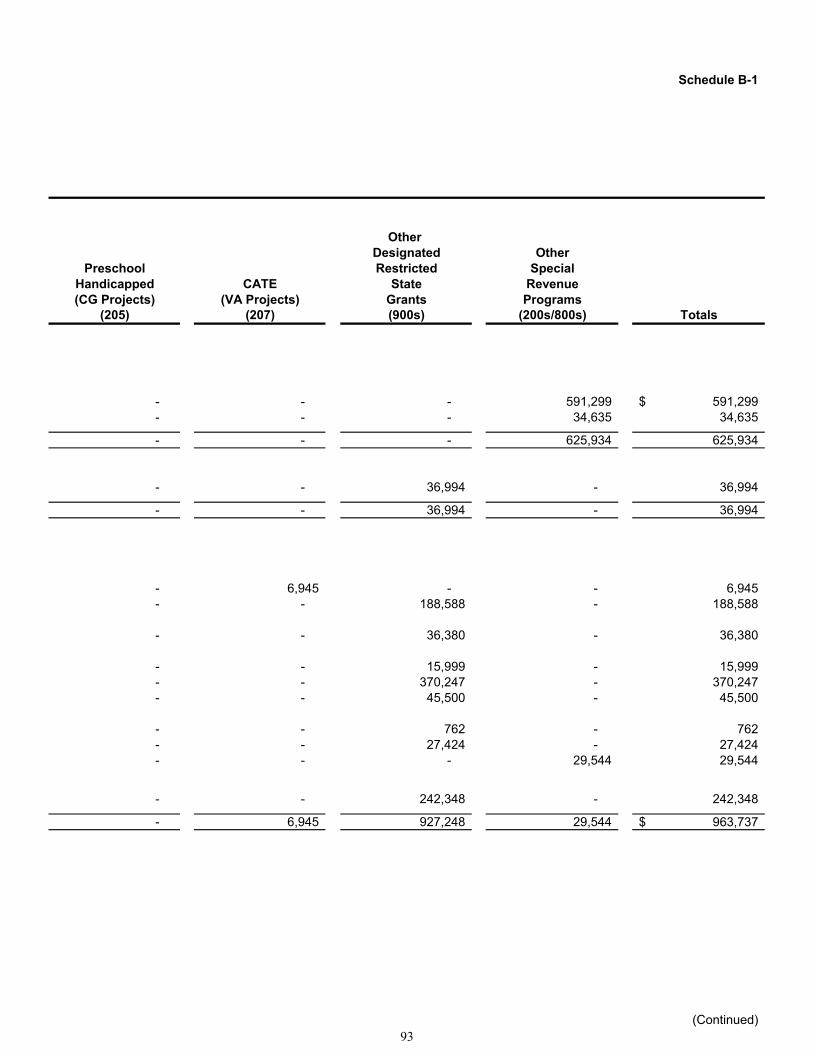
Schedule B-1
Other Designated Other
Preschool Restricted SpecialHandicapped CATE State Revenue(CG Projects) (VA Projects) Grants Programs
(205) (207) (900s) (200s/800s) Totals
- - - 591,299 591,299$ - - - 34,635 34,635
- - - 625,934 625,934
- - 36,994 - 36,994
- - 36,994 - 36,994
- 6,945 - - 6,945 - - 188,588 - 188,588
- - 36,380 - 36,380
- - 15,999 - 15,999 - - 370,247 - 370,247 - - 45,500 - 45,500
- - 762 - 762 - - 27,424 - 27,424 - - - 29,544 29,544
- - 242,348 - 242,348
- 6,945 927,248 29,544 963,737$
(Continued)93
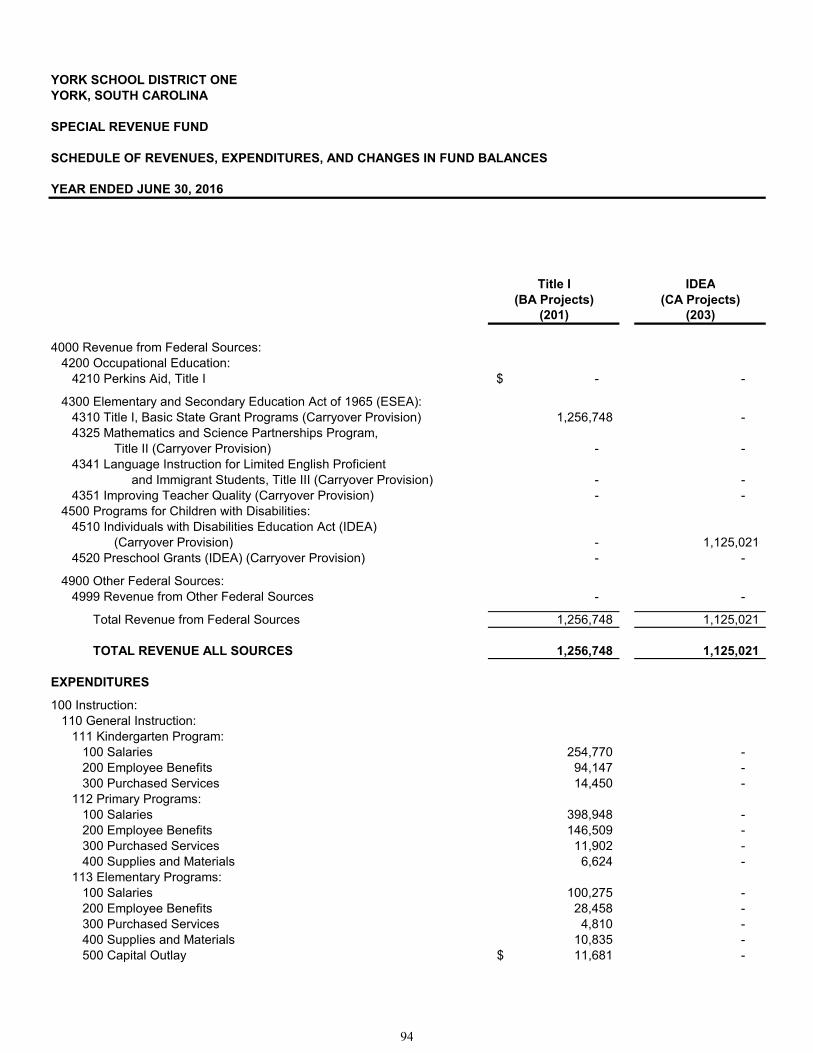
YORK SCHOOL DISTRICT ONEYORK, SOUTH CAROLINA
SPECIAL REVENUE FUND
YEAR ENDED JUNE 30, 2016
Title I IDEA(BA Projects) (CA Projects)
(201) (203)
SCHEDULE OF REVENUES, EXPENDITURES, AND CHANGES IN FUND BALANCES
4000 Revenue from Federal Sources:4200 Occupational Education:
4210 Perkins Aid, Title I -$ -
4300 Elementary and Secondary Education Act of 1965 (ESEA):4310 Title I, Basic State Grant Programs (Carryover Provision) 1,256,748 - 4325 Mathematics and Science Partnerships Program,
Title II (Carryover Provision) - - 4341 Language Instruction for Limited English Proficient
and Immigrant Students, Title III (Carryover Provision) - - 4351 Improving Teacher Quality (Carryover Provision) - -
4500 Programs for Children with Disabilities:4510 Individuals with Disabilities Education Act (IDEA)
(Carryover Provision) - 1,125,021 4520 Preschool Grants (IDEA) (Carryover Provision) - -
4900 Other Federal Sources:4999 Revenue from Other Federal Sources - -
Total Revenue from Federal Sources 1,256,748 1,125,021
TOTAL REVENUE ALL SOURCES 1,256,748 1,125,021
EXPENDITURES
100 Instruction:110 General Instruction:
111 Kindergarten Program:100 Salaries 254,770 - 200 Employee Benefits 94,147 - 300 Purchased Services 14,450 -
112 Primary Programs:100 Salaries 398,948 - 200 Employee Benefits 146,509 - 300 Purchased Services 11,902 - 400 Supplies and Materials 6,624 -
113 Elementary Programs:100 Salaries 100,275 - 200 Employee Benefits 28,458 - 300 Purchased Services 4,810 - 400 Supplies and Materials 10,835 - 500 Capital Outlay 11,681$ -
94

Schedule B-1
Other Designated Other
Preschool Restricted SpecialHandicapped CATE State Revenue(CG Projects) (VA Projects) Grants Programs
(205) (207) (900s) (200s/800s) Totals
- 83,910 - - 83,910$
- - - - 1,256,748
- - - 334,179 334,179
- - - 16,680 16,680 - - - 131,607 131,607
- - - 7,901 1,132,922 63,441 - - - 63,441
- - - 255,308 255,308
63,441 83,910 - 745,675 3,274,795
63,441 90,855 964,242 1,401,153 4,901,460
- - - 54,104 308,874 - - - 16,325 110,472 - - - - 14,450
- - 46,125 41,768 486,841 - - 14,008 18,187 178,704 - - 7,888 - 19,790 - - 8,416 1,324 16,364
- - - 11,019 111,294 - - - 2,404 30,862 - - - 15,730 20,540 - - 813 6,320 17,968 - - - - 11,681$
(Continued)
95

YORK SCHOOL DISTRICT ONEYORK, SOUTH CAROLINA
SPECIAL REVENUE FUND
YEAR ENDED JUNE 30, 2016
Title I IDEA(BA Projects) (CA Projects)
(201) (203)
SCHEDULE OF REVENUES, EXPENDITURES, AND CHANGES IN FUND BALANCES
114 High School Programs:100 Salaries -$ - 200 Employee Benefits - - 400 Supplies and Materials - -
115 Career and Technology Education Program:100 Salaries - - 300 Purchased Services - Other Than Tuition - - 400 Supplies and Materials - -
120 Exceptional Programs:121 Educable Mentally Handicapped:
100 Salaries - 20,925 200 Employee Benefits - 15,417 300 Purchased Services - 545 400 Supplies and Materials - 5,716
122 Trainable Mentally Handicapped:100 Salaries - 17,433 200 Employee Benefits - 12,520 300 Purchased Services 161 2,488 400 Supplies and Materials - 13,702
123 Orthopedically Handicapped:400 Supplies and Materials - 2,240
124 Visually Handicapped:100 Salaries - 625 200 Employee Benefits - 143 300 Purchased Services - 69,118 400 Supplies and Materials - 69
125 Hearing Handicapped:300 Purchased Services - 10,295 400 Supplies and Materials - 1,742
126 Speech Handicapped:100 Salaries - 58,495 200 Employee Benefits - 24,394 300 Purchased Services - 34,191 400 Supplies and Materials - 10,223
127 Learning Disabilities:100 Salaries - 214,430 200 Employee Benefits - 88,779 300 Purchased Services - 10,324 400 Supplies and Materials -$ 9,991
96

Schedule B-1
Other Designated Other
Preschool Restricted SpecialHandicapped CATE State Revenue(CG Projects) (VA Projects) Grants Programs
(205) (207) (900s) (200s/800s) Totals
- - - 78,992 78,992$ - - - 447 447 - - - 23,569 23,569
- 11,945 - - 11,945 - 2,000 - - 2,000 - - - 1,570 1,570
- - - - 20,925 - - - - 15,417 - - - - 545 - - - - 5,716
- - - - 17,433 - - - - 12,520 - - - - 2,649 - - - - 13,702
- - - - 2,240
- - - - 625 - - - - 143 - - - - 69,118 - - - - 69
- - - - 10,295 - - - - 1,742
- - - 45,602 104,097 - - - 10,821 35,215 - - - - 34,191 - - - - 10,223
- - - 20,802 235,232 - - - - 88,779 - - - - 10,324 - - - 500 10,491$
(Continued)97
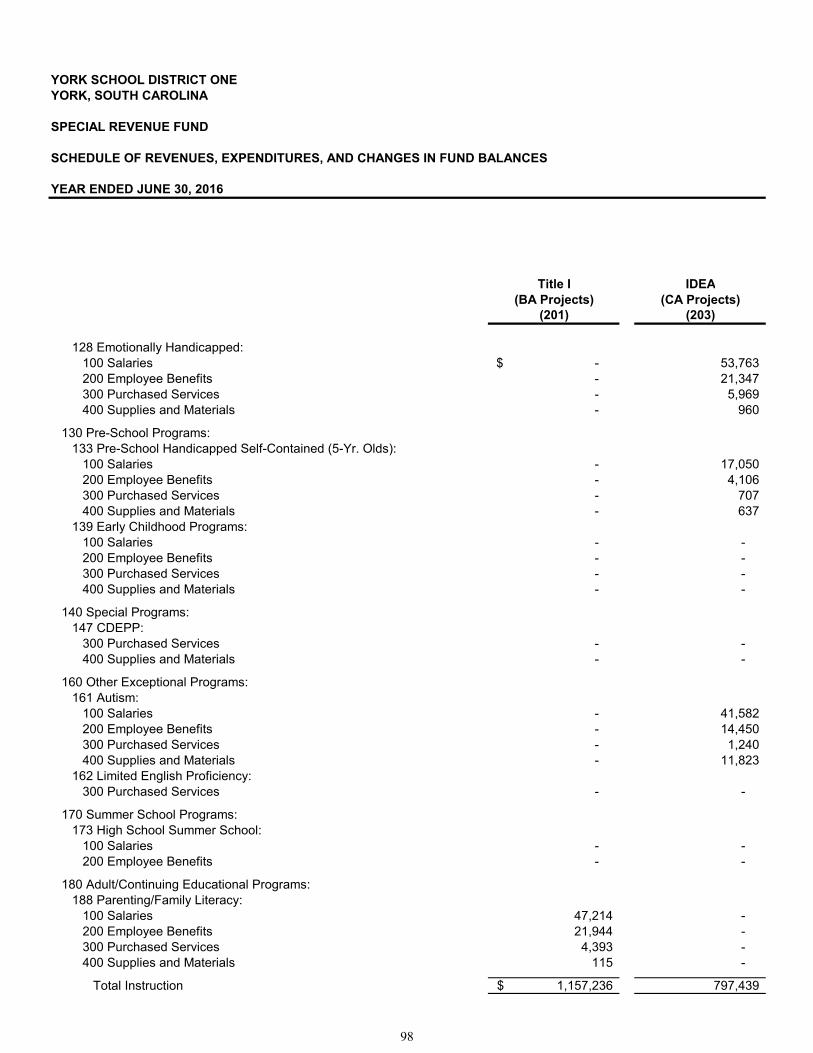
YORK SCHOOL DISTRICT ONEYORK, SOUTH CAROLINA
SPECIAL REVENUE FUND
YEAR ENDED JUNE 30, 2016
Title I IDEA(BA Projects) (CA Projects)
(201) (203)
SCHEDULE OF REVENUES, EXPENDITURES, AND CHANGES IN FUND BALANCES
128 Emotionally Handicapped:100 Salaries -$ 53,763 200 Employee Benefits - 21,347 300 Purchased Services - 5,969 400 Supplies and Materials - 960
130 Pre-School Programs:133 Pre-School Handicapped Self-Contained (5-Yr. Olds):
100 Salaries - 17,050 200 Employee Benefits - 4,106 300 Purchased Services - 707 400 Supplies and Materials - 637
139 Early Childhood Programs:100 Salaries - - 200 Employee Benefits - - 300 Purchased Services - - 400 Supplies and Materials - -
140 Special Programs:147 CDEPP:
300 Purchased Services - - 400 Supplies and Materials - -
160 Other Exceptional Programs:161 Autism:
100 Salaries - 41,582 200 Employee Benefits - 14,450 300 Purchased Services - 1,240 400 Supplies and Materials - 11,823
162 Limited English Proficiency:300 Purchased Services - -
170 Summer School Programs:173 High School Summer School:
100 Salaries - - 200 Employee Benefits - -
180 Adult/Continuing Educational Programs:188 Parenting/Family Literacy:
100 Salaries 47,214 - 200 Employee Benefits 21,944 - 300 Purchased Services 4,393 - 400 Supplies and Materials 115 -
Total Instruction 1,157,236$ 797,439
98
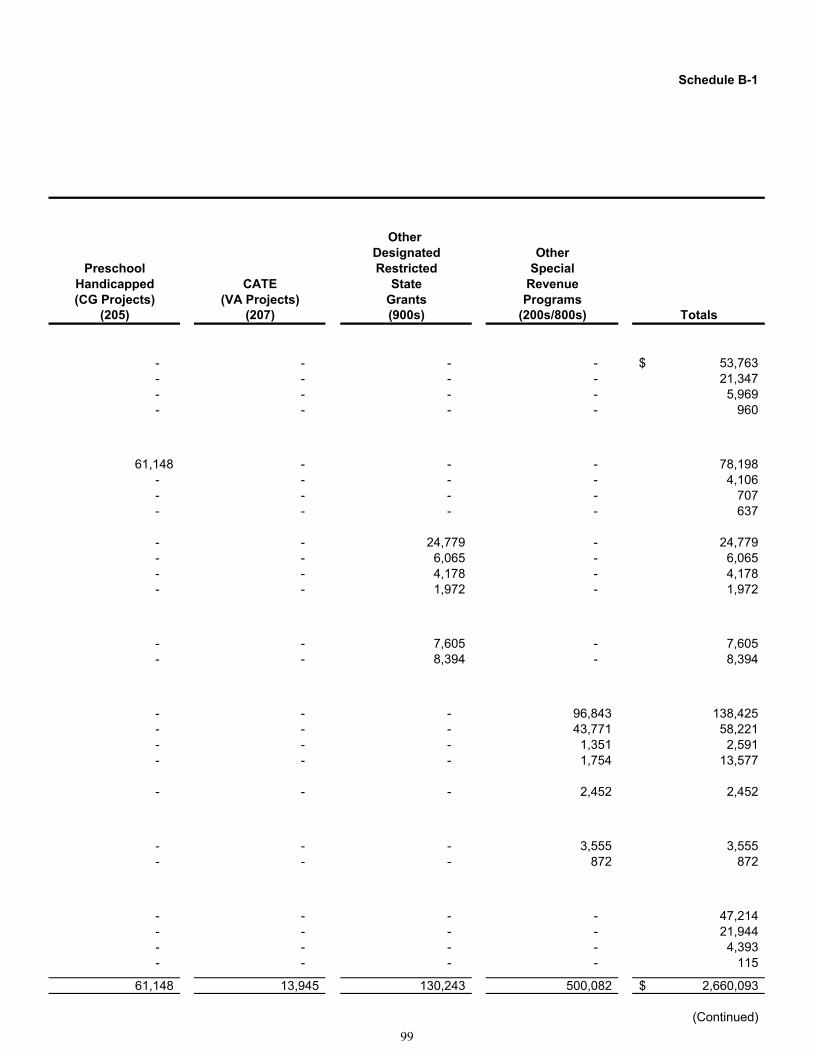
Schedule B-1
Other Designated Other
Preschool Restricted SpecialHandicapped CATE State Revenue(CG Projects) (VA Projects) Grants Programs
(205) (207) (900s) (200s/800s) Totals
- - - - 53,763$ - - - - 21,347 - - - - 5,969 - - - - 960
61,148 - - - 78,198 - - - - 4,106 - - - - 707 - - - - 637
- - 24,779 - 24,779 - - 6,065 - 6,065 - - 4,178 - 4,178 - - 1,972 - 1,972
- - 7,605 - 7,605 - - 8,394 - 8,394
- - - 96,843 138,425 - - - 43,771 58,221 - - - 1,351 2,591 - - - 1,754 13,577
- - - 2,452 2,452
- - - 3,555 3,555 - - - 872 872
- - - - 47,214 - - - - 21,944 - - - - 4,393 - - - - 115
61,148 13,945 130,243 500,082 2,660,093$
(Continued)
99
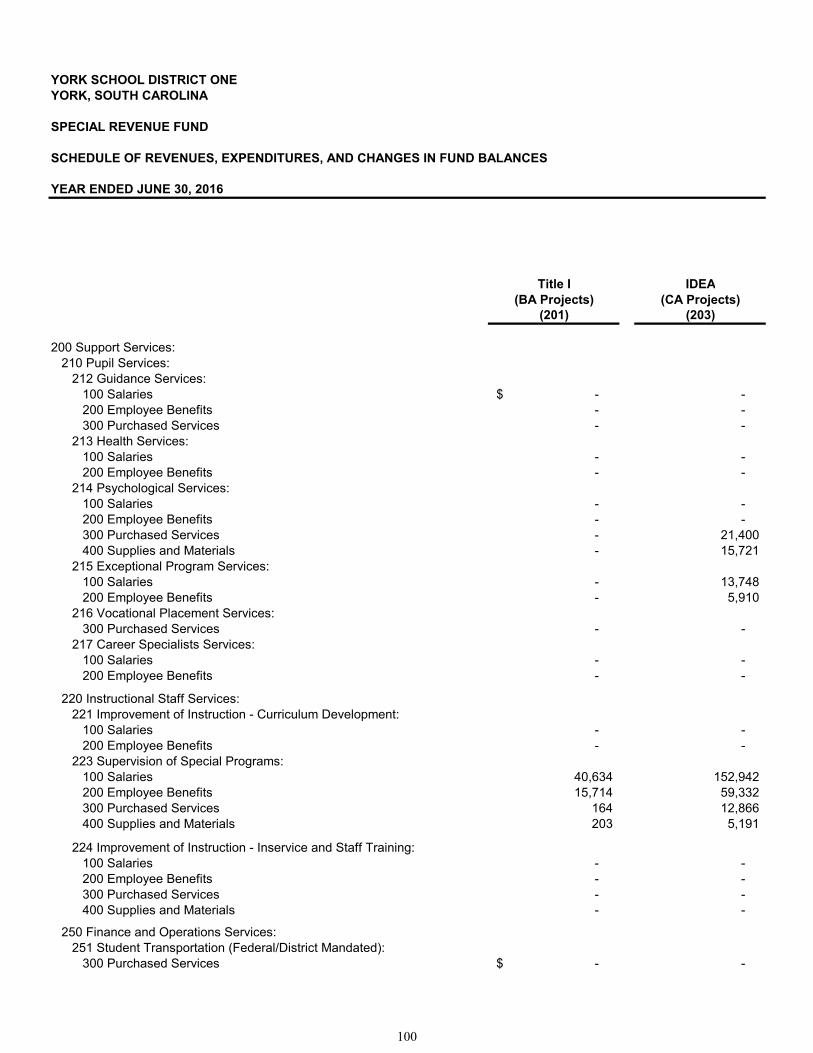
YORK SCHOOL DISTRICT ONEYORK, SOUTH CAROLINA
SPECIAL REVENUE FUND
YEAR ENDED JUNE 30, 2016
Title I IDEA(BA Projects) (CA Projects)
(201) (203)
SCHEDULE OF REVENUES, EXPENDITURES, AND CHANGES IN FUND BALANCES
200 Support Services:210 Pupil Services:
212 Guidance Services:100 Salaries -$ - 200 Employee Benefits - - 300 Purchased Services - -
213 Health Services:100 Salaries - - 200 Employee Benefits - -
214 Psychological Services:100 Salaries - - 200 Employee Benefits - - 300 Purchased Services - 21,400 400 Supplies and Materials - 15,721
215 Exceptional Program Services:100 Salaries - 13,748 200 Employee Benefits - 5,910
216 Vocational Placement Services:300 Purchased Services - -
217 Career Specialists Services:100 Salaries - - 200 Employee Benefits - -
220 Instructional Staff Services:221 Improvement of Instruction - Curriculum Development:
100 Salaries - - 200 Employee Benefits - -
223 Supervision of Special Programs:100 Salaries 40,634 152,942 200 Employee Benefits 15,714 59,332 300 Purchased Services 164 12,866 400 Supplies and Materials 203 5,191
224 Improvement of Instruction - Inservice and Staff Training:100 Salaries - - 200 Employee Benefits - - 300 Purchased Services - - 400 Supplies and Materials - -
250 Finance and Operations Services:251 Student Transportation (Federal/District Mandated):
300 Purchased Services -$ -
100
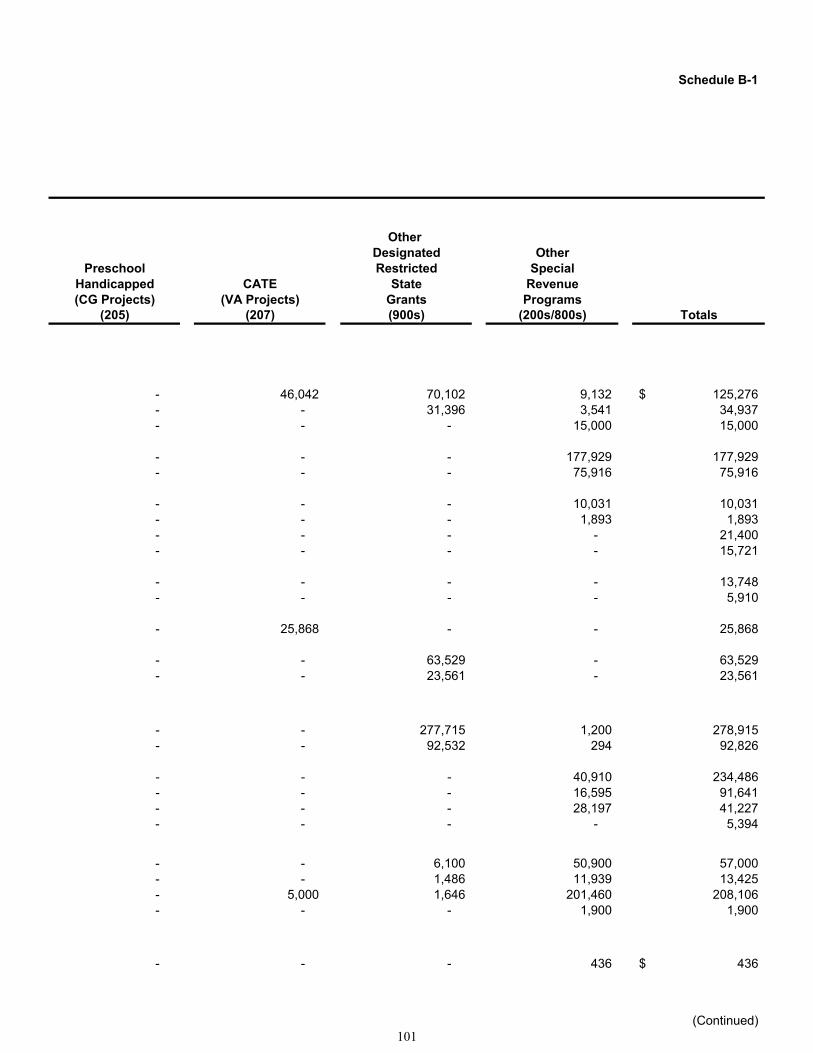
Schedule B-1
Other Designated Other
Preschool Restricted SpecialHandicapped CATE State Revenue(CG Projects) (VA Projects) Grants Programs
(205) (207) (900s) (200s/800s) Totals
- 46,042 70,102 9,132 125,276$ - - 31,396 3,541 34,937 - - - 15,000 15,000
- - - 177,929 177,929 - - - 75,916 75,916
- - - 10,031 10,031 - - - 1,893 1,893 - - - - 21,400 - - - - 15,721
- - - - 13,748 - - - - 5,910
- 25,868 - - 25,868
- - 63,529 - 63,529 - - 23,561 - 23,561
- - 277,715 1,200 278,915 - - 92,532 294 92,826
- - - 40,910 234,486 - - - 16,595 91,641 - - - 28,197 41,227 - - - - 5,394
- - 6,100 50,900 57,000 - - 1,486 11,939 13,425 - 5,000 1,646 201,460 208,106 - - - 1,900 1,900
- - - 436 436$
(Continued)101
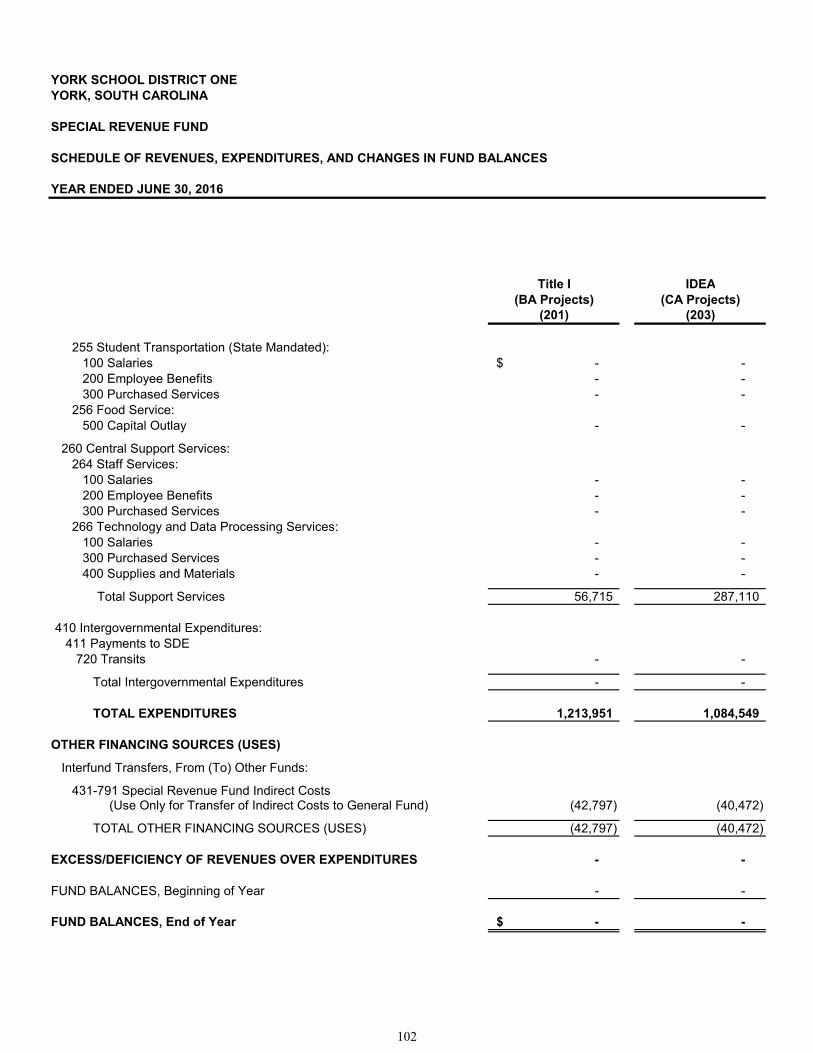
YORK SCHOOL DISTRICT ONEYORK, SOUTH CAROLINA
SPECIAL REVENUE FUND
YEAR ENDED JUNE 30, 2016
Title I IDEA(BA Projects) (CA Projects)
(201) (203)
SCHEDULE OF REVENUES, EXPENDITURES, AND CHANGES IN FUND BALANCES
255 Student Transportation (State Mandated):100 Salaries -$ - 200 Employee Benefits - - 300 Purchased Services - -
256 Food Service:500 Capital Outlay - -
260 Central Support Services:264 Staff Services:
100 Salaries - - 200 Employee Benefits - - 300 Purchased Services - -
266 Technology and Data Processing Services:100 Salaries - - 300 Purchased Services - - 400 Supplies and Materials - -
Total Support Services 56,715 287,110
410 Intergovernmental Expenditures:411 Payments to SDE
720 Transits - -
Total Intergovernmental Expenditures - -
TOTAL EXPENDITURES 1,213,951 1,084,549
OTHER FINANCING SOURCES (USES)
Interfund Transfers, From (To) Other Funds:
431-791 Special Revenue Fund Indirect Costs(Use Only for Transfer of Indirect Costs to General Fund) (42,797) (40,472)
TOTAL OTHER FINANCING SOURCES (USES) (42,797) (40,472)
EXCESS/DEFICIENCY OF REVENUES OVER EXPENDITURES - -
FUND BALANCES, Beginning of Year - -
FUND BALANCES, End of Year -$ -
102
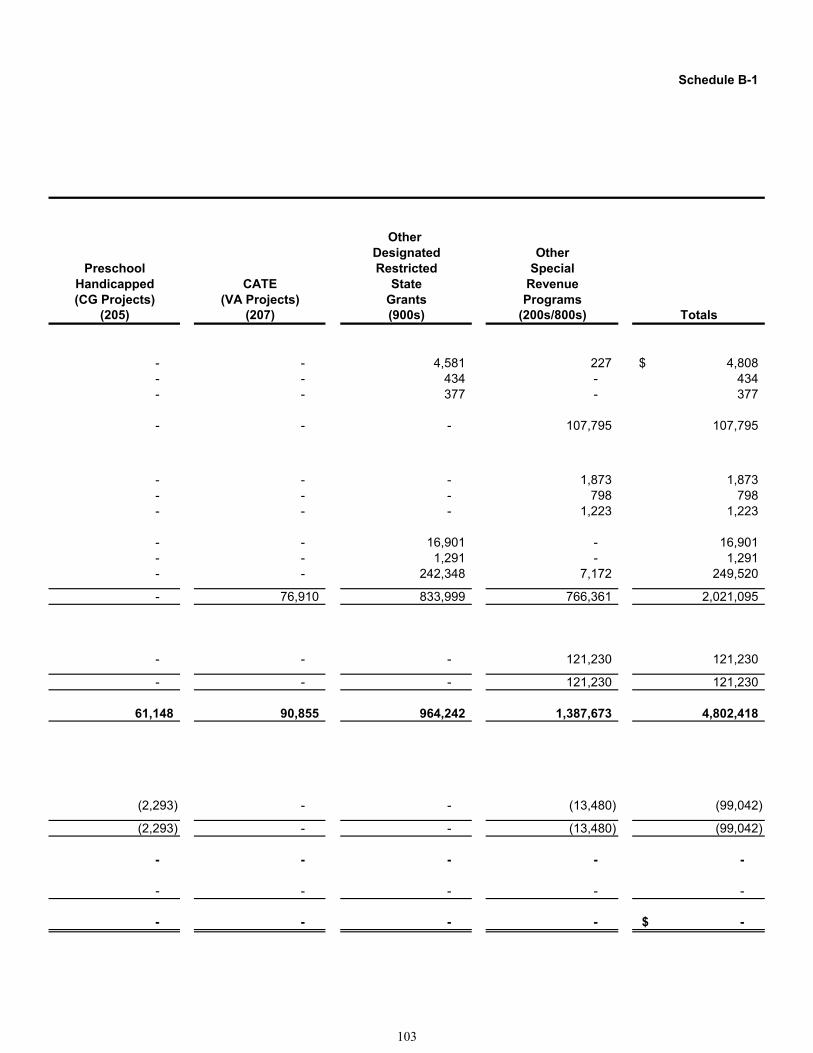
Schedule B-1
Other Designated Other
Preschool Restricted SpecialHandicapped CATE State Revenue(CG Projects) (VA Projects) Grants Programs
(205) (207) (900s) (200s/800s) Totals
- - 4,581 227 4,808$ - - 434 - 434 - - 377 - 377
- - - 107,795 107,795
- - - 1,873 1,873 - - - 798 798 - - - 1,223 1,223
- - 16,901 - 16,901 - - 1,291 - 1,291 - - 242,348 7,172 249,520
- 76,910 833,999 766,361 2,021,095
- - - 121,230 121,230
- - - 121,230 121,230
61,148 90,855 964,242 1,387,673 4,802,418
(2,293) - - (13,480) (99,042)
(2,293) - - (13,480) (99,042)
- - - - -
- - - - -
- - - - -$
103
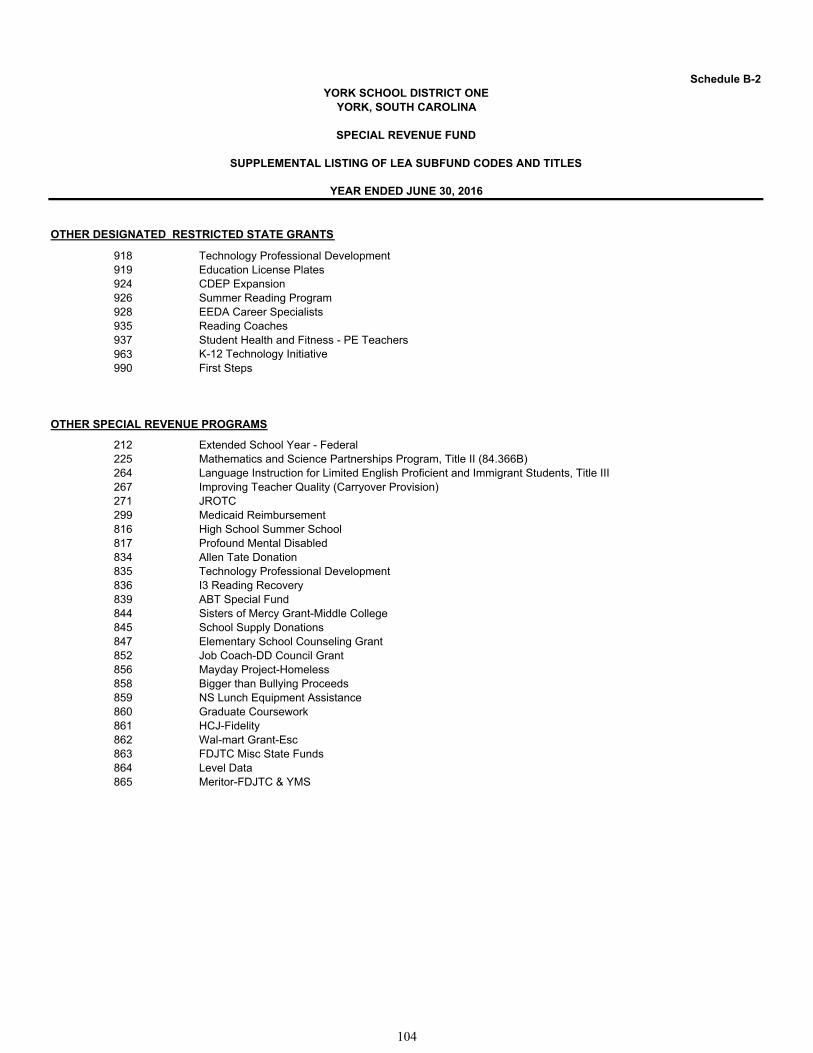
Schedule B-2
OTHER DESIGNATED RESTRICTED STATE GRANTS
918 Technology Professional Development919 Education License Plates924 CDEP Expansion926 Summer Reading Program928 EEDA Career Specialists935 Reading Coaches937 Student Health and Fitness - PE Teachers963 K-12 Technology Initiative990 First Steps
OTHER SPECIAL REVENUE PROGRAMS
212 Extended School Year - Federal225 Mathematics and Science Partnerships Program, Title II (84.366B)264 Language Instruction for Limited English Proficient and Immigrant Students, Title III267 Improving Teacher Quality (Carryover Provision)271 JROTC299 Medicaid Reimbursement816 High School Summer School817 Profound Mental Disabled834 Allen Tate Donation835 Technology Professional Development836 I3 Reading Recovery839 ABT Special Fund844 Sisters of Mercy Grant-Middle College845 School Supply Donations847 Elementary School Counseling Grant852 Job Coach-DD Council Grant856 Mayday Project-Homeless858 Bigger than Bullying Proceeds859 NS Lunch Equipment Assistance860 Graduate Coursework861 HCJ-Fidelity862 Wal-mart Grant-Esc863 FDJTC Misc State Funds864 Level Data865 Meritor-FDJTC & YMS
YORK SCHOOL DISTRICT ONEYORK, SOUTH CAROLINA
SPECIAL REVENUE FUND
SUPPLEMENTAL LISTING OF LEA SUBFUND CODES AND TITLES
YEAR ENDED JUNE 30, 2016
104
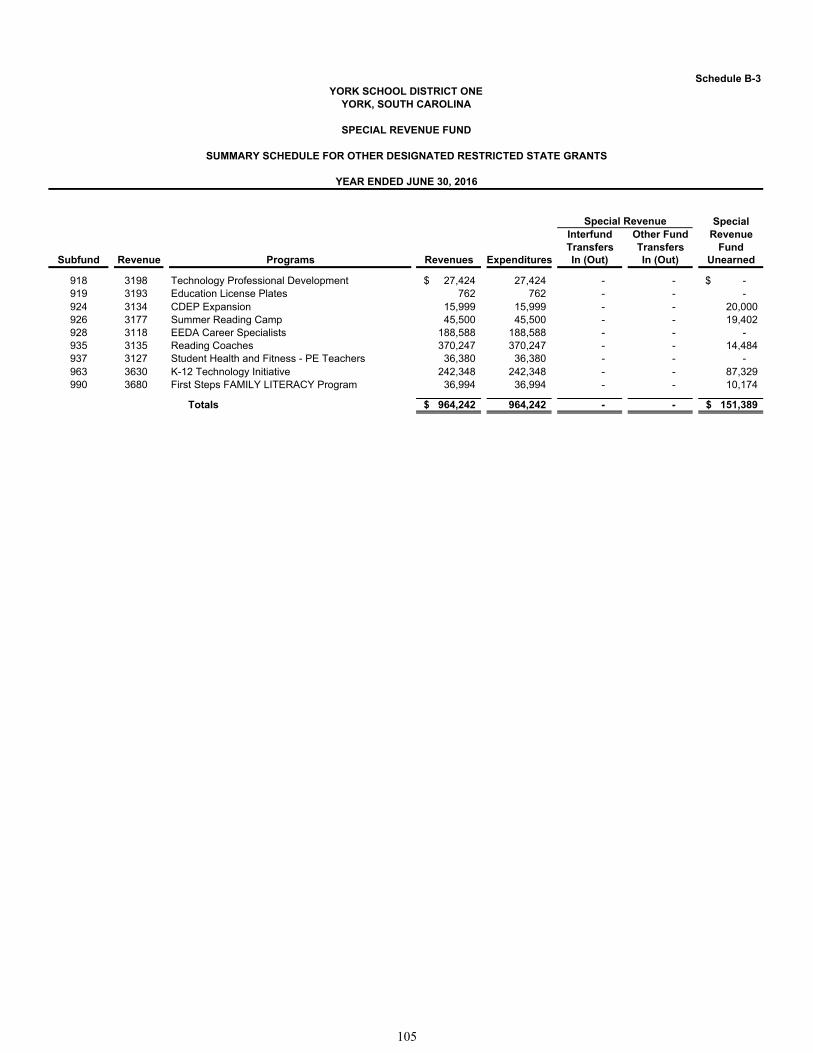
Schedule B-3
SpecialInterfund Other Fund RevenueTransfers Transfers Fund
Subfund Revenue Programs Revenues Expenditures In (Out) In (Out) Unearned
918 3198 Technology Professional Development 27,424$ 27,424 - - -$ 919 3193 Education License Plates 762 762 - - - 924 3134 CDEP Expansion 15,999 15,999 - - 20,000 926 3177 Summer Reading Camp 45,500 45,500 - - 19,402 928 3118 EEDA Career Specialists 188,588 188,588 - - - 935 3135 Reading Coaches 370,247 370,247 - - 14,484 937 3127 Student Health and Fitness - PE Teachers 36,380 36,380 - - - 963 3630 K-12 Technology Initiative 242,348 242,348 - - 87,329 990 3680 First Steps FAMILY LITERACY Program 36,994 36,994 - - 10,174
Totals 964,242$ 964,242 - - 151,389$
YORK SCHOOL DISTRICT ONEYORK, SOUTH CAROLINA
SPECIAL REVENUE FUND
SUMMARY SCHEDULE FOR OTHER DESIGNATED RESTRICTED STATE GRANTS
YEAR ENDED JUNE 30, 2016
Special Revenue
105

Schedule B-4
ACTUALREVENUES
1000 Revenue from Local Sources:1990 Miscellaneous Local Revenue:
1999 Revenue from Other Local Sources 2,484$
Total Revenue from Local Sources 2,484
3000 Revenue from State Sources:3500 Education Improvement Act:
3502 ADEPT 2,992 3504 Level Data 3,000 3505 School Technology Initiative 9,548 3509 Arts in Education 12,600 3511 Professional Development 28,268 3518 Formative Assessment 24,224 3525 Career and Technology Education Equipment 102,830 3526 Refurbishment of K-8 Science Kits 18,849 3532 National Board Certification (NBC) Salary Supplement (No Carryover Provision) 390,726 3533 Teacher of the Year Awards 1,077 3538 Student at Risk of School Failure 623,615 3541 CDEPP (Child Development Education Pilot Program) 746,586 3550 Teacher Salary Increase (No Carryover Provision) 854,788 3555 School Employer Contributions (No Carryover Provision) 128,200 3557 Summer Reading Program 35,101 3558 Reading 29,357 3577 Teacher Supplies (No Carryover Provision) 91,250 3578 High Schools That Work/Making Middle Grades Work 15,478 3581 Student Health and Fitness-Nurses 177,168 3592 Work-Based Learning 19,901 3594 EEDA Supplemental Programs 143,201 3595 EEDA - Supplies and Materials - Career Awareness 9,317 3597 Aid to Districts 257,914
Total Revenue from State Sources 3,725,990
TOTAL REVENUE ALL SOURCES 3,728,474$
(Continued)
ALL PROGRAMS
YEAR ENDED JUNE 30, 2016
YORK SCHOOL DISTRICT ONEYORK, SOUTH CAROLINA
EDUCATION IMPROVEMENT ACT
COMBINING SCHEDULE OF REVENUES, EXPENDITURES, AND CHANGES IN FUND BALANCE -
106
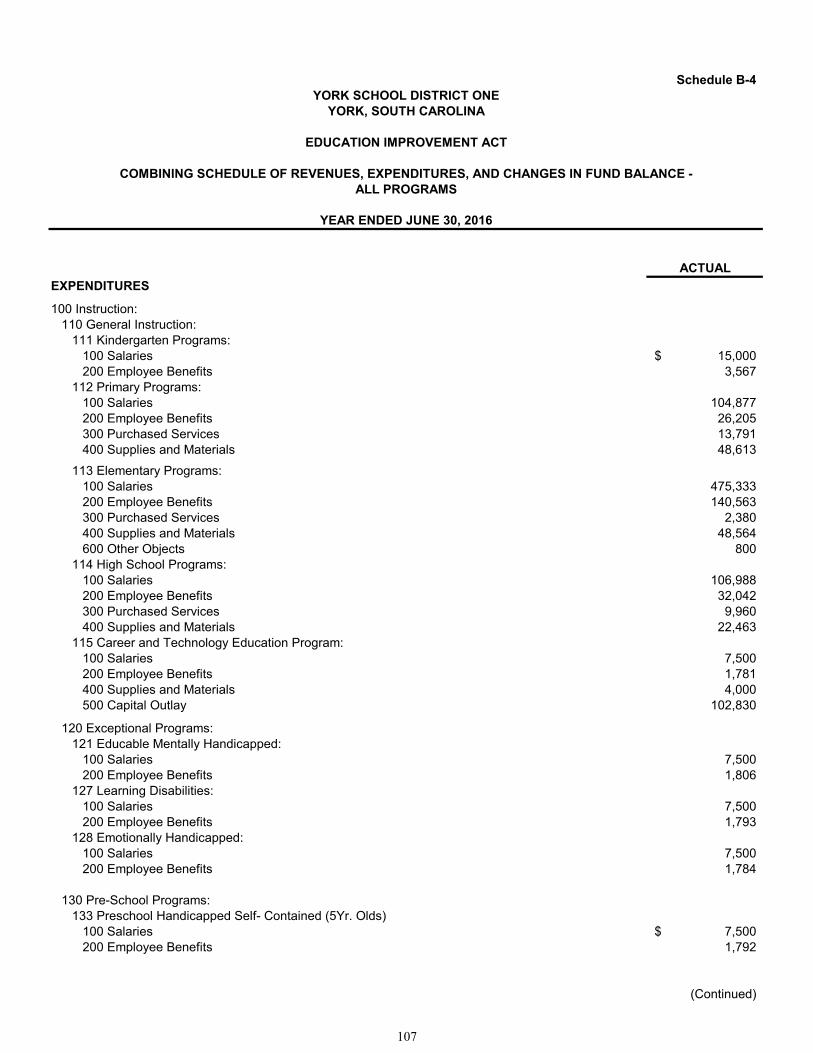
Schedule B-4
ACTUAL
ALL PROGRAMS
YEAR ENDED JUNE 30, 2016
YORK SCHOOL DISTRICT ONEYORK, SOUTH CAROLINA
EDUCATION IMPROVEMENT ACT
COMBINING SCHEDULE OF REVENUES, EXPENDITURES, AND CHANGES IN FUND BALANCE -
EXPENDITURES
100 Instruction:110 General Instruction:
111 Kindergarten Programs:100 Salaries 15,000$ 200 Employee Benefits 3,567
112 Primary Programs:100 Salaries 104,877 200 Employee Benefits 26,205 300 Purchased Services 13,791 400 Supplies and Materials 48,613
113 Elementary Programs:100 Salaries 475,333 200 Employee Benefits 140,563 300 Purchased Services 2,380 400 Supplies and Materials 48,564 600 Other Objects 800
114 High School Programs:100 Salaries 106,988 200 Employee Benefits 32,042 300 Purchased Services 9,960 400 Supplies and Materials 22,463
115 Career and Technology Education Program:100 Salaries 7,500 200 Employee Benefits 1,781 400 Supplies and Materials 4,000 500 Capital Outlay 102,830
120 Exceptional Programs:121 Educable Mentally Handicapped:
100 Salaries 7,500 200 Employee Benefits 1,806
127 Learning Disabilities:100 Salaries 7,500 200 Employee Benefits 1,793
128 Emotionally Handicapped:100 Salaries 7,500 200 Employee Benefits 1,784
130 Pre-School Programs:133 Preschool Handicapped Self- Contained (5Yr. Olds)
100 Salaries 7,500$ 200 Employee Benefits 1,792
(Continued)
107
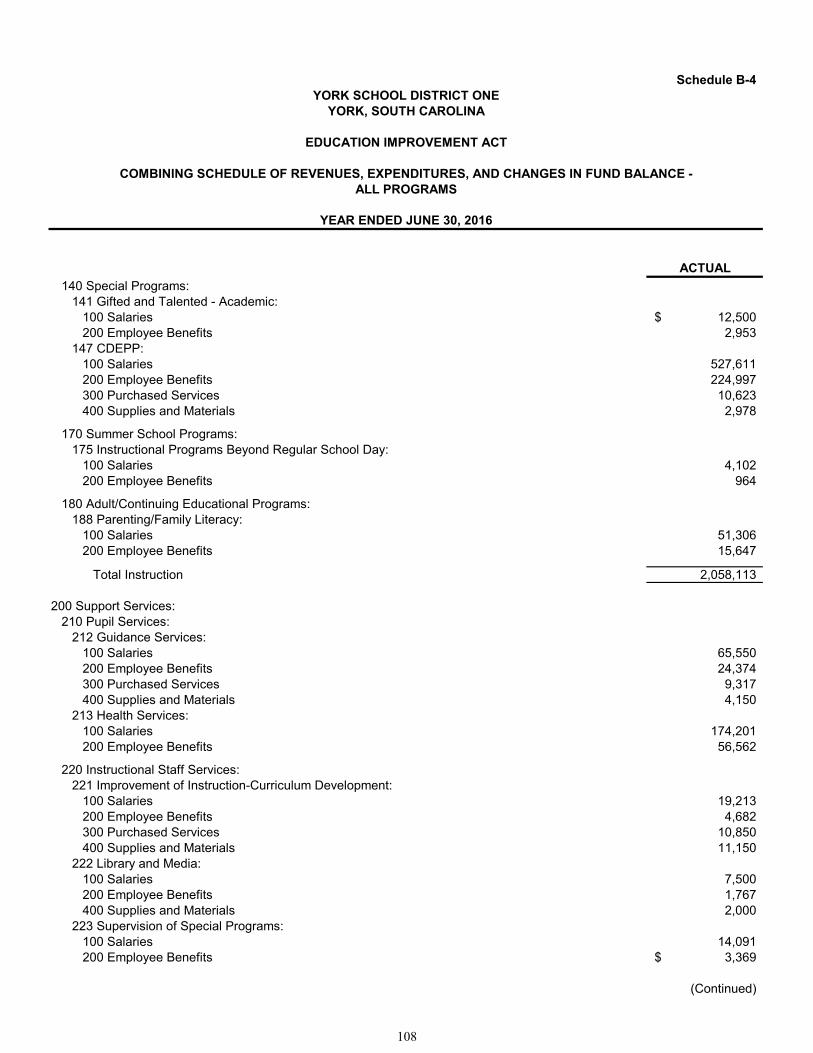
Schedule B-4
ACTUAL
ALL PROGRAMS
YEAR ENDED JUNE 30, 2016
YORK SCHOOL DISTRICT ONEYORK, SOUTH CAROLINA
EDUCATION IMPROVEMENT ACT
COMBINING SCHEDULE OF REVENUES, EXPENDITURES, AND CHANGES IN FUND BALANCE -
140 Special Programs:141 Gifted and Talented - Academic:
100 Salaries 12,500$ 200 Employee Benefits 2,953
147 CDEPP:100 Salaries 527,611 200 Employee Benefits 224,997 300 Purchased Services 10,623 400 Supplies and Materials 2,978
170 Summer School Programs:175 Instructional Programs Beyond Regular School Day:
100 Salaries 4,102 200 Employee Benefits 964
180 Adult/Continuing Educational Programs:188 Parenting/Family Literacy:
100 Salaries 51,306 200 Employee Benefits 15,647
Total Instruction 2,058,113
200 Support Services:210 Pupil Services:
212 Guidance Services:100 Salaries 65,550 200 Employee Benefits 24,374 300 Purchased Services 9,317 400 Supplies and Materials 4,150
213 Health Services:100 Salaries 174,201 200 Employee Benefits 56,562
220 Instructional Staff Services:221 Improvement of Instruction-Curriculum Development:
100 Salaries 19,213 200 Employee Benefits 4,682 300 Purchased Services 10,850 400 Supplies and Materials 11,150
222 Library and Media:100 Salaries 7,500 200 Employee Benefits 1,767 400 Supplies and Materials 2,000
223 Supervision of Special Programs:100 Salaries 14,091 200 Employee Benefits 3,369$
(Continued)
108
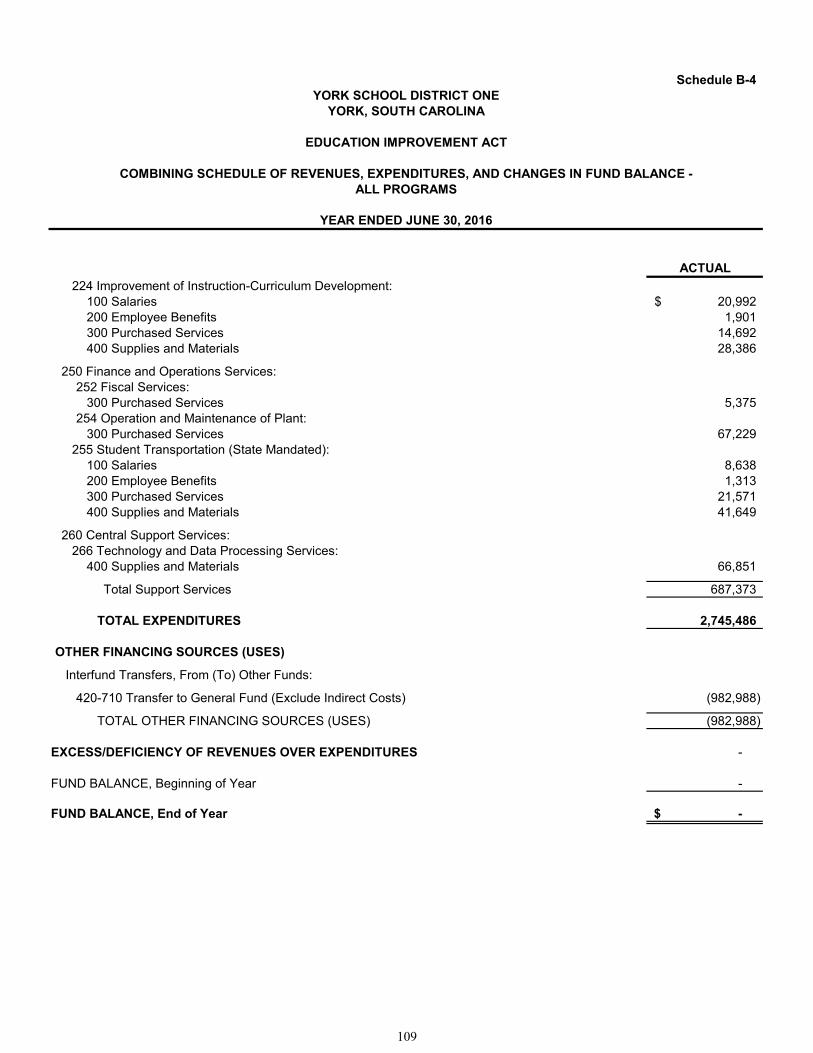
Schedule B-4
ACTUAL
ALL PROGRAMS
YEAR ENDED JUNE 30, 2016
YORK SCHOOL DISTRICT ONEYORK, SOUTH CAROLINA
EDUCATION IMPROVEMENT ACT
COMBINING SCHEDULE OF REVENUES, EXPENDITURES, AND CHANGES IN FUND BALANCE -
224 Improvement of Instruction-Curriculum Development:100 Salaries 20,992$ 200 Employee Benefits 1,901 300 Purchased Services 14,692 400 Supplies and Materials 28,386
250 Finance and Operations Services:252 Fiscal Services:
300 Purchased Services 5,375 254 Operation and Maintenance of Plant:
300 Purchased Services 67,229 255 Student Transportation (State Mandated):
100 Salaries 8,638 200 Employee Benefits 1,313 300 Purchased Services 21,571 400 Supplies and Materials 41,649
260 Central Support Services:266 Technology and Data Processing Services:
400 Supplies and Materials 66,851
Total Support Services 687,373
TOTAL EXPENDITURES 2,745,486
OTHER FINANCING SOURCES (USES)
Interfund Transfers, From (To) Other Funds:
420-710 Transfer to General Fund (Exclude Indirect Costs) (982,988)
TOTAL OTHER FINANCING SOURCES (USES) (982,988)
EXCESS/DEFICIENCY OF REVENUES OVER EXPENDITURES -
FUND BALANCE, Beginning of Year -
FUND BALANCE, End of Year -$
109

Schedule B-5
EIA Interfund Other Fund EIA FundTransfers Transfers Unearned
Program Revenues Expenditures In/(Out) In/(Out) Revenue
3500 Education Improvement Act:3502 ADEPT 2,992$ 2,992 - - -$ 3504 Level Data Reimbursement 3,000 3,000 - - - 3505 School Technology Initiative 9,548 9,548 - - - 3509 Arts in Education 12,600 12,600 - - - 3511 Professional Development 28,268 28,268 - - - 3512 Technology Professional Development - - - - 27,230 3518 Formative Assessment 24,224 24,224 - - - 3525 Career and Technology Education Equipment 102,830 102,830 - - 3,251 3526 Refurbishment of K-8 Science Kits 18,849 18,849 - - 22,462 3532 National Board Certification (NBC) Salary Supplement
(No Carryover Provision) 390,726 390,726 - - - 3533 Teacher of the Year Awards (No Carryover Provision) 1,077 1,077 - - - 3535 Reading Coaches - - - - 8,000 3538 Student at Risk of School Failure 623,615 623,615 - - - 3541 Child Development Education Program (CDEP) 746,586 746,586 - - - 3550 Teacher Salary Increase (No Carryover Provision) 854,788 - - (854,788) - 3555 School Employer Contributions (No Carryover Provision) 128,200 - - (128,200) - 3557 Summer Reading Program 35,101 35,101 - - 11,754 3558 Reading 31,841 31,841 - - 17,670 3577 Teacher Supplies (No Carryover Provision) 91,250 91,250 - - - 3578 High Schools That Work/Making Middle Grades Work 15,478 15,478 - - 20,458 3581 Student Health and Fitness-Nurses 177,168 177,168 - - - 3592 Work-Based Learning 19,901 19,901 - - - 3594 EEDA Supplemental Programs 143,201 143,201 - - - 3595 EEDA Professional Development Funds 9,317 9,317 - - 9,206 3597 Aid to Districts 257,914 257,914 - - 62,473
Totals 3,728,474$ 2,745,486 - (982,988) 182,504$
Note: Included in Program 3558 Revenues is $2,484 of Other Local Sources Revenue (Revenue Code #1999).
YEAR ENDED JUNE 30, 2016
YORK SCHOOL DISTRICT ONEYORK, SOUTH CAROLINA
EDUCATION IMPROVEMENT ACT
SUMMARY SCHEDULE BY PROGRAM
110
Schedule B-6
Amount Dueto State Dept.
Project/ Revenue of Education Status ofGrant & Subfund or Federal Amount Due
Program Number Code Description Government to Grantors
None
YEAR ENDED JUNE 30, 2016
YORK SCHOOL DISTRICT ONEYORK, SOUTH CAROLINA
DETAILED SCHEDULE OF DUE TO STATE DEPARTMENT OF EDUCATION/FEDERAL GOVERNMENT
111

112
York School District One York, South Carolina
Comprehensive Annual Financial Report
Debt Service Fund
The Debt Service Fund, a major fund and an unbudgeted fund, is used to account for the accumulation of financial resources that are restricted, committed, or assigned for the payment of all long-term debt principal, interest and related costs for the District.
113

114

Schedule C-1
ACTUALREVENUES
1000 Revenue from Local Sources:1200 Revenue from Local Governmental Units Other than LEAs:
1210 Ad Valorem Taxes-Including Delinquent (Fiscally Dependent LEA) 6,847,018$ 1240 Penalties & Interest on Taxes (Dependent) 570,731
1500 Earnings on Investments:1510 Interest on Investments 29,337
Total Revenue from Local Sources 7,447,086
3000 Revenue from State Sources:3800 State Revenue in Lieu of Taxes:
3820 Homestead Exemption (Tier 2) 387,641 3830 Merchant's Inventory Tax 19,010
Total Revenue from State Sources 406,651
TOTAL REVENUE ALL SOURCES 7,853,737
EXPENDITURES
500 Debt Service:610 Redemption of Principal 2,467,000 620 Interest 3,963,931 690 Other Objects (Includes Fees for Servicing Bonds) 435,029
Total Debt Service 6,865,960
TOTAL EXPENDITURES 6,865,960
OTHER FINANCING SOURCES (USES)
5110 Premium on Bonds Sold 9,890,126 5130 Proceeds of Refunding Debt 45,380,000
441-720 Payment to Refunded Debt Escrow Agent (54,833,084)
Interfund Transfers, From (To) Other Funds:
5250 Transfer from Capital Projects Fund 3,907,656
424-710 Transfer to Capital Projects Fund (1,935,061)
TOTAL OTHER FINANCING SOURCES (USES) 2,409,637
EXCESS/DEFICIENCY OF REVENUES OVER EXPENDITURES 3,397,414
FUND BALANCE, Beginning of Year 2,496,780
FUND BALANCE, End of Year 5,894,194$
YEAR ENDED JUNE 30, 2016
YORK SCHOOL DISTRICT ONEYORK, SOUTH CAROLINA
DEBT SERVICE FUND
SCHEDULE OF REVENUES, EXPENDITURES, AND CHANGES IN FUND BALANCE
115

116
York School District One York, South Carolina
Comprehensive Annual Financial Report
Capital Projects Fund
The Capital Projects Fund, a major fund and an unbudgeted fund, is used to account for and report financial resources that are restricted, committed, or assigned for expenditures of capital outlay related to site acquisitions, construction, equipment, and renovation of all major capital facilities except for those financed in the Enterprise Fund.
117

118

Schedule D-1
ACTUALREVENUES
1000 Revenue from Local Sources:1500 Earnings on Investments:
1510 Interest on Investments 23,987$
1900 Other Revenue from Local Sources:1999 Revenue from Other Local Sources 20,646
Total Revenue from Local Sources 44,633
TOTAL REVENUE ALL SOURCES 44,633
EXPENDITURES
250 Finance and Operations:253 Facilities Acquisition & Construction:
300 Purchased Services 65,749 400 Supplies and Materials 851,862 500 Capital Outlay:
525 Buildings 6,250 530 Improvements Other Than Buildings 524,603 540 Equipment 12,611
Total Support Services 1,461,075
TOTAL EXPENDITURES 1,461,075
OTHER FINANCING SOURCES (USES)
Interfund Transfers, From (To) Other Funds:
5210 Transfer from General Fund (Exclude Indirect Costs) 1,100,000 5240 Transfer from Debt Service Fund 1,935,061
420-710 Transfer to General Fund (Exclude Indirect Cost) (50,000) 423-710 Transfer to Debt Service Fund (3,907,656)
TOTAL OTHER FINANCING SOURCES (USES) (922,595)
EXCESS/DEFICIENCY OF REVENUES OVER EXPENDITURES (2,339,037)
FUND BALANCE, Beginning of Year 6,608,216
FUND BALANCE, End of Year 4,269,179$
YEAR ENDED JUNE 30, 2016
YORK SCHOOL DISTRICT ONEYORK, SOUTH CAROLINA
CAPITAL PROJECTS FUND
SCHEDULE OF REVENUES, EXPENDITURES, AND CHANGES IN FUND BALANCE
119

120
York School District One York, South Carolina
Comprehensive Annual Financial Report
Proprietary Fund-Enterprise-Food Service
Proprietary Fund Types are accounted for based on the flow of economic resources measurement focus and use of the accrual basis of accounting. Under this method, revenues are recorded when earned and expenses are recorded at the time liabilities are incurred. Proprietary funds distinguish operating revenues and expenses from non-operating items. Operating revenues and expenses generally result from providing services and producing and delivering goods in connection with a proprietary fund’s principal ongoing operations. The principal operating revenues of the Enterprise Fund are charges to students and teachers for breakfast, lunch and special sales. Operating expenses for the Enterprise Fund include the cost of sales, administrative expenses, and depreciation of capital assets. All revenues and expenses not meeting this definition are reported as non operating revenues and expenses. Proprietary Fund types include the following fund:
The Enterprise Fund, a major fund and an unbudgeted fund, is used to account for those operations that are financed and operated in a manner similar to private business enterprises or where the District has decided that periodic determination of revenues earned, expenses incurred, and/or net income is necessary for management accountability. The Food Service Fund is the District's only Enterprise Fund and is used to account for the United States Department of Agriculture's (“USDA”) approved school breakfast and lunch programs.
121

122
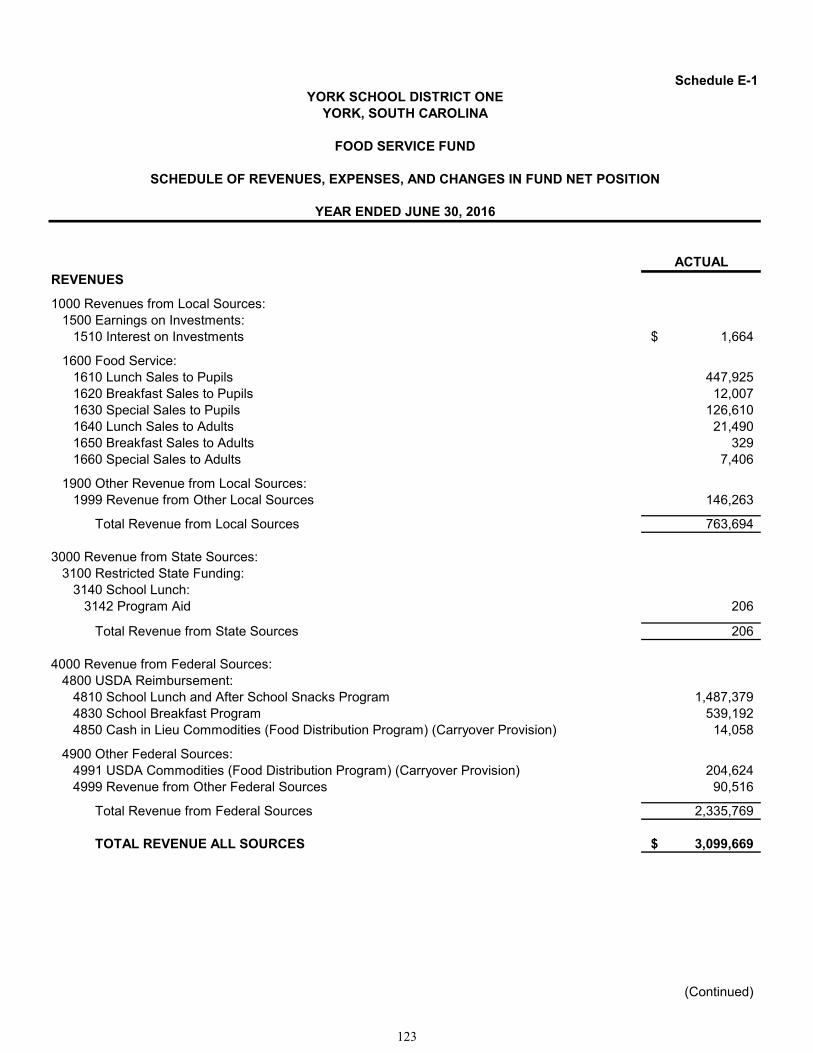
Schedule E-1
ACTUALREVENUES
1000 Revenues from Local Sources:1500 Earnings on Investments:
1510 Interest on Investments 1,664$
1600 Food Service:1610 Lunch Sales to Pupils 447,925 1620 Breakfast Sales to Pupils 12,007 1630 Special Sales to Pupils 126,610 1640 Lunch Sales to Adults 21,490 1650 Breakfast Sales to Adults 329 1660 Special Sales to Adults 7,406
1900 Other Revenue from Local Sources:1999 Revenue from Other Local Sources 146,263
Total Revenue from Local Sources 763,694
3000 Revenue from State Sources:3100 Restricted State Funding:
3140 School Lunch:3142 Program Aid 206
Total Revenue from State Sources 206
4000 Revenue from Federal Sources:4800 USDA Reimbursement:
4810 School Lunch and After School Snacks Program 1,487,379 4830 School Breakfast Program 539,192 4850 Cash in Lieu Commodities (Food Distribution Program) (Carryover Provision) 14,058
4900 Other Federal Sources:4991 USDA Commodities (Food Distribution Program) (Carryover Provision) 204,624 4999 Revenue from Other Federal Sources 90,516
Total Revenue from Federal Sources 2,335,769
TOTAL REVENUE ALL SOURCES 3,099,669$
(Continued)
YEAR ENDED JUNE 30, 2016
YORK SCHOOL DISTRICT ONEYORK, SOUTH CAROLINA
FOOD SERVICE FUND
SCHEDULE OF REVENUES, EXPENSES, AND CHANGES IN FUND NET POSITION
123
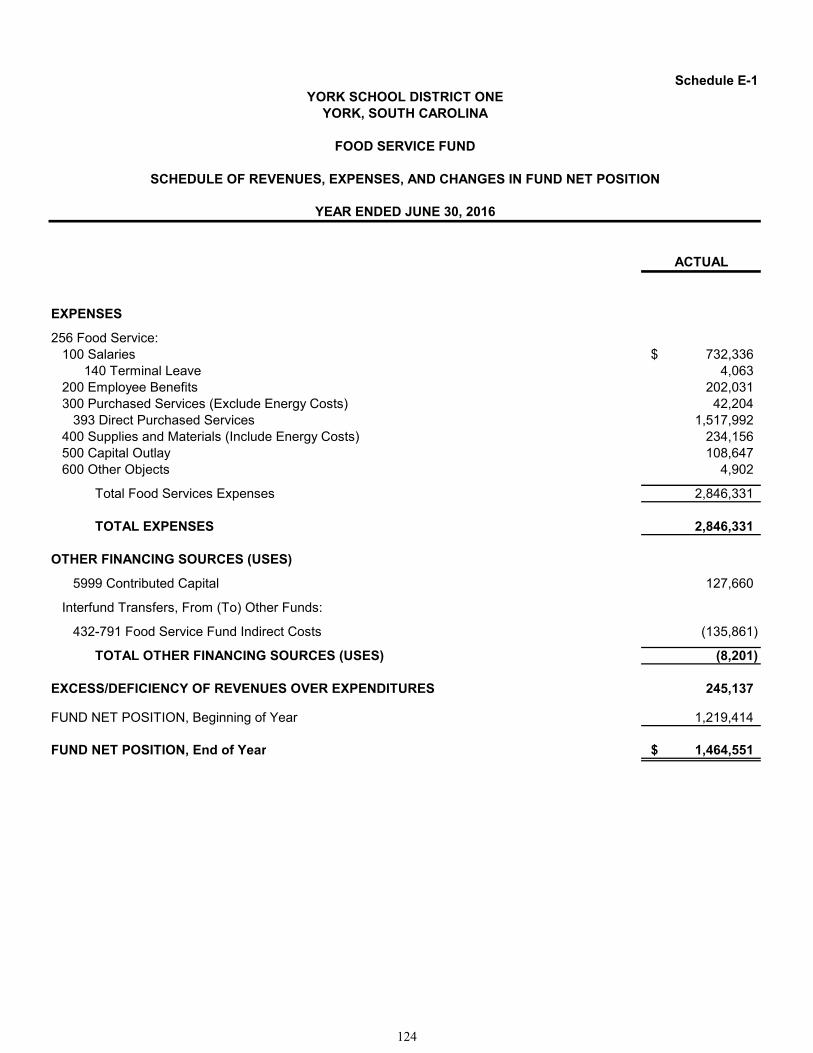
Schedule E-1
ACTUAL
YEAR ENDED JUNE 30, 2016
YORK SCHOOL DISTRICT ONEYORK, SOUTH CAROLINA
FOOD SERVICE FUND
SCHEDULE OF REVENUES, EXPENSES, AND CHANGES IN FUND NET POSITION
EXPENSES
256 Food Service:100 Salaries 732,336$
140 Terminal Leave 4,063 200 Employee Benefits 202,031 300 Purchased Services (Exclude Energy Costs) 42,204
393 Direct Purchased Services 1,517,992 400 Supplies and Materials (Include Energy Costs) 234,156 500 Capital Outlay 108,647 600 Other Objects 4,902
Total Food Services Expenses 2,846,331
TOTAL EXPENSES 2,846,331
OTHER FINANCING SOURCES (USES)
5999 Contributed Capital 127,660
Interfund Transfers, From (To) Other Funds:
432-791 Food Service Fund Indirect Costs (135,861)
TOTAL OTHER FINANCING SOURCES (USES) (8,201)
EXCESS/DEFICIENCY OF REVENUES OVER EXPENDITURES 245,137
FUND NET POSITION, Beginning of Year 1,219,414
FUND NET POSITION, End of Year 1,464,551$
124
York School District One York, South Carolina
Comprehensive Annual Financial Report
Fiduciary Fund-Agency-Pupil Activity
Fiduciary Fund Types are used to account for expendable assets held by the District in a trustee capacity or as an agent for individuals, private organizations, other governmental units and/or other funds and include Agency Funds. Fiduciary Fund Types include the following:
The Agency Fund, an unbudgeted fund, accounts for the receipt and disbursement of monies to and from student activity organizations. These funds have no equity (assets are equal to liabilities) and do not include revenues and expenditures for the general operation of the District. This accounting reflects the agency relationship of the District with the student activity organizations.
125

126

Schedule F-1
ACTUALRECEIPTS
1000 Receipts from Local Sources:1500 Earnings on Investments:
1510 Interest on Investments 566$
1700 Pupil Activities:1710 Admissions 75,392 1720 Bookstore Sales 15,042 1730 Pupil Organization Membership Dues and Fees 102,404 1740 Student Fees 132,615 1790 Other 1,077,709
1900 Other Revenue from Local Sources:1920 Contributions & Donations Private Sources 24,802 1999 Revenue from Other Local Sources 15,000
Total Receipts from Local Sources 1,443,530
TOTAL RECEIPTS ALL SOURCES 1,443,530
DISBURSEMENTS
190 Instructional Pupil Activity:660 Pupil Activity 208,039
Total Instruction 208,039
270 Support Services Pupil Activity:271 Pupil Service Activities:
660 Pupil Activity 776,005 272 Enterprise Activities:
660 Pupil Activity 301,301 273 Trust and Agency Activities:
660 Enterprise Activity 122,292
Total Pupil Activity Expenditures 1,199,598
TOTAL DISBURSEMENTS 1,407,637
EXCESS/DEFICIENCY OF RECEIPTS OVER DISBURSEMENTS 35,893
DUE TO STUDENT ORGANIZATIONS, Beginning of Year 563,382
DUE TO STUDENT ORGANIZATIONS, End of Year 599,275$
DUE TO STUDENT ORGANIZATIONS
YEAR ENDED JUNE 30, 2016
YORK SCHOOL DISTRICT ONEYORK, SOUTH CAROLINA
PUPIL ACTIVITY FUND
SCHEDULE OF RECEIPTS, DISBURSEMENTS, AND CHANGES IN
127
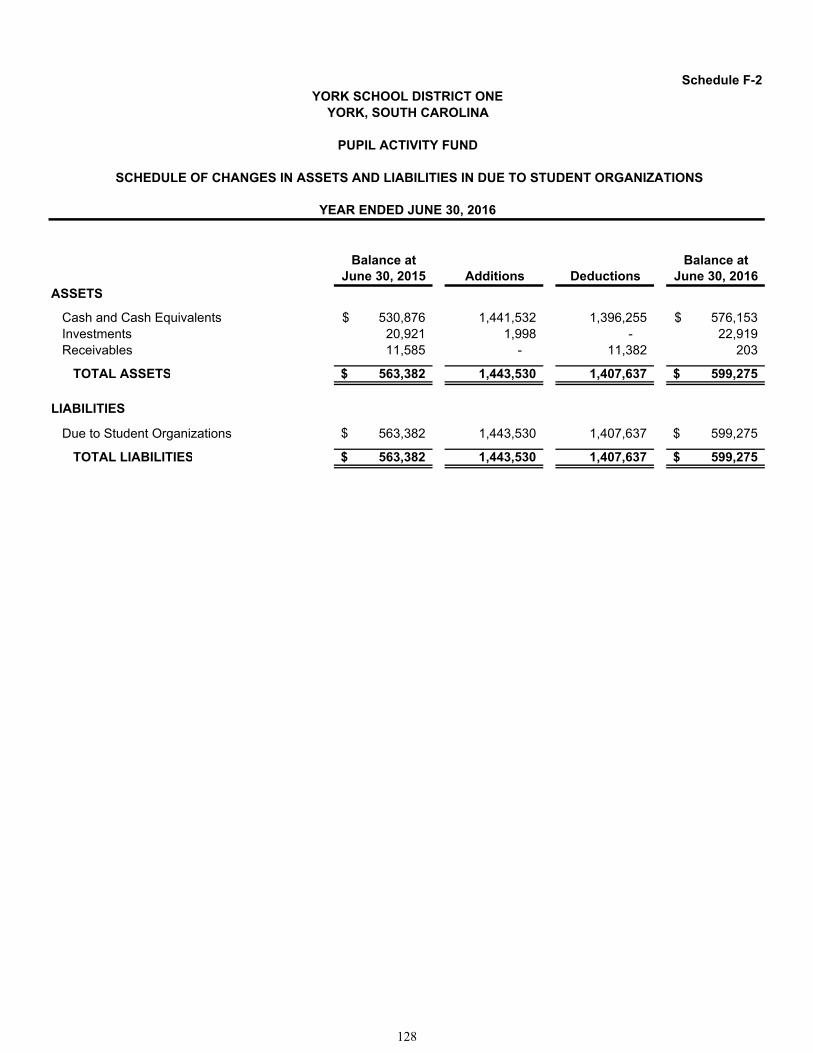
Schedule F-2
Balance at Balance atJune 30, 2015 Additions Deductions June 30, 2016
ASSETS
Cash and Cash Equivalents 530,876$ 1,441,532 1,396,255 576,153$ Investments 20,921 1,998 - 22,919 Receivables 11,585 - 11,382 203
TOTAL ASSETS 563,382$ 1,443,530 1,407,637 599,275$
LIABILITIES
Due to Student Organizations 563,382 1,443,530 1,407,637 599,275$
TOTAL LIABILITIES 563,382$ 1,443,530 1,407,637 599,275$
YORK, SOUTH CAROLINA
SCHEDULE OF CHANGES IN ASSETS AND LIABILITIES IN DUE TO STUDENT ORGANIZATIONS
YORK SCHOOL DISTRICT ONE
YEAR ENDED JUNE 30, 2016
PUPIL ACTIVITY FUND
128
$
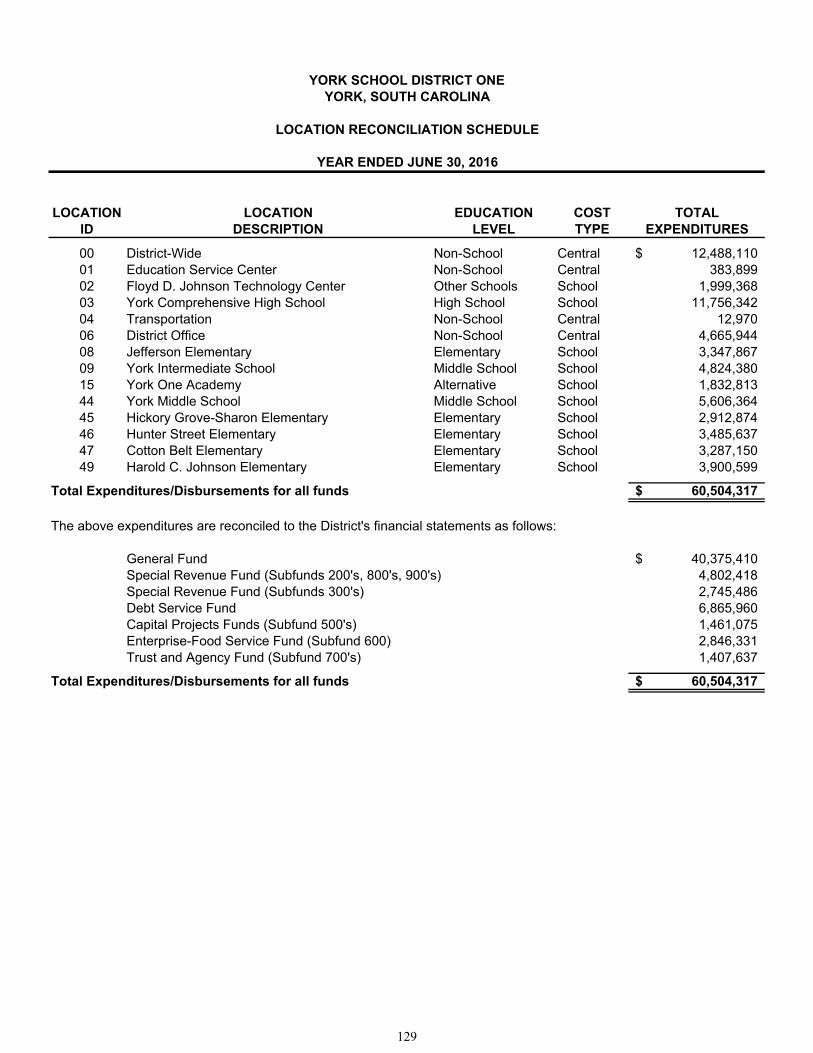
LOCATION LOCATION EDUCATION COST TOTALID DESCRIPTION LEVEL TYPE EXPENDITURES
00 District-Wide Non-School Central 12,488,110$ 01 Education Service Center Non-School Central 383,899 02 Floyd D. Johnson Technology Center Other Schools School 1,999,368 03 York Comprehensive High School High School School 11,756,342 04 Transportation Non-School Central 12,970 06 District Office Non-School Central 4,665,944 08 Jefferson Elementary Elementary School 3,347,867 09 York Intermediate School Middle School School 4,824,380 15 York One Academy Alternative School 1,832,813 44 York Middle School Middle School School 5,606,364 45 Hickory Grove-Sharon Elementary Elementary School 2,912,874 46 Hunter Street Elementary Elementary School 3,485,637 47 Cotton Belt Elementary Elementary School 3,287,150 49 Harold C. Johnson Elementary Elementary School 3,900,599
Total Expenditures/Disbursements for all funds 60,504,317$
The above expenditures are reconciled to the District's financial statements as follows:
General Fund 40,375,410$ Special Revenue Fund (Subfunds 200's, 800's, 900's) 4,802,418 Special Revenue Fund (Subfunds 300's) 2,745,486 Debt Service Fund 6,865,960 Capital Projects Funds (Subfund 500's) 1,461,075 Enterprise-Food Service Fund (Subfund 600) 2,846,331 Trust and Agency Fund (Subfund 700's) 1,407,637
Total Expenditures/Disbursements for all funds 60,504,317$
YEAR ENDED JUNE 30, 2016
YORK, SOUTH CAROLINAYORK SCHOOL DISTRICT ONE
LOCATION RECONCILIATION SCHEDULE
129

130
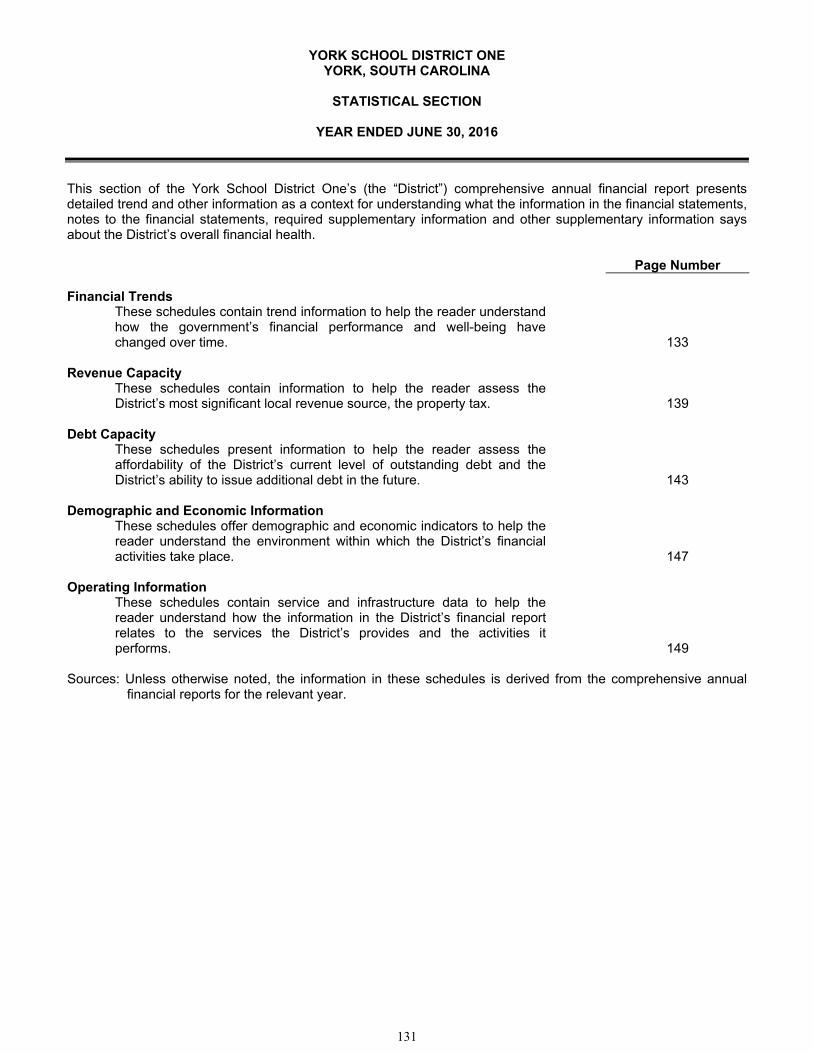
YORK SCHOOL DISTRICT ONE YORK, SOUTH CAROLINA
STATISTICAL SECTION
YEAR ENDED JUNE 30, 2016
This section of the York School District One’s (the “District”) comprehensive annual financial report presents detailed trend and other information as a context for understanding what the information in the financial statements, notes to the financial statements, required supplementary information and other supplementary information says about the District’s overall financial health. Page Number Financial Trends
These schedules contain trend information to help the reader understand how the government’s financial performance and well-being have changed over time.
133
Revenue Capacity These schedules contain information to help the reader assess the District’s most significant local revenue source, the property tax.
139
Debt Capacity
These schedules present information to help the reader assess the affordability of the District’s current level of outstanding debt and the District’s ability to issue additional debt in the future.
143
Demographic and Economic Information These schedules offer demographic and economic indicators to help the reader understand the environment within which the District’s financial activities take place.
147
Operating Information These schedules contain service and infrastructure data to help the reader understand how the information in the District’s financial report relates to the services the District’s provides and the activities it performs.
149 Sources: Unless otherwise noted, the information in these schedules is derived from the comprehensive annual
financial reports for the relevant year.
131

132
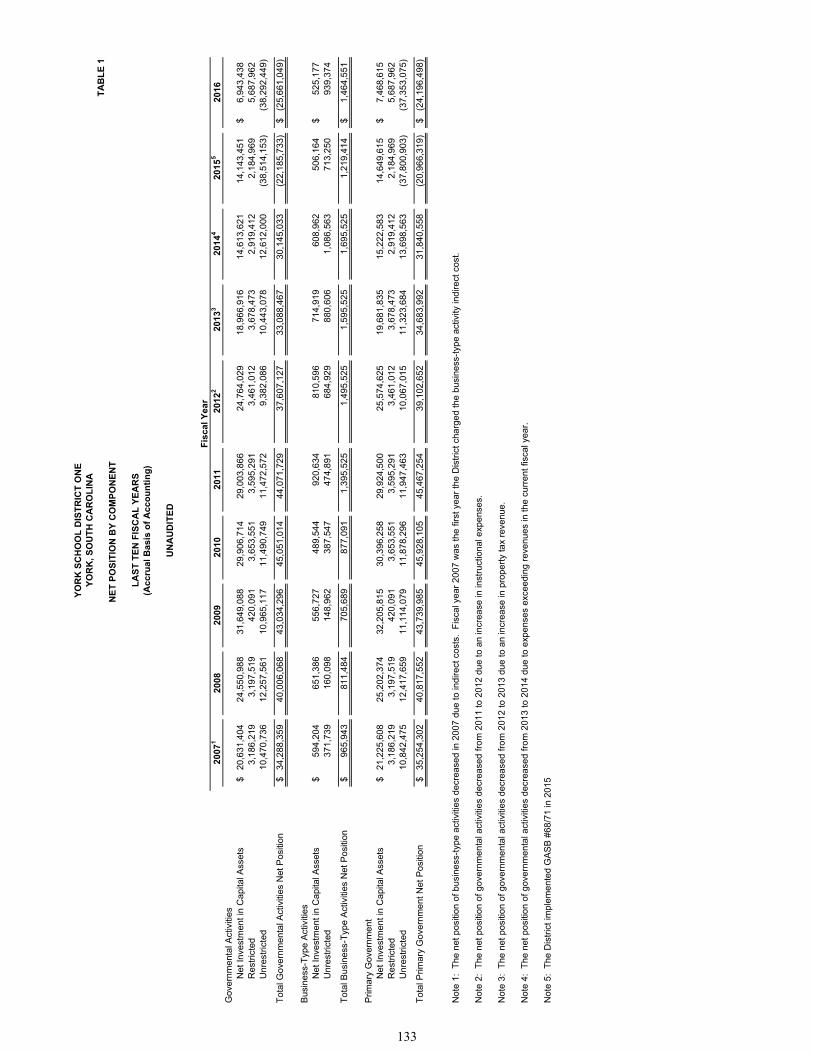
TA
BL
E 1
2007
120
0820
0920
1020
1120
122
2013
320
144
2015
520
16G
over
nmen
tal A
ctiv
ities
Net
Inve
stm
ent i
n C
apita
l Ass
ets
20,6
31,4
04$
24
,550
,988
31,6
49,0
88
29
,906
,714
29,0
03,8
66
24
,764
,029
18,9
66,9
16
14,6
13,6
21
14,1
43,4
51
6,94
3,43
8$
R
estr
icte
d3,
186,
219
3,
197,
519
42
0,09
1
3,
653,
551
3,
595,
291
3,
461,
012
3,
678,
473
2,91
9,41
2
2,
184,
969
5,68
7,96
2
U
nres
tric
ted
10,4
70,7
36
12
,257
,561
10,9
65,1
17
11
,490
,749
11,4
72,5
72
9,
382,
086
10
,443
,078
12
,612
,000
(3
8,51
4,15
3)
(3
8,29
2,44
9)
Tot
al G
over
nmen
tal A
ctiv
ities
Net
Pos
ition
34,2
88,3
59$
40
,006
,068
43,0
34,2
96
45
,051
,014
44,0
71,7
29
37
,607
,127
33,0
88,4
67
30,1
45,0
33
(22,
185,
733)
(25,
661,
049)
$
Bus
ines
s-T
ype
Act
iviti
esN
et In
vest
men
t in
Cap
ital A
sset
s59
4,20
4$
65
1,38
6
55
6,72
7
48
9,54
4
92
0,63
4
81
0,59
6
714,
919
60
8,96
2
506,
164
52
5,17
7$
Unr
estr
icte
d37
1,73
9
16
0,09
8
14
8,96
2
38
7,54
7
47
4,89
1
68
4,92
9
880,
606
1,
086,
563
713,
250
93
9,37
4
Tot
al B
usin
ess-
Typ
e A
ctiv
ities
Net
Pos
ition
965,
943
$
811,
484
705,
689
877,
091
1,39
5,52
5
1,49
5,52
5
1,59
5,52
5
1,
695,
525
1,21
9,41
4
1,
464,
551
$
Prim
ary
Gov
ernm
ent
Net
Inve
stm
ent i
n C
apita
l Ass
ets
21,2
25,6
08$
25
,202
,374
32,2
05,8
15
30
,396
,258
29,9
24,5
00
25
,574
,625
19,6
81,8
35
15,2
22,5
83
14,6
49,6
15
7,46
8,61
5$
R
estr
icte
d3,
186,
219
3,
197,
519
42
0,09
1
3,
653,
551
3,
595,
291
3,
461,
012
3,
678,
473
2,91
9,41
2
2,
184,
969
5,68
7,96
2
U
nres
tric
ted
10,8
42,4
75
12
,417
,659
11,1
14,0
79
11
,878
,296
11,9
47,4
63
10
,067
,015
11,3
23,6
84
13,6
98,5
63
(37,
800,
903)
(37,
353,
075)
Tot
al P
rimar
y G
over
nmen
t Net
Pos
ition
35,2
54,3
02$
40
,817
,552
43,7
39,9
85
45
,928
,105
45,4
67,2
54
39
,102
,652
34,6
83,9
92
31,8
40,5
58
(20,
966,
319)
(24,
196,
498)
$
Not
e 1:
The
net
pos
ition
of b
usin
ess-
type
act
iviti
es d
ecre
ased
in 2
007
due
to in
dire
ct c
osts
. F
isca
l yea
r 20
07 w
as th
e fir
st y
ear
the
Dis
tric
t cha
rged
the
busi
ness
-typ
e ac
tivity
indi
rect
cos
t.
Not
e 2:
The
net
pos
ition
of g
over
nmen
tal a
ctiv
ities
dec
reas
ed f
rom
201
1 to
201
2 du
e to
an
incr
ease
in in
stru
ctio
nal e
xpen
ses.
Not
e 3:
The
net
pos
ition
of g
over
nmen
tal a
ctiv
ities
dec
reas
ed f
rom
201
2 to
201
3 du
e to
an
incr
ease
in p
rope
rty
tax
reve
nue.
Not
e 4:
The
net
pos
ition
of g
over
nmen
tal a
ctiv
ities
dec
reas
ed f
rom
201
3 to
201
4 du
e to
exp
ense
s ex
ceed
ing
reve
nues
in th
e cu
rren
t fis
cal y
ear.
Not
e 5:
The
Dis
tric
t im
plem
ente
d G
AS
B #
68/7
1 in
201
5
LA
ST
TE
N F
ISC
AL
YE
AR
S(A
ccru
al B
asis
of
Acc
ou
nti
ng
)
UN
AU
DIT
ED
Fis
cal Y
ear
YO
RK
SC
HO
OL
DIS
TR
ICT
ON
EY
OR
K, S
OU
TH
CA
RO
LIN
A
NE
T P
OS
ITIO
N B
Y C
OM
PO
NE
NT
133

T
AB
LE
2
2007
120
082
2009
320
1020
114
2012
520
136
2014
720
158
2016
Exp
ense
sG
over
nmen
tal A
ctiv
ities
:In
stru
ctio
n26
,438
,222
$
26
,799
,632
27,3
85,1
21
27
,821
,416
15,6
55,9
36
29
,530
,775
31
,405
,400
30
,377
,162
31
,353
,768
32
,481
,326
$
S
uppo
rt S
ervi
ces
15,6
42,9
47
17,6
99,3
61
18
,348
,659
18,1
09,2
29
31
,000
,076
22,8
52,5
14
21,1
61,2
33
20,2
53,8
81
21,7
28,6
54
22,9
30,8
65
Inte
rgov
ernm
enta
l12
7,53
4
79
,628
87,1
81
-
-
-
-
-
-
-
In
tere
st a
nd O
ther
Cha
rges
631,
973
691,
178
1,60
0,22
3
4,00
9,48
3
4,55
8,14
2
5,24
3,74
8
5,
053,
739
6,22
4,13
7
4,
170,
449
6,20
9,18
1
Tot
al G
over
nmen
tal A
ctiv
ities
Exp
ense
s42
,840
,676
45
,269
,799
47,4
21,1
84
49
,940
,128
51,2
14,1
54
57
,627
,037
57
,620
,372
56
,855
,180
57
,252
,871
61
,621
,372
Bus
ines
s-T
ype
Act
iviti
es:
Foo
d S
ervi
ces
2,19
9,28
3
2,38
2,54
6
2,61
3,16
6
2,32
8,84
7
2,08
8,49
6
2,34
5,60
3
2,
353,
674
2,42
1,92
7
2,
816,
279
2,84
6,33
1
Tot
al B
usin
ess-
Typ
e A
ctiv
ities
Exp
ense
s2,
199,
283
2,
382,
546
2,
613,
166
2,
328,
847
2,
088,
496
2,
345,
603
2,35
3,67
4
2,
421,
927
2,81
6,27
9
2,
846,
331
Tot
al P
rim
ary
Gov
ernm
ent E
xpen
ses
45,0
39,9
59$
47,6
52,3
45
50
,034
,350
52,2
68,9
75
53
,302
,650
59,9
72,6
40
59,9
74,0
46
59,2
77,1
07
60,0
69,1
50
64,4
67,7
03$
Pro
gra
m R
even
ues
Gov
ernm
enta
l Act
iviti
es:
Cha
rges
for
Ser
vice
s:O
pera
ting
Gra
nts
and
Con
trib
utio
ns24
,723
,152
$
26
,742
,351
25,5
20,0
16
25
,645
,279
24,0
93,0
28
24
,587
,788
25,3
26,1
32
24,9
85,4
78
26,7
77,4
87
27,4
89,0
89$
Cap
i tal G
rant
s an
d C
ontr
ibut
ions
-
108,
240
129,
927
-
10
,061
-
-
-
-
10
7,79
5
Tot
al G
over
nmen
tal A
ctiv
ities
Pro
gram
Rev
enue
s24
,723
,152
26
,850
,591
25,6
49,9
43
25
,645
,279
24,1
03,0
89
24
,587
,788
25
,326
,132
24
,985
,478
26
,777
,487
27
,596
,884
Bus
ines
s-T
ype
Act
iviti
es:
Cha
rges
for
Ser
vice
s:F
ood
Ser
vice
773,
972
804,
509
811,
686
704,
158
610,
206
653,
165
61
6,17
3
615,
816
59
6,77
1
615,
767
O
pera
ting
Gra
nts
and
Con
trib
utio
ns1,
433,
730
1,
519,
454
1,
694,
507
1,
795,
273
1,
727,
844
1,
927,
686
1,97
2,96
2
2,
041,
698
2,44
8,01
4
2,
482,
238
Tot
al B
usin
ess-
Typ
e A
ctiv
ities
Pro
gram
Rev
enue
s2,
207,
702
2,
323,
963
2,
506,
193
2,
499,
431
2,
338,
050
2,
580,
851
2,58
9,13
5
2,
657,
514
3,04
4,78
5
3,
098,
005
Tot
al P
rim
ary
Gov
ernm
ent P
rogr
am R
even
ues
26,9
30,8
54$
29,1
74,5
54
28
,156
,136
28,1
44,7
10
26
,441
,139
27,1
68,6
39
27,9
15,2
67
27,6
42,9
92
29,8
22,2
72
30,6
94,8
89$
Net
(E
xpen
se)/
Rev
enu
eG
over
nmen
tal A
ctiv
ities
(18,
117,
524)
$
(18,
419,
208)
(2
1,77
1,24
1)
(24,
294,
849)
(2
7,11
1,06
5)
(3
3,03
9,24
9)
(32,
294,
240)
(3
1,86
9,70
2)
(30,
475,
384)
(3
4,02
4,48
8)$
Bus
ines
s-T
ype
Act
iviti
es8,
419
(58,
583)
(106
,973
)
170,
584
249,
554
235,
248
23
5,46
1
235,
587
22
8,50
6
251,
674
Tot
al P
rim
ary
Gov
ernm
ent N
et (
Exp
ense
)/R
even
ue(1
8,10
9,10
5)$
(1
8,47
7,79
1)
(21,
878,
214)
(2
4,12
4,26
5)
(26,
861,
511)
(32,
804,
001)
(3
2,05
8,77
9)
(31,
634,
115)
(3
0,24
6,87
8)
(33,
772,
814)
$
(Con
tinue
d)
LA
ST
TE
N F
ISC
AL
YE
AR
S(A
ccru
al B
asis
of
Acc
ou
nti
ng
)
UN
AU
DIT
ED
Fis
cal Y
ear
YO
RK
SC
HO
OL
DIS
TR
ICT
ON
EY
OR
K, S
OU
TH
CA
RO
LIN
A
CH
AN
GE
S IN
NE
T P
OS
ITIO
N
134
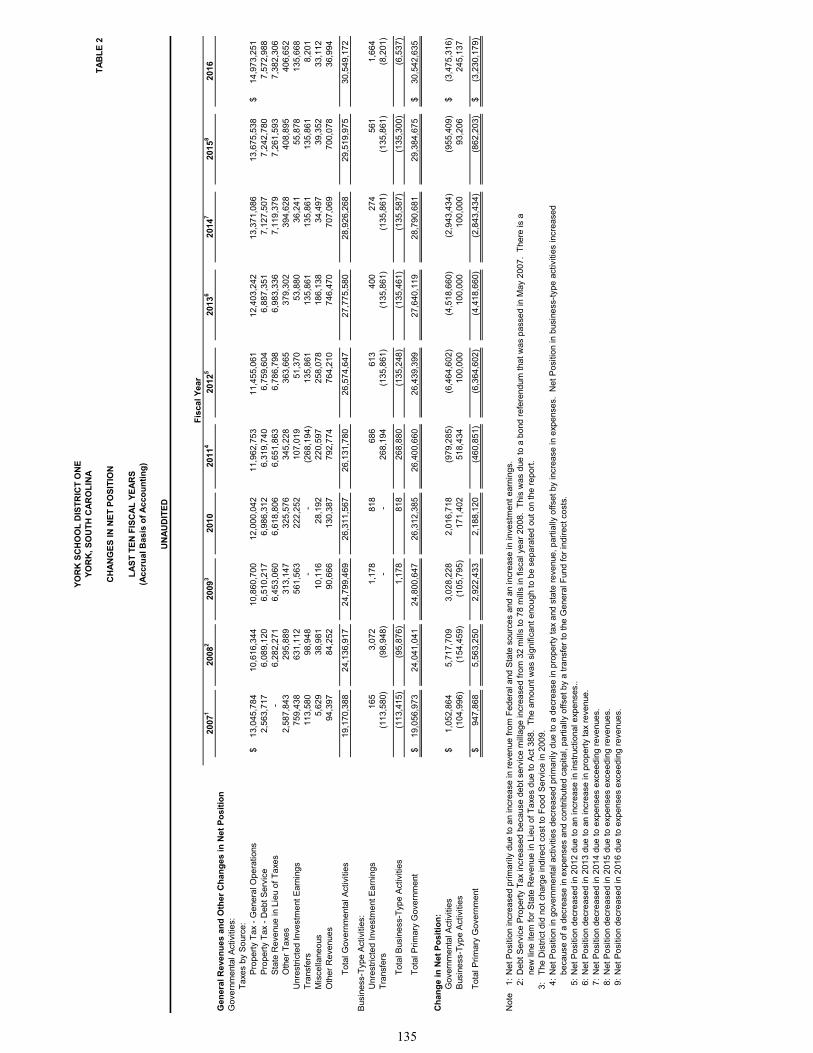
T
AB
LE
2
2007
120
082
2009
320
1020
114
2012
520
136
2014
720
158
2016
LA
ST
TE
N F
ISC
AL
YE
AR
S(A
ccru
al B
asis
of
Acc
ou
nti
ng
)
UN
AU
DIT
ED
Fis
cal Y
ear
YO
RK
SC
HO
OL
DIS
TR
ICT
ON
EY
OR
K, S
OU
TH
CA
RO
LIN
A
CH
AN
GE
S IN
NE
T P
OS
ITIO
N
Gen
eral
Rev
enu
es a
nd
Oth
er C
han
ges
in N
et P
osi
tio
nG
over
nmen
tal A
ctiv
ities
:T
axes
by
Sou
rce:
Pro
pert
y T
ax -
Gen
eral
Ope
ratio
ns13
,045
,784
$
10
,616
,344
10,8
60,7
00
12
,000
,042
11,9
62,7
53
11
,455
,061
12
,403
,242
13
,371
,086
13
,675
,538
14
,973
,251
$
P
rope
rty
Tax
- D
ebt S
ervi
ce2,
563,
717
6,
089,
120
6,
510,
217
6,
986,
312
6,
319,
740
6,
759,
604
6,88
7,35
1
7,
127,
507
7,24
2,78
0
7,
572,
988
Sta
te R
even
ue in
Lie
u of
Tax
es-
6,
282,
271
6,
453,
060
6,
618,
806
6,
651,
863
6,
786,
798
6,98
3,33
6
7,
119,
379
7,26
1,59
3
7,
382,
306
Oth
er T
axes
2,58
7,84
3
295,
889
313,
147
325,
576
345,
228
363,
665
37
9,30
2
394,
628
40
8,89
5
406,
652
U
nres
tric
ted
Inve
stm
ent E
arni
ngs
759,
438
631,
112
561,
563
222,
252
107,
019
51,3
70
53,8
80
36,2
41
55,8
78
135,
668
T
rans
fers
113,
580
98,9
48
-
-
(2
68,1
94)
13
5,86
1
135,
861
13
5,86
1
135,
861
8,
201
Mis
cella
neou
s5,
629
38,9
81
10
,116
28,1
92
22
0,59
7
25
8,07
8
186,
138
34
,497
39
,352
33
,112
O
ther
Rev
enue
s94
,397
84
,252
90,6
66
13
0,38
7
79
2,77
4
76
4,21
0
746,
470
70
7,06
9
700,
078
36
,994
Tot
al G
over
nmen
tal A
ctiv
ities
19,1
70,3
88
24,1
36,9
17
24
,799
,469
26,3
11,5
67
26
,131
,780
26,5
74,6
47
27,7
75,5
80
28,9
26,2
68
29,5
19,9
75
30,5
49,1
72
Bu s
ines
s-T
ype
Act
iviti
es:
Un r
estr
icte
d In
vest
men
t Ear
ning
s16
5
3,07
2
1,17
8
818
686
613
40
0
274
56
1
1,66
4
T
rans
fers
(113
,580
)
(9
8,94
8)
-
-
26
8,19
4
(1
35,8
61)
(135
,861
)
(1
35,8
61)
(135
,861
)
(8
,201
)
Tot
al B
usin
ess-
Typ
e A
ctiv
ities
(113
,415
)
(9
5,87
6)
1,
178
81
8
26
8,88
0
(1
35,2
48)
(135
,461
)
(1
35,5
87)
(135
,300
)
(6
,537
)
Tot
al P
rim
ary
Gov
ernm
ent
19,0
56,9
73$
24,0
41,0
41
24
,800
,647
26,3
12,3
85
26
,400
,660
26,4
39,3
99
27,6
40,1
19
28,7
90,6
81
29,3
84,6
75
30,5
42,6
35$
Ch
ang
e in
Net
Po
siti
on
:G
over
nmen
tal A
ctiv
ities
1,05
2,86
4$
5,71
7,70
9
3,02
8,22
8
2,01
6,71
8
(979
,285
)
(6,4
64,6
02)
(4
,518
,660
)
(2,9
43,4
34)
(9
55,4
09)
(3,4
75,3
16)
$
B
usin
ess-
Typ
e A
ctiv
ities
(104
,996
)
(1
54,4
59)
(1
05,7
95)
17
1,40
2
51
8,43
4
10
0,00
0
100,
000
10
0,00
0
93,2
06
245,
137
Tot
al P
rim
ary
Gov
ernm
ent
947,
868
$
5,56
3,25
0
2,92
2,43
3
2,18
8,12
0
(460
,851
)
(6,3
64,6
02)
(4
,418
,660
)
(2,8
43,4
34)
(8
62,2
03)
(3,2
30,1
79)
$
Not
e1:
Net
Pos
ition
incr
ease
d pr
imar
ily d
ue to
an
incr
ease
in r
even
ue fr
om F
eder
al a
nd S
tate
sou
rces
and
an
incr
ease
in in
vest
men
t ear
ning
s.2:
Deb
t Ser
vice
Pro
pert
y T
ax in
crea
sed
beca
use
debt
ser
vice
mill
age
incr
ease
d fr
om 3
2 m
ills
to 7
8 m
ills
in fi
scal
yea
r 20
08.
Thi
s w
as d
ue to
a b
ond
refe
rend
um th
at w
as p
asse
d in
May
200
7. T
here
is a
ne
w li
ne it
em fo
r S
tate
Rev
enue
in L
ieu
of T
axes
due
to A
ct 3
88.
The
am
ount
was
sig
nific
ant e
noug
h to
be
sepa
rate
d ou
t on
the
repo
rt.
3:T
he D
istr
ict d
id n
ot c
harg
e in
dire
ct c
ost t
o F
ood
Ser
vice
in 2
009.
4:N
et P
ositi
on in
gov
ernm
enta
l act
iviti
es d
ecre
ased
pri
mar
ily d
ue to
a d
ecre
ase
in p
rope
rty
tax
and
stat
e re
venu
e, p
artia
lly o
ffset
by
incr
ease
in e
xpen
ses.
Net
Pos
ition
in b
usin
ess-
type
act
iviti
es in
crea
sed
beca
use
of a
dec
reas
e in
exp
ense
s an
d co
ntri
bute
d ca
pita
l, pa
rtia
lly o
ffset
by
a tr
ansf
er to
the
Gen
eral
Fun
d fo
r in
dire
ct c
osts
.5:
Net
Pos
ition
dec
reas
ed in
201
2 du
e to
an
incr
ease
in in
stru
ctio
nal e
xpen
ses.
.6:
Net
Pos
ition
dec
reas
ed in
201
3 du
e to
an
incr
ease
in p
rope
rty
tax
reve
nue.
7:N
et P
ositi
on d
ecre
ased
in 2
014
due
to e
xpen
ses
exce
edin
g re
venu
es.
8:N
et P
ositi
on d
ecre
ased
in 2
015
due
to e
xpen
ses
exce
edin
g re
venu
es.
9:N
et P
ositi
on d
ecre
ased
in 2
016
due
to e
xpen
ses
exce
edin
g re
venu
es.
135
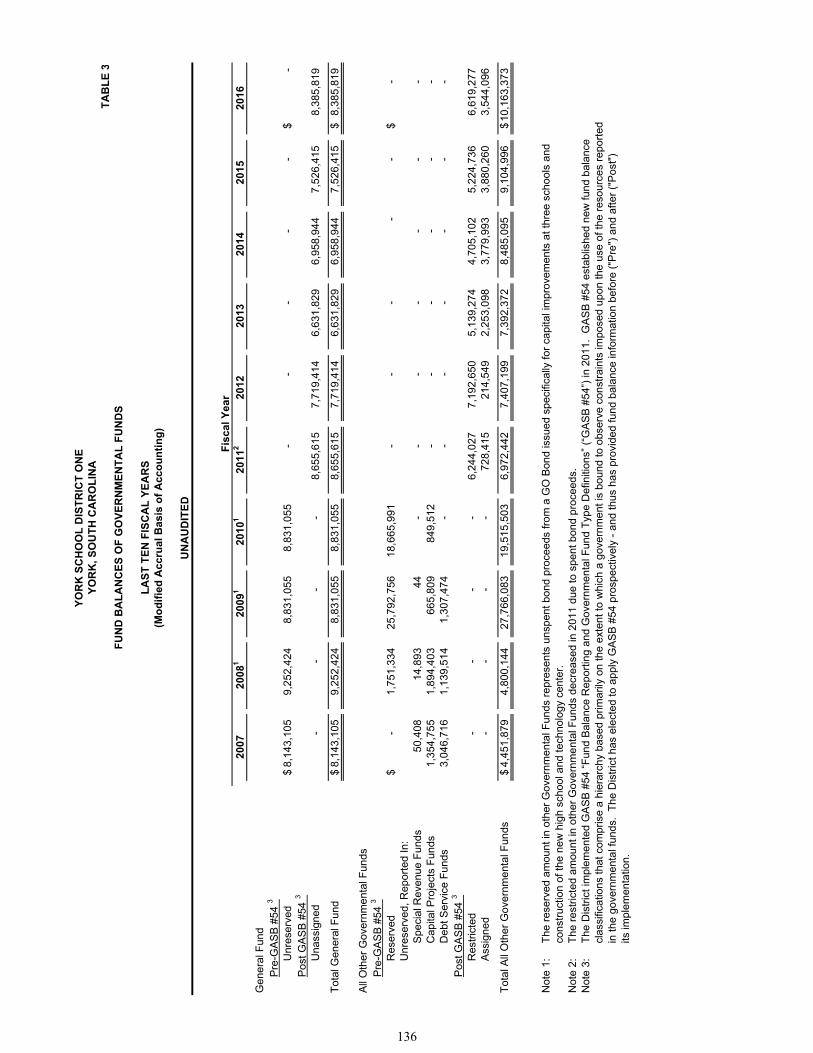
T
AB
LE
3
2007
2008
120
091
2010
120
112
2012
2013
2014
2015
2016
Gen
eral
Fun
dP
re-G
AS
B #
54 3
Unr
eser
ved
8,14
3,10
5$
9,25
2,42
4
8,
831,
055
8,83
1,05
5
-
-
-
-
-
-
$
P
ost G
AS
B #
54 3
Una
ssig
ned
-
-
-
-
8,65
5,61
5
7,
719,
414
6,63
1,82
9
6,
958,
944
7,52
6,41
5
8,
385,
819
Tot
al G
ener
al F
und
8,14
3,10
5$
9,25
2,42
4
8,
831,
055
8,83
1,05
5
8,
655,
615
7,71
9,41
4
6,
631,
829
6,95
8,94
4
7,
526,
415
8,38
5,81
9$
All
Oth
er G
over
nmen
tal F
unds
Pre
-GA
SB
#54
3
Res
erve
d-
$
1,
751,
334
25,7
92,7
56
18,6
65,9
91
-
-
-
-
-
-
$
Unr
eser
ved,
Rep
orte
d In
:S
peci
al R
even
ue F
unds
50,4
08
14,8
93
44
-
-
-
-
-
-
-
Cap
ital P
roje
cts
Fun
ds1,
354,
755
1,89
4,40
3
66
5,80
9
849,
512
-
-
-
-
-
-
Deb
t Ser
vice
Fun
ds3,
046,
716
1,13
9,51
4
1,
307,
474
-
-
-
-
-
-
-
P
ost G
AS
B #
54 3
Res
tric
ted
-
-
-
-
6,24
4,02
7
7,
192,
650
5,13
9,27
4
4,
705,
102
5,22
4,73
6
6,
619,
277
Ass
igne
d-
-
-
-
72
8,41
5
214,
549
2,
253,
098
3,77
9,99
3
3,
880,
260
3,54
4,09
6
Tot
al A
ll O
ther
Gov
ernm
enta
l Fun
ds4,
451,
879
$ 4,
800,
144
27,7
66,0
83
19,5
15,5
03
6,97
2,44
2
7,
407,
199
7,39
2,37
2
8,
485,
095
9,10
4,99
6
10
,163
,373
$
Not
e 1:
T
he r
eser
ved
amou
nt in
oth
er G
over
nmen
tal F
unds
rep
rese
nts
unsp
ent b
ond
proc
eeds
from
a G
O B
ond
issu
ed s
peci
fical
ly f
or c
apita
l im
prov
emen
ts a
t thr
ee s
choo
ls a
nd
co
nstr
uctio
n of
the
new
hig
h sc
hool
and
tech
nolo
gy c
ente
r.N
ote
2:T
he r
estr
icte
d am
ount
in o
ther
Gov
ernm
enta
l Fun
ds d
ecre
ase
d in
201
1 du
e to
spe
nt b
ond
proc
eeds
.N
ote
3:T
he D
istr
ict i
mpl
emen
ted
GA
SB
#54
“F
und
Bal
ance
Rep
ortin
g an
d G
over
nmen
tal F
und
Typ
e D
efin
ition
s” (
“GA
SB
#54
”) in
201
1. G
AS
B #
54 e
stab
lishe
d ne
w fu
nd b
alan
ce
clas
sific
atio
ns th
at c
ompr
ise
a hi
erar
chy
base
d pr
imar
ily o
n th
e ex
tent
to w
hich
a g
over
nmen
t is
boun
d to
obs
erve
con
stra
ints
impo
sed
upon
the
use
of th
e re
sour
ces
repo
rted
in th
e go
vern
men
tal f
unds
. T
he D
istr
ict h
as e
lect
ed to
app
ly G
AS
B #
54 p
rosp
ectiv
ely
- an
d th
us h
as p
rovi
ded
fund
bal
ance
info
rmat
ion
befo
re (
"Pre
") a
nd a
fter
("P
ost"
)its
impl
emen
tatio
n.
LA
ST
TE
N F
ISC
AL
YE
AR
S(M
od
ifie
d A
ccru
al B
asis
of
Acc
ou
nti
ng
)
UN
AU
DIT
ED
Fis
cal Y
ear
YO
RK
SC
HO
OL
DIS
TR
ICT
ON
EY
OR
K, S
OU
TH
CA
RO
LIN
A
FU
ND
BA
LA
NC
ES
OF
GO
VE
RN
ME
NT
AL
FU
ND
S
136

T
AB
LE
4
2007
2008
2009
120
102
2011
320
1220
1320
144
2015
520
16R
even
ues
Loca
l Sou
rces
:T
axes
by
Sou
rce:
Pro
pert
y T
ax -
Gen
eral
Ope
ratio
ns12
,899
,509
$
10,4
59,2
82
10
,523
,477
11,6
39,1
10
11
,292
,158
12,0
72,6
13
12,2
84,5
22
13,0
70,6
76
13,4
91,3
32
14,5
85,8
62$
Pro
pert
y T
ax -
Deb
t Ser
vice
2,54
3,97
4
5,91
6,83
2
6,31
7,14
0
6,85
4,79
2
6,48
8,27
2
6,89
3,79
1
6,83
9,68
3
7,
031,
199
7,20
6,95
9
7,
417,
749
Inve
stm
ent E
arni
ngs
759,
438
631,
112
561,
563
222,
252
107,
019
51,3
70
53,8
80
36,2
41
55,8
78
135,
668
O
ther
Loc
al S
ourc
es51
9,59
6
34
5,83
9
43
8,71
8
57
6,25
0
62
7,87
1
79
7,22
3
1,
293,
053
565,
728
32
6,96
8
682,
174
S
tate
Sou
rces
23,3
36,2
15
29
,624
,480
28,4
02,8
67
25
,537
,127
24,9
43,9
76
27
,191
,788
27
,722
,640
28
,189
,450
30
,627
,623
31
,461
,985
F
eder
al S
ourc
es3,
447,
741
3,
488,
699
3,
565,
244
6,
487,
631
6,
417,
286
4,
714,
540
4,
566,
435
4,42
9,80
0
4,
188,
683
3,27
4,79
5
In
terg
over
nmen
tal R
even
ue10
7,46
9
92
,966
110,
103
147,
232
124,
419
56,9
87
39,2
46
56,0
70
44,1
29
36,9
94
Tot
al R
even
ues
43,6
13,9
42
50
,559
,210
49,9
19,1
12
51
,464
,394
50,0
01,0
01
51
,778
,312
52
,799
,459
53
,379
,164
55
,941
,572
57
,595
,227
Exp
end
itu
res
Cur
rent
:In
stru
ctio
n25
,095
,555
$
26,5
43,6
04
27
,585
,814
27,4
40,1
70
25
,932
,428
27,0
84,3
09
27,1
88,0
35
26,2
08,6
04
26,8
05,3
87
27,8
61,8
12$
Sup
port
Ser
vice
s14
,696
,009
19,5
81,6
22
16
,549
,787
17,6
44,6
25
18
,716
,637
20,1
64,5
98
19,3
02,7
00
18,6
11,8
77
19,8
44,1
89
20,5
95,6
77
Inte
rgov
ernm
enta
l12
7,53
4
79
,628
87,1
81
67
,981
66,7
58
10
2,56
1
10
4,69
0
82,6
24
82,0
61
121,
230
C
apita
l Out
lay
1,50
0,31
2
302,
965
42,9
86,5
55
48
,231
,550
11,2
55,3
04
1,
036,
352
23
7,79
5
156,
203
38
0,92
2
805,
670
D
ebt S
ervi
ce:
Prin
cipa
l1,
555,
000
1,
960,
000
1,
215,
000
1,
280,
000
1,
535,
000
7,
940,
000
1,
739,
000
2,00
3,00
0
37
,959
,000
2,
467,
000
Inte
rest
and
Fis
cal C
harg
es66
8,79
9
73
2,75
5
57
6,04
3
4,
169,
007
5,
448,
658
5,
531,
424
5,
182,
558
5,02
1,64
8
4,
913,
319
3,96
3,93
1
O
ther
Cha
rges
-
-
232,
162
843,
465
16,7
17
14
2,53
8
28
2,95
4
11,2
31
175,
284
43
5,02
9
Tot
al E
xpen
ditu
res
43,6
43,2
09
49
,200
,574
89,2
32,5
42
99
,676
,798
62,9
71,5
02
62
,001
,782
54
,037
,732
52
,095
,187
90
,160
,162
56
,250
,349
Exc
ess
of R
even
ues
Ove
r (U
nder
) E
xpen
ditu
res
(29,
267)
$
1,35
8,63
6
(39,
313,
430)
(48,
212,
404)
(12,
970,
501)
(10,
223,
470)
(1,2
38,2
73)
1,
283,
977
(34,
218,
590)
1,
344,
878
$
(C
ontin
ued)
Fis
cal Y
ear
YO
RK
SC
HO
OL
DIS
TR
ICT
ON
EY
OR
K, S
OU
TH
CA
RO
LIN
A
CH
AN
GE
S IN
FU
ND
BA
LA
NC
ES
OF
GO
VE
RN
ME
NT
AL
FU
ND
S
LA
ST
TE
N F
ISC
AL
YE
AR
S(M
od
ifie
d A
ccru
al B
asis
of
Acc
ou
nti
ng
)
UN
AU
DIT
ED
137
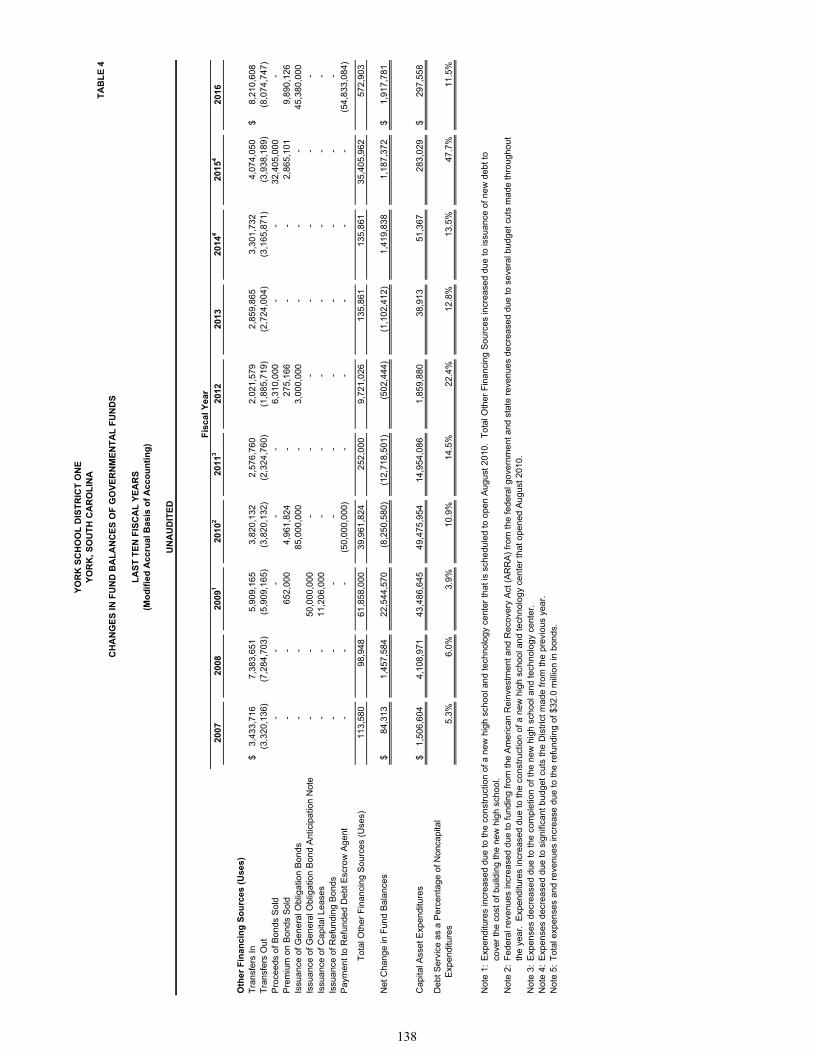
T
AB
LE
4
2007
2008
2009
120
102
2011
320
1220
1320
144
2015
420
16
Oth
er F
inan
cin
g S
ou
rces
(U
ses)
Tra
nsfe
rs In
3,43
3,71
6$
7,38
3,65
1
5,90
9,16
5
3,82
0,13
2
2,57
6,76
0
2,02
1,57
9
2,85
9,86
5
3,
301,
732
4,07
4,05
0
8,
210,
608
$
Tra
nsfe
rs O
ut(3
,320
,136
)
(7
,284
,703
)
(5
,909
,165
)
(3
,820
,132
)
(2
,324
,760
)
(1
,885
,719
)
(2,7
24,0
04)
(3,1
65,8
71)
(3,9
38,1
89)
(8,0
74,7
47)
P
roce
eds
of B
onds
Sol
d-
-
-
-
-
6,31
0,00
0
-
-
32,4
05,0
00
-
Pre
miu
m o
n B
onds
Sol
d-
-
65
2,00
0
4,
961,
824
-
275,
166
-
-
2,86
5,10
1
9,
890,
126
Issu
ance
of G
ener
al O
blig
atio
n B
onds
-
-
85,0
00,0
00
-
3,00
0,00
0
-
-
-
45,3
80,0
00
Issu
ance
of G
ener
al O
blig
atio
n B
ond
Ant
icip
atio
n N
ote
-
-
50,0
00,0
00
-
-
-
-
-
-
-
Is
suan
ce o
f Cap
ital L
ease
s-
-
11
,206
,000
-
-
-
-
-
-
-
Issu
ance
of R
efun
ding
Bon
ds-
-
-
-
-
-
-
-
-
-
Pay
men
t to
Ref
unde
d D
ebt E
scro
w A
gent
-
-
-
(5
0,00
0,00
0)
-
-
-
-
-
(54,
833,
084)
Tot
al O
ther
Fin
anci
ng S
ourc
es (
Use
s)11
3,58
0
98
,948
61,8
58,0
00
39
,961
,824
252,
000
9,72
1,02
6
135,
861
13
5,86
1
35,4
05,9
62
572,
903
Net
Cha
nge
in F
und
Bal
ance
s84
,313
$
1,45
7,58
4
22,5
44,5
70
(8
,250
,580
)
(1
2,71
8,50
1)
(5
02,4
44)
(1,1
02,4
12)
1,
419,
838
1,18
7,37
2
1,
917,
781
$
Cap
ital A
sset
Exp
endi
ture
s1,
506,
604
$
4,
108,
971
43
,486
,645
49,4
75,9
54
14
,954
,086
1,85
9,88
0
38,9
13
51,3
67
283,
029
29
7,55
8$
Deb
t Ser
vice
as
a P
erce
ntag
e of
Non
capi
tal
Exp
endi
ture
s5.
3%6.
0%3.
9%10
.9%
14.5
%22
.4%
12.8
%13
.5%
47.7
%11
.5%
Not
e 1:
Exp
endi
ture
s in
crea
sed
due
to th
e co
nstr
uctio
n of
a n
ew h
igh
scho
ol a
nd te
chno
logy
cen
ter
that
is s
ched
uled
to o
pen
Aug
ust 2
010.
Tot
al O
ther
Fin
anci
ng S
ourc
es in
crea
sed
due
to is
sua
nce
of n
ew d
ebt t
o co
ver
the
cost
of b
uild
ing
the
new
hig
h sc
hool
.N
ote
2:F
eder
al r
even
ues
incr
ease
d du
e to
fund
ing
from
the
Am
eric
an R
einv
estm
ent a
nd R
ecov
ery
Act
(A
RR
A)
from
the
fede
ral g
over
nmen
t and
sta
te r
even
ues
decr
ease
d du
e to
sev
eral
bud
get c
uts
mad
e th
roug
hout
th
e ye
ar.
Exp
endi
ture
s in
crea
sed
due
to th
e co
nstr
uctio
n of
a n
ew h
igh
scho
ol a
nd te
chno
logy
cen
ter
that
ope
ned
Aug
ust 2
010.
Not
e 3:
Exp
ense
s de
crea
sed
due
to th
e co
mpl
etio
n of
the
new
hig
h s
choo
l and
tech
nolo
gy c
ente
r.N
ote
4:E
xpen
ses
decr
ease
d du
e to
sig
nific
ant b
udge
t cut
s th
e D
istr
ict m
ade
from
the
prev
ious
yea
r.N
ote
5:T
otal
exp
ense
s an
d re
venu
es in
crea
se d
ue to
the
refu
ndin
g of
$32
.0 m
illio
n in
bon
ds.
Fis
cal Y
ear
YO
RK
SC
HO
OL
DIS
TR
ICT
ON
EY
OR
K, S
OU
TH
CA
RO
LIN
A
CH
AN
GE
S IN
FU
ND
BA
LA
NC
ES
OF
GO
VE
RN
ME
NT
AL
FU
ND
S
LA
ST
TE
N F
ISC
AL
YE
AR
S(M
od
ifie
d A
ccru
al B
asis
of
Acc
ou
nti
ng
)
UN
AU
DIT
ED
138
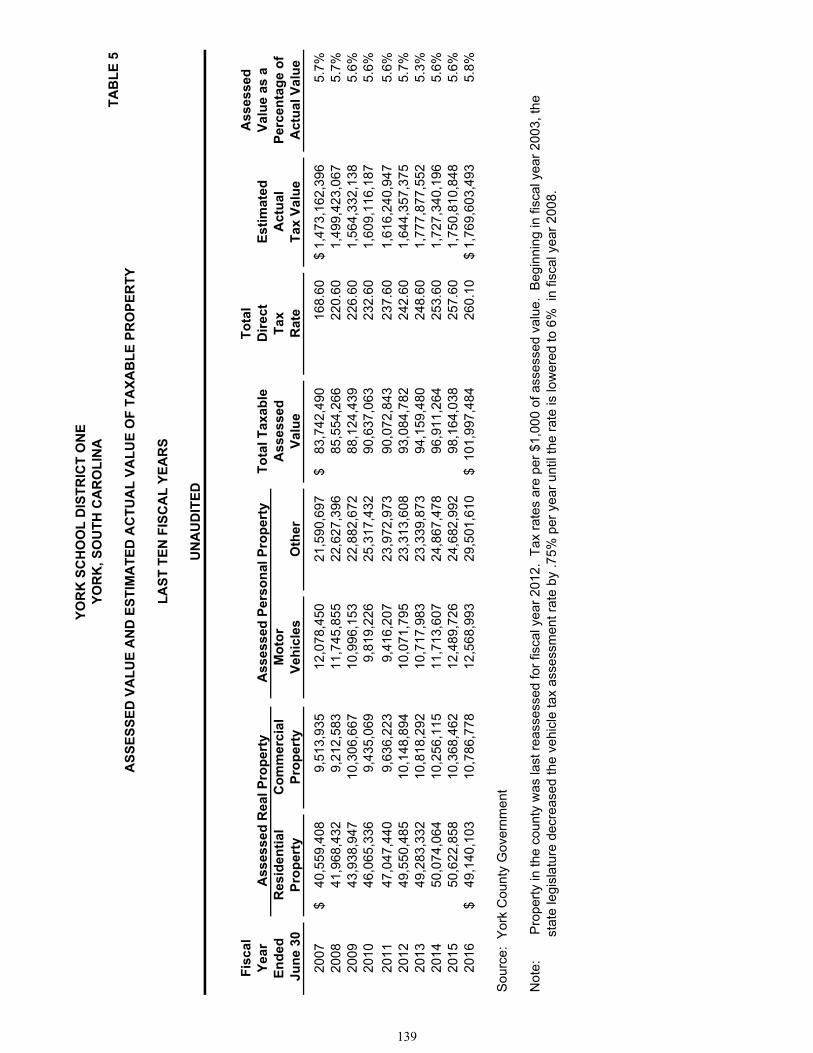
TA
BL
E 5
Fis
cal
To
tal
Ass
esse
dY
ear
To
tal T
axab
leD
irec
tE
stim
ated
Val
ue
as a
En
ded
Res
iden
tial
Co
mm
erci
alM
oto
rA
sses
sed
Tax
Act
ual
Per
cen
tag
e o
f J
un
e 30
Pro
per
tyP
rop
erty
Veh
icle
sO
ther
Val
ue
Rat
eT
ax V
alu
eA
ctu
al V
alu
e
2007
40,5
59,4
08$
9,
513,
935
12
,078
,450
21,5
90,6
97
83
,742
,490
$
168.
60
1,47
3,16
2,39
6$
5.7%
2008
41,9
68,4
32
9,
212,
583
11
,745
,855
22,6
27,3
96
85
,554
,266
220.
60
1,49
9,42
3,06
7
5.7%
2009
43,9
38,9
47
10
,306
,667
10,9
96,1
53
22
,882
,672
88,1
24,4
39
22
6.60
1,
564,
332,
138
5.
6%20
1046
,065
,336
9,43
5,06
9
9,81
9,22
6
25,3
17,4
32
90
,637
,063
232.
60
1,60
9,11
6,18
7
5.6%
2011
47,0
47,4
40
9,
636,
223
9,
416,
207
23
,972
,973
90,0
72,8
43
23
7.60
1,
616,
240,
947
5.
6%20
1249
,550
,485
10,1
48,8
94
10
,071
,795
23,3
13,6
08
93
,084
,782
242.
60
1,64
4,35
7,37
5
5.7%
2013
49,2
83,3
32
10
,818
,292
10,7
17,9
83
23
,339
,873
94,1
59,4
80
24
8.60
1,
777,
877,
552
5.
3%20
1450
,074
,064
10,2
56,1
15
11
,713
,607
24,8
67,4
78
96
,911
,264
253.
60
1,72
7,34
0,19
6
5.6%
2015
50,6
22,8
58
10
,368
,462
12,4
89,7
26
24
,682
,992
98,1
64,0
38
25
7.60
1,
750,
810,
848
5.
6%20
1649
,140
,103
$
10,7
86,7
78
12
,568
,993
29,5
01,6
10
10
1,99
7,48
4$
26
0.10
1,
769,
603,
493
$ 5.
8%
Sou
rce:
Yor
k C
ount
y G
over
nmen
t
Not
e:
P
rope
rty
in th
e co
unty
was
last
rea
sses
sed
for
fisca
l yea
r 20
12.
Tax
rat
es a
re p
er $
1,00
0 of
ass
esse
d va
lue.
Beg
inni
ng in
fisc
al y
ear
2003
, the
stat
e le
gisl
atur
e de
crea
sed
the
vehi
cle
tax
asse
ssm
ent r
ate
by .7
5% p
er y
ear
until
the
rate
is lo
wer
ed to
6%
in
fisca
l yea
r 20
08.
YO
RK
SC
HO
OL
DIS
TR
ICT
ON
EY
OR
K, S
OU
TH
CA
RO
LIN
A
AS
SE
SS
ED
VA
LU
E A
ND
ES
TIM
AT
ED
AC
TU
AL
VA
LU
E O
F T
AX
AB
LE
PR
OP
ER
TY
Ass
esse
d R
eal P
rop
erty
Ass
esse
d P
erso
nal
Pro
per
ty
LA
ST
TE
N F
ISC
AL
YE
AR
S
UN
AU
DIT
ED
139

TA
BL
E 6
Fis
cal
To
tal
Yea
rD
ebt
Yo
rk C
ou
nty
Yo
rk C
ou
nty
Dir
ect
and
En
ded
Op
erat
ing
Ser
vice
To
tal
Cit
y o
f Y
ork
Inco
rpo
rate
dU
nin
corp
ora
ted
2O
verl
app
ing
Ju
ne
30M
illag
eM
illag
e3
Mill
age
Mill
age
Mill
age
Mill
age
Rat
es
2007
136.
6032
.00
168.
6011
5.00
62.6
09.
4035
5.60
2008
142.
6078
.00
220.
6011
5.00
66.0
09.
4041
1.00
2009
148.
6078
.00
226.
6011
5.00
66.0
09.
6041
7.20
2010
154.
6078
.00
232.
6011
5.00
66.0
09.
6042
3.20
2011
159.
6078
.00
237.
6011
5.00
66.0
09.
6042
8.20
2012
164.
6078
.00
242.
6011
5.00
62.5
09.
4042
9.50
2013
170.
6078
.00
248.
6011
5.00
64.5
09.
4043
7.50
2014
175.
6078
.00
253.
6011
5.00
64.5
09.
4044
2.50
2015
179.
6078
.00
257.
6011
7.20
68.7
09.
4045
2.90
2016
182.
1078
.00
260.
1011
7.20
69.7
09.
6045
6.60
Sou
rce:
Yor
k S
choo
l Dis
tric
t One
and
Yor
k C
ount
y G
over
nmen
t
rat
es a
pply
to a
ll of
the
Yor
k S
choo
l Dis
tric
t pro
pert
y ow
ners
(i.e
., th
e ra
tes
for
spec
ial d
istr
icts
app
ly o
nly
to th
e pr
opor
tion
of th
e Y
ork
Sch
ool D
istr
ict's
pro
pert
y ow
ners
who
se p
rope
rty
is lo
cate
d w
ithin
the
geog
raph
ic b
ound
arie
s of
the
spec
ial d
istr
ict)
.
2: T
he U
ninc
orpo
rate
d ta
x ra
tes
for
Yor
k C
ount
y ar
e le
vied
on
all p
rope
rty
for
taxp
ayer
s w
ho d
o no
t res
ide
with
in a
mun
icip
ality
.
3: I
n 20
08, D
ebt S
ervi
ce m
illag
e in
crea
sed
46 m
ills
due
to a
n $8
5 m
illio
n bo
nd r
efer
endu
m th
at w
as p
asse
d in
May
200
7.
PR
OP
ER
TY
TA
X R
AT
ES
- D
IRE
CT
AN
D O
VE
RL
AP
PIN
G G
OV
ER
NM
EN
TS
YO
RK
, SO
UT
H C
AR
OL
INA
YO
RK
SC
HO
OL
DIS
TR
ICT
ON
E
Not
e 1:
Ove
rlapp
ing
rate
s ar
e th
ose
of lo
cal a
nd c
ount
y go
vern
men
ts th
at a
pply
to p
rope
rty
owne
rs w
ithin
the
Yor
k S
choo
l Dis
tric
t. N
ot a
ll ov
erla
ppin
g
Yo
rk S
cho
ol D
istr
ict
On
e
Ove
rlap
pin
g R
ates
1
LA
ST
TE
N F
ISC
AL
YE
AR
S
UN
AU
DIT
ED
140
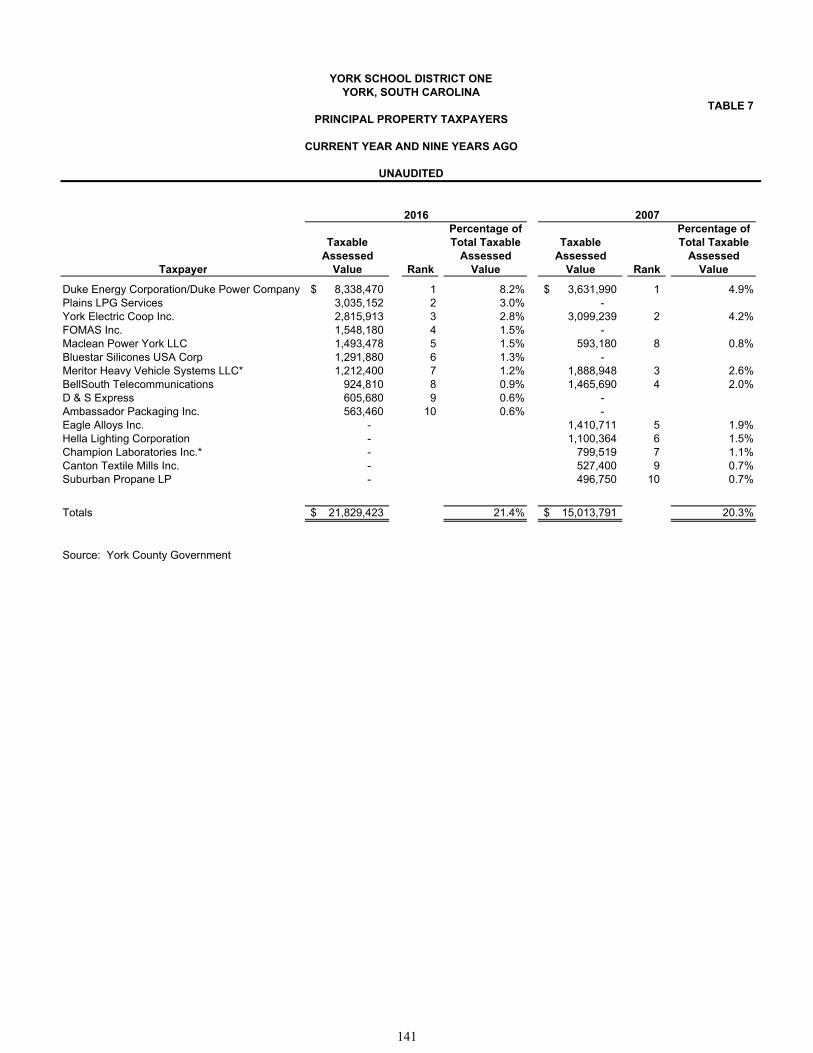
YORK SCHOOL DISTRICT ONEYORK, SOUTH CAROLINA
TABLE 7PRINCIPAL PROPERTY TAXPAYERS
Percentage of Percentage ofTaxable Total Taxable Taxable Total Taxable
Assessed Assessed Assessed AssessedTaxpayer Value Rank Value Value Rank Value
Duke Energy Corporation/Duke Power Company 8,338,470$ 1 8.2% 3,631,990$ 1 4.9%Plains LPG Services 3,035,152 2 3.0% - York Electric Coop Inc. 2,815,913 3 2.8% 3,099,239 2 4.2%FOMAS Inc. 1,548,180 4 1.5% - Maclean Power York LLC 1,493,478 5 1.5% 593,180 8 0.8%Bluestar Silicones USA Corp 1,291,880 6 1.3% - Meritor Heavy Vehicle Systems LLC* 1,212,400 7 1.2% 1,888,948 3 2.6%BellSouth Telecommunications 924,810 8 0.9% 1,465,690 4 2.0%D & S Express 605,680 9 0.6% - Ambassador Packaging Inc. 563,460 10 0.6% - Eagle Alloys Inc. - 1,410,711 5 1.9%Hella Lighting Corporation - 1,100,364 6 1.5%Champion Laboratories Inc.* - 799,519 7 1.1%Canton Textile Mills Inc. - 527,400 9 0.7%Suburban Propane LP - 496,750 10 0.7%
Totals 21,829,423$ 21.4% 15,013,791$ 20.3%
Source: York County Government
2016
CURRENT YEAR AND NINE YEARS AGO
2007
UNAUDITED
141
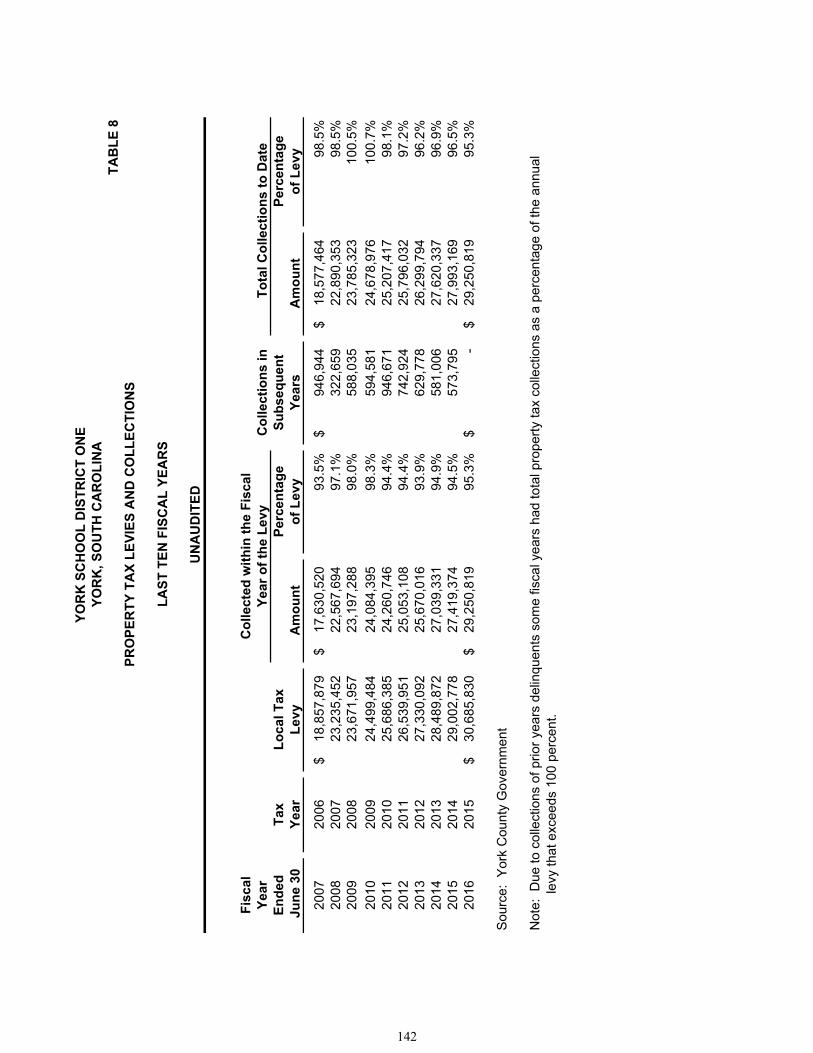
TA
BL
E 8
Fis
cal
Yea
rC
olle
ctio
ns
inE
nd
edT
axL
oca
l Tax
Per
cen
tag
eS
ub
seq
uen
tP
erce
nta
ge
Ju
ne
30Y
ear
Lev
yA
mo
un
to
f L
evy
Yea
rsA
mo
un
to
f L
evy
2007
2006
18,8
57,8
79$
17,6
30,5
20$
93.5
%94
6,94
4$
18
,577
,464
$
98
.5%
2008
2007
23,2
35,4
52
22,5
67,6
94
97.1
%32
2,65
9
22
,890
,353
98
.5%
2009
2008
23,6
71,9
57
23,1
97,2
88
98.0
%58
8,03
5
23
,785
,323
10
0.5%
2010
2009
24,4
99,4
84
24,0
84,3
95
98.3
%59
4,58
1
24
,678
,976
10
0.7%
2011
2010
25,6
86,3
85
24,2
60,7
46
94.4
%94
6,67
1
25
,207
,417
98
.1%
2012
2011
26,5
39,9
51
25,0
53,1
08
94.4
%74
2,92
4
25
,796
,032
97
.2%
2013
2012
27,3
30,0
92
25,6
70,0
16
93.9
%62
9,77
8
26
,299
,794
96
.2%
2014
2013
28,4
89,8
72
27,0
39,3
31
94.9
%58
1,00
6
27
,620
,337
96
.9%
2015
2014
29,0
02,7
78
27,4
19,3
74
94.5
%57
3,79
5
27
,993
,169
96
.5%
2016
2015
30,6
85,8
30$
29,2
50,8
19$
95.3
%-
$
29,2
50,8
19$
95.3
%
Sou
rce:
Yor
k C
ount
y G
over
nmen
t
Not
e: D
ue to
col
lect
ions
of p
rior
year
s de
linqu
ents
som
e fis
cal y
ears
had
tota
l pro
pert
y ta
x co
llect
ions
as
a pe
rcen
tage
of t
he a
nnua
l le
vy th
at e
xcee
ds 1
00 p
erce
nt.
YO
RK
SC
HO
OL
DIS
TR
ICT
ON
EY
OR
K, S
OU
TH
CA
RO
LIN
A
PR
OP
ER
TY
TA
X L
EV
IES
AN
D C
OL
LE
CT
ION
S
T
ota
l Co
llect
ion
s to
Dat
eC
olle
cted
wit
hin
th
e F
isca
lY
ear
of
the
Lev
y
LA
ST
TE
N F
ISC
AL
YE
AR
S
UN
AU
DIT
ED
142

TABLE 9
FiscalYear General Total Percentage
Ended Obligation Capital Primary of Personal Per June 30 Bonds Leases Government Income Capita
2007 14,135,000$ - 14,135,000$ 0.2% 68$ 2008 12,175,000 - 12,175,000 0.2% 56
2009160,960,000 11,206,000 72,166,000 1.0% 318
2010 94,680,000 11,206,000 105,886,000 1.4% 468 2011 93,345,000 11,006,000 104,351,000 1.3% 453 2012 99,299,000 10,806,000 110,105,000 1.3% 469 2013 97,479,790 10,567,000 108,046,790 1.2% 451 2014 95,530,582 10,193,000 105,723,582 1.1% 431$ 2015 92,820,916 9,604,000 102,424,916 N/A N/A2016 84,223,691$ 8,852,000 93,075,691$ N/A N/A
Note: Details regarding the York School District One's outstanding debt can be found in the notes to the financial statements. See the Schedule of Demographic and Economic Statistics for personal income and population data.N/A = Not Available
Note 1: The District issued $61,206,000 million in debt in Fiscal Year 2009. $11,206,000 was an Equipment Acquisition Lease.
Note 2: Fiscal years 2012, 2013, 2014, 2015 and 2016 are shown net of related premiums, discounts, and adjustments.
YORK SCHOOL DISTRICT ONEYORK, SOUTH CAROLINA
RATIOS OF OUTSTANDING DEBT BY TYPE
Governmental Activities
LAST TEN FISCAL YEARS
UNAUDITED
143
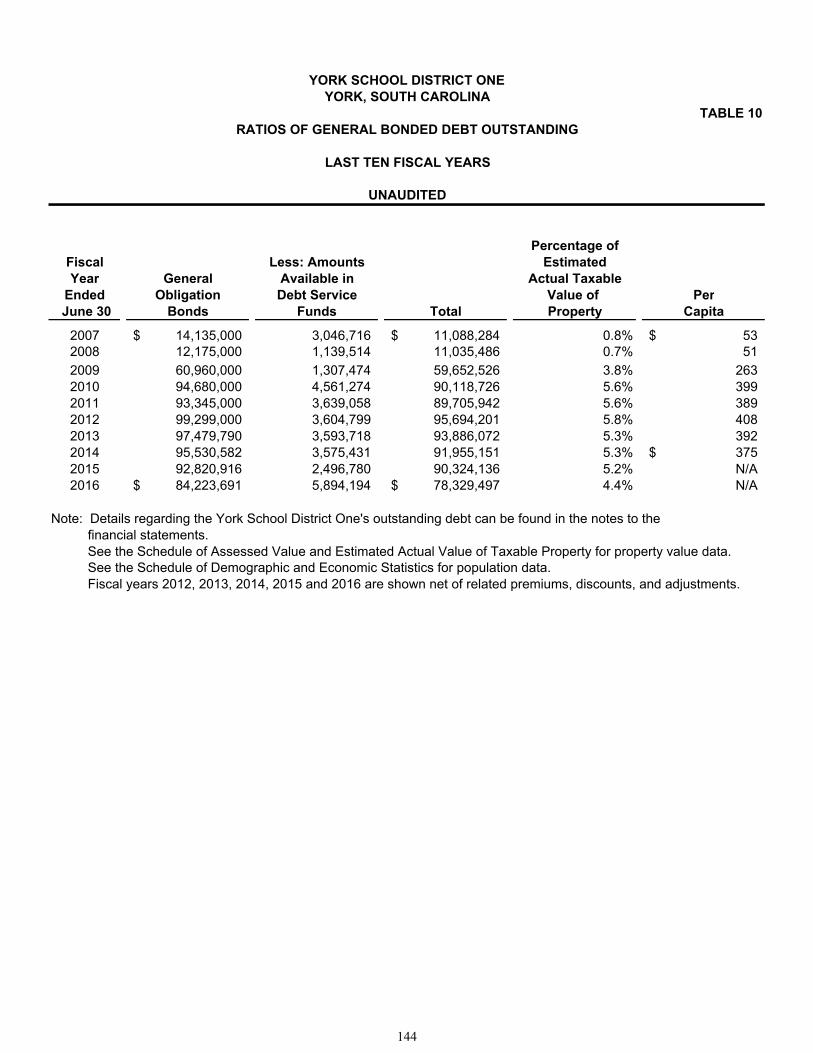
TABLE 10
Percentage ofFiscal Less: Amounts EstimatedYear General Available in Actual Taxable
Ended Obligation Debt Service Value of Per June 30 Bonds Funds Total Property Capita
2007 14,135,000$ 3,046,716 11,088,284$ 0.8% 53$ 2008 12,175,000 1,139,514 11,035,486 0.7% 51
2009 60,960,000 1,307,474 59,652,526 3.8% 263 2010 94,680,000 4,561,274 90,118,726 5.6% 399 2011 93,345,000 3,639,058 89,705,942 5.6% 389 2012 99,299,000 3,604,799 95,694,201 5.8% 408 2013 97,479,790 3,593,718 93,886,072 5.3% 392 2014 95,530,582 3,575,431 91,955,151 5.3% 375$ 2015 92,820,916 2,496,780 90,324,136 5.2% N/A2016 84,223,691$ 5,894,194 78,329,497$ 4.4% N/A
See the Schedule of Demographic and Economic Statistics for population data. Fiscal years 2012, 2013, 2014, 2015 and 2016 are shown net of related premiums, discounts, and adjustments.
See the Schedule of Assessed Value and Estimated Actual Value of Taxable Property for property value data.
LAST TEN FISCAL YEARS
UNAUDITED
YORK SCHOOL DISTRICT ONEYORK, SOUTH CAROLINA
RATIOS OF GENERAL BONDED DEBT OUTSTANDING
Note: Details regarding the York School District One's outstanding debt can be found in the notes to the financial statements.
144
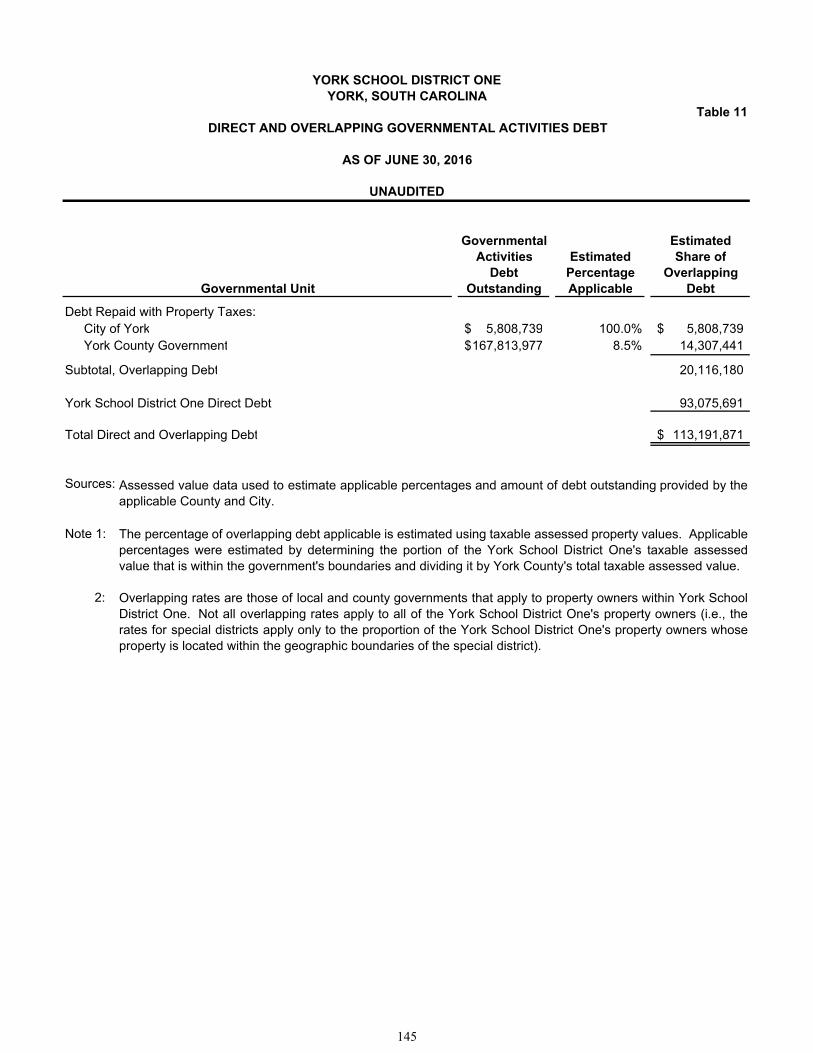
Table 11
Governmental EstimatedActivities Estimated Share of
Debt Percentage OverlappingOutstanding Applicable Debt
Debt Repaid with Property Taxes:City of York 5,808,739$ 100.0% 5,808,739$ York County Government 167,813,977$ 8.5% 14,307,441
Subtotal, Overlapping Debt 20,116,180
York School District One Direct Debt 93,075,691
Total Direct and Overlapping Debt 113,191,871$
Sources:
Note 1:
2:
YORK SCHOOL DISTRICT ONEYORK, SOUTH CAROLINA
DIRECT AND OVERLAPPING GOVERNMENTAL ACTIVITIES DEBT
Overlapping rates are those of local and county governments that apply to property owners within York SchoolDistrict One. Not all overlapping rates apply to all of the York School District One's property owners (i.e., therates for special districts apply only to the proportion of the York School District One's property owners whoseproperty is located within the geographic boundaries of the special district).
Governmental Unit
Assessed value data used to estimate applicable percentages and amount of debt outstanding provided by theapplicable County and City.
The percentage of overlapping debt applicable is estimated using taxable assessed property values. Applicablepercentages were estimated by determining the portion of the York School District One's taxable assessedvalue that is within the government's boundaries and dividing it by York County's total taxable assessed value.
AS OF JUNE 30, 2016
UNAUDITED
145
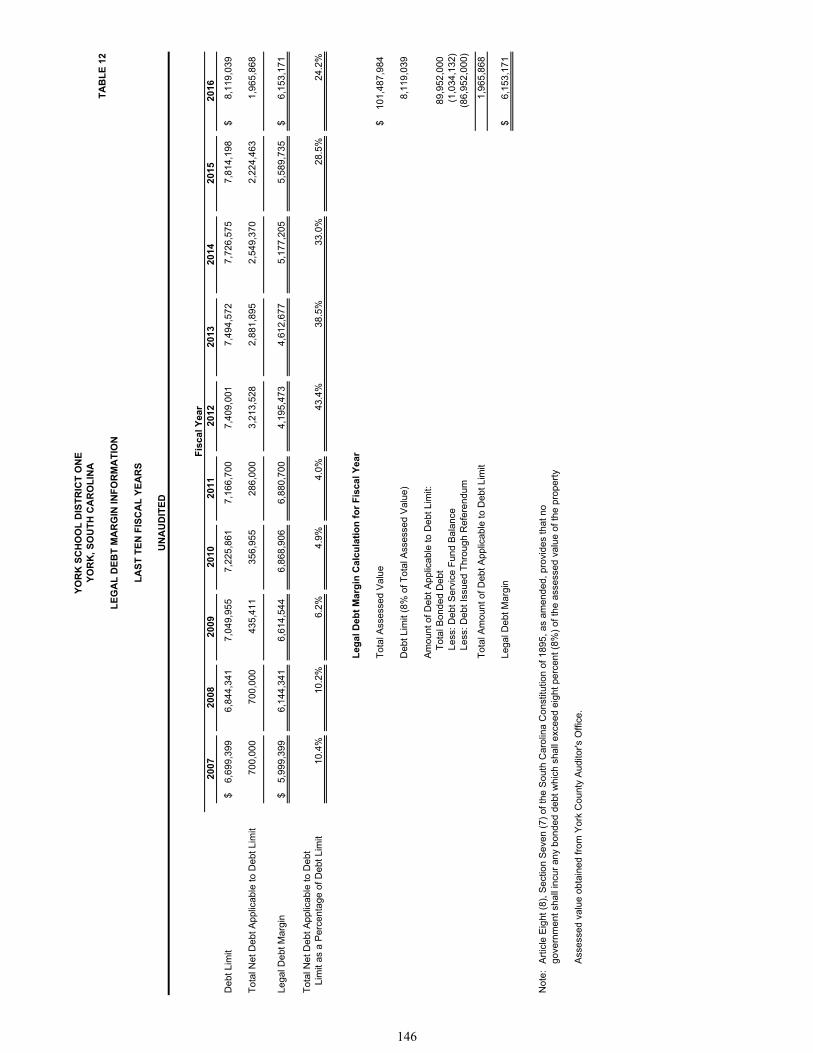
T
AB
LE
12
2007
2008
2009
2010
2011
2012
2013
201
420
1520
16
Deb
t Lim
it6,
699,
399
$
6,
844,
341
7,
049,
955
7,
225,
861
7,16
6,70
0
7,
409,
001
7,
494,
572
7,72
6,57
5
7,
814,
198
8,11
9,03
9$
Tot
al N
et D
ebt A
pplic
able
to D
ebt L
imit
700,
000
700,
000
435,
411
356,
955
28
6,00
0
3,21
3,52
8
2,88
1,89
5
2,
549,
370
2,22
4,46
3
1,
965,
868
Lega
l Deb
t Mar
gin
5,99
9,39
9$
6,14
4,34
1
6,61
4,54
4
6,86
8,90
6
6,
880,
700
4,19
5,47
3
4,61
2,67
7
5,
177,
205
5,58
9,73
5
6,
153,
171
$
Tot
al N
et D
ebt A
pplic
able
to D
ebt
Li
mit
as a
Per
cent
age
of D
ebt L
imit
10.4
%10
.2%
6.2%
4.9%
4.0%
43.4
%38
.5%
33.0
%28
.5%
24.2
%
Leg
al D
ebt
Mar
gin
Cal
cula
tio
n f
or
Fis
cal Y
ear
Tot
al A
sses
sed
Val
ue10
1,48
7,98
4$
Deb
t Lim
it (8
% o
f Tot
al A
sses
sed
Val
ue)
8,11
9,03
9
Am
ount
of D
ebt A
pplic
able
to D
ebt L
imit:
Tot
al B
onde
d D
ebt
89,9
52,0
00
Less
: Deb
t Ser
vice
Fun
d B
alan
ce(1
,034
,132
)
Le
ss: D
ebt I
ssue
d T
hrou
gh R
efer
endu
m(8
6,95
2,00
0)
Tot
al A
mou
nt o
f Deb
t App
licab
le to
Deb
t Lim
it1,
965,
868
Lega
l Deb
t Mar
gin
6,15
3,17
1$
Not
e:
Ass
esse
d va
lue
obta
ined
from
Yor
k C
ount
y A
udito
r's O
ffice
.
LA
ST
TE
N F
ISC
AL
YE
AR
S
UN
AU
DIT
ED
Fis
cal Y
ear
Art
icle
Eig
ht (
8), S
ectio
n S
even
(7)
of t
he S
outh
Car
olin
a C
onst
itutio
n of
189
5, a
s am
ende
d, p
rovi
des
that
no
gove
rnm
ent s
hall
incu
r an
y bo
nded
deb
t whi
ch s
hall
exce
ed e
ight
per
cent
(8%
) of
the
asse
ssed
val
ue o
f the
pro
pert
y
YO
RK
SC
HO
OL
DIS
TR
ICT
ON
EY
OR
K, S
OU
TH
CA
RO
LIN
A
LE
GA
L D
EB
T M
AR
GIN
INF
OR
MA
TIO
N
146
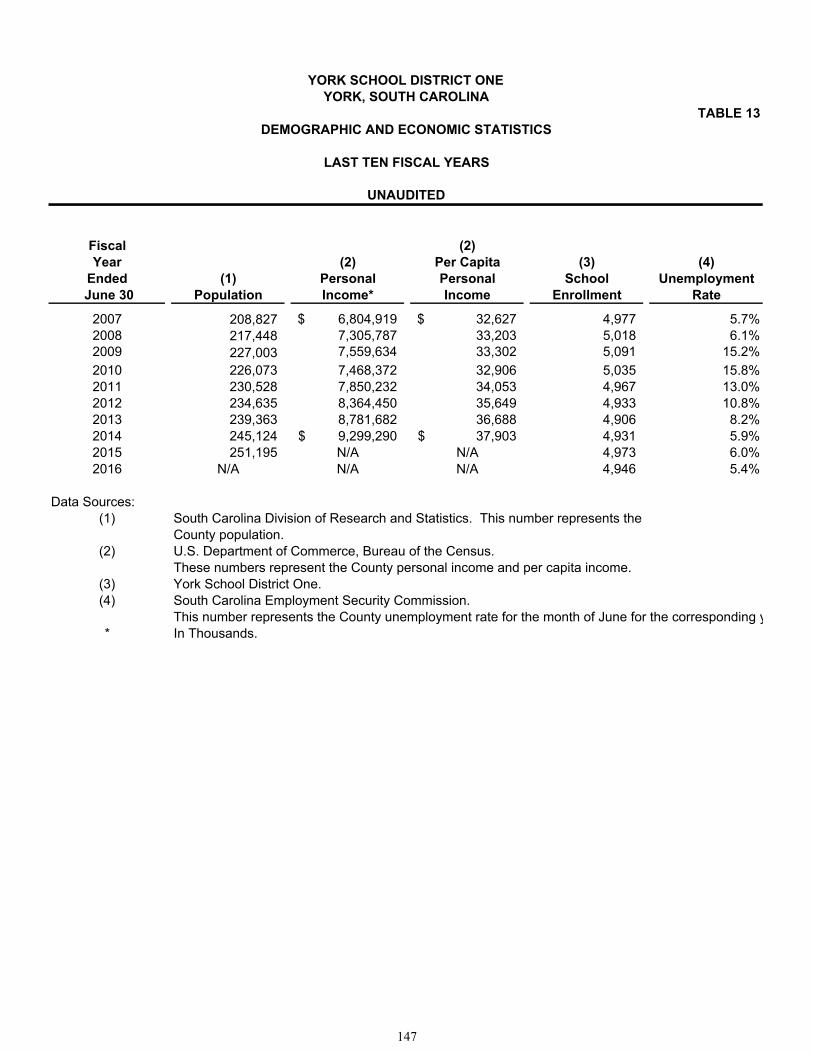
TABLE 13
Fiscal (2)Year (2) Per Capita (3) (4)
Ended (1) Personal Personal School Unemployment June 30 Population Income* Income Enrollment Rate
2007 208,827 6,804,919$ 32,627$ 4,977 5.7%2008 217,448 7,305,787 33,203 5,018 6.1%2009 227,003 7,559,634 33,302 5,091 15.2%
2010 226,073 7,468,372 32,906 5,035 15.8%2011 230,528 7,850,232 34,053 4,967 13.0%2012 234,635 8,364,450 35,649 4,933 10.8%2013 239,363 8,781,682 36,688 4,906 8.2%2014 245,124 9,299,290$ 37,903$ 4,931 5.9%2015 251,195 N/A N/A 4,973 6.0%2016 N/A N/A N/A 4,946 5.4%
Data Sources:(1) South Carolina Division of Research and Statistics. This number represents the
County population.(2) U.S. Department of Commerce, Bureau of the Census.
These numbers represent the County personal income and per capita income. (3) York School District One.(4) South Carolina Employment Security Commission.
This number represents the County unemployment rate for the month of June for the corresponding y* In Thousands.
UNAUDITED
DEMOGRAPHIC AND ECONOMIC STATISTICS
YORK, SOUTH CAROLINAYORK SCHOOL DISTRICT ONE
LAST TEN FISCAL YEARS
147
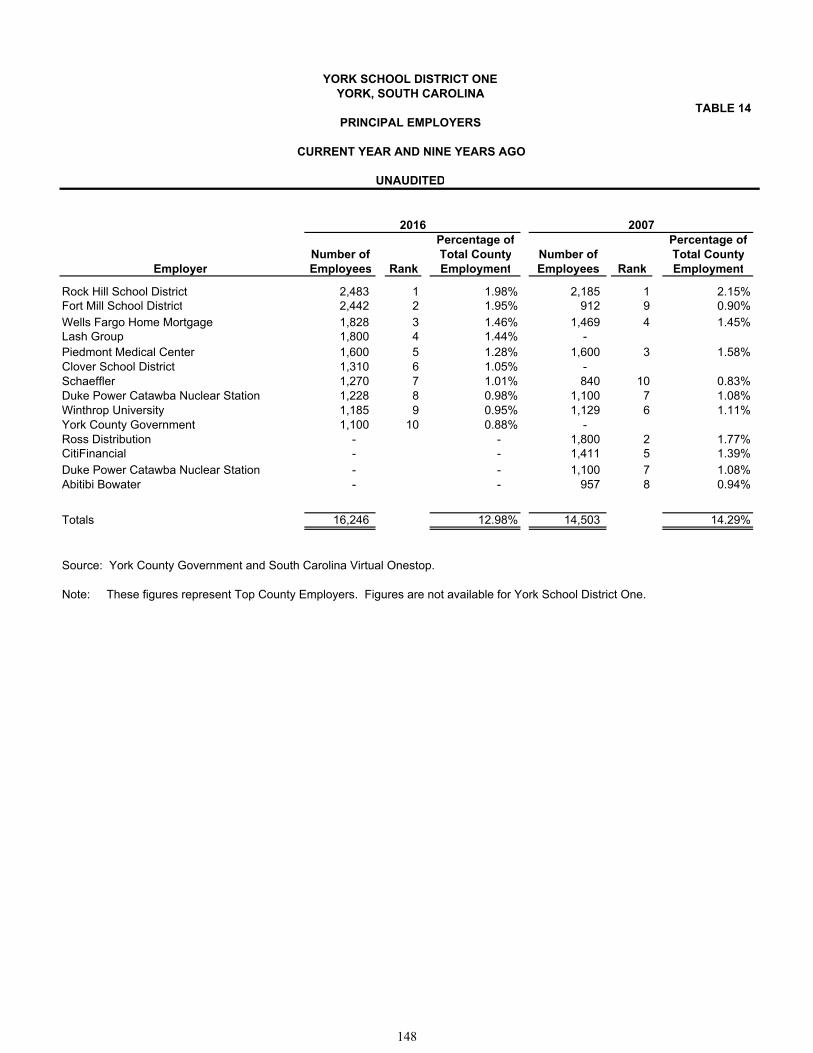
TABLE 14
Percentage of Percentage ofNumber of Total County Number of Total County
Employer Employees Rank Employment Employees Rank Employment
Rock Hill School District 2,483 1 1.98% 2,185 1 2.15%Fort Mill School District 2,442 2 1.95% 912 9 0.90%Wells Fargo Home Mortgage 1,828 3 1.46% 1,469 4 1.45%Lash Group 1,800 4 1.44% - Piedmont Medical Center 1,600 5 1.28% 1,600 3 1.58%Clover School District 1,310 6 1.05% - Schaeffler 1,270 7 1.01% 840 10 0.83%Duke Power Catawba Nuclear Station 1,228 8 0.98% 1,100 7 1.08%Winthrop University 1,185 9 0.95% 1,129 6 1.11%York County Government 1,100 10 0.88% - Ross Distribution - - 1,800 2 1.77%CitiFinancial - - 1,411 5 1.39%Duke Power Catawba Nuclear Station - - 1,100 7 1.08%Abitibi Bowater - - 957 8 0.94%
Totals 16,246 12.98% 14,503 14.29%
Source: York County Government and South Carolina Virtual Onestop.
Note: These figures represent Top County Employers. Figures are not available for York School District One.
YORK SCHOOL DISTRICT ONEYORK, SOUTH CAROLINA
PRINCIPAL EMPLOYERS
CURRENT YEAR AND NINE YEARS AGO
UNAUDITED
2016 2007
148
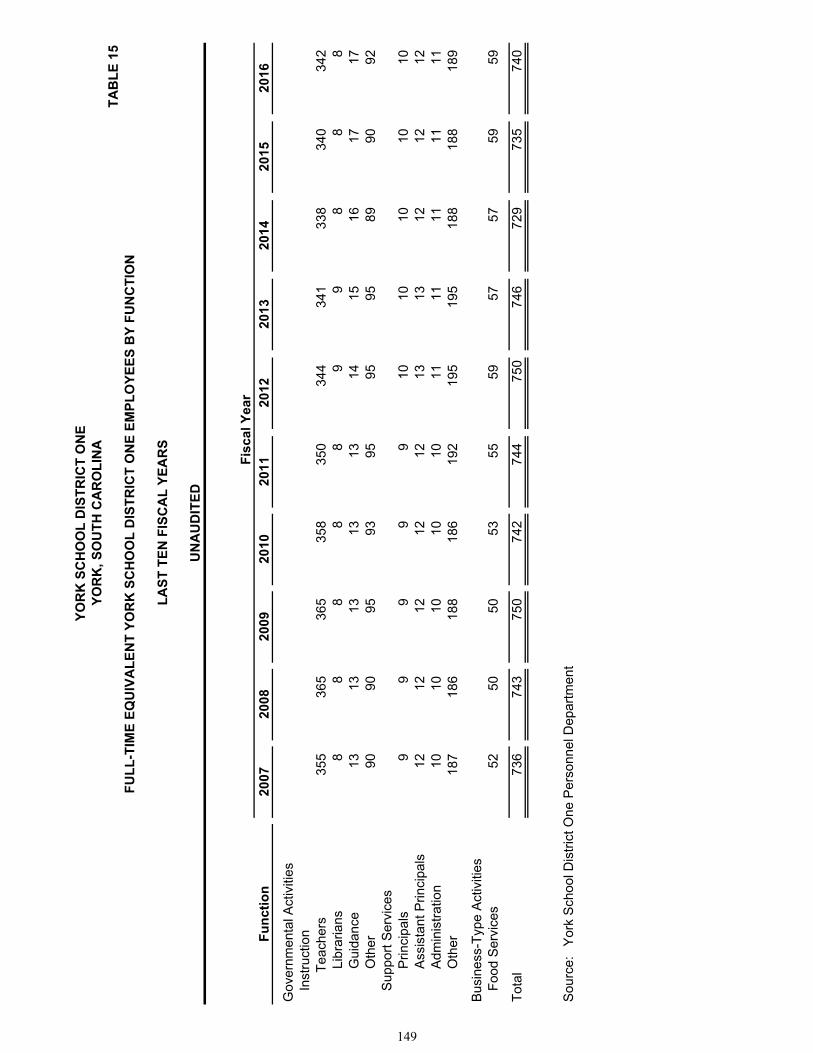
T
AB
LE
15
2007
2008
2009
2010
2011
2012
2013
2014
2015
2016
Gov
ernm
enta
l Act
iviti
esIn
stru
ctio
n
Tea
cher
s35
5
36
5
36
5
35
8
35
0
34
4
34
1
33
8
34
0
34
2
Li
brar
ians
8
8
8
8
8
9
9
8
8
8
Gui
danc
e13
13
13
13
13
14
15
16
17
17
O
ther
90
90
95
93
95
95
95
89
90
92
Sup
port
Ser
vice
s
P
rinci
pals
9
9
9
9
9
10
10
10
10
10
A
ssis
tant
Prin
cipa
ls12
12
12
12
12
13
13
12
12
12
A
dmin
istr
atio
n10
10
10
10
10
11
11
11
11
11
O
ther
187
186
188
186
192
195
195
188
188
189
B
usin
ess-
Typ
e A
ctiv
ities
Foo
d S
ervi
ces
52
50
50
53
55
59
57
57
59
59
Tot
al73
6
74
3
75
0
74
2
74
4
75
074
6
72
9
73
5
74
0
Sou
rce:
Yor
k S
choo
l Dis
tric
t One
Per
sonn
el D
epar
tmen
t
LA
ST
TE
N F
ISC
AL
YE
AR
S
UN
AU
DIT
ED
Fis
cal Y
ear
Fu
nct
ion
YO
RK
SC
HO
OL
DIS
TR
ICT
ON
EY
OR
K, S
OU
TH
CA
RO
LIN
A
FU
LL
-TIM
E E
QU
IVA
LE
NT
YO
RK
SC
HO
OL
DIS
TR
ICT
ON
E E
MP
LO
YE
ES
BY
FU
NC
TIO
N
149
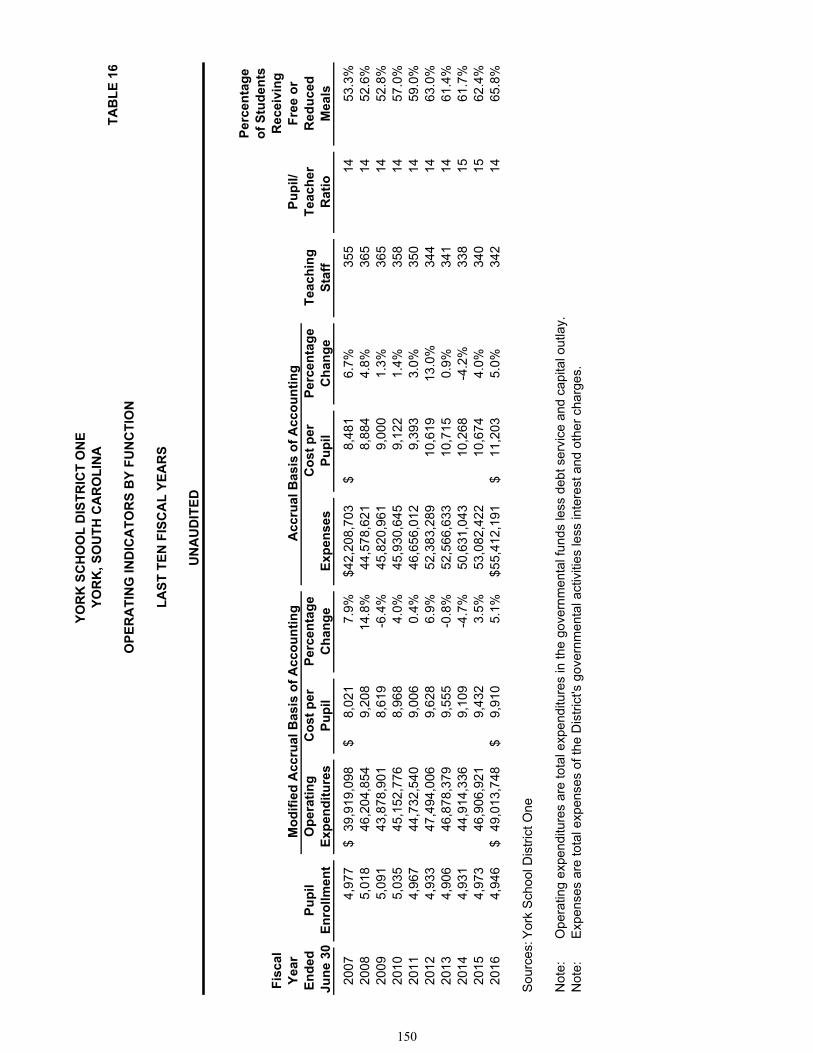
TA
BL
E 1
6
Per
cen
tag
eo
f S
tud
ents
Fis
cal
Rec
eivi
ng
Yea
rP
up
il/F
ree
or
En
ded
Pu
pil
Op
erat
ing
Co
st p
e rP
erce
nta
ge
Co
st p
erP
erce
nta
ge
Tea
chin
gT
each
erR
edu
ced
Jun
e 30
En
rollm
ent
Exp
end
itu
res
Pu
pil
Ch
ang
eE
xpen
ses
Pu
pil
Ch
ang
eS
taf f
Rat
ioM
eals
2007
4,97
7
39
,919
,098
$
8,02
1$
7.9%
42,2
08,7
03$
8,48
1$
6.
7%35
5
14
53
.3%
2008
5,01
8
46
,204
,854
9,20
8
14.8
%44
,578
,621
8,88
4
4.
8%36
5
14
52
.6%
2009
5,09
1
43
,878
,901
8,61
9
-6.4
%45
,820
,961
9,00
0
1.
3%36
5
14
52
.8%
2010
5,03
5
45
,152
,776
8,96
8
4.0%
45,9
30,6
45
9,
122
1.4%
358
14
57.0
%20
114,
967
44,7
32,5
40
9,
006
0.
4%46
,656
,012
9,39
3
3.
0%35
0
14
59
.0%
2012
4,93
3
47
,494
,006
9,62
8
6.9%
52,3
83,2
89
10
,619
13
.0%
344
14
63.0
%20
134,
906
46,8
78,3
79
9,
555
-0
.8%
52,5
66,6
33
10
,715
0.
9%34
1
14
61
.4%
2014
4,93
1
44
,914
,336
9,10
9
-4.7
%50
,631
,043
10,2
68
-4.2
%33
8
15
61
.7%
2015
4,97
3
46
,906
,921
9,43
2
3.5%
53,0
82,4
22
10
,674
4.
0%34
0
15
62
.4%
2016
4,94
6
49
,013
,748
$
9,91
0$
5.1%
55,4
12,1
91$
11,2
03$
5.0%
342
14
65.8
%
Sou
rces
:Yor
k S
choo
l Dis
tric
t One
Not
e:O
pera
ting
expe
nditu
res
are
tota
l exp
endi
ture
s in
the
gove
rnm
enta
l fun
ds le
ss d
ebt s
ervi
ce a
nd c
apita
l out
lay.
Not
e:E
xpen
ses
are
tota
l exp
ense
s of
the
Dis
tric
t's g
over
nmen
tal a
ctiv
ities
less
inte
rest
and
oth
er c
harg
es.
YO
RK
SC
HO
OL
DIS
TR
ICT
ON
E
Mo
dif
ied
Acc
rual
Bas
is o
f A
cco
un
tin
gA
ccru
al B
asis
of
Acc
ou
nti
ng
YO
RK
, SO
UT
H C
AR
OL
INA
OP
ER
AT
ING
IND
ICA
TO
RS
BY
FU
NC
TIO
N
LA
ST
TE
N F
ISC
AL
YE
AR
S
UN
AU
DIT
ED
150
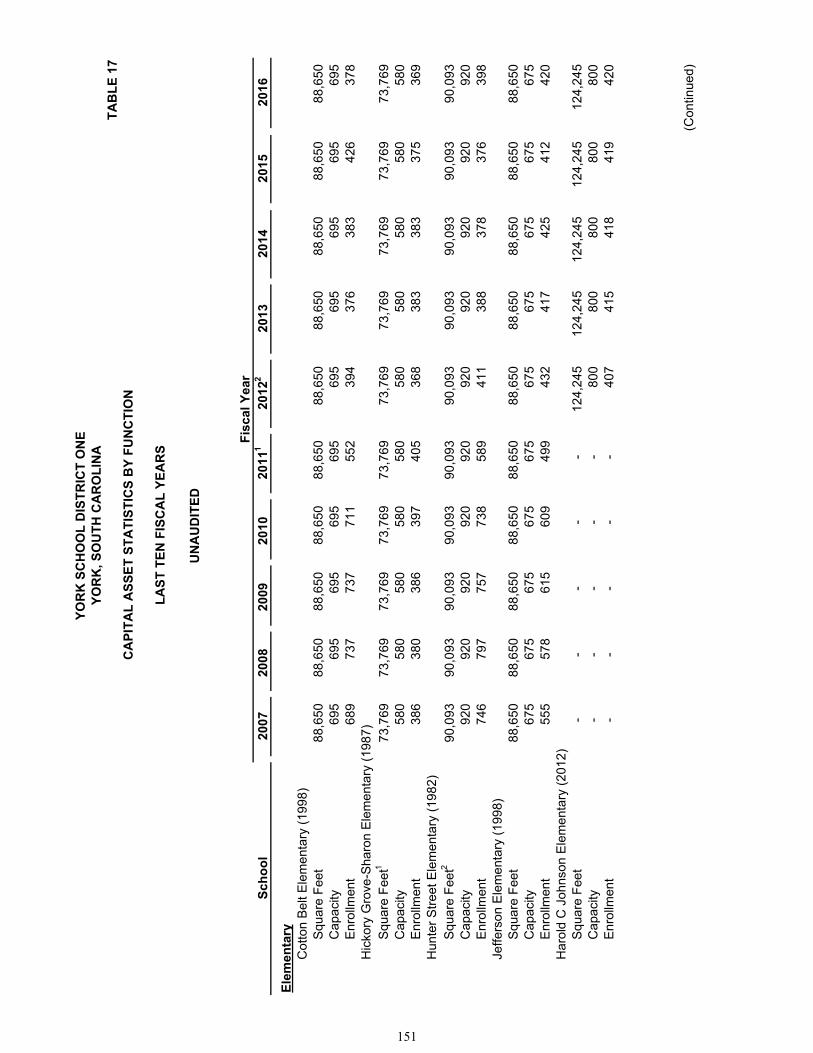
T
AB
LE
17
2007
2008
2009
2010
2011
120
122
2013
2014
2015
2016
Ele
men
tar y
Cot
ton
Bel
t Ele
men
tary
(19
98)
Squ
are
Fee
t88
,650
88
,650
88,6
5088
,650
88,6
5088
,650
88,6
50
88
,650
88,6
50
88
,650
Cap
acity
695
69
569
569
569
569
569
5
69
5
69
5
69
5
E
nrol
lmen
t68
9
737
737
711
552
394
376
383
426
378
Hic
kory
Gro
ve-S
haro
n E
lem
enta
ry (
1987
)S
quar
e F
eet1
73,7
69
73,7
6973
,769
73,7
6973
,769
73,7
6973
,769
73,7
69
73
,769
73,7
69
C
apac
ity58
0
580
580
580
580
580
580
580
580
580
Enr
ollm
ent
386
38
038
639
740
536
838
3
38
3
37
5
36
9
H
unte
r S
tree
t Ele
men
tary
(19
82)
Squ
are
Fee
t290
,093
90
,093
90,0
9390
,093
90,0
9390
,093
90,0
93
90
,093
90,0
93
90
,093
Cap
acity
920
92
092
092
092
092
092
0
92
0
92
0
92
0
E
nrol
lmen
t74
6
797
757
738
589
411
388
378
376
398
Jeffe
rson
Ele
men
tary
(19
98)
Squ
are
Fee
t88
,650
88
,650
88,6
5088
,650
88,6
5088
,650
88,6
50
88
,650
88,6
50
88
,650
Cap
acity
675
67
567
567
567
567
567
5
67
5
67
5
67
5
E
nrol
lmen
t55
5
578
615
609
499
432
417
425
412
420
Har
old
C J
ohns
on E
lem
enta
ry (
2012
)S
quar
e F
eet
-
-
-
-
-
124,
245
124,
245
124,
245
12
4,24
5
124,
245
Cap
acity
-
-
-
-
-
800
800
800
800
800
Enr
ollm
ent
-
-
-
-
-
407
415
418
419
420
(Con
tinue
d)
YO
RK
SC
HO
OL
DIS
TR
ICT
ON
EY
OR
K, S
OU
TH
CA
RO
LIN
A
CA
PIT
AL
AS
SE
T S
TA
TIS
TIC
S B
Y F
UN
CT
ION
LA
ST
TE
N F
ISC
AL
YE
AR
S
UN
AU
DIT
ED
Sch
oo
lF
isca
l Yea
r
151
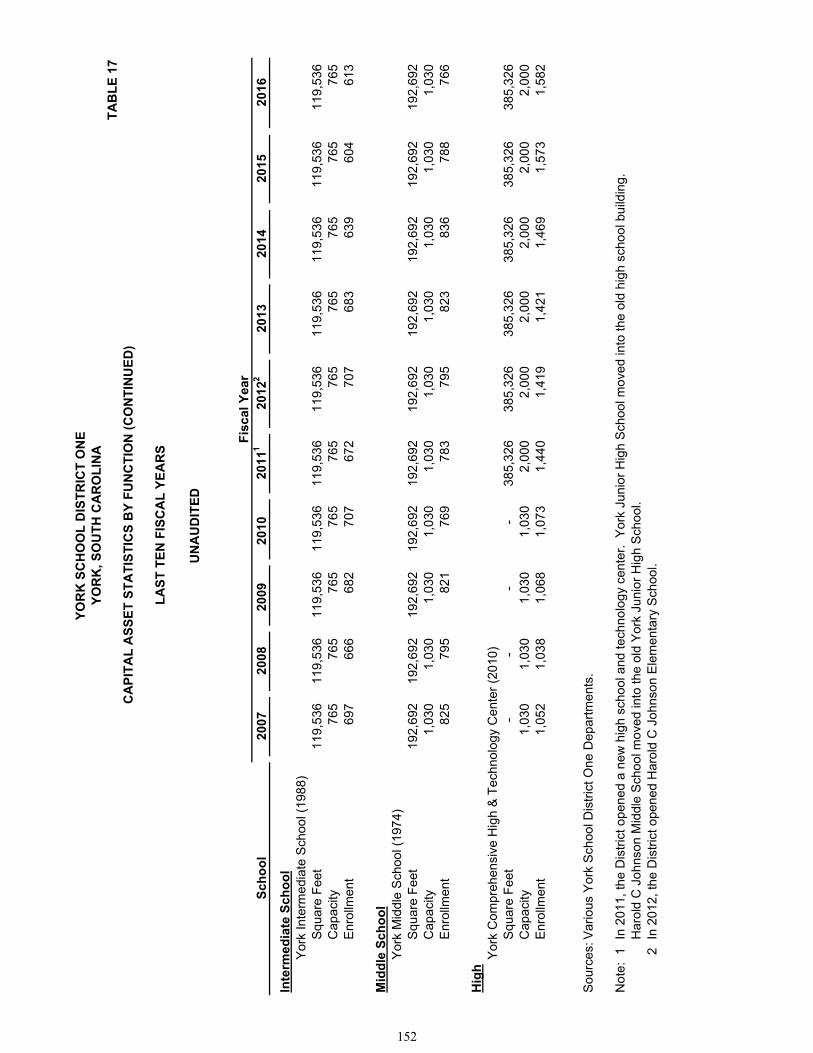
TA
BL
E 1
7
2007
2008
2009
2010
2011
120
122
2013
2014
2015
2016
Inte
rmed
iate
Sch
oo
lY
ork
Inte
rmed
iate
Sch
ool (
1988
)S
quar
e F
eet
119,
536
11
9,53
611
9,53
611
9,53
611
9,53
611
9,53
611
9,53
6
11
9,53
6
119,
536
11
9,53
6
C
apac
ity76
5
765
765
765
765
765
765
765
765
765
Enr
ollm
ent
697
66
668
270
767
270
768
3
63
9
60
4
61
3
Mid
dle
Sch
oo
lY
ork
Mid
dle
Sch
ool (
1974
)S
quar
e F
eet
192,
692
19
2,69
219
2,69
219
2,69
219
2,69
219
2,69
2
192,
692
192,
692
19
2,69
2
192,
692
Cap
acity
1,03
0
1,
030
1,03
01,
030
1,03
01,
030
1,
030
1,
030
1,
030
1,
030
E
nrol
lmen
t82
5
795
821
769
783
795
823
836
788
766
Hig
hY
ork
Com
preh
ensi
ve H
igh
& T
echn
olog
y C
ente
r (2
010)
Squ
are
Fee
t-
-
-
-
38
5,32
638
5,32
6
385,
326
385,
326
38
5,32
6
385,
326
Cap
acity
1,03
0
1,
030
1,03
01,
030
2,00
02,
000
2,
000
2,
000
2,
000
2,
000
E
nrol
lmen
t1,
052
1,03
81,
068
1,07
31,
440
1,41
9
1,42
1
1,46
9
1,57
3
1,58
2
Sou
rces
:Var
ious
Yor
k S
choo
l Dis
tric
t One
Dep
artm
ents
.
Not
e:1
In 2
011,
the
Dis
tric
t ope
ned
a ne
w h
igh
scho
ol a
nd te
chno
logy
cen
ter.
Yor
k Ju
nior
Hig
h S
choo
l mov
ed in
to th
e ol
d hi
gh s
choo
l bui
ldin
g.
Har
old
C J
ohns
on M
iddl
e S
choo
l mov
ed in
to th
e ol
d Y
ork
Juni
or H
igh
Sch
ool.
2
In 2
012,
the
Dis
tric
t ope
ned
Har
old
C J
ohns
on E
lem
enta
ry S
choo
l.
Sch
oo
lF
isca
l Yea
r
YO
RK
SC
HO
OL
DIS
TR
ICT
ON
EY
OR
K, S
OU
TH
CA
RO
LIN
A
CA
PIT
AL
AS
SE
T S
TA
TIS
TIC
S B
Y F
UN
CT
ION
(C
ON
TIN
UE
D)
LA
ST
TE
N F
ISC
AL
YE
AR
S
UN
AU
DIT
ED
152
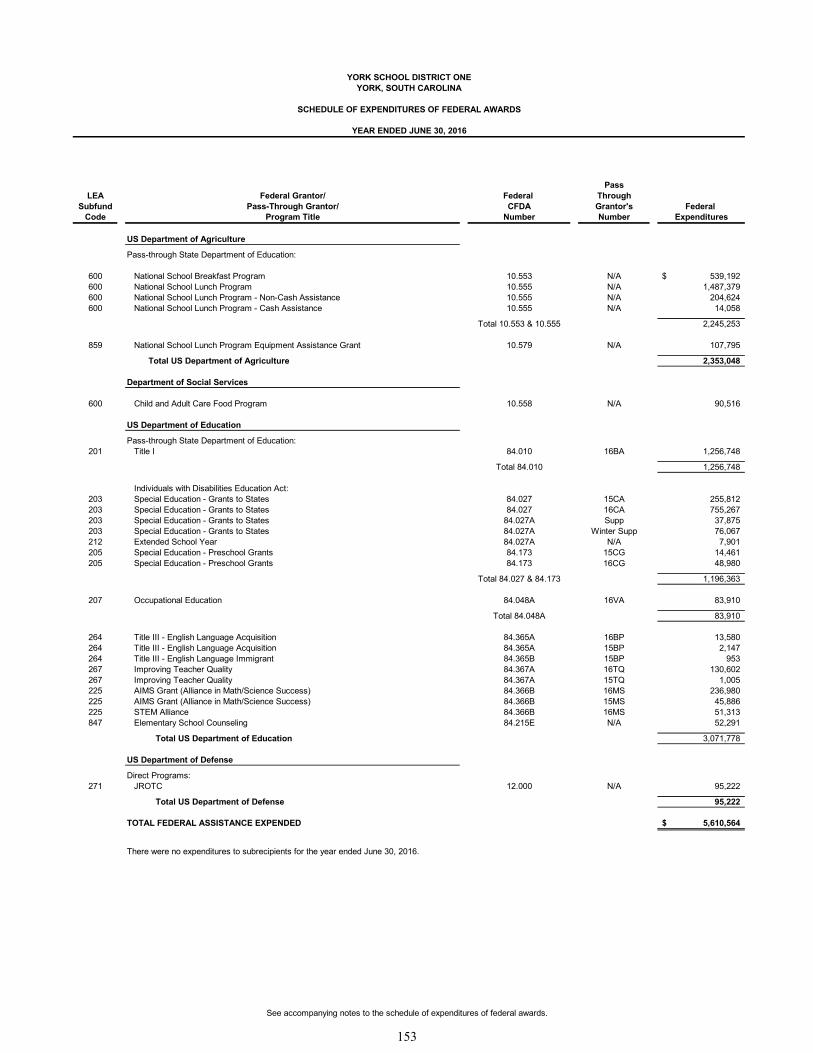
PassLEA Federal Grantor/ Federal Through
Subfund Pass-Through Grantor/ CFDA Grantor's Federal Code Program Title Number Number Expenditures
US Department of Agriculture
Pass-through State Department of Education:
600 National School Breakfast Program 10.553 N/A 539,192$ 600 National School Lunch Program 10.555 N/A 1,487,379 600 National School Lunch Program - Non-Cash Assistance 10.555 N/A 204,624 600 National School Lunch Program - Cash Assistance 10.555 N/A 14,058
Total 10.553 & 10.555 2,245,253
859 National School Lunch Program Equipment Assistance Grant 10.579 N/A 107,795
Total US Department of Agriculture 2,353,048
Department of Social Services
600 Child and Adult Care Food Program 10.558 N/A 90,516
US Department of Education
Pass-through State Department of Education:201 Title I 84.010 16BA 1,256,748
Total 84.010 1,256,748
Individuals with Disabilities Education Act: 203 Special Education - Grants to States 84.027 15CA 255,812 203 Special Education - Grants to States 84.027 16CA 755,267 203 Special Education - Grants to States 84.027A Supp 37,875 203 Special Education - Grants to States 84.027A Winter Supp 76,067 212 Extended School Year 84.027A N/A 7,901 205 Special Education - Preschool Grants 84.173 15CG 14,461 205 Special Education - Preschool Grants 84.173 16CG 48,980
Total 84.027 & 84.173 1,196,363
207 Occupational Education 84.048A 16VA 83,910
Total 84.048A 83,910
264 Title III - English Language Acquisition 84.365A 16BP 13,580 264 Title III - English Language Acquisition 84.365A 15BP 2,147 264 Title III - English Language Immigrant 84.365B 15BP 953 267 Improving Teacher Quality 84.367A 16TQ 130,602 267 Improving Teacher Quality 84.367A 15TQ 1,005 225 AIMS Grant (Alliance in Math/Science Success) 84.366B 16MS 236,980 225 AIMS Grant (Alliance in Math/Science Success) 84.366B 15MS 45,886 225 STEM Alliance 84.366B 16MS 51,313 847 Elementary School Counseling 84.215E N/A 52,291
Total US Department of Education 3,071,778
US Department of Defense
Direct Programs:271 JROTC 12.000 N/A 95,222
Total US Department of Defense 95,222
TOTAL FEDERAL ASSISTANCE EXPENDED 5,610,564$
There were no expenditures to subrecipients for the year ended June 30, 2016.
YORK SCHOOL DISTRICT ONEYORK, SOUTH CAROLINA
SCHEDULE OF EXPENDITURES OF FEDERAL AWARDS
YEAR ENDED JUNE 30, 2016
See accompanying notes to the schedule of expenditures of federal awards.
153
YORK SCHOOL DISTRICT ONE YORK, SOUTH CAROLINA
NOTES TO THE SCHEDULE OF EXPENDITURES OF FEDERAL AWARDS
YEAR ENDED JUNE 30, 2016
A – General The accompanying Schedule of Expenditures of Federal Awards (the “Schedule”) presents the activity of all federal award programs of York School District One, York, South Carolina (the “District”) for the year ended June 30, 2016. All federal awards received directly from the federal agencies, as well as those passed through other government agencies, are included on the Schedule. B – Basis of Accounting The accompanying Schedule is presented using the modified accrual basis of accounting, which is described in the notes to the District’s financial statements. C – Relationship to Financial Statements Federal award expenditures are reported in the District’s financial statements as expenditures in the Special Revenue Funds and non-operating expenses in the Enterprise Fund. D – Relationship to Federal Financial Reports Amounts reported in the accompanying Schedule agree with the amounts reported in the related federal financial reports except for timing differences relating to expenditures made subsequent to the filing of the federal financial reports. E – Indirect Cost Rate The District has elected not to use the 10% de minimis indirect cost rate allowed under the Uniform Guidance.
154
www.gfhllp.com Greenville Mauldin Mount Pleasant
(864) 451-7381 (864) 232-5204 (843) 735-5805
REPORT ON INTERNAL CONTROL OVER FINANCIAL REPORTING AND ON COMPLIANCE AND OTHER MATTERS BASED ON AN AUDIT OF FINANCIAL STATEMENTS PERFORMED
IN ACCORDANCE WITH GOVERNMENT AUDITING STANDARDS
INDEPENDENT AUDITOR’S REPORT The Board of Trustees York School District One York, South Carolina We have audited, in accordance with the auditing standards generally accepted in the United States of America and the standards applicable to financial audits contained in Government Auditing Standards issued by the Comptroller General of the United States, the financial statements of the governmental activities, the business-type activities, each major fund, and the aggregate remaining fund information of York School District One, South Carolina (the “District”) as of and for the year ended June 30, 2016, and the related notes to the financial statements, which collectively comprise the District’s basic financial statements, and have issued our report thereon dated September 27, 2016. Internal Control Over Financial Reporting
In planning and performing our audit of the financial statements, we considered the District’s internal control over financial reporting (internal control) to determine the audit procedures that are appropriate in the circumstances for the purpose of expressing our opinions on the financial statements, but not for the purpose of expressing an opinion on the effectiveness of the District’s internal control. Accordingly, we do not express an opinion on the effectiveness of the District’s internal control. A deficiency in internal control exists when the design or operation of a control does not allow management or employees, in the normal course of performing their assigned functions, to prevent, or detect and correct, misstatements on a timely basis. A material weakness is a deficiency, or a combination of deficiencies, in internal control, such that there is a reasonable possibility that a material misstatement of the entity’s financial statements will not be prevented, or detected and corrected on a timely basis. A significant deficiency is a deficiency, or a combination of deficiencies, in internal control that is less severe than a material weakness, yet important enough to merit attention by those charged with governance. Our consideration of internal control was for the limited purpose described in the first paragraph of this section and was not designed to identify all deficiencies in internal control that might be material weaknesses or significant deficiencies. Given these limitations, during our audit we did not identify any deficiencies in internal control that we consider to be material weaknesses. However, material weaknesses may exist that have not been identified. Compliance and Other Matters
As part of obtaining reasonable assurance about whether the District’s financial statements are free from material misstatement, we performed tests of its compliance with certain provisions of laws, regulations, contracts, and grant agreements, noncompliance with which could have a direct and material effect on the determination of financial statement amounts. However, providing an opinion on compliance with those provisions was not an objective of our audit, and accordingly, we do not express such an opinion. The results of our tests disclosed no instances of noncompliance or other matters that are required to be reported under Government Auditing Standards. Purpose of this Report
The purpose of this report is solely to describe the scope of our testing of internal control and compliance and the results of that testing, and not to provide an opinion on the effectiveness of the District’s internal control or on compliance. This report is an integral part of an audit performed in accordance with Government Auditing Standards in considering the entity’s internal control and compliance. Accordingly, this communication is not suitable for any other purpose.
Greene, Finney & Horton, LLP Mauldin, South Carolina September 27, 2016
155
156
www.gfhllp.com Greenville Mauldin Mount Pleasant
(864) 451-7381 (864) 232-5204 (843) 735-5805
REPORT ON COMPLIANCE FOR EACH MAJOR FEDERAL PROGRAM AND REPORT ON INTERNAL CONTROL OVER COMPLIANCE REQUIRED BY THE UNIFORM GUIDANCE
INDEPENDENT AUDITOR’S REPORT
The Board of Trustees York School District One York, South Carolina Report on Compliance for Each Major Federal Program We have audited York School District One, South Carolina’s (the “District”) compliance with the types of compliance requirements described in the OMB Compliance Supplement that could have a direct and material effect on each of the District’s major federal programs for the year ended June 30, 2016. The District’s major federal programs are identified in the summary of auditor’s results section of the accompanying schedule of findings and questioned costs. Management’s Responsibility Management is responsible for compliance with federal statutes, regulations, and the terms and conditions of its federal awards applicable to its federal programs. Auditor’s Responsibility Our responsibility is to express an opinion on compliance for each of the District’s major federal programs based on our audit of the types of compliance requirements referred to above. We conducted our audit of compliance in accordance with auditing standards generally accepted in the United States of America; the standards applicable to financial audits contained in Government Auditing Standards, issued by the Comptroller General of the United States; and the audit requirements of Title 2 U.S. Code of Federal Regulations Part 200, Uniform Administrative Requirements, Cost Principles, and Audit Requirements for Federal Awards (“Uniform Guidance”). Those standards and the Uniform Guidance require that we plan and perform the audit to obtain reasonable assurance about whether noncompliance with the types of compliance requirements referred to above that could have a direct and material effect on a major federal program occurred. An audit includes examining, on a test basis, evidence about the District’s compliance with those requirements and performing such other procedures as we considered necessary in the circumstances. We believe that our audit provides a reasonable basis for our opinion on compliance for each major federal program. However, our audit does not provide a legal determination of the District’s compliance. Opinion on Each Major Federal Program In our opinion, the District complied, in all material respects, with the types of compliance requirements referred to above that could have a direct and material effect on each of its major federal programs for the year ended June 30, 2016. Report on Internal Control Over Compliance Management of the District is responsible for establishing and maintaining effective internal control over compliance with the types of compliance requirements referred to above. In planning and performing our audit of compliance, we considered the District’s internal control over compliance with the types of requirements that could have a direct and material effect on each major federal program to determine the auditing procedures that are appropriate in the circumstances for the purpose of expressing an opinion on compliance for each major federal program and to test and report on internal control over compliance in accordance with the Uniform Guidance, but not for the purpose of expressing an opinion on the effectiveness of internal control over compliance. Accordingly, we do not express an opinion on the effectiveness of the District’s internal control over compliance.
157
A deficiency in internal control over compliance exists when the design or operation of a control over compliance does not allow management or employees, in the normal course of performing their assigned functions, to prevent, or detect and correct, noncompliance with a type of compliance requirement of a federal program on a timely basis. A material weakness in internal control over compliance is a deficiency, or combination of deficiencies, in internal control over compliance, such that there is a reasonable possibility that material noncompliance with a type of compliance requirement of a federal program will not be prevented, or detected and corrected, on a timely basis. A significant deficiency in internal control over compliance is a deficiency, or a combination of deficiencies, in internal control over compliance with a type of compliance requirement of a federal program that is less severe than a material weakness in internal control over compliance, yet important enough to merit attention by those charged with governance. Our consideration of internal control over compliance was for the limited purpose described in the first paragraph of this section and was not designed to identify all deficiencies in internal control over compliance that might be material weaknesses or significant deficiencies. We did not identify any deficiencies in internal control over compliance that we consider to be material weaknesses. However, material weaknesses may exist that have not been identified. The purpose of this report on internal control over compliance is solely to describe the scope of our testing of internal control over compliance and the results of that testing based on the requirements of the Uniform Guidance. Accordingly, this report is not suitable for any other purpose.
Greene, Finney & Horton, LLP Mauldin, South Carolina September 27, 2016
158

There were no audit findings in the prior year.
YORK SCHOOL DISTRICT ONEYORK, SOUTH CAROLINA
SUMMARY SCHEDULE OF PRIOR AUDIT FINDINGS
YEAR ENDED JUNE 30, 2016
159
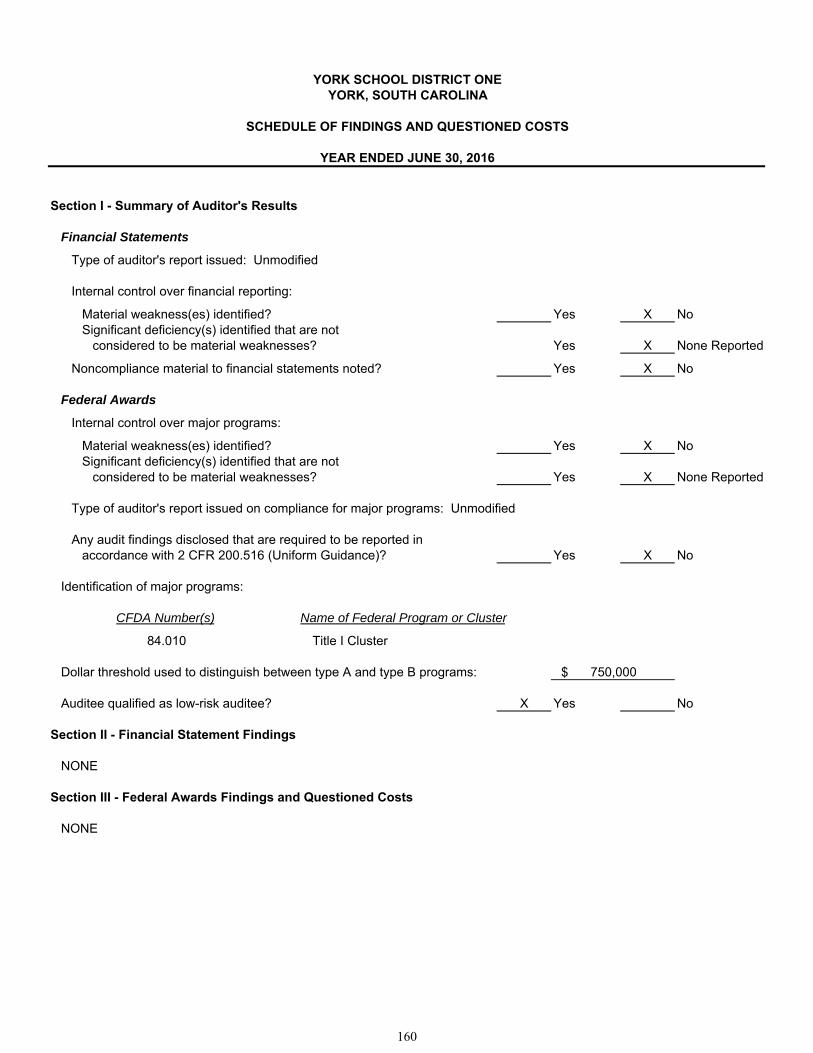
YORK SCHOOL DISTRICT ONEYORK, SOUTH CAROLINA
SCHEDULE OF FINDINGS AND QUESTIONED COSTS
YEAR ENDED JUNE 30, 2016
Financial Statements
Type of auditor's report issued: Unmodified
Internal control over financial reporting:
Material weakness(es) identified? Yes X NoSignificant deficiency(s) identified that are not
considered to be material weaknesses? Yes X None Reported
Noncompliance material to financial statements noted? Yes X No
Federal Awards
Internal control over major programs:
Material weakness(es) identified? Yes X NoSignificant deficiency(s) identified that are not
considered to be material weaknesses? Yes X None Reported
Type of auditor's report issued on compliance for major programs: Unmodified
Any audit findings disclosed that are required to be reported inaccordance with 2 CFR 200.516 (Uniform Guidance)? Yes X No
Identification of major programs:
CFDA Number(s) Name of Federal Program or Cluster
84.010 Title I Cluster
Dollar threshold used to distinguish between type A and type B programs:
Auditee qualified as low-risk auditee? X Yes No
NONE
NONE
Section I - Summary of Auditor's Results
Section II - Financial Statement Findings
Section III - Federal Awards Findings and Questioned Costs
750,000
160
$
Related Documents