Yield Improvement and Defect Reduction in Steel Casting Principal Investigator: Christoph Beckermann Report Preparation: Kent Carlson Richard Hardin The University of Iowa Iowa City, Iowa 52242 Project Period: December 1, 2001 through November 30, 2004 Award Number: DE-FC36-02ID14225 March 16, 2004

Welcome message from author
This document is posted to help you gain knowledge. Please leave a comment to let me know what you think about it! Share it to your friends and learn new things together.
Transcript

Yield Improvement and Defect
Reduction in Steel Casting
Principal Investigator: Christoph Beckermann
Report Preparation: Kent Carlson Richard Hardin
The University of Iowa Iowa City, Iowa 52242
Project Period: December 1, 2001 through November 30, 2004
Award Number: DE-FC36-02ID14225
March 16, 2004

FINAL TECHNICAL REPORT Project Title: Yield Improvement and Defect Reduction in Steel Casting Award Number: DE-FC36-02ID14225 Project Period: December 1, 2001 through November 30, 2004 Contact(s): Principal Investigator: Christoph Beckermann telephone: (319) 335-5681 e-mail: [email protected] Assistant Research Engineer (in charge of report preparation/submittal): Kent Carlson telephone: (319) 335-6075 e-mail: [email protected] Recipient: The University of Iowa 2 Gilmore Hall Iowa City, Iowa 52242 Other Partners: various member foundries of the Steel Founders’ Society of America
(SFSA) Project Team: DOE Project Officer: Debo Aichbhaumik, U.S. DOE Golden Field Office Steel Founders’ Society of America (SFSA): Malcolm Blair, Vice President – Technology Raymond Monroe, Executive Vice President

2
Acknowledgement: This report is based upon work supported by the U.S. Department of Energy, under Award No. DE-FC36-02ID14225 Disclaimer: Any findings, opinions, and conclusions or recommendations expressed in this report are those of the authors, and do not necessarily reflect the views of the Department of Energy.
Table of Contents Page List of Figures ............................................................................................................................. 3 List of Tables .............................................................................................................................. 3 List of Appendices ...................................................................................................................... 4 Executive Summary .................................................................................................................... 5 Introduction ................................................................................................................................. 7 Background ................................................................................................................................. 9 Research Summary ..................................................................................................................... 12 Accomplishments ....................................................................................................................... 33 References .................................................................................................................................. 35 Appendices ................................................................................................................................. 36

3
List of Figures Page Figure 1 Top-view sketch of a casting, showing the feeding distance, FD. ........................... 13 Figure 2 Comparison between existing rules [2] and the new feeding distance rule
for CF-8M (0.06 pct carbon) in furan sand with a 160ºC superheat. ....................... 14 Figure 3 Comparison of existing C&LA and high alloy riser sizing rules [2]. ...................... 17 Figure 4 Simulated solid fraction curves for the high-nickel alloys. ...................................... 18 Figure 5 Experimental radiographic soundness results for CN-7M. ...................................... 19 Figure 6 Experimental radiographic soundness results for CZ-100. ...................................... 19 Figure 7 Experimental radiographic soundness results for Hastelloy (CW-12MW). ............. 20 Figure 8 Experimental radiographic soundness results for Monel. ......................................... 20 Figure 9 Feeding distances for plates of various geometries for CW-12MW,
CN-7M and M-35-1, all with a 150°C (270°F) superheat. ....................................... 22 Figure 10 Quarter section of “ring” casting simulated as a pressurized riser case study. ......... 23 Figure 11 Porosity volume for case study simulated without pressure. Maximum
porosity of about 3% observed in section. ................................................................ 25 Figure 12 Porosity volume for case study simulated 5 bar of pressure applied to riser.
Maximum porosity of about 0.35% observed in section with pressure. ................... 25 Figure 13 Example radiographs of 10” wide x 6” thick nickel-aluminum bronze plates
(a) cast without pressure, (b) casting with pressurized riser at 50 psig. ................... 26 Figure 14 Illustration of the tilt mold concept, showing (a) position after pouring
from the ladle into the basin; (b) tilting; and (c) final position with the metal in the casting cavity. ....................................................................................... 27
Figure 15 Design selected for the mold tilting trials: (a) cross-sectional view of the mold; and (b) isometric view of the pouring basin (with exothermic sleeve) and plate. ...................................................................................................... 27
Figure 16 Comparison between simulation and experimental results: (a) Top view of final simulated inclusion locations. Inclusions shown at 3x magnification; (b) photo showing inclusion locations on the cope surface of two experimental plates. .......................................................................... 31
Figure 17 Results of composition simulation for a low alloy steel. Oxygen is added from the initial temperature of 1600°C until the liquidus temperature. ................... 32
List of Tables Page Table 1 Multipliers used to apply base case feeding rules to other casting conditions.
Base case conditions are listed with the multiplier C = 1. .......................................... 15 Table 2 Comparison between measured and simulated inclusion compositions for a
low alloy steel. ............................................................................................................ 30

4
List of Appendices Page Appendix A: Feeding and Risering of High Alloy Steel Castings ......................................... 37 Appendix B: Feeding of Nickel-Based Alloys ....................................................................... 85 Appendix C: Feeding of High Nickel Alloys ......................................................................... 123 Appendix D: Riser Pressurization for Increased Feeding Distance and
Improved Casting Yield..................................................................................... 171 Appendix E: Tilt Pour Trials and Analysis............................................................................. 182 Appendix F: Progress Report: Tilt Pour Trials and Analysis ................................................ 202 Appendix G: Modeling of Reoxidation Inclusion Formation During
Filling of Steel Castings .................................................................................... 223 Appendix H: Reoxidation Inclusion Formation – Modeling and Experiments ...................... 250

5
Executive Summary This research project investigated yield improvement and defect reduction techniques in steel casting. Research and technology development was performed in the following three specific areas: 1. Feeding rules for high alloy steel castings 2. Unconventional yield improvement and defect reduction techniques a. Riser pressurization b. Filling with a tilting mold 3. Modeling of reoxidation inclusions during filling of steel castings During the preparation of the proposal for this project, these areas were identified by the High Alloy Committee and Carbon and Low Alloy Committee of the Steel Founders’ Society of America (SFSA) as having the highest research priority to the steel foundry industry. The research in each of the areas involved a combination of foundry experiments, modeling and simulation. Numerous SFSA member steel foundries participated in the project through casting trials and meetings. The technology resulting from this project will result in decreased scrap and rework, casting yield improvement, and higher quality steel castings produced with less iteration. This will result in considerable business benefits to steel foundries, primarily due to reduced energy and labor costs, increased capacity and productivity, reduced lead-time, and wider use and application of steel castings. As estimated using energy data provided by the DOE, the technology produced as a result of this project will result in an energy savings of 2.6 x 10¹² BTU/year. This excludes the savings that were anticipated from the mold tilting research (see the mold tilting section below). In addition to the energy savings, and corresponding financial savings this implies, there are substantial environmental benefits as well. The results from each of the research areas listed above are summarized as follows: Feeding Rules for High Alloy Steel Castings Less conservative, more accurate feeding and riser sizing rules have been developed for the common high alloy grades CF-8M, CA-15, HH, HK and HP; for the austenitic stainless steel CN-7M; and for the nickel-based alloys Monel-35-1 and CW-12MW. In addition, previously unavailable material property databases were developed for CN-7M, Monel-35-1, CW-12MW and CZ-100—these databases are absolutely necessary to perform accurate solidification simulations for these alloys. The new rules for all of these alloys have been made available to SFSA member foundries through SFSA Technical & Operating conference presentations and proceedings. The new rules for the common high alloy grades have also been published in the archival journal Metallurgical and Materials Transactions. All of these new rules will also soon be available in a feeding and risering handbook published by the SFSA, which is under preparation.

6
Unconventional Yield Improvement and Defect Reduction Technologies: Riser Pressurization A method for pressurizing risers to increase feeding distance and improve casting soundness has been developed. Using a simulation tool we developed that can model the effects of pressure-assisted feeding in steel castings, the pressurization of a large ring-shaped commercial casting was investigated. The simulations indicated that casting soundness could be improved dramatically through riser pressurization. Due to the promising nature of this pressurization technique, additional casting trials were performed for a nickel-aluminum bronze alloy by the Navy. Using this avenue, it was possible to further develop and optimize the method of riser pressurization. Although the details of these trials cannot be included in this report, this riser pressurization technique successfully enables risers to provide the feed metal necessary to produce sound castings over much longer distances than un-pressurized risers. It is expected that the findings of these new pressurized riser casting trials will be presented in an upcoming SFSA Technical & Operating conference. Unconventional Yield Improvement and Defect Reduction Technologies: Filling with a Tilting Mold A method was developed for tilting the mold during filling, to allow metal to flow smoothly into the casting cavity without splashing and air entrainment and thus greatly reduce reoxidation inclusion formation. Five different sets of casting trials were performed at a participating foundry, casting several of the same geometry plates each using a tilting mold and a standard mold for comparison. Several problems were encountered and overcome, but in the end there was not a consistent enough improvement using tilting molds over standard molds to extend the project to production castings. Detailed analysis of the tilting trials was made available to SFSA member foundries through SFSA Technical & Operating conference presentations and proceedings. Modeling of Reoxidation Inclusions During Filling of Steel Castings A model was developed that predicts the entire life cycle of inclusions formed during the pouring of steel castings, including the formation of reoxidation inclusions, as well as their growth, agglomeration and motion during filling, and their final characteristics (size, number density, etc.) and location in the solidified casting. The model has been verified by comparing the simulated final size and location of inclusions to actual castings, and good agreement was obtained. The inclusion composition model was developed separately from the model just discussed, and has been compared to experimentally measured inclusion compositions. Good agreement was obtained in this model as well. This inclusion model is currently being incorporated into the main model. Because this model was developed in commercial casting simulation software, it will be available to steel foundries when the beta testing phase is complete. The details of the model, including the underlying physics, have been made available to SFSA member foundries through SFSA Technical & Operating conference presentations and proceedings.

7
Introduction Most steel foundries must melt about twice as much steel as will be shipped as finished product. The additional metal is primarily present in risers, which act as metal reservoirs that are used to provide feed metal to prevent holes or voids from forming inside the casting as the metal contracts during solidification. The research performed for this project developed techniques for decreasing the size and number of risers required to produce quality castings. Reducing the size and number of risers results in an increase in casting yield, which is defined as the percentage of metal shipped as finished product to the total amount of metal that was melted to produce the product. Improvements in casting yield mean that less metal must be melted to produce the same finished product, and melting less metal translates directly into substantial energy savings. In addition, since significant energy must be expended to remove risers from castings, reducing the size and number of risers also results in energy savings in this area. This research also developed a model to predict the formation, growth and motion of reoxidation inclusions during the pouring of steel castings. Such inclusions tend to rise to the cope (upper) surface of castings, and must be removed and repaired with weld metal before the castings can be shipped. Removal of inclusions from steel castings and the subsequent repair of the removal site require a great deal of energy and time; it is estimated that twenty percent of the cost of producing castings is due to inclusion removal and repair [1]. The inclusion model will provide foundries with the ability to predict inclusion problems that may lead to extensive removal and repair work (or even scrapped castings), and then redesign the metal delivery system to avoid troublesome inclusions before any castings are actually poured. This capability will result in substantial energy savings to the steel casting industry. For this project, The University of Iowa proposed to develop (with the assistance of the SFSA and various member foundries) technologies in three separate areas, each of which would lead to yield improvement and/or defect reduction in steel castings. These areas are: 1. Feeding rules for high alloy steel castings 2. Unconventional yield improvement and defect reduction techniques a. Riser pressurization b. Filling with a tilting mold 3. Modeling of reoxidation inclusions during filling of steel castings A brief description of the proposed technology in each of these three areas is summarized here, along with the commercialization plan, the target industries and the magnitude of potential energy savings: Feeding Rules for High Alloy Steel Castings The currently available feeding distance and riser sizing rules [2] used to place a sufficient number of adequately-sized risers on high alloy steel castings to produce sound castings have been found to be overly conservative and too limited in their scope [3]. One facet of this research project was to develop less conservative, more accurate and tailored feeding and risering rules for high alloy steel castings. Once developed, these new rules would be made available to the steel casting industry in a new SFSA feeding and risering manual for high alloy steel castings. These new rules would also be presented in SFSA conference presentations and

8
proceedings, as well as published in an archival journal. It is assumed that these new rules would be applicable to all high alloy sand castings, and that they would improve casting yield on average by 5%. According to our energy metrics calculations, these new rules would thus result in an energy savings of about 8.1 x 10¹¹ BTU/year. Unconventional Yield Improvement and Defect Reduction Technologies: Riser Pressurization The idea of pressurizing risers to extend the riser feeding distance (and hence increase yield) is an old one, and yet it is not currently being applied in the steel casting industry. The aim of this area of the research project was to develop and optimize the method of riser pressurization to reduce shrinkage porosity defects and increase yield in steel castings. Once developed, the riser pressurization technology would be made available to the steel casting industry through SFSA reports, conference presentations and proceedings. Assuming that this new pressurization technology is applicable to 20% of the total tonnage of both carbon and low alloy (C&LA) and high alloy steel sand castings, and that pressurization will increase yield by 10%, this new technology would result in an energy savings of about 7.9 x 10¹¹ BTU/year. Unconventional Yield Improvement and Defect Reduction Technologies: Filling with a Tilting Mold Reoxidation inclusions in steel castings are costly to remove and repair, in terms of both energy and time. The aim of this area of the research project was to develop and optimize a method to tilt the mold during mold filling. This was expected to largely avoid the formation of reoxidation inclusion defects. In addition, it would also increase casting yield because filling can be done through the riser, thus eliminating the need for a gating system. Once developed, the mold tilting technology would be made available to the steel casting industry through SFSA reports, conference presentations and proceedings. Assuming that this new mold tilting technology will reduce the quantity/severity of inclusions by 70%, and that it is applicable to 10% of the total tonnage of both C&LA and high alloy steel sand castings, this new technology would result in an energy savings of about 4.2 x 10¹¹ BTU/year. Modeling of Reoxidation Inclusions During Filling of Steel Castings The final facet of this research project aimed to develop a model that can predict the entire life cycle of reoxidation inclusions during the pouring of steel castings. The model accounts for inclusion birth, growth, agglomeration and motion, and predicts the final location, size, number and composition of reoxidation inclusions in steel castings. Providing foundries with this predictive capability would allow them to develop gating systems that produce castings that minimize troublesome inclusions, without the typical trial-and-error procedures required in the current technology. This would reduce scrapped castings and casting rework and repair due to inclusion defects. Once developed, the model would be available in commercial casting simulation software, and a description of the model (as well as the underlying physics) would be made available to the steel casting industry through SFSA reports, conference presentations and proceedings. Assuming that inclusion modeling will reduce the quantity/severity of inclusions by 75%, and assuming that this technology is applicable to castings that are produced by foundries that already use simulation software (28% of the total tonnage of sand mold steel castings), this new technology would result in an energy savings of about 9.8 x 10¹¹ BTU/year.

9
Background For each of the project areas described in the previous section, the current state of the art of technology, as well as the specific area of this technology being addressed by this project, are summarized below. In addition, the project objectives are provided, along with a brief description of the approach used to accomplish them. Past experience of the project team members in this context is also mentioned, where appropriate. Feeding Distance Rules for High Alloy Steel Castings In previous DOE-sponsored yield improvement projects by the present investigator, new feeding rules were developed for risering of carbon and low alloy (C&LA) steel castings [4, 5]. This work resulted in more consistent and widely applicable feeding distance rules that improve casting yield by up to 10%. These low alloy feeding rules were published in a new SFSA manual for risering of steel castings [6]. Also as part of the previous project, preliminary casting trials were performed at several foundries using CF-8M (high alloy) steel [3]. These pilot trials indicated that the presently available feeding rules for high alloy steel [2] are overly conservative and too limited in their scope. After seeing the results of the past work on feeding rules for C&LA steel castings, numerous high alloy steel foundries expressed their strong desire to have similar rules developed for high alloy steel castings. The objective of the first part of this project was to develop less conservative, more accurate and tailored feeding rules for high alloy steels, using an approach similar to that used to develop the new C&LA feeding distance rules mentioned in the preceding paragraph. Analogous to the previous C&LA work by the present investigator, this was accomplished by conducting a limited amount of high alloy casting trials and combining the results of these trials with extensive casting simulation to develop the new feeding rules for high alloy steel castings. The trials were conducted at several participating high alloy foundries, and involved the casting and radiographic testing of simple plates. The casting trial results were primarily used to validate the simulation methodology for predicting the shrinkage defects seen on the radiographs. A large number of additional simulations then allowed for the development of the actual rules. An extension to this part of the project added four high-nickel alloys to the list of alloys for which rules were to be developed. These alloys added a new challenge, as material property data for these alloys necessary to simulate their solidification was unavailable. Thus, it was necessary to develop material property databases for these alloys through the use of temperature measurements during solidification in conjunction with thermodynamic simulation software. Once this was accomplished, the rules for these alloys were developed in the same manner as for the others. The new rules for all the high alloy metals investigated are tailored to the alloy composition, casting conditions, and desired soundness. Unconventional Yield Improvement and Defect Reduction Technologies: Riser Pressurization In the previous DOE-sponsored project on yield improvement by the present investigator, a pilot study was performed at a participating foundry to investigate the external application of pressure, in the form of compressed argon, to the riser during solidification to improve feeding of steel castings. This pilot study gave promising results, and constitutes the groundwork for this research. Riser pressurization has been reported to increase feeding distances for castings in low carbon steel, cast irons and aluminum alloys, using both permanent and sand molds [7, 8, 9].

10
With increased feeding distances, the occurrence of shrinkage defects is reduced and the casting yield is improved. The available literature describes the methods, potential advantages and possible pitfalls. However, no steel foundries could be identified in the U.S. that currently use riser pressurization. The objective of this area of the project was to develop and optimize the method of riser pressurization to reduce shrinkage porosity defects and increase steel casting yield. Pilot casting trials performed by the current researchers as part of a previous DOE yield improvement project indicated that the pressurization method held promise, and that the development of the pressurization schedule (when and how much pressure to apply) was of paramount importance to the success of this method. It was planned to continue developing this method by using casting simulation to develop the pressurization schedule for a production part, and then to use this pressurization schedule to produce the part. Using simulation software, a parametric study was performed to investigate the effect of different magnitudes of pressurization, and a pressurization schedule was developed. However, due to the large size (and corresponding cost) of this casting, the foundry eventually opted not to perform this casting trial. Additional casting trials were performed by the Navy, which allowed the development of the riser pressurization methodology to continue. Unconventional Yield Improvement and Defect Reduction Technologies: Filling with a Tilting Mold Tilting the mold during filling would accomplish two things. First, the metal would flow smoothly into the casting cavity without splashing and air entrainment. This would largely avoid the formation of reoxidation inclusion defects that usually occur in a casting when using a gravity pour through a sprue. Second, by pouring directly into a riser, this technique would also improve the casting yield, since a separate gating system would not be necessary. Some large production foundries currently use filling with a tilting mold, where the technique is automated [10]. However, no steel foundries could be identified in the U.S. that currently use this technology. The objective of this area of the project was to develop a technique where the mold is tilted during filling, such that the metal flows smoothly into the casting cavity without splashing and air entrainment, in order to greatly reduce the amount and severity of reoxidation inclusions in the resulting casting. The filling was done through the riser, to increase the yield due to the elimination of the gating system. A pouring basin in the mold was filled from the ladle, and then the mold was tilted such that the metal flowed from the basin into the casting cavity. Once the mold was tilted ninety degrees, the casting cavity was full and solidification proceeded as usual. A simple plate casting was selected, to provide a large cope surface on which to measure inclusion severity. The tilt casting trials were performed at a participating steel foundry. Tilting parameters such as the tilting time were selected through the use of simulation software, which allowed us to optimize the tilting process to produce the slowest, smoothest flow from the basin into the casting cavity. The reduction in inclusion severity was measured by counting the inclusions on the machined cope surface of tilted plates, and comparing those results to inclusion counts for plates of the same geometry, produced from the same ladle and same heat of metal, but using a standard (i.e., non-tilted) mold. If successful, this tilting procedure would then be applied to production castings.

11
Modeling of Reoxidation Inclusions During Filling of Steel Castings Extensive casting trials and water modeling have been performed under the “Clean Cast Steel” projects by Bates et al. of the University of Alabama [11] to investigate means of reducing inclusion defects in steel castings. The most common forms of inclusions are those resulting from reoxidation of the steel during pouring. They often limit the casting yield, result in the need for weld repair, cause machining problems and casting rejection, and reduce the service performance of cast steel components. However, much of the previous work is empirical and no systematic method is available to judge if a given pouring/gating system produces an acceptable amount of inclusions, or how the pouring/gating system can be modified to reduce the amount of inclusions in the casting. There is currently no method available to predict the amount and location of reoxidation inclusions in a solidified casting. Thus, when foundries have problems with inclusions in castings, they must resort to trial-and-error procedures in an attempt to correct these problems. The objective of the final part of this project is to develop a model to predict the entire life cycle of inclusions formed during the pouring of steel castings, including reoxidation inclusion formation, their growth, agglomeration and motion during filling, and their final characteristics (composition, size, number density, etc.) and location in the solidified casting. Casting trials in participating steel foundries were conducted to validate the model. While it is not possible to simulate the intricate details of the turbulent motion and splashing during steel pouring, a simplified model was developed that takes into account the major fluid mechanical parameters and the relevant thermodynamics and kinetics of inclusion formation. The model was developed in commercial casting simulation software. This will result in substantial benefits to steel foundries, primarily due to the ability to redesign the metal delivery system to avoid inclusions before any castings are actually poured.

12
Research Summary This section provides a summary of the research performed in each of the areas investigated under this project, including the main results/accomplishments of each area of research, as well as the conclusions and recommendations. Details are provided in the Appendices. Feeding Rules for High Alloy Steel Castings Working with the SFSA High Alloy Committee, five high alloy grades were originally selected for this study as being of the greatest interest to the steel casting industry: CF-8M, CA-15, HH, HK and HP. Four different SFSA member foundries cast a total of 165 high alloy plates with a single top riser. The foundries carefully recorded casting data during their casting trials, such as pouring temperature, pouring time, exact alloy composition, sand mold composition, etc. These plates were then radiographed and rated for soundness according to ASTM standards. Based on the information given on the casting trial data sheets for the plates, simulations were performed for each plate for which unique casting data was available, using a commercial solidification simulation software package. By comparing simulation results with the corresponding radiographic soundness data for each plate, it was determined that there is a correlation between radiographic soundness and a simulation parameter known as the Niyama criterion (a local thermal parameter). It was found that if the minimum value of the Niyama criterion in the plate was greater than 0.1, the casting was radiographically sound (meaning no visible shrinkage indications on the radiographs at 2 pct sensitivity). This is completely analogous to the previous C&LA feeding distance rule development by the present investigator. In fact, the critical minimum Niyama value of 0.1 is the same as in the C&LA feeding distance rule development. Having determined that plate simulations with minimum Niyama criterion values greater than 0.1 correspond to radiographically sound plates, an extensive number of simulations were performed for plates with a variety of widths, thicknesses, superheats, sand mold materials, and alloy compositions. For each particular set of conditions, the plate length was varied and solidification was simulated until the resulting minimum value of the Niyama criterion in the plate was 0.1. The length where this occurred corresponded to the longest possible radiographically sound plate for that set of conditions. This plate geometry was then used to compute the feeding distance, FD, which is depicted in Figure 1. The feeding distance is defined as the maximum distance over which the riser can provide feed metal resulting in a radiographically sound casting. It is measured from the riser to the furthest point in the casting section being considered. After computing the feeding distance for an extensive set of casting conditions for each alloy, the results were plotted against the plate width for each alloy; an example of this is shown in Figure 2 (uppermost curve) for CF-8M with 0.06 pct carbon. The casting trials, simulations and feeding distance rule development for these five high alloy grades are described in Appendix A.

13
Figure 1 Top-view sketch of a casting, showing the feeding distance, FD.
Using knowledge gained during the previous feeding distance rule development for C&LA steels, it was determined that the previously developed feeding distance rule for C&LA steels could also be used for each of these high alloy grades, provided that the casting conditions and alloy grade were accounted for with appropriate multipliers. This feeding distance rule can be given by the polynomial:
97.1 99.1 266.0 0174.01029.4
2344
effectend+
+
−
+
×−=
−
TW
TW
TW
TW
TFD
(1)
Equation (1) is accurate up to W/T = 15, beyond which FD/T has a constant value of 9.0. This equation represents the C&LA feeding distance rule for the base case casting conditions, which are:
• AISI 1025 steel, • PUNB (furan) sand mold, • 60°C (108°F) pouring superheat.
In addition to these base case casting conditions, rules were also developed for different sand mold materials, steel compositions, pouring superheats, and cooling conditions (end chill, drag chill). It was determined that variations from the base case could all be accounted for with simple multipliers. Then the feeding distance for casting conditions other than the base case conditions could be computed with the equation:
alloycastsuperheat casebaseconditionsdifferent
CCT
FDT
FD××
=
conditionscoolingmoldsand CC ×× (2)
where (FD/T)base case represents the feeding distance determined from Equation (1), and the multipliers in Equation (2) are provided in Table 1.
DR
FD riser
W

14
3
4
5
6
7
8
9
10
11
12
1 2 3 4 5 6 7 8 9 10 11 12 13 14 15
Feed
ing
Dis
tanc
e to
Thi
ckne
ss R
atio
, FD
/T
Width to Thickness Ratio, W/T
SFSA rules shown are for 1 in. section thickness
DR FD
W
SFSA rules for HT-0.60C
SFSA rules for low carbon HF, HH, CA-15 and CF-8
new feeding distance rule for CF-8M (0.06 pct carbon) in furan sand, with 160°C superheat → valid for T = 1 – 12 in.
SFSA rules for HT-0.35C and high carbon HF, HH, CA-15 and CF-8
Figure 2 Comparison between existing rules [2] and the new feeding distance rule for CF-8M (0.06 pct carbon) in furan sand with a 160ºC superheat.

15
Table 1 Multipliers used to apply base case feeding rules to other casting conditions. Base case conditions are listed with the multiplier C = 1.
Casting Parameter Condition
Description Multiplication
Factor, C green sand 1.09
furan 1 zircon 0.96
Sand Mold Material (Csand mold)
chromite 0.88 end chill 1.19 end effect 1 Cooling Conditions
(Ccooling conditions) drag chill 0.95 AISI 1025 1 AISI 4125 0.98 AISI 1522 0.97 AISI 4135 0.97 AISI 4330 0.97 AISI 8620 0.96 AISI 8630 0.95
Carbon & Low Alloy (use with multiplier for Nymin = 0.1
for radiographically sound)
AISI 4340 0.86 CF8M – C 0.08 1.036
HH30 0.985 CF8M – C 0.06 0.978
HK44 0.965 CA15 – C 0.13 0.943
HP37 0.904
High Alloy (use with multiplier for Nymin = 0.1
for radiographically sound)
CF8M – C 0.03 0.900 CW-12MW 0.979
M-35-1 0.976 High-Nickel Alloy
(use with multiplier for Nymin = 1.0 for radiographically sound) CN-7M 0.925
250°C (450°F) 1.38 150°C (270°F) 1.18 120°C (216°F) 1.12 90°C (162°F) 1.06 60°C (108°F) 1
Superheat (Csuperheat)
30°C (54°F) 0.94 0.1 1 0.2 0.90 0.3 0.84 0.7 0.733 1.0 0.66
Minimum Niyama Value, Nymin
1.8 0.56

16
Thus, the feeding distance of a casting section for the five high alloys discussed thus far can be determined knowing the casting conditions by using Equations (1) and (2) and Table 1. Note that the feeding distances given here are intended to produce radiographically sound castings at 2 pct sensitivity. Another important point to note is that these rules are not only valid for plates. These rules can be applied to complex-shaped castings by dividing up the castings into approximately plate-shaped pieces, and then applying the rules to these pieces. This is the same method that is currently used with previously published feeding distance rules. Figure 2 shows the substantial improvement that the new feeding distance rules provide over existing rules. The uppermost curve in this figure is the new rule for CF-8M, and the lower three curves are existing rules. The improvement is due to the removal of a large factor of safety that was built into the existing rules, as well as the fact that the new rule accounts for casting conditions such as superheat. Note in Table 1 that a superheat of 160°C increases the feeding distance by about 20 pct. An additional study was performed for these high alloy grades, investigating the existing riser sizing rule. This rule is intended to yield risers that are large enough to supply adequate feed metal to the casting, but not overly large as to be unnecessarily detrimental to the casting yield. Our study determined that the existing high alloy riser sizing rule is overly conservative, due to a number of factors of safety and approximations built into the rule as it was developed. This study determined that for open top risers, the previously published C&LA riser sizing rule (which was determined to be adequate in the previous C&LA study by the present investigator) is also valid for high alloy steels. This rule is less conservative than existing high alloy riser sizing rules, as shown in Figure 3. Thus, the thick black line in Figure 3 can be used to size open top risers for high alloy steels, rather than using the upper three lines that correspond to existing high alloy riser sizing rules. In addition, for vented blind top risers, it was determined that the previously published rules are also overly conservative. The development of the feeding distance and riser sizing rules for these five high alloy grades are described in extensive detail in Appendix A. When it became apparent that the high alloy feeding distance rule development just discussed was going to be successful, this project was extended to include additional alloys that were of great interest to the steel casting industry. Again working with the SFSA High Alloy Committee, four high-nickel alloys were chosen for feeding distance rule development: the austenitic stainless steel CN-7M, and the nickel-based alloys Monel-35-1, CW-12MW and CZ-100. The nominal compositions for these alloys are given in Appendix B (Table 1). Note that they all have very high percentages of nickel. These alloys were chosen because it was agreed that the industry in general does not really know the feeding distances of these alloys. There are no published feeding distance rules for these alloys, and when we surveyed various foundries, we determined that their in-house rules for these alloys varied significantly. The research plan for these high-nickel alloys was to take the same approach just described: perform limited casting trials, correlate experimental results to simulation, then use extensive simulation to develop feeding distance rules. However, it was determined that the material property data required to simulate these high-nickel alloys was not available. Thus, it was first necessary to generate material property databases for these alloys. To do this, temperature data

17
0
0.5
1
1.5
2
2.5
3
2 6 10 14 18 22 26 30 34
Ris
er V
olum
e to
Cas
ting
Vol
ume
Rat
io, V
R/V
C
Shape Factor, SF = (L + W)/T
carbon & low alloy rule for open top risers
low carbon HF, HH, CA-15 and CF-8
HT-0.35C and high carbon HF, HH, CA-15 and CF-8
HT-0.60C
high alloy riser sizes are for blind top risers
simulation results with SM = 0, DR = HR, AISI 1025 steel, green sand, 120ºC superheat
Figure 3 Comparison of existing C&LA and high alloy riser sizing rules [2].

18
during solidification was needed for each alloy. Very-high temperature thermocouples were designed, tested and built, and after some iteration, a design was selected that could withstand the high temperatures of molten metal (over 1500°C, or 2730°F). Casting trials were performed at a participating foundry, in which these thermocouples were inserted into the molds to measure the metal temperatures during solidification. The resulting temperature data was used in conjunction with material property simulation software to develop the necessary material property databases. The end result was material property data such as the solidification curves shown in Figure 4. Details of the thermocouple design, the casting trials, and the property database development are given in Appendix B.
0
0.1
0.2
0.3
0.4
0.5
0.6
0.7
0.8
0.9
1
1150 1200 1250 1300 1350 1400
Temperature, ºC
Solid
frac
tion
CN-7M
CW-12MW(N composition)
CZ-100
M-35-1
M-30C
Figure 4 Simulated solid fraction curves for the high-nickel alloys.
In addition to the casting trials conducted to collect temperature data, additional nickel-alloy casting trials were also performed at four other foundries. A total of 55 plates were cast for this portion of the project. The original experimental results of these trials are given in Appendix B. However, these ratings include indications that were discovered upon inspection to be under-riser shrinkage. Shrinkage under the riser was due to the riser being too small, and not because of feeding issues. The results including only feeding-related shrinkage (which is the only shrinkage of interest in terms of feeding distance rules) are shown in Figures 5 – 8, which plot the plate feeding length against the resulting shrinkage x-ray level. The feeding length (FL) is measured in the same way as feeding distance, but the feeding length is purely geometrical—the length that needs to be fed—it implies nothing about casting soundness. X-ray level 0 indicates that the plate was completely sound (no visible indication on the radiographs), and level 5 indicates that the plate had a large amount of visible shrinkage. The open symbols in these figures indicate individual plates, with the numbers beside the symbols indicating the number of

19
2.75
4.00
2.00
0.33
-1
0
1
2
3
4
5
6
0 2 4 6 8 10 12 14
Feeding Length, FL (in.)
AST
M S
hrin
kage
X-r
ay L
evel
FD/T = 5.4x0.9X1.17 = 5.68
FD/T = 5.4X1.17 = 6.32
FD/T = 8X1.17 = 9.36
Foundry AGA (8 plates)
Foundry S (8 plates)
Mean X-ray Level +/- 1 StandardDeviation
DR
WFL
L
W/T = 8
4
2
24
1
1
1
1
Feed
ing
Dis
tanc
e fo
r 145
ºC s
uper
heat
, min
Ny
= 0.
7
Feed
ing
Dis
tanc
e fo
r 102
5, 1
45 ºC
sup
erhe
at, m
in N
y =
0.1
Feed
ing
Dis
tanc
e fo
r 145
ºC s
uper
heat
, min
Ny
= 1.
0
CN-7M (16 PLATES)
Figure 5 Experimental radiographic soundness results for CN-7M.
1 1
0
0.4
-1
0
1
2
3
4
5
6
0 2 4 6 8 10 12 14
Feeding Length, FL (in.)
AST
M S
hrin
kage
X-r
ay L
evel
FD/T = 8X1.15 = 9.22Foundry AGA (7 plates)Foundry W (6 plates)Mean X-ray Level +/- 1 Standard Deviation
DR
WFL
L
W/T = 8
CZ-100 (13 PLATES) 33
23 2
Feed
ing
Dis
tanc
e fo
r 102
5, 1
35 ºC
sup
erhe
at, m
in N
y =
0.1
Figure 6 Experimental radiographic soundness results for CZ-100.

20
4
1
0.6
2.67
-1
0
1
2
3
4
5
6
0 2 4 6 8 10 12 14
Feeding Length, FL (in.)
AST
M S
hrin
kage
X-r
ay L
evel
FD/T = 5.7X1.28 = 7.3FD/T = 5.7X0.9x1.28 = 6.56FD/T = 8X1.28 = 10.24Foundry AGA (6 plates)Foundry A (6 plates)Mean X-ray Level +/- 1 Standard Deviation
DR
WFL
L
W/T = 8
3
12
21
1
1
1
Feed
ing
Dis
tanc
e fo
r 200
ºC s
uper
heat
, min
Ny
= 0.
7
Feed
ing
Dis
tanc
e fo
r 102
5, 2
00 ºC
sup
erhe
at, m
in N
y =
0.1
Feed
ing
Dis
tanc
e fo
r 200
ºC s
uper
heat
, min
Ny
= 1.
0
CW-12MW (12 PLATES)
Figure 7 Experimental radiographic soundness results for Hastelloy (CW-12MW).
0.4
1.5
5
1.25
-1
0
1
2
3
4
5
6
0 2 4 6 8 10 12 14
Feeding Length, FL (in.)
AST
M S
hrin
kage
X-r
ay L
evel
FD/T = 8X1.3X0.773X0.976 = 7.44FD/T = 8X1.3X0.773X0.976 = 7.44FD/T = 8X1.3 = 10.4Foundry AGA M-30C (8 plates)Foundry ST M-35-1 (6 plates)Mean X-ray Level +/- 1 Standard Deviation
DR
WFL
L
W/T = 8
3
2 1
1
3
1
3
Feed
ing
Dis
tanc
e fo
r 102
5, 2
10 ºC
sup
erhe
at,
min
Ny
= 0
.1
Feed
ing
Dis
tanc
e fo
r 210
ºC s
uper
heat
, m
in N
y =
0.7
M-30C & Monel-35-1 (14 PLATES)
Feed
ing
Dis
tanc
e fo
r 210
ºC s
uper
heat
, m
in N
y =
1.0
Figure 8 Experimental radiographic soundness results for Monel.

21
plates the symbol represents. The dark squares indicate an average x-ray level, and the error bars indicate a range of plus/minus one standard deviation. Note that these statistical values are provided only to guide the eye to the trends in x-ray level versus feeding length; they are not based on enough data to be truly meaningful. Notice that in Figure 6, all of the CZ-100 plates that were cast were either completely sound or x-ray level 1. This was true even for very long plates. For comparison, the vertical line in the middle of this figure represents the feeding distance rule for AISI 1025 steel with the average superheat that was used for the CZ-100 casting trials. For most high alloy steels, the feeding distance was found to be about the same as or somewhat less than the AISI 1025 steel result for the same superheat. But for CZ-100, note that even the plates at feeding lengths much longer than this 1025 rule distance are sound. The foundry engineers who performed these trials indicated that they had seen this trend with CZ-100 in the past—that feeding distance is not really an issue for this particular alloy. Because of this, we did not attempt to formulate a feeding distance rule for CZ-100. It was deemed unnecessary. For the other three alloys, however, the same procedure described earlier for the five common high alloy steels was performed, to seek a correlation between casting soundness and corresponding simulation parameters. It was determined for all three of these alloys that if the minimum Niyama value in the plate was 1.0, the plate would be radiographically sound. Note the difference in this value of 1.0 for the nickel alloys, compared to the value of 0.1 for C&LA and the common high alloy steels studied. As in the previous studies, an extensive number of simulations were performed for different plate geometries and casting conditions, using a minimum Niyama value of 1.0 to determine the feeding distance as discussed earlier. A set of results from these simulations for each of the three alloys under consideration and a superheat of 150°C (270°F) is shown in Figure 9. These curves are valid for plates with thickness ranging from 1” to 12”. Note that these nickel alloys all have similar feeding distances, which are significantly shorter than for AISI 1025 with the same superheat. This agrees with the experiences of foundry engineers. Using the same techniques as for the common high alloy steels discussed earlier, polynomials were fit to curves such as the ones shown in Figure 9, and it was determined that the C&LA feeding distance rule given by Equations (1) and (2) could also be used for these high-nickel alloys, provided that the alloy and the higher minimum Niyama value were both accounted for with the appropriate multipliers given in Table 1. The superheat, sand mold, and cooling condition multipliers were tested and found to also be valid for these alloys. Details of the feeding rule development for nickel alloy steels are provided in Appendix C.

22
2
3
4
5
6
7
8
9
10
11
12
1 2 3 4 5 6 7 8 9 10 11 12 13 14 15
Width to Thickness, W/T
Feed
ing
Dis
tanc
e to
Thi
ckne
ss, F
D/T
All with conditions:1”=T=12”Furan sand
M-35-1 min Ny = 1.0, 150C superheat
CN-7M min Ny = 1.0, 150C superheat
CW-12MW min Ny = 1.0, 150C superheat
AISI 1025 min Ny = 0.1, 60C superheat
AISI 1025 min Ny = 0.1, 150C superheat
Figure 9 Feeding distances for plates of various geometries for CW-12MW, CN-7M and
M-35-1, all with a 150°C (270°F) superheat. In conclusion, this area of the project was completely successful, and the new less conservative, more accurate feeding distance rules are now available for alloy grades CF-8M, CA-15, HH, HK, HP, CN-7M, CW-12MW, and Monel-35-1. A new SFSA handbook containing these new rules is in preparation, and will soon be available to the steel casting industry.
All with conditions: - 1” ≤ T ≤ 12” - Furan sand mold

23
Unconventional Yield Improvement and Defect Reduction Technologies: Riser Pressurization In previous casting trials, pressure was applied to the liquid steel in a riser to demonstrate that a pressurized riser is able to feed a greater distance than a riser operating under normal atmospheric pressure. The primary goal of this trial was to experiment with the method to determine a simple, safe and reliable method which could be used to apply pressure to risers to enhance their feeding. The trial demonstrated the capability to maintain pressure tightness and to deliver the desired force on the surface of the liquid steel in the riser. There was clear evidence that the technique can increase casting soundness by forcing liquid feed metal over remarkable lengths to feed centerline shrinkage. Riser pressures in the 15 to 28 psig range were sustained. It was found that the riser feeding zone length can be extended by a factor of at least 4 with a casting soundness rated at ASTM radiographic testing Class 1. It was determined that a special pressure cap is not necessary to achieve good pressure tightness. Proper sealing of the pressurization tube can be achieved using the solidifying steel “shell” of the riser alone. However, this sealing between the pressurization tube and the riser metal is all important. An adequate time delay must be used before pressure is applied; here it was found that when the minimum surface solid fraction is about 0.7 (determined by simulation), pressure can be applied without rupturing the surface of the casting or mold penetration. A number of questions remained following the preliminary trials. It was hoped that these could be answered by additional trials. The foremost questions were: how much sounder can a casting be made by the technique, and at what solid fractions and pressures is the technique effective? In the current project, a new computer model developed by our research group that includes the physics of the pressure-forced liquid flow in the mush was used to study the effect of pressure on feeding steel castings and porosity formation. A case study from industry was selected for this project; this ring-shaped casting is shown in Figure 10. Results from the model indicate that a
Figure 10 Quarter section of “ring” casting simulated as a pressurized riser case study.
Top Viewof
Ring Casting
Ring casting:265" OD233" ID
Riser:36" D by 36" H
37.5" high
Quarter Symmetry View
of Simulation Mesh
Top Viewof
Ring Casting
Ring casting:265" OD233" ID
Riser:36" D by 36" H
37.5" high
Riser:36" D by 36" H
37.5" high
Quarter Symmetry View
of Simulation Mesh

24
large region of porosity, greater than 3% by volume, will form in the casting without pressurizing the riser, as shown in Figure 11. This figure shows a horizontal cross-section of the casting, containing the region where porosity tends to form in this casting. By contrast, the results with 5 bar of gage pressure applied to the top of the riser are shown in Figure 12. The maximum porosity level in the casting is seen to decrease by a factor of 10 to about 0.35% with pressurization. Simulations with gage pressures higher than 5 bar showed that additional pressurization beyond this amount did not improve casting soundness. This indicates that the pressurization technique can be effectively applied without resorting to very high pressures. Although simulation indicated that the pressurization method would produce an acceptably sound casting, the foundry eventually opted not to perform this casting trial, due to the large size (and corresponding cost) of this casting. Arising from this work, the project team was approached to investigate applying riser pressurization to castings produced in Navy foundries. A series of casting trials were simulated, and resulted in lessons learned. A proprietary method of delivering pressure to the riser was devised, but the methods described in the open literature would also work [1,3-5,7,8]. Firstly, one important technical issue that must be addressed in using this technique in practice is pressure scheduling: knowing when to apply pressure and how much, after a shell of sufficient strength has formed near the casting surface. Hot spots near the surface will form in most castings, for example near risers and junctions. These regions are weak spots that may rupture during pressurization. The project team developed a technique using simulation to locate and eliminate such spots by placing small, relatively thin chills at the locations of these weak spots. Use of this technique was then verified by subsequent trials. The project team also found that simulation could be used to guide the determination of the pressure schedule. Successful trials such as that resulting in the radiographs without (Figure 13a) and with pressure (Figure 13b) indicate that the technique holds merit for additional investigation. It is expected that the findings of these new pressurized riser casting trials will be presented in an upcoming SFSA Technical & Operating conference. In summary, the riser pressurization technique has been developed, and has been shown through simulation and casting trials to significantly extend riser feeding lengths, thus producing sounder castings for a given riser configuration, and allowing the use of fewer risers, which subsequently increases casting yield. Further details of this research can be found in Appendix D.

25
• No Pressure is applied
– Nitrogen Gas at 100 ppm
• Maximum Porosity at about 3%
• No Pressure is applied
– Nitrogen Gas at 100 ppm
• Maximum Porosity at about 3%
• Pressure is applied to riser at 5 bar
– Nitrogen Gas at 100 ppm
• Maximum Porosity less than 0.4%
• Pressure is applied to riser at 5 bar
– Nitrogen Gas at 100 ppm
• Maximum Porosity less than 0.4%
Figure 11 Porosity volume for case study simulated without pressure. Maximum porosity of about 3% observed in section.
Figure 12 Porosity volume for case study simulated 5 bar of pressure applied to riser.
Maximum porosity of about 0.35% observed in section with pressure.

26
Figure 13. Example radiographs of 10” wide x 6” thick nickel-aluminum bronze plates (a) cast without pressure, (b) casting with pressurized riser at 50 psig.
Unconventional Yield Improvement and Defect Reduction Technologies: Filling with a Tilting Mold To develop the tilting mold process, it was first necessary to choose a casting shape. A 1” thick by 10” wide by 13” long plate was selected, because it was simple and would provide a large cope surface (upper plate surface) on which to count inclusions. To perform the tilting, a mold was designed that contained a holding basin. Metal was poured from the ladle into the holding basin, and then the mold was tilted. When the mold was tilted, metal flowed from the basin through the riser and into the casting, as illustrated in Figure 14. With a casting shape selected, the metal delivery system and tilting time were optimized through simulation. By running simulations with various geometries and tilting times, a design was selected that provided a smooth transfer of metal from the holding basin to the casting cavity, with the minimum flow velocity. The final design is shown in Figure 15. Noteworthy items in this figure include the exothermic sleeve around the pouring basin and the t-pot refractory board. The exothermic sleeve was included to prevent the metal from freezing in the basin after pouring from the ladle and before the mold could be tilted. The t-pot board acted as a dam that required the liquid metal to flow under it rather than over it as it exited the basin and entered the plate cavity. Forcing the metal to exit the bottom of the basin rather than the top was done to prevent any of the slag that formed on top of the basin from flowing into the casting cavity. Once the tilt mold was designed, five sets of casting trials were performed. In each set of casting trials, plates were cast using both the tilt mold as well as a standard mold for comparison. For the standard mold, we had the foundry create a mold for the same geometry plate, using the gating and risering procedures they would use to riser the casting for a customer. In each set of trials, all plates were poured from the same ladle of the same heat, to make sure that was not a source of variability. After the plates were cast, 1/8” was machined off the cope surface of each
(a)
(b)

27
Figure 14 Illustration of the tilt mold concept, showing (a) position after pouring from the
ladle into the basin; (b) tilting; and (c) final position with the metal in the casting cavity.
Figure 15 Design selected for the mold tilting trials: (a) cross-sectional view of the mold;
and (b) isometric view of the pouring basin (with exothermic sleeve) and plate.
(a) (b) (c) fill holding basin from ladle
(a) (b)
casting: plate shape with top riser
t-pot pouring basin
side top

28
plate, and the inclusions were counted using a standard counting procedure. In this procedure, one inch diameter circles were drawn to encompass all inclusions (i.e., more than one inclusion could be in a single circle). The number of circles on a casting was used as the inclusion count for that casting. Over the course of the five sets of trials, a number of different tilt mold parameters were varied: holding time (time after pouring into the holding basin and before tilting began) was varied, tilt plates were cast with and without exothermic sleeves, with and without t-pot boards, and with different t-pot board materials. Unfortunately, the metal in the plates cast with t-pot boards underwent some sort of chemical reaction as it flowed into the casting cavity, which led to the machined surface looking like swiss cheese (i.e., full of holes). Many iterative attempts were made to solve this problem. Eventually, it was discovered that it was not necessarily the t-pot board causing the problem, but that the exothermic sleeve was probably also contributing to the problem. In the last trials, no exothermic sleeves or t-pot boards were used. Not using the exothermic sleeves did not cause problems—holding times up to about 20 seconds could still be used without the metal freezing in the basin. The lack of a t-pot board in these trials did lead to a few pieces of slag being swept into the castings, which contributed to the inclusion count. Throughout the trials, there was only one convincing heat where the tilt plates had considerably fewer inclusions than the standard plates. So although the method did show promise, and several important lessons were learned regarding what should and should not be done with tilt molds, we were unable to fine-tune the process to the point that we could consistently produce tilt castings with fewer inclusions than their standard counterparts. A production part (a butterfly valve) from the foundry doing these casting trials was also investigated as a candidate for a tilting mold, but this was not pursued due to the lack of a consistently successful tilt mold in the casting trials. Details of the tilt mold trials can be found in Appendices E and F. Modeling of Reoxidation Inclusions During Filling of Steel Castings Over the course of this area of the project, methods have been developed to predict various aspects of the life cycle of reoxidation inclusions. These separate pieces of the overall inclusion model were first implemented and tested in a research code. Once the research code was deemed to be functional and providing reasonable results, the model was then implemented in a commercial solidification software package. The model is currently in the beta-phase of testing, and it includes the critical elements necessary to model the life cycle of reoxidation inclusions. The model simulates the life cycle of each reoxidation inclusion, which includes inclusion formation, growth, agglomeration and motion. See Appendix G for details. Inclusion formation can be simulated by releasing inclusions at the inlet as the casting is filled, and also by allowing inclusions to nucleate on the free surface of the melt. These two methods of formation can be used separately or together. Inclusion release is used to model tiny deoxidation inclusions that enter the mold from the ladle, or to model larger inclusions that enter into the mold cavity in the incoming metal. Inclusion nucleation is used to model the interaction at the liquid metal free surface between the metal and the oxygen in the surrounding atmosphere. Chemical reactions between the available oxygen and elements within the melt result in the birth of reoxidation inclusions on the free surface. Originally, it was thought that the model would predict air entrainment as the metal flowed and splashed into the casting cavity. This was investigated in the initial work with the research code. However, it was determined that it was

29
computationally far too impractical to accurately model air entrainment, due to computational difficulties that arise from computing the combined flow of both air and liquid metal (due to the enormous differences in densities of these two substances). As a result, commercial software packages do not consider the air flow when computing mold filling. Additionally, it was decided that it was unnecessary to simulate air entrainment in this way. It has been found that nucleation at the free surface can be modeled accurately with a good local estimate of the free surface area and a reasonable model for the mass transfer coefficient, both of which are included in the present model. Growth of reoxidation inclusions occurs when inclusions absorb additional oxygen. Due to the presence of elements within the steel melt that have an affinity for oxygen, there is a negligible amount of dissolved oxygen contained within the steel (i.e., within the melt, away from the free surface). Thus, it is a good assumption that inclusion growth occurs only at the metal free surface, where oxygen is available due to contact with the atmosphere. Inclusion growth is simulated with a model that relates the time rate of change of the inclusion mass to the free surface area and the mass transfer coefficient. Agglomeration (combination) of reoxidation inclusions occurs when inclusions on the free surface are close enough to each other to be drawn together as a result of surface tension. When inclusions are closer than some critical distance from each other (where the critical distance is a function of the size of the inclusions), the model combines them into a single inclusion. Inclusions that are not on the free surface (i.e., within the melt) can also agglomerate, but they must actually come into contact with each other, as there are no surface tension forces within the melt. In order to determine the final location of inclusions, it is necessary to track their movement from the time they form until filling is complete. This is done by solving an equation of motion for each inclusion, at each time step. This equation of motion accounts for the effects of buoyancy and drag on the inclusions as they move through the melt. The inclusion velocity determined through this equation is then used to update the location of each inclusion. If an inclusion comes into contact with a mold wall, it is assumed to stick to the wall. As discussed in Appendix G, this inclusion model was employed to simulate inclusion formation in the standard mold plates cast during the mold tilting trials. The final location and size of the simulated inclusions are shown in Figure 16, and compared to experimental results. Both the location and size of the large inclusions agree well with the experimental results. This model was also employed to simulate inclusions in a potential production casting for the tilt mold trials (a butterfly valve), and the simulated location and size of large inclusions on the cope surface of the valve was in good agreement with the observations of the foundry engineers who cast this part. This simulation result can be seen in Appendix F. In parallel with the inclusion modeling discussed thus far, the modeling of reoxidation inclusion composition has also been carried out. This was done using a commercial software package that computes thermochemical equilibrium of a system, given the temperature and metal composition, and determines the phases (and their respective compositions) that form as solidification proceeds. To model inclusion formation at the metal free surface, this software

30
was used in conjunction with an elemental balance, where each element was conserved except oxygen, which was added until the liquidus temperature was reached. Inclusion formation was modeled for several systems in which the inclusion composition had been experimentally measured, and the modeled compositions were compared to the experimentally determined compositions. An example of this composition modeling is shown in Figure 17. In order to compare these results to experimental results, the equivalent oxide phase inclusion compositions were computed for the results in Figure 17, using chemical equilibrium equations to convert the complex oxide phases shown in the figure into the reported compositions of Al2O3, SiO2, MnO and CaO. The resulting compositions, shown in Table 2, agree very well with the measured compositions. Details regarding the modeling of inclusion formation and composition are given in Appendix H. Table 2 Comparison between measured and simulated inclusion compositions for a low alloy
steel.
Inclusion composition Al2O3 SiO2 MnO + CaO
Simulation composition 21.5 44.4 34.1 Average composition from 8 experiments 22 46 31
In conclusion, the modeling of reoxidation inclusions has been successful. The composition model has been developed, and is in the process of being implemented into the inclusion life cycle model that is currently implemented in commercial software. The development of this model is nearing completion, and once the beta phase testing of the model is complete, it will be commercially available for use by steel foundries.

31
(a)
(b)
Figure 16 Comparison between simulation and experimental results: (a) Top view of final simulated inclusion locations. Inclusions shown at 3x magnification; (b) photo showing inclusion locations on the cope surface of two experimental plates.

32
Figure 17 Results of composition simulation for a low alloy steel. Oxygen is added from
the initial temperature of 1600°C until the liquidus temperature.
0
0.5
1
1.5
2
2.5
3
1600 1400 1200 1000 800 600 400 200 20 Temperature, °C
MnO_SiO2 (s)
Cr2O3 (s)
Tephroite (l) (Mn2SiO4) Tephroite (s)
(Mn2SiO4)
Quartz (SiO2) (s)
Tridymite (s)(SiO2) MnO_Al2O3 (s)
Al – 0.2 wt% ∆CO = 0.9 wt%
Am
ount
of I
nclu
sion
, wt%
Total inclusions Tliq

33
Accomplishments The project accomplishments for each project area are summarized below, in relation to the project objectives. Feeding Rules for High Alloy Steel Castings The objective of the first part of this project was to develop less conservative, more accurate feeding rules for high alloy steels. These rules have successfully been developed for the common high alloy grades CF-8M, CA-15, HH, HK and HP; for the austenitic stainless steel CN-7M; and for the nickel-based alloys Monel-35-1 and CW-12MW. Less conservative riser sizing rules were also developed high alloy steels. In addition, previously unavailable material property databases were developed for CN-7M, Monel-35-1, CW-12MW and CZ-100—these databases are absolutely necessary to perform accurate solidification simulations for these alloys. The new rules for all of these alloys have been made available to SFSA member foundries through the following SFSA Technical & Operating conference proceedings:
Carlson, K.D., Ou, S., and Beckermann, C., "Feeding and Risering of High Alloy Steel Castings," in Proceedings of the 57th Technical and Operating Conference, SFSA, Chicago, 2003.
Carlson, K.D., Ou, S., and Beckermann, C., "Feeding of Nickel-Based Alloys," in Proceedings of the 58th Technical and Operating Conference, SFSA, Chicago, 2004.
The new rules for the common high alloy grades have also been published in the archival journal Metallurgical and Materials Transactions: Ou, S., Carlson, K.D., and Beckermann, C., "Feeding and Risering of High-Alloy Steel
Castings," Metall. Mater. Trans. B, Vol. 36B, 2005, pp. 97-116. All of these new rules will also soon be available in a feeding and risering handbook published by the SFSA, which is under preparation. Unconventional Yield Improvement and Defect Reduction Technologies: Riser Pressurization The objective of this area of the project was to develop and optimize the method of riser pressurization to reduce shrinkage porosity defects and increase steel casting yield. Using this pressurization method, both trial castings and simulation have demonstrated that riser pressurization can significantly extend riser feeding lengths, thus producing sounder castings for a given riser configuration; and allowing the use of fewer risers, which subsequently increases casting yield. Simulation results shown along with corresponding pressurization casting trial results, demonstrating the effectiveness of riser pressurization and the ability of the simulation to model the effects of pressurization, are published in the following proceedings: Carlson, K.D., Lin, Z., Hardin, R.A., Beckermann, C., Mazurkevich, G., and Schneider,
M.C., "Modeling of Porosity Formation and Feeding Flow in Steel Casting," in Modeling of Casting, Welding and Advanced Solidification Processes X, eds. D.M. Stefanescu et al., TMS, Warrendale, PA, 2003, pp. 295-302.

34
Unconventional Yield Improvement and Defect Reduction Technologies: Filling with a Tilting Mold The objective of this area of the project was to develop a technique where the mold is tilted during filling, such that the metal flows smoothly into the casting cavity without splashing and air entrainment, in order to greatly reduce the amount and severity of reoxidation inclusions in the resulting casting. Filling with a tilting mold would also increase casting yield by allowing filling straight through the riser, without the need for additional gating. The tilting mold technique was developed and tested. Five different sets of casting trials were performed at a participating foundry, casting several of the same geometry plates each using a tilting mold and a standard mold for comparison. Several problems were encountered and overcome, but in the end there was not a substantial enough improvement using tilting molds over standard molds to warrant the extra effort foundries would require to develop a tilting mold. Thus, this area of the project was not extended to production castings. Detailed analysis of the tilting trials was made available to SFSA member foundries through SFSA Technical & Operating conference proceedings:
Bryant, R., Carlson, K.D., Ou, S., and Beckermann, C., "Tilt Pour Trials and Analysis," in Proceedings of the 57th Technical and Operating Conference, SFSA, Chicago, 2003.
Modeling of Reoxidation Inclusions During Filling of Steel Castings The objective of the final part of this project is to develop a model to predict the entire life cycle of inclusions formed during the pouring of steel castings, including reoxidation inclusion formation, their growth, agglomeration and motion during filling, and their final characteristics (composition, size, number density, etc.) and location in the solidified casting. The model has been developed, and has been verified by comparing the simulated final size and location of inclusions to actual castings. Good agreement was obtained. This model was also employed to simulate inclusions in a potential production casting for the tilt mold trials (a butterfly valve), and the simulated location and size of large inclusions on the cope surface of the valve was in good agreement with the observations of the foundry engineers who cast this part. The inclusion composition model was developed separately from the model just discussed, and has been compared to experimentally measured inclusion compositions, also with good agreement. This inclusion model is currently being incorporated into the main model. Because this model was developed in commercial casting simulation software, it will be available to steel foundries when the beta testing phase is complete. The details of the model, including the underlying physics, have been made available to SFSA member foundries through SFSA Technical & Operating conference proceedings:
Carlson, K.D., and Beckermann, C., "Modeling of Reoxidation Inclusion Formation During Filling of Steel Castings," in Proceedings of the 58th Technical and Operating Conference, SFSA, Chicago, 2004.
The details of the composition model will be made available to SFSA member foundries through conference proceedings and a presentation at the next Technical & Operating conference.

35
References [1] J.M. Svoboda, R.W. Monroe, C.E. Bates and J. Griffin (1987), “Appearance and
Composition of Oxide Macroinclusions in Steel Castings,” AFS Transactions, Vol. 95, pp. 187-202.
[2] Risering Steel Castings, Steel Founders’ Society of America (SFSA), Barrington, Illinois,
1973. [3] Hardin, R.A., Ou, S., Carlson, K., and Beckermann, C., “SFSA High Alloy Steel Plate
Casting Trials,” presentation at SFSA High Alloy Committee meeting, December 2000. [4] K.D. Carlson, S. Ou, R.A. Hardin and C. Beckermann: “Development of New Feeding-
Distance Rules Using Casting Simulation: Part I. Methodology,” Metall. Mater. Trans. B, 2002, vol. 33B, pp. 731-740.
[5] S. Ou, K.D. Carlson, R.A. Hardin and C. Beckermann: “Development of New Feeding-
Distance Rules Using Casting Simulation: Part II. The New Rules,” Metall. Mater. Trans. B, 2002, vol. 33B, pp. 741-755.
[6] Feeding & Risering Guidelines for Steel Castings, SFSA, Barrington, Illinois, 2001. [7] Desnizki, W., in Iron and Steel, p. 58, Feb. 1958. [8] Berry, J. T., and Watmough, T., “Factors Affecting Soundness in Alloys with Long and
Short Freezing Range,” AFS Transactions, p. 11, vol. 69, 1961. [9] Berry, J. T., and Taylor, R. P., “Improving Casting Performance by Extending Feeding
Action in Long-Freezing Range Cast Aluminum Alloys,” AFS Transactions, p. 203, vol. 72, 1999.
[10] Stahl, G.W., “Tilt Pouring Permanent Mold Aluminum Castings,” AFS Transactions, pp.
476-478, vol. 69, 1961. [11] Griffin, J.A., and Bates, C.E., “Ladle Treating, Pouring and Gating for the Production of
Clean Steel Castings,” SFSA Research Report No. 104, 1991.

36
Appendices Page Appendix A: Feeding and Risering of High Alloy Steel Castings ......................................... 37 Appendix B: Feeding of Nickel-Based Alloys ....................................................................... 85 Appendix C: Feeding of High Nickel Alloys ......................................................................... 123 Appendix D: Riser Pressurization for Increased Feeding Distance and
Improved Casting Yield..................................................................................... 171 Appendix E: Tilt Pour Trials and Analysis............................................................................. 182 Appendix F: Progress Report: Tilt Pour Trials and Analysis ................................................ 202 Appendix G: Modeling of Reoxidation Inclusion Formation During
Filling of Steel Castings .................................................................................... 223 Appendix H: Reoxidation Inclusion Formation – Modeling and Experiments ...................... 250

37
Appendix A: Feeding and Risering of
High Alloy Steel Castings
Kent D. Carlson, Shouzhu Ou and Christoph Beckermann
Department of Mechanical and Industrial Engineering
The University of Iowa, Iowa City, IA 52242 ABSTRACT
A more accurate, less conservative set of feeding distance and riser sizing rules is developed for high alloy steel grades CF-8M, CA-15, HH, HK and HP. These rules are designed to produce radiographically sound castings at 2 pct sensitivity. By comparing results between plate casting trials and the corresponding simulations of those trials, a relationship is shown to exist between a local thermal parameter known as the Niyama criterion and ASTM shrinkage x-ray level. This relationship was then used in an extensive set of casting simulations to numerically determine feeding distances for a wide range of casting conditions. It is shown that the feeding distance rule developed in an analogous earlier study for carbon and low alloy (C&LA) steels can also be used for these high alloy grades, provided that the feeding distance is modified by a multiplier that accounts for the high alloy steel grade. In addition, it is shown that multipliers for superheat, sand mold material and the use of chills developed in the earlier work are also valid with these high alloy steel grades. In comparison with previously published high alloy feeding distance rules, the present rules are shown to provide longer feeding distances in most casting situations. This study also investigates riser sizing rules. It is determined that for open top risers, the previously published C&LA riser sizing rule is also valid for high alloy steels. This rule is less conservative than existing high alloy riser sizing rules. In addition, for vented blind top risers, it is shown that the previously published rules are overly conservative.

38
1 INTRODUCTION In a time when competition for business in the steel casting industry is very intense, it is of utmost importance for foundries to produce high-quality castings at the lowest possible cost. Not only is there competition for business between steel foundries, but the foundries must also compete with businesses that produce steel products by other techniques (e.g., forging or fabricating), as well as with businesses that produce products from materials other than steel (e.g., aluminum). As such, the savings brought about by a relatively small increase in casting yield may well determine whether a foundry succeeds or fails in its competition to produce a particular part. An increase in casting yield will decrease the cost of castings due to decreased production costs; with increased yield, production of the same number of castings requires less melted metal and fewer heats, as well as reduced labor and materials costs required for production. Also, higher yield usually has the side benefit of lower casting cleaning costs. One effective way to improve casting yield is through riser optimization, where “optimized” means (1) the riser has the minimum possible volume to provide sufficient feed metal to the casting, without the riser pipe extending into the casting; and (2) the smallest number of risers are utilized, while still ensuring that the risers are close enough to each other to produce a sufficiently sound casting. Computer simulation of the casting process is becoming an indispensable tool in the effort to achieve increased casting yield. Through the use of simulation, foundries are able to evaluate modifications to casting designs without having to actually produce the casting, thus saving time, material resources and manpower. However, computer simulation must be applied on a case-by-case basis, and its effective use requires expertise as well as accurate data for many process variables. Due to these limitations, risering rules are still widely used in the steel casting industry. Risering rules dictate riser size and placement by determining (1) the riser size necessary to supply adequate feed metal to a casting section, and (2) the feeding distance, which is the maximum distance over which a riser can supply feed metal to produce a sound casting. A recent survey indicates that simulation is used for less than ten percent of the tonnage of steel castings produced, and that risering rules (or rules-based software) are used to rig about eighty percent of the tonnage produced.[1,2] Due to the prevalence of rules-based rigging in the steel casting industry, any attempt to increase casting yield in a general sense must begin with these rules. Even if simulation is used, risering rules are still useful to develop a reasonable starting point for simulation, which will shorten the iterative optimization cycle. A great deal of effort has been expended to develop rules for determining riser feeding distances in steel castings. Many researchers have developed empirical relations for determining feeding distances in carbon and low-alloy (C&LA) steels. These rules are typically based on experimental casting trials performed in the 1950’s by Bishop, Myskowski and Pellini at the Naval Research Laboratory (NRL),[3-7] as well as on similar casting trials conducted by the Steel Founders’ Society of America (SFSA).[8] An extensive review of empirical feeding distance relations for C&LA steels is provided in previous work by the current authors.[9,10] Numerical determination of feeding distances for C&LA steels has also been investigated. One of the earliest efforts was undertaken at Case Western Reserve University (Cleveland, OH) by Spiegelberg,[11,12] Maier[13] and Ghun,[14] under the direction of Professor J.F. Wallace. The idea of this work was that the solidification gradient could be used to determine whether or not shrinkage porosity would form in a casting. Spiegelberg theorized that if the solidification

39
gradient near the end of solidification dropped below some minimum value, shrinkage porosity would form. They determined the minimum value by comparing their numerical results to the NRL casting trial results.[3-7] More recently, the present authors[9] developed a methodology to numerically determine feeding distances in low-alloy steel castings through the use of the
Niyama criterion,[15] which is a local thermal parameter defined as TG &/ , where G is the temperature gradient and T& is the cooling rate. By comparing radiographic testing (RT) casting soundness results from an extensive set of plate casting trials with Niyama criterion values computed from simulations corresponding to each casting trial, a correlation was found between casting soundness and the minimum Niyama criterion value. It was determined that, if the minimum Niyama value of a casting section is greater than 0.1 K1/2s1/2mm-1, the section will be radiographically sound (i.e., no shrinkage visible on x-ray). Further, if a section is unsound, shrinkage is likely to occur in regions where the Niyama criterion for that casting section is below the threshold value.
To the authors’ knowledge, the only extensive research effort to develop feeding distance
rules specifically for high alloy steels was performed by Varga, Stone and Lownie[16-19] at Battelle Memorial Institute, under a grant from the Alloy Casting Institute (ACI). Varga et al. began with the shape factor concept first proposed by Bishop et al.;[3-7] the shape factor of a casting section is calculated from the section’s length, width and thickness according to the relation: SF = (L + W)/T. Varga et al. developed empirical charts that gave the appropriate riser size and feeding distance for a given shape factor, assuming the riser was centrally located on the casting section. This was initially done for the C&LA castings produced at the Naval Research Laboratory,[3-7] to determine if the methodology provided feeding distances and riser sizes that agreed with those of Bishop et al. The results were encouraging, so Varga et al. proceeded to perform high alloy casting trials. They cast plates in sixteen foundries, in CF-8, CA-15, HH, HF and HT alloy grades (including multiple compositions of several grades). Top-risered plates were cast with thicknesses T = 1.27, 2.54 and 5.08 cm (0.5, 1 and 2 in.), with an emphasis on T = 1.27 and 2.54 cm (0.5 and 1 in.), because those values are more common in the high alloy casting industry. The width-to-thickness ratios (W/T) used for top-risered plates ranged from 1 to 10. Side-risered plates were only cast with thickness T = 2.54 cm (1 in.), with W/T ranging from 1 to 5. All plates (top- and side-risered) were cast with blind risers, both with and without cracker cores. Feeding distances were determined by finding the maximum length that a riser could feed to produce a sound casting, where soundness was defined as no visible shrinkage on radiographs filmed at 1.5 pct sensitivity. The end result of this work is three empirical feeding distance charts: one for blind top risers feeding 1.27 cm (0.5 in.) thick sections, one for blind top risers feeding 2.54 cm (1 in.) thick sections, and one for blind side risers feeding 2.54 cm (1 in.) thick sections. An important note regarding these high-alloy feeding distance charts is that the feeding distance is defined from the center of the riser to the edge of the casting, rather than from the edge of the riser to the edge of the casting, as in the C&LA rules (see Figure 1). These inconsistent definitions make direct comparison of C&LA and high alloy feeding distances difficult.
Considerable research has also been done to develop riser sizing guidelines for steel castings. Early quantitative approaches developed by Chvorinov[20] and Janco[21] allowed a foundry engineer to determine the riser size necessary to ensure that the riser would solidify after the casting section it was feeding. These methods were based on the work of Chvorinov,[22] who

40
found that solidification time was directly related to a casting’s volume-to-surface-area ratio. While these methods provided a riser that solidified after the casting, they did not ensure that the casting would be free from under-riser shrinkage. Wlodawer[23] termed Chvorinov’s volume-to-surface-area ratio the “solidification modulus,” and developed the modulus method. According to his method, if the modulus of the riser is 20% larger than the modulus of the casting section to be fed, the riser will be sufficient and free from under-riser shrinkage. The modulus method is valid for both C&LA and high alloy steels, primarily because it employs a significant factor of safety. Ruddle[24] modified Wlodawer’s method by explicitly accounting for the volumetric shrinkage of the casting section, which reduces the factor of safety somewhat to provide a more optimized riser size. Caine[25] developed a riser sizing method for C&LA steels that also ensures castings free of under-riser shrinkage, by determining adequate riser size from an empirical relationship between the riser-volume-to-casting-volume ratio and a “freezing ratio,” which is the surface-area-to-volume ratio of the casting divided by that of the riser. A disadvantage to this method is that it requires trial-and-error; one simply guesses a riser size, performs the calculations, and checks whether or not the size selected is adequate. If not, a larger size is chosen, and the calculations are repeated. This disadvantage was overcome in a method proposed by Bishop, Myskowski and Pellini,[26] who developed a direct method for determining riser size in C&LA steels. They replaced Caine’s freezing ratio with a shape factor for the casting section to be fed (as discussed above, SF = (L + W)/T). Once the shape factor for a casting section is calculated, the riser size can be directly determined through an empirical relation. They developed this empirical relation for riser height-to-diameter ratios from 0.5 to 1, and stated that a ratio larger than one decreases yield without providing additional benefits, while a ratio smaller than 0.5 produces a riser with a relatively large diameter that requires excessive cleaning costs to remove. They also provided a method to modify the riser size for complex-shaped castings (i.e., casting sections with appendages). As was the case for high alloy feeding distance rules, the only extensive effort to develop riser sizing rules for high alloy steels is the work of Varga et al.[16-19] In their casting trials, they used blind risers (top and side) that had height-to-diameter ratios of one. They used the shape factor concept of Bishop et al.,[26] but Varga et al. determined the sufficient/minimum riser volume (and hence diameter and height, since H/D = 1) in a somewhat different manner than did Bishop et al. After determining the appropriate riser sizes for all the experimental castings, Varga et al. developed relations to directly determine riser sizes for blind top and blind side risers, based on the shape factor of the section to be fed. As with their feeding distance rules, these riser sizing rules were developed for high alloy grades CF-8, CA-15, HH, HF and HT. Analogous to the work of Bishop et al., they also provided a method to modify the riser size for complex-shaped high alloy casting sections. For several reasons, the riser sizing methodology of Varga et al. is more conservative than that of Bishop et al.; this will be discussed in further detail in the section that describes the new high alloy riser sizing rules. As a final note on riser sizing rules, some numerical research has been performed on riser size optimization. Morthland et al.[27] developed a scheme to iteratively perform entire solidification simulations and optimize the riser size based on the resulting riser pipes. Ou[28] developed a mathematical riser model that simulated riser pipe formation based on liquid and solidification

41
shrinkage coupled with fluid dynamics, and then optimized riser size through the minimization of a cost function that provided the minimum riser size while ensuring the riser pipe did not penetrate beyond the riser into the casting. Both of these numerical methods, which are applicable to both C&LA and high alloy steels, produced riser pipes that were in good agreement with actual castings. In 1973, the SFSA compiled the available low alloy feeding distance rules (the results from the NRL[3-7] and SFSA[8] casting trials, and the numerical predictions performed at Case Western Reserve University[11-14]), the low alloy riser sizing rules of Bishop et al.,[26] and the high alloy feeding distance and riser sizing rules developed by Varga et al.[16-19] into a handbook entitled Risering Steel Castings.[29] The data in this handbook, presented as charts, nomographs, equations, and procedures for risering steel castings, is intended to assist foundry engineers in the placement and sizing of risers on steel castings. Although this handbook is thirty years old, it is still used in foundry practice today. However, there has been substantial feedback from SFSA member foundries indicating that the risering rules contained in Risering Steel Castings, while adequate, are often overly conservative.[1] Also, it was noted that these rules do not account for differences in sand mold material, alloy composition (for low alloy steels), or superheat, all of which are known to affect the distance over which a riser can provide feed metal to a casting section. For high alloy steels, superheat is particularly important, as foundries typically use significantly larger superheats for high alloy steels than for low alloy steels. To address the need for more accurate, less conservative risering rules, the present authors recently developed a new set of C&LA feeding distance rules.[9,10] As discussed earlier in this section, through extensive casting trials and corresponding simulations of each trial casting, a correlation was developed between the Niyama criterion and radiographic soundness. Once this correlation was established, a large number of simulations were performed in order to determine feeding distances for a wide variety of casting conditions. Based on the resulting information, a new set of feeding distance rules was designed to produce radiographically sound castings at 2 pct sensitivity. Rules are provided for end-effect feeding distance and lateral feeding distance for top risers, as well as feeding distance for side risers. In addition, multipliers are provided to apply these rules with end chills and drag chills, as well as to tailor these rules to different steel alloy compositions, sand mold materials and pouring superheats. These new rules are shown to provide longer feeding distances in most casting situations. The C&LA riser sizing methodology of Bishop et al.[26] was not revised, because it was found to be adequate (i.e., not overly conservative). These rules were also published in an SFSA report[30] that was distributed among SFSA member foundries. The objective of the present study is to develop a new, less conservative set of riser feeding distance rules for common high alloy steel grades. The approach taken will be completely analogous to the present authors’ C&LA feeding distance rule development just discussed. High alloy casting trials will be coupled with simulation to develop the necessary correlation to develop high alloy feeding distance rules. In addition, high alloy riser sizing rules are examined; based on this investigation, less conservative riser sizing rules are suggested. The use of these new high alloy rules will provide less conservative riser sizes and feeding distances in most instances, which will increase high alloy casting yield.

42
2 FEEDING DISTANCE TERMINOLOGY
Before discussing the development of the feeding distance rules, it is prudent to carefully define the terms that will be used for this development. The feeding distance (FD) is defined as the maximum distance over which the riser can provide feed metal resulting in a radiographically sound casting. In the case of the SFSA guidelines for high alloy steels, FD is defined from the center of the riser to the edge of the casting section (see FDHA in Figure 1), and soundness is defined as Class I soundness at 1.5 pct radiographic sensitivity.[29] Class I soundness implies that some shrinkage is allowable, provided it is less severe than in the Class I standard radiographs. For the present study, FD is defined from the edge of the riser to the furthest point in the casting section (see FD in Figure 1), and soundness is defined as radiographically sound at 2 pct sensitivity (i.e., no shrinkage visible on x-ray). Another way to explain how the feeding distance is measured in the present study is to draw a circle centered about the riser with a radius equal to the feeding distance plus the riser radius (see Figure 1). Then the casting section inside the circle is fed by that riser. For multi-risered castings (such as in lateral feeding), the circles must overlap such that all sections of a casting are inside these circles. It is noteworthy that this definition of FD is the same as the one used by the present authors in the C&LA feeding distance rule development;[9,10,30] the importance of this consistency will become evident when the high alloy feeding distance rules are developed. A similar term that will be commonly used in this work is feeding length (FL). The feeding length of a casting section is simply the distance from the riser to the furthest point in the section. It is the length to be fed. It is purely geometrical, and implies nothing about the soundness of the casting section being fed. If the feeding length is less than or equal to the feeding distance, the casting section will be sound; if the feeding length exceeds the feeding distance, the casting section is likely to have visible shrinkage porosity. There are two other terms that are important to understand when considering feeding distances: riser zone and end zone. Since the riser remains hotter than the casting section to be fed, it provides a temperature gradient that facilitates feeding. The length over which this riser effect acts to prevent shrinkage porosity is called the riser zone length (RZL), which is measured radially outward from a riser. This is illustrated for a top riser in Figure 2. The cooling effect of the mold at the end of a casting section also provides a temperature gradient along the length of the casting section to be fed. This is called the end effect, and it produces a sound casting over the so-called end zone length (EZL), which is measured normal to the end of a casting section. This is depicted in Figure 3. The feeding distance, FD, is a function of RZL and EZL. As an example, consider Figure 4. For the casting section in this figure to be sound, the entire section must be within a riser zone or end zone region (note that end zones extend from the top and bottom edges (EZL2) of this casting, as well as from the right edge (EZL1)). In the case shown in Figure 4 (W > 2EZL2), the feeding distance is determined by the largest casting section that can still be completely covered by riser zones and end zones (Figure 4a). If the size of the casting section to be fed increases beyond that shown in Figure 4a, the feeding length of this larger casting section will exceed the feeding distance, and shrinkage porosity will form in the portions of the casting not covered by a riser zone or end zone, as shown in Figure 4b. Note that if W ≤ 2EZL2, or if there are multiple risers, the end zone/riser zone requirements for a sound casting change somewhat. This is discussed in detail in the earlier C&LA work[9,30]

43
3 HIGH ALLOY PLATE CASTING TRIALS
As part of the present study, four different foundries cast a total of 165 high alloy plates with a single top riser. The alloys cast were CF-8M (125 plates), HH (20 plates) and HP (20 plates). The original intent was to also cast plates from CA-15 and HK, but the foundries that had agreed to perform those trials had to withdraw from the project. It will be shown in the next section, however, that it was possible to develop rules for these alloys without performing their casting trials. The general casting configurations used for high alloy plate trials are shown in Figure 5; one set of plates (25 CF-8M plates) was cast vertically (Figure 5b), and the rest horizontally (Figure 5a). Again, recall that the feeding lengths FL shown in Figure 5 are purely geometrical, and imply nothing about casting soundness. The casting trial plates can be categorized into four groups, based on their cross-section: 20 of the plates had a cross-section 1.27 cm thick by 2.54 cm wide (0.5 in. T by 1 in. W), 50 plates were 2.54 cm thick by 14.0 cm wide (1 in. T by 5.5 in. W), 70 plates were 2.54 cm by 20.3 cm (1 in. T by 8 in. W), and the remaining 20 plates were 1.27 cm by 15.2 cm (0.5 in. T by 6 in. W). For brevity, these groups of plates will hereafter be referred to by their width-to-thickness (W/T) ratios: W/T = 2, 5.5, 8 and 12, respectively. The W/T = 5.5 and 8 plates were designed with riser diameters DR = 10.2 cm (4 in.), the W/T = 12 plates used DR = 15.2 cm (6 in.), and the W/T = 2 plates used DR = 3.8 cm (1.5 in.). The riser height-to-diameter ratios were all designed to be unity (HR/DR = 1); this was approximately achieved in practice, except for the W/T = 2 and W/T = 12 plates, where the casting foundry decided to use HR/DR ratios of 4.67 and 3, respectively. Several different lengths (L) were cast for each of these groups of plates, with the lengths selected to produce plates ranging from radiographically sound to ASTM shrinkage x-ray level 5 (very unsound). All of the plates described above were cast in either PUNB (furan) or green sand molds. The casting trial data are summarized in Table 1.
When conducting the casting trials, it was envisioned that the trials would include the normal variations in casting conditions that are possible in foundry practice. These variations would then be considered in the analysis of the results. Therefore, detailed information was collected on the casting process for the trial plates, and all information was recorded in detailed data sheets that were filled out by the participating foundries. The casting parameters that were recorded were: pouring temperature, pouring time, steel chemistry, mold material, actual casting rigging and mold-box geometry. In addition, each plate cast in these trials was examined by radiographic testing (RT) according to ASTM E94[31] procedures, using E446[32] reference radiographs (for casting sections up to 5.08 cm (2 in.) thick]. Based on this examination, an ASTM shrinkage RT level was assigned to each plate. The results of the casting trials are given in Figures 6 through 9, which plot the feeding lengths of the W/T = 2, 12, 5.5 and 8 plates, respectively, against the resulting ASTM shrinkage x-ray level for each corresponding plate. The different hollow symbols indicate plates cast by different foundries. When a number appears next to a symbol (or group of overlapping symbols), this indicates the number of plates of that feeding length with the same x-ray level. The shrinkage x-ray levels in these figures range from 0 to 5, where level 0 indicates that the plate was radiographically sound (i.e., absolutely no indications visible on x-ray). While level 0 is not a standard ASTM x-ray level, it is used in this study because it provides additional information. Also shown in these figures are the mean x-ray levels for each value of FL, as well as error bars indicating one standard deviation. The mean values and error bars are not intended to provide

44
meaningful statistical data—the number of plates at each feeding length is generally small, and x-ray levels are quantized rather than continuous data—rather, they are provided to more clearly indicate the trends in the data.
Figures 6 and 7 show the results for the 1.27 cm (0.5 in.) thick plates. Some plate lengths were chosen for both of these sets of plates that are well in excess of the existing high alloy feeding distance rules for 1.27 cm (0.5 in) plates, in an attempt to produce unsound plates with x-ray levels between 1 and 5. However, all the plates represented in Figures 6 and 7 have shrinkage levels of 0 or 1. The sound radiographic results of these casting trials are not entirely surprising; it is known that, for thin casting sections (i.e., less than 2.54 cm (1 in.) thick), the feeding distance becomes highly dependent on the filling process.[29] If a thin section is gated through the riser, feeding distances substantially longer than those predicted with rules for thicker sections can be achieved.[3] This phenomenon can be understood through casting simulation (using the methodology to determine feeding distance, riser zone length and end zone length described in Section 5). Gating through the riser enhances feeding distance by increasing the riser zone length; it has little effect on the end zone length. This increase in riser zone length is moderate for castings that have thickness 2.54 cm (1 in.) or larger, but becomes considerable when the thickness decreases to 1.27 cm (0.5 in.). Figures 8 and 9 show the results for the 2.54 cm (1 in.) thick plates. Notice that, as plate length increases, the average shrinkage x-ray level tends to increase as well. An interesting feature of the casting trial results visible in these figures is the spread of x-ray levels for a given feeding length. Notice that there are several instances in Figures 8 and 9 where the range of x-ray levels at a given feeding length varies by three to five levels. This is particularly evident in Figure 9. This scatter is partially due to the variability in the casting process. Steel composition, pouring temperature, pouring time, mold material, etc. varied from foundry to foundry. The effect of such differences in the production setting is visible in the results shown in Figures 8 and 9; notice that the variation in x-ray level at a given feeding length for a given alloy cast by one foundry is generally smaller than the total variation at that feeding length. Some casting parameters (e.g., pouring temperature) even varied to some degree within a single foundry. Another factor contributing to the scatter in x-ray level at a given feeding length is the variability inherent in assigning x-ray levels to a given radiograph (about ±1.4 x-ray levels, on average[33]). A final cause of the scatter is the presence of gas porosity (of a spherical nature, and thus not considered in the shrinkage rating) in some of these plates. 4 SIMULATION OF CASTING TRIALS Based on the information given on the casting trial data sheets for the plates, simulations were performed for each plate for which unique casting data was available, using the commercial simulation software package MAGMASOFT.1 By using this detailed casting information as input for the simulations, it was possible to account for the variability due to differences in
1 Although MAGMASOFT[34] was used in this work to simulate the casting trials, a number of simulation
packages are available, and most of them are capable of calculating the Niyama criterion. In fact, the authors performed a comparison between MAGMASOFT and AFSolid,[35] and determined that the Niyama values calculated by these two packages for the same casting conditions are similar, provided that one takes care to ensure the Niyama values are calculated in the same manner (e.g., evaluated at the same temperature), and that the values are converted to the same units.[36]

45
casting parameters from foundry to foundry (and from plate to plate). Simulation of the filling process was included, to model the flow of the melt through the gating and into the castings, as well as the cooling of the metal that occurs during this process. The thermophysical properties of each steel alloy considered were computed using the interdendritic solidification computer software (IDS) developed by Miettinen et al.[37,38] The solid fraction versus temperature and density versus temperature curves for the alloys of interest are shown in Figure 10. Also included in this figure are the corresponding curves for a plain carbon steel (AISI 1025), for comparison. Three different CF-8M compositions were computed (with 0.03, 0.06 and 0.08 pct carbon), to correspond with the different compositions cast by the foundries involved. In Figure 10a, note the similarity in the freezing ranges for these alloys; the curves shift to the left (to lower temperature ranges) as the amount of alloying elements increases, but the sizes are generally similar. However, Figure 10b shows that there are greater differences among these alloys in their density change during solidification (i.e., solidification shrinkage). These differences in shrinkage contraction will be discussed in the riser sizing section. Figure 10 can be used to explain the rationale behind developing feeding distance rules for HK and CA-15 alloys without performing those casting trials. The composition of HK is very similar to that of HH and HP, differing primarily in the nickel content. Fortunately, the nickel content of HK is between that of HH and HP. Thus, one would expect the thermophysical properties of HK to be similar to those of HH and HP. This is evident in Figure 10a, where the solidification path of HK44 is seen to fall between HH and HP. Figure 10b shows that the density curves for these three alloys are very similar as well. Similarly, the composition of CA-15 falls between plain carbon steel and CF-8M. Figure 10 shows that both the solidification path and density curves of CA-15 fall between plain carbon steel and CF-8M values. Because the properties of HK and CA-15 lie between those of alloys that were cast in the casting trials (plain carbon steel plates were cast in the low-alloy casting trials[9]), and because the primary purpose of the casting trials was to validate the simulation results used to develop the feeding distance rules, it was deemed acceptable to develop feeding distance rules for HK and CA-15 based on simulation alone. The simulations of the plate casting trials provided the distribution of the Niyama criterion throughout the castings. An example of the Niyama-value distribution in a typical plate is shown in Figure 11. This is a simulation of a 2.54 by 20.3 by 43.2 cm (1 by 8 by 17 in.) HH plate, which is long enough to exceed the feeding distance for the riser (see the results for FL = 34.4 cm (13.5 in.) in Figure 9). In the casting trials, centerline shrinkage was commonly found in plates with these dimensions. Notice that, in both the top view (Figure 11a) and side view (Figure 11b) cross-sections, the lowest Niyama values are confined to the center of the plate. The region with the lowest Niyama values corresponds very closely to the region where centerline shrinkage occurs. For each simulated plate, the minimum value of the Niyama criterion in the central-thickness cross-section (i.e., the plane one would see in a typical x-ray of the plate, Figure 7a) was determined. In addition, the total area in that same cross-section with Niyama criterion values below some critical value was also recorded for each simulation. It is important to note that care must be taken when extracting Niyama values from simulation results. For example, in the present study, it was necessary to turn off the postprocessor’s interpolation function (which is set

46
“on” by default in MAGMASOFT) in order to determine the correct Niyama values for each metal cell of interest. Figure 12 plots the minimum Niyama values of the W/T = 8 plates against the feeding length of each plate. There is a very obvious trend of decreasing minimum Niyama values as the feeding length increases (and hence plate soundness decreases). Analogous plots for the W/T = 2, 5.5 and 12 plates look very similar to Figure 12; for this reason, they are not presented here. Computational results such as those in Figure 12 can be combined with the experimental results shown in Figures 6 through 9 by eliminating the feeding length from these figures and simply plotting the ASTM shrinkage x-ray level determined for each plate versus the minimum Niyama value resulting from the simulation of that plate. In other words, one can plot the measured soundness, in terms of shrinkage x-ray level, against the predicted soundness, in terms of minimum Niyama value. This is shown in Figure 13, which includes all 165 high alloy plates (W/T = 2, 5.5, 8 and 12) described in the previous section. The first noteworthy feature of this figure is a definite tendency toward lower and lower minimum Niyama values as the x-ray level increases. This trend is highlighted in the plot inset in the upper-right corner of Figure 13, which shows the mean value of Nymin for plates having x-ray levels from level 1 to level 4. The mean values for each x-ray level are shown with bars indicating the size of the range from minus one to plus one standard deviation from the mean. This is an indication of the scatter of the values for plates with a given x-ray level. No mean minimum Niyama values are given for level 0 or level 5 because the mean value for level 5 plates could be made almost arbitrarily small by casting a large number of very long plates, and the mean value for level 0 plates could similarly be made almost arbitrarily large by casting a large number of short plates. Note that the minimum Niyama value asymptotes to zero as the x-ray level increases to level 5, and that the scatter in Nymin tends to decrease as the x-ray level increases. It is also apparent from Figure 13 that a plate with a relatively large value of Nymin will have a low x-ray level. Note that all of the plates with a minimum Niyama value greater than 0.2 are level 1 or better, and almost all of the plates with Nymin > 0.1 are level 1 or better. The two plates with Nymin > 0.1 that have x-ray levels higher than level 1 are considered outliers; they are the result of (1) the previously mentioned scatter in the experimental data that could not be accounted for in the simulations, and (2) differences between the actual casting conditions and the values that were recorded. As an example of the latter, if the recorded superheat was higher than the actual superheat, the simulation would result in a plate more sound (hence, with a larger Nymin) than was produced in the trials. It is evident that there is a transition, as the Niyama value decreases down to somewhere around 0.1 to 0.2, from radiographically sound plates to unsound plates. For the present study, it was desirable to define some threshold value to denote this transition. The value chosen as the threshold is Nymin = 0.1 K1/2s1/2mm-1. This is the same threshold value that was chosen for the C&LA feeding distance rules developed by the present authors[9]; a thorough justification of the choice is provided in this earlier work.
While it is true that a relatively large Niyama value indicates that a plate will probably have a low x-ray level, the converse is not true: a small value of Nymin does not necessarily imply that the corresponding plate will have a high x-ray level. This is evident from the large number of plates in the lower-left corner of Figure 13 that are level 1 or better, and yet have Nymin < 0.05. Although this may appear troubling at first glance, it can be explained by considering Figure 13

47
in conjunction with Figure 14, which plots the shrinkage x-ray level of the W/T = 5.5 plates against the area of these plates with Niyama criterion values below the threshold value of 0.1, measured from the corresponding plate simulations (see Figure 11a). Figure 14 includes the values for each individual plate (numbers next to symbols indicate multiple plates with the same value), as well as the mean area for all of the plates at each x-ray level plus/minus one standard deviation. As in Figure 13, no mean values are given for level 0 or level 5 in these figures, because the mean areas for these levels are rather arbitrary. An area of zero indicates that the minimum Niyama value is greater than 0.1. Figure 14 shows that, as the x-ray level of a plate increases, the area with Niyama values less than 0.1 tends to increase as well. The standard deviation bars show that there is a significant amount of scatter in this data, however. From Figure 14, it can be seen that the level 0 and level 1 plates in Figure 13 with Nymin < 0.1 generally have very small areas with Niyama values less than 0.1. Thus, a small minimum Niyama value does not necessarily imply that the plate should have a high x-ray level; if the area with Ny < 0.1 is small, the plate may still be radiographically sound. The analogous plot for the W/T = 8 plates shows the same trends, and thus is not shown; the W/T = 2 and 12 plates all have x-ray levels of 0 or 1, so a plot of this type is not useful. 5 CALCULATION OF FEEDING DISTANCE
At this point, it is necessary to review the C&LA feeding distance rule development previously performed by the present authors.[9,10,30] The reason for this is that the high alloy rules will be shown to be directly linked to the previously developed rules for C&LA steels. As mentioned earlier, the high alloy rule development described in this paper was performed in a manner completely analogous to the development of the C&LA rules. Comparison between the C&LA casting trials and the simulations of those trials led to the same conclusion determined for high alloy steels in the previous section: if the minimum Niyama value in a casting section is greater than 0.1 K1/2s1/2mm-1, the casting section should be radiographically sound. Once this relationship was established, a great number of casting simulations were performed. These simulations were run without considering filling; i.e., the simulation began with the mold cavity full of metal at Tpour. Simulating without filling results in slightly shorter feeding distances, which means that the rules developed here are slightly conservative; however, the overall effect is very small. Simulations were performed using values of plate thickness T ranging from 2.54 cm to 30.5 cm (1 in. to 12 in.). For each thickness, plates were simulated with widths corresponding to W/T ratios ranging from 1 to 17. For each value of T and W/T, the plate length L was varied until the minimum Niyama value in the central-thickness cross-section (i.e., typical x-ray plane) was equal to 0.1 K1/2s1/2mm-1. An example illustrating this is provided in Figure 15. If the plate shown in this figure was made any longer, the minimum Niyama value would drop below 0.1, and radiographic soundness would no longer be expected. The plate length for which Nymin = 0.1 was used to determine the feeding distance (FD), as well as the riser zone length (RZL) and end zone length (EZL), as shown in Figure 15. The end effect (i.e., single top riser) feeding distance rule resulting from this C&LA work is shown in Figure 16, which gives the feeding distance as a function of W/T. By dividing FD by the thickness T (the dimension into the page for the casting sketch shown in Figure 16), it was possible to represent the feeding distance with a single curve for all section thicknesses in the range being considered. The curve in Figure 16 can be represented by the following polynomial expression:

48
97.1 99.1 266.0 0174.01029.4
2344
effectend+
+
−
+
×−=
−
TW
TW
TW
TW
TFD
(1) Equation (1) is accurate up to W/T = 15, beyond which FD/T has a constant value of 9.0. Figure 16 and Equation (1) represent the C&LA feeding distance rule for the base case casting conditions, which are:
• AISI 1025 steel, • PUNB (furan) sand mold, • 60°C (108°F) pouring superheat.
In addition to these base case casting conditions, rules were also developed for different sand mold materials, C&LA steel compositions, pouring superheats, and cooling conditions (end chill, drag chill). It was determined that variations from the base case could all be accounted for with simple multipliers. Then the feeding distance for casting conditions other than the base case conditions could be computed with the equation
alloycastsuperheat casebaseconditionsdifferent
CCT
FDT
FD××
=
conditionscoolingmoldsand CC ×× (2)
where (FD/T)base case represents the feeding distance determined from Figure 16 or Equation (1), and the multipliers in Equation (2) are provided in Table 2. For the high alloy steel rule development, just as in C&LA steels, once the critical minimum Niyama value of 0.1 was determined, a large number of casting simulations were performed for each alloy under consideration (CF-8M, CA-15, HH, HK and HP). Plate thickness T was again varied from 2.54 cm to 30.5 cm (1 in. to 12 in.), and for each thickness, plates were simulated with widths corresponding to W/T = 1, 2, 4, 6, 8 and 12. As in the previous work, the plate length L was varied for each plate until the feeding distance, riser zone length and end zone length were determined (as in Figure 15). An example of the results of this effort is shown in Figure 17. This figure contains curves representing feeding distance, riser zone length and end zone length for CF-8M (0.06 pct carbon). All simulations represented in this figure were performed using furan sand, and a superheat of 100°C (180°F). Again, FD, EZL, RZL and W are all normalized by the thickness T, so that the feeding distance, riser zone length and end zone length can each be represented by a single curve for all section thicknesses in the range being considered. By comparing the CF-8M curves in Figure 17 to the CF-8M simulation results for the different thicknesses, one can see that the curves were generated using the average values at each W/T ratio for casting sections with thicknesses ranging from 2.54 to 30.5 cm (1 to 12 in.). Note that as thickness decreases, FD/T increases slightly. However, it is a relatively small change, and as such it is neglected for the sake of producing a single feeding distance curve for all values of thickness. Also shown in Figure 17 is the feeding distance rule for 1025 steel under these casting conditions. Except for the superheat, the conditions for this curve are all the base case conditions

49
(see Table 2). Therefore, this curve can be determined by multiplying the feeding distance given in Figure 16 or Equation (1) by the superheat multiplier for 100°C (180°F), which is Csuperheat = 1.08. Notice that this curve and the feeding distance rule for 0.06 pct carbon CF-8M are very similar. In fact, these rules differ by a scale factor; i.e., if the 1025 steel curve is scaled by the factor 0.978 (determined through regression analysis), the result is essentially coincident with the CF-8M curve in this figure. The correlation between these feeding distance curves is possible because the high alloy rules were developed in a manner completely consistent with the methodology used to develop the C&LA rules. Besides consistent methodology, two other important areas of consistency are worth noting: first, the definitions of feeding distance, riser zone length and end zone length used for the C&LA and high alloy rules are identical; and second, the same value of minimum Niyama criterion was chosen as the critical value for both C&LA and high alloy steels. Further evidence of the scalability between C&LA and high alloy feeding distances is given in Figure 18, which shows the feeding distance results for CA-15, again with furan sand and 100°C (180°F) superheat. The open circles represent the average of the simulation results over all thickness values computed at each value of W/T. The upper curve again represents the feeding distance rule for AISI 1025 steel for these casting conditions. The lower curve represents the 1025 curve, scaled by a factor of 0.943 (again determined through regression analysis). Note the good agreement between the scaled 1025 rule and the CA-15 results. This process was repeated for each of the high alloy grades studied, and the scale factors were collected and tabulated along with the C&LA cast alloy multipliers in Table 2. Note that all the high alloy multipliers are relatively close to unity. The largest deviations from unity, for HP and low carbon CF-8M, are only ten pct. This indicates that the feeding distances of the high alloy grades considered are all very similar to those of C&LA steels, if all other casting conditions are the same. With the exception of high carbon CF-8M, all the alloys studied have slightly shorter feeding distances than AISI 1025 steel. In their study, Varga et al.[17] found that most of these alloys had longer feeding distances than C&LA steel. This is likely due to the larger superheats typically used for high alloy steels than for C&LA steels; pouring temperatures are often similar, but high alloy steels have significantly lower liquidus temperatures (due to the additional alloying elements) than do C&LA steels. Evidence of the higher superheat can be seen from the data in Table 1; the average superheat from the high alloy casting trials was 158°C (284°F). Considering the superheat multipliers in Table 2, a 158°C (284°F) superheat has a multiplier of almost 1.2, or nearly a 20 pct increase in feeding distance due to the superheat alone. As with the C&LA rule development, each high alloy grade studied was also simulated, over the whole range of T and W/T considered, with superheats ranging from 30°C to 250°C (54°F to 450°F), with different sand mold materials, and with drag chills and end chills. Simulation results were compared with values generated using the end effect feeding distance rule (Figure 16 or Equation (1)) with the appropriate multipliers (Equation (2) and Table 2), to ensure that the superheat, mold material and chill multipliers from the C&LA rule development were also valid for high alloy steels. An example of this is provided in Figure 19. The middle curve in this figure is the end effect feeding distance rule for the base casting conditions (Figure 16 or Equation (1)). The lower curve is the same feeding distance rule scaled by the CF-8M (0.06 pct carbon) multiplier, and the upper curve accounts for both CF-8M and a superheat of 100°C (180°F). The open symbols in this plot are simulation results for 5.08 cm (2 in.) thick CF-8M

50
plates cast in furan sand molds; the diamonds represent a superheat of 60°C (108°F), and the circles represent a superheat of 100°C (180°F). Note the good agreement between the simulation results and the corresponding feeding distance rule values. Good agreement was also found for the cooling condition and sand mold material multipliers in Table 2. A comparison between the new high alloy feeding distance rule and current SFSA rules[29] is provided in Figure 20. The uppermost curve in this figure represents the new feeding distance rule over a range of W/T for CF-8M (0.06 pct carbon) cast in a furan sand mold, with a superheat of 160°C (288°F). As mentioned earlier, this value represents the average superheat from the high alloy casting trials (see Table 1); although Varga et al.[17] neither considered nor reported the superheats used in their casting trials, it can be expected that they were of the same order. Again, the new rule was developed using the average feeding distance values for thicknesses ranging from T = 2.54 to 30.5 cm (1 to 12 in.), and is valid over this thickness range. The three lower curves, which are taken from the high alloy risering rules in Risering Steel Castings,[29] are only applicable to 2.54 cm (1 in.) thick sections. It should be noted that, in Risering Steel Castings, there is only one feeding distance rule provided for 2.54 cm (1 in.) thick sections for all the high alloy grades listed in this figure. However, this handbook measures feeding distance from the center of the riser to the edge of the casting (see Figure 1). In order to convert the feeding distance from the SFSA high alloy definition to the present definition (shown in Figure 20), it is necessary to calculate the appropriate riser size for each casting geometry. Risering Steel Castings provides different riser sizing rules for three categories of high alloy steels; these different rules lead to the three lower curves seen in Figure 20. In this example, the new rule feeding distance is seen to be significantly longer over the entire range of W/T than feeding distances determined with the existing rules. There are two reasons for this. First, Varga et al.[16-19] developed their rules based solely on empirical analysis; they determined feeding distances primarily by sectioning castings with centerline shrinkage, and measuring the riser zone (distance from the riser to the beginning of the shrinkage) and end zone (distance from end of shrinkage to the end of the casting). They added these two values (plus the riser radius) to determine the feeding distance. However, the feeding distance (FDHA in Figure 1) can only be computed as the sum of the riser radius, riser zone length and end zone length for the longest sound casting before shrinkage forms (e.g., Figure 15). As noted by Pellini et al.,[3,6] if the casting length exceeds the maximum length of a sound casting and shrinkage forms (e.g., Figure 11), the shrinkage region encroaches on the riser zone, which reduces the riser zone length from its maximum value. This yields a conservative estimate of the feeding distance. Also, Risering Steel Castings only provides a single feeding distance chart for all high alloy grades. Varga et al.[17,18] developed such charts for several grades; when this work was condensed into Risering Steel Castings, only the most conservative feeding distance chart was provided, so that it would be valid for all alloys. In summary, through high alloy casting trials and extensive use of casting simulation, it was determined that the low alloy feeding distance rules developed in the authors’ previous work[9,10,30] are also applicable to the high alloy grades considered in this work, provided that the appropriate high alloy grade multiplier (given in Table 2) is used. The present work only discussed the end effect feeding distance rule, applicable to single top risers. However, the previous work also presented rules for lateral feeding and side risers.[10,30] In order to use these lateral feeding or side riser rules for high alloy steels, one simply needs to replace (FD/T)base case

51
in Equation (2) with the corresponding feeding distance rule, and apply the appropriate multipliers. One clarification is in order, however: if distances are being computed for lateral feeding between two risers, and a drag chill is being used, one should use the end effect feeding distance rule in Equation (1) and the drag chill multiplier from Table 2 to determine this distance. The reason for this is that a drag chill essentially creates an artificial end zone, which approximates an end effect (which is why the drag chill multiplier is close to unity). The end chill and drag chill dimensions recommended for application of these feeding distance rules are given in the previous work.[10,30]
6 CALCULATION OF RISER SIZE As stated in the introduction, the only known extensive effort to develop riser sizing rules for high alloy steels was performed by Varga et al.;[16-19] this work was later incorporated into the SFSA handbook Risering Steel Castings,[29] along with the C&LA riser sizing rules developed by Bishop et al.[26] A direct comparison of the C&LA riser sizing rule of Bishop et al. and the high alloy rules of Varga et al. is shown in Figure 21. This figure gives the riser-volume-to-casting-volume ratio as a function of the shape factor of the casting section the riser is intended to feed. From this figure, it is evident that the high alloy riser sizing rules call for significantly larger riser sizes for a given shape factor. To understand why this is the case, it is necessary to review how these rules were developed. Bishop et al.[26] developed their C&LA riser sizing rules based on a set of plate casting trials. These trials used open top risers, with a wide range of plate sizes and riser height-to-diameter ratios. Using radiographs of the riser pipe, they defined the minimum riser size as one where the tip of the riser pipe just met the riser-casting contact surface. Defining the safety margin (SM) to be the distance from the riser-casting contact surface to the tip of the riser pipe (see Figure 22), the minimum riser requirement of Bishop et al. can also be described as a riser having a safety margin of zero (SM = 0). Through experimentation, they found that the minimum riser height could be determined from any casting by determining its safety margin, provided that the safety margin did not exceed one or two inches. The minimum riser height was found by simply subtracting the safety margin from the original riser height (i.e., HR,min = HR – SM). Note that if the riser pipe extended into the casting, the safety margin was negative, so the minimum riser height was larger than the original height. Bishop et al. used this new minimum riser height (HR,min) with the original riser diameter (DR) to determine the minimum riser volume, and in this manner developed a plot of riser-volume-to-casting-volume ratio versus shape factor. The experimental data in this plot fall in a band of riser volumes for each shape factor; Bishop et al. included an upper-bound curve (above which the riser is too large) and a lower-bound curve (below which the riser is too small) for the experimental data. The C&LA riser size curve shown in Figure 21, developed by Spiegelberg[12], represents the upper-bound curve of this band. The nomograph given to size C&LA risers in Risering Steel Castings[29] was developed from this upper-bound curve. Varga et al.[16-17] developed their high alloy riser sizing rules using a methodology similar to that of Bishop et al., but with several important differences. They also performed casting trials, for the high alloy steels they were investigating, and used riser pipe radiographs to determine the safety margin. For their study, however, all of their risers were blind top risers (both with and without cracker cores) that had height-to-diameter ratios of unity (i.e., DR = HR). When they

52
measured the safety margin, then, they modified both the riser height and diameter to determine the minimum riser size (i.e., HR,min = HR – SM and DR,min = DR – SM). An important note regarding this procedure, however, is that most of their original risers were too small. As a result, most of their riser pipes extended into the castings (up to about 1.27 cm (0.5 in.)), producing negative safety margins, as illustrated in Figure 23. Thus, when they calculated minimum riser size, they typically increased both the riser height and diameter, when it was really only necessary to increase the height (according to the methodology experimentally established by Bishop et al.[26]). This produced larger than necessary riser volumes. Also analogous to Bishop et al., Varga et al. then plotted the experimental minimum riser volumes as a function of shape factor. The results for each alloy grade were plotted separately, and if the alloy was cast both with and without cracker cores, two plots were made for that alloy grade to separate this effect as well. Varga et al. then represented the band of experimental data in each of these plots by using the upper-bound curve, analogous to the C&LA curve shown in Figure 21. When an alloy grade had results both with and without cracker cores, they condensed this information by using the more conservative of the two to represent that alloy grade. The results for blind risers with cracker cores were more conservative, as they tend to produce deeper riser pipes. This is illustrated through MAGMASOFT casting simulation results in Figure 24. This figure shows riser pipes for a 2.54 by 38.1 by 35.6 cm (1 by 15 by 14 in.) CA-15 plate casting with a riser having both diameter and height equal to 7.64 cm (2.9375 in.). Note that the open riser has a larger safety margin than either blind riser case. The blind riser with the cracker core has a slightly deeper riser pipe than the vented blind riser without a cracker core; this trend is seen in industry as well. However, the difference between the riser pipes in Figures 24b and 24c is small enough that it could be considered a grid effect; a finer grid would be required to verify this difference. Figure 24c corresponds to one of the plates cast in the trials of Varga et al.; they measured a safety margin of -0.76 cm (–0.3 in.). The discrepancy between the measured value and the simulated value of –0.20 cm (–0.08 in.) is likely due to the fact that Varga et al. did not report the superheat used to produce these plates; a superheat of 150ºC (270ºF) was used in the simulations shown in Figure 24, but if a superheat of 200ºC (360ºF) is used in the case shown in Figure 24c, the simulated safety margin is –0.69 cm (-0.27 in.). It should be noted that the simulated riser pipes produced by MAGMASOFT[34] are considered reliable in industry; a comparison between simulations and the casting trial results of Bishop et al.[26] (who did report superheats) for 1025 steel castings is shown in Figure 25. Finally, two other factors of safety were built in to the riser sizing rules of Varga et al. First, they combined the alloys they considered into three groups (the three high alloy groups shown in Figure 21), taking the most conservative curve from each group to represent the entire group. Finally, when they had reduced their data down to riser sizing curves for three groups, they increased the riser sizes further by adding a safety margin of 0.64 cm (0.25 in.) to define their minimum riser size. Also shown in Figure 21 (as open circles) are simulation values of the minimum riser size for several shape factors. These simulations were performed with AISI 1025 steel in a green sand mold, with a 120ºC (216ºF) superheat. All risers in the simulations were open top risers with height-to-diameter ratios of unity, and the minimum riser size was defined as a riser with SM = 0. This was determined by iteratively changing the riser size until the simulation resulted in a zero safety margin. Note that the simulation data agree very well with the C&LA riser sizing curve of Bishop et al., and that the simulation data are slightly less conservative. This is not surprising,

53
considering that the C&LA curve shown was taken as the upper-bound curve from the SM = 0 data in the work of Bishop et al. As stated earlier, the C&LA riser sizing rule developed by Spiegelberg[12], based on the work of Bishop et al.,[26] is considered adequate for C&LA steels. The changes made by Varga et al.[16-
17] in the methodology of Bishop et al. result in riser sizing rules that are too conservative. In an effort to demonstrate this, the minimum riser sizes for the casting trial data of Varga et al. were recalculated, using the same riser sizing methodology that was used by Bishop et al. (i.e., determining the minimum riser dimensions by changing the riser height based on the safety margin, but continuing to use the original riser diameter; also, designing the minimum riser size for SM = 0 rather than 0.64 cm (0.25 in.)). The results for each alloy were combined into the same groups used by Varga et al., taking the most conservative results from each group. This information is plotted in Figure 26. Comparing Figure 26 to Figure 21, note that the re-calculated high alloy blind riser sizes are considerably less conservative than those of Varga et al. The results for low carbon HF, HH, CA-15 and CF-8 are, in fact, nearly coincident with the C&LA curve for open top risers. The curves for the other high alloy grades are not very far above the C&LA curve for open top risers. The issue of whether or not different riser sizing curves are truly required for different high alloy grades was investigated further. As mentioned in the discussion of Figure 10b, due to the differences in density curves among the alloy grades, the differences in their solidification shrinkage can be significant. This could indicate that riser pipe depths may be different for different alloys, and that different riser sizes for the same casting section may be required. However, as illustrated in Figure 27, simulation results indicate that this is not the case. This figure shows minimum riser sizes for simulations of plate castings of various sizes and alloys. All other casting conditions were held constant for these simulations. As with the simulation results shown in Figure 21, the minimum riser sizes were calculated using open top risers with HR/DR = 1, and iterating on the riser size until a safety margin of zero was achieved. Notice that the riser sizes for a given plate size are essentially constant, regardless of the alloy; also note that AISI 1025 is included along with the high alloy grades. This indicates that, for open top risers, as long as the casting conditions other than alloy grade are held constant, the same size riser can be used, regardless of the alloy. Therefore, the C&LA curve shown in Figure 26 can be used to size high alloy open top risers as well as C&LA open top risers. How is this possible, considering that the solidification shrinkage in this figure varies from about 2.8 pct to 4.5 pct? This is explained in Figure 28, which shows risers resulting from another set of simulations. All of these simulations are for a 2.54 by 12.7 by 35.6 cm (1 by 5 by 14 in.) plate, with a vented blind top riser (DR = 6.70 cm (2.6375 in.) and HR = 7.46 cm (2.9375 in.)). The simulation was performed for various alloys, all cast in green sand with a 100°C (180°F) superheat. Notice that these riser pipes have different shapes; some wider and some narrower. However, the safety margin for all these risers is essentially the same. This explains the consistency in riser size, regardless of the amount of solidification shrinkage: the riser pipes take on different shapes, but have about the same depth! This indicates that the size of blind risers is also essentially independent of alloy grade, for C&LA steels and the high alloy grades considered. In summary, based on this work, the following riser sizing recommendations are made for the high alloy steel grades considered:

54
• For open top risers: size the riser using the C&LA riser sizing rule given in Figure 26.
• For blind top risers: although the casting trials performed in this work did not use blind risers, simulation with vented blind top risers indicates that the size of blind risers is also independent of the alloy grade, for the high alloy grades considered. Although no blind riser rule was developed, the same practice used in C&LA foundries can be employed: size the riser based on the C&LA rule for open top risers, and then make the riser somewhat taller to account for the deeper pipe that results from a blind riser.
CONCLUSIONS
A new set of feeding distance and riser sizing rules has been developed for high alloy steel grades CF-8M, CA-15, HH, HK and HP. By comparing casting trial results with corresponding casting simulation results, a correlation was developed between the Niyama criterion (a local thermal parameter) and casting soundness. Using this information, extensive casting simulation was used to develop feeding distance rules for a wide range of casting conditions. It was found that the feeding distance rules developed in an earlier analogous study for carbon and low-alloy steels could also be used for the high alloy steels considered, provided that the feeding distance was modified by the appropriate high alloy steel grade multiplier. Other multipliers for these feeding distance rules account for superheat, sand mold material, and the use of chills. The new high alloy feeding distance rules, which are valid for section thicknesses ranging from 2.54 to 30.5 cm (1 to 12 in.), are shown to be less conservative than existing feeding distance rules, and are more tailored to the actual casting conditions. In another part of this study, high alloy riser sizing rules were investigated. It was determined that if open top risers are used, the C&LA riser sizing rule (which is less conservative than previously published high alloy riser sizing rules) is applicable for high alloy steels as well. This study also determined that riser size is independent of alloy grade for blind top risers. ACKNOWLEDGMENTS This work was prepared with the support of the U.S. Department of Energy (DOE) Award No. DE-FC36-02ID14225. However, any opinions, findings, conclusions, or recommendations expressed herein are those of the authors, and do not necessarily reflect the views of the DOE. We are indebted to Malcolm Blair and Raymond Monroe of the SFSA for their work in helping organize the trials and recruiting members to participate. Most importantly, we thank the participants in the plate casting trials for their substantial investments of both time and resources. This work could not have been accomplished without their shared efforts.

55
REFERENCES
1. Yield in the Steel Casting Industry – Literature Review and Industry Survey, Steel Founders' Society of America Special Report No. 30, 1998.
2. C. Beckermann, X. Shen, J. Gu and R.A. Hardin: “A Computational Study of Feeding Rules and Yield Improvement Techniques,” 1997 SFSA Technical and Operating Conference, 1997.
3. H.F. Bishop and W.S. Pellini: Am. Foundrymen’s Soc. Trans., 1950, vol. 58, pp. 185-197.
4. H.F. Bishop, E.T. Myskowski and W.S. Pellini: Am. Foundrymen’s Soc. Trans., 1951, vol. 59, pp. 171-180.
5. E.T. Myskowski, H.F. Bishop and W.S. Pellini: Am. Foundrymen’s Soc. Trans., 1952, vol. 60, pp. 389-400.
6. W.S. Pellini: Am. Foundrymen’s Soc. Trans., 1953, vol. 61, pp. 61-80.
7. E.T. Myskowski, H.F. Bishop and W.S. Pellini: Am. Foundrymen’s Soc. Trans., 1953, vol. 61, pp. 302-308.
8. C.W. Briggs: Determination of the Factors Influencing Riser Efficiency Part II, The Distance Risers Will Feed Uniformly Thick Sections, Steel Founders' Society of America Research Report No. 30, Technical Research Committee Report, 1953.
9. K.D. Carlson, S. Ou, R.A. Hardin and C. Beckermann: Metall. Mater. Trans. B, 2002, vol. 33B, pp. 731-740.
10. S. Ou, K.D. Carlson, R.A. Hardin and C. Beckermann: Metall. Mater. Trans. B, 2002, vol. 33B, pp. 741-755.
11. W.D. Spiegelberg: M.S. Thesis, Case Western Reserve University, Cleveland, OH, 1968.
12. W.D. Spiegelberg: Ph.D. Thesis, Case Western Reserve University, Cleveland, OH, 1970.
13. R. Maier: M.S. Thesis, Case Western Reserve University, Cleveland, OH, 1972.
14. W.P. Ghun: M.S. Thesis, Case Western Reserve University, Cleveland, OH, 1974.
15. E. Niyama, T. Uchida, M. Morikawa and S. Saito: Am. Foundrymen’s Soc. Int. Cast Met. J., 1982, vol. 7 (3), pp. 52-63.
16. J. Varga, Jr. and H.W. Lownie, Jr.: Summary Report on Solidification and Feeding of High-Alloy Castings, Alloy Casting Institute, April 1955.
17. J. Varga, Jr., A.J. Stone and H.W. Lownie, Jr.: Summary Report on Solidification and Feeding of High-Alloy Castings, Alloy Casting Institute, September 1956.
18. J. Varga, Jr., A.J. Stone and H.W. Lownie, Jr.: Summary Report on Solidification and Feeding of High-Alloy Castings, Alloy Casting Institute, September 1957.
19. J. Varga, Jr., A.J. Stone and H.W. Lownie, Jr.: Summary Report on Solidification and Feeding of High-Alloy Castings, Alloy Casting Institute, June 1958.
20. N. Chvorinov: Giesserei, 1940, vol. 27, pp. 177-225.

56
21. N. Janco: “Calculating Sizes of Gates and Risers,” Am. Foundrymen’s Soc. Trans., 1947, vol. 55, pp. 296-300.
22. N. Chvorinov: “Control of the Solidification of Castings by Calculation,” Foundry Trade Journal, 1939, pp. 95-98.
23. Wlodawer: Directional Solidification of Steel Castings, 1st English ed., Pergamon Press Inc., Long Island, New York, 1966, pp. 1-15.
24. R.W. Ruddle: Am. Foundrymen’s Soc. Trans., 1971, vol. 79, pp. 269-280
25. J.B. Caine: “A Theoretical Approach to the Problem of Dimensioning Risers,” Am. Foundrymen’s Soc. Trans., 1949, vol. 57, pp. 492-501.
26. H.F. Bishop, E.T. Myskowski and W.S. Pellini: “A Simplified Method for Determining Riser Dimensions,” Am. Foundrymen’s Soc. Trans., 1955, vol. 63, pp. 271-281.
27. T.E. Morthland, P.E. Byrne, D.A. Tortorelli and J.A. Dantzig: Metall. Mater. Trans. B, 1995, vol. 26B, pp. 871-895.
28. S. Ou: Ph.D. Thesis, The University of Leoben, Leoben, Austria, 1998.
29. Risering Steel Castings, Steel Founders' Society of America, Barrington, Illinois, 1973.
30. Feeding & Risering Guidelines for Steel Castings, Steel Founders' Society of America, Barrington, Illinois, 2001.
31. ASTM E94-00, Annual Book of ASTM Standards, Volume 03.03: Nondestructive Testing, American Society for Testing of Materials, 2002.
32. ASTM E446-98, Annual Book of ASTM Standards, Volume 03.03: Nondestructive Testing, American Society for Testing of Materials, 2002.
33. K. Carlson, S. Ou, R.A. Hardin and C. Beckermann: Int. J. Cast Metals Res., 2001, vol. 14 (3), pp. 169-183.
34. MAGMASOFT, MAGMA GmbH, Kackerstrasse 11, 52072 Aachen, Germany.
35. AFSolid, AFS, Inc., 505 State Street, Des Plaines, Illinois, 60016, USA.
36. Development of a Methodology to Predict and Prevent Leaks Caused by Microporosity in Steel Castings, Steel Founders' Society of America Research Report No. 110, 2001.
37. J. Miettinen: Metall. Trans. B, 1997, vol. 28B, pp. 281-297.
38. J. Miettinen and S. Louhenkilpi: Metall. Trans. B, 1994, vol. 25B, pp. 909-916.

57
Table 1 Experimental data from the high alloy plate casting trials.
W/T* Steel Alloy Foundry
L (in.)
DR (in.)
HR (in.)
FL (in.)
Pouring T (ºC)
Superheat (ºC)
Sand Mold
X-ray level
W/T*
Steel Alloy Foundry
L (in.)
DR (in.)
HR (in.)
FL (in.)
Pouring T (ºC)
Superheat (ºC)
Sand Mold
X-ray level
2 CF-8M A 3.25 1.5 7 1.80 1593.3 161.1 furan 0 5.5 CF-8M K 14 4 4.5 10.3 1580.0 148.0 furan 0 2 CF-8M A 3.25 1.5 7 1.80 1604.4 172.2 furan 0 5.5 CF-8M K 14 4 4.5 10.3 1579.4 147.4 furan 0 2 CF-8M A 3.25 1.5 7 1.80 1598.9 166.7 furan 0 5.5 CF-8M K 16 4 4 12.3 1597.8 165.8 furan 1 2 CF-8M A 3.25 1.5 7 1.80 1587.8 155.6 furan 0 5.5 CF-8M K 16 4 4 12.3 1590.0 158.0 furan 3 2 CF-8M A 3.25 1.5 7 1.80 1596.1 163.9 furan 0 5.5 CF-8M K 16 4 4 12.3 1590.0 158.0 furan 2 2 CF-8M A 3.75 1.5 7 2.29 1557.2 122.6 furan 0 5.5 CF-8M K 16 4 4 12.3 1587.8 155.8 furan 2 2 CF-8M A 3.75 1.5 7 2.29 1554.4 119.8 furan 0 5.5 CF-8M K 16 4 4 12.3 1582.2 150.2 furan 4 2 CF-8M A 3.75 1.5 7 2.29 1571.1 136.5 furan 0 5.5 CF-8M K 18.5 4 4 14.7 1596.1 164.1 furan 3 2 CF-8M A 3.75 1.5 7 2.29 1560.0 125.4 furan 0 5.5 CF-8M K 18.5 4 4 14.7 1593.9 161.9 furan 3 2 CF-8M A 3.75 1.5 7 2.29 1562.8 128.2 furan 0 5.5 CF-8M K 18.5 4 4 14.7 1590.6 158.6 furan 3 2 CF-8M A 4.75 1.5 7 3.28 1576.7 142.1 furan 0 5.5 CF-8M K 18.5 4 4 14.7 1590.0 158.0 furan 3 2 CF-8M A 4.75 1.5 7 3.28 1571.1 136.5 furan 0 5.5 CF-8M K 18.5 4 4 14.7 1581.7 149.7 furan 2 2 CF-8M A 4.75 1.5 7 3.28 1565.6 131.0 furan 0 8 CF-8M A 9 4 6 6.06 1595.6 167.1 furan 0 2 CF-8M A 4.75 1.5 7 3.28 1586.7 152.1 furan 0 8 CF-8M A 9 4 6 6.06 1580.6 152.1 furan 0 2 CF-8M A 4.75 1.5 7 3.28 1582.2 147.6 furan 0 8 CF-8M A 9 4 6 6.06 1590.6 162.1 furan 0 2 CF-8M A 6.75 1.5 7 5.27 1554.4 119.8 furan 1 8 CF-8M A 9 4 6 6.06 1587.8 159.3 furan 0 2 CF-8M A 6.75 1.5 7 5.27 1548.9 114.3 furan 1 8 CF-8M A 9 4 6 6.06 1593.3 164.8 furan 0 2 CF-8M A 6.75 1.5 7 5.27 1551.7 117.1 furan 0 8 CF-8M A 10 4 6 6.94 1558.9 123.4 furan 0 2 CF-8M A 6.75 1.5 7 5.27 1565.6 131.0 furan 1 8 CF-8M A 10 4 6 6.94 1570.6 135.1 furan 0 2 CF-8M A 6.75 1.5 7 5.27 1555.6 121.0 furan 1 8 CF-8M A 10 4 6 6.94 1548.9 113.4 furan 0
5.5 CF-8M F 7 4 3.5 7.0 1587.2 133.2 furan 0 8 CF-8M A 10 4 6 6.94 1560.0 124.5 furan 0 5.5 CF-8M F 7 4 3.5 7.0 1587.2 133.2 furan 0 8 CF-8M A 10 4 6 6.94 1554.4 118.9 furan 0 5.5 CF-8M F 7 4 3.5 7.0 1587.2 133.2 furan 0 8 CF-8M A 11 4 6 7.85 1557.2 125.0 furan 0 5.5 CF-8M F 7 4 3.5 7.0 1587.2 133.2 furan 0 8 CF-8M A 11 4 6 7.85 1551.7 119.5 furan 0 5.5 CF-8M F 7 4 3.5 7.0 1587.2 133.2 furan 0 8 CF-8M A 11 4 6 7.85 1576.7 144.5 furan 0 5.5 CF-8M F 9.4 4 3.5 9.4 1587.2 133.2 furan 2 8 CF-8M A 11 4 6 7.85 1565.6 133.4 furan 0 5.5 CF-8M F 9.4 4 3.5 9.4 1587.2 133.2 furan 2 8 CF-8M A 11 4 6 7.85 1582.2 150.0 furan 0 5.5 CF-8M F 9.4 4 3.5 9.4 1587.2 133.2 furan 0 8 CF-8M A 15 4 6 11.6 1605.6 170.1 furan 0 5.5 CF-8M F 9.4 4 3.5 9.4 1587.2 133.2 furan 3 8 CF-8M A 15 4 6 11.6 1604.4 168.9 furan 0 5.5 CF-8M F 9.4 4 3.5 9.4 1587.2 133.2 furan 3 8 CF-8M A 15 4 6 11.6 1593.3 157.8 furan 0 5.5 CF-8M F 12.3 4 3.5 12.3 1582.8 128.8 furan 3 8 CF-8M A 15 4 6 11.6 1582.2 146.7 furan 0 5.5 CF-8M F 12.3 4 3.5 12.3 1582.8 128.8 furan 3 8 CF-8M A 15 4 6 11.6 1576.7 141.2 furan 0 5.5 CF-8M F 12.3 4 3.5 12.3 1582.8 128.8 furan 4 8 CF-8M S 13 4 5.7 9.70 1552.2 120.2 green 4 5.5 CF-8M F 12.3 4 3.5 12.3 1582.8 128.8 furan 2 8 CF-8M S 13 4 3.8 9.70 1543.3 111.3 green 5 5.5 CF-8M F 12.3 4 3.5 12.3 1582.8 128.8 furan 4 8 CF-8M S 13 4 5.56 9.70 1553.9 121.9 green 5 5.5 CF-8M F 15 4 3.5 15.0 1582.8 128.8 furan 5 8 CF-8M S 13 4 5.22 9.70 1553.9 121.9 green 5 5.5 CF-8M F 15 4 3.5 15.0 1582.8 128.8 furan 5 8 CF-8M S 15 4 4.6 11.6 1552.2 120.2 green 3 5.5 CF-8M F 15 4 3.5 15.0 1582.8 128.8 furan 5 8 CF-8M S 15 4 4.8 11.6 1541.7 109.7 green 5 5.5 CF-8M F 15 4 3.5 15.0 1582.8 128.8 furan 5 8 CF-8M S 17 4 4.4 13.5 1551.7 119.7 green 5 5.5 CF-8M F 15 4 3.5 15.0 1582.8 128.8 furan 5 8 CF-8M S 17 4 4.8 13.5 1543.3 111.3 green 5 5.5 CF-8M F 18 4 3.5 18.0 1582.2 128.2 furan 5 8 CF-8M S 20 4 4.8 16.4 1551.7 119.7 green 5 5.5 CF-8M F 18 4 3.5 18.0 1582.2 128.2 furan 5 8 CF-8M S 20 4 5.9 16.4 1543.3 111.3 green 5 5.5 CF-8M F 18 4 3.5 18.0 1582.2 128.2 furan 5 8 HH A 11 4 4.25 7.85 1590.6 196.6 furan 0 5.5 CF-8M F 18 4 3.5 18.0 1582.2 128.2 furan 5 8 HH A 11 4 4.25 7.85 1590.6 196.6 furan 0 5.5 CF-8M F 18 4 3.5 18.0 1582.2 128.2 furan 5 8 HH A 11 4 4.75 7.85 1579.4 185.4 furan 0 5.5 CF-8M K 11 4 4.5 7.41 1586.1 154.1 furan 0 8 HH A 11 4 4.75 7.85 1579.4 185.4 furan 0 5.5 CF-8M K 11 4 4.5 7.41 1579.4 147.4 furan 0 8 HH A 13 4 4.125 9.70 1567.2 173.2 furan 1 5.5 CF-8M K 11 4 4.5 7.41 1579.4 147.4 furan 0 8 HH A 13 4 4.125 9.70 1567.2 173.2 furan 0 5.5 CF-8M K 11 4 4.5 7.41 1580.6 148.6 furan 0 8 HH A 13 4 4.25 9.70 1575.6 181.6 furan 0 5.5 CF-8M K 11 4 4.5 7.41 1579.4 147.4 furan 0 8 HH A 13 4 4.25 9.70 1575.6 181.6 furan 1 5.5 CF-8M K 12.5 4 4.5 8.85 1587.8 155.8 furan 0 8 HH A 15 4 4.5 11.6 1570.6 176.6 furan 2 5.5 CF-8M K 12.5 4 4.5 8.85 1587.2 155.2 furan 0 8 HH A 15 4 4.5 11.6 1570.6 176.6 furan 1 5.5 CF-8M K 12.5 4 4.5 8.85 1585.0 153.0 furan 0 8 HH A 15 4 4.5 11.6 1556.1 162.1 furan 1 5.5 CF-8M K 12.5 4 4.5 8.85 1579.4 147.4 furan 0 8 HH A 15 4 4.5 11.6 1556.1 162.1 furan 2 5.5 CF-8M K 12.5 4 4.5 8.85 1579.4 147.4 furan 0 8 HH A 17 4 4 13.5 1552.8 158.8 furan 1 5.5 CF-8M K 14 4 4.5 10.3 1598.9 166.9 furan 2 8 HH A 17 4 4 13.5 1552.8 158.8 furan 1 5.5 CF-8M K 14 4 4.5 10.3 1587.8 155.8 furan 3 8 HH A 17 4 4 13.5 1534.4 140.4 furan 1 5.5 CF-8M K 14 4 4.5 10.3 1579.4 147.4 furan 0 8 HH A 17 4 4 13.5 1534.4 140.4 furan 1

58
Table 1 (continued) Experimental data from the high alloy plate casting trials.
W/T* Steel Alloy Foundry
L (in.)
DR (in.)
HR (in.)
FL (in.)
Pouring T (ºC)
Superheat (ºC)
Sand Mold
X-ray level
W/T*
Steel Alloy Foundry
L (in.)
DR (in.)
HR (in.)
FL (in.)
Pouring T (ºC)
Superheat (ºC)
Sand Mold
X-ray level
8 HH A 20 4 4.25 16.4 1583.9 189.9 furan 1 12 CF-8M A 4.4 2 6 3.53 1605.6 181.2 furan 0 8 HH A 20 4 4.25 16.4 1583.9 189.9 furan 2 12 CF-8M A 4.4 2 6 3.53 1582.8 158.4 furan 0 8 HH A 20 4 3.75 16.4 1614.4 220.4 furan 4 12 CF-8M A 4.4 2 6 3.53 1586.7 162.3 furan 0 8 HH A 20 4 3.75 16.4 1614.4 220.4 furan 2 12 CF-8M A 4.4 2 6 3.53 1587.8 163.4 furan 0 8 HP A 11 4 4 7.85 1576.7 231.7 furan 0 12 CF-8M A 4.4 2 6 3.53 1595.6 171.2 furan 0 8 HP A 11 4 4 7.85 1576.7 231.7 furan 0 12 CF-8M A 5 2 6 4.00 1588.3 163.9 furan 0 8 HP A 11 4 4.5 7.85 1586.1 241.1 furan 0 12 CF-8M A 5 2 6 4.00 1610.6 186.2 furan 0 8 HP A 11 4 4.5 7.85 1586.1 241.1 furan 0 12 CF-8M A 5 2 6 4.00 1604.4 180.0 furan 0 8 HP A 13 4 4 9.70 1565.6 220.6 furan 2 12 CF-8M A 5 2 6 4.00 1598.9 174.5 furan 0 8 HP A 13 4 4 9.70 1565.6 220.6 furan 3 12 CF-8M A 5 2 6 4.00 1593.3 168.9 furan 0 8 HP A 13 4 4.125 9.70 1565.6 220.6 furan 1 12 CF-8M A 5.7 2 6 4.58 1585.0 150.3 furan 0 8 HP A 13 4 4.125 9.70 1565.6 220.6 furan 1 12 CF-8M A 5.7 2 6 4.58 1582.2 147.5 furan 0 8 HP A 15 4 5 11.6 1597.2 252.2 furan 1 12 CF-8M A 5.7 2 6 4.58 1578.9 144.2 furan 0 8 HP A 15 4 5 11.6 1597.2 252.2 furan 2 12 CF-8M A 5.7 2 6 4.58 1585.0 150.3 furan 0 8 HP A 15 4 4.5 11.6 1602.8 257.8 furan 2 12 CF-8M A 5.7 2 6 4.58 1587.8 153.1 furan 0 8 HP A 15 4 4.5 11.6 1602.8 257.8 furan 2 12 CF-8M A 7.2 2 6 5.89 1593.3 168.9 furan 1 8 HP A 17 4 4 13.5 1536.7 191.7 furan 4 12 CF-8M A 7.2 2 6 5.89 1598.9 174.5 furan 1 8 HP A 17 4 4 13.5 1536.7 191.7 furan 5 12 CF-8M A 7.2 2 6 5.89 1587.8 163.4 furan 1 8 HP A 17 4 4.25 13.5 1585.6 240.6 furan 5 12 CF-8M A 7.2 2 6 5.89 1582.8 158.4 furan 1 8 HP A 17 4 4.25 13.5 1585.6 240.6 furan 5 12 CF-8M A 7.2 2 6 5.89 1600.0 175.6 furan 1 8 HP A 20 4 4.25 16.4 1598.9 253.9 furan 5 12 CF-8M A 9.2 2 6 7.73 1567.8 99.8 furan 1 8 HP A 20 4 4.25 16.4 1598.9 253.9 furan 5 12 CF-8M A 9.2 2 6 7.73 1571.1 103.1 furan 0 8 HP A 20 4 4.25 16.4 1607.8 262.8 furan 5 12 CF-8M A 9.2 2 6 7.73 1565.6 97.6 furan 1 8 HP A 20 4 4.25 16.4 1607.8 262.8 furan 5 12 CF-8M A 9.2 2 6 7.73 1577.8 109.8 furan 0 12 CF-8M A 9.2 2 6 7.73 1568.3 100.3 furan 0
* The W/T = 2 and 12 plates are 1.27 cm (0.5 in.) thick, and the W/T = 5.5 and 8 plates are 2.54 cm (1 in.) thick.

59
Table 2 Multipliers used to apply base case feeding rules to other conditions. Base case conditions are listed with the multiplier C = 1.
Casting Parameter Condition
Description Multiplication Factor,
C furan 1
green sand 1.09 zircon 0.96
Sand Mold
Material (Csand mold) chromite 0.88
end effect 1 end chill 1.19
Cooling Conditions
(Ccooling conditions) drag chill 0.95 AISI 1025 1 AISI 4125 0.98 AISI 1522 0.97 AISI 4135 0.97 AISI 4330 0.97 AISI 8620 0.96 AISI 8630 0.95
Carbon & Low Alloy
AISI 4340 0.86 CF8M – C 0.08 1.036
HH30 0.985 CF8M – C 0.06 0.978
HK44 0.965 CA15 – C 0.13 0.943
HP37 0.904
Steel Alloy Composition
(Ccast alloy)
High Alloy
CF8M – C 0.03 0.900 30°C (54°F) 0.94 60°C (108°F) 1 90°C (162°F) 1.06 120°C (216°F) 1.12 150°C (270°F) 1.18
Superheat (Csuperheat)
250°C (450°F) 1.38

60
Figure 1 Alternate definitions of feeding distance for previous C&LA (FDC&LA) and high
alloy (FDHA) rules, as well as the feeding distance in the current work (FD), which extends from the edge of the riser to the furthest point in the casting.
DR
FDriser
FDC&LA
FDHA

61
riser zone
DR
riser zone length, RZL
end zone length, EZL
mold casting
end zone
Figure 2 Illustration of the riser zone length RZL of a casting section without end effects; note
that RZL is independent of the riser diameter DR. Figure 3 Illustration of the end zone length EZL of a casting section.

62
riser
casting
gating drag
T
copeHR
W
mold
FL DR
L
(a)
T DR
mold
cope
W
L FL
drag
riser
casting
(b)
EZL = end zone length RZL = riser zone length FD = feeding distance FL = feeding length
(a) (b)
EZL1
top view
shrinkage porosity
DR
RZL
EZL2
W
EZL2FL > FD
EZL1
top view EZL2
W
EZL2
DR
RZL FL = FD
Figure 4 Relationships among EZL, RZL, FD and FL: (a) when FL = FD, casting section is
just covered by riser zones and end zones; (b) when FL > FD, shrinkage porosity forms in the shaded sections of casting not covered by riser zones or end zones.
Figure 5 General configuration and nomenclature for (a) horizontal; and (b) vertical plate
casting trials.

63
-1
0
1
2
3
4
5
6
0.0 0.5 1.0 1.5 2.0 2.5 3.0 3.5 4.0 4.5 5.0 5.5 6.0
CF-8M, Foundry A (20 Plates) Mean X-ray Levels +/-1 Standard Deviation
5 55
4AST
M S
hrin
kage
X-r
ay L
evel
Feeding Length, FL (in.)
DR
L
W
T = 0.5 in., W/T = 2
FL
Figure 6 Casting trial results for the W/T = 2 [1.27 cm by 2.54 cm (0.5 in. T by 1 in. W)] plates: soundness versus feeding length.

64
-1
0
1
2
3
4
5
6
3.0 3.5 4.0 4.5 5.0 5.5 6.0 6.5 7.0 7.5 8.0
CF-8M, Foundry A (25 Plates) Mean X-ray Levels +/-1 Standard Deviation
5 55
3
5 2AST
M S
hrin
kage
X-r
ay L
evel
Feeding Length, FL (in.)
T = 0.5 in., W/T = 12
DR
L
W FL
Figure 7 Casting trial results for the W/T = 12 [1.27 cm by 15.2 cm (0.5 in. T by 6 in. W)] plates: soundness versus feeding length.

65
Figure 8 Casting trial results for the W/T = 5.5 [2.54 cm by 14.0 cm (1 in. T by 5.5 in. W)] plates: soundness versus feeding length.
-1
0
1
2
3
4
5
6
6 7 8 9 10 11 12 13 14 15 16 17 18 19
CF-8M, Foundry F (25 Vertical Plates) CF-8M, Foundry K (25 Plates) Mean X-ray Levels +/-1 Standard Deviation
5
3
55
5 5
2
2
3
3
3
4
AST
M S
hrin
kage
X-r
ay L
evel
Feeding Length, FL (in.)
T = 1 in., W/T = 5.5
DR
L
W horizontal plate
FL
L
W
DR
FL
vertical plate

66
-1
0
1
2
3
4
5
6
6 7 8 9 10 11 12 13 14 15 16 17
CF-8M, Foundry S (10 Plates) CF-8M, Foundry A (20 Plates) HH, Foundry A (20 Plates) HP, Foundry A (20 Plates) Mean X-ray Levels +/-1 Standard Deviation
5 5135
5 63
4
2
5
3
4
AST
M S
hrin
kage
X-r
ay L
evel
Feeding Length, FL (in.)
T = 1 in., W/T = 8
DR
L
W FL
Figure 9 Casting trial results for the W/T = 8 [2.54 cm by 20.3 cm (1 in. T by 8 in. W)] plates: soundness versus feeding length.

67
6940
6990
7040
7090
7140
7190
7240
7290
1235 1260 1285 1310 1335 1360 1385 1410 1435 1460 1485
Den
sity
(kg/
m3 )
Temperature (°C)
AISI 1025
HP37
CF8M-0.03C
HH30
HK44
CA15
CF8M-0.08C
CF8M-0.06C (b)
0
0.1
0.2
0.3
0.4
0.5
0.6
0.7
0.8
0.9
1
1235 1260 1285 1310 1335 1360 1385 1410 1435 1460 1485
(a) So
lid F
ract
ion
Temperature (°C)
AISI 1025
HP37
CF8M-0.03C
HH30
HK44
CA15
CF8M-0.08C
CF8M-0.06C
Figure 10 Computed values for alloys of interest: (a) solid fraction and (b) density during
solidification.

68
Figure 11 Niyama value distribution in a 2.54 cm by 20.3 cm by 43.2 cm (1 in. by 8 in. by 17
in.) HH plate: (a) top view of central-thickness cross-section; and (b) side view of central-width cross-section.
(b)
(a)

69
-0.1
0
0.1
0.2
0.3
0.4
0.5
0.6
0.7
0.8
0.9
1
1.1
1.2
1.3
1.4
1.5
1.6
5 6 7 8 9 10 11 12 13 14 15 16 17 18
Min
imum
Niy
ama
Cri
teri
on V
alue
, Ny m
in (K
1/2 s1/
2 mm
-1)
Feeding Length, FL (in.)
CF-8M, Foundry S (10 Plates) CF-8M, Foundry A (20 Plates) HH, Foundry A (20 Plates) HP, Foundry A (20 Plates)
T = 1 in., W/T = 8
DR
L
W FL
10 10 15
3
4 4
5
2
2
2
Figure 12 Simulation results for the W/T = 8 plates: minimum Niyama value vs. feeding length.

70
-1
0
1
2
3
4
5
6
-0.1 0.1 0.3 0.5 0.7 0.9 1.1 1.3 1.5 1.7 1.9 2.1
AST
M S
hrin
kage
X-r
ay L
evel
Minimum Niyama Criterion Value, Nymin (K1/2s1/2mm-1)
W/T = 2, CF-8M (20 Plates) W/T = 5.5, CF-8M (50 Plates) W/T = 8, CF-8M (30 Plates) W/T = 8, HH (20 Plates) W/T = 8, HP (20 Plates) W/T = 12, CF-8M (25 Plates)
Level 5: 25 Plates Level 4: 6 Plates Level 3: 12 Plates Level 2: 15 Plates Level 1: 24 Plates Level 0: 83 Plates
TOTAL: 165 Plates
25
6
70
9
11
14
15
13
0
-1
0
1
2
3
4
5
6
0 0.1 0.2
X-r
ay L
evel
Minimum Niyama Value, Nymin (K1/2s1/2mm-1)
0.074
0.005
0.022
0.024
Mean Minimum Niyama Values +/- One Standard Deviation
Figure 13 ASTM shrinkage x-ray level vs. minimum Niyama criterion value for the W/T = 2, 5.5, 8 and 12 plates.

71
-1
0
1
2
3
4
5
6
-1 0 1 2 3 4 5 6 7 8 9 10 11 12 13 14 15 16 17 18 19 20 21 22
AST
M S
hrin
kage
X-r
ay L
evel
Area of Niyama Criterion Below 0.1 Threshold Value (cm2)
CF-8M, Foundry A (25 Plates) CF-8M, Foundry F (25 Vertical Plates) Mean Area +/- One Standard Deviation
Level 5: 10 Plates Level 4: 3 Plates Level 3: 10 Plates Level 2: 7 Plates Level 1: 1 Plate Level 0: 19 Plates
TOTAL: 50 Plates
15
T = 1 in., W/T = 5.5
5
2
2
2 3
Figure 14 Casting soundness vs. area of cells below Niyama criterion threshold value of 0.1 (K s)1/2/mm, for the W/T = 5.5 plates.

72
Figure 15 Cross-section side view (a) and top view (b) Niyama plots from a simulation of a 7.62 cm by 15.2 cm by 52.6 cm (3 in. T by 6 in. W by 20.7 in. L) top-risered AISI 1025 steel plate.
(a)
(b)
EZL RZL
FD
Nymin = 0.104

73
3
4
5
6
7
8
9
10
1 2 3 4 5 6 7 8 9 10 11 12 13 14 15 16 17
Top
Ris
er F
eedi
ng D
ista
nce
to T
hick
ness
Rat
io, F
D/T
Width to Thickness Ratio, W/T
• AISI 1025 steel • furan sand mold • 108°F (60°C) superheat• 1” ≤ T ≤ 12”
(2.54 cm – 30.5 cm) • no visible shrinkage
porosity on x-ray
DR
FDW
Figure 16 Feeding distance (FD) as a function of width and thickness for top-risered sections
cast with plain carbon steel.

74
Figure 17 Riser zone length, end zone length and feeding distance curves for CF-8M (0.06 pct
carbon), all normalized by the thickness T, shown with simulation results for various thicknesses.
1
2
3
4
5
6
7
8
9
10
11
1 2 3 4 5 6 7 8 9 10 11 12 13 14 15
T = 2 in. T = 1 in.
T = 3 in.
T = 8 in. T = 6 in.
T = 12 in.
Simulation ResultsR
ZL/T
, EZL
/T a
nd F
D/T
Width to Thickness Ratio, W/T
all simulations shown used furan sand mold, 180°F (100°C) superheat
CF8M-0.06C riser zone length
(RZL/T) DR
RZL
W
EZLW
CF8M-0.06C end zone length
(EZL/T)
DRFD
W
CF8M-0.06C feeding distance (FD/T)
AISI 1025 feeding distance (FD/T)

75
3
4
5
6
7
8
9
10
1 2 3 4 5 6 7 8 9 10 11 12 13 14 15
Feed
ing
Dis
tanc
e to
Thi
ckne
ss R
atio
, FD
/T
Width to Thickness Ratio, W/T
all simulations shown used furan sand mold, 180°F (100°C) superheat
DRFD
W
CA-15 feeding distances from simulation
AISI 1025 feeding distance, (FD/T)AISI 1025, 100°C superheat
0.943*(FD/T) AISI 1025, 100°C superheat
Figure 18 Feeding distance results for CA-15 (open circles), compared with AISI 1025 feeding
distance curve, scaled by 0.943.

76
3
4
5
6
7
8
9
10
1 2 3 4 5 6 7 8 9 10 11 12 13 14 15
Feed
ing
Dis
tanc
e to
Thi
ckne
ss R
atio
, FD
/T
Width to Thickness Ratio, W/T
all simulation results shown are for 2 in. thick CF-8M (0.06 pct carbon) plates in furan sand molds
DR FD
W
simulation results with 60°C superheat
AISI 1025 feeding distance for base casting conditions, (FD/T)AISI 1025
simulation results with 100°C superheat
feeding distance rule for CF-8M (0.06 pct carbon) with 60°C superheat ( = (FD/T)AISI 1025*CCF8M-0.06C)
feeding distance rule for CF-8M (0.06 pct carbon) with 100°C superheat ( = (FD/T)AISI 1025*CCF8M-0.06C*C100°C superheat)
Figure 19 Comparison between CF-8M (0.06 pct carbon) simulation results and values
calculated using feeding distance rule. (FD/T)AISI 1025 is calculated using Eq. (1); multipliers CCF8M-0.06C and C100°C superheat are from Table 1.

77
3
4
5
6
7
8
9
10
11
12
1 2 3 4 5 6 7 8 9 10 11 12 13 14 15
Feed
ing
Dis
tanc
e to
Thi
ckne
ss R
atio
, FD
/T
Width to Thickness Ratio, W/T
SFSA rules shown are for 1 in. section thickness
DR FD
W
SFSA rules for HT-0.60C
SFSA rules for low carbon HF, HH, CA-15 and CF-8
new feeding distance rule for CF-8M (0.06 pct carbon) in furan sand, with 160°C superheat → valid for T = 1 – 12 in.
SFSA rules for HT-0.35C and high carbon HF, HH, CA-15 and CF-8
Figure 20 Comparison between existing rules[29] and the new feeding distance rule for CF-8M
(0.06 pct carbon) in furan sand with a 160ºC superheat.

78
0
0.5
1
1.5
2
2.5
3
2 6 10 14 18 22 26 30 34
Ris
er V
olum
e to
Cas
ting
Vol
ume
Rat
io, V
R/V
C
Shape Factor, SF = (L + W)/T
carbon & low alloy rule for open top risers
low carbon HF, HH, CA-15 and CF-8
HT-0.35C and high carbon HF, HH, CA-15 and CF-8
HT-0.60C
high alloy riser sizes are for blind top risers
simulation results with SM = 0, DR = HR, AISI 1025 steel, green sand, 120ºC superheat
Figure 21 Direct comparison between the C&LA riser sizing rules of Bishop et al.[26] and the
high alloy riser sizing rules of Varga et al.[17]

79
SM < 0
DR = HR
Figure 22 Sketch illustrating the definition of safety margin (SM). Figure 23 Illustration of negative safety margin (SM) due to insufficient riser size. Reproduced
from Varga et al.[17]
SM
riser
casting

80
Figure 24 Comparison of safety margins (SM) for a CA-15 plate casting with different types of
risers.
(a) open top riser SM = 0.41 in.
SM
(b) vented blind
top riser, SM = 0.07 in.
SM
(c) blind top riser,
with cracker core SM = -0.08 in.
SM < 0

81
Figure 25 Comparison between simulated safety margins (SM) and measured values from
Bishop et al.[26] for 1025 steel.
Casting: 4 x 4 x 12 in. Riser: DR = 6 in., HR = 6 in. Measured SM = 1.0 in. Simulated SM = 1.1 in.
SM
Casting: 2 x 36 x 36 in. Riser: DR = 12 in., HR = 6.5 in. Measured SM = 2.0 in. Simulated SM = 1.97 in.
SM

82
0
0.5
1
1.5
2
2 6 10 14 18 22 26 30 34
Ris
er V
olum
e to
Cas
ting
Vol
ume
Rat
io, V
R/V
C
Shape Factor, SF = (L + W)/T
low carbon HF, HH, CA-15 and CF-8
HT-0.35C and high carbon HF, HH, CA-15 and CF-8
HT-0.60C
high alloy riser sizes are for blind top risers
carbon & low alloy rule for open top risers
Figure 26 Comparison between the C&LA riser sizing rules of Bishop et al.[26] and the high
alloy riser sizing rules of Varga et al.,[17] if the high alloy rules are sized according to the methodology of Bishop et al.

83
Figure 27 Minimum riser sizes (based on a safety margin of zero) for various alloys.
0
0.1
0.2
0.3
0.4
0.5
0.6
0.7
0.8
0.9
1
2 2.5 3 3.5 4 4.5 5
SIMULATIONS RESULTING IN RISERS WITH SM = 0
All simulations used 60ºC superheat, furan sand mold
1 x 2 x 2 in. plates
1 x 5 x 5 in. plates
1 x 10 x 10 in. plates
1 x 15 x 15 in. plates
CF-8M CA-15 AISI 1025
CF-20
Ris
er V
olum
e to
Cas
ting
Vol
ume
Rat
io, V
R/V
C
Solidification Shrinkage, pct
CF-3

84
Figure 28 Comparison between riser pipes of different steel alloys. All risers shown are vented
top blind risers.
AISI 1025, SM = -0.1 in.
CA-15, SM = -0.1 in.
CF-3, SM = 0.0 in.
CF-8M 0.06C,SM = -0.11 in.
HH-35, SM = -0.12 in.
CF-20, SM = 0.0 in.

85
Appendix B: Feeding of Nickel-Based Alloys
Kent D. Carlson, Shouzhu Ou and Christoph Beckermann
Department of Mechanical and Industrial Engineering
The University of Iowa, Iowa City, IA 52242
Abstract
Building on the successful creation of more accurate, less conservative feeding distance rules for carbon and low alloy (C&LA) and high alloy steel castings, a similar project is underway to develop feeding distance rules for the nickel-based alloys CZ-100, M-35-1 and CW-12MW, as well as for the austenitic stainless steel CN-7M. Casting trials were performed at five foundries to produce experimental feeding distance results for a total of 55 plates of varying lengths. In order to develop the property databases necessary to simulate these alloys, temperature data was recorded for each alloy during the casting trials. This measured data was then used in conjunction with material property simulation to develop the necessary property data for each alloy, including the solidification path. This property data was used to simulate the casting trials. Good agreement between the simulation results and the radiographic testing results for the castings has been obtained. Future work will include the development of general feeding and risering rules for these high-nickel alloys.

86
1. Introduction Feeding distance in a steel casting is defined as the distance over which a riser can provide feed metal resulting in a sound casting. This is an important concept for steel foundries, because knowledge of feeding distances allows foundries to produce sound castings with a reasonable number of risers, which helps to maximize casting yield. Due to the importance of feeding distances, a great deal of effort has been expended to develop rules to determine riser feeding distances in steel castings. In 1973, the Steel Founders’ Society of America (SFSA) published a foundry handbook entitled Risering Steel Castings[1]; this handbook provided charts, nomographs and equations for calculating feeding distances for carbon and low alloy (C&LA) and several high alloy steels. While the feeding guidelines in this handbook have been widely used in industry for the past thirty years, it is generally accepted that these rules can be overly conservative in many situations. To address the need for more accurate, less conservative feeding rules, the present authors developed a new set of C&LA feeding distance rules[2-4], followed by an analogous set of rules for high alloy steel grades CF-8M, CA-15, HH, HK and HP[5]. Both sets of rules were developed by performing plate casting trials and performing corresponding casting simulations of these trials. Through this work, a correlation was developed between the Niyama criterion (a local thermal parameter) and radiographic soundness. It was found that the same correlation was valid for both C&LA and high alloy steels. Once this correlation was established, a large number of simulations were performed in order to determine feeding distances for a wide variety of casting conditions. Based on the resulting information, a new set of feeding distance rules was designed to produce radiographically sound castings at 2 pct sensitivity. The new feeding distance rules are valid for both C&LA and high alloy steels. Rules are provided for end-effect feeding distance and lateral feeding distance for top risers, as well as feeding distance for side risers. In addition, multipliers are provided to apply these rules with end chills and drag chills, as well as to tailor these rules to different steel alloy compositions, sand mold materials and pouring superheats. These new rules are shown to provide longer feeding distances in most casting situations than previously published rules. Based on the success of these new feeding distance rules, the steel foundry industry (through the SFSA) expressed interest in the development of similar feeding distance rules for four additional alloys: three nickel-based alloys (CW-12MW, CZ-100 and Monel-35-1) and an austenitic stainless steel (CN-7M) with a large nickel component. The nominal compositions for each of these alloys are provided in Table 1. The research plan is to develop these rules in a manner similar to the C&LA and high alloy rules discussed in the previous paragraph: plate casting trials performed in conjunction with corresponding casting simulations will provide correlations between simulation variables and experimental results. Once correlations are developed, extensive simulation will be used to develop feeding distance rules for a wide range of casting conditions. One substantial difference between the current feeding distance development and the previous work by the present authors is the need in the present study to determine thermophysical properties (solidification path, thermal conductivity,

87
density, etc.) for these nickel alloys. For the C&LA and high alloy steels, a significant amount of property data was already available. This is not true for the present alloys. Property data was determined in the present work by coupling solidification temperature measurements of these alloys, taken during the casting trials, with property data computed from the software package JMatPro[6]. This package determines the solidification path and all casting-relevant material properties for a given alloy composition through thermodynamic calculations. The feeding distance development for these high-nickel alloys is currently well underway; this paper is intended to provide a progress report on the development. Section 2 describes the casting trials and provides the results of these trials. Section 3 describes the collection of thermocouple data during these casting trials that was necessary to develop property databases for the current alloys, and then Section 4 details the property database development for these alloys. Section 5 describes the casting simulations and presents the simulation results to date, and Section 6 discusses the current status and ongoing work in the project. 2. Casting Trials Five foundries participated in the nickel-alloy feeding distance trials. All foundries cast multiple lengths of 1 in. thick by 8 in. wide plates, using lengths chosen to produce plates ranging from completely sound to very unsound. A schematic of the general casting configuration is given in Figure 1. In terms of gating, this schematic is approximate; each foundry used a typical gating system for this type of casting. Trial data such as alloy composition, sand mold composition, pouring temperature and pouring time were collected during the trials, for later use in simulations. The alloy compositions measured during the casting trials are listed below each alloy’s nominal composition in Table 1. Note that the alloy M-30C appears in this table. This is because Foundry G cast M-30C rather than M-35-1; while these alloys are similar (compare the nominal compositions in Table 1), their resulting properties are different enough to warrant distinguishing between the alloys. Another important note regarding Table 1 is that the CW-12MW compositions cast by both Foundries N and G are out of specification. Foundry N has a molybdenum content that is slightly below specification, and Foundry G has both molybdenum and iron contents that are out of specification. In the latter case, the foundry ran out of pure molybdenum, and was forced to use charge metal containing both iron and molybdenum to raise the molybdenum content. After the plates were cast, the foundries had each plate examined using radiographic testing (RT) according to ASTM E94[7] procedures, using E446[8] reference radiographs (for casting sections up to 2 in. thick). Based on this examination, an ASTM shrinkage RT level was assigned to each plate. Table 2 lists the details for each plate cast by each foundry, including alloy, plate length, riser size, sand mold type, and resulting shrinkage x-ray level for the plate. Note that some plates have two shrinkage levels listed, with one in parentheses. In these cases, the first value is the shrinkage rating for the plate away from the riser, and the value in parentheses is a rating for the under-riser shrinkage. Because under-riser shrinkage is related to riser size and not feeding

88
distance, the under-riser ratings will not be used to develop feeding distance correlations. The experimental shrinkage RT results from the casting trials are presented in Figures 2 – 5. In each of these figures, the feeding length for each plate cast is plotted against its resulting ASTM shrinkage x-ray level. The feeding length (FL), shown schematically in Figures 2 – 5, is defined as the distance from the riser to the furthest point in the casting section being fed by that riser. The feeding length is purely geometrical; it should not be confused with the feeding distance (FD) defined in the introduction, which is the longest distance over which a riser can provide feed metal to produce a sound casting. In Figures 2 – 5, the hollow symbols represent the individual plates, with different symbols representing the different casting foundries. The numbers to the left of the hollow symbols indicate how many plates that symbol represents. The solid squares represent the average x-ray level for all plates with a given feeding length. The bold numbers to the right of these solid squares indicate their numerical value. The error bars associated with these squares indicate one standard deviation around the mean. Note that the mean and standard deviation values shown on these figures are not intended to provide valid statistical information; the number of plates at each feeding length is too small to provide any meaningful data. These are merely included to provide some indication about how the average x-ray levels change with feeding length, and to show the amount of scatter at a given feeding length. In these figures, notice that for a given foundry, the x-ray level tends to increase with feeding length. However, the x-ray levels for a given alloy seem to vary from foundry to foundry. This is currently being investigated. 3. Temperature Measurement As mentioned in the introduction, it was necessary to collect temperature data during the solidification of the alloys investigated in this work, in order to develop the property databases that would be used to simulate the casting trials. All temperature measurements were performed at A.G. Anderson, during their casting trials of the alloys CN-7M, CZ-100, CW-12MW and M-30C. Due to the high temperatures to which the thermocouples would be subjected during these trials (see Table 2), B-type thermocouples (Pt-6%Rh – Pt-30%Rh) were used. B-type thermocouples have a maximum operating temperature of about 3100°F (1700°C)[9]. The two types of thermocouple assemblies that were used are shown in Figure 6. In both arrangements, the thermocouple wire was encased in a two-hole high purity alumina ceramic insulating tube. In one arrangement, Figure 6a, the insulating tube was inserted into a closed-end fused quartz tube. In the other, Figure 6b, the insulating tube was inserted into a closed-end alumina ceramic protection tube, which was then inserted into an open-end fused quartz tube. In all thermocouple assemblies, the base end of the thermocouple (i.e., the end opposite the thermocouple bead) was sealed with a high-temperature alumina cement, to minimize convective and conductive heat losses. It should be noted that the original design of the thermocouple assemblies was the same as shown in Figure 6, but without the fused quartz tubes. A test of the original assemblies was performed at Keokuk Steel Castings, and all four of the thermocouples tested (two of each type shown in Figure 6) failed within one minute of pouring. Although there were

89
several possible reasons for failure, the most likely candidate was that thermal shock had cracked the alumina tubing and broken the thermocouple wires. To remedy this, fused quartz tubes were added to the remaining thermocouples that were to be taken to A.G. Anderson for the temperature measurements. Fused quartz is essentially immune to thermal shock (due to an extremely small thermal expansion coefficient), and it was thought that adding quartz tubes could prevent the thermocouple assemblies from being destroyed during the temperature measurement process. Schematics of the rigging used for the thermocouple plate trials are shown in Figure 7. Two plates, one 8 in. and one 12 in. long, were cast in each mold. For each alloy, one 12 in. plate was rigged with two thermocouples. Three thermocouples are shown in Figure 7a to indicate the three different possible thermocouple locations. This was necessary because there were three different sizes of thermocouples (see Figure 8):
• mid-plate thermocouple: the middle thermocouple in Figure 7a, that extends 5 in. into the plate, was 12 in. long and had an outer diameter (OD) of 0.394 in. (10 mm). This thermocouple had both an alumina protection tube and a fused quartz tube, as shown in Figure 6b.
• end-plate thermocouple (8 mm OD): the top thermocouple in Figure 7a, extending 0.5 in. into the plate, was 7.5 in. long and had an OD of 0.315 in. (8 mm). This thermocouple also had both an alumina protection tube and a fused quartz tube, as shown in Figure 6b. It was essentially a smaller version of the mid-plate thermocouple.
• end-plate thermocouple (6 mm OD): the bottom thermocouple in Figure 7a, extending 0.5 in. into the plate, was 7.5 in. long and had an OD of 0.236 in. (6 mm). This thermocouple had a fused quartz tube but no alumina protection tube, as shown in Figure 6a.
Each thermocoupled plate was cast with one mid-plate thermocouple, and one of the two end-plate thermocouples. The 6 mm OD end-plate thermocouples were used for CN-7M and CW-12MW, and the 8 mm OD end-plate thermocouples were used for CZ-100 and M-30C. To create holes in the mold into which the thermocouples could be inserted, holes of the appropriate size (6 mm, 8 mm or 10 mm) were drilled in both the side of the flask and the 12 in. plate pattern. Steel tubes of the same diameter as the corresponding thermocouples were inserted through the holes in the flask and into the holes in the plate pattern, and then the sand was poured into the flask and packed around these tubes. The tubes were then taken out so the mold could be removed from the flask, and then the thermocouples were inserted, as shown in Figure 9. The points where each thermocouple exited the mold were then covered in high temperature glue, to hold the thermocouples in place, prevent metal from exiting the mold, and to further limit convection and conduction heat losses. Before each alloy was poured, the two thermocouples were connected to a Personal Daq[10] portable data acquisition system. A measurement duration of 610 ms was used,

90
with an acquisition rate of 0.667 Hz. This provided the most accurate reading possible, and produced an output from each thermocouple every 1.5 seconds. The error inherent in a B-type thermocouple is about +/- 2 or 3°C[9]. The data acquisition was largely successful. Six of the eight thermocouples were completely successful in recording temperature data, while two thermocouples failed during solidification. The two that failed were in two different alloys, so at least one complete cooling curve was obtained for each alloy. Substantial data was obtained even for the two thermocouples that failed: in the CZ-100 trial, the 8 mm OD end-plate thermocouple failed after five minutes, and in the CW-12MW trial, the 10 mm mid-plate thermocouple failed after ten minutes. In both cases, the metal was mostly solidified when the thermocouples failed. The temperature data collected during these trials will be presented in the next section. 4. Property Database Development The temperature data recorded for each alloy was then used in conjunction with simulation to determine the material properties of each alloy before, during and after solidification. For each alloy, the measured composition was input into the software package JMatPro[6], which determines the solidification path and all casting-relevant material properties through thermodynamic calculations. Once these properties were calculated, they were input into the casting simulation software MAGMASOFT[11], and the thermocouple casting trials were simulated using the casting data collected during the trials. The thermocouples were included as a user-defined material in the MAGMASOFT simulations, and temperature and cooling rate versus time curves were output for various locations in the vicinity of the thermocouple beads. These predicted temperature and cooling rate curves were then compared with the measured curves, and adjustments to several aspects of the simulations were made to bring these curves into agreement, as described below. Plots showing the measured temperature and cooling rate curves together with the final simulated curves for each alloy are shown in Figures 10 – 13; these figures will be used to explain the adjustments that were made. The scale on the left of Figures 10 – 13 is for the temperature curves, while the scale on the right is for the cooling rate curves. Before comparing the measured and predicted temperatures, it is necessary to establish the liquidus (TL) and solidus (TS) temperatures, which denote the beginning and end of solidification, respectively, from the measured data. Both of these temperatures are obtained from the mid-plate thermocouple data (Figures 10a – 13a), because the end-plate thermocouples are subject to a significant conduction error, as explained in more detail below. The liquidus temperature is determined from a local peak in the cooling rate curve (see, for example, the left side of Figure 10a). Note that the cooling rate scale (right side of the plot in Figure 10a) increases from top to bottom, so this peak in the cooling rate curve is actually a local minimum in the cooling rate, caused by the onset of latent heat release as solidification begins. The liquidus temperature can also be seen as a kink in the temperature curve, from a very steeply descending slope to a much shallower slope (see the upper left of Figure 10a). For each of the four alloys, the minimum cooling rate corresponding to the liquidus

91
temperature is indicated by a vertical dashed line with arrows on each end in Figures 10a – 13a. The liquidus temperature is then given by the intersection of the vertical dashed line with the measured temperature curve, as indicated by a thick horizontal dashed line in the figures. The solidus temperature is determined from the measured cooling rate and temperature curves in a similar manner. At the location of the solidus, the cooling rate curve shows a local trough. Again, because the cooling rate scale on the right of these figures increases from top to bottom, a local trough is actually a local maximum in the cooling rate, brought about by the end of latent heat release at the end of solidification. For each of the four alloys, the maximum cooling rate corresponding to the solidus temperature is indicated by another vertical dashed line with arrows on each end in Figures 10a – 13a. The location of the maximum cooling rate is obvious for all alloys, except for CW-12MW (Figure 12a). This can be attributed to the mid-plate thermocouple in this casting failing prematurely. Nonetheless, it was possible to make a reasonable estimate of the location of the maximum cooling rate by checking the measured cooling rates for the end-plate thermocouple. The solidus temperature is now given by the intersection of the vertical dashed line with the measured temperature curve, as indicated by a thick horizontal dashed line in Figures 10 – 13. The measured liquidus and solidus temperatures are also summarized in Table 3. The estimated uncertainties in the measured liquidus and solidus temperatures are 3 oC and 10 oC, respectively. The first step in bringing the measured and simulated temperatures into agreement was to perform a time shift on the experimental data. The experimental time was shifted until the simulated and measured temperatures matched where the thermocouple reading first begins to decrease after its initial rise (see, for example, the upper left corner of Figure 10a). This time shift was necessary for two reasons. First, when the temperature measurements were taken, the data recorder was turned on a few minutes before pouring occurred, so the beginning of filling cannot be readily determined from the data. Second, there is a delay in thermocouple response time created by the insulating effect of the alumina and quartz tubes that protected the thermocouple beads. This explains why the mid-plate thermocouples, which were the largest thermocouples with the thickest insulating layers (10 mm OD quartz tubing), have longer time shifts than the end-plate thermocouples. The next step was to modify the thermal conductivity of the liquid metal in the simulation. This was done because the simulation neglects convection in the liquid. Convection enhances cooling of the liquid metal early in the casting process, before solidification begins. After some trial-and-error, the liquid metal thermal conductivity was multiplied by 2.5. This value was chosen because it brought the simulation cooling rate before solidification into agreement with the experimental data. This can be clearly seen on the far left sides of Figures 10 – 13 from the excellent agreement in the steeply decreasing temperatures before the liquidus is reached. Next, it was necessary to determine the effective thermal conductivity and other properties of the thermocouples themselves. The thermocouples were included in the casting simulations in order to model the effect of conduction losses on the

92
thermocouple readings. As shown in Figures 7 and 9, the thermocouples extended through the mold into the atmosphere, and it was noticed during the casting trials that the ends of the thermocouple tubes were glowing red hot. The heat conduction away from the thermocouple bead, along the tubes to the atmosphere, will generally result in readings that are lower than the metal temperature would be at the location of the bead. One indication of this effect can be seen for the end-plate thermocouple in Figures 10b and 12b: the measured end-plate temperatures never reach the liquidus temperature. There are many uncertainties involved in the thermal modeling of each thermocouple. The exact location of the thermocouple bead is not known, since the bead is inside a closed-end ceramic or quartz tube. Also, the thermal conductivity must account for many materials, including the ceramic insulators and tubes and the quartz tubes, as well as the air gaps present (see Figure 6). Finally, due to discretization limits in the simulation, the entire cross-section of the thermocouple must be represented by only a few control volumes, so it would be impossible to accurately represent the many materials that are in the thermocouple. Due to all of these complexities, it was decided that the best course of action would be to choose a single, effective thermal conductivity for the entire thermocouple arrangement. In addition, it was necessary to determine the location within the simulated thermocouple to assign to the thermocouple bead. This can be understood from the simulation grid arrangement inset into Figure 10a, for example. This picture shows part of the top-view cross-section that cuts through the middle of the plate and thermocouples. The top edge of this grid picture is the end of the plate, where the thermocouples are inserted. The long thermocouple that extends to the middle of the plate (mid-plate thermocouple) is on the left, and the short thermocouple that only extends a small distance into the plate (end-plate thermocouple) is on the right. Considering the mid-plate thermocouple, there are three cells (p2, p3 and p4) for which the temperatures predicted by the simulation are plotted in Figure 10a. The first cell, p2, is actually outside of the thermocouple (thus providing the actual metal temperature at this location), while p3 and p4 are both inside the thermocouple. Notice that these three predicted temperature curves are very similar, indicating that this region of the casting is relatively isothermal, and that conduction losses for the mid-plate thermocouples are small. On the other hand, the three predicted temperature curves for the end-plate thermocouple (at locations p8, p9 and p10 in Figure 10b) show differences of up to 30 oC at certain times. This indicates that the end-plate thermocouple is indeed experiencing significant conduction losses, as expected based on its location in the plate and the small amount of mold between the plate and the atmosphere. Based on this information, the end-plate thermocouple readings were used to determine the effective thermal conductivity. After some trial-and-error, a value of 10 W/m-K was selected for the effective thermal conductivity of the thermocouples, which seems realistic. Other, less important effective properties of the thermocouples were chosen as 2,700 kg/m3 for the density and 1,300 J/kg-K for the specific heat. Another adjustment that was required to obtain agreement in some instances was a slight adjustment to the composition. This was done in order to match the simulated liquidus temperatures from JMatPro with the measured values. Adjustment of the composition to obtain the measured liquidus temperature with JMatPro can be justified by the fact that there could be small inaccuracies in the measured compositions, that
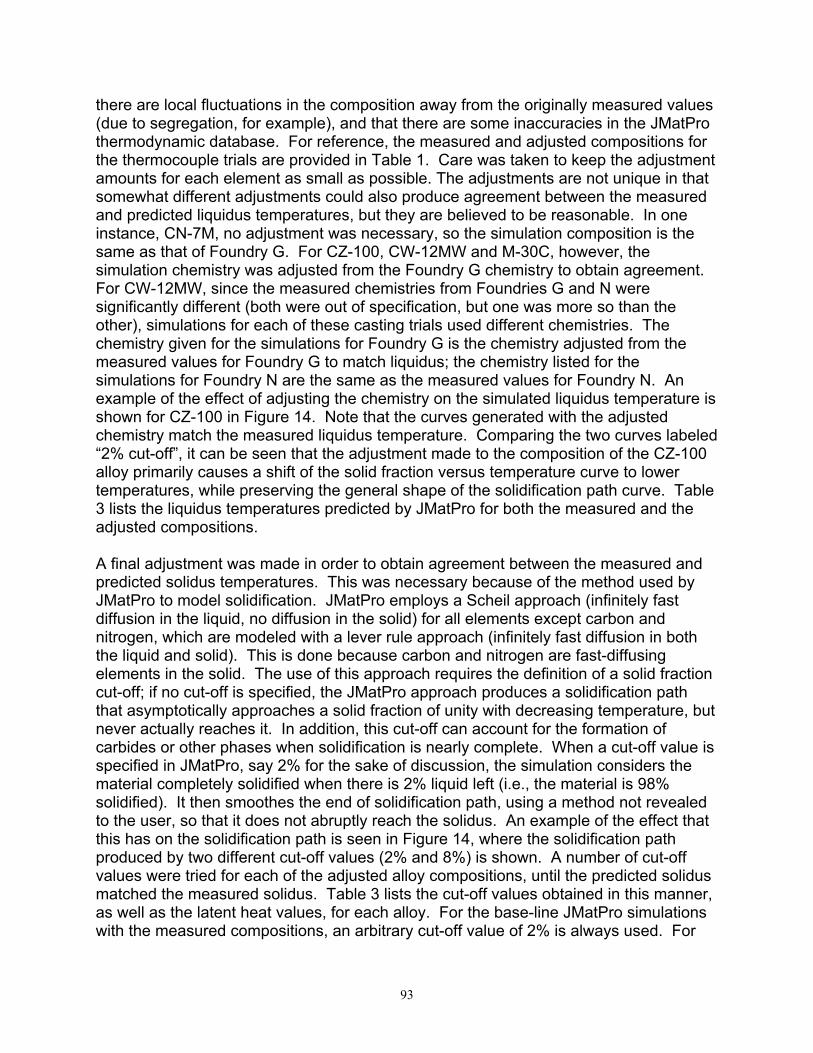
93
there are local fluctuations in the composition away from the originally measured values (due to segregation, for example), and that there are some inaccuracies in the JMatPro thermodynamic database. For reference, the measured and adjusted compositions for the thermocouple trials are provided in Table 1. Care was taken to keep the adjustment amounts for each element as small as possible. The adjustments are not unique in that somewhat different adjustments could also produce agreement between the measured and predicted liquidus temperatures, but they are believed to be reasonable. In one instance, CN-7M, no adjustment was necessary, so the simulation composition is the same as that of Foundry G. For CZ-100, CW-12MW and M-30C, however, the simulation chemistry was adjusted from the Foundry G chemistry to obtain agreement. For CW-12MW, since the measured chemistries from Foundries G and N were significantly different (both were out of specification, but one was more so than the other), simulations for each of these casting trials used different chemistries. The chemistry given for the simulations for Foundry G is the chemistry adjusted from the measured values for Foundry G to match liquidus; the chemistry listed for the simulations for Foundry N are the same as the measured values for Foundry N. An example of the effect of adjusting the chemistry on the simulated liquidus temperature is shown for CZ-100 in Figure 14. Note that the curves generated with the adjusted chemistry match the measured liquidus temperature. Comparing the two curves labeled “2% cut-off”, it can be seen that the adjustment made to the composition of the CZ-100 alloy primarily causes a shift of the solid fraction versus temperature curve to lower temperatures, while preserving the general shape of the solidification path curve. Table 3 lists the liquidus temperatures predicted by JMatPro for both the measured and the adjusted compositions. A final adjustment was made in order to obtain agreement between the measured and predicted solidus temperatures. This was necessary because of the method used by JMatPro to model solidification. JMatPro employs a Scheil approach (infinitely fast diffusion in the liquid, no diffusion in the solid) for all elements except carbon and nitrogen, which are modeled with a lever rule approach (infinitely fast diffusion in both the liquid and solid). This is done because carbon and nitrogen are fast-diffusing elements in the solid. The use of this approach requires the definition of a solid fraction cut-off; if no cut-off is specified, the JMatPro approach produces a solidification path that asymptotically approaches a solid fraction of unity with decreasing temperature, but never actually reaches it. In addition, this cut-off can account for the formation of carbides or other phases when solidification is nearly complete. When a cut-off value is specified in JMatPro, say 2% for the sake of discussion, the simulation considers the material completely solidified when there is 2% liquid left (i.e., the material is 98% solidified). It then smoothes the end of solidification path, using a method not revealed to the user, so that it does not abruptly reach the solidus. An example of the effect that this has on the solidification path is seen in Figure 14, where the solidification path produced by two different cut-off values (2% and 8%) is shown. A number of cut-off values were tried for each of the adjusted alloy compositions, until the predicted solidus matched the measured solidus. Table 3 lists the cut-off values obtained in this manner, as well as the latent heat values, for each alloy. For the base-line JMatPro simulations with the measured compositions, an arbitrary cut-off value of 2% is always used. For

94
the adjusted compositions, the cut-off value reflects the matching of the measured and predicted solidus temperatures, as explained above. It can be seen that the cut-off values range from 2% to 15% and that the different cut-offs shift the solidus temperature by up to 150 oC. The higher cut-off values cause significant changes in the solidification path that are unlikely to be very realistic. Nonetheless, it was decided that for the purposes of the present study it is more important to match the measured and predicted solidus temperatures than to attain an accurate solidification path. Since the cut-off value for M-30C is only 2%, this solidification path is likely to be quite accurate. The final property curves predicted by JMatPro and used in the simulation of the casting trials are summarized for CN-7M, CZ-100, CW-12MW, M-35-1 and M-30C in Figures 15 – 18. These curves were generated using the chemistries labeled as “Simulation” in Table 1. In the case of CW-12MW, the curves shown in Figures 15 – 18 are for the Foundry N chemistry, since the Foundry G chemistry is notably out of specification. The solid fraction curves for these alloys are shown in Figure 15. This figure demonstrates why M-35-1 and M-30C were treated separately; although they have nearly the same liquidus and similar solidus temperatures, they have very different solidification paths. Figure 16 contains the density curves for these alloys. All of the nickel-base alloys have similar density curves. The CN-7M curve is of a similar shape, but the density is lower at any given temperature than for the nickel-base alloys. The thermal conductivity curves are provided in Figure 17. The CN-7M and the CW-12MW curves are very similar. The remaining nickel-base alloys have conductivity curves that are also similar to each other, but with significantly higher conductivity values than CN-7M and CW-12MW. Finally, the specific heat curves are shown in Figure 18. These curves are all relatively similar. Returning now to Figures 10 – 13, generally good agreement can be observed between the measured and predicted temperatures and cooling rates for both the mid-plate and the end-plate thermocouples. The mid-plate thermocouple comparisons (Figure 10a – 13a) show small deviations between the measured and predicted temperatures that occur between the liquidus and solidus temperatures, near the end of solidification. These deviations can be attributed to the use of relatively high cut-off values in some cases to achieve agreement between the measured and predicted solidus temperatures, as explained previously (Table 3). The change in the solidification path produced by the cut-off (see Figure 14) causes the latent heat release in the simulation to be inaccurate. It would have been possible to make further, “manual” adjustments to the solidification path for each of the alloys (Figure 15), but this would have meant abandoning the use of JMatPro for obtaining the material properties altogether. The end-plate thermocouple comparisons (Figure 10b – 13b) are also good other than that the conduction error appears to be underestimated for two of the casting trials (Figures 10b and 13b). Further adjustments to the end-plate thermocouple effective thermal conductivity used in the simulations would have been possible, but the present choice appears to produce reasonable overall agreement for most casting trials. Note from Figure 12b that the accounting for the conduction error in the simulations, through the inclusion of the thermocouples, is able to approximately reproduce the measured effect that the end-plate thermocouple does not reach the liquidus temperature.

95
5. Casting Trial Simulations Based on the information collected during the plate casting trials, and using the material property data for each alloy described in the previous section, MAGMASOFT simulations were performed for each plate listed in Table 2 for which unique casting data is available. Special care was taken to specify a realistic thermal boundary condition at the top of the riser for those cases where no hot topping was used (Table 2). In MAGMASOFT, the default boundary condition at the top of the riser corresponds to the use of hot topping. The simulations of the plate casting trials provide the distribution of the Niyama criterion as well as the feeding percentage throughout the castings. The Niyama criterion[12] is a local thermal parameter defined as TG &/ [K1/2s1/2mm-1], where G is the temperature gradient and T& is the cooling rate[2]. The feeding percentage represents the amount of each control volume that contains solid metal; it is equal to one minus the porosity percentage. Due to limitations of the feeding algorithm currently used in MAGMASOFT, no feeding percentages are predicted along the centerline inside the plates, away from the riser, even if a large amount of porosity is revealed by the x-rays (see figures below)[2,3]. Therefore, the feeding percentages are only used to compare simulated and measured riser pipes. The correlation between the x-ray indications inside the plate and the simulation results must rely on the Niyama criterion. Generally, a smaller Niyama value corresponds to a higher probability of porosity occurring in the plate. Our previous work on C&LA and high alloy steels[2-4] indicated a critical Niyama value of 0.1 below which porosity indications become visible on an x-ray film such that a level of 1 or greater would be assigned. The following comparisons between predicted Niyama values (and feeding percentages) and shrinkage indications and levels from x-rays are intended to shed some light on this correspondence between simulation and casting trials for the present high-nickel alloys. Figure 19 shows simulation and x-ray results from two of the CN-7M plates cast at Foundry O. The upper panels show the Niyama values together with the measured x-ray levels. It can be seen that for the short plate (left side) there is no Niyama indication below 1.4 other than for a small indication in the riser; the measured x-ray level for this plate is 0 (i.e., completely sound). For the longer plate (right side), a large region with Niyama values below 0.1 can be observed along the centerline; the measured x-ray level for this plate is 3. The lower panels show the predicted feeding percentages together with x-rays of the un-cut risers and photographs of the cut risers. For these plates, no hot topping was used. It can be seen that the riser is frozen off at the top and that the riser pipe consists of an internal shrinkage cavity. For both plates, good agreement exists between the predicted riser pipes and what can be discerned from the x-rays and photographs. Figure 20 shows top views, cut at the mid-plate thickness, of the predicted Niyama values for the same two plates, together with the top-view x-ray of the longer plate. For the longer plate, a good correlation can be observed between the shrinkage indications on the x-ray and the region where Niyama values below approximately 0.1 are predicted. Since the shorter plate is radiographically sound (x-ray level 0), no image of the x-ray is included in Figure 20. All predicted Niyama values for this plate are above 1.4. Figure 21 shows a comparison of the predicted feeding

96
percentages and Niyama values with riser x-rays for two plates of the same alloy and dimensions as in Figures 19 and 20, but for a case where a hot topping was used. For the shorter plate (left side) excellent agreement exists between the predicted feeding percentages and the riser pipe indications on the x-ray. Note that the hot topping caused the riser pipe to be open at the top. For the longer plate, the agreement is not as good, primarily because the hot topping does not appear to have been effective in the casting trial; a thick solid layer can be observed on the x-ray at the top of the riser, and the riser pipe consists of an internal shrinkage cavity, as if no hot topping was applied. Figure 22 shows similar results for two plates made of CZ-100. No Niyama indications below 1.4 are predicted for the shorter plate other than inside and right below the riser. The measured x-ray level for this plate is 0 (completely sound). For the longer plate, a fairly large region of Niyama values below 1.4 is predicted inside the plate, but all Niyama values are above 0.2. No internal shrinkage indications are apparent on the x-ray for this plate, as indicated on the figure (x-ray level 0). The riser pipes are reasonably well predicted by the feeding percentages for both the short and the long plate (lower panels of Figure 22). No hot topping was used. For the shorter plate, the internal riser pipe on the x-ray appears smaller than what is predicted. This could be attributed to the presence of a depression at the top of the riser on the x-ray that is not predicted in the present simulation. It is possible that an adjustment in the thermal boundary conditions at the top of the riser would produce better agreement for this riser. The predicted Niyama distributions for two CW-12MW plates are compared to the corresponding top-view x-rays in Figure 23 (no riser x-rays are available for these plates). Both plates show a shrinkage indication directly below the riser, while the Niyama values in this region are all above 1.4. This discrepancy can be attributed to the simulation predicting a riser pipe that is shorter than the pipe the casting trials produced. The shorter plate itself, away from the riser, is radiographically sound (x-ray level 0) and all Niyama values are above 1.4. The longer plate has level 4 indications along the centerline, extending almost throughout the length of the plate. The predicted Niyama values below 1.4 approximately coincide with this shrinkage pattern. The minimum Niyama values inside the longer plate are below 0.1. Figures 24 and 25 show the predicted Niyama and feeding percentage distributions and the corresponding x-rays for two M-35-1 plates. Good agreement can be observed between the feeding percentages and the riser pipes on the x-rays (lower panels in Figure 24), although the depth of the riser pipe for the shorter plate is somewhat over predicted. The Niyama predictions also show a good correspondence with the x-rays, as can be seen in Figure 25. The short plate has a level 4 indication below the riser that coincides with Niyama values between about 0.4 and 1.0. The remainder of the plate is radiographically sound (x-ray level 0) and all Niyama values are above 1.4. The longer plate has several level 5 indications along the centerline on the top-view x-ray. These correspond very well with the predicted Niyama values at the same locations. The minimum Niyama value in the level 5 region is about 0.1.

97
Figure 26 plots the predicted minimum Niyama values for all casting trial plates as a function of the feeding length of the plates. Here, ‘feeding length’ should not be confused with ‘feeding distance’; the feeding length is simply the length to be fed, as explained in the inset in Figure 26. Even though the results correspond to five different high-Ni alloys, the minimum Niyama values show the same trend: they decrease with increasing feeding length length. A very similar trend was observed in our previous studies on C&LA and high alloy steels[2-4], but a direct comparison cannot be made because the plate lengths and W/T ratios were different. The longer plates typically have a higher x-ray rating level, while the shortest plates are usually sound. This indicates that the Niyama criterion can be used as an indicator of soundness and as a tool to determine feeding distances. A plot of the measured x-ray levels versus the predicted minimum Niyama values is not included in this paper, because some of the x-ray ratings still needed to be verified at the time of writing. 6. Conclusions A total of 55 plates of varying length were cast at five foundries in an effort to develop feeding distance rules for the nickel-based alloys CZ-100, M-35-1 and CW-12MW, as well as for the austenitic stainless steel CN-7M. In order to develop the property databases necessary to simulate these alloys, temperature data was recorded for each alloy during the casting trials. This measured data was then used in conjunction with material property simulation (JMatPro) to develop the necessary property data for each alloy. This paper documents the property data obtained, and foundries interested in using them should contact the authors. A comparison of the radiographs taken of the plates and the risers with the corresponding MAGMASOFT casting simulation results reveals generally good agreement. The riser pipes correlate well with the feeding percentage predictions in MAGMASOFT, while the shrinkage indications on the x-rays for those plates where the feeding distance was exceeded are well predicted by the Niyama criterion. The study will be completed within the next few months by first establishing a direct, quantitative correlation between the measured x-ray levels and the predicted minimum Niyama values. Then, a large number of additional simulations will be conducted to establish general feeding and risering rules. The rules will be tailored to the alloy composition, casting conditions and geometry, and soundness desired, as in our previous C&LA and high alloy steel work[2-4]. Acknowledgements This work was prepared with the support of the U.S. Department of Energy (DOE) Award No. DE-FC36-02ID14225. However, any opinions, findings, conclusions, or recommendations expressed herein are those of the authors, and do not necessarily reflect the views of the DOE. We are indebted to Malcolm Blair and Raymond Monroe of the SFSA for their work in helping organize the trials and recruiting members to participate. Most importantly, we thank the participants in the plate casting trials (A.G. Anderson, Ancast, Southern Alloy, Stainless Foundry & Engineering, and Wollaston

98
Alloy) for their substantial investments of both time and resources. This work could not have been accomplished without their shared efforts. In particular, we are very grateful to Vasile Ionescu of A.G. Anderson, for his help in organizing, preparing for, and performing the thermocouple casting trials. References 1. Risering Steel Castings, Steel Founders' Society of America, Barrington, Illinois,
1973. 2. K.D. Carlson, S. Ou, R.A. Hardin and C. Beckermann: “Development of New
Feeding-Distance Rules Using Casting Simulation: Part I. Methodology,” Metall. Mater. Trans. B, 2002, vol. 33B, pp. 731-740.
3. S. Ou, K.D. Carlson, R.A. Hardin and C. Beckermann: “Development of New Feeding-Distance Rules Using Casting Simulation: Part II. The New Rules,” Metall. Mater. Trans. B, 2002, vol. 33B, pp. 741-755.
4. Feeding & Risering Guidelines for Steel Castings, Steel Founders' Society of America, Barrington, Illinois, 2001.
5. K.D. Carlson, S. Ou and C. Beckermann: “Feeding and Risering of High Alloy Steel Castings,” 2003 SFSA Technical and Operating Conference, 2003.
6. JMatPro, Sente Software Ltd., Surrey Technology Centre, 40 Occam Road, GU2 7YG, United Kingdom.
7. ASTM E94-00, Annual Book of ASTM Standards, Volume 03.03: Nondestructive Testing, American Society for Testing and Materials, 2002.
8. ASTM E446-98, Annual Book of ASTM Standards, Volume 03.03: Nondestructive Testing, American Society for Testing and Materials, 2002.
9. Manual on the Use of Thermocouples in Temperature Measurement, ASTM Special Technical Publication 470B, American Society for Testing and Materials, 1981.
10. Personal Daq, IOTech, Inc., 25971 Cannon Road, Cleveland, Ohio 44146, USA. 11. MAGMASOFT, MAGMA GmbH, Kackerstrasse 11, 52072 Aachen, Germany. 12. E. Niyama, T. Uchida, M. Morikawa and S. Saito: Am. Foundrymen’s Soc. Int. Cast
Met. J., 1982, vol. 7 (3), pp. 52-63.

99
Table 1. Compositions for the alloys of interest, given in weight percent. Nominal composition entries that are single numbers rather than number ranges indicate the maximum weight percentage for that element.
Alloy C Mn Si P S Cr Ni Cu Mo Cb W V Fe
Nominal 0.07 1.5 1.5 0.04 0.04 19 -22 27.5 -30.5 3 - 4 2 - 3 balance
Foundry G 0.019 0.76 0.34 0.023 0.01 19 27.54 3.9 2.1 46.3
Foundry O 0.05 0.59 0.57 0.015 0.025 20.5 28.6 3.51 2.26 43.88 CN-7M
Simulation 0.019 0.76 0.34 0.023 0.01 19 27.54 3.9 2.1 46.3
Nominal 1 1.5 2 0.03 0.03 balance 1.25 3 Foundry W 0.735 0.869 1.57 0.001 0.003 96.5 0.057 0.265 Foundry G 0.76 0.46 0.79 0.001 0.006 97.29 0.01 0.68 CZ-100
Simulation 0.86 1.5 0.89 0.06 0.01 94 1.2 1.48
Nominal 0.12 1 1 0.04 0.03 15.5 - 17.5 balance 16 - 18 3.75 -
5.25 0.2 - 0.4 4.5 - 7.5
Foundry G 0.03 0.2 0.54 0.029 0.018 15.6 52.78 15.2* 3.77 0.23 11.6* Simulation
(for G) 0.04 0.3 0.7 0.02 0.03 15.6 52.6 16 3.77 0.23 10.7*
Foundry N 0.06 0.67 0.76 0.005 0.015 17.3 55.25 15.8* 4.1 0.24 5.8
CW-12MW
Simulation (for N) 0.06 0.67 0.76 0.005 0.015 17.3 55.25 15.8* 4.1 0.24 5.8
Nominal 0.3 1.5 1 - 2 0.03 0.03 0.03 balance 26 - 33 1 - 3 3.5 Foundry G 0.02 1.07 1.54 0.001 0.005 60.72 31.95 1.3 3.4 M-30C
Simulation 0.12 1.07 1.54 0.001 0.005 60.72 32 1.3 3.4 Nominal 0.35 1.5 1.25 0.03 0.03 balance 26 - 33 0.5 3.5
Foundry T 0.181 1.129 1.035 0.0047 0.004 0.3 64.58 30.88 0.005 0.03 1.87 M-35-1
Simulation 0.181 1.129 1.035 0.0047 0.004 0.3 64.58 30.88 0.005 0.03 1.87
* Note: entries listed in red are out of specification.

100
Table 2. Experimental data from the nickel-alloy plate casting trials.
Alloy T x W (in.)
Length (in.)
Feeding Length (in.)
Riser D x H (in.)
Pouring Temp. (°C)
Pouring Time (s)
Hot Topping
Shrinkage X-ray Level
Sand mold
Foundry
CN-7M 1 x 8 8 5.3 4 x 5 1608 10 no 2 furan sand G CN-7M 1 x 8 8 5.3 4 x 5 1558 10 no 2 furan sand G CN-7M 1 x 8 8 5.3 4 x 4 1496 7 no 0 furan sand O CN-7M 1 x 8 8 5.3 4 x 4 1492 7 no 0 furan sand O CN-7M 1 x 8 8 5.3 4 x 4 1487 7 no 0 furan sand O CN-7M 1 x 8 8 5.3 4 x 4 1496 7 yes 0 furan sand O CN-7M 1 x 8 10 6.9 4 x 5 1589 10 no 2 furan sand G CN-7M 1 x 8 10 6.9 4 x 5 1589 10 no 3 furan sand G CN-7M 1 x 8 10 6.9 4 x 5 1561 10 no 3 furan sand G CN-7M 1 x 8 10 6.9 4 x 5 1561 10 no 3 furan sand G CN-7M 1 x 8 12 8.8 4 x 5 1608 10 no 5 furan sand G CN-7M 1 x 8 12 8.8 4 x 5 1558 10 no 5 furan sand G CN-7M 1 x 8 16 12.6 4 x 4 1496 10 no 4 furan sand O CN-7M 1 x 8 16 12.6 4 x 4 1492 10 no 3 furan sand O CN-7M 1 x 8 16 12.6 4 x 4 1487 10 no 2 furan sand O CN-7M 1 x 8 16 12.6 4 x 4 1496 10 yes 3 furan sand O
CW-12MW 1 x 8 8 5.3 4 x 5 1584 10 no 2 furan sand G CW-12MW 1 x 8 8 5.3 4 x 5 1521 10 no 3 furan sand G CW-12MW 1 x 8 8 5.3 4 x 4 1588 4 no 0 (3)* furan sand N CW-12MW 1 x 8 8 5.3 4 x 4 1579 4 no 0 (3)* furan sand N CW-12MW 1 x 8 8 5.3 4 x 4 1571 4 no 0 (3)* furan sand N CW-12MW 1 x 8 10 6.9 4 x 5 1558 10 no 2 furan sand G CW-12MW 1 x 8 10 6.9 4 x 5 1558 10 no 3 furan sand G CW-12MW 1 x 8 12 8.8 4 x 5 1584 10 no 4 furan sand G CW-12MW 1 x 8 12 8.8 4 x 5 1521 10 no 5 furan sand G CW-12MW 1 x 8 16 12.6 4 x 4 1560 7 no 2 (3)* furan sand N CW-12MW 1 x 8 16 12.6 4 x 4 1552 8 no 2 (3)* furan sand N CW-12MW 1 x 8 16 12.6 4 x 4 1541 9 no 4 (4)* furan sand N
* X-ray levels in parentheses indicate ratings of under-riser shrinkage, which is not relevant to feeding distance.

101
Table 2. (continued) Experimental data from the nickel-alloy plate casting trials.
Alloy T x W (in.)
Length (in.)
Feeding Length (in.)
Riser D x H (in.)
Pouring Temp. (°C)
Pouring Time (s)
Hot Topping
Shrinkage X-ray Level
Sand mold
Foundry
CZ-100 1 x 8 8 5.3 4 x 5 1594 10 no 1 furan sand G CZ-100 1 x 8 8 5.3 4 x 5 1579 10 no 2 furan sand G CZ-100 1 x 8 8 5.3 4 x 4 1459 7 no 0 furan sand W CZ-100 1 x 8 8 5.3 4 x 4 1455 7 no 0 furan sand W CZ-100 1 x 8 8 5.3 4 x 4 1451 7 no 0 furan sand W CZ-100 1 x 8 10 6.9 4 x 5 1572 10 no 2 furan sand G CZ-100 1 x 8 10 6.9 4 x 5 1572 10 no 2 furan sand G CZ-100 1 x 8 10 6.9 4 x 5 1551 10 no 2 furan sand G CZ-100 1 x 8 12 8.8 4 x 5 1594 10 no 3 furan sand G CZ-100 1 x 8 12 8.8 4 x 5 1579 10 no 3 furan sand G CZ-100 1 x 8 16 12.6 4 x 6 1432 14 no 0 furan sand W CZ-100 1 x 8 16 12.6 4 x 6 1444 12 no 0 furan sand W CZ-100 1 x 8 16 12.6 4 x 6 1448 11 no 0 furan sand W
Monel-35-1 1 x 8 8 5.3 4 x 5 1428 5.7 no 0 (1)* green sand T Monel-35-1 1 x 8 8 5.3 4 x 5.8 1421 4.3 no 0 (4)* green sand T Monel-35-1 1 x 8 8 5.3 4 x 5.7 1421 4.9 no 0 (4)* green sand T Monel-35-1 1 x 8 16 12.6 4 x 6.2 1428 11 no 5 (5)* green sand T Monel-35-1 1 x 8 16 12.6 4 x 6 1428 6.4 no 5 (5)* green sand T Monel-35-1 1 x 8 16 12.6 4 x 5.6 1428 7.8 no 5 (5)* green sand T
M-30C 1 x 8 8 5.3 4 x 5 1608 10 no 1 furan sand G M-30C 1 x 8 8 5.3 4 x 5 1558 10 no 2 furan sand G M-30C 1 x 8 10 6.9 4 x 5 1589 10 no 3 furan sand G M-30C 1 x 8 10 6.9 4 x 5 1589 10 no 3 furan sand G M-30C 1 x 8 10 6.9 4 x 5 1561 10 no 3 furan sand G M-30C 1 x 8 10 6.9 4 x 5 1561 10 no 4 furan sand G M-30C 1 x 8 12 8.8 4 x 5 1608 10 no 1 furan sand G M-30C 1 x 8 12 8.8 4 x 5 1558 10 no 3 furan sand G
* X-ray levels in parentheses indicate ratings of under-riser shrinkage, which is not relevant to feeding distance.

102
Table 3. Simulated and measured values of liquidus and solidus temperatures, with simulated values of latent heat.
Solidus
Alloy Liquidus
TL (ºC) TS (ºC) Solidification
cut-off (%) Latent heat
(J/g) Measurement – thermocouple data 1392.5 1300
JMatPro: Measured G composition 1392.5 1151 2 195.9 CN-7M
JMatPro: Adjusted G composition 1392.5 1300 15 174.3
Measurement – thermocouple data 1376.9 1243 JMatPro: Measured G composition 1402.2 1274 2 268 CZ-100 JMatPro: Adjusted G composition 1376.9 1243 8 238
Measurement – thermocouple data 1359.5 1207
JMatPro: Measured G composition 1369.5 990 2 220
JMatPro: Adjusted G composition 1359.5 1207 11 191.6 CW-12MW
JMatPro: Measured N composition 1350 1206 11 191.8
Measurement – thermocouple data 1303.1 1192.6
JMatPro: Measured G composition 1312.5 1178 2 205 M-30C
JMatPro: Adjusted G composition 1303.1 1192.6 2 195
M-35-1 JMatPro: Measured T composition 1303.6 1196 2 198

103
Figure 1. General configuration for the nickel-alloy plate casting trials.
riser
casting
gating drag
T
cope HR
W
mold
FL DR
L
side-view cross section
top-view cross section

104
Figure 2. Casting trial results: feeding length versus shrinkage x-ray level for CN-7M plates.
0.67
2.75 2.75
5
-1
0
1
2
3
4
5
6
0 2 4 6 8 10 12 14
Feeding Length, FL (in.)
AST
M S
hrin
kage
X-r
ay L
evel
Foundry G (8 plates)Foundry O (8 plates)Mean X-ray Level +/- 1 Standard Deviation
D W
FL
L
W/T = 8
CN-7M (16 plates total)
4
2 1 2
3 1
1
2

105
Figure 3. Casting trial results: feeding length versus shrinkage x-ray level for CZ-100 plates.
0
3
2
0.6
-1
0
1
2
3
4
5
6
0 2 4 6 8 10 12 14
Feeding Length, FL (in.)
AST
M S
hrin
kage
X-r
ay L
evel
Foundry G (7 plates)
Foundry W (6 plates)Mean X-ray Level +/- 1 Standard Deviation
D W
FL
L
W/T = 8
CZ-100 (13 plates total)
33
1
1 3
2

106
Figure 4. Casting trial results: feeding length versus shrinkage x-ray level for CW-12MW plates.
4.5
2.5
1
2.67
-1
0
1
2
3
4
5
6
0 2 4 6 8 10 12 14
Feeding Length, FL (in.)
AST
M S
hrin
kage
X-r
ay L
evel
Foundry G (6 plates)
Foundry N (6 plates)
Mean X-ray Level +/- 1 Standard Deviation
DR
WFL
L
W/T = 8
CW-12MW (12 plates total)
3
1 1 2
1 1
1 1
1

107
Figure 5. Casting trial results: feeding length versus shrinkage x-ray level for Monel-35-1 and M-30C plates.
0.6
1.5
5
3.25
-1
0
1
2
3
4
5
6
0 2 4 6 8 10 12 14
Feeding Length, FL (in.)
AST
M S
hrin
kage
X-r
ay L
evel
Foundry G, M-30C (8 plates)Foundry T, M-35-1 (6 plates)Mean X-ray Level +/- 1 Standard Deviation
D W
FL
L
W/T = 8
M-30C & Monel-35-1 (14 plates total)
3
1 1
1 1
3
1
3

108
Figure 6. Cross-sectional schematics of thermocouple assemblies (a) without an
alumina protection tube, and (b) with an alumina protection tube.
(a)
(b)
fused quartz 2-hole alumina insulator
alumina protection tube
B-type thermocouple wire
thermocouple bead

109
Figure 7. Schematics of the rigging used for the thermocouple trials.
(b) side view
HR = 5”
T = 1”
10 ppi filter
(a) top view
DR = 4”
L = 8”
W = 8” (both plates)
DR = 4”
L = 12”
thermocouples (2 of these 3 used for each plate)
1.5” 1.5”
5”
0.5”
D = 3”
3”

110
Figure 8 Picture of the three different thermocouples used in the trials. Figure 9 Mold cope, with two thermocouples inserted.
mid-plate thermocouple (10 mm OD)
end-plate thermocouple 1 (8 mm OD)
end-plate thermocouple 2 (6 mm OD)

111
700
800
900
1000
1100
1200
1300
1400
1500
0 400 800 1200 1600 2000 2400 2800
Time, s
Tem
pera
ture
, ºC
-1.5
-1
-0.5
0
0.5
1
Coo
ling
rate
, ºC
/s
TL = 1376.9 ºC
TS = 1243 ºC
MeasurementSimulation at p2Simulation at p3 Simulation at p4
-1
-0.5
0
0.5
1.0
1.5
CZ-100mid-plate thermocouple
(TC time delay 26s)
700
800
900
1000
1100
1200
1300
1400
1500
0 400 800 1200 1600 2000 2400 2800
Time, s
Tem
pera
ture
, ºC
-1.5
-1
-0.5
0
0.5
1
Coo
ling
rate
, ºC
/s
CZ-100end-plate thermocouple
(TC time delay 22s)
MeasurementSimulation at p8Simulation at p9 Simulation at p10
TL = 1376.9 ºC
TS = 1243 ºC
TC failure
-1
-0.5
0
0.5
1.0
1.5
(a)
(b)
Figure 10. Measured and simulated CZ-100 temperature and cooling rate curves for (a) mid-plate thermocouple (TC); and (b) end-plate TC.

112
700
800
900
1000
1100
1200
1300
1400
1500
0 400 800 1200 1600 2000 2400
Time, s
Tem
pera
ture
, ºC
-1.5
-1
-0.5
0
0.5
1
Coo
ling
rate
, ºC
/s
MeasurementSimulation at p2Simulation at p3 Simulation at p4
TL = 1392.5 ºC
TS = 1300 ºC
-1
-0.5
0
0.5
1.0
1.5
CN-7Mmid-plate thermocouple
(TC time delay 32s)
700
800
900
1000
1100
1200
1300
1400
1500
0 400 800 1200 1600 2000 2400
Time, s
Tem
pera
ture
, ºC
-1.5
-1
-0.5
0
0.5
1
Coo
ling
rate
, ºC
/s
CN-7Mend-plate thermocouple
(TC time delay 6s)
MeasurementSimulation at p8Simulation at p9 Simulation at p10
TL = 1392.5 ºC
TS = 1300 ºC
-1
-0.5
0
0.5
1.0
1.5
(a)
(b)
Figure 11. Measured and simulated CN-7M temperature and cooling rate curves for (a) mid-plate thermocouple (TC); and (b) end-plate TC.

113
700
800
900
1000
1100
1200
1300
1400
1500
0 400 800 1200 1600 2000
Time, s
Tem
pera
ture
, ºC
-1.5
-1
-0.5
0
0.5
1
Coo
ling
rate
, ºC
/s
TL = 1359.5 ºC
MeasurementSimulation at p2Simulation at p3 Simulation at p4
TC failure
-1
-0.5
0
0.5
1.0
1.5
TS = 1207 ºC
CW-12MWend-plate thermocouple
(TC time delay 30s)
700
800
900
1000
1100
1200
1300
1400
1500
0 400 800 1200 1600 2000
Time, s
Tem
pera
ture
, ºC
-1.5
-1
-0.5
0
0.5
1
Coo
ling
rate
, ºC
/s
CW-12MWend-plate thermocouple
(TC time delay 10s)
TL= 1359.5 ºC
TS = 1207 ºC
MeasurementSimulation at p8Simulation at p9 Simulation at p10
TC failure
-1
-0.5
0
0.5
1.0
1.5
Figure 12. Measured and simulated CW-12MW temperature and cooling rate curves for
(a) mid-plate thermocouple (TC); and (b) end-plate TC.
(b)
(a)

114
700
800
900
1000
1100
1200
1300
1400
1500
0 400 800 1200 1600 2000 2400 2800
Time, s
Tem
pera
ture
, ºC
-1.5
-1
-0.5
0
0.5
1
Coo
ling
rate
, ºC
/s
MeasurementSimulation at p2Simulation at p3 Simulation at p4
TL = 1303.1 ºC
TS = 1192.6 ºC
-1
-0.5
0
0.5
1.0
1.5
M-30Cmidd-plate thermocouple
(TC time delay 30s)
700
800
900
1000
1100
1200
1300
1400
1500
0 400 800 1200 1600 2000 2400 2800
Time, s
Tem
pera
ture
, ºC
-1.5
-1
-0.5
0
0.5
1
Coo
ling
rate
, ºC
/s
MeasurementSimulation at p8Simulation at p9 Simulation at p10 TL = 1303.1 ºC
TS = 1192.6 ºC
-1
-0.5
0
0.5
1.0
1.5
M-30Cend-plate thermocouple
(TC time delay 5s)
(a)
(b)
Figure 13. Measured and simulated M-30C temperature and cooling rate curves for (a) mid-plate thermocouple (TC); and (b) end-plate TC.

115
0
0.1
0.2
0.3
0.4
0.5
0.6
0.7
0.8
0.9
1
1100 1125 1150 1175 1200 1225 1250 1275 1300 1325 1350 1375 1400
Temperature, ºC
Solid
frac
tion
Foundry G adjusted chemistry
2% cut-off
8% cut-off
FoundryG original chemistry
CZ-100Measured liquidus temperture
TL = 1376.9 ºC
Figure 14. Variations in the simulated solidification path for CZ-100 due to changes in
the metal chemistry and the simulation cut-off percentage.
0
0.1
0.2
0.3
0.4
0.5
0.6
0.7
0.8
0.9
1
1150 1200 1250 1300 1350 1400
Temperature, ºC
Solid
frac
tion
CN-7M
CW-12MW(N composition)
CZ-100
M-35-1
M-30C
Figure 15. Simulated solid fraction curves.

116
7000
7200
7400
7600
7800
8000
8200
8400
8600
8800
9000
0 200 400 600 800 1000 1200 1400 1600
Temperature, ºC
Den
sity
, kg/
m3
M-35-1
CW-12MW(N composition)
CZ-100
CN-7M
M-30C
Figure 16. Simulated density curves.
0
10
20
30
40
50
60
70
80
90
0 200 400 600 800 1000 1200 1400 1600
Temperature, ºC
Ther
mal
Con
duct
ivity
, W/(m
K)
M-35-1
CW-12MW(N composition)
CZ-100
CN-7M
M-30C
Figure 17. Simulated thermal conductivity curves.

117
0
100
200
300
400
500
600
700
800
0 200 400 600 800 1000 1200 1400 1600
Temperature, ºC
Spec
ific
Hea
t, J/
(kgK
)
CW-12MW(N composition)
CN-7M
CZ-100
M-35-1 & M-30C
Figure 18. Simulated specific heat curves.
Figure 19. Side view cross-section simulation results and riser pipe x-rays for two CN-
7M plates from Foundry O.
X-ray Level 3 X-ray Level 0
Plate 1”x8”x16” Riser D4”XH4”
Plate 1”x8”x8” Riser D4”XH4”

118
Figure 20. Top view cross-section simulation results for two CN-7M plates from Foundry
O, with plate x-ray for long plate.
X-ray Level 3
X-ray Level 0
Plate 1”x8”x16”Riser D4”XH4”
Plate 1”x8”x8” Riser D4”XH4”

119
Figure 21. Side view cross-section simulation results and riser pipe x-rays for two CN-
7M plates cast with hot topping from Foundry O. Figure 22. Side view cross-section simulation results and riser pipe x-rays for two CZ-
100 plates from Foundry W.
X-ray Level 3 X-ray Level 0
Plate 1”x8”x16”Riser D4”XH4”
Plate 1”x8”x8” Riser D4”XH4”
X-ray Level 0 X-ray Level 0
Plate 1”x8”x8” Riser D4”XH4”
Plate 1”x8”x16”Riser D4”XH6”

120
Figure 23. Top view cross-section simulation results for two CW-12MW plates from
Foundry N, shown with corresponding plate x-rays.
Figure 24. Side view cross-section simulation results and riser pipe x-rays for two M-35-
1 plates from Foundry T.
Plate 1”x8”x16” Riser D4”XH6”
X-ray Level 4 (4) X-ray Level 0 (3)
Plate 1”x8”x8” Riser D4”XH4”
X-ray Level 5 (5) X-ray Level 0 (4)
Plate 1”x8”x8” Riser D4”XH5.7”
Plate 1”x8”x16”Riser D4”XH6.2”

121
Figure 25. Top view cross-section simulation results for two M-35-1 plates from Foundry
T, shown with corresponding plate x-rays.
X-ray Level 5 (5) X-ray Level 0 (4)
Plate 1”x8”x8” Riser D4”XH5.7”
Plate 1”x8”x16”Riser D4”XH6.2”

122
0
0.2
0.4
0.6
0.8
1
1.2
1.4
1.6
1.8
2
2.2
2.4
2.6
2.8
4 5 6 7 8 9 10 11 12 13 14
Feeding Length, FL (in.)
Min
imum
Ny
Valu
e, (K
1/2 s1/
2 mm
-1)
Alloy M-30C (8 PLATES) Alloy M-35-1 (6 PLATES)Alloy CZ-100 (13 PLATES)Alloy CW-12MW (12 PLATES)Alloy CN-7M (16 PLATES)
W
FL
L
W/T = 8
13
813
21
Figure 26. Feeding length versus minimum Niyama value for the simulations of all
casting trial plates.

Appendix C:Feeding of
High Nickel Alloys
SFSA High Alloy Research Committee MeetingFebruary 3, 2005
University of Iowa

• New feeding and risering rules have been developed for most common C&LA and high alloy steels
• Steel foundries expressed interest in four additional alloys– Little property data available for these alloys
Background & Motivation
C Mn P S Si Ni CrCZ-100 1 1.5 0.03 0.03 2 balance
Monel-35-1 0.35 1.5 0.03 0.03 1.25 balanceCW-12MW 0.12 1 0.04 0.03 1 balance 17.5
CN-7M 0.07 1.5 0.04 0.04 1.5 27.5 - 30.5 19 - 22
Composition (%)Alloy
Mo Cu Fe Cb V WCZ-100 1.25 3
Monel-35-1 26 - 33 3.5 0.5CW-12MW 18 4.5 - 7.5 0.2 - 0.4 3.75 - 4.25
CN-7M 2 3 3 4 balance
Composition (%)Alloy
- -

• Develop feeding and risering rules for:– Nickel-based alloys: CW-12MW (Hastelloy), Monel-35-1, CZ-100– Austenitic stainless steel: CN-7M
• Determine:– Material properties (liquidus, solidus, density, conductivity, etc.)
• Properties needed for casting simulation– Can simulation be used to determine feeding distance?
• Is Niyama criterion correlated to casting soundness for any of these alloys?
• If not, are any other parameters correlated to casting soundness?
Objectives

• Perform limited plate casting trials– Plate radiographs will provide feeding distance and riser pipe information
(similar to previous trials)– Collect thermocouple data from each alloy, for property development
• Record temperature data during solidification of each alloy– Thermocouple measurements taken at A.G. Anderson during casting trials
• Develop property data for alloys– JMatPro and Thermo-Calc provide simulated property data– Use thermocouple data to adjust the simulation properties to match
experimental values
• Conduct computer simulations– Determine if Niyama, new feeding algorithm, or other simulation
variables can be used to determine feeding distance– Correlate casting trial results with simulation results
• Develop new feeding rules from correlations
Project Overview

• Five foundries participated in the trials (total of 55 plates cast)– A.G. Anderson, Ancast, Southern Alloy,
Stainless Foundry & Engineering, Wollaston Alloy
• Each foundry:– Cast various lengths of 1”T x 8”W plates– Recorded trial casting data (metal chemistry, pouring temperature and
time, gating geometry, mold material, etc.)– Had plates radiographed and rated for ASTM shrinkage level– Radiographed and/or took digital photos of riser pipes
Casting Trials
riser
casting
gating system dragT
copeHR
W
mold
FLDR
L
side-view cross section
top-view cross section

• CN-7M trial results
Casting Trials
0.33
4.00
2.75
2.00
-1
0
1
2
3
4
5
6
0 2 4 6 8 10 12 14
Feeding Length, FL (in.)
AST
M S
hrin
kage
X-r
ay L
evel
Foundry AGA (8 plates)
Foundry S (8 plates)
Mean X-ray Level +/- 1 Standard Deviation
DR
WFL
L
W/T = 8
CN-7M (16 PLATES)
4
2
1 24
1
1
1
1

• CZ-100 trial results
Casting Trials
1 1
0
0.4
-1
0
1
2
3
4
5
6
0 2 4 6 8 10 12 14
Feeding Length, FL (in.)
AST
M S
hrin
kage
X-r
ay L
evel
Foundry AGA (7 plates)
Foundry W (6 plates)
Mean X-ray Level +/- 1 Standard Deviation
W
FL
L
W/T = 8
CZ-100 (13 PLATES)
33
23 2

• CW-12MW trial results
Casting Trials
4
1
0.6
2.67
-1
0
1
2
3
4
5
6
0 2 4 6 8 10 12 14
Feeding Length, FL (in.)
AST
M S
hrin
kage
X-r
ay L
evel
Foundry AGA (6 plates)
Foundry A (6 plates)
Mean X-ray Level +/- 1 Standard Deviation
DR
WFL
L
W/T = 8
3
12
21
1
1
1
CW-12MW (12 PLATES)

• M-30-C and M-35-1 trial results
Casting Trials
0.4
1.5
5
1.25
-1
0
1
2
3
4
5
6
0 2 4 6 8 10 12 14
Feeding Length, FL (in.)
AST
M S
hrin
kage
X-r
ay L
evel
Foundry AGA M-30C (8 plates)
Foundry ST M-35-1 (6 plates)
Mean X-ray Level +/- 1 Standard Deviation
DR
WFL
L
W/T = 8
3
2 1
1
3
1
3
M-30C & Monel-35-1 (14 PLATES)

• All thermocouple (T/C) data was recorded at A.G. Anderson– 700-lb furnace used to melt small heats of all 4 alloys– One plate of each alloy rigged with 2 T/C’s
• B-type (Pt-6%Rh - Pt-30%Rh) T/C’s used in plates– B-type T/C: Tmax = 3100°F (1700°C )
Temperature Measurement
fused quartz tubethermocouple beadB-type thermocouple wire
alumina protection tube
2-hole alumina insulatortwo
arrangements
no alumina protection tube
with alumina protection tube
(8 mm OD,10 mm OD)
(6 mm OD)

• Schematic of mold:
Temperature Measurement
sideview
HR = 5”
T = 1”
10 ppifilter
topview
DR = 4”
L = 8”
W = 8” (both plates)
DR = 4”
L = 12”
thermocouples (2 of these 3 used for each plate)
5”
0.5”
D = 3”
6 mm OD T/C10 mm OD T/C8 mm OD T/C
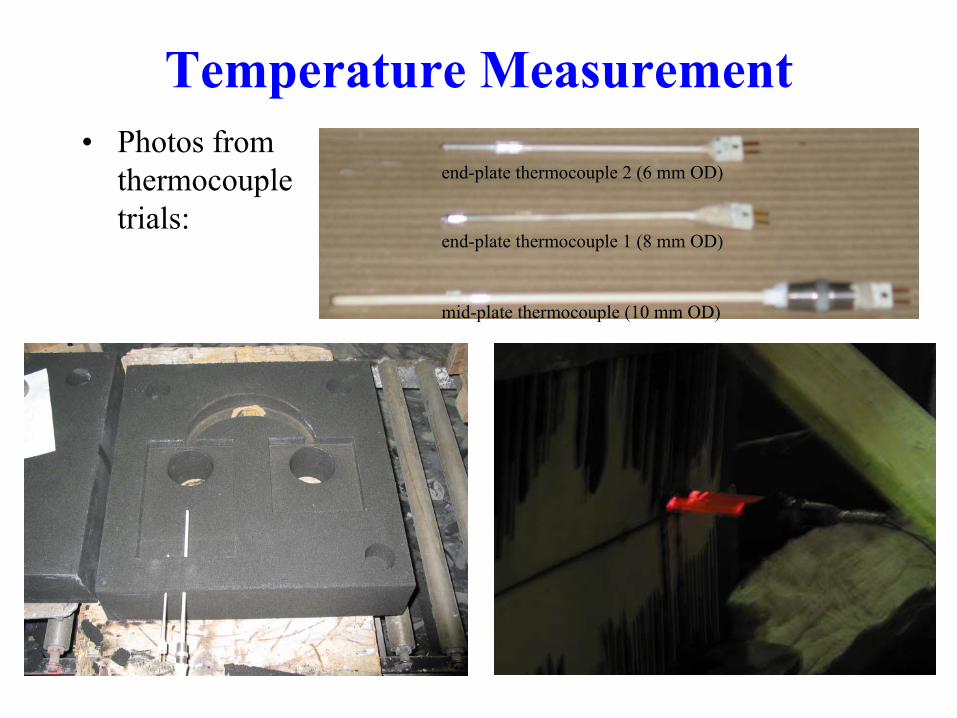
• Photos from thermocouple trials:
Temperature Measurement
mid-plate thermocouple (10 mm OD)
end-plate thermocouple 1 (8 mm OD)
end-plate thermocouple 2 (6 mm OD)

• 6 of 8 T/C’s successfully recorded temperatures throughout solidification– The 2 T/C’s that failed were in different plates, so at least one
complete set of temperature data was obtained for each alloy– One failed after 5 min., the other after 10 min.
Temperature Measurement
700
800
900
1000
1100
1200
1300
1400
1500
0 500 1000 1500 2000 2500
time (s)
tem
pera
ture
(C)
CN7M, mid-plate TC (big) CN7M, end-plate TC (small)

• Measured alloy compositions from thermocouple trials were used in JMatPro to develop property databases
• These databases were input into MAGMASOFT, and the thermocouple trials were simulated with actual casting conditions
– Thermocouples were included in simulation
• When necessary, adjustments were made to bring simulated and measured temperature and cooling rate curves into agreement
– Time shift performed to account for thermocouple response time lag– Thermal conductivity of liquid metal increased to account for convection– End-plate T/C readings were used to determine effective thermal
conductivity of T/C– Slight composition adjustments made to match liquidus temperatures– Solidification “cut-off” in JMatPro was adjusted to match solidus
temperatures
Property Database Development

• CZ-100 mid-plate temperature and cooling rate curves:
Property Database Development
700
800
900
1000
1100
1200
1300
1400
1500
0 400 800 1200 1600 2000 2400 2800
Time, s
Tem
pera
ture
, ºC
-1.5
-1
-0.5
0
0.5
1
Coo
ling
rate
, ºC
/s
TL = 1376.9 ºC
TS = 1243 ºC
MeasurementSimulation at p2Simulation at p3 Simulation at p4
-1
-0.5
0
0.5
1.0
1.5
CZ-100mid-plate thermocouple
(TC time delay 26s)

• CN-7M end-plate temperature and cooling rate curves:
Property Database Development
700
800
900
1000
1100
1200
1300
1400
1500
0 400 800 1200 1600 2000 2400
Time, s
Tem
pera
ture
, ºC
-1.5
-1
-0.5
0
0.5
1
Coo
ling
rate
, ºC
/s
CN-7Mend-plate thermocouple
(TC time delay 6s)
MeasurementSimulation at p8Simulation at p9 Simulation at p10
TL = 1392.5 ºC
TS = 1300 ºC
-1
-0.5
0
0.5
1.0
1.5

• M-30C mid-plate temperature and cooling rate curves:
Property Database Development
700
800
900
1000
1100
1200
1300
1400
1500
0 400 800 1200 1600 2000 2400 2800
Time, s
Tem
pera
ture
, ºC
-1.5
-1
-0.5
0
0.5
1
Coo
ling
rate
, ºC
/s
MeasurementSimulation at p2Simulation at p3 Simulation at p4
TL = 1303.1 ºC
TS = 1192.6 ºC
-1
-0.5
0
0.5
1.0
1.5
M-30Cmidd-plate thermocouple
(TC time delay 30s)

• M-30C end-plate temperature and cooling rate curves:
Property Database Development
700
800
900
1000
1100
1200
1300
1400
1500
0 400 800 1200 1600 2000 2400 2800
Time, s
Tem
pera
ture
, ºC
-1.5
-1
-0.5
0
0.5
1
Coo
ling
rate
, ºC
/s
MeasurementSimulation at p8Simulation at p9 Simulation at p10 TL = 1303.1 ºC
TS = 1192.6 ºC
-1
-0.5
0
0.5
1.0
1.5
M-30Cend-plate thermocouple
(TC time delay 5s)

• Final solid fraction curves:
• All other properties (ρ, k, L, cp) shown in T&O paper
Property Database Development
0
0.1
0.2
0.3
0.4
0.5
0.6
0.7
0.8
0.9
1
1150 1200 1250 1300 1350 1400
Temperature, ºC
Solid
frac
tion
CN-7M
CW-12MW(N composition)
CZ-100
M-35-1
M-30C

Casting Trial Simulations• Once property databases were developed, all casting trial
plates were simulated using MAGMASOFT• Simulation results (feeding percentages and Niyama
criterion values) are compared to experimental riser pipe and plate soundness results– Feeding percentage is the amount of each control volume that
contains solid metal– Niyama criterion is a local thermal parameter: TGNy &=

• Two CN-7M plates:
Casting Trial Simulations
Plate: 1” x 8” x 16”Riser: D4” x H4”
Plate: 1” x 8” x 8”Riser: D4” x H4”
Measured X-ray Level 0 Measured X-ray Level 3

• Two CN-7M plates:
Casting Trial Simulations
Plate: 1” x 8” x 16”Riser: D4” x H4”
Plate: 1” x 8” x 8”Riser: D4” x H4”
Measured X-ray Level 0
Measured X-ray Level 3

• Two CN-7M plates (with hot topping):
Casting Trial Simulations
Plate: 1” x 8” x 16”Riser: D4” x H4”
Plate: 1” x 8” x 8”Riser: D4” x H4”
Measured X-ray Level 0 Measured X-ray Level 3

• Two CZ-100 plates:
Casting Trial Simulations
Plate: 1” x 8” x 16”Riser: D4” x H6”
Plate: 1” x 8” x 8”Riser: D4” x H4”
Measured X-ray Level 0 Measured X-ray Level 0

• Two CW-12MW plates:
Casting Trial Simulations
Plate: 1” x 8” x 16”Riser: D4” x H6”
Plate: 1” x 8” x 8”Riser: D4” x H4”
Measured X-ray Level 0 (3) Measured X-ray Level 4 (4)

• Two M-35-1 plates:
Casting Trial Simulations
Plate: 1” x 8” x 16”Riser: D4” x H6.2”
Plate: 1” x 8” x 8”Riser: D4” x H5.7”
Measured X-ray Level 0 (4) Measured X-ray Level 5 (5)

• Two M-35-1 plates:
Casting Trial Simulations
Plate: 1” x 8” x 16”Riser: D4” x H6.2”
Plate: 1” x 8” x 8”Riser: D4” x H5.7”
Measured X-ray Level 0 (4) Measured X-ray Level 5 (5)

• Simulation results:
Casting Trial Simulations
0
0.2
0.4
0.6
0.8
1
1.2
1.4
1.6
1.8
2
2.2
2.4
2.6
2.8
4 5 6 7 8 9 10 11 12 13 14
Feeding Length, FL (in.)
Min
imum
Ny
Valu
e, (K
1/2 s1/
2 mm
-1)
Alloy M-30C (8 PLATES) Alloy M-35-1 (6 PLATES)Alloy CZ-100 (13 PLATES)Alloy CW-12MW (12 PLATES)Alloy CN-7M (16 PLATES)
W
FL
L
W/T = 8
13
813
21

0.33
4.00
2.75
2.00
-1
0
1
2
3
4
5
6
0 0.2 0.4 0.6 0.8 1 1.2 1.4 1.6 1.8 2 2.2
Minimum Ny Value, (K1/2s1/2mm-1)
AST
M S
hrin
kage
X-r
ay L
evel
Series6Series5Ny = 0.7Foundry AGA (8 PLATES)Foundry S (8 PLATES)Mean X-ray Level +/- 1 Standard Deviation
2
1 1
1111
11
1
1
1
1
11
CN-7M (16 PLATES)
W/T = 8
DR WFL
L
Rule development – CN-7M

Rule development – CN-7M
1
2
3
4
5
6
7
8
9
10
11
1 2 3 4 5 6 7 8 9 10 11 12 13 14 15
Width to Thickness, W/T
RZL
/T, E
ZL/T
and
FD
/T
All simulations shown used furan sand mold, 108 ºF (60 ºC) superheat
CN-7M feeding distance (FD/T ) with min. Ny = 0.7
AISI 1025 feeding distance (FD/T ) with min. Ny = 0.1
CN-7Mriser zone length
(RZL/T)
CN-7Mriser zone length
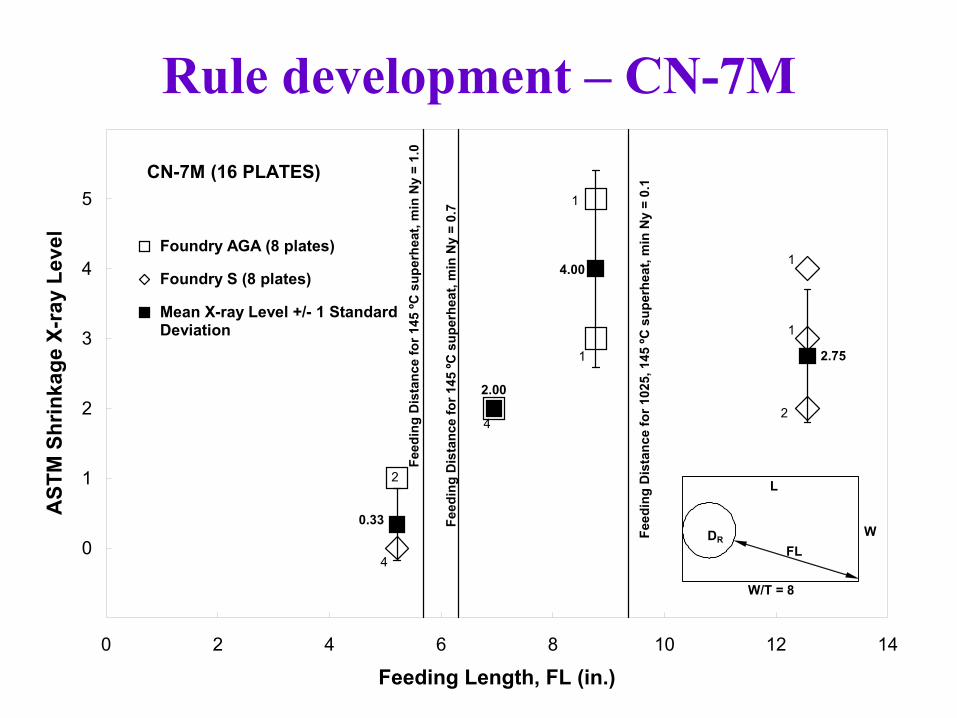
2.75
4.00
2.00
0.33
-1
0
1
2
3
4
5
6
0 2 4 6 8 10 12 14
Feeding Length, FL (in.)
AST
M S
hrin
kage
X-r
ay L
evel
FD/T = 5.4x0.9X1.17 = 5.68
FD/T = 5.4X1.17 = 6.32
FD/T = 8X1.17 = 9.36
Foundry AGA (8 plates)
Foundry S (8 plates)
Mean X-ray Level +/- 1 StandardDeviation
DR
WFL
L
W/T = 8
4
2
24
1
1
1
1
Feed
ing
Dis
tanc
e fo
r 145
ºC s
uper
heat
, min
Ny
= 0.
7
Feed
ing
Dis
tanc
e fo
r 102
5, 1
45 ºC
sup
erhe
at, m
in N
y =
0.1
Feed
ing
Dis
tanc
e fo
r 145
ºC s
uper
heat
, min
Ny
= 1.
0
CN-7M (16 PLATES)
Rule development – CN-7M

0.60
4.00
2.67
1.00
-1
0
1
2
3
4
5
6
0 0.2 0.4 0.6 0.8 1 1.2 1.4 1.6 1.8 2 2.2 2.4 2.6
Minimum Ny Value, (K1/2s1/2mm-1)
AST
M S
hrin
kage
X-r
ay L
evel
Series6Series5Ny = 0.7Foundry AGA (6 PLATES)Foundry A (6 PLATES)Mean X-ray Level +/- 1 Standard Deviation
DR WFL
L
2
1
1
1
1
1
1 1 1
11
CW-12MW (12 PLATES)
W/T = 8
Rule development – CW-12MW

Rule development – CW-12MW
1
2
3
4
5
6
7
8
9
10
11
1 2 3 4 5 6 7 8 9 10 11 12 13 14 15
Width to Thickness, W/T
RZL
/T, E
ZL/T
and
FD
/T
CW-12MW
base case
All simulations shown used furan sand mold, 108 ºF (60 ºC)
superheat
CW-12MW feeding distance (FD/T) with min. Ny = 0.7
AISI 1025 feeding distance (FD/T) with min.
N 0 1
CW-12MWriser zone
length (RZL/T)
CW-12MWriser zone length

4
1
0.6
2.67
-1
0
1
2
3
4
5
6
0 2 4 6 8 10 12 14
Feeding Length, FL (in.)
AST
M S
hrin
kage
X-r
ay L
evel
FD/T = 5.7X1.28 = 7.3FD/T = 5.7X0.9x1.28 = 6.56FD/T = 8X1.28 = 10.24Foundry AGA (6 plates)Foundry A (6 plates)Mean X-ray Level +/- 1 Standard Deviation
DR
WFL
L
W/T = 8
3
12
21
1
1
1
Feed
ing
Dis
tanc
e fo
r 200
ºC s
uper
heat
, min
Ny
= 0.
7
Feed
ing
Dis
tanc
e fo
r 102
5, 2
00 ºC
sup
erhe
at, m
in N
y =
0.1
Feed
ing
Dis
tanc
e fo
r 200
ºC s
uper
heat
, min
Ny
= 1.
0
CW-12MW (12 PLATES)
Rule development – CW-12MW

0.4
1.251.5
5
-1
0
1
2
3
4
5
6
0 0.2 0.4 0.6 0.8 1 1.2 1.4 1.6 1.8 2 2.2 2.4
Minimum Ny Value, (K1/2s1/2mm-1)
AST
M S
hrin
kage
X-r
ay L
evel
Series6Series3Ny = 0.7Foundry AGA (8 PLATES)Foundry ST (6 PLATES)Mean X-ray Level +/- 1 Standard Deviation
DRW
FL
L
1
1 1
1
1 1 1
1
3
M-30C & Monel-35-1 (14 PLATES)
3
W/T = 8
Rule development – M-35-1

Rule development – M-35-1
1
2
3
4
5
6
7
8
9
10
11
1 2 3 4 5 6 7 8 9 10 11 12 13 14 15
Width to Thickness Ratio, W/T
RZL
/T, E
ZL/T
and
FD
/T
All simulations shown used furan sand mold, 108 ºF (60 ºC) superheat
M-35-1 feeding distance (FD/T ) with min. Ny = 0.7
AISI 1025 feeding distance (FD/T ) with min. Ny = 0.1
M-35-1riser zone length
(RZL/T)
M-35-1riser zone length

0.4
1.5
5
1.25
-1
0
1
2
3
4
5
6
0 2 4 6 8 10 12 14
Feeding Length, FL (in.)
AST
M S
hrin
kage
X-r
ay L
evel
FD/T = 8X1.3X0.773X0.976 = 7.44FD/T = 8X1.3X0.773X0.976 = 7.44FD/T = 8X1.3 = 10.4Foundry AGA M-30C (8 plates)Foundry ST M-35-1 (6 plates)Mean X-ray Level +/- 1 Standard Deviation
DR
WFL
L
W/T = 8
3
2 1
1
3
1
3
Feed
ing
Dis
tanc
e fo
r 102
5, 2
10 ºC
sup
erhe
at,
min
Ny
= 0
.1
Feed
ing
Dis
tanc
e fo
r 210
ºC s
uper
heat
, m
in N
y =
0.7
M-30C & Monel-35-1 (14 PLATES)
Feed
ing
Dis
tanc
e fo
r 210
ºC s
uper
heat
, m
in N
y =
1.0
Rule development – M-35-1

1 1
0
0.4
-1
0
1
2
3
4
5
6
0 2 4 6 8 10 12 14
Feeding Length, FL (in.)
AST
M S
hrin
kage
X-r
ay L
evel
FD/T = 8X1.15 = 9.22Foundry AGA (7 plates)Foundry W (6 plates)Mean X-ray Level +/- 1 Standard Deviation
DR
WFL
L
W/T = 8
CZ-100 (13 PLATES) 33
23 2
Feed
ing
Dis
tanc
e fo
r 102
5, 1
35 ºC
sup
erhe
at, m
in N
y =
0.1
Rule development – CZ-100 not possible!

2
3
4
5
6
7
8
9
10
11
12
1 2 3 4 5 6 7 8 9 10 11 12 13 14 15
Width to Thickness, W/T
Feed
ing
Dis
tanc
e to
Thi
ckne
ss, F
D/T
All with conditions:1”=T=12”Furan sand
M-35-1 min Ny = 1.0, 150C superheat
CN-7M min Ny = 1.0, 150C superheat
CW-12MW min Ny = 1.0, 150C superheat
AISI 1025 min Ny = 0.1, 60C superheat
AISI 1025 min Ny = 0.1, 150C superheat
Comparison of Feeding Distances

C = -0.1502Ln(Ny) + 0.6579R2 = 0.9951
0.4
0.5
0.6
0.7
0.8
0.9
1
0.1 0.2 0.3 0.4 0.5 0.6 0.7 0.8 0.9 1 1.1 1.2 1.3 1.4 1.5 1.6 1.7 1.8 1.9
Minimum Ny value
Coe
ffici
ent
Soundness MultiplierC&LA and High Alloy Steel: radiographically sound!
CN-7M, CW-12MW, M-35-1Level 1 Sound (Level 0)
No degradation in ductility properties (Griffin, UAB)
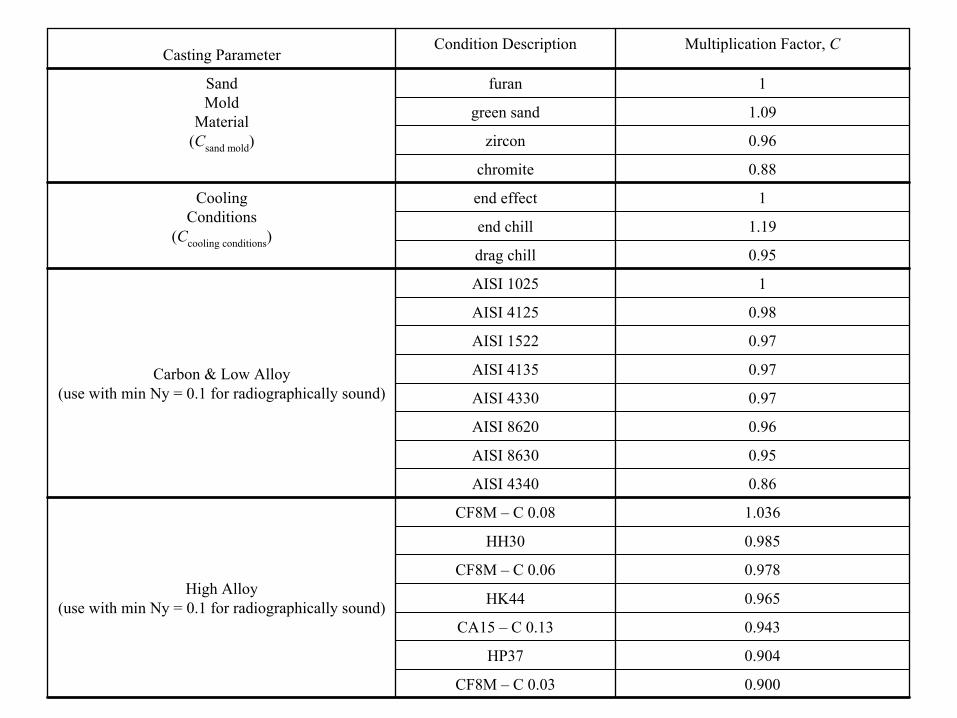
0.900CF8M – C 0.03
0.904HP37
0.943CA15 – C 0.13
0.965HK44
0.978CF8M – C 0.06
0.985HH30
1.036CF8M – C 0.08
High Alloy (use with min Ny = 0.1 for radiographically sound)
0.86AISI 4340
0.95AISI 8630
0.96AISI 8620
0.97AISI 4330
0.97AISI 4135
0.97AISI 1522
0.98AISI 4125
1AISI 1025
Carbon & Low Alloy (use with min Ny = 0.1 for radiographically sound)
0.95drag chill
1.19end chill
1end effectCoolingConditions
(Ccooling conditions)
0.88chromite
0.96zircon
1.09green sand
1furanSandMold
Material(Csand mold)
Multiplication Factor, CCondition DescriptionCasting Parameter

0.561.8
0.661.0
0.7330.7
0.840.3
0.900.2
10.1
Min Ny Value
1.38250°C (450°F)
1.18150°C (270°F)
1.12120°C (216°F)
1.0690°C (162°F)
160°C (108°F)
0.9430°C (54°F)
Superheat(Csuperheat)
0.925CN-7M
0.976M-35-1
0.979CW-12MWHigh Ni Alloy
(use with min Ny = 1.0 for radiographically sound)

Riser Rule Verification: CN-7MHR/DR = 1DR = 3.48”
HR/DR = 1.5DR = 3.04”
Plate 1”x8”x19”, central/top riser, furan sand, 150 ºC superheat
Riser volume is calculated using C&LA rule!

Riser Rule Verification: CW-12MWHR/DR = 1DR = 3.48”
HR/DR = 1.5DR = 3.04”
Riser volume is calculated using C&LA rule!
Plate 1”x8”x19”, central/top riser, furan sand, 150 ºC superheat

Riser Rule Verification: M-35-1HR/DR = 1DR = 3.48”
HR/DR = 1.5DR = 3.04”
Riser volume is calculated using C&LA rule!
Plate 1”x8”x19”, central/top riser, furan sand, 150 ºC superheat

Riser Rule Verification: CZ-100HR/DR = 1DR = 3.48”
HR/DR = 1.5DR = 3.04”
Riser volume is calculated using C&LA rule!
Plate 1”x8”x19”, central/top riser, furan sand, 150 ºC superheat

Summary • Thermophysical property databases developed for use in casting
simulation: – 3 nickel-base alloys: CW-12MW (Hastelloy), Monel-35-1, CZ-100– Austenitic stainless steel: CN-7M
• Quantitatively related Niyama predictions to radiographic quality in plate castings (e.g., Ny=1.0 is radiographically sound), except for CZ-100.
• Developed feeding rules (i.e., equations for the feeding distance as a function of section geometry, casting conditions, and quality level).
• Verified that riser size equation for C&LA steel works for high-nickel alloys.

• This work was prepared with the support of the U.S. Department of Energy (DOE) Award No. DE-FC36-02ID14225
• We would like to thank the participants of the casting trials:– A.G. Anderson– Ancast– Southern Alloy– Stainless Foundry & Engineering– Wollaston Alloy
• We would particularly like to thank Vasile Ionescu and A.G. Anderson, for helping to organize and carry out the thermocouple trials
• We are very grateful to Malcolm Blair and Raymond Monroe for their input, as well as their assistance in recruiting participating foundries
Acknowledgements

171
Appendix D:
Riser Pressurization for Increased Feeding Distance and Improved Casting Yield
1. Introduction The application of increased force on liquid feed metal during solidification assists feeding and reduces porosity in castings. The force on the liquid feed metal can be increased in a number of ways: for example by using centrifugal acceleration, or by pressure as in the case of squeeze casting. There is substantial evidence in the literature that even relatively low pressures can provide great improvements in feeding distances in castings and casting soundness [1-11]. It is an open question as to how much pressure is necessary to improve feeding and casting soundness, and to what degree and under what circumstances feeding and soundness can be improved. Also, a safe and effective means of pressurizing the riser must be devised, and issues surrounding the practical application of pressure on the shop floor need to be tackled. One of the most important issues to be addressed is determining when pressure may be applied to the riser and the magnitude of the applied pressure. This “pressure scheduling” must be determined so that the applied pressure is large enough to be beneficial yet safe, and not so high as to rupture the casting or riser. In previous casting trials with Harrison Steel Castings Company [1], pressure was applied to the liquid steel in a riser to demonstrate that a pressurized riser is able to feed a greater distance than a riser operating under normal atmospheric pressure. Argon was used as the pressurization gas. The primary goal of this trial was to experiment with the method, to determine a simple, safe and reliable method which could be used to apply pressure to risers to enhance their feeding. Several configurations were tested to apply the pressure in these casting trials. The trial demonstrated the capability to maintain pressure tightness and to deliver the desired force on the surface of the liquid steel in the riser. There was clear evidence that the technique can increase casting soundness by forcing liquid feed metal over remarkable lengths to feed centerline shrinkage in the 3" x 6" plates cast. Riser pressures in the 15 to 28 psig range were sustained. It was found that the riser feeding zone length can be extended by a factor of at least 4 with a casting soundness rated at ASTM radiographic testing Class 1. It was determined that a special pressure cap is not necessary to achieve good pressure tightness. Proper sealing of the pressurization tube can be achieved using the solidifying steel “shell” of the riser alone. However, this sealing between the pressurization tube and the riser metal is all important. An adequate time delay must be used before pressure is applied; here it was found that when the minimum surface solid fraction is about 0.7 (determined by simulation), pressure can be applied without rupturing the surface of the casting or mold penetration. A number of questions remained following the preliminary trials. It was hoped that these could be answered by additional trials. The foremost questions were: how much sounder can a casting

172
be made by the technique, and at what solid fractions and pressures is the technique effective? Plates were produced with pressurization that had ASTM radiographic Class 1 rating, meaning a small level of porosity was found. However, all plate lengths cast exceeded the rule feeding distance (distance over which a standard riser is able to feed a casting and still produce a sound casting) by a considerable amount, and therefore would have been expected under normal (unpressurized) circumstances to have a large amount of shrinkage porosity. Comparing simulations with the trial results, it was determined that pressures in the range tested (2 to 28 psig) can force liquid metal through centerline solid fractions in the 0.5 to 0.7 range, producing plates of ASTM Class 1 soundness.
In the current project, a new computer model developed by our research group that includes the physics of the pressure-forced liquid flow in the mush was used to study the effect of pressure on feeding steel castings and porosity formation. The model has been implemented for use by researchers of this project in a customized module in the commercial casting simulation software MAGMAsoft. In this Appendix, a case study is presented using a test casting geometry proposed by The Falk Corporation. This geometry was chosen for simulation because it is simple yet similar to castings to which the method might be applied at Falk. Unfortunately, because of the cost involved, they have never been able to conduct the casting trial we had planned. No steel foundry was able to execute further trials using riser pressurization during the project due to time and production constraints. The results of this simulated case study are shown in the following section. Fortunately, additional riser pressurization casting trials were able to be conducted using castings produced from a nickel-aluminum bronze alloy. These casting trials and simulations were performed as part of project work initiated by Mr. Russell S. (Steve) Fielder from the Naval Surface Warfare Center, Carderock Division, and it was jointly sponsored by MANTECH funds from the Office of Naval Research, and by the Virginia Class Submarine R & D manager, NAVSEA PMS 450. Through this cost sharing and sponsorship we were able to conduct several casting trials and perform practical applications of the method, and were able to investigate this technique to an extent far beyond what was envisioned in this CMC project. This research enabled us to continue development of the method and participate in casting trials, and complete the research on pressurized risers that was planned for this project. As a result, only a small part of the resulting effort was supported by this CMC project, and unfortunately all the details of these trials cannot be presented in this report. However, our general findings and the important outcomes from those trials will be presented here in Section 3. The casting trials that were conducted and the lessons learned allowed us to complete the planned research. 2. Results of Case Study Using Simulation The current solidification model commercially available in MAGMAsoft does not model pressure-assisted feeding and the physics related to it, such as: pressure driven liquid flow, nucleation and growth of gas porosity, shrinkage porosity formation and shrinkage driven flow in the mush. However, algorithms have been implemented in MAGMAsoft through a special module that allows us to simulate these effects.

173
Using this capability, a case study configuration was run for The Falk Corporation to prepare for casting trials they would perform for the project. The case study configuration is shown in Figure 1. Results from the model indicate that a large region of porosity, greater than 3% by volume, will form in the casting without pressurizing the riser, as shown in Figure 2. The model includes the effects of dissolved gas in the liquid. While including gas in the simulation is not necessary to predict shrinkage porosity, including it in the simulation results in a more realistic prediction of the amount of porosity formed. In this case study, 100 ppm of nitrogen was used throughout. Shown in Figure 3 are the results of the case study with pressurization of the riser to 5 bar of gage pressure. The maximum porosity level in the casting is seen to decrease by a factor of 10 to about 0.35% with pressurization. In Figure 3, the same horizontal cross-section through the casting is shown as in Figure 2, along with the same porosity scale for comparison. Next, simulations were run at an extremely high pressure—higher than would ever be practical to apply—by increasing the pressurization from 5 bar (72.5 psig) to 500 bar (7250 psig) to test a limiting case of applied pressure. This result is shown in Figure 4. It was found that porosity could not be completely eliminated from the casting for this configuration, and the maximum porosity level in the casting was not any less than when 5 bar of riser pressure was applied. This result agrees in trend with the observations of Taylor [4], who did not see much difference in the porosity reduction between riser pressures of 50 psig (about 3.4 bar) and 100 psig (about 6.9 bar) in his 1 inch thick plate trials. In examining the results with 5 bar of applied pressure, it was seen that no porosity forms until after the centerline is about 75% solid, as shown in Figure 5. This model still requires validation, but it has proven to be a useful tool in determining the effects of riser pressurization in steel castings. Another example of the application of this simulation tool can be found in [12], where a pressurized/non-pressurized plate pair from the previous casting trials [1] was simulated both with and without pressurization. Comparisons between simulation results and shrinkage visible on radiographs show that the simulation tool reasonably predicts the improvement in casting soundness that was seen in the experiments. Based on the initial work summarized here, the range of riser pressurization should probably be limited to pressures less than 60 psig (since higher pressures are probably of no additional benefit to casting soundness), and for safety during development and testing of the technique a maximum of 30 psig is recommended. 3. Results of Casting Trials for Nickel-Aluminum Bronze Arising from this work, the project team was approached to investigate applying riser pressurization to castings produced in Navy foundries. A series of casting trials were simulated, and resulted in lessons learned. A proprietary method of delivering pressure to the riser was devised, but the methods described in the open literature would also work [1,3-5,7,8]. Firstly, one important technical issue that must be addressed in using this technique in practice is pressure scheduling: knowing when to apply pressure and how much, after a shell of sufficient strength has formed near the casting surface. Hot spots near the surface will form in most castings, for example near risers and junctions. These regions are weak spots that may rupture during pressurization. One such spot is shown in the simulation output showing solid fraction at the surface in Figure 6. The spot is at the junction of the riser and plate. The project team developed a technique using simulation to eliminate such spots by placing small, relatively thin

174
chills at the locations of these weak spots. Use of this technique was then verified by subsequent trials. Simulations indicated that the use of less effective chilling action, by chromite sand for example, did not chill the surface sufficiently to remove the weak spots. The project team also found that simulation could be used to guide the determination of the pressure schedule. Successful trials such as that resulting in the radiographs without (Figure 7a) and with pressure (Figure 7b) indicate that the technique holds merit for additional investigation. The main issues to examine for future work are controlled experiments with simulations to examine: 1) the strength and pressure tightness of the solidifying steel shell in various mold materials, and 2) the ability of the pressure to force liquid metal to feed through partially solidified steel. Although a substantial amount of qualitative knowledge has been developed regarding riser pressurization, it is still not known with engineering certainty, how far, through what solid fractions, and at what pressures liquid feed metal can be forced to prevent porosity from forming. 4. Summary Based on our experience and the literature surveyed, the advantages and disadvantages of using riser pressurization are summarized below.
Advantages and Reasons to Develop and Study Pressure-Assisted Feeding: • Improved yield from increased feeding distance and reduced number of risers,
yield increase of 30% reported in the literature. • Reduced cleaning room time and cost can result. • Castings can be appreciably more sound and perform better as a result. • Required equipment is relatively inexpensive, in most cases already in-house. • Offers a solution for difficult "tall" castings with large vertical dimensions that
gravity driven risers cannot adequately feed. • Trials will also provide data on physical mechanisms of feeding and the effect of
pressure on feeding.
Disadvantages and Problem Areas in Pressure-Assisted Feeding: • Cannot assist in feeding a thick section through a thin one. • If a leak forms in the riser pressurization system, the gas/air might act as a cooling
agent in the riser; therefore the riser must be properly sealed. • Metal skin around casting must be sufficiently strong to contain pressure. In
particular, weak partially solidified regions at the casting surface near parting lines must be made sufficiently strong (through small chills, for example) to contain pressure.
• Successful application of pressurization depends upon: rate of pressure increase and pressurization schedule, size and shape of casting, position of risers, gating system, rate of mold filling.
• Our findings agree with Taylor's 1961 SFSA report [4] that says centerline shrink cannot be completely eliminated (only minimized) for very long feeding distances.
• Technique is probably not 100% reliable when used without experience and/or simulation to design the correct pressurization schedule.

175
Consider also that simulations using low alloy steel having a relatively narrow (approximately 50°C) freezing range indicate that such metals naturally form a shell capable of containing pressure. The simulations also indicate that thicker casting sections form better shells capable of containing higher pressures, and having longer time periods available to apply the pressure. This makes larger castings ideal candidates for the method. Unfortunately, these are the most expensive castings to produce, and the least desirable to use for casting trials. To alleviate the hesitancy to experiment with the technique in an industry setting, it should be pointed out that our experience with the nickel-aluminum bronze casting trials shows that riser pressurization will not result in a less-sound casting than would be produced by a non-pressurized riser. Hence, there appears to be no down side to experimenting with the technique. It is hoped that this realization will convince foundries to experiment with the technique in casting trials in the future on production castings. Despite the disadvantages, riser pressurization is used in production settings [13]. This indicates that its difficulties in application can be overcome. References [1] Hardin, R., Hays T. and Beckermann, C., “Pressurized Riser Casting Trials,” in Proceedings of the 55th Technical and Operating Conference, SFSA, Chicago (2001). [2] Berry, J.T., Luck, R., Zhang, B. and Taylor, R.P, The Effect of Applied Pressure During Feeding of Critical Cast Aluminum Alloy Components with Particular Reference to Fatigue Resistance, Final Report on Cast Metals Coalition Project Supported by the United States Department of Energy, June 2003. [3] S. T. Jazwinski and S. L. Finch, "A New Method of Feeding Applied to Castings Made in Static Moulds", Foundry Trade Journal, Nov. 29-Dec. 6, p. 269, 1945. [4] Taylor, H.F., "The Pressure Feeding of Steel Castings at Pressures Higher than Atmospheric Pressure", Final Report on SFSA Research Project No. 20, SFSA, 1948. [5] C. W. Briggs and H. F. Taylor, "Feeding of Castings at Greater-than-Atmospheric Pressures", Proc. Inst. Brit. Foundrymen, 1953, 46, A. 207. [6] D. R. Kononow, "Compressed Air Risers", Hochwertiger Stahlguss, V.E.B. Verlag Technik, Berlin, p. 63, 1955. [7] W. P. Desnizki, "The Application of Risers with High Atmospheric Pressure", Iron & Steel, Feb., p.51, 1958. [8] Advertisement, Foundry Trade Journal, Mar., p. 15, 1957. [9] Berry, J.T., and Watmough, T., "Factors Affecting Soundness in Alloys with Long and Short Freezing Range", AFS Transactions, vol. 69, p. 11-22, 1961.

176
[10] J. R. Shenefelt, R. Luck, and J. T. Berry, "The Case for Riser Pressurization", 1st International Conference on Gating, Filling and Feeding of Aluminum Castings, Oct 11-13, Nashville, TN, pp. 227-237, 1999. [11] Berry, J.T., and Taylor, R.P., "Improving Casting Performance by Extending Feeding Action in Long-Freezing Range Cast Aluminum Alloys", AFS Transactions, vol. 107, p. 203-206, 1999. [12] Carlson, K.D., Lin, Z., Hardin, R.A., Beckermann, C., Mazurkevich, G., and Schneider, M.C., "Modeling of Porosity Formation and Feeding Flow in Steel Casting," in Modeling of Casting, Welding and Advanced Solidification Processes X, eds. D.M. Stefanescu et al., TMS, Warrendale, PA, 2003, pp. 295-302. [13] Aagaard, R., Schaefer, W., Hansen, P.N., and Rasmussen, N.W., "Active Feeding of Ductile Iron Castings", Modeling of Casting, Welding, and Advanced Solidification Processes - IX, Edited by Sahm, Hansen, and Conley, Shaker Verlag, 2000, pp. 861-867.

177
Top Viewof
Ring Casting
Ring casting:265" OD233" ID
Riser:36" D by 36" H
37.5" high
Quarter Symmetry View
of Simulation Mesh
Top Viewof
Ring Casting
Ring casting:265" OD233" ID
Riser:36" D by 36" H
37.5" high
Riser:36" D by 36" H
37.5" high
Quarter Symmetry View
of Simulation Mesh
• No Pressure is applied
– Nitrogen Gas at 100 ppm
• Maximum Porosity at about 3%
• No Pressure is applied
– Nitrogen Gas at 100 ppm
• Maximum Porosity at about 3%
Figure 1 Quarter section of “ring” casting simulated for the Falk Corporation as a pressurized riser case study
Figure 2 Porosity volume for case study simulated without pressure, nitrogen gas used at 100 ppm. Maximum porosity of about 3% observed in section.
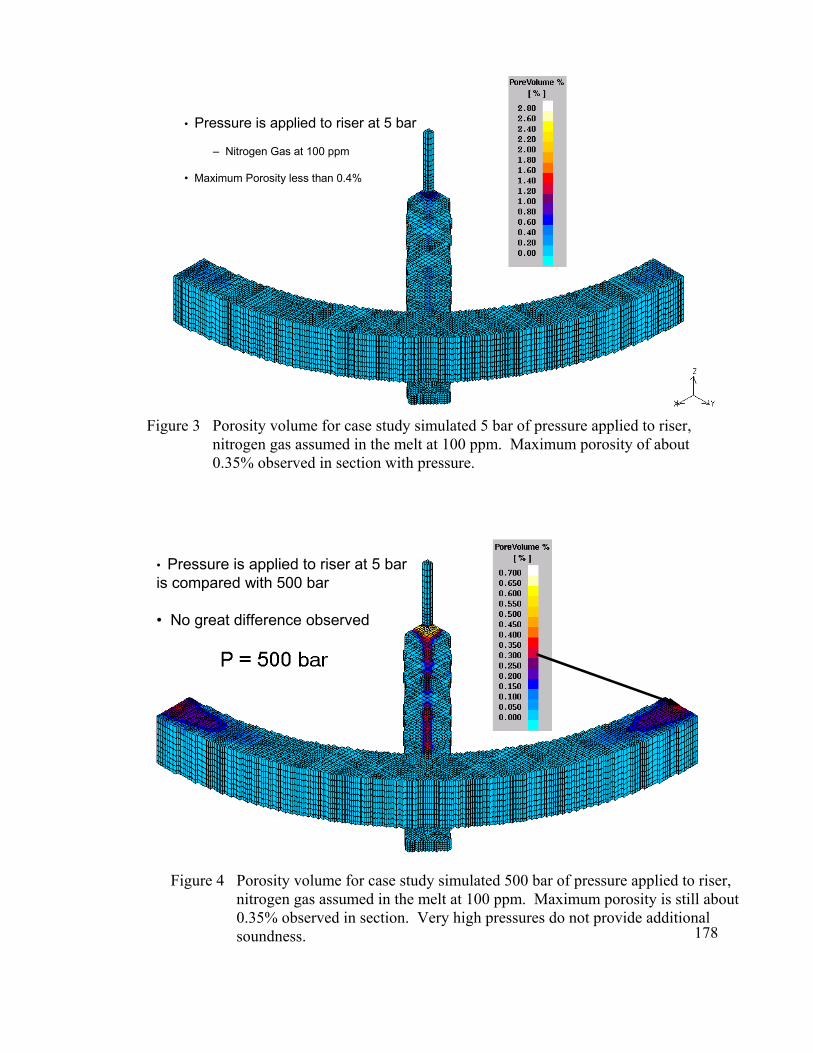
178
• Pressure is applied to riser at 5 bar
– Nitrogen Gas at 100 ppm
• Maximum Porosity less than 0.4%
• Pressure is applied to riser at 5 bar
– Nitrogen Gas at 100 ppm
• Maximum Porosity less than 0.4%
Figure 3 Porosity volume for case study simulated 5 bar of pressure applied to riser, nitrogen gas assumed in the melt at 100 ppm. Maximum porosity of about 0.35% observed in section with pressure.
• Pressure is applied to riser at 5 bar is compared with 500 bar
• No great difference observed
• Pressure is applied to riser at 5 bar is compared with 500 bar
• No great difference observed
Figure 4 Porosity volume for case study simulated 500 bar of pressure applied to riser, nitrogen gas assumed in the melt at 100 ppm. Maximum porosity is still about 0.35% observed in section. Very high pressures do not provide additional soundness.

179
• Pressure is applied to riser at 5 bar
• Centerline is about 75% solid
• Porosity forms after this stage
Solid Fraction at 90% Solid
Figure 5 Solid fraction through horizontal section of case study casting at time when the entire casting system is 90% solidified. Simulation is performed with 5 bar pressure applied to riser, nitrogen gas assumed in the melt at 100 ppm. No porosity had formed yet, with pressure porosity forms much later than without.

180
• Weak Spot at Location of Rupture
• Weak Spot at Location of Rupture
Figure 6 Solid fraction distribution at the casting surface of a nickel-aluminum bronze pressurized test casting simulation at 55% solid. Plate is 10” wide by 6” thick by 46” long. A weak spot, of about 50% solid fraction, was found to correspond with the location of a breakout (or rupture) of the casting when pressurized to 50 psi.

181
Figure 7 Example radiographs of 10” wide x 6” thick nickel-aluminum bronze plates (a) cast without pressure, (b) casting with pressurized riser at 50 psig.
(a)
(b)

182
APPENDIX E: TILT POUR TRIALS AND ANALYSIS
Bob Bryant1, Kent D. Carlson2, Shouzhu Ou2, Christoph Beckermann2
1 Matrix Metals Keokuk Facility (Keokuk Steel Castings) Keokuk, Iowa 52632
2 Department of Mechanical and Industrial Engineering
The University of Iowa, Iowa City, Iowa 52242
Abstract
The use of tilting molds in steel casting to reduce inclusion severity is investigated through a series of plate casting trials. In the tilting molds used for these casting trials, metal is initially poured into a holding basin in the mold and held for several seconds, in order to allow reoxidation inclusions that form during pouring to grow and float to the top of the basin. Then the entire mold is tilted to transfer metal from the holding basin into the casting cavity. Filling a casting cavity through tilting rather than by using standard pouring and gating techniques transfers the metal with less turbulence and splashing, thus reducing air entrainment. By reducing air entrainment, less oxygen is brought into contact with the metal, and hence fewer reoxidation inclusions form. Since reoxidation inclusions constitute a significant portion of the total inclusion population, this significantly reduces the overall severity of inclusions in the casting. In the casting trials described here, plates were cast with tilting molds as well as with standard molds using typical gating, for comparison. The cope surfaces of all plates were machined and the inclusions were counted. It is found that the tilting mold technique used in this work can substantially reduce inclusion severity, compared to standard techniques.

183
Introduction
The removal of oxide inclusions from castings and the subsequent repair of those castings are expensive and time consuming procedures. Svoboda et al. [1] estimated that twenty percent of the cost of producing castings is due to the removal of inclusions and the repair of the resulting defect areas with weld metal. Inclusions that remain in the casting adversely affect machining and mechanical performance, and may cause the casting to be rejected for failing to meet the radiographic standard requirements specified by the customer regarding allowable inclusion severity. In light of this, it is in the best interest of the steel casting industry to pursue the development of casting methods capable of reducing the quantity of oxide inclusions in castings.
Reoxidation inclusions, which form when deoxidized steel comes into contact with oxygen during mold filling, make up a substantial portion of the inclusions found in steel castings. Griffin and Bates [2] estimated that 83% of the macro-inclusions found in low-alloy steel castings are reoxidation inclusions, as are 48% of those found in high-alloy steel castings. The primary source of oxygen in reoxidation inclusion formation is air, which contacts the metal stream during pouring and the metal free surface in the mold cavity during filling. Since contact between the metal and air during filling is the primary source of reoxidation inclusions, several techniques have been developed to minimize this contact. Two examples of this are the use of thin, flat runners and tapered downsprues. Thin, flat runners provide minimal surface area between metal and air, and tapered downsprues entrain less air because they quickly fill (and stay full) during pouring.
Another idea that has not been widely implemented is that of pouring the metal into a reservoir located in the mold, and then tilting the mold to transfer the metal from the reservoir into the casting cavity. This idea was first proposed in 1916 by Durville [3], for the production of ingots. His idea further stated that the pouring-out surface of the reservoir and the pouring-in surface of the casting should lie along a straight line. That way, when tilting is performed, the metal free surface remains horizontal as metal is transferred smoothly from the reservoir into the casting cavity (see Figure 1). Transferring metal in this manner eliminates the excessive turbulence and splashing that occur during pouring, both of which lead to air entrainment and the mixing of oxide inclusions into the melt.
Several other people have since filed patents using similar mold tilting techniques. Seaton and Seaton [4] patented an assembly-line procedure for Ford Motor Company in which a nozzle is connected to the bottom of a mold cavity to fill it with metal (thus gaining the advantages of a smooth, quiescent bottom fill); once filling is complete, the mold is rotated 180° and allowed to solidify. The benefit to this procedure is that, once the mold is rotated, the filling nozzle is on top of the mold. It can then be disconnected and re-connected to the next mold in the line, without having to wait for the first casting to solidify. Kahn and Kahn [5] patented a procedure in which they also bottom-fill a mold, rotate it 180° and allow it to solidify. However, they add two new elements: (1) to prevent oxidation, they use a sealed system with a “protective gas” (most likely an inert gas such as argon) to prevent contact with oxygen, and (2) once the mold is rotated, they pressurize the system, to improve the casting soundness. An additional benefit to

184
Figure 1 Figures illustrating the mold tilting process. The progression of mold tilting is shown
in Fig. 1 – Fig. 6. Reproduced from Durville [3].
these mold tilting ideas is that the need for gating can be drastically reduced or even eliminated; the designs by Seaton and Seaton [4] and Kahn and Kahn [5] allow the metal to flow into the casting cavity through the risers. Reduction or elimination of gating will improve casting yield.
Although several researchers have investigated the idea of mold tilting, no literature was found that quantified the difference that this technique makes with regard to oxide inclusions. In addition, while the idea of mold tilting has been applied in industry for large-scale aluminum castings, it has not been utilized in the steel casting industry on a scale smaller than ingots. The purpose of this study is to determine if mold tilting is a worthwhile technique for production castings in the steel casting industry. This is accomplished by developing a mold tilting system, producing castings with both the new mold tilting system and using a standard gating system, and then comparing the resulting castings to determine to what degree a mold tilting system can

185
reduce oxide inclusion formation. It should be noted that this project is ongoing, and therefore this paper is not a final report on mold tilting; it is only intended to describe the casting trials and to summarize the preliminary findings.
Tilting Mold Development
The preliminary design concept for the mold tilting trials uses the basic idea of the Durville process [3], with several variations made for practical reasons. The mold was developed with a vertical parting line (see Figures 2(a) and 2(b)), and was designed to rotate 90° (rather than 180°) to deliver the metal from the receiving basin to the casting cavity, as shown in Figures 2(c) – 2(e). The receiving basin is lined with an exothermic sleeve and a piece of refractory board on the bottom, to insulate the metal and prevent it from freezing before it is delivered to the casting cavity. A wide, thin plate shape (1”T x 10”W x 12”L) was chosen for the casting, in order to provide a large, uniform cope surface on which inclusions could easily be counted. For the purposes of tilting, the mold was designed with a hole through it. The idea is to insert a bar through the hole, and connect this bar to a tilting mechanism similar to that used to tilt pouring ladles.
In order to optimize the mold design before it was constructed, simulation was utilized. The Rotacast module of MAGMAsoft [6], which can simulate mold tilting, was used to predict the flow of metal from the holding basin into the casting cavity. Simulations were run using 1025 steel and no-bake (furan) sand with a variety of different mold designs and tilting times, and the geometry/tilting time combination that produced the lowest metal velocities throughout the tilting process was selected. A tilting time of six seconds was selected, with the geometry shown in Figure 3. This design includes an additional refractory plate (see Figures 3(a), 3(c) and 3(d)), which was added to create a t-pot basin, to prevent any slag that forms on the surface of the holding basin from entering the casting cavity during tilting. Velocity contours for this geometry at several times during tilting are shown in Figure 4. Note that, even though tilting only takes six seconds, it takes eight seconds for the metal to flow to its final position. With this design, the maximum velocity is less than 50 cm/s for most of the tilting process, reaching as high as about 70 cm/s from 5.5 – 6.0 seconds after the start of tilting. If tilting is not used, the maximum velocity during pouring is around 165 cm/s. Thus, a significant reduction in velocity (and turbulence and splashing) results from this tilting design.
Casting Trials
All of the casting trials discussed in this paper were performed at Matrix Metals Keokuk Facility (Keokuk Steel Castings). Chemical analysis was performed on a ladle sample from each heat used, and further chemical analyses were performed on metal samples from the holding basin and the resulting plate for each tilt mold plate produced. The cope surface of all plates (standard and tilt plates) was machined, removing 1/8 inch. After machining, inclusions were counted and the plates were radiographed and rated according to ASTM standards.

186
Figure 2 Sketches of the initial concept of the mold tilting trials. (a) and (b) show two views
of the mold, and (c) – (e) illustrate the tilting process.
Before beginning the casting trials, a couple of tests were performed to investigate tilting options and determine if the original concept would be able to produce the desired castings. Pictures of a test mold created to study tilting options are shown in Figure 5. Figure 5(a) shows the entire mold in the upright position necessary for basin filling, and Figure 5(b) shows half of the mold, so the inside can be seen. The exothermic sleeve was not used in this test mold, since it was not meant to be used for casting. Figure 5(b) also shows the location of a test coupon that
(c) (d) (e)
fill from ladle (< 100 lb pour
weight)
basin liner: - 6” exothermic sleeve - refractory bottom
casting: plate shape with top riser
3” square bar
vertical parting line
clamp together (b) (a)

187
was added for the casting trials, to allow chemical analysis of the metal in the basin. For illustrative purposes, Figure 6 shows four views of a casting that was produced in a test of the tilting procedure, prior to the first casting trials. This figure shows the thin shell of metal that remains around the pouring basin, as well as the channel through which the metal flows to travel from the basin into the plate cavity. The location of the insulating sleeve can be clearly seen in Figure 6(a). With respect to inclusions, the as-cast surface of the plate looks very clean. Figure 3 Design selected for the mold tilting trials: (a) cross-sectional view of the mold; (b)
isometric view of the pouring basin (with exothermic sleeve) and plate; (c) cross-sectional and (d) top views of the t-pot basin.
(a) (b)
parting lineexothermic
sleeve basin
bottom refractory
board
t-pot refractory board
cross-sectional view top view (c) (d)

188
Figure 4 Velocity contours at several times during a simulation with a tilt time of 6 seconds.
t = 0.25 s t = 0. 5 s t = 1.5 s
t = 2.5 s t = 3.5 s t = 4.5 s
t = 5.5 s t = 8 st = 6 s

189
Figure 5 Pictures of (a) complete mold and (b) half mold; this mold was created to test tilting
options.
First Trials For the first casting trials, performed in March 2003, three plates were cast with the tilting
procedure, and three plates were cast using a standard mold, with typical gating for such a casting (see Figure 7). In this set of trials, the refractory boards shown in Figure 3 (one to create a t-pot basin and one to insulate the bottom of the holding basin) were not used; in other words, all three tilt molds had a lip pour holding basin in the first trials. All plates (standard and tilt) were poured from the same ladle of the same heat. The alloy used in this set of trials was 1019 steel, which was poured at 2878°F. It should be noted that all molds for all the trials performed were made with no-bake sand.
Figure 8 shows the tilt molds prior to pouring. After consideration of different methods of tilting, it was decided to use a very simple manual procedure for tilting in these proof-of-concept trials, and to worry about developing a more sophisticated method once it had been demonstrated that the process was a worthwhile method of casting. To that end, long boards were clamped onto either side of the tilting molds; after the holding basin in the mold was filled, a foundryman used the boards to manually lower the mold from the upright position shown in Figure 8 to the horizontal position shown in Figure 9.
Table 1 gives a summary of the important features of the first casting trials. Note that the pouring time was not measured for the tilt molds. The tilting times were all between seven and eight seconds. All six plates had significant ASTM x-ray shrinkage levels—this was not surprising, since the feeding length for the plate geometry exceeded the feeding distance of the riser; the focus was more on creating a large cope surface than on producing sound plates. In
Test block addedhere for chemicalanalysis of basin
sleeve around basin notused in this test mold,
but was used in 1st trials
(a) (b)

190
Figure 6 Four views of a test tilt casting.
addition to significant x-ray shrinkage indications, two of the three standard plates also had x-ray inclusion indications (B1 and B2); none of the tilt plates had inclusion indications. Examining the inclusion counts, however, there is no significant difference between the tilt plates and the standard plates. The inclusion counts shown in Table 1 were obtained by drawing one-inch circles around groups of inclusions on the machined surface of each plate, until all visible inclusions were encompassed within a circle. The number of circles is then taken as the inclusion count. Examples of inclusion counts are shown in Figure 10(a) for a standard plate, and in Figure 10(b) for a tilt plate.
(a)
(c)
(d)
(b)

191
Table 1 Summary of results from the first casting trials.
1st Trials - 1019 steel, Tpour = 2878°F - all plates poured from same heat, same ladle
Plate
Pour Time
(s)
Tilt Time
(s) Inclusion
Count
ASTM X-ray
Shrinkage Rating
ASTM X-ray
Inclusion Rating
ASTM X-ray
Porosity Rating
Tilt #1 8 6 CD4 - A1 Tilt #2 7 7 CD4 - A1 Tilt #3 8 7 CD5 - - Standard #1 8 n/a 5 CA2 B1 - Standard #2 7 n/a 5 CA3 B2 A1 Standard #3 7 n/a 8 CA3 - -
Figure 7 Gating diagram for standard mold plates.
One possible explanation for the lack of reduction in the inclusion counts between the tilt and standard plates is that perhaps the inclusions that were counted in the tilt plates, such as those seen in Figure 10(b), were actually not inclusions, but rather part of the extensive shrinkage that occurred in the casting (all the tilt plates had ASTM shrinkage levels CD4 or CD5). This idea is supported by the fact that no inclusions were seen on the radiographs. In any case, the tilt casting process was analyzed after little difference was seen in the inclusion counts between the tilt and standard plates. It was determined that a potentially important step was missing from the process. For each tilt mold, after the holding basin was filled, the mold was immediately tilted. This did not allow time for inclusions formed during the filling of the holding basin to grow and float to the top of the basin, forming a small slag layer there. Thus, any inclusions created during
4”φ x 6”H riser
1”T x 10”W x 12”L plate
1.25” x 0.5” drag runner
2.25”φ x 1.5” sprue well
1”φ sprue

192
Figure 8 Tilting molds ready for pouring during first trials. Figure 9 A tilting mold after pouring and tilting.
(b)(a)

193
Figure 10 Examples of machined plate surfaces from first casting trials for (a) a standard plate
and (b) a tilt plate, showing 1” inclusion count circles.
the filling of the holding basin were still in the melt, and were swept into the casting when it was tilted. It was decided that, in the next set of trials, a holding time would be introduced after pouring and before tilting, in order to allow inclusions time to float to the surface of the melt.
(b)
standard plate
tilt plate
(a)

194
Finally, Table 2 summarizes the chemical analysis for the first tilt plate. Samples of metal were taken from the ladle, from the holding basin (using the test coupon shown in Figure 5) and from the plate. Note the increase in nitrogen and oxygen between the ladle and the basin; this shows the increase of gases taken from the air during pouring. The oxygen level then drops considerably between the basin and the plate, likely due to the formation of oxides.
Table 2 Chemical analysis for Tilt Plate #1.
Element (wt %)
Test Bar from… C Mn Si Ni Cr Mo Al
Ladle 0.199 1.06 0.53 0.09 0.16 0.08 0.0435 Basin 0.192 1.06 0.53 0.08 0.15 0.08 0.0467 Plate 0.195 1.07 0.54 0.08 0.15 0.08 0.0453
Element (wt %)
Test Bar from… P S Fe Cu N O
Ladle 0.019 0.026 97.61 0.121 0.0079 n/a Basin 0.019 0.029 97.61 0.122 0.0107 0.0225 Plate 0.020 0.027 97.60 0.118 0.0103 0.0122
Second Trials For the second tilting trials, performed in May 2003, the holding time mentioned above was
added for the tilt plates, to allow inclusions to float out of the holding basin after pouring. A holding time of fifteen seconds was planned for all three tilt plates. In addition, the three tilt plates had slight variations in their mold arrangements: the mold for tilt plate #1 used a refractory board to insulate the bottom of the holding basin, but did not use one to create a t-pot basin (i.e., it was a lip pour basin, as in the first trials); the mold for tilt plate #2 used refractory boards both to insulate the bottom and to create a t-pot basin; the mold for tilt plate #3 did not use a refractory board to insulate the bottom of the basin, but did use one to create a t-pot basin. As in the first trials, three plates were also cast using a standard mold and gating, for comparison. All plates were again poured from the same ladle of the same heat. The alloy used in this set of trials was 4318 steel, which was poured at 2836°F. It is worth noting that this turned out to be a dirty heat; this will be discussed later.
The second tilting trials are summarized in Table 3. The pour/tilt time column of the table indicates pouring time for standard plates and tilting time for tilt plates. The tilting time for all tilt molds was about six seconds. The planned holding time of fifteen seconds was achieved for the first two tilt plates, but because the second and third plates were poured in rapid succession, the foundryman tilting the plates did not finish tilting the second plate until the third plate had been held for nineteen seconds. Note that the inclusion counts for the standard plates are much higher than in the first trials (see Table 1), because this was a dirty heat. An example of the severity of the inclusions in the standard plates can be seen in Figure 11, which shows the machined surface of standard plate #1. A key result in Table 3 is that the inclusion count for tilt

195
plate #1 is significantly smaller than for any of the standard plates. This indicates that the tilt pour method does show promise in reducing inclusions. Both the as-cast and machined surfaces of tilt plate #1 are shown in Figure 12. Comparing Figures 11 and 12, it is evident that the tilt plate has a greatly reduced inclusion severity compared to the standard plate. A piece of slag is identified in the lower right portion of Figure 12(b). Even though this tilt plate, as well as all three tilt plates from the first trials, used a lip pour holding basin, the slag that formed in the basin was generally trapped in the gating rather than passing into the casting. The inclusion counts for tilt plate #1 and all three standard plates are shown in Figure 13. This figure clearly illustrates the improvement in the inclusion severity due to the tilting method. The radiographic and chemical analyses for the second trials have not yet been completed.
Table 3 Summary of results from the second casting trials.
2nd Trials - 4318 steel, Tpour = 2836°F
- all plates poured from same heat, same ladle → dirty heat!
Plate
Insulated Basin
Bottom?
T-pot / Lip Pour Basin?
Pour/Tilt Time (s)
Holding Time (s)
Inclusion Count Comments
Tilt #1 yes lip pour 6 15 5 Tilt #2 yes t-pot 6 15 n/a full of holes Tilt #3 no t-pot 6 19 n/a full of holes Standard #1 n/a n/a 5 n/a 17 Standard #2 n/a n/a 5 n/a 13 Standard #3 n/a n/a 5 n/a 18 Figure 11 Machined surface of standard plate #1 from second trials.

196
Figure 12 Tilt plate #1 from second trials: (a) as-cast surface; (b) machined surface. Figure 13 Machined plate surfaces for (a) tilt plate #1, and (b) all three standard plates, showing
1” inclusion count circles.
Unfortunately, the other two tilt plates (#2 and #3) turned out very poorly, due to an adverse chemical reaction between the metal and the refractory board that was used to create the t-pot basin. The bottom surface of each t-pot refractory board, around which the metal flowed when the mold was tilted, was cut to produce a board of the correct size; it was thought that the exposure of this uncoated surface of the refractory board to the metal is what produced the reaction. The resulting reaction produced a great deal of gas, which caused both of these plates
(b)(a)
slag near riser
(b)(a)

197
to pour short, and gave their machined surfaces a swiss cheese-like appearance. The as-cast and machined surfaces of these plates are shown in Figures 14 and 15. Figure 14 Tilt plate #2 from second trials: (a) as-cast surface; (b) machined surface. Figure 15 Tilt plate #3 from second trials: (a) as-cast surface; (b) machined surface.
Third Trials The reaction between the metal and the t-pot boards in the second trials made it clear that
another material would need to be used to create the t-pot basin. The new material selected was a section of a nine inch exothermic sleeve (see Figure 16). It was reasoned that the sleeve was coated, and that the metal in the holding basin was already in contact with an exothermic sleeve,
(b)(a)
(b)(a)

198
Figure 16 Top view of t-pot basin created using a section of a nine inch exothermic sleeve.
so this material should not create the same problems seen in the second trials. It was decided that the refractory board used to line the bottom of the holding basin was unnecessary, so the basin bottom refractory board was not used in these trials.
The third set of casting trials was performed in July 2003. There were three tilt plates for this set of trials: the mold for tilt plate #1 used a lip pour basin, and the molds for tilt plates #2 and #3 had t-pot basins. Only one standard plate was cast in these trials. All plates were again poured from the same ladle of the same heat. The alloy used in this set of trials was 1022 steel, which was poured at 2841°F. The original intent was to use a holding time of fifteen seconds for tilt plates #1 and #2, and ten seconds for #3. However, a difficulty that occurred during casting altered this plan somewhat. First of all, due to some re-arranging of the carts that held the tilting molds before pouring, the casting order was: tilt plate #3, tilt plate #2, tilt plate #1, standard plate. After tilt plate #3 was poured and held for ten seconds, and then tilted, there was difficulty keeping the mold on the cart. Because of this, it was jostled and moved around to slide it to a stable position on the cart, which took a few extra seconds. As a result, tilt plates #2 and #1 (which had already been poured) were subjected to holding times of twenty seconds each before they were tilted.
The results of the third trials are summarized in Table 4. Again, the pour/tilt time column records the pouring time for the standard plate, and tilting times for the tilt plates. The tilt time Table 4 Summary of results from the third casting trials.
3rd Trials - 1022 steel, Tpour = 2841°F - all plates poured from same heat, same ladle
Plate
Insulated Basin
Bottom?
T-pot / Lip Pour Basin?
Pour/Tilt Time (s)
Holding Time (s)
Inclusion Count Comments
Tilt #1 no lip pour 5 20 3 Tilt #2 no t-pot 5 20 n/a full of holes Tilt #3 no t-pot 20 10 n/a full of holes Standard #1 n/a n/a 5 n/a 5
parting line
piece of a 9” sleeve
6” exothermic sleeve

199
was about five seconds for tilt plates #1 and #2, and about twenty seconds for #3 (which can be broken into about eight seconds of tilting, and about twelve seconds of jostling and shifting to get the mold stable on the cart). The standard plate had an inclusion count of five, and tilt plate #1 had an inclusion count of three. Figures 17 and 18 show the as-cast and machined surfaces of the standard plate and tilt plate #1, respectively. Both machined surfaces (Figures 17(b) and 18(b)) look good. Figure 17 Standard plate from third trials: (a) as-cast surface; (b) machined surface.
Figure 18 Tilt plate #1 from third trials: (a) as-cast surface; (b) machined surface.
Unexpectedly, tilt plates #2 and #3 again had an adverse reaction between the metal and the t-pot board. As seen in Figures 19(b) and 20(b), the strong reaction again created a great deal of
(b)(a)
(b)(a)

200
gas, giving the machined surfaces a similar swiss cheese-like appearance (worse than in the second trials, in fact). It is interesting to note from Figures 19(a) and 20(a), though, that the as-cast surfaces of these plates look clean. The laplines visible in Figure 20(a) are the result of the difficulty encountered in lowering tilt mold #1 onto the cart; the shifting and jostling used to move the mold to a stable position on the cart created waves within the mold, which froze as the casting solidified. Figure 19 Tilt plate #2 from third trials: (a) as-cast surface; (b) machined surface.
Figure 20 Tilt plate #3 from third trials: (a) as-cast surface; (b) machined surface.
It was decided in hindsight that more than one standard plate should have been cast. Because only one of the three tilt plates turned out to be useful, it is difficult to draw any meaningful
(b)(a)
(b)(a)

201
conclusions from one tilt plate and one standard plate that have inclusion counts of three and five, respectively.
Conclusions
The tilting mold casting trials described in this paper indicate that filling a casting cavity with a tilting mold can indeed reduce the severity of reoxidation inclusion defects in steel castings. Particularly for the dirty heat used in the second casting trials, the plate produced by tilting had considerably fewer inclusion defects on the machined cope surface than did any of the three plates cast with a standard mold. It was found that a key element in the tilting process is to allow ten to twenty seconds of settling time after the tilt mold holding basin is filled from the ladle and before the mold is tilted, in order to allow reoxidation inclusions that form during pouring to float out of the melt before tilting is performed. Items of ongoing research include developing a t-pot basin that does not react with the melt, and developing a more automated tilting system. Once the process has been further refined, it will be applied to a production casting.
Acknowledgements
This work was prepared with the support of the U.S. Department of Energy (DOE) Award No. DE-FC36-02ID14225. However, any opinions, findings, conclusions, or recommendations expressed herein are those of the authors, and do not necessarily reflect the views of the DOE. We would like to thank the foundry workers at Matrix Metals – Keokuk for carrying out the casting trials described in this paper. We would also like to thank Malcolm Blair and Raymond Monroe of the SFSA for their helpful suggestions and guidance in this work.
References
[1] J.M. Svoboda, R.W. Monroe, C.E. Bates and J. Griffin (1987), “Appearance and Composition of Oxide Macroinclusions in Steel Castings,” AFS Transactions, Vol. 95, pp. 187-202.
[2] J.A Griffin and C.E. Bates (1991), “Ladle Treating, Pouring and Gating for the Production of Clean Steel Castings,” Steel Founders' Society of America Research Report No. 104, Technical Steering Committee Report.
[3] P.H.G. Durville (1916), “Apparatus for and Process of Casting Ingots of Metals and Alloys,” U.S. Patent Number 1,189,548.
[4] W.W. Seaton and G.W. Seaton (1992), “Rollover Method for Metal Casting,” U.S. Patent Number 5,163,500.
[5] F. Kahn and J. Kahn (1997), “Process and Device for Casting Components,” U.S. Patent Number 5,626,180.
[6] MAGMASOFT, MAGMA GmbH, Kackerstrasse 11, 52072 Aachen, Germany.

Appendix F:Progress Report -
Tilt Pour Trialsand Analysis
SFSA C&LA Research Review MeetingJune 14-15, 2004
University of Iowa

– Oxide inclusions cause serious problems in steel castings• about 20% of casting cost attributed to removing inclusions and
repairing casting with weld metal
– Most inclusions in steel castings are reoxidation defects
– Reoxidation inclusions caused mainly by reaction between deoxidized steel and air during pouring/mold filling
– Reoxidation inclusions:• start very small• rapidly increase in size• float to cope surface
Background & Motivation
1.4 mm

Tilt Pour Overview• Objective: Develop technique to tilt mold during filling to
reduce reoxidation inclusion severity– reduce splashing and air entrainment– less contact with air → fewer reoxidation inclusions

• Trial casting chosen: 1” x 10” x 12” plate (large cope surface)
• Tilting simulations run with a variety of geometries and tilting times to optimize flow (low velocity, smooth flow)
• Optimumgeometryshown
• Tilting timeof 6 secondschosen
Tilt Pour Trials and Analysis

Axis of rotation
t-pot pouring basin
side top
• Tilt mold design specifications:
Tilt Pour Trials and Analysis

Overview of Trials• Trials of this design conducted at Keokuk Steel Castings
(Matrix Metals Keokuk Facility)
• Five sets of trials completed
• Plates cast two ways:– With mold tilting– With standard gating system
• Plates poured from same heat, same ladle
• 1/8” machined off cope surface of each plate
• Cope surface inclusions counted
Tilt Pour Trials and Analysis

• Inclusion counting:– draw 1” circles around inclusions– each circle counts as one inclusion
standard plate tilt plate
Tilt Pour Trials and Analysis

Summary: First Trials– No t-pot boards or refractory basin bottoms (i.e., all lip pour tilt plates)– No holding time between basin pour and tilt– 1019 steel, poured at 2878°F (1581°C)
– Inclusion counts similar for tilted plates and standard plates– To improve process:
• introduce holding time after filling, before tilting– let inclusions from pouring rise before tilting
• use t-pot basin
PlatePour
Time (s)Tilt
Time (s)Inclusion
Count
ASTMX-ray
ShrinkageRating
ASTMX-ray
InclusionRating
ASTMX-ray
PorosityRating
Tilt #1 8 6 CD4 - A1Tilt #2 7 7 CD4 - A1Tilt #3 8 7 CD5 - -
Standard #1 8 5 CA2 B1 -Standard #2 7 5 CA3 B2 A1Standard #3 7 8 CA3 - -
Tilt Pour Trials and Analysis

Summary: Second Trials– Holding time introduced before tilting– Refractory basin bottoms used in Tilt #1, Tilt #2– Refractory t-pot boards used in Tilt #2, Tilt #3– 4318 steel, poured at 2836°F (1558°C) - DIRTY HEAT!
– Bad reaction between metal and cut surface of t-pot boards caused short runs and swiss-cheese plates
• another material needs to be used for t-pot board– Tilt plate with lip pour basin much better than standard plates!
• holding time seems to reduce inclusion count
Tilt Pour Trials and Analysis
PlatePour/TiltTime (s)
HoldingTime (s)
InclusionCount comments
Tilt #1 6 15 5Tilt #2 6 15 n/a ran short; reaction with t-pot boardTilt #3 6 19 n/a ran short; reaction with t-pot board
Standard #1 5 17Standard #2 5 13Standard #3 5 18

Summary: Third Trials– No refractory boards used to insulate basin bottoms (deemed unnecessary)– Used section of a 9” sleeve for t-pot boards– T-pot basins used in Tilt #2, Tilt #3– 1022 steel, poured at 2841°F (1561°C)
– No short runs, even with 20 sec. holding times– T-pot basin tilt plates full of holes due to reaction between metal and basin
• again, as-cast surfaces look good, but holes appear after machining• another alternative needed to create t-pot basin?
– Lip pour basin tilt plate has fewer inclusions than standard plate• only one example of each plate, though
Tilt Pour Trials and Analysis
PlatePour/TiltTime (s)
HoldingTime (s)
InclusionCount comments
Tilt #1 5 20 3Tilt #2 5 20 n/a reaction with t-pot boardTilt #3 20 10 n/a reaction with t-pot board
Standard #1 5 5

Fourth Trials• Thinking that the t-pot board was causing the gas reaction, a non-
porous ceramic plate was used as a t-pot board• 3 tilt plates (1 t-pot, 2 lip pour)• 2 standard plates
Tilt Pour Trials and Analysis
Tilt #1 (lip pour) Tilt #2 (lip pour)

Fourth Trials• T-pot tilt plate had same reaction as in previous trials
Tilt Pour Trials and Analysis
Tilt #3 (t-pot)

Fourth Trials
Tilt Pour Trials and Analysis
Standard #1 Standard #2

Summary: Fourth Trials– Ceramic plate t-pot board in Tilt #3– Lip pour basins used in Tilt #1, Tilt #2– Pouring order: Std. #1, Tilt #1, Tilt #2, Tilt #3, Std. #2– 1022 steel, poured at 2841°F (1561°C)
– T-pot basin tilt plate again looked good as cast, but full of holes machined• t-pot board is not the problem• exothermic sleeve lining basin may be the problem (especially notches cut to
hold t-pot board)– Standard plates significantly cleaner than tilt plates?
• need more than 2 plates of each kind for good comparison
Tilt Pour Trials and Analysis
PlatePour/TiltTime (s)
HoldingTime (s)
InclusionCount comments
Tilt #1 5 15 5 small inclusionsTilt #2 6 16 9 inclusions mostly slagTilt #3 7 19 n/a swiss cheese reaction with t-pot basin
Standard #1 10 1 one small inclusionStandard #2 10 1 one small inclusion

Fifth Trials• No t-pot boards, no sleeves in tilt plates
– simulation: metal will not freeze in basin with 15-second holding time• Cast larger number of plates (4 standard, 4 tilt)
Tilt Pour Trials and Analysis
Standard #1 and #2 Standard #3 and #4

Fifth Trials
Tilt Pour Trials and Analysis
Tilt #1, #3 and #4

Summary: Fifth Trials– No sleeves used in tilt plates– Pouring order: Tilt #1, Std. #1, Tilt #2, Std. #2,
Std. #3, Tilt #3, Tilt #4, Std. #4– 1022 steel, poured at 2851°F (1566°C)
– Both standard and tilt plates have similar inclusion counts• except for 2nd trial (dirty heat), small number of inclusions in both standard
and tilt plates throughout trials– Find a geometry with known inclusion problems
Tilt Pour Trials and Analysis
PlatePour/TiltTime (s)
HoldingTime (s)
InclusionCount comments
Tilt #1 5 17 2 hot topping used on basinTilt #2 6 30 n/a froze in basinTilt #3 6 9 5 basin deslagged with steel rodTilt #4 5 16 4 basin deslagged with steel rod
Standard #1 7 6Standard #2 15 7Standard #3 8 2Standard #4 7 2

Candidate Production Part for Tilting– Butterfly valve with inclusion
issues along valve cope surface
Tilt Pour Trials and Analysis
current (standard) rigging
proposedtilt rigging
start
finish

Candidate Production Part for Tilting• Butterfly valve (9” OD, 3” high)
– Reoxidation inclusions often found on cope surface of valve– WCB steel in green sand mold, with furan core– Tpour = 1600°C (2912°F), tpour = 7 sec– Inclusion birth only, no release at inlet:
– Nucleation spacing l0 = 0.5 cm– Inclusion density ρ = 0.003 kg/cm3
– Spherical inclusions– Initial diameter d = 4 µm
– Surface roughnessfactor fsr = 10
– ~210,000 inclusions at theend of filling
– Inclusions shown at3x magnification
Tilt Pour Trials and Analysis

Candidate Production Part for Tilting
– Final inclusion distribution:• Inclusions gather on cope
surface of ring
Tilt Pour Trials and Analysis

Ongoing Work• Trials inconclusive, possibly due to small number of
inclusions with standard gating– Focus on part with known inclusion problems
• Different approach to t-pot mechanism? →
• Develop a more reliable (less manual)tilting mechanism
• Find additional production parts?
• Optimize production part tilt rigging through simulation (both flow andinclusion simulations)
Tilt Pour Trials and Analysis
basintop
view
basinsideview

223
Appendix G: Modeling of Reoxidation Inclusion
Formation During Filling of Steel Castings
Kent D. Carlson and Christoph Beckermann
Department of Mechanical and Industrial Engineering
The University of Iowa, Iowa City, IA 52242
Abstract
A reoxidation inclusion model is being developed that simulates the entire life cycle of inclusions during the filling of steel castings. There are two ways that inclusions can be introduced into the casting: inclusions can be released at the inlet to model tiny deoxidation or other larger inclusions entering the mold cavity from the ladle, and they can also be born on the metal free surface, where contact with oxygen from the atmosphere creates them. These models can be used separately or together. Inclusion motion is calculated by solving an equation of motion for each inclusion at each time step. The growth of reoxidation inclusions is modeled both by oxide growth due to oxygen pickup at the free surface as well as by inclusion agglomeration (combination) when inclusions come close enough together to merge. All of these pieces of the inclusion model have been implemented in commercial casting simulation software, and an application is provided to qualitatively compare the simulation results to experimental results. A parametric study is also performed, to examine the effect of various values specified in the model. Once completed, the present simulation model will provide a tool for foundries to determine the final location and characteristics of reoxidation inclusions in steel castings.

224
1. Introduction
The removal of oxide inclusions from castings and the subsequent repair of those castings are expensive and time consuming procedures. Svoboda et al.[1] estimated that twenty percent of the cost of producing castings is due to the removal of inclusions and the repair of the resulting defect areas with weld metal. Inclusions that remain in the casting adversely affect machining and mechanical performance, and may cause the casting to be rejected for failing to meet the radiographic standard requirements specified by the customer regarding allowable inclusion severity. Reoxidation inclusions, which form when deoxidized steel comes into contact with oxygen during mold filling, make up a substantial portion of the inclusions found in steel castings. Griffin and Bates[2] estimated that 83% of the macro-inclusions found in low-alloy steel castings are reoxidation inclusions, as are 48% of those found in high-alloy steel castings. The primary source of oxygen in reoxidation inclusion formation is air, which contacts the metal stream during pouring and the metal free surface in the mold cavity during filling (see Figure 1).
At present, trial-and-error and experience are the only tools that foundry engineers have at their disposal to solve inclusion problems in steel castings. If a casting has inclusion problems, the foundry engineer may change the pouring practice or gating design for the casting in hopes that this will eliminate or reduce the severity of the problem. Changing the pouring or gating will change melt flow patterns during filling. This may reduce the amount of reoxidation inclusions created, or it may merely change the final location of macro-inclusions; if the inclusions are swept into a riser rather than collecting on the cope surface of the casting, the inclusion problem is solved even if the volume of reoxidation inclusions created does not change. In order to avoid inclusion problems or to reduce their severity, foundries often employ special gating techniques to reduce the contact area and time between the melt and the atmosphere during mold filling or to trap inclusions inside the runners. However, while a poor gating system can create inclusion problems in castings, a good gating system will not necessarily prevent inclusion problems. Thus, several iterations on the rigging of a casting may be necessary to resolve inclusion issues.
In an attempt to provide foundry engineers with a tool for eliminating or minimizing inclusion problems, a model is being developed that simulates the formation, growth, and motion of reoxidation inclusions during the pouring of steel castings. This model, which is being developed within the commercial casting simulation software MAGMASOFT[3], will allow foundries to predict the final location, size, number and other characteristics of reoxidation inclusions in a casting. This information can be used to help determine whether or not a given mold design will lead to inclusion problems, without having to expend the time, effort and money to produce the casting to determine this information.
The various components of the inclusion model that are currently implemented in MAGMASOFT are described in Section 2. A preliminary application of this model to perform a parametric study and to compare simulation results with experimental results is presented in Section 3. Ongoing work is then summarized in Section 4. It is stressed that the work on inclusion modeling is well underway, but is not yet complete. This paper is intended to serve as a status report, showing some very promising preliminary results.

225
2. Modeling Inclusion Formation, Growth, Agglomeration, and Motion
This section describes the different aspects of inclusion modeling currently implemented in MAGMASOFT. These aspects include inclusion formation, growth, agglomeration and motion. Presently, inclusions can be modeled either as spheres or as thin disks (i.e., pancake-shaped inclusions), as shown in Figure 2. Spheres are characterized by a diameter d, while disks are characterized by a disk diameter ddisk and thickness t.
Formation
The present model provides two mechanisms that can be used to create reoxidation inclusions: release and birth (nucleation). These mechanisms can be used separately or together.
Release: The release mechanism allows the user to release inclusions at the inlet to the mold.
This option can be used to model tiny deoxidation or other larger inclusions that enter from the ladle into the casting cavity with the melt during pouring. This way, the effects of the cleanliness of the melt from the ladle can be examined. The user chooses the initial size of the inclusions that are released by specifying d0 (cm) for spheres or ddisk,0 and t0 (both in cm) for disks. The user also specifies a “release” spacing, rell (cm), and the model releases inclusions spaced rell apart over the inlet area. Each inclusion is assigned an initial velocity equal to that of the liquid metal at the release location. The model then determines the inclusion release frequency, relf (s-1), from
relinrel lvf r= (1)
where invr (cm/s) is the average inlet velocity, and releases inclusions at time intervals of relf1 seconds. This provides a continuous release of inclusions with an inclusion number density, reln (cm-3), of
3−= relrel ln (2)
If the approximate inclusion number density in the melt coming from the ladle is known, this can be used as reln to determine rell from Equation (2); i.e., 3/1−= relrel nl .
Birth: The birth mechanism creates tiny new inclusions on the free surface of the melt during filling. The phenomenon of nucleation of oxide inclusions on a low-carbon aluminum-killed (LCAK) liquid steel free surface has been photographed by Wang et al.[4] This series of photographs is reproduced in Figure 3. It can be seen that the free surface is initially free of inclusions (Figures 3a and 3b). The inclusions nucleate at approximately the time of the photograph in Figure 3c. The initial inclusion spacing appears to be around 10 microns. The later photographs show continued growth and agglomeration of the inclusions, as discussed in more detail below.
In the present birth model, the initial size of the inclusions that nucleate on the free surface is
assumed to be negligibly small. In practice, a small but finite value for the initial diameter is used, such that the initial inclusion volume is still negligibly small. The user specifies a “nucleation” spacing, 0l (cm), which indicates the desired initial spacing between inclusions that

226
nucleate on the free surface. This value would typically be different from the release spacing, rell . The nucleation spacing can be related to the number of nuclei per unit free surface area, 0n ′′
(cm-2), by the equation
200−=′′ ln (3)
In order to compute the area of the free surface that is available for nucleation of new inclusions, the following approximations are made. The total area of the free surface in a computational cell, cellFSA , (cm2), is first approximated using the equation
( ) ( ) 32
, 2.114 dzdydxfVOFVOFA srcellFS ×××−= (4)
where VOF is the volume of fluid [VOF = (volume of fluid in cell)/(total cell volume), 0 ≤ VOF ≤ 1]; srf is a surface roughness factor that accounts for the fact that fluid flow simulations cannot capture the actual roughness of the metal surface due to turbulence and splashing (see, for example, the picture on the left side of Figure 1); and dx, dy and dz (all in cm) are the flow cell dimensions. The term )1(4 VOFVOF − in Equation (4) determines the size of the free surface based on how much liquid metal the flow cell contains. This term has a maximum value of one when the cell is half full (i.e., VOF = 0.5), and a minimum value of zero when the cell is either completely empty or completely full (i.e., VOF = 0 or VOF = 1). The term ( ) 3
22.1 dzdydx ×× in
Equation (4) approximates the area of the free surface, assuming the cell is half full. To understand this, consider the schematics shown in Figure 4. Figure 4a shows a general free surface, while Figures 4b and 4c show free surfaces for a uniform grid cell (i.e., dzdydx == ).
If the grid is uniform, the term ( ) 32
2.1 dzdydx ×× simplifies to 22.1 dx , which is the area shown in Figure 4b multiplied by 1.2. The factor 1.2 is used because the actual orientation of the free surface within a cell is unknown. The minimum possible area for a half-full cell is the surface shown in Figure 4b, which has an area of 20.1 dx . The maximum area, shown in Figure 4c, is
241.1 dx . The factor 1.2 is used because it is the average of the minimum and maximum values. While the above method for computing the area of the free surface within in a computational cell may appear to be crude, more exact calculations cannot be justified in view of the fact that typical filling simulations are far from being able to resolve all details of the highly turbulent free surface that can exist during filling of a steel casting.
Once the total free surface area in a cell is computed, the number density of the inclusions already existing on that free surface area, existn ′′ (cm-2), can be found from
cellFSexistexist ANn ,=′′ (5)
where existN is the number of inclusions that already exist in the flow cell that contains a free surface. Here, it is assumed that all inclusions within a free surface cell are on the free surface. From this value, the spacing of the existing inclusions, existl (cm), can be approximated as
( ) 21−′′= existexist nl (6)

227
If the spacing between existing inclusions exceeds the user-specified nucleation spacing, 0l , then inclusion birth may occur, provided there is available free surface area. The free surface area available for inclusion birth, birthA (cm2), is calculated from
existcellFSbirth AAA −= , (7)
where existA (cm2) is the sum of the cross-sectional areas of all existing inclusions in this cell
2
1 4 j
n
jexist dA ∑
=
=π (8)
where jd is the diameter of inclusion j (d for spherical inclusions and ddisk for disk-shaped inclusions), and n is the total number of existing inclusions in this cell.
If birthA calculated from Equation (7) is greater than zero, birth will occur. The number of inclusions that will be created, birthN , is determined from
birthbirthbirth AlAnN 200−=′′= (9)
This value is then rounded up to the nearest integer, and birthN inclusions are added to the cell that contains a free surface, spaced a distance of 0l apart.
In practice, 0l should be chosen smaller than the smallest grid dimension (dx, dy, or dz), in order to ensure that there is at least one inclusion in each cell that contains a free surface. On the other hand, specifying a nucleation spacing that is comparable to the one observed in experiments (see Figure 3), i.e., about 10 microns, would result in a total number of inclusions that is too large for present-day computing resources. Hence, a compromise must be found that provides final results that are reasonably independent of the number of inclusions generated by the above birth model and that can be obtained within present computational capabilities. This issue is examined in detail in Section 3.
Growth
When reoxidation inclusions are on the melt free surface, they will absorb oxygen from the atmosphere and grow as a result. This phenomenon is governed by the equation
( )
βρρ
inclFSinclinclincl A
tV
,=∂
∂ (10)
In this equation, inclρ and inclV are the inclusion density (kg/cm3) and volume (cm3), respectively; inclFSA , is the area (cm2) of the melt free surface that is contributing oxide to the growing inclusion; and β is an effective, overall mass transfer coefficient (cm/s), which is determined from the expression
2
22
Oa
oxide
Oa
Oa
oxide
oxide TRpDM
rδρ
β =

228
where oxider is the ratio of the number of moles of oxide to the number of moles of diatomic oxygen (O2) in the balanced chemical equation, oxideM is the molecular weight of the oxide (kg/kmol), 2O
aD is the binary diffusion coefficient (cm2/s), 2Oap is the partial pressure of oxygen
in the atmosphere ( 2scmkg ⋅ ), R is the universal gas constant ( ( ) ( )Kkmolscmkg 22 ⋅⋅ ), T is the temperature (K), oxideρ is the density of the oxide (kg/cm3), and 2O
aδ is the boundary layer thickness (cm), which is estimated based on the velocity of the liquid metal and air properties.
In the present growth model, the total oxidation rate is proportional to the entire free surface
area at any instant of time. However, the amount of oxide formed during a given time step must be apportioned to the individual inclusions. This can be done in a cell-by-cell manner, since each free surface cell has at least one inclusion. The present apportioning procedure is based on the idea that larger inclusions “attract” oxide from a larger portion of the free surface than smaller inclusions do. Hence, in order to determine the area inclFSA , in Equation (10) it is assumed that the total flow cell free surface area [ cellFSA , , defined in Equation (4)] is divided among the inclusions within that flow cell, proportional to each inclusion’s surface area. This can expressed as,
cellFSn
jjincl
inclinclFS A
SA
SAA ,
1,
,
∑=
= (11)
where n represents the number of inclusions in the flow cell. The surface area of spherical inclusions is
2dSAsphere π= (12)
while the surface area of disk-shaped inclusions is
tddSA diskdiskdisk ππ+= 2
2 (13)
However, note that for thin disks such as the one shown in Figure 2b, the surface area on the disk faces (i.e., the top and bottom surfaces) is much larger than the area created by the thickness [given by the term tddiskπ on the right side of Equation (13)]. Because the first term on the right side of Equation (13) is much larger than the second, the second term can be neglected. If this is done, then substituting either Equation (12) or (13) into Equation (11) results in
cellFSn
jjincl
inclinclFS A
d
dA ,
1
2,
2
,
∑=
= (14)
where incld is d for spherical inclusions, and ddisk for disk-shaped inclusions.
With the above information, the volume of each inclusion after growth, inclV , can be calculated from Equation (10). This new volume is then used to compute the new inclusion size.

229
For spheres, the diameter after growth is given by the equation relating the volume of a sphere to its diameter
( ) 316 πinclVd = (15)
For disks, the volume is related to the diameter and thickness by
tdV diskincl2
4π
= (16)
Note that growth can cause an increase in both the diameter and the thickness. An assumption must be made in order to determine both of these quantities from the volume after growth. The assumption used in the model is that the thickness and diameter both grow by the same ratio, growr . In other words, the disk diameter and thickness after growth can be written as
olddiskgrowdisk drd ,= (17)
and
oldgrowtrt = (18)
where olddiskd , and oldt are the values before growth. Substituting Equations (17) and (18) into Equation (16) results in
oldolddiskgrowincl tdrV 2,
3
4π
= (19)
Equation (19) can be solved for growr , and then the disk diameter and thickness after growth can be calculated from Equations (17) and (18).
Agglomeration
Aside from growth, inclusions can also increase in size during filling by colliding with and sticking to each other, to form a single larger inclusion. This is known as agglomeration. While this can happen anywhere in the melt due to random collisions, it is more likely to occur on the liquid metal free surface. This is because solid inclusions on the liquid free surface cause small indentations in the free surface. These indentations extend beyond the inclusions themselves, and essentially create an effect not unlike gravity over very small distances (on the order of ten to a few hundred microns). To understand this, imagine placing two bowling balls on a trampoline. If the balls get close enough, the indentations they each make in the trampoline will interact, and the balls will roll together and touch. This can be seen in Figure 5, which shows photographs of inclusions agglomerating on the free surface of low-carbon aluminum-killed (LCAK) liquid steel. These photos, presented by Shibata et al.[5], are clear evidence of the attractive forces between inclusions that were essentially motionless relative to each other in the first frame of Figure 5. The photographs obtained by Wang et al.[4] and reproduced in Figure 3 also show the phenomena of growth and agglomeration on a LCAK steel free surface. The inclusions that nucleated on the liquid steel surface (Figure 3d) grow until their spacing becomes small enough that they agglomerate (Figures 3e and 3f).

230
The present agglomeration model is shown schematically in Figure 6, for both spheres and disks. If two inclusions are within some critical distance L1 of each other, they are assumed to agglomerate immediately. The assumption of instantaneous agglomeration neglects the inertia and drag forces on the particles during agglomeration; it is needed because of the difficulty to resolve the motion of the inclusions over the small distances involved in the agglomeration process. To determine if two inclusions agglomerate, it is necessary to determine the critical distance L1 shown in Figure 6. This was done using the experimental data of Shibata et al.[5], shown in Figure 7. They measured accelerations and separation distances of inclusions such as those shown in Figure 5 to determine the attractive forces and critical distances (“acting length” in Figure 7) between inclusions. The data shown in Figure 7 indicates that the critical distance depends primarily on the radius of the larger of the two inclusions. This can be understood by returning to the bowling ball analogy. Assuming that the bowling balls have the same density, a larger bowling ball would create a larger indentation in the trampoline. The size of the smaller bowling ball becomes less important, because it will be attracted to the larger bowling ball as soon as it encounters the larger indentation caused by the larger ball. To determine the relationship between the radius of the larger inclusion and the critical distance, a line was drawn through the center of the data shown in the upper part of Figure 7. The equation of this line is approximately given by
2084.0)cm( max1 dL = (20)
where maxd (cm) is the diameter of the larger of the two inclusions. For simplicity, the same relation is used for disks, replacing maxd with max,diskd . It is important that the diameter used in Equation (20) is in centimeters, because the constant in front of the square root has units of (cm)1/2. Note that the critical distance given in Equation (20) is only valid if both inclusions involved are on the metal free surface. If one or both are immersed in the metal, the attractive surface force is absent, and a critical distance of L1 = 0 is used. Finally, note that more than two inclusions can be involved in an agglomeration. It is possible for several inclusions to be located on the free surface close enough to a given inclusion to satisfy the agglomeration criterion, in which case all inclusions within this distance are combined.
When inclusions agglomerate, it is necessary to determine the properties of the newly formed inclusion. This is done by first summing the masses and volumes of the inclusions involved, to determine the mass and volume of the agglomerated group, aggm (kg) and aggV (cm3), respectively. The density of the newly agglomerated inclusion, aggρ (kg/cm3), is then found from
aggaggagg Vm=ρ (21)
Since the densities of the inclusions are currently assumed to be equal and constant, the above equation simply gives inclagg ρρ = . For spheres, the diameter of the new inclusion, aggd (cm), is determined from
( ) 316 πaggagg Vd = (22)

231
For disks, both the diameter and the thickness of the new inclusion must be determined from the agglomerated volume. To do this, the model assumes that the new inclusion thickness, aggt (cm), is equal to the maximum thickness value of all inclusions involved in the agglomeration, i.e., ( )ttagg MAX= . The new agglomerated disk diameter, aggdiskd , (cm), is then found from
agg
aggaggdisk t
Vd
π4
, = (23)
The location of the new inclusion, aggxr (cm), is given by the center of mass of the inclusions that were involved in the agglomeration, which can be written as
∑∑==
=n
jj
n
jjjagg mxmx
11
rr (24)
where jxr and jm are the position vector and mass of inclusion j, respectively, and n is the number of inclusions that agglomerated. Finally, the velocity of the new inclusion, aggvr (cm/s), is determined by conservation of linear momentum for the group of inclusions involved. This is expressed as
∑∑==
=n
jj
n
jjjagg mvmv
11
rr (25)
where jvr is the velocity vector of inclusion j.
Motion
In order to determine the final location of inclusions, it is necessary to track their movement from the time they form until filling is complete. In the present model, this is done by solving the following equation of motion for each inclusion, at each time step:
buoyancydragincl
incl FFdtvd
m +=r
(26)
where inclm and inclvr are the mass (kg) and velocity (cm/s) of the inclusion, respectively; and
dragF and buoyancyF are the drag and buoyancy forces (kg-cm/s2) acting on the inclusion. Since agglomeration of inclusions is assumed to be instantaneous (see the previous sub-section), no attraction forces between inclusions are included in the above equation. Other forces (virtual mass, lift, drag due to the presence of other inclusions, etc.) are also neglected. In addition, Equation (26) assumes that the inclusion mass is constant during motion. If the inclusions are assumed to be spherical, Equation (26) can be expressed as
( )( ) ( )gvvddt
vdlinclincll
incl
linclincl
rrrr
ρρµ
ρ −++−= 687.02 Re15.01
18 (27)
where inclρ and incld are the density (kg/cm3) and diameter (cm) of the inclusion, respectively;
lρ and lµ are the density (kg/cm3) and dynamic viscosity (kg/cm-s) of the liquid, respectively;

232
gr is the gravity vector (cm/s2); t is the time (not the disk thickness); and Re is the Reynolds number, which is a dimensionless number defined in terms of the difference between the velocity of the inclusion ( inclvr ) and the velocity of the surrounding liquid metal ( lvr ) as
l
incllincll dvvµρrr
−=Re (28)
The first term on the right side of Equation (27) is the drag force, and the second term is the buoyancy force. The drag force is written in terms of a dimensionless drag coefficient, DC , given by
( )687.0Re15.01Re24
+=DC (29)
This drag coefficient correlation is valid for 1000Re ≤ .
During each time step of the filling simulation, Equation (27) is solved for each inclusion to determine its velocity. This information is then used to update the location of each inclusion according to inclincl vdtxd rr
= , where inclxr is the position vector of an inclusion. If an inclusion comes into contact with a mold wall, it is assumed to stick to the wall.
Note that the inclusion momentum equation given in Equation (27) is employed even when disk-shaped inclusions are used. To account for the size and shape of each disk in the momentum equation, a volume equivalent diameter is used in Equation (27). This is the diameter that the disk would have, based on its volume, if it were spherical. The volume equivalent diameter, eqd (cm), is determined from
3 2
23 tdd diskeq = (30)
After the equation of motion has been solved for each inclusion, the volume equivalent diameter is converted back into a disk diameter with the equation
t
dd eq
disk
3
32
= (31)
3. Application of the Model
As mentioned earlier, the model described in the previous section has been implemented in the casting simulation software MAGMASOFT. This section describes the results of a parametric study that was performed with this software to evaluate the current state of the model.
The geometry used in this study is the plate geometry shown in the upper left of Figure 8. The plate is 1 in. thick by 10 in. wide by 12 in. long, with a 4 in. diameter by 4 in. high end riser. This particular geometry was selected because it was used for a separate experimental study of inclusion formation, so there is experimental data with which to compare simulation results. Filling of this geometry is simulated for 1022 steel in a furan sand mold. The pouring

233
temperature is 1581˚C (2878˚F), which gives a superheat of 80˚C (144˚F). The pouring time is 7 seconds.
The present investigation focuses on the birth model, so this model is used in all cases presented in this work. The release model is not employed in any of the simulations discussed here. The inclusion density is taken to be constant and equal to 0.003 kg/cm3; this is approximately the density of the alumina inclusions that are prevalent in reoxidation. The inclusion size at birth is specified as d = 4 microns for spherical inclusions, and ddisk = 4 microns, t = 2 microns for disk-shaped inclusions. This size is small enough that it results in an essentially negligible initial inclusion volume at birth. The mass transfer coefficient for these simulations is specified as β = 0.0002 cm/s; this value provides a reasonable growth rate for the purpose of the present simulations.
Other simulation parameters that must be specified include the grid size (or number of metal cells); the nucleation spacing, 0l ; the surface roughness factor, srf ; and whether to use spherical or disk-shaped inclusions. These parameters were varied to create the present parametric study. The values of these parameters for the five cases considered are listed in Table 1.
The simulated inclusions at 10% increments during filling are shown for Case 1 in Figure 8. As the plate becomes nearly filled, a group of relatively large inclusions are seen to form and stick to the middle of the plate cope surface. This is caused by a swirling behavior of the liquid metal in this region when the plate is nearly filled. The swirling of the liquid metal brings many inclusions into the same area, where they agglomerate on the free surface to form the large inclusions seen on the plate cope surface in Figure 8. However, Figure 8 also shows that smaller inclusions (around 100 microns in diameter) are evenly distributed throughout the casting. A top view of the inclusions at the end of filling is shown in Figure 9a. This simulation result can be compared to the two experimental plates shown in Figure 9b. These plates were cast with the rigging shown in Figure 8, and then ⅛ in. of material was machined from their cope surfaces. The circles drawn on the plates in Figure 9b are inclusion counts, where 1-in. diameter circles are drawn around all visible inclusions on the machined cope surfaces. Note that the locations of the inclusions seen in the experimental plates in Figure 9b are in good agreement with the locations of the largest inclusions shown in Figure 9a. The final inclusion plots produced for Cases 2 – 5 look qualitatively very similar to those of Case 1 in Figures 8 and 9; therefore, they are not shown here. It is interesting to note, however, that even as the model parameters are varied, the simulated final locations of the largest inclusions match the experimental results.
Table 1 summarizes the results of the parametric study mentioned above. Furthermore, the final size and volume distributions of the inclusions for each case are presented in Figures 10 – 14. Figures 10a – 14a show the distribution of the number of inclusions for each case. Final inclusion diameter is plotted on the x-axis of these figures. The inclusions were grouped by their diameters into one-micron diameter increments and counted. This count (i.e., the number of inclusions in each one-micron interval) was then divided by the total number of inclusions at the end of the simulation and plotted on the y-axis, as the number fraction of inclusions per micron of diameter. Hence, the area under each of the curves in Figures 10a – 14a is equal to unity. These figures show the distribution of inclusions, based on their diameter. For example, Figure 10a shows that the majority of inclusions produced in this simulation have a final diameter of around 100 microns, with very few inclusions larger than 500 microns (0.5 mm). Figures 10b –

234
14b show the distribution of the final inclusion volume as a function of inclusion diameter. These figures also plot the final inclusion diameter on the x-axis, but now the total volume of the inclusions within each micron increment of diameter are computed and divided by the total volume of all inclusions. This is plotted on the y-axis, as the total final volume fraction per micron of diameter. The area under each of the curves in Figures 10b – 14b is also equal to unity. These figures relate the distribution of the total inclusion volume to the inclusion diameter. For example, Figure 10b shows that the majority of the final inclusion volume consists of inclusions 500 microns or smaller, with a peak around 200 microns. The presence of relatively few large inclusions can be clearly observed in Figures 10b – 14b.
As shown in Table 1, Case 1 used a grid with about 26,000 metal cells (i.e., cells that will contain metal at the end of filling), a nucleation spacing of 0.5 cm, a surface roughness factor of 1, and spherical inclusions. This simulation resulted in a final total inclusion volume of 0.276 cm3, consisting of about 147,000 inclusions, with a maximum inclusion diameter of 0.269 cm (2.69 mm). A total of about 213,000 inclusions were generated, implying that about 66,000 inclusions combined together through agglomeration. Case 2 used all the same parameters as Case 1, except that the nucleation spacing was reduced from 0.5 cm to 0.25 cm. Table 1 shows that in Case 2 the smaller nucleation spacing resulted in a final count of about 284,000 inclusions, which is nearly twice as many inclusions as in Case 1. As in Case 1, Case 2 resulted in a final total inclusion volume of 0.276 cm3. This shows that the total volume of oxide generated is not affected by the number of inclusions simulated. The average inclusion diameter is different for the two cases (Table 1), since the same total inclusion volume is produced with a different number of inclusions. However, Table 1 shows that, despite the vastly different number of inclusions generated in Cases 1 and 2, the final diameter of the largest inclusion is approximately the same. Comparing Figures 10a and 11a, it is seen that the normalized size distribution of the final inclusions is also very similar in both cases. The peaks in both figures are of the same magnitude and occur at diameters slightly under 100 microns. This indicates that the predicted final size distribution of the inclusions is not affected by the number of the inclusions simulated, if the size distribution is normalized by the total final number of inclusions. This result is important for trying to minimize the number of inclusions in a simulation in order to reduce computational times. The volume distributions for Cases 1 and 2 are also quite similar (Figures 10b and 11b). In particular, the presence of a few inclusions of a large volume is predicted in approximately the same manner in both cases. This implies that the prediction of the large inclusions is not strongly affected by the total number of inclusions simulated. Since the large inclusions are of primary concern to steel foundries, this finding again can be used to minimize the number of inclusions in a simulation. Although the curves are of a similar shape, note that the magnitude of the peak just below 200 microns is about 0.0038/micron in Figure 10b, while it is about 0.0048/micron in Figure 11b. This indicates that more of the oxide volume is distributed among the smaller inclusions in Case 2 than in Case 1, which can be attributed to the much larger total number of inclusions in Case 2 than in Case 1.
Case 3 provides a check for grid independence: this case uses the same parameters as Case 2, except that it uses a grid that has about half the number of metal cells used in Case 2 (about 13,000). The total inclusion volume resulting for Case 3 is 0.279 cm3, a value very close to the first two cases. Case 3 results in about 219,000 inclusions, which is a somewhat smaller number than in Case 2. However, both the maximum and average inclusion diameters in Case 3 are similar to Case 2. Comparing Figures 11a and 12a, it is seen that the normalized distribution of

235
inclusions over the range of diameters is very similar. The peak value in Case 3 occurs at about the same diameter as in Case 2, although the fraction of inclusions at the peak is about 10% smaller. Comparing Figures 11b and 12b, the trends are also very similar. Again, the peak volume fraction in Figure 12b is somewhat lower than in Figure 11b. This indicates that more of the volume in Case 3 comes from somewhat larger inclusions, which can be seen by comparing these figures in the range of about 700 to 1300 microns (0.7 – 1.3 mm). The similarity of the results from Cases 2 and 3 gives some confidence in the grid independence of the present inclusion formation model. It should be noted that the similarity between the results from Cases 2 and 3 also implies a degree of time step independence, because the time step was larger in Case 3 than in Case 2. The time step in MAGMASOFT is variable and automatically determined based on many factors, one of which is grid size. Coarser grids lead MAGMASOFT to use larger time steps.
Case 4 is the same as Case 1, except that the inclusions are modeled as disks rather than spheres. This case produces a final inclusion volume of 0.276 cm3, which is the same as in Case 1. The final number of inclusions in Case 4 (135,000) is also similar to Case 1. As expected, the maximum diameter is very different: the maximum disk diameter in Case 4 is nearly 1 cm, while the largest sphere diameter in Case 1 is only 0.27 cm. Rather than growing uniformly in all directions, the disk diameter increases much more than the thickness. This can be seen by noting that the initial ratio of tddisk is 2, while the final maximum ratio is 39. Since the growth model increases both the diameter and thickness by the same ratio, this indicates that the largest inclusion underwent many agglomerations, since in agglomeration the thickness is taken as the maximum value of the inclusions involved. Indeed, the largest inclusion in this simulation actually contains about 1,760 agglomerated inclusions. Comparing Figures 10 and 13, notice again that they are qualitatively very similar, except the x-axis scale is different due to the larger range of disk diameters. If one would scale the horizontal axes in Figures 10 and 13 by the largest inclusion diameters, the distributions would more directly coincide.
Finally, Case 5 is the same as Case 1, except a surface roughness factor, srf , of 10 (rather than 1) is used. In practice, a larger surface roughness factor corresponds to more turbulent filling process. The final inclusion volume for this case is 2.76 cm3, which is exactly ten times the value from Case 1. This is not surprising; looking at Equations (4) and (10), one sees that the growth rate of the inclusions is directly proportional to srf . This increased growth rate increases both the maximum and average inclusion diameters. The diameter of the largest inclusion is about 7.8 mm in Case 5, as opposed to 2.7 mm in Case 1. The final number of inclusions increases from 146,522 in Case 1 to 196,058 in Case 5 (Table 1). This difference is due to a combination of two effects: the larger free surface area in Case 5 results in many more inclusions being generated (563,710 in Case 5 versus 212,604 in Case 1), even though the nucleation spacing is the same in both cases; on the other hand, the much larger size of the inclusions causes many more agglomerations in Case 5 compared to Case 1. Comparing Figures 10a and 14a, the peak inclusion fraction decreases almost in half, but the visible distribution in Figure 14a extends for almost 1000 microns, rather than for almost 500 microns as in Figure 10a (note the difference in the x-axis scales). Comparing Figures 10b and 14b, the volume distribution in Case 5 is spread over a much wider range of diameters, and there are more large inclusions. One would not expect the distributions in Cases 1 and 5 to be similar, since the two cases correspond to much different physical situations.

236
An interesting overall observation from this study is that simulations with the same growth rate (Cases 1 – 4) all produce about the same total volume of inclusions. Furthermore, the size and volume distributions in Cases 1 – 3 are similar when normalized with the total final number of inclusions. As mentioned when discussing Figures 8 and 9a, the inclusion simulation results at the end of filling for all five cases looked qualitatively very similar (i.e., the largest inclusions ended up in roughly the same location). It is encouraging to see similar results from the model as relatively arbitrary parameters such as nucleation spacing and grid size are varied. Of course, the final inclusion sizes depend strongly on whether the inclusions are modeled as spheres or as disks, the roughness of the free surface during filling, and the oxidation rate.
4. Ongoing Work
While the present inclusion model is showing promising results, there are still enhancements to be made. The primary area of enhancement is to implement an improved oxidation rate model, such that the mass transfer coefficient, β, is a function of the local flow conditions. A similar improvement will be made with respect to the surface roughness factor. Additional simulations will be performed to test the inclusion release model, in order to examine the effect of the cleanliness of the melt entering the mold from the ladle. Most importantly, more comparisons with casting trials are needed. In particular, differences in the prediction of reoxidation inclusions due to changes in the pouring practice or the gating system and mold design need to be compared with measurements performed on actual steel castings.
Acknowledgements
This work was prepared with the support of the U.S. Department of Energy (DOE) Award No. DE-FC36-02ID14225. However, any opinions, findings, conclusions, or recommendations expressed herein are those of the authors, and do not necessarily reflect the views of the DOE. We would like to thank Bob Bryant and Keokuk Steel Castings for carrying out the casting trials that produced the experimental inclusion results provided in this paper. We would also like to thank Malcolm Blair and Raymond Monroe of the SFSA for their helpful suggestions and guidance in this work.
References
[1] J.M. Svoboda, R.W. Monroe, C.E. Bates and J. Griffin (1987), “Appearance and Composition of Oxide Macroinclusions in Steel Castings,” AFS Transactions, Vol. 95, pp. 187-202.
[2] J.A Griffin and C.E. Bates (1991), “Ladle Treating, Pouring and Gating for the Production of Clean Steel Castings,” Steel Founders' Society of America Research Report No. 104.
[3] MAGMASOFT, MAGMA GmbH, Kackerstrasse 11, 52072 Aachen, Germany.
[4] Y. Wang, S. Shridhar, A.W. Cramb, A. Gomez and C. Cicutti (2004), “Reoxidation of Low-Carbon, Aluminum-Killed Steel,” AIST Transactions (Iron & Steel Technology), February 2004, pp. 87-96.

237
[5] Shibata, Yin and Emi (1998), “The Capillary Effect Promoting Collision and Agglomeration of Inclusion Particles at the Inert Gas-Steel Interface,” Phil. Trans. R. Soc. Lond. A, Vol. 356, pp. 957-966.

238
Table 1. Parameters and results for inclusion simulations.
Case
inclusion spacing
l0 (cm) at birth
number of
metal cells
surface roughness
factor fsr
sphere /disk
number of
inclusionsgenerated
final number
of inclusions
total inclusionvolume (cm3)
dmax (cm)
davg (cm)
tmax (cm)
1 0.5 26,053 1 S 212,604 146,522 0.276 0.269 0.0115 -- 2 0.25 26,053 1 S 405,824 283,571 0.276 0.227 0.0091 -- 3 0.25 13,263 1 S 302,876 219,285 0.279 0.210 0.0095 -- 4 0.5 26,053 1 D 213,532 134,662 0.276 0.922 -- 0.0237 5 0.5 26,053 10 S 563,710 196,058 2.76 0.782 0.0157 --

239
Figure 1. Opportunities for oxygen absorption during mold filling. Adapted from SFSA
research report.[2] Figure 2. Possible inclusion geometries: (a) sphere; and (b) thin disk.
Ladle
Entrained Air (Internal oxidation)
Sprue may or may not be offset from pour basin
Air Entrainment (Surface and bubble oxidation)
Stream roughness (Surface oxidation)
Sprue well
Flow into casting cavity (Surface oxidation, entrainment under worst case conditions)
d(a) t
ddisk (b)

240
Figure 3. Time-elapsed photographs of nucleation, growth and agglomeration of inclusions on
a liquid steel free surface. Adapted from Wang et al.[4] Figure 4. Schematics showing the free surface area for a cell that is half-full of liquid metal:
(a) general surface; (b) minimum surface area; and (c) maximum surface area.
dx
dx
dx
A = dx2
dx
dxdx
A = 1.41dx2
dx
dy
dz A
(a) (b) (c)

241
Figure 5. Time-elapsed photographs of inclusions agglomerating on the surface of liquid steel.
Adapted from Shibata et al.[5] Figure 6. Schematics showing the critical distance, 1L , for the agglomeration of (a) spheres;
and (b) disks.
(a) d2 d1L1
t2
ddisk,2
(b) t1
ddisk,1 L1

242
Figure 7. Experimental agglomeration data, showing relations between inclusion radii and the
attraction force and acting length (critical distance L1). R1 is the radius of the smaller inclusion, and R2 is the radius of the larger inclusion. Adapted from Shibata et al.[5]

243
Figure 8. Simulated inclusions at various times during filling for Case 1. Inclusions shown at 3x magnification.
4”D x 4”H riser
inlet
1”T x 10”W x 12”L plate
20%10% filled
60%50%40%30%
70% 80% 90% 100%

244
(a)
(b)
Figure 9. Comparison between simulation and experimental results: (a) Top view of final
simulated inclusion locations. Inclusions shown at 3x magnification; (b) photo showing inclusion locations on the cope surface of two experimental plates.

245
(a) (b) Figure 10. Distribution of (a) number of inclusions based on diameter; and (b) inclusion volume
based on diameter for Case 1.
0
0.001
0.002
0.003
0.004
0.005
0.006
0.007
0.008
0.009
0.01
0 500 1000 1500 2000 2500 3000
Inclusion Diameter (µm)
Incl
usio
n V
olum
e Fr
actio
n Pe
r M
icro
n ( µ
m-1
)
0
0.001
0.002
0.003
0.004
0.005
0.006
0.007
0.008
0.009
0.01
0 500 1000 1500 2000 2500 3000
Inclusion Diameter (µm)
Frac
tion
Of I
nclu
sion
s Per
Mic
ron
( µm
-1)
dmax = 2687 µm
dmax = 2687 µm

246
(a) (b) Figure 11. Distribution of (a) number of inclusions based on diameter; and (b) inclusion volume
based on diameter for Case 2.
0
0.001
0.002
0.003
0.004
0.005
0.006
0.007
0.008
0.009
0.01
0 500 1000 1500 2000 2500 3000
Inclusion Diameter (µm)
Incl
usio
n V
olum
e Fr
actio
n Pe
r M
icro
n ( µ
m-1
)
0
0.001
0.002
0.003
0.004
0.005
0.006
0.007
0.008
0.009
0.01
0 500 1000 1500 2000 2500 3000
Inclusion Diameter (µm)
Frac
tion
Of I
nclu
sion
s Per
Mic
ron
( µm
-1)
dmax = 2266 µm
dmax = 2266 µm

247
(a) (b) Figure 12. Distribution of (a) number of inclusions based on diameter; and (b) inclusion volume
based on diameter for Case 3.
0
0.001
0.002
0.003
0.004
0.005
0.006
0.007
0.008
0.009
0.01
0 500 1000 1500 2000 2500 3000
Inclusion Diameter (µm)
Incl
usio
n V
olum
e Fr
actio
n Pe
r M
icro
n ( µ
m-1
)
0
0.001
0.002
0.003
0.004
0.005
0.006
0.007
0.008
0.009
0.01
0 500 1000 1500 2000 2500 3000
Inclusion Diameter (µm)
Frac
tion
Of I
nclu
sion
s Per
Mic
ron
( µm
-1)
dmax = 2104 µm
dmax = 2104 µm

248
(a) (b) Figure 13. Distribution of (a) number of inclusions based on diameter; and (b) inclusion volume
based on diameter for Case 4.
0
0.002
0.004
0.006
0.008
0.01
0.012
0.014
0 1000 2000 3000 4000 5000 6000 7000 8000 9000 10000
Inclusion Diameter (µm)
Incl
usio
n V
olum
e Fr
actio
n Pe
r M
icro
n ( µ
m-1
)
0
0.001
0.002
0.003
0.004
0.005
0.006
0.007
0.008
0.009
0.01
0 1000 2000 3000 4000 5000 6000 7000 8000 9000 10000
Inclusion Diameter (µm)
Frac
tion
Of I
nclu
sion
s Per
Mic
ron
( µm
-1)
ddisk,max = 9219 µm
ddisk,max = 9219 µm

249
(a) (b) Figure 14. Distribution of (a) number of inclusions based on diameter; and (b) inclusion volume
based on diameter for Case 5.
0
0.002
0.004
0.006
0.008
0.01
0.012
0.014
0.016
0.018
0.02
0 1000 2000 3000 4000 5000 6000 7000 8000
Inclusion Diameter (µm)
Incl
usio
n V
olum
e Fr
actio
n Pe
r M
icro
n ( µ
m-1
)
0
0.001
0.002
0.003
0.004
0.005
0.006
0.007
0.008
0.009
0.01
0 1000 2000 3000 4000 5000 6000 7000 8000
Inclusion Diameter (µm)
Frac
tion
Of I
nclu
sion
s Per
Mic
ron
( µm
-1)
dmax = 7819 µm
dmax = 7819 µm

Appendix H:Reoxidation Inclusion Formation
- Modeling and Experiments
February 2nd, 2005
SFSA High Alloy and Carbon and Low Alloy Research Committees Meeting

Background & Motivation
• Reoxidation is the oxidation reaction of elements present in the liquid steel with oxygen supplied by– Atmosphere
– Slags
– Mold/Refractories
• Atmospheric Reoxidation is most important and considered here only.
• No general and reliable model is available to calculate the reoxidation rate, and the amount, size, and composition of the inclusions formed, as a function of steel composition, atmospheric conditions and casting conditions.

Background & Motivation
Opportunities for oxygen absorption from the surrounding atmosphere during pouring.
Ladle
Air Entrainment (Bubble oxidation)
Stream surface oxidation
Flow into casting cavity(Surface oxidation, entrainment under worst case conditions)
Steel pool surface oxidation
Entrained Air(Internal oxidation)

• Reoxidation inclusions start out small (on the order of microns), and rapidly increase in size through growth and agglomeration
• The final reoxidation defects that appear in castings can be large enough to be visible to the naked eye (macroinclusions)
1.6 mm
FeO
1.4 mm
32% Al2O350% SiO218% MnO
2.0 mm
34% Al2O346% SiO220% MnO
1.3 mm
25% Al2O356% SiO218% MnO
Background & Motivation

• Develop a model to predict inclusion composition as a function of steel composition, atmospheric conditions, and casting conditions.
• Predict the amount of oxygen absorbed per mass of steel by matching measured and predicted inclusion compositions.
• Investigate the influence of steel composition on the composition of inclusions.
• Investigate the influence of atmospheric conditions and casting conditions on the amount of oxygen absorbed per mass of steel.
Outline

Elemental Balance Equation
i
k
ikk
iJCf
dtd
dtdC
=
= ∑
ikC
• Oxygen (O) absorption rate (atmospheric transport control)
- fraction mass of element i in system
- fraction mass of element i in phase k
- fraction mass of phase k in system
- mass transport rate of element i
iC
kfiJ
for=iJ
O=i
O≠i0
fordt
dCO

Thermo-Calc Procedures• ∆CO is added between T0 and Tliq in equal increments.
• Lever rule approach (complete equilibrium):
– Species well-mixed within each phase.
– Previously formed inclusions can dissolve and inclusion composition can
change up to room temperature.
• Scheil approach:
– Species well-mixed in liquid phase, but no transport in other phases.
– Previously formed inclusions cannot dissolve and inclusion composition
is constant when steel is solidified.

Experiment I (SFSA, 1961)*
• SFSA instigated a research project to study reoxidation inclusions at Battelle Memorial Institute.
• More than 400 castings were poured from 62 experimental heats and ranged in size from 90 to 250 pounds. The pouring temperature was about 1600 °C.
• Both high-Al and low-Al carbon steels were investigated.
• Green sand molds were used for most of the castings.
* W.S. Lyman, and F.W. Boulger, SFSA Research Report No. 48, February 1961.

Test Plate Mold Pattern
Gating ratio: 1:1:1.1
6×9×1 inch

• Nominal composition:C – 0.3 Si – 0.35 Mn – 0.8 P – 0.015 S – 0.015 Fe – Balance
• Some heats were made with 0.4, 1.6, or 3.0 Mn.
• High-Al carbon steel: Al – 0.15
• Low-Al carbon steel: Al – 0.05
Steel Composition [wt%]

Measured Inclusion Composition
Mn/Si, wt%
Incl
usio
n C
ompo
sitio
n, w
t%
• Steel composition (wt%) for each sample: Si – 0.35; Mn – 0.4, 0.8, 1.6, 3.0 • Each point is the average of three or more samples. • The number beneath each point shows how many samples it represents.
High-Al carbon steel
Low-Al carbon steel

High-Al Carbon Steel
• ∆CO is varied until predicted composition of inclusion agrees with
measured average inclusion composition.
• Once ∆CO is determined, the predicted and measured inclusion
compositions are compared for different contents of Mn.
• Parametric study varying Mn, Si, Al, C in the following ranges:
Mn – 0.1 ~ 3.6; Si – 0.1 ~ 1; Al – 0 ~ 0.3; C – 0.1 ~ 2

Evolution of Reoxidation Inclusions
0
0.5
1
1.5
2
2.5
1600 1580 1560 1540 1520 1500 1480
Am
ount
of I
nclu
sion
, wt%
Cristobalite (s)(SiO2)
Total inclusions
Al2O3 (s)
liqT
CO (g)
Tephroite (l)(Mn2SiO4)Si2O4_Al6O9 (s)
• At the liquidus temperature, Si, Al solid oxides, Mn liquid oxide, and CO gas are formed.
HighHigh--Al Carbon SteelAl Carbon Steel
∆CO = 0.9 wt%Lever ruleMn – 0.8 wt%
Temperature, °C
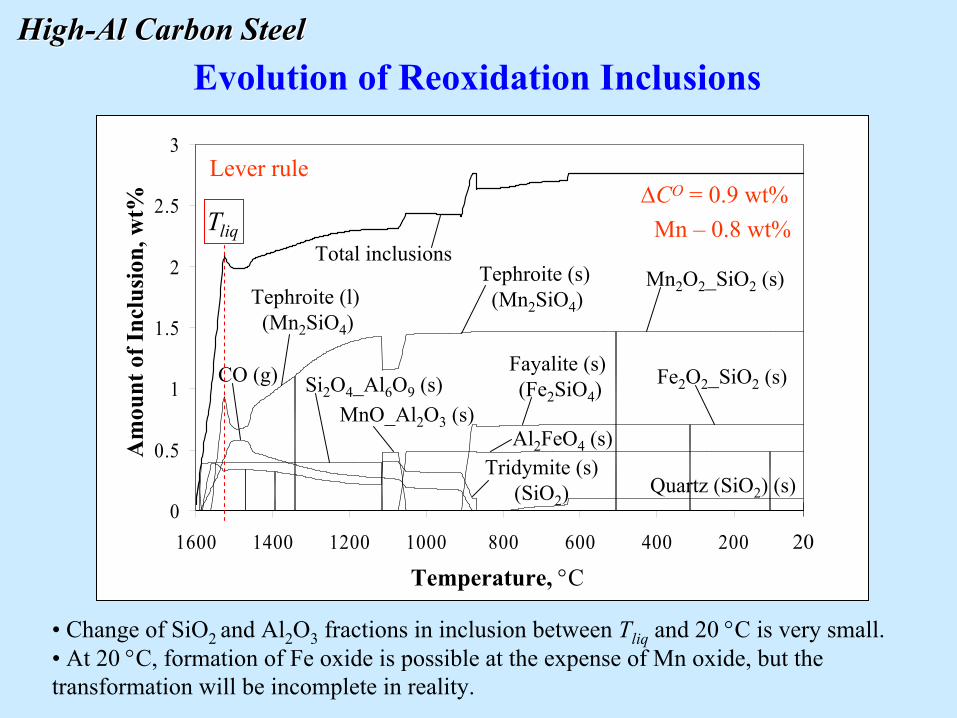
0
0.5
1
1.5
2
2.5
3
1600 1400 1200 1000 800 600 400 200 20
Temperature, °C
Total inclusions
Fe2O2_SiO2 (s)
Quartz (SiO2) (s)
CO (g)
Tridymite (s)(SiO2)
Tephroite (l)(Mn2SiO4)
Tephroite (s)(Mn2SiO4)
Mn2O2_SiO2 (s)
Al2FeO4 (s)
Si2O4_Al6O9 (s)MnO_Al2O3 (s)
• Change of SiO2 and Al2O3 fractions in inclusion between Tliq and 20 °C is very small. • At 20 °C, formation of Fe oxide is possible at the expense of Mn oxide, but the transformation will be incomplete in reality.
Fayalite (s)(Fe2SiO4)
HighHigh--Al Carbon SteelAl Carbon SteelEvolution of Reoxidation Inclusions
Am
ount
of I
nclu
sion
, wt%
∆CO = 0.9 wt%Lever rule
Mn – 0.8 wt%liqT

0
0.5
1
1.5
2
1600 1580 1560 1540 1520 1500 1480
Temperature, °C
Cristobalite (s)(SiO2)Al2O3 (s)
liqT
CO (g)
Tephroite (l)(Mn2SiO4)
• At the liquidus temperature, Si, Al solid oxides, Mn liquid oxide, and CO gas are formed.• Oxide fractions are constant when T is lower than Tliq.
HighHigh--Al Carbon SteelAl Carbon SteelEvolution of Reoxidation Inclusions
Am
ount
of I
nclu
sion
, wt%
Total inclusions
∆CO = 0.9 wt%Scheil approachMn – 0.8 wt%

• In order to compare with the measured inclusion
compositions, the predicted oxide fractions at Tliq are
converted to equivalent oxide fractions at room temperature
in the following manner:
– Si2O4_Al6O9 = 2SiO2 + 3Al2O3
– Mn2SiO4 = 2MnO + SiO2
– Fe2SiO4 = 2FeO + SiO2
– Al2FeO4 = FeO + Al2O3
• CO gas is not included in the equivalent oxide calculation.
HighHigh--Al Carbon SteelAl Carbon Steel
Predicted Inclusion Composition

0.3220.325Cristobalite (SiO2) (s)0.2540Al2O3 (s)
0.7380.934Tephroite (Mn2SiO4) (l)
39.439.7MnO41.243.1SiO2
19.417.2Al2O3Equivalent oxide phase excluding CO
gas in inclusions (wt%)
00.395Si2O4_Al6O9 (s)
0.3310.429CO (g)Oxide phase in system (wt%)
Scheil approach
Lever Ruleapproach
Predicted Inclusion Composition
OC∆ = 0.9 wt%,
• Different oxide phases formed for the lever rule and Scheil approaches.• However, similar fractions of equivalent oxides are obtained for both approaches.• Only lever rule approach is used in the following.
HighHigh--Al Carbon SteelAl Carbon Steel
Mn – 0.8 wt%

0
20
40
60
80
100
0 0.2 0.4 0.6 0.8 1 1.2 1.4
Effect of ∆CO on Inclusion Composition
Incl
usio
n C
ompo
sitio
n, w
t%
Al2O3
MnO+FeO
SiO2
MnO
FeO
• ∆CO = 0.9 wt% gives agreement with measured inclusion composition. • Sum of measured FeO and MnO fractions agrees with calculated MnO fraction.• FeO could form during cooling at the expense of MnO.
Amount of Absorbed Oxygen per Mass of Steel (∆CO), wt%
MnO+FeO
Al2O3MnO
SiO2
FeO
MeasurementsMn – 0.8 wt%
HighHigh--Al Carbon SteelAl Carbon Steel
2828
28
2828

0
20
40
60
80
100
0 0.2 0.4 0.6 0.8 1 1.2 1.4
Effect of ∆CO on Inclusion Composition
Incl
usio
n C
ompo
sitio
n, w
t%
Al2O3
SiO2
MnO
Amount of Absorbed Oxygen per Mass of Steel (∆CO), wt%
MnO+FeO
Al2O3MnO
SiO2
FeO
Measurements
HighHigh--Al Carbon SteelAl Carbon Steel
99
9
99
• ∆CO = 0.9 wt% gives qualitative agreement with measured inclusion composition.
Mn – 1.6 wt%

0
20
40
60
80
100
0 0.2 0.4 0.6 0.8 1 1.2 1.4
Effect of ∆CO on Inclusion Composition
Incl
usio
n C
ompo
sitio
n, w
t% Al2O3
SiO2MnO
• ∆CO = 0.9 wt% gives qualitative agreement with measured inclusion composition.
MnO+FeO
Al2O3MnO
SiO2
FeO
Measurements
HighHigh--Al Carbon SteelAl Carbon Steel
5
5
5
55
Amount of Absorbed Oxygen per Mass of Steel (∆CO), wt%
Mn – 3.0 wt%

0
20
40
60
80
100
0.1 0.6 1.1 1.6 2.1 2.6 3.1 3.6Mn Content, wt%
MnO
SiO2
Al2O3
Effect of Mn Content on Inclusion Composition
• The predicted inclusion composition qualitatively agrees with the measured data.• MnO and SiO2 fraction in inclusion strongly depend on the content of Mn.• Al2O3 fraction in inclusion slightly depends on the content of Mn.
MnO+FeO
Al2O3SiO2
Measurements∆CO = 0.9 wt%
HighHigh--Al Carbon SteelAl Carbon Steel
Incl
usio
n C
ompo
sitio
n, w
t%
28
28
28
99
9
5
5
5

0
1
2
3
0 1 2 3 4Mn Content, wt%
Effect of Mn Content on the Formation of CO Gas
• Increasing Mn content – decreases the amount of CO gas formed in the melt. – increases the amount of total inclusions in the melt.
∆CO = 0.9 wt%
HighHigh--Al Carbon SteelAl Carbon Steel
Wei
ght P
erce
nt a
t Tliq Total oxides
Total inclusions
CO gas

0
20
40
60
80
100
0.1 0.2 0.3 0.4 0.5 0.6 0.7 0.8 0.9 1
Si Content, wt%
SiO2
Al2O3
MnO
Nominal Si
• MnO and SiO2 fraction in inclusion strongly depend on the content of Si.• Al2O3 fraction in inclusion slightly depends on the content of Si.
∆CO = 0.9 wt%
Effect of Si Content on Inclusion Composition
Mn – 0.8 wt%
HighHigh--Al Carbon SteelAl Carbon Steel
Incl
usio
n C
ompo
sitio
n, w
t%

0
20
40
60
80
100
0 0.05 0.1 0.15 0.2 0.25 0.3
Al Content, wt%
SiO2
Al2O3
MnO
Nominal Al
• MnO and Al2O3 fraction in inclusion strongly depend on the content of Al.• SiO2 fraction in inclusion slightly depends on the content of Al.
Effect of Al Content on Inclusion CompositionHighHigh--Al Carbon SteelAl Carbon Steel
Incl
usio
n C
ompo
sitio
n, w
t%∆CO = 0.9 wt%Mn – 0.8 wt%

0
20
40
60
80
100
0.1 0.5 0.9 1.3 1.7
C Content, wt%
SiO2
Al2O3
MnO
2
Nominal C
• MnO, SiO2 and Al2O3 fraction in inclusion strongly depend on the content of C.• Al2O3 is the only solid oxide when C is greater than 1.3 wt%.
Effect of C Content on Inclusion CompositionHighHigh--Al Carbon SteelAl Carbon Steel
Incl
usio
n C
ompo
sitio
n, w
t%∆CO = 0.9 wt%Mn – 0.8 wt%

• ∆CO is varied until predicted composition of inclusion agrees
with measured average inclusion composition.
• The predicted and measured inclusion compositions are
compared for different content of Mn.
Low-Al Carbon Steel

0
20
40
60
80
100
0 0.2 0.4 0.6 0.8 1 1.2 1.4
Effect of ∆CO on Inclusion CompositionIn
clus
ion
Com
posi
tion,
wt%
Al2O3
MnO+FeO
SiO2
MnOFeO
• ∆CO = 0.9 wt% gives agreement with measured inclusion composition. • Sum of measured FeO and MnO fractions agrees with calculated MnO fraction.• FeO could form during cooling at the expense of MnO.
MnO+FeO
Al2O3MnO
SiO2
FeO
MeasurementsMn – 0.4 wt%
LowLow--Al Carbon SteelAl Carbon Steel
3
3
33
3
Amount of Absorbed Oxygen per Mass of Steel (∆CO), wt%

0
20
40
60
80
100
0 0.2 0.4 0.6 0.8 1 1.2 1.4
Effect of ∆CO on Inclusion CompositionIn
clus
ion
Com
posi
tion,
wt%
Al2O3
MnO+FeO
SiO2
MnO
FeO
MnO+FeO
Al2O3MnO
SiO2
FeO
MeasurementsMn – 0.8 wt%
LowLow--Al Carbon SteelAl Carbon Steel
9
9
99
9
Amount of Absorbed Oxygen per Mass of Steel (∆CO), wt%
• ∆CO = 0.9 wt% gives qualitative agreement with measured inclusion composition.

0
20
40
60
80
100
0 0.2 0.4 0.6 0.8 1 1.2 1.4
Effect of ∆CO on Inclusion CompositionIn
clus
ion
Com
posi
tion,
wt% Al2O3
SiO2
MnO
• ∆CO = 0.9 wt% gives qualitative agreement with measured inclusion composition.
MnO+FeO
Al2O3MnO
SiO2
FeO
MeasurementsMn – 1.6 wt%
LowLow--Al Carbon SteelAl Carbon Steel
3
3
33
3
Amount of Absorbed Oxygen per Mass of Steel (∆CO), wt%

0
20
40
60
80
100
0 0.2 0.4 0.6 0.8 1 1.2 1.4
Effect of ∆CO on Inclusion CompositionIn
clus
ion
Com
posi
tion,
wt% Al2O3
SiO2
MnO
• ∆CO = 0.9 wt% gives qualitative agreement with measured inclusion composition.
MnO+FeO
Al2O3MnO
SiO2
FeO
MeasurementsMn – 3.0 wt%
LowLow--Al Carbon SteelAl Carbon Steel
55
5
5
5
Amount of Absorbed Oxygen per Mass of Steel (∆CO), wt%

0
20
40
60
80
100
0.1 0.6 1.1 1.6 2.1 2.6 3.1 3.6
Mn Content, wt%
MnO
SiO2
Al2O3
Effect of Mn Content on Inclusion Composition
• The predicted inclusion composition qualitatively agrees with the measured data.• MnO and SiO2 fraction in inclusion strongly depend on the content of Mn.• Al2O3 fraction in inclusion slightly depends on the content of Mn.
MnO+FeO
Al2O3SiO2
Measurements∆CO = 0.9 wt%
LowLow--Al Carbon SteelAl Carbon Steel
Incl
usio
n C
ompo
sitio
n, w
t%
5
5
5
3
3
3
9
9
9
3
3
3

0
1
2
3
0 1 2 3 4Mn Content, wt%
Effect of Mn Content on the Formation of CO Gas
• Increasing Mn content – decreases the amount of CO gas formed in the melt. – increases the amount of total inclusions in the melt.
∆CO = 0.9 wt%
LowLow--Al Carbon SteelAl Carbon Steel
Wei
ght P
erce
nt a
t Tliq Total oxides
Total inclusions
CO gas

Summary for Experiment I• ∆CO = 0.9 wt% gives qualitative agreement with measured
inclusion composition for both high-Al and low-Al carbon steel.
• The predicted inclusion composition qualitatively agrees with the measured data for different Mn contents.
• Effect of steel composition on the inclusion composition:
-AlC
-Mn-Si
MnOAl2O3SiO2
increase
decrease
- almost constant

Experiment II (SFSA, 1986)*
• This program was sponsored by steel foundries, foundry supply companies, and the U.S. Department of Commerce.
• Over 500 macro-inclusions from low and high alloy steel castings were analyzed.
• The pouring weight of the plates was approximately 200 lb, and the casting weight was approximately 95 lb. The pouring temperature was about 1600 °C.
• Both sand and special ceramic molds were used.
* J.A. Griffin, and C.E. Bates, SFSA Research Report SoRI-EAS-86-810, 1986.

4318
214
Test Plate Mold Pattern
641510
8310
°
212 °2
°464257 4
34
64412

• Approximate nominal composition: [wt%]
C – 0.26 Si – 0.39 Mn – 0.83 P – 0.010 S – 0.017
Cr – 0.45 Ni – 0.52 Mo – 0.16 Al – unknown Fe – Balance
• Both ∆CO and the content of Al are varied until predicted
composition of inclusion agrees with measured inclusion
composition.
Low Alloy Steel

Sample 106-116-2
200x 600x
Light phase
Matrix phase
Bulk
000100B
5284226A
291574
CaOMnOSiO2Al2O3
• Light phase (Al2O3) forms due to deoxidation.
• Matrix phase forms as a result of reoxidation.
Low Alloy SteelLow Alloy Steel

Sample 107-103-3
50x 400x
Matrix phase
Light phase
Bulk
0364618B
00099A
0162261
CaOMnOSiO2Al2O3
Low Alloy SteelLow Alloy Steel

11325603284622Average02535400344225112-51726653205520111-2411622612294819110-1350816750284919110-107-211026645284322109-119-401622610364618107-103-32915745284226106-116-241536426204524103-4
CaOMnOSiO2Al2O3CaOMnOSiO2Al2O3
BulkMatrix PhaseSample
Measured Inclusion Composition
• The difference in the matrix and bulk phase inclusion compositions is due to the presence of Al2O3 deoxidation inclusions in the reoxidation inclusions. • Average inclusion composition in matrix phase is used in the calculations.• The sum of MnO and CaO is used as the MnO content in the calculations.
Low Alloy SteelLow Alloy Steel

0
0.5
1
1.5
2
2.5
1600 1560 1520 1480 1440 1400
Temperature, °C
Cristobalite (s)(SiO2)
Total inclusions
liqT
Tridymite (s)(SiO2)
CO (g)
Si2O4_Al6O9 (s)Al2O3 (s)
Tephroite (l)(Mn2SiO4)
• At the liquidus temperature, Si, Al solid oxides, Mn liquid oxide, and CO gas are formed.
Lever ruleAl – 0.2 wt%
∆CO = 0.9 wt%
Evolution of Reoxidation InclusionsA
mou
nt o
f Inc
lusi
on, w
t%
Low Alloy SteelLow Alloy Steel
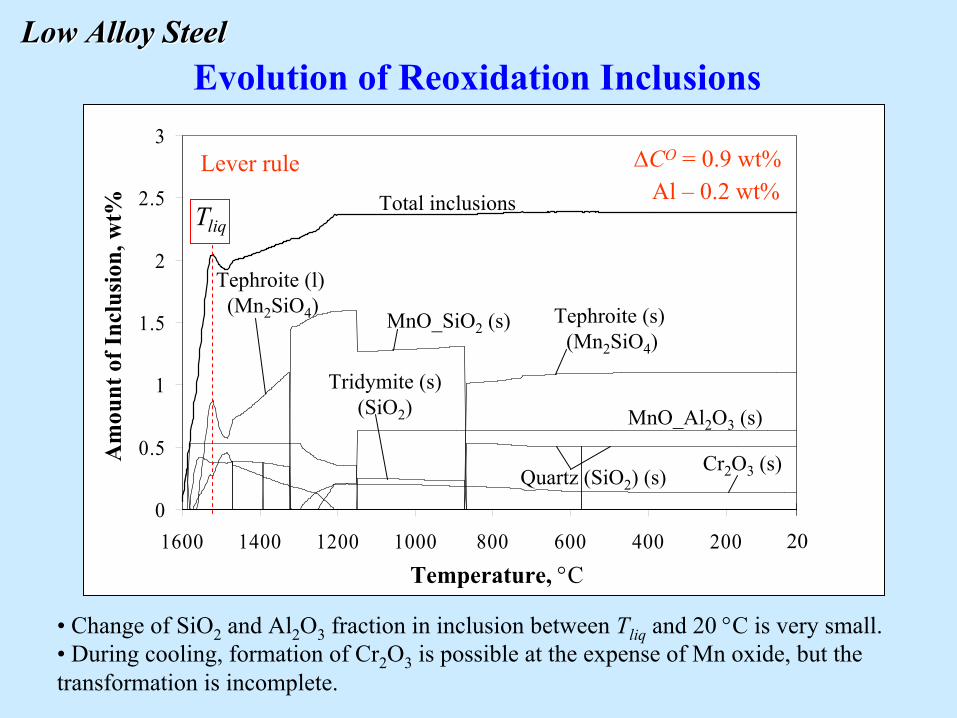
0
0.5
1
1.5
2
2.5
3
1600 1400 1200 1000 800 600 400 200 20Temperature, °C
MnO_SiO2 (s)
Cr2O3 (s)
liqT
Tephroite (l)(Mn2SiO4) Tephroite (s)
(Mn2SiO4)
Quartz (SiO2) (s)
Tridymite (s)(SiO2) MnO_Al2O3 (s)
• Change of SiO2 and Al2O3 fraction in inclusion between Tliq and 20 °C is very small.• During cooling, formation of Cr2O3 is possible at the expense of Mn oxide, but the transformation is incomplete.
Al – 0.2 wt%∆CO = 0.9 wt%
Evolution of Reoxidation InclusionsA
mou
nt o
f Inc
lusi
on, w
t% Total inclusions
Low Alloy SteelLow Alloy Steel
Lever rule

0
0.5
1
1.5
2
2.5
1600 1560 1520 1480 1440 1400
Temperature, °C
Scheil approach
Cristobalite (s)(SiO2)
Total inclusions
CO (g)
Al2O3 (s)
Tephroite (l)(Mn2SiO4)
liqT
• At the liquidus temperature, Si, Al solid oxides, Mn liquid oxide, and CO gas are formed.• Oxides fractions are constant when T is lower than Tliq.
Al – 0.2 wt%∆CO = 0.9 wt%
Am
ount
of I
nclu
sion
, wt%
Evolution of Reoxidation InclusionsLow Alloy SteelLow Alloy Steel

0.470.377Cristobalite (SiO2) (s)0.3540Al2O3 (s)
0.8160.851Tephroite (Mn2SiO4) (l)
35.034.1MnO43.444.4SiO2
21.621.5Al2O3Equivalent oxide phase excluding CO
gas in inclusions (wt%)
00.526Si2O4_Al6O9 (s)
0.230.28CO (g)Oxide phase in system (wt%)
Scheil approach
Lever Ruleapproach
OC∆ = 0.9 wt%,
• Different oxide phases formed for the lever rule and Scheil approaches.• However, similar fraction of equivalent oxide phase are obtained for both approaches.• Only lever rule is used in the following.
Predicted Inclusion CompositionLow Alloy SteelLow Alloy Steel
Al – 0.2 wt%

Determine ∆CO and Al Content
• ∆CO = 0.9 wt% and 0.2 wt% Al give agreement with measured inclusion composition.
02040
6080
100
0.05 0.1 0.15 0.2 0.25 0.3 0.35
02040
6080
100
0.05 0.1 0.15 0.2 0.25 0.3 0.35
02040
6080
100
0.05 0.1 0.15 0.2 0.25 0.3 0.35
Al Content, wt%
= 0.9 wt%
= 1.1 wt%
= 0.7 wt%OC∆
OC∆
OC∆
SiO2
MnOAl2O3
Measurements
Incl
usio
n C
ompo
sitio
n, w
t%In
clus
ion
Com
posi
tion,
wt%
Incl
usio
n C
ompo
sitio
n, w
t%
Al Content, wt%
Al Content, wt%
Low Alloy SteelLow Alloy Steel
888
8
88
888

0
20
40
60
80
100
0 0.2 0.4 0.6 0.8 1 1.2 1.4
Effect of ∆CO on Inclusion Composition
SiO2
Al2O3
MnOCr2O3
FeO
Incl
usio
n C
ompo
sitio
n, w
t%
• ∆CO = 0.9 wt% gives agreement with measured inclusion composition.
SiO2
MnOAl2O3
MeasurementsAl – 0.2 wt%
Low Alloy SteelLow Alloy Steel
8
8
8
Amount of Absorbed Oxygen per Mass of Steel (∆CO), wt%

Amount of Al2O3 Present in Steel at 1600 °C, wt%
0102030405060708090
100
0 1 2 3 4 5
SiO2
Al2O3
MnO
Al – 0.2 wt%
• High Al2O3 content in bulk inclusion is due to presence of Al2O3 deoxidation inclusions in melt from ladle.• High percentage (up to 4%) of Al2O3 deoxidation inclusions is due to their agglomeration in the reoxidation inclusions (inside matrix); i.e., the distribution of Al2O3 deoxidation inclusions is not uniform in the casting.
Bulk Inclusion Composition
SiO2
MnOAl2O3
Measurements ∆CO = 0.9 wt%
Low Alloy SteelLow Alloy Steel
Bul
k In
clus
ion
Com
posi
tion,
wt%
In matrix phase

High Alloy Steel (CF8M)
• Approximate nominal composition: [wt%]
C – 0.05 Si – 2.0 max Mn – 1.0 P – 0.03 S – 0.03Cr – 19.5 Ni – 10.5 Mo – 2.5 Fe – Balance
• Assume ∆CO is the same as predicted in low alloy steel and equal to 0.9 wt%.
• The content of Si is varied until predicted composition of inclusion agrees with measured inclusion composition.
• Parametric study varying Mn, Si, Cr in the following ranges:Mn – 0.5 ~ 1.5; Si – 0.5 ~ 2; Cr – 18 ~ 21

Sample 113-26CF8M SteelCF8M Steel
000100Dark phaseB
000100Sand grainA
Gray phase
Light phase
Bulk*
474049D
2657214C
1424459
MnOCr2O3TiO2SiO2* Excludingsand grains
200x 600x
AB
CD

Sample 114-4CF8M SteelCF8M Steel
0124038Gray phaseB
26191Matrix phaseA
Bright phase
Light phase
Bulk
217611D
0.2452232C
0301159
FeOCr2O3MnOSiO2
1000x
A
B
C
D

0.911.126.30.460.80.5Average29170710114-138-2010270630114-110-2011230660114-109-1210270602114-837280620114-625380550114-5011300590114-4018180602113-28014244590113-26016310531113-25
FeOMnOCr2O3TiO2SiO2Al2O3Specimen No.
• Average inclusion composition in bulk is used in the calculation.
Inclusion Composition in BulkCF8M SteelCF8M Steel

0
0.5
1
1.5
2
2.5
1600 1550 1500 1450 1400 1350 1300
Temperature, °C
Cristobalite (s)(SiO2)
Cr2O3 (s)
liqT
Tridymite (s)(SiO2)
CF8M SteelCF8M Steel
• At the liquidus temperature, solid SiO2 and Cr2O3 are formed.• No liquid oxides and gas are formed.
Lever rule ∆CO = 0.9 wt%Si – 1.33 wt%
Evolution of Reoxidation InclusionsA
mou
nt o
f Inc
lusi
on, w
t%
Total inclusions

0
0.5
1
1.5
2
2.5
3
1600 1400 1200 1000 800 600 400 200 20Temperature, °C
Cristobalite (s)(SiO2)
Mn2O2_SiO2 (s)
Quartz (SiO2) (s)
Cr2O3 (s)
liqT
Tridymite (s)(SiO2)
Tephroite (s)(Mn2SiO4)
CF8M SteelCF8M Steel
• Change of SiO2 fraction in inclusion between Tliq and 20 °C is very small.• At 20 °C, formation of Mn oxide is possible at the expense of Cr2O3, but the transformation is incomplete.
Lever rule ∆CO = 0.9 wt%Si – 1.33 wt%
Evolution of Reoxidation InclusionsA
mou
nt o
f Inc
lusi
on, w
t%
Total inclusions

0
0.5
1
1.5
2
2.5
1600 1550 1500 1450 1400 1350 1300Temperature, °C
Cristobalite (s)(SiO2)
Cr2O3 (s)
liqT
Tridymite (s)(SiO2)
CF8M SteelCF8M Steel
Scheil approach
• At the liquidus temperature, solid SiO2 and Cr2O3 are formed.• No liquid oxides and gas are formed.• Oxides fraction keeps constant when T is lower than Tliq.
∆CO = 0.9 wt%Si – 1.33 wt%
Evolution of Reoxidation InclusionsA
mou
nt o
f Inc
lusi
on, w
t%
Total inclusions

0.800.82Cr2O3
59.259.4SiO2
40.840.6Cr2O3Oxide phase in inclusions (wt%)
1.161.20SiO2
Oxide phase in system (wt%)
Scheil approach
Lever Ruleapproach
CF8M SteelCF8M Steel
• Similar SiO2 and Cr2O3 fractions are obtained for the lever rule and Scheil approaches.• Only lever rule is used in the following.
OC∆ = 0.9 wt%
Predicted Inclusion Composition

0
20
40
60
80
100
0.5 0.8 1.1 1.4 1.7 2
Si Content, wt%
Tridymite (s)(SiO2)
Cr2O3 (s)
∆CO = 0.9 wt%
Effect of Si Content on Inclusion Composition
• Approximately 1.33 wt% Si gives agreement with measured SiO2 fraction.• Sum of measured MnO and Cr2O3 fraction fits the calculated Cr2O3 fraction.• MnO could form at room temperature at the expense of Cr2O3.
CF8M SteelCF8M Steel
SiO2
Cr2O3
MnOMnO+Cr2O3
Measurements
Incl
usio
n C
ompo
sitio
n, w
t%
10
10
10
10

Effect of ∆CO on Inclusion Composition
0
20
40
60
80
100
0 0.3 0.6 0.9 1.2 1.5
Tridymite (s)(SiO2)
Cr2O3 (s)
CF8M SteelCF8M Steel
SiO2
Cr2O3
MnOMnO+Cr2O3
Measurements
Si – 1.33 wt%
Predicted ∆CO
Incl
usio
n C
ompo
sitio
n, w
t%
10
10
10
10
Amount of Absorbed Oxygen per Mass of Steel (∆CO), wt%

0
20
40
60
80
100
0.5 0.7 0.9 1.1 1.3 1.5
Tridymite (s)(SiO2)
Cr2O3 (s)
CF8M SteelCF8M Steel
Nominal Mn
• Cr2O3 and SiO2 fraction in inclusion slightly depend on the content of Mn.
∆CO = 0.9 wt%Si – 1.33 wt%
Effect of Mn Content on Inclusion Composition
Mn Content, wt%
Incl
usio
n C
ompo
sitio
n, w
t%

0
20
40
60
80
100
18 18.5 19 19.5 20 20.5 21
Cr Content, wt%
Tridymite (s)(SiO2)
Cr2O3 (s)
CF8M SteelCF8M Steel
Nominal Cr
• Cr2O3 and SiO2 fraction in inclusion strongly depend on the content of Cr.
Effect of Cr Content on Inclusion CompositionIn
clus
ion
Com
posi
tion,
wt%
∆CO = 0.9 wt%Si – 1.33 wt%

Summary for Experiment II • ∆CO = 0.9 wt% gives agreement with measured inclusion
composition for both low and high alloy steel.
• Effect of steel composition on the inclusion composition:
increase
decrease
- almost constant Cr--Mn
SiCr2O3SiO2

0
20
40
60
80
0 0.3 0.6 0.9 1.2 1.5
Mass of Total Inclusions per Ton SteelM
ass o
f Tot
al In
clus
ions
(lb)
pe
r T
on S
teel
Low alloy steelwithout CO gas
CF8M steel
Low alloy steelwith CO gas
Predicted ∆CO
Amount of Absorbed Oxygen per Mass of Steel (∆CO), wt%
• About 40 lb of inclusions are formed in a 1 ton steel casting when ∆CO = 0.9 wt%.

Calculation Results
403541Total inclusions (lb)per ton steel
0.890.420.78Total inclusions (mol)per mole oxygen (O2) consumed
2.301.952.27Total inclusions (kg)per kg oxygen (O) consumed
8314993Average molecular weight of inclusion (g/mol)
3.083.231.31×10-3Average density of inclusion (g/cm3)
Without CO gas
With CO gas
CF8M steel
Low alloy steelOC∆ = 0.9 wt%

• ∆CO = 0.9 wt% seems to work reasonably well for 200 lb
plate castings analyzed here (all four steels); pouring
system was similar in all experiments.
• That does not mean that ∆CO is the same for other castings
and pouring systems, even if the weight (200 lb) is the
same; e.g., more splashing should result in higher ∆CO
(which in turn should change inclusion composition).
Discussions

• atmospheric transport control
• species well-mixed in steel
- atmospheric O2 boundary layer thickness
- partial pressure of O2 gas in the atmosphere
- surface area of molten steel
- total volume of molten steel
2Oaδ
2
222Oas
Oas
s
Oa
OO
VpA
RTDM
dtdC
δρ=
where
Oxygen Absorption Rate
2Oap
2Oaδ
2Oap
sAsteel
surfaceatmosphere
Ci (Si, Mn, Al, etc.)
DistanceC
once
ntra
tion
or
Part
ial P
ress
ure
sA
sV

-5
-4.8
-4.6
-4.4
-4.2
-4
-3.8
3.6 3.8 4 4.2 4.4 4.6 4.8
, lg (Pa)
lg(d
CO/d
t), lg
(wt%
/s)
• Oxygen absorption rate is proportional to partial pressure of O2 gas in the atmosphere.• = 7.9 cm fits all experimental data.
Oxygen Absorption Rate
2lg Oap
Fe meltFe-Al meltFe-S melt
Measurements*
11
Still state
2Oaδ
* K. Sasai, and Y. Mizukami, ISIJ Int., 1996, vol. 36(4), pp. 388-394.

-4.8
-4.6
-4.4
-4.2
-4
-3.8
3.5 3.7 3.9 4.1 4.3 4.5
, lg (Pa)
lg(d
CO/d
t), lg
(wt%
/s)
• Oxygen absorption rate is proportional to partial pressure of O2 gas in the atmosphere.• = 0.98 cm fits all the experimental data. is smaller in stirred than in still state.
Oxygen Absorption Rate
2lg Oap
Stirred state
2Oaδ
Fe meltFe-S meltFe-Al-S melt
Measurements*
Fe-Al melt
11
2Oaδ
* K. Sasai, and Y. Mizukami, ISIJ Int., 1996, vol. 36(4), pp. 388-394.

Calculation of ∆CO
• , (since )
• If , then ∆CO = const.; same for all castings.
fillOa
s
s
O tAV
C2
1~δ
∆
fills tV ~ ][][ lbWst sfill =
fillOa
s tA ~2δ
∫=∆ fillt
Oa
s
ss
Oa
Oa
OO dtA
RTVpDMC
0 2
222δρ
• Amount of absorbed oxygen per mass of steel:
• As a first approximation:
• Certainly, the above does not need to be true.
• As can be changed, depending on pouring practice, even for the same tfill and Vs.

0
0.2
0.4
0.6
0.8
1
0 0.5 1 1.5 2 2.5
Calculation of 2Oaδ
• Sphere (other geometries with a small change in coefficients)
a
aaurµρ2Re =
2Oaa
a
DSc
ρµ
=
2
2Oa
rShδ
=
3/12/1Re6.02 ScSh +=r
3 m/s
0 m/s
1 m/s
0.5 m/s
10 m/s
r (cm)
δ(c
m)
au

Example I• 3 m/s, = 0.35 cm
• = 1.25 cm
•
Ladle
Casting
h ≈ 0.5 m
2r ≈ 5 cm
≈= ghua 2 2Oaδ
2
222Oas
fills
s
Oa
Oa
OO
VtA
RTpDMC
δρ=∆
2r
AV
s
s =
• The resulting value for ∆CO is too low compared to the 0.9 wt% value obtained for the 200 lb plate castings.
• This indicates that splashing and air entrainment result in muchhigher surface area than for a 2" diameter straight cylinder.
= 0.16 wt%
tfill = 30 s

• If metal stream is splashing so hard that steel consists of n
droplets of average radius r, then .
– Longer tfill causes increased oxygen absorption.
• From Sh correlation, , hence .
– ∆CO increases with Increasing velocityDecreasing radius of droplets
rnVnA
s
s 3=
22~1~ O
a
fillfillO
a
s
s
O
rt
tAV
Cδδ
∆
5.0
5.1~2
a
Oa u
rrδ fillaO t
ruC 5.1
5.0~∆
Example II
r
For ua = 3.0 m/s; tfill = 30 s; ∆CO = 0.9 wt%
we get r = 0.2 cm, which is reasonable.
au

Conclusions • Model allows for calculation of amount of oxygen absorbed per
mass of steel if inclusion composition is known.
– ∆CO = 0.9 wt% gives agreement with measured inclusion composition
for 200 lb carbon steel and low and high alloy steel plate castings.
• Model allows for calculation of amount of oxygen absorbed per
mass of steel knowing the volume of steel and the surface area
integrated over the fill time.

• Model can qualitatively predict the inclusion composition as a
function of the composition of steel, atmospheric condition,
and casting conditions.
- The inclusion composition strongly depends on the composition of
steel.
• Model can calculate the properties of inclusions, such as
average density, average molecular weight.
• Established connection to previous air entrainment
measurements.
Conclusions (Cont.)
Related Documents