1 | Page Yesterday I concluded “We may get some profit taking over the Holiday; but it should only be corrective (small 4 th waves)”. And today certainly looked like that with only a 5p range on the S&P. Hence the wave count and ideal wave tracker table price targets remain the same. Table 1. Ideal wave tracker table for nano and micro-waves of minute-v The 1-minute chart below shows my best interpretation of the price action since the SPX2578 low (price moves <10p are always very hard to interpret and subject to interpretation…). Figure 1. SPX-1 min chart. Micro-3 ideally now underway

Welcome message from author
This document is posted to help you gain knowledge. Please leave a comment to let me know what you think about it! Share it to your friends and learn new things together.
Transcript
1 | P a g e
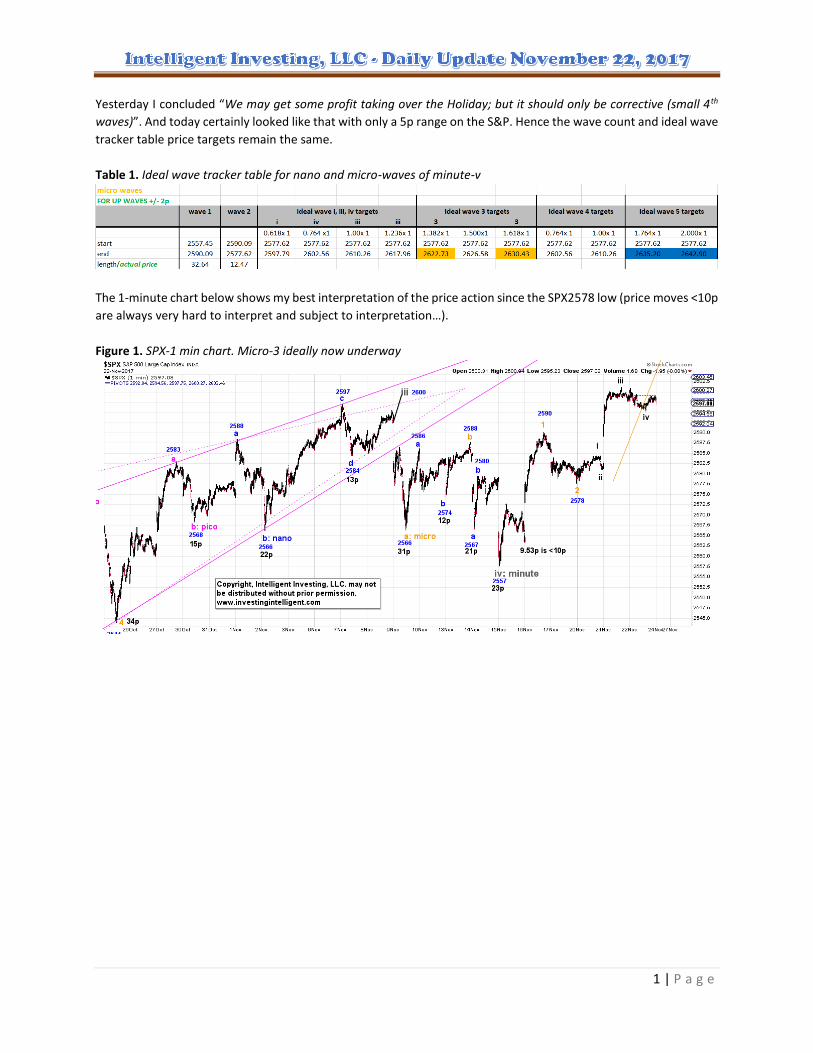
Yesterday I concluded “We may get some profit taking over the Holiday; but it should only be corrective (small 4th
waves)”. And today certainly looked like that with only a 5p range on the S&P. Hence the wave count and ideal wave
tracker table price targets remain the same.
Table 1. Ideal wave tracker table for nano and micro-waves of minute-v
The 1-minute chart below shows my best interpretation of the price action since the SPX2578 low (price moves <10p
are always very hard to interpret and subject to interpretation…).
Figure 1. SPX-1 min chart. Micro-3 ideally now underway
2 | P a g e
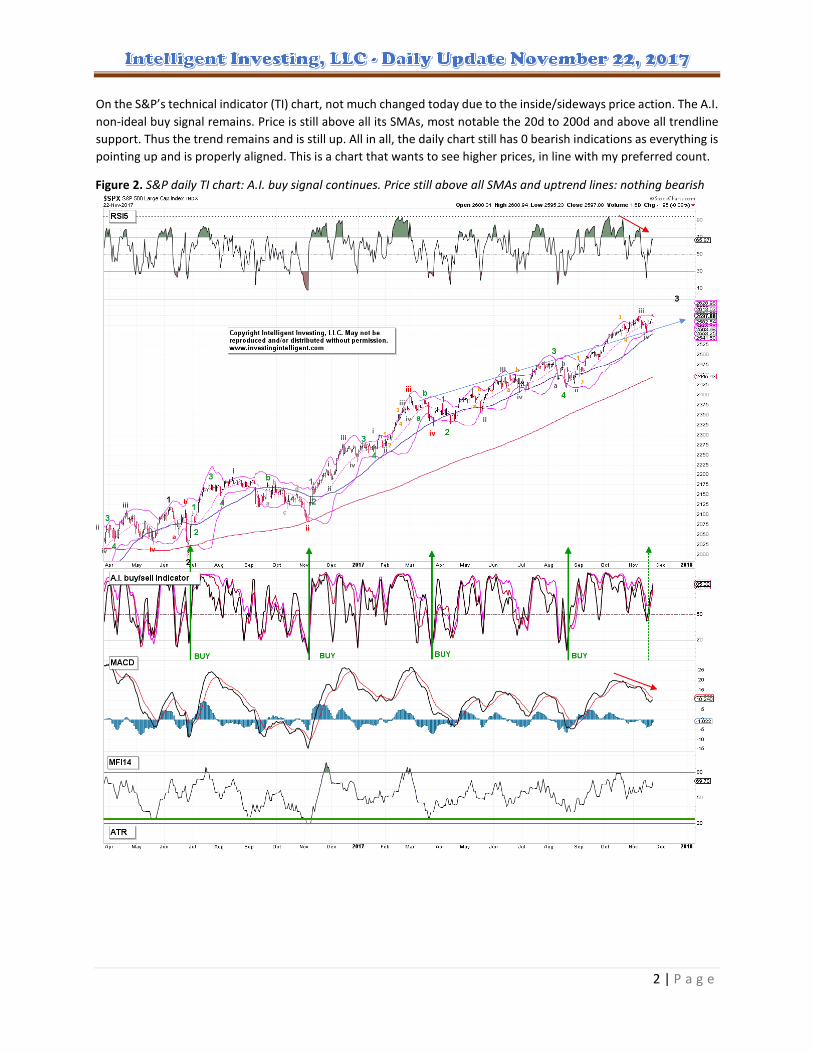
On the S&P’s technical indicator (TI) chart, not much changed today due to the inside/sideways price action. The A.I.
non-ideal buy signal remains. Price is still above all its SMAs, most notable the 20d to 200d and above all trendline
support. Thus the trend remains and is still up. All in all, the daily chart still has 0 bearish indications as everything is
pointing up and is properly aligned. This is a chart that wants to see higher prices, in line with my preferred count.
Figure 2. S&P daily TI chart: A.I. buy signal continues. Price still above all SMAs and uptrend lines: nothing bearish
3 | P a g e
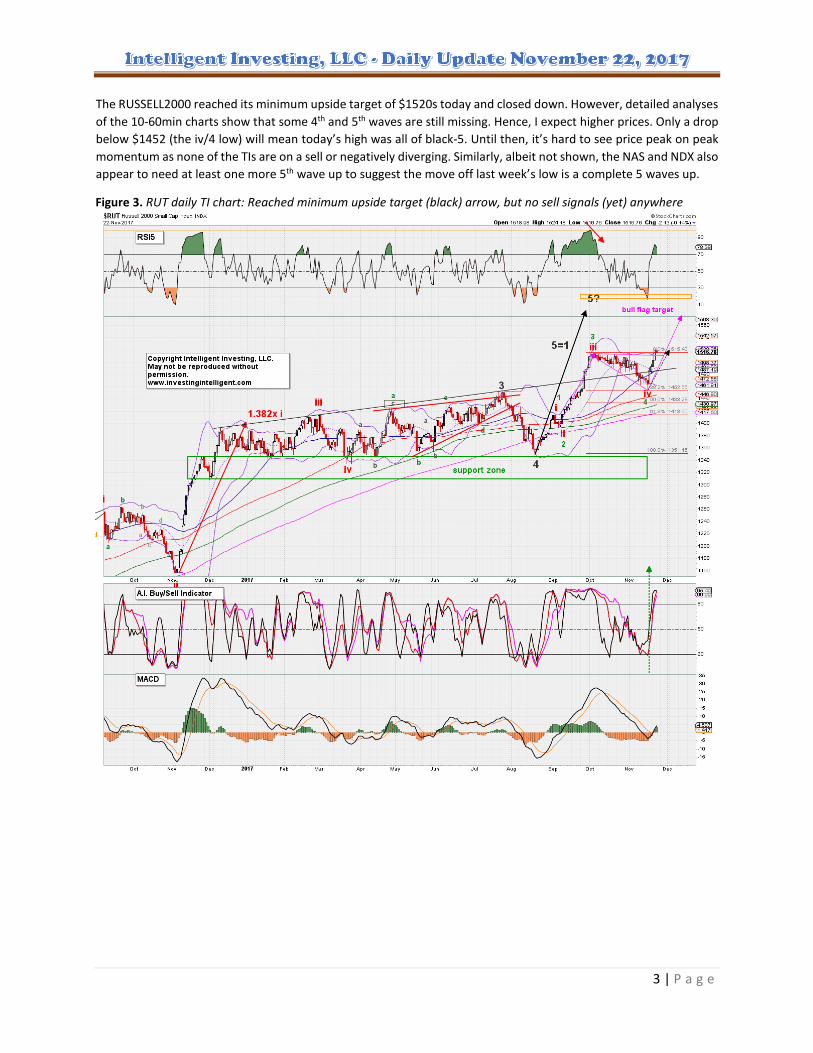
The RUSSELL2000 reached its minimum upside target of $1520s today and closed down. However, detailed analyses
of the 10-60min charts show that some 4th and 5th waves are still missing. Hence, I expect higher prices. Only a drop
below $1452 (the iv/4 low) will mean today’s high was all of black-5. Until then, it’s hard to see price peak on peak
momentum as none of the TIs are on a sell or negatively diverging. Similarly, albeit not shown, the NAS and NDX also
appear to need at least one more 5th wave up to suggest the move off last week’s low is a complete 5 waves up.
Figure 3. RUT daily TI chart: Reached minimum upside target (black) arrow, but no sell signals (yet) anywhere

4 | P a g e
The S&P500’s McClellan Oscillator (MO) ended today at +7, down 13p from yesterday’s close and thus confirming
today’s lower prices. But, like yesterday the NDX-MO, NAS-MO and NYMO continue to be positive. However, given
this is a 5th of a 5th wave; I don’t expect very high breadth readings for this last rally. As such, the SPX-SI ([Cumulative]
Summation Index of the MO) does remain on a sell. But, the NDX-SI and NAS-SI are almost on a buy. Today the NYA-
A/D cumulative line “for common stocks only” moved even higher making another new ATH. It continues to tell us
the markets want to go even higher.
Figure 3. SPX-SI still on a sell, as breadth is only marginally positive. NAS-SI and NDX-SI are almost on a buy. The NYA
A/D “common stock” cumulative line made another ATH today: more upside ahead.
5 | P a g e
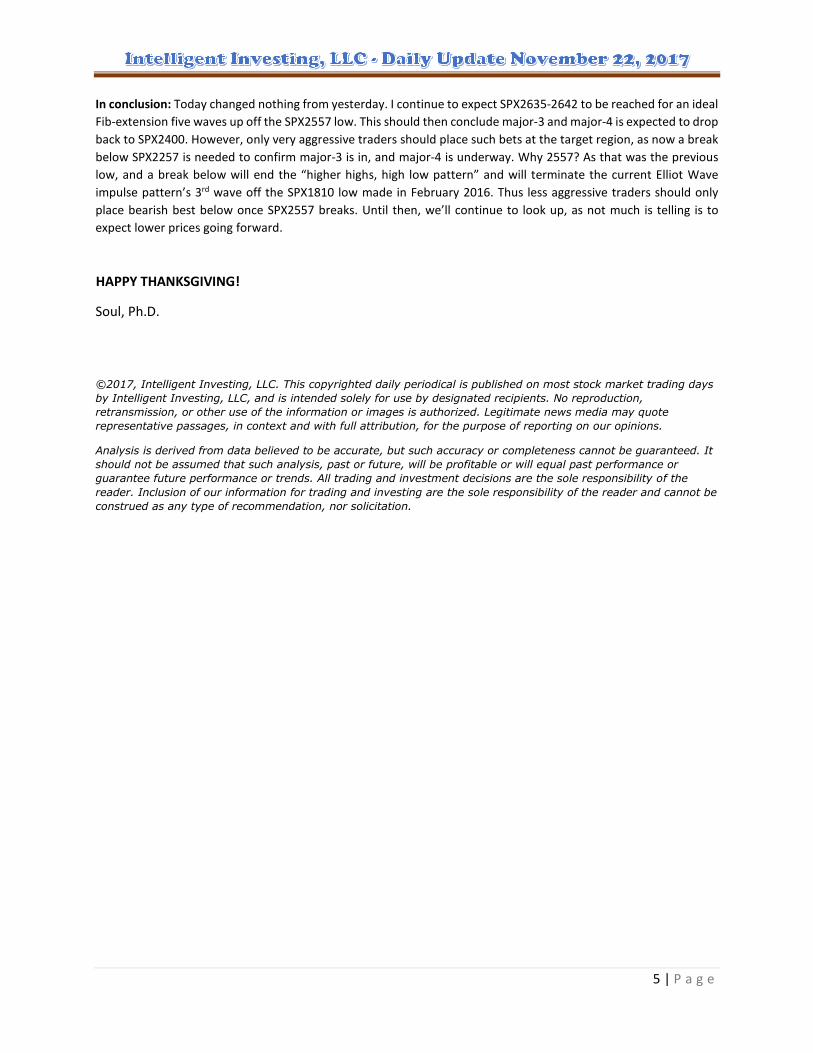
In conclusion: Today changed nothing from yesterday. I continue to expect SPX2635-2642 to be reached for an ideal
Fib-extension five waves up off the SPX2557 low. This should then conclude major-3 and major-4 is expected to drop
back to SPX2400. However, only very aggressive traders should place such bets at the target region, as now a break
below SPX2257 is needed to confirm major-3 is in, and major-4 is underway. Why 2557? As that was the previous
low, and a break below will end the “higher highs, high low pattern” and will terminate the current Elliot Wave
impulse pattern’s 3rd wave off the SPX1810 low made in February 2016. Thus less aggressive traders should only
place bearish best below once SPX2557 breaks. Until then, we’ll continue to look up, as not much is telling is to
expect lower prices going forward.
HAPPY THANKSGIVING!
Soul, Ph.D.
©2017, Intelligent Investing, LLC. This copyrighted daily periodical is published on most stock market trading days
by Intelligent Investing, LLC, and is intended solely for use by designated recipients. No reproduction,
retransmission, or other use of the information or images is authorized. Legitimate news media may quote
representative passages, in context and with full attribution, for the purpose of reporting on our opinions.
Analysis is derived from data believed to be accurate, but such accuracy or completeness cannot be guaranteed. It
should not be assumed that such analysis, past or future, will be profitable or will equal past performance or
guarantee future performance or trends. All trading and investment decisions are the sole responsibility of the
reader. Inclusion of our information for trading and investing are the sole responsibility of the reader and cannot be
construed as any type of recommendation, nor solicitation.
Related Documents