Yessotoxin induces ER-stress followed by autophagic cell death in glioma cells mediated by mTOR and BNIP3 J.A. Rubiolo a,d , H. López-Alonso a , P. Martínez b , A. Millán b , E. Cagide c , M.R. Vieytes d , F.V. Vega d , L.M. Botana a, ⁎ a Departamento de Farmacología, Facultad de Veterinaria, Universidad de Santiago de Compostela (USC), Campus Lugo, 27002 Lugo, Spain b Departamento de Genética, Facultad de Veterinaria, Universidad de Santiago de Compostela (USC), Campus de Lugo, 27002 Lugo, Spain c Laboratorio CIFGA S.A., Plaza de Santo Domingo 20, 5ta planta, 27002 Lugo, Spain d Departamento de Fisiología, Facultad de Veterinaria, Universidad de Santiago de Compostela (USC), Campus Lugo, 27002 Lugo, Spain abstract article info Article history: Received 6 September 2013 Received in revised form 9 October 2013 Accepted 17 October 2013 Available online 25 October 2013 Keywords: Yessotoxin Autophagic cell death ER-stress BNIP3 mTOR Lipid metabolism Yessotoxin at nanomolar concentrations can induce programmed cell death in different model systems. Paraptosis-like cell death induced by YTX in BC3H1 cells, which are insensitive to several caspase inhibitors, has also been reported. This makes yessotoxin of interest in the search of molecules that target cancer cells vulnerabilities when resistance to apoptosis is observed. To better understand the effect of this molecule at the molecular level on tumor cells, we conducted a transcriptomic analysis using 3 human glioma cell lines with different sensitivities to yessotoxin. We show that the toxin induces a deregulation of the lipid metabolism in glioma cells as a consequence of induction of endoplasmic reticulum stress. The endoplasmic reticulum stress in turn arrests the cell cycle and inhibits the protein synthesis. In the three cell lines used we show that YTX induces autophagy, which is involved in cell death. The sensibility of the cell lines used towards autophagic cell death was related to their doubling time, being the cell line with the lowest proliferation rate the most resis- tant. The involvement of mTOR and BNIP3 in the autophagy induction was also determined. © 2013 Elsevier Inc. All rights reserved. 1. Introduction Yessotoxin (YTX) is a polycyclic ether compound produced by dino- flagellates that accumulates in filter feeding shellfish [1,2]. It has been shown to modulate calcium gating inducing an increase in the cytosolic calcium in human lymphocytes which is prevented by the calcium channel antagonists nifedipine, thapsigargin, SFK96395 and verapamil [3–5]. However, YTX does not increase the level of basal Ca2+ and cAMP in cardiomyocytes [6]. Other reported effect of YTX, is the disruption of cell adhesion at low concentrations producing E-cadherin fragmentation in MCF-7 human breast cancer cells [7]. In epithelial cells, YTX altered cell–cell contacts and inhibited cell proliferation [8]. The involvement of mitochondrial permeability transition pore in YTX toxic effect has been studied in isolated mitochondria from rat livers, and in a hepatoma cell line [9]. Also the involvement of mitochon- dria in apoptosis induction by YTX has been reported for L6 and BC3H1 skeletal muscle myoblasts [10]. At nanomolar concentrations YTX can induce programmed cell death in different model systems [11]. YTX can also induce paraptosis- like cell death in BC3H1 cells [12], which is insensitive to several caspase inhibitors and proceeds in a caspase-independent manner [13]. This makes yessotoxin of interest in the search for molecules that target cancer cell vulnerabilities when resistance to apoptosis is the case. Accumulation of misfolded proteins due to chemical stress is capable of inducing endoplasmic reticulum stress (ER-stress) with the conse- quent activation of the unfolded protein response (UPR). The UPR leads to translation attenuation, preventing further accumulation of unfolded proteins, and cell cycle arrest. The proteins responsible for this response are PERK, IRE1 and ATF6 which are sensors of the protein folding inside of the endoplasmic reticulum [14,15]. Phosphorylation of PERK and its downstream target eIF2α has also been shown to induce autophagy [16,17], involved in the degradation of cellular components. Autophagy is negatively regulated by mTOR through the protein complex mTORC1 [18]. If autophagy persists and is not resolved this process can induce cell death [19]. In this work we show that YTX induces ER-stress, activates the UPR and induces autophagic cell death in glioma cells. To reach these conclusions we conducted a transcriptomic analysis using 3 human glioma cell lines with different Cellular Signalling 26 (2014) 419–432 Abbreviations: YTX, yessotoxin; DE, differentially expressed; UPR, unfolded protein re- sponse; ER-stress, endoplasmic reticulum stress; mTOR, mechanistic target of rapamycin (serine/threonine kinase); LC3, microtubule-associated protein 1 light chain 3 alpha; BNIP3, BCL2/adenovirus E1B 19 kDa interacting protein 3; SREBF, sterol regulatory element binding transcription factor; eIF2α, eukaryotic translation initiation factor 2A; PERK, eu- karyotic translation initiation factor 2-alpha kinase 3; DDIT3, DNA-damage-inducible tran- script 3; REDD1, DNA-damage-inducible transcript 4; U-XBP1, unspliced X-box binding protein 1; S-XBP1, spliced X-box binding protein 1; TRIB3, tribbles homolog 3 (Drosophila). ⁎ Corresponding author at: Departamento de Farmacología, Facultad de Veterinaria, USC, 27002 Lugo, Spain. Tel./fax: +982822233. E-mail address: [email protected] (L.M. Botana). 0898-6568/$ – see front matter © 2013 Elsevier Inc. All rights reserved. http://dx.doi.org/10.1016/j.cellsig.2013.10.004 Contents lists available at ScienceDirect Cellular Signalling journal homepage: www.elsevier.com/locate/cellsig

Welcome message from author
This document is posted to help you gain knowledge. Please leave a comment to let me know what you think about it! Share it to your friends and learn new things together.
Transcript

Cellular Signalling 26 (2014) 419–432
Contents lists available at ScienceDirect
Cellular Signalling
j ourna l homepage: www.e lsev ie r .com/ locate /ce l l s ig
Yessotoxin induces ER-stress followed by autophagic cell death in glioma cellsmediated by mTOR and BNIP3
J.A. Rubiolo a,d, H. López-Alonso a, P. Martínez b, A. Millán b, E. Cagide c, M.R. Vieytes d, F.V. Vega d, L.M. Botana a,⁎a Departamento de Farmacología, Facultad de Veterinaria, Universidad de Santiago de Compostela (USC), Campus Lugo, 27002 Lugo, Spainb Departamento de Genética, Facultad de Veterinaria, Universidad de Santiago de Compostela (USC), Campus de Lugo, 27002 Lugo, Spainc Laboratorio CIFGA S.A., Plaza de Santo Domingo 20, 5ta planta, 27002 Lugo, Spaind Departamento de Fisiología, Facultad de Veterinaria, Universidad de Santiago de Compostela (USC), Campus Lugo, 27002 Lugo, Spain
Abbreviations: YTX, yessotoxin; DE, differentially expresponse; ER-stress, endoplasmic reticulum stress; mTOR, m(serine/threonine kinase); LC3, microtubule-associated pBNIP3, BCL2/adenovirus E1B 19 kDa interacting protein 3; Sbinding transcription factor; eIF2α, eukaryotic translationkaryotic translation initiation factor 2-alpha kinase 3; DDITscript 3; REDD1, DNA-damage-inducible transcript 4; U-protein 1; S-XBP1, spliced X-box binding protein 1; TRIB3, t⁎ Corresponding author at: Departamento de Farmaco
USC, 27002 Lugo, Spain. Tel./fax: +982822233.E-mail address: [email protected] (L.M. Botana).
0898-6568/$ – see front matter © 2013 Elsevier Inc. All rihttp://dx.doi.org/10.1016/j.cellsig.2013.10.004
a b s t r a c t
a r t i c l e i n f oArticle history:Received 6 September 2013Received in revised form 9 October 2013Accepted 17 October 2013Available online 25 October 2013
Keywords:YessotoxinAutophagic cell deathER-stressBNIP3mTORLipid metabolism
Yessotoxin at nanomolar concentrations can induce programmed cell death in different model systems.Paraptosis-like cell death induced by YTX in BC3H1 cells, which are insensitive to several caspase inhibitors,has also been reported. This makes yessotoxin of interest in the search of molecules that target cancer cellsvulnerabilities when resistance to apoptosis is observed. To better understand the effect of this molecule at themolecular level on tumor cells, we conducted a transcriptomic analysis using 3 human glioma cell lines withdifferent sensitivities to yessotoxin. We show that the toxin induces a deregulation of the lipid metabolism inglioma cells as a consequence of induction of endoplasmic reticulum stress. The endoplasmic reticulum stressin turn arrests the cell cycle and inhibits the protein synthesis. In the three cell lines used we show that YTXinduces autophagy, which is involved in cell death. The sensibility of the cell lines used towards autophagiccell death was related to their doubling time, being the cell line with the lowest proliferation rate themost resis-tant. The involvement of mTOR and BNIP3 in the autophagy induction was also determined.
© 2013 Elsevier Inc. All rights reserved.
1. Introduction
Yessotoxin (YTX) is a polycyclic ether compound produced by dino-flagellates that accumulates in filter feeding shellfish [1,2]. It has beenshown tomodulate calcium gating inducing an increase in the cytosoliccalcium in human lymphocytes which is prevented by the calciumchannel antagonists nifedipine, thapsigargin, SFK96395 and verapamil[3–5]. However, YTX does not increase the level of basal Ca2+ andcAMP in cardiomyocytes [6].
Other reported effect of YTX, is the disruption of cell adhesion at lowconcentrations producing E-cadherin fragmentation in MCF-7 humanbreast cancer cells [7]. In epithelial cells, YTX altered cell–cell contactsand inhibited cell proliferation [8].
ssed; UPR, unfolded protein re-echanistic target of rapamycinrotein 1 light chain 3 alpha;REBF, sterol regulatory elementinitiation factor 2A; PERK, eu-3, DNA-damage-inducible tran-XBP1, unspliced X-box bindingribbles homolog 3 (Drosophila).logía, Facultad de Veterinaria,
ghts reserved.
The involvement of mitochondrial permeability transition pore inYTX toxic effect has been studied in isolated mitochondria from ratlivers, and in a hepatomacell line [9]. Also the involvement ofmitochon-dria in apoptosis induction by YTX has been reported for L6 and BC3H1skeletal muscle myoblasts [10].
At nanomolar concentrations YTX can induce programmed celldeath in different model systems [11]. YTX can also induce paraptosis-like cell death in BC3H1 cells [12], which is insensitive to several caspaseinhibitors and proceeds in a caspase-independent manner [13]. Thismakes yessotoxin of interest in the search for molecules that targetcancer cell vulnerabilities when resistance to apoptosis is the case.
Accumulation ofmisfolded proteins due to chemical stress is capableof inducing endoplasmic reticulum stress (ER-stress) with the conse-quent activation of the unfolded protein response (UPR). The UPRleads to translation attenuation, preventing further accumulation ofunfolded proteins, and cell cycle arrest. The proteins responsible forthis response are PERK, IRE1 and ATF6 which are sensors of the proteinfolding inside of the endoplasmic reticulum [14,15]. Phosphorylation ofPERK and its downstream target eIF2α has also been shown to induceautophagy [16,17], involved in the degradation of cellular components.Autophagy is negatively regulated by mTOR through the proteincomplex mTORC1 [18]. If autophagy persists and is not resolved thisprocess can induce cell death [19]. In this work we show that YTXinduces ER-stress, activates the UPR and induces autophagic celldeath in glioma cells. To reach these conclusions we conducted atranscriptomic analysis using 3 human glioma cell lines with different
420 J.A. Rubiolo et al. / Cellular Signalling 26 (2014) 419–432
sensitivities to YTX. This study was followed by several experiments toconfirm the observed effects of YTX on transcription. We show thatYTX induces a deregulation of the lipid metabolism as a consequenceof endoplasmic reticulum (ER) stress. The ER stress in turn arrests thecell cycle and inhibits the protein synthesis also inducing an incrementin themitochondrialmembrane potential. In the three cell lines usedweshow that YTX induces autophagy, through mTORC1 inhibition andBNIP3 induction, which is involved in cell death.
2. Materials and methods
2.1. Toxin and cell lines used
Yessotoxin was of commercial origin (CIFGA), 99% pure, and dis-solved in DMSO. The cell lines used in this workwere the human gliomaderived cell lines SF295, SF539 and SNB75 (National Cancer Institute,NCI-60 cell line panel). Cells were cultured in RPMI 1640 medium(GIBCO®) supplemented with 10% fetal bovine serum (CAMBREX),50 UI/ml penicillin (Calbiochem) and 0.6 μM streptomycin (SIGMA) at37 °C in a humidified 5% CO2 atmosphere.
2.2. Cell viability assay
Cells were seeded in 96-well cell culture plates at a concentrationof 10,000 cells per well in 100 μl of medium. Twenty four hours afterplating, cells were incubated for different times with YTX, as describedin the results section. Cell viability was determined by the MTTmethodas previously described [20].
2.3. Microarray assay
SF295, SF539 and SNB75 cells were seeded in 6-well plates. Whenthe cells reached 80% confluence the medium was changed and 12 hlater SF295 cells were treated with 30nM YTX while SF539 and SNB75cells were treated with 250nM YTX. Each treatment was performed induplicate. After 6 and 24 h total RNA was extracted with the RNeasyMini Kit (QIAGEN) following the manufacturer's instructions. RNA con-centration was determined with a NanoDrop 2000 (Thermo Scientific),and its integrity confirmed with a Bioanalyzer 2100 (Agilent Technolo-gies) using the kit RNA 6000 nano reagents (Agilent Technologies)following the manufacturer instructions.
To obtain fluorescently labeled RNA formicroarray hybridizationweused the Low RNA Input Linear Amp Kit (Agilent Technologies) and theQuick-Amp Labeling Kit (Agilent Technologies) and followed themanu-facturer instructions. Labeled RNAwashybridized to 44KAgilentWholeHuman Genome Oligo Microarrays (G4112F). The microarrays werescanned with a G2505 scanner (Agilent Technologies) using one colorscan setting for 4×44K array slides (Scan Area 61×21.6mm, Scan res-olution 5μm, Dye channel is set to Green, and Extended Dynamic RangeScan Mode (Hi; 100%, Low;10%)). In each slide, 4 microarrays includingone control and three YTX cell treatments were used. The scanned im-ages were analyzed with the Feature Extraction Software 9.5.3 (AgilentTechnologies) using default parameters (protocol GE1-v1_95 and Grid:014850_D_F_20060807). Normalization within each microarray wascarried out using the LOESS method, which assumes that most genesin microarrays are not differentially expressed versus the control.
2.4. Gene expression analysis
Differentially expressed (DE) genes between control and YTX treat-ed cells were identified using the TM4 Microarray Software Suite[21,22]. Gene lists were analyzed for DE genes using the statistic toolsRANK PRODUCTS and SAM set at pb0.05. Datamining for significant al-tered metabolic pathways and ontological categories at the biologicalprocess level 5, in YTX treated cells with respect to control cells, wasperformed with the DAVID Bioinformatics Database [23,24].
2.5. Western blot
SF295, SF539 and SNB75 cells were seeded in 6-well plates andtreated with 30 or 250 nM YTX for 24 or 48 h. After treatment, cellswere suspended in lysis buffer (50mM Tris–HCl, 150mM NaCl, 1mMEDTA, 1% Triton X-100) containing protease and phosphatase inhibitorsand sonicated. The protein concentration of the cell lysates was deter-mined by the Bradford assay [25]. Cell lysates were resolved by SDS-PAGE and transferred to PVDF membranes (MILLIPORE). Membraneswere blocked with 3% milk, or 3% BSA for phospho-protein detection,dissolved in PBS and 0.1% Tween 20 for 1 h. The membranes werethen incubated with primary antibodies dissolved in blocking solution,for 4 h at room temperature. The primary antibodies used were:anti-phospho-eIF2α (Santa Cruz Biotechnology), anti-phospho-PERK (Santa Cruz Biotechnology), anti-DDIT3 (Santa Cruz Biotechnolo-gy), anti-LC3 (SIGMA), anti-phospho-mTOR (Millipore), anti-phophoS6 kinase (Millipore) and anti-βtubulin (Millipore). The secondaryHRP conjugated antibodies, dissolved in the same solution as primaryantibodies, were incubated for 1 h at room temperature. The mem-branes were revealed with SuperSignal®West Pico (Thermo Scientific)or SuperSignal West Femto (Thermo Scientific), and image acquisitionwas made with the Dyversity system (Syngene). The differences inprotein expression between treatments were determined with theimage analysis software GeneTools, using βtubulin as reference.
2.6. Reverse transcription, PCR and qPCR
SF295, SF539 and SNB75 cells were treated with 30 or 250nM YTX,and 24 or 48h later total RNAwas purified as indicated for the microar-ray assay in materials and methods. After DNAse treatment, reversetranscription of total RNA was performed using an oligo-dT with theRevertAid™M-MuLV reverse transcriptase (Fisher Scientific) followingthe manufacturer's instructions.
For the detection of unspliced and spliced XBP1, cDNAwas ampli-fied with 25 amplification cycles using the oligonucleotideshXBP1.3S (5′-A AAC AGA GTA GCA GCT CAG ACT GC-3′) andhXBP1.12AS (5′-TC CTT CTG GGT AGA CCT CTG GGA G-3′) capableof amplifying both variants. At the same time tubulin was amplifiedto determine the equal loading of each cDNA sample. Amplificationproducts were resolved in a 3% agarose gel.
For real-time PCR, cDNA was amplified in a StepOne real-time PCR(Applied Biosystems) with a FastStartTM Universal SYBR Green MasterKit (ROCHE), following the manufacturer's instructions and using theΔΔCTmethod to determine variations in themRNA expression betweentreatments. Each treatment was analyzed in triplicate and three exper-iments were done.
2.7. Flow cytometry
Cells treated for 24hwith 30 or 250nMYTXwere detached from theplates with 0.25% trypsin and 0.2% EDTA and washed twice with PBS.Flow cytometry was performed as previously described [26].
2.8. Confocal microscopy
In all cases SF295, SF539 and SNB75 cells were cultured on coverslips and after reaching 80% confluence they were treated with 30 or250 nM YTX for 24 h. Cells were fixed with 4% paraformaldehyde for15min at 4 °C except when ER-TRACKER and JC-1 were used.
Cholesterolwas stained using Filipin III (SIGMA) and lipids usingRedNile (SIGMA), following the manufacturer's instructions.
To assess ER-stress the dye ER-TRACKER (Invitrogen) was used.After toxin incubation, cells were washed with HBSS and incubatedwith 0.1 μM ER-TRACKER dissolved in HBSS for 30min at 37 °C. Finallythe staining solution was replaced with fresh medium and the coverslips analyzed.
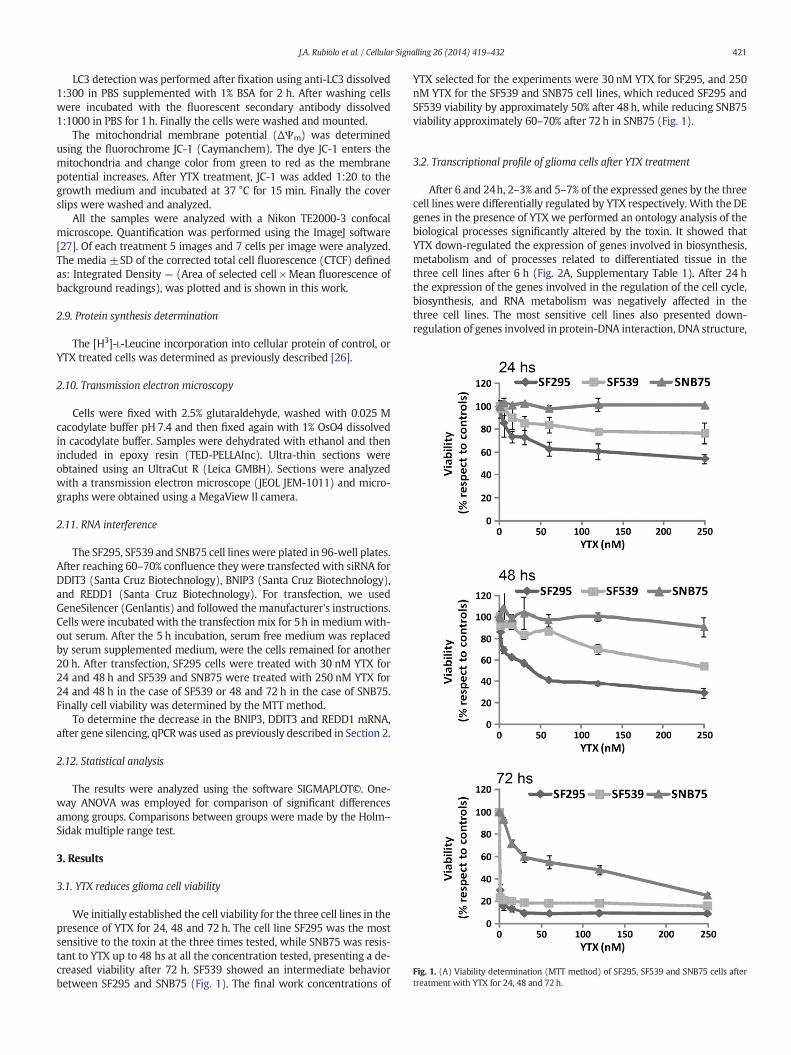
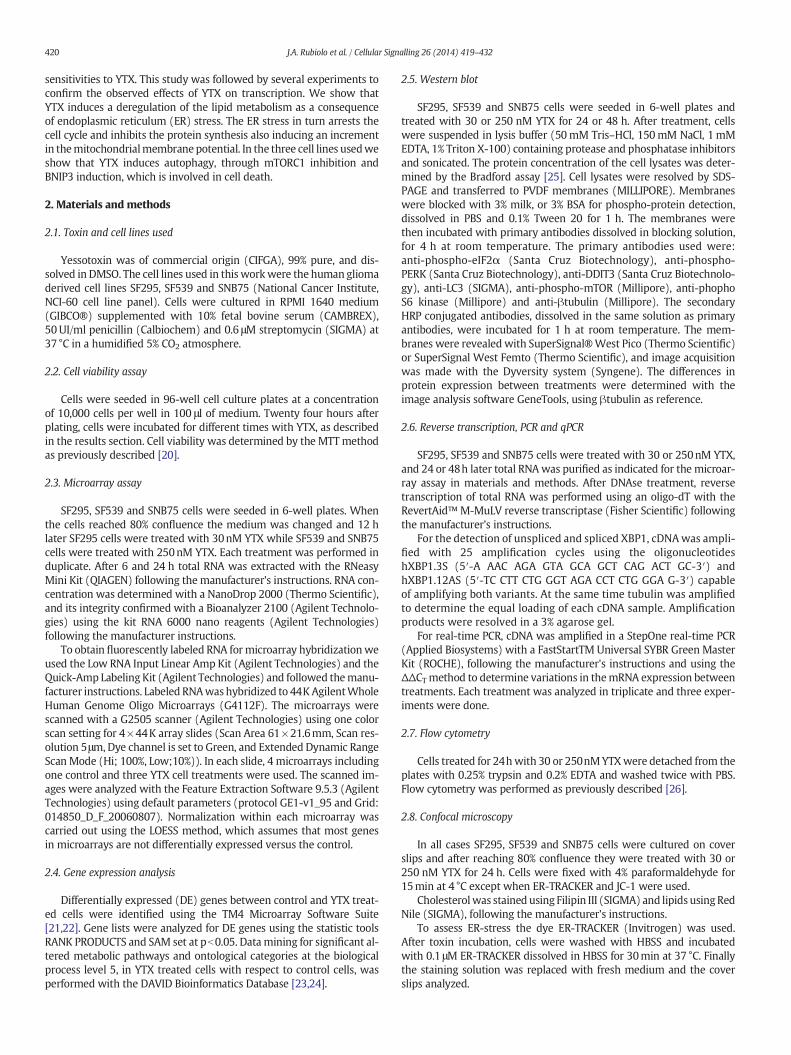
Fig. 1. (A) Viability determination (MTT method) of SF295, SF539 and SNB75 cells aftertreatment with YTX for 24, 48 and 72 h.
421J.A. Rubiolo et al. / Cellular Signalling 26 (2014) 419–432
LC3 detection was performed after fixation using anti-LC3 dissolved1:300 in PBS supplemented with 1% BSA for 2 h. After washing cellswere incubated with the fluorescent secondary antibody dissolved1:1000 in PBS for 1h. Finally the cells were washed and mounted.
The mitochondrial membrane potential (ΔΨm) was determinedusing the fluorochrome JC-1 (Caymanchem). The dye JC-1 enters themitochondria and change color from green to red as the membranepotential increases. After YTX treatment, JC-1 was added 1:20 to thegrowth medium and incubated at 37 °C for 15 min. Finally the coverslips were washed and analyzed.
All the samples were analyzed with a Nikon TE2000-3 confocalmicroscope. Quantification was performed using the ImageJ software[27]. Of each treatment 5 images and 7 cells per image were analyzed.The media ±SD of the corrected total cell fluorescence (CTCF) definedas: Integrated Density — (Area of selected cell ×Mean fluorescence ofbackground readings), was plotted and is shown in this work.
2.9. Protein synthesis determination
The [H3]-L-Leucine incorporation into cellular protein of control, orYTX treated cells was determined as previously described [26].
2.10. Transmission electron microscopy
Cells were fixed with 2.5% glutaraldehyde, washed with 0.025 Mcacodylate buffer pH 7.4 and then fixed again with 1% OsO4 dissolvedin cacodylate buffer. Samples were dehydrated with ethanol and thenincluded in epoxy resin (TED-PELLAInc). Ultra-thin sections wereobtained using an UltraCut R (Leica GMBH). Sections were analyzedwith a transmission electron microscope (JEOL JEM-1011) and micro-graphs were obtained using a MegaView II camera.
2.11. RNA interference
The SF295, SF539 and SNB75 cell lines were plated in 96-well plates.After reaching 60–70% confluence they were transfected with siRNA forDDIT3 (Santa Cruz Biotechnology), BNIP3 (Santa Cruz Biotechnology),and REDD1 (Santa Cruz Biotechnology). For transfection, we usedGeneSilencer (Genlantis) and followed the manufacturer's instructions.Cells were incubated with the transfection mix for 5h in mediumwith-out serum. After the 5 h incubation, serum free medium was replacedby serum supplemented medium, were the cells remained for another20 h. After transfection, SF295 cells were treated with 30 nM YTX for24 and 48 h and SF539 and SNB75 were treated with 250 nM YTX for24 and 48 h in the case of SF539 or 48 and 72 h in the case of SNB75.Finally cell viability was determined by the MTT method.
To determine the decrease in the BNIP3, DDIT3 and REDD1 mRNA,after gene silencing, qPCRwas used as previously described in Section 2.
2.12. Statistical analysis
The results were analyzed using the software SIGMAPLOT©. One-way ANOVA was employed for comparison of significant differencesamong groups. Comparisons between groups were made by the Holm–
Sidak multiple range test.
3. Results
3.1. YTX reduces glioma cell viability
We initially established the cell viability for the three cell lines in thepresence of YTX for 24, 48 and 72 h. The cell line SF295 was the mostsensitive to the toxin at the three times tested, while SNB75 was resis-tant to YTX up to 48 hs at all the concentration tested, presenting a de-creased viability after 72 h. SF539 showed an intermediate behaviorbetween SF295 and SNB75 (Fig. 1). The final work concentrations of
YTX selected for the experiments were 30 nM YTX for SF295, and 250nM YTX for the SF539 and SNB75 cell lines, which reduced SF295 andSF539 viability by approximately 50% after 48h, while reducing SNB75viability approximately 60–70% after 72h in SNB75 (Fig. 1).
3.2. Transcriptional profile of glioma cells after YTX treatment
After 6 and 24h, 2–3% and 5–7% of the expressed genes by the threecell lines were differentially regulated by YTX respectively. With the DEgenes in the presence of YTX we performed an ontology analysis of thebiological processes significantly altered by the toxin. It showed thatYTX down-regulated the expression of genes involved in biosynthesis,metabolism and of processes related to differentiated tissue in thethree cell lines after 6 h (Fig. 2A, Supplementary Table 1). After 24 hthe expression of the genes involved in the regulation of the cell cycle,biosynthesis, and RNA metabolism was negatively affected in thethree cell lines. The most sensitive cell lines also presented down-regulation of genes involved in protein-DNA interaction, DNA structure,

Fig. 2. Plots of the biological processes altered by YTX in SF295, SF539 and SNB75 cells, based on the genes included in the significant ontological categories at level 5 (EASE threshold=0.01)of biologic processes (shown in the Supplementary Table 1). SF295 cells were treatedwith 30nMYTX,while the other two cell lineswere treatedwith 250nMYTX. Down-regulated after 6h(A) and 24 h (B). Up-regulated after 6 h (C) and 24 h (D).
422 J.A. Rubiolo et al. / Cellular Signalling 26 (2014) 419–432

423J.A. Rubiolo et al. / Cellular Signalling 26 (2014) 419–432
and DNA replication and repair (Fig. 2B, Supplementary Table 1). Theup-regulated biological processes after 6 h were mainly involved inthe regulation of the cell migration, Ca2+ homeostasis, biosynthesis,and cell signaling (Fig. 2C, Supplementary Table 1). After 24 h the up-regulated processes shared by the three cell lines were those involvedin sterol metabolism, cell death, migration, endoplasmic reticulum, re-sponse to nutrient, biosynthesis andmetabolism (Fig. 2D, Supplementa-ry Table 1).
To gain a clearer insight of the gene expression pattern inducedby YTX in the three cell lines studied, we compared DE mRNAs in-duced by YTX in SF295 with the significantly DE mRNAs in SF539and SNB75. Venn diagrams obtained with the negatively regulatedbiological processes after 24 h indicated that YTX down-regulatedprocesses involved in biosynthesis, transcription, protein foldingand degradation, cell cycle regulation, and DNA replication and re-pair (Fig. 3A, Supplementary Table 2). Some of these biological pro-cesses were also significantly altered when comparing SF295 vs.SF539, SF295 vs. SNB75 and SF539 vs. SNB75. Positively regulatedprocesses by YTX in the three lines, were those involved in the un-folded protein response, lipid homeostasis, carbohydrate metabolism,regulation of gene expression, and steroid biosynthesis and metabolism(Fig. 3, Supplementary Table 2).
Fig. 3. (A) Venn diagrams of the down-regulated biological processes by YTX after 24h shared bold=0.01) of biologic processes (shown in Supplementary Table 2). (B) Venn diagrams of thethe significant ontological categories at level 5 (EASE threshold=0.01) of biologic processes (
3.3. YTX induces ER-stress in glioma cells
Among the ontological up-regulated categories in the three cell lineswere the unfolded protein response (UPR), together with lipid and ste-rol metabolism. These processes take place in the endoplasmic reticu-lum, so we decided to study the effect of YTX on this organelle inorder to establish if the toxin induced ER-stress with the consequentUPR. The increased expression of the ER-stress sensors PERK, eIF2αand DDIT3 was validated by qPCR (Fig. 4A). At the protein level, we ob-served the up-regulation of DDIT3 and of the phosphorylated forms ofeIF2α and PERK after exposure to YTX for 24h (Fig. 4B). Densitometryanalysis showed a significant increase in P-PERK, P-eIF2α and DDIT3(Fig. 4C). Since ER-stress induces cytosolic splicing of U-XBP1 that pro-duces a smaller transcript (S-XBP1), we reverse transcribed the RNA ofcontrol and YTX treated cells and amplified the resulting cDNA by PCRwith oligonucleotides that amplified both forms of XBP1. PCR resultsshowed the appearance of a second smaller band in YTX treated cellsafter 24 h in SF295 and SF539 and after 48 h in SNB75 cells, indicativeof XBP1 splicing as a consequence of ER-stress in YTX treated cells(Fig. 4D). To further confirm the ER stress, we stained control and YTXtreated cell with ER-Tracker and observed a fluorescence intensity in-crease in YTX treated cells after 6 and 24h, which was more noticeable
y the three cell lines, based on the significant ontological categories at level 5 (EASE thresh-up-regulated biological processes by YTX after 24h shared by the three cell lines, based onshown in Supplementary Table 2).

Fig. 4. (A) Validation of themicroarray results for PERK, eIF2α andDDIT3 byqPCR for cells treated for 24hwith YTX (30nM for SF295 and250nM for SF539 and SNB75). (B) Detection of P-eIF2α, P-PERK, and DDIT3 by western blot in control and YTX treated cells. Tubulin was used as loading control. (C) Densitometry analysis of the western blots shown in A. * significantdifferences respect to controls (pb0.01, n=2). (D)Agarose gel electrophoresis of the PCR products obtained after amplifying the cDNA from control and YTX treated cells (30nMfor SF295and 250nM for SF539 and SNB75) using oligonucleotides capable of amplifying the un-spliced and the spliced forms of XBP1 (see Section 2 for primers sequences). (E) Confocal micros-copy of control and YTX treated cells stained with ER-Tracker showing and increased fluorescence in treated cells after 6 and 24 h.
424 J.A. Rubiolo et al. / Cellular Signalling 26 (2014) 419–432
in the SF295 cell line (Fig. 4E and Supplementary Fig. 1). The increasedexpression of several genes involved in the response against ER-stressdetected by microarray analysis are presented in Supplementary Fig. 2.
3.4. ER-stress induced by YTX arrest cell cycle and inhibits protein synthesisin glioma cells
Cell cycle arrest at G0/G1 and inhibition of protein synthesis areobserved during ER-stress, and after eIF2α phosphorylation. To assessif this was the case for YTX treated cells, the cell cycle was investigatedby flow cytometry and protein synthesis by LEU-H3 incorporation. Weobserved an increase in the G0/G1 cell population with a decrease in
the G2/M phase in YTX treated cells (Fig. 5A). The cyclin expressionwas down-regulated as observed in the microarray results and aftervalidation by qPCR (Fig. 5B). Protein synthesis decreased in the threecell lines when treated with YTX (Fig. 5C).
3.5. YTX increases the cholesterol and polar lipid content in glioma cells
Hierarchical clustering of microarray data showed that after 6 hsof YTX exposure there was a down-regulation of genes coding forSREBP1 and 2, besides down-regulation or no significant change in theexpression of genes coding for cholesterol synthesizing enzymes. After24 h these genes appeared up-regulated in YTX-treated cells (Fig. 6A).

Fig. 5. (A) Plot showing the population in eachphase of the cell cycle after 24h, in control and YTX treated cells (30nM for SF295 and 250nM for SF539 and SNB75). * significant differencesrespect to controls (pb0.01, n=3). (B) Down-regulation of cyclins A2, B1, B2, D3, E1, E2, and F expression in YTX (at the same concentrations as inA) treated cells after 24h as determinedbymicroarray analysis and after validation byqPCR. (C) Protein synthesis after 6 and 24h in control and YTX (at the same concentrations as inA) treated cells. * significant differenceswithrespect to controls (p b 0.01, n= 3).
425J.A. Rubiolo et al. / Cellular Signalling 26 (2014) 419–432
Several of these DE genes were validated by qPCR (SupplementaryFig. 3). To determine if the transcriptional up-regulation of the sterolmetabolism induced an increase in cholesterol, cells were treated withYTX for 24 hs and analyzed by confocal microscopy after staining withFilipin III. A cholesterol increase was observed in YTX treated cells(Fig. 6B and C).
Besides cholesterol synthesis, SREBPs control lipid metabolism.Since hierarchical clustering showed that genes involved in lipid syn-thesis where up-regulated after 24 h of YTX treatment (Fig. 7A), thelipid content of the cells was studied. We detected an increase in thepolar lipid content with a decrease of nonpolar lipids in the three celllines after treatment with YTX for 24h (Fig. 7B and C).
3.6. ER-stress is not directly involved in cell death induction
Persistent ER-stress has been shown to induce apoptosis throughDDIT3, sowe assessed if thiswas the case by silencing DDIT3. RNA inter-ference experiments showed that DDIT3 knockdown had no effect inthe toxicity of YTX in the three cell lines (results not shown). Also, nocytoprotection was observed after incubating the cell lines with the
caspases inhibitor Z-VAD-FMK in the presence of YTX (results notshown).
3.7. YTX induces autophagy in glioma cells
Electron microscopy showed that YTX induced the appearance ofautophagosomes containing peroxysomes and mitochondria (Fig. 8A).Autophagy was confirmed by the increase in LC3-I expression and ap-pearance of LC3-II in YTX treated cells by western blot (Fig. 8B and C).Also, LC3 aggregation was observed in the cytosol of YTX treated cells(Fig. 8F). Since inhibition of mTOR is involved in autophagy induction,we studied if YTX altered mTOR phosphorylation. As observed bywestern blot, YTX treated cells had a lower degree of phosphorylatedmTOR on serine 2448 (characteristic of mTOR in mTORC1) and of thedownstream S6 kinase (Fig. 8D and E).
To determine if mTOR inhibition was involved in the YTX cytotoxic-ity, we treated the three cell lines with YTX or YTX plus EGF which in-duces mTOR phosphorylation. We observed a lower cytotoxicity inYTX plus EGF treated cell when compared with YTX treated cells(Fig. 9A). LC3-II was also lower in cells treated with the growth factor

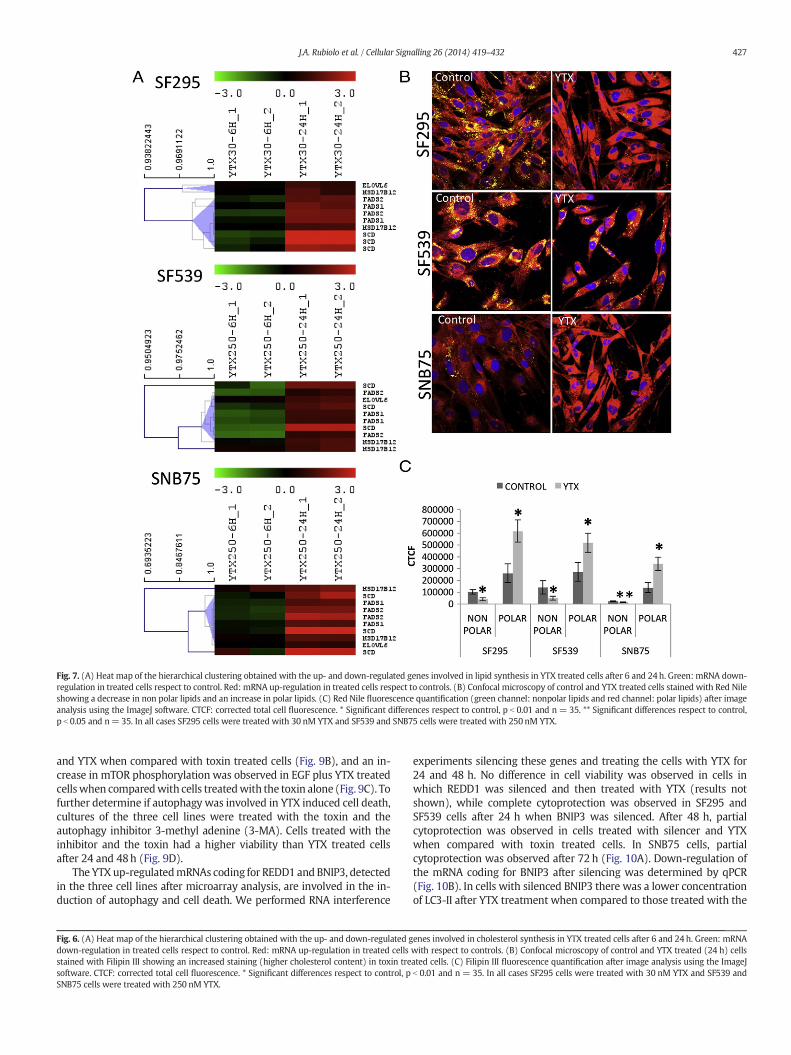
Fig. 7. (A) Heat map of the hierarchical clustering obtained with the up- and down-regulated genes involved in lipid synthesis in YTX treated cells after 6 and 24h. Green: mRNA down-regulation in treated cells respect to control. Red: mRNA up-regulation in treated cells respect to controls. (B) Confocal microscopy of control and YTX treated cells stained with Red Nileshowing a decrease in non polar lipids and an increase in polar lipids. (C) Red Nile fluorescence quantification (green channel: nonpolar lipids and red channel: polar lipids) after imageanalysis using the ImageJ software. CTCF: corrected total cell fluorescence. * Significant differences respect to control, p b 0.01 and n= 35. ** Significant differences respect to control,p b 0.05 and n=35. In all cases SF295 cells were treated with 30 nM YTX and SF539 and SNB75 cells were treated with 250 nM YTX.
427J.A. Rubiolo et al. / Cellular Signalling 26 (2014) 419–432
and YTX when compared with toxin treated cells (Fig. 9B), and an in-crease in mTOR phosphorylation was observed in EGF plus YTX treatedcellswhen comparedwith cells treatedwith the toxin alone (Fig. 9C). Tofurther determine if autophagy was involved in YTX induced cell death,cultures of the three cell lines were treated with the toxin and theautophagy inhibitor 3-methyl adenine (3-MA). Cells treated with theinhibitor and the toxin had a higher viability than YTX treated cellsafter 24 and 48h (Fig. 9D).
The YTX up-regulatedmRNAs coding for REDD1 and BNIP3, detectedin the three cell lines after microarray analysis, are involved in the in-duction of autophagy and cell death. We performed RNA interference
Fig. 6. (A) Heat map of the hierarchical clustering obtained with the up- and down-regulated gdown-regulation in treated cells respect to control. Red: mRNA up-regulation in treated cellsstained with Filipin III showing an increased staining (higher cholesterol content) in toxin tresoftware. CTCF: corrected total cell fluorescence. * Significant differences respect to control, pSNB75 cells were treated with 250 nM YTX.
experiments silencing these genes and treating the cells with YTX for24 and 48 h. No difference in cell viability was observed in cells inwhich REDD1 was silenced and then treated with YTX (results notshown), while complete cytoprotection was observed in SF295 andSF539 cells after 24 h when BNIP3 was silenced. After 48 h, partialcytoprotection was observed in cells treated with silencer and YTXwhen compared with toxin treated cells. In SNB75 cells, partialcytoprotection was observed after 72 h (Fig. 10A). Down-regulation ofthe mRNA coding for BNIP3 after silencing was determined by qPCR(Fig. 10B). In cells with silenced BNIP3 there was a lower concentrationof LC3-II after YTX treatment when compared to those treated with the
enes involved in cholesterol synthesis in YTX treated cells after 6 and 24 h. Green: mRNAwith respect to controls. (B) Confocal microscopy of control and YTX treated (24 h) cellsated cells. (C) Filipin III fluorescence quantification after image analysis using the ImageJb 0.01 and n = 35. In all cases SF295 cells were treated with 30 nM YTX and SF539 and

P-mTOR
P-mTOR
P-mTOR
P-S6 kinase
P-S6 kinase
P-S6 kinase
Tubulin
Tubulin
Tubulin
Control YTXS
F295
SF
539S
NB
75
LC3-ILC3-II
TUB.
CONTROL YTX
CONTROL YTX-24H YTX-48HS
F29
5S
F53
9S
NB
75A
B
SF
295
SF
539
SN
B75
SF
295
24 H 48 H 72 H
SF
539
SN
B75
Control
Control
Control
YTX
YTX
YTX
YTX
YTX
YTX
C
D
LC3-II
TUB.
LC3-I
LC3-II
TUB.
LC3-I
0
0.5
1
1.5
2
2.5
3
SF295-LC3I
SF539-LC3I
SNB75-LC3I
SF295-LC3II
SF539-LC3II
SNB75-LC3II
Fo
ld c
han
ge
0
5
10
15
20
25
30
Fo
ld c
han
ge
* **
0
0.2
0.4
0.6
0.8
1
1.2
1.4
SF295-P-S6kinase
SF539-P-S6kinase
SNB75-P-S6kinase
Fo
ld c
han
ge
*
* *
0
0.2
0.4
0.6
0.8
1
1.2
1.4
1.6
SF295-P-mTOR
SF539-P-mTOR
SNB75-P-mTOR
Fo
ld c
han
ge
* **
* * *
E
F
YTX
YTX
YTX
Fig. 8. (A) Electron microscopy of control and YTX treated cells showing the presence of autophagosomes (arrows) in toxin treated cells after 24 and 48 h. Arrowheads: mitochondria.(B) Western blots of soluble protein from control and YTX treated cells for 24 h. Toxin treated cells show an increase in LC3-I and the appearance of LC3-II, characteristic of autophagy.(C) Quantification of the western blots shown in B. Gray: control, Light gray: YTX. * Significant differences respect to control, p b 0.01 and n= 2. ** Significant differences with respectto control, p b 0.05 and n = 2. (D) Western blots of soluble protein form control and YTX treated cells for 24 h. Toxin treated cells show a decrease in serine 2448 phospho-mTORand phospho-S6 kinase. (E) Quantification of the western blots shown in D. Gray: control, Light gray: YTX. * Significant differences respect to control, p b 0.01 and n= 2. (F) Confocalmicroscopy of control and YTX treated cells after LC3 staining. YTX treated cells show aggregated LC3 in the cytosol, characteristic of autophagy. In all cases SF295 cells were treatedwith 30 nM YTX and SF539 and SNB75 cells were treated with 250 nM YTX.
428 J.A. Rubiolo et al. / Cellular Signalling 26 (2014) 419–432

Fig. 9. (A) Viability of control, YTX or YTX plus EGF treated cells determined by the MTT method. * significant differences with respect to controls (p b 0.01, n=8). (B) Detection of LC3and phospho-mTOR, by western blot in control, YTX or YTX plus EGF treated cells. (C) Cell viability after treatment with YTX in the presence of 0.5 or 1mM 3-MA after 24, 48 and 72 h.* significant differences with respect to controls (p b 0.01, n= 8). In all cases SF295 cells were treated with 30 nM YTX and SF539 and SNB75 cells were treated with 250 nM YTX.
429J.A. Rubiolo et al. / Cellular Signalling 26 (2014) 419–432
toxin alone (Fig. 10C). Since BNIP3 mediated mitochondrial autophagyis independent of the mitochondrial permeability transition pore, wemeasured the mitochondrial membrane potential in YTX treated orcontrol cells and detected a higher degree of mitochondrial oxidativemetabolism in cells treated with YTX after 24 and 48h than in controlcells after confocal microscopy analysis of JC-1 stained cells (Fig. 10D).
4. Discussion
In this work we show that YTX induces several transcriptionalchanges in glioma cells. Of the altered pathways, the lipid metabolismis one of the most affected, together with genes involved in the regula-tion of cell cycle, cell death and glucosemetabolism. The three cell linesshowed a similar transcriptional response for genes involved in lipidmetabolism with an up-regulation after 24 h of the mRNAs coding for
key enzymes that synthesize sterols, saturated and unsaturated fattyacids. These resulted in an increase of cholesterol and oxidized fattyacids in treated cells. Also a similar down-regulation of effectors andregulators of the cell cycle was observed in the three cell lines used.Other transcriptional changes in toxin treated cells pointed to inductionof the UPR. This effect appeared as an increase in the transcription ofseveral genes involved in the regulation of the cell response after stressin the endoplasmic reticulum. The UPR involves an elaborated, initiallycytoprotective, mechanism which uses three sensor molecules (PERK,ATF6 and IRE1) for monitoring the accumulation of unfolded proteinsin the ER. PERK, a kinase localized in the ER membrane phosphorylatestheα subunit of the eukaryotic initiation factor of translation (eIF2α), inturn leading to translation attenuation and then preventing further ac-cumulation of unfolded proteins [14,15]. In this paper we show an in-crease in the phosphorylated active forms of PERK, and eIF2α with the
Fig. 10. (A) Cell viability in YTX treated cells after transfection with BNIP3 interfering RNA (SCRAM-YTX: cells transfected with scrambled non interfering RNA and then treated withYTX, iBNIP3-YTX: cell transfected with BNIP3 interfering RNA and then treated with YTX, iBNIP3: control of viability after iBNIP3 silencing). Δ significant differences respect to controls(pb 0.01, n=8). * significant differences with respect to iBNIP3-YTX treated cells (pb 0.01, n=8). (B) Relative quantification by qPCR of the mRNA coding for BNIP3 24h after transfectionwith BNIP3 iRNA. * significant differenceswith respect to controls (pb0.01, n=3). (C) LC3 detection, bywestern blot, in YTX treated cells after transfectionwith BNIP3 iRNA. (D) Detection ofmitochondrially oxidized and aggregated JC-1 (red) and of non oxidized JC-1 (green), by confocal microscopy, in control and YTX treated cells.
430 J.A. Rubiolo et al. / Cellular Signalling 26 (2014) 419–432
consequent inhibition of the cell cycle in G1 and protein synthesis inhi-bition. All these data indicate that the armof theUPR controlled by PERKand eIF2α becomes activated in glioma cells exposed to YTX. We alsoshow that YTX induces XBP1 splicing. This splicing is mediated byIRE1 that upon ER stress convert the XBP1 unspliced-mRNA intomaturemRNAby cytoplasmic RNA splicing, leading to translation of active tran-scription factor S-XBP1 [28,29]. The spliced form activates the transcrip-tion of ER chaperone genes as a homodimer or as heterodimer withATF6 [30,31]. The appearance of S-XBP1 in YTX treated cells points tothe activation of the UPR sensor IRE1. ATF6 is a transcription factor
that acts like a sensor and is embedded in the ER membrane [32].Upon ER stress, it is cleaved and the cytoplasmic portion is released mi-grating to the nucleus and activating the transcription of ER chaperonegenes [30,33]. As we show in this work several chaperone genes are in-duced in cells treatedwith YTX. These observations, togetherwith thoseusing the dye ER-tracker indicates that YTX activates the UPR in thethree cell lines used, inducing cell cycle arrest and protein synthesis in-hibition. If the UPR cannot deal with ER-stress, apoptosis is induced incompromised cells. One of the apoptosis inducers up-regulated by ER-stress is DDIT3, which is induced by ATF4 [34]. YTX increased the
431J.A. Rubiolo et al. / Cellular Signalling 26 (2014) 419–432
expression of ATF4 and DDIT3. Even this, RNA interference experimentsindicated that this proteinwas not involved in the cytotoxicity of YTX inglioma cells.
ER stress also explains the increase in the cholesterol content of cellstreated with YTX. Even though the cell cholesterol content is regulatedby a negative feedback mechanism, it has been shown that conditionsthat cause ER-stress induce SREBPs activation, irrespective of intracellu-lar cholesterol content [35–39]. The induction of the cholesterol andlipid synthesizing enzymes by SREBPs, increases the intracellularcholesterol content, even in the presence of high cholesterol concentra-tions. The decrease in lipids in the form of triglycerides and the increasein oxidized lipids in YTX treated cells could be produced by lipolysis oftriglycerides and mitochondrial β-oxidation of the free fatty acids [40].The report indicating that autophagy is involved in triglycerides breakdown into free fatty acids for mitochondrial β-oxidation [41], togetherwith the increased mitochondrial activity observed in YTX treatedcells shown in this work support this notion.
YTX has been shown to induce an increase in the cytosolic calcium.The induction of ER-stress by this toxin could explain this observationsbeing that ER-stress activation is frequently accompanied by calciumrelease into the cytosol [42]. Also different agents (including ER-stressinducers) activate autophagy in a calcium-dependent manner throughAMPK [43], DAPK [44], and PKCθ [45].
At the onset and during the adaptive phase of ER-stress, an increasein themitochondrial metabolism has been reported. Among the param-eters enhanced is mitochondrial membrane potential [46]. In gliomacells treated with YTX we observed an increase in the mitochondrialmembrane potential that appeared early after treatment and persistedup to 48 h. When the ER-stress cannot be resolved by the cells,mitochondrial dysfunction is observed with activation of apoptosis[47,48]. In glioma cells instead of apoptosis, we observed autophagyafter 24 and 48 h, as determined by electron microscopy showingautophagic vesicles and the LC3-II detected in YTX treated cells. It hasbeen previously shown that eIF2α and PERK phosphorylation promotesautophagy [16,17]. These data indicates that there is a connectionbetween ER-stress induction and autophagy. In this work we showthat phosphorylation of these two proteins is increased in YTX treatedcells, indicating that YTX could induce autophagy through thesemechanism.
In cancer cells, mTOR serves as the main negative regulator ofautophagy. This protein forms two complexes in mammalian cells,the mammalian target of rapamycin complex 1 (mTORC1), and themammalian target of rapamycin complex 2 (mTORC2). Inhibition ofmTORC1 induces autophagy [18]. YTX treated glioma cells showed a de-crease in serine 2448mTOR phosphorylation together with a decreasedphosphorylated S6 kinase, a downstream effector of mTOR that acti-vates the initiation of protein synthesis [49], indicating that YTX inhibitsmTORC1, with the consequent induction of autophagy. Using the inhib-itor of autophagy 3-MA, complete cytoprotection in YTX treated cellswas observed after 24 h, while partial cytoprotection was observedafter 48 h indicating that this process is involved in cell death inducedby YTX. EGF, an activator of mTOR, induced cytoprotection in YTX treat-ed glioma cells, also supporting the involvement of autophagy in celldeath induced by YTX. EGF reduced the mTOR inhibition by YTX andalso reduced the levels of LC3-II in YTX treated cells.
Microarray data analysis after YTX treatment of glioma cells showedan increase in themRNA coding for two proteins that have been report-ed to induce autophagy by interaction with mTOR. These proteins areBNIP3 and REDD1. There is evidence indicating that BNIP3 inhibits themTORpathway throughRHEB (an activator ofmTOR) [50], and this pro-tein has been shown to induce cell death by autophagy which wasinhibibed by 3-MA but not by an apoptosis inhibitor [51]. Knockdownof BNIP3 has been shown to prevent LC3-I to LC3-II conversion and au-tophagic cell death in hepatoma cells [52]. Also this protein mediatesautophagic cell death induced by arsenic trioxide [53] and ceramide[54] in glioma cells, and concavalin A in hepatoma cells [52]. We show
that down-regulation of BNIP3 mRNA by RNA interference reducedautophagy and rescued the cells from death indicating that BNIP3 isinvolved in the induction of autophagy and cell death by YTX.
REDD1 functions as a negative regulator of mTOR substratephosphorylation in response to different stressful situations and wasinitially identified as a gene induced following DNA damage [55]. Nocytoprotection was observed in YTX treated cells when the REDD1mRNA was down-regulated by RNA interference, implying that eventhough YTX increases the transcription of REDD1 this protein is notinvolved in the autophagy observed.
After YTX treatment there is induction of ER-stress with increasedmitochondrial oxidation which then derives in autophagy. This processis induced by BNIP3 by negative regulation ofmTOR. Even thoughBNIP3has been shown to induce cell death by inducing loss of mitochondrialmembrane potential [56–58], several studies have been reported thatthis protein is a potent inducer of autophagy in many different celltypes [51,53,59–61]. The autophagy induced by BNIP3 is independentof the mitochondrial permeability transition pore [61], so no loss ofmitochondrial membrane potential is induced. This last is what weobserved in glioma cells treated with YTX.
Based on the results obtained for the three cell lines, the difference inYTX induced autophagic cell death observed could be related to theirproliferation rate. The toxin is more potent in the most rapidly growingcell line (SF295) that has a doubling time of 29h. Themost resistant cellline, SNB75, has a doubling time of 63h, so autophagy could proceed fora longer time before cell death occurred. This is evidenced by the factthat the same YTX concentration that produces a 50% reduction ofviability in SF295 after 48 h has approximately the same potency inSNB75 but after 72h. The SF539 cell line with an intermediate doublingtime (35h) has also and intermediate sensitivity to YTX.
Finally, TRIB3, which has also been proposed to inhibit the mTORpathway [62], is induced in glioma cells treated with YTX and we con-sider that the involvement of this protein in YTX induced autophagyshould be investigated.
Supplementary data to this article can be found online at http://dx.doi.org/10.1016/j.cellsig.2013.10.004.
Conflict of interest
The authors declare that they have no conflict of interest.
Acknowledgments
This workwas supported by the following FEDER cofounded-grants:
From the Ministerio de Ciencia y Tecnología, Spain: SAF2009-12581 (subprograma NEF), AGL2009-13581-CO2-01, TRA2009-0189, AGL2010-17875. From Xunta de Galicia, Spain: GRC 2010/10,and PGDIT 07MMA006261PR, PGIDIT (INCITE) 09MMA003261PR,PGDIT (INCITE) 09261080PR, 2009/XA044, and 10PXIB261254PR.From EU VIIth Frame Program: 211326 – CP (CONffIDENCE), 265896BAMMBO, 265409 μAQUA, and 262649 BEADS, 312184 PharmaSea.From the Atlantic Area Programme (Interreg IVB Trans-national):2009-1/117 Pharmatlantic.
References
[1] R. Draisci, E. Ferretti, L. Palleschi, C. Marchiafava, R. Poletti, A. Milandri, A. Ceredi, M.Pompei, Toxicon 37 (1999) 1187–1193.
[2] M. Satake, L. MacKenzie, T. Yasumoto, Nat. Toxins 5 (1997) 164–167.[3] A. Alfonso, L. de la Rosa, M.R. Vieytes, T. Yasumoto, L.M. Botana, Biochem. Pharmacol.
65 (2003) 193–208.[4] L.A. de la Rosa, A. Alfonso, N. Vilarino, M.R. Vieytes, T. Yasumoto, L.M. Botana, Cell.
Signal. 13 (2001) 711–716.[5] A. Perez-Gomez, A. Ferrero-Gutierrez, A. Novelli, J.M. Franco, B. Paz, M.T.
Fernandez-Sanchez, Toxicol. Sci. 90 (2006) 168–177.[6] V. Dell'Ovo, E. Bandi, T. Coslovich, C. Florio, M. Sciancalepore, G. Decorti, S. Sosa, P.
Lorenzon, T. Yasumoto, A. Tubaro, Toxicol. Sci. 106 (2008) 392–399.

432 J.A. Rubiolo et al. / Cellular Signalling 26 (2014) 419–432
[7] S. Pierotti, C. Malaguti, A. Milandri, R. Poletti, G. Paolo Rossini, Anal. Biochem. 312(2003) 208–216.
[8] G. Ronzitti, F. Callegari, C. Malaguti, G.P. Rossini, Br. J. Cancer 90 (2004) 1100–1107.[9] C. Bianchi, R. Fato, A. Angelin, F. Trombetti, V. Ventrella, A.R. Borgatti, E. Fattorusso, P.
Ciminiello, P. Bernardi, G. Lenaz, G. Parenti Castelli, Biochim. Biophys. Acta 1656(2004) 139–147.
[10] M.S. Korsnes, D.L. Hetland, A. Espenes, T. Aune, Toxicol. in Vitro 20 (2006) 1419–1426.[11] M.S. Korsnes, A. Espenes, Toxicon 57 (2011) 947–958.[12] M.S. Korsnes, A. Espenes, D.L. Hetland, L.C. Hermansen, Toxicol. in Vitro 25 (2011)
1764–1770.[13] S. Sperandio, I. de Belle, D.E. Bredesen, Proc. Natl. Acad. Sci. U. S. A. 97 (2000)
14376–14381.[14] H.P. Harding, Y. Zhang, A. Bertolotti, H. Zeng, D. Ron, Mol. Cell 5 (2000) 897–904.[15] H.P. Harding, Y. Zhang, D. Ron, Nature 397 (1999) 271–274.[16] Y. Kouroku, E. Fujita, I. Tanida, T. Ueno, A. Isoai, H. Kumagai, S. Ogawa, R.J. Kaufman,
E. Kominami, T. Momoi, Cell Death Differ. 14 (2007) 230–239.[17] Z. Talloczy, W. Jiang, Virgin HWt, D.A. Leib, D. Scheuner, R.J. Kaufman, E.L. Eskelinen,
B. Levine, Proc. Natl. Acad. Sci. U. S. A. 99 (2002) 190–195.[18] C.H. Jung, S.H. Ro, J. Cao, N.M. Otto, D.H. Kim, FEBS Lett. 584 (2010) 1287–1295.[19] S.Y. Wang, Q.J. Yu, R.D. Zhang, B. Liu, Int. J. Biochem. Cell Biol. 43 (2011) 1263–1266.[20] J.A. Rubiolo, H. Lopez-Alonso, F.V. Vega, M.R. Vieytes, L.M. Botana, Arch. Toxicol. 85
(2011) 1541–1550.[21] A.I. Saeed, N.K. Bhagabati, J.C. Braisted, W. Liang, V. Sharov, E.A. Howe, J. Li, M.
Thiagarajan, J.A. White, J. Quackenbush, Methods Enzymol. 411 (2006) 134–193.[22] A.I. Saeed, V. Sharov, J. White, J. Li, W. Liang, N. Bhagabati, J. Braisted, M. Klapa, T.
Currier, M. Thiagarajan, A. Sturn, M. Snuffin, A. Rezantsev, D. Popov, A. Ryltsov, E.Kostukovich, I. Borisovsky, Z. Liu, A. Vinsavich, V. Trush, J. Quackenbush,Biotechniques 34 (2003) 374–378.
[23] W. Huang da, B.T. Sherman, R.A. Lempicki, Nat. Protoc. 4 (2009) 44–57.[24] W. Huang da, B.T. Sherman, R.A. Lempicki, Nucleic Acids Res. 37 (2009) 1–13.[25] M.M. Bradford, Anal. Biochem. 72 (1976) 248–254.[26] H. Lopez-Alonso, J.A. Rubiolo, F. Vega, M.R. Vieytes, L.M. Botana, Chem. Res. Toxicol.
26 (2013) 203–212.[27] C.A. Schneider, W.S. Rasband, K.W. Eliceiri, Nat. Methods 9 (2012) 671–675.[28] M. Calfon, H. Zeng, F. Urano, J.H. Till, S.R. Hubbard, H.P. Harding, S.G. Clark, D. Ron,
Nature 415 (2002) 92–96.[29] H. Yoshida, T. Matsui, A. Yamamoto, T. Okada, K. Mori, Cell 107 (2001) 881–891.[30] K. Yamamoto, T. Sato, T. Matsui, M. Sato, T. Okada, H. Yoshida, A. Harada, K. Mori,
Dev. Cell 13 (2007) 365–376.[31] H. Yoshida, M. Oku, M. Suzuki, K. Mori, J. Cell Biol. 172 (2006) 565–575.[32] H. Yoshida, K. Haze, H. Yanagi, T. Yura, K. Mori, J. Biol. Chem. 273 (1998) 33741–33749.[33] H. Yoshida, T. Okada, K. Haze, H. Yanagi, T. Yura, M. Negishi, K. Mori, Mol. Cell. Biol.
20 (2000) 6755–6767.[34] H. Puthalakath, L.A. O'Reilly, P. Gunn, L. Lee, P.N. Kelly, N.D. Huntington, P.D. Hughes,
E.M. Michalak, J. McKimm-Breschkin, N. Motoyama, T. Gotoh, S. Akira, P. Bouillet, A.Strasser, Cell 129 (2007) 1337–1349.
[35] S.M. Colgan, D. Tang, G.H. Werstuck, R.C. Austin, Int. J. Biochem. Cell Biol. 39 (2007)1843–1851.
[36] J.N. Lee, J. Ye, J. Biol. Chem. 279 (2004) 45257–45265.[37] J.T. Pai, M.S. Brown, J.L. Goldstein, Proc. Natl. Acad. Sci. U. S. A. 93 (1996) 5437–5442.[38] X. Wang, J.T. Pai, E.A. Wiedenfeld, J.C. Medina, C.A. Slaughter, J.L. Goldstein, M.S.
Brown, J. Biol. Chem. 270 (1995) 18044–18050.[39] G.H.Werstuck, S.R. Lentz, S. Dayal, G.S. Hossain, S.K. Sood, Y.Y. Shi, J. Zhou, N. Maeda,
S.K. Krisans, M.R. Malinow, R.C. Austin, J. Clin. Invest. 107 (2001) 1263–1273.[40] G.F. Gibbons, K. Islam, R.J. Pease, Biochim. Biophys. Acta 1483 (2000) 37–57.[41] M.J. Czaja, Am. J. Physiol. Cell Physiol. 298 (2010) C973–C978.[42] M. Schroder, R.J. Kaufman, Annu. Rev. Biochem. 74 (2005) 739–789.[43] M. Hoyer-Hansen, L. Bastholm, P. Szyniarowski, M. Campanella, G. Szabadkai, T.
Farkas, K. Bianchi, N. Fehrenbacher, F. Elling, R. Rizzuto, I.S. Mathiasen, M. Jaattela,Mol. Cell 25 (2007) 193–205.
[44] D. Gozuacik, S. Bialik, T. Raveh, G. Mitou, G. Shohat, H. Sabanay, N. Mizushima, T.Yoshimori, A. Kimchi, Cell Death Differ. 15 (2008) 1875–1886.
[45] K. Sakaki, J. Wu, R.J. Kaufman, J. Biol. Chem. 283 (2008) 15370–15380.[46] R. Bravo, J.M. Vicencio, V. Parra, R. Troncoso, J.P. Munoz, M. Bui, C. Quiroga, A.E.
Rodriguez, H.E. Verdejo, J. Ferreira, M. Iglewski, M. Chiong, T. Simmen, A. Zorzano,J.A. Hill, B.A. Rothermel, G. Szabadkai, S. Lavandero, J. Cell Sci. 124 (2011)2143–2152.
[47] M. Chami, B. Oules, G. Szabadkai, R. Tacine, R. Rizzuto, P. Paterlini-Brechot, Mol. Cell32 (2008) 641–651.
[48] G. Csordas, C. Renken, P. Varnai, L. Walter, D. Weaver, K.F. Buttle, T. Balla, C.A.Mannella, G. Hajnoczky, J. Cell Biol. 174 (2006) 915–921.
[49] R.T. Peterson, S.L. Schreiber, Curr. Biol. 8 (1998) R248–R250.[50] Y. Li, Y. Wang, E. Kim, P. Beemiller, C.Y. Wang, J. Swanson, M. You, K.L. Guan, J. Biol.
Chem. 282 (2007) 35803–35813.[51] M.B. Azad, Y. Chen, E.S. Henson, J. Cizeau, E. McMillan-Ward, S.J. Israels, S.B. Gibson,
Autophagy 4 (2008) 195–204.[52] C.P. Chang, M.C. Yang, H.S. Liu, Y.S. Lin, H.Y. Lei, Hepatology 45 (2007) 286–296.[53] T. Kanzawa, L. Zhang, L. Xiao, I.M. Germano, Y. Kondo, S. Kondo, Oncogene 24 (2005)
980–991.[54] S. Daido, T. Kanzawa, A. Yamamoto, H. Takeuchi, Y. Kondo, S. Kondo, Cancer Res. 64
(2004) 4286–4293.[55] L.W. Ellisen, K.D. Ramsayer, C.M. Johannessen, A. Yang, H. Beppu, K. Minda, J.D.
Oliner, F. McKeon, D.A. Haber, Mol. Cell 10 (2002) 995–1005.[56] D.A. Kubli, J.E. Ycaza, A.B. Gustafsson, Biochem. J. 405 (2007) 407–415.[57] K.M. Regula, K. Ens, L.A. Kirshenbaum, Circ. Res. 91 (2002) 226–231.[58] C. Vande Velde, J. Cizeau, D. Dubik, J. Alimonti, T. Brown, S. Israels, R. Hakem, A.H.
Greenberg, Mol. Cell. Biol. 20 (2000) 5454–5468.[59] G. Bellot, R. Garcia-Medina, P. Gounon, J. Chiche, D. Roux, J. Pouyssegur, N.M.
Mazure, Mol. Cell. Biol. 29 (2009) 2570–2581.[60] A. Hamacher-Brady, N.R. Brady, S.E. Logue, M.R. Sayen, M. Jinno, L.A. Kirshenbaum,
R.A. Gottlieb, A.B. Gustafsson, Cell Death Differ. 14 (2007) 146–157.[61] M.N. Quinsay, R.L. Thomas, Y. Lee, A.B. Gustafsson, Autophagy 6 (2010) 855–862.[62] M. Salazar, A. Carracedo, I.J. Salanueva, S. Hernandez-Tiedra, M. Lorente, A. Egia, P.
Vazquez, C. Blazquez, S. Torres, S. Garcia, J. Nowak, G.M. Fimia, M. Piacentini, F.Cecconi, P.P. Pandolfi, L. Gonzalez-Feria, J.L. Iovanna, M. Guzman, P. Boya, G.Velasco, J. Clin. Invest. 119 (2009) 1359–1372.
Related Documents


