Annual Report & Accounts 2017 Years of Firsts

Welcome message from author
This document is posted to help you gain knowledge. Please leave a comment to let me know what you think about it! Share it to your friends and learn new things together.
Transcript
Annual Report & Accounts 2017
Years of FirstsRegistered office
Tŷ Admiral David Street Cardiff CF10 2EH
www.admiralgroup.co.uk
Adm
iral Group plc
Annual R
eport and Accounts 2017
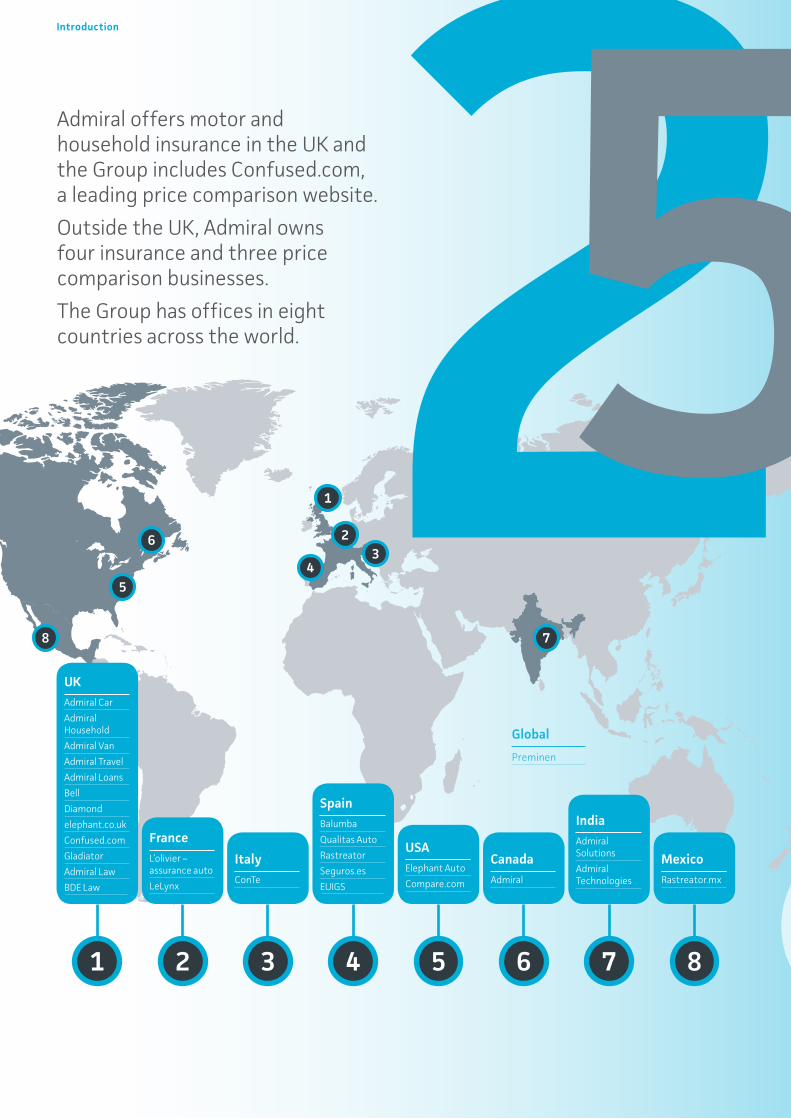
Admiral offers motor and household insurance in the UK and the Group includes Confused.com, a leading price comparison website.
Outside the UK, Admiral owns four insurance and three price comparison businesses.
The Group has offices in eight countries across the world.
1
23
45
6
7
1 2 3 4 5 6 7 8
FranceL’olivier – assurance auto
LeLynx
ItalyConTe
SpainBalumba
Qualitas Auto
Rastreator
Seguros.es
EUIGS
USAElephant Auto
Compare.com
CanadaAdmiral
IndiaAdmiral Solutions
Admiral Technologies
MexicoRastreator.mx
UKAdmiral Car
Admiral Household
Admiral Van
Admiral Travel
Admiral Loans
Bell
Diamond
elephant.co.uk
Confused.com
Gladiator
Admiral Law
BDE Law
8
Global
Preminen
Introduction
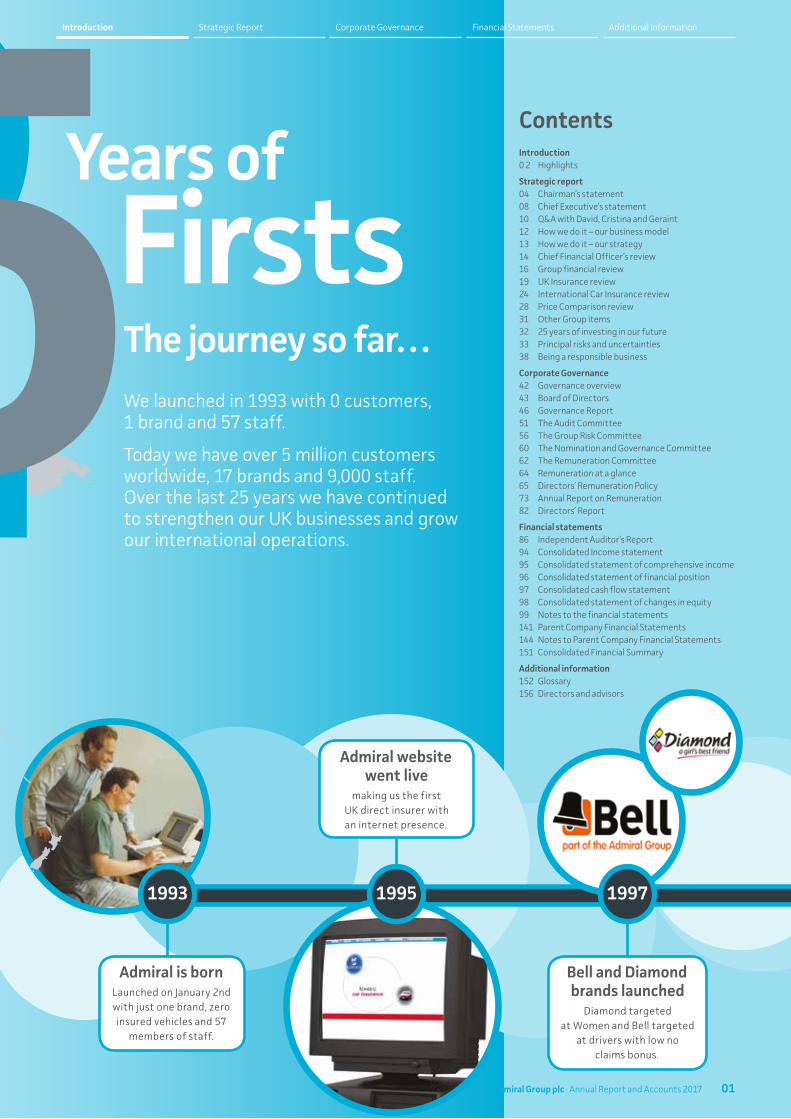
Admiral is born Launched on January 2nd with just one brand, zero insured vehicles and 57
members of staff.
1993 1995 1997
Years of Firsts
The journey so far…We launched in 1993 with 0 customers, 1 brand and 57 staff.
Today we have over 5 million customers worldwide, 17 brands and 9,000 staff. Over the last 25 years we have continued to strengthen our UK businesses and grow our international operations.
Introduction0 2 Highlights
Strategic report 04 Chairman’s statement 08 Chief Executive’s statement10 Q&A with David, Cristina and Geraint12 How we do it – our business model13 How we do it – our strategy14 Chief Financial Officer’s review16 Group financial review19 UK Insurance review24 International Car Insurance review28 Price Comparison review31 Other Group items32 25 years of investing in our future33 Principal risks and uncertainties38 Being a responsible business
Corporate Governance 42 Governance overview43 Board of Directors46 Governance Report51 The Audit Committee56 The Group Risk Committee60 The Nomination and Governance Committee62 The Remuneration Committee64 Remuneration at a glance65 Directors’ Remuneration Policy73 Annual Report on Remuneration82 Directors’ Report
Financial statements86 Independent Auditor’s Report94 Consolidated Income statement95 Consolidated statement of comprehensive income96 Consolidated statement of financial position 97 Consolidated cash flow statement98 Consolidated statement of changes in equity99 Notes to the financial statements141 Parent Company Financial Statements 144 Notes to Parent Company Financial Statements151 Consolidated Financial Summary
Additional information 152 Glossary156 Directors and advisors
Contents
Admiral website went live
making us the first UK direct insurer with an internet presence.
Bell and Diamond brands launched
Diamond targeted at Women and Bell targeted
at drivers with low no claims bonus.
01Admiral Group plc · Annual Report and Accounts 2017
Financial Statements Additional InformationCorporate GovernanceStrategic ReportIntroduction

02
Financial Highlights
2001
Group’s share of profit before tax*1 (£million)
£405.4m
Return on equity*1 (%)
55%
Customers*1 (million)
5.73mFull year dividend per share*3 (pence)
114.0p
Group’s statutory profit before tax (£million)
£403.5m
Turnover*1 (£billion)
£2.96bn
2017
2017
2017
2017
2017
2017
2017 2017405.4
55
5.73
2.96
114.0
1.13
403.5 117.2
2016
2016
2016
2016
2016
2016
2016 2016
2015
2015
2015
2015
2015
2015
2015 2015
Earnings per share (pence)
117.2p
Net revenue (£billion)
£1.13bn
Sunday Times 100 Best Companies
to Work For We made it on to the list
for the first time at 32nd.
elephant.co.uk launched:
The UK’s first brand to offer a complete online
solution to car insurance.
1998
Gladiator launched
Our commercial vehicle insurance broker.
376.8
49
4.43
2.12
102.5
0.90
368.7 107.3
284.3
37
5.15
2.58
102.5
1.02
278.4
“ It’s 25 years since the launch of Admiral. 2016 was only the second year we’d ever reported a year on year fall in profits. So it’s great to be back in the groove, with a 23rd year of ‘record profits’.”
David Stevens, CBE
Group Chief Executive Officer
2000
02 Admiral Group plc · Annual Report and Accounts 2017
Introduction: Financial Highlights
2002 20052004
03Admiral Group plc · Annual Report and Accounts 2017
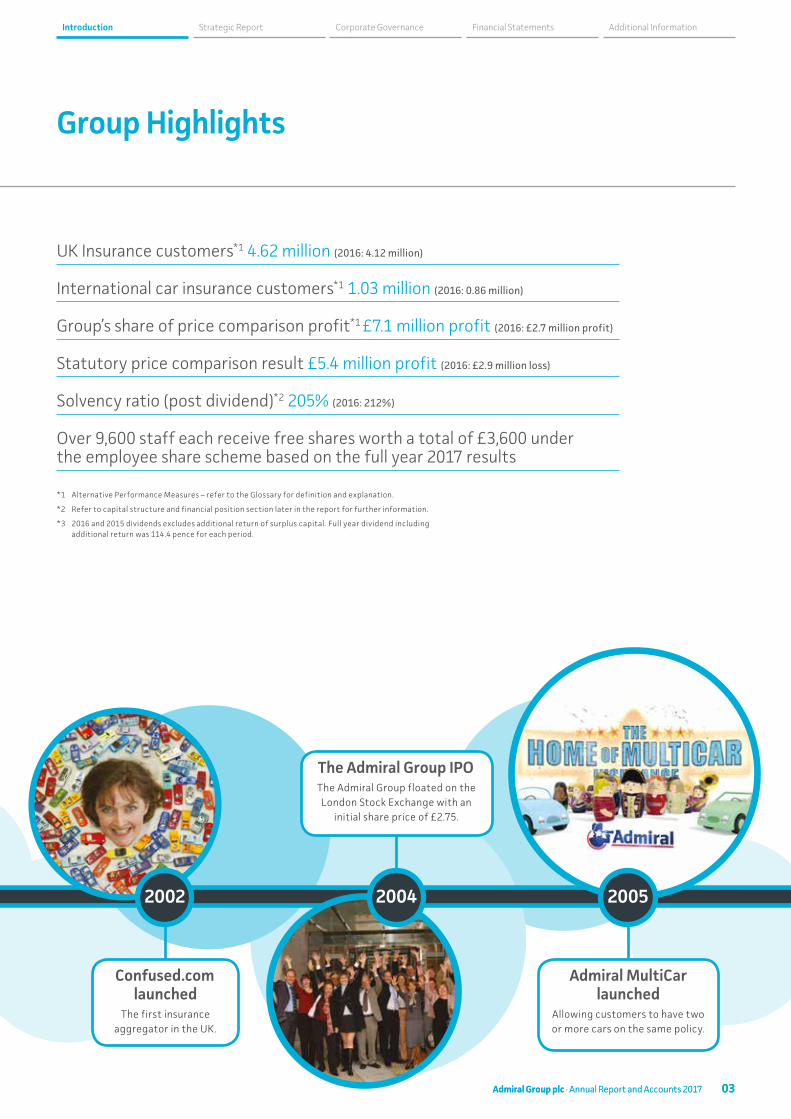
Group Highlights
The Admiral Group IPO The Admiral Group floated on the London Stock Exchange with an
initial share price of £2.75.
UK Insurance customers*1 4.62 million (2016: 4.12 million)
International car insurance customers*1 1.03 million (2016: 0.86 million)
Group’s share of price comparison profit*1 £7.1 million profit (2016: £2.7 million profit)
Statutory price comparison result £5.4 million profit (2016: £2.9 million loss)
Solvency ratio (post dividend)*2 205% (2016: 212%)
Over 9,600 staff each receive free shares worth a total of £3,600 under the employee share scheme based on the full year 2017 results
*1 Alternative Performance Measures – refer to the Glossary for definition and explanation.
*2 Refer to capital structure and financial position section later in the report for further information.
*3 2016 and 2015 dividends excludes additional return of surplus capital. Full year dividend including additional return was 114.4 pence for each period.
Confused.com launched
The first insurance aggregator in the UK.
Admiral MultiCar launched
Allowing customers to have two or more cars on the same policy.
Financial Statements Additional InformationCorporate GovernanceStrategic ReportIntroduction
03Admiral Group plc · Annual Report and Accounts 2017
04 Admiral Group plc · Annual Report and Accounts 2016
Chairman’s statement
In 2018 we celebrate 25 years since the launch of the company in January 1993. The core of the company’s success remains the distinctive Admiral culture which drives the way that our people work and serve our customers in the UK, Italy, Spain, France and the US.
2006
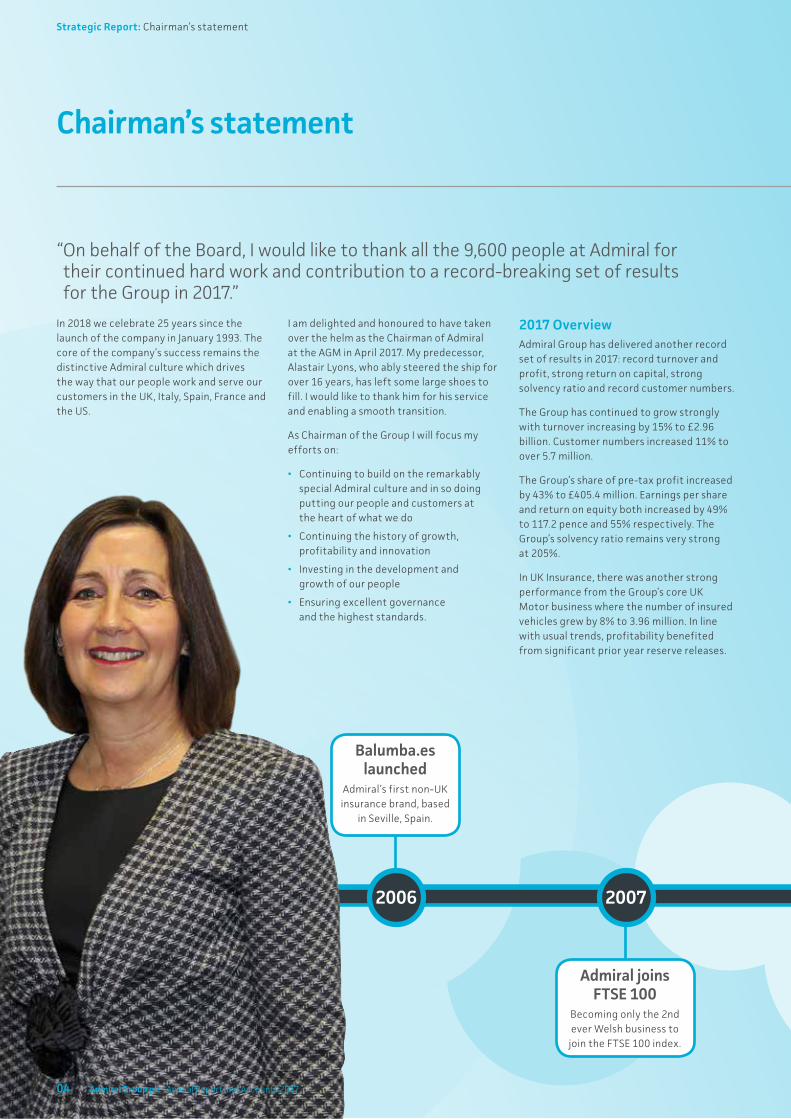
“ On behalf of the Board, I would like to thank all the 9,600 people at Admiral for their continued hard work and contribution to a record-breaking set of results for the Group in 2017.”
I am delighted and honoured to have taken over the helm as the Chairman of Admiral at the AGM in April 2017. My predecessor, Alastair Lyons, who ably steered the ship for over 16 years, has left some large shoes to fill. I would like to thank him for his service and enabling a smooth transition.
As Chairman of the Group I will focus my efforts on:
• Continuing to build on the remarkably special Admiral culture and in so doing putting our people and customers at the heart of what we do
• Continuing the history of growth, profitability and innovation
• Investing in the development and growth of our people
• Ensuring excellent governance and the highest standards.
2017 OverviewAdmiral Group has delivered another record set of results in 2017: record turnover and profit, strong return on capital, strong solvency ratio and record customer numbers.
The Group has continued to grow strongly with turnover increasing by 15% to £2.96 billion. Customer numbers increased 11% to over 5.7 million.
The Group’s share of pre-tax profit increased by 43% to £405.4 million. Earnings per share and return on equity both increased by 49% to 117.2 pence and 55% respectively. The Group’s solvency ratio remains very strong at 205%.
In UK Insurance, there was another strong performance from the Group’s core UK Motor business where the number of insured vehicles grew by 8% to 3.96 million. In line with usual trends, profitability benefited from significant prior year reserve releases.
2007
Balumba.es launched
Admiral’s first non-UK insurance brand, based
in Seville, Spain.
Admiral joins FTSE 100
Becoming only the 2nd ever Welsh business to
join the FTSE 100 index.
04 Admiral Group plc · Annual Report and Accounts 2017
Strategic Report: Chairman’s statement
Whilst we devote time and resources to exploring new opportunities outside of car insurance we also recognise that this remains our core focus. We continue to invest heavily in improving our core skills as evidenced by our continuing growth in premiums and profit. We also have a range of innovations including car sharing insurance, learner driver insurance and we remain the largest telematics provider in the UK.
There is still a backdrop of uncertainty in our largest business, UK Car, due to the continued deliberations over the Ogden rate affecting large personal injury claims. We expect to see some conclusions on the way forward in 2018. In the meantime, we have taken a prudent approach and reflected the current discount rate in our reserves.
Household Insurance continues to grow apace. Turnover is now £107.1 million and properties insured have increased by 41% to 0.7 million. Customers buy from us either using price comparison sites, directly and, increasingly, using our MultiCover offering, building on the success of MultiCar.
2017 saw the successful launch of our in-house underwritten van insurance product and, most recently, the launch of our new travel insurance product.
Most significantly, we have launched personal loans, firstly unsecured, then car finance as part of our new Admiral Financial Services business. We expect this to be an increasingly significant part of our business in future.
We are continuing to invest in our overseas insurance businesses, bearing fruit with reduced losses overall (despite the impact of Hurricane Harvey in the US) and another year of profits in ConTe. Turnover and customer numbers are continuing to grow materially by some 23% and 20% respectively and we now have £0.5 billion of combined turnover and over one million customers outside the UK. We believe we are on the cusp of delivering long term profit for the Group.
As a result of Brexit, we are exploring establishing an insurance company and an insurance intermediary business in Spain to support our European operations.
In our Price Comparison (PC) businesses, Confused.com in the UK continues to face a competitive and challenging market, whilst it implements its new Drivers Win strategy; this is offset by encouraging growth in Compare.com in the US and record profits at Rastreator and LeLynx, with all PC businesses delivering an improved customer experience. Our joint venture Preminen PC business continues to explore new opportunities and has recently established operations in Mexico and is soon to be in Turkey.
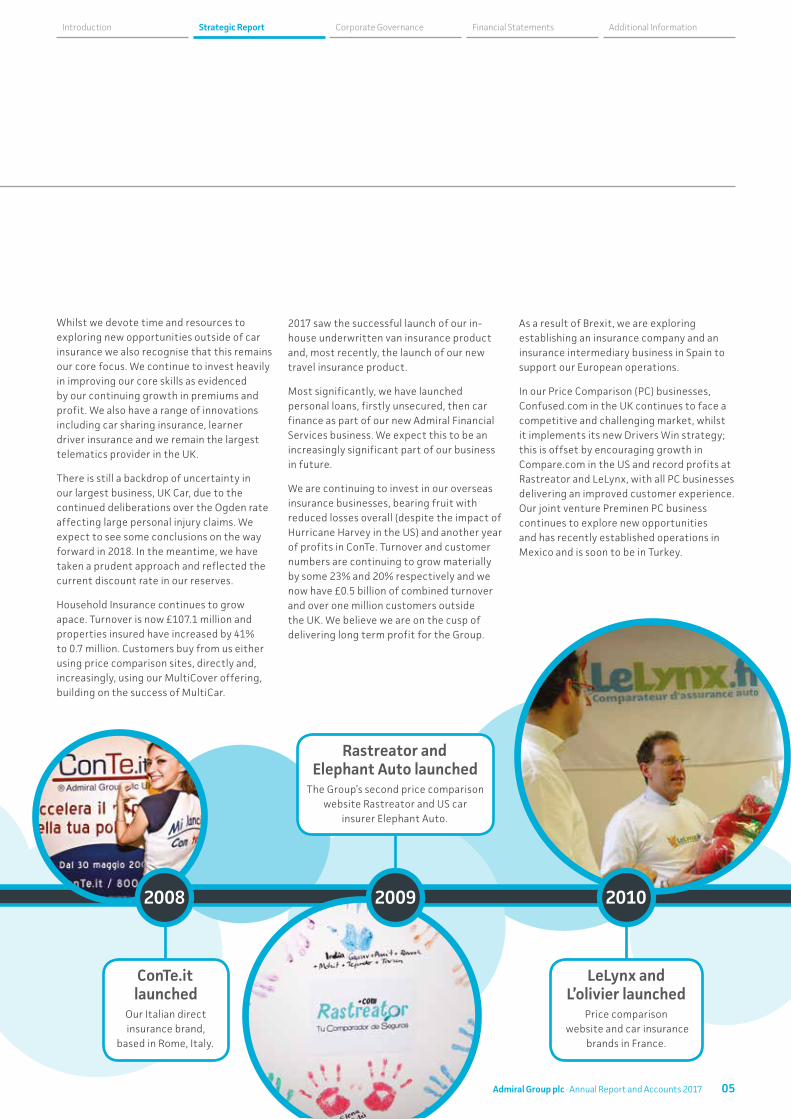
2008 2009 2010
ConTe.it launched
Our Italian direct insurance brand,
based in Rome, Italy.
LeLynx and L’olivier launched
Price comparison website and car insurance
brands in France.
Rastreator and Elephant Auto launched
The Group’s second price comparison website Rastreator and US car
insurer Elephant Auto.
05Admiral Group plc · Annual Report and Accounts 2017
Financial Statements Additional InformationCorporate GovernanceStrategic ReportIntroduction
What makes Admiral different?Our successful model which has been maintained since launch is definitely worth a further mention. It can be distilled into the following areas:
• Highly talented team – David Stevens leads a strong, capable and experienced management team which engages the whole business
• Focus – targeted diversification building on our core skills
• Pricing – data analysis lies at the heart of what we do
• Prudent reserving – continuing our conservative approach to claims reserving
• Claims management – consistent positive feedback from customers on the service they receive
• Controlled test and learn – organic growth with measured expansion steps
• Low-cost approach – constantly challenging ourselves on how we can do things more cost effectively
• Shareholder returns – we believe in returning excess capital to shareholders.
Overall we believe that people who like what they do, do it better.
DividendThe Directors have proposed a final dividend of 58.0 pence per share (2016: 51.5 pence) for the year to 31 December 2017, representing a distribution of 97% of our second half earnings. This included a normal dividend (65% of post-tax profits) of 39.5 pence per share and a further special dividend of 18.5 pence per share comprising earnings not required to be held in the Group for solvency or buffers.
This will bring the total dividend for the year to 114.0 pence per share, an overall increase of 11% (excluding the additional return of surplus capital in 2016) and the 13th consecutive year that Admiral has paid an increased dividend. This represents a payout ratio of 97%.
The business has delivered a Total Shareholder Return (TSR) of 382% over the last 9 years (as illustrated in the chart on page 79).
Corporate governance and Board changesThe Board recognises the need for a strong corporate governance framework and supporting processes across the Group and believes that good governance, with tone set from the top, is a key factor in delivering sustainable business performance and creating value for all the Group’s stakeholders.
The Board and I feel that the Board has a good balance of experience, skills and knowledge to support and challenge the management team and it is supported by effective governance and control systems. During the year the Board undertook a review of its effectiveness. Further details are provided in the Governance Report on pages 46 to 81.
Admiral’s incentive schemes remain distinctive, as every employee is a shareholder. They are designed to ensure that decisions are made by management to support long-term growth, that the right behaviours are rewarded and that our people’s interests are aligned with those of shareholders. Our core belief is that over the long-term, share appreciation depends on delivering great outcomes for our customers. Further details are provided in the Remuneration Report on pages 62 to 81.
Chairman’s statement continued
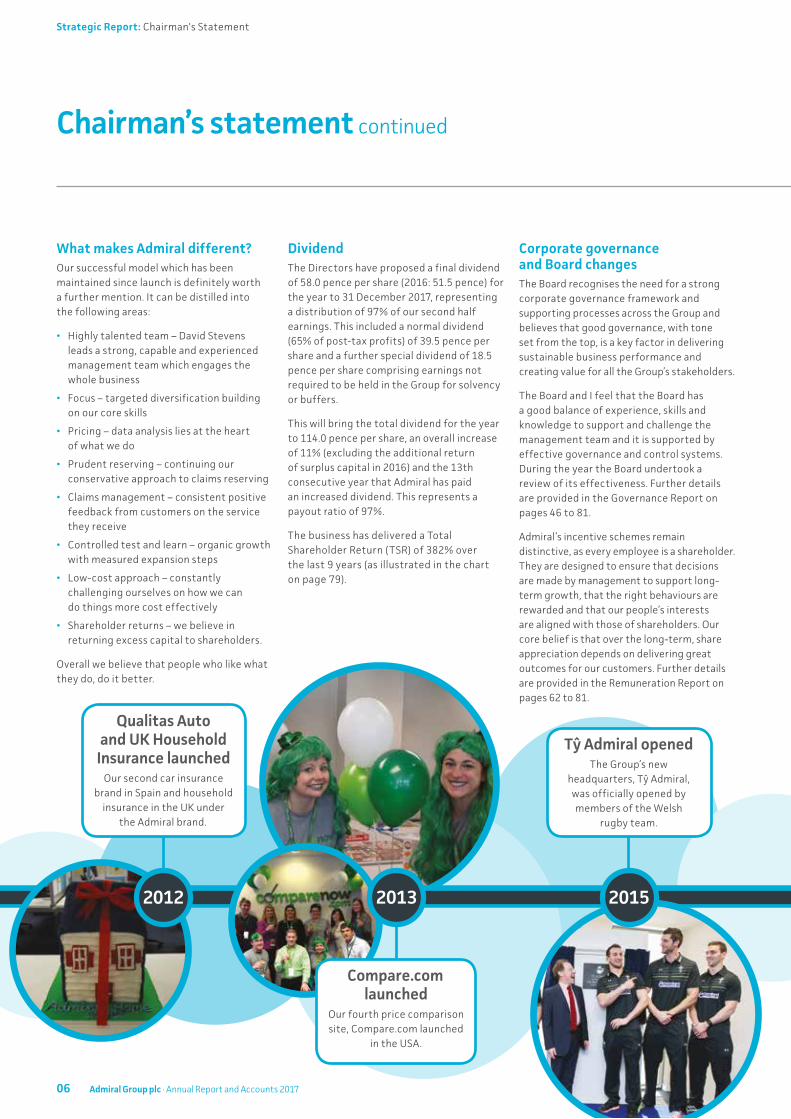
2012 2015
Qualitas Auto and UK Household
Insurance launched Our second car insurance
brand in Spain and household insurance in the UK under
the Admiral brand.
Tŷ Admiral opened The Group’s new
headquarters, Tŷ Admiral, was officially opened by members of the Welsh
rugby team.
Compare.com launched
Our fourth price comparison site, Compare.com launched
in the USA.
2013
06 Admiral Group plc · Annual Report and Accounts 2017
Strategic Report: Chairman's Statement
2017
Penny James stepped down from the Board effective from 8 September 2017 following a change in her Executive role, and I would like to thank her for her valuable contribution. Owen Clarke was announced as taking the Remuneration Committee chair in April, subject to regulatory approval. We are in the process of seeking additional Board members, and in February 2018 appointed Andy Crossley to the Board as a Non-Executive Director and member of the Audit Committee.
Our role in societyAdmiral takes its role in society very seriously and has an active corporate responsibility programme (more information in Corporate Social Responsibility Report on pages 38 to 41. We are proud to be Wales’ only FTSE 100 headquartered company. Our staff play an active part in the communities in which we operate.
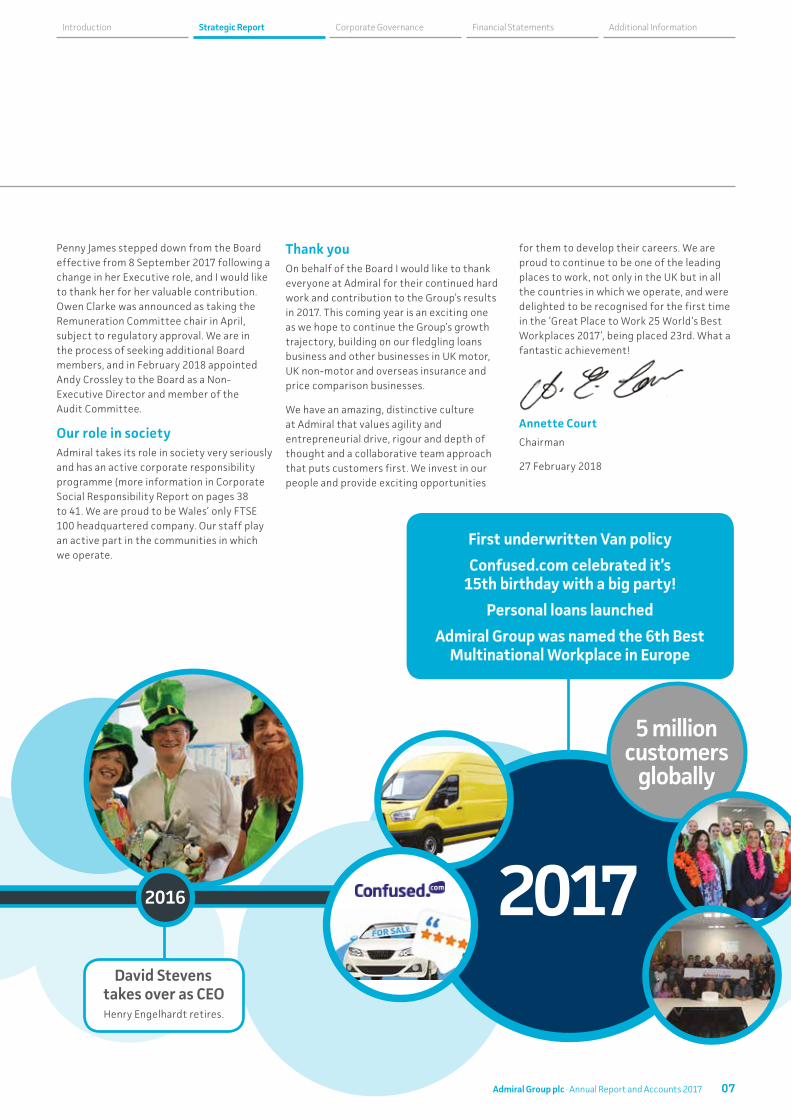
2016
David Stevens takes over as CEOHenry Engelhardt retires.
First underwritten Van policy
Confused.com celebrated it’s 15th birthday with a big party!
Personal loans launched
Admiral Group was named the 6th Best Multinational Workplace in Europe
Thank youOn behalf of the Board I would like to thank everyone at Admiral for their continued hard work and contribution to the Group’s results in 2017. This coming year is an exciting one as we hope to continue the Group’s growth trajectory, building on our fledgling loans business and other businesses in UK motor, UK non-motor and overseas insurance and price comparison businesses.
We have an amazing, distinctive culture at Admiral that values agility and entrepreneurial drive, rigour and depth of thought and a collaborative team approach that puts customers first. We invest in our people and provide exciting opportunities
for them to develop their careers. We are proud to continue to be one of the leading places to work, not only in the UK but in all the countries in which we operate, and were delighted to be recognised for the first time in the ‘Great Place to Work 25 World’s Best Workplaces 2017’, being placed 23rd. What a fantastic achievement!
Annette Court
Chairman
27 February 2018
5 million customers
globally
07Admiral Group plc · Annual Report and Accounts 2017
Financial Statements Additional InformationCorporate GovernanceStrategic ReportIntroduction
Chief Executive's Statement
Unusually for a CEO statement, I am not going to talk about what a great job the managers have done for the shareholders, nor about the company’s performance over the last twelve months, or indeed, prospects for the next twelve.
Instead, at a time when the public support for the free market economy is fraying and many more people see the world of business as a zero sum game, where profit can only be earned at the expense of, rather than in the service of, customers, I’d like to talk about the value that Admiral has delivered for UK motorists over the last 20 years, while making, and not despite making, good profits throughout.
The first reason Admiral has been, and remains, good news for customers is that we operate at a lower cost than almost all our competitors. When shopping for car insurance, most motorists are looking for the best possible price, along with reassurance that they’ll be looked after well, when needed. Admiral’s lower costs mean lower premiums for our customers.
Over most of the last 20 years our costs have been lower than our competitors – by at least ten percentage points of premium. That’s the equivalent of £50 less expense for a typical policy, and over £200 less for a higher premium policy. And that’s one of the main reasons Admiral’s brands come top on the UK’s price comparison sites more often than any of our competitors.
In the nineties, the industry was dominated by large, often grossly inefficient, multi-product, composite insurers with too many layers and top heavy structures. Most of those are long gone, under the pressure from upstarts like Admiral and other, lower-cost, Admiral-like, operators who have followed in our footsteps. So much the better for the customer and an example of the creative destruction which explains the success of competitive free markets.
“ The first reason Admiral has been, and remains, good news for customers is that we operate at a lower cost”
MultiCover; Telematics (200k+ customers, and rising); 10-month Bonus Accelerator (one from the nineties for real insurance anoraks) have all made our policies more attractive and more accessible to UK motorists and householders, and helped keep our acquisition costs low.
I strongly believe that a market made up of a large number of companies competing actively for customers’ attention and loyalty, combined with appropriate regulatory oversight, is a recipe for the best possible outcome for motorists and householders, and I believe that Admiral’s success over the last 25 years demonstrates why.
David Stevens, CBE
Chief Executive Officer 27 February 2018
P.S. I don’t want to count chickens, but in a year during which our Italian insurer broke through 500,000 vehicles on cover, delivered a fourth year of profit in a row and reduced its expense ratio by an amazing six percentage points, I’m looking forward, in a few years time, to saving myself an hour or two by recycling the above CEO Statement, but just substituting “ConTe” for “Admiral”.
Cheap, but maybe “nasty” the cynics might reply.
Far from it.
With “an intention to renew after a claim” score of consistently well over 90% (94.5% in 2017 to be precise) we deliver for our customers at the moment of truth. And you cannot build four million plus customers in the fiercely competitive UK insurance market without delivering a good customer experience.
Not every time.
We make mistakes.
But we recognise the long-term value of the company depends on us making sure our customers, by and large, are not only glad to join us but also happy to stay with us.
If I’m proud of our outperformance on expense compared to the bulk of the car insurance market, I’m doubly proud of our expense ratio advantage in our relatively new and rapidly growing home insurance operation – doubly proud because our cost advantage over the market is not ten percentage points, but nearer twenty points. Again, this allows us to be the top most often on price comparison sites, while also making a profit. Admittedly, as yet, a small one, but watch this space.
How do we achieve lower costs while delivering a great product (5 star Defaqto ratings available across all Admiral’s Motor products) and (normally) a positive customer experience, and why don’t most of our competitors manage all three?
Well, it’s not just about the constant pursuit of efficiencies by a loyal and motivated team of employee shareholders (because all of us are both). It’s also about another great driver of growth in long-term prosperity in free market economies – innovation. Throughout our life major innovations such as Confused.com, the first insurance price comparison site; MultiCar and now
08 Admiral Group plc · Annual Report and Accounts 2017
Strategic Report: Chief Executive's Statement
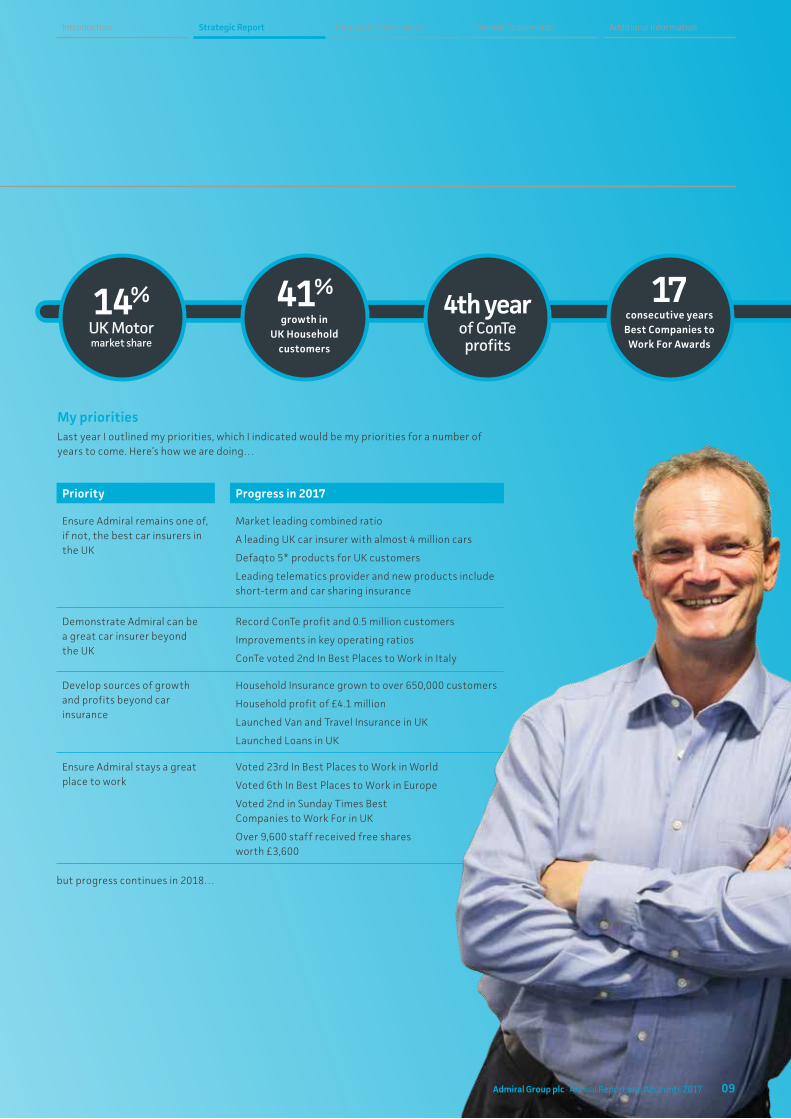
14%UK Motormarket share
4th year of ConTe profits
41%growth in
UK Household customers
17consecutive years Best Companies to Work For Awards
Priority
Ensure Admiral remains one of, if not, the best car insurers in the UK
Demonstrate Admiral can be a great car insurer beyond the UK
Develop sources of growth and profits beyond car insurance
Ensure Admiral stays a great place to work
Progress in 2017
Market leading combined ratio
A leading UK car insurer with almost 4 million cars
Defaqto 5* products for UK customers
Leading telematics provider and new products include short-term and car sharing insurance
Record ConTe profit and 0.5 million customers
Improvements in key operating ratios
ConTe voted 2nd In Best Places to Work in Italy
Household Insurance grown to over 650,000 customers
Household profit of £4.1 million
Launched Van and Travel Insurance in UK
Launched Loans in UK
Voted 23rd In Best Places to Work in World
Voted 6th In Best Places to Work in Europe
Voted 2nd in Sunday Times Best Companies to Work For in UK
Over 9,600 staff received free shares worth £3,600
My prioritiesLast year I outlined my priorities, which I indicated would be my priorities for a number of years to come. Here’s how we are doing…
but progress continues in 2018…
09Admiral Group plc · Annual Report and Accounts 2017
Financial Statements Additional InformationCorporate GovernanceStrategic ReportIntroduction
QA&
10 Admiral Group plc · Annual Report and Accounts 2017
QThe International Insurance businesses have been part of the strategy for a number of years but have yet to deliver meaningful profits – does it make sense to keep them?
ADavid: Our strategy has always been about building value over the longer term, by developing sustainable profitable businesses, rather than delivering short-term profits. We believe that the combined European insurance businesses are on the cusp of demonstrating that value. ConTe, our Italian business delivered another profit for the year (a record) and collectively our European insurance businesses practically broke even over 2017 despite growing fast. We continue to invest in Admiral Seguros in Spain, L’olivier in France and Elephant in the US because we believe that there are strong prospects for long-term value creation in all three markets. The International Insurance businesses now insure over one million customers and may ultimately provide us with an opportunity to offer those customers more than just car insurance.
with David, Cristina and Geraint
QAdmiral Household continues to grow and appears to be less affected by market conditions than competitors – why?
ACristina: The UK household market is going through a period of change as more and more householders realise that they can shop online for their home insurance. We are taking advantage of that shift in customer behaviour. We recognise, however, that the household market is very different from motor insurance, so whilst our growth has been very strong since launch we continue to adopt a test and learn approach to our underwriting. We started with a relatively cautious underwriting footprint and have gradually expanded this as we have grown.
During 2017 we have seen similar claims experience to the market but our cautious starting point has allowed us to absorb this with no significant impact on the Household result.
QThere has been a change of CEO at your US insurance operation, Elephant Auto – what does that mean for future strategy?
ADavid: Alberto Schiavon, our new CEO at Elephant, working alongside Henry Engelhardt, took advantage of a second set of eyes to judge what was good about what we were doing and what could be done better. The conclusion was that we need to continue our drive towards lower loss ratios and to sharpen our focus on higher retaining customers throughout our product and process design, our pricing and underwriting rules and our marketing.
QAdmiral has recently launched its personal lending business. Can you give us an update and also explain why you think now is a good time to enter the market with uncertain economic times ahead?
AGeraint: It’s still early days for Admiral Loans, though we’re very pleased with the way things are going so far. We think we have a very strong team, a good system and the signs so far are really positive.
We of course recognise that an economic downturn could adversely affect loan credit losses. Our approach to loan underwriting is to minimise the possible adverse impact of such a downturn in our book by focusing on segments which have historically demonstrated better resilience in times of stress.
Ultimately downturns tend to be followed by upturns and by building and learning now, we hope to be in a position to benefit from a subsequent upturn as a competent player operating at an adequate scale.
10 Admiral Group plc · Annual Report and Accounts 2017
11
I have no doubt this approach will be valuable in helping us through to a sustainable scale and an ultimately profitable operation.
QCan you give us an update on the Internal Model and what this means for capital?
AGeraint: Our team continues to do a great job building the model and putting in place the numerous processes and documents that are also needed for a successful application. We’re still on track to make our submission to the regulator by the end of 2018. At this point we’re not anticipating a significant change in the Group’s capital position under the model, though of course the outcome isn’t fully in our hands and so there is still some uncertainty over what that future position looks like.
Once the model is (hopefully) approved (and that shouldn’t be expected until well into 2019), the Board will make an assessment of the capital position and work out what, if anything, that means for potential returns of surplus capital to shareholders.
QHow do you see the long-term prospect of motor insurance given the continuing focus on autonomous technology and driverless cars?
ADavid: There are widely varying views on when to expect autonomous technology but considerably less uncertainty about the impact; once we are in a world of autonomous vehicles, the requirement for motor insurance, as we currently know it, will change. What future motor insurance looks like is up for debate. We believe that
the timescale for autonomous vehicles to become a meaningful part of the motor car parc is decades rather than sooner. Given the continued growth in developed and developing markets in the interim period, we believe there continues to be an opportunity for growth and for some interesting challenges where manual and autonomous vehicles are on the roads together.
Ultimately, we recognise that as claims frequency falls as a result of sophisticated autonomous technology, average motor insurance premiums will reduce which could have a significant impact on our revenue and profits. We expect to see the impact mitigated by growth in other non-life insurance products and growth in personal lending. We will continue to explore other products to offset potentially lower levels of motor premium in the future.
QWhat was the outcome of this year’s excess of loss reinsurance renewals and how was this influenced by Ogden?
ACristina: In late December 2016, in anticipation of a change in the Ogden discount rate we increased our 2017 excess of loss reinsurance with no significant price increase. During 2017 reinsurers responded to the change in Ogden by significantly increasing their prices. For 2018, we reviewed the level of cover we required and returned closer to historic levels but at a higher cost. The temporary competitive disadvantage we experienced in 2016 has been reduced and we are back on a level playing field.
QThe UK Motor market is increasingly competitive – is Admiral at risk of losing its competitive edge?
ACristina: It is a competitive market and one that looks significantly different from ten years ago (or even 25 years ago) when the primary players were large composite multi-line insurers. We are now in an environment where around 45% of the UK motor market is in the hands of a small number of focused direct players, including Admiral. This focus, inevitably, leads to a superior performance by these players, but there is still significant inefficiency in the market as a whole. Whilst market data has become difficult to access, we believe our underwriting advantage against the market is still significant and that we continue to maintain largely the same margin on expense ratio that we did ten years ago.
Are others getting better? Yes!
But Admiral is not standing still and waiting for them to catch up! We continue to look at ways in which we can improve and automate our internal processes to identify further efficiencies; to explore innovative ways of doing business as consumer behaviours change; and we continue to look for ways in which our detailed understanding of that customer behaviour can further enhance our underwriting strength.
Admiral Group plc · Annual Report and Accounts 2017
“ Our strategy has always been about building value over the longer term, by developing sustainable profitable businesses”
11Admiral Group plc · Annual Report and Accounts 2017
Financial Statements Additional InformationCorporate GovernanceStrategic ReportIntroduction
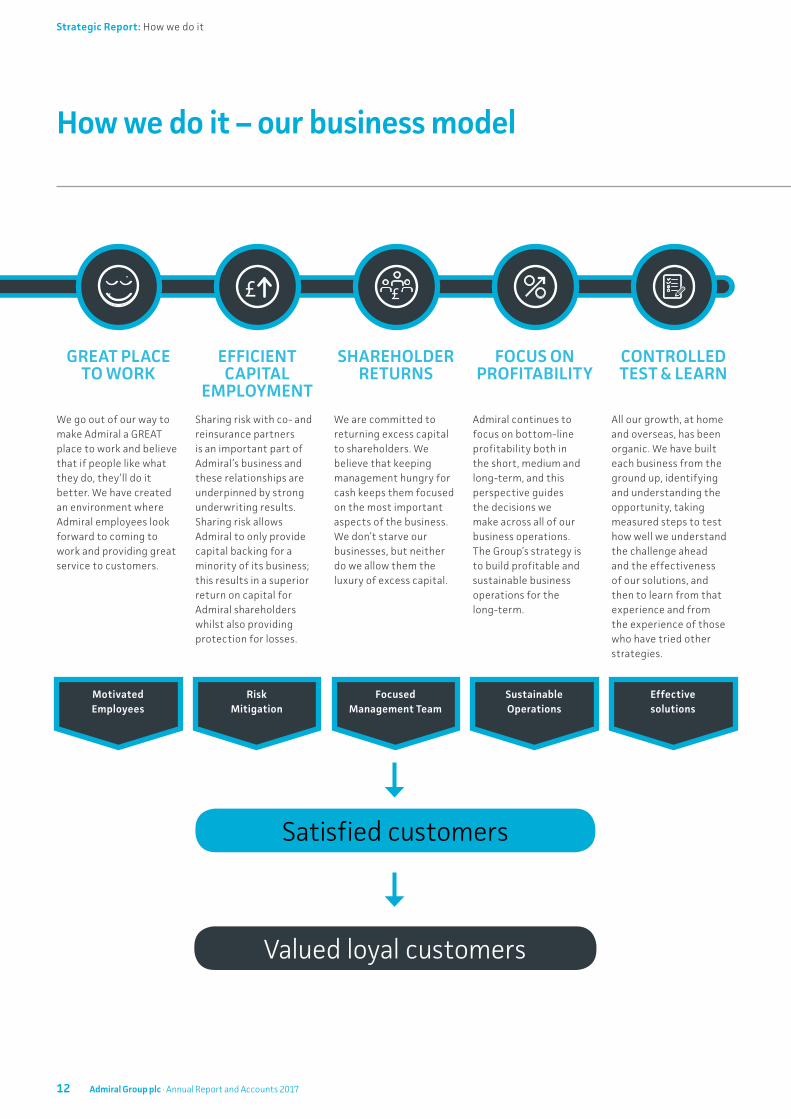
GREAT PLACE TO WORK
We go out of our way to make Admiral a GREAT place to work and believe that if people like what they do, they’ll do it better. We have created an environment where Admiral employees look forward to coming to work and providing great service to customers.
SHAREHOLDER RETURNS
We are committed to returning excess capital to shareholders. We believe that keeping management hungry for cash keeps them focused on the most important aspects of the business. We don’t starve our businesses, but neither do we allow them the luxury of excess capital.
EFFICIENT CAPITAL
EMPLOYMENT
Sharing risk with co- and reinsurance partners is an important part of Admiral’s business and these relationships are underpinned by strong underwriting results. Sharing risk allows Admiral to only provide capital backing for a minority of its business; this results in a superior return on capital for Admiral shareholders whilst also providing protection for losses.
FOCUS ON PROFITABILITY
Admiral continues to focus on bottom-line profitability both in the short, medium and long-term, and this perspective guides the decisions we make across all of our business operations. The Group’s strategy is to build profitable and sustainable business operations for the long-term.
CONTROLLED TEST & LEARN
All our growth, at home and overseas, has been organic. We have built each business from the ground up, identifying and understanding the opportunity, taking measured steps to test how well we understand the challenge ahead and the effectiveness of our solutions, and then to learn from that experience and from the experience of those who have tried other strategies.
How we do it – our business model
Motivated Employees
Risk Mitigation
Focused Management Team
Sustainable Operations
Effective solutions
Satisfied customers
Valued loyal customers
12 Admiral Group plc · Annual Report and Accounts 2017
Strategic Report: How we do it
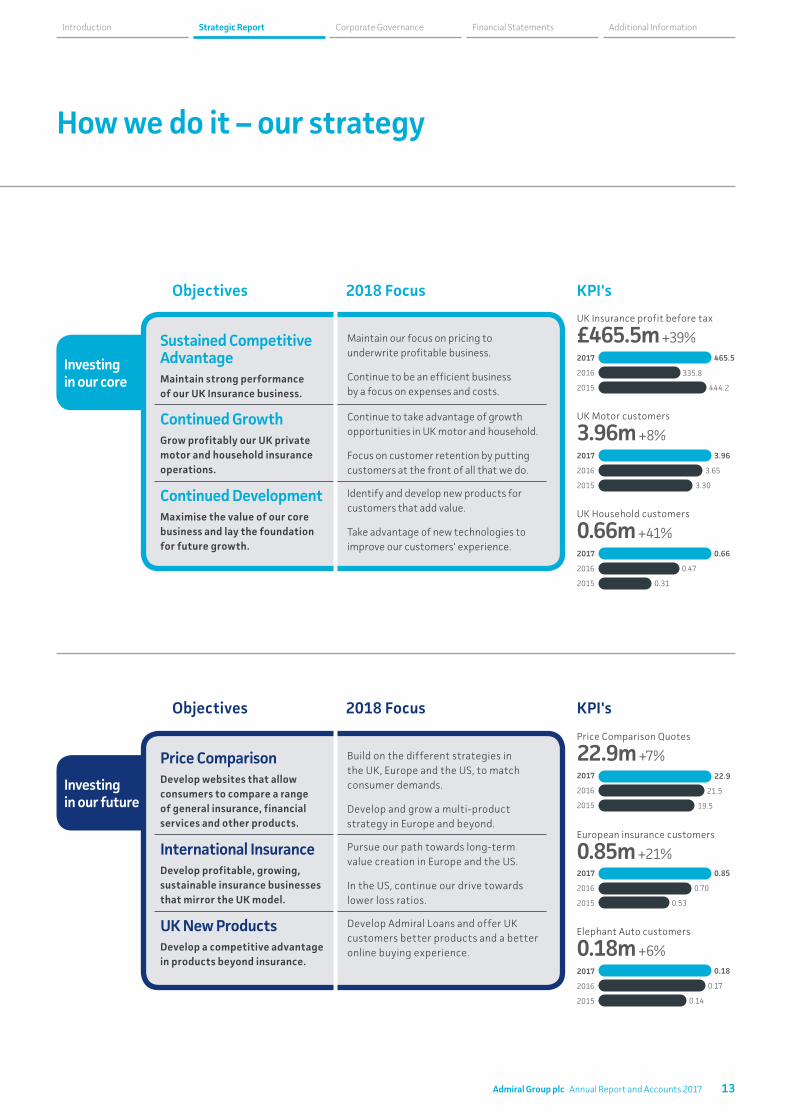
Investing in our future
Investing in our core
How we do it – our strategy
Sustained Competitive Advantage
Maintain our focus on pricing to underwrite profitable business.
Continue to be an efficient business by a focus on expenses and costs.
Maintain strong performance of our UK Insurance business.
Continued Growth Continue to take advantage of growth opportunities in UK motor and household.
Focus on customer retention by putting customers at the front of all that we do.
Grow profitably our UK private motor and household insurance operations.
Continued Development Identify and develop new products for customers that add value.
Take advantage of new technologies to improve our customers' experience.
Maximise the value of our core business and lay the foundation for future growth.
Price Comparison Build on the different strategies in the UK, Europe and the US, to match consumer demands.
Develop and grow a multi-product strategy in Europe and beyond.
Develop websites that allow consumers to compare a range of general insurance, financial services and other products.
International Insurance Pursue our path towards long-term value creation in Europe and the US.
In the US, continue our drive towards lower loss ratios.
Develop profitable, growing, sustainable insurance businesses that mirror the UK model.
UK New Products Develop Admiral Loans and offer UK customers better products and a better online buying experience.Develop a competitive advantage
in products beyond insurance.
Objectives 2018 Focus KPI's
UK Insurance profit before tax
£465.5m +39%2017
2017
2017
2017
2017
2017
465.5
3.96
335.8
3.65
3.30
2016
2016
2016
2016
2016
2016
444.22015
2015
2015
2015
2015
2015
UK Motor customers
3.96m +8%
UK Household customers
0.66m +41%0.66
0.47
0.31
Price Comparison Quotes
22.9m +7%22.9
21.5
19.5
European insurance customers
0.85m +21%0.85
0.70
0.53
Elephant Auto customers
0.18m +6%0.18
0.17
0.14
Objectives 2018 Focus KPI's
13Admiral Group plc · Annual Report and Accounts 2017
Financial Statements Additional InformationCorporate GovernanceStrategic ReportIntroduction
Ogden discount rateRegular readers of our results will be very familiar with the Ogden topic and I won’t repeat the full detail here. A year ago we estimated that the change in rate which came into effect in March 2017 would cost the Group around £150 million after tax and reinsurance. Most of the impact has now been reflected in the income statement and we still consider the £150 million a valid estimate.
These accounts and our current capital position assume the minus 0.75% rate remains effective indefinitely, as we think that’s the prudent thing to do in the absence of other information.
Sensitivities in terms of balance sheet and capital to different rates are set out on page 22.
In the 2016 Annual Report, we disclosed a profit number (£390 million) that the Group would have reported had the Ogden rate remained unchanged. This year’s Group profit of £405 million is around 4% higher than that ‘pre-Ogden’ number, though 2017’s profit is further adversely impacted by the Ogden change to the order of £40 million. As the comparatives become less helpful, we have not repeated the pre-Ogden number from 2016 in this report.
The financial statements continue to include a significant and prudent margin above the projected ultimate claims outcomes, although this margin has reduced since the end of 2016, partly due to increased confidence over the impact of the change in Ogden rate to minus 0.75%.
“ It was pleasing to deliver a record profit with lots of positives from around the Group”
ResultsNo last minute change to the Ogden discount rate made for a somewhat smoother year-end and it was pleasing to deliver a record profit with lots of positives from around the Group. Performance of our various businesses is covered in detail in the Strategic Report and whilst it’s hard to choose highlights from many potentials, I’ll try anyway:
• A nice, continued improvement in the International Insurance result (£22 million loss in 2015, £19 million in ‘16, £14 million in ‘17)
• A near break-even EU insurance result (plus improvements in some key metrics whilst growing premiums by almost a quarter in not exactly the easiest of market conditions)
• Breaking through one million customers outside the UK in September 2017
• Comfortably beating our targets for Admiral Loans in its first proper year of operation
• Achieving ‘marketing break-even’ in Compare.com ahead of target
• Very positive progress in converting our Gladiator van insurance broker portfolio to being underwritten within the Group
• And of course, a record UK Insurance profit of £466 million.
And for balance, a few of the less positive aspects:
• Investment behind the Drivers Win campaign alongside new product development cost and a generally fierce market led to a fall in profits at Confused.com (£16 million to £10 million)
• Despite continued confidence in the long-term prospects of the business, there was a £25 million write down in the carrying value of Elephant Auto in the parent company balance sheet
• 2017 saw higher Group overheads and other items (some of which are non-recurring) at £52.9 million v £36.8 million.
Further detail on these latter points can be found on pages 30, 146
and 31 respectively.
Chief Financial Officer’s review
14 Admiral Group plc · Annual Report and Accounts 2017
Strategic Report: Chief Financial Officer’s review
15Admiral Group plc · Annual Report and Accounts 2017
Capital, Dividends, Internal Model Speaking of capital, not too much has changed since the end of 2016. Our solvency ratio remains very strong at over 200%, though has reduced modestly since the end of 2016, mainly as the result of growth. A ratio of over 200% is still higher than we’d expect to report in the medium/long-term. However (copy and paste alert), we continue to believe that’s the prudent approach as we move towards applying to use our own model to calculate the capital requirement (no change to report on the expected submission date which is late in 2018). We’ll continue to provide updates as we make progress.
Brexit We have made good progress on preparing the Group to be able to continue trading in Europe should, as seems highly likely, we lose the ability to passport our UK regulatory licenses into those markets.
In terms of insurance, we have made applications to the regulator in Spain for permission to underwrite all the EU insurance business (Admiral Seguros, ConTe and L’olivier) from there and expect to have everything up and running in advance of any hard deadline that might eventually become clear.
Spain made sense for us for a number of reasons, not least the fact that we already have people and infrastructure in Madrid and Seville and of course an existing relationship with the regulator.
Things are more straightforward on the price comparison side where we are setting up new, locally regulated entities in Spain and France through which Rastreator and LeLynx will trade. Again, we expect these moves to be complete in good time.
The cost of the restructuring work will not be material to the Group and we don’t expect there to be material impact on the Group’s regulatory capital position as a result of the restructure.
I'm looking forward to continued growth and progress across the Group in 2018.
Geraint Jones
Chief Financial Officer
27 February 2018
15Admiral Group plc · Annual Report and Accounts 2017
Financial Statements Additional InformationCorporate GovernanceStrategic ReportIntroduction
Group financial review
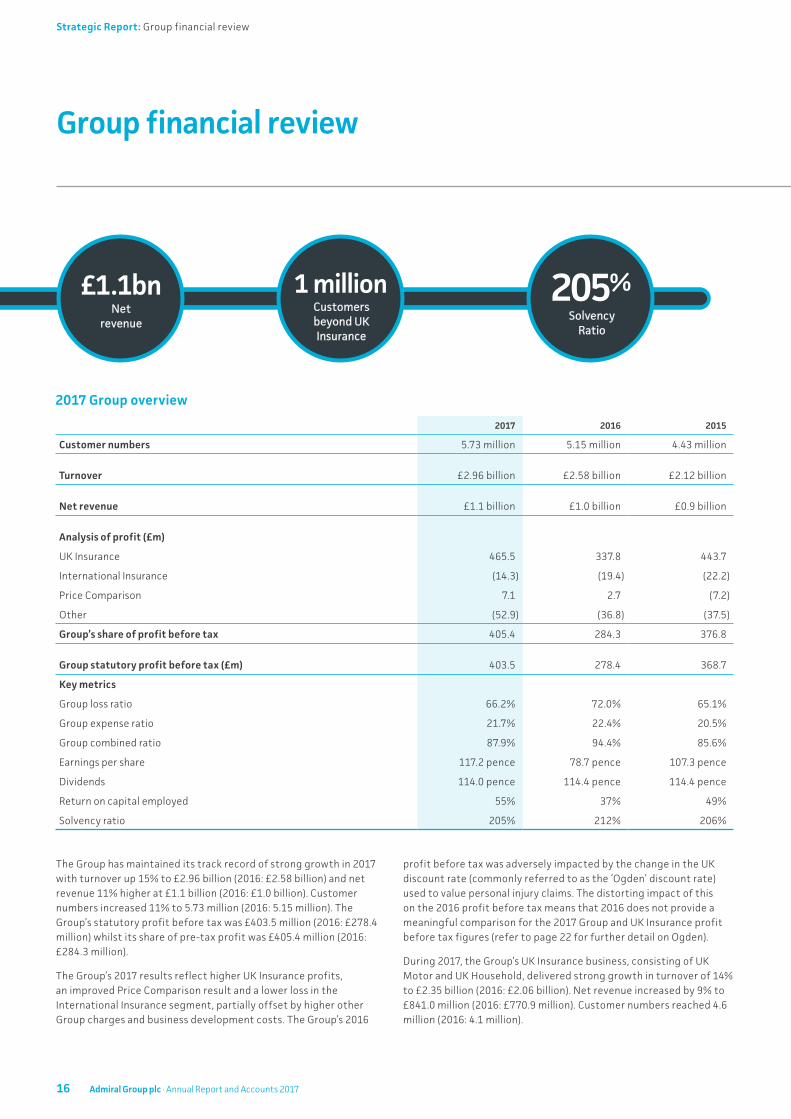
The Group has maintained its track record of strong growth in 2017 with turnover up 15% to £2.96 billion (2016: £2.58 billion) and net revenue 11% higher at £1.1 billion (2016: £1.0 billion). Customer numbers increased 11% to 5.73 million (2016: 5.15 million). The Group’s statutory profit before tax was £403.5 million (2016: £278.4 million) whilst its share of pre-tax profit was £405.4 million (2016: £284.3 million).
The Group’s 2017 results reflect higher UK Insurance profits, an improved Price Comparison result and a lower loss in the International Insurance segment, partially offset by higher other Group charges and business development costs. The Group’s 2016
profit before tax was adversely impacted by the change in the UK discount rate (commonly referred to as the ‘Ogden’ discount rate) used to value personal injury claims. The distorting impact of this on the 2016 profit before tax means that 2016 does not provide a meaningful comparison for the 2017 Group and UK Insurance profit before tax figures (refer to page 22 for further detail on Ogden).
During 2017, the Group’s UK Insurance business, consisting of UK Motor and UK Household, delivered strong growth in turnover of 14% to £2.35 billion (2016: £2.06 billion). Net revenue increased by 9% to £841.0 million (2016: £770.9 million). Customer numbers reached 4.6 million (2016: 4.1 million).
£1.1bnNet
revenue
1 millionCustomers beyond UK Insurance
205%Solvency
Ratio
2017 Group overview
2017 2016 2015
Customer numbers 5.73 million 5.15 million 4.43 million
Turnover £2.96 billion £2.58 billion £2.12 billion
Net revenue £1.1 billion £1.0 billion £0.9 billion
Analysis of profit (£m)
UK Insurance 465.5 337.8 443.7
International Insurance (14.3) (19.4) (22.2)
Price Comparison 7.1 2.7 (7.2)
Other (52.9) (36.8) (37.5)
Group’s share of profit before tax 405.4 284.3 376.8
Group statutory profit before tax (£m) 403.5 278.4 368.7
Key metrics
Group loss ratio 66.2% 72.0% 65.1%
Group expense ratio 21.7% 22.4% 20.5%
Group combined ratio 87.9% 94.4% 85.6%
Earnings per share 117.2 pence 78.7 pence 107.3 pence
Dividends 114.0 pence 114.4 pence 114.4 pence
Return on capital employed 55% 37% 49%
Solvency ratio 205% 212% 206%
16 Admiral Group plc · Annual Report and Accounts 2017
Strategic Report: Group financial review
Outside the UK, Admiral’s International Insurance businesses grew combined turnover by 23% to £449.8 million (2016: £365.9 million) whilst net revenue increased by 35% to £144.8 million (2016: £107.3 million). Customer numbers were up 20% to 1.03 million (2016: 0.86 million). Encouraging progress was made in combined ratio terms with a 4 point improvement, and in aggregate the segment recorded reduced losses of £14.3 million (down from £19.4 million, despite the impact of a significant hurricane on the US result). The Group’s Italian insurer ConTe recorded a profit for the fourth consecutive year.
Admiral’s Price Comparison businesses made an increased combined profit (excluding minority interests’ shares) of £7.1 million (2016: £2.7 million). In the UK, the high level of competition in the price comparison market and investment in the new marketing campaign and product development by Confused.com resulted in reduced profits of £10.1 million in 2017 (2016: £16.1 million). This lower Confused.com profit was offset by a significantly reduced combined loss of £3.0 million (2016: loss £13.4 million) from the international price comparison businesses, where a growing profit in the European operations of £4.1 million (2016: £2.8 million) was offset by a significantly smaller loss in Compare.com of £7.1 million (2016: loss £16.2 million).
Earnings per shareEarnings per share were 117.2 pence (2016: 78.7 pence), the near 50% increase being higher than the increase in pre-tax profit as a result of a lower effective rate of taxation in 2017.
DividendsThe Group’s dividend policy is to pay 65% of post-tax profits as a normal dividend and to pay a further special dividend comprising earnings not required to be held in the Group for solvency or buffers.
The continued strength in the Group’s solvency ratio has allowed the Board to propose a final dividend of 58.0 pence per share (£163 million) as follows:
• 39.5 pence per share representing a normal element, based on the dividend policy of distributing 65% of post-tax profits; and
• A special element of 18.5 pence per share.
This final dividend reflects a 13% increase on the final 2016 dividend of 51.5 pence per share. The total dividend for the 2017 financial year is 114.0 pence per share, which is broadly in line with the 114.4 pence paid in 2016 and in 2015, both years including an additional return of surplus capital of 11.9 pence per share. Excluding this additional return, the total dividend for 2017 is 11% higher than 2016 and 2015.
The payment date is 1 June 2018, ex-dividend date 10 May 2018 and record date 11 May 2018.
Return on equityAdmiral’s capital efficient and highly profitable business model achieved a return on equity of 55% (2016: 37%).
A key part of Admiral’s business model is the extensive use of co- and reinsurance across the Group which provides both loss protection and capital relief and, when combined with high levels of profitability, leads to a superior return on equity.
As noted above, 2016’s result was materially distorted by the impact of the Ogden rate change.
Capital structure and financial positionThe Group’s co-insurance and quota share reinsurance arrangements for the UK Car Insurance business are in place until at least the end of 2019. The Group‘s net retained share of that business is 22%. Munich Re will underwrite 40% of the business (through co-insurance and quota share reinsurance arrangements) until at least the end of 2020.
Similar long-term arrangements are in place in the Group’s International Insurance operations and UK Household Insurance business.
The Group continues to manage its capital to ensure that all entities within the Group are able to continue as going concerns and that regulated entities comfortably meet regulatory capital requirements. Surplus capital within subsidiaries is paid up to the Group holding company in the form of dividends.
The Group’s regulatory capital is based on the Solvency II Standard Formula, with a capital add-on to reflect recognised limitations in the Standard Formula with respect to Admiral’s business (predominantly in respect of profit commission arrangements in co- and reinsurance agreements and risks arising from claims including Periodic Payment Order (PPO) claims).
The capital add-on to the Standard Formula for 2018 is subject to the usual regulatory approval process. The Group plans to submit an application for approval to use an internal model to calculate capital requirements during 2018.
The majority of the Group’s capital requirement is derived from its European insurance operations, Admiral Insurance (Gibraltar) Limited (AIGL) and Admiral Insurance Company Limited (AICL). The estimated (and unaudited) Solvency II position for the Group at the date of this report was as follows:
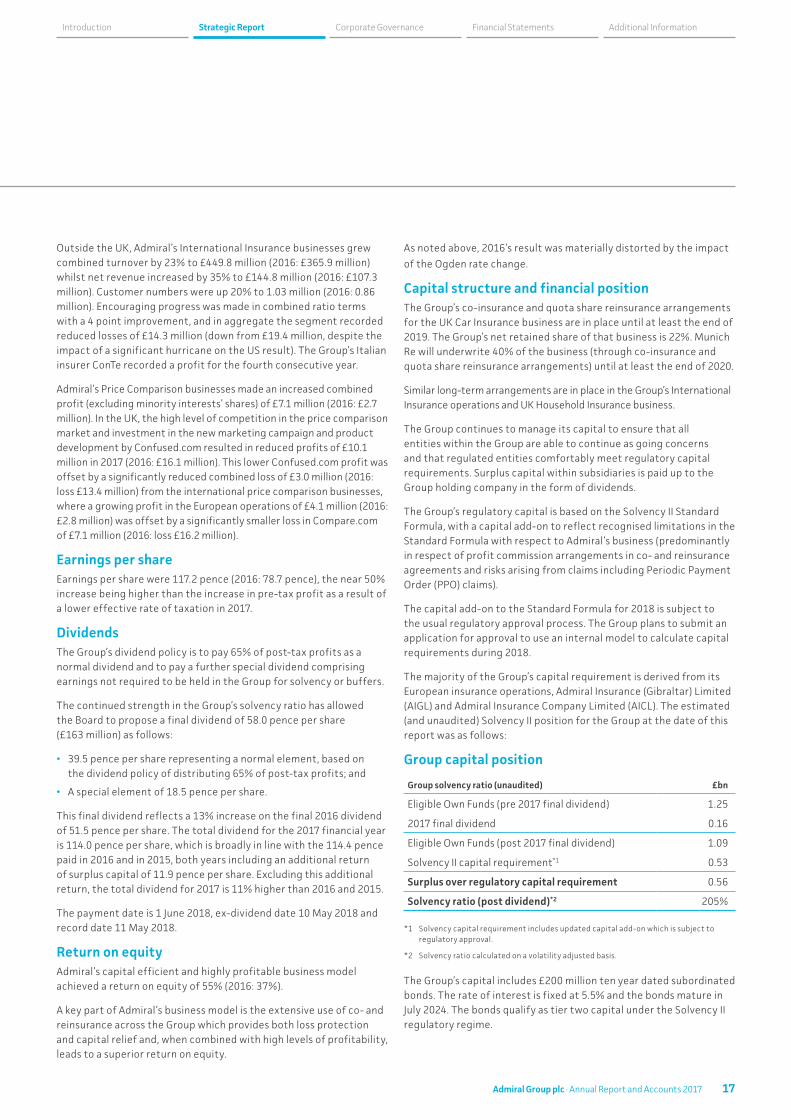
Group capital position
Group solvency ratio (unaudited) £bn
Eligible Own Funds (pre 2017 final dividend) 1.25
2017 final dividend 0.16
Eligible Own Funds (post 2017 final dividend) 1.09
Solvency II capital requirement*1 0.53
Surplus over regulatory capital requirement 0.56
Solvency ratio (post dividend)*2 205%
*1 Solvency capital requirement includes updated capital add-on which is subject to regulatory approval.
*2 Solvency ratio calculated on a volatility adjusted basis.
The Group’s capital includes £200 million ten year dated subordinated bonds. The rate of interest is fixed at 5.5% and the bonds mature in July 2024. The bonds qualify as tier two capital under the Solvency II regulatory regime.
17Admiral Group plc · Annual Report and Accounts 2017
Financial Statements Additional InformationCorporate GovernanceStrategic ReportIntroduction

Estimated sensitivities to the current Group solvency ratio are presented in the table below. These sensitivities cover the two most material risk types, insurance risk and market risk, and within these risks cover the most significant elements of the risk profile. Aside from the catastrophe events, estimated sensitivities have not been calibrated to individual return periods.
Solvency ratio sensitivities (unaudited)
UK Motor – incurred loss ratio +5% -26%
UK Motor – 1 in 200 catastrophe event -3%
UK Household – 1 in 200 catastrophe event -2%
Interest rate – yield curve down 50 bps -11%
Credit spreads widen 100 bps -4%
Currency – 25% movement in euro and US dollar -3%
ASHE – long term inflation assumption up 0.5% -4%
TaxationThe tax charge reported in the Consolidated income statement is £71.9 million (2016: £64.3 million), which equates to 17.8% (2016: 23.1%) of profit before tax. The lower effective rate of taxation compared to 2016 results from lower losses in the Group’s US businesses leading to a lower level of unrecognised deferred tax asset and the reduction in the UK corporation tax rate to 19.0% (from 20.0% from 1 April 2017).
Investments and cashInvestment strategy
Admiral’s investment strategy was unchanged in 2017 and the Group continued to invest in the same asset classes as previous years.
The main focus of the Group’s strategy is preservation of amounts invested, with additional priorities including low volatility of returns and high levels of liquidity. The Group’s Investment Committee performs regular reviews of the strategy to ensure it remains appropriate.
Cash and investments analysis
£m 2017 2016 2015
Fixed income and debt securities 1,493.5 1,469.2 1,428.2
Money market funds and other fair value instruments 1,074.3 781.0 627.7
Cash deposits 130.0 170.0 267.6
Cash 326.8 326.6 265.3
Total 3,024.6 2,746.8 2,588.8
Money market funds, fixed income and debt securities comprise the majority of the total; 85% at 31 December 2017 (2016: 82%).
Investment and interest income in 2017 was £41.7 million, a reduction of £11.4 million on 2016 (£53.1 million). There are a number of partially offsetting variances: 2016 benefitted from £9.2 million of income
relating to the release of an accrual relating to quota share reinsurance arrangements, which wasn’t repeated in 2017. In addition, there is a negative variance of £8.8 million relating to unrealised gains and losses on forward exchange contracts, offset by a one-off gain in 2017 relating to the realised gains on sale of government gilt assets of £5.4 million.
The underlying rate of return for the year (excluding accruals related to reinsurance contract funds withheld) on the Group’s cash and investments was 1.3% (2016: 1.4%).
The Group continues to generate significant amounts of cash and its capital-efficient business model enables the distribution of the majority of post-tax profits as dividends.
Cash flow
£m 2017 2016 2015
Operating cash flow, before transfers to investments 617.2 525.1 487.2
Transfers to financial investments (229.4) (18.1) (112.5)
Operating cash flow 387.8 507.0 374.7
Tax payments (55.9) (74.6) (63.8)
Investing cash flows (capital expenditure) (22.7) (31.6) (47.8)
Financing cash flows (309.6) (364.7) (256.3)
Foreign currency translation impact 0.6 25.2 2.6
Net cash movement 0.2 61.3 9.4
Movement in unrealised gains on investments 11.2 35.2 (12.6)
Movement in accrued interest 37.0 43.4 29.5
Net increase in cash and financial investments 277.8 158.0 138.8
The main items contributing to the operating cash inflow are as follows:
£m 2017 2016 2015
Profit after tax 331.6 214.1 291.8
Change in net insurance liabilities 53.2 206.8 148.7
Net change in trade receivables and liabilities 131.3 25.3 (55.7)
Non-cash income statement items 29.2 14.6 25.5
Taxation expense 71.9 64.3 76.9
Operating cash flow, before transfers to investments 617.2 525.1 487.2
Total cash plus investments increased by £277.8 million or 10% (2016: £158.0 million, 6%).
Group financial review continued
18 Admiral Group plc · Annual Report and Accounts 2017
Strategic Report: UK Insurance review
UK Insurance review
The last twelve months has been a year of big birthdays and a couple of births for Admiral’s UK Insurance segment. It’s now 25 years since we sold our first car insurance policy (2 January 1993), and 5 years since we sold our first household policy (18 December 2012). Over that time, our customer focused approach and strategy of providing excellent service at an affordable price has attracted more than 4.5 million customers. I’m very excited that we’ve launched another two insurance businesses during 2017, with Admiral Van launching in May and Admiral Travel in late November. We hope that by expanding our offering we can provide a fuller product set to satisfy our existing customers, as well as attracting new customers to the Admiral brand.
I opened last year’s review with a brief reference to the Ogden discount rate, which had changed a few days before we announced our 2016 results. Whilst it’s not quite such a hot topic this time around, it seems like a fairly logical place to start this time around too, as it has continued to influence the UK Car Insurance business throughout the year.
One of the cornerstones of Admiral’s success is of course our strong underwriting record, which has enabled us to consistently grow profits over the last 25 years. To protect that underwriting result in a time of significant uncertainty, we put up prices considerably at the start of the year, which impacted our volumes in the first couple of months of 2017 (having grown by more than 10% over the course of 2016). Our competitiveness gradually improved over the first half (despite significant further rate increases) as other insurers gradually adjusted their prices after the new Ogden rate was announced.
Confidence then returned to the market in the second half of the year and we and many others started to reduce prices, partly following the announcement that the Ogden rate would be reviewed (which may lead to a partial reversal of the rate increases required following the February announcement),
but significantly also due to the market-wide favourable experience on bodily injury (BI) frequency. The frequency of BI claims registered on the MOJ portal is 12.5% lower than in 2016, which is consistent with Admiral’s experience.
Whilst some of that benefit has been offset by continued inflation on accidental damage claims, due to the increasing sophistication of cars and movements in exchange rates, the net impact of the price rises and claims frequency reduction means that 2017’s underwriting year looks like Admiral’s best year for a number of years, encouragingly achieved against a backdrop of a 5% growth in the customer base despite the slow start to the year. There’s also scope for further improvement should the Government’s review of the discount rate result in lower settlements than those currently reserved on large BI claims.
Whilst we are proud of our track record of pricing and claims handling, what actually allows us to grow and generate profits each year is that our customers trust us to not only offer competitive prices, but also to provide excellent service. That is regularly supported by a number of customer KPIs we track continuously, whether in the form of direct feedback, retention rates or complaint figures. As a result it was disappointing that we made an error in the way we disclosed prior year premiums on some customer notices during the second quarter of the year. However, having recognised the error, I was very encouraged with the dedication of our people, from a number of different departments, to pull together and correct the issue, and to quickly provide remediation to our affected customers. Whilst not in the ideal circumstances, it was another example of the great team spirit and culture that still exists 25 years on from our launch.
Aside from Car Insurance, our Household business performed very well once again, and continues to show significant promise. We benefitted from another benign year
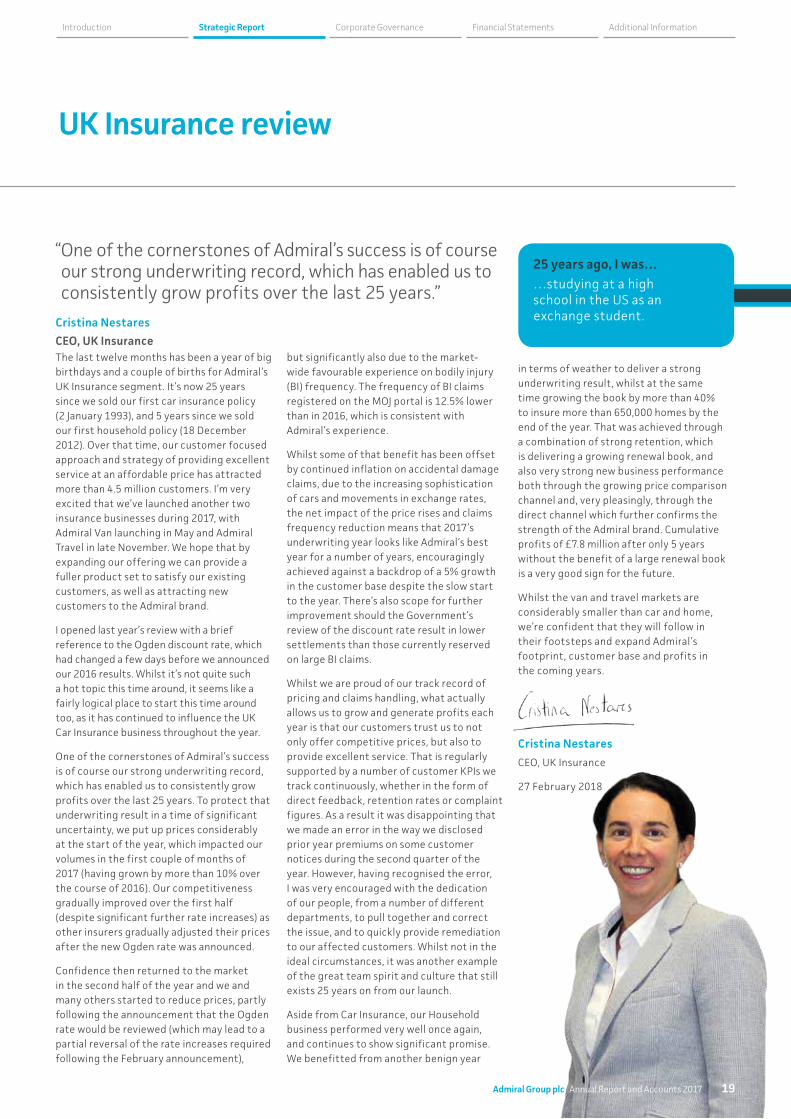
Cristina Nestares
CEO, UK Insurance
25 years ago, I was……studying at a high school in the US as an exchange student.
“ One of the cornerstones of Admiral’s success is of course our strong underwriting record, which has enabled us to consistently grow profits over the last 25 years.”
in terms of weather to deliver a strong underwriting result, whilst at the same time growing the book by more than 40% to insure more than 650,000 homes by the end of the year. That was achieved through a combination of strong retention, which is delivering a growing renewal book, and also very strong new business performance both through the growing price comparison channel and, very pleasingly, through the direct channel which further confirms the strength of the Admiral brand. Cumulative profits of £7.8 million after only 5 years without the benefit of a large renewal book is a very good sign for the future.
Whilst the van and travel markets are considerably smaller than car and home, we’re confident that they will follow in their footsteps and expand Admiral’s footprint, customer base and profits in the coming years.
Cristina Nestares
CEO, UK Insurance
27 February 2018
Financial Statements Additional InformationCorporate GovernanceStrategic ReportIntroduction
19Admiral Group plc · Annual Report and Accounts 2017
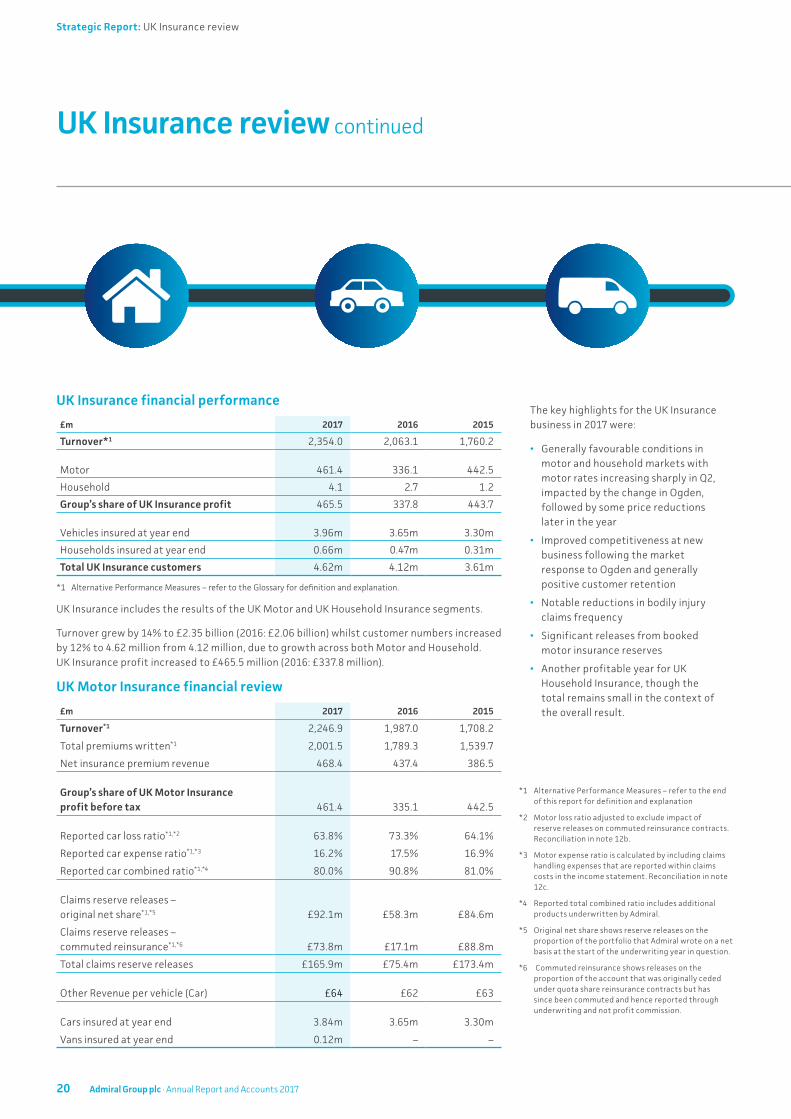
UK Insurance financial performance
£m 2017 2016 2015
Turnover*1 2,354.0 2,063.1 1,760.2
Motor 461.4 336.1 442.5
Household 4.1 2.7 1.2
Group’s share of UK Insurance profit 465.5 337.8 443.7
Vehicles insured at year end 3.96m 3.65m 3.30m
Households insured at year end 0.66m 0.47m 0.31m
Total UK Insurance customers 4.62m 4.12m 3.61m
*1 Alternative Performance Measures – refer to the Glossary for definition and explanation.
UK Insurance includes the results of the UK Motor and UK Household Insurance segments.
Turnover grew by 14% to £2.35 billion (2016: £2.06 billion) whilst customer numbers increased by 12% to 4.62 million from 4.12 million, due to growth across both Motor and Household. UK Insurance profit increased to £465.5 million (2016: £337.8 million).
UK Motor Insurance financial review
£m 2017 2016 2015
Turnover*1 2,246.9 1,987.0 1,708.2
Total premiums written*1 2,001.5 1,789.3 1,539.7
Net insurance premium revenue 468.4 437.4 386.5
Group’s share of UK Motor Insurance profit before tax 461.4 335.1 442.5
Reported car loss ratio*1,*2 63.8% 73.3% 64.1%
Reported car expense ratio*1,*3 16.2% 17.5% 16.9%
Reported car combined ratio*1,*4 80.0% 90.8% 81.0%
Claims reserve releases – original net share*1,*5 £92.1m £58.3m £84.6m
Claims reserve releases – commuted reinsurance*1,*6 £73.8m £17.1m £88.8m
Total claims reserve releases £165.9m £75.4m £173.4m
Other Revenue per vehicle (Car) £64 £62 £63
Cars insured at year end 3.84m 3.65m 3.30m
Vans insured at year end 0.12m – –
*1 Alternative Performance Measures – refer to the end of this report for definition and explanation
*2 Motor loss ratio adjusted to exclude impact of reserve releases on commuted reinsurance contracts. Reconciliation in note 12b.
*3 Motor expense ratio is calculated by including claims handling expenses that are reported within claims costs in the income statement. Reconciliation in note 12c.
*4 Reported total combined ratio includes additional products underwritten by Admiral.
*5 Original net share shows reserve releases on the proportion of the portfolio that Admiral wrote on a net basis at the start of the underwriting year in question.
*6 Commuted reinsurance shows releases on the proportion of the account that was originally ceded under quota share reinsurance contracts but has since been commuted and hence reported through underwriting and not profit commission.
The key highlights for the UK Insurance business in 2017 were:
• Generally favourable conditions in motor and household markets with motor rates increasing sharply in Q2, impacted by the change in Ogden, followed by some price reductions later in the year
• Improved competitiveness at new business following the market response to Ogden and generally positive customer retention
• Notable reductions in bodily injury claims frequency
• Significant releases from booked motor insurance reserves
• Another profitable year for UK Household Insurance, though the total remains small in the context of the overall result.
UK Insurance review continued
20 Admiral Group plc · Annual Report and Accounts 2017
Strategic Report: UK Insurance review
UK Motor Insurance includes UK Car and UK van results. During May 2017, the Group ceased operating its commercial vehicle insurance broker and started underwriting van insurance directly through two brands, Gladiator and Admiral Van. Admiral offers van insurance and associated products, typically to small businesses, via telephone and the internet, including price comparison websites.
The UK Motor Insurance business continued to attract and retain customers in the competitive UK market and this, together with higher average premiums, contributed to an increase in turnover of 13% to £2.25 billion (2016: £1.99 billion) and vehicles insured increased by 8% to 3.96 million from 3.65 million. Group’s share of UK Motor Insurance profit before tax was £461.4 million (2016: £335.1 million).
The strong performance of UK motor in 2017 reflects:
• Higher premium revenue and a lower current year loss ratio and therefore reduced net claims costs
• Higher reserve releases on Admiral’s original net share (approximately £34 million positive impact) reflecting improvement in prior year claims reserves
• Higher reserve releases on the portion of reserves originally reinsured but since commuted (approximately £57 million positive impact), leading to higher aggregate net reserve releases across original net and commuted shares
• Higher profit commission income (£12 million positive impact) resulting from higher reserve releases
• Lower investment return (£7 million adverse impact) mainly related to non-recurring items in 2016 as explained in the Investments and cash section above
• Higher ancillary income (£16 million positive impact) mainly as a result of higher instalment income (impact £22 million) as a result of a change in the co-insurance arrangements with Munich Re.
The UK market saw rate increases during 2017, particularly from Q2 in response to the change in Ogden discount rate (below), before the market-wide favourable experience on bodily injury frequency led to price decreases. Admiral increased its rates in December 2016 in advance of the Ogden change and this impacted competitiveness in the first few months of 2017. This improved in Q2 as the market increased prices in response to the Ogden change and Admiral continued to increase prices during the first six months of 2017 before responding to market conditions and reducing prices in the latter part of the year.
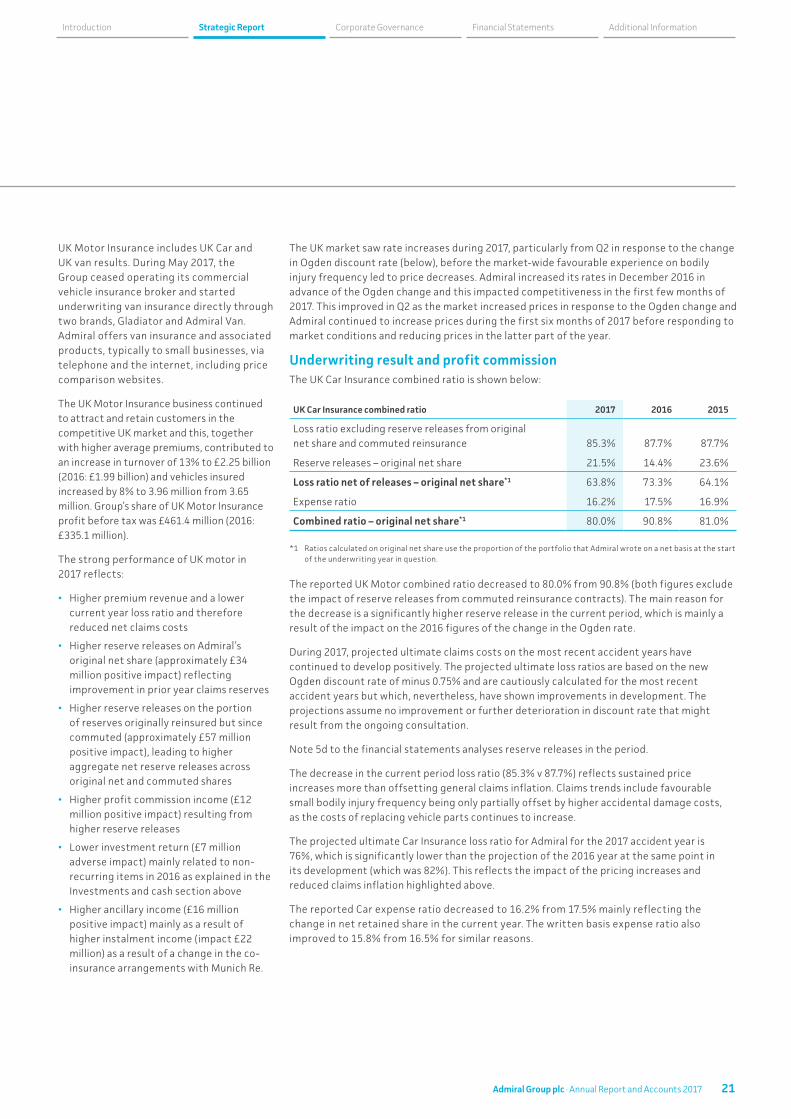
Underwriting result and profit commissionThe UK Car Insurance combined ratio is shown below:
UK Car Insurance combined ratio 2017 2016 2015
Loss ratio excluding reserve releases from original net share and commuted reinsurance 85.3% 87.7% 87.7%
Reserve releases – original net share 21.5% 14.4% 23.6%
Loss ratio net of releases – original net share*1 63.8% 73.3% 64.1%
Expense ratio 16.2% 17.5% 16.9%
Combined ratio – original net share*1 80.0% 90.8% 81.0%
*1 Ratios calculated on original net share use the proportion of the portfolio that Admiral wrote on a net basis at the start of the underwriting year in question.
The reported UK Motor combined ratio decreased to 80.0% from 90.8% (both figures exclude the impact of reserve releases from commuted reinsurance contracts). The main reason for the decrease is a significantly higher reserve release in the current period, which is mainly a result of the impact on the 2016 figures of the change in the Ogden rate.
During 2017, projected ultimate claims costs on the most recent accident years have continued to develop positively. The projected ultimate loss ratios are based on the new Ogden discount rate of minus 0.75% and are cautiously calculated for the most recent accident years but which, nevertheless, have shown improvements in development. The projections assume no improvement or further deterioration in discount rate that might result from the ongoing consultation.
Note 5d to the financial statements analyses reserve releases in the period.
The decrease in the current period loss ratio (85.3% v 87.7%) reflects sustained price increases more than offsetting general claims inflation. Claims trends include favourable small bodily injury frequency being only partially offset by higher accidental damage costs, as the costs of replacing vehicle parts continues to increase.
The projected ultimate Car Insurance loss ratio for Admiral for the 2017 accident year is 76%, which is significantly lower than the projection of the 2016 year at the same point in its development (which was 82%). This reflects the impact of the pricing increases and reduced claims inflation highlighted above.
The reported Car expense ratio decreased to 16.2% from 17.5% mainly reflecting the change in net retained share in the current year. The written basis expense ratio also improved to 15.8% from 16.5% for similar reasons.
21Admiral Group plc · Annual Report and Accounts 2017
Financial Statements Additional InformationCorporate GovernanceStrategic ReportIntroduction
UK Insurance review continued
22
Change in UK discount rate (‘Ogden’) On 27 February 2017, the UK Government announced the outcome of the review of the discount rate (referred to as the Ogden discount rate) used for calculating the value of lump sum personal injury compensation. The new rate is minus 0.75% and applies to all unsettled and new claims from 20 March 2017.
The estimated cost to Admiral, net of tax and reinsurance, of the change is approximately £150 million. Most of the impact has now been reflected in the income statements of 2016 and 2017.
As noted above, the UK Motor Insurance actuarial best estimates reflect the new rate of minus 0.75%. Although its relative size has reduced since the end of 2016, the financial statements continue to include a significant and prudent margin above the projected ultimate claims outcomes.
The Government’s review of the discount rate and the process by which the rate is set continue and the Group looks forward to reviewing its conclusions when they are reported.
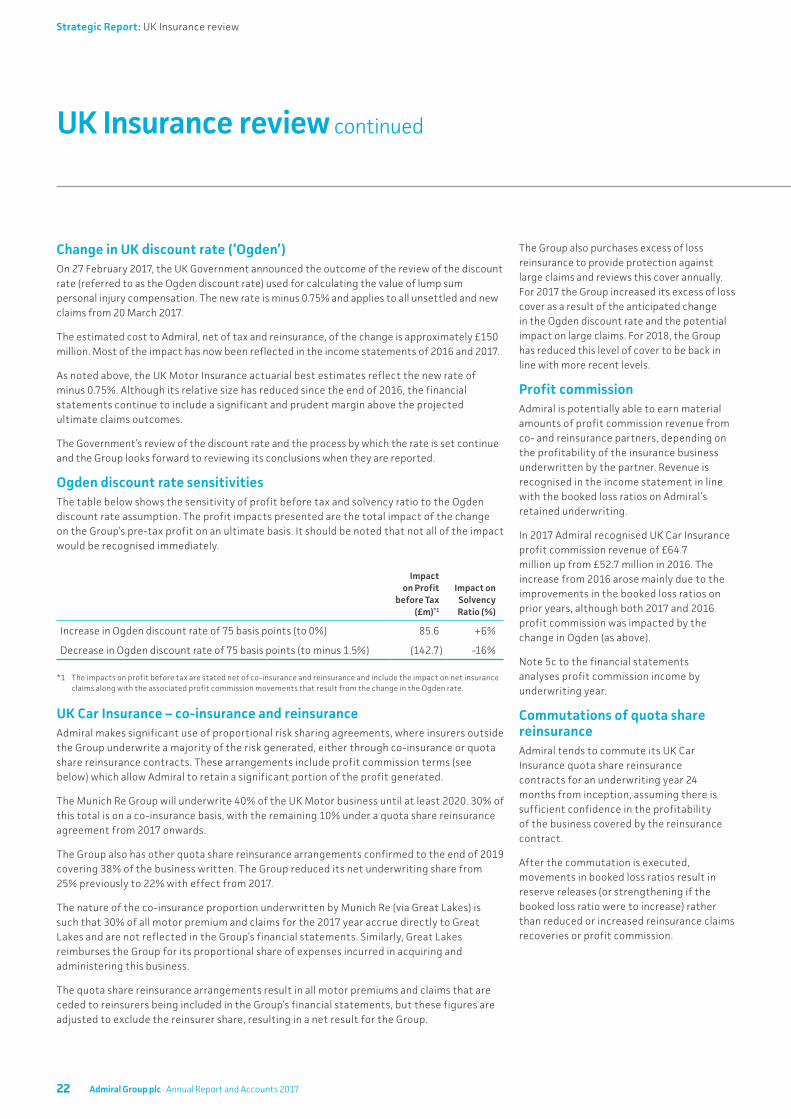
Ogden discount rate sensitivitiesThe table below shows the sensitivity of profit before tax and solvency ratio to the Ogden discount rate assumption. The profit impacts presented are the total impact of the change on the Group’s pre-tax profit on an ultimate basis. It should be noted that not all of the impact would be recognised immediately.
Impact on Profit
before Tax (£m)*1
Impact on Solvency Ratio (%)
Increase in Ogden discount rate of 75 basis points (to 0%) 85.6 +6%
Decrease in Ogden discount rate of 75 basis points (to minus 1.5%) (142.7) -16%
*1 The impacts on profit before tax are stated net of co-insurance and reinsurance and include the impact on net insurance claims along with the associated profit commission movements that result from the change in the Ogden rate.
UK Car Insurance – co-insurance and reinsurance Admiral makes significant use of proportional risk sharing agreements, where insurers outside the Group underwrite a majority of the risk generated, either through co-insurance or quota share reinsurance contracts. These arrangements include profit commission terms (see below) which allow Admiral to retain a significant portion of the profit generated.
The Munich Re Group will underwrite 40% of the UK Motor business until at least 2020. 30% of this total is on a co-insurance basis, with the remaining 10% under a quota share reinsurance agreement from 2017 onwards.
The Group also has other quota share reinsurance arrangements confirmed to the end of 2019 covering 38% of the business written. The Group reduced its net underwriting share from 25% previously to 22% with effect from 2017.
The nature of the co-insurance proportion underwritten by Munich Re (via Great Lakes) is such that 30% of all motor premium and claims for the 2017 year accrue directly to Great Lakes and are not reflected in the Group’s financial statements. Similarly, Great Lakes reimburses the Group for its proportional share of expenses incurred in acquiring and administering this business.
The quota share reinsurance arrangements result in all motor premiums and claims that are ceded to reinsurers being included in the Group’s financial statements, but these figures are adjusted to exclude the reinsurer share, resulting in a net result for the Group.
The Group also purchases excess of loss reinsurance to provide protection against large claims and reviews this cover annually. For 2017 the Group increased its excess of loss cover as a result of the anticipated change in the Ogden discount rate and the potential impact on large claims. For 2018, the Group has reduced this level of cover to be back in line with more recent levels.
Profit commissionAdmiral is potentially able to earn material amounts of profit commission revenue from co- and reinsurance partners, depending on the profitability of the insurance business underwritten by the partner. Revenue is recognised in the income statement in line with the booked loss ratios on Admiral’s retained underwriting.
In 2017 Admiral recognised UK Car Insurance profit commission revenue of £64.7 million up from £52.7 million in 2016. The increase from 2016 arose mainly due to the improvements in the booked loss ratios on prior years, although both 2017 and 2016 profit commission was impacted by the change in Ogden (as above).
Note 5c to the financial statements analyses profit commission income by underwriting year.
Commutations of quota share reinsuranceAdmiral tends to commute its UK Car Insurance quota share reinsurance contracts for an underwriting year 24 months from inception, assuming there is sufficient confidence in the profitability of the business covered by the reinsurance contract.
After the commutation is executed, movements in booked loss ratios result in reserve releases (or strengthening if the booked loss ratio were to increase) rather than reduced or increased reinsurance claims recoveries or profit commission.
22 Admiral Group plc · Annual Report and Accounts 2017
Strategic Report: UK Insurance review
In 2017 Admiral recognised reserve releases from commuted reinsurance contracts of £73.8 million (2016: £17.1 million). The increase from 2016 arose mainly due to the improvements in the booked loss ratios on prior years, although the comparative figure was adversely affected by the impact (£31 million) of the 2014 underwriting year commutation which was completed in 2016.
During 2017, a number of reinsurance contracts relating to the 2015 underwriting year were commuted. At 31 December 2017, reinsurance contracts remain in place for the 2015, 2016 and 2017 years.
Refer to note 5d (vi) of the financial statements for analysis of reserve releases on commuted quota share reinsurance contracts.
UK Car Insurance other revenue
£m 2017 2016 2015
Net other revenue 202.9 188.7 174.6
Other revenue per vehicle*1 £64 £62 £63
*1 Other revenue (before internal costs) divided by average active vehicles, rolling 12 month basis.
Admiral generates other revenue from a portfolio of insurance products that complement the core car insurance product, and also fees generated over the life of the policy.
Net other revenue has increased by 8% mainly due to the increase in instalment income which represents amounts charged to customers paying for cover in instalments. During 2017 Admiral earned £55.5 million from instalment income, up 66% on the prior year (2016: £33.5 million). The main reason for this increase is a change to the co-insurance arrangements resulting in all instalment income from 2017 underwriting year onwards being retained by Admiral. Other factors affecting the increase are increases in average premium and customer numbers.
Other revenue was equivalent to £64 per vehicle (gross of costs; 2016: £62). The majority of the increase reflects increases in instalment income (above) and optional legal cover.
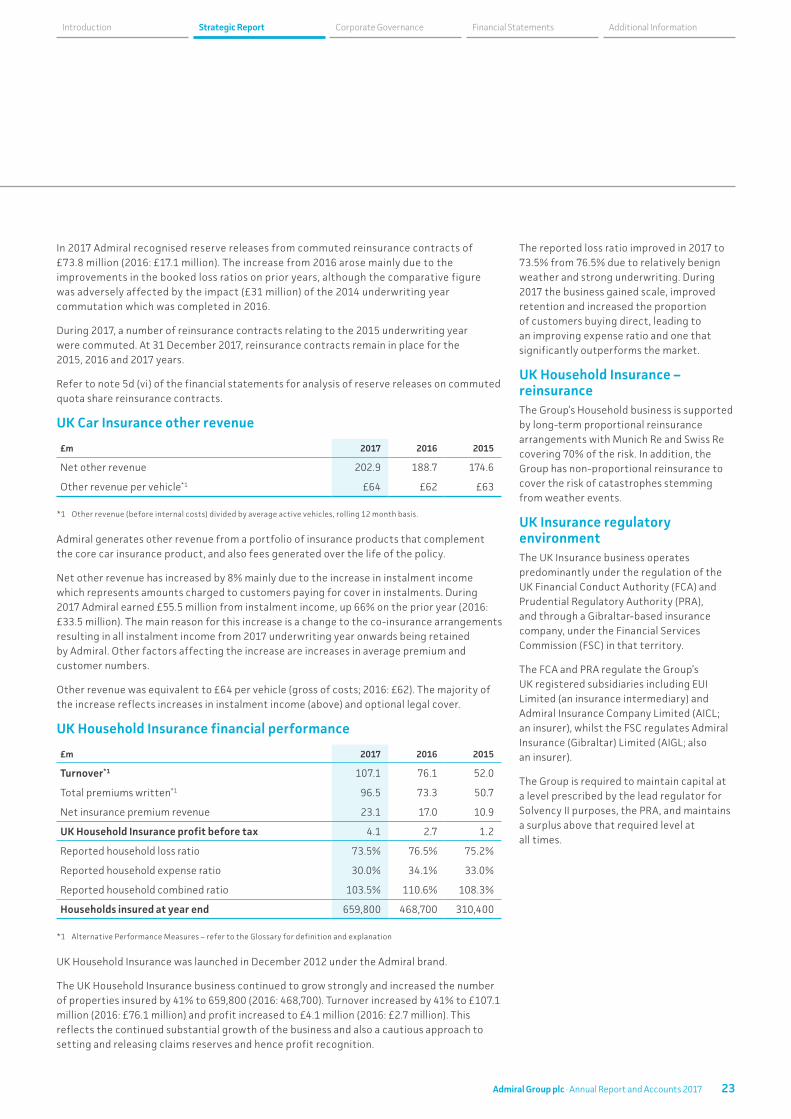
UK Household Insurance financial performance
£m 2017 2016 2015
Turnover*1 107.1 76.1 52.0
Total premiums written*1 96.5 73.3 50.7
Net insurance premium revenue 23.1 17.0 10.9
UK Household Insurance profit before tax 4.1 2.7 1.2
Reported household loss ratio 73.5% 76.5% 75.2%
Reported household expense ratio 30.0% 34.1% 33.0%
Reported household combined ratio 103.5% 110.6% 108.3%
Households insured at year end 659,800 468,700 310,400
*1 Alternative Performance Measures – refer to the Glossary for definition and explanation
UK Household Insurance was launched in December 2012 under the Admiral brand.
The UK Household Insurance business continued to grow strongly and increased the number of properties insured by 41% to 659,800 (2016: 468,700). Turnover increased by 41% to £107.1 million (2016: £76.1 million) and profit increased to £4.1 million (2016: £2.7 million). This reflects the continued substantial growth of the business and also a cautious approach to setting and releasing claims reserves and hence profit recognition.
The reported loss ratio improved in 2017 to 73.5% from 76.5% due to relatively benign weather and strong underwriting. During 2017 the business gained scale, improved retention and increased the proportion of customers buying direct, leading to an improving expense ratio and one that significantly outperforms the market.
UK Household Insurance – reinsurance The Group’s Household business is supported by long-term proportional reinsurance arrangements with Munich Re and Swiss Re covering 70% of the risk. In addition, the Group has non-proportional reinsurance to cover the risk of catastrophes stemming from weather events.
UK Insurance regulatory environmentThe UK Insurance business operates predominantly under the regulation of the UK Financial Conduct Authority (FCA) and Prudential Regulatory Authority (PRA), and through a Gibraltar-based insurance company, under the Financial Services Commission (FSC) in that territory.
The FCA and PRA regulate the Group’s UK registered subsidiaries including EUI Limited (an insurance intermediary) and Admiral Insurance Company Limited (AICL; an insurer), whilst the FSC regulates Admiral Insurance (Gibraltar) Limited (AIGL; also an insurer).
The Group is required to maintain capital at a level prescribed by the lead regulator for Solvency II purposes, the PRA, and maintains a surplus above that required level at all times.
23Admiral Group plc · Annual Report and Accounts 2017
Financial Statements Additional InformationCorporate GovernanceStrategic ReportIntroduction
International Car Insurance review
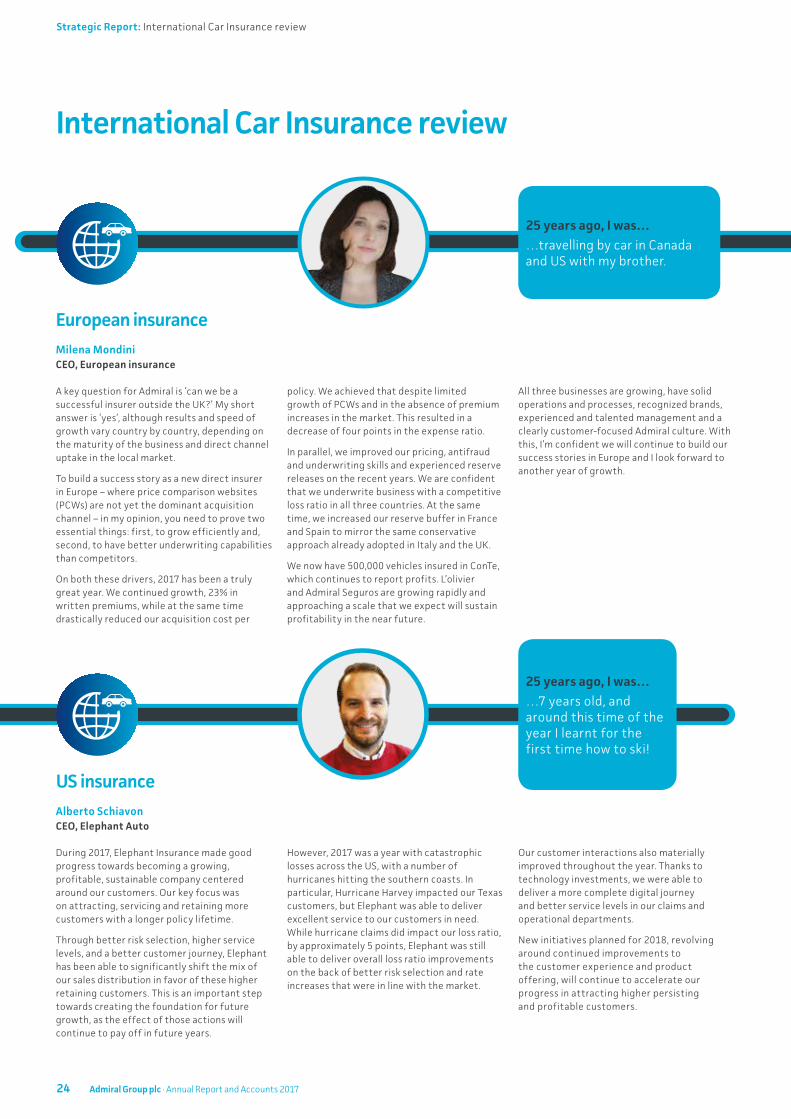
European insurance
US insurance
A key question for Admiral is ‘can we be a successful insurer outside the UK?’ My short answer is ‘yes’, although results and speed of growth vary country by country, depending on the maturity of the business and direct channel uptake in the local market.
To build a success story as a new direct insurer in Europe – where price comparison websites (PCWs) are not yet the dominant acquisition channel – in my opinion, you need to prove two essential things: first, to grow efficiently and, second, to have better underwriting capabilities than competitors.
On both these drivers, 2017 has been a truly great year. We continued growth, 23% in written premiums, while at the same time drastically reduced our acquisition cost per
policy. We achieved that despite limited growth of PCWs and in the absence of premium increases in the market. This resulted in a decrease of four points in the expense ratio.
In parallel, we improved our pricing, antifraud and underwriting skills and experienced reserve releases on the recent years. We are confident that we underwrite business with a competitive loss ratio in all three countries. At the same time, we increased our reserve buffer in France and Spain to mirror the same conservative approach already adopted in Italy and the UK.
We now have 500,000 vehicles insured in ConTe, which continues to report profits. L’olivier and Admiral Seguros are growing rapidly and approaching a scale that we expect will sustain profitability in the near future.
All three businesses are growing, have solid operations and processes, recognized brands, experienced and talented management and a clearly customer-focused Admiral culture. With this, I’m confident we will continue to build our success stories in Europe and I look forward to another year of growth.
During 2017, Elephant Insurance made good progress towards becoming a growing, profitable, sustainable company centered around our customers. Our key focus was on attracting, servicing and retaining more customers with a longer policy lifetime.
Through better risk selection, higher service levels, and a better customer journey, Elephant has been able to significantly shift the mix of our sales distribution in favor of these higher retaining customers. This is an important step towards creating the foundation for future growth, as the effect of those actions will continue to pay off in future years.
However, 2017 was a year with catastrophic losses across the US, with a number of hurricanes hitting the southern coasts. In particular, Hurricane Harvey impacted our Texas customers, but Elephant was able to deliver excellent service to our customers in need. While hurricane claims did impact our loss ratio, by approximately 5 points, Elephant was still able to deliver overall loss ratio improvements on the back of better risk selection and rate increases that were in line with the market.
Our customer interactions also materially improved throughout the year. Thanks to technology investments, we were able to deliver a more complete digital journey and better service levels in our claims and operational departments.
New initiatives planned for 2018, revolving around continued improvements to the customer experience and product offering, will continue to accelerate our progress in attracting higher persisting and profitable customers.
Milena Mondini CEO, European insurance
Alberto Schiavon CEO, Elephant Auto
25 years ago, I was……travelling by car in Canada and US with my brother.
25 years ago, I was……7 years old, and around this time of the year I learnt for the first time how to ski!
24 Admiral Group plc · Annual Report and Accounts 2017
Strategic Report: International Car Insurance review
25 years ago, I was……at school!
25 years ago, I was……in high school and had a Summer trip to learn English in Cardiff!
25 years ago, I was……at school and playing tennis and having fun windsurfing!
Spain Admiral Seguros (Seville)
France L’olivier – assurance auto (Paris)
Italy ConTe (Rome)
L’olivier – assurance auto had another year of strong growth, with a more than 40% increase in turnover and closing the year with 130,000 customers. This was due to a growing aggregator market and some effective TV investments that improved our brand awareness. Two years ago, a new regulation was passed helping French customers to switch their motor insurance more easily. Though more an evolution than a revolution, this change is having a growing impact in market fluidity and L’olivier – assurance auto is benefiting from it.
Moderated price increases in the market were not strong enough to compensate for higher claims costs and market profitability isn’t likely to improve much in 2017. The market motor combined ratio is expected to be around 105%.
L’olivier – assurance auto managed to improve its technical results thanks to our unique way of pricing in the French market. Our pricing competitive advantage should become even more significant with a larger book of business, more data and more exposure.
What’s next? L’olivier needs to keep growing and build scale in order to provide sustainable profits to Admiral Group. Service quality will be a key lever to achieve this goal and our ambition is to prove to French customers that a direct insurer can provide service excellence. Our vision by 2020 is to be in the top three direct motor insurers in France, providing a high service quality and using one of the most sophisticated approaches to pricing and underwriting in the French market.
Lots of new exciting projects are in the pipeline to make our vision a reality!
More growth and profit!
Despite a challenging market where the average premium continued to fall (around 3% year-on-year) and price comparison growth was low, we have increased our customer base to 500,000 (+20% year-on-year) and have maintained a strong focus on profitability, reaching a profit for the fourth year in a row. The main drivers of this are: a better customer journey sustained by a stronger brand; a more mature portfolio; and improvement in the expense ratio.
Loss ratios are developing well and show a consistent downtrend across 2016 and prior underwriting years.
The 2017 market combined ratio should be around 100% while for the direct part of the market it should already be above 100%, and as a consequence a timid market cycle upturn is now more likely than one year ago.
In this context, ConTe continues to pursue its ‘sustainable growth’ strategy and to maintain a consistent level of investment in technology, brand and people.
In 2017 Admiral Seguros continued our path of sustainable growth. We increased customers by almost 20%, with strong technical results.
The Spanish market grew premium by about 3%. Price competition means that insurers are not passing to customers the full impact of claims cost inflation from the new “Baremo” (regulating compensation for bodily injury cases).
In this highly competitive context we continued to grow market share due to customer journey improvements in the price comparison channel, combined with strong growth in direct-to-site digital sales, particularly for the Qualitas Auto brand. Technical results developed well, with especially positive evolution for the 2016 underwriting year.
In 2018 we don´t expect much change in the market. We will maintain focus on scaling up the business in a sustainable way.
Pascal Gonzalvez CEO, L’olivier – assurance auto
Costantino Moretti CEO, ConTe
Sarah Harris CEO, Admiral Seguros
25Admiral Group plc · Annual Report and Accounts 2017
Financial Statements Additional InformationCorporate GovernanceStrategic ReportIntroduction
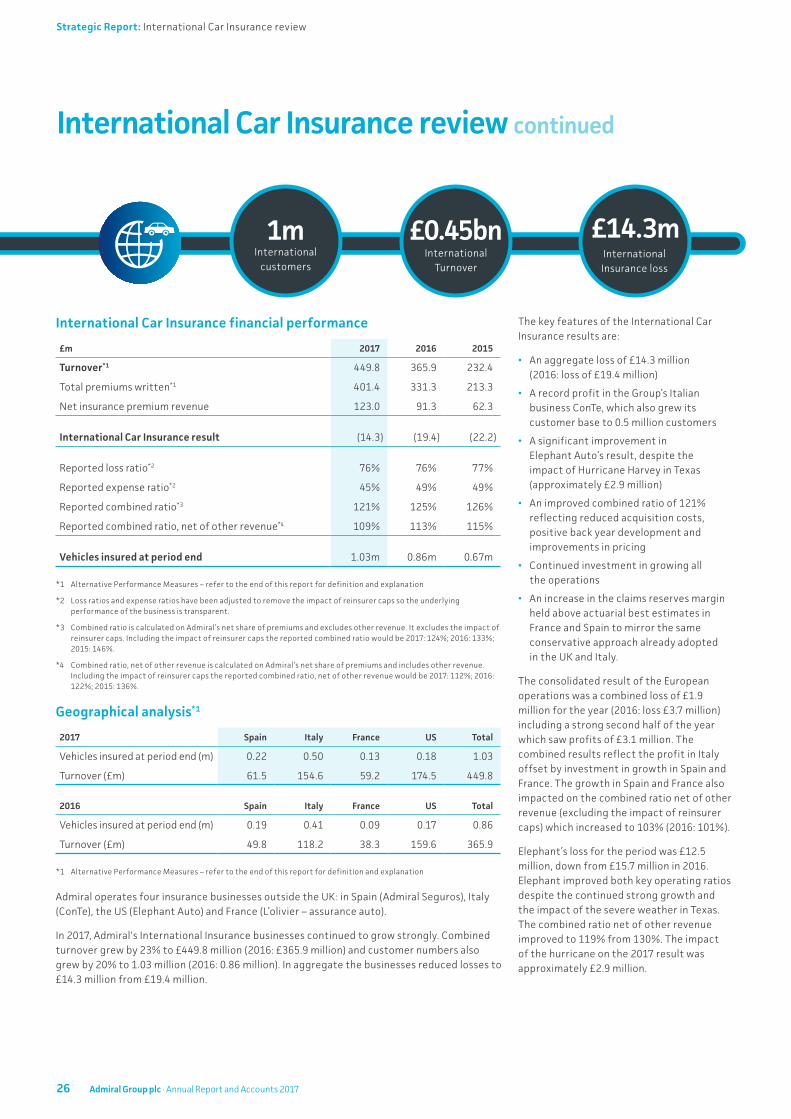
International Car Insurance review continued
£14.3m£0.45bn1mInternational Insurance loss
International Turnover
International customers
International Car Insurance financial performance
£m 2017 2016 2015
Turnover*1 449.8 365.9 232.4
Total premiums written*1 401.4 331.3 213.3
Net insurance premium revenue 123.0 91.3 62.3
International Car Insurance result (14.3) (19.4) (22.2)
Reported loss ratio*2 76% 76% 77%
Reported expense ratio*2 45% 49% 49%
Reported combined ratio*3 121% 125% 126%
Reported combined ratio, net of other revenue*4 109% 113% 115%
Vehicles insured at period end 1.03m 0.86m 0.67m
*1 Alternative Performance Measures – refer to the end of this report for definition and explanation
*2 Loss ratios and expense ratios have been adjusted to remove the impact of reinsurer caps so the underlying performance of the business is transparent.
*3 Combined ratio is calculated on Admiral’s net share of premiums and excludes other revenue. It excludes the impact of reinsurer caps. Including the impact of reinsurer caps the reported combined ratio would be 2017: 124%; 2016: 133%; 2015: 146%.
*4 Combined ratio, net of other revenue is calculated on Admiral’s net share of premiums and includes other revenue. Including the impact of reinsurer caps the reported combined ratio, net of other revenue would be 2017: 112%; 2016: 122%; 2015: 136%.
Geographical analysis*1
2017 Spain Italy France US Total
Vehicles insured at period end (m) 0.22 0.50 0.13 0.18 1.03
Turnover (£m) 61.5 154.6 59.2 174.5 449.8
2016 Spain Italy France US Total
Vehicles insured at period end (m) 0.19 0.41 0.09 0.17 0.86
Turnover (£m) 49.8 118.2 38.3 159.6 365.9
*1 Alternative Performance Measures – refer to the end of this report for definition and explanation
Admiral operates four insurance businesses outside the UK: in Spain (Admiral Seguros), Italy (ConTe), the US (Elephant Auto) and France (L’olivier – assurance auto).
In 2017, Admiral's International Insurance businesses continued to grow strongly. Combined turnover grew by 23% to £449.8 million (2016: £365.9 million) and customer numbers also grew by 20% to 1.03 million (2016: 0.86 million). In aggregate the businesses reduced losses to £14.3 million from £19.4 million.
The key features of the International Car Insurance results are:
• An aggregate loss of £14.3 million (2016: loss of £19.4 million)
• A record profit in the Group’s Italian business ConTe, which also grew its customer base to 0.5 million customers
• A significant improvement in Elephant Auto’s result, despite the impact of Hurricane Harvey in Texas (approximately £2.9 million)
• An improved combined ratio of 121% reflecting reduced acquisition costs, positive back year development and improvements in pricing
• Continued investment in growing all the operations
• An increase in the claims reserves margin held above actuarial best estimates in France and Spain to mirror the same conservative approach already adopted in the UK and Italy.
The consolidated result of the European operations was a combined loss of £1.9 million for the year (2016: loss £3.7 million) including a strong second half of the year which saw profits of £3.1 million. The combined results reflect the profit in Italy offset by investment in growth in Spain and France. The growth in Spain and France also impacted on the combined ratio net of other revenue (excluding the impact of reinsurer caps) which increased to 103% (2016: 101%).
Elephant’s loss for the period was £12.5 million, down from £15.7 million in 2016. Elephant improved both key operating ratios despite the continued strong growth and the impact of the severe weather in Texas. The combined ratio net of other revenue improved to 119% from 130%. The impact of the hurricane on the 2017 result was approximately £2.9 million.
26 Admiral Group plc · Annual Report and Accounts 2017
Strategic Report: International Car Insurance review
In 2017, a non-cash impairment charge of £25 million was recognised by the parent company in respect of its investment in Elephant Auto. This followed the regular review of the carrying value of subsidiary companies and coincided with a review of the long-term strategy of Elephant by its management team and subsequent approval by the Board. During 2017, additional capital of £16 million was provided to Elephant to continue to maintain a strong surplus over regulatory requirements. Elephant remains loss making at this stage in its development, which is in line with its long-term plan. Whilst the long-term plan did support the carrying value of the subsidiary, impairment was considered appropriate following the results of a number of stress tests applied to the plans.
During 2017 the management team at Elephant has been strengthened and a number of important operational improvements have been made. Although success is not certain, the Board remains confident in the prospects of the business and continues to support Elephant in the achievement of its goals. The impairment charge has no impact on the Group’s profit for the period or capital position. Further information is set out on page 146.
International Car Insurance co-insurance and reinsuranceIn 2017 Admiral retained 35% (Italy), 30% (France and Spain) and 33% (US) of the underwriting risk respectively. The arrangements for 2018 will remain the same.
International Car Insurance regulatory environmentAdmiral’s European insurance operations are currently subject to the same regulation as the UK Car Insurance business, details of which are summarised above, but also comply with local requirements as appropriate. Further information on the potential impact of Brexit on the European insurance operations can be found on page 31.
The Group’s US insurer, Elephant Insurance Company, is regulated by the Virginia State Corporation Commission’s Bureau of Insurance. The Company is required to maintain capital at levels prescribed by the regulator and holds a surplus above these requirements at all times.
27Admiral Group plc · Annual Report and Accounts 2017
Financial Statements Additional InformationCorporate GovernanceStrategic ReportIntroduction
International
France Spain
Our original market, the UK, gives us some guidelines for the expected development of PCWs around the world; first, we expect digital insurance comparison will grow substantially - it is still under-penetrated around the world; and second, there are a limited number of players that will succeed in each country.
Admiral has driven organic international expansion in PCW around the world: Spain (Rastreator.com), France (LeLynx.fr), Italy (Chiarreza.it), US (Compare.com), China (Duobi), Mexico (Rastreator.mx) and more coming.
We believe our proven capability to organically set up successful PCWs for a reasonable investment with clean exits where needed (Italy and China), allows us to increase our total addressable market substantially and allows us to keep growing in the future while the UK faces a more competitive market.
Being based in several locations allows us to anticipate customer needs and to promote innovation. Developing our own platforms gives us scalability. We believe that our world requires some disruption to improve customer experience.
In all countries, brand development and investment is required to attract relevant traffic, however our core, car insurance, provides us sufficient margin and potential to create relevant brands to leverage the diversification.
Strategically, we hope to keep expanding and play relevant roles in the markets we are in. Big challenges and big opportunities in a business model with low barriers to entry but high barriers to lead and succeed.
Price Comparison review
Elena Betés European Price Comparison Director
Martin Coriat CEO, LeLynx
Fernando Summers CEO, Rastreator
In 2017, the French market became more competitive for aggregators - strong competitors and a significant new entrant helped grow the market. The French economy showed signs of change, growth and digitalization with insurance aggregation seeing double digit market growth.
As for operational results, LeLynx had a positive year in 2017, with both revenue and profit growing. The business has gone from strength to strength; the team has grown while the market dynamics have become more complex although more promising. During 2017 we also made operational changes that will support future growth. Finally, LeLynx ranked 11th in the Great Place to Work in France in its first year of participation!
Our 2018 priorities remain similar to 2017: focus on operational execution, build our brand equity to grow the market and expand our product range to make the most of media investment and brand equity.
2017 has been a year of challenge and growth for Rastreator. A major challenge was to improve price accuracy and conversion in our core business while maintaining growth in all business lines. And we can proudly say we have achieved both. Conversion is at its historical maximum while we keep on improving revenues, sales and profit. Challenges remain: improving customer experience, maximising profitability and growing revenue for other business lines.
Focus areas for 2018 are to consolidate our core business, as we develop our data strategy, and launch our car buying/selling vertical and mortgage brokerage model. We will do this by improving customer experience in our existing verticals.
I am proud of our Rastreator team; strong and committed in our ambition and attitude.
25 years ago, I was……at school, spending my days studying, horse riding and working (walking dogs!).
25 years ago, I was……a member of Champion Under 13 French Junior Rugby league team. I loved that feeling of collective victory.
25 years ago, I was……on my first solo summer abroad in Canterbury, UK, where I stayed with a local family – a summer that changed my perspective!
28 Admiral Group plc · Annual Report and Accounts 2017
Strategic Report: Price Comparison review
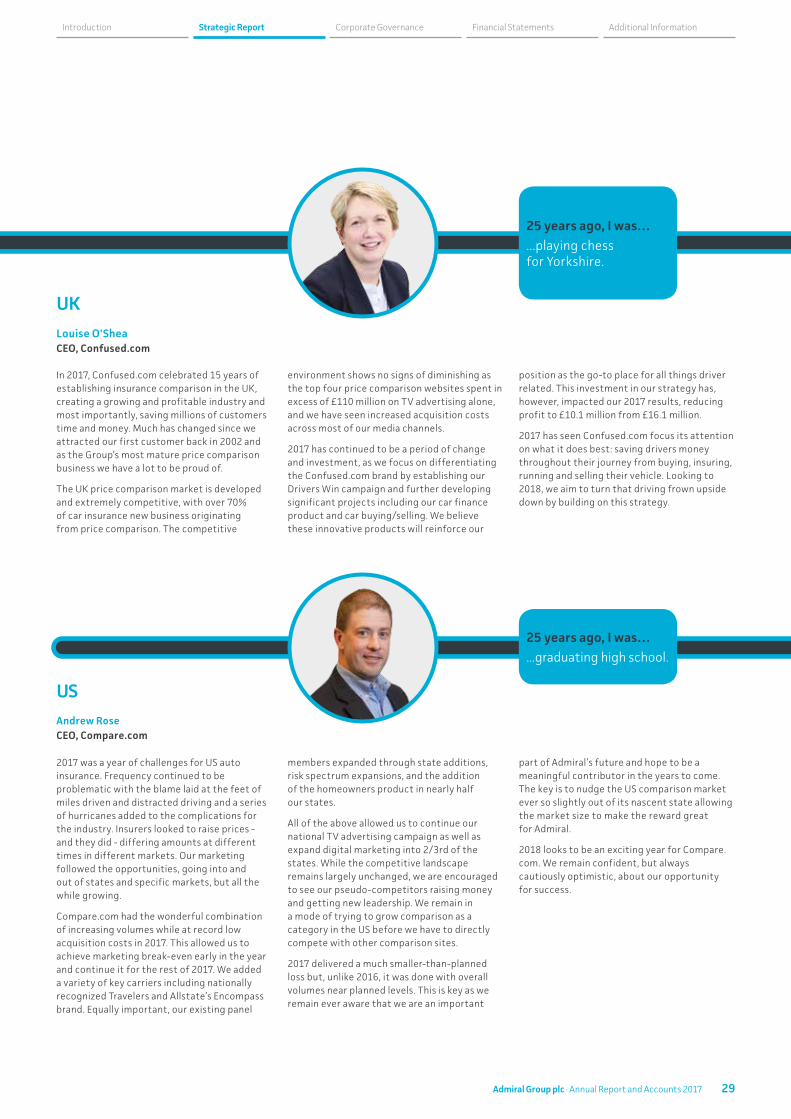
US
UK
In 2017, Confused.com celebrated 15 years of establishing insurance comparison in the UK, creating a growing and profitable industry and most importantly, saving millions of customers time and money. Much has changed since we attracted our first customer back in 2002 and as the Group’s most mature price comparison business we have a lot to be proud of.
The UK price comparison market is developed and extremely competitive, with over 70% of car insurance new business originating from price comparison. The competitive
environment shows no signs of diminishing as the top four price comparison websites spent in excess of £110 million on TV advertising alone, and we have seen increased acquisition costs across most of our media channels.
2017 has continued to be a period of change and investment, as we focus on differentiating the Confused.com brand by establishing our Drivers Win campaign and further developing significant projects including our car finance product and car buying/selling. We believe these innovative products will reinforce our
position as the go-to place for all things driver related. This investment in our strategy has, however, impacted our 2017 results, reducing profit to £10.1 million from £16.1 million.
2017 has seen Confused.com focus its attention on what it does best: saving drivers money throughout their journey from buying, insuring, running and selling their vehicle. Looking to 2018, we aim to turn that driving frown upside down by building on this strategy.
2017 was a year of challenges for US auto insurance. Frequency continued to be problematic with the blame laid at the feet of miles driven and distracted driving and a series of hurricanes added to the complications for the industry. Insurers looked to raise prices - and they did - differing amounts at different times in different markets. Our marketing followed the opportunities, going into and out of states and specific markets, but all the while growing.
Compare.com had the wonderful combination of increasing volumes while at record low acquisition costs in 2017. This allowed us to achieve marketing break-even early in the year and continue it for the rest of 2017. We added a variety of key carriers including nationally recognized Travelers and Allstate’s Encompass brand. Equally important, our existing panel
members expanded through state additions, risk spectrum expansions, and the addition of the homeowners product in nearly half our states.
All of the above allowed us to continue our national TV advertising campaign as well as expand digital marketing into 2/3rd of the states. While the competitive landscape remains largely unchanged, we are encouraged to see our pseudo-competitors raising money and getting new leadership. We remain in a mode of trying to grow comparison as a category in the US before we have to directly compete with other comparison sites.
2017 delivered a much smaller-than-planned loss but, unlike 2016, it was done with overall volumes near planned levels. This is key as we remain ever aware that we are an important
part of Admiral’s future and hope to be a meaningful contributor in the years to come. The key is to nudge the US comparison market ever so slightly out of its nascent state allowing the market size to make the reward great for Admiral.
2018 looks to be an exciting year for Compare.com. We remain confident, but always cautiously optimistic, about our opportunity for success.
Andrew Rose CEO, Compare.com
Louise O'Shea CEO, Confused.com
25 years ago, I was…...playing chess for Yorkshire.
25 years ago, I was…...graduating high school.
29Admiral Group plc · Annual Report and Accounts 2017
Financial Statements Additional InformationCorporate GovernanceStrategic ReportIntroduction
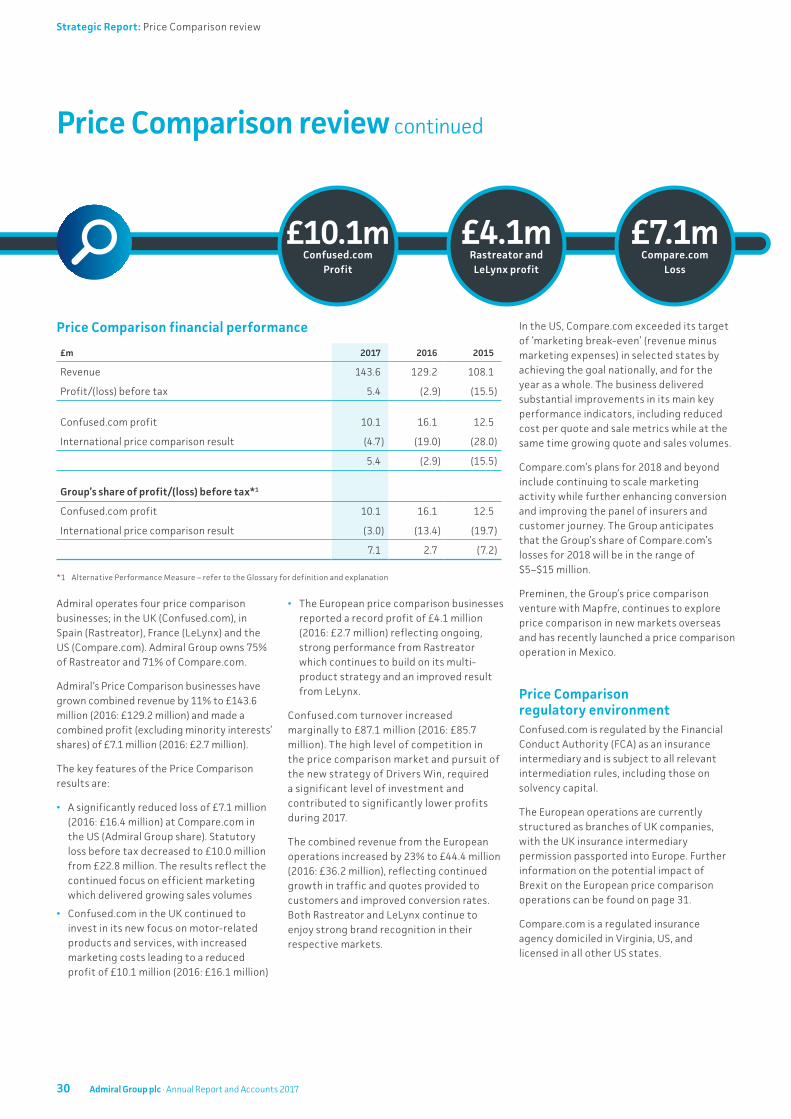
£10.1mConfused.com
Profit
£4.1mRastreator and LeLynx profit
£7.1mCompare.com
Loss
Price Comparison review continued
Price Comparison financial performance
£m 2017 2016 2015
Revenue 143.6 129.2 108.1
Profit/(loss) before tax 5.4 (2.9) (15.5)
Confused.com profit 10.1 16.1 12.5
International price comparison result (4.7) (19.0) (28.0)
5.4 (2.9) (15.5)
Group’s share of profit/(loss) before tax*1
Confused.com profit 10.1 16.1 12.5
International price comparison result (3.0) (13.4) (19.7)
7.1 2.7 (7.2)
*1 Alternative Performance Measure – refer to the Glossary for definition and explanation
Admiral operates four price comparison businesses; in the UK (Confused.com), in Spain (Rastreator), France (LeLynx) and the US (Compare.com). Admiral Group owns 75% of Rastreator and 71% of Compare.com.
Admiral’s Price Comparison businesses have grown combined revenue by 11% to £143.6 million (2016: £129.2 million) and made a combined profit (excluding minority interests’ shares) of £7.1 million (2016: £2.7 million).
The key features of the Price Comparison results are:
• A significantly reduced loss of £7.1 million (2016: £16.4 million) at Compare.com in the US (Admiral Group share). Statutory loss before tax decreased to £10.0 million from £22.8 million. The results reflect the continued focus on efficient marketing which delivered growing sales volumes
• Confused.com in the UK continued to invest in its new focus on motor-related products and services, with increased marketing costs leading to a reduced profit of £10.1 million (2016: £16.1 million)
• The European price comparison businesses reported a record profit of £4.1 million (2016: £2.7 million) reflecting ongoing, strong performance from Rastreator which continues to build on its multi-product strategy and an improved result from LeLynx.
Confused.com turnover increased marginally to £87.1 million (2016: £85.7 million). The high level of competition in the price comparison market and pursuit of the new strategy of Drivers Win, required a significant level of investment and contributed to significantly lower profits during 2017.
The combined revenue from the European operations increased by 23% to £44.4 million (2016: £36.2 million), reflecting continued growth in traffic and quotes provided to customers and improved conversion rates. Both Rastreator and LeLynx continue to enjoy strong brand recognition in their respective markets.
In the US, Compare.com exceeded its target of ‘marketing break-even’ (revenue minus marketing expenses) in selected states by achieving the goal nationally, and for the year as a whole. The business delivered substantial improvements in its main key performance indicators, including reduced cost per quote and sale metrics while at the same time growing quote and sales volumes.
Compare.com’s plans for 2018 and beyond include continuing to scale marketing activity while further enhancing conversion and improving the panel of insurers and customer journey. The Group anticipates that the Group’s share of Compare.com’s losses for 2018 will be in the range of $5–$15 million.
Preminen, the Group’s price comparison venture with Mapfre, continues to explore price comparison in new markets overseas and has recently launched a price comparison operation in Mexico.
Price Comparison regulatory environmentConfused.com is regulated by the Financial Conduct Authority (FCA) as an insurance intermediary and is subject to all relevant intermediation rules, including those on solvency capital.
The European operations are currently structured as branches of UK companies, with the UK insurance intermediary permission passported into Europe. Further information on the potential impact of Brexit on the European price comparison operations can be found on page 31.
Compare.com is a regulated insurance agency domiciled in Virginia, US, and licensed in all other US states.
30 Admiral Group plc · Annual Report and Accounts 2017
Strategic Report: Price Comparison review
The UK commercial vehicle result relates to the Gladiator broking business which is migrating its portfolio to being underwritten within the UK Insurance business of the Group. Future results from the business are expected to be insignificant.
During the first half of 2017, the Group successfully rolled out the first release of its new technology platform for UK personal loans. The business currently distributes unsecured personal loans and car finance through the price comparison channel and also direct to consumers via the Admiral website. The Group expects the business to make small losses in its early phase mostly as a result of high fixed costs relative to the current scale of the business.
Other interest and investment income of £8.4 million (2016: £13.4 million) includes £5.4 million (2016: £Nil) of realised gains on investments held by the Group parent company and unrealised losses of £2.3 million (2016: £6.5 million unrealised gains) in respect of forward foreign exchange contracts.
Share scheme charges relate to the Group’s two employee share schemes (refer to note 8 to the financial statements). The increase in the charge is due to an increase in the number of awards reflecting the increasing Group headcount. The Group does not anticipate further significant increases in the volume of awards.
Business development costs include costs associated with potential new ventures, including the launch of Admiral Travel insurance and investment in Preminen Ventures, including the launch of a price comparison operation in Mexico. Other central overheads of £6.2 million are £2.1 million higher than 2016 (£4.1 million), as a result of a number of non-recurring costs relating to ongoing Group projects.
Finance charges of £11.4 million (2016: £11.4 million) mainly represent interest on the £200 million subordinated notes issued in July 2014 (refer to note 6 to the financial statements).
UK Exit from the European Union (‘Brexit’)Although uncertainty remains as to the outcome of the Brexit negotiations between the UK and the EU, the Group has adopted a prudent approach that will ensure it is well prepared in the event of a ‘hard’ Brexit which includes being ready to deal with the likely loss of passporting rights from the UK and Gibraltar into the EU.
Applications for new licenses for insurance and intermediary companies have been made to the Spanish regulator, with approvals expected in 2018.
Separately, two new locally licensed intermediaries will be established through which Rastreator and LeLynx will trade in Spain and France.
Brexit continues to bring risks to the Group, which include:
• The potential for market volatility, particularly in interest and exchange rates
• The potential for the uncertainty or the emerging terms of exit to trigger or exacerbate less favourable economic conditions in the UK and other countries in which Admiral operates (though it is worth noting that car insurance has tended to be resilient to economic downturns)
• Potential changes to the rules relating to the free movement of people between the UK and the remaining EU member states.
At present, the Group does not foresee a material adverse impact on day to day operations (including customers or staff), nor does it expect the costs associated with any Group restructure to be material in the context of the Group.
Other Group items
Other Group items financial performance
£m 2017 2016 2015
UK Commercial Vehicle operating profit 1.1 2.0 1.5
Admiral Loans (4.4) – –
Other interest and investment income 8.4 13.4 6.5
Share scheme charges (35.2) (31.5) (27.0)
Business development costs (5.2) (5.2) (1.8)
Other central overheads (6.2) (4.1) (5.6)
Finance charges (11.4) (11.4) (11.1)
Group’s share of other Group items result (52.9) (36.8) (37.5)
31Admiral Group plc · Annual Report and Accounts 2017
Financial Statements Additional InformationCorporate GovernanceStrategic ReportIntroduction
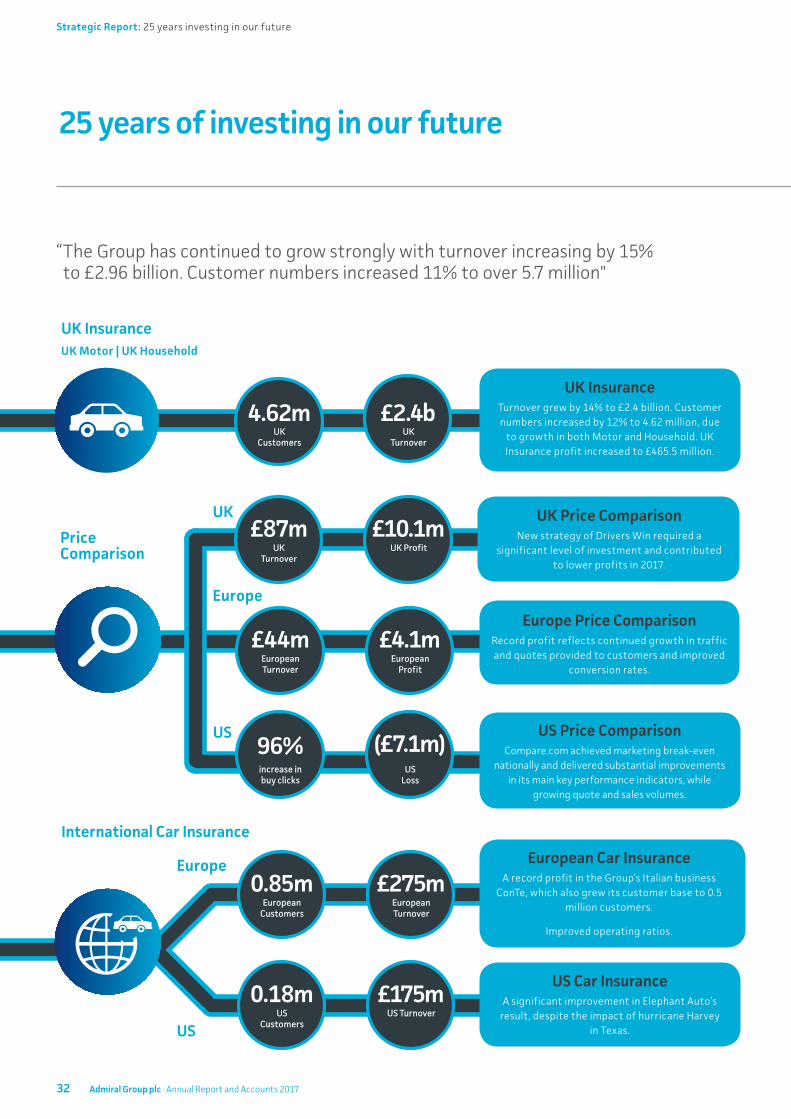
25 years of investing in our future
“ The Group has continued to grow strongly with turnover increasing by 15% to £2.96 billion. Customer numbers increased 11% to over 5.7 million"
Price Comparison
UK Insurance
International Car Insurance
UK Motor | UK Household
4.62m £2.4bUK Insurance
Turnover grew by 14% to £2.4 billion. Customer numbers increased by 12% to 4.62 million, due
to growth in both Motor and Household. UK Insurance profit increased to £465.5 million.
UK Customers
UK Turnover
0.18mUS
Customers
£175mUS Turnover
0.85mEuropean
Customers
£275mEuropean Turnover
Europe
US
US Car Insurance A significant improvement in Elephant Auto’s
result, despite the impact of hurricane Harvey in Texas.
£44mEuropean Turnover
£4.1mEuropean
Profit
Europe
US96%increase in buy clicks
(£7.1m)US
Loss
US Price ComparisonCompare.com achieved marketing break-even
nationally and delivered substantial improvements in its main key performance indicators, while
growing quote and sales volumes.
£87mUK
Turnover
£10.1mUK Profit
UK UK Price ComparisonNew strategy of Drivers Win required a
significant level of investment and contributed to lower profits in 2017.
European Car Insurance A record profit in the Group’s Italian business
ConTe, which also grew its customer base to 0.5 million customers.
Improved operating ratios.
Europe Price ComparisonRecord profit reflects continued growth in traffic and quotes provided to customers and improved
conversion rates.
32 Admiral Group plc · Annual Report and Accounts 2017
Strategic Report: 25 years investing in our future

Principal risks and uncertainties
The Board, with support from the Group Risk Committee and the Group Risk Department, undertakes a regular and robust assessment of the principal risks. These risks have been summarised as those which would threaten its business model, future performance, liquidity and solvency.The table below sets out the principal risks which Admiral has identified through its Enterprise Risk Management Framework (‘ERMF’). The impact of those risks and actions taken to mitigate them are explained below.
Insurance Risk
Reserving risk in the UK and International Insurance
Admiral is exposed to reserving risk through its underwriting of motor and household insurance policies. Claims reserves in the financial statements may prove inadequate to cover the ultimate cost of claims which are by nature uncertain.
This is a particular risk for motor insurance liabilities, where the amount payable for bodily injury claims (particularly large claims) can change significantly during the lifetime of the claim as a result of external risks such as changes in Ogden rates and impacts of increased levels of Periodic Payment Orders (PPO).
Impact
Adverse run-off leading to higher claims costs in the financial statements.
PPO claims are capital intensive owing to increased uncertainty of the cost of significant claims over a longer term.
Mitigating Factors
Admiral has a conservative reserving policy and continues to hold a material margin in its financial statement claims reserves above actuarially determined best estimates to cover adverse developments.
Best estimate reserves are estimated both internally and externally by independent actuaries.
For very large claims Admiral purchases excess of loss reinsurance, which mitigates a portion of the loss.
Regular reviews of both settled and potential PPO cases are undertaken by the claims and actuarial teams, with independent actuarial opinions provided as part of the external reserving analysis.
Admiral’s investment portfolio is the result of a structured, disciplined and transparent investment process which considers settled and potential future PPOs.
Premium risk & Catastrophe risk
The Group is exposed to the risk that claims cost on future business is higher than allowed for in the premiums charged to customers.
The Group is exposed to the risk of increased claims and reduced business volumes following both a UK and European recession.
Admiral is exposed to the risk of high losses due to the occurrence of man-made catastrophes or natural weather events.
Impact
Higher claims costs and loss ratios, resulting in reduced profits or underwriting losses.
A large flood or windstorm could cause extensive property damage (both motor and household) to a significant proportion of the portfolio, leading to a large total claims cost in relation to the event.
Mitigating Factors
There are a number of aspects which contribute to Admiral’s strong UK underwriting results, including:
• Experienced and focused senior management and teams in key business areas including pricing and claims management
• Highly data-driven and analytical approach to regular monitoring of claims and underwriting performance
• Capability to identify and resolve underperformance promptly through changes to key performance drivers, particularly pricing
• Continuous appraisal of and investment in staff, systems and processes.
Admiral purchases excess of loss reinsurance, designed to mitigate the impact of very large individual or catastrophe event claims.
33Admiral Group plc · Annual Report and Accounts 2017
Financial Statements Additional InformationCorporate GovernanceStrategic ReportIntroduction
Group Risk
Insurance Risk continued
Erosion of competitive advantage in UK Car Insurance
Admiral typically maintains a significant combined ratio advantage over the UK market. This advantage and/or the level of underwriting profit (and associated profit commission) could be eroded.
This risk could be exacerbated by irrational competitor pricing and/or new technologies used within the insurance market. It may arise from new or existing competitors.
Impact
A worse UK Car Insurance result and lower return on capital employed.
A sustained and uncorrected erosion of competitive advantage could affect the ability of Admiral to extend its reinsurance arrangements, which might in turn require Admiral to hold more capital.
Mitigating Factors
Admiral’s focus remains on the wide range of factors that contribute to Admiral’s combined ratio outperformance of the UK market. Some are set out earlier in the Strategic Report, but in addition:
• Track record of innovation and ability to react quickly to market conditions and developments
• Keen focus on maintaining a low-cost infrastructure and efficient acquisition costs.
Reduced availability of co-insurance and reinsurance arrangements
Admiral uses proportional co-insurance and reinsurance across its insurance businesses to reduce its own capital needs (and increase return on the capital it does hold) and to mitigate the cost and risk of establishing new operations.
There is a risk that support will not be available in the future if the results and/or future prospects of either the UK business or (more realistically) one or more of the newer operations are not satisfactory to the co- and/or reinsurers.
Impact
A potential need to raise additional capital or reduce dividends to support an increased underwriting share. This could be in the form of equity or debt.
Return on capital might reduce compared to current levels.
Mitigating Factors
Admiral mitigates the risk to its reinsurance arrangements by ensuring that it has a diverse range of financially secure partners.
Admiral continues to enjoy a long-term relationship with some of the world’s largest reinsurers.
Admiral also has relationships with a number of other reinsurers.
As well as UK Motor, long-term arrangements are also in place for UK Household and International businesses.
Potential diminution of other revenue
Admiral earns other revenue from a portfolio of products and other sources.
The level of this revenue could diminish due to regulatory or legal changes, customer behaviour or market forces.
Impact
Lower profits from insurance operations and lower return on capital.
Mitigating Factors
Admiral continuously assesses the value to its customers of the products it offers, and makes changes to ensure the products continue to meet customer needs and offer good value.
Admiral seeks to minimise reliance on any single source by earning revenue from a range of products. This would mitigate the impact of a regulatory change which might affect a particular product or income stream.
Principal risks and uncertainties continued
34 Admiral Group plc · Annual Report and Accounts 2017
Strategic Report: Principle risks and uncertainties

Failure of geographic and/or product expansion
Admiral continues to develop the UK Household, non-insurance operations such as Loans and expand its overseas operations.
One or more of the operations could fail to become a sustainable, profitable long-term business.
Product expansion into new areas could lead to unprofitable business and increased regulatory risk.
Growth in business plans exceeds the scale of infrastructure of the operation.
Impact
Higher than planned losses (and potentially closure costs) and distraction of key management.
A collective failure of these businesses would threaten Admiral’s objective to diversify its earnings by expanding into new markets and products.
Mitigating Factors
Admiral’s approach to expansion and product development remains conservative, applying the ‘test and learn’ philosophy that has proven successful for previous operations. International Insurance businesses have generally executed cautious launch strategies and are all backed by proportional reinsurance support which provides substantial mitigation against start-up losses in the early years.
New price comparison businesses have aligned their marketing investment with the extent of improvement in key performance indicators such as average cost per quote and conversion ratio. The Group also accepts partial disposals of equity to share start-up losses with partners.
The Directors are mindful of management stretch and regularly assess the suitability of the infrastructure and management structure in place for Admiral’s new UK and International operations.
Reliance on UK price comparison distribution channel
Admiral is dependent on the four main UK price comparison websites as an important source of new business and growth.
Growth in this distribution channel could slow, cease or reverse, or Admiral could lose one or more of the websites as a source of customers.
Impact
A potentially material reduction in UK Car Insurance new business volumes.
However, a more competitive market might benefit the car insurance business through lower acquisition costs.
Mitigating Factors
Admiral’s ownership of Confused.com (one of the leading UK price comparison websites which operates independently of the UK Car Insurance business) helps to mitigate the risk of over-reliance on this distribution channel.
Admiral also contributes materially to the revenues of other price comparison businesses and therefore it is not considered probable that a material source of new business would be lost.
35Admiral Group plc · Annual Report and Accounts 2017
Financial Statements Additional InformationCorporate GovernanceStrategic ReportIntroduction
Counterparty Risk
Admiral is primarily exposed to credit risk in the form of a) default of reinsurer; b) failure of banking or investment counterparty.
One or more counterparties suffer significant losses leading to a credit default.
Impact
Additional capital may need to be raised as a result of a major credit event, dependent on its nature and severity.
Admiral would also need to ensure that it continues to have sufficient liquid assets to meet its claims and other liabilities as they fell due.
Mitigating Factors
Admiral only conducts business with reinsurers of appropriate financial strength. In addition, most reinsurance contracts are operated on a funds-withheld basis, which substantially reduces credit risk, as Admiral holds the cash received as collateral.
Concentrations of credit risk are managed by investing in liquidity funds which invest in a wide range of short duration, high quality securities. Cash balances and deposits are placed only with highly rated credit institutions. Some long-term investments are held in Government bonds to further mitigate the exposure to credit risk.
Admiral considers counterparty exposure frequently and in significant detail, and has in place appropriate triggers and limits, to mitigate exposure to individual investment counterparties.
Market Risk
Market risk arises as a result of fluctuations in the value of market prices of investment assets, liabilities, or the income from the Group’s investment portfolio.
Impact
Market volatility (notably very significant reductions in risk free interest rates) can adversely impact the Group's solvency due to an increased regulatory valuation of claims liabilities, in particular in relation to longer dated potential PPO claims.
Mitigating Factors
The Group’s low appetite for market risk results in an investment strategy that focuses on preservation of the amount invested, low volatility of returns and strong liquidity. The majority of the portfolio is invested in high quality fixed income and other debt securities, and money market funds in order to achieve these objectives.
The Group’s mitigation for interest rate risk resulting from long duration PPO liabilities includes a comprehensive level of reinsurance cover and continuing focus on strategies to ensure that the risks relating to both assets and liabilities are appropriately matched.
The Group has relatively low exposure to net assets currencies other than pounds sterling.
Principal risks and uncertainties continued
36 Admiral Group plc · Annual Report and Accounts 2017
Strategic Report: Principle risks and uncertainties
Failure to comply with legal or regulatory requirements and/or changes.
Unexpected regulatory changes are introduced.
Impact
Exposure to regulatory intervention, censure and/or enforcement action through fines and other sanctions.
Mitigating Factors
Mitigated by regular review of the Group’s compliance with current and proposed requirements (including the General Data Protection Regulation) and interaction with regulators by Executive management and the Board.
There is investment in resources to prepare for a Partial Internal Model application. The project will have regular progress updates with the Board and Regulators.
Operational Risk
Operational risk arises within all areas of the business. The principal categories of operational risk for Admiral are:
• People • Information security • Outsourcing • Processes • Business continuity • Project risk • IT Systems • Customer outcomes
Impact
The risk of reductions in earnings and/or value, through financial or reputational loss, from inadequate or failed internal processes and systems, or from people related or external events.
In particular:
Potential customer detriment and/or potential regulatory censure/enforcement and/or reputational damage as a result of Admiral’s action.
Risk to Admiral occurs through the losses that could occur if the internal control framework to manage these business processes fails.
Availability of systems and data
Integrity of data
Confidentiality of data outcomes
Mitigating Factors
We aim to attract, retain and motivate quality staff to deliver quality customer service and achieve business objectives.
Succession planning is based on targeted recruitment, identifying potential leaders through internal development, talent management and retention processes.
Internal controls are in place and monitored to mitigate the risk and the control framework is regularly reviewed.
The internal audit function has an agreed cycle of testing of the adequacy and effectiveness of controls.
Regular review of the effectiveness of the Group’s IT capability by Executive management and the Board.
Enhanced project governance and oversight of new systems implementations with external specialist review and assurance where required.
Admiral continues to invest in its security programme in order to mitigate information security risks
Within IT there is a major incident team which is tasked with maintaining system availability, with business continuity and disaster recovery plans in place.
Data is backed up to allow for its recovery in the event of corruption.
Admiral monitors its outsourced and offshore activities, through ongoing supplier relationship and performance management, with regular due diligence reviews.
Admiral operates the three lines of defence model for overseeing its products, processes and service. At each stage of the customer journey customer outcomes are monitored, managed and reported in order to mitigate customer detriment.
Admiral purchases a range of insurance covers to mitigate the impact of a number of operational risks.
Operational risk
Legal and regulatory risk
The Strategic Report was approved by the Board of Directors and signed on its behalf by:
David Stevens, CBE
Chief Executive Officer 27 February 2018
37Admiral Group plc · Annual Report and Accounts 2017
Financial Statements Additional InformationCorporate GovernanceStrategic ReportIntroduction
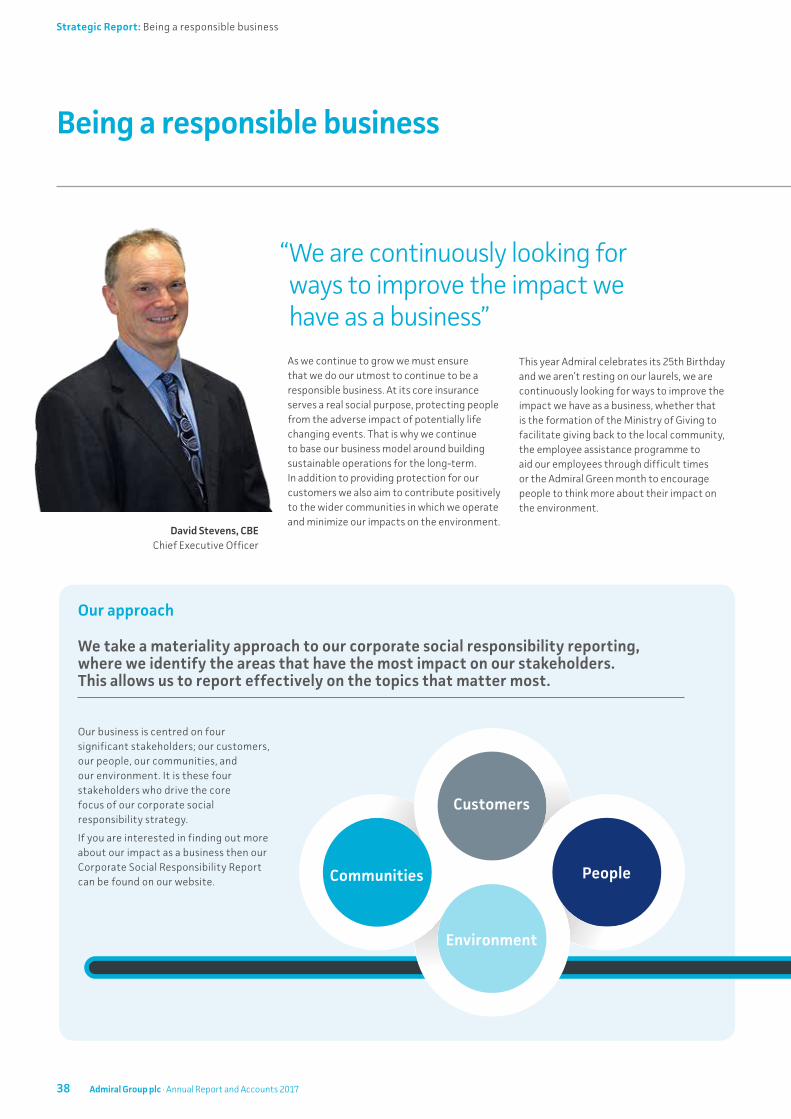
Being a responsible business
“ We are continuously looking for ways to improve the impact we have as a business”As we continue to grow we must ensure that we do our utmost to continue to be a responsible business. At its core insurance serves a real social purpose, protecting people from the adverse impact of potentially life changing events. That is why we continue to base our business model around building sustainable operations for the long-term. In addition to providing protection for our customers we also aim to contribute positively to the wider communities in which we operate and minimize our impacts on the environment.
This year Admiral celebrates its 25th Birthday and we aren’t resting on our laurels, we are continuously looking for ways to improve the impact we have as a business, whether that is the formation of the Ministry of Giving to facilitate giving back to the local community, the employee assistance programme to aid our employees through difficult times or the Admiral Green month to encourage people to think more about their impact on the environment.
David Stevens, CBE Chief Executive Officer
Our approach
We take a materiality approach to our corporate social responsibility reporting, where we identify the areas that have the most impact on our stakeholders. This allows us to report effectively on the topics that matter most.
Our business is centred on four significant stakeholders; our customers, our people, our communities, and our environment. It is these four stakeholders who drive the core focus of our corporate social responsibility strategy.
If you are interested in finding out more about our impact as a business then our Corporate Social Responsibility Report can be found on our website.
Customers
Communities People
Environment
38 Admiral Group plc · Annual Report and Accounts 2017
Strategic Report: Being a responsible business
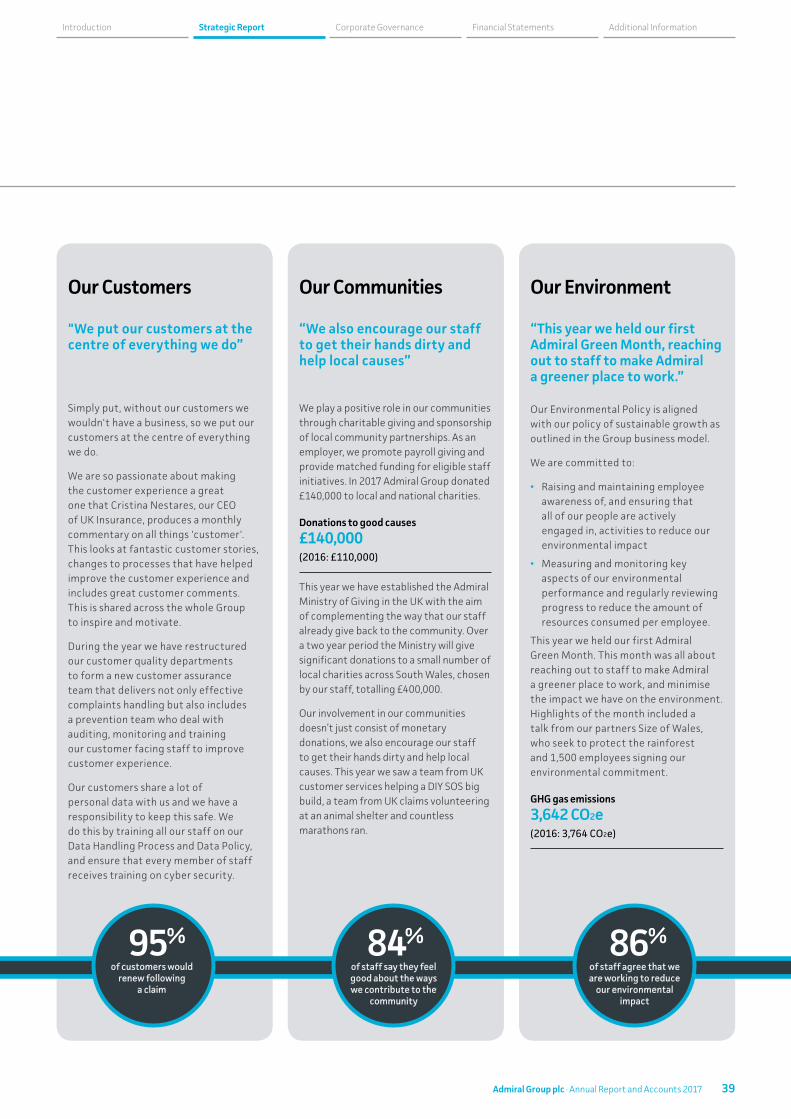
Our Customers
"We put our customers at the centre of everything we do” Simply put, without our customers we wouldn't have a business, so we put our customers at the centre of everything we do.
We are so passionate about making the customer experience a great one that Cristina Nestares, our CEO of UK Insurance, produces a monthly commentary on all things 'customer'.This looks at fantastic customer stories, changes to processes that have helped improve the customer experience and includes great customer comments. This is shared across the whole Group to inspire and motivate.
During the year we have restructured our customer quality departments to form a new customer assurance team that delivers not only effective complaints handling but also includes a prevention team who deal with auditing, monitoring and training our customer facing staff to improve customer experience.
Our customers share a lot of personal data with us and we have a responsibility to keep this safe. We do this by training all our staff on our Data Handling Process and Data Policy, and ensure that every member of staff receives training on cyber security.
Our Communities
“We also encourage our staff to get their hands dirty and help local causes”
We play a positive role in our communities through charitable giving and sponsorship of local community partnerships. As an employer, we promote payroll giving and provide matched funding for eligible staff initiatives. In 2017 Admiral Group donated £140,000 to local and national charities.
Donations to good causes £140,000 (2016: £110,000)
This year we have established the Admiral Ministry of Giving in the UK with the aim of complementing the way that our staff already give back to the community. Over a two year period the Ministry will give significant donations to a small number of local charities across South Wales, chosen by our staff, totalling £400,000.
Our involvement in our communities doesn’t just consist of monetary donations, we also encourage our staff to get their hands dirty and help local causes. This year we saw a team from UK customer services helping a DIY SOS big build, a team from UK claims volunteering at an animal shelter and countless marathons ran.
Our Environment
“This year we held our first Admiral Green Month, reaching out to staff to make Admiral a greener place to work.”
Our Environmental Policy is aligned with our policy of sustainable growth as outlined in the Group business model.
We are committed to:
• Raising and maintaining employee awareness of, and ensuring that all of our people are actively engaged in, activities to reduce our environmental impact
• Measuring and monitoring key aspects of our environmental performance and regularly reviewing progress to reduce the amount of resources consumed per employee.
This year we held our first Admiral Green Month. This month was all about reaching out to staff to make Admiral a greener place to work, and minimise the impact we have on the environment. Highlights of the month included a talk from our partners Size of Wales, who seek to protect the rainforest and 1,500 employees signing our environmental commitment.
GHG gas emissions 3,642 CO2e (2016: 3,764 CO2e)
95%of customers would
renew following a claim
84%of staff say they feel good about the ways we contribute to the
community
86%of staff agree that we are working to reduce
our environmental impact
39Admiral Group plc · Annual Report and Accounts 2017
Financial Statements Additional InformationCorporate GovernanceStrategic ReportIntroduction
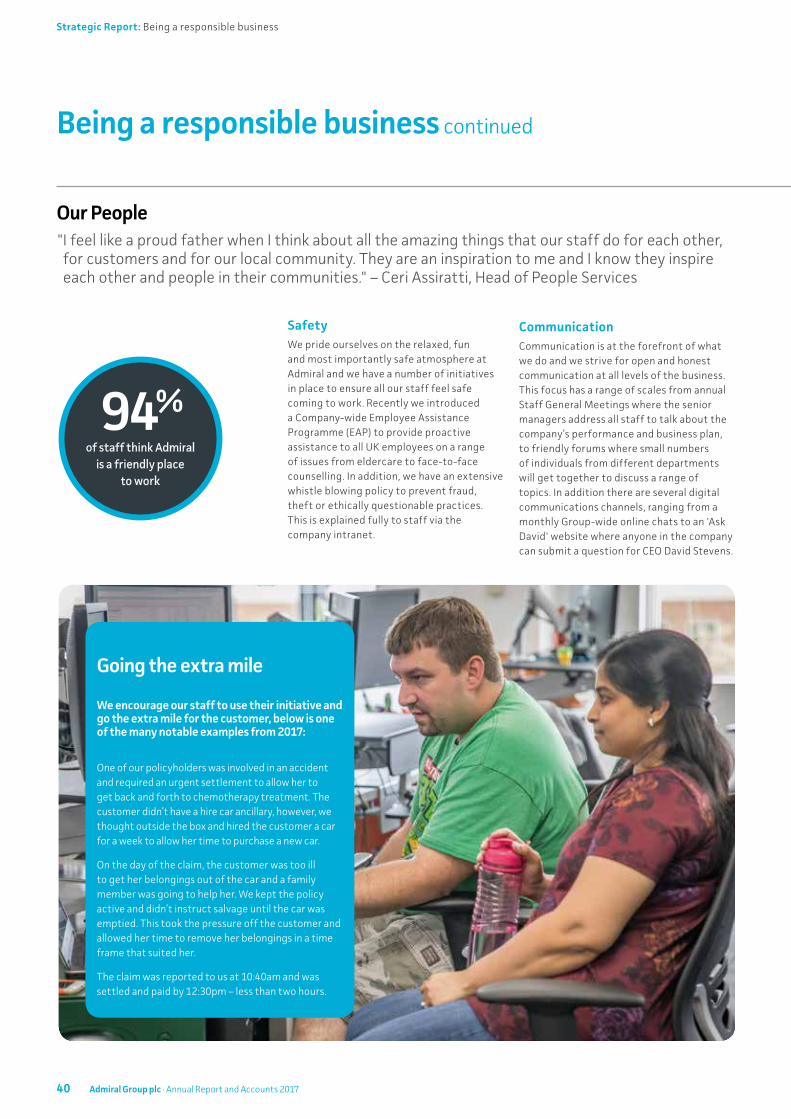
Being a responsible business continued
" I feel like a proud father when I think about all the amazing things that our staff do for each other, for customers and for our local community. They are an inspiration to me and I know they inspire each other and people in their communities." – Ceri Assiratti, Head of People Services
Our People
Going the extra mile
We encourage our staff to use their initiative and go the extra mile for the customer, below is one of the many notable examples from 2017:
One of our policyholders was involved in an accident and required an urgent settlement to allow her to get back and forth to chemotherapy treatment. The customer didn’t have a hire car ancillary, however, we thought outside the box and hired the customer a car for a week to allow her time to purchase a new car.
On the day of the claim, the customer was too ill to get her belongings out of the car and a family member was going to help her. We kept the policy active and didn’t instruct salvage until the car was emptied. This took the pressure off the customer and allowed her time to remove her belongings in a time frame that suited her.
The claim was reported to us at 10:40am and was settled and paid by 12:30pm – less than two hours.
SafetyWe pride ourselves on the relaxed, fun and most importantly safe atmosphere at Admiral and we have a number of initiatives in place to ensure all our staff feel safe coming to work. Recently we introduced a Company-wide Employee Assistance Programme (EAP) to provide proactive assistance to all UK employees on a range of issues from eldercare to face-to-face counselling. In addition, we have an extensive whistle blowing policy to prevent fraud, theft or ethically questionable practices. This is explained fully to staff via the company intranet.
CommunicationCommunication is at the forefront of what we do and we strive for open and honest communication at all levels of the business. This focus has a range of scales from annual Staff General Meetings where the senior managers address all staff to talk about the company’s performance and business plan, to friendly forums where small numbers of individuals from different departments will get together to discuss a range of topics. In addition there are several digital communications channels, ranging from a monthly Group-wide online chats to an 'Ask David' website where anyone in the company can submit a question for CEO David Stevens.
94%of staff think Admiral
is a friendly place to work
40 Admiral Group plc · Annual Report and Accounts 2017
Strategic Report: Being a responsible business
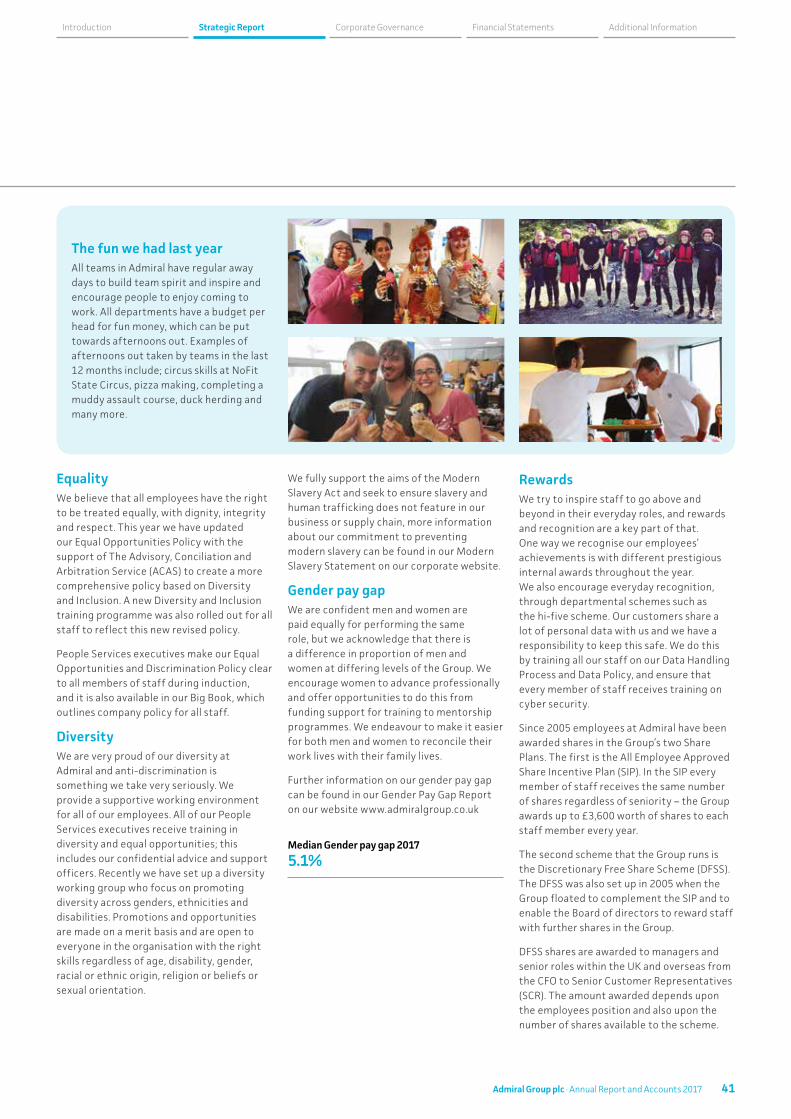
EqualityWe believe that all employees have the right to be treated equally, with dignity, integrity and respect. This year we have updated our Equal Opportunities Policy with the support of The Advisory, Conciliation and Arbitration Service (ACAS) to create a more comprehensive policy based on Diversity and Inclusion. A new Diversity and Inclusion training programme was also rolled out for all staff to reflect this new revised policy.
People Services executives make our Equal Opportunities and Discrimination Policy clear to all members of staff during induction, and it is also available in our Big Book, which outlines company policy for all staff.
DiversityWe are very proud of our diversity at Admiral and anti-discrimination is something we take very seriously. We provide a supportive working environment for all of our employees. All of our People Services executives receive training in diversity and equal opportunities; this includes our confidential advice and support officers. Recently we have set up a diversity working group who focus on promoting diversity across genders, ethnicities and disabilities. Promotions and opportunities are made on a merit basis and are open to everyone in the organisation with the right skills regardless of age, disability, gender, racial or ethnic origin, religion or beliefs or sexual orientation.
We fully support the aims of the Modern Slavery Act and seek to ensure slavery and human trafficking does not feature in our business or supply chain, more information about our commitment to preventing modern slavery can be found in our Modern Slavery Statement on our corporate website.
Gender pay gapWe are confident men and women are paid equally for performing the same role, but we acknowledge that there is a difference in proportion of men and women at differing levels of the Group. We encourage women to advance professionally and offer opportunities to do this from funding support for training to mentorship programmes. We endeavour to make it easier for both men and women to reconcile their work lives with their family lives.
Further information on our gender pay gap can be found in our Gender Pay Gap Report on our website www.admiralgroup.co.uk
RewardsWe try to inspire staff to go above and beyond in their everyday roles, and rewards and recognition are a key part of that. One way we recognise our employees’ achievements is with different prestigious internal awards throughout the year. We also encourage everyday recognition, through departmental schemes such as the hi-five scheme. Our customers share a lot of personal data with us and we have a responsibility to keep this safe. We do this by training all our staff on our Data Handling Process and Data Policy, and ensure that every member of staff receives training on cyber security.
Since 2005 employees at Admiral have been awarded shares in the Group’s two Share Plans. The first is the All Employee Approved Share Incentive Plan (SIP). In the SIP every member of staff receives the same number of shares regardless of seniority – the Group awards up to £3,600 worth of shares to each staff member every year.
The second scheme that the Group runs is the Discretionary Free Share Scheme (DFSS). The DFSS was also set up in 2005 when the Group floated to complement the SIP and to enable the Board of directors to reward staff with further shares in the Group.
DFSS shares are awarded to managers and senior roles within the UK and overseas from the CFO to Senior Customer Representatives (SCR). The amount awarded depends upon the employees position and also upon the number of shares available to the scheme.
The fun we had last year All teams in Admiral have regular away days to build team spirit and inspire and encourage people to enjoy coming to work. All departments have a budget per head for fun money, which can be put towards afternoons out. Examples of afternoons out taken by teams in the last 12 months include; circus skills at NoFit State Circus, pizza making, completing a muddy assault course, duck herding and many more.
Median Gender pay gap 2017 5.1%
41Admiral Group plc · Annual Report and Accounts 2017
Financial Statements Additional InformationCorporate GovernanceStrategic ReportIntroduction
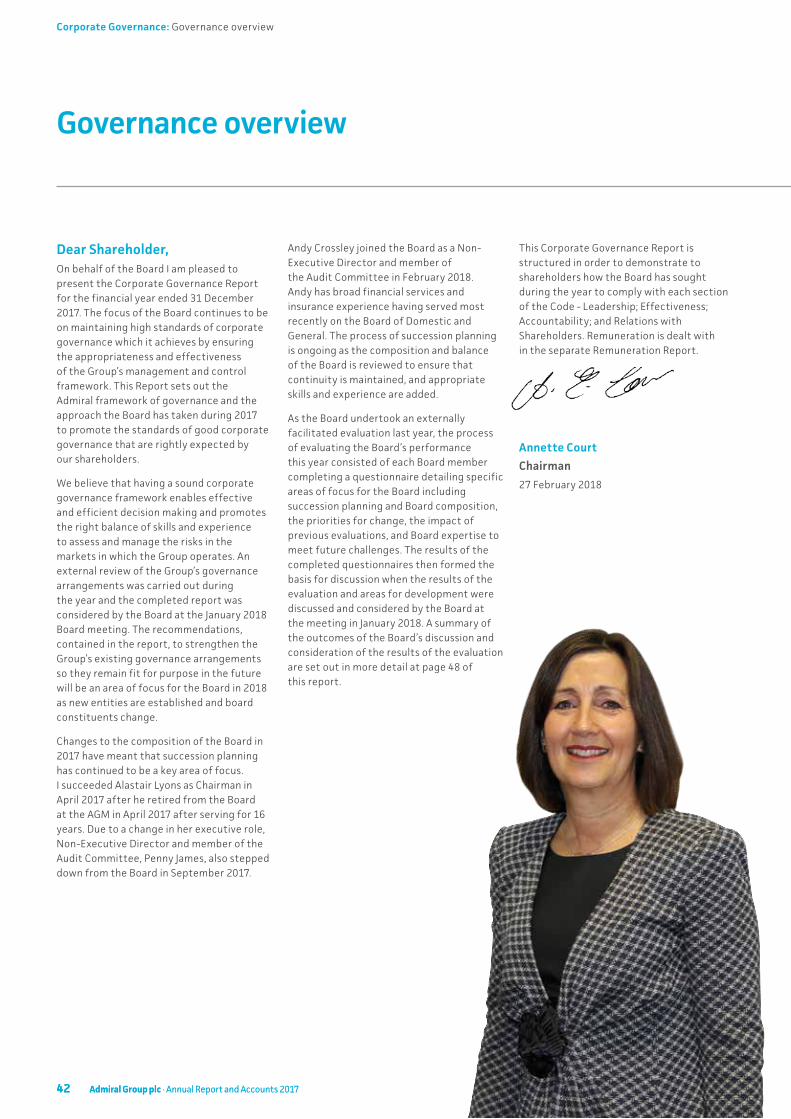
42 Admiral Group plc · Annual Report and Accounts 2017
Governance overview
Andy Crossley joined the Board as a Non-Executive Director and member of the Audit Committee in February 2018. Andy has broad financial services and insurance experience having served most recently on the Board of Domestic and General. The process of succession planning is ongoing as the composition and balance of the Board is reviewed to ensure that continuity is maintained, and appropriate skills and experience are added.
As the Board undertook an externally facilitated evaluation last year, the process of evaluating the Board’s performance this year consisted of each Board member completing a questionnaire detailing specific areas of focus for the Board including succession planning and Board composition, the priorities for change, the impact of previous evaluations, and Board expertise to meet future challenges. The results of the completed questionnaires then formed the basis for discussion when the results of the evaluation and areas for development were discussed and considered by the Board at the meeting in January 2018. A summary of the outcomes of the Board’s discussion and consideration of the results of the evaluation are set out in more detail at page 48 of this report.
Dear Shareholder,On behalf of the Board I am pleased to present the Corporate Governance Report for the financial year ended 31 December 2017. The focus of the Board continues to be on maintaining high standards of corporate governance which it achieves by ensuring the appropriateness and effectiveness of the Group’s management and control framework. This Report sets out the Admiral framework of governance and the approach the Board has taken during 2017 to promote the standards of good corporate governance that are rightly expected by our shareholders.
We believe that having a sound corporate governance framework enables effective and efficient decision making and promotes the right balance of skills and experience to assess and manage the risks in the markets in which the Group operates. An external review of the Group’s governance arrangements was carried out during the year and the completed report was considered by the Board at the January 2018 Board meeting. The recommendations, contained in the report, to strengthen the Group’s existing governance arrangements so they remain fit for purpose in the future will be an area of focus for the Board in 2018 as new entities are established and board constituents change.
Changes to the composition of the Board in 2017 have meant that succession planning has continued to be a key area of focus. I succeeded Alastair Lyons as Chairman in April 2017 after he retired from the Board at the AGM in April 2017 after serving for 16 years. Due to a change in her executive role, Non-Executive Director and member of the Audit Committee, Penny James, also stepped down from the Board in September 2017.
This Corporate Governance Report is structured in order to demonstrate to shareholders how the Board has sought during the year to comply with each section of the Code - Leadership; Effectiveness; Accountability; and Relations with Shareholders. Remuneration is dealt with in the separate Remuneration Report.
Annette Court
Chairman
27 February 2018
42 Admiral Group plc · Annual Report and Accounts 2017
Corporate Governance: Governance overview
Board of Directors
Background and experience: Geraint’s responsibilities include finance, actuarial, investments and investor relations. He joined Admiral in 2002 and held a number of senior finance positions including Head of Finance, before being promoted to Deputy Chief Financial Officer in January 2012 and Chief Financial Officer in August 2014.
A Fellow of the Institute of Chartered Accountants in England and Wales, Geraint spent the early part of his career as an external auditor at Ernst & Young and KPMG.
Appointed in 2014
Current Appointments: Trustee of the Waterloo Foundation
Background and experience: David is a founder Director of Admiral and was recruited in 1991 to set up the Admiral business.
Prior to joining Admiral David worked at McKinsey & Company, in the Financial Interest Group, and Cadbury Schweppes in the UK and the USA.
David has an MBA from INSEAD and he was awarded a CBE in 2010 for services to business and the community in Wales.
Originally appointed to the Board in 1999, subsequently appointed as CEO in 2016
GRC
GRC RC NGC
Current Appointments: Non-Executive Director of Jardine Lloyd Thompson Group plc.
Background and experience: Between 2007 and 2010 Annette was CEO of Europe General Insurance for Zurich Financial Services and a member of the Group Executive Committee.
Annette is former CEO of the Direct Line Group (formerly known as RBS Insurance). In this role Annette was also a member of the RBS Group Executive Management Committee.
Annette has previously served as a member on the Board of the Association of British Insurers (ABI).
Appointed in 2012 (originally appointed to the Board
in 2012, subsequently appointed as Chairman in 2017)
25 years ago……as Admiral’s marketing manager, with two dozen hungry salesmen to feed, I was worrying whether Admiral’s first ad, a half page in the Western Mail, would set the phones on fire (It didn’t, but fortunately others did).
25 years ago, I was……working as an account manager at IBM.
25 years ago……aside from being in lower sixth I was playing guitar in a punk/heavy metal band. We were dreaming of big things, though sadly it wasn’t to be.
Annette Court (55) Chairman
Geraint Jones (41) Chief Financial Officer
David Stevens, CBE (56) Chief Executive Officer
AC RC
GRC
NGC
Audit Committee member Remuneration Committee member
Group Risk Committee member Committee Chair
Nomination and Governance Committee member Senior Independent Director
43Admiral Group plc · Annual Report and Accounts 2017
Financial Statements Additional InformationCorporate GovernanceStrategic ReportIntroduction
44
Board of Directors continued
25 years ago, I was……eagerly awaiting the imminent arrival of our first child.
25 years ago, I was……watching my now grown up son take his first steps.
25 years ago, I was……a Global Economist at S. G. Warburg.
Current Appointments: CEO & Founder, Mumsnet.com & Gransnet.com
Advisory board member of Britain Thinks and Portland Communications.
Background and experience: Justine founded Mumsnet in 2000 and is responsible for creation, strategic direction and overall management. In May 2011, Justine founded Gransnet, a sister site to Mumsnet, for the over-50s. Before that Justine was a freelance football and cricket journalist for the Times and Daily Telegraph, after working for Deutsche Bank, managing the South African equity operation in US.
Appointed in 2016
Current Appointments: Chair of the British Heart Foundation Retail Committee
Member of the Chartered Institute of Management Accountants Advisory Panel
Background and experience: Previous roles include Chairman of GoOutdoors and Non-Executive Director at Bovis Homes Group plc. Until 2010 Colin was a member of the Executive Committee of Tesco plc and during a 22 year career at Tesco held a wide range of positions, including UK Finance Director and CEO of Tesco Express. He is a Fellow of the Chartered Institute of Management Accountants.
Appointed in 2010
Current Appointments: Chief Investment Officer of Equistone Partners Europe (formerly Barclays Private Equity, ‘BPE’)
Background and experience: Previous Director of Admiral (1999-2004). Led BPE’s participation in the Management Buy Out.
Appointed in 2015
Justine Roberts, CBE (50) Non-Executive Director
Colin Holmes (52) Senior Independent Director
Owen Clarke (54) Non-Executive Director
RC
AC AC NGCRCNGC
44 Admiral Group plc · Annual Report and Accounts 2017
Corporate Governance: Board of Directors
25 years ago, I was……doing my junior year abroad in Venice, Italy.
25 years ago, I was……working for Scottish Life (a life insurer and asset manager, now part of Royal London) as Assistant General Manager Finance.
25 years ago, I was……the Finance Director of the Agricultural Mortgage Corporation, which provided mortgages to farmers.
Current Appointments: Non-Executive Director of Murray Income Trust plc
Non-Executive Director of the National House Building Council
Background and experience: Jean was Group Chief Risk Officer at the Phoenix Group from 2009 until June 2013, during which time she held responsibility for the Group’s relationship with the regulator and founded the Board Risk Committee. Previously, she was Risk Management Director of the Insurance and Investments division of Lloyds TSB and, before that, Head of Compliance and Audit at Scottish Widows.
Jean is a Member of the Institute of Chartered Accountants of Scotland.
Appointed in 2014
Current Appointments: Non-Executive Director of Vitality Health & Life
Background and experience: Andy has 31 years’ experience within the financial services sector, most recently as Chief Financial Officer at Domestic & General Group from 2014 to 2017. He spent 14 years at Prudential Plc from 2000 as Director, Group Finance; Group Chief Risk Officer; and CFO and Deputy Chief Executive of Prudential UK. He previously held senior manager roles at Legal & General Group Plc, where he was Group Financial Controller, and Lloyds Bank Plc. Andy is a Fellow of the Institute of Chartered Accountants.
Appointed in 2018
Current Appointments: Chief Executive Officer and Director of White Mountains Insurance Group, Ltd.
Director of Build America Mutual Assurance Company.
Background and experience: Manning joined White Mountains in 2004 and is the former President of White Mountains Advisors and White Mountains Capital.
Prior to joining White Mountains, Manning spent two years with Putnam Investments and three years with McKinsey & Company.
Appointed in 2015
Jean Park (63) Non-Executive Director Andy Crossley (61)
Non-Executive Director
Manning Rountree (45) Non-Executive Director
GRC
GRC
AC
RC
AC RC
GRC
NGC
Audit Committee member Remuneration Committee member
Group Risk Committee member Committee Chair
Nomination and Governance Committee member Senior Independent Director
45Admiral Group plc · Annual Report and Accounts 2017
Financial Statements Additional InformationCorporate GovernanceStrategic ReportIntroduction
Governance Report
Leadership The Role of the Board
The Board is the principal decision-making forum for the Group providing entrepreneurial leadership, both directly and through its Committees, and delegating authority to the Executive team. The Board is responsible for organising and directing the affairs of the Group in a manner that is most likely to promote its success for the benefit of its members as a whole. The Board is accountable to shareholders for setting and achieving the Group’s strategic objectives; for the creation and delivery of strong sustainable financial and operational performance; for ensuring that in carrying out its duties the Group’s legal and regulatory obligations are being met; and for ensuring that it operates within appropriately established risk parameters. The Group’s UK regulated entities are responsible to the Financial Conduct Authority (FCA) and the Prudential Regulatory Authority (PRA) for ensuring compliance with the Group’s UK regulatory obligations and that dealings with the FCA and PRA are handled in a constructive, co-operative and transparent manner. Similar provisions apply in respect of the Group’s international businesses with regard to the relevant regulatory authorities in those overseas jurisdictions in which the Group also operates.
The Board has adopted a formal schedule of matters reserved for the Board’s consideration. This is monitored by the Company Secretary and reviewed by the Board on an annual basis. Specific matters reserved to the Board include the approval of:
• The Group’s long-term objectives and corporate strategy
• Operating and capital budgets, financial results, and any significant changes to accounting practices or policies
• The Group’s capital structure
• Results and financial reporting
• The system of internal control and risk management
• The Group’s overall risk appetite
• Changes to the structure, size and composition of the Board, including new appointments
• Succession plans for the Board and senior management
• Dividend policy and proposals for dividend payments
• Major acquisitions, disposals, and other transactions outside delegated limits
• The annual review of its own performance and that of its Board Committees
• Annual review of the Group’s Board policies
• The review of the Group’s overall corporate governance arrangements
Board Activity During 2017The Board met on seven occasions in 2017 with all these meetings being held over two days and one of the meetings being a separate strategy meeting held off-site. In addition to the seven scheduled meetings, there were five additional unscheduled telephone meetings that were called at short notice. The majority of these meetings were called in relation to consideration of the change to the Ogden discount rate announced in February 2017 and the impact this would have on the Group.
At each scheduled meeting the Board receives updates from the Chief Executive and Chief Financial Officer as to the financial and operational performance of the Group and any specific developments in the areas of the business for which they are directly responsible and of which the Board should be aware. Items that are considered on an annual basis are included in an annual schedule of rolling agenda items to ensure that they are considered at the appropriate point in the financial and regulatory cycle. Meetings are structured so as to allow for consideration and debate of all matters. The Head of the Group’s European insurance businesses and the CEO of UK Motor (respectively Milena Mondini and Cristina Nestares) together with the Chief Risk Officer (James Armstrong) are invited to attend every Board meeting and regular Board dinners. This has proved an effective means of ensuring that senior managers below Board level have exposure to and gain experience of the operation of the Board.
Compliance with the UK Corporate Governance CodeDuring the year under review and up to the date of this report, the Group complied with all the provisions of the UK Corporate Governance Code 2016 (the Code) other than the exception noted below.
• Provision C.3.1 – (regarding having at least three independent Non-Executive Directors serving on the Audit Committee) Penny James, who served as an independent Non-Executive member of the Audit Committee, stepped down as a Non-Executive Director on 8 September 2017 following a change in her Executive role. From this date up to the appointment of Andy Crossley as an independent Non-Executive member of the Board and Audit Committee on 27 February 2018 the Audit Committee only had two independent Non-Executive members and did not meet the Code requirements to have at least three independent Non-Executive members. The Group fully complied with this requirement apart from this period from 8 September 2017 to 27 February 2018 and held three meetings during the period, two of which Andy Crossley attended.
46 Admiral Group plc · Annual Report and Accounts 2017
Corporate Governance: Governance Report
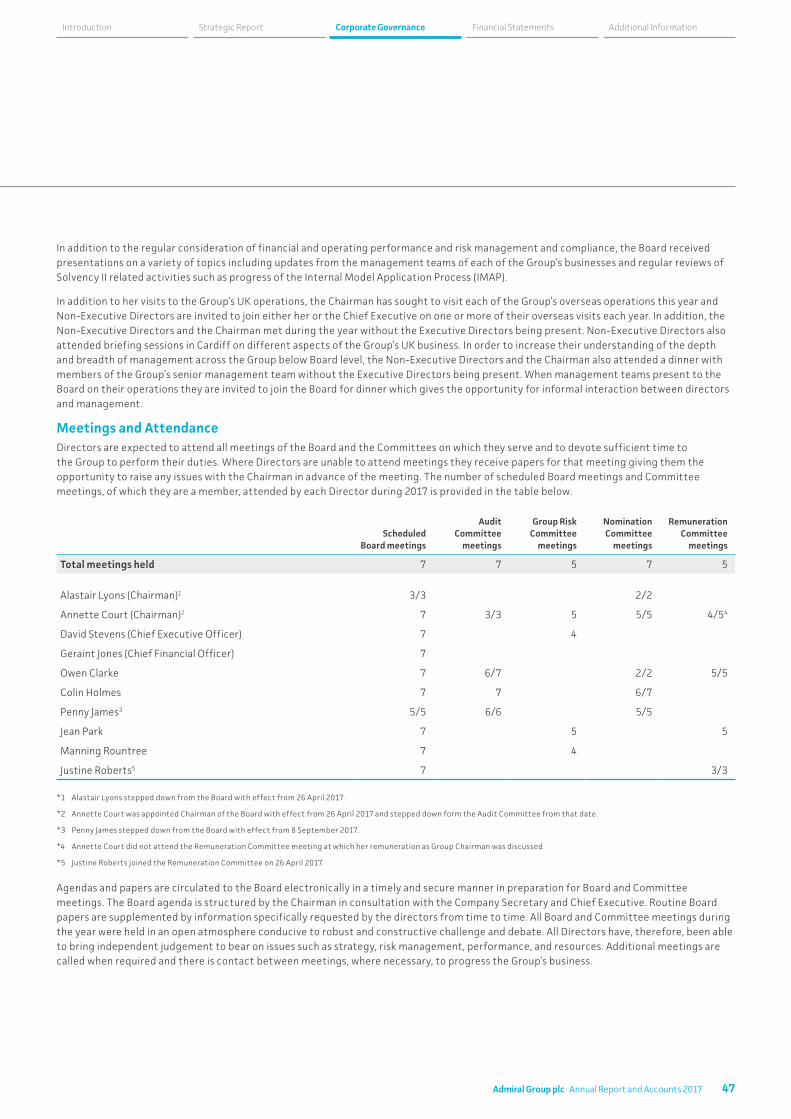
In addition to the regular consideration of financial and operating performance and risk management and compliance, the Board received presentations on a variety of topics including updates from the management teams of each of the Group’s businesses and regular reviews of Solvency II related activities such as progress of the Internal Model Application Process (IMAP).
In addition to her visits to the Group’s UK operations, the Chairman has sought to visit each of the Group’s overseas operations this year and Non-Executive Directors are invited to join either her or the Chief Executive on one or more of their overseas visits each year. In addition, the Non-Executive Directors and the Chairman met during the year without the Executive Directors being present. Non-Executive Directors also attended briefing sessions in Cardiff on different aspects of the Group’s UK business. In order to increase their understanding of the depth and breadth of management across the Group below Board level, the Non-Executive Directors and the Chairman also attended a dinner with members of the Group’s senior management team without the Executive Directors being present. When management teams present to the Board on their operations they are invited to join the Board for dinner which gives the opportunity for informal interaction between directors and management.
Meetings and AttendanceDirectors are expected to attend all meetings of the Board and the Committees on which they serve and to devote sufficient time to the Group to perform their duties. Where Directors are unable to attend meetings they receive papers for that meeting giving them the opportunity to raise any issues with the Chairman in advance of the meeting. The number of scheduled Board meetings and Committee meetings, of which they are a member, attended by each Director during 2017 is provided in the table below.
Scheduled Board meetings
Audit Committee
meetings
Group Risk Committee
meetings
Nomination Committee
meetings
Remuneration Committee
meetings
Total meetings held 7 7 5 7 5
Alastair Lyons (Chairman)1 3/3 2/2
Annette Court (Chairman)2 7 3/3 5 5/5 4/54
David Stevens (Chief Executive Officer) 7 4
Geraint Jones (Chief Financial Officer) 7
Owen Clarke 7 6/7 2/2 5/5
Colin Holmes 7 7 6/7
Penny James3 5/5 6/6 5/5
Jean Park 7 5 5
Manning Rountree 7 4
Justine Roberts5 7 3/3
*1 Alastair Lyons stepped down from the Board with effect from 26 April 2017.
*2 Annette Court was appointed Chairman of the Board with effect from 26 April 2017 and stepped down form the Audit Committee from that date.
*3 Penny James stepped down from the Board with effect from 8 September 2017.
*4 Annette Court did not attend the Remuneration Committee meeting at which her remuneration as Group Chairman was discussed.
*5 Justine Roberts joined the Remuneration Committee on 26 April 2017.
Agendas and papers are circulated to the Board electronically in a timely and secure manner in preparation for Board and Committee meetings. The Board agenda is structured by the Chairman in consultation with the Company Secretary and Chief Executive. Routine Board papers are supplemented by information specifically requested by the directors from time to time. All Board and Committee meetings during the year were held in an open atmosphere conducive to robust and constructive challenge and debate. All Directors have, therefore, been able to bring independent judgement to bear on issues such as strategy, risk management, performance, and resources. Additional meetings are called when required and there is contact between meetings, where necessary, to progress the Group’s business.
47Admiral Group plc · Annual Report and Accounts 2017
Financial Statements Additional InformationCorporate GovernanceStrategic ReportIntroduction
Governance Report continued
The Company SecretaryAll the Directors have access to the advice and services of the Company Secretary. He has responsibility for ensuring that Board procedures are followed and for advising the Board, through the Chairman, on governance matters. The Company Secretary provides updates to the Board on regulatory and corporate governance issues, new legislation, and Directors’ duties and obligations. The appointment and removal of the Company Secretary is one of the matters reserved for the Board.
Board effectivenessFollowing the external Board evaluation that was carried out last year, this year sought to focus on the recommendations coming out of that evaluation together with a review of the Board’s effectiveness and particular areas of focus. The Board evaluation, consisted of the Chairman, supported by the Company Secretary, compiling a comprehensive questionnaire that was circulated by the Company Secretary for completion by all Directors and Board attendees.
The questionnaire considered:
• Time management of Board meetings
• Board composition and dynamics
• The effectiveness of the Board in considering the Group’s risk management framework and internal controls
• The Board’s strategic and operational oversight
• Succession planning including the oversight of the Group’s processes for Managing, developing and retaining talent;
• Management of group subsidiaries
• Content of discussion and focus at Board meetings
• Priorities for change that would improve Board performance.
The results of the review were discussed by the Board in January 2018. Overall the review found that the Board continued to work effectively and that each Director demonstrates full commitment to his/her duties and contributes in an open and transparent way, enabling a detailed level of debate and discussion around material
matters affecting the Group. The review also identified good awareness by the Board of the governance and regulatory environment in which the Group operates and the main risks impacting the Group and how they should be managed and mitigated.
Following last year’s feedback, the Board has spent more time on considering succession plans and senior management evaluation and development. A number of recommendations were identified in the review as areas for the Board to give particular focus in 2018 in order to enhance the Board’s effectiveness. These included: greater understanding of the views of customers of today and tomorrow; major investors and focus on the technological issues facing the Group, particularly around cyber security; consideration of the composition of the Board in the context of there being appropriate Board experience as the Group looks to explore opportunities in other product and geographical areas; Board dynamics and improving the content and quality of information provided to the Board so that the Board could focus more easily on the key areas for discussion and decision; and Board oversight of company processes for managing, developing and retaining talent was highlighted as an important area that would need continued Board focus in the coming year.
The Chief Executive, to whom he reports, appraises annually the performance of the Chief Financial Officer. The Chairman, taking into account the views of the other Directors, reviews the performance of the Chief Executive. The performance of the Chairman is reviewed by the Board led by the Senior Independent Director (“SID”). Following the latest review, the SID considered and discussed with the Chairman the comments and feedback that had been received from the Directors as part of the Chairman’s evaluation questionnaire, and was able to confirm that the performance of the Chairman is effective and that she demonstrates appropriate commitment to her role.
The roles of the Chairman and Chief ExecutiveThe Board has approved a statement that sets out the clear division of responsibilities between the Chairman and the Chief Executive. The Chairman is primarily responsible for the leadership and workings of the Board, setting its agenda, and monitoring its effectiveness. The Chairman is not involved in the day-to-day management of the business. Save for matters reserved for decision by the Board, the Chief Executive, with the support of the other Executive Director and the senior executives, is responsible for proposing the strategy to be adopted by the Group; running the business in accordance with the strategy agreed by the Board; and implementing specific Board decisions relating to the operation of the Group. The statements of division of responsibilities and matters reserved for decision by the Board are reviewed annually.
Board balance and independenceIn the context of recent and forthcoming Board changes, careful consideration continues to be given to the composition and balance of the Board. As a result the Group continues to monitor the need to refresh Board and Committee membership in an orderly manner so as to maintain the continuity of Board process and the strength of personal interaction which underlies the effectiveness of the Board as a team. As a result of recent appointments, the Board remains satisfied that it has the appropriate balance of skills, experience, independence and knowledge of the Group to enable it and its Committees to discharge their duties and responsibilities effectively, as required by the Code.
The Board currently comprises nine Directors, the Chairman (who was independent on appointment), two Executive Directors, and six independent Non-Executive Directors. As can be seen from the Directors’ biographies on pages 43 to 45, the Directors have a broad range of skills and experience and can bring independent judgement to bear on issues of strategy, performance, risk management, resources and standards of conduct which are integral to the success of the Group.
48 Admiral Group plc · Annual Report and Accounts 2017
Corporate Governance: Governance Report

Appointments to the Board are the responsibility of the Board as a whole, acting on the advice and recommendations of the Nomination and Governance Committee. The Nomination and Governance Committee seeks to balance the retirement and recruitment of Non-Executive Directors ahead of their replacement so as to avoid dislocation of Board process by losing experience and skills. Appointments are made on merit and against objective criteria, having due regard to the benefits of diversity, including gender, with a view to ensuring the Board has the appropriate mix of personality, skills, and experience. Following a formal, rigorous and transparent process led by the Nomination and Governance Committee, the Board was pleased to appoint Andy Crossley as an independent Non-Executive Director with effect from 27 February 2018. Andy will be subject to election by shareholders at the forthcoming AGM.
Manning Rountree is the Chief Executive Officer for White Mountains Insurance Group Limited (White Mountains) and acts as Board Observer for White Mountains on the Board of the Group’s US price comparison subsidiary, in which White Mountains has a minority shareholding. Given the relatively small size of White Mountains’ shareholding in an overseas Group subsidiary company, the Board has determined that Manning Rountree remains independent in character and judgement and that his attendance at Inspop USA LLC Board meetings does not affect his ability to present an objective, rigorous and constructive challenge to the
assumptions and viewpoints presented by management and the Board. A process for managing any potential conflicts has been agreed by the Board such that Manning Rountree will recuse himself from any Group Board discussions where a potential conflict of interest with his role with White Mountains has been identified.
The Board, having given thorough consideration to the matter, considers the six Non-Executive Directors to be independent and is not aware of any relationships or circumstances, other than the above, which are likely to affect, or could appear to affect, the judgement of any of them. It is the view of the Board that the independent Non-Executive Directors are of sufficient calibre and number that their views carry significant weight in the Board’s decision making.
Independent Non-Executive Directors are currently appointed for fixed periods of three years, subject to election by shareholders. The initial three-year period may be extended for two further three-year periods subject to re-election by shareholders. Their letters of appointment may be inspected at the Company’s registered office or can be obtained on request from the Company Secretary.
Colin Holmes is the Senior Independent Non-Executive Director (SID). He has the requisite knowledge and experience gained through his Board position, his Chairmanship of the Audit Committee, and his appointments to the Boards of other companies. He is available to shareholders if they have concerns that contact through the normal
channels of Chairman, Chief Executive, or Chief Financial Officer have failed to resolve or for which such contact is inappropriate. He is also responsible for leading the Board’s discussion on the Chairman’s performance and the appointment of a new Chairman, as and when appropriate.
In accordance with the requirement under the Code for annual election of Directors, all Directors will be submitting themselves for re-election by shareholders at the forthcoming AGM. The Board is satisfied that all are properly qualified for their reappointment by virtue of their skills and experience and their contribution to the Board and its Committees.
The Directors are given access to independent professional advice at the Group’s expense, should they deem it necessary to carry out their responsibilities.
Professional developmentOn appointment, Directors take part in a comprehensive induction programme whereby they receive financial and operational information about the Group; details concerning their responsibilities and duties; as well as an introduction to the Group’s governance, regulatory and control environment.
This induction is supplemented by visits to the Group’s head office in Cardiff and certain overseas offices, and meetings with members of the senior management team and their departments. Development and training of Directors is an ongoing process. Throughout their period in office the Directors are
The table below details the length of service of the Chairman and each of the Non-Executive Directors and illustrates the balance of experience and fresh perspectives.
5 years 9 months
2 years 4 months
3 years 11 months
2 years 6 months
1 years 6 months
7 years 1 month
Director
Annette Court 21 March 2012
Owen Clarke 19 August 2015
Colin Holmes 3 December 2010
Manning Rountree 16 June 2015
Jean Park 17 January 2014
Justine Roberts
Andy Crossley
17 June 2016
27 February 2018
Date of Appointment Current length of service as a Non-Executive Director at 31 December 2017
49Admiral Group plc · Annual Report and Accounts 2017
Financial Statements Additional InformationCorporate GovernanceStrategic ReportIntroduction
Governance Report continued
regularly updated on the Group’s business; legal matters concerning their role and duties; the competitive environments in which the Group operates; and any other significant changes affecting the Group and the industry of which it is a part.
The Board receives presentations from senior managers within the Group on a regular basis and Non-Executive Directors are encouraged to make informal visits to different parts of the Group to meet with local management.
Engagement with shareholdersThe Company attaches considerable importance to communications with shareholders and engages with them regularly. Open and frequent dialogue with investors enables them to understand fully the Group’s strategy, objectives and governance. The Investor Relations team has day-to-day primary responsibility for managing communications with institutional shareholders through a combination of briefings to analysts and institutional shareholders, both at the half-year and full-year results. A number of analysts and investors visited the Group’s Cardiff office during the year to meet with the Executive Directors and senior management in order to get a better understanding of how the Group operates and how it intends to achieve its strategic and operational objectives. Senior executives from the Group’s overseas businesses also visit the UK in order to present to, and meet with, analysts and investors. Site visits and individual discussions with the Executive Directors are also arranged throughout the year with individual shareholders.
In addition the Chairman had individual meetings during the year with major shareholders and reported to the Board on issues raised with her.
This is supplemented by feedback to the Board on meetings between management and investors. In addition, the Investor Relations team produces a quarterly Investor Relations Report that is circulated to the Board for their consideration. The Report contains an analysis of share price performance; a summary of analyst
reports received during the month and of meetings that have been held with investors and analysts; together with details of any significant changes to the shareholders’ register.
The Senior Independent Director has specific responsibility to be available to investors who have any issues or concerns, and in cases where contact with the Chairman, Chief Executive Officer and Chief Financial Officer has either failed to resolve their concerns, or where such contact is inappropriate. No such concerns have been raised in the year under review.
All shareholders are invited to attend the Company’s Annual General Meeting (AGM). The Chairs of the Audit, Remuneration, Nomination and Governance and Group Risk Committees attend the AGM along with the other Directors and are available to answer shareholders’ questions on the activities of the Committees they chair. Shareholders are also invited to ask questions during the meeting and have an opportunity to meet with Directors after the formal business of the meeting has been concluded. Details of proxy voting by shareholders, including votes withheld, are made available on request and are placed on the Company’s website following the meeting.
The Group maintains a corporate website (www.admiralgroup.co.uk) containing a wide range of information of interest to institutional and private investors. The major shareholders of the Company are listed on page 83.
Conflicts of interestIn compliance with the requirements of the Companies Act 2006 regarding Directors’ duties in relation to conflicts of interest, the Group’s Articles of Association allow the Board to authorise potential conflicts of interest that may arise and to impose such limits as it thinks fit. The Company has put in place a Conflicts of Interest Policy to deal with conflicts of interest. These procedures include each Board member completing, annually, a conflicts of interest questionnaire that sets out any situation in which they, or their connected persons have, or could have, a direct or indirect interest that could conflict with the interests of the Company.
Any current directorships that they, or their connected persons hold, any advisory roles or trusteeships held, together with any companies in which they hold more than 1% of the issued share capital are also disclosed. These procedures were reviewed by the Board in April 2017 and it was concluded that they continued to operate effectively.
Board CommitteesThe Board has delegated authority to a number of permanent Committees to deal with matters in accordance with written Terms of Reference. The principal Committees of the Board are: Audit, Remuneration, Group Risk and Nomination and Governance. Subject to the exceptions listed above, all comply fully with the requirements of the Code.
All Committees are chaired by an independent Non-Executive Director except, the Nomination and Governance Committee which is chaired by the Chairman of the Board, and comprise a majority of independent Non-Executive Directors. Appointments to the Committees are made on the recommendation of the Nomination and Governance Committee and are for a period of up to three years, which may be extended for two further three year periods, provided the Director remains independent. The Committees are constituted with written Terms of Reference that are reviewed annually to ensure that they remain appropriate and reflect any changes in good practice and governance. These Terms of Reference are available on request from the Company Secretary and can also be found on the Company’s website: www.admiralgroup.co.uk. Directors are fully informed of all Committee matters by the Committee Chairmen reporting on the proceedings of their Committee at the subsequent Board meeting. Copies of Committee minutes are also distributed to the Board. Committees are authorised to obtain outside legal or other independent professional advice if they consider it necessary. The Chairman of each Committee attends the Annual General Meeting to respond to any shareholder questions that might be raised on the Committee’s activities.
50 Admiral Group plc · Annual Report and Accounts 2017
Corporate Governance: Governance Report
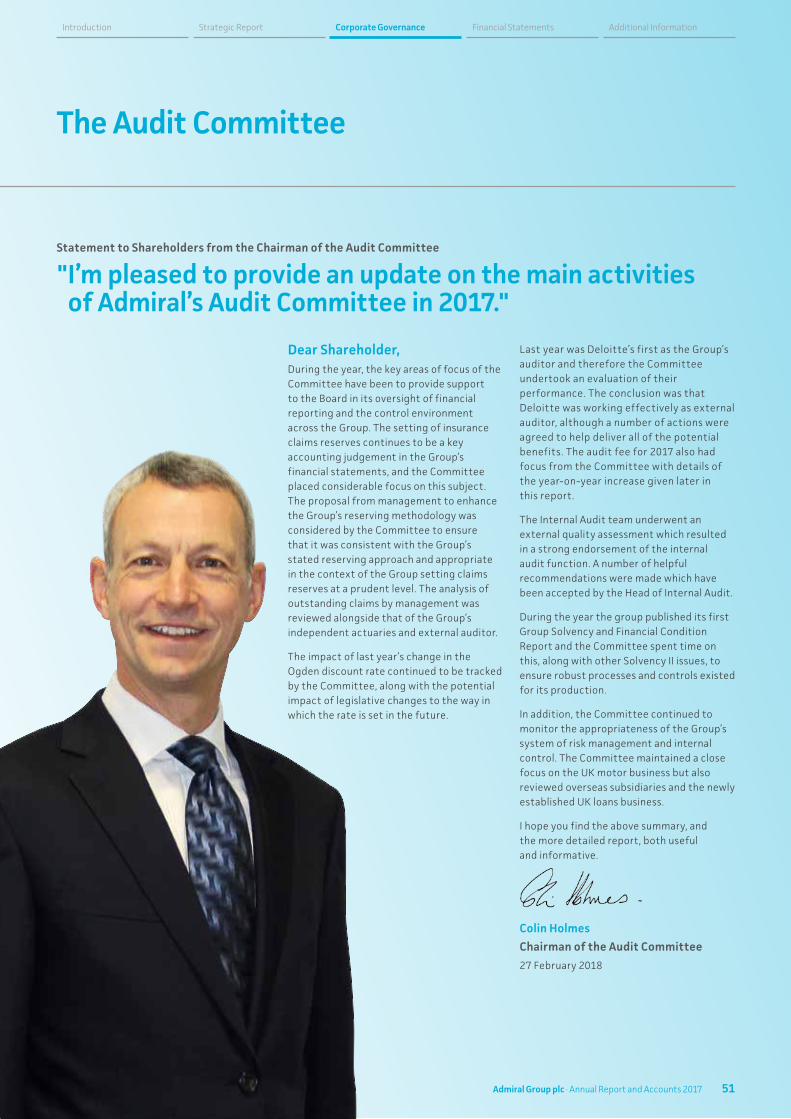
Dear Shareholder,During the year, the key areas of focus of the Committee have been to provide support to the Board in its oversight of financial reporting and the control environment across the Group. The setting of insurance claims reserves continues to be a key accounting judgement in the Group’s financial statements, and the Committee placed considerable focus on this subject. The proposal from management to enhance the Group’s reserving methodology was considered by the Committee to ensure that it was consistent with the Group’s stated reserving approach and appropriate in the context of the Group setting claims reserves at a prudent level. The analysis of outstanding claims by management was reviewed alongside that of the Group’s independent actuaries and external auditor.
The impact of last year’s change in the Ogden discount rate continued to be tracked by the Committee, along with the potential impact of legislative changes to the way in which the rate is set in the future.
The Audit Committee
Statement to Shareholders from the Chairman of the Audit Committee
" I’m pleased to provide an update on the main activities of Admiral’s Audit Committee in 2017."
Last year was Deloitte’s first as the Group’s auditor and therefore the Committee undertook an evaluation of their performance. The conclusion was that Deloitte was working effectively as external auditor, although a number of actions were agreed to help deliver all of the potential benefits. The audit fee for 2017 also had focus from the Committee with details of the year-on-year increase given later in this report.
The Internal Audit team underwent an external quality assessment which resulted in a strong endorsement of the internal audit function. A number of helpful recommendations were made which have been accepted by the Head of Internal Audit.
During the year the group published its first Group Solvency and Financial Condition Report and the Committee spent time on this, along with other Solvency II issues, to ensure robust processes and controls existed for its production.
In addition, the Committee continued to monitor the appropriateness of the Group’s system of risk management and internal control. The Committee maintained a close focus on the UK motor business but also reviewed overseas subsidiaries and the newly established UK loans business.
I hope you find the above summary, and the more detailed report, both useful and informative.
Colin Holmes
Chairman of the Audit Committee
27 February 2018
51Admiral Group plc · Annual Report and Accounts 2017
Financial Statements Additional InformationCorporate GovernanceStrategic ReportIntroduction
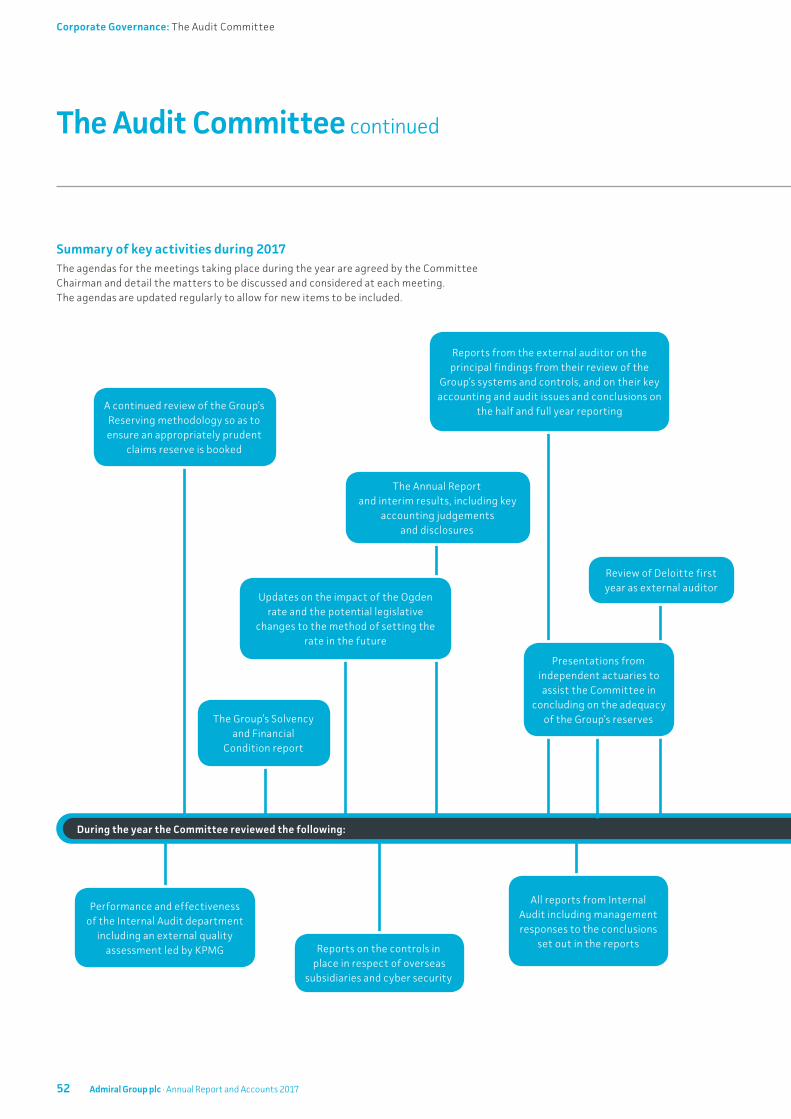
Performance and effectiveness of the Internal Audit department
including an external quality assessment led by KPMG
The Annual Report and interim results, including key
accounting judgements and disclosures
Review of Deloitte first year as external auditor
All reports from Internal Audit including management responses to the conclusions
set out in the reports
The Group’s Solvency and Financial
Condition report
Reports from the external auditor on the principal findings from their review of the
Group’s systems and controls, and on their key accounting and audit issues and conclusions on
the half and full year reporting
Reports on the controls in place in respect of overseas
subsidiaries and cyber security
Summary of key activities during 2017The agendas for the meetings taking place during the year are agreed by the Committee Chairman and detail the matters to be discussed and considered at each meeting. The agendas are updated regularly to allow for new items to be included.
The Audit Committee continued
During the year the Committee reviewed the following:
Presentations from independent actuaries to assist the Committee in
concluding on the adequacy of the Group’s reserves
Updates on the impact of the Ogden rate and the potential legislative
changes to the method of setting the rate in the future
A continued review of the Group’s Reserving methodology so as to ensure an appropriately prudent
claims reserve is booked
52 Admiral Group plc · Annual Report and Accounts 2017
Corporate Governance: The Audit Committee
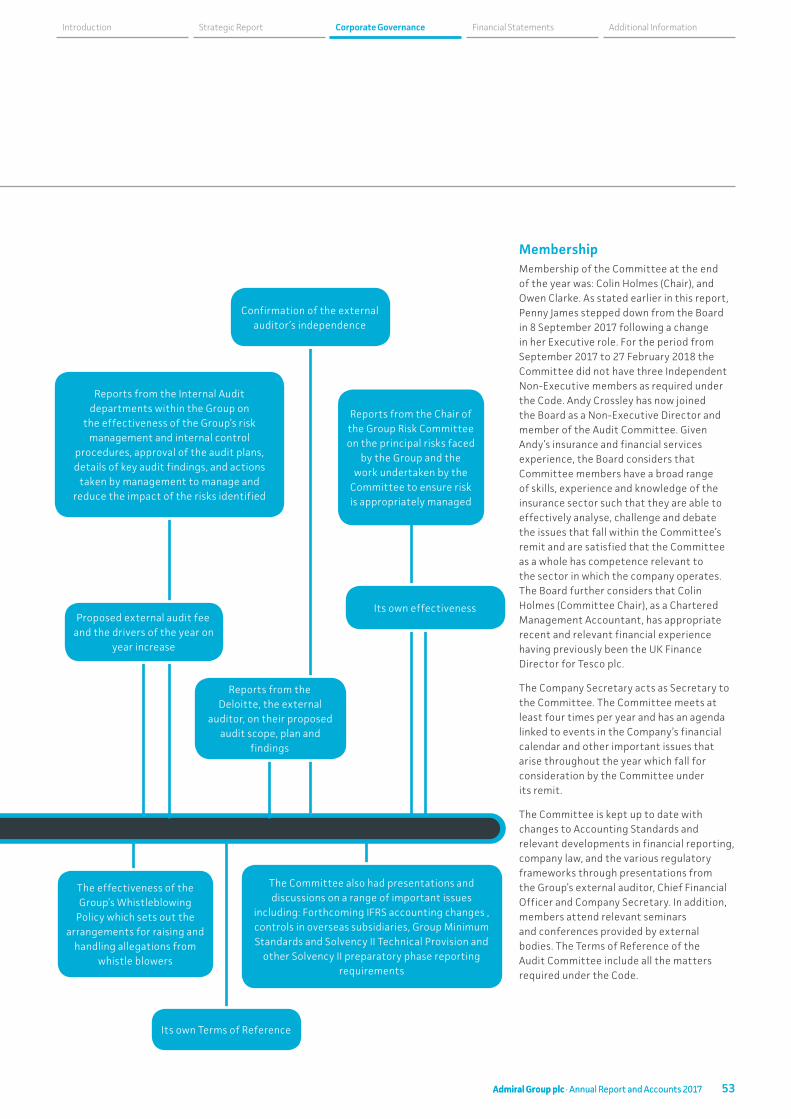
The effectiveness of the Group’s Whistleblowing
Policy which sets out the arrangements for raising and
handling allegations from whistle blowers
Its own Terms of Reference
Its own effectiveness
Confirmation of the external auditor’s independence
The Committee also had presentations and discussions on a range of important issues
including: Forthcoming IFRS accounting changes , controls in overseas subsidiaries, Group Minimum Standards and Solvency II Technical Provision and
other Solvency II preparatory phase reporting requirements
Reports from the Chair of the Group Risk Committee on the principal risks faced
by the Group and the work undertaken by the
Committee to ensure risk is appropriately managed
Reports from the Deloitte, the external
auditor, on their proposed audit scope, plan and
findings
MembershipMembership of the Committee at the end of the year was: Colin Holmes (Chair), and Owen Clarke. As stated earlier in this report, Penny James stepped down from the Board in 8 September 2017 following a change in her Executive role. For the period from September 2017 to 27 February 2018 the Committee did not have three Independent Non-Executive members as required under the Code. Andy Crossley has now joined the Board as a Non-Executive Director and member of the Audit Committee. Given Andy’s insurance and financial services experience, the Board considers that Committee members have a broad range of skills, experience and knowledge of the insurance sector such that they are able to effectively analyse, challenge and debate the issues that fall within the Committee’s remit and are satisfied that the Committee as a whole has competence relevant to the sector in which the company operates. The Board further considers that Colin Holmes (Committee Chair), as a Chartered Management Accountant, has appropriate recent and relevant financial experience having previously been the UK Finance Director for Tesco plc.
The Company Secretary acts as Secretary to the Committee. The Committee meets at least four times per year and has an agenda linked to events in the Company’s financial calendar and other important issues that arise throughout the year which fall for consideration by the Committee under its remit.
The Committee is kept up to date with changes to Accounting Standards and relevant developments in financial reporting, company law, and the various regulatory frameworks through presentations from the Group’s external auditor, Chief Financial Officer and Company Secretary. In addition, members attend relevant seminars and conferences provided by external bodies. The Terms of Reference of the Audit Committee include all the matters required under the Code.
Proposed external audit fee and the drivers of the year on
year increase
Reports from the Internal Audit departments within the Group on
the effectiveness of the Group’s risk management and internal control
procedures, approval of the audit plans, details of key audit findings, and actions
taken by management to manage and reduce the impact of the risks identified
53Admiral Group plc · Annual Report and Accounts 2017
Financial Statements Additional InformationCorporate GovernanceStrategic ReportIntroduction
Admiral Group plc · Annual Report and Accounts 2017
Other individuals such as the Chairman of the Board, Chief Executive Officer, Chief Financial Officer, the Chief Risk Officer, Heads of Compliance and Internal Audit, and representatives of different parts of the Group may be invited to attend all or part of any meeting as and when appropriate. The Chair of the Audit Committee meets privately with the Head of Internal Audit on a regular basis. The external auditor was invited to attend all of the Committee’s meetings held in 2017, excepting those agenda items when its own performance/appointment was to be reviewed and provision of non-audit services discussed. In addition, a number of private meetings were held between members of the Committee and the auditor.
The Audit Committee’s primary responsibilities are to:
• Monitor the integrity of the Group’s financial statements and any formal announcement relating to the Group’s financial performance, reviewing any significant financial reporting judgements which they contain
• Keep under review the effectiveness of the Company’s internal financial controls, internal control and risk management systems
• Review the Group’s procedures for handling allegations from whistleblowers and for detecting fraud
• Monitor and assess the role and effectiveness of the Group’s Internal Audit functions in the context of the Group’s overall internal control and risk management systems
• Consider and make recommendations to the Board, to be put to shareholders for their approval at the AGM, in relation to the appointment, reappointment and removal of the Group’s external auditor
• Review the external auditor’s independence and objectivity and the effectiveness of the audit process
• Review the policy on the engagement of the external auditor to provide non-audit services, considering the relevant regulatory guidance regarding the provision of non-audit services by the external auditor.
Significant Issues considered by the CommitteeAfter discussion with both management and the external auditor, the Audit Committee determined that the key risks of misstatement of the Group’s financial statements related to insurance liabilities and profit commissions.
These issues were discussed with management during the year and with the auditor at the time the Committee reviewed and agreed the auditor’s Group audit plan; when the auditor reviewed the interim financial statements in August 2017 and also at the conclusion of the audit of these full year financial statements.
Valuation of Insurance Claims ReservesGiven the important judgements involved in estimating outstanding claims the Committee continued to spend significant time reviewing and challenging the approach and methodology adopted by management in setting reserves for insurance liabilities in the financial statements. The Committee noted the proposals of management to continue to enhance the methodology applied and were supportive of these plans. The Committee spent time with management during the year to understand the rationale behind the enhanced methodology that was being proposed and process by which it would be reflected in the financial statements reserves at the full and half year. The Committee was satisfied that the methodology was consistent with the Group’s stated reserving approach and appropriate in the context of the Group setting claims reserves at a prudent level.
The Committee held separate meetings with the external actuaries at which there was challenge and debate on the best estimates developed by the external actuaries. At these meetings management provided further information on the reserving levels proposed and were challenged by the Committee as to their adequacy and level of inherent prudence.
Given the material impact of changes to the Ogden rate, the Committee has continued to monitor developments in this area to ensure that it was well prepared to manage any impact on its reserves. The Committee is satisfied that in accounting for reserves
using the current discount rate, the value contained in the balance sheet for future claims remains appropriate and prudent.
Whilst acknowledging that the setting of reserves to cover future claims is a complex and judgemental area and having had the opportunity at the separate meetings referred to above to consider and question the recommended best estimates, the Committee is satisfied that an appropriate process has been followed and that there has been scrutiny, challenge and debate to give confidence that the reserving levels set provide an appropriate margin above best estimates, though note the continued high level of prudence that remains within the reserves.
The Committee also received an update from the auditor regarding the procedures they had used to test management’s methodology in setting best estimates and considered the auditor’s assertion that they had challenged the reserving approach taken by management and were satisfied with management’s assumptions and that the Group’s approach to setting reserves was in compliance with current accounting standards.
Profit commissionThe Committee considered the impact on profit commission income of future changes in claims reserves as the recognition of this income is dependent on the loss ratio booked in the financial statements and cash receivable is dependent on actuarial projections of ultimate loss ratios. The Committee remained satisfied that profit commission was correctly accounted for by the Group and was in accordance with the contractual arrangements that were in place.
The Audit Committee considered the auditor’s overall findings on this area which indicated that the profit commission recognised was considered appropriate in the context of the financial statements as a whole.
MisstatementsNo material unadjusted audit differences were reported by the external auditor. The Committee confirms that it is satisfied that the auditor has fulfilled its responsibilities with diligence and professional scepticism.
After reviewing the presentations and reports from management and consulting where necessary with the auditor, the
The Audit Committee continued
54 Admiral Group plc · Annual Report and Accounts 2017
Corporate Governance: The Audit Committee
Committee is satisfied that the financial statements appropriately address the critical judgements and key estimates (both in respect to the amounts reported and the disclosures). The Committee is also satisfied that the significant assumptions used for determining the value of assets and liabilities have been appropriately scrutinised, challenged and are sufficiently robust.
Non-Audit feesThe Committee reviewed and approved its policy on non-audit services in April 2017, and were satisfied that it was aligned with current regulatory guidance. Under the policy, the Group’s statutory auditor would only be engaged to carry out non-audit work in exceptional circumstances or where there was a regulatory or tax authority request and where agreed by the Committee.
Unless required by law, regulatory or tax authority and non-audit services will: a) be subject to prior approval from the Committee and b) in aggregate, shall not cost more than 70% of the average statutory audit fee for the past three financial years. In considering whether to approve such non-audit services, the Committee shall ensure that:
• There is no direct effect, or in the view of an objective, reasonable and informed third party, would have an inconsequential effect, on the audit services on the Group’s financial statements
• The estimation of the effect on the financial statements is comprehensively documented and explained in a report to the Committee
• The non-audit services provided comply with the principle of independence
• The audit firm must not place significant reliance on the output of the non-audit services for the audit work.
The Committee will continue to monitor regulatory developments in this area to ensure that its policy on non-audit fees adheres to current guidance.
Effectiveness of the External Audit ProcessThe Committee undertakes an annual review to assess the independence and objectivity of the external auditor and the effectiveness of the audit process, taking into consideration relevant professional and regulatory requirements, the progress achieved against
the agreed audit plan, and the competence with which the auditor handled the key accounting and audit judgments. Following this review the Committee concluded that the auditor, Deloitte LLP, remained independent and provided a service that was robust and fit for purpose.
Audit feeDuring 2017, the Committee reviewed and approved the audit fee proposal for the 2017 year-end Group audit. The agreed fee for the audit and other assurance related services for 2017 is £490,000, an increase on the fee initially agreed for 2016 of £420,000. The main reasons for the increase were:
• Additional costs incurred during the course of the 2016 audit which are recurring in 2017, primarily reflecting areas where an increased level of substantive audit testing was employed than had been initially planned;
• An increased audit scope in areas of the Group outside of UK Car Insurance, reflecting the increased growth, complexity and materiality of these businesses to the Group as a whole; and
• The impact of changes to the regulatory environment, including the introduction of EU rules in relation to Public Interest Entities and the update to Auditing Standards.
The Committee approved the fee increase having provided robust challenge to the auditor on the elimination of first year transition costs and any potential inefficiencies within the audit process.
Internal Audit The Group Head of Internal Audit attends all Audit Committee meetings and provides a range of presentations and papers to the Committee, through which the Committee monitors the effectiveness of the Group’s internal controls. The Committee reviewed and approved the Group Internal Audit Terms of Reference which set out the role; objectives; reporting lines and accountability; authority; independence; and objectivity of the Internal Audit function. The role and competence of each Internal Audit function across the Group was also assessed and considered by the Committee. As agreed last year, the Group Head of Internal Audit continues to have responsibility to ensure the quality of the Internal Audit activities in the Group’s
overseas locations. In the year under review an external quality assessment of Internal Audit was carried out, results of which were considered and discussed by the Committee at the meeting in August 2017. The Committee had noted that the review indicated that there was a strong endorsement of the Internal Audit function but noted that there were some suggested recommendations to further enhance the efficiency and effectiveness of the Internal Audit function that should be considered further. The recommendations are in the process of being implemented.
Members of the Committee also receive all issued audit reports, enabling them to challenge the reports’ content and related recommendations. The Committee approves the Internal Audit programmes at the start of each calendar year whilst the effectiveness and workload of the Internal Audit functions and the adequacy of available resources are monitored throughout the year.
In accordance with agreed parameters, the overseas operations in Spain, Italy and the US have their own locally based internal auditors, who report to their respective country heads. All reports are evaluated by the Group Head of Internal Audit to ensure the quality and effectiveness of the reported findings. In addition, the UK Internal Audit department carries out high level governance reviews of all foreign operations, assessing the internal control frameworks and system of risk management. The overseas internal auditors attend Committee meetings periodically.
Committee effectiveness reviewAs part of the Committee’s detailed annual review of its performance and processes, each Committee member completed a comprehensive questionnaire designed to provide objective assessment of the Committee’s performance, including its effectiveness in monitoring internal and external audit. The Committee discussed the results of the review and it was concluded that, overall, the Committee and the audit process were effective; that the Committee had full access to all the information it required; that the Committee had appropriate Terms of Reference; and that it was adequately discharging its responsibilities.
55Admiral Group plc · Annual Report and Accounts 2017
Financial Statements Additional InformationCorporate GovernanceStrategic ReportIntroduction
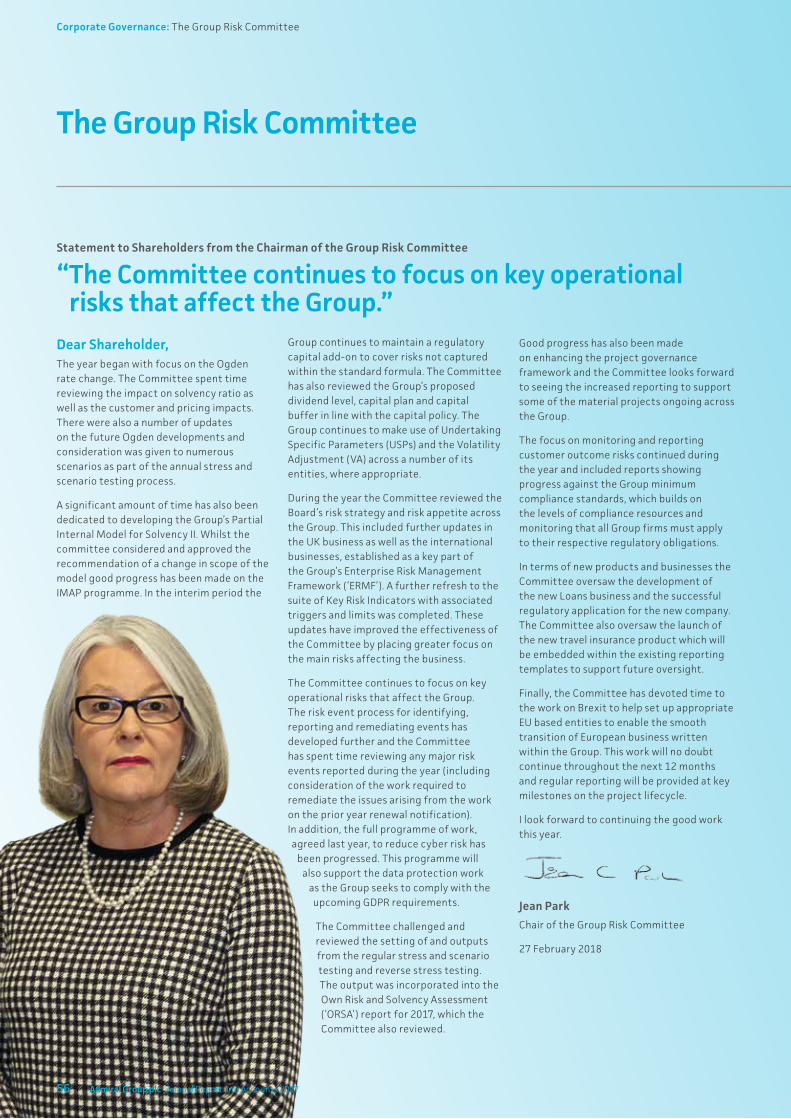
The Group Risk Committee
Group continues to maintain a regulatory capital add-on to cover risks not captured within the standard formula. The Committee has also reviewed the Group’s proposed dividend level, capital plan and capital buffer in line with the capital policy. The Group continues to make use of Undertaking Specific Parameters (USPs) and the Volatility Adjustment (VA) across a number of its entities, where appropriate.
During the year the Committee reviewed the Board’s risk strategy and risk appetite across the Group. This included further updates in the UK business as well as the international businesses, established as a key part of the Group’s Enterprise Risk Management Framework (‘ERMF’). A further refresh to the suite of Key Risk Indicators with associated triggers and limits was completed. These updates have improved the effectiveness of the Committee by placing greater focus on the main risks affecting the business.
The Committee continues to focus on key operational risks that affect the Group. The risk event process for identifying, reporting and remediating events has developed further and the Committee has spent time reviewing any major risk events reported during the year (including consideration of the work required to remediate the issues arising from the work on the prior year renewal notification). In addition, the full programme of work, agreed last year, to reduce cyber risk has
been progressed. This programme will also support the data protection work
as the Group seeks to comply with the upcoming GDPR requirements.
The Committee challenged and reviewed the setting of and outputs from the regular stress and scenario testing and reverse stress testing. The output was incorporated into the Own Risk and Solvency Assessment (‘ORSA’) report for 2017, which the Committee also reviewed.
Good progress has also been made on enhancing the project governance framework and the Committee looks forward to seeing the increased reporting to support some of the material projects ongoing across the Group.
The focus on monitoring and reporting customer outcome risks continued during the year and included reports showing progress against the Group minimum compliance standards, which builds on the levels of compliance resources and monitoring that all Group firms must apply to their respective regulatory obligations.
In terms of new products and businesses the Committee oversaw the development of the new Loans business and the successful regulatory application for the new company. The Committee also oversaw the launch of the new travel insurance product which will be embedded within the existing reporting templates to support future oversight.
Finally, the Committee has devoted time to the work on Brexit to help set up appropriate EU based entities to enable the smooth transition of European business written within the Group. This work will no doubt continue throughout the next 12 months and regular reporting will be provided at key milestones on the project lifecycle.
I look forward to continuing the good work this year.
Jean Park
Chair of the Group Risk Committee
27 February 2018
Dear Shareholder,The year began with focus on the Ogden rate change. The Committee spent time reviewing the impact on solvency ratio as well as the customer and pricing impacts. There were also a number of updates on the future Ogden developments and consideration was given to numerous scenarios as part of the annual stress and scenario testing process.
A significant amount of time has also been dedicated to developing the Group’s Partial Internal Model for Solvency II. Whilst the committee considered and approved the recommendation of a change in scope of the model good progress has been made on the IMAP programme. In the interim period the
Statement to Shareholders from the Chairman of the Group Risk Committee
“ The Committee continues to focus on key operational risks that affect the Group.”
56 Admiral Group plc · Annual Report and Accounts 2017
Corporate Governance: The Group Risk Committee
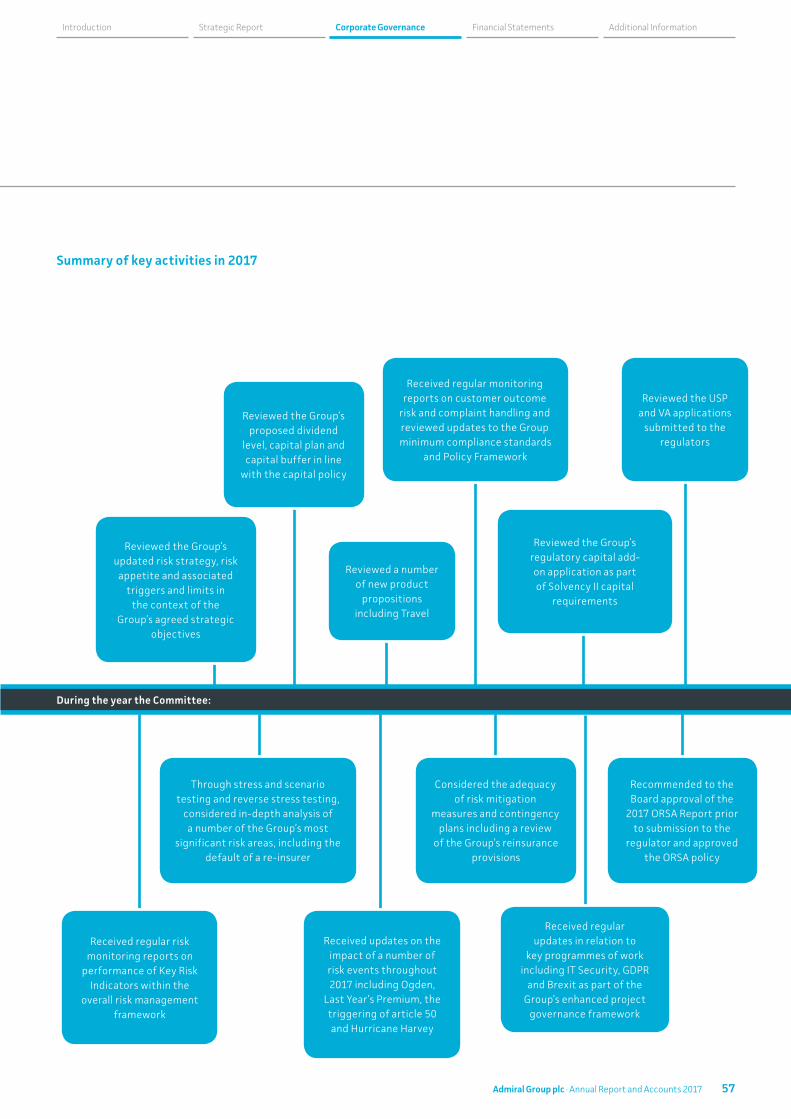
Reviewed the Group’s proposed dividend
level, capital plan and capital buffer in line
with the capital policy
Considered the adequacy of risk mitigation
measures and contingency plans including a review
of the Group’s reinsurance provisions
Received regular monitoring reports on customer outcome
risk and complaint handling and reviewed updates to the Group minimum compliance standards
and Policy Framework
Recommended to the Board approval of the
2017 ORSA Report prior to submission to the
regulator and approved the ORSA policy
Reviewed the USP and VA applications
submitted to the regulators
Received regular updates in relation to
key programmes of work including IT Security, GDPR
and Brexit as part of the Group’s enhanced project
governance framework
Through stress and scenario testing and reverse stress testing,
considered in-depth analysis of a number of the Group’s most
significant risk areas, including the default of a re-insurer
Reviewed a number of new product
propositions including Travel
Received updates on the impact of a number of risk events throughout 2017 including Ogden,
Last Year’s Premium, the triggering of article 50 and Hurricane Harvey
Reviewed the Group’s regulatory capital add-on application as part of Solvency II capital
requirements
Reviewed the Group’s updated risk strategy, risk appetite and associated
triggers and limits in the context of the
Group’s agreed strategic objectives
Received regular risk monitoring reports on
performance of Key Risk Indicators within the
overall risk management framework
Summary of key activities in 2017
During the year the Committee:
57Admiral Group plc · Annual Report and Accounts 2017
Financial Statements Additional InformationCorporate GovernanceStrategic ReportIntroduction
Composition of the Group Risk Committee Membership at the end of the year was: Annette Court, Jean Park (Chair), Manning Rountree and David Stevens. The Company Secretary acts as Secretary to the Committee.
The Committee met five times during the year.
Duties and responsibilities of the Group Risk Committee The duties and responsibilities of the Committee are set out in Terms of Reference that were reviewed during the year and approved by the Board in December 2017.
The responsibilities of the Committee can be summarised as:
• Oversee the development, implementation and maintenance of the Group’s overall Risk Management Framework and ensure that it is in line with emerging regulatory, corporate governance and best practice guidelines
• Monitoring the Group’s prudential risk exposure, which includes ensuring that the Group’s capital resources and liquidity profile are appropriate to its needs whilst meeting minimum regulatory requirements, including overseeing and challenging the design and execution of the Group’s stress and scenario testing
• Monitoring the Group’s current and future conduct risk exposure
• Ensuring the adequacy and effectiveness of the Group’s systems and controls for the prevention of financial crime, data protection systems and controls
• Monitoring the adequacy and effectiveness of the Group’s Compliance functions
• Reviewing the Group’s progress towards achieving Solvency II compliance
• Reviewing compliance with Group policies, including the established Reserving Policy and process
• Considering, and recommending to the Board for approval, the Group’s risk appetite, including any changes to the appetite for each material type of risk faced by the Group
• Approving the annual plans for the Group Risk and Compliance functions which include reviewing regulatory developments and regular meetings with the PRA and FCA
• Review the ORSA report each year with recommendations being provided to the Group Board for approval
• Review and approve the Solvency II actuarial function reports on reinsurance and underwriting each year
• Review and approve the remuneration report from the Chief Risk Officer prior to Remuneration Committee sign off.
The Committee Chairperson reports formally to the Board on its proceedings after each meeting on all matters within its duties and responsibilities, as set out in previously circulated minutes to the Board. The Committee Chairperson also reports on the activities of the Committee in a formal written report that is submitted to and discussed by the Board every six months.
The work of the Committee is supported by more detailed work undertaken by executive Risk Management Committees in each of the Group’s operational entities. At each meeting, the Risk Management Committees consider significant movements in the operation’s risk profile, any risks that have arisen and any emerging risks. Risk Management Committees also assess and monitor any regulatory issues, ensuring that their resolution and the action taken are appropriately recorded. In the UK, the Risk Management Committee receives regular information on conduct risk, such as complaint handling reports and other related management information. The Group Risk Management function reviews and collates information from across the group for consideration by the Committee.
Internal Control and Risk Management StatementThe Board is ultimately responsible for the Group’s system of risk management and internal control including that relating to financial reporting processes and, through the Audit Committee, has reviewed the effectiveness of this system. The system of risk management and internal control over
insurance, operational, market, credit and group risks is designed to manage rather than eliminate the risk of failure to achieve business objectives and breaches of risk appetites and can only provide reasonable and not absolute assurance against material misstatement or loss.
The Board is of the view that there is an ongoing process for identifying, evaluating and managing the Group’s risks and internal controls; that it has been in place for the year ended 31 December 2017; and that, up to the date of approval of the Annual Report and Accounts, it is regularly reviewed by the Board and accords with the internal control guidance for Directors provided in the UK Corporate Governance Code.
The Board confirms that it has performed a robust assessment of the Group’s principal risks. These risks, along with explanations of how they are being managed and mitigated, are included in the strategic report on page 33.
The Board is responsible for determining the nature and extent of the principal risks it is willing to take in achieving its strategic objectives. The Board meets at least seven times a year to discuss the direction of the company and provide oversight of the Group’s risk management and internal control systems. The role and responsibilities of the Board are documented within their Terms of Reference and these are reviewed annually.
A key element of the control system is that the Board meets regularly with a formal schedule of matters reserved to it for decision and has put in place an organisational structure with clearly defined lines of responsibility. As described above, in order to ensure these responsibilities are properly discharged, the Board has delegated to the Audit Committee to keep under review the adequacy and effectiveness of the Company’s internal financial controls, internal control and risk management systems.
The Board has delegated the development, implementation and maintenance of the Group’s overall risk management framework to the Group Risk Committee (“GRC”). The GRC reports on its activities to the Board
The Group Risk Committee continued
58 Admiral Group plc · Annual Report and Accounts 2017
Corporate Governance: The Group Risk Committee

and the Audit Committee, supporting the overall assurance provided by the Audit Committee that the Group’s internal control, risk management and compliance systems continue to operate effectively.
The Group has a ‘three lines of defence’ approach to internal control, including those controls that relate to the financial reporting process. The Board recognises that the day-to-day responsibility for implementing policies lies with the senior management, the ‘first line of defence’, whose operational decisions must take into account risk and how this can be controlled effectively.
The ‘second line of defence’ describes the Committees and functions that are in place to provide an oversight of the effective operation of the internal control framework. The Group Risk department and the compliance functions are part of the second line of defence.
The Group Risk department defines and prescribes the insurance, operational, market, credit and group risk assessment processes for the business. It performs second line reviews, including of the reserving, capital modelling and business planning processes, and undertakes regular reviews of all risks in conjunction with management, with the results of these reviews recorded in risk registers collated centrally on the Group risk management system. Furthermore, Group Risk records any actual losses or near misses that occur as a consequence of the crystallisation of risk and analyses the sufficiency of the action taken to avoid reoccurrence. The Chief Risk Officer has responsibility for ensuring that managers are aware of their risk management obligations, providing them with support and advice, and ensuring that risk management strategies are properly communicated. Reports are produced showing the most significant risks identified and the controls in place. Internal Audit uses the risk registers to plan and inform their programme of audits around the most significant risks to the Group to ensure that the prescribed controls are in place and are operating effectively.
There is compliance resource assigned to each operation who review and report on the first line of defence’s compliance with designated control activities. The Group compliance function consolidates these reviews and provides reports to the Group Risk Committee.
The ‘third line of defence’ describes the independent assurance provided by the Audit Committee and the Group Internal Audit function that reports to that Committee. Internal Audit undertakes a programme of risk based audits covering all aspects of both the first and second lines of defence. The findings from these audits are reported to all three lines, i.e. management, the executive and oversight Committees, and the Audit Committee.
The Group and subsidiary Risk Committees, receive reports setting out key performance and risk indicators and consider possible control issues brought to their attention by early warning mechanisms that are embedded within the operational units. They, together with the Audit Committee, also receive regular reports from the Internal Audit function, which include recommendations for improvement of the control and operational environment. The Chair of the Group Risk Committee provides a comprehensive written report to the Board of the activities carried out by the Committee on an annual basis. In addition, the Board receives reports from the Chair of the Audit Committee as to its activities, together with copies of the minutes of the GRC and Audit Committee.
The Audit Committee’s ability to provide the appropriate assurance to the Board depends on the provision of periodic and independent confirmation, primarily by Internal Audit, that the controls established by management are operating effectively and where necessary provides a high-level challenge to the steps being taken by the GRC to implement the risk management strategy.
ViabilityIn accordance with provision C.2.2 of the 2016 UK Corporate Governance Code, the Directors have assessed the prospect of the Company over a longer period than the 12 months required by the ‘Going Concern’ provision. The Board conducted this review for a period of three years to December 2020. This assessment has been made taking into account the current financial position of the Group, the Group’s business plans, the Group’s ‘Own Risk and Solvency Assessment’ (ORSA) process, and the principal risks and uncertainties faced by the Group, which are disclosed on pages 39 to 44 of the strategic report.
The ORSA is performed in line with Solvency II regulations and requires the Group to demonstrate that it has a detailed understanding of the risks facing the business over a three-year time horizon. In addition to this the Group Risk Committee and the Group Board review regular updates to the Group’s capital and solvency projections.
Quantitative and qualitative assessments of risks are performed as part of the ORSA process. The quantitative assessment (in line with the Group’s capital and solvency projections) considers how the regulatory capital requirements, economic capital needs, own funds and the solvency position of the Company is projected to change over the three year time horizon. It also includes a series of stress tests, linked to the Group’s principal risks and reports the impact of these stresses alongside any mitigating factors that reduce the impact.
The results of the stress tests form part of the process to set the Group’s capital risk appetite, which ensures that a buffer on top of the Group’s regulatory capital requirement is held to protect its capital position against shocks and stresses. Refer to the Strategic report for information on sensitivities to the reported 2017 solvency ratio position.
Based on the results of this analysis, the Directors have a reasonable expectation that the Company will be able to continue in operation and meet its liabilities as they fall due over this three year period.
59Admiral Group plc · Annual Report and Accounts 2017
Financial Statements Additional InformationCorporate GovernanceStrategic ReportIntroduction
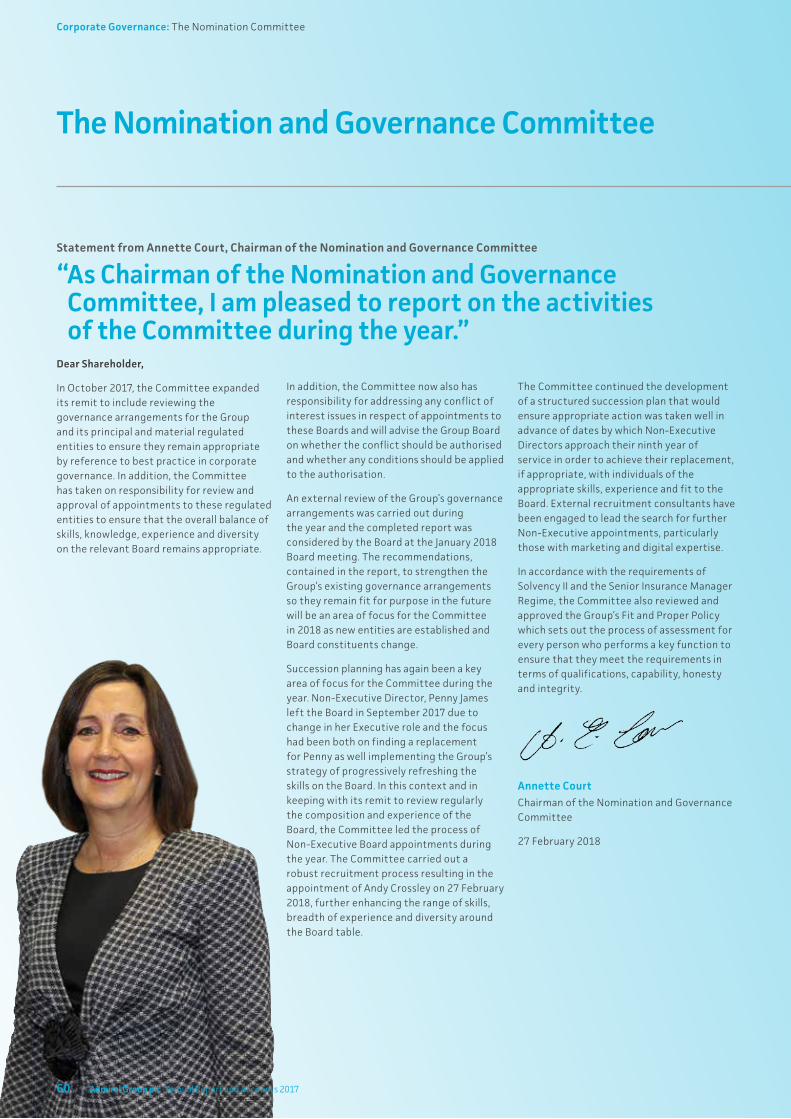
The Nomination and Governance Committee
Dear Shareholder,
In October 2017, the Committee expanded its remit to include reviewing the governance arrangements for the Group and its principal and material regulated entities to ensure they remain appropriate by reference to best practice in corporate governance. In addition, the Committee has taken on responsibility for review and approval of appointments to these regulated entities to ensure that the overall balance of skills, knowledge, experience and diversity on the relevant Board remains appropriate.
Statement from Annette Court, Chairman of the Nomination and Governance Committee
“ As Chairman of the Nomination and Governance Committee, I am pleased to report on the activities of the Committee during the year.”
In addition, the Committee now also has responsibility for addressing any conflict of interest issues in respect of appointments to these Boards and will advise the Group Board on whether the conflict should be authorised and whether any conditions should be applied to the authorisation.
An external review of the Group’s governance arrangements was carried out during the year and the completed report was considered by the Board at the January 2018 Board meeting. The recommendations, contained in the report, to strengthen the Group’s existing governance arrangements so they remain fit for purpose in the future will be an area of focus for the Committee in 2018 as new entities are established and Board constituents change.
Succession planning has again been a key area of focus for the Committee during the year. Non-Executive Director, Penny James left the Board in September 2017 due to change in her Executive role and the focus had been both on finding a replacement for Penny as well implementing the Group’s strategy of progressively refreshing the skills on the Board. In this context and in keeping with its remit to review regularly the composition and experience of the Board, the Committee led the process of Non-Executive Board appointments during the year. The Committee carried out a robust recruitment process resulting in the appointment of Andy Crossley on 27 February 2018, further enhancing the range of skills, breadth of experience and diversity around the Board table.
The Committee continued the development of a structured succession plan that would ensure appropriate action was taken well in advance of dates by which Non-Executive Directors approach their ninth year of service in order to achieve their replacement, if appropriate, with individuals of the appropriate skills, experience and fit to the Board. External recruitment consultants have been engaged to lead the search for further Non-Executive appointments, particularly those with marketing and digital expertise.
In accordance with the requirements of Solvency II and the Senior Insurance Manager Regime, the Committee also reviewed and approved the Group’s Fit and Proper Policy which sets out the process of assessment for every person who performs a key function to ensure that they meet the requirements in terms of qualifications, capability, honesty and integrity.
Annette Court Chairman of the Nomination and Governance Committee
27 February 2018
60 Admiral Group plc · Annual Report and Accounts 2017
Corporate Governance: The Nomination Committee
MembershipThe membership of the Committee at the year end was: Annette Court (Chairman), Colin Holmes and Owen Clarke. The Company Secretary acts as Secretary to the Committee. The Committee invites the Chief Executive and/or the Chief Financial Officer to attend meetings when it deems appropriate. The Committee met formally on seven occasions in 2017. In addition, members of the Committee corresponded and met informally on a number of occasions to consider and meet with individuals that the Committee had identified as possible candidates to join the Board.
Board composition and changesThe Committee leads the process for making appointments to the Board or where the appointee is likely to become a Board member. The Committee ensures there is a formal, rigorous and transparent process for the appointment of new Directors to the Board embracing a full evaluation of the skills, knowledge and experience required of Directors. The Committee also ensures plans are in place for orderly succession for appointments to the Board and reviews the succession plans for other senior management positions. Responsibility for making senior management appointments rests with the Chief Executive.
The Group has in place a policy of recruiting well ahead of impending retirements in order to ensure continuity of knowledge and Board dynamics. In 2017 the Board initiated a search for a new Non-Executive Director. The Committee developed an appropriate specification for the new Non-Executive Director and identified the required skills and experience. Following this process, the Committee identified Andy Crossley as best placed to fill the role identified.
Andy has 31 years’ experience within the financial services sector, most recently as Chief Financial Officer at Domestic & General Group from 2014 to 2017.
He spent 14 years at Prudential Plc from 2000 as Director, Group Finance; Group Chief Risk Officer; and CFO and Deputy Chief Executive of Prudential UK. He previously held senior manager roles at Legal & General Group Plc, where he was Group Financial Controller, and Lloyds Bank Plc. Andy is a Fellow of the Institute of Chartered Accountants.
Given Andy’s background, experience and competence and the external references that were obtained, the Committee did not consider it either necessary or appropriate to undertake a full search led by an external recruitment consultancy.
Each Committee member met separately with Andy and agreed that he would bring invaluable experience to the Board. The Board approved the Committee’s recommendations and following regulatory approval Andy was formally appointed to the Board with effect from 27 February 2018.
Succession planning and talent management Talent management continues to be a key area of focus and the Board, at its meeting in June 2017, considered talent management within the Group and identified where there were individuals who, with further experience and guidance, might be capable of moving into particular senior management roles. The Committee remains satisfied that succession plans for Directors and senior management are in place to ensure the continued ability of the Group to implement strategy and compete effectively in the markets in which it operates.
Gender and diversityGiven women constitute 33% of our plc Board, the Group has already met the target set by both Lord Davies in his report. Women on Boards’, and the Hampton Alexander Review (that builds on the Davies Review) which encourages FTSE 350 companies to achieve at least 33% women on Boards by 2020. The Group also already meets the
Hampton Alexander Review target of 33% women’s representation across executive committees below Board level and direct reports to those committees, as shown by the gender diversity table on page 82. In addition, the Committee will review, during 2018, the Parker Review’s final report on ethnic diversity and will focus on its “Beyond One by ‘21” recommendation. As part of their review, the Committee will focus on how the Group should develop a process to identify, develop and promote ethnic diversity such that a pipeline of suitable candidates is available for consideration for future Board and senior manager positions. However, the Group remains strongly supportive of the principle of boardroom diversity, of which gender and ethnicity are important, but not the only, aspects. What is important is diversity of thought, experience and approach and each new appointment must complement what already exists at the Board table. Accordingly, appointments will always be made on merit against objective criteria, including diversity, and not just to achieve an externally prescribed number.
The Group remains committed to providing equal opportunities, eliminating discrimination, and encouraging diversity amongst its workforce both in the UK and overseas. A breakdown of the gender of Company Directors and senior employees at the end of the financial year together with details of the Group’s Equality, Diversity and Dignity at Work Policy are set out in the Directors’ Report on pages 82 to 85.
61Admiral Group plc · Annual Report and Accounts 2017
Financial Statements Additional InformationCorporate GovernanceStrategic ReportIntroduction
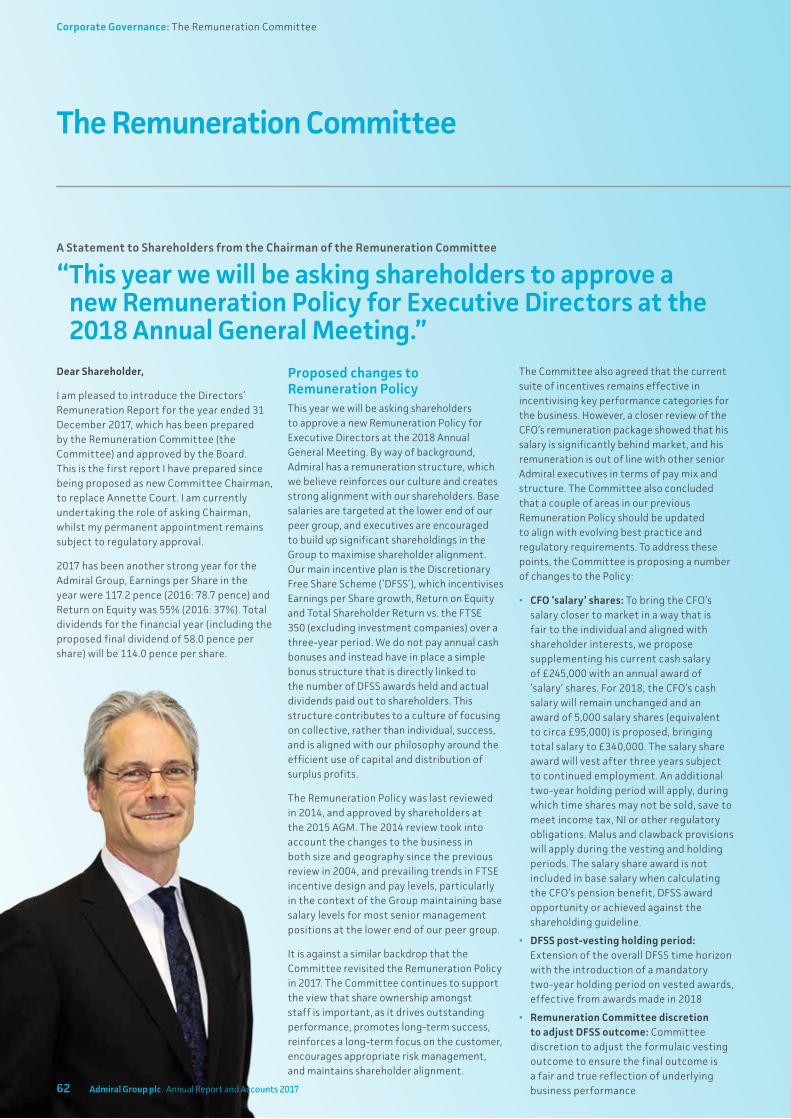
62 Admiral Group plc · Annual Report and Accounts 2017
Dear Shareholder,
I am pleased to introduce the Directors’ Remuneration Report for the year ended 31 December 2017, which has been prepared by the Remuneration Committee (the Committee) and approved by the Board. This is the first report I have prepared since being proposed as new Committee Chairman, to replace Annette Court. I am currently undertaking the role of asking Chairman, whilst my permanent appointment remains subject to regulatory approval.
2017 has been another strong year for the Admiral Group, Earnings per Share in the year were 117.2 pence (2016: 78.7 pence) and Return on Equity was 55% (2016: 37%). Total dividends for the financial year (including the proposed final dividend of 58.0 pence per share) will be 114.0 pence per share.
The Remuneration Committee
A Statement to Shareholders from the Chairman of the Remuneration Committee
“ This year we will be asking shareholders to approve a new Remuneration Policy for Executive Directors at the 2018 Annual General Meeting.”
Proposed changes to Remuneration PolicyThis year we will be asking shareholders to approve a new Remuneration Policy for Executive Directors at the 2018 Annual General Meeting. By way of background, Admiral has a remuneration structure, which we believe reinforces our culture and creates strong alignment with our shareholders. Base salaries are targeted at the lower end of our peer group, and executives are encouraged to build up significant shareholdings in the Group to maximise shareholder alignment. Our main incentive plan is the Discretionary Free Share Scheme (‘DFSS’), which incentivises Earnings per Share growth, Return on Equity and Total Shareholder Return vs. the FTSE 350 (excluding investment companies) over a three-year period. We do not pay annual cash bonuses and instead have in place a simple bonus structure that is directly linked to the number of DFSS awards held and actual dividends paid out to shareholders. This structure contributes to a culture of focusing on collective, rather than individual, success, and is aligned with our philosophy around the efficient use of capital and distribution of surplus profits.
The Remuneration Policy was last reviewed in 2014, and approved by shareholders at the 2015 AGM. The 2014 review took into account the changes to the business in both size and geography since the previous review in 2004, and prevailing trends in FTSE incentive design and pay levels, particularly in the context of the Group maintaining base salary levels for most senior management positions at the lower end of our peer group.
It is against a similar backdrop that the Committee revisited the Remuneration Policy in 2017. The Committee continues to support the view that share ownership amongst staff is important, as it drives outstanding performance, promotes long-term success, reinforces a long-term focus on the customer, encourages appropriate risk management, and maintains shareholder alignment.
The Committee also agreed that the current suite of incentives remains effective in incentivising key performance categories for the business. However, a closer review of the CFO’s remuneration package showed that his salary is significantly behind market, and his remuneration is out of line with other senior Admiral executives in terms of pay mix and structure. The Committee also concluded that a couple of areas in our previous Remuneration Policy should be updated to align with evolving best practice and regulatory requirements. To address these points, the Committee is proposing a number of changes to the Policy:
• CFO ‘salary’ shares: To bring the CFO’s salary closer to market in a way that is fair to the individual and aligned with shareholder interests, we propose supplementing his current cash salary of £245,000 with an annual award of ‘salary’ shares. For 2018, the CFO’s cash salary will remain unchanged and an award of 5,000 salary shares (equivalent to circa £95,000) is proposed, bringing total salary to £340,000. The salary share award will vest after three years subject to continued employment. An additional two-year holding period will apply, during which time shares may not be sold, save to meet income tax, NI or other regulatory obligations. Malus and clawback provisions will apply during the vesting and holding periods. The salary share award is not included in base salary when calculating the CFO’s pension benefit, DFSS award opportunity or achieved against the shareholding guideline.
• DFSS post-vesting holding period: Extension of the overall DFSS time horizon with the introduction of a mandatory two-year holding period on vested awards, effective from awards made in 2018
• Remuneration Committee discretion to adjust DFSS outcome: Committee discretion to adjust the formulaic vesting outcome to ensure the final outcome is a fair and true reflection of underlying business performance62 Admiral Group plc · Annual Report and Accounts 2017
Corporate Governance: The Remuneration Committee

• Risk adjustment to DFSS bonus: DFSS bonus to include a ±20% adjustment based on performance against a set of risk metrics, effective from awards made in 2018
• Shareholding guideline: Increase to the guideline from 200% to 300% of base salary.
The Committee believes that structuring the CFO’s salary increase as an award of shares, rather than cash, is better aligned with shareholders, is consistent with our philosophy of low cash awards balanced by the award of shares, and more effectively supports the CFO’s retention. The proposed change will bring the CFO’s package closer to market (though it will remain in the bottom quartile). It also reflects a move towards improving internal consistency between the CFO’s remuneration structure and that of the broader Admiral executive team below the Board, for whom a proportion of their share awards are subject to continued employment but not subject to the DFSS vesting criteria.
The Board undertakes a regular and robust assessment of the principal risks to the business, and is keen to ensure that the Group’s Remuneration Policy and practices promote sound and effective risk management and excellent customer outcomes. It is in this context that the Committee proposes making a change to the DFSS bonus made to Executive Directors and other senior staff to include a ±20% adjustment based on risk performance. A scorecard of risk performance measures will be set by the Committee each year for all significant areas of the business with specified targets to determine the amount of any DFSS bonus adjustment. It is anticipated that many of these measures will be directly related to customer outcomes to reinforce the Group’s focus on delivering a great customer experience. Whilst the bonus may be adjusted upwards or downwards by up to 20% in any given year, it is not anticipated that the adjustment will increase the CFO’s remuneration on average over the long-term. The Committee believes that this change will help to reinforce our focus on risk management and our customers, whilst also more clearly demonstrating alignment of Group remuneration practices with the requirements of Solvency II.
One of the two Executive Directors, the CEO David Stevens, is a founding Director and receives remuneration that comprises only
salary and modest benefits. The Committee continues to hold the view that this is appropriate, as his significant shareholding provides a sufficient alignment of his interest with those of other shareholders.
The Committee also reviewed the Company’s fixed pay arrangements during 2017. It is proposed that the pension provision of 6% of salary should remain unchanged, but that the internal cap on pension will increase from £9,000 to £15,000 p.a. and the Company will offer individuals a choice between pension contributions and cash in lieu. No other changes to Remuneration Policy in respect of fixed pay are proposed.
During the early part of 2018, we consulted with our largest shareholders on the proposed revisions to the Remuneration Policy. Feedback has been positive and we hope to receive your support for the revised Policy at the upcoming AGM. Subject to shareholder approval, the proposed Policy will take effect from the date of the AGM, being 26 April 2018. The first DFSS award under the revised Policy will be made in September 2018.
Remuneration in 2017In addition to consideration of the proposed Policy changes set out above and oversight of the associated shareholder consultation, the activities of the Committee during the year ended 31 December 2017 included:
• Reviewing the salary arrangements and fee proposals for the Executive Directors, the former and current Chairman and senior management
• Reviewing the appropriateness of the performance conditions for the DFSS and Free Share Incentive Plan (SIP) awards
• Reviewing the Company’s performance against the performance conditions applicable to the DFSS and SIP awards and where appropriate authorising the vesting of awards
• Considering the appropriate performance conditions to attach to the DFSS awards for the Group’s European insurance operations
• Considering the appropriate application of withholding provisions
• Reviewing and authorising the grant of awards under both the DFSS and SIP
• Reviewing the Committee’s Terms of Reference and recommending amendments to the Board for approval
• Considering and approval of the Group’s Material Risk Takers in accordance with the requirements of Solvency II regime and reviewed the Solvency II Remuneration Policy
• Considering the Group’s regulatory Remuneration Policy Statement
• Reviewed the impact of the Living Wage on the Group’s current remuneration structure
• Considering and approval of the Group’s Expense Policy
• Considered the terms of engagement with the Group’s Remuneration Consultants;
• Reviewing the Gender Pay reporting requirements
• Evaluating the performance of the Committee.
In September 2017, Geraint Jones was granted an award under the DFSS of 50,000 shares, equivalent to £905,000 or 369% of salary. Consistent with the approach for 2016, the award will vest on three-year EPS growth vs. LIBOR, TSR vs. FTSE 350 (excluding investment companies), and ROE, weighted equally. David Stevens again declined to be included given his significant shareholding.
Based on performance to 31 December 2017, 74.3% of the DFSS award made in 2015 will vest. The EPS condition was partially achieved, vesting at 41.0% of this element; and the ROE condition was also partially achieved, vesting at 81.9% of the element. The TSR condition vested at 100% of the element.
Resolutions to approve the proposed Remuneration Policy (subject to a binding vote) and the Annual Report on Remuneration (subject to an advisory vote) will be put to our shareholders at the AGM in April 2018. I am available to meet and discuss our Remuneration Policy with shareholders.
Owen Clarke
Acting Chairman of the Remuneration Committee
27 February 2018
63Admiral Group plc · Annual Report and Accounts 2017
Financial Statements Additional InformationCorporate GovernanceStrategic ReportIntroduction
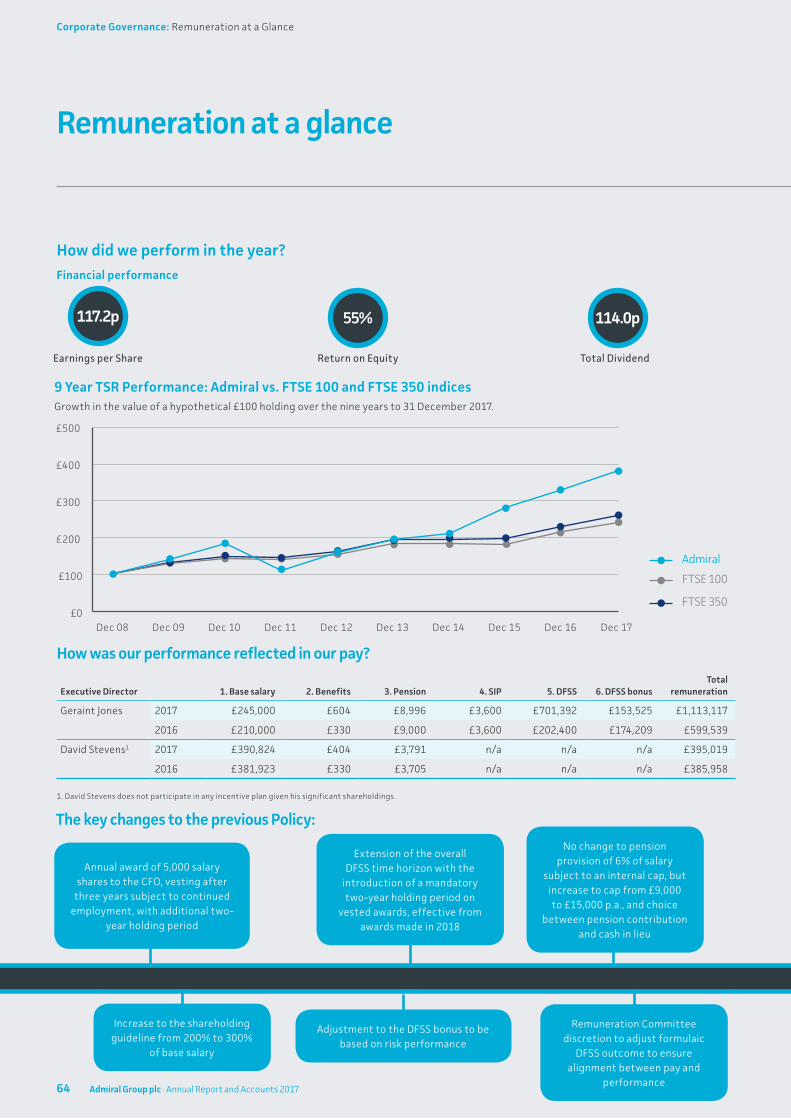
Remuneration at a glance
How did we perform in the year?Financial performance
The key changes to the previous Policy:
Earnings per Share
117.2p
Return on Equity
55%
Total Dividend
114.0p
Extension of the overall DFSS time horizon with the
introduction of a mandatory two-year holding period on
vested awards, effective from awards made in 2018
Adjustment to the DFSS bonus to be based on risk performance
Remuneration Committee discretion to adjust formulaic
DFSS outcome to ensure alignment between pay and
performance
Increase to the shareholding guideline from 200% to 300%
of base salary
No change to pension provision of 6% of salary
subject to an internal cap, but increase to cap from £9,000 to £15,000 p.a., and choice
between pension contribution and cash in lieu
Annual award of 5,000 salary shares to the CFO, vesting after
three years subject to continued employment, with additional two-
year holding period
How was our performance reflected in our pay?
Executive Director 1. Base salary 2. Benefits 3. Pension 4. SIP 5. DFSS 6. DFSS bonusTotal
remuneration
Geraint Jones 2017 £245,000 £604 £8,996 £3,600 £701,392 £153,525 £1,113,117
2016 £210,000 £330 £9,000 £3,600 £202,400 £174,209 £599,539
David Stevens1 2017 £390,824 £404 £3,791 n/a n/a n/a £395,019
2016 £381,923 £330 £3,705 n/a n/a n/a £385,958
1. David Stevens does not participate in any incentive plan given his significant shareholdings.
Admiral
FTSE 100
FTSE 350£0
£100
£200
£300
£400
£500
Dec 08 Dec 10 Dec 12 Dec 15Dec 09 Dec 11 Dec 14Dec 13 Dec 16 Dec 17
9 Year TSR Performance: Admiral vs. FTSE 100 and FTSE 350 indices Growth in the value of a hypothetical £100 holding over the nine years to 31 December 2017.
64 Admiral Group plc · Annual Report and Accounts 2017
Corporate Governance: Remuneration at a Glance

Directors’ Remuneration Policy
Compliance StatementThis Remuneration Report has been prepared according to the requirements of the Companies Act 2006 (the Act), Regulation 11 and Schedule 8 of the Large and Medium-Sized Companies and Groups (Accounts and Reports) (Amendment) Regulations 2013 and other relevant requirements of the FCA Listing Rules. In addition, the Board has applied the principles of good corporate governance set out in the UK Corporate Governance Code (the Code) and has considered the guidelines issued by its leading shareholders and bodies such as ISS, the Investment Association, and the Pensions and Lifetime Savings Association. Unless otherwise stated, information contained within this Remuneration Report is unaudited.
The Remuneration Committee is seeking shareholder approval for an updated Remuneration Policy at the 2018 AGM. The key changes to the previous Policy are as follows:
• Annual award of 5,000 salary shares to the CFO, vesting after three years subject to continued employment, with additional two-year holding period
• Extension of the overall DFSS time horizon with the introduction of a mandatory two-year holding period on vested awards, effective from awards made in 2018
• Remuneration Committee discretion to adjust formulaic DFSS outcome to ensure alignment between pay and performance
• Adjustment to the DFSS bonus to be based on risk performance
• Increase to the shareholding guideline from 200% to 300% of base salary
• No change to pension provision of 6% of salary subject to an internal cap, but increase to cap from £9,000 to £15,000 p.a., and choice between pension contribution and cash in lieu.
Subject to shareholder approval, the new Remuneration Policy will formally come into effect from the date of the 2018 AGM.
Key principles of Admiral remuneration arrangementsThe Group is committed to the primary objective of maximising shareholder value over time in a way that also promotes effective risk management and excellent customer outcome and ensuring that there is a strong link between performance and reward. This is reflected in the Group’s stated Remuneration Policy of paying competitive, performance-linked and shareholder-aligned total remuneration packages comprising basic salaries coupled with participation in performance-based share schemes to generate competitive total reward packages for superior performance. The Board is satisfied that the adoption of this Policy continues to meet the objectives of attracting and retaining executives of the highest quality across the Group.
The Committee reviews the framework and remuneration packages of the Executive Directors and the most senior managers and recognises the need to ensure that the Remuneration Policy is firmly linked to the Group’s strategy, including its risk management approach. In setting the Policy and making remuneration decisions, the Committee takes into account pay and conditions elsewhere in the Group. The main principles underlying the Remuneration Policy are:
• Competitive total package – the Group aims to deliver total remuneration packages that are market-competitive, taking into account the role, job size, responsibility, and the individual’s performance and effectiveness. Prevailing market and economic conditions and developments in governance are also considered, as are general salary levels throughout the organisation
• Significantly share-based – our base salaries are targeted towards the lower end of market, but are combined with meaningful annual share awards that vest on long-term performance to ensure strong alignment with shareholders and the long-term interests of the Group.
Executives are also encouraged to build up significant shareholdings in the Group to maximise shareholder alignment
• Long-term perspective – a significant part of senior executives’ remuneration is based on the achievement of stretching performance targets that support the delivery of the Group’s strategy and shareholder value. The extended performance and vesting horizons promote a long-term perspective that is appropriate to the insurance sector
• Effective risk management – incentives are designed to ensure they do not encourage excessive risk-taking. They are aligned with the delivery of positive customer outcomes and reinforce the Group’s risk policy
• Open and honest culture – the Group has a strong culture of focussing on collective success, whilst still recognising individual contribution to the Group’s performance, and this is reflected in our remuneration structure across the business
• Transparency to stakeholders – the remuneration structure is designed to be simple and easy to understand, and all aspects are clear to employees and openly communicated to employees, shareholders, and regulators.
65Admiral Group plc · Annual Report and Accounts 2017
Financial Statements Additional InformationCorporate GovernanceStrategic ReportIntroduction
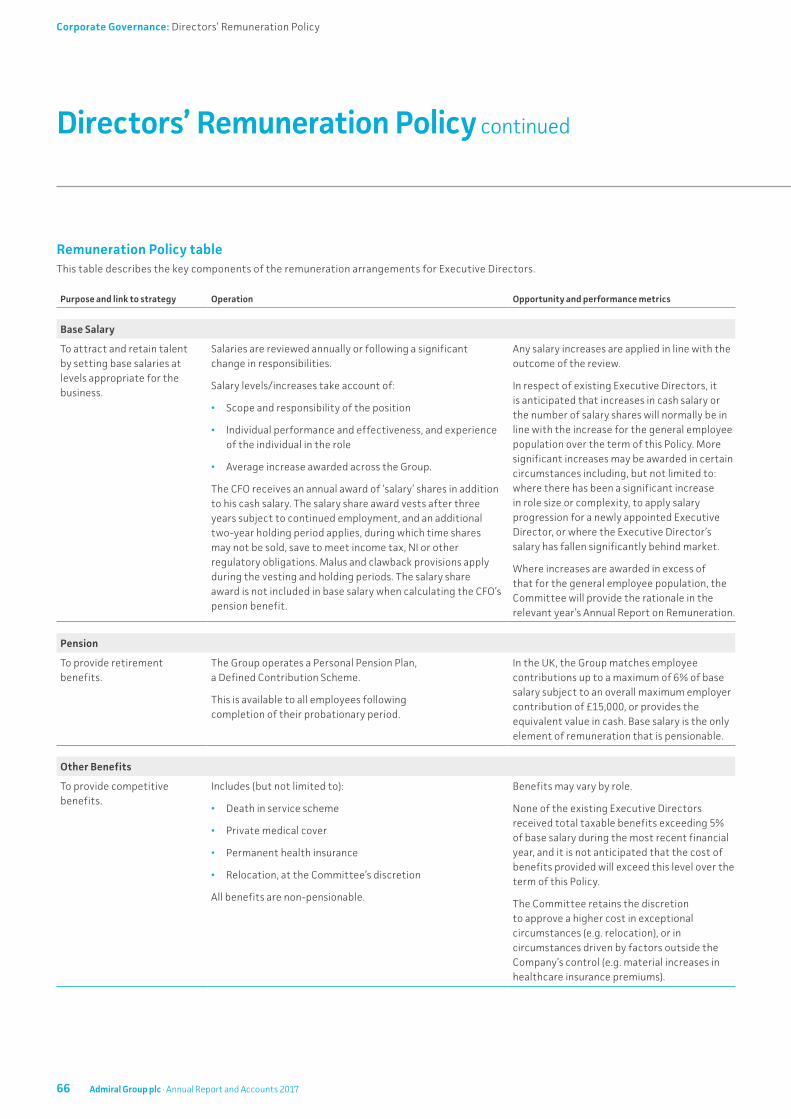
Directors’ Remuneration Policy continued
Remuneration Policy tableThis table describes the key components of the remuneration arrangements for Executive Directors.
Purpose and link to strategy Operation Opportunity and performance metrics
Base Salary
To attract and retain talent by setting base salaries at levels appropriate for the business.
Salaries are reviewed annually or following a significant change in responsibilities.
Salary levels/increases take account of:
• Scope and responsibility of the position
• Individual performance and effectiveness, and experience of the individual in the role
• Average increase awarded across the Group.
The CFO receives an annual award of ‘salary’ shares in addition to his cash salary. The salary share award vests after three years subject to continued employment, and an additional two-year holding period applies, during which time shares may not be sold, save to meet income tax, NI or other regulatory obligations. Malus and clawback provisions apply during the vesting and holding periods. The salary share award is not included in base salary when calculating the CFO’s pension benefit.
Any salary increases are applied in line with the outcome of the review.
In respect of existing Executive Directors, it is anticipated that increases in cash salary or the number of salary shares will normally be in line with the increase for the general employee population over the term of this Policy. More significant increases may be awarded in certain circumstances including, but not limited to: where there has been a significant increase in role size or complexity, to apply salary progression for a newly appointed Executive Director, or where the Executive Director’s salary has fallen significantly behind market.
Where increases are awarded in excess of that for the general employee population, the Committee will provide the rationale in the relevant year’s Annual Report on Remuneration.
Pension
To provide retirement benefits.
The Group operates a Personal Pension Plan, a Defined Contribution Scheme.
This is available to all employees following completion of their probationary period.
In the UK, the Group matches employee contributions up to a maximum of 6% of base salary subject to an overall maximum employer contribution of £15,000, or provides the equivalent value in cash. Base salary is the only element of remuneration that is pensionable.
Other Benefits
To provide competitive benefits.
Includes (but not limited to):
• Death in service scheme
• Private medical cover
• Permanent health insurance
• Relocation, at the Committee’s discretion
All benefits are non-pensionable.
Benefits may vary by role.
None of the existing Executive Directors received total taxable benefits exceeding 5% of base salary during the most recent financial year, and it is not anticipated that the cost of benefits provided will exceed this level over the term of this Policy.
The Committee retains the discretion to approve a higher cost in exceptional circumstances (e.g. relocation), or in circumstances driven by factors outside the Company’s control (e.g. material increases in healthcare insurance premiums).
66 Admiral Group plc · Annual Report and Accounts 2017
Corporate Governance: Directors’ Remuneration Policy
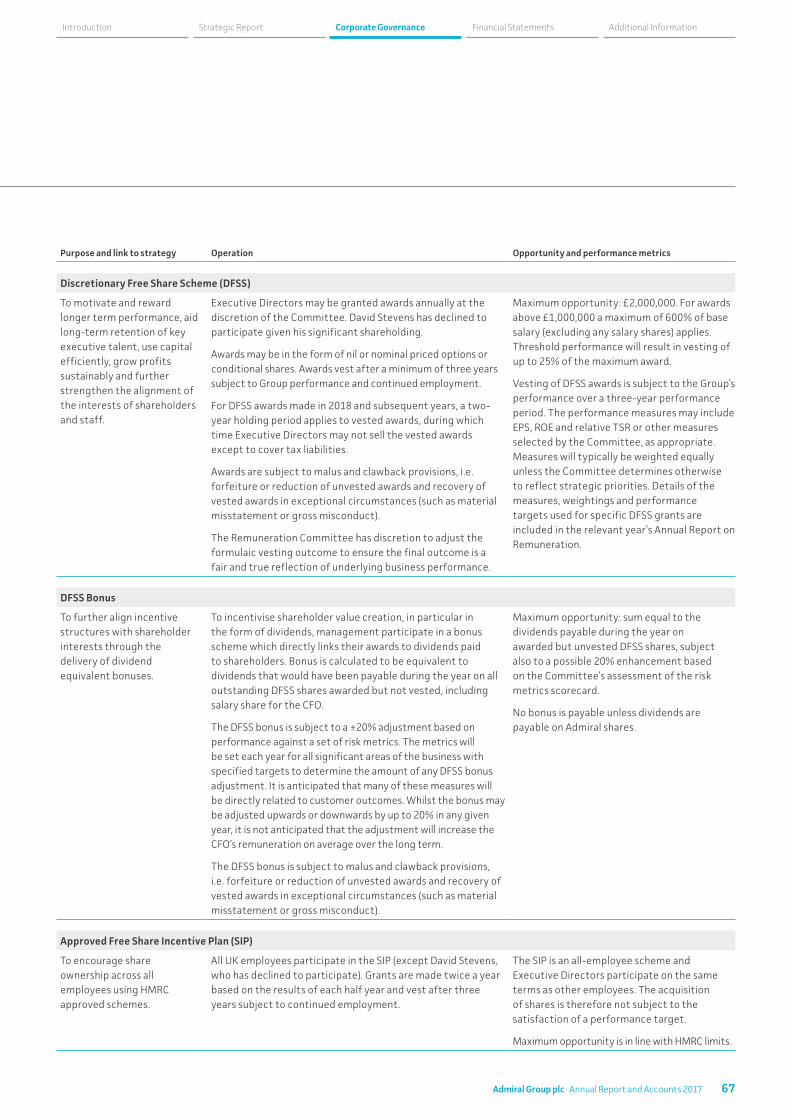
Purpose and link to strategy Operation Opportunity and performance metrics
Discretionary Free Share Scheme (DFSS)
To motivate and reward longer term performance, aid long-term retention of key executive talent, use capital efficiently, grow profits sustainably and further strengthen the alignment of the interests of shareholders and staff.
Executive Directors may be granted awards annually at the discretion of the Committee. David Stevens has declined to participate given his significant shareholding.
Awards may be in the form of nil or nominal priced options or conditional shares. Awards vest after a minimum of three years subject to Group performance and continued employment.
For DFSS awards made in 2018 and subsequent years, a two-year holding period applies to vested awards, during which time Executive Directors may not sell the vested awards except to cover tax liabilities.
Awards are subject to malus and clawback provisions, i.e. forfeiture or reduction of unvested awards and recovery of vested awards in exceptional circumstances (such as material misstatement or gross misconduct).
The Remuneration Committee has discretion to adjust the formulaic vesting outcome to ensure the final outcome is a fair and true reflection of underlying business performance.
Maximum opportunity: £2,000,000. For awards above £1,000,000 a maximum of 600% of base salary (excluding any salary shares) applies. Threshold performance will result in vesting of up to 25% of the maximum award.
Vesting of DFSS awards is subject to the Group’s performance over a three-year performance period. The performance measures may include EPS, ROE and relative TSR or other measures selected by the Committee, as appropriate. Measures will typically be weighted equally unless the Committee determines otherwise to reflect strategic priorities. Details of the measures, weightings and performance targets used for specific DFSS grants are included in the relevant year’s Annual Report on Remuneration.
DFSS Bonus
To further align incentive structures with shareholder interests through the delivery of dividend equivalent bonuses.
To incentivise shareholder value creation, in particular in the form of dividends, management participate in a bonus scheme which directly links their awards to dividends paid to shareholders. Bonus is calculated to be equivalent to dividends that would have been payable during the year on all outstanding DFSS shares awarded but not vested, including salary share for the CFO.
The DFSS bonus is subject to a ±20% adjustment based on performance against a set of risk metrics. The metrics will be set each year for all significant areas of the business with specified targets to determine the amount of any DFSS bonus adjustment. It is anticipated that many of these measures will be directly related to customer outcomes. Whilst the bonus may be adjusted upwards or downwards by up to 20% in any given year, it is not anticipated that the adjustment will increase the CFO’s remuneration on average over the long term.
The DFSS bonus is subject to malus and clawback provisions, i.e. forfeiture or reduction of unvested awards and recovery of vested awards in exceptional circumstances (such as material misstatement or gross misconduct).
Maximum opportunity: sum equal to the dividends payable during the year on awarded but unvested DFSS shares, subject also to a possible 20% enhancement based on the Committee’s assessment of the risk metrics scorecard.
No bonus is payable unless dividends are payable on Admiral shares.
Approved Free Share Incentive Plan (SIP)
To encourage share ownership across all employees using HMRC approved schemes.
All UK employees participate in the SIP (except David Stevens, who has declined to participate). Grants are made twice a year based on the results of each half year and vest after three years subject to continued employment.
The SIP is an all-employee scheme and Executive Directors participate on the same terms as other employees. The acquisition of shares is therefore not subject to the satisfaction of a performance target.
Maximum opportunity is in line with HMRC limits.
67Admiral Group plc · Annual Report and Accounts 2017
Financial Statements Additional InformationCorporate GovernanceStrategic ReportIntroduction
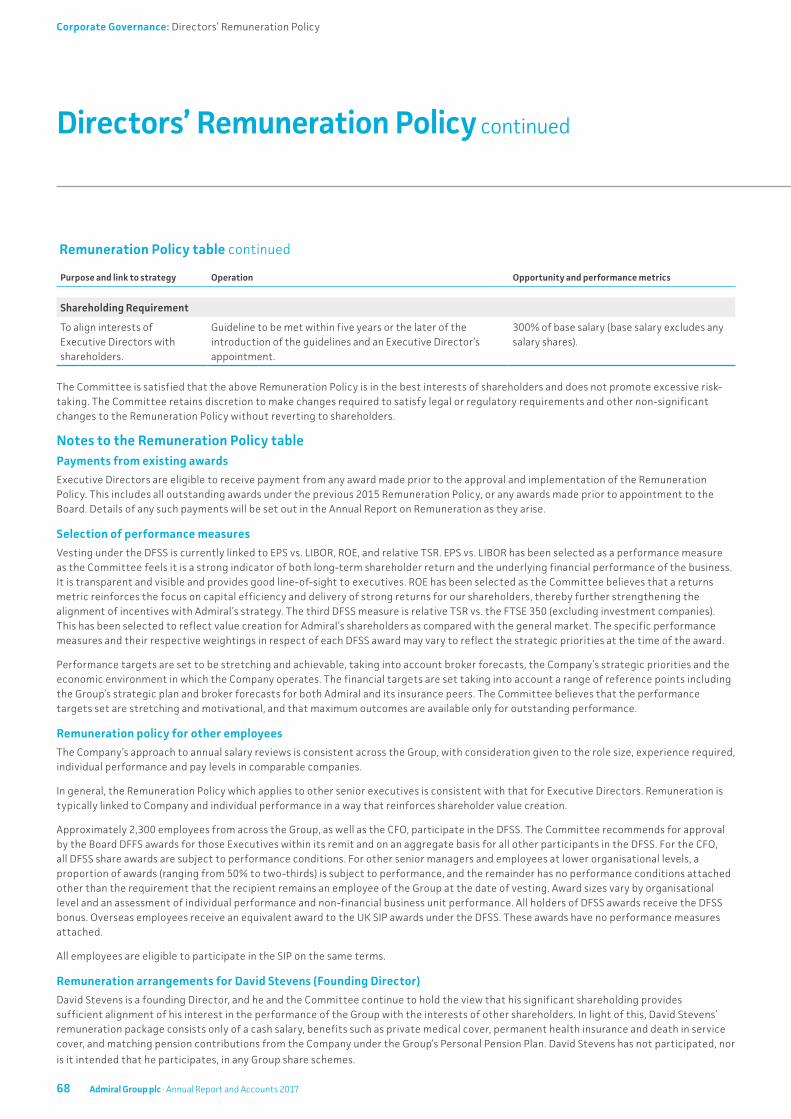
Directors’ Remuneration Policy continued
Purpose and link to strategy Operation Opportunity and performance metrics
Shareholding Requirement
To align interests of Executive Directors with shareholders.
Guideline to be met within five years or the later of the introduction of the guidelines and an Executive Director’s appointment.
300% of base salary (base salary excludes any salary shares).
The Committee is satisfied that the above Remuneration Policy is in the best interests of shareholders and does not promote excessive risk-taking. The Committee retains discretion to make changes required to satisfy legal or regulatory requirements and other non-significant changes to the Remuneration Policy without reverting to shareholders.
Notes to the Remuneration Policy tablePayments from existing awards
Executive Directors are eligible to receive payment from any award made prior to the approval and implementation of the Remuneration Policy. This includes all outstanding awards under the previous 2015 Remuneration Policy, or any awards made prior to appointment to the Board. Details of any such payments will be set out in the Annual Report on Remuneration as they arise.
Selection of performance measures
Vesting under the DFSS is currently linked to EPS vs. LIBOR, ROE, and relative TSR. EPS vs. LIBOR has been selected as a performance measure as the Committee feels it is a strong indicator of both long-term shareholder return and the underlying financial performance of the business. It is transparent and visible and provides good line-of-sight to executives. ROE has been selected as the Committee believes that a returns metric reinforces the focus on capital efficiency and delivery of strong returns for our shareholders, thereby further strengthening the alignment of incentives with Admiral’s strategy. The third DFSS measure is relative TSR vs. the FTSE 350 (excluding investment companies). This has been selected to reflect value creation for Admiral’s shareholders as compared with the general market. The specific performance measures and their respective weightings in respect of each DFSS award may vary to reflect the strategic priorities at the time of the award.
Performance targets are set to be stretching and achievable, taking into account broker forecasts, the Company’s strategic priorities and the economic environment in which the Company operates. The financial targets are set taking into account a range of reference points including the Group’s strategic plan and broker forecasts for both Admiral and its insurance peers. The Committee believes that the performance targets set are stretching and motivational, and that maximum outcomes are available only for outstanding performance.
Remuneration policy for other employees
The Company’s approach to annual salary reviews is consistent across the Group, with consideration given to the role size, experience required, individual performance and pay levels in comparable companies.
In general, the Remuneration Policy which applies to other senior executives is consistent with that for Executive Directors. Remuneration is typically linked to Company and individual performance in a way that reinforces shareholder value creation.
Approximately 2,300 employees from across the Group, as well as the CFO, participate in the DFSS. The Committee recommends for approval by the Board DFFS awards for those Executives within its remit and on an aggregate basis for all other participants in the DFSS. For the CFO, all DFSS share awards are subject to performance conditions. For other senior managers and employees at lower organisational levels, a proportion of awards (ranging from 50% to two-thirds) is subject to performance, and the remainder has no performance conditions attached other than the requirement that the recipient remains an employee of the Group at the date of vesting. Award sizes vary by organisational level and an assessment of individual performance and non-financial business unit performance. All holders of DFSS awards receive the DFSS bonus. Overseas employees receive an equivalent award to the UK SIP awards under the DFSS. These awards have no performance measures attached.
All employees are eligible to participate in the SIP on the same terms.
Remuneration arrangements for David Stevens (Founding Director)
David Stevens is a founding Director, and he and the Committee continue to hold the view that his significant shareholding provides sufficient alignment of his interest in the performance of the Group with the interests of other shareholders. In light of this, David Stevens’ remuneration package consists only of a cash salary, benefits such as private medical cover, permanent health insurance and death in service cover, and matching pension contributions from the Company under the Group’s Personal Pension Plan. David Stevens has not participated, nor is it intended that he participates, in any Group share schemes.
Remuneration Policy table continued
68 Admiral Group plc · Annual Report and Accounts 2017
Corporate Governance: Directors’ Remuneration Policy
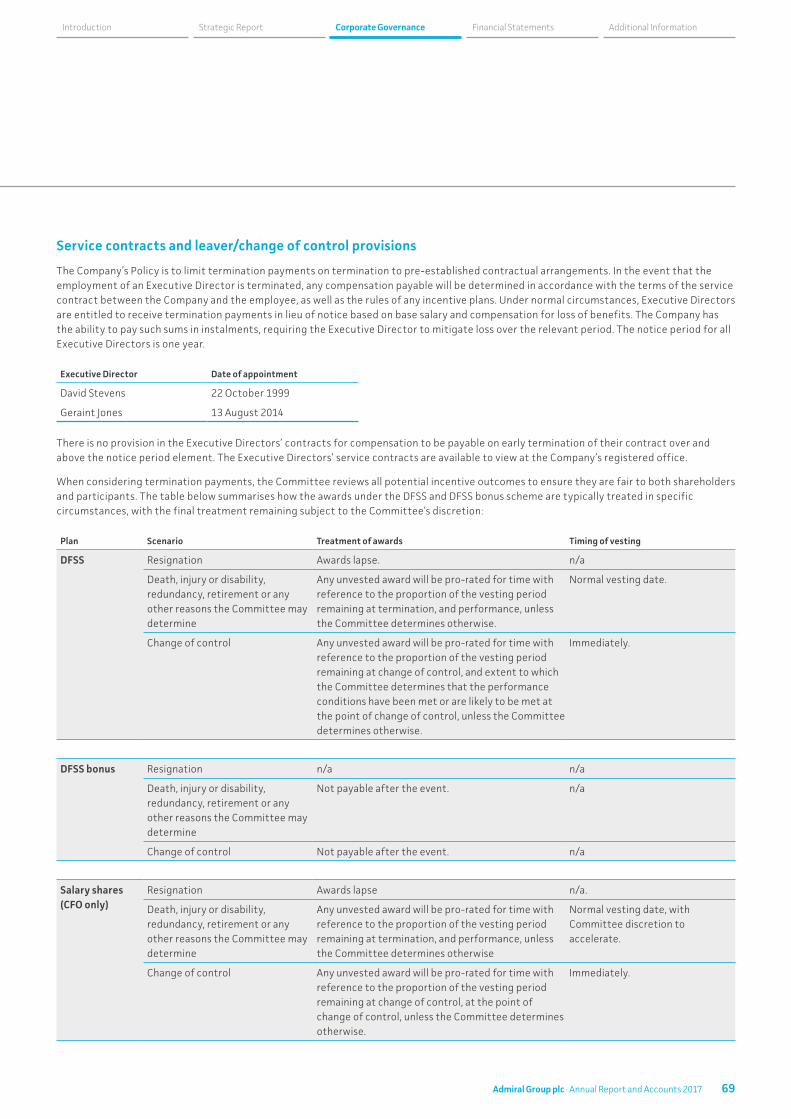
Service contracts and leaver/change of control provisions
The Company’s Policy is to limit termination payments on termination to pre-established contractual arrangements. In the event that the employment of an Executive Director is terminated, any compensation payable will be determined in accordance with the terms of the service contract between the Company and the employee, as well as the rules of any incentive plans. Under normal circumstances, Executive Directors are entitled to receive termination payments in lieu of notice based on base salary and compensation for loss of benefits. The Company has the ability to pay such sums in instalments, requiring the Executive Director to mitigate loss over the relevant period. The notice period for all Executive Directors is one year.
Executive Director Date of appointment
David Stevens 22 October 1999
Geraint Jones 13 August 2014
There is no provision in the Executive Directors’ contracts for compensation to be payable on early termination of their contract over and above the notice period element. The Executive Directors’ service contracts are available to view at the Company’s registered office.
When considering termination payments, the Committee reviews all potential incentive outcomes to ensure they are fair to both shareholders and participants. The table below summarises how the awards under the DFSS and DFSS bonus scheme are typically treated in specific circumstances, with the final treatment remaining subject to the Committee’s discretion:
Plan Scenario Treatment of awards Timing of vesting
DFSS Resignation Awards lapse. n/a
Death, injury or disability, redundancy, retirement or any other reasons the Committee may determine
Any unvested award will be pro-rated for time with reference to the proportion of the vesting period remaining at termination, and performance, unless the Committee determines otherwise.
Normal vesting date.
Change of control Any unvested award will be pro-rated for time with reference to the proportion of the vesting period remaining at change of control, and extent to which the Committee determines that the performance conditions have been met or are likely to be met at the point of change of control, unless the Committee determines otherwise.
Immediately.
DFSS bonus Resignation n/a n/a
Death, injury or disability, redundancy, retirement or any other reasons the Committee may determine
Not payable after the event. n/a
Change of control Not payable after the event. n/a
Salary shares (CFO only)
Resignation Awards lapse n/a.
Death, injury or disability, redundancy, retirement or any other reasons the Committee may determine
Any unvested award will be pro-rated for time with reference to the proportion of the vesting period remaining at termination, and performance, unless the Committee determines otherwise
Normal vesting date, with Committee discretion to accelerate.
Change of control Any unvested award will be pro-rated for time with reference to the proportion of the vesting period remaining at change of control, at the point of change of control, unless the Committee determines otherwise.
Immediately.
69Admiral Group plc · Annual Report and Accounts 2017
Financial Statements Additional InformationCorporate GovernanceStrategic ReportIntroduction

Service contracts and leaver/change of control provisions continuedFor all leavers (with the exception of termination for cause). In respect of vested DFSS and vested salary share awards that are still subject to a holding period, awards will normally be released in full at the end of the holding period, though the Committee has discretion to determine otherwise, taking into account the circumstances at the time.
Non-Executive DirectorsThe Company has entered into letters of appointment with its Non-Executive Directors (NEDs). Summary details of terms and notice periods are included below.
NED Term Commencement date Notice period
Annette Court 3 years 21 March 2015 Three months
Owen Clarke 3 years 19 August 2015 One month
Colin Holmes 3 years 3 December 2016 One month
Jean Park 3 years 17 January 2014 One month
Justine Roberts 3 years 17 June 2016 One month
Manning Rountree 3 years 16 June 2015 One month
The NEDs are not eligible to participate in the DFSS or DFSS bonus scheme and do not receive any pension contributions.
Details of the Policy on NED fees are set out in the table below:
Purpose and link to strategy Operation Opportunity and performance metrics
To attract and retain NEDs of the highest calibre with experience relevant to the Company
Fees are reviewed annually.
The Group Chairman fee is determined by the Committee after consultation with the Executive Directors. The NED fees are determined by the Group Chairman together with the Executive Directors.
Additional fees are payable for acting as Senior Independent Director or as Chair or member of a Board Committee as appropriate, and may be payable as appropriate in relation to other additional responsibilities (e.g. attending meetings overseas).
Fees are paid in a mix of cash and Company shares for the Company Chair, and in cash for other Non-Executive Directors. The Board retains discretion to vary the mix or determine that fees are paid entirely in cash or Company shares.
Fee levels are set by reference to NED fees at companies of a similar size and complexity. It is anticipated that NED fee increases will normally be in line with the increase for the general employee population over the term of this Policy.
In the event that there is a material misalignment with the market or a change in the complexity, responsibility or time commitment required to fulfil a NED role, the Board has discretion to make an appropriate adjustment to the fee level.
The maximum aggregate annual fee for NEDs is capped at the limit provided for in the Company’s Articles of Association.
Pay-for-performance: scenario analysisThe following charts provide an estimate of the potential future reward opportunities for the Executive Directors, and the potential split between the different elements of pay under three different performance scenarios: ‘Minimum’, ‘On-target’ and ‘Maximum’.
As described above, Admiral’s DFSS bonus is directly aligned with dividends received by our shareholders. Whilst the final bonus outcome may be adjusted upwards or downwards for risk by up to 20% in any given year, it is anticipated that the average adjustment over the long term will be close to 0%. The figures shown in the chart below for the CFO’s DFSS bonus include the value of the actual DFSS bonus paid in 2017 as an illustration of the value he might receive. Under all scenarios, potential reward opportunities are based on the proposed Remuneration Policy and expected awards for 2018, applied to salaries as at 1 January 2018.
Directors’ Remuneration Policy continued
Corporate Governance: Directors’ Remuneration Policy
70 Admiral Group plc · Annual Report and Accounts 2017

The value of DFSS awards is calculated based on the average share price in the last three months of 2017 (£18.88) and the number of DFSS shares awarded in 2017 (50,000 shares) and salary shares expected to be awarded in 2018 (5,000 shares, subject to shareholder approval).
The charts above exclude the effect of any Company share price movement. For this reason, were the CFO’s DFSS shares to vest in full, his actual total remuneration may exceed the £ value shown in the chart above.
Component ‘Minimum’ ‘On-target’ ‘Maximum’
Base salary • Annual cash salary and salary shares (CFO only) for 2018
Pension • £15,000 annual contribution for CFO and CEO
Benefits • Taxable value of annual benefits provided
DFSS • 0% vesting • 20% average vesting • 100% vesting
DFSS bonus • Based on DFSS bonus paid in 2017
£0
200
600
1,000
400
800
1,200
1,400
Minimum MinimumOn-target
CFO: Geraint Jones CEO: David Stevens
On-targetMaximum Maximum
70% 51% 24%
100%100% 100%
30% 22% 11%
27%
65% Fixed Rem
DFSS bonusDFSS
71Admiral Group plc · Annual Report and Accounts 2017
Financial Statements Additional InformationCorporate GovernanceStrategic ReportIntroduction
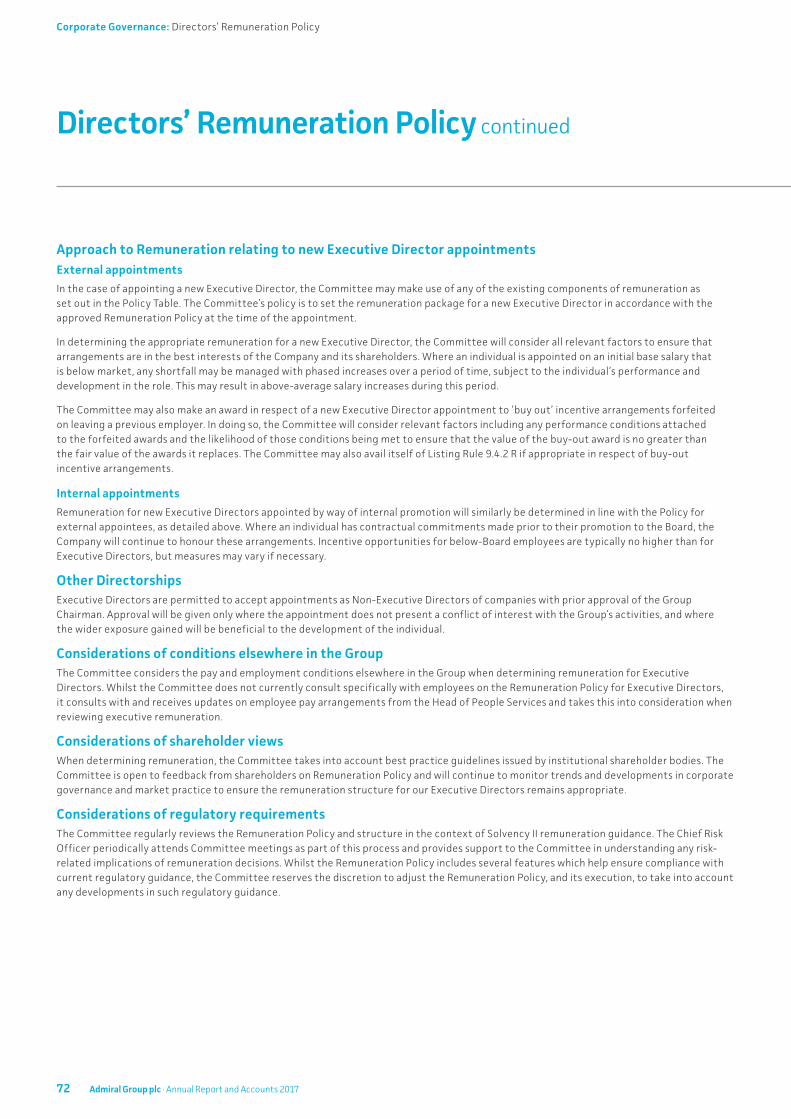
Approach to Remuneration relating to new Executive Director appointmentsExternal appointments
In the case of appointing a new Executive Director, the Committee may make use of any of the existing components of remuneration as set out in the Policy Table. The Committee’s policy is to set the remuneration package for a new Executive Director in accordance with the approved Remuneration Policy at the time of the appointment.
In determining the appropriate remuneration for a new Executive Director, the Committee will consider all relevant factors to ensure that arrangements are in the best interests of the Company and its shareholders. Where an individual is appointed on an initial base salary that is below market, any shortfall may be managed with phased increases over a period of time, subject to the individual’s performance and development in the role. This may result in above-average salary increases during this period.
The Committee may also make an award in respect of a new Executive Director appointment to ‘buy out’ incentive arrangements forfeited on leaving a previous employer. In doing so, the Committee will consider relevant factors including any performance conditions attached to the forfeited awards and the likelihood of those conditions being met to ensure that the value of the buy-out award is no greater than the fair value of the awards it replaces. The Committee may also avail itself of Listing Rule 9.4.2 R if appropriate in respect of buy-out incentive arrangements.
Internal appointments
Remuneration for new Executive Directors appointed by way of internal promotion will similarly be determined in line with the Policy for external appointees, as detailed above. Where an individual has contractual commitments made prior to their promotion to the Board, the Company will continue to honour these arrangements. Incentive opportunities for below-Board employees are typically no higher than for Executive Directors, but measures may vary if necessary.
Other DirectorshipsExecutive Directors are permitted to accept appointments as Non-Executive Directors of companies with prior approval of the Group Chairman. Approval will be given only where the appointment does not present a conflict of interest with the Group’s activities, and where the wider exposure gained will be beneficial to the development of the individual.
Considerations of conditions elsewhere in the Group The Committee considers the pay and employment conditions elsewhere in the Group when determining remuneration for Executive Directors. Whilst the Committee does not currently consult specifically with employees on the Remuneration Policy for Executive Directors, it consults with and receives updates on employee pay arrangements from the Head of People Services and takes this into consideration when reviewing executive remuneration.
Considerations of shareholder views When determining remuneration, the Committee takes into account best practice guidelines issued by institutional shareholder bodies. The Committee is open to feedback from shareholders on Remuneration Policy and will continue to monitor trends and developments in corporate governance and market practice to ensure the remuneration structure for our Executive Directors remains appropriate.
Considerations of regulatory requirements The Committee regularly reviews the Remuneration Policy and structure in the context of Solvency II remuneration guidance. The Chief Risk Officer periodically attends Committee meetings as part of this process and provides support to the Committee in understanding any risk-related implications of remuneration decisions. Whilst the Remuneration Policy includes several features which help ensure compliance with current regulatory guidance, the Committee reserves the discretion to adjust the Remuneration Policy, and its execution, to take into account any developments in such regulatory guidance.
Directors’ Remuneration Policy continued
Corporate Governance: Directors’ Remuneration Policy
72 Admiral Group plc · Annual Report and Accounts 2017
Annual Report on Remuneration
This section of the report provides details of how Admiral’s 2015 Remuneration Policy was implemented in 2017 and how the Remuneration Committee intends to implement the proposed Remuneration Policy in 2018.
Remuneration Committee membership in 2017The Board sets the Group’s Remuneration Policy and, through the authority delegated to it by the Board, the Committee is responsible for making recommendations to the Board on the structure and implementation of the Remuneration Policy across the Group with consideration to the prevailing economic climate within the economies in which the Group operates. Its remit includes recommending the remuneration of the Group Board Chairman, the Executive Directors and the Company Secretary; reviewing the remuneration of senior management; and reviewing the composition of and awards made under the performance-related incentive schemes.
At the end of 2017 the Committee consisted of Owen Clarke, Jean Park, Justine Roberts and Annette Court. Owen Clarke joined the Remuneration Committee with effect from 28 April 2016 and was proposed as the Chairman of the Committee on 26 April 2017. Owen Clarke is currently the Acting Chairman of the Committee as his appointment remains subject to regulatory approval. Justine Roberts joined the Committee with effect from 26 April 2017. Annette Court was the Chair of the Committee until the date of the 2017 AGM (26 April 2017) when she was appointed as Non-Executive Chair of Admiral and remains a member of the Committee pending the conclusion of Owen Clarke’s regulatory application process. The Committee met seven times during the year.
The Group Chairman, CEO, CFO and Chief Risk Officer are invited to meetings where the Committee considers it appropriate to obtain their advice on Group strategy and performance and Senior Executive pay strategy. The members of the Committee do not have any personal financial interests (other than shareholdings), or any conflicts, that relate to the business of the Committee. The Committee members do not have any day-to-day involvement in the running of the Group.
Advisor to the CommitteeDuring the year, in order to enable the Committee to reach informed decisions on Executive remuneration, advice on market data and trends was obtained from independent consultants, Mercer Kepler. Mercer Kepler reports directly to the Committee Chairman, and is a signatory to and abides by the Code of Conduct for Remuneration Consultants (which can be found at www.remunerationconsultantsgroup.com). Other than advice on remuneration, no other services were provided by Mercer Kepler (or any other part of the MMC group of companies) to the Company. The fees paid to Mercer Kepler in respect of work carried out in 2017 (based on time and materials) totalled £48,430, excluding expenses and VAT.
The Committee undertakes due diligence periodically to ensure that Mercer Kepler remains independent of the Company and that the advice provided is impartial and objective. The Committee is satisfied that the advice provided by Mercer Kepler is independent.
The Company Secretary also circulates market survey results as appropriate.
Summary of shareholder voting at the 2017 AGMThe table below shows the result of the advisory vote on the 2016 Annual Report on Remuneration at the 2017 AGM.
For Against Total votes cast Abstentions
2016 Annual Report on RemunerationTotal number of votes 173,833,258 9,309,064 183,142,322 10,552
% of votes cast 94.9% 5.1%
73Admiral Group plc · Annual Report and Accounts 2017
Financial Statements Additional InformationCorporate GovernanceStrategic ReportIntroduction
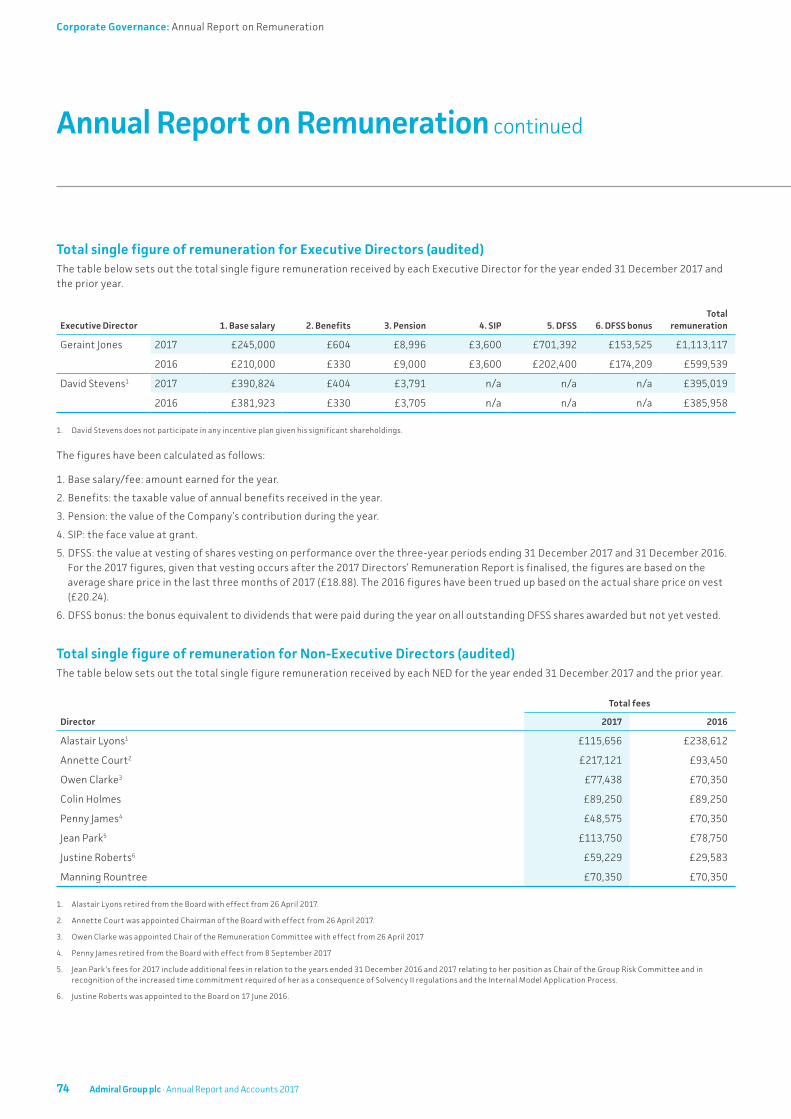
Annual Report on Remuneration continued
Total single figure of remuneration for Executive Directors (audited)The table below sets out the total single figure remuneration received by each Executive Director for the year ended 31 December 2017 and the prior year.
Executive Director 1. Base salary 2. Benefits 3. Pension 4. SIP 5. DFSS 6. DFSS bonusTotal
remuneration
Geraint Jones 2017 £245,000 £604 £8,996 £3,600 £701,392 £153,525 £1,113,117
2016 £210,000 £330 £9,000 £3,600 £202,400 £174,209 £599,539
David Stevens1 2017 £390,824 £404 £3,791 n/a n/a n/a £395,019
2016 £381,923 £330 £3,705 n/a n/a n/a £385,958
1. David Stevens does not participate in any incentive plan given his significant shareholdings.
The figures have been calculated as follows:
1. Base salary/fee: amount earned for the year.
2. Benefits: the taxable value of annual benefits received in the year.
3. Pension: the value of the Company’s contribution during the year.
4. SIP: the face value at grant.
5. DFSS: the value at vesting of shares vesting on performance over the three-year periods ending 31 December 2017 and 31 December 2016. For the 2017 figures, given that vesting occurs after the 2017 Directors’ Remuneration Report is finalised, the figures are based on the average share price in the last three months of 2017 (£18.88). The 2016 figures have been trued up based on the actual share price on vest (£20.24).
6. DFSS bonus: the bonus equivalent to dividends that were paid during the year on all outstanding DFSS shares awarded but not yet vested.
Total single figure of remuneration for Non-Executive Directors (audited)The table below sets out the total single figure remuneration received by each NED for the year ended 31 December 2017 and the prior year.
Director
Total fees
2017 2016
Alastair Lyons1 £115,656 £238,612
Annette Court2 £217,121 £93,450
Owen Clarke3 £77,438 £70,350
Colin Holmes £89,250 £89,250
Penny James4 £48,575 £70,350
Jean Park5 £113,750 £78,750
Justine Roberts6 £59,229 £29,583
Manning Rountree £70,350 £70,350
1. Alastair Lyons retired from the Board with effect from 26 April 2017.
2. Annette Court was appointed Chairman of the Board with effect from 26 April 2017.
3. Owen Clarke was appointed Chair of the Remuneration Committee with effect from 26 April 2017
4. Penny James retired from the Board with effect from 8 September 2017
5. Jean Park’s fees for 2017 include additional fees in relation to the years ended 31 December 2016 and 2017 relating to her position as Chair of the Group Risk Committee and in recognition of the increased time commitment required of her as a consequence of Solvency II regulations and the Internal Model Application Process.
6. Justine Roberts was appointed to the Board on 17 June 2016.
74 Admiral Group plc · Annual Report and Accounts 2017
Corporate Governance: Annual Report on Remuneration

Incentive outcomes for financial year to 31 December 2017 (audited)DFSS awards vesting on performance to 31 December 2017
On 29 September 2015, Geraint Jones was granted an award under the DFSS of 50,000 shares with a value at the date of award of £743,500 (based on a grant date share price of £14.87), equivalent to 372% of salary.
Vesting of the award was based 100% on the achievement of performance conditions, being EPS growth vs. LIBOR, TSR vs. FTSE 350 (excluding investment companies), and ROE, weighted equally and all measured over the three-year period 1 January 2015 to 31 December 2017. Over this period, the returns to our shareholders were strong, with TSR in the top quartile of FTSE350 companies and with ROE of over 47%. The combination of these shareholder returns and EPS growth comfortably in excess of the threshold performance set for these awards contributed to a vesting level of 74.3%. The table below details the Company’s performance against targets and the resulting vesting outcome.
Performance measure
Performance range
Actual outturnVesting outcome (% of maximum)Threshold Maximum Vesting schedule
EPS growth vs. LIBOR (weighted 33%)
Growth in line with LIBOR
Growth of 36 points (equivalent to 10%
p.a.) in excess of LIBOR
10% for achieving threshold with straight line relationship to 100% for maximum performance
12.4% points. in excess of LIBOR
41.0%
TSR vs. FTSE 350 (excluding investment companies) (33%)
Median Upper quartile 25% for median, with straight line relationship to 100% for
upper quartile
77th percentile 100%
Return on Equity (ROE) (33%)
25% 55% 25% for achieving threshold with straight line relationship to 100% for maximum performance
47.7% 81.9%
Total vesting 74.3%
Based on performance, the total amount that will vest to Geraint Jones in September 2018 will therefore be 74.3% of his award (i.e. 37,150 shares), subject to his continued employment on the vesting date.
Vested DFSS awards are subject to clawback provisions in exceptional circumstances, such as material misstatement or gross misconduct.
DFSS bonus in respect of 2017
In line with the Remuneration Policy, the Group paid a bonus to all holders of DFSS shares in 2017, which was equivalent to the dividend payable on all outstanding DFSS shares awarded but not yet vested. The Committee continues to believe that having a bonus equivalent to the dividend flow received by investors further aligns the incentive structure with shareholders.
In 2017, Geraint Jones received a DFSS bonus of £153,525 (2016: £174,209). David Stevens did not receive a DFSS bonus as he does not participate in the DFSS.
DFSS bonus payments are subject to clawback provisions in exceptional circumstances, such as material misstatement or gross misconduct.
75Admiral Group plc · Annual Report and Accounts 2017
Financial Statements Additional InformationCorporate GovernanceStrategic ReportIntroduction
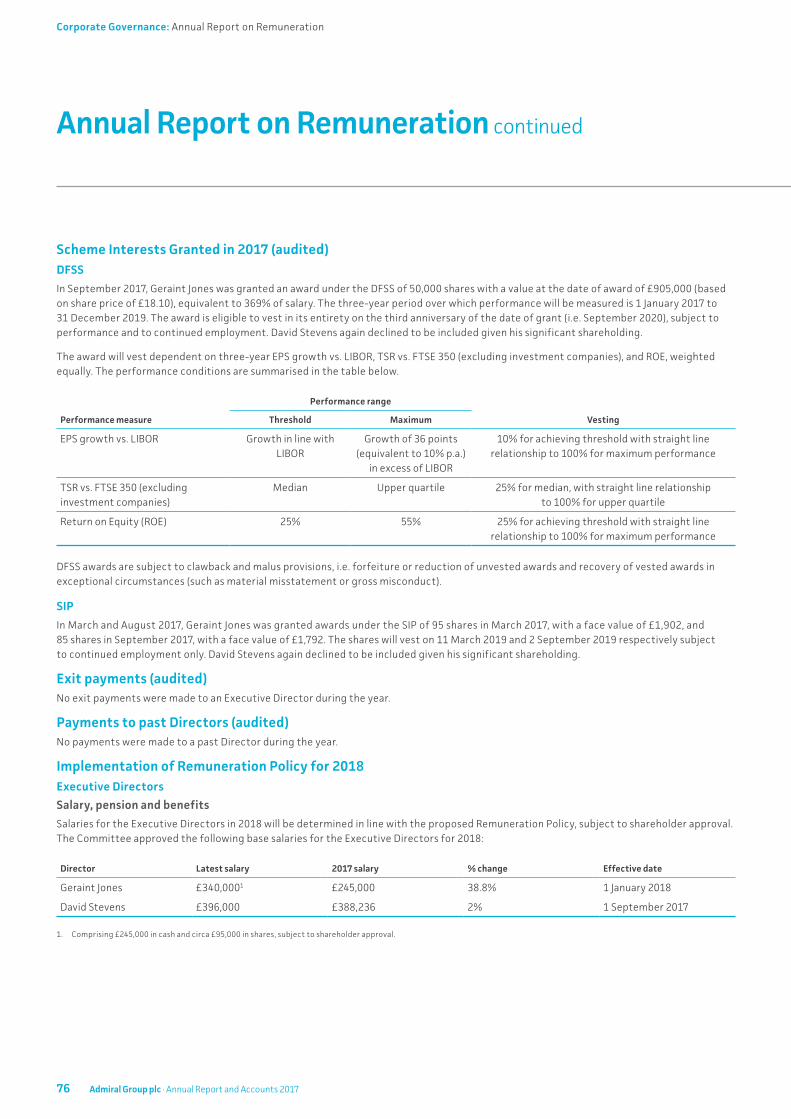
Annual Report on Remuneration continued
Scheme Interests Granted in 2017 (audited)DFSS
In September 2017, Geraint Jones was granted an award under the DFSS of 50,000 shares with a value at the date of award of £905,000 (based on share price of £18.10), equivalent to 369% of salary. The three-year period over which performance will be measured is 1 January 2017 to 31 December 2019. The award is eligible to vest in its entirety on the third anniversary of the date of grant (i.e. September 2020), subject to performance and to continued employment. David Stevens again declined to be included given his significant shareholding.
The award will vest dependent on three-year EPS growth vs. LIBOR, TSR vs. FTSE 350 (excluding investment companies), and ROE, weighted equally. The performance conditions are summarised in the table below.
Performance measure
Performance range
VestingThreshold Maximum
EPS growth vs. LIBOR Growth in line with LIBOR
Growth of 36 points (equivalent to 10% p.a.)
in excess of LIBOR
10% for achieving threshold with straight line relationship to 100% for maximum performance
TSR vs. FTSE 350 (excluding investment companies)
Median Upper quartile 25% for median, with straight line relationship to 100% for upper quartile
Return on Equity (ROE) 25% 55% 25% for achieving threshold with straight line relationship to 100% for maximum performance
DFSS awards are subject to clawback and malus provisions, i.e. forfeiture or reduction of unvested awards and recovery of vested awards in exceptional circumstances (such as material misstatement or gross misconduct).
SIP
In March and August 2017, Geraint Jones was granted awards under the SIP of 95 shares in March 2017, with a face value of £1,902, and 85 shares in September 2017, with a face value of £1,792. The shares will vest on 11 March 2019 and 2 September 2019 respectively subject to continued employment only. David Stevens again declined to be included given his significant shareholding.
Exit payments (audited)No exit payments were made to an Executive Director during the year.
Payments to past Directors (audited)No payments were made to a past Director during the year.
Implementation of Remuneration Policy for 2018Executive Directors
Salary, pension and benefits
Salaries for the Executive Directors in 2018 will be determined in line with the proposed Remuneration Policy, subject to shareholder approval. The Committee approved the following base salaries for the Executive Directors for 2018:
Director Latest salary 2017 salary % change Effective date
Geraint Jones £340,0001 £245,000 38.8% 1 January 2018
David Stevens £396,000 £388,236 2% 1 September 2017
1. Comprising £245,000 in cash and circa £95,000 in shares, subject to shareholder approval.
76 Admiral Group plc · Annual Report and Accounts 2017
Corporate Governance: Annual Report on Remuneration
For 2018, the CFO’s cash salary will remain unchanged at £245,000 and an award of 5,000 salary shares is proposed, bringing total salary to circa £340,000. The salary share award will vest after three years subject to continued employment. An additional two-year holding period will apply, during which time shares may not be sold, save to meet income tax, NI or other regulatory obligations. Malus and clawback provisions will apply during the vesting and holding periods. The salary share award is not included in base salary when calculating the CFO’s pension benefit.
The Committee believes that structuring the CFO’s salary increase as an award of shares, rather than cash, is better aligned with shareholders, is consistent with our philosophy of low cash awards balanced by the award of shares, and more effectively supports the CFO’s retention. The proposed change will bring the CFO’s package closer to market (though it will remain in the bottom quartile). It also reflects a move towards improving internal consistency between the CFO’s remuneration structure and that of the broader Admiral executive team below Board, for whom a proportion of their share awards are subject to continued employment but not subject to the DFSS vesting criteria.
Geraint Jones will continue to participate in the Group Personal Pension Plan, where employee contributions are matched up to a maximum 6% of base salary with internal cap on the maximum employer contribution. Effective from 2018 and subject to shareholder approval, whilst pension provision will remain 6% of base salary, the cap will be increased from £9,000 to £15,000 p.a. and the Company will offer individuals a choice between pension contributions and cash in lieu. David Stevens will also continue to participate in the plan, on the same basis as Geraint. Both Executive Directors will continue to receive benefits in line with the Policy.
DFSS
As in prior years, the Committee intends to make an award under the DFSS to Geraint Jones in September 2018. In advance of each DFSS cycle, the Committee reviews the appropriateness of the performance measures and corresponding targets. The Committee will determine the award size and performance conditions to be attached to the 2018 DFSS award closer to the award date (expected to be in September 2018), and will disclose them in the 2018 Annual Report on Remuneration.
DFSS bonus
As in prior years, Geraint Jones will be eligible to receive a DFSS bonus in 2018. The bonus is calculated to be equivalent to dividends that would have been payable during the year on all outstanding DFSS shares and any salary shares awarded but not vested. Effective from 2018, the DFSS bonus will include a ±20% adjustment based on performance against a set of risk metrics. The details of the risk metric and any adjustment applied will be provided in the 2018 Annual Report on Remuneration.
77Admiral Group plc · Annual Report and Accounts 2017
Financial Statements Additional InformationCorporate GovernanceStrategic ReportIntroduction
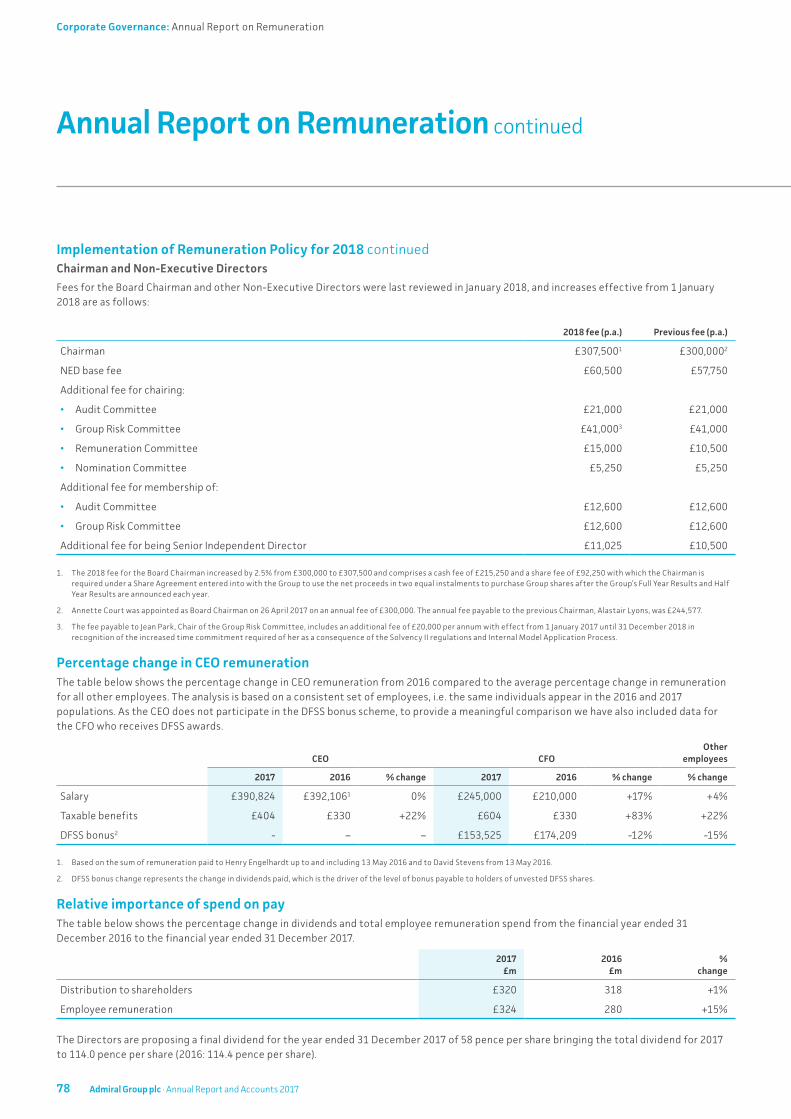
Annual Report on Remuneration continued
Implementation of Remuneration Policy for 2018 continuedChairman and Non-Executive Directors
Fees for the Board Chairman and other Non-Executive Directors were last reviewed in January 2018, and increases effective from 1 January 2018 are as follows:
2018 fee (p.a.) Previous fee (p.a.)
Chairman £307,5001 £300,0002
NED base fee £60,500 £57,750
Additional fee for chairing:
• Audit Committee £21,000 £21,000
• Group Risk Committee £41,0003 £41,000
• Remuneration Committee £15,000 £10,500
• Nomination Committee £5,250 £5,250
Additional fee for membership of:
• Audit Committee £12,600 £12,600
• Group Risk Committee £12,600 £12,600
Additional fee for being Senior Independent Director £11,025 £10,500
1. The 2018 fee for the Board Chairman increased by 2.5% from £300,000 to £307,500 and comprises a cash fee of £215,250 and a share fee of £92,250 with which the Chairman is required under a Share Agreement entered into with the Group to use the net proceeds in two equal instalments to purchase Group shares after the Group’s Full Year Results and Half Year Results are announced each year.
2. Annette Court was appointed as Board Chairman on 26 April 2017 on an annual fee of £300,000. The annual fee payable to the previous Chairman, Alastair Lyons, was £244,577.
3. The fee payable to Jean Park, Chair of the Group Risk Committee, includes an additional fee of £20,000 per annum with effect from 1 January 2017 until 31 December 2018 in recognition of the increased time commitment required of her as a consequence of the Solvency II regulations and Internal Model Application Process.
Percentage change in CEO remunerationThe table below shows the percentage change in CEO remuneration from 2016 compared to the average percentage change in remuneration for all other employees. The analysis is based on a consistent set of employees, i.e. the same individuals appear in the 2016 and 2017 populations. As the CEO does not participate in the DFSS bonus scheme, to provide a meaningful comparison we have also included data for the CFO who receives DFSS awards.
CEO CFOOther
employees
2017 2016 % change 2017 2016 % change % change
Salary £390,824 £392,1061 0% £245,000 £210,000 +17% +4%
Taxable benefits £404 £330 +22% £604 £330 +83% +22%
DFSS bonus2 - – – £153,525 £174,209 -12% -15%
1. Based on the sum of remuneration paid to Henry Engelhardt up to and including 13 May 2016 and to David Stevens from 13 May 2016.
2. DFSS bonus change represents the change in dividends paid, which is the driver of the level of bonus payable to holders of unvested DFSS shares.
Relative importance of spend on payThe table below shows the percentage change in dividends and total employee remuneration spend from the financial year ended 31 December 2016 to the financial year ended 31 December 2017.
2017 £m
2016 £m
% change
Distribution to shareholders £320 318 +1%
Employee remuneration £324 280 +15%
The Directors are proposing a final dividend for the year ended 31 December 2017 of 58 pence per share bringing the total dividend for 2017 to 114.0 pence per share (2016: 114.4 pence per share).
78 Admiral Group plc · Annual Report and Accounts 2017
Corporate Governance: Annual Report on Remuneration

Pay for performance The following graph sets out a comparison of TSR for Admiral Group plc shares with that of the FTSE 100 and FTSE 350 indices, of which the Company is a constituent, over the nine-year period to 31 December 2017. The Directors consider these to be the most appropriate indices against which the Company should be compared. TSR is defined as the percentage change over the period, assuming reinvestment of income.
9 Year TSR Performance: Admiral vs. FTSE 100 and FTSE 350 indices Growth in the value of a hypothetical £100 holding over the nine years to 31 December 2017.
CEO 2009 2010 2011 2012 2013 2014 2015 2016 2017
IncumbentHenry
EngelhardtHenry
EngelhardtHenry
EngelhardtHenry
EngelhardtHenry
EngelhardtHenry
EngelhardtHenry
EngelhardtHenry
Engelhardt1
David Stevens2
David Stevens
CEO single figure of remuneration £328,027 £343,106 £358,199 £373,759 £387,546 £393,260 £397,688 £148,776 £246,023 £395,019
DFSS vesting outcome (% of maximum) n/a n/a n/a n/a n/a n/a n/a n/a n/a n/a
CFO 2009 2010 2011 2012 2013 2014 2015 2016 2017
IncumbentKevin
ChidwickKevin
ChidwickKevin
ChidwickKevin
ChidwickKevin
ChidwickKevin
Chidwick3
Geraint Jones4
Geraint Jones
Geraint Jones
Geraint Jones
CFO single figure of remuneration £632,312 £1,269,535 £1,048,130 £1,431,218 £1,444,4435 £1,204,1645 £363,551 £539,704 £599,5396 £1,113,117
DFSS vesting outcome (% of maximum) 98% 100% 100% 100% 100% 70% 85% 69% 50% and 0% 74.3%7
1. Henry Engelhard stepped down from the Board on 13 May 2016. His 2016 remuneration includes salary and benefits in respect of his service as CEO.
2. David Stevens was appointed as the CEO on 13 May 2016. His 2016 remuneration includes salary, pension and benefits in respect of his service as CEO.
3. Kevin Chidwick left the Board on 13 August 2014 to focus on his new role as CEO of Elephant Auto. His 2014 remuneration includes salary, pension and benefits in respect of his service as CFO, his full year DFSS and his full year DFSS bonus.
4. Geraint Jones was appointed to the Board as CFO on 13 August 2014. His 2014 remuneration includes salary, pension and benefits in respect of his service as CFO, his full year DFSS and his full year DFSS bonus.
5. These figures include reimbursement of £177,104 and £165,000 in 2014 and 2013, respectively, for expenses incurred in respect of the previous CFO’s relocation.
6. This figure has been trued up since the 2016 report for the value of the 2014 DFSS based on the actual share price on vest (£20.24).
7. 74.3% of Geraint Jones’ 2015 DFSS award will vest in September 2018 subject to his continued employment on the vesting date.
There are no annual bonus outcomes to report in the table as the Admiral DFSS bonus is not structured as a traditional annual bonus scheme and consequently a vesting outcome (as a percentage of max) is meaningless.
Admiral
FTSE 100
FTSE 350£0
£100
£200
£300
£400
£500
Dec 08 Dec 10 Dec 12 Dec 15Dec 09 Dec 11 Dec 14Dec 13 Dec 16 Dec 17
79Admiral Group plc · Annual Report and Accounts 2017
Financial Statements Additional InformationCorporate GovernanceStrategic ReportIntroduction
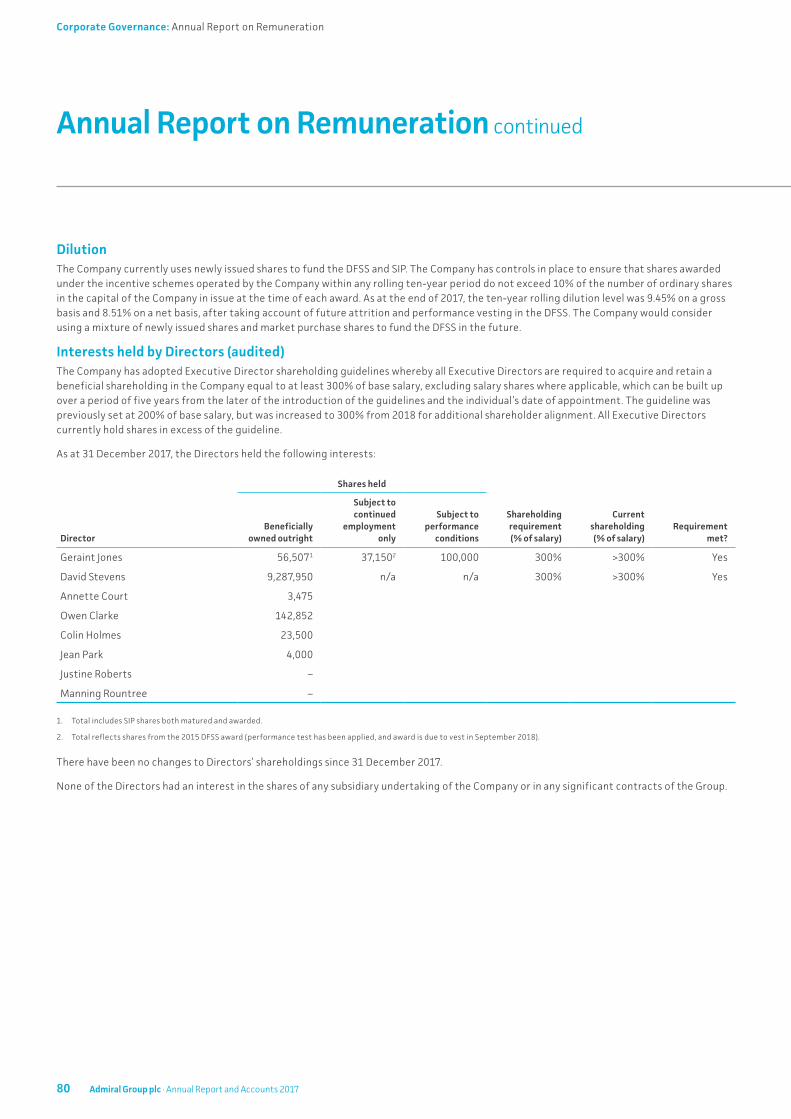
Annual Report on Remuneration continued
DilutionThe Company currently uses newly issued shares to fund the DFSS and SIP. The Company has controls in place to ensure that shares awarded under the incentive schemes operated by the Company within any rolling ten-year period do not exceed 10% of the number of ordinary shares in the capital of the Company in issue at the time of each award. As at the end of 2017, the ten-year rolling dilution level was 9.45% on a gross basis and 8.51% on a net basis, after taking account of future attrition and performance vesting in the DFSS. The Company would consider using a mixture of newly issued shares and market purchase shares to fund the DFSS in the future.
Interests held by Directors (audited)The Company has adopted Executive Director shareholding guidelines whereby all Executive Directors are required to acquire and retain a beneficial shareholding in the Company equal to at least 300% of base salary, excluding salary shares where applicable, which can be built up over a period of five years from the later of the introduction of the guidelines and the individual’s date of appointment. The guideline was previously set at 200% of base salary, but was increased to 300% from 2018 for additional shareholder alignment. All Executive Directors currently hold shares in excess of the guideline.
As at 31 December 2017, the Directors held the following interests:
Director
Shares held
Shareholding requirement (% of salary)
Current shareholding (% of salary)
Requirement met?
Beneficially owned outright
Subject to continued
employment only
Subject to performance
conditions
Geraint Jones 56,5071 37,1502 100,000 300% >300% Yes
David Stevens 9,287,950 n/a n/a 300% >300% Yes
Annette Court 3,475
Owen Clarke 142,852
Colin Holmes 23,500
Jean Park 4,000
Justine Roberts –
Manning Rountree –
1. Total includes SIP shares both matured and awarded.
2. Total reflects shares from the 2015 DFSS award (performance test has been applied, and award is due to vest in September 2018).
There have been no changes to Directors’ shareholdings since 31 December 2017.
None of the Directors had an interest in the shares of any subsidiary undertaking of the Company or in any significant contracts of the Group.
80 Admiral Group plc · Annual Report and Accounts 2017
Corporate Governance: Annual Report on Remuneration
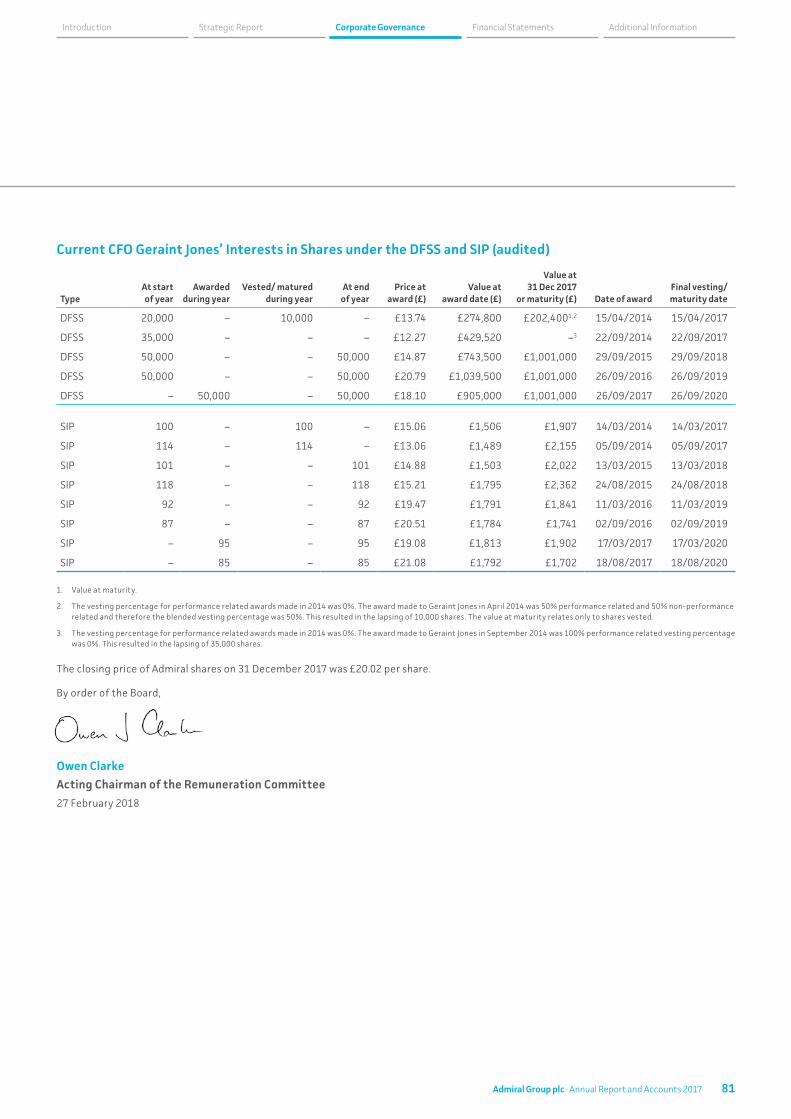
Current CFO Geraint Jones’ Interests in Shares under the DFSS and SIP (audited)
TypeAt start of year
Awarded during year
Vested/ matured during year
At end of year
Price at award (£)
Value at award date (£)
Value at 31 Dec 2017
or maturity (£) Date of awardFinal vesting/maturity date
DFSS 20,000 – 10,000 – £13.74 £274,800 £202,4001,2 15/04/2014 15/04/2017
DFSS 35,000 – – – £12.27 £429,520 –3 22/09/2014 22/09/2017
DFSS 50,000 – – 50,000 £14.87 £743,500 £1,001,000 29/09/2015 29/09/2018
DFSS 50,000 – – 50,000 £20.79 £1,039,500 £1,001,000 26/09/2016 26/09/2019
DFSS – 50,000 – 50,000 £18.10 £905,000 £1,001,000 26/09/2017 26/09/2020
SIP 100 – 100 – £15.06 £1,506 £1,907 14/03/2014 14/03/2017
SIP 114 – 114 – £13.06 £1,489 £2,155 05/09/2014 05/09/2017
SIP 101 – – 101 £14.88 £1,503 £2,022 13/03/2015 13/03/2018
SIP 118 – – 118 £15.21 £1,795 £2,362 24/08/2015 24/08/2018
SIP 92 – – 92 £19.47 £1,791 £1,841 11/03/2016 11/03/2019
SIP 87 – – 87 £20.51 £1,784 £1,741 02/09/2016 02/09/2019
SIP – 95 – 95 £19.08 £1,813 £1,902 17/03/2017 17/03/2020
SIP – 85 – 85 £21.08 £1,792 £1,702 18/08/2017 18/08/2020
1. Value at maturity.
2. The vesting percentage for performance related awards made in 2014 was 0%. The award made to Geraint Jones in April 2014 was 50% performance related and 50% non-performance related and therefore the blended vesting percentage was 50%. This resulted in the lapsing of 10,000 shares. The value at maturity relates only to shares vested.
3. The vesting percentage for performance related awards made in 2014 was 0%. The award made to Geraint Jones in September 2014 was 100% performance related vesting percentage was 0%. This resulted in the lapsing of 35,000 shares.
The closing price of Admiral shares on 31 December 2017 was £20.02 per share.
By order of the Board,
Owen Clarke
Acting Chairman of the Remuneration Committee
27 February 2018
81Admiral Group plc · Annual Report and Accounts 2017
Financial Statements Additional InformationCorporate GovernanceStrategic ReportIntroduction

Directors’ Report
The Directors present their Annual Report and the audited financial statements for the year ended 31 December 2017.
Statutory disclosuresGroup results and dividends
The profit for the year, after tax but before dividends, amounted to £331.6 million (2016: £214.1 million).
The Directors declared and paid dividends of £300.3 million during 2017 (2016: £349.8 million) – refer to note 11b for further details.
The Directors have proposed a final dividend of £163 million (58 pence per share) payable on 1 June 2018.
Employee policies
Detailed information on the Group’s employment practices is set out in the Strategic Report and on the corporate website. The Group purchases appropriate liability insurance for all staff and Directors.
Diversity, ethics and human rights
Admiral Group respects and values the individuality and diversity of every employee. The Group’s Equality, Diversity and Dignity at Work Policy ensures that every employee is treated equally and fairly and that all employees are aware of their obligations. The Group is fully committed to the health and safety and the human rights of its employees regardless of their background. In addition, the Group maintains a number of employee codes of conduct regarding appropriate ethical standards in the workplace.
The Group’s principles of respect for human rights, diversity, health and safety and workplace ethical standards not only apply to staff directly employed by Admiral, but also to staff employed by the Group’s outsourced partner in Bangalore, India. To meet this commitment, Admiral Group maintains regular contact with its outsourcer’s management team and the Group’s senior managers visit the outsourcer on a regular basis, whilst the Group also provides training and development to ensure that the team uphold these principles. In addition, Admiral Group has appointed a manager based
permanently at the outsourced operation, who is responsible for ensuring that the Group’s principles are adhered to by the outsourced partner, and that the wellbeing of outsourced staff is monitored.
Anti-bribery
The Group’s Anti-bribery Policy strictly prohibits the solicitation or the acceptance of any bribe, whether cash or inducement, to or from any person or company, wherever they are situated and whether they are a public official or body or private person or company, by any individual employee, Board member, agent or other person or body on the Group’s behalf.
Gender diversity
The table below provides a breakdown of the gender of Company Directors and employees at the end of the financial year:
Male Female
Company Directors*1 5 3
Other senior managers*2 38 17
All employees 4,715 4,981
Notes
*1 Company Directors consists of the Board of Directors, as detailed on pages 43 to 45.
*2 Other senior managers is as defined in the Companies Act 2006 (Strategic Report and Directors’ Report) and includes persons responsible for planning, directing or controlling the activities of the Company, or a strategically significant part of the Company, other than Company Directors. Any other Directors of undertakings included in the consolidated accounts that are not considered strategically significant have not been included.
Disabled employees
Admiral Group gives full and fair consideration to applications for employment made by those with disabilities, having regard to their particular aptitudes and abilities. Admiral Group’s UK businesses are Disability Confident Employers. This means they are recognised as going the extra mile to make sure disabled people get a fair chance.
The Group will support any employee who is disabled or has a life threatening illness and help them to contribute to the Group as long as their health allows.
Managers in the Group are sensitive to health concerns and special needs and will not knowingly allow any employee with a disabling or life threatening illness to suffer from discrimination at work. The Group provides staff with access to the EAP Care First confidential helpline which offers advice and support on a range of health issues.
Communication
There are a wide range of communication tools used by the Group to communicate to employees which assists in the understanding of business goals and objectives including; the staff portal (Atlas), internal newsletters, videos, team briefings, suggestion schemes, staff forums, updates on the staff share scheme and the annual Staff General Meeting (SGM). In the 2017 annual staff survey, 83% of staff were happy with the amount of information they receive about the company (2016: 84%).
The transparency of our communication philosophy extends to senior managers and Directors, who sit amongst their teams which encourages a dialogue between staff of all levels of seniority across all areas of our business. Furthermore, our Chief Executive Officer (CEO) operates an ‘open door’ policy so if any member of our staff wants to ask him a question, they can email him directly through our ‘Ask David’ intranet initiative. Our senior managers and Directors also participate in regular online chats with staff.
Contractual arrangements
The Group considers its co-insurance and reinsurance contracts, as described in the Strategic Report, to be essential to the running of the Group’s business. No other contractual arrangements are considered to be essential.
Financial instruments
The objectives and policies for managing risks in relation to financial instruments held by the Group are set out in note 6 to the financial statements.
82 Admiral Group plc · Annual Report and Accounts 2017
Corporate Governance: Directors’ Report
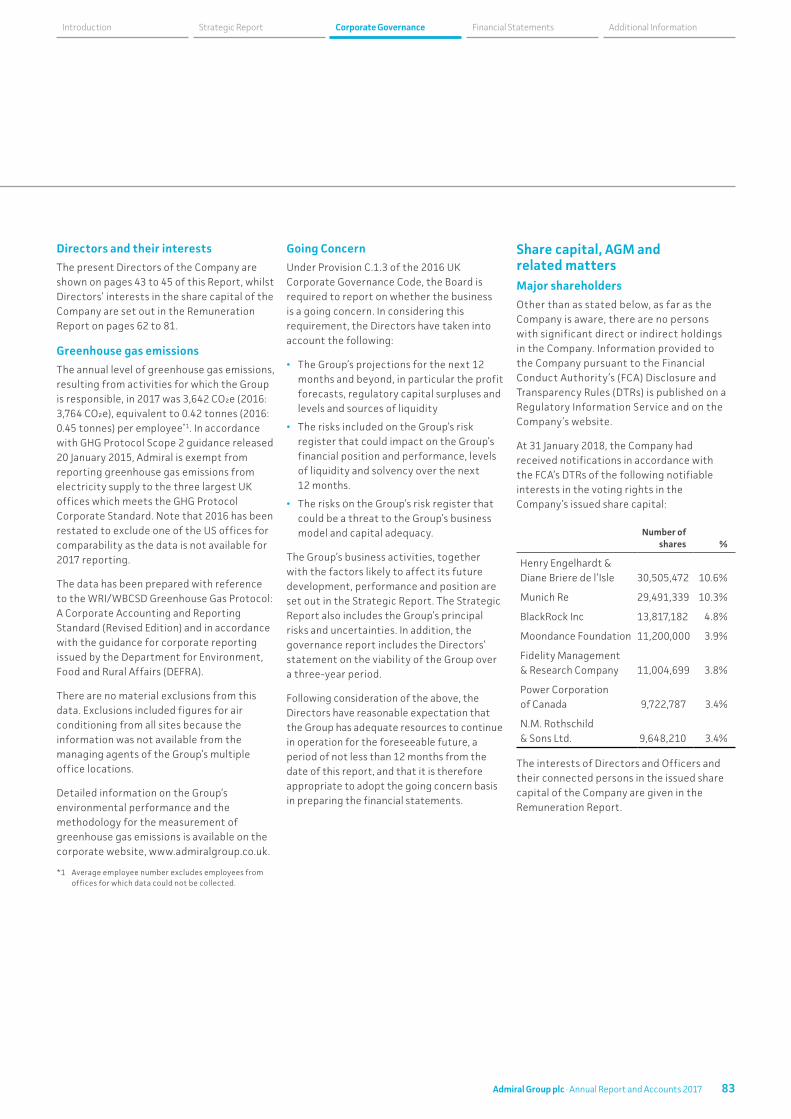
Directors and their interests
The present Directors of the Company are shown on pages 43 to 45 of this Report, whilst Directors’ interests in the share capital of the Company are set out in the Remuneration Report on pages 62 to 81.
Greenhouse gas emissions
The annual level of greenhouse gas emissions, resulting from activities for which the Group is responsible, in 2017 was 3,642 CO2e (2016: 3,764 CO2e), equivalent to 0.42 tonnes (2016: 0.45 tonnes) per employee*1. In accordance with GHG Protocol Scope 2 guidance released 20 January 2015, Admiral is exempt from reporting greenhouse gas emissions from electricity supply to the three largest UK offices which meets the GHG Protocol Corporate Standard. Note that 2016 has been restated to exclude one of the US offices for comparability as the data is not available for 2017 reporting.
The data has been prepared with reference to the WRI/WBCSD Greenhouse Gas Protocol: A Corporate Accounting and Reporting Standard (Revised Edition) and in accordance with the guidance for corporate reporting issued by the Department for Environment, Food and Rural Affairs (DEFRA).
There are no material exclusions from this data. Exclusions included figures for air conditioning from all sites because the information was not available from the managing agents of the Group’s multiple office locations.
Detailed information on the Group’s environmental performance and the methodology for the measurement of greenhouse gas emissions is available on the corporate website, www.admiralgroup.co.uk.
*1 Average employee number excludes employees from offices for which data could not be collected.
Going Concern
Under Provision C.1.3 of the 2016 UK Corporate Governance Code, the Board is required to report on whether the business is a going concern. In considering this requirement, the Directors have taken into account the following:
• The Group’s projections for the next 12 months and beyond, in particular the profit forecasts, regulatory capital surpluses and levels and sources of liquidity
• The risks included on the Group’s risk register that could impact on the Group’s financial position and performance, levels of liquidity and solvency over the next 12 months.
• The risks On the Group’s risk register that could be a threat to the Group’s business model and capital adequacy.
The Group’s business activities, together with the factors likely to affect its future development, performance and position are set out in the Strategic Report. The Strategic Report also includes the Group’s principal risks and uncertainties. In addition, the governance report includes the Directors’ statement on the viability of the Group over a three-year period.
Following consideration of the above, the Directors have reasonable expectation that the Group has adequate resources to continue in operation for the foreseeable future, a period of not less than 12 months from the date of this report, and that it is therefore appropriate to adopt the going concern basis in preparing the financial statements.
Share capital, AGM and related mattersMajor shareholders
Other than as stated below, as far as the Company is aware, there are no persons with significant direct or indirect holdings in the Company. Information provided to the Company pursuant to the Financial Conduct Authority’s (FCA) Disclosure and Transparency Rules (DTRs) is published on a Regulatory Information Service and on the Company’s website.
At 31 January 2018, the Company had received notifications in accordance with the FCA’s DTRs of the following notifiable interests in the voting rights in the Company’s issued share capital:
Number of shares %
Henry Engelhardt & Diane Briere de l’Isle 30,505,472 10.6%
Munich Re 29,491,339 10.3%
BlackRock Inc 13,817,182 4.8%
Moondance Foundation 11,200,000 3.9%
Fidelity Management & Research Company 11,004,699 3.8%
Power Corporation of Canada 9,722,787 3.4%
N.M. Rothschild & Sons Ltd. 9,648,210 3.4%
The interests of Directors and Officers and their connected persons in the issued share capital of the Company are given in the Remuneration Report.
83Admiral Group plc · Annual Report and Accounts 2017
Financial Statements Additional InformationCorporate GovernanceStrategic ReportIntroduction
Additional information for shareholders
Where not provided previously in this Directors’ Report, the following provides the additional information required for shareholders as a result of the implementation of the Takeovers Directive into UK law.
At 31 December 2017, the Company’s issued share capital comprised a single class of shares referred to as ordinary shares. Details of the share capital and shares issued during the year can be found in note 11d.
On a poll, every member present in person or by proxy and entitled to vote shall have one vote for every ordinary share held. The notice of the general meeting specifies deadlines for exercising voting rights either by proxy notice or present in person or by proxy in relation to resolutions to be passed at general meeting. All proxy votes are counted and the numbers for, against or withheld in relation to each resolution are announced at the Annual General Meeting and published on the Company’s website after the meeting.
There are no restrictions on the transfer of ordinary shares in the Company other than:
• Certain restrictions may from time to time be imposed by laws and regulations (for example, insider trading laws).
• Pursuant to the Listing Rules of the FCA whereby certain employees of the Company require the approval of the Company to deal in the Company’s securities.
The Company has not purchased any of its own shares during the period.
There are no agreements between the Company and its Directors or employees providing for compensation for loss of office or employment (whether through resignation, purported redundancy or otherwise) that occurs because of a takeover bid.
There are a number of agreements that alter or terminate upon a change of control of the Company following a takeover bid, such as commercial contracts. None are considered to be significant in terms of their impact on
the business of the Group as a whole except for the long term co-insurance agreement in place with Great Lakes Insurance SE. Details relating to this agreement are contained in the Strategic Report.
Power to issue shares
At the last Annual General Meeting, held on 26 April 2017, authority was given to the Directors to allot unissued relevant securities in the Company up to a maximum of £93,836, equivalent to one third of the issued share capital as at 20 March 2017. This authority expires on the date of the Annual General Meeting to be held on 26 April 2018 and the Directors will seek to renew this authority for the following year.
A further special resolution passed at that meeting granted authority to the Directors to allot equity securities in the Company (up to a maximum of 5% of the issued share capital of the Company) for cash, without regard to the pre-emption provisions of the Companies Act 2006. This authority also expires on the date of the Annual General Meeting to be held on 26 April 2018 and the Directors will seek to renew this authority for the following year.
In line with the new principles published by the Pre-Emption Group in March 2015, and their template resolutions published in May 2016, allowing a company the ability to seek authority over a further 5% of the issued ordinary share capital on a non-pre-emptive basis subject to certain conditions, it is the intention of the Company, at the AGM on 26 April 2018, to seek this additional authority by special resolution and will confirm in the Notice of AGM that such additional shares are only issued in connection with a specified acquisition or capital investment.
Appointments of Directors
The Company’s Articles of Association (the Articles) give the Directors power to appoint and replace Directors. Under the Terms of Reference of the Nomination and Governance Committee, any appointment must be recommended by the Nomination and Governance Committee for approval by the Board of Directors. The Articles also require Directors to retire and submit
themselves for election at the first Annual General Meeting following appointment and all Directors who held office at the time of the two preceding Annual General Meetings to submit themselves for re-election.
However, in accordance with the requirement under the UK Corporate Governance Code (the Code) for annual election of Directors, all Directors will submit themselves for re-election at the Group’s Annual General Meeting on 26 April 2018.
Articles of Association
The Articles may only be amended by special resolution of the shareholders.
Power of the Directors
The Directors are responsible for managing the business of the Company and may exercise all powers of the Company subject to the provisions of relevant statutes, to any directions given by special resolution and to the Company’s Memorandum and Articles. The Articles, for example, contain specific provisions and restrictions concerning the Company’s power to borrow money. Powers relating to the issuing of new shares are also included in the Articles and such authorities are renewed by shareholders at the Annual General Meeting each year.
Directors’ indemnities and insurance
Directors and Officers insurance cover is in place for all Directors to provide cover against certain acts or omissions on behalf of the Company. A Deed Poll of Indemnity was executed in October 2015, indemnifying each of the Directors, and Company Secretary, in relation to certain losses and liabilities that they might incur in the course of acting as Directors of the Company. The Deed Poll of Indemnity is categorised as qualifying third party indemnity provisions as defined by section 234 of the Companies Act 2006 and remains in force for all past and present Directors of the Company.
The Board is of the view that it is in the best interests of the Group to attract and retain the services of the most able and experienced Directors by offering competitive terms of engagement, including the granting of such indemnities.
Directors’ Report Continued
84 Admiral Group plc · Annual Report and Accounts 2017
Corporate Governance: Directors’ Report
Neither the Deed Poll of Indemnity nor insurance cover would provide any coverage in the event that a Director is proved to have acted fraudulently or dishonestly.
Annual General Meeting (AGM)
It is proposed that the next AGM be held at City Hall, Cardiff on Thursday 26 April 2018 at 2.00pm, notice of which will be sent to shareholders with the Annual Report.
Reporting, accountability and auditUK Corporate Governance Code
Admiral is subject to the UK Corporate Governance Code (the Code), published by the Financial Reporting Council (FRC) in April 2016 and available on their website, www.frc.org.uk. The Company’s Annual Report and Accounts, taken as a whole, addresses the requirements of the 2016 Code.
During the year to 31 December 2017, the Company has in all respects complied with the provisions of the 2016 Code except with regard to non-compliance with the provisions as set out in the corporate governance report at page 46.
The Directors confirm that the Annual Report and Accounts, taken as a whole, is fair, balanced and understandable and provides the information necessary for shareholders to assess the Company’s position and performance, business model and strategy.
Directors’ responsibilities
The Directors are responsible for preparing the Annual Report and the Group and parent company financial statements in accordance with applicable law and regulations.
Company law requires the directors to prepare Group and parent company financial statements for each financial year. Under that law they are required to prepare the Group financial statements in accordance with IFRSs as adopted by the EU and applicable law and have elected to prepare the parent company financial statements in accordance with UK Accounting Standards, including FRS 101 Reduced Disclosure Framework.
Under company law the Directors must not approve the financial statements unless they are satisfied that they give a true and fair view of the state of affairs of the Group and Parent Company and of their profit or loss for that period. In preparing each of the Group and Parent Company financial statements, the directors are required to:
• select suitable accounting policies and then apply them consistently
• make judgements and estimates that are reasonable and prudent
• for the Group financial statements, state whether they have been prepared in accordance with IFRSs as adopted by the EU
• for the Parent Company financial statements, state whether applicable UK Accounting Standards, including FRS 101 Reduced Disclosure Framework, have been followed, subject to any material departures disclosed and explained in the parent company financial statements.
The directors are responsible for keeping adequate accounting records that are sufficient to show and explain the parent company’s transactions and disclose with reasonable accuracy at any time the financial position of the parent company and enable them to ensure that its financial statements comply with the Companies Act 2006. They have general responsibility for taking such steps as are reasonably open to them to safeguard the assets of the Group and to prevent and detect fraud and other irregularities.
Under applicable law and regulations, the directors are also responsible for preparing a Strategic Report, Directors’ Report, Directors’ Remuneration Report and Corporate Governance Statement that complies with that law and those regulations.
The Directors are responsible for the maintenance and integrity of the corporate and financial information included on the company’s website. Legislation in the UK governing the preparation and dissemination of financial statements may differ from legislation in other jurisdictions.
Responsibility statement
The Directors confirm that to the best of their knowledge:
• the financial statements, prepared in accordance with the applicable set of accounting standards, give a true and fair view of the assets, liabilities, financial position and profit or loss of the Company and the undertakings included in the consolidation taken as a whole; and
• the Strategic Report includes a fair review of the development and performance of the business and the position of the issuer and the undertakings included in the consolidation taken as a whole, together with a description of the principal risks and uncertainties that they face.
Disclosure of information to auditor
The Directors who held office at the date of approval of this Directors’ Report confirm that, so far as they are each aware, there is no relevant audit information of which the Company’s auditor is unaware; and each Director has taken all the steps that they ought to have taken as a Director to make themselves aware of any relevant audit information and to establish that the Company’s auditor is aware of that information.
Auditor
The Company’s auditor, Deloitte LLP, has indicated a willingness to continue in office and resolutions to reappoint it and to authorise the Directors to fix its remuneration will be proposed at the Annual General Meeting.
By Order of the Board,
Mark Waters Geraint Jones
Company Secretary Chief Financial Officer
27 February 2018 27 February 2018
85Admiral Group plc · Annual Report and Accounts 2017
Financial Statements Additional InformationCorporate GovernanceStrategic ReportIntroduction
Report on the audit of the financial statementsOpinion
In our opinion:
• the financial statements give a true and fair view of the state of the group’s and of the parent company’s affairs as at 31 December 2017 and of the group’s profit for the year then ended;
• the group financial statements have been properly prepared in accordance with International Financial Reporting Standards (IFRSs) as adopted by the European Union;
• the parent company financial statements have been properly prepared in accordance with United Kingdom Generally Accepted Accounting Practice including Financial Reporting Standard 101 “Reduced Disclosure Framework”; and
• the financial statements have been prepared in accordance with the requirements of the Companies Act 2006 and, as regards the group financial statements, Article 4 of the IAS Regulation.
We have audited the financial statements of Admiral Group plc (the ‘parent company’) and its subsidiaries (the ‘group’) which comprise:
• the Consolidated and Parent Company Income Statements;
• the Consolidated and Parent Company Statements of Comprehensive Income;
• the Consolidated and Parent Company Statements of Financial Position;
• the Consolidated Cash Flow Statement;
• the Consolidated and Parent Company Statements of Changes in Equity;
• the related notes 1 to 12 to the group financial statements; and
• the related notes 1 to 9 to the Parent Company financial statements.
The financial reporting framework that has been applied in the preparation of the group financial statements is applicable law and IFRSs as adopted by the European Union. The financial reporting framework that has been applied in the preparation of the parent company financial statements is applicable law and United Kingdom Accounting Standards, including FRS 101 “Reduced Disclosure Framework” (United Kingdom Generally Accepted Accounting Practice).
Basis for opinion
We conducted our audit in accordance with International Standards on Auditing (UK) (ISAs (UK)) and applicable law. Our responsibilities under those standards are further described in the auditor’s responsibilities for the audit of the financial statements section of our report.
We are independent of the group and the parent company in accordance with the ethical requirements that are relevant to our audit of the financial statements in the UK, including the FRC’s Ethical Standard as applied to listed public interest entities, and we have fulfilled our other ethical responsibilities in accordance with these requirements. We confirm that the non-audit services prohibited by the FRC’s Ethical Standard were not provided to the group or the parent company.
We believe that the audit evidence we have obtained is sufficient and appropriate to provide a basis for our opinion.
to the Members of Admiral Group Plc
Independent Auditor’s Report
86 Admiral Group plc · Annual Report and Accounts 2017
Financial Statements: Independent Auditor’s Report
Summary of our audit approach
Key audit matters The key audit matters that we identified in the current year were:
• Valuation of gross insurance claims reserves; and
• Revenue recognition – profit commission income
The key audit matters identified are the same as the prior year.
Materiality The materiality that we used in the current year was £20m which was determined on the basis of 5% of profit before tax.
Scoping We identified seven reporting components which we determined should be subjected to audits for group reporting purposes this year (2016: five reporting components were subjected to full scope audits).
Further specific audit procedures were completed in respect of two further components which, although not financially significant, did present some specific audit risks which needed to be addressed.
The components within the scope of our audit procedures account for 93% of the group’s profits and losses before tax (2016: 94%), 91% of revenue (2016: 87%) and 91% of the group’s net assets (2016: 95%).
Significant changes in our approach
The main change in component scoping since 2016 is to subject the group’s two underwriting divisions in Italy to full scope audits. Whilst these divisions are not considered significant to the group as a whole in 2017, they do represent a significant portion of the group’s European underwriting activity and therefore we have determined that treating them in this way is the most appropriate approach.
Conclusions relating to going concern, principal risks and viability statement
Going concern
We have reviewed the directors’ statement in note 2 to the financial statements about whether they considered it appropriate to adopt the going concern basis of accounting in preparing them and their identification of any material uncertainties to the group’s and company’s ability to continue to do so over a period of at least twelve months from the date of approval of the financial statements.
We are required to state whether we have anything material to add or draw attention to in relation to that statement required by Listing Rule 9.8.6R(3) and report if the statement is materially inconsistent with our knowledge obtained in the audit.
We confirm that we have nothing material to report, add or draw attention to in respect of these matters.
Principal risks and viability statement
Based solely on reading the directors’ statements and considering whether they were consistent with the knowledge we obtained in the course of the audit, including the knowledge obtained in the evaluation of the directors’ assessment of the group’s and the company’s ability to continue as a going concern, we are required to state whether we have anything material to add or draw attention to in relation to:
• the disclosures on pages 33 to 37 that describe the principal risks and explain how they are being managed or mitigated;
• the directors' confirmation on page 33 that they have carried out a robust assessment of the principal risks facing the group, including those that would threaten its business model, future performance, solvency or liquidity; or
• the directors’ explanation on page 59 as to how they have assessed the prospects of the group, over what period they have done so and why they consider that period to be appropriate, and their statement as to whether they have a reasonable expectation that the group will be able to continue in operation and meet its liabilities as they fall due over the period of their assessment, including any related disclosures drawing attention to any necessary qualifications or assumptions.
We are also required to report whether the directors’ statement relating to the prospects of the group required by Listing Rule 9.8.6R(3) is materially inconsistent with our knowledge obtained in the audit.
We confirm that we have nothing material to report, add or draw attention to in respect of these matters.
87Admiral Group plc · Annual Report and Accounts 2017
Financial Statements Additional InformationCorporate GovernanceStrategic ReportIntroduction
Key audit matters
Key audit matters are those matters that, in our professional judgement, were of most significance in our audit of the financial statements of the current period and include the most significant assessed risks of material misstatement (whether or not due to fraud) that we identified. These matters included those which had the greatest effect on: the overall audit strategy, the allocation of resources in the audit; and directing the efforts of the engagement team.
These matters were addressed in the context of our audit of the financial statements as a whole, and in forming our opinion thereon, and we do not provide a separate opinion on these matters. The key audit matters identified this year are in line with those identified in the 2016 audit.
Valuation of gross insurance claims reserves
Key audit matter description
The group’s gross insurance claims reserves total £2,403m (2016 year-end: £2,031m). The judgements which are made by management in determining the total valuation of incurred claims reserves, including those claims which are incurred but not reported (“IBNR”) are by far the most significant, in terms of their impact on the group’s financial position. Setting these claims reserves is an inherently subjective exercise and small changes in underlying assumptions such as average frequency or average severity may have a material impact on the overall year end result reported. We therefore consider that this account balance contains potential fraud risks.
Specifically, our significant areas of focus are management’s assumptions underpinning the modelled frequency and severity of large bodily injury claims arising in the UK Car Insurance business. These particular claims result in higher individual claims reserves and are more judgemental, in terms of the development of the ultimate losses, due to the longer-term nature of the group’s exposure (compared to property damage claims).
In line with the group's accounting policy, management adds a margin to the actuarial best estimate to arrive at the booked gross claims reserves. This margin reflects the inherent uncertainty in estimating the ultimate losses on claims, over and above that which can be projected actuarially based on underlying claims development data. This is a significant area of management judgement and, therefore, a focus of our audit. Specifically, the margin in the UK Car Insurance reserves, related to large bodily injury claims, is our key area of focus in respect of the margins included.
Refer to page 54 in the audit committee report where this is included as a significant issue and note 5d and note 3 in the financial statements which refer to this matter.
How the scope of our audit responded to the key audit matter
We have assessed the design and implementation and tested the operating effectiveness of key controls relating to the key actuarial assumptions identified above and the setting of the reserve margin. This included testing controls concerning management and Audit Committee challenge of the external actuarial expert’s work and the appropriate governance oversight in respect of the key assumptions and margins determined.
We reviewed the reports from management’s external expert actuary and involved our own Deloitte actuarial experts to support our challenge of management’s key assumptions. We benchmarked assumptions relating to the severity and frequency of large bodily injury claims against available industry data and to peers where possible and appropriate. We also completed procedures to specifically assess the competence and objectivity of management’s expert in their role.
We challenged management's qualitative and quantitative justifications for the margin held over the actuarial best estimate through review of the accounting judgement papers produced, including involvement of Deloitte actuarial experts. Further, we analysed its consistency with previous reporting periods and challenged management's justification for the booked margin in relation to the uncertainty in the ultimate claims reserves.
Where there was a movement in the perceived level of prudence in the booked reserves, or a change in methodology, we assessed this against the applicable accounting standard (IFRS 4: Insurance Contracts). Where there was a change in methodology, we assessed this against IFRS 4 and IAS 8 (Accounting Policies, Changes in Accounting Estimates and Errors).
Key observations Based on our procedures above, we consider the booked reserves remain appropriate and in line with the Group’s prudent accounting policy.
to the Members of Admiral Group Plc
Independent Auditor’s Report continued
88 Admiral Group plc · Annual Report and Accounts 2017
Financial Statements: Independent Auditor’s Report
Revenue recognition – profit commission income
Key audit matter description
The auditing standards prescribe that a risk of fraud in revenue recognition should be presumed for all trading groups and companies. We therefore performed an assessment of the group’s classes of revenue transactions to identify the areas where there was a potential for fraud through possible manipulation of this balance.
In our view, the profit commission income earned by the group, which, on a consolidated basis, consists of amounts due from the group’s co-insurer of £64.7m (2016: £54.3m), represents a revenue class for which there is an incentive to fraudulently overstate the amounts recorded. Accordingly, we have determined that the accuracy of profit commission income due from the group’s co-insurance arrangement includes elements which constitute a significant risk of material misstatement for the group financial statements and therefore identified this as a key audit matter.
The risk is particularly acute where there have been changes to the terms of the profit commission arrangements or other one-off adjustments which therefore mean that the calculation to be performed is not uniform across all underwriting years – i.e. where the same underwriting result within two different periods could give rise to different levels of profit commissions for each because of variances in the applicable contracted terms. The accuracy of the calculation in respect of these changes is the specific risk area which we determined represents a significant risk of misstatement.
Refer to page 54 in the audit committee report where this is included as a significant issue, and note 5c and note 3 in the financial statements which refer to this matter.
How the scope of our audit responded to the key audit matter
We tested and were able to rely upon the key controls associated with changes in the calculation; which are controls designed to ensure that the inputs to the calculation are accurate and the review by management which is performed to check that the requisite changes have been reflected in the detailed calculation.
Our substantive response constituted inspection of the applicable co-insurance contracts to evaluate the form and content of management’s calculation and a substantive analytical review. We developed an independent expectation of the commission income to recognise, based upon our understanding of the contracts and using the loss ratios audited as part of our insurance reserves testing, compared that to the output of management’s calculation and then investigated any differences.
Key observations Based on our procedures above, we considered the profit commission to be appropriately calculated.
89Admiral Group plc · Annual Report and Accounts 2017
Financial Statements Additional InformationCorporate GovernanceStrategic ReportIntroduction
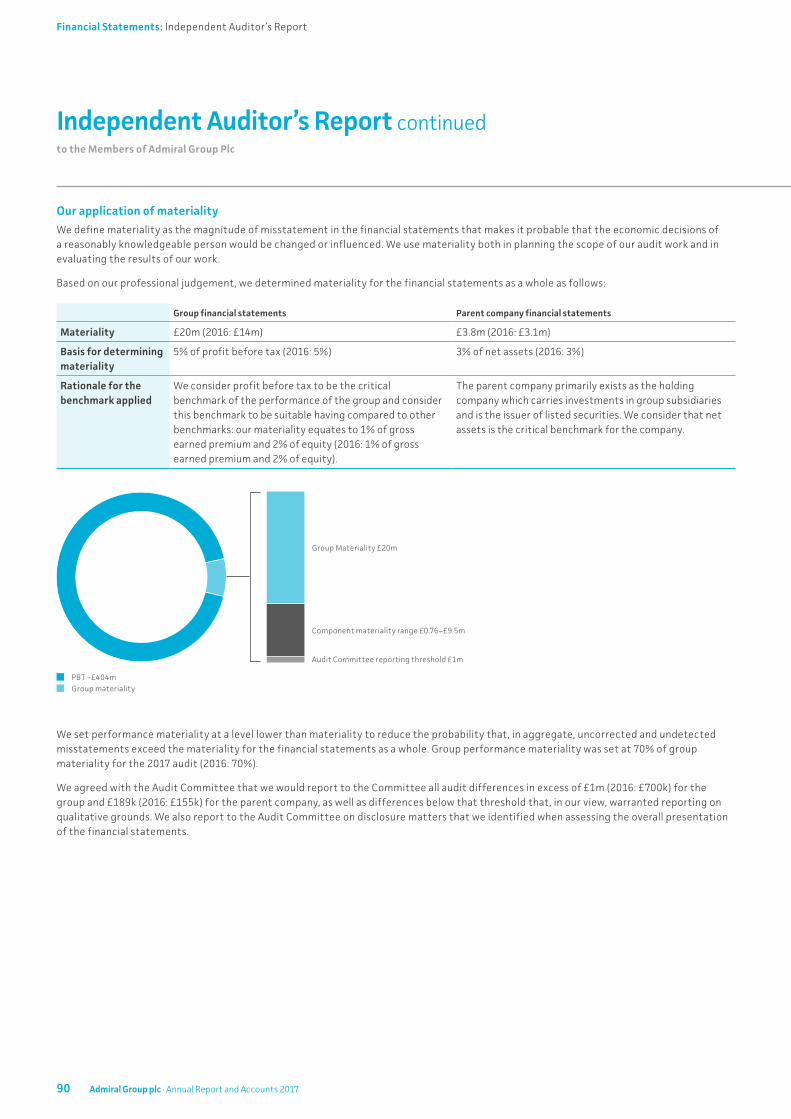
Our application of materiality
We define materiality as the magnitude of misstatement in the financial statements that makes it probable that the economic decisions of a reasonably knowledgeable person would be changed or influenced. We use materiality both in planning the scope of our audit work and in evaluating the results of our work.
Based on our professional judgement, we determined materiality for the financial statements as a whole as follows:
Group financial statements Parent company financial statements
Materiality £20m (2016: £14m) £3.8m (2016: £3.1m)
Basis for determining materiality
5% of profit before tax (2016: 5%) 3% of net assets (2016: 3%)
Rationale for the benchmark applied
We consider profit before tax to be the critical benchmark of the performance of the group and consider this benchmark to be suitable having compared to other benchmarks: our materiality equates to 1% of gross earned premium and 2% of equity (2016: 1% of gross earned premium and 2% of equity).
The parent company primarily exists as the holding company which carries investments in group subsidiaries and is the issuer of listed securities. We consider that net assets is the critical benchmark for the company.
to the Members of Admiral Group Plc
Independent Auditor’s Report continued
We set performance materiality at a level lower than materiality to reduce the probability that, in aggregate, uncorrected and undetected misstatements exceed the materiality for the financial statements as a whole. Group performance materiality was set at 70% of group materiality for the 2017 audit (2016: 70%).
We agreed with the Audit Committee that we would report to the Committee all audit differences in excess of £1m (2016: £700k) for the group and £189k (2016: £155k) for the parent company, as well as differences below that threshold that, in our view, warranted reporting on qualitative grounds. We also report to the Audit Committee on disclosure matters that we identified when assessing the overall presentation of the financial statements.
PBT –£404m
Group Materiality £20m
Component materiality range £0.76–£9.5m
Audit Committee reporting threshold £1m
Group materiality
90 Admiral Group plc · Annual Report and Accounts 2017
Financial Statements: Independent Auditor’s Report
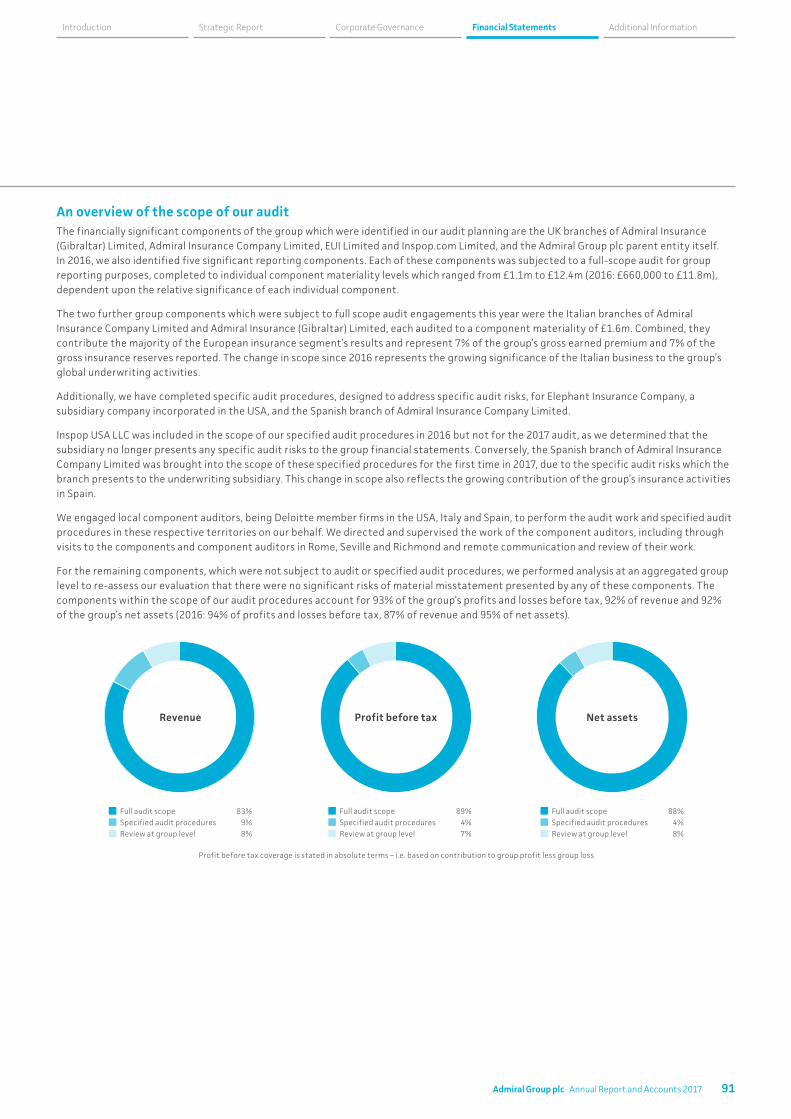
An overview of the scope of our auditThe financially significant components of the group which were identified in our audit planning are the UK branches of Admiral Insurance (Gibraltar) Limited, Admiral Insurance Company Limited, EUI Limited and Inspop.com Limited, and the Admiral Group plc parent entity itself. In 2016, we also identified five significant reporting components. Each of these components was subjected to a full-scope audit for group reporting purposes, completed to individual component materiality levels which ranged from £1.1m to £12.4m (2016: £660,000 to £11.8m), dependent upon the relative significance of each individual component.
The two further group components which were subject to full scope audit engagements this year were the Italian branches of Admiral Insurance Company Limited and Admiral Insurance (Gibraltar) Limited, each audited to a component materiality of £1.6m. Combined, they contribute the majority of the European insurance segment’s results and represent 7% of the group’s gross earned premium and 7% of the gross insurance reserves reported. The change in scope since 2016 represents the growing significance of the Italian business to the group’s global underwriting activities.
Additionally, we have completed specific audit procedures, designed to address specific audit risks, for Elephant Insurance Company, a subsidiary company incorporated in the USA, and the Spanish branch of Admiral Insurance Company Limited.
Inspop USA LLC was included in the scope of our specified audit procedures in 2016 but not for the 2017 audit, as we determined that the subsidiary no longer presents any specific audit risks to the group financial statements. Conversely, the Spanish branch of Admiral Insurance Company Limited was brought into the scope of these specified procedures for the first time in 2017, due to the specific audit risks which the branch presents to the underwriting subsidiary. This change in scope also reflects the growing contribution of the group’s insurance activities in Spain.
We engaged local component auditors, being Deloitte member firms in the USA, Italy and Spain, to perform the audit work and specified audit procedures in these respective territories on our behalf. We directed and supervised the work of the component auditors, including through visits to the components and component auditors in Rome, Seville and Richmond and remote communication and review of their work.
For the remaining components, which were not subject to audit or specified audit procedures, we performed analysis at an aggregated group level to re-assess our evaluation that there were no significant risks of material misstatement presented by any of these components. The components within the scope of our audit procedures account for 93% of the group’s profits and losses before tax, 92% of revenue and 92% of the group’s net assets (2016: 94% of profits and losses before tax, 87% of revenue and 95% of net assets).
Revenue
Full audit scope 83% Full audit scope 89% Full audit scope 88%Specified audit procedures 9% Specified audit procedures 4% Specified audit procedures 4%Review at group level 8% Review at group level 7% Review at group level 8%
Profit before tax Net assets
Profit before tax coverage is stated in absolute terms – i.e. based on contribution to group profit less group loss
91Admiral Group plc · Annual Report and Accounts 2017
Financial Statements Additional InformationCorporate GovernanceStrategic ReportIntroduction
Other information
The directors are responsible for the other information. The other information comprises the information included in the annual report other than the financial statements and our auditor’s report thereon.
Our opinion on the financial statements does not cover the other information and, except to the extent otherwise explicitly stated in our report, we do not express any form of assurance conclusion thereon.
In connection with our audit of the financial statements, our responsibility is to read the other information and, in doing so, consider whether the other information is materially inconsistent with the financial statements or our knowledge obtained in the audit or otherwise appears to be materially misstated.
If we identify such material inconsistencies or apparent material misstatements, we are required to determine whether there is a material misstatement in the financial statements or a material misstatement of the other information. If, based on the work we have performed, we conclude that there is a material misstatement of this other information, we are required to report that fact.
In this context, matters that we are specifically required to report to you as uncorrected material misstatements of the other information include where we conclude that:
• Fair, balanced and understandable – the statement given by the directors that they consider the annual report and financial statements taken as a whole is fair, balanced and understandable and provides the information necessary for shareholders to assess the group’s position and performance, business model and strategy, is materially inconsistent with our knowledge obtained in the audit; or
• Audit committee reporting – the section describing the work of the audit committee does not appropriately address matters communicated by us to the audit committee; or
• Directors’ statement of compliance with the UK Corporate Governance Code – the parts of the directors’ statement required under the Listing Rules relating to the company’s compliance with the UK Corporate Governance Code containing provisions specified for review by the auditor in accordance with Listing Rule 9.8.10R(2) do not properly disclose a departure from a relevant provision of the UK Corporate Governance Code.
We have nothing to report in respect of these matters
Responsibilities of directors
As explained more fully in the directors’ responsibilities statement, the directors are responsible for the preparation of the financial statements and for being satisfied that they give a true and fair view, and for such internal control as the directors determine is necessary to enable the preparation of financial statements that are free from material misstatement, whether due to fraud or error.
In preparing the financial statements, the directors are responsible for assessing the group’s and the parent company’s ability to continue as a going concern, disclosing as applicable, matters related to going concern and using the going concern basis of accounting unless the directors either intend to liquidate the group or the parent company or to cease operations, or have no realistic alternative but to do so.
Auditor’s responsibilities for the audit of the financial statements
Our objectives are to obtain reasonable assurance about whether the financial statements as a whole are free from material misstatement, whether due to fraud or error, and to issue an auditor’s report that includes our opinion. Reasonable assurance is a high level of assurance, but is not a guarantee that an audit conducted in accordance with ISAs (UK) will always detect a material misstatement when it exists. Misstatements can arise from fraud or error and are considered material if, individually or in the aggregate, they could reasonably be expected to influence the economic decisions of users taken on the basis of these financial statements.
A further description of our responsibilities for the audit of the financial statements is located on the Financial Reporting Council’s website at: www.frc.org.uk/auditorsresponsibilities. This description forms part of our auditor’s report.
Use of our report
This report is made solely to the company’s members, as a body, in accordance with Chapter 3 of Part 16 of the Companies Act 2006. Our audit work has been undertaken so that we might state to the company’s members those matters we are required to state to them in an auditor’s report and for no other purpose. To the fullest extent permitted by law, we do not accept or assume responsibility to anyone other than the company and the company’s members as a body, for our audit work, for this report, or for the opinions we have formed.
to the Members of Admiral Group Plc
Independent Auditor’s Report continued
92 Admiral Group plc · Annual Report and Accounts 2017
Financial Statements: Independent Auditor’s Report
Report on other legal and regulatory requirementsOpinions on other matters prescribed by the Companies Act 2006
In our opinion the part of the directors’ remuneration report to be audited has been properly prepared in accordance with the Companies Act 2006.
In our opinion, based on the work undertaken in the course of the audit:
• the information given in the strategic report and the directors’ report for the financial year for which the financial statements are prepared is consistent with the financial statements; and
• the strategic report and the directors’ report have been prepared in accordance with applicable legal requirements.
In the light of the knowledge and understanding of the group and of the parent company and their environment obtained in the course of the audit, we have not identified any material misstatements in the strategic report or the directors’ report.
Matters on which we are required to report by exception
Adequacy of explanations received and accounting records Under the Companies Act 2006 we are required to report to you if, in our opinion:
• we have not received all the information and explanations we require for our audit; or
• adequate accounting records have not been kept by the parent company, or returns adequate for our audit have not been received from branches not visited by us; or
• the parent company financial statements are not in agreement with the accounting records and returns.
We have nothing to report in respect of these matters.
Directors’ remuneration Under the Companies Act 2006 we are also required to report if in our opinion certain disclosures of directors’ remuneration have not been made or the part of the directors’ remuneration report to be audited is not in agreement with the accounting records and returns.
We have nothing to report in respect of these matters.
Other matters
Auditor tenure
Following the recommendation of the audit committee, we were appointed by shareholders’ approval at the Annual General Meeting on 28 April 2016 to audit the financial statements for the year ending 31 December 2016 and subsequent financial periods. The period of total uninterrupted engagement including previous renewals and reappointments of the firm is 2 years, covering the years ending 31 December 2016 to 31 December 2017.
Consistency of the audit report with the additional report to the audit committee
Our audit opinion is consistent with the additional report to the audit committee we are required to provide in accordance with ISAs (UK).
Mark McQueen ACA (Senior statutory auditor)
For and on behalf of Deloitte LLP
Statutory Auditor London, United Kingdom
27 February 2018
93Admiral Group plc · Annual Report and Accounts 2017
Financial Statements Additional InformationCorporate GovernanceStrategic ReportIntroduction
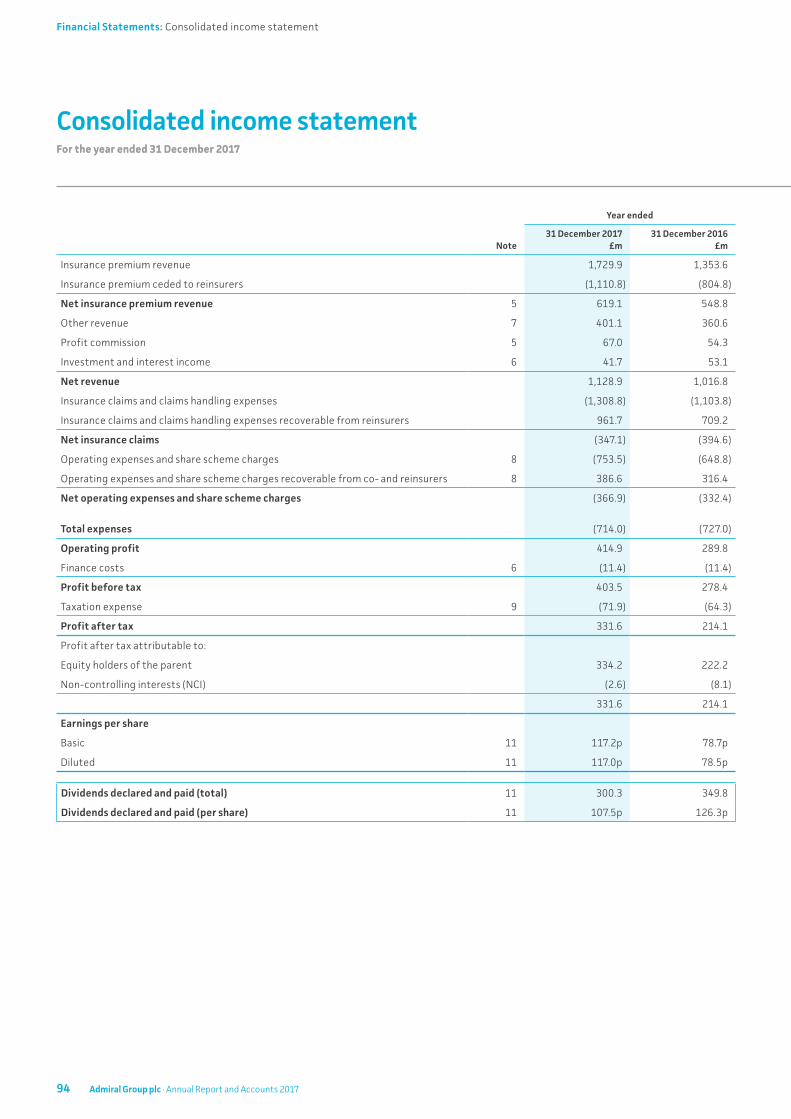
For the year ended 31 December 2017
Consolidated income statementFor the year ended 31 December 2017
Note
Year ended
31 December 2017 £m
31 December 2016 £m
Insurance premium revenue 1,729.9 1,353.6
Insurance premium ceded to reinsurers (1,110.8) (804.8)
Net insurance premium revenue 5 619.1 548.8
Other revenue 7 401.1 360.6
Profit commission 5 67.0 54.3
Investment and interest income 6 41.7 53.1
Net revenue 1,128.9 1,016.8
Insurance claims and claims handling expenses (1,308.8) (1,103.8)
Insurance claims and claims handling expenses recoverable from reinsurers 961.7 709.2
Net insurance claims (347.1) (394.6)
Operating expenses and share scheme charges 8 (753.5) (648.8)
Operating expenses and share scheme charges recoverable from co- and reinsurers 8 386.6 316.4
Net operating expenses and share scheme charges (366.9) (332.4)
Total expenses (714.0) (727.0)
Operating profit 414.9 289.8
Finance costs 6 (11.4) (11.4)
Profit before tax 403.5 278.4
Taxation expense 9 (71.9) (64.3)
Profit after tax 331.6 214.1
Profit after tax attributable to:
Equity holders of the parent 334.2 222.2
Non-controlling interests (NCI) (2.6) (8.1)
331.6 214.1
Earnings per share
Basic 11 117.2p 78.7p
Diluted 11 117.0p 78.5p
Dividends declared and paid (total) 11 300.3 349.8
Dividends declared and paid (per share) 11 107.5p 126.3p
94 Admiral Group plc · Annual Report and Accounts 2017
Financial Statements: Consolidated income statement

Consolidated statement of comprehensive incomeFor the year ended 31 December 2017
Year ended
31 December 2017 £m
31 December 2016 £m
Profit for the period 331.6 214.1
Other comprehensive income
Items that are or may be reclassified to profit or loss
Movements in fair value reserve 12.4 30.3
Deferred tax charge in relation to movement in fair value reserve (4.1) (0.5)
Exchange differences on translation of foreign operations (8.0) 21.2
Other comprehensive income for the period, net of income tax 0.3 51.0
Total comprehensive income for the period 331.9 265.1
Total comprehensive income for the period attributable to:
Equity holders of the parent 334.8 271.3
Non-controlling interests (2.9) (6.2)
331.9 265.1
95Admiral Group plc · Annual Report and Accounts 2017
Financial Statements Additional InformationCorporate GovernanceStrategic ReportIntroduction
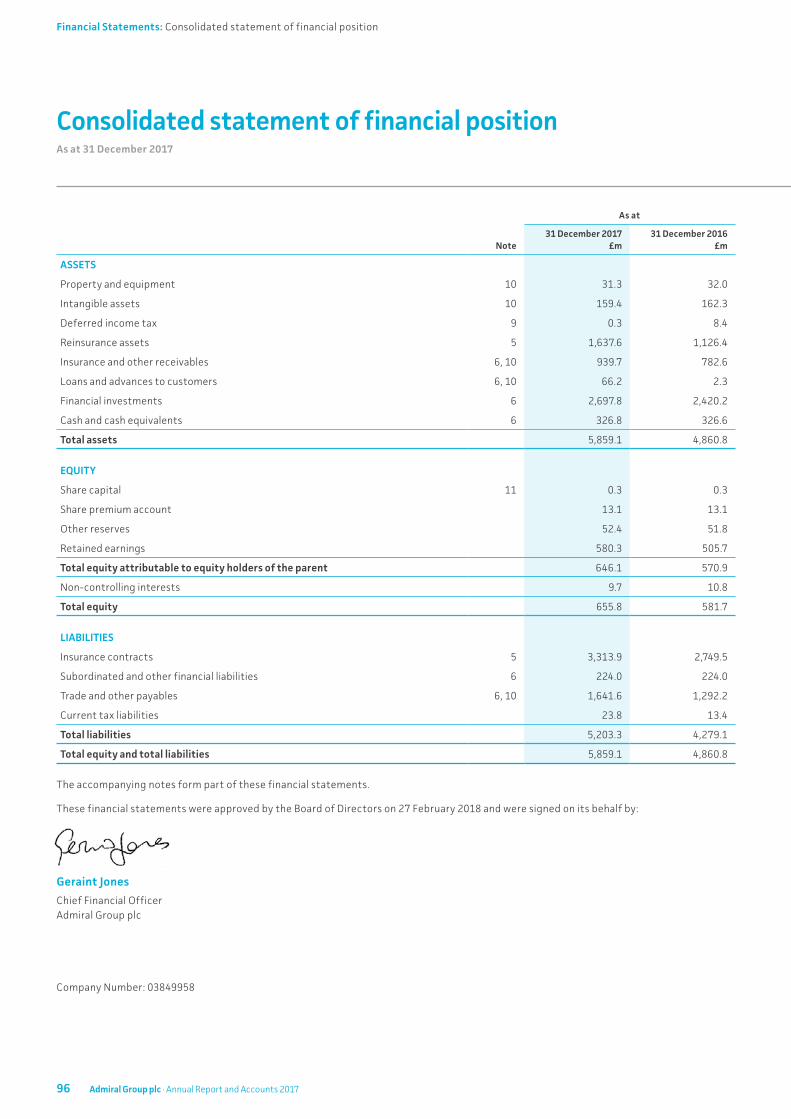
As at 31 December 2017
Consolidated statement of financial position
Note
As at
31 December 2017 £m
31 December 2016 £m
ASSETS
Property and equipment 10 31.3 32.0
Intangible assets 10 159.4 162.3
Deferred income tax 9 0.3 8.4
Reinsurance assets 5 1,637.6 1,126.4
Insurance and other receivables 6, 10 939.7 782.6
Loans and advances to customers 6, 10 66.2 2.3
Financial investments 6 2,697.8 2,420.2
Cash and cash equivalents 6 326.8 326.6
Total assets 5,859.1 4,860.8
EQUITY
Share capital 11 0.3 0.3
Share premium account 13.1 13.1
Other reserves 52.4 51.8
Retained earnings 580.3 505.7
Total equity attributable to equity holders of the parent 646.1 570.9
Non-controlling interests 9.7 10.8
Total equity 655.8 581.7
LIABILITIES
Insurance contracts 5 3,313.9 2,749.5
Subordinated and other financial liabilities 6 224.0 224.0
Trade and other payables 6, 10 1,641.6 1,292.2
Current tax liabilities 23.8 13.4
Total liabilities 5,203.3 4,279.1
Total equity and total liabilities 5,859.1 4,860.8
The accompanying notes form part of these financial statements.
These financial statements were approved by the Board of Directors on 27 February 2018 and were signed on its behalf by:
Geraint Jones
Chief Financial Officer Admiral Group plc
Company Number: 03849958
96 Admiral Group plc · Annual Report and Accounts 2017
Financial Statements: Consolidated statement of financial position
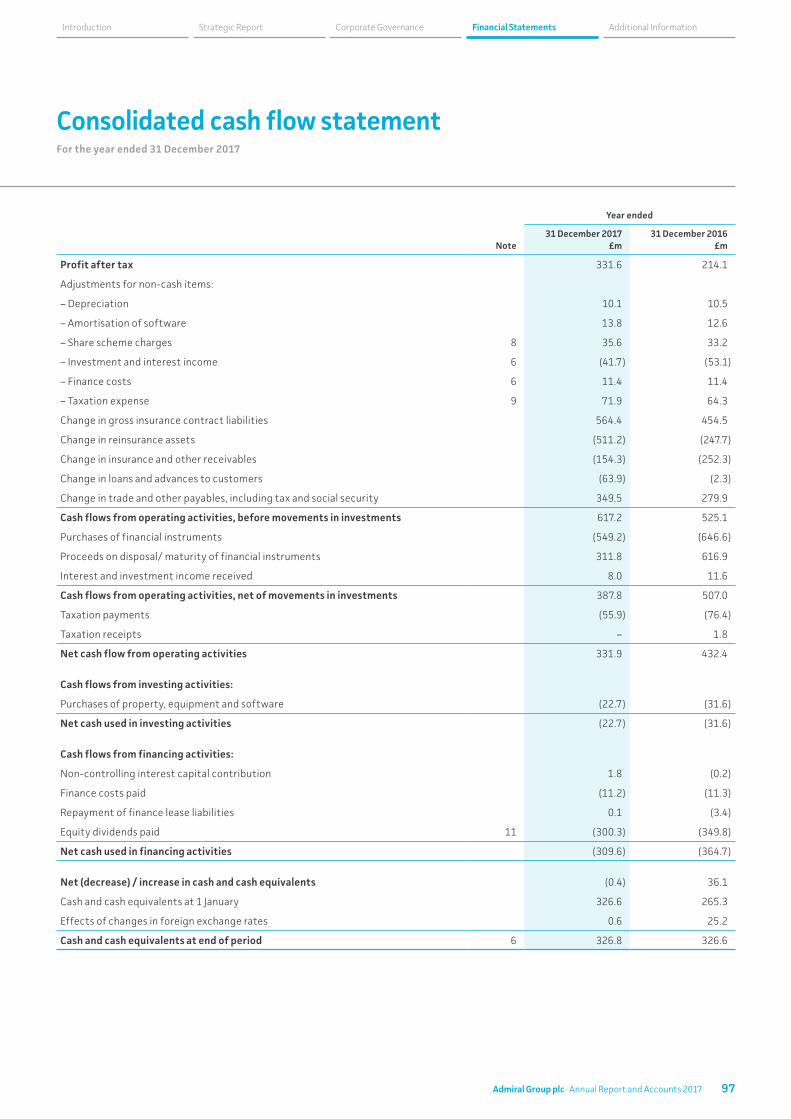
For the year ended 31 December 2017
Consolidated cash flow statement
Note
Year ended
31 December 2017 £m
31 December 2016 £m
Profit after tax 331.6 214.1
Adjustments for non-cash items:
– Depreciation 10.1 10.5
– Amortisation of software 13.8 12.6
– Share scheme charges 8 35.6 33.2
– Investment and interest income 6 (41.7) (53.1)
– Finance costs 6 11.4 11.4
– Taxation expense 9 71.9 64.3
Change in gross insurance contract liabilities 564.4 454.5
Change in reinsurance assets (511.2) (247.7)
Change in insurance and other receivables (154.3) (252.3)
Change in loans and advances to customers (63.9) (2.3)
Change in trade and other payables, including tax and social security 349.5 279.9
Cash flows from operating activities, before movements in investments 617.2 525.1
Purchases of financial instruments (549.2) (646.6)
Proceeds on disposal/ maturity of financial instruments 311.8 616.9
Interest and investment income received 8.0 11.6
Cash flows from operating activities, net of movements in investments 387.8 507.0
Taxation payments (55.9) (76.4)
Taxation receipts – 1.8
Net cash flow from operating activities 331.9 432.4
Cash flows from investing activities:
Purchases of property, equipment and software (22.7) (31.6)
Net cash used in investing activities (22.7) (31.6)
Cash flows from financing activities:
Non-controlling interest capital contribution 1.8 (0.2)
Finance costs paid (11.2) (11.3)
Repayment of finance lease liabilities 0.1 (3.4)
Equity dividends paid 11 (300.3) (349.8)
Net cash used in financing activities (309.6) (364.7)
Net (decrease) / increase in cash and cash equivalents (0.4) 36.1
Cash and cash equivalents at 1 January 326.6 265.3
Effects of changes in foreign exchange rates 0.6 25.2
Cash and cash equivalents at end of period 6 326.8 326.6
97Admiral Group plc · Annual Report and Accounts 2017
Financial Statements Additional InformationCorporate GovernanceStrategic ReportIntroduction
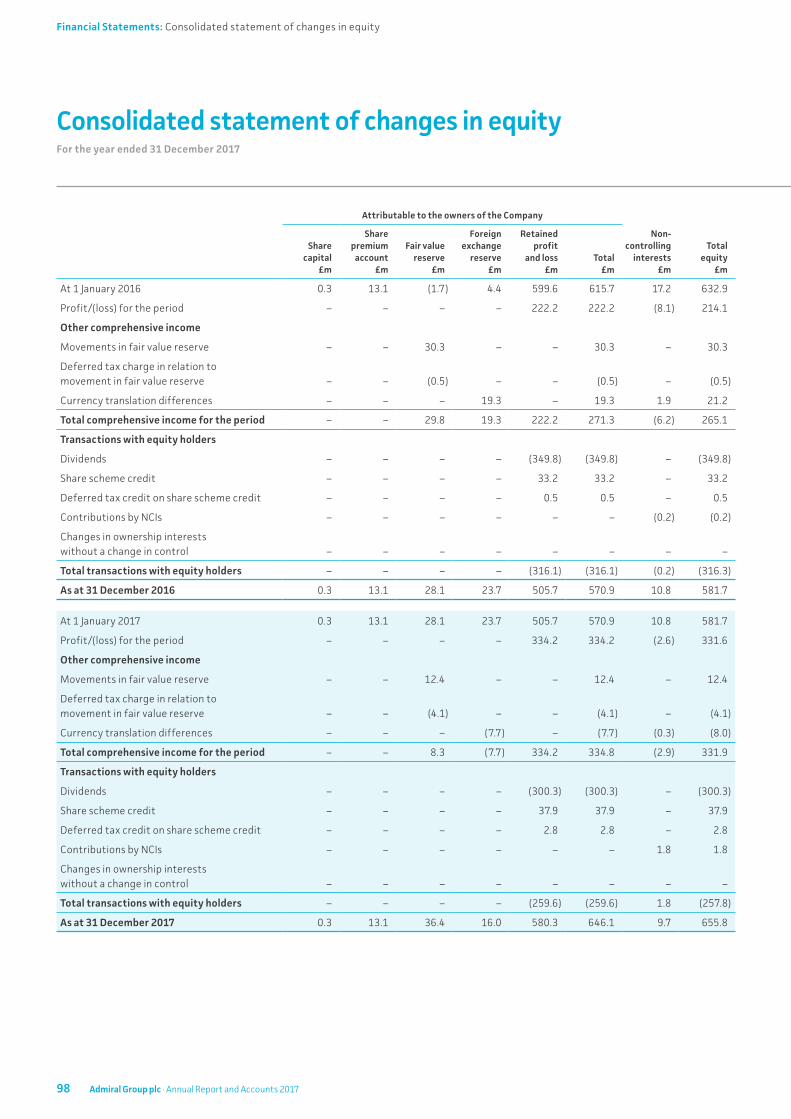
For the year ended 31 December 2017
Consolidated statement of changes in equity
Attributable to the owners of the Company
Non-controlling
interests £m
Total equity
£m
Share capital
£m
Share premium
account £m
Fair value reserve
£m
Foreign exchange
reserve £m
Retained profit
and loss £m
Total £m
At 1 January 2016 0.3 13.1 (1.7) 4.4 599.6 615.7 17.2 632.9
Profit/(loss) for the period – – – – 222.2 222.2 (8.1) 214.1
Other comprehensive income
Movements in fair value reserve – – 30.3 – – 30.3 – 30.3
Deferred tax charge in relation to movement in fair value reserve – – (0.5) – – (0.5) – (0.5)
Currency translation differences – – – 19.3 – 19.3 1.9 21.2
Total comprehensive income for the period – – 29.8 19.3 222.2 271.3 (6.2) 265.1
Transactions with equity holders
Dividends – – – – (349.8) (349.8) – (349.8)
Share scheme credit – – – – 33.2 33.2 – 33.2
Deferred tax credit on share scheme credit – – – – 0.5 0.5 – 0.5
Contributions by NCIs – – – – – – (0.2) (0.2)
Changes in ownership interests without a change in control – – – – – – – –
Total transactions with equity holders – – – – (316.1) (316.1) (0.2) (316.3)
As at 31 December 2016 0.3 13.1 28.1 23.7 505.7 570.9 10.8 581.7
At 1 January 2017 0.3 13.1 28.1 23.7 505.7 570.9 10.8 581.7
Profit/(loss) for the period – – – – 334.2 334.2 (2.6) 331.6
Other comprehensive income
Movements in fair value reserve – – 12.4 – – 12.4 – 12.4
Deferred tax charge in relation to movement in fair value reserve – – (4.1) – – (4.1) – (4.1)
Currency translation differences – – – (7.7) – (7.7) (0.3) (8.0)
Total comprehensive income for the period – – 8.3 (7.7) 334.2 334.8 (2.9) 331.9
Transactions with equity holders
Dividends – – – – (300.3) (300.3) – (300.3)
Share scheme credit – – – – 37.9 37.9 – 37.9
Deferred tax credit on share scheme credit – – – – 2.8 2.8 – 2.8
Contributions by NCIs – – – – – – 1.8 1.8
Changes in ownership interests without a change in control – – – – – – – –
Total transactions with equity holders – – – – (259.6) (259.6) 1.8 (257.8)
As at 31 December 2017 0.3 13.1 36.4 16.0 580.3 646.1 9.7 655.8
98 Admiral Group plc · Annual Report and Accounts 2017
Financial Statements: Consolidated statement of changes in equity
For the year ended 31 December 2017
Notes to the financial statements
1. General informationAdmiral Group plc is a company incorporated in England and Wales. Its registered office is at Tŷ Admiral, David Street, Cardiff, CF10 2EH and its shares are listed on the London Stock Exchange.
The consolidated financial statements have been prepared and approved by the Directors in accordance with International Financial Reporting Standards (IFRS) as adopted by the European Union (EU). The Company has elected to prepare its Parent Company financial statements in accordance with Financial Reporting Standard 101 Reduced Disclosure Framework (FRS 101).
Adoption of new and revised standards
The Group has adopted the following IFRSs and interpretations during the year, which have been issued and endorsed by the EU:
• Amendments to IAS 7 (Disclosure Initiative) and IAS 12 (Recognition of Deferred Tax Assets for Unrealised Losses).
The application of these amendments has not had a material impact on the Group’s results, financial position and cash flows.
As at 31 December 2017, the following standards had been endorsed by the EU but are not yet effective:
• IFRS 9 Financial Instruments (effective date 1 January 2018), along with Amendments to IFRS 4 Applying IFRS 9 Financial Instruments with IFRS 4 Insurance Contracts;
• IFRS 15 Revenue from Contracts with Customers (effective date 1 January 2018);
• IFRS 16 Leases (effective date 1 January 2019).
IFRS 9 – Financial Instruments
In 2014, the IASB issued the final version of IFRS 9. The standard has an effective date of 1 January 2018 although earlier application is permitted. The standard affects a number of areas within the accounts including the classification and measurement of financial instruments, and a requirement to use the expected loss impairment model.
In 2017 the Group conducted an assessment of the impact of IFRS 9 and based on current information expects no significant impact on its balance sheet and equity, with the significant classes of financial assets being accounted for using the same measurement and valuation techniques as those currently used.
There is an impact of applying the expected loss model for the first time, with the application of IFRS 9 resulting in earlier impairment charges and the potential for increased volatility. This impact has been assessed and is currently immaterial, at less than £0.5 million as at 31 December 2017.
The Group plans to adopt IFRS 9 as of 1 January 2018, in line with its effective date.
IFRS 15 – Revenue from Contracts with Customers
IFRS 15 was issued during 2014, with clarifications to the standard endorsed on 31 October 2017, and will be effective for Admiral on 1 January 2018. The standard introduces a simple, five step principles-based model to be applied to the accounting of all contracts with customers. Revenue from insurance contracts and financial instruments is outside the scope of IFRS 15.
During 2017, the Group performed an assessment of the impact of the standard on its revenue streams, quantifying this impact on its results, financial position and cash-flows. The primary area of focus of this work was the other revenue generated by a portfolio of products that supplement the core car and household insurance policies and revenue generated by the Group’s price comparison businesses, where the new standard could potentially result in a delay in revenue recognition. Management’s assessment, based on the work performed, is that the implementation of the standard is not expected to have a material impact on the Group’s financial statements, with the majority of material revenue classes not being impacted.
The Group is planning on using the modified retrospective approach on transition, which will result in a cumulative adjustment to retained earnings as at 1 January 2018. The impact on the Consolidated income statement in future periods is expected to be immaterial.
IFRS 16 – Leases
IFRS 16 Leases was issued in early 2016 and is effective from 1 January 2019. The standard specifies how firms will recognise, measure, present and disclose leases. It presents a single lessee accounting model and requires that assets and liabilities to be recognised in the Consolidated statement of financial position, other than in the cases where leases are of low value or of a short-term nature of 12 months or less.
The Group expects to apply the modified retrospective approach to transition that is permitted under IFRS 16. Impact assessments performed to date conclude that:
– Property leases represent the most significant class of lease held by the Group that will be impacted by the new standard.
– No significant adjustment to IFRS equity is expected at the transition date of 1 January 2019.
– The presentation of the Consolidated statement of financial position is expected to be significantly impacted, with material lease liabilities and ‘Right of Use’ assets being included for the first time.
The profile of lease related expense recognised in the Consolidated income statement is not expected to change materially.
99Admiral Group plc · Annual Report and Accounts 2017
Financial Statements Additional InformationCorporate GovernanceStrategic ReportIntroduction
Notes to the Financial Statements continuedFor the year ended 31 December 2017
1. General information continuedStandards yet to be endorsed by the EU
There are a number of standards, amendments to standards and interpretations that were issued by 31 December 2017 but have either yet to be endorsed by the EU, or were endorsed shortly after the year end. The following IFRSs have been issued but have not been applied by the Group in these financial statements:
• IFRS 17 Insurance Contracts
• IFRIC 22 Foreign Currency Transactions and Advance Considerations
• IFRIC 23 Uncertainty over Income Tax Treatments
• Annual improvements to IFRS standard 2014–2016 cycle
• Amendments to IFRS 2 Classification and Measurement of Share-based payment transactions.
IFRS 17 – Insurance Contracts
IFRS 17 Insurance Contracts was issued in May 2017. The standard will replace IFRS 4, establishing new principles for the recognition, measurement, presentation and disclosure of Insurance contracts within the scope of the standard. The standard will apply to reporting periods beginning on or after 1 January 2021.
The Group is currently assessing the impact of IFRS 17 on its results and financial position, along with any impacts of the other standards and amendments which have yet to be endorsed.
2. Basis of preparationThe accounts have been prepared on a going concern basis. In considering this requirement, the Directors have taken into account the following:
• The Group’s projections for the next 12 months and beyond, in particular the profit forecasts, regulatory capital surpluses and levels and sources of liquidity.
• The risks included on the Group’s risk register that could impact on the Group’s financial performance, levels of liquidity and solvency over the next 12 months.
• The risks on the Group’s risk register that could be a threat to the Group’s business model and capital adequacy.
The Group’s business activities, together with the factors likely to affect its future development, performance and position are set out in the Strategic Report. The Strategic Report also includes the Group’s principal risks and uncertainties. In addition, the Governance report includes the Directors’ statement on the viability of the Group over a three year period.
Following consideration of the above, the Directors have reasonable expectation that the Group has adequate resources to continue in operation for the foreseeable future, a period not less than 12 months from the date of this report, and that it is therefore appropriate to adopt the going concern basis in preparing the financial statements.
Further information regarding the Company’s business activities, together with the factors likely to affect its future development, performance and position, is set out in the Strategic Report. Further information regarding the financial position of the Company, its cash flows, liquidity position and borrowing facilities are also described in the Strategic Report. In addition, notes 6 and 11 to the financial statements include the Company’s objectives, policies and processes for managing its capital; its financial risk management objectives; details of its financial instruments; and its exposures to credit risk and liquidity risk.
The accounting policies set out in the notes to the financial statements have, unless otherwise stated, been applied consistently to all periods presented in these Group financial statements.
The financial statements are prepared on the historical cost basis, except for the revaluation of financial assets classified as fair value through profit or loss or as available for sale. The Group and Company financial statements are presented in pounds sterling, rounded to the nearest £0.1 million.
Subsidiaries are entities controlled by the Group. The Group controls an entity when it is exposed to, or has rights to, variable returns from its involvement with the entity and has the ability to affect those returns through its power over the entity. In assessing control, the Group takes into consideration potential voting rights that are currently exercisable. The acquisition date is the date on which control is transferred to the acquirer. The financial statements of subsidiaries are included in the consolidated financial statements from the date that control commences until the date that control ceases. Losses applicable to the non-controlling interests in a subsidiary are allocated to the non-controlling interests even if doing so causes the non-controlling interests to have a deficit balance.
The preparation of financial statements in conformity with adopted IFRS requires management to make judgements, estimates and assumptions that affect the application of policies and reported amounts of assets and liabilities, income and expenses. The estimates and associated assumptions are based on historical experience and various other factors that are believed to be reasonable under the circumstances, the results of which form the basis of making the judgements about carrying values of assets and liabilities that are not readily apparent from other sources.
The estimates and underlying assumptions are reviewed on an ongoing basis. Revisions to accounting estimates are recognised in the year in which the estimate is reviewed. To the extent that a change in an accounting estimate gives rise to changes in assets and liabilities, it is recognised by adjusting the carrying amount of the related asset or liability in the period of the change.
100 Admiral Group plc · Annual Report and Accounts 2017
Financial Statements: Notes to the Financial Statements
3. Critical accounting judgements and estimatesJudgements
In applying the Group’s accounting policies as described in the notes to the financial statements, management has primarily applied judgement in the following area:
• Classification of the Group’s contracts with reinsurers as reinsurance contracts:
A contract is required to transfer significant insurance risk in order to be classified as such. Management reviews all terms and conditions of each such contract, and if necessary obtains the opinion of an independent expert at the negotiation stage in order to be able to make this judgement. All reinsurance contracts (both excess of loss and quota share contracts) held by the Group have been assessed and it has been concluded that all contracts transfer significant insurance risk and have therefore been classified and accounted for as reinsurance contracts within these financial statements.
In addition there are two further significant accounting estimates within the financial statements that also require management to apply judgement:
• Calculation of insurance claims reserves:
The Group’s reserving methodology requires management to set insurance claims reserves for the purpose of the financial statements, above the projected best estimate outcome, to allow for unforeseen adverse claims development. Management applies judgement in determining where, above the projected best estimate outcome, the insurance claims reserves should sit in line with the Group's reserving methodology. Refer to the section on estimation techniques below. Above the projected best estimate outcome the insurance claims reserves should sit, in line with the Group’s reserving methodology. Refer to the section on estimation techniques below, and the analysis of Insurance risk in note 5 to the financial statements for further detail on the development of the Group’s reserving methodology applied during the period and the calculation of the projected best estimate outcome.
• Recognition of deferred tax assets relating to unused tax losses:
Management applies judgement in determining the probability of future taxable profits of an entity against which to utilise accumulated losses in determining the recognition of deferred tax assets. In applying this judgement, management makes an assessment of the reliability of approved business plan projections using both qualitative and quantitative factors including the age and status of the business, the Group’s previous experience in similar markets, historic performance against business plans and the application of a number of stress and sensitivity tests to the projections.
Estimation techniques used in calculation of claims provisions and profit commission
Estimation techniques are used in the calculation of the provisions for claims outstanding, which represent a projection of the ultimate cost of settling claims that have occurred prior to the balance sheet date and remain unsettled at the balance sheet date.
The key area where these techniques are used relates to the ultimate cost of reported claims. A secondary area relates to the emergence of claims that occurred prior to the balance sheet date, but had not been reported at that date.
The estimates of the ultimate cost of reported claims are based on the setting of claim provisions on a case-by-case basis, for all but the simplest of claims.
The sum of these provisions is compared with projected ultimate costs using a variety of different projection techniques (including incurred and paid chain ladder and an average cost of claim approach) to allow an actuarial assessment of their potential outcome. They include allowance for unreported claims.
The most significant sensitivity in the use of the projection techniques arises from any future step change in claims costs, which would cause future claim cost inflation to deviate from historic trends. This is most likely to arise from a change in the regulatory or judicial regime that leads to an increase in awards or legal costs for bodily injury claims that is significantly above or below the historical trend.
The Group’s independent actuarial advisors project best estimate claims reserves using a variety of recognised actuarial techniques.
The Group’s reserving policy requires management to reserve above the projected best estimate outcome, to allow for unforeseen adverse claims development. The Group’s reserving methodology which determines the basis for setting this reserve estimate has been developed and enhanced in the period in line with new information that has become available in relation to both the projected best estimate reserve and the reserve uncertainty through the Group’s development of its internal capital model.
For further detail on objectives, policies and procedures for managing insurance risk, refer to note 5 of the financial statements.
Future changes in claims reserves also impact profit commission income, as the measurement of this income is dependent on the loss ratio booked in the financial statements, and cash receivable is dependent on actuarial projections of ultimate loss ratios.
101Admiral Group plc · Annual Report and Accounts 2017
Financial Statements Additional InformationCorporate GovernanceStrategic ReportIntroduction
Notes to the Financial Statements continuedFor the year ended 31 December 2017
4. Group consolidation and operating segments4a. Accounting policies
(i) Group consolidation
The consolidated financial statements comprise the results and balances of the Company and its subsidiaries (together referred to as the Group) for the year ended 31 December 2017 and comparative figures for the year ended 31 December 2016. The financial statements of the Company’s subsidiaries are consolidated in the Group financial statements. The Company controls 100% of the voting share capital of all its principal subsidiaries, except Admiral Law Limited, BDE Law Limited, Inspop USA LLC, the indirect holding in comparenow.com Insurance Agency LLC, Rastreator.com Limited, the indirect holding in Comparaseguros Correduría de Seguros, S.L., Sociedad Unipersonal, Preminen Price Comparison Holdings Limited and the indirect holding in Preminen Dragon Price Comparison Limited.
The Parent Company financial statements present information about the Company as a separate entity and not about its Group. In accordance with IAS 24, transactions or balances between Group companies that have been eliminated on consolidation are not reported as related party transactions in the consolidated financial statements.
(ii) Foreign currency translation
Items included in the financial statements of each of the Group’s entities are measured using the currency of the primary economic environment in which the entity operates (‘the functional currency’). The consolidated financial statements are presented in pounds sterling, rounded to the nearest £0.1 million, which is the Group’s presentation currency.
Foreign currency transactions are translated into the functional currency using the exchange rates prevailing at the dates of the transactions. Foreign exchange gains and losses resulting from the settlement of such transactions and from the translation at year end exchange rates of monetary assets and liabilities denominated in foreign currencies are recognised in the income statement.
Non-monetary items measured at cost are translated at their historic rate and non-monetary items held at fair value are translated using the foreign exchange rate on the date that the fair value was established.
The financial statements of foreign operations whose functional currency is not pounds sterling are translated into the Group presentation currency (sterling) as follows:
• Assets and liabilities for each balance sheet presented are translated at the closing rate at the date of that balance sheet.
• Income and expenses for each income statement are translated at average exchange rates (unless this average is not a reasonable approximation of the cumulative effect of the rates prevailing on the transaction dates, in which case income and expenses are translated at the date of the transaction).
• All resulting exchange differences are recognised in other comprehensive income and in a separate component of equity except to the extent that the translation differences are attributable to non-controlling interests.
On disposal of a foreign operation, the cumulative amount recognised in equity relating to that particular operation is recognised in the income statement.
4b. Segment reporting
The Group has four reportable segments, as described below. These segments represent the principal split of business that is regularly reported to the Group’s Board of Directors, which is considered to be the Group’s chief operating decision maker in line with IFRS 8 Operating Segments.
During the period, the Group launched a UK Van Insurance product that is included within the UK Insurance segment. The results from the Group’s commercial van broker Gladiator continue to be presented within the ‘Other’ segment.
UK Insurance
The segment consists of the underwriting of car insurance, van insurance, household insurance and other products that supplement these insurance policies within the UK. It also includes the generation of revenue from additional products and fees from underwriting insurance in the UK. The Directors consider the results of these activities to be reportable as one segment as the activities carried out in generating the revenue are not independent of each other and are performed as one business. This mirrors the approach taken in management reporting.
International Car Insurance
The segment consists of the underwriting of car insurance and the generation of revenue from additional products and fees from underwriting car insurance outside of the UK. It specifically covers the Group operations Admiral Seguros in Spain, ConTe in Italy, L’olivier – assurance auto in France and Elephant Auto in the US. None of these operations are reportable on an individual basis, based on the threshold requirements in IFRS 8.
Price Comparison
The segment relates to the Group’s price comparison businesses: Confused.com in the UK, Rastreator in Spain, LeLynx in France and Compare.com in the US. Each of the price comparison businesses are operating in individual geographical segments but are grouped into one reporting segment as Rastreator, LeLynx and Compare.com do not individually meet the threshold requirements in IFRS 8.
Other
The ‘Other’ segment is designed to be comprised of all other operating segments that do not meet the threshold requirements for individual reporting. It includes the Group’s commercial van insurance broker, Gladiator.
Taxes are not allocated across the segments and, as with the corporate activities, are included in the reconciliation to the Consolidated income statement and Consolidated statement of financial position.
An analysis of the Group’s revenue and results for the year ended 31 December 2017, by reportable segment, is shown below. The accounting policies of the reportable segments are consistent with those presented in the notes to the financial statements for the Group.
102 Admiral Group plc · Annual Report and Accounts 2017
Financial Statements: Notes to the Financial Statements
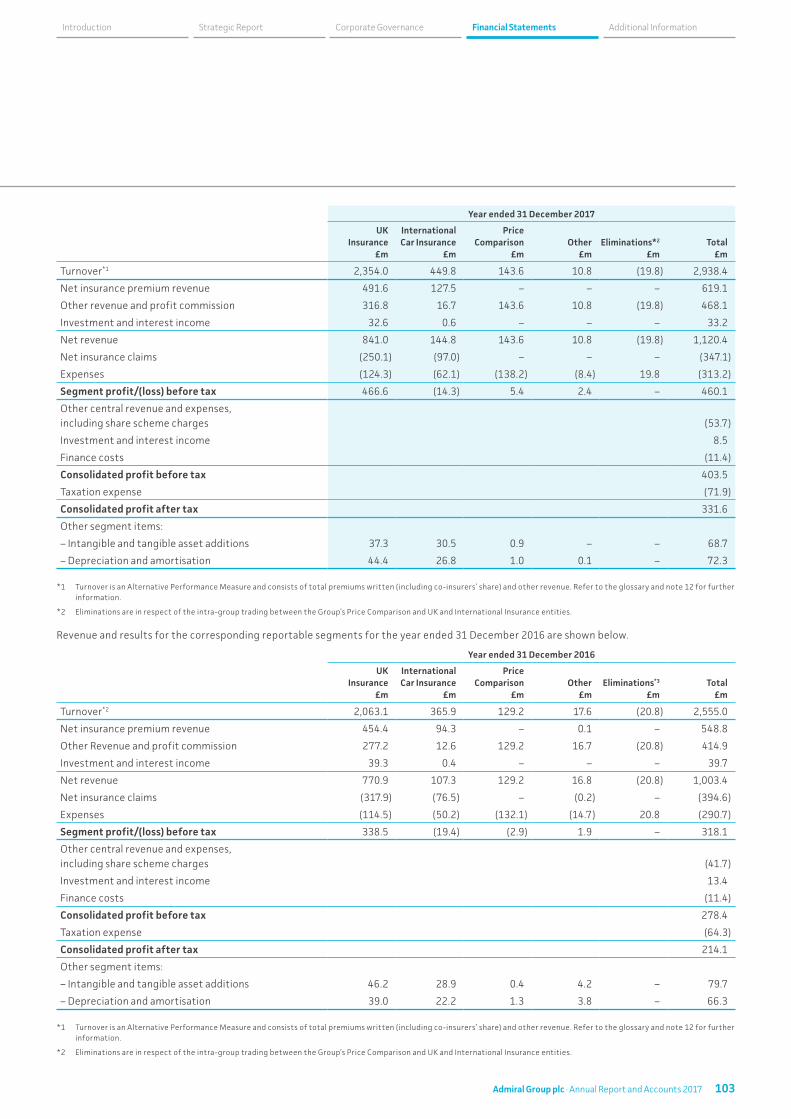
Year ended 31 December 2017
UK Insurance
£m
International Car Insurance
£m
Price Comparison
£mOther
£mEliminations*2
£mTotal
£m
Turnover*1 2,354.0 449.8 143.6 10.8 (19.8) 2,938.4
Net insurance premium revenue 491.6 127.5 – – – 619.1
Other revenue and profit commission 316.8 16.7 143.6 10.8 (19.8) 468.1
Investment and interest income 32.6 0.6 – – – 33.2
Net revenue 841.0 144.8 143.6 10.8 (19.8) 1,120.4
Net insurance claims (250.1) (97.0) – – – (347.1)
Expenses (124.3) (62.1) (138.2) (8.4) 19.8 (313.2)
Segment profit/(loss) before tax 466.6 (14.3) 5.4 2.4 – 460.1
Other central revenue and expenses, including share scheme charges (53.7)
Investment and interest income 8.5
Finance costs (11.4)
Consolidated profit before tax 403.5
Taxation expense (71.9)
Consolidated profit after tax 331.6
Other segment items:
– Intangible and tangible asset additions 37.3 30.5 0.9 – – 68.7
– Depreciation and amortisation 44.4 26.8 1.0 0.1 – 72.3
*1 Turnover is an Alternative Performance Measure and consists of total premiums written (including co-insurers’ share) and other revenue. Refer to the glossary and note 12 for further information.
*2 Eliminations are in respect of the intra-group trading between the Group’s Price Comparison and UK and International Insurance entities.
Revenue and results for the corresponding reportable segments for the year ended 31 December 2016 are shown below.
Year ended 31 December 2016
UK Insurance
£m
International Car Insurance
£m
Price Comparison
£mOther
£mEliminations*3
£mTotal
£m
Turnover*2 2,063.1 365.9 129.2 17.6 (20.8) 2,555.0
Net insurance premium revenue 454.4 94.3 – 0.1 – 548.8
Other Revenue and profit commission 277.2 12.6 129.2 16.7 (20.8) 414.9
Investment and interest income 39.3 0.4 – – – 39.7
Net revenue 770.9 107.3 129.2 16.8 (20.8) 1,003.4
Net insurance claims (317.9) (76.5) – (0.2) – (394.6)
Expenses (114.5) (50.2) (132.1) (14.7) 20.8 (290.7)
Segment profit/(loss) before tax 338.5 (19.4) (2.9) 1.9 – 318.1
Other central revenue and expenses, including share scheme charges (41.7)
Investment and interest income 13.4
Finance costs (11.4)
Consolidated profit before tax 278.4
Taxation expense (64.3)
Consolidated profit after tax 214.1
Other segment items:
– Intangible and tangible asset additions 46.2 28.9 0.4 4.2 – 79.7
– Depreciation and amortisation 39.0 22.2 1.3 3.8 – 66.3
*1 Turnover is an Alternative Performance Measure and consists of total premiums written (including co-insurers’ share) and other revenue. Refer to the glossary and note 12 for further information.
*2 Eliminations are in respect of the intra-group trading between the Group’s Price Comparison and UK and International Insurance entities.
103Admiral Group plc · Annual Report and Accounts 2017
Financial Statements Additional InformationCorporate GovernanceStrategic ReportIntroduction
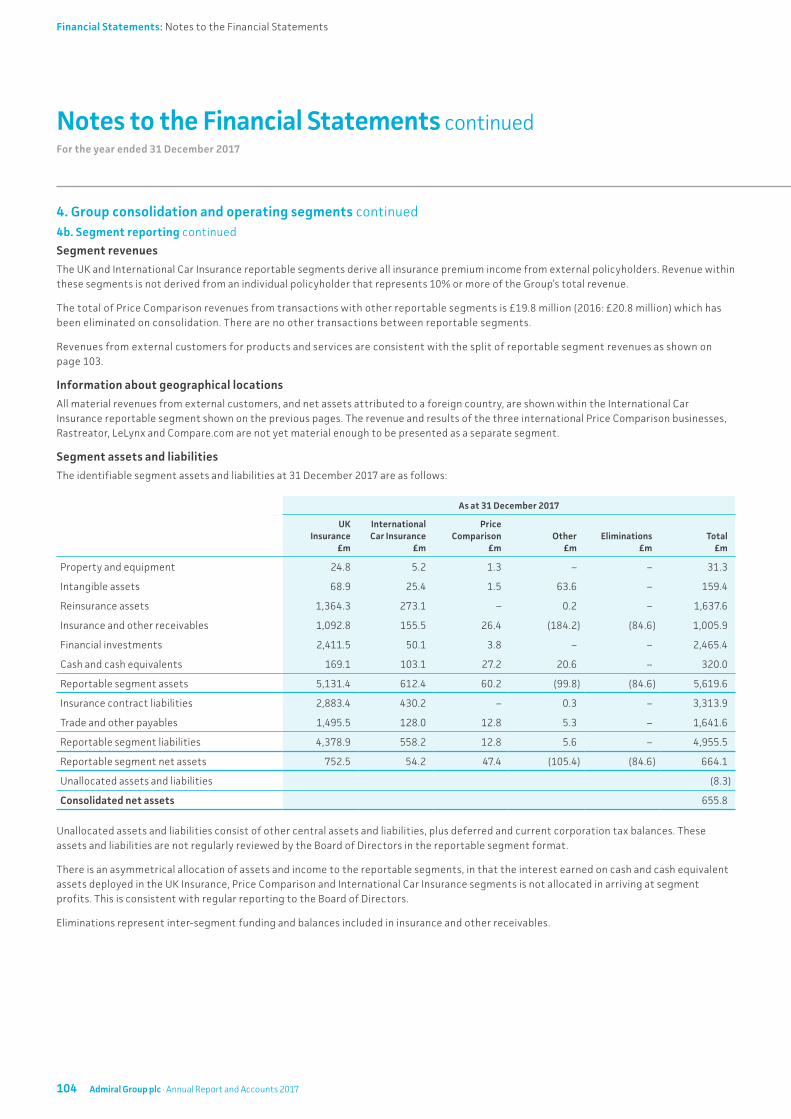
Notes to the Financial Statements continuedFor the year ended 31 December 2017
4. Group consolidation and operating segments continued4b. Segment reporting continued
Segment revenues
The UK and International Car Insurance reportable segments derive all insurance premium income from external policyholders. Revenue within these segments is not derived from an individual policyholder that represents 10% or more of the Group’s total revenue.
The total of Price Comparison revenues from transactions with other reportable segments is £19.8 million (2016: £20.8 million) which has been eliminated on consolidation. There are no other transactions between reportable segments.
Revenues from external customers for products and services are consistent with the split of reportable segment revenues as shown on page 103.
Information about geographical locations
All material revenues from external customers, and net assets attributed to a foreign country, are shown within the International Car Insurance reportable segment shown on the previous pages. The revenue and results of the three international Price Comparison businesses, Rastreator, LeLynx and Compare.com are not yet material enough to be presented as a separate segment.
Segment assets and liabilities
The identifiable segment assets and liabilities at 31 December 2017 are as follows:
As at 31 December 2017
UK Insurance
£m
International Car Insurance
£m
Price Comparison
£mOther
£mEliminations
£mTotal
£m
Property and equipment 24.8 5.2 1.3 – – 31.3
Intangible assets 68.9 25.4 1.5 63.6 – 159.4
Reinsurance assets 1,364.3 273.1 – 0.2 – 1,637.6
Insurance and other receivables 1,092.8 155.5 26.4 (184.2) (84.6) 1,005.9
Financial investments 2,411.5 50.1 3.8 – – 2,465.4
Cash and cash equivalents 169.1 103.1 27.2 20.6 – 320.0
Reportable segment assets 5,131.4 612.4 60.2 (99.8) (84.6) 5,619.6
Insurance contract liabilities 2,883.4 430.2 – 0.3 – 3,313.9
Trade and other payables 1,495.5 128.0 12.8 5.3 – 1,641.6
Reportable segment liabilities 4,378.9 558.2 12.8 5.6 – 4,955.5
Reportable segment net assets 752.5 54.2 47.4 (105.4) (84.6) 664.1
Unallocated assets and liabilities (8.3)
Consolidated net assets 655.8
Unallocated assets and liabilities consist of other central assets and liabilities, plus deferred and current corporation tax balances. These assets and liabilities are not regularly reviewed by the Board of Directors in the reportable segment format.
There is an asymmetrical allocation of assets and income to the reportable segments, in that the interest earned on cash and cash equivalent assets deployed in the UK Insurance, Price Comparison and International Car Insurance segments is not allocated in arriving at segment profits. This is consistent with regular reporting to the Board of Directors.
Eliminations represent inter-segment funding and balances included in insurance and other receivables.
104 Admiral Group plc · Annual Report and Accounts 2017
Financial Statements: Notes to the Financial Statements
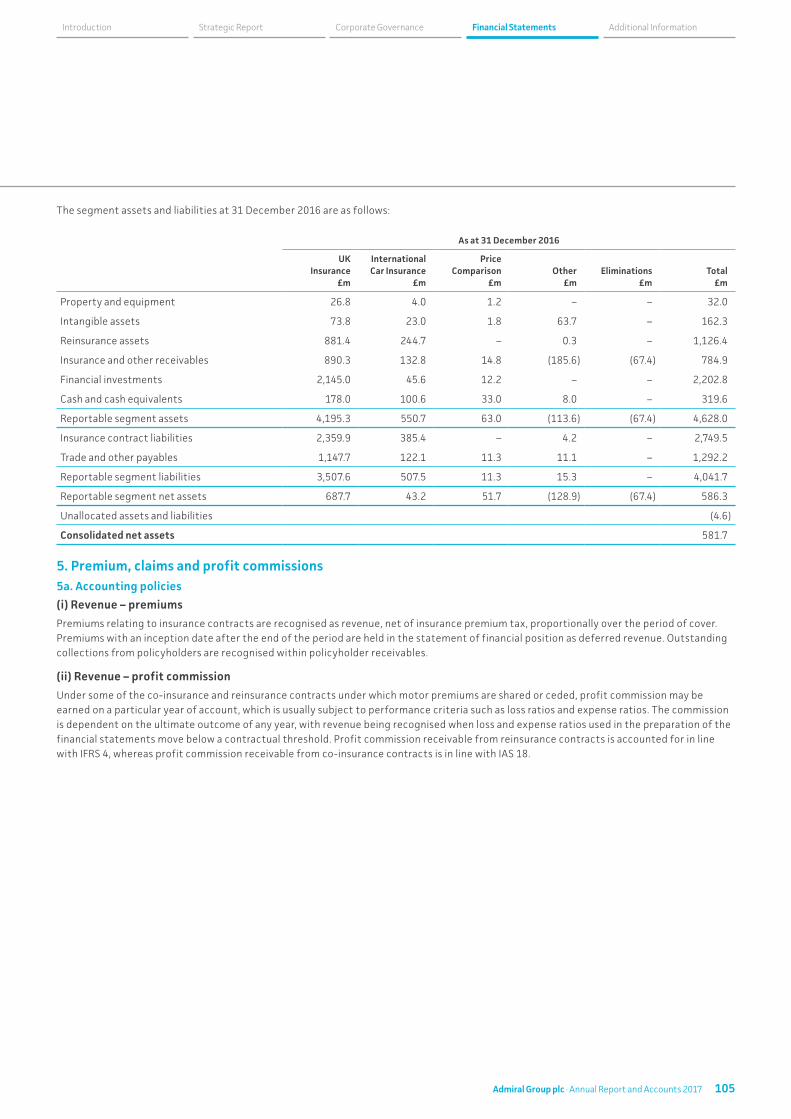
The segment assets and liabilities at 31 December 2016 are as follows:
As at 31 December 2016
UK Insurance
£m
International Car Insurance
£m
Price Comparison
£mOther
£mEliminations
£mTotal
£m
Property and equipment 26.8 4.0 1.2 – – 32.0
Intangible assets 73.8 23.0 1.8 63.7 – 162.3
Reinsurance assets 881.4 244.7 – 0.3 – 1,126.4
Insurance and other receivables 890.3 132.8 14.8 (185.6) (67.4) 784.9
Financial investments 2,145.0 45.6 12.2 – – 2,202.8
Cash and cash equivalents 178.0 100.6 33.0 8.0 – 319.6
Reportable segment assets 4,195.3 550.7 63.0 (113.6) (67.4) 4,628.0
Insurance contract liabilities 2,359.9 385.4 – 4.2 – 2,749.5
Trade and other payables 1,147.7 122.1 11.3 11.1 – 1,292.2
Reportable segment liabilities 3,507.6 507.5 11.3 15.3 – 4,041.7
Reportable segment net assets 687.7 43.2 51.7 (128.9) (67.4) 586.3
Unallocated assets and liabilities (4.6)
Consolidated net assets 581.7
5. Premium, claims and profit commissions 5a. Accounting policies
(i) Revenue – premiums
Premiums relating to insurance contracts are recognised as revenue, net of insurance premium tax, proportionally over the period of cover. Premiums with an inception date after the end of the period are held in the statement of financial position as deferred revenue. Outstanding collections from policyholders are recognised within policyholder receivables.
(ii) Revenue – profit commission
Under some of the co-insurance and reinsurance contracts under which motor premiums are shared or ceded, profit commission may be earned on a particular year of account, which is usually subject to performance criteria such as loss ratios and expense ratios. The commission is dependent on the ultimate outcome of any year, with revenue being recognised when loss and expense ratios used in the preparation of the financial statements move below a contractual threshold. Profit commission receivable from reinsurance contracts is accounted for in line with IFRS 4, whereas profit commission receivable from co-insurance contracts is in line with IAS 18.
105Admiral Group plc · Annual Report and Accounts 2017
Financial Statements Additional InformationCorporate GovernanceStrategic ReportIntroduction
Notes to the Financial Statements continuedFor the year ended 31 December 2017
5. Premium, claims and profit commissions continued5a. Accounting policies continued
(iii) Insurance contracts and reinsurance assets
Premiums
The proportion of premium receivable on in-force policies relating to unexpired risks is reported in insurance contract liabilities and reinsurance assets as the unearned premium provision – gross and reinsurers’ share respectively.
Claims
Claims and claims handling expenses are charged as incurred, based on the estimated direct and indirect costs of settling all liabilities arising on events occurring up to the balance sheet date.
The provision for claims outstanding comprises provisions for the estimated cost of settling all claims incurred but unpaid at the balance sheet date, whether reported or not. Anticipated reinsurance recoveries are disclosed separately as assets.
Whilst the Directors consider that the gross provisions for claims and the related reinsurance recoveries are fairly stated on the basis of the information currently available to them, the ultimate liability will vary as a result of subsequent information and events and may result in significant adjustments to the amounts provided.
Adjustments to the amounts of claims provisions established in prior years are reflected in the income statement for the period in which the adjustments are made and disclosed separately if material. The methods used, and the estimates made, are reviewed regularly.
Provision for unexpired risks is made where necessary for the estimated amount required over and above unearned premiums (net of deferred acquisition costs) to meet future claims and related expenses.
Co-insurance
The Group has entered into certain co-insurance contracts under which insurance risks are shared on a proportional basis, with the co-insurer taking a specific percentage of premium written and being responsible for the same proportion of each claim. The co-insurer therefore takes direct insurance risk from the policyholder and is subsequently directly responsible to the claimant for its proportion of the claim. As the contractual liability is several and not joint, neither the premiums nor claims relating to the co-insurance are included in the income statement. Under the terms of these agreements the co-insurers reimburse the Group for the same proportionate share of the costs of acquiring and administering the business.
Reinsurance assets
Contracts entered into by the Group with reinsurers under which the Group is compensated for losses on the insurance contracts issued by the Group are classified as reinsurance contracts. A contract is only accounted for as a reinsurance contract where there is significant insurance risk transfer between the insured and the insurer.
Reinsurance assets are comprised of balances due from reinsurance companies for ceded insurance liabilities. Amounts recoverable from reinsurers are estimated in a consistent manner with the outstanding claims provisions or settled claims associated with the reinsured policies and in accordance with the relevant reinsurance contract.
The Group assesses its reinsurance assets for impairment on a regular basis, and in detail every six months. If there is objective evidence that the asset is impaired, then the carrying value will be written down to its recoverable amount.
On the commutation of reinsurance contracts, the reinsurer is discharged from all obligations relating to the contract. Reinsurance assets and liabilities relating to the commuted contracts are settled in the period in which the commutation agreement is signed.
106 Admiral Group plc · Annual Report and Accounts 2017
Financial Statements: Notes to the Financial Statements
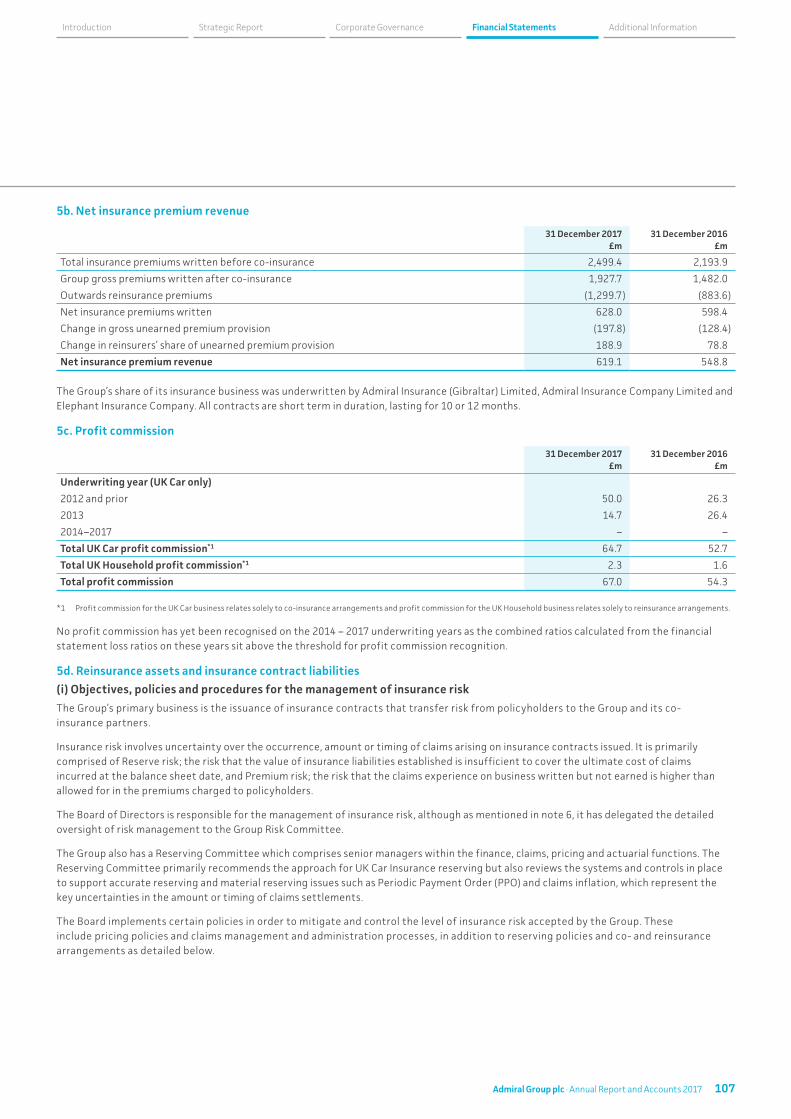
5b. Net insurance premium revenue
31 December 2017 £m
31 December 2016 £m
Total insurance premiums written before co-insurance 2,499.4 2,193.9
Group gross premiums written after co-insurance 1,927.7 1,482.0
Outwards reinsurance premiums (1,299.7) (883.6)
Net insurance premiums written 628.0 598.4
Change in gross unearned premium provision (197.8) (128.4)
Change in reinsurers’ share of unearned premium provision 188.9 78.8
Net insurance premium revenue 619.1 548.8
The Group’s share of its insurance business was underwritten by Admiral Insurance (Gibraltar) Limited, Admiral Insurance Company Limited and Elephant Insurance Company. All contracts are short term in duration, lasting for 10 or 12 months.
5c. Profit commission
31 December 2017 £m
31 December 2016 £m
Underwriting year (UK Car only)
2012 and prior 50.0 26.3
2013 14.7 26.4
2014–2017 – –
Total UK Car profit commission*1 64.7 52.7
Total UK Household profit commission*1 2.3 1.6
Total profit commission 67.0 54.3
*1 Profit commission for the UK Car business relates solely to co-insurance arrangements and profit commission for the UK Household business relates solely to reinsurance arrangements.
No profit commission has yet been recognised on the 2014 – 2017 underwriting years as the combined ratios calculated from the financial statement loss ratios on these years sit above the threshold for profit commission recognition.
5d. Reinsurance assets and insurance contract liabilities
(i) Objectives, policies and procedures for the management of insurance risk
The Group’s primary business is the issuance of insurance contracts that transfer risk from policyholders to the Group and its co- insurance partners.
Insurance risk involves uncertainty over the occurrence, amount or timing of claims arising on insurance contracts issued. It is primarily comprised of Reserve risk; the risk that the value of insurance liabilities established is insufficient to cover the ultimate cost of claims incurred at the balance sheet date, and Premium risk; the risk that the claims experience on business written but not earned is higher than allowed for in the premiums charged to policyholders.
The Board of Directors is responsible for the management of insurance risk, although as mentioned in note 6, it has delegated the detailed oversight of risk management to the Group Risk Committee.
The Group also has a Reserving Committee which comprises senior managers within the finance, claims, pricing and actuarial functions. The Reserving Committee primarily recommends the approach for UK Car Insurance reserving but also reviews the systems and controls in place to support accurate reserving and material reserving issues such as Periodic Payment Order (PPO) and claims inflation, which represent the key uncertainties in the amount or timing of claims settlements.
The Board implements certain policies in order to mitigate and control the level of insurance risk accepted by the Group. These include pricing policies and claims management and administration processes, in addition to reserving policies and co- and reinsurance arrangements as detailed below.
107Admiral Group plc · Annual Report and Accounts 2017
Financial Statements Additional InformationCorporate GovernanceStrategic ReportIntroduction
Notes to the Financial Statements continuedFor the year ended 31 December 2017
5. Premium, claims and profit commissions continued 5d. Reinsurance assets and insurance contract liabilities continued
Reserve Risk
Reserving risk is mitigated through a series of processes and controls. The key processes are as follows:
• Regular management and internal actuarial review of individual and aggregate case claim reserves, including regular reporting of management information and exception reporting of significant movements
• Regular management and internal actuarial review of large claims, including claims settled or potentially settled by PPOs for which the uncertainty is increased by factors such as the lifetime of the claimant and movements in the indexation for the cost of future care of the claimant;
• Bi-annual external actuarial review of best estimate claims reserves using a variety of recognised actuarial techniques
• Internal actuarial analysis of reserve uncertainty through qualitative analysis, scenario testing and a range of stochastic reserving techniques
• Ad hoc external reviews of reserving related processes and assumptions
• Use of a reserving methodology which informs management’s reserving decisions for the purposes of the Group’s financial statements. As described in note 3, critical accounting judgements and estimates, the methodology determines that reserves should be set within a range above projected best estimate outcomes to allow for unforeseen adverse claims development.
As noted above, the Group shares a significant amount of the motor insurance business generated with external underwriters. As well as these proportional arrangements, an excess of loss reinsurance programme is also purchased to protect the Group against very large individual claims and catastrophe losses.
Claims reserving
As previously disclosed, Admiral’s reserving policy (both within the claims function and in the financial statements) is initially to reserve conservatively, above internal and independent projections of actuarial best estimates. This is designed to create a margin held in reserves to allow for unforeseen adverse development in open claims and typically results in Admiral making above industry average reserve releases. Admiral’s booked claims reserves continue to include a significant margin above projected best estimates of ultimate claims costs.
Admiral continues to develop and enhance its methodology in setting the margin held above actuarial best estimates. A wide range of factors inform management’s recommendation which is subject to approval from the Group’s Reserving and Audit Committees, including:
• Reserve KPIs such as the level of margin as a percentage of the ultimate reserve
• Results of stress testing of key assumptions underpinning key actuarial assumptions within best estimate reserves
• A review of a number of individual and aggregated reserve scenarios which may result in future adverse variance to the ultimate best estimate reserve
• Qualitative assessment of the level of uncertainty and volatility within the reserves and the change in that assessment compared to previous periods.
In addition, the internal reserve risk distribution is used to determine the approximate confidence level of the recommended booked reserve position which enables comparison of the reserve strength to previous periods and demonstration of the compliance with IFRS 4.
As at 31 December 2017, the level of reserve margin is lower than at 31 December 2016, although remains very prudent when measured against the internal reserve risk distribution and other market benchmarks. The reduction in the level of reserve margin since 2016 is partly due to the increased level of confidence over the impact of the Ogden rate change to -0.75%.
As profit commission income is recognised in the income statement in line with loss ratios accounted for on Admiral’s own claims reserves, the reserving policy also results in profit commission income being deferred and recognised over time.
Premium Risk
As noted above, the Group defines Premium risk as the risk that claims cost on business written but not yet earned is higher than allowed for in the premiums charged to policyholders. This also includes catastrophe risk; the risk of incurring significant losses as a result of the occurrence of man-made catastrophe or natural weather events.
Key processes and controls operating to mitigate premium risk are as follows:
• Experienced and focused senior management and teams in relevant business areas including pricing and claims management
• A data-driven and analytical approach to regular monitoring of claims and underwriting performance
• Capability to identify and resolve underperformance promptly through changes to key performance drivers, in particular pricing.
108 Admiral Group plc · Annual Report and Accounts 2017
Financial Statements: Notes to the Financial Statements
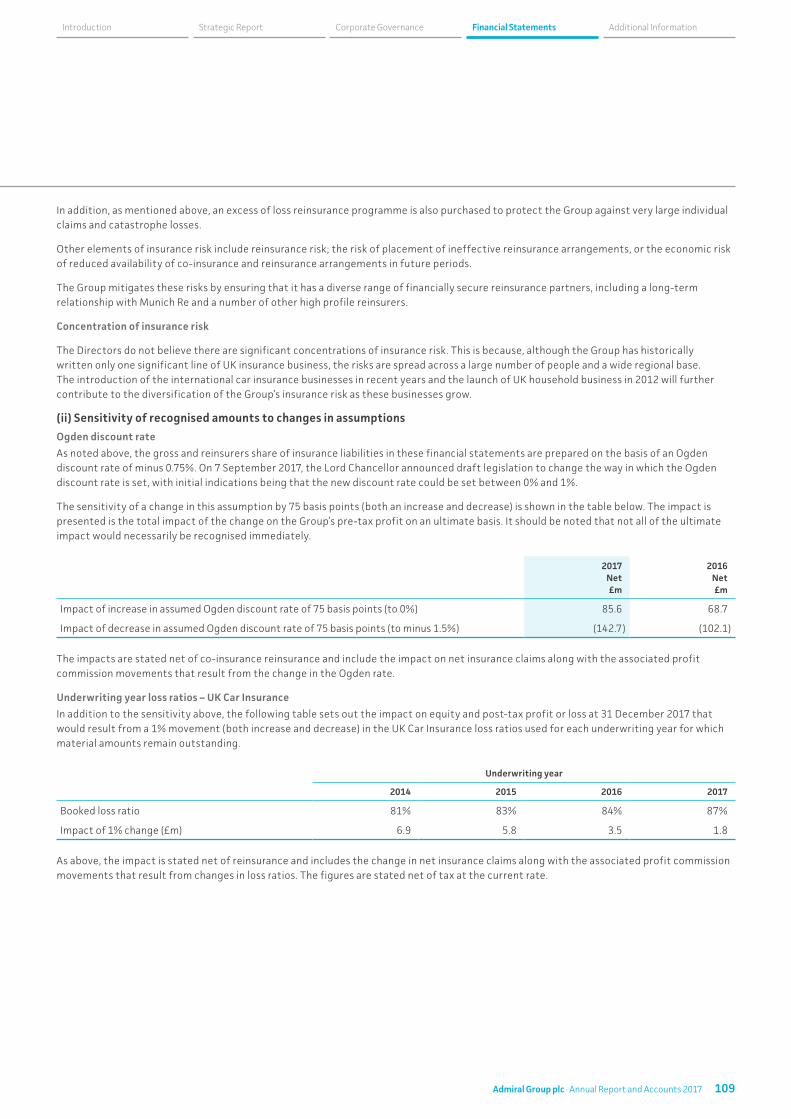
In addition, as mentioned above, an excess of loss reinsurance programme is also purchased to protect the Group against very large individual claims and catastrophe losses.
Other elements of insurance risk include reinsurance risk; the risk of placement of ineffective reinsurance arrangements, or the economic risk of reduced availability of co-insurance and reinsurance arrangements in future periods.
The Group mitigates these risks by ensuring that it has a diverse range of financially secure reinsurance partners, including a long-term relationship with Munich Re and a number of other high profile reinsurers.
Concentration of insurance risk
The Directors do not believe there are significant concentrations of insurance risk. This is because, although the Group has historically written only one significant line of UK insurance business, the risks are spread across a large number of people and a wide regional base. The introduction of the international car insurance businesses in recent years and the launch of UK household business in 2012 will further contribute to the diversification of the Group’s insurance risk as these businesses grow.
(ii) Sensitivity of recognised amounts to changes in assumptions
Ogden discount rate
As noted above, the gross and reinsurers share of insurance liabilities in these financial statements are prepared on the basis of an Ogden discount rate of minus 0.75%. On 7 September 2017, the Lord Chancellor announced draft legislation to change the way in which the Ogden discount rate is set, with initial indications being that the new discount rate could be set between 0% and 1%.
The sensitivity of a change in this assumption by 75 basis points (both an increase and decrease) is shown in the table below. The impact is presented is the total impact of the change on the Group’s pre-tax profit on an ultimate basis. It should be noted that not all of the ultimate impact would necessarily be recognised immediately.
2017 Net£m
2016 Net £m
Impact of increase in assumed Ogden discount rate of 75 basis points (to 0%) 85.6 68.7
Impact of decrease in assumed Ogden discount rate of 75 basis points (to minus 1.5%) (142.7) (102.1)
The impacts are stated net of co-insurance reinsurance and include the impact on net insurance claims along with the associated profit commission movements that result from the change in the Ogden rate.
Underwriting year loss ratios – UK Car Insurance
In addition to the sensitivity above, the following table sets out the impact on equity and post-tax profit or loss at 31 December 2017 that would result from a 1% movement (both increase and decrease) in the UK Car Insurance loss ratios used for each underwriting year for which material amounts remain outstanding.
Underwriting year
2014 2015 2016 2017
Booked loss ratio 81% 83% 84% 87%
Impact of 1% change (£m) 6.9 5.8 3.5 1.8
As above, the impact is stated net of reinsurance and includes the change in net insurance claims along with the associated profit commission movements that result from changes in loss ratios. The figures are stated net of tax at the current rate.
109Admiral Group plc · Annual Report and Accounts 2017
Financial Statements Additional InformationCorporate GovernanceStrategic ReportIntroduction
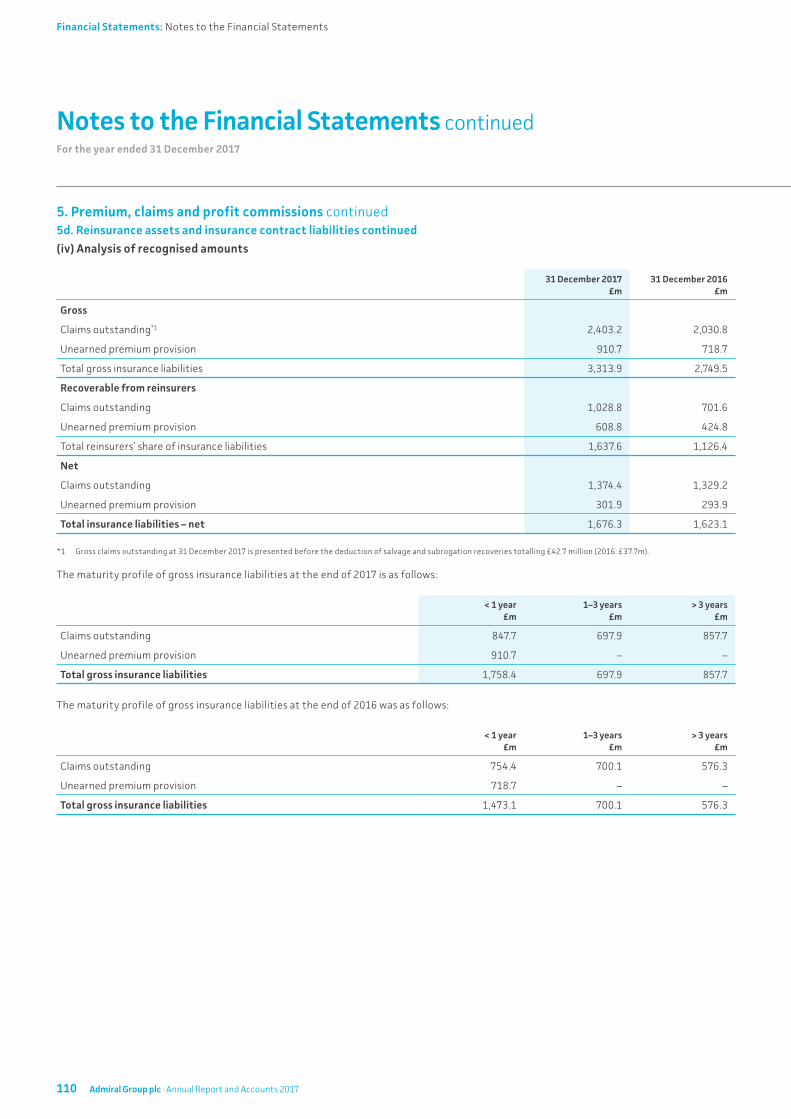
Notes to the Financial Statements continuedFor the year ended 31 December 2017
5. Premium, claims and profit commissions continued 5d. Reinsurance assets and insurance contract liabilities continued
(iv) Analysis of recognised amounts
31 December 2017 £m
31 December 2016 £m
Gross
Claims outstanding*1 2,403.2 2,030.8
Unearned premium provision 910.7 718.7
Total gross insurance liabilities 3,313.9 2,749.5
Recoverable from reinsurers
Claims outstanding 1,028.8 701.6
Unearned premium provision 608.8 424.8
Total reinsurers’ share of insurance liabilities 1,637.6 1,126.4
Net
Claims outstanding 1,374.4 1,329.2
Unearned premium provision 301.9 293.9
Total insurance liabilities – net 1,676.3 1,623.1
*1 Gross claims outstanding at 31 December 2017 is presented before the deduction of salvage and subrogation recoveries totalling £42.7 million (2016: £37.7m).
The maturity profile of gross insurance liabilities at the end of 2017 is as follows:
< 1 year £m
1–3 years £m
> 3 years £m
Claims outstanding 847.7 697.9 857.7
Unearned premium provision 910.7 – –
Total gross insurance liabilities 1,758.4 697.9 857.7
The maturity profile of gross insurance liabilities at the end of 2016 was as follows:
< 1 year £m
1–3 years £m
> 3 years £m
Claims outstanding 754.4 700.1 576.3
Unearned premium provision 718.7 – –
Total gross insurance liabilities 1,473.1 700.1 576.3
110 Admiral Group plc · Annual Report and Accounts 2017
Financial Statements: Notes to the Financial Statements
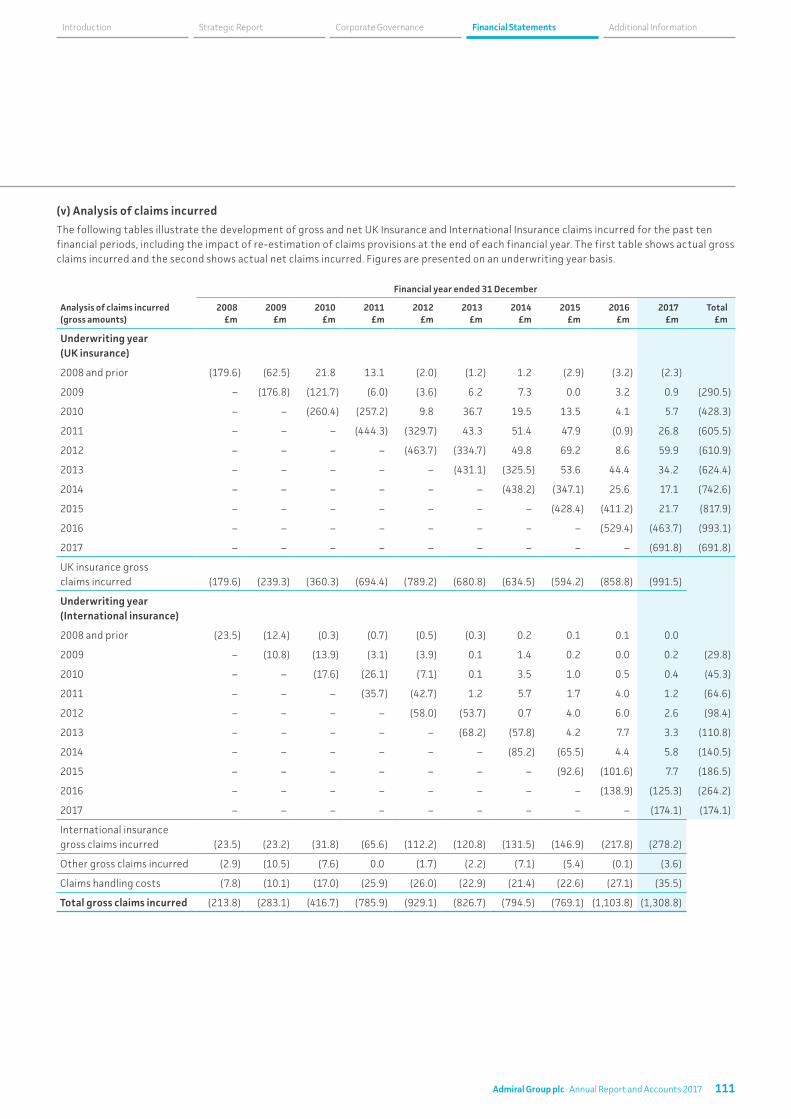
(v) Analysis of claims incurred
The following tables illustrate the development of gross and net UK Insurance and International Insurance claims incurred for the past ten financial periods, including the impact of re-estimation of claims provisions at the end of each financial year. The first table shows actual gross claims incurred and the second shows actual net claims incurred. Figures are presented on an underwriting year basis.
Analysis of claims incurred (gross amounts)
Financial year ended 31 December
2008 £m
2009 £m
2010 £m
2011 £m
2012 £m
2013 £m
2014 £m
2015 £m
2016 £m
2017 £m
Total £m
Underwriting year (UK insurance)
2008 and prior (179.6) (62.5) 21.8 13.1 (2.0) (1.2) 1.2 (2.9) (3.2) (2.3)
2009 – (176.8) (121.7) (6.0) (3.6) 6.2 7.3 0.0 3.2 0.9 (290.5)
2010 – – (260.4) (257.2) 9.8 36.7 19.5 13.5 4.1 5.7 (428.3)
2011 – – – (444.3) (329.7) 43.3 51.4 47.9 (0.9) 26.8 (605.5)
2012 – – – – (463.7) (334.7) 49.8 69.2 8.6 59.9 (610.9)
2013 – – – – – (431.1) (325.5) 53.6 44.4 34.2 (624.4)
2014 – – – – – – (438.2) (347.1) 25.6 17.1 (742.6)
2015 – – – – – – – (428.4) (411.2) 21.7 (817.9)
2016 – – – – – – – – (529.4) (463.7) (993.1)
2017 – – – – – – – – – (691.8) (691.8)
UK insurance gross claims incurred (179.6) (239.3) (360.3) (694.4) (789.2) (680.8) (634.5) (594.2) (858.8) (991.5)
Underwriting year (International insurance)
2008 and prior (23.5) (12.4) (0.3) (0.7) (0.5) (0.3) 0.2 0.1 0.1 0.0
2009 – (10.8) (13.9) (3.1) (3.9) 0.1 1.4 0.2 0.0 0.2 (29.8)
2010 – – (17.6) (26.1) (7.1) 0.1 3.5 1.0 0.5 0.4 (45.3)
2011 – – – (35.7) (42.7) 1.2 5.7 1.7 4.0 1.2 (64.6)
2012 – – – – (58.0) (53.7) 0.7 4.0 6.0 2.6 (98.4)
2013 – – – – – (68.2) (57.8) 4.2 7.7 3.3 (110.8)
2014 – – – – – – (85.2) (65.5) 4.4 5.8 (140.5)
2015 – – – – – – – (92.6) (101.6) 7.7 (186.5)
2016 – – – – – – – – (138.9) (125.3) (264.2)
2017 – – – – – – – – – (174.1) (174.1)
International insurance gross claims incurred (23.5) (23.2) (31.8) (65.6) (112.2) (120.8) (131.5) (146.9) (217.8) (278.2)
Other gross claims incurred (2.9) (10.5) (7.6) 0.0 (1.7) (2.2) (7.1) (5.4) (0.1) (3.6)
Claims handling costs (7.8) (10.1) (17.0) (25.9) (26.0) (22.9) (21.4) (22.6) (27.1) (35.5)
Total gross claims incurred (213.8) (283.1) (416.7) (785.9) (929.1) (826.7) (794.5) (769.1) (1,103.8) (1,308.8)
111Admiral Group plc · Annual Report and Accounts 2017
Financial Statements Additional InformationCorporate GovernanceStrategic ReportIntroduction
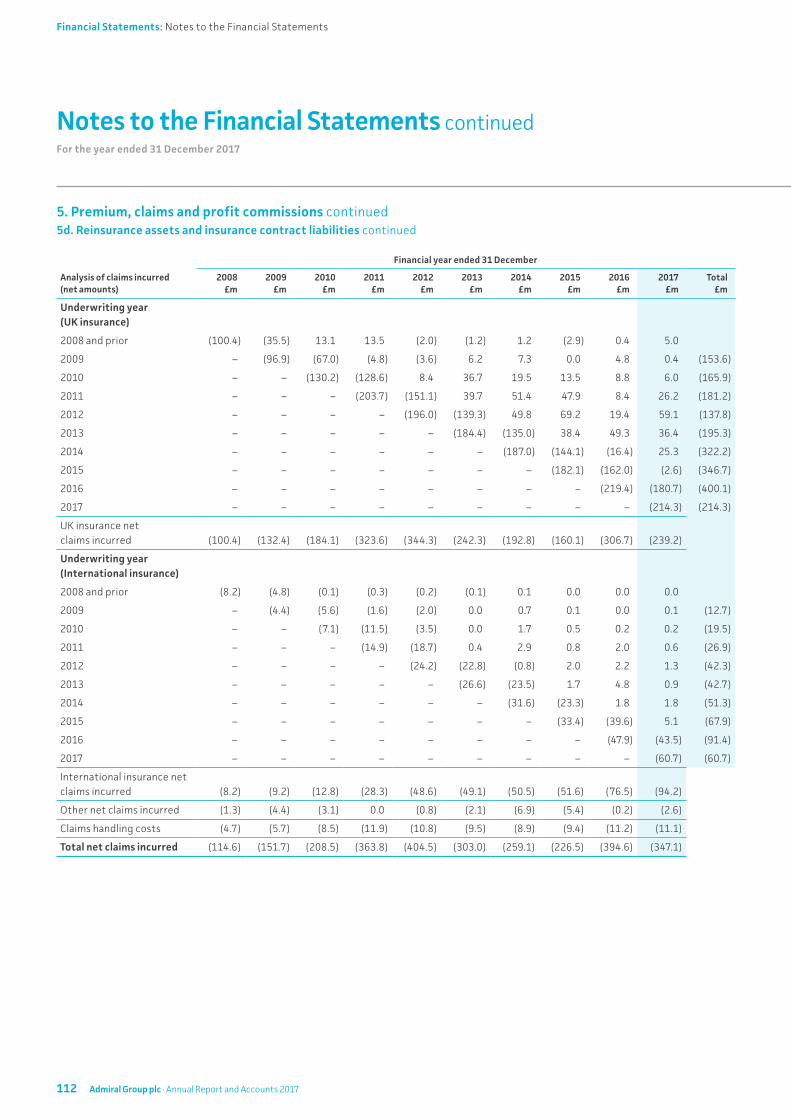
Notes to the Financial Statements continuedFor the year ended 31 December 2017
5. Premium, claims and profit commissions continued 5d. Reinsurance assets and insurance contract liabilities continued
Analysis of claims incurred (net amounts)
Financial year ended 31 December
2008 £m
2009 £m
2010 £m
2011 £m
2012 £m
2013 £m
2014 £m
2015 £m
2016 £m
2017 £m
Total £m
Underwriting year (UK insurance)
2008 and prior (100.4) (35.5) 13.1 13.5 (2.0) (1.2) 1.2 (2.9) 0.4 5.0
2009 – (96.9) (67.0) (4.8) (3.6) 6.2 7.3 0.0 4.8 0.4 (153.6)
2010 – – (130.2) (128.6) 8.4 36.7 19.5 13.5 8.8 6.0 (165.9)
2011 – – – (203.7) (151.1) 39.7 51.4 47.9 8.4 26.2 (181.2)
2012 – – – – (196.0) (139.3) 49.8 69.2 19.4 59.1 (137.8)
2013 – – – – – (184.4) (135.0) 38.4 49.3 36.4 (195.3)
2014 – – – – – – (187.0) (144.1) (16.4) 25.3 (322.2)
2015 – – – – – – – (182.1) (162.0) (2.6) (346.7)
2016 – – – – – – – – (219.4) (180.7) (400.1)
2017 – – – – – – – – – (214.3) (214.3)
UK insurance net claims incurred (100.4) (132.4) (184.1) (323.6) (344.3) (242.3) (192.8) (160.1) (306.7) (239.2)
Underwriting year (International insurance)
2008 and prior (8.2) (4.8) (0.1) (0.3) (0.2) (0.1) 0.1 0.0 0.0 0.0
2009 – (4.4) (5.6) (1.6) (2.0) 0.0 0.7 0.1 0.0 0.1 (12.7)
2010 – – (7.1) (11.5) (3.5) 0.0 1.7 0.5 0.2 0.2 (19.5)
2011 – – – (14.9) (18.7) 0.4 2.9 0.8 2.0 0.6 (26.9)
2012 – – – – (24.2) (22.8) (0.8) 2.0 2.2 1.3 (42.3)
2013 – – – – – (26.6) (23.5) 1.7 4.8 0.9 (42.7)
2014 – – – – – – (31.6) (23.3) 1.8 1.8 (51.3)
2015 – – – – – – – (33.4) (39.6) 5.1 (67.9)
2016 – – – – – – – – (47.9) (43.5) (91.4)
2017 – – – – – – – – – (60.7) (60.7)
International insurance net claims incurred (8.2) (9.2) (12.8) (28.3) (48.6) (49.1) (50.5) (51.6) (76.5) (94.2)
Other net claims incurred (1.3) (4.4) (3.1) 0.0 (0.8) (2.1) (6.9) (5.4) (0.2) (2.6)
Claims handling costs (4.7) (5.7) (8.5) (11.9) (10.8) (9.5) (8.9) (9.4) (11.2) (11.1)
Total net claims incurred (114.6) (151.7) (208.5) (363.8) (404.5) (303.0) (259.1) (226.5) (394.6) (347.1)
112 Admiral Group plc · Annual Report and Accounts 2017
Financial Statements: Notes to the Financial Statements
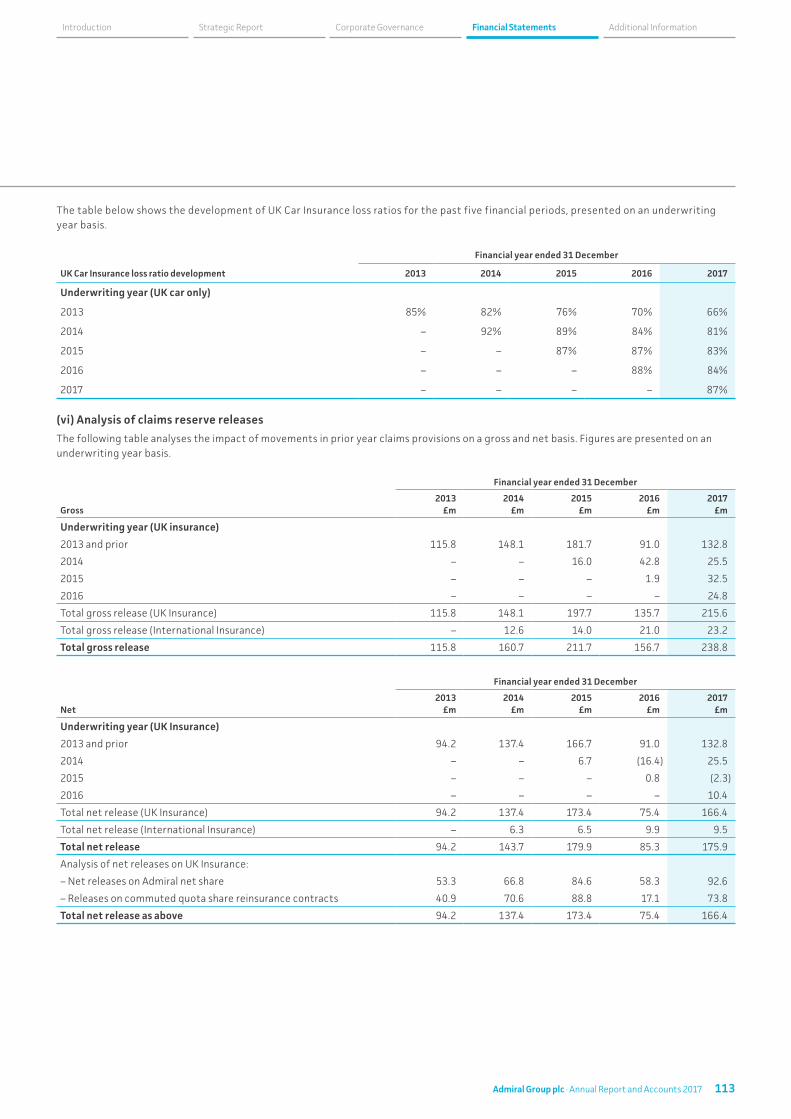
The table below shows the development of UK Car Insurance loss ratios for the past five financial periods, presented on an underwriting year basis.
UK Car Insurance loss ratio development
Financial year ended 31 December
2013 2014 2015 2016 2017
Underwriting year (UK car only)
2013 85% 82% 76% 70% 66%
2014 – 92% 89% 84% 81%
2015 – – 87% 87% 83%
2016 – – – 88% 84%
2017 – – – – 87%
(vi) Analysis of claims reserve releases
The following table analyses the impact of movements in prior year claims provisions on a gross and net basis. Figures are presented on an underwriting year basis.
Gross
Financial year ended 31 December
2013 £m
2014 £m
2015 £m
2016 £m
2017 £m
Underwriting year (UK insurance)
2013 and prior 115.8 148.1 181.7 91.0 132.8
2014 – – 16.0 42.8 25.5
2015 – – – 1.9 32.5
2016 – – – – 24.8
Total gross release (UK Insurance) 115.8 148.1 197.7 135.7 215.6
Total gross release (International Insurance) – 12.6 14.0 21.0 23.2
Total gross release 115.8 160.7 211.7 156.7 238.8
Net
Financial year ended 31 December
2013 £m
2014 £m
2015 £m
2016 £m
2017 £m
Underwriting year (UK Insurance)
2013 and prior 94.2 137.4 166.7 91.0 132.8
2014 – – 6.7 (16.4) 25.5
2015 – – – 0.8 (2.3)
2016 – – – – 10.4
Total net release (UK Insurance) 94.2 137.4 173.4 75.4 166.4
Total net release (International Insurance) – 6.3 6.5 9.9 9.5
Total net release 94.2 143.7 179.9 85.3 175.9
Analysis of net releases on UK Insurance:
– Net releases on Admiral net share 53.3 66.8 84.6 58.3 92.6
– Releases on commuted quota share reinsurance contracts 40.9 70.6 88.8 17.1 73.8
Total net release as above 94.2 137.4 173.4 75.4 166.4
113Admiral Group plc · Annual Report and Accounts 2017
Financial Statements Additional InformationCorporate GovernanceStrategic ReportIntroduction
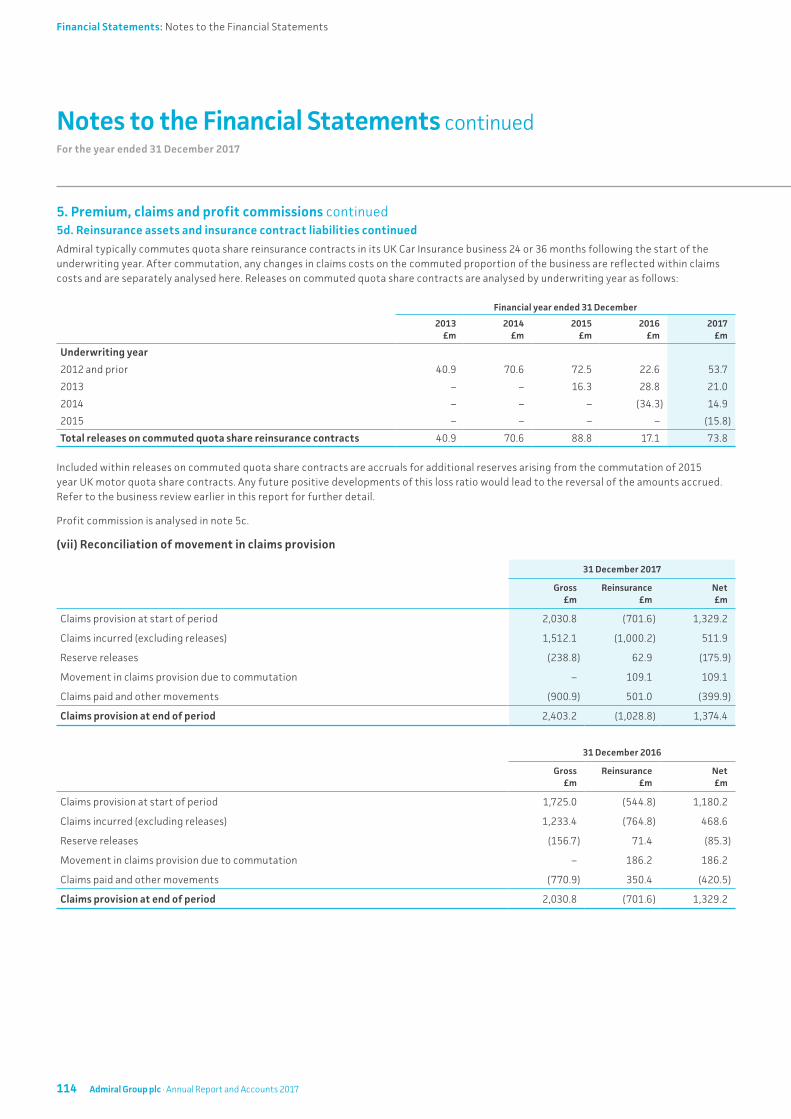
Notes to the Financial Statements continuedFor the year ended 31 December 2017
5. Premium, claims and profit commissions continued 5d. Reinsurance assets and insurance contract liabilities continued
Admiral typically commutes quota share reinsurance contracts in its UK Car Insurance business 24 or 36 months following the start of the underwriting year. After commutation, any changes in claims costs on the commuted proportion of the business are reflected within claims costs and are separately analysed here. Releases on commuted quota share contracts are analysed by underwriting year as follows:
Financial year ended 31 December
2013£m
2014£m
2015 £m
2016£m
2017 £m
Underwriting year
2012 and prior 40.9 70.6 72.5 22.6 53.7
2013 – – 16.3 28.8 21.0
2014 – – – (34.3) 14.9
2015 – – – – (15.8)
Total releases on commuted quota share reinsurance contracts 40.9 70.6 88.8 17.1 73.8
Included within releases on commuted quota share contracts are accruals for additional reserves arising from the commutation of 2015 year UK motor quota share contracts. Any future positive developments of this loss ratio would lead to the reversal of the amounts accrued. Refer to the business review earlier in this report for further detail.
Profit commission is analysed in note 5c.
(vii) Reconciliation of movement in claims provision
31 December 2017
Gross £m
Reinsurance £m
Net £m
Claims provision at start of period 2,030.8 (701.6) 1,329.2
Claims incurred (excluding releases) 1,512.1 (1,000.2) 511.9
Reserve releases (238.8) 62.9 (175.9)
Movement in claims provision due to commutation – 109.1 109.1
Claims paid and other movements (900.9) 501.0 (399.9)
Claims provision at end of period 2,403.2 (1,028.8) 1,374.4
31 December 2016
Gross £m
Reinsurance £m
Net £m
Claims provision at start of period 1,725.0 (544.8) 1,180.2
Claims incurred (excluding releases) 1,233.4 (764.8) 468.6
Reserve releases (156.7) 71.4 (85.3)
Movement in claims provision due to commutation – 186.2 186.2
Claims paid and other movements (770.9) 350.4 (420.5)
Claims provision at end of period 2,030.8 (701.6) 1,329.2
114 Admiral Group plc · Annual Report and Accounts 2017
Financial Statements: Notes to the Financial Statements

(viii) Reconciliation of movement in net unearned premium provision
31 December 2017
Gross £m
Reinsurance £m
Net £m
Unearned premium provision at start of period 718.7 (424.8) 293.9
Written in the period 1,927.7 (1,299.7) 628.0
Earned in the period (1,735.7) 1,115.7 (620.0)
Unearned premium provision at end of period 910.7 (608.8) 301.9
31 December 2016
Gross £m
Reinsurance £m
Net £m
Unearned premium provision at start of period 570.0 (333.9) 236.1
Written in the period 1,482.0 (883.6) 598.4
Earned in the period (1,333.3) 792.7 (540.6)
Unearned premium provision at end of period 718.7 (424.8) 293.9
6. Investments6a. Accounting policies
(i) Investment income and finance costs
Investment income from financial assets comprises distributions as well as net realised and unrealised gains on financial assets classified as ‘fair value through profit or loss’ (FVTPL), interest income and net realised gains from assets classified as ‘available for sale’ (AFS), and interest income on holdings in deposits and gilts.
Finance costs from financial liabilities comprise interest expense on subordinated notes, calculated on the effective interest rate method. The effective interest rate method calculates the amortised cost of a financial asset or liability (or group of financial assets or financial liabilities) and allocates the interest income or expense over the expected life of the asset or liability.
(ii) Financial assets – investments and receivables
Initial recognition
Financial assets within the scope of IAS 39 are classified as financial assets at FVTPL, AFS assets, loans and receivables or held to maturity investments.
At initial recognition assets are recognised at fair value and classified according to the purpose for which they were acquired.
The Group’s investments in investment funds are designated as FVTPL at inception.
This designation is permitted under IAS 39, as the investments in money market funds are managed as a group of assets and internal performance evaluation of this group is conducted on a fair value basis.
The Group’s holdings in Fixed Income and Asset Backed Securities are classified as AFS investments, which is consistent with the intention for which they were purchased.
Government gilts are also classified as AFS investments, in line with IAS 39, due to a reclassification in the period following the disposal of a portion of the holding.
Deposits held with credit institutions are classified as loans and receivables, in line with the nature of these deposits, with 2016 comparatives restated to reflect this more appropriate classification of these assets.
Transaction costs associated with the purchase of all financial assets are expensed within the income statement as incurred.
115Admiral Group plc · Annual Report and Accounts 2017
Financial Statements Additional InformationCorporate GovernanceStrategic ReportIntroduction
Notes to the Financial Statements continuedFor the year ended 31 December 2017
6. Investments continued6a. Accounting policies continued
Subsequent measurement
Financial assets at FVTPL are stated at fair value, with any resultant realised or unrealised gain or loss recognised through the income statement.
Investments classified as available for sale are stated at fair value. Unrealised changes in the fair value of these assets are recognised in Other Comprehensive Income (OCI). Interest income is recognised within profit or loss using the effective interest rate method.
Loans and receivables are stated at their amortised cost less impairment using the effective interest method. Impairment losses are recognised through the income statement.
Impairment of financial assets
The Group assesses at each balance sheet date whether any financial assets or groups of financial assets held at fair value or amortised cost are impaired. Financial assets are impaired where there is evidence that one or more events occurring after the initial recognition of the asset, may lead to a reduction in the estimated future cash flows arising from the asset.
Objective evidence of impairment may include default on cash flows due from the asset and reported financial difficulty of the issuer or counterparty.
Identified impairments of financial assets are recognised in the income statement, except in the case of assets classified as AFS where unrealised gains have been recognised through OCI. In this instance, impairments of the asset are first set against the unrealised gain in OCI with any excess being recognised in the income statement.
De-recognition of financial assets
A financial asset is derecognised when the rights to receive cash flows from that asset have expired, or when the Group transfers the asset and all the attached substantial risks and rewards relating to the asset to a third party.
Cash and cash equivalents
Cash and cash equivalents includes cash in hand, deposits held at call with banks and other short-term deposits with original maturities of three months or less. All cash and cash equivalents are measured at amortised cost.
(iii) Financial liabilities
Initial recognition
The Group’s financial liabilities comprise subordinated notes and other financial liabilities initially recognised at fair value received, net of transaction costs incurred.
Subsequent measurement
Subsequent measurement is at amortised cost using the effective interest method. Movements in the amortised cost are recognised through the income statement.
De-recognition of financial liabilities
A financial liability is derecognised when the obligation under that liability is discharged, cancelled or expires.
(iv) Fair value measurement of assets held at amortised cost
The fair value of gilts and subordinated notes held at amortised cost is calculated with reference to quoted market valuations. See note 6d for a comparison of fair value and carrying value at the statement of financial position date.
The Group’s deposits are held with well rated institutions; as such the fair value approximates to the book value of the investment based on the interest rates of the instruments, credit risk movements and durations of the assets. The amortised cost carrying amount of receivables is a reasonable approximation of fair value.
116 Admiral Group plc · Annual Report and Accounts 2017
Financial Statements: Notes to the Financial Statements
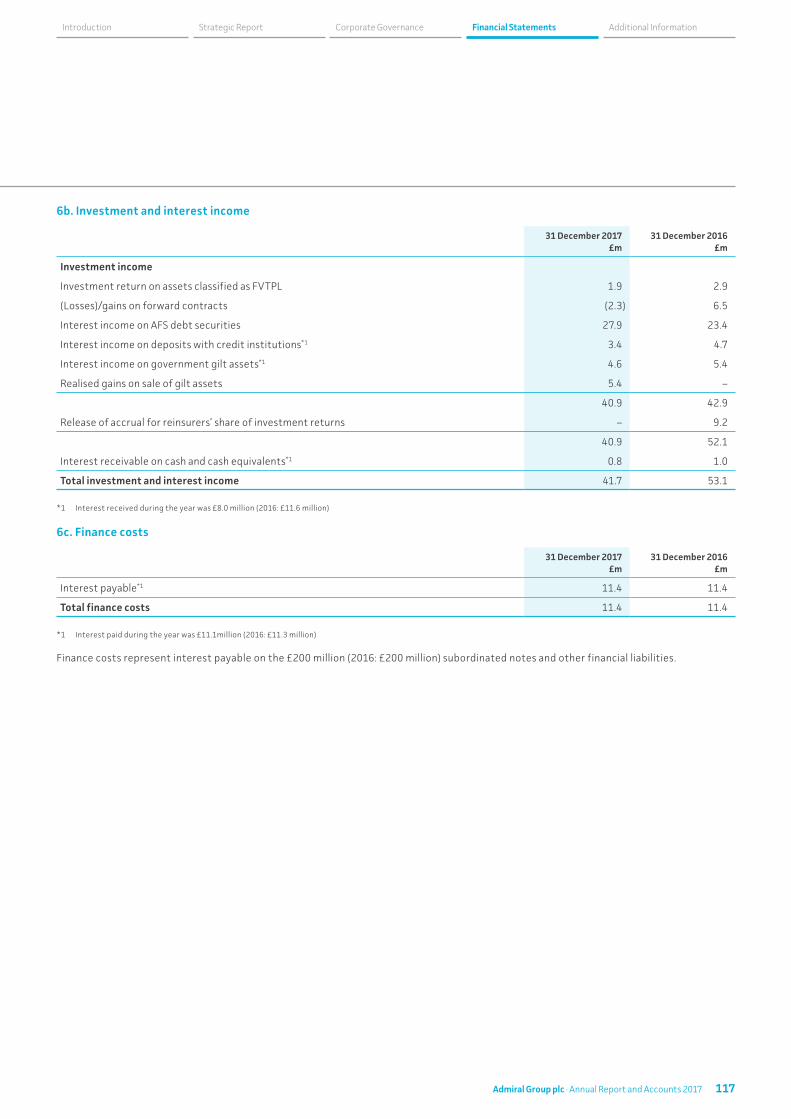
6b. Investment and interest income
31 December 2017 £m
31 December 2016 £m
Investment income
Investment return on assets classified as FVTPL 1.9 2.9
(Losses)/gains on forward contracts (2.3) 6.5
Interest income on AFS debt securities 27.9 23.4
Interest income on deposits with credit institutions*1 3.4 4.7
Interest income on government gilt assets*1 4.6 5.4
Realised gains on sale of gilt assets 5.4 –
40.9 42.9
Release of accrual for reinsurers’ share of investment returns – 9.2
40.9 52.1
Interest receivable on cash and cash equivalents*1 0.8 1.0
Total investment and interest income 41.7 53.1
*1 Interest received during the year was £8.0 million (2016: £11.6 million)
6c. Finance costs
31 December 2017 £m
31 December 2016 £m
Interest payable*1 11.4 11.4
Total finance costs 11.4 11.4
*1 Interest paid during the year was £11.1million (2016: £11.3 million)
Finance costs represent interest payable on the £200 million (2016: £200 million) subordinated notes and other financial liabilities.
117Admiral Group plc · Annual Report and Accounts 2017
Financial Statements Additional InformationCorporate GovernanceStrategic ReportIntroduction

Notes to the Financial Statements continuedFor the year ended 31 December 2017
6. Investments continued6d. Financial assets and liabilities
The Group’s financial instruments can be analysed as follows:
31 December 2017 £m
Restated*1 31 December 2016
£m
Investments held at fair value through profit or loss
Investment funds 1,071.9 776.3
Derivative financial instruments 2.4 4.7
1,074.3 781.0
Investments classified as available for sale
Available for sale debt securities 1,319.7 1,271.8
Available for sale government gilts 173.8 –
1,493.5 1,271.8
Investments classified as held to maturity
Government gilts – 197.4
– 197.4
Loans and receivables
Deposits with credit institutions*1 130.0 170.0
130.0 170.0
Total financial investments 2,697.8 2,420.2
Insurance and financial assets
Insurance receivables 737.6 606.6
Trade and other receivables 202.1 176.0
Loans and advances to customers 66.2 2.3
Cash and cash equivalents 326.8 326.6
Total financial assets 4,030.5 3,531.7
Financial liabilities
Subordinated notes 204.0 204.0
Other borrowings 20.0 20.0
Trade and other payables 1,641.6 1,292.2
Total financial liabilities 1,865.6 1,516.2
*1 2016 comparatives have been restated to present deposits held with credit institutions as loans and receivables, as this is considered to be a more appropriate classification of these assets.
Financial liabilities are inclusive of £200 million subordinated notes issued on 25 July 2014 at a fixed rate of 5.5% with a redemption date of 25 July 2024.
The notes are unsecured subordinated obligations of the Group and rank pari passu without any preference among themselves. In the event of a winding-up or bankruptcy, they are to be repaid only after the claims of all other creditors have been met.
There have been no defaults on any of the notes during the year. The Group has the option to defer interest payments on the notes but to date has not exercised this right. The aggregate fair value of subordinated dated notes at the balance sheet date is disclosed in the table below.
The Group holds two revolving credit facilities of £100 million each. As at 31 December 2017, £20 million (2016: £20 million) was drawn under these agreements as shown within other borrowings in the table above.
118 Admiral Group plc · Annual Report and Accounts 2017
Financial Statements: Notes to the Financial Statements
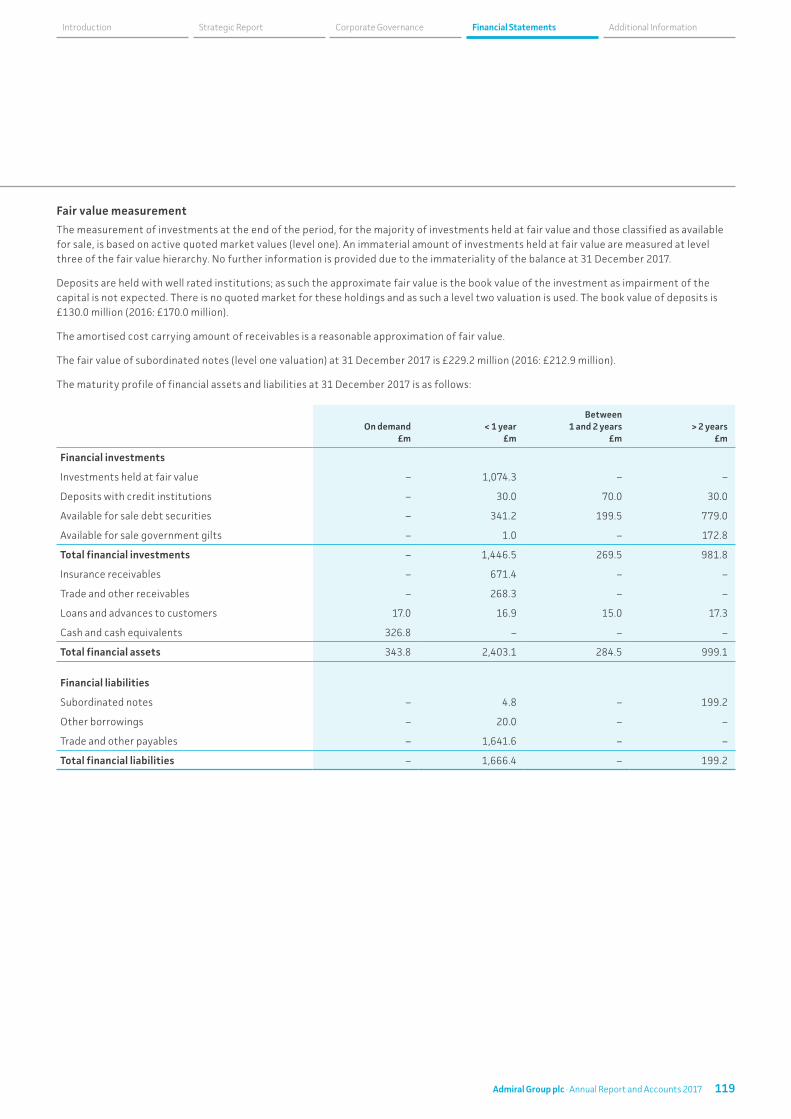
Fair value measurement
The measurement of investments at the end of the period, for the majority of investments held at fair value and those classified as available for sale, is based on active quoted market values (level one). An immaterial amount of investments held at fair value are measured at level three of the fair value hierarchy. No further information is provided due to the immateriality of the balance at 31 December 2017.
Deposits are held with well rated institutions; as such the approximate fair value is the book value of the investment as impairment of the capital is not expected. There is no quoted market for these holdings and as such a level two valuation is used. The book value of deposits is £130.0 million (2016: £170.0 million).
The amortised cost carrying amount of receivables is a reasonable approximation of fair value.
The fair value of subordinated notes (level one valuation) at 31 December 2017 is £229.2 million (2016: £212.9 million).
The maturity profile of financial assets and liabilities at 31 December 2017 is as follows:
On demand £m
< 1 year £m
Between 1 and 2 years
£m> 2 years
£m
Financial investments
Investments held at fair value – 1,074.3 – –
Deposits with credit institutions – 30.0 70.0 30.0
Available for sale debt securities – 341.2 199.5 779.0
Available for sale government gilts – 1.0 – 172.8
Total financial investments – 1,446.5 269.5 981.8
Insurance receivables – 671.4 – –
Trade and other receivables – 268.3 – –
Loans and advances to customers 17.0 16.9 15.0 17.3
Cash and cash equivalents 326.8 – – –
Total financial assets 343.8 2,403.1 284.5 999.1
Financial liabilities
Subordinated notes – 4.8 – 199.2
Other borrowings – 20.0 – –
Trade and other payables – 1,641.6 – –
Total financial liabilities – 1,666.4 – 199.2
119Admiral Group plc · Annual Report and Accounts 2017
Financial Statements Additional InformationCorporate GovernanceStrategic ReportIntroduction
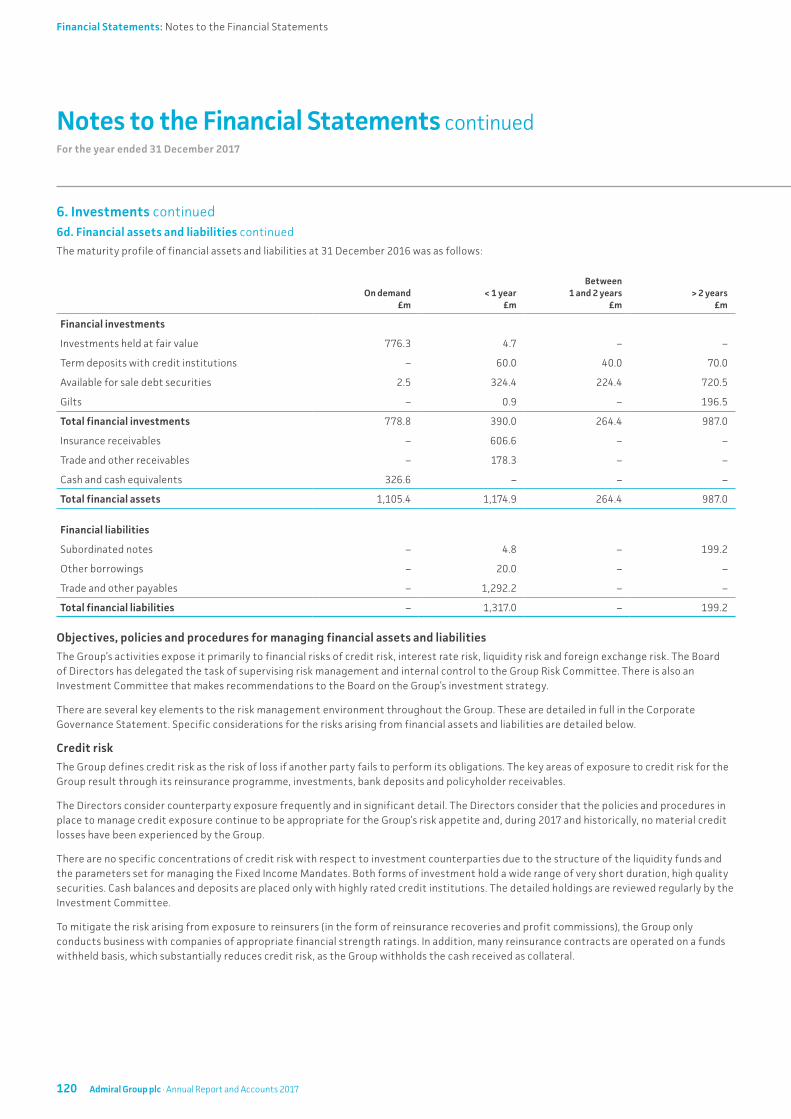
Notes to the Financial Statements continuedFor the year ended 31 December 2017
6. Investments continued6d. Financial assets and liabilities continued
The maturity profile of financial assets and liabilities at 31 December 2016 was as follows:
On demand £m
< 1 year £m
Between 1 and 2 years
£m> 2 years
£m
Financial investments
Investments held at fair value 776.3 4.7 – –
Term deposits with credit institutions – 60.0 40.0 70.0
Available for sale debt securities 2.5 324.4 224.4 720.5
Gilts – 0.9 – 196.5
Total financial investments 778.8 390.0 264.4 987.0
Insurance receivables – 606.6 – –
Trade and other receivables – 178.3 – –
Cash and cash equivalents 326.6 – – –
Total financial assets 1,105.4 1,174.9 264.4 987.0
Financial liabilities
Subordinated notes – 4.8 – 199.2
Other borrowings – 20.0 – –
Trade and other payables – 1,292.2 – –
Total financial liabilities – 1,317.0 – 199.2
Objectives, policies and procedures for managing financial assets and liabilities
The Group’s activities expose it primarily to financial risks of credit risk, interest rate risk, liquidity risk and foreign exchange risk. The Board of Directors has delegated the task of supervising risk management and internal control to the Group Risk Committee. There is also an Investment Committee that makes recommendations to the Board on the Group’s investment strategy.
There are several key elements to the risk management environment throughout the Group. These are detailed in full in the Corporate Governance Statement. Specific considerations for the risks arising from financial assets and liabilities are detailed below.
Credit risk
The Group defines credit risk as the risk of loss if another party fails to perform its obligations. The key areas of exposure to credit risk for the Group result through its reinsurance programme, investments, bank deposits and policyholder receivables.
The Directors consider counterparty exposure frequently and in significant detail. The Directors consider that the policies and procedures in place to manage credit exposure continue to be appropriate for the Group’s risk appetite and, during 2017 and historically, no material credit losses have been experienced by the Group.
There are no specific concentrations of credit risk with respect to investment counterparties due to the structure of the liquidity funds and the parameters set for managing the Fixed Income Mandates. Both forms of investment hold a wide range of very short duration, high quality securities. Cash balances and deposits are placed only with highly rated credit institutions. The detailed holdings are reviewed regularly by the Investment Committee.
To mitigate the risk arising from exposure to reinsurers (in the form of reinsurance recoveries and profit commissions), the Group only conducts business with companies of appropriate financial strength ratings. In addition, many reinsurance contracts are operated on a funds withheld basis, which substantially reduces credit risk, as the Group withholds the cash received as collateral.
120 Admiral Group plc · Annual Report and Accounts 2017
Financial Statements: Notes to the Financial Statements
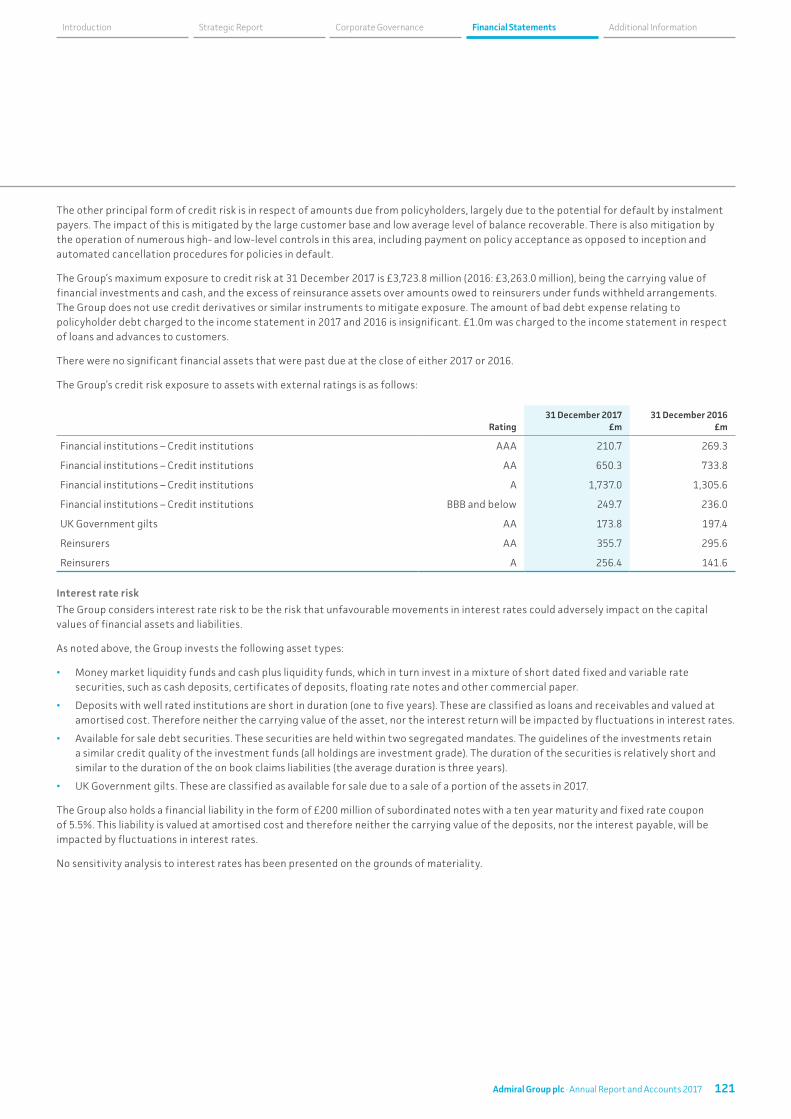
The other principal form of credit risk is in respect of amounts due from policyholders, largely due to the potential for default by instalment payers. The impact of this is mitigated by the large customer base and low average level of balance recoverable. There is also mitigation by the operation of numerous high- and low-level controls in this area, including payment on policy acceptance as opposed to inception and automated cancellation procedures for policies in default.
The Group’s maximum exposure to credit risk at 31 December 2017 is £3,723.8 million (2016: £3,263.0 million), being the carrying value of financial investments and cash, and the excess of reinsurance assets over amounts owed to reinsurers under funds withheld arrangements. The Group does not use credit derivatives or similar instruments to mitigate exposure. The amount of bad debt expense relating to policyholder debt charged to the income statement in 2017 and 2016 is insignificant. £1.0m was charged to the income statement in respect of loans and advances to customers.
There were no significant financial assets that were past due at the close of either 2017 or 2016.
The Group’s credit risk exposure to assets with external ratings is as follows:
Rating31 December 2017
£m31 December 2016
£m
Financial institutions – Credit institutions AAA 210.7 269.3
Financial institutions – Credit institutions AA 650.3 733.8
Financial institutions – Credit institutions A 1,737.0 1,305.6
Financial institutions – Credit institutions BBB and below 249.7 236.0
UK Government gilts AA 173.8 197.4
Reinsurers AA 355.7 295.6
Reinsurers A 256.4 141.6
Interest rate risk
The Group considers interest rate risk to be the risk that unfavourable movements in interest rates could adversely impact on the capital values of financial assets and liabilities.
As noted above, the Group invests the following asset types:
• Money market liquidity funds and cash plus liquidity funds, which in turn invest in a mixture of short dated fixed and variable rate securities, such as cash deposits, certificates of deposits, floating rate notes and other commercial paper.
• Deposits with well rated institutions are short in duration (one to five years). These are classified as loans and receivables and valued at amortised cost. Therefore neither the carrying value of the asset, nor the interest return will be impacted by fluctuations in interest rates.
• Available for sale debt securities. These securities are held within two segregated mandates. The guidelines of the investments retain a similar credit quality of the investment funds (all holdings are investment grade). The duration of the securities is relatively short and similar to the duration of the on book claims liabilities (the average duration is three years).
• UK Government gilts. These are classified as available for sale due to a sale of a portion of the assets in 2017.
The Group also holds a financial liability in the form of £200 million of subordinated notes with a ten year maturity and fixed rate coupon of 5.5%. This liability is valued at amortised cost and therefore neither the carrying value of the deposits, nor the interest payable, will be impacted by fluctuations in interest rates.
No sensitivity analysis to interest rates has been presented on the grounds of materiality.
121Admiral Group plc · Annual Report and Accounts 2017
Financial Statements Additional InformationCorporate GovernanceStrategic ReportIntroduction
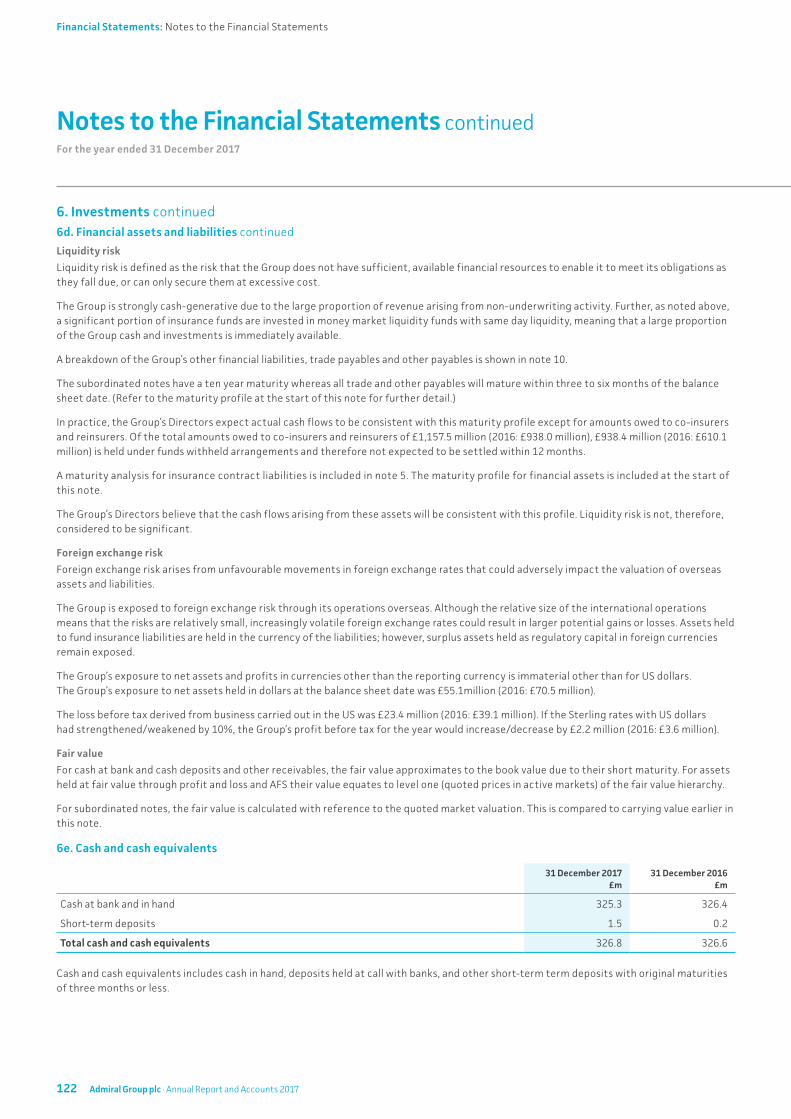
Notes to the Financial Statements continuedFor the year ended 31 December 2017
6. Investments continued6d. Financial assets and liabilities continued
Liquidity risk
Liquidity risk is defined as the risk that the Group does not have sufficient, available financial resources to enable it to meet its obligations as they fall due, or can only secure them at excessive cost.
The Group is strongly cash-generative due to the large proportion of revenue arising from non-underwriting activity. Further, as noted above, a significant portion of insurance funds are invested in money market liquidity funds with same day liquidity, meaning that a large proportion of the Group cash and investments is immediately available.
A breakdown of the Group’s other financial liabilities, trade payables and other payables is shown in note 10.
The subordinated notes have a ten year maturity whereas all trade and other payables will mature within three to six months of the balance sheet date. (Refer to the maturity profile at the start of this note for further detail.)
In practice, the Group’s Directors expect actual cash flows to be consistent with this maturity profile except for amounts owed to co-insurers and reinsurers. Of the total amounts owed to co-insurers and reinsurers of £1,157.5 million (2016: £938.0 million), £938.4 million (2016: £610.1 million) is held under funds withheld arrangements and therefore not expected to be settled within 12 months.
A maturity analysis for insurance contract liabilities is included in note 5. The maturity profile for financial assets is included at the start of this note.
The Group’s Directors believe that the cash flows arising from these assets will be consistent with this profile. Liquidity risk is not, therefore, considered to be significant.
Foreign exchange risk
Foreign exchange risk arises from unfavourable movements in foreign exchange rates that could adversely impact the valuation of overseas assets and liabilities.
The Group is exposed to foreign exchange risk through its operations overseas. Although the relative size of the international operations means that the risks are relatively small, increasingly volatile foreign exchange rates could result in larger potential gains or losses. Assets held to fund insurance liabilities are held in the currency of the liabilities; however, surplus assets held as regulatory capital in foreign currencies remain exposed.
The Group’s exposure to net assets and profits in currencies other than the reporting currency is immaterial other than for US dollars. The Group’s exposure to net assets held in dollars at the balance sheet date was £55.1million (2016: £70.5 million).
The loss before tax derived from business carried out in the US was £23.4 million (2016: £39.1 million). If the Sterling rates with US dollars had strengthened/weakened by 10%, the Group’s profit before tax for the year would increase/decrease by £2.2 million (2016: £3.6 million).
Fair value
For cash at bank and cash deposits and other receivables, the fair value approximates to the book value due to their short maturity. For assets held at fair value through profit and loss and AFS their value equates to level one (quoted prices in active markets) of the fair value hierarchy.
For subordinated notes, the fair value is calculated with reference to the quoted market valuation. This is compared to carrying value earlier in this note.
6e. Cash and cash equivalents
31 December 2017 £m
31 December 2016 £m
Cash at bank and in hand 325.3 326.4
Short-term deposits 1.5 0.2
Total cash and cash equivalents 326.8 326.6
Cash and cash equivalents includes cash in hand, deposits held at call with banks, and other short-term term deposits with original maturities of three months or less.
122 Admiral Group plc · Annual Report and Accounts 2017
Financial Statements: Notes to the Financial Statements
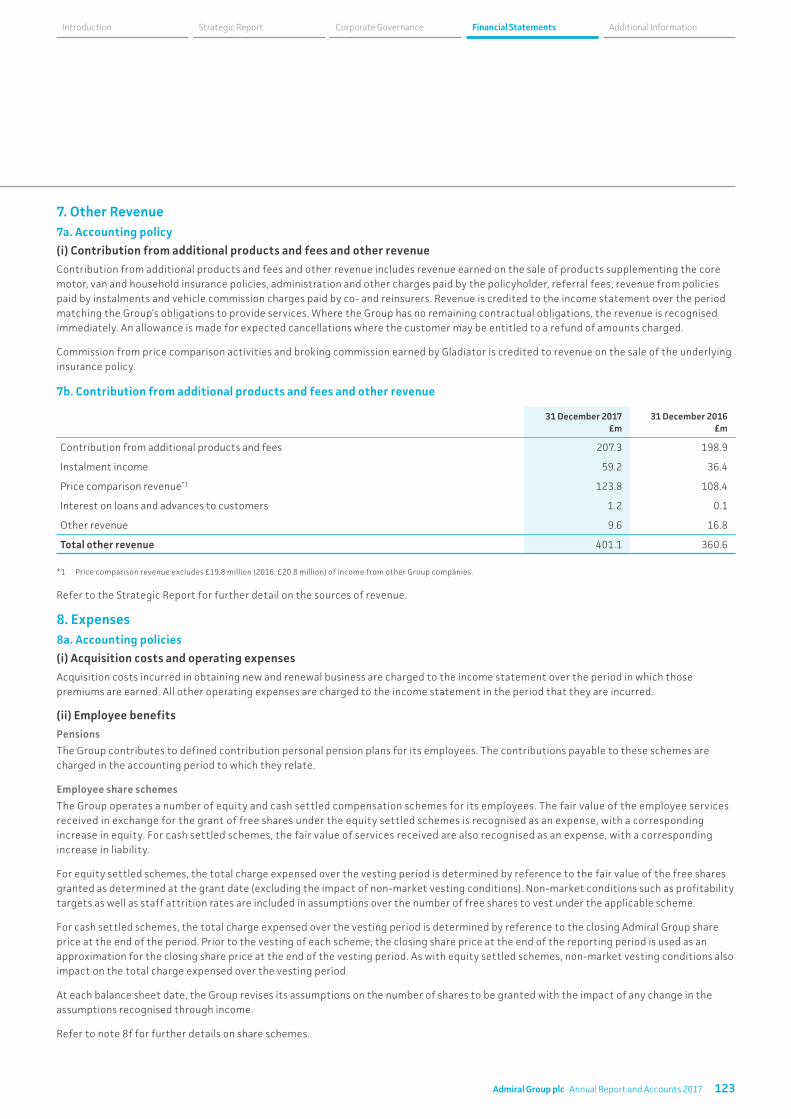
7. Other Revenue7a. Accounting policy
(i) Contribution from additional products and fees and other revenue
Contribution from additional products and fees and other revenue includes revenue earned on the sale of products supplementing the core motor, van and household insurance policies, administration and other charges paid by the policyholder, referral fees, revenue from policies paid by instalments and vehicle commission charges paid by co- and reinsurers. Revenue is credited to the income statement over the period matching the Group’s obligations to provide services. Where the Group has no remaining contractual obligations, the revenue is recognised immediately. An allowance is made for expected cancellations where the customer may be entitled to a refund of amounts charged.
Commission from price comparison activities and broking commission earned by Gladiator is credited to revenue on the sale of the underlying insurance policy.
7b. Contribution from additional products and fees and other revenue
31 December 2017 £m
31 December 2016 £m
Contribution from additional products and fees 207.3 198.9
Instalment income 59.2 36.4
Price comparison revenue*1 123.8 108.4
Interest on loans and advances to customers 1.2 0.1
Other revenue 9.6 16.8
Total other revenue 401.1 360.6
*1 Price comparison revenue excludes £19.8 million (2016: £20.8 million) of income from other Group companies.
Refer to the Strategic Report for further detail on the sources of revenue.
8. Expenses8a. Accounting policies
(i) Acquisition costs and operating expenses
Acquisition costs incurred in obtaining new and renewal business are charged to the income statement over the period in which those premiums are earned. All other operating expenses are charged to the income statement in the period that they are incurred.
(ii) Employee benefits
Pensions
The Group contributes to defined contribution personal pension plans for its employees. The contributions payable to these schemes are charged in the accounting period to which they relate.
Employee share schemes
The Group operates a number of equity and cash settled compensation schemes for its employees. The fair value of the employee services received in exchange for the grant of free shares under the equity settled schemes is recognised as an expense, with a corresponding increase in equity. For cash settled schemes, the fair value of services received are also recognised as an expense, with a corresponding increase in liability.
For equity settled schemes, the total charge expensed over the vesting period is determined by reference to the fair value of the free shares granted as determined at the grant date (excluding the impact of non-market vesting conditions). Non-market conditions such as profitability targets as well as staff attrition rates are included in assumptions over the number of free shares to vest under the applicable scheme.
For cash settled schemes, the total charge expensed over the vesting period is determined by reference to the closing Admiral Group share price at the end of the period. Prior to the vesting of each scheme, the closing share price at the end of the reporting period is used as an approximation for the closing share price at the end of the vesting period. As with equity settled schemes, non-market vesting conditions also impact on the total charge expensed over the vesting period.
At each balance sheet date, the Group revises its assumptions on the number of shares to be granted with the impact of any change in the assumptions recognised through income.
Refer to note 8f for further details on share schemes.
123Admiral Group plc · Annual Report and Accounts 2017
Financial Statements Additional InformationCorporate GovernanceStrategic ReportIntroduction
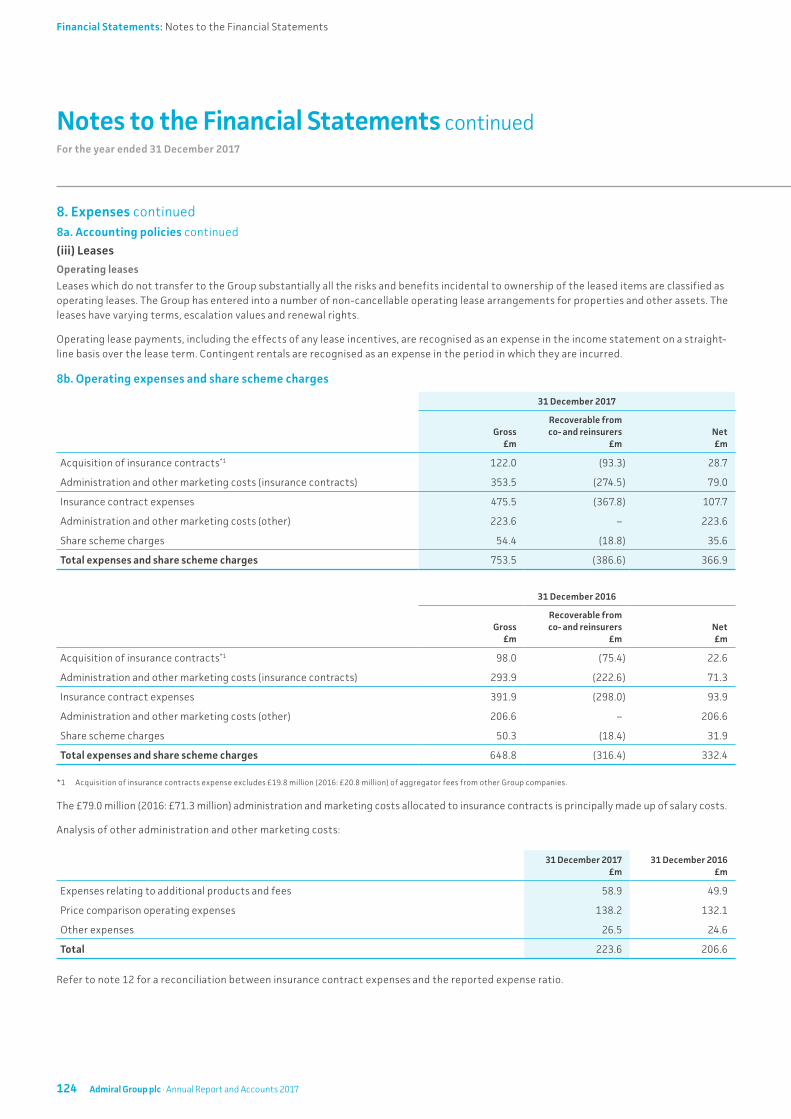
Notes to the Financial Statements continuedFor the year ended 31 December 2017
8. Expenses continued8a. Accounting policies continued
(iii) Leases
Operating leases
Leases which do not transfer to the Group substantially all the risks and benefits incidental to ownership of the leased items are classified as operating leases. The Group has entered into a number of non-cancellable operating lease arrangements for properties and other assets. The leases have varying terms, escalation values and renewal rights.
Operating lease payments, including the effects of any lease incentives, are recognised as an expense in the income statement on a straight-line basis over the lease term. Contingent rentals are recognised as an expense in the period in which they are incurred.
8b. Operating expenses and share scheme charges
31 December 2017
Gross £m
Recoverable from co- and reinsurers
£mNet £m
Acquisition of insurance contracts*1 122.0 (93.3) 28.7
Administration and other marketing costs (insurance contracts) 353.5 (274.5) 79.0
Insurance contract expenses 475.5 (367.8) 107.7
Administration and other marketing costs (other) 223.6 – 223.6
Share scheme charges 54.4 (18.8) 35.6
Total expenses and share scheme charges 753.5 (386.6) 366.9
31 December 2016
Gross £m
Recoverable from co- and reinsurers
£mNet £m
Acquisition of insurance contracts*1 98.0 (75.4) 22.6
Administration and other marketing costs (insurance contracts) 293.9 (222.6) 71.3
Insurance contract expenses 391.9 (298.0) 93.9
Administration and other marketing costs (other) 206.6 – 206.6
Share scheme charges 50.3 (18.4) 31.9
Total expenses and share scheme charges 648.8 (316.4) 332.4
*1 Acquisition of insurance contracts expense excludes £19.8 million (2016: £20.8 million) of aggregator fees from other Group companies.
The £79.0 million (2016: £71.3 million) administration and marketing costs allocated to insurance contracts is principally made up of salary costs.
Analysis of other administration and other marketing costs:
31 December 2017 £m
31 December 2016 £m
Expenses relating to additional products and fees 58.9 49.9
Price comparison operating expenses 138.2 132.1
Other expenses 26.5 24.6
Total 223.6 206.6
Refer to note 12 for a reconciliation between insurance contract expenses and the reported expense ratio.
124 Admiral Group plc · Annual Report and Accounts 2017
Financial Statements: Notes to the Financial Statements
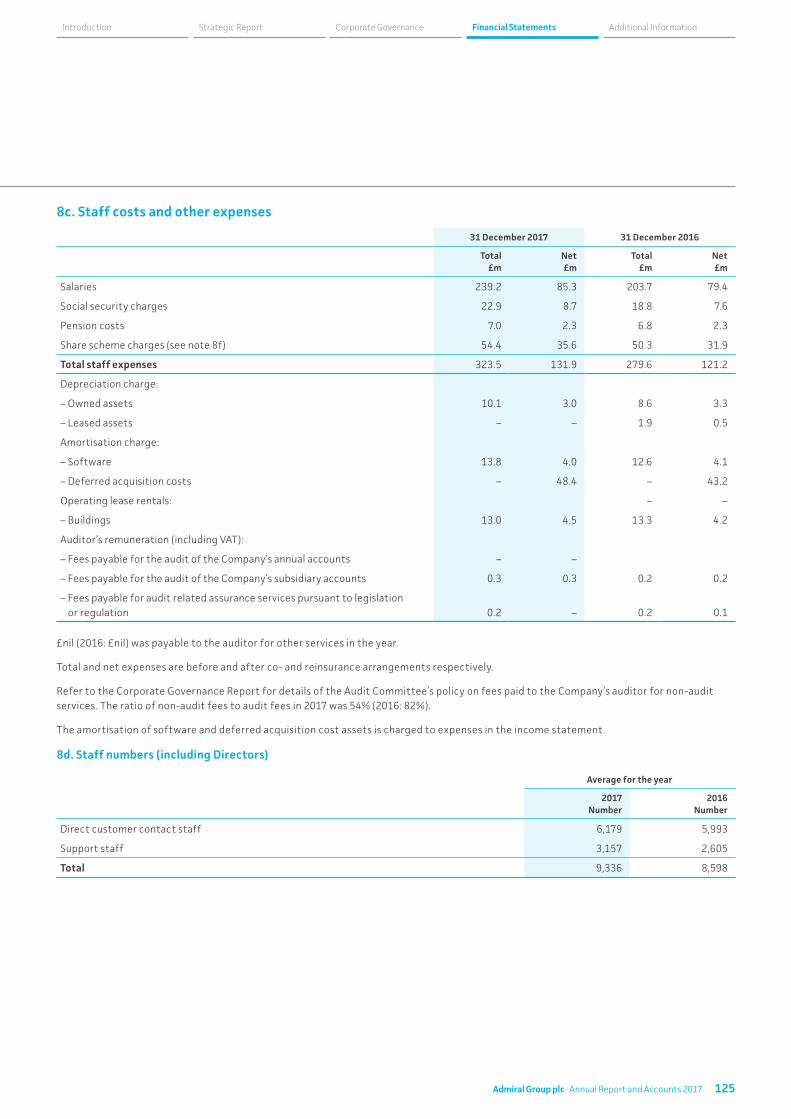
8c. Staff costs and other expenses
31 December 2017 31 December 2016
Total £m
Net £m
Total £m
Net £m
Salaries 239.2 85.3 203.7 79.4
Social security charges 22.9 8.7 18.8 7.6
Pension costs 7.0 2.3 6.8 2.3
Share scheme charges (see note 8f) 54.4 35.6 50.3 31.9
Total staff expenses 323.5 131.9 279.6 121.2
Depreciation charge:
– Owned assets 10.1 3.0 8.6 3.3
– Leased assets – – 1.9 0.5
Amortisation charge:
– Software 13.8 4.0 12.6 4.1
– Deferred acquisition costs – 48.4 – 43.2
Operating lease rentals: – –
– Buildings 13.0 4.5 13.3 4.2
Auditor’s remuneration (including VAT):
– Fees payable for the audit of the Company’s annual accounts – –
– Fees payable for the audit of the Company’s subsidiary accounts 0.3 0.3 0.2 0.2
– Fees payable for audit related assurance services pursuant to legislation or regulation 0.2 – 0.2 0.1
£nil (2016: £nil) was payable to the auditor for other services in the year.
Total and net expenses are before and after co- and reinsurance arrangements respectively.
Refer to the Corporate Governance Report for details of the Audit Committee’s policy on fees paid to the Company’s auditor for non-audit services. The ratio of non-audit fees to audit fees in 2017 was 54% (2016: 82%).
The amortisation of software and deferred acquisition cost assets is charged to expenses in the income statement.
8d. Staff numbers (including Directors)
Average for the year
2017 Number
2016 Number
Direct customer contact staff 6,179 5,993
Support staff 3,157 2,605
Total 9,336 8,598
125Admiral Group plc · Annual Report and Accounts 2017
Financial Statements Additional InformationCorporate GovernanceStrategic ReportIntroduction
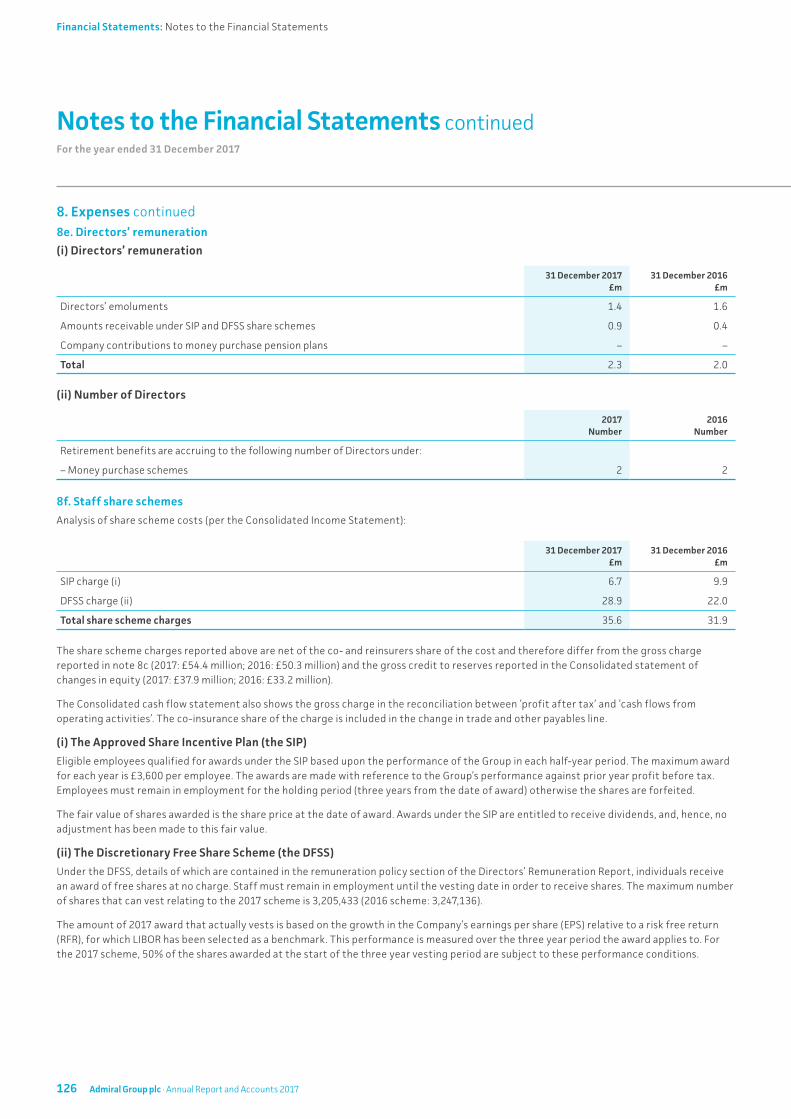
Notes to the Financial Statements continuedFor the year ended 31 December 2017
8. Expenses continued8e. Directors’ remuneration
(i) Directors’ remuneration
31 December 2017 £m
31 December 2016 £m
Directors’ emoluments 1.4 1.6
Amounts receivable under SIP and DFSS share schemes 0.9 0.4
Company contributions to money purchase pension plans – –
Total 2.3 2.0
(ii) Number of Directors
2017 Number
2016 Number
Retirement benefits are accruing to the following number of Directors under:
– Money purchase schemes 2 2
8f. Staff share schemes
Analysis of share scheme costs (per the Consolidated Income Statement):
31 December 2017 £m
31 December 2016 £m
SIP charge (i) 6.7 9.9
DFSS charge (ii) 28.9 22.0
Total share scheme charges 35.6 31.9
The share scheme charges reported above are net of the co- and reinsurers share of the cost and therefore differ from the gross charge reported in note 8c (2017: £54.4 million; 2016: £50.3 million) and the gross credit to reserves reported in the Consolidated statement of changes in equity (2017: £37.9 million; 2016: £33.2 million).
The Consolidated cash flow statement also shows the gross charge in the reconciliation between ‘profit after tax’ and ‘cash flows from operating activities’. The co-insurance share of the charge is included in the change in trade and other payables line.
(i) The Approved Share Incentive Plan (the SIP)
Eligible employees qualified for awards under the SIP based upon the performance of the Group in each half-year period. The maximum award for each year is £3,600 per employee. The awards are made with reference to the Group’s performance against prior year profit before tax. Employees must remain in employment for the holding period (three years from the date of award) otherwise the shares are forfeited.
The fair value of shares awarded is the share price at the date of award. Awards under the SIP are entitled to receive dividends, and, hence, no adjustment has been made to this fair value.
(ii) The Discretionary Free Share Scheme (the DFSS)
Under the DFSS, details of which are contained in the remuneration policy section of the Directors’ Remuneration Report, individuals receive an award of free shares at no charge. Staff must remain in employment until the vesting date in order to receive shares. The maximum number of shares that can vest relating to the 2017 scheme is 3,205,433 (2016 scheme: 3,247,136).
The amount of 2017 award that actually vests is based on the growth in the Company’s earnings per share (EPS) relative to a risk free return (RFR), for which LIBOR has been selected as a benchmark. This performance is measured over the three year period the award applies to. For the 2017 scheme, 50% of the shares awarded at the start of the three year vesting period are subject to these performance conditions.
126 Admiral Group plc · Annual Report and Accounts 2017
Financial Statements: Notes to the Financial Statements

The range of awards is as follows:
• If the growth in EPS is less than the RFR, no awards vest.
• EPS growth is equal to RFR – 10% of maximum award vests.
• To achieve the maximum award, EPS growth has to be 36 points higher than RFR over the three year period.
Between 10% and 100% of the maximum awards, a linear relationship exists.
For awards in 2016 and onwards there are now three performance conditions which the 50% not guaranteed to vest are subject to. These are three-year EPS growth vs. LIBOR, TSR vs. FTSE 350 (excluding investment companies), and ROE, weighted equally.
Performance measure
Performance range
Threshold Maximum
EPS growth vs. LIBOR Growth in line with LIBOR Growth of 10% p.a. in excess of LIBOR
TSR vs. FTSE 350 (excluding investment companies) Median Upper Quartile
ROE 25% 55%
Awards under the DFSS are not eligible for dividends (although a discretionary bonus is currently paid equivalent to the dividend that would have been paid on the respective shareholding) and hence the fair value of free shares to be awarded under this scheme has been revised downwards to take account of these distributions.
Number of free share awards committed at 31 December 2017
Awards outstanding*1 Vesting date
SIP H214 scheme 536,613 March 2018
SIP H115 scheme 636,612 August 2018
SIP H215 scheme 523,877 March 2019
SIP H116 scheme 501,785 September 2019
SIP H216 scheme 560,476 March 2020
SIP H117 scheme 506,815 August 2020
DFSS 2015 scheme 1st award 190,275 March 2018
DFSS 2015 scheme 2nd award 2,828,913 September 2018
DFSS 2016 scheme 1st award 199,346 March 2019
DFSS 2016 scheme 2nd award 3,053,904 September 2019
DFSS 2017 scheme 1st award 238,024 March 2020
DFSS 2017 scheme 2nd award 2,882,243 September 2020
Total awards committed 12,658,883
*1 Being the maximum number of awards expected to vest before accounting for expected staff attrition.
During the year ended 31 December 2017, awards under the SIP H213 and H114 schemes and the DFSS 2014 scheme vested. The total number of awards vesting for each scheme is as follows.
Number of free share awards vesting during the year ended 31 December 2017
Original awards Awards vested
SIP H213 scheme 514,500 393,100
SIP H114 scheme 575,016 450,642
DFSS 2014 scheme 1st award 203,292 125,394
DFSS 2014 scheme 2nd award 2,481,806 1,504,972
The weighted average market share price at the date of exercise for shares exercised during the year was £18.51 (2016: £20.09).
127Admiral Group plc · Annual Report and Accounts 2017
Financial Statements Additional InformationCorporate GovernanceStrategic ReportIntroduction
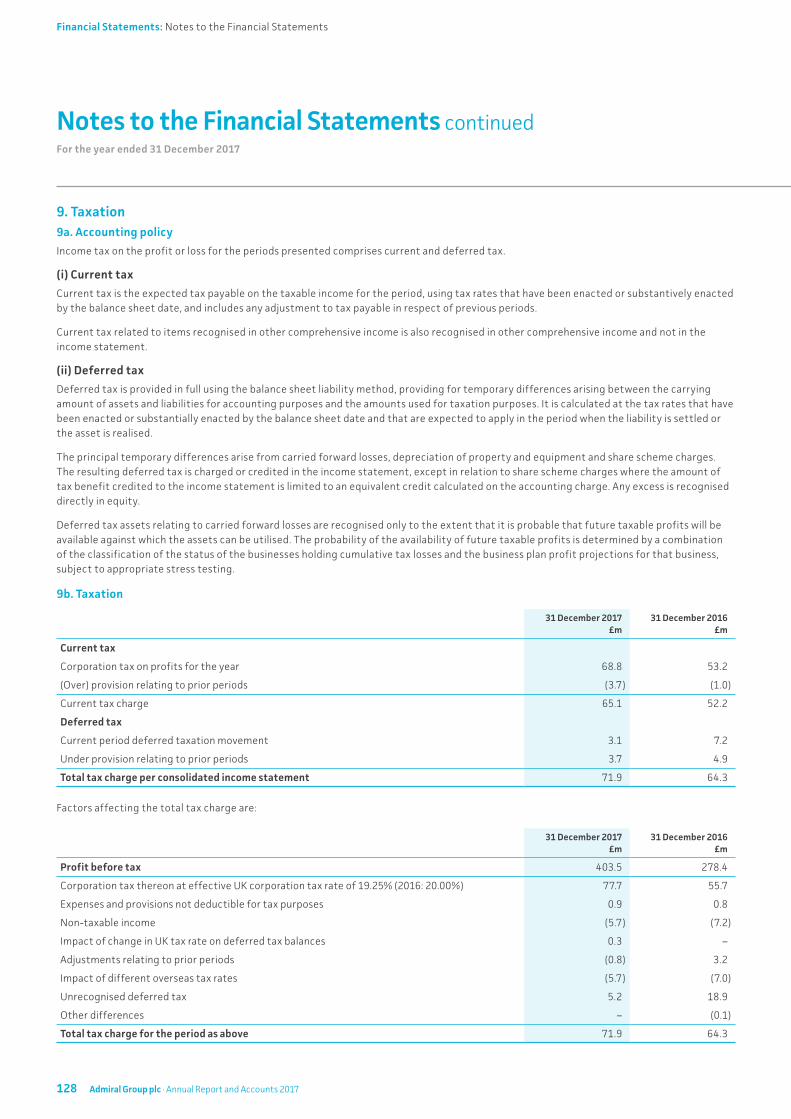
Notes to the Financial Statements continuedFor the year ended 31 December 2017
9. Taxation9a. Accounting policy
Income tax on the profit or loss for the periods presented comprises current and deferred tax.
(i) Current tax
Current tax is the expected tax payable on the taxable income for the period, using tax rates that have been enacted or substantively enacted by the balance sheet date, and includes any adjustment to tax payable in respect of previous periods.
Current tax related to items recognised in other comprehensive income is also recognised in other comprehensive income and not in the income statement.
(ii) Deferred tax
Deferred tax is provided in full using the balance sheet liability method, providing for temporary differences arising between the carrying amount of assets and liabilities for accounting purposes and the amounts used for taxation purposes. It is calculated at the tax rates that have been enacted or substantially enacted by the balance sheet date and that are expected to apply in the period when the liability is settled or the asset is realised.
The principal temporary differences arise from carried forward losses, depreciation of property and equipment and share scheme charges. The resulting deferred tax is charged or credited in the income statement, except in relation to share scheme charges where the amount of tax benefit credited to the income statement is limited to an equivalent credit calculated on the accounting charge. Any excess is recognised directly in equity.
Deferred tax assets relating to carried forward losses are recognised only to the extent that it is probable that future taxable profits will be available against which the assets can be utilised. The probability of the availability of future taxable profits is determined by a combination of the classification of the status of the businesses holding cumulative tax losses and the business plan profit projections for that business, subject to appropriate stress testing.
9b. Taxation
31 December 2017 £m
31 December 2016 £m
Current tax
Corporation tax on profits for the year 68.8 53.2
(Over) provision relating to prior periods (3.7) (1.0)
Current tax charge 65.1 52.2
Deferred tax
Current period deferred taxation movement 3.1 7.2
Under provision relating to prior periods 3.7 4.9
Total tax charge per consolidated income statement 71.9 64.3
Factors affecting the total tax charge are:
31 December 2017 £m
31 December 2016 £m
Profit before tax 403.5 278.4
Corporation tax thereon at effective UK corporation tax rate of 19.25% (2016: 20.00%) 77.7 55.7
Expenses and provisions not deductible for tax purposes 0.9 0.8
Non-taxable income (5.7) (7.2)
Impact of change in UK tax rate on deferred tax balances 0.3 –
Adjustments relating to prior periods (0.8) 3.2
Impact of different overseas tax rates (5.7) (7.0)
Unrecognised deferred tax 5.2 18.9
Other differences – (0.1)
Total tax charge for the period as above 71.9 64.3
128 Admiral Group plc · Annual Report and Accounts 2017
Financial Statements: Notes to the Financial Statements
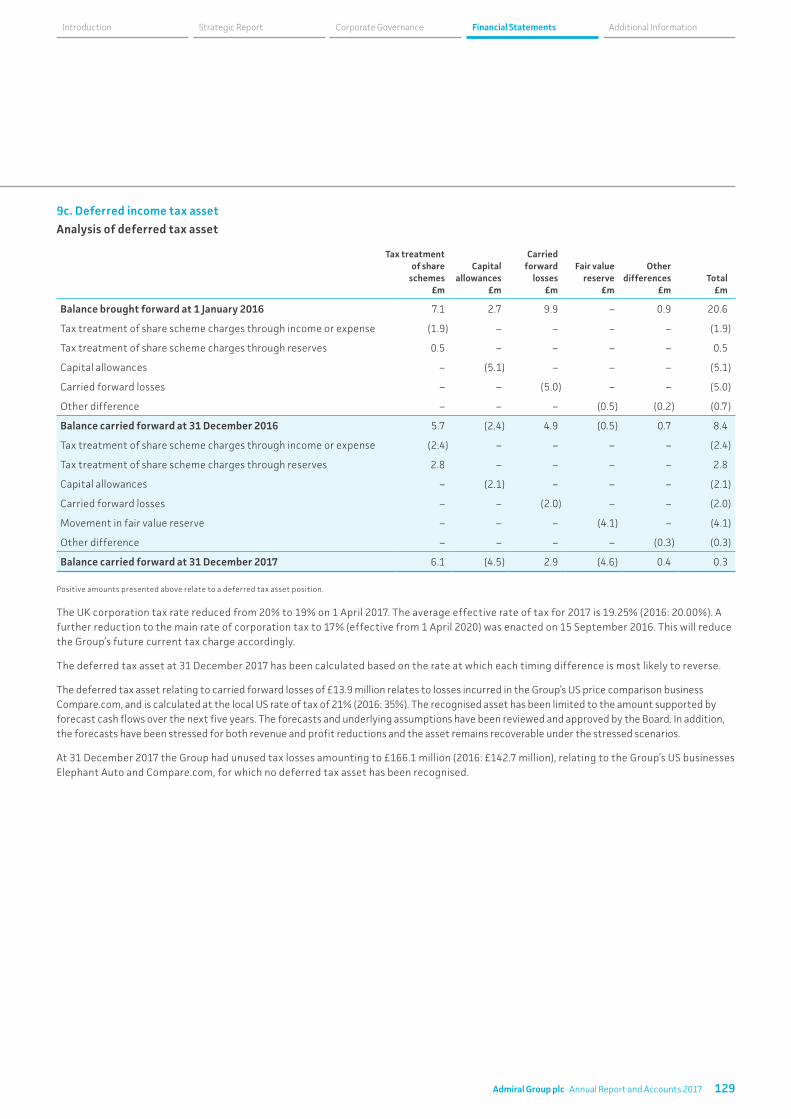
9c. Deferred income tax asset
Analysis of deferred tax asset
Tax treatment of share schemes
£m
Capital allowances
£m
Carried forward
losses £m
Fair value reserve
£m
Other differences
£mTotal
£m
Balance brought forward at 1 January 2016 7.1 2.7 9.9 – 0.9 20.6
Tax treatment of share scheme charges through income or expense (1.9) – – – – (1.9)
Tax treatment of share scheme charges through reserves 0.5 – – – – 0.5
Capital allowances – (5.1) – – – (5.1)
Carried forward losses – – (5.0) – – (5.0)
Other difference – – – (0.5) (0.2) (0.7)
Balance carried forward at 31 December 2016 5.7 (2.4) 4.9 (0.5) 0.7 8.4
Tax treatment of share scheme charges through income or expense (2.4) – – – – (2.4)
Tax treatment of share scheme charges through reserves 2.8 – – – – 2.8
Capital allowances – (2.1) – – – (2.1)
Carried forward losses – – (2.0) – – (2.0)
Movement in fair value reserve – – – (4.1) – (4.1)
Other difference – – – – (0.3) (0.3)
Balance carried forward at 31 December 2017 6.1 (4.5) 2.9 (4.6) 0.4 0.3
Positive amounts presented above relate to a deferred tax asset position.
The UK corporation tax rate reduced from 20% to 19% on 1 April 2017. The average effective rate of tax for 2017 is 19.25% (2016: 20.00%). A further reduction to the main rate of corporation tax to 17% (effective from 1 April 2020) was enacted on 15 September 2016. This will reduce the Group’s future current tax charge accordingly.
The deferred tax asset at 31 December 2017 has been calculated based on the rate at which each timing difference is most likely to reverse.
The deferred tax asset relating to carried forward losses of £13.9 million relates to losses incurred in the Group’s US price comparison business Compare.com, and is calculated at the local US rate of tax of 21% (2016: 35%). The recognised asset has been limited to the amount supported by forecast cash flows over the next five years. The forecasts and underlying assumptions have been reviewed and approved by the Board. In addition, the forecasts have been stressed for both revenue and profit reductions and the asset remains recoverable under the stressed scenarios.
At 31 December 2017 the Group had unused tax losses amounting to £166.1 million (2016: £142.7 million), relating to the Group’s US businesses Elephant Auto and Compare.com, for which no deferred tax asset has been recognised.
129Admiral Group plc · Annual Report and Accounts 2017
Financial Statements Additional InformationCorporate GovernanceStrategic ReportIntroduction
Notes to the Financial Statements continuedFor the year ended 31 December 2017
10. Other assets and other liabilities10a. Accounting policy
(i) Property and equipment, and depreciation
All property and equipment is stated at cost less accumulated depreciation. Depreciation is calculated using the straight line method to write off the cost less residual values of the assets over their useful economic lives. These useful economic lives are as follows:
Improvements to short leasehold buildings – four to ten years Computer equipment – two to four years Office equipment – four years Furniture and fittings – four years Motor vehicles – four years
(ii) Impairment of property and equipment
In the case of property and equipment, carrying values are reviewed at each balance sheet date to determine whether there are any indications of impairment. If any such indications exist, the asset’s recoverable amount is estimated and compared to the carrying value. The carrying value is the higher of the fair value of the asset less costs to sell, and the asset’s value in use. Impairment losses are recognised through the income statement.
(iii) Leased assets
The rental costs relating to assets held under operating leases are charged to the income statement on a straight line basis over the life of the lease.
Leases under the terms of which the Group assumes substantially all of the risks and rewards of ownership are classed as finance leases. Assets acquired under finance leases are included in property and equipment at fair value on acquisition and are depreciated in the same manner as equivalent owned assets. Finance lease and hire purchase obligations are included in creditors and the finance costs are spread over the periods of the agreements based on the net amount outstanding.
(iv) Intangible assets
Goodwill
All business combinations are accounted for using the acquisition method. Goodwill has been recognised in acquisitions of subsidiaries, and represents the difference between the cost of the acquisition and the fair value of the net identifiable assets acquired.
The classification and accounting treatment of acquisitions occurring before 1 January 2004 have not been reconsidered in preparing the Group’s opening IFRS balance sheet at 1 January 2004 due to the exemption available in IFRS 1 (First time adoption). In respect of acquisitions prior to 1 January 2004, goodwill is included at the transition date on the basis of its deemed cost, which represents the amount recorded under UK GAAP, which was tested for impairment at the transition date. On transition, amortisation of goodwill has ceased as required by IAS 38.
Goodwill is stated at cost less any accumulated impairment losses. Goodwill is allocated to cash generating units (CGUs) according to business segment and is reviewed annually for impairment.
The goodwill held on the balance sheet at 31 December 2017 is allocated solely to the UK Car Insurance segment.
130 Admiral Group plc · Annual Report and Accounts 2017
Financial Statements: Notes to the Financial Statements
Impairment of goodwill
The annual impairment review involves comparing the carrying amount to the estimated recoverable amount (by allocating the goodwill to CGUs) and recognising an impairment loss if the recoverable amount is lower. Impairment losses are recognised through the income statement and are not subsequently reversed.
The recoverable amount is the greater of the fair value of the asset less costs to sell and the value in use of the CGU.
The value in use calculations use cash flow projections based on financial budgets approved by management covering a three year period. Cash flows beyond this period are considered, but not included in the calculation.
The key assumptions used in the value in use calculations are those regarding growth rates and expected changes in pricing and expenses incurred during the period. Management estimates growth rates and changes in pricing based on past practices and expected future changes in the market.
The headroom above the goodwill carrying value is very significant, and there is no foreseeable event that would eliminate this margin.
Deferred acquisition costs
Acquisition costs comprise all direct and indirect costs arising from the conclusion of insurance contracts. Deferred acquisition costs represent the proportion of acquisition costs incurred that correspond to the unearned premiums provision at the balance sheet date. This balance is held as an intangible asset. It is amortised over the term of the contract as premium is earned.
Software
Purchased software is recognised as an intangible asset and amortised over its expected useful life (generally the licence term). Internally generated software is recognised as an intangible asset, with directly attributable costs incurred in the development stage capitalised. The internally generated software assets are amortised over the expected useful life of the systems and amortisation commences when the software is available for use.
The carrying value of software is reviewed every six months for evidence of impairment, with the value being written down if any impairment exists. Impairment may be reversed if conditions subsequently improve.
(iv) Provisions, Contingent Liabilities and Contingent Assets
Provisions are recognised when a legal or constructive obligation arises as a result of an event that occurred before the balance sheet date, when a cash-outflow relating to this obligation is probable and when the amount can be estimated reliably.
Where an obligation exists, but the likelihood of a cash out-flow or the amount is uncertain, or where there is a possible obligation arising from a past event that is contingent on a future event, a contingent liability is disclosed.
Contingent assets are possible assets that arise from past events, whose existence will be confirmed only by the occurrence or non-occurrence of future events. Where it is probable that a cash-inflow will arise from a contingent asset, this is disclosed.
131Admiral Group plc · Annual Report and Accounts 2017
Financial Statements Additional InformationCorporate GovernanceStrategic ReportIntroduction
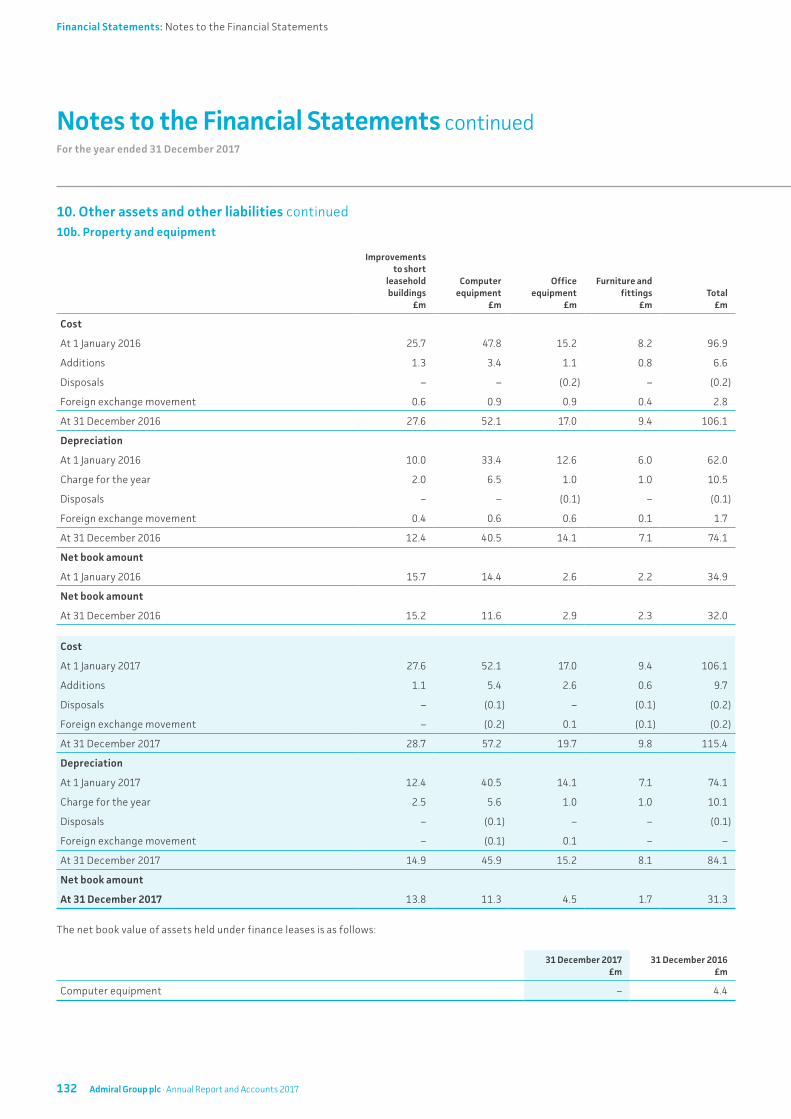
Notes to the Financial Statements continuedFor the year ended 31 December 2017
10. Other assets and other liabilities continued10b. Property and equipment
Improvements to short
leasehold buildings
£m
Computer equipment
£m
Office equipment
£m
Furniture and fittings
£mTotal
£m
Cost
At 1 January 2016 25.7 47.8 15.2 8.2 96.9
Additions 1.3 3.4 1.1 0.8 6.6
Disposals – – (0.2) – (0.2)
Foreign exchange movement 0.6 0.9 0.9 0.4 2.8
At 31 December 2016 27.6 52.1 17.0 9.4 106.1
Depreciation
At 1 January 2016 10.0 33.4 12.6 6.0 62.0
Charge for the year 2.0 6.5 1.0 1.0 10.5
Disposals – – (0.1) – (0.1)
Foreign exchange movement 0.4 0.6 0.6 0.1 1.7
At 31 December 2016 12.4 40.5 14.1 7.1 74.1
Net book amount
At 1 January 2016 15.7 14.4 2.6 2.2 34.9
Net book amount
At 31 December 2016 15.2 11.6 2.9 2.3 32.0
Cost
At 1 January 2017 27.6 52.1 17.0 9.4 106.1
Additions 1.1 5.4 2.6 0.6 9.7
Disposals – (0.1) – (0.1) (0.2)
Foreign exchange movement – (0.2) 0.1 (0.1) (0.2)
At 31 December 2017 28.7 57.2 19.7 9.8 115.4
Depreciation
At 1 January 2017 12.4 40.5 14.1 7.1 74.1
Charge for the year 2.5 5.6 1.0 1.0 10.1
Disposals – (0.1) – – (0.1)
Foreign exchange movement – (0.1) 0.1 – –
At 31 December 2017 14.9 45.9 15.2 8.1 84.1
Net book amount
At 31 December 2017 13.8 11.3 4.5 1.7 31.3
The net book value of assets held under finance leases is as follows:
31 December 2017 £m
31 December 2016 £m
Computer equipment – 4.4
132 Admiral Group plc · Annual Report and Accounts 2017
Financial Statements: Notes to the Financial Statements
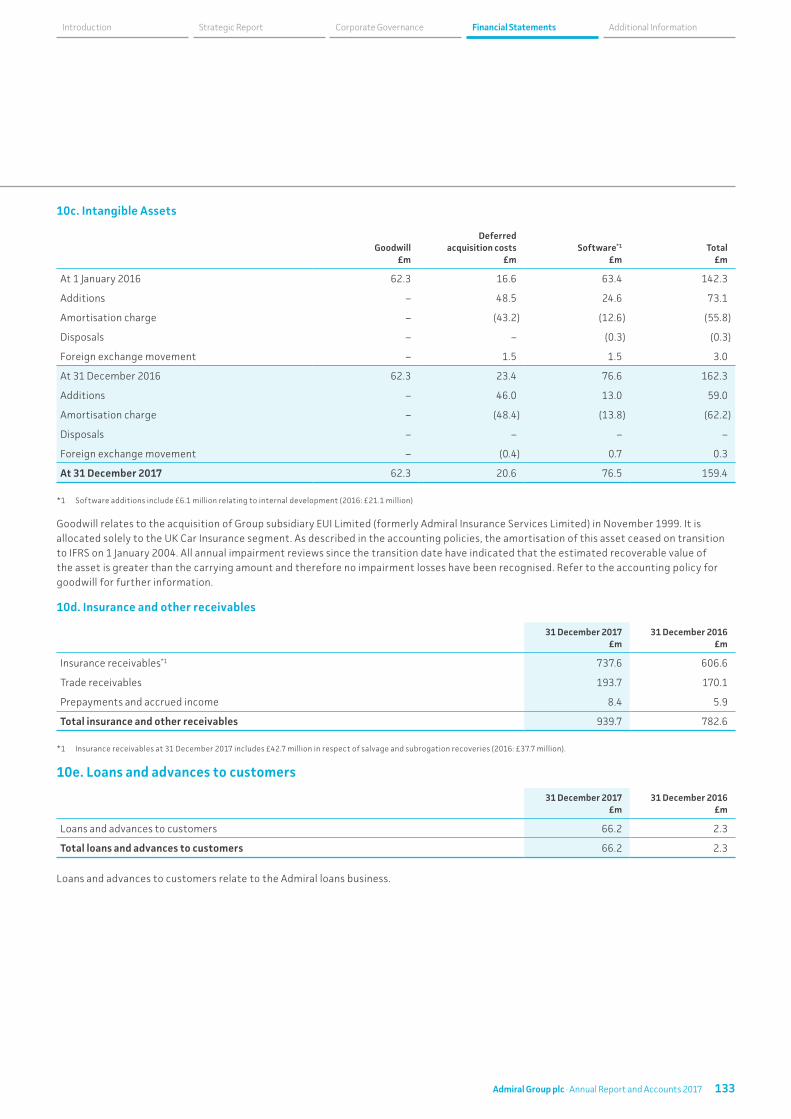
10c. Intangible Assets
Goodwill £m
Deferred acquisition costs
£mSoftware*1
£mTotal
£m
At 1 January 2016 62.3 16.6 63.4 142.3
Additions – 48.5 24.6 73.1
Amortisation charge – (43.2) (12.6) (55.8)
Disposals – – (0.3) (0.3)
Foreign exchange movement – 1.5 1.5 3.0
At 31 December 2016 62.3 23.4 76.6 162.3
Additions – 46.0 13.0 59.0
Amortisation charge – (48.4) (13.8) (62.2)
Disposals – – – –
Foreign exchange movement – (0.4) 0.7 0.3
At 31 December 2017 62.3 20.6 76.5 159.4
*1 Software additions include £6.1 million relating to internal development (2016: £21.1 million)
Goodwill relates to the acquisition of Group subsidiary EUI Limited (formerly Admiral Insurance Services Limited) in November 1999. It is allocated solely to the UK Car Insurance segment. As described in the accounting policies, the amortisation of this asset ceased on transition to IFRS on 1 January 2004. All annual impairment reviews since the transition date have indicated that the estimated recoverable value of the asset is greater than the carrying amount and therefore no impairment losses have been recognised. Refer to the accounting policy for goodwill for further information.
10d. Insurance and other receivables
31 December 2017 £m
31 December 2016 £m
Insurance receivables*1 737.6 606.6
Trade receivables 193.7 170.1
Prepayments and accrued income 8.4 5.9
Total insurance and other receivables 939.7 782.6
*1 Insurance receivables at 31 December 2017 includes £42.7 million in respect of salvage and subrogation recoveries (2016: £37.7 million).
10e. Loans and advances to customers
31 December 2017 £m
31 December 2016 £m
Loans and advances to customers 66.2 2.3
Total loans and advances to customers 66.2 2.3
Loans and advances to customers relate to the Admiral loans business.
133Admiral Group plc · Annual Report and Accounts 2017
Financial Statements Additional InformationCorporate GovernanceStrategic ReportIntroduction
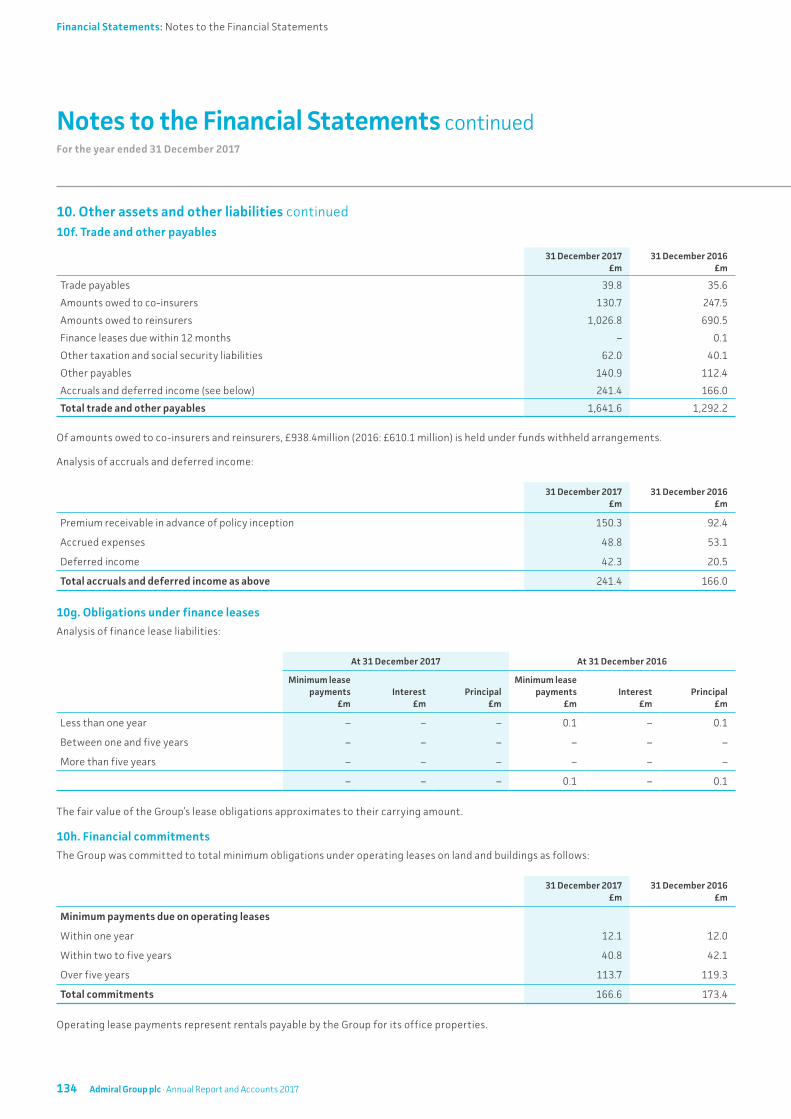
Notes to the Financial Statements continuedFor the year ended 31 December 2017
10. Other assets and other liabilities continued10f. Trade and other payables
31 December 2017 £m
31 December 2016 £m
Trade payables 39.8 35.6
Amounts owed to co-insurers 130.7 247.5
Amounts owed to reinsurers 1,026.8 690.5
Finance leases due within 12 months – 0.1
Other taxation and social security liabilities 62.0 40.1
Other payables 140.9 112.4
Accruals and deferred income (see below) 241.4 166.0
Total trade and other payables 1,641.6 1,292.2
Of amounts owed to co-insurers and reinsurers, £938.4million (2016: £610.1 million) is held under funds withheld arrangements.
Analysis of accruals and deferred income:
31 December 2017 £m
31 December 2016 £m
Premium receivable in advance of policy inception 150.3 92.4
Accrued expenses 48.8 53.1
Deferred income 42.3 20.5
Total accruals and deferred income as above 241.4 166.0
10g. Obligations under finance leases
Analysis of finance lease liabilities:
At 31 December 2017 At 31 December 2016
Minimum lease payments
£mInterest
£mPrincipal
£m
Minimum lease payments
£mInterest
£mPrincipal
£m
Less than one year – – – 0.1 – 0.1
Between one and five years – – – – – –
More than five years – – – – – –
– – – 0.1 – 0.1
The fair value of the Group’s lease obligations approximates to their carrying amount.
10h. Financial commitments
The Group was committed to total minimum obligations under operating leases on land and buildings as follows:
31 December 2017 £m
31 December 2016 £m
Minimum payments due on operating leases
Within one year 12.1 12.0
Within two to five years 40.8 42.1
Over five years 113.7 119.3
Total commitments 166.6 173.4
Operating lease payments represent rentals payable by the Group for its office properties.
134 Admiral Group plc · Annual Report and Accounts 2017
Financial Statements: Notes to the Financial Statements
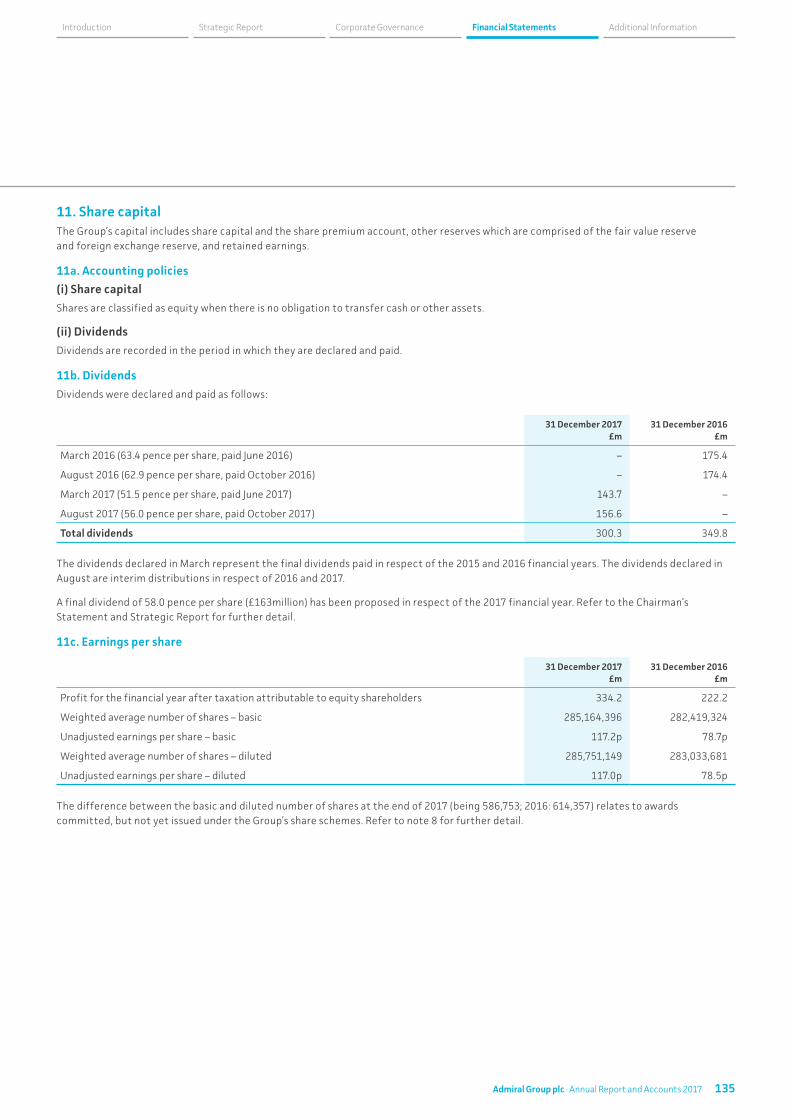
11. Share capitalThe Group’s capital includes share capital and the share premium account, other reserves which are comprised of the fair value reserve and foreign exchange reserve, and retained earnings.
11a. Accounting policies
(i) Share capital
Shares are classified as equity when there is no obligation to transfer cash or other assets.
(ii) Dividends
Dividends are recorded in the period in which they are declared and paid.
11b. Dividends
Dividends were declared and paid as follows:
31 December 2017 £m
31 December 2016 £m
March 2016 (63.4 pence per share, paid June 2016) – 175.4
August 2016 (62.9 pence per share, paid October 2016) – 174.4
March 2017 (51.5 pence per share, paid June 2017) 143.7 –
August 2017 (56.0 pence per share, paid October 2017) 156.6 –
Total dividends 300.3 349.8
The dividends declared in March represent the final dividends paid in respect of the 2015 and 2016 financial years. The dividends declared in August are interim distributions in respect of 2016 and 2017.
A final dividend of 58.0 pence per share (£163million) has been proposed in respect of the 2017 financial year. Refer to the Chairman’s Statement and Strategic Report for further detail.
11c. Earnings per share
31 December 2017 £m
31 December 2016 £m
Profit for the financial year after taxation attributable to equity shareholders 334.2 222.2
Weighted average number of shares – basic 285,164,396 282,419,324
Unadjusted earnings per share – basic 117.2p 78.7p
Weighted average number of shares – diluted 285,751,149 283,033,681
Unadjusted earnings per share – diluted 117.0p 78.5p
The difference between the basic and diluted number of shares at the end of 2017 (being 586,753; 2016: 614,357) relates to awards committed, but not yet issued under the Group’s share schemes. Refer to note 8 for further detail.
135Admiral Group plc · Annual Report and Accounts 2017
Financial Statements Additional InformationCorporate GovernanceStrategic ReportIntroduction
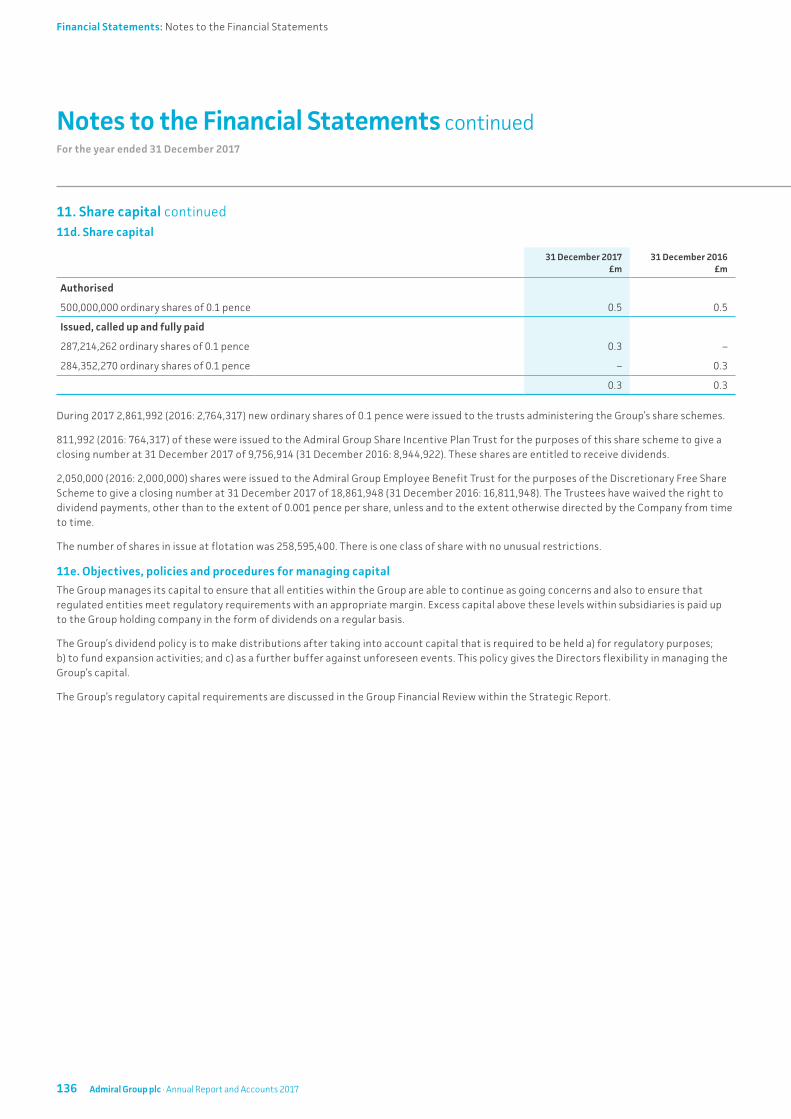
Notes to the Financial Statements continuedFor the year ended 31 December 2017
11. Share capital continued11d. Share capital
31 December 2017 £m
31 December 2016 £m
Authorised
500,000,000 ordinary shares of 0.1 pence 0.5 0.5
Issued, called up and fully paid
287,214,262 ordinary shares of 0.1 pence 0.3 –
284,352,270 ordinary shares of 0.1 pence – 0.3
0.3 0.3
During 2017 2,861,992 (2016: 2,764,317) new ordinary shares of 0.1 pence were issued to the trusts administering the Group’s share schemes.
811,992 (2016: 764,317) of these were issued to the Admiral Group Share Incentive Plan Trust for the purposes of this share scheme to give a closing number at 31 December 2017 of 9,756,914 (31 December 2016: 8,944,922). These shares are entitled to receive dividends.
2,050,000 (2016: 2,000,000) shares were issued to the Admiral Group Employee Benefit Trust for the purposes of the Discretionary Free Share Scheme to give a closing number at 31 December 2017 of 18,861,948 (31 December 2016: 16,811,948). The Trustees have waived the right to dividend payments, other than to the extent of 0.001 pence per share, unless and to the extent otherwise directed by the Company from time to time.
The number of shares in issue at flotation was 258,595,400. There is one class of share with no unusual restrictions.
11e. Objectives, policies and procedures for managing capital
The Group manages its capital to ensure that all entities within the Group are able to continue as going concerns and also to ensure that regulated entities meet regulatory requirements with an appropriate margin. Excess capital above these levels within subsidiaries is paid up to the Group holding company in the form of dividends on a regular basis.
The Group’s dividend policy is to make distributions after taking into account capital that is required to be held a) for regulatory purposes; b) to fund expansion activities; and c) as a further buffer against unforeseen events. This policy gives the Directors flexibility in managing the Group’s capital.
The Group’s regulatory capital requirements are discussed in the Group Financial Review within the Strategic Report.
136 Admiral Group plc · Annual Report and Accounts 2017
Financial Statements: Notes to the Financial Statements
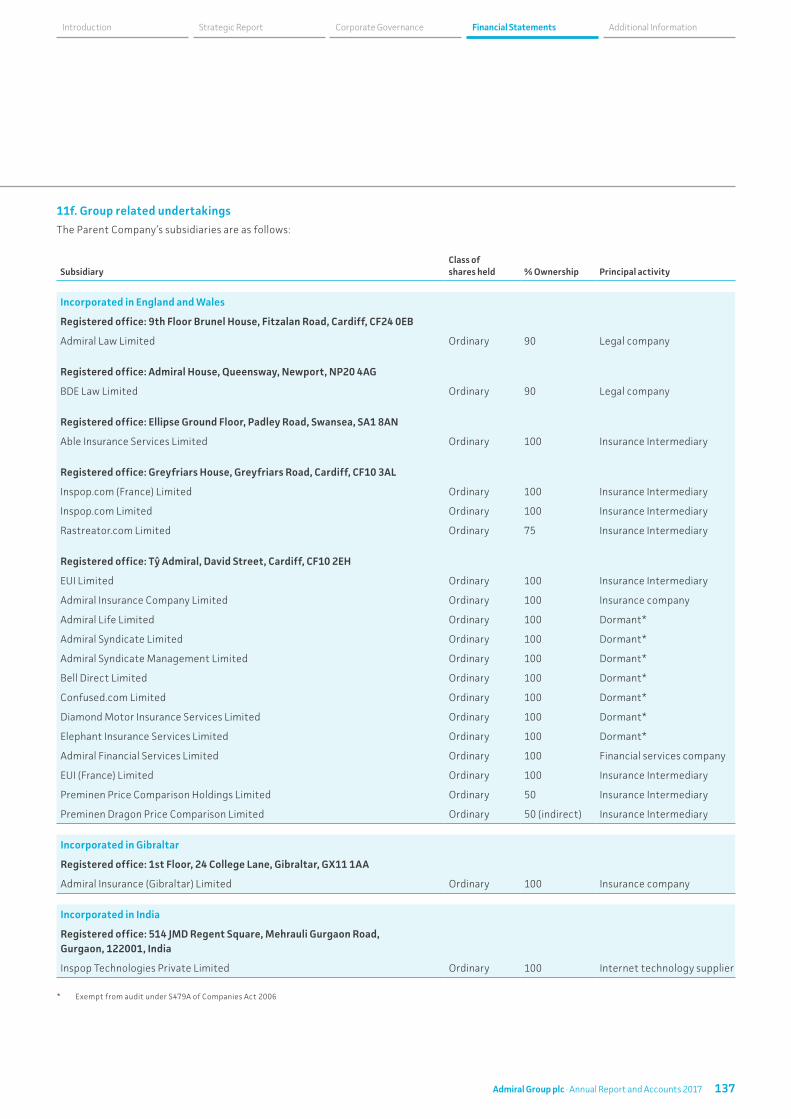
11f. Group related undertakings
The Parent Company’s subsidiaries are as follows:
SubsidiaryClass of shares held % Ownership Principal activity
Incorporated in England and Wales
Registered office: 9th Floor Brunel House, Fitzalan Road, Cardiff, CF24 0EB
Admiral Law Limited Ordinary 90 Legal company
Registered office: Admiral House, Queensway, Newport, NP20 4AG
BDE Law Limited Ordinary 90 Legal company
Registered office: Ellipse Ground Floor, Padley Road, Swansea, SA1 8AN
Able Insurance Services Limited Ordinary 100 Insurance Intermediary
Registered office: Greyfriars House, Greyfriars Road, Cardiff, CF10 3AL
Inspop.com (France) Limited Ordinary 100 Insurance Intermediary
Inspop.com Limited Ordinary 100 Insurance Intermediary
Rastreator.com Limited Ordinary 75 Insurance Intermediary
Registered office: Tŷ Admiral, David Street, Cardiff, CF10 2EH
EUI Limited Ordinary 100 Insurance Intermediary
Admiral Insurance Company Limited Ordinary 100 Insurance company
Admiral Life Limited Ordinary 100 Dormant*
Admiral Syndicate Limited Ordinary 100 Dormant*
Admiral Syndicate Management Limited Ordinary 100 Dormant*
Bell Direct Limited Ordinary 100 Dormant*
Confused.com Limited Ordinary 100 Dormant*
Diamond Motor Insurance Services Limited Ordinary 100 Dormant*
Elephant Insurance Services Limited Ordinary 100 Dormant*
Admiral Financial Services Limited Ordinary 100 Financial services company
EUI (France) Limited Ordinary 100 Insurance Intermediary
Preminen Price Comparison Holdings Limited Ordinary 50 Insurance Intermediary
Preminen Dragon Price Comparison Limited Ordinary 50 (indirect) Insurance Intermediary
Incorporated in Gibraltar
Registered office: 1st Floor, 24 College Lane, Gibraltar, GX11 1AA
Admiral Insurance (Gibraltar) Limited Ordinary 100 Insurance company
Incorporated in India
Registered office: 514 JMD Regent Square, Mehrauli Gurgaon Road, Gurgaon, 122001, India
Inspop Technologies Private Limited Ordinary 100 Internet technology supplier
* Exempt from audit under S479A of Companies Act 2006
137Admiral Group plc · Annual Report and Accounts 2017
Financial Statements Additional InformationCorporate GovernanceStrategic ReportIntroduction
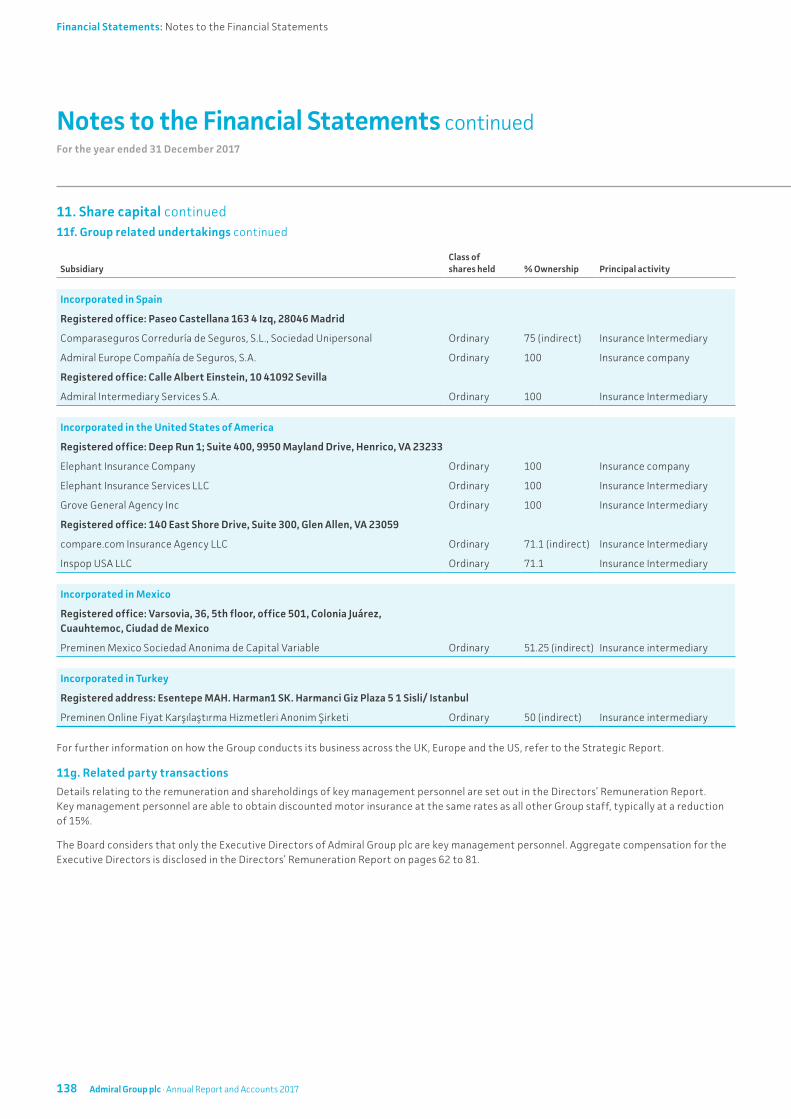
For the year ended 31 December 2017
Notes to the Financial Statements continued
11. Share capital continued11f. Group related undertakings continued
SubsidiaryClass of shares held % Ownership Principal activity
Incorporated in Spain
Registered office: Paseo Castellana 163 4 Izq, 28046 Madrid
Comparaseguros Correduría de Seguros, S.L., Sociedad Unipersonal Ordinary 75 (indirect) Insurance Intermediary
Admiral Europe Compañía de Seguros, S.A. Ordinary 100 Insurance company
Registered office: Calle Albert Einstein, 10 41092 Sevilla
Admiral Intermediary Services S.A. Ordinary 100 Insurance Intermediary
Incorporated in the United States of America
Registered office: Deep Run 1; Suite 400, 9950 Mayland Drive, Henrico, VA 23233
Elephant Insurance Company Ordinary 100 Insurance company
Elephant Insurance Services LLC Ordinary 100 Insurance Intermediary
Grove General Agency Inc Ordinary 100 Insurance Intermediary
Registered office: 140 East Shore Drive, Suite 300, Glen Allen, VA 23059
compare.com Insurance Agency LLC Ordinary 71.1 (indirect) Insurance Intermediary
Inspop USA LLC Ordinary 71.1 Insurance Intermediary
Incorporated in Mexico
Registered office: Varsovia, 36, 5th floor, office 501, Colonia Juárez, Cuauhtemoc, Ciudad de Mexico
Preminen Mexico Sociedad Anonima de Capital Variable Ordinary 51.25 (indirect) Insurance intermediary
Incorporated in Turkey
Registered address: Esentepe MAH. Harman1 SK. Harmanci Giz Plaza 5 1 Sisli/ Istanbul
Preminen Online Fiyat Karşılaştırma Hizmetleri Anonim Şirketi Ordinary 50 (indirect) Insurance intermediary
For further information on how the Group conducts its business across the UK, Europe and the US, refer to the Strategic Report.
11g. Related party transactions
Details relating to the remuneration and shareholdings of key management personnel are set out in the Directors’ Remuneration Report. Key management personnel are able to obtain discounted motor insurance at the same rates as all other Group staff, typically at a reduction of 15%.
The Board considers that only the Executive Directors of Admiral Group plc are key management personnel. Aggregate compensation for the Executive Directors is disclosed in the Directors’ Remuneration Report on pages 62 to 81.
138 Admiral Group plc · Annual Report and Accounts 2017
Financial Statements: Notes to the Financial Statements
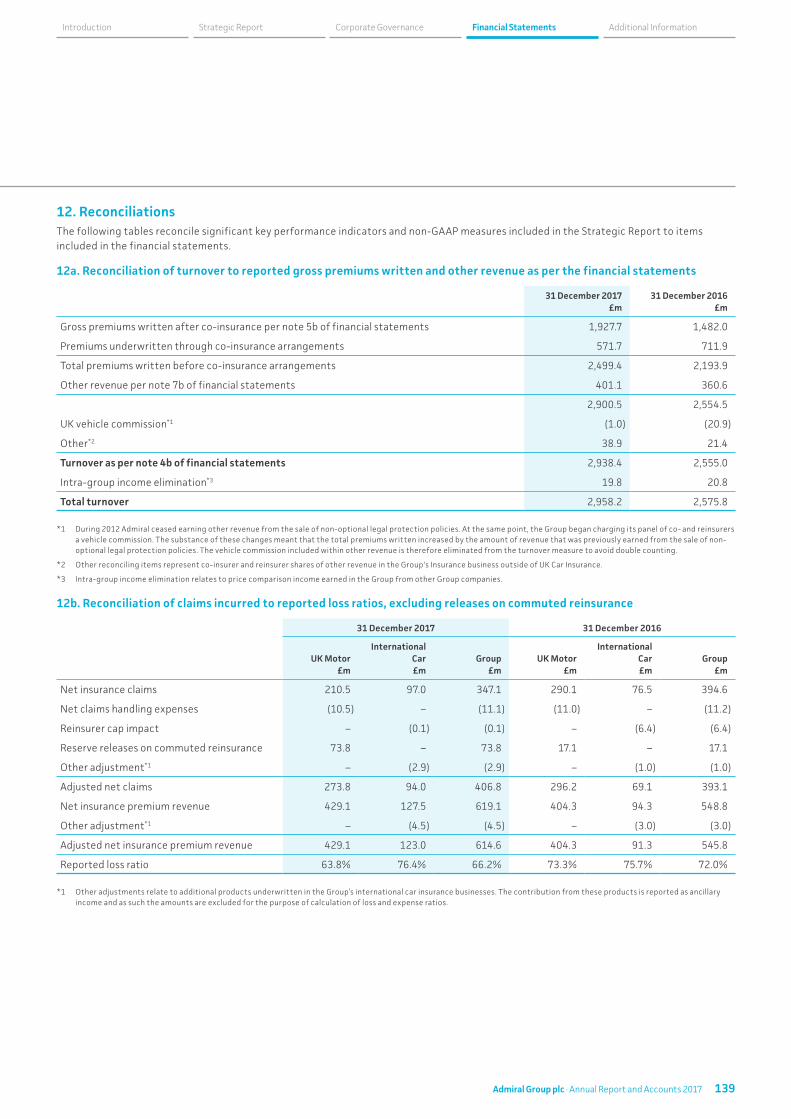
12. ReconciliationsThe following tables reconcile significant key performance indicators and non-GAAP measures included in the Strategic Report to items included in the financial statements.
12a. Reconciliation of turnover to reported gross premiums written and other revenue as per the financial statements
31 December 2017 £m
31 December 2016 £m
Gross premiums written after co-insurance per note 5b of financial statements 1,927.7 1,482.0
Premiums underwritten through co-insurance arrangements 571.7 711.9
Total premiums written before co-insurance arrangements 2,499.4 2,193.9
Other revenue per note 7b of financial statements 401.1 360.6
2,900.5 2,554.5
UK vehicle commission*1 (1.0) (20.9)
Other*2 38.9 21.4
Turnover as per note 4b of financial statements 2,938.4 2,555.0
Intra-group income elimination*3 19.8 20.8
Total turnover 2,958.2 2,575.8
*1 During 2012 Admiral ceased earning other revenue from the sale of non-optional legal protection policies. At the same point, the Group began charging its panel of co- and reinsurers a vehicle commission. The substance of these changes meant that the total premiums written increased by the amount of revenue that was previously earned from the sale of non-optional legal protection policies. The vehicle commission included within other revenue is therefore eliminated from the turnover measure to avoid double counting.
*2 Other reconciling items represent co-insurer and reinsurer shares of other revenue in the Group's Insurance business outside of UK Car Insurance.
*3 Intra-group income elimination relates to price comparison income earned in the Group from other Group companies.
12b. Reconciliation of claims incurred to reported loss ratios, excluding releases on commuted reinsurance
31 December 2017 31 December 2016
UK Motor£m
International Car £m
Group£m
UK Motor £m
International Car£m
Group £m
Net insurance claims 210.5 97.0 347.1 290.1 76.5 394.6
Net claims handling expenses (10.5) – (11.1) (11.0) – (11.2)
Reinsurer cap impact – (0.1) (0.1) – (6.4) (6.4)
Reserve releases on commuted reinsurance 73.8 – 73.8 17.1 – 17.1
Other adjustment*1 – (2.9) (2.9) – (1.0) (1.0)
Adjusted net claims 273.8 94.0 406.8 296.2 69.1 393.1
Net insurance premium revenue 429.1 127.5 619.1 404.3 94.3 548.8
Other adjustment*1 – (4.5) (4.5) – (3.0) (3.0)
Adjusted net insurance premium revenue 429.1 123.0 614.6 404.3 91.3 545.8
Reported loss ratio 63.8% 76.4% 66.2% 73.3% 75.7% 72.0%
*1 Other adjustments relate to additional products underwritten in the Group’s international car insurance businesses. The contribution from these products is reported as ancillary income and as such the amounts are excluded for the purpose of calculation of loss and expense ratios.
139Admiral Group plc · Annual Report and Accounts 2017
Financial Statements Additional InformationCorporate GovernanceStrategic ReportIntroduction
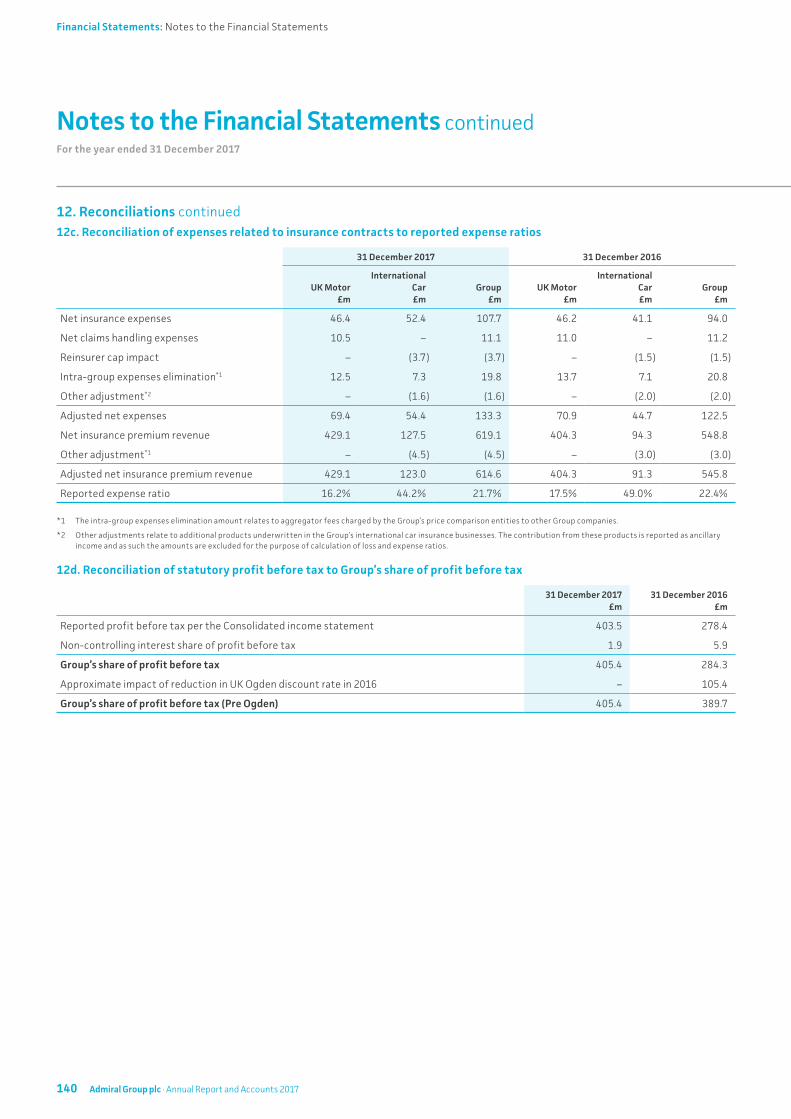
12. Reconciliations continued12c. Reconciliation of expenses related to insurance contracts to reported expense ratios
31 December 2017 31 December 2016
UK Motor£m
International Car £m
Group £m
UK Motor £m
International Car £m
Group £m
Net insurance expenses 46.4 52.4 107.7 46.2 41.1 94.0
Net claims handling expenses 10.5 – 11.1 11.0 – 11.2
Reinsurer cap impact – (3.7) (3.7) – (1.5) (1.5)
Intra-group expenses elimination*1 12.5 7.3 19.8 13.7 7.1 20.8
Other adjustment*2 – (1.6) (1.6) – (2.0) (2.0)
Adjusted net expenses 69.4 54.4 133.3 70.9 44.7 122.5
Net insurance premium revenue 429.1 127.5 619.1 404.3 94.3 548.8
Other adjustment*1 – (4.5) (4.5) – (3.0) (3.0)
Adjusted net insurance premium revenue 429.1 123.0 614.6 404.3 91.3 545.8
Reported expense ratio 16.2% 44.2% 21.7% 17.5% 49.0% 22.4%
*1 The intra-group expenses elimination amount relates to aggregator fees charged by the Group’s price comparison entities to other Group companies.
*2 Other adjustments relate to additional products underwritten in the Group’s international car insurance businesses. The contribution from these products is reported as ancillary income and as such the amounts are excluded for the purpose of calculation of loss and expense ratios.
12d. Reconciliation of statutory profit before tax to Group’s share of profit before tax
31 December 2017 £m
31 December 2016 £m
Reported profit before tax per the Consolidated income statement 403.5 278.4
Non-controlling interest share of profit before tax 1.9 5.9
Group’s share of profit before tax 405.4 284.3
Approximate impact of reduction in UK Ogden discount rate in 2016 – 105.4
Group’s share of profit before tax (Pre Ogden) 405.4 389.7
For the year ended 31 December 2017
Notes to the Financial Statements continued
140 Admiral Group plc · Annual Report and Accounts 2017
Financial Statements: Notes to the Financial Statements
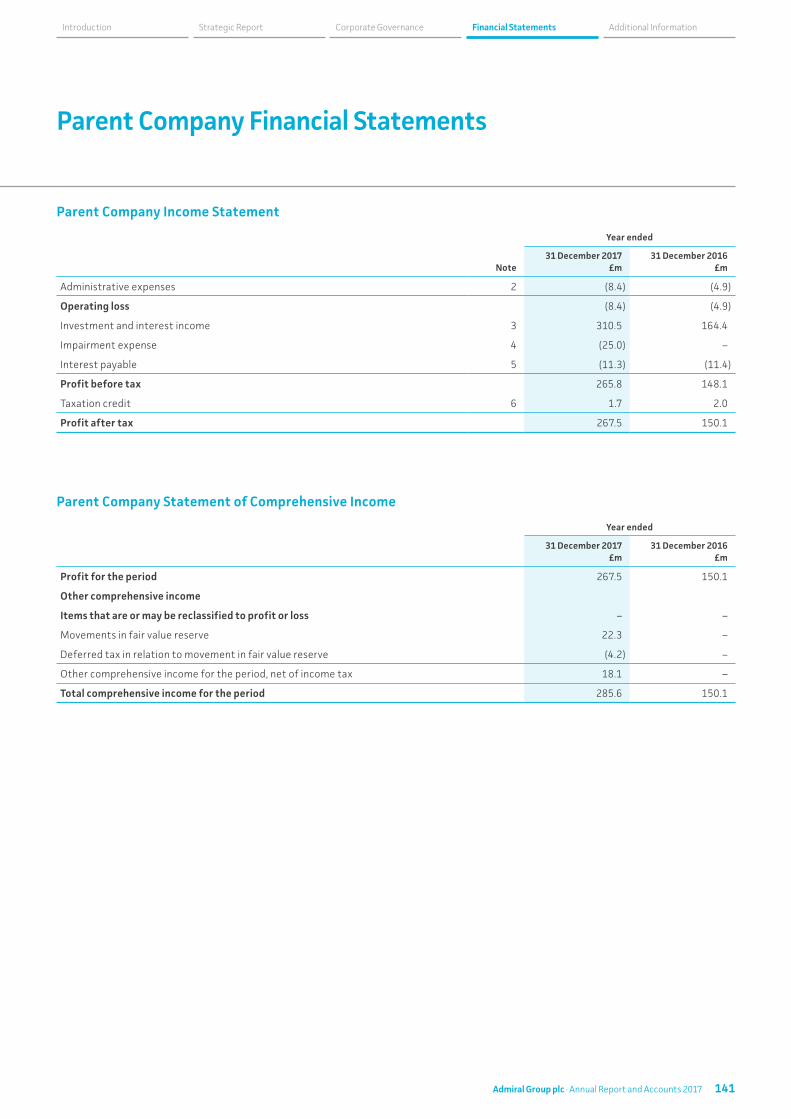
Parent Company Income Statement
Note
Year ended
31 December 2017 £m
31 December 2016 £m
Administrative expenses 2 (8.4) (4.9)
Operating loss (8.4) (4.9)
Investment and interest income 3 310.5 164.4
Impairment expense 4 (25.0) –
Interest payable 5 (11.3) (11.4)
Profit before tax 265.8 148.1
Taxation credit 6 1.7 2.0
Profit after tax 267.5 150.1
Parent Company Statement of Comprehensive Income
Year ended
31 December 2017 £m
31 December 2016 £m
Profit for the period 267.5 150.1
Other comprehensive income
Items that are or may be reclassified to profit or loss – –
Movements in fair value reserve 22.3 –
Deferred tax in relation to movement in fair value reserve (4.2) –
Other comprehensive income for the period, net of income tax 18.1 –
Total comprehensive income for the period 285.6 150.1
Parent Company Financial Statements
141Admiral Group plc · Annual Report and Accounts 2017
Financial Statements Additional InformationCorporate GovernanceStrategic ReportIntroduction
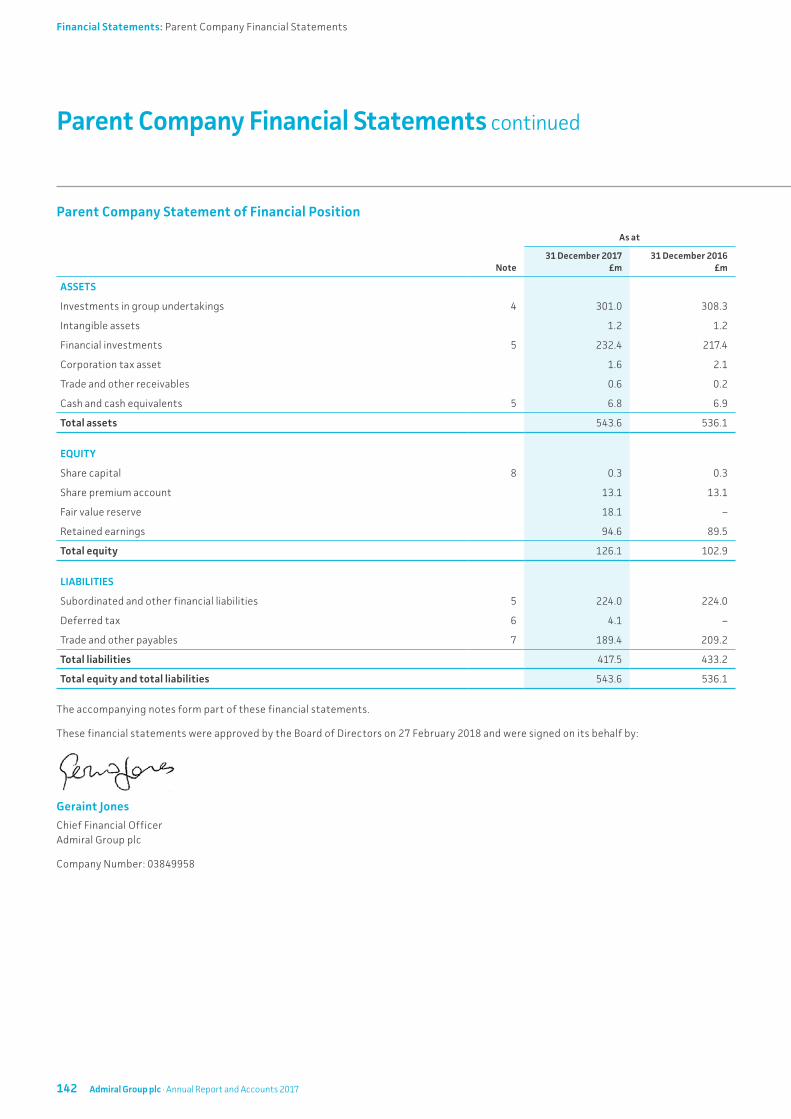
Parent Company Financial Statements continued
Parent Company Statement of Financial Position
Note
As at
31 December 2017 £m
31 December 2016 £m
ASSETS
Investments in group undertakings 4 301.0 308.3
Intangible assets 1.2 1.2
Financial investments 5 232.4 217.4
Corporation tax asset 1.6 2.1
Trade and other receivables 0.6 0.2
Cash and cash equivalents 5 6.8 6.9
Total assets 543.6 536.1
EQUITY
Share capital 8 0.3 0.3
Share premium account 13.1 13.1
Fair value reserve 18.1 –
Retained earnings 94.6 89.5
Total equity 126.1 102.9
LIABILITIES
Subordinated and other financial liabilities 5 224.0 224.0
Deferred tax 6 4.1 –
Trade and other payables 7 189.4 209.2
Total liabilities 417.5 433.2
Total equity and total liabilities 543.6 536.1
The accompanying notes form part of these financial statements.
These financial statements were approved by the Board of Directors on 27 February 2018 and were signed on its behalf by:
Geraint Jones
Chief Financial Officer Admiral Group plc
Company Number: 03849958
142 Admiral Group plc · Annual Report and Accounts 2017
Financial Statements: Parent Company Financial Statements
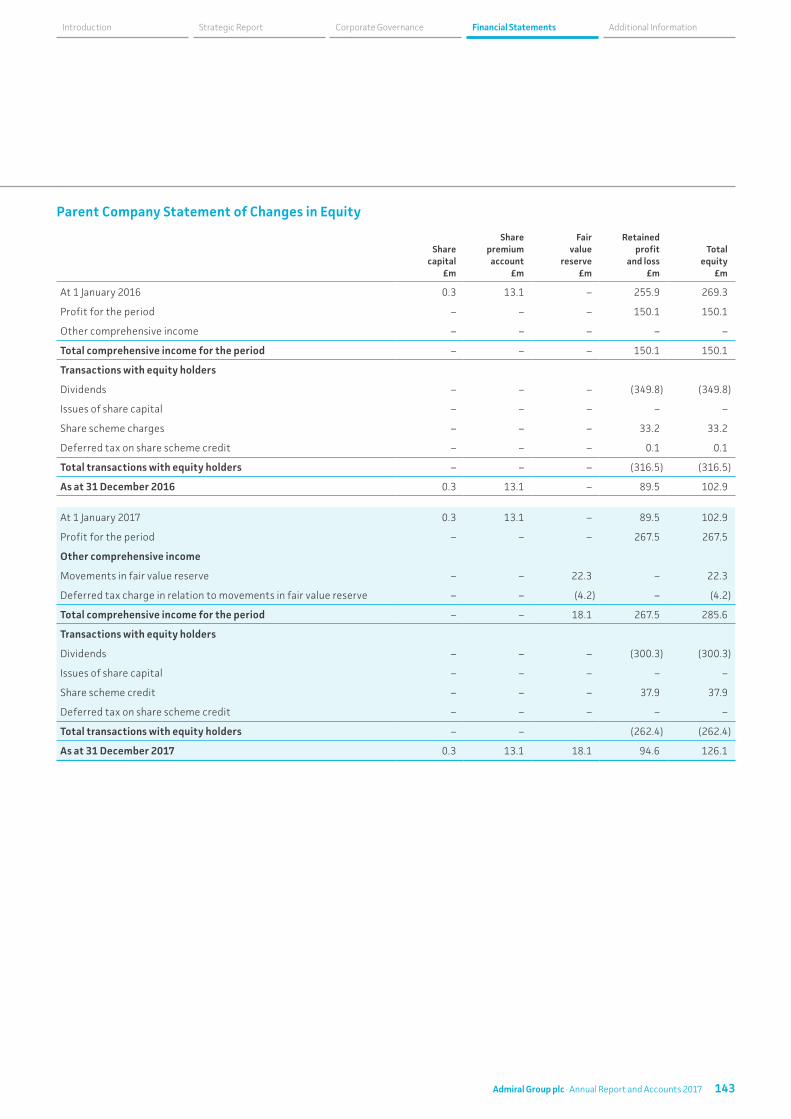
Parent Company Statement of Changes in Equity
Share capital
£m
Share premium
account £m
Fair value
reserve £m
Retained profit
and loss £m
Total equity
£m
At 1 January 2016 0.3 13.1 – 255.9 269.3
Profit for the period – – – 150.1 150.1
Other comprehensive income – – – – –
Total comprehensive income for the period – – – 150.1 150.1
Transactions with equity holders
Dividends – – – (349.8) (349.8)
Issues of share capital – – – – –
Share scheme charges – – – 33.2 33.2
Deferred tax on share scheme credit – – – 0.1 0.1
Total transactions with equity holders – – – (316.5) (316.5)
As at 31 December 2016 0.3 13.1 – 89.5 102.9
At 1 January 2017 0.3 13.1 – 89.5 102.9
Profit for the period – – – 267.5 267.5
Other comprehensive income
Movements in fair value reserve – – 22.3 – 22.3
Deferred tax charge in relation to movements in fair value reserve – – (4.2) – (4.2)
Total comprehensive income for the period – – 18.1 267.5 285.6
Transactions with equity holders
Dividends – – – (300.3) (300.3)
Issues of share capital – – – – –
Share scheme credit – – – 37.9 37.9
Deferred tax on share scheme credit – – – – –
Total transactions with equity holders – – (262.4) (262.4)
As at 31 December 2017 0.3 13.1 18.1 94.6 126.1
143Admiral Group plc · Annual Report and Accounts 2017
Financial Statements Additional InformationCorporate GovernanceStrategic ReportIntroduction
For the year ended 31 December 2017
1. Accounting policies1.1 Basis of preparation
These financial statements were prepared in accordance with Financial Reporting Standard 101 Reduced Disclosure Framework (FRS 101). The amendments to FRS 101 (2015/16 Cycle) issued in June 2016 and effective immediately have been applied. The financial statements are prepared on the historical cost basis except for the revaluation of financial assets classified as fair value through the profit or loss.
In preparing these financial statements, the Company applies the recognition, measurement and disclosure requirements of International Financial Reporting Standards as adopted by the EU (“Adopted IFRSs”), but makes amendments where necessary in order to comply with Companies Act 2006 and has set out below where advantage of the FRS 101 disclosure exemptions has been taken.
1.2 Disclosure exemptions applied under FRS 101
The Company has taken advantage of the following disclosure exemptions under FRS 101:
• FRS 101.8 (d): the requirement of IFRS 7 Financial Instruments: Disclosure to make disclosures about financial instruments
• FRS 101.8 (e): the disclosure requirements of IFRS13 Fair Value Measurement
• FRS 101.8 (f): the requirement in paragraph 38 of IAS 1 Presentation of Financial Statements to present comparative information in respect of:
- paragraph 118(3) of IAS 38 Intangible Assets
• FRS 101.8 (g): the requirements of paragraphs 10(d), 10(f), 16, 38A, 38B, 38C, 38D, 40A, 40B, 40C, 40D and 111 of IAS 1 Presentation of Financial Statements to produce a cash flow statement, a third balance sheet and to make an explicit and unreserved statement of compliance with IFRSs
• FRS 101.8 (h): the requirements of IAS 7 Statements of Cash Flows to produce a cash flow statement
• FRS 101.8 (i): the requirements of paragraphs 30 and 31 of IAS 8 Accounting Policies, Changes in Accounting Estimates and Errors to include a list of new IFRSs that have been issued but that have yet to be applied
• FRS 101.8 (k): the requirements in IAS 24 Related Party Disclosures to disclose related party transactions entered into between two or more members of a group, provided that any subsidiary which is a party to transaction is wholly owned by such a member
The accounting policies set out below have, unless otherwise stated, been applied consistently to all periods presented in these financial statements.
1.3 Going concern
The financial statements have been prepared on a going concern basis. In considering the appropriateness of this assumption, the Board have reviewed the Company's projections for the next twelve months and beyond, including cash flow forecasts and regulatory capital surpluses.
The Directors have a reasonable expectation that the Company has adequate resources to continue in operational existence for the foreseeable future. Thus they continue to adopt the going concern basis in preparing the annual financial statements.
1.4 Critical accounting judgements and estimates
In applying the Group’s accounting policies as described below management has primarily applied judgement in the impairment testing of the Company’s investment in group undertakings. Management has applied judgement in determining whether the carrying value of the investment, or asset may be supported by the recoverable amount calculation based on the ‘value in use’ of the asset (the net present value of future cash-flows arising from the asset).
In calculating the net present value of future cash-flows, management has made assumptions over the timing and amount of underlying profit projections of the relevant undertakings, long term growth rates in those projections and the discount rate applied to these projections that is appropriate to reflect the market’s view of the risk of the relevant investment.
Notes to the Parent Company Financial Statements
144 Admiral Group plc · Annual Report and Accounts 2017
Financial Statements: Notes to the Parent Company Financial Statements

1.5 Shares in Group Undertakings
Shares in Group undertakings are valued at cost less any provision for impairment in value.
The requirements of IAS 36 are applied to determine whether it is necessary to recognise any impairment loss with respect to the Company’s investments in subsidiaries. When necessary, the entire carrying amount of the investment is tested for impairment in accordance with IAS 36 Impairment of Assets as a single asset by comparing its recoverable amount (higher of value in use and fair value less costs of disposal) with its carrying amount. Any impairment loss recognised forms part of the carrying amount of the investment. Any reversal of that impairment loss is recognised in accordance with IAS 36 to the extent that the recoverable amount of the investment subsequently increases.
1.6 Employee share schemes
The Company operates a number of share schemes for its employees. For equity settled schemes commencing 1 January 2004 and after, the fair value of the employee services received in exchange for the grant of free shares under the schemes is recognised as an increase in equity in the Company.
1.7 Taxation
The charge for taxation is based on the profit for the year and takes into account taxation deferred because of timing differences between the treatment of certain items for taxation and accounting purposes.
Deferred tax assets are recognised to the extent that they are regarded as recoverable. They are regarded as recoverable to the extent that, on the basis of all available evidence, it can be regarded as more likely than not that there will be sufficient taxable profits from which the future reversal of the underlying timing differences can be deducted.
1.8 Financial assets and liabilities
All material investments held at fair value at the end of the period are invested in AAA-rated money market liquidity funds. The measurement of these investments is based on active quoted market values (level 1).
Government gilts are classified as AFS investments, in line with IAS 39 due to a reclassification in the period following the disposal of a portion of the holding.
Deposits held with credit institutions are classified as loans and receivables, in line with the nature of these deposits, with the 2016 comparative restated to reflect this more appropriate classification of these assets.
Cash and cash equivalents include cash in hand and deposits held at call with banks. All cash and cash equivalents are measured at amortised cost.
The Company’s financial liabilities comprise subordinated notes which are held at amortised cost using the effective interest method and a credit facility held at amortised cost.
2. Administrative expensesIncluded within administrative expenses are re-charges of £1.6 million (2016: £1.4 million) relating to employees within the Group who perform services on behalf of the Company. No staff are directly employed by the Company.
3. Investment and interest income
31 December 2017
£m
31 December 2016
£m
Dividend income from subsidiary undertakings 300.0 158.0
Interest income 10.5 6.3
Total investment and interest income 310.5 164.4
145Admiral Group plc · Annual Report and Accounts 2017
Financial Statements Additional InformationCorporate GovernanceStrategic ReportIntroduction
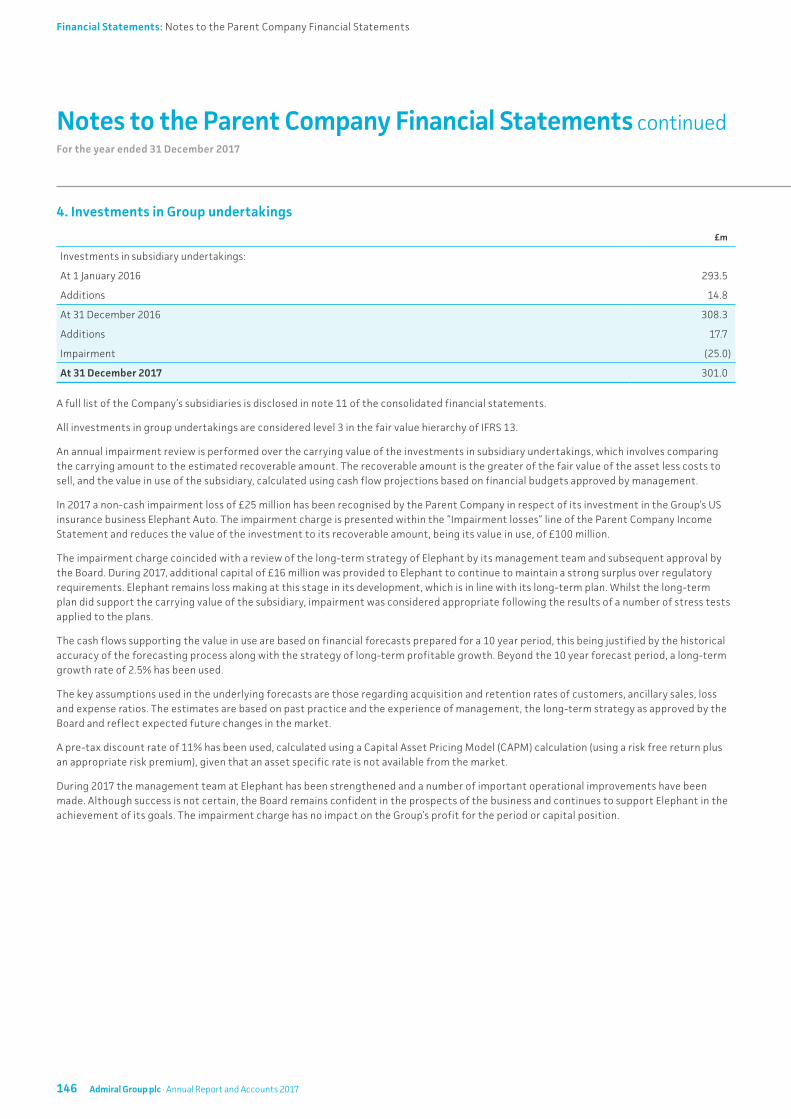
For the year ended 31 December 2017
4. Investments in Group undertakings
£m
Investments in subsidiary undertakings:
At 1 January 2016 293.5
Additions 14.8
At 31 December 2016 308.3
Additions 17.7
Impairment (25.0)
At 31 December 2017 301.0
A full list of the Company’s subsidiaries is disclosed in note 11 of the consolidated financial statements.
All investments in group undertakings are considered level 3 in the fair value hierarchy of IFRS 13.
An annual impairment review is performed over the carrying value of the investments in subsidiary undertakings, which involves comparing the carrying amount to the estimated recoverable amount. The recoverable amount is the greater of the fair value of the asset less costs to sell, and the value in use of the subsidiary, calculated using cash flow projections based on financial budgets approved by management.
In 2017 a non-cash impairment loss of £25 million has been recognised by the Parent Company in respect of its investment in the Group’s US insurance business Elephant Auto. The impairment charge is presented within the “Impairment losses” line of the Parent Company Income Statement and reduces the value of the investment to its recoverable amount, being its value in use, of £100 million.
The impairment charge coincided with a review of the long-term strategy of Elephant by its management team and subsequent approval by the Board. During 2017, additional capital of £16 million was provided to Elephant to continue to maintain a strong surplus over regulatory requirements. Elephant remains loss making at this stage in its development, which is in line with its long-term plan. Whilst the long-term plan did support the carrying value of the subsidiary, impairment was considered appropriate following the results of a number of stress tests applied to the plans.
The cash flows supporting the value in use are based on financial forecasts prepared for a 10 year period, this being justified by the historical accuracy of the forecasting process along with the strategy of long-term profitable growth. Beyond the 10 year forecast period, a long-term growth rate of 2.5% has been used.
The key assumptions used in the underlying forecasts are those regarding acquisition and retention rates of customers, ancillary sales, loss and expense ratios. The estimates are based on past practice and the experience of management, the long-term strategy as approved by the Board and reflect expected future changes in the market.
A pre-tax discount rate of 11% has been used, calculated using a Capital Asset Pricing Model (CAPM) calculation (using a risk free return plus an appropriate risk premium), given that an asset specific rate is not available from the market.
During 2017 the management team at Elephant has been strengthened and a number of important operational improvements have been made. Although success is not certain, the Board remains confident in the prospects of the business and continues to support Elephant in the achievement of its goals. The impairment charge has no impact on the Group’s profit for the period or capital position.
Notes to the Parent Company Financial Statements continued
146 Admiral Group plc · Annual Report and Accounts 2017
Financial Statements: Notes to the Parent Company Financial Statements
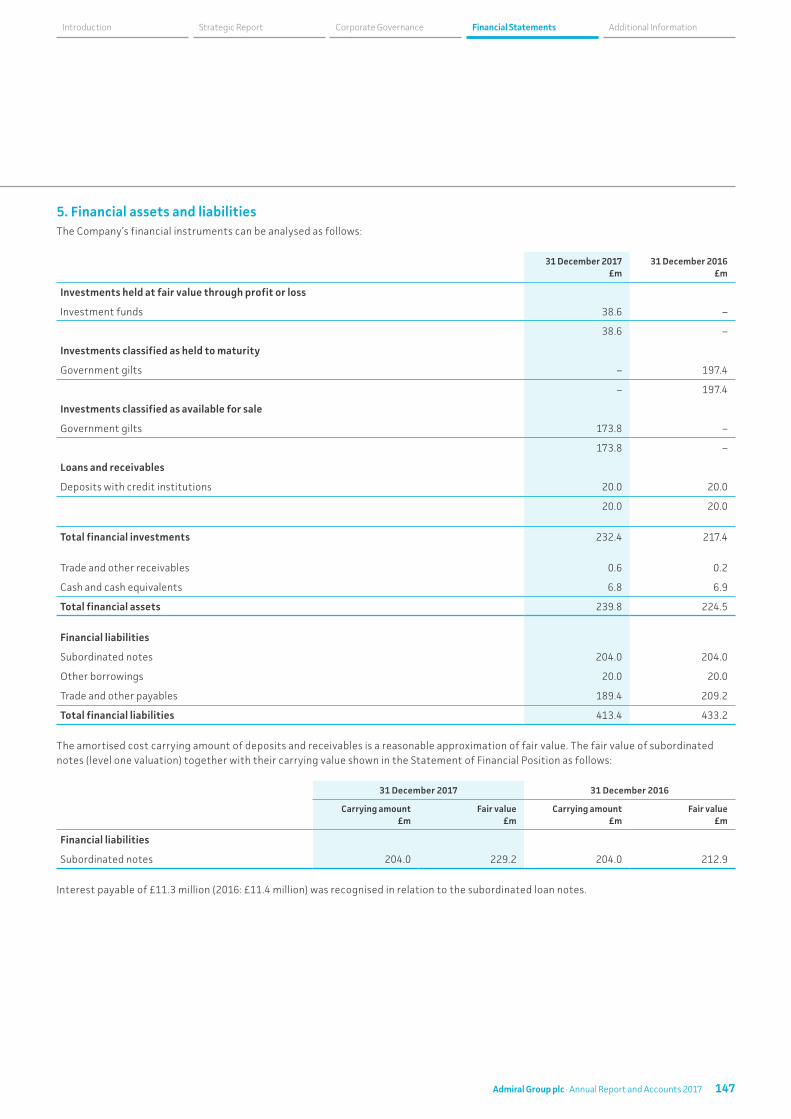
5. Financial assets and liabilitiesThe Company’s financial instruments can be analysed as follows:
31 December 2017 £m
31 December 2016 £m
Investments held at fair value through profit or loss
Investment funds 38.6 –
38.6 –
Investments classified as held to maturity
Government gilts – 197.4
– 197.4
Investments classified as available for sale
Government gilts 173.8 –
173.8 –
Loans and receivables
Deposits with credit institutions 20.0 20.0
20.0 20.0
Total financial investments 232.4 217.4
Trade and other receivables 0.6 0.2
Cash and cash equivalents 6.8 6.9
Total financial assets 239.8 224.5
Financial liabilities
Subordinated notes 204.0 204.0
Other borrowings 20.0 20.0
Trade and other payables 189.4 209.2
Total financial liabilities 413.4 433.2
The amortised cost carrying amount of deposits and receivables is a reasonable approximation of fair value. The fair value of subordinated notes (level one valuation) together with their carrying value shown in the Statement of Financial Position as follows:
31 December 2017 31 December 2016
Carrying amount £m
Fair value £m
Carrying amount £m
Fair value £m
Financial liabilities
Subordinated notes 204.0 229.2 204.0 212.9
Interest payable of £11.3 million (2016: £11.4 million) was recognised in relation to the subordinated loan notes.
147Admiral Group plc · Annual Report and Accounts 2017
Financial Statements Additional InformationCorporate GovernanceStrategic ReportIntroduction
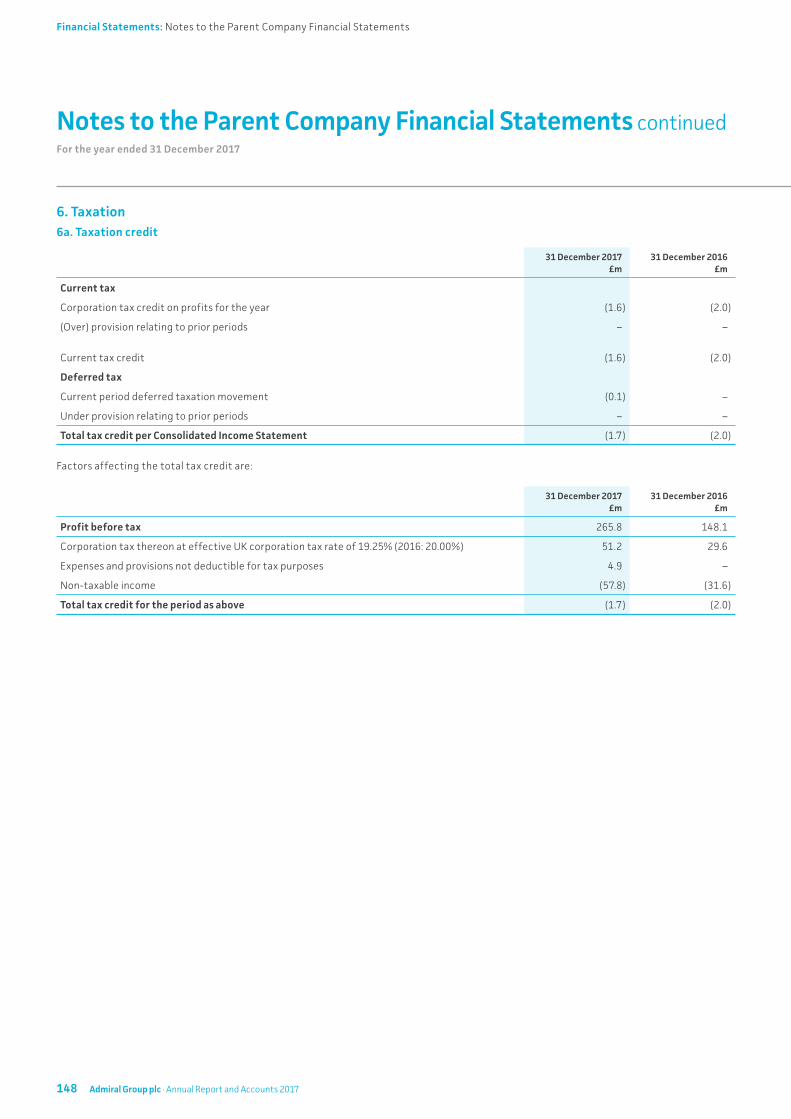
For the year ended 31 December 2017
6. Taxation6a. Taxation credit
31 December 2017 £m
31 December 2016 £m
Current tax
Corporation tax credit on profits for the year (1.6) (2.0)
(Over) provision relating to prior periods – –
Current tax credit (1.6) (2.0)
Deferred tax
Current period deferred taxation movement (0.1) –
Under provision relating to prior periods – –
Total tax credit per Consolidated Income Statement (1.7) (2.0)
Factors affecting the total tax credit are:
31 December 2017 £m
31 December 2016 £m
Profit before tax 265.8 148.1
Corporation tax thereon at effective UK corporation tax rate of 19.25% (2016: 20.00%) 51.2 29.6
Expenses and provisions not deductible for tax purposes 4.9 –
Non-taxable income (57.8) (31.6)
Total tax credit for the period as above (1.7) (2.0)
Notes to the Parent Company Financial Statements continued
148 Admiral Group plc · Annual Report and Accounts 2017
Financial Statements: Notes to the Parent Company Financial Statements
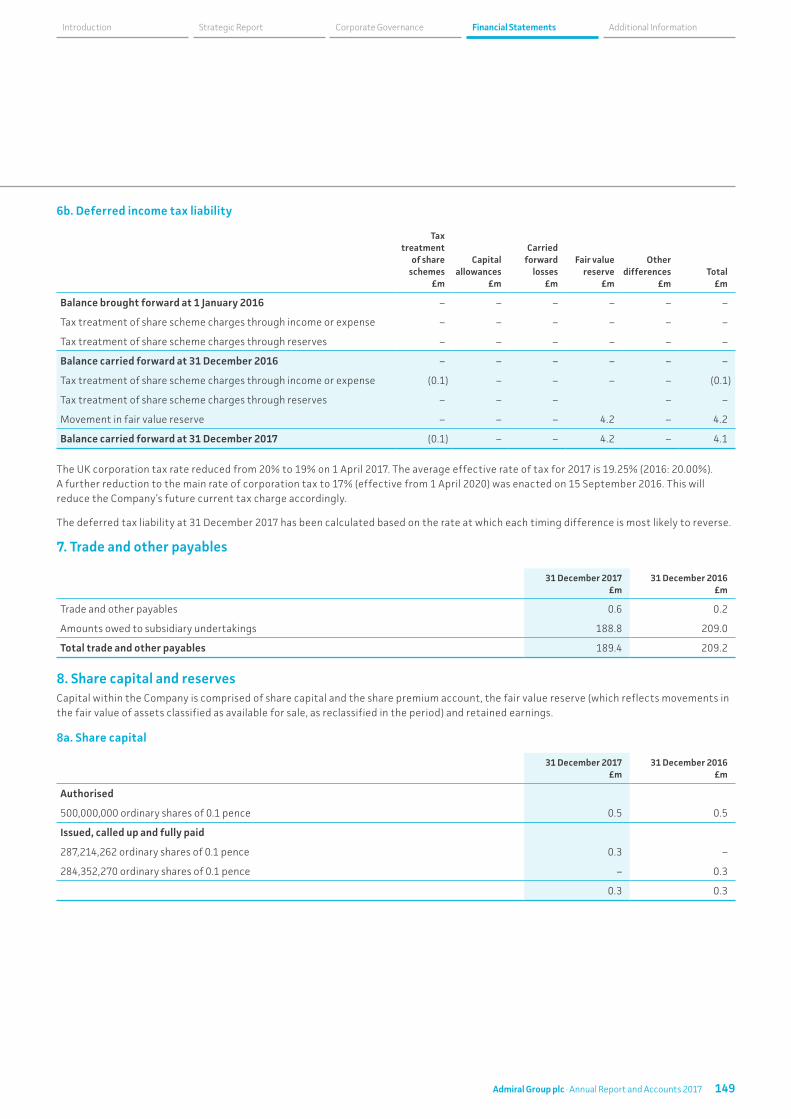
6b. Deferred income tax liability
Tax treatment
of share schemes
£m
Capital allowances
£m
Carried forward
losses £m
Fair value reserve
£m
Other differences
£mTotal
£m
Balance brought forward at 1 January 2016 – – – – – –
Tax treatment of share scheme charges through income or expense – – – – – –
Tax treatment of share scheme charges through reserves – – – – – –
Balance carried forward at 31 December 2016 – – – – – –
Tax treatment of share scheme charges through income or expense (0.1) – – – – (0.1)
Tax treatment of share scheme charges through reserves – – – – –
Movement in fair value reserve – – – 4.2 – 4.2
Balance carried forward at 31 December 2017 (0.1) – – 4.2 – 4.1
The UK corporation tax rate reduced from 20% to 19% on 1 April 2017. The average effective rate of tax for 2017 is 19.25% (2016: 20.00%). A further reduction to the main rate of corporation tax to 17% (effective from 1 April 2020) was enacted on 15 September 2016. This will reduce the Company’s future current tax charge accordingly.
The deferred tax liability at 31 December 2017 has been calculated based on the rate at which each timing difference is most likely to reverse.
7. Trade and other payables
31 December 2017 £m
31 December 2016£m
Trade and other payables 0.6 0.2
Amounts owed to subsidiary undertakings 188.8 209.0
Total trade and other payables 189.4 209.2
8. Share capital and reservesCapital within the Company is comprised of share capital and the share premium account, the fair value reserve (which reflects movements in the fair value of assets classified as available for sale, as reclassified in the period) and retained earnings.
8a. Share capital
31 December 2017 £m
31 December 2016 £m
Authorised
500,000,000 ordinary shares of 0.1 pence 0.5 0.5
Issued, called up and fully paid
287,214,262 ordinary shares of 0.1 pence 0.3 –
284,352,270 ordinary shares of 0.1 pence – 0.3
0.3 0.3
149Admiral Group plc · Annual Report and Accounts 2017
Financial Statements Additional InformationCorporate GovernanceStrategic ReportIntroduction
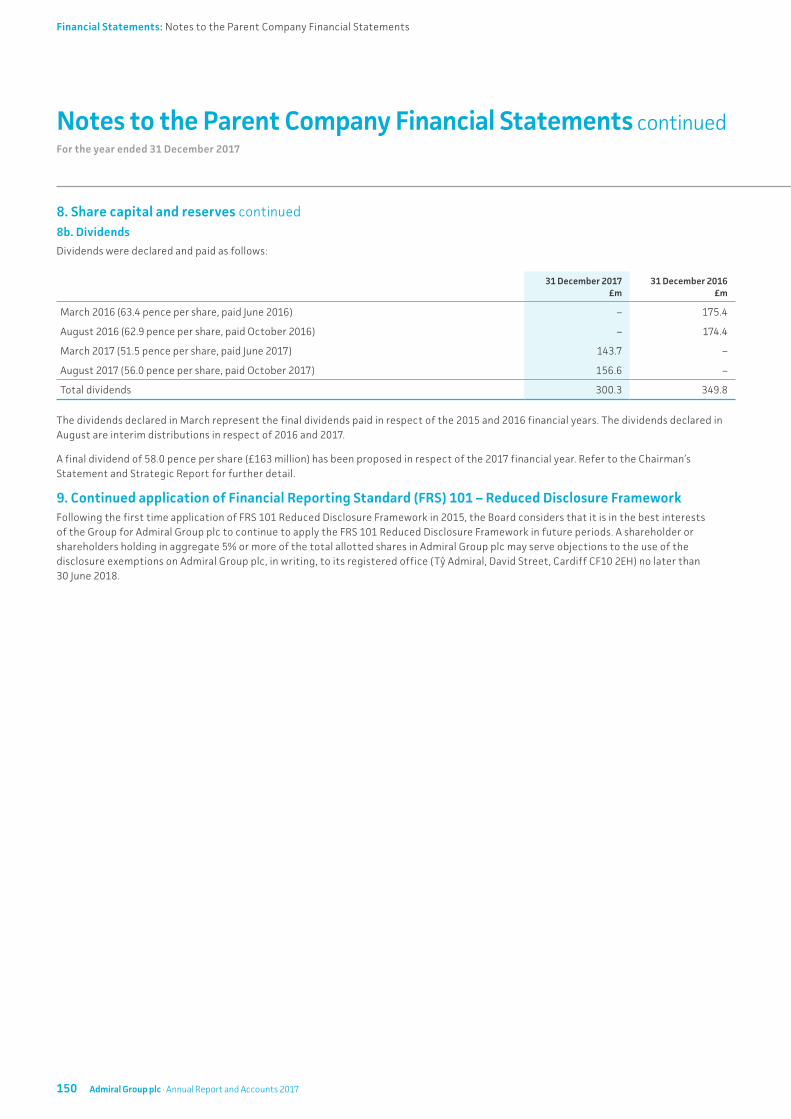
For the year ended 31 December 2017
8. Share capital and reserves continued8b. Dividends
Dividends were declared and paid as follows:
31 December 2017 £m
31 December 2016 £m
March 2016 (63.4 pence per share, paid June 2016) – 175.4
August 2016 (62.9 pence per share, paid October 2016) – 174.4
March 2017 (51.5 pence per share, paid June 2017) 143.7 –
August 2017 (56.0 pence per share, paid October 2017) 156.6 –
Total dividends 300.3 349.8
The dividends declared in March represent the final dividends paid in respect of the 2015 and 2016 financial years. The dividends declared in August are interim distributions in respect of 2016 and 2017.
A final dividend of 58.0 pence per share (£163 million) has been proposed in respect of the 2017 financial year. Refer to the Chairman’s Statement and Strategic Report for further detail.
9. Continued application of Financial Reporting Standard (FRS) 101 – Reduced Disclosure FrameworkFollowing the first time application of FRS 101 Reduced Disclosure Framework in 2015, the Board considers that it is in the best interests of the Group for Admiral Group plc to continue to apply the FRS 101 Reduced Disclosure Framework in future periods. A shareholder or shareholders holding in aggregate 5% or more of the total allotted shares in Admiral Group plc may serve objections to the use of the disclosure exemptions on Admiral Group plc, in writing, to its registered office (Tŷ Admiral, David Street, Cardiff CF10 2EH) no later than 30 June 2018.
Notes to the Parent Company Financial Statements continued
150 Admiral Group plc · Annual Report and Accounts 2017
Financial Statements: Notes to the Parent Company Financial Statements
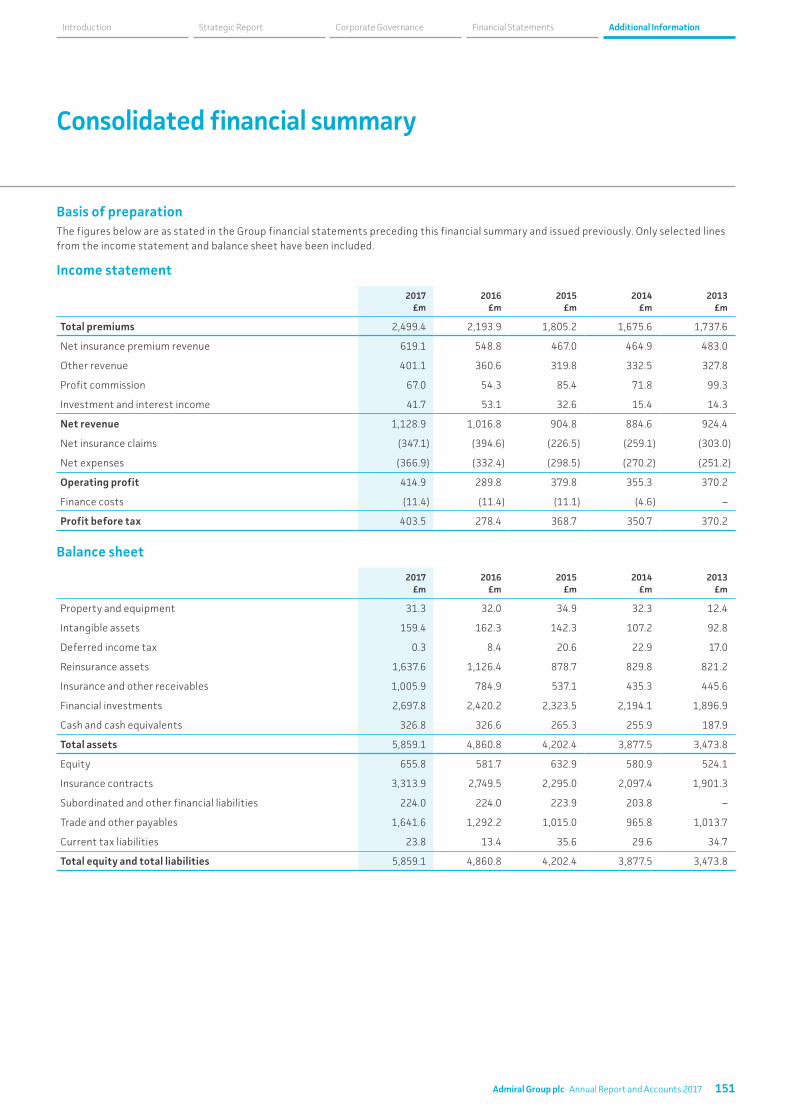
Basis of preparationThe figures below are as stated in the Group financial statements preceding this financial summary and issued previously. Only selected lines from the income statement and balance sheet have been included.
Income statement
2017 £m
2016 £m
2015 £m
2014 £m
2013 £m
Total premiums 2,499.4 2,193.9 1,805.2 1,675.6 1,737.6
Net insurance premium revenue 619.1 548.8 467.0 464.9 483.0
Other revenue 401.1 360.6 319.8 332.5 327.8
Profit commission 67.0 54.3 85.4 71.8 99.3
Investment and interest income 41.7 53.1 32.6 15.4 14.3
Net revenue 1,128.9 1,016.8 904.8 884.6 924.4
Net insurance claims (347.1) (394.6) (226.5) (259.1) (303.0)
Net expenses (366.9) (332.4) (298.5) (270.2) (251.2)
Operating profit 414.9 289.8 379.8 355.3 370.2
Finance costs (11.4) (11.4) (11.1) (4.6) –
Profit before tax 403.5 278.4 368.7 350.7 370.2
Balance sheet
2017 £m
2016 £m
2015 £m
2014 £m
2013 £m
Property and equipment 31.3 32.0 34.9 32.3 12.4
Intangible assets 159.4 162.3 142.3 107.2 92.8
Deferred income tax 0.3 8.4 20.6 22.9 17.0
Reinsurance assets 1,637.6 1,126.4 878.7 829.8 821.2
Insurance and other receivables 1,005.9 784.9 537.1 435.3 445.6
Financial investments 2,697.8 2,420.2 2,323.5 2,194.1 1,896.9
Cash and cash equivalents 326.8 326.6 265.3 255.9 187.9
Total assets 5,859.1 4,860.8 4,202.4 3,877.5 3,473.8
Equity 655.8 581.7 632.9 580.9 524.1
Insurance contracts 3,313.9 2,749.5 2,295.0 2,097.4 1,901.3
Subordinated and other financial liabilities 224.0 224.0 223.9 203.8 –
Trade and other payables 1,641.6 1,292.2 1,015.0 965.8 1,013.7
Current tax liabilities 23.8 13.4 35.6 29.6 34.7
Total equity and total liabilities 5,859.1 4,860.8 4,202.4 3,877.5 3,473.8
Consolidated financial summary
151Admiral Group plc · Annual Report and Accounts 2017
Corporate GovernanceStrategic ReportIntroduction Financial Statements Additional Information
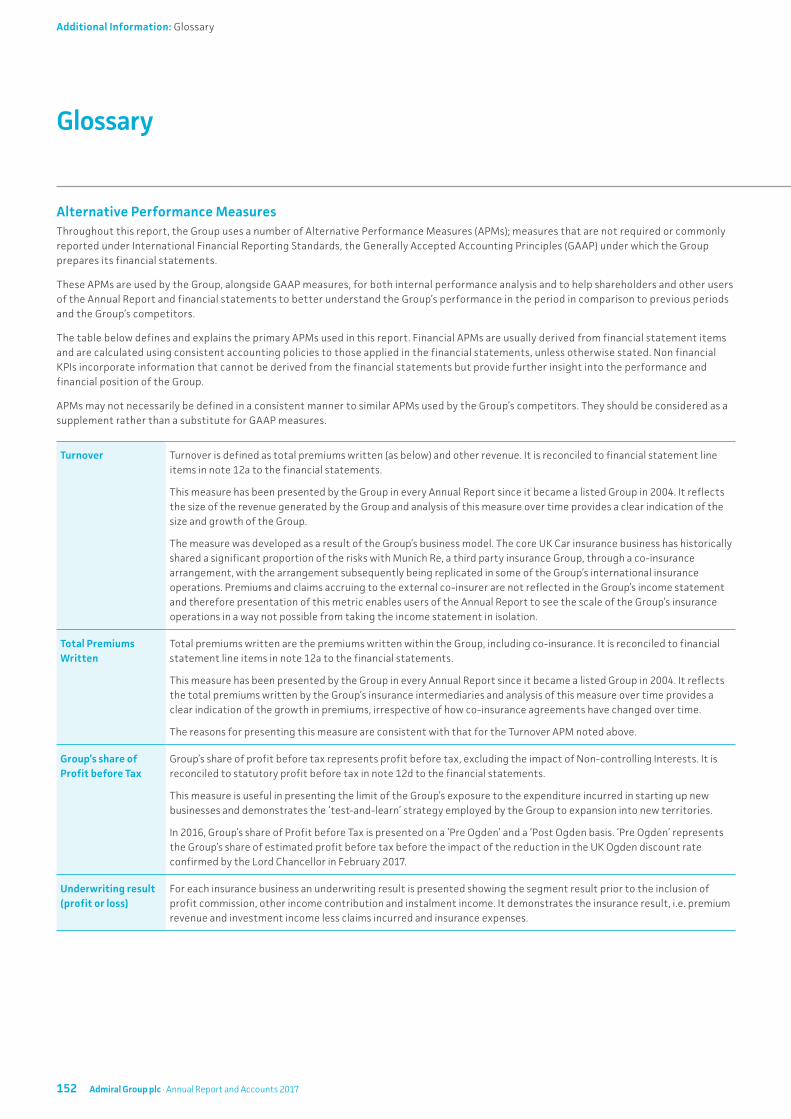
Alternative Performance MeasuresThroughout this report, the Group uses a number of Alternative Performance Measures (APMs); measures that are not required or commonly reported under International Financial Reporting Standards, the Generally Accepted Accounting Principles (GAAP) under which the Group prepares its financial statements.
These APMs are used by the Group, alongside GAAP measures, for both internal performance analysis and to help shareholders and other users of the Annual Report and financial statements to better understand the Group’s performance in the period in comparison to previous periods and the Group’s competitors.
The table below defines and explains the primary APMs used in this report. Financial APMs are usually derived from financial statement items and are calculated using consistent accounting policies to those applied in the financial statements, unless otherwise stated. Non financial KPIs incorporate information that cannot be derived from the financial statements but provide further insight into the performance and financial position of the Group.
APMs may not necessarily be defined in a consistent manner to similar APMs used by the Group’s competitors. They should be considered as a supplement rather than a substitute for GAAP measures.
Turnover Turnover is defined as total premiums written (as below) and other revenue. It is reconciled to financial statement line items in note 12a to the financial statements.
This measure has been presented by the Group in every Annual Report since it became a listed Group in 2004. It reflects the size of the revenue generated by the Group and analysis of this measure over time provides a clear indication of the size and growth of the Group.
The measure was developed as a result of the Group’s business model. The core UK Car insurance business has historically shared a significant proportion of the risks with Munich Re, a third party insurance Group, through a co-insurance arrangement, with the arrangement subsequently being replicated in some of the Group’s international insurance operations. Premiums and claims accruing to the external co-insurer are not reflected in the Group’s income statement and therefore presentation of this metric enables users of the Annual Report to see the scale of the Group’s insurance operations in a way not possible from taking the income statement in isolation.
Total Premiums Written
Total premiums written are the premiums written within the Group, including co-insurance. It is reconciled to financial statement line items in note 12a to the financial statements.
This measure has been presented by the Group in every Annual Report since it became a listed Group in 2004. It reflects the total premiums written by the Group’s insurance intermediaries and analysis of this measure over time provides a clear indication of the growth in premiums, irrespective of how co-insurance agreements have changed over time.
The reasons for presenting this measure are consistent with that for the Turnover APM noted above.
Group’s share of Profit before Tax
Group’s share of profit before tax represents profit before tax, excluding the impact of Non-controlling Interests. It is reconciled to statutory profit before tax in note 12d to the financial statements.
This measure is useful in presenting the limit of the Group’s exposure to the expenditure incurred in starting up new businesses and demonstrates the ‘test-and-learn’ strategy employed by the Group to expansion into new territories.
In 2016, Group’s share of Profit before Tax is presented on a ‘Pre Ogden’ and a ‘Post Ogden basis. ‘Pre Ogden’ represents the Group’s share of estimated profit before tax before the impact of the reduction in the UK Ogden discount rate confirmed by the Lord Chancellor in February 2017.
Underwriting result (profit or loss)
For each insurance business an underwriting result is presented showing the segment result prior to the inclusion of profit commission, other income contribution and instalment income. It demonstrates the insurance result, i.e. premium revenue and investment income less claims incurred and insurance expenses.
Glossary
152 Admiral Group plc · Annual Report and Accounts 2017
Additional Information: Glossary
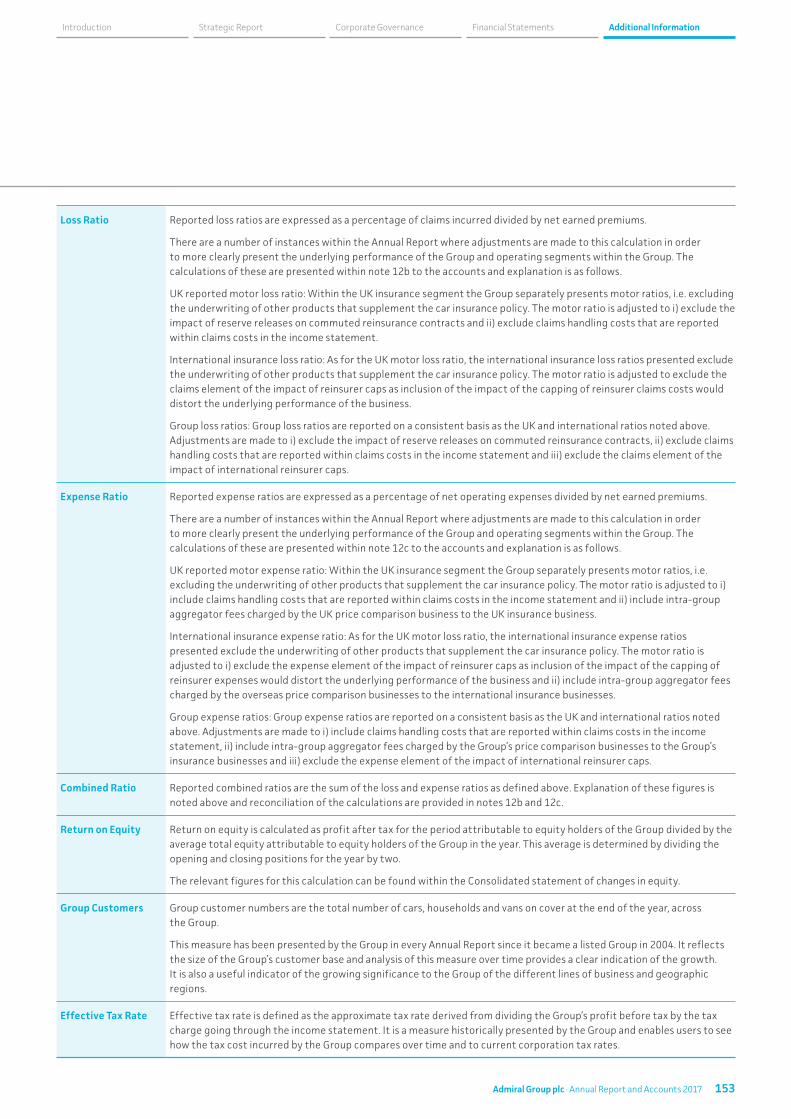
Loss Ratio Reported loss ratios are expressed as a percentage of claims incurred divided by net earned premiums.
There are a number of instances within the Annual Report where adjustments are made to this calculation in order to more clearly present the underlying performance of the Group and operating segments within the Group. The calculations of these are presented within note 12b to the accounts and explanation is as follows.
UK reported motor loss ratio: Within the UK insurance segment the Group separately presents motor ratios, i.e. excluding the underwriting of other products that supplement the car insurance policy. The motor ratio is adjusted to i) exclude the impact of reserve releases on commuted reinsurance contracts and ii) exclude claims handling costs that are reported within claims costs in the income statement.
International insurance loss ratio: As for the UK motor loss ratio, the international insurance loss ratios presented exclude the underwriting of other products that supplement the car insurance policy. The motor ratio is adjusted to exclude the claims element of the impact of reinsurer caps as inclusion of the impact of the capping of reinsurer claims costs would distort the underlying performance of the business.
Group loss ratios: Group loss ratios are reported on a consistent basis as the UK and international ratios noted above. Adjustments are made to i) exclude the impact of reserve releases on commuted reinsurance contracts, ii) exclude claims handling costs that are reported within claims costs in the income statement and iii) exclude the claims element of the impact of international reinsurer caps.
Expense Ratio Reported expense ratios are expressed as a percentage of net operating expenses divided by net earned premiums.
There are a number of instances within the Annual Report where adjustments are made to this calculation in order to more clearly present the underlying performance of the Group and operating segments within the Group. The calculations of these are presented within note 12c to the accounts and explanation is as follows.
UK reported motor expense ratio: Within the UK insurance segment the Group separately presents motor ratios, i.e. excluding the underwriting of other products that supplement the car insurance policy. The motor ratio is adjusted to i) include claims handling costs that are reported within claims costs in the income statement and ii) include intra-group aggregator fees charged by the UK price comparison business to the UK insurance business.
International insurance expense ratio: As for the UK motor loss ratio, the international insurance expense ratios presented exclude the underwriting of other products that supplement the car insurance policy. The motor ratio is adjusted to i) exclude the expense element of the impact of reinsurer caps as inclusion of the impact of the capping of reinsurer expenses would distort the underlying performance of the business and ii) include intra-group aggregator fees charged by the overseas price comparison businesses to the international insurance businesses.
Group expense ratios: Group expense ratios are reported on a consistent basis as the UK and international ratios noted above. Adjustments are made to i) include claims handling costs that are reported within claims costs in the income statement, ii) include intra-group aggregator fees charged by the Group’s price comparison businesses to the Group’s insurance businesses and iii) exclude the expense element of the impact of international reinsurer caps.
Combined Ratio Reported combined ratios are the sum of the loss and expense ratios as defined above. Explanation of these figures is noted above and reconciliation of the calculations are provided in notes 12b and 12c.
Return on Equity Return on equity is calculated as profit after tax for the period attributable to equity holders of the Group divided by the average total equity attributable to equity holders of the Group in the year. This average is determined by dividing the opening and closing positions for the year by two.
The relevant figures for this calculation can be found within the Consolidated statement of changes in equity.
Group Customers Group customer numbers are the total number of cars, households and vans on cover at the end of the year, across the Group.
This measure has been presented by the Group in every Annual Report since it became a listed Group in 2004. It reflects the size of the Group’s customer base and analysis of this measure over time provides a clear indication of the growth. It is also a useful indicator of the growing significance to the Group of the different lines of business and geographic regions.
Effective Tax Rate Effective tax rate is defined as the approximate tax rate derived from dividing the Group’s profit before tax by the tax charge going through the income statement. It is a measure historically presented by the Group and enables users to see how the tax cost incurred by the Group compares over time and to current corporation tax rates.
153Admiral Group plc · Annual Report and Accounts 2017
Corporate GovernanceStrategic ReportIntroduction Financial Statements Additional Information
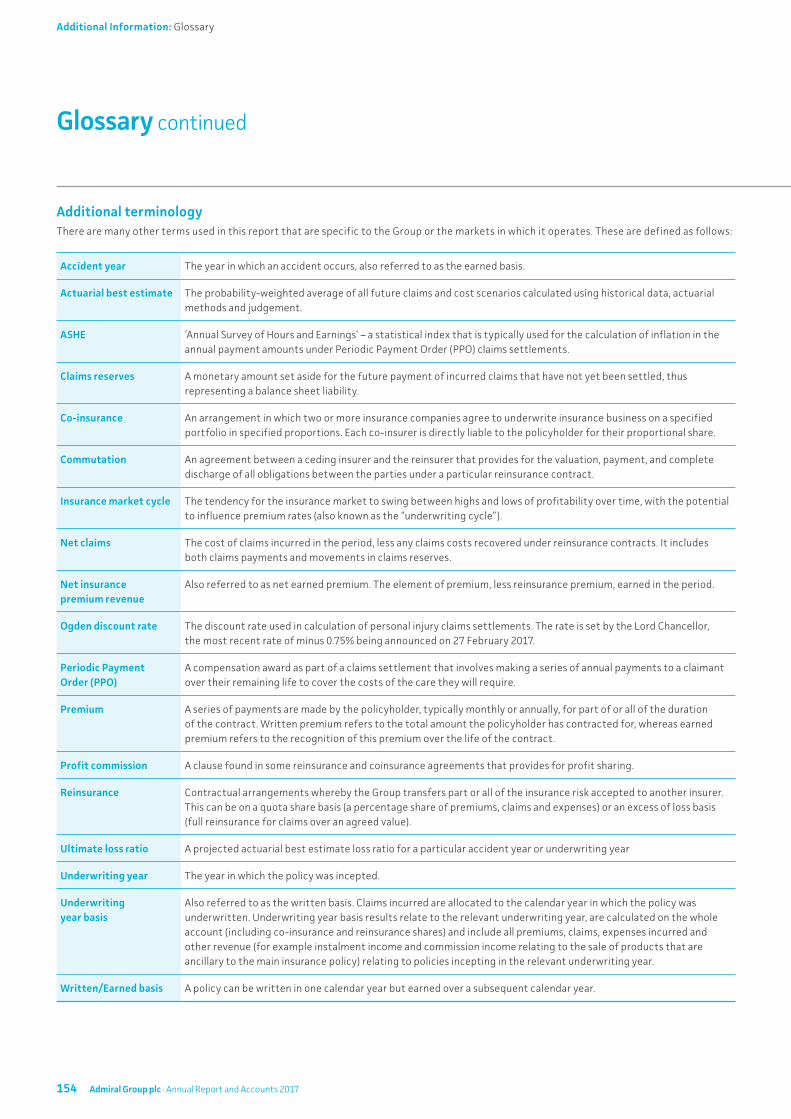
For the year ended 31 December 2017
Additional terminologyThere are many other terms used in this report that are specific to the Group or the markets in which it operates. These are defined as follows:
Accident year The year in which an accident occurs, also referred to as the earned basis.
Actuarial best estimate The probability-weighted average of all future claims and cost scenarios calculated using historical data, actuarial methods and judgement.
ASHE ‘Annual Survey of Hours and Earnings’ – a statistical index that is typically used for the calculation of inflation in the annual payment amounts under Periodic Payment Order (PPO) claims settlements.
Claims reserves A monetary amount set aside for the future payment of incurred claims that have not yet been settled, thus representing a balance sheet liability.
Co-insurance An arrangement in which two or more insurance companies agree to underwrite insurance business on a specified portfolio in specified proportions. Each co-insurer is directly liable to the policyholder for their proportional share.
Commutation An agreement between a ceding insurer and the reinsurer that provides for the valuation, payment, and complete discharge of all obligations between the parties under a particular reinsurance contract.
Insurance market cycle The tendency for the insurance market to swing between highs and lows of profitability over time, with the potential to influence premium rates (also known as the “underwriting cycle”).
Net claims The cost of claims incurred in the period, less any claims costs recovered under reinsurance contracts. It includes both claims payments and movements in claims reserves.
Net insurance premium revenue
Also referred to as net earned premium. The element of premium, less reinsurance premium, earned in the period.
Ogden discount rate The discount rate used in calculation of personal injury claims settlements. The rate is set by the Lord Chancellor, the most recent rate of minus 0.75% being announced on 27 February 2017.
Periodic Payment Order (PPO)
A compensation award as part of a claims settlement that involves making a series of annual payments to a claimant over their remaining life to cover the costs of the care they will require.
Premium A series of payments are made by the policyholder, typically monthly or annually, for part of or all of the duration of the contract. Written premium refers to the total amount the policyholder has contracted for, whereas earned premium refers to the recognition of this premium over the life of the contract.
Profit commission A clause found in some reinsurance and coinsurance agreements that provides for profit sharing.
Reinsurance Contractual arrangements whereby the Group transfers part or all of the insurance risk accepted to another insurer. This can be on a quota share basis (a percentage share of premiums, claims and expenses) or an excess of loss basis (full reinsurance for claims over an agreed value).
Ultimate loss ratio A projected actuarial best estimate loss ratio for a particular accident year or underwriting year
Underwriting year The year in which the policy was incepted.
Underwriting year basis
Also referred to as the written basis. Claims incurred are allocated to the calendar year in which the policy was underwritten. Underwriting year basis results relate to the relevant underwriting year, are calculated on the whole account (including co-insurance and reinsurance shares) and include all premiums, claims, expenses incurred and other revenue (for example instalment income and commission income relating to the sale of products that are ancillary to the main insurance policy) relating to policies incepting in the relevant underwriting year.
Written/Earned basis A policy can be written in one calendar year but earned over a subsequent calendar year.
Glossary continued
154 Admiral Group plc · Annual Report and Accounts 2017
Additional Information: Glossary
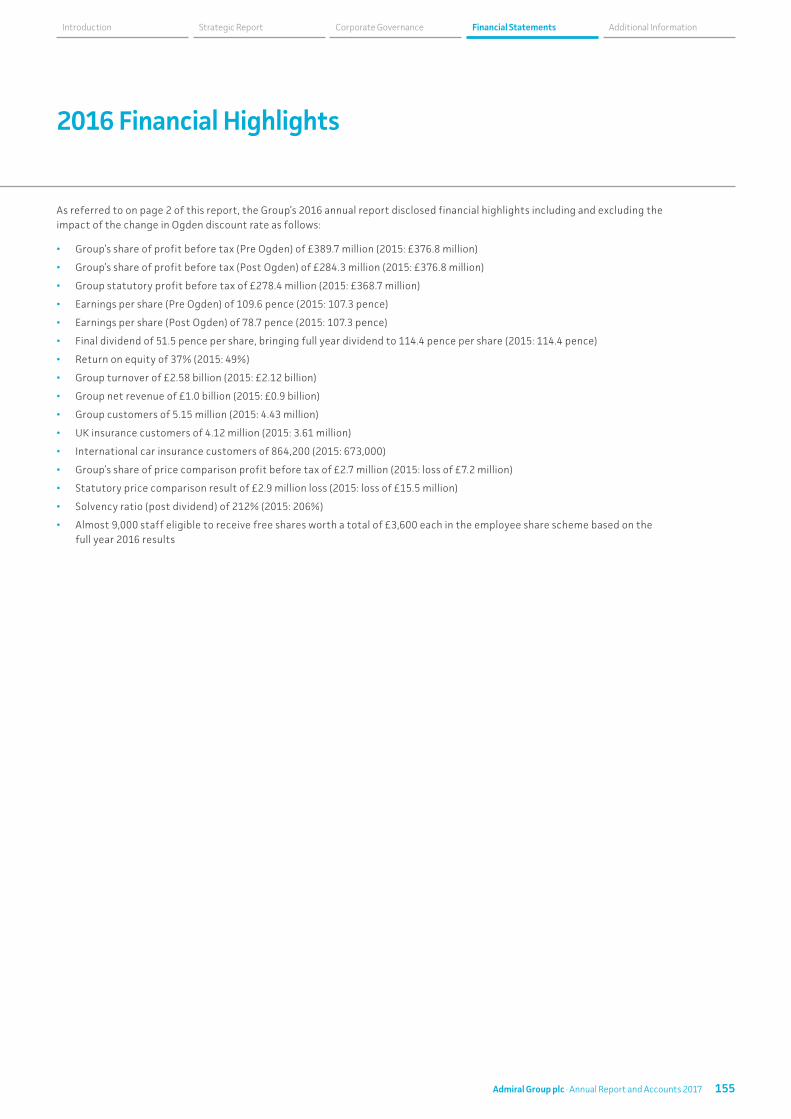
2016 Financial Highlights
As referred to on page 2 of this report, the Group’s 2016 annual report disclosed financial highlights including and excluding the impact of the change in Ogden discount rate as follows:
• Group’s share of profit before tax (Pre Ogden) of £389.7 million (2015: £376.8 million)
• Group’s share of profit before tax (Post Ogden) of £284.3 million (2015: £376.8 million)
• Group statutory profit before tax of £278.4 million (2015: £368.7 million)
• Earnings per share (Pre Ogden) of 109.6 pence (2015: 107.3 pence)
• Earnings per share (Post Ogden) of 78.7 pence (2015: 107.3 pence)
• Final dividend of 51.5 pence per share, bringing full year dividend to 114.4 pence per share (2015: 114.4 pence)
• Return on equity of 37% (2015: 49%)
• Group turnover of £2.58 billion (2015: £2.12 billion)
• Group net revenue of £1.0 billion (2015: £0.9 billion)
• Group customers of 5.15 million (2015: 4.43 million)
• UK insurance customers of 4.12 million (2015: 3.61 million)
• International car insurance customers of 864,200 (2015: 673,000)
• Group’s share of price comparison profit before tax of £2.7 million (2015: loss of £7.2 million)
• Statutory price comparison result of £2.9 million loss (2015: loss of £15.5 million)
• Solvency ratio (post dividend) of 212% (2015: 206%)
• Almost 9,000 staff eligible to receive free shares worth a total of £3,600 each in the employee share scheme based on the full year 2016 results
155Admiral Group plc · Annual Report and Accounts 2017
Financial Statements Additional InformationCorporate GovernanceStrategic ReportIntroduction
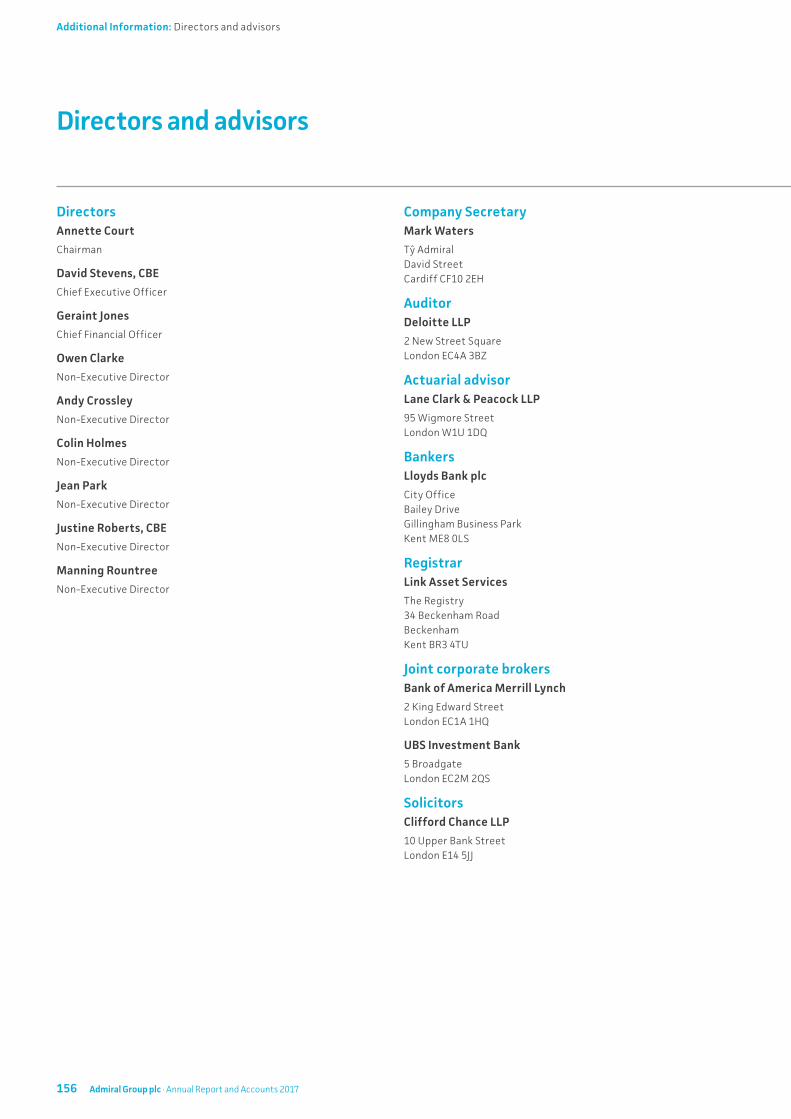
Directors and advisors
DirectorsAnnette Court
Chairman
David Stevens, CBE
Chief Executive Officer
Geraint Jones
Chief Financial Officer
Owen Clarke
Non-Executive Director
Andy Crossley
Non-Executive Director
Colin Holmes
Non-Executive Director
Jean Park
Non-Executive Director
Justine Roberts, CBE
Non-Executive Director
Manning Rountree
Non-Executive Director
Company SecretaryMark Waters
Tŷ Admiral David Street Cardiff CF10 2EH
AuditorDeloitte LLP
2 New Street Square London EC4A 3BZ
Actuarial advisor Lane Clark & Peacock LLP
95 Wigmore Street London W1U 1DQ
BankersLloyds Bank plc
City Office Bailey Drive Gillingham Business Park Kent ME8 0LS
Registrar Link Asset Services
The Registry 34 Beckenham Road Beckenham Kent BR3 4TU
Joint corporate brokers Bank of America Merrill Lynch
2 King Edward Street London EC1A 1HQ
UBS Investment Bank
5 Broadgate London EC2M 2QS
SolicitorsClifford Chance LLP
10 Upper Bank Street London E14 5JJ
156 Admiral Group plc · Annual Report and Accounts 2017
Additional Information: Directors and advisors

Corporate websiteThe Group’s corporate website is at www.admiralgroup.co.uk. A range of information about the Admiral Group is presented, including the Group’s history, financial reports and press releases, corporate responsibility and governance.
The website also includes the contact details for investor relations.
Financial calendar Final 2016 dividend
10 May 2018 – Ex dividend date 11 May 2018 – Record date 1 June 2018 – Payment date
Annual General Meeting
26 April 2018
Interim results
15 August 2018
The Group does not produce printed copies of interim results for shareholders unless requested.
The interim results will be available on the corporate website from 15 August 2018.
Registered officeTŷ Admiral David Street Cardiff CF10 2EH
Admiral Group businesses
UK
Car Insurance Admiral www.admiral.com elephant.co.uk www.elephant.co.uk Diamond www.diamond.co.uk Bell www.bell.co.uk
Spain
Car Insurance Balumba www.balumba.es Qualitas Auto www.qualitasauto.com
Italy
Car Insurance ConTe www.conte.it
USA
Car Insurance Elephant Auto www.elephant.com
France
Car Insurance L'olivier - assurance auto www.lolivier.fr
Price Comparison LeLynx www.lelynx.fr
Price Comparison compare.com www.compare.com
Price Comparison Rastreator www.rastreator.com Seguros.es www.seguros.es
Price Comparison Confused.com www.confused.com
Household Insurance Admiral household insurance www.admiral.com/home-insurance
Van Insurance Gladiator www.gladiator.co.uk Admiral Van www.admiral.com/van-insurance
Legal services companies Admiral Law www.admirallaw.co.uk BDE Law www.diamondlaw.co.uk
Loans Admiral Loans www.admiral.co.uk/loans
Travel Insurance Admiral Travel www.admiral.com/travel-insurance
Short-term Insurance Veygo www.veygo.com
157Admiral Group plc · Annual Report and Accounts 2017
Corporate GovernanceStrategic ReportIntroduction Financial Statements Additional Information

Annual Report & Accounts 2017
Years of FirstsRegistered office
Tŷ Admiral David Street Cardiff CF10 2EH
www.admiralgroup.co.uk
Adm
iral Group plc
Annual R
eport and Accounts 2017
Related Documents