MARKET INSIGHT Year-End Valuations Update January 2019 www.bourne-partners.com

Welcome message from author
This document is posted to help you gain knowledge. Please leave a comment to let me know what you think about it! Share it to your friends and learn new things together.
Transcript
MARKET INSIGHTYear-End Valuations UpdateJanuary 2019
www.bourne-partners.com

Table of Contents
2
Pharma Services1 4
PBM/Managed Care2 13
Compounding/Specialty Pharmacy3 18
Pharmaceuticals4 23
Consumer Health5 32
3
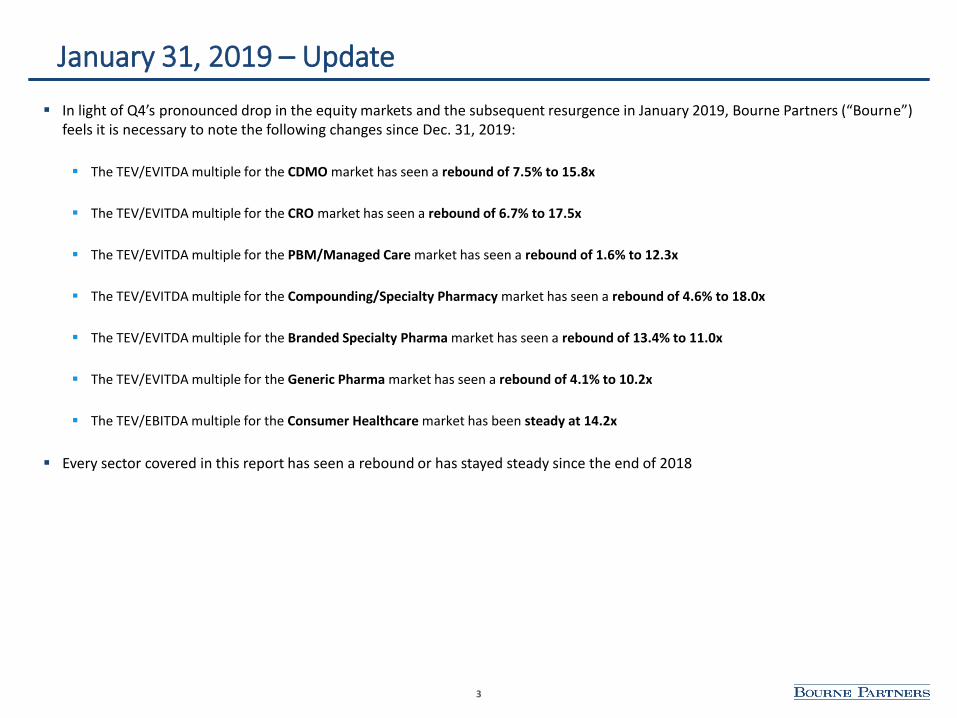
January 31, 2019 – Update
▪ In light of Q4’s pronounced drop in the equity markets and the subsequent resurgence in January 2019, Bourne Partners (“Bourne”)feels it is necessary to note the following changes since Dec. 31, 2019:
▪ The TEV/EVITDA multiple for the CDMO market has seen a rebound of 7.5% to 15.8x
▪ The TEV/EVITDA multiple for the CRO market has seen a rebound of 6.7% to 17.5x
▪ The TEV/EVITDA multiple for the PBM/Managed Care market has seen a rebound of 1.6% to 12.3x
▪ The TEV/EVITDA multiple for the Compounding/Specialty Pharmacy market has seen a rebound of 4.6% to 18.0x
▪ The TEV/EVITDA multiple for the Branded Specialty Pharma market has seen a rebound of 13.4% to 11.0x
▪ The TEV/EVITDA multiple for the Generic Pharma market has seen a rebound of 4.1% to 10.2x
▪ The TEV/EBITDA multiple for the Consumer Healthcare market has been steady at 14.2x
▪ Every sector covered in this report has seen a rebound or has stayed steady since the end of 2018
Pharma Services
4

5
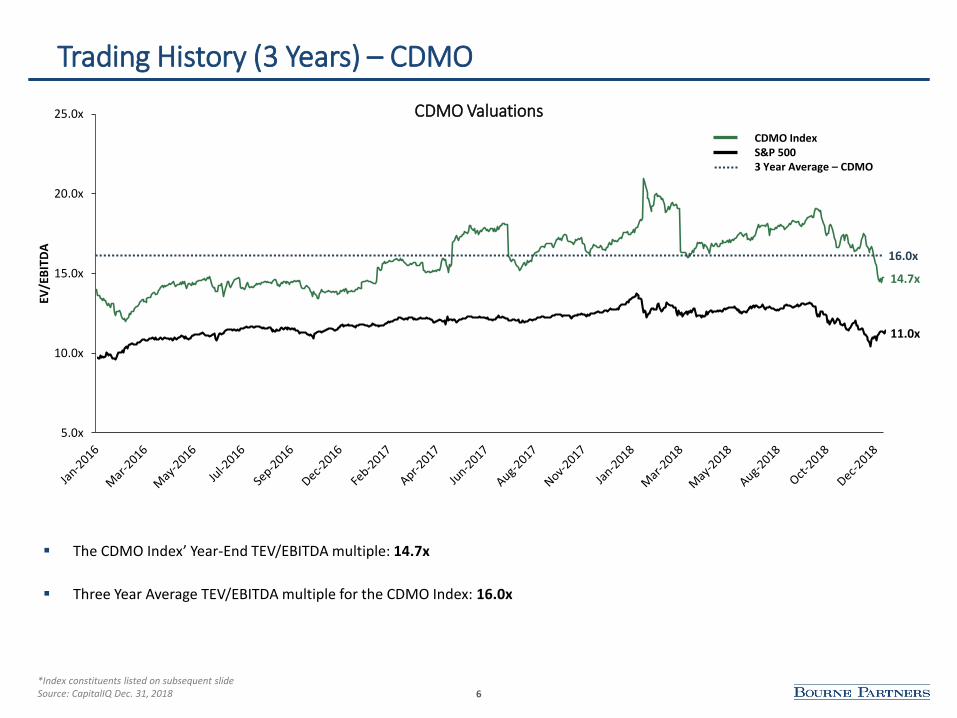
CDMO Recap
▪ Due to the late year decline, CDMO multiples are depressed from the 2018 high of 21.0x but still remain elevated overall
▪ The Dec. 31, 2018 TEV/EBITDA multiple for the CDMO sector was 14.7x LTM EBITDA
▪ 34% premium to the broader market but below its three year average of 16.0x
▪ Bourne Partners believes the CDMO sector has been particularly hot over the last handful of years and may see additional correction in 2019 as a result
▪ However, this sector will remain strong compared to the overall market due to industry tailwinds (i.e. the continued outsourcing of manufacturing from larger pharma companies)
▪ As Biopharma continues its run, CDMOs focused on biologics should see higher multiples than their traditional CDMO counterparts
6
14.7x
5.0x
10.0x
15.0x
20.0x
25.0x
EV/E
BIT
DA
CDMO Valuations
11.0x
Trading History (3 Years) – CDMO
*Index constituents listed on subsequent slideSource: CapitalIQ Dec. 31, 2018
CDMO IndexS&P 5003 Year Average – CDMO
▪ The CDMO Index’ Year-End TEV/EBITDA multiple: 14.7x
▪ Three Year Average TEV/EBITDA multiple for the CDMO Index: 16.0x
16.0x
7
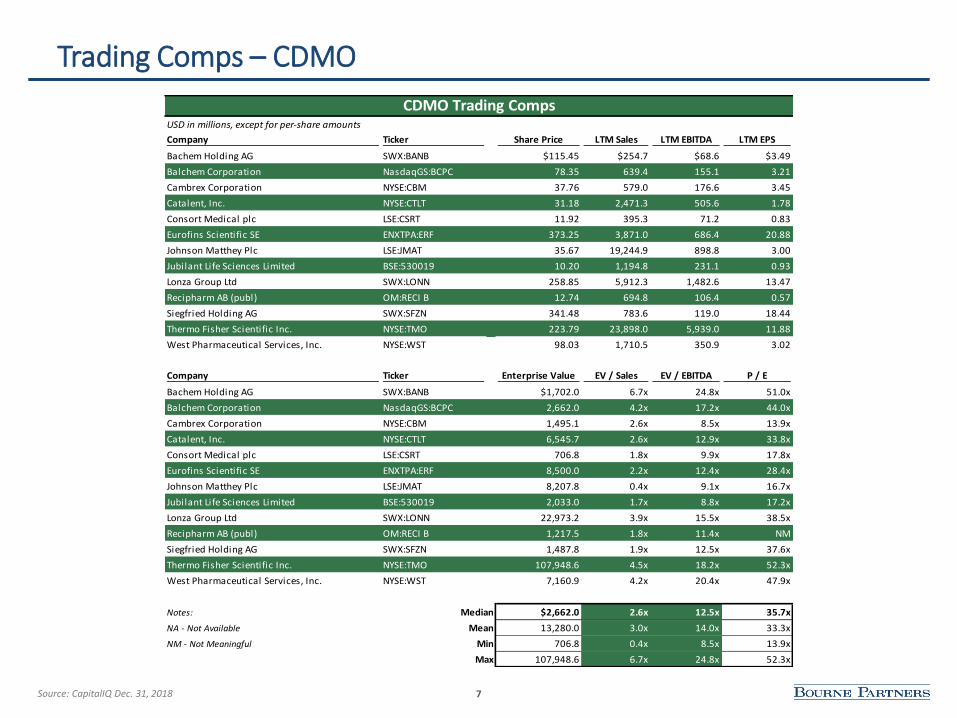
Trading Comps – CDMO
Source: CapitalIQ Dec. 31, 2018
CDMO Trading CompsUSD in millions, except for per-share amounts
Company Ticker Share Price LTM Sales LTM EBITDA LTM EPS
Bachem Holding AG SWX:BANB $115.45 $254.7 $68.6 $3.49
Balchem Corporation NasdaqGS:BCPC 78.35 639.4 155.1 3.21
Cambrex Corporation NYSE:CBM 37.76 579.0 176.6 3.45
Catalent, Inc. NYSE:CTLT 31.18 2,471.3 505.6 1.78
Consort Medical plc LSE:CSRT 11.92 395.3 71.2 0.83
Eurofins Scientific SE ENXTPA:ERF 373.25 3,871.0 686.4 20.88
Johnson Matthey Plc LSE:JMAT 35.67 19,244.9 898.8 3.00
Jubilant Life Sciences Limited BSE:530019 10.20 1,194.8 231.1 0.93
Lonza Group Ltd SWX:LONN 258.85 5,912.3 1,482.6 13.47
Recipharm AB (publ) OM:RECI B 12.74 694.8 106.4 0.57
Siegfried Holding AG SWX:SFZN 341.48 783.6 119.0 18.44
Thermo Fisher Scientific Inc. NYSE:TMO 223.79 23,898.0 5,939.0 11.88
West Pharmaceutical Services, Inc. NYSE:WST 98.03 1,710.5 350.9 3.02
Company Ticker Enterprise Value EV / Sales EV / EBITDA P / E
Bachem Holding AG SWX:BANB $1,702.0 6.7x 24.8x 51.0x
Balchem Corporation NasdaqGS:BCPC 2,662.0 4.2x 17.2x 44.0x
Cambrex Corporation NYSE:CBM 1,495.1 2.6x 8.5x 13.9x
Catalent, Inc. NYSE:CTLT 6,545.7 2.6x 12.9x 33.8x
Consort Medical plc LSE:CSRT 706.8 1.8x 9.9x 17.8x
Eurofins Scientific SE ENXTPA:ERF 8,500.0 2.2x 12.4x 28.4x
Johnson Matthey Plc LSE:JMAT 8,207.8 0.4x 9.1x 16.7x
Jubilant Life Sciences Limited BSE:530019 2,033.0 1.7x 8.8x 17.2x
Lonza Group Ltd SWX:LONN 22,973.2 3.9x 15.5x 38.5x
Recipharm AB (publ) OM:RECI B 1,217.5 1.8x 11.4x NM
Siegfried Holding AG SWX:SFZN 1,487.8 1.9x 12.5x 37.6x
Thermo Fisher Scientific Inc. NYSE:TMO 107,948.6 4.5x 18.2x 52.3x
West Pharmaceutical Services, Inc. NYSE:WST 7,160.9 4.2x 20.4x 47.9x
Notes: Median $2,662.0 2.6x 12.5x 35.7x
NA - Not Available Mean 13,280.0 3.0x 14.0x 33.3x
NM - Not Meaningful Min 706.8 0.4x 8.5x 13.9x
Max 107,948.6 6.7x 24.8x 52.3x

8
Transaction Comps – CDMO
Source: CapitalIQ Dec. 31, 2018*Cambrex Corporation Press Release
CDMO Transaction CompsUSD in millions
Announced Date Target Buyer
Geographic
Location
Enterprise
Value LTM Revenue LTM EBITDA
EV / LTM
Revenue
EV / LTM
EBITDA
Nov-18 Avista Pharma Solutions Cambrex Corporation USA $252.0 $65.0 NA 3.9x NA
Jul-18 AMPAC Fine Chemicals LLC SK Holdings Co., Ltd. USA 455.0 200.0 NA NA NA
Jul-18 Halo Pharma, Inc. Cambrex Corporation USA 425.0 105.0 $27.0 4.0x 15.7x
Jun-18 Alcami CorporationMadison Dearborn
PartnersUSA NA NA NA NA NA
Sep-17 Cook Pharmica LLCCatalent Pharma Solutions,
Inc.USA 950.0 177.8 NA 5.3x NA
Jul-17 Aptuit LLC Evotec AG USA 300.0 92.9 11.6 3.2x 25.8x
Jun-17 PCAS SA Novacap France 335.9 243.7 19.7 1.4x 17.0x
Jun-17 Albany Molecular Research, Inc. The Carlyle Group L.P. USA 1,593.5 628.7 71.8 2.5x 22.2x
May-17 Patheon N.V. Thermo Fisher USA 7,205.3 1,933.0 351.2 3.7x 20.5x
Dec-16 Capsugel, Inc. Lonza Group Ltd. USA 5,500.0 1,000.0 344.0 5.5x 16.0x
Sep-16 PharmaCore, Inc. Cambrex Corporation USA 25.0 17.0 2.0 1.5x 12.5x
Notes: Median $440.0 $188.9 $27.0 3.7x 17.0x
NA - Not Available Mean 1,865.5 488.7 118.2 3.4x 18.5x
NM - Not Meaningful Min 25.0 17.0 2.0 1.4x 12.5x
Max 7,205.3 1,933.0 351.2 5.5x 25.8x
*

9
CRO Recap
▪ Despite the late year sell-off, the CRO market continues to see heightened multiples
▪ The Dec. 31, 2018 TEV/EBITDA multiple for the CRO sector is 16.4x LTM EBITDA
▪ 49% premium to the broader market and level with its three year average of 16.7x
▪ The sharp increase in TEV/EBITDA multiples in late 2016 is from the increase that IQVIA Holdings (then known as Quintiles Transnational Holdings) saw when it announced it’s merger with IMS Health Holdings. This is pronounced in the graph because of IQVIA’s size/weighting in the index
▪ Moving forward, Bourne Partners expects to see some correction in the CRO market, but believes it will stay propped above thebroader market due to industry tailwinds
▪ The positive sentiment towards CROs from pharmaceutical companies and investors should continue as pharmaceutical companies continue to outsource clinical development services to focus on core-competencies
▪ We also expect to see an increased use of big data for CROs in an effort to streamline many of the development processes

10
11.0x
16.4x
5.0x
10.0x
15.0x
20.0x
25.0x
EV/E
BIT
DA
CRO Valuations
Trading History (3 Years) – CRO
*Index constituents listed on subsequent slideSource: CapitalIQ Dec. 31, 2018
CRO IndexS&P 5003 Year Average – CRO
▪ The CRO Index’ Year-End TEV/EBITDA multiple: 16.4x
▪ Three Year Average TEV/EBITDA multiple for the CRO Index: 16.7x
16.7x
Quintiles – IMS merger announcement

11
Trading Comps – CRO
Source: CapitalIQ Dec. 31, 2018
CRO Trading CompsUSD in millions, except for per-share amounts
Company Ticker Share Price LTM Sales LTM EBITDA LTM EPS
Charles River Laboratories International, Inc. NYSE:CRL $113.18 $2,143.0 $495.0 $6.07
ICON Public Limited Company NasdaqGS:ICLR 129.21 2,371.9 444.5 6.60
IQVIA Holdings Inc. NYSE:IQV 116.17 8,603.0 1,817.0 6.02
Linical Co., Ltd. TSE:2183 11.78 91.7 17.6 0.61
Medpace Holdings, Inc. NasdaqGS:MEDP 52.93 611.9 126.5 2.88
PRA Health Sciences, Inc. NasdaqGS:PRAH 91.96 2,487.2 410.3 4.69
Syneos Health, Inc. Nasdaq:SYNH 39.35 3,995.1 489.1 3.01
Company Ticker Enterprise Value EV / Sales EV / EBITDA P / E
Charles River Laboratories International, Inc. NYSE:CRL $6,983.8 3.3x 14.1x 27.6x
ICON Public Limited Company NasdaqGS:ICLR 6,891.4 2.9x 15.5x 33.6x
IQVIA Holdings Inc. NYSE:IQV 32,753.0 3.8x 18.0x 95.8x
Linical Co., Ltd. TSE:2183 259.2 2.8x 14.8x 24.8x
Medpace Holdings, Inc. NasdaqGS:MEDP 1,991.6 3.3x 15.7x 58.1x
PRA Health Sciences, Inc. NasdaqGS:PRAH 7,039.1 2.8x 17.2x 53.2x
Syneos Health, Inc. Nasdaq:SYNH 6,804.8 1.7x 13.9x NM
Notes: Median $6,891.4 2.9x 15.5x 43.4x
NA - Not Available Mean 8,960.4 2.9x 15.6x 48.8x
NM - Not Meaningful Min 259.2 1.7x 13.9x 24.8x
Max 32,753.0 3.8x 18.0x 95.8x

12
Transaction Comps – CRO
Source: CapitalIQ Dec. 31, 2018
CRO Transaction CompsUSD in millions
Announced Date Target Buyer
Geographic
Location
Enterprise
Value LTM Revenue LTM EBITDA
EV / LTM
Revenue
EV / LTM
EBITDA
Mar-18 Accelovance, Inc. Linical USA, Inc. USA $32.9 $26.8 NA 1.2x NA
Feb-18 MPI Research Inc.Charles River Laboratories
International, Inc.USA 800.0 240.0 $68.4 3.3x 11.7x
Sep-17 Optimal Research Synexus Limited USA NA NA NA NA NA
Jul-17 MAPI Development SASICON Public Limited
CompanyFrance 139.5 NA NA NA NA
Jul-17 Chiltern International Limited Covance Inc. UK 1,200.0 NA NA NA NA
Jun-17PAREXEL International
Corporation
Pamplona Capital
Management LLPUSA 5,007.4 2,097.0 342.8 2.4x 14.6x
May-17 inVentiv HealthINC Research Holdings,
Inc.USA 4,513.7 2,177.4 292.7 2.1x 15.4x
Sep-16 ExecuPharm Inc.PAREXEL International
CorporationUSA 155.0 NA NA NA NA
May-16 IMS Health Holdings, Inc.Quintiles Transnational
Holdings Inc.USA 13,266.8 3,063.0 743.0 4.3x 17.9x
May-16 Synexus LimitedPharmaceutical Product
Development, LLCUK 257.8 68.8 15.9 3.7x 16.2x
Notes: Median $800.0 $1,168.5 $292.7 2.9x 15.4x
NA - Not Available Mean 2,819.2 1,278.8 292.6 2.9x 15.2x
NM - Not Meaningful Min 32.9 26.8 15.9 1.2x 11.7x
Max 13,266.8 3,063.0 743.0 4.3x 17.9x

PBM/Managed Care
13

14
PBM/Managed Care Recap
▪ Over the last three years, PBMs and Managed Care organizations have traded roughly in line with the S&P 500, but with the Q4 market sell-off, multiples for the PBM/Managed Care segment have surpassed those of the S&P 500
▪ The Dec. 31, 2018 TEV/EBITDA multiple for the PBM/Managed Care sector was 12.1x LTM EBITDA
▪ 10% premium to the broader market and above its three year average of 11.0x
▪ In 2018, valuations and economics were largely driven by mega-deals and transformational moves such as the CVS-Aetna, Cigna-Express Scripts, and Amazon-PillPack transactions
▪ Both CVS-Aetna and Cigna-Express Scripts showed the industry’s move toward vertical integration in an effort to control the skyrocketing cost of healthcare and expand network/service profile
▪ The Amazon-PillPack transaction was not directly between PBM’s or Managed Care Organizations but promises to disrupt the traditional drug supply chain and pharmaceutical delivery channels

15
11.0x
12.1x
5.0x
10.0x
15.0x
20.0x
EV/E
BIT
DA
PBM/Managed Care Valuations
Trading History (3 Years) – PBM/Managed Care
*Index constituents listed on subsequent slideSource: CapitalIQ Dec. 31, 2018
PBM/Managed Care IndexS&P 5003 Year Average – PBM/Managed Care
▪ The PBM/Managed Care Index’ Year-End TEV/EBITDA multiple: 12.1x
▪ Three Year Average TEV/EBITDA multiple for the PBM/Managed Care Index: 11.0x
11.0x
16
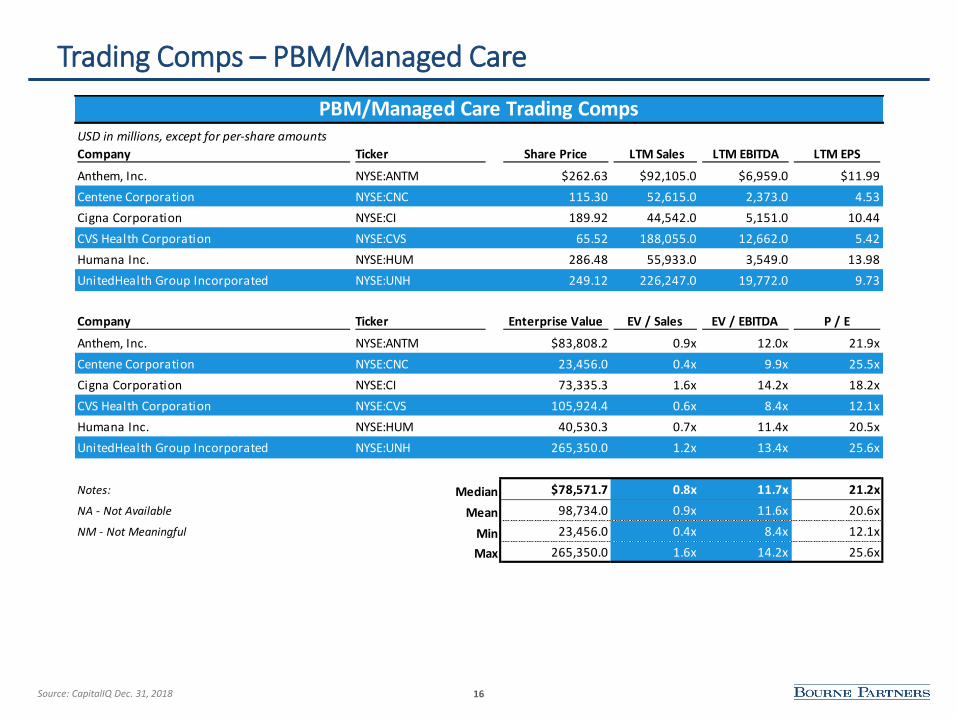
Trading Comps – PBM/Managed Care
Source: CapitalIQ Dec. 31, 2018
PBM/Managed Care Trading CompsUSD in millions, except for per-share amounts
Company Ticker Share Price LTM Sales LTM EBITDA LTM EPS
Anthem, Inc. NYSE:ANTM $262.63 $92,105.0 $6,959.0 $11.99
Centene Corporation NYSE:CNC 115.30 52,615.0 2,373.0 4.53
Cigna Corporation NYSE:CI 189.92 44,542.0 5,151.0 10.44
CVS Health Corporation NYSE:CVS 65.52 188,055.0 12,662.0 5.42
Humana Inc. NYSE:HUM 286.48 55,933.0 3,549.0 13.98
UnitedHealth Group Incorporated NYSE:UNH 249.12 226,247.0 19,772.0 9.73
Company Ticker Enterprise Value EV / Sales EV / EBITDA P / E
Anthem, Inc. NYSE:ANTM $83,808.2 0.9x 12.0x 21.9x
Centene Corporation NYSE:CNC 23,456.0 0.4x 9.9x 25.5x
Cigna Corporation NYSE:CI 73,335.3 1.6x 14.2x 18.2x
CVS Health Corporation NYSE:CVS 105,924.4 0.6x 8.4x 12.1x
Humana Inc. NYSE:HUM 40,530.3 0.7x 11.4x 20.5x
UnitedHealth Group Incorporated NYSE:UNH 265,350.0 1.2x 13.4x 25.6x
Notes: Median $78,571.7 0.8x 11.7x 21.2x
NA - Not Available Mean 98,734.0 0.9x 11.6x 20.6x
NM - Not Meaningful Min 23,456.0 0.4x 8.4x 12.1x
Max 265,350.0 1.6x 14.2x 25.6x

17
Transaction Comps – PBM/Managed Care
Source: CapitalIQ Dec. 31, 2018
PBM/Managed Care Transaction CompsUSD in millions
Announced Date Target Buyer
Geographic
Location
Enterprise
Value LTM Revenue LTM EBITDA
EV / LTM
Revenue
EV / LTM
EBITDA
Sep-18 Genoa Healthcare, LLC OptumRx, Inc. USA $2,500.0 NA NA NA NA
Jul-18 Pulse Rx Inc.Leviathan Cannabis Group
Inc.Canada 4.2 $1.9 NA 2.2x NA
Mar-18 RxAdvance Corporation Centene Corporation USA NA NA NA NA NA
Mar-18Express Scripts Holding
CompanyCigna Corporation USA 68,671.4 100,064.6 $7,132.5 0.7x 9.6x
Dec-17 Aetna Inc. CVS Health Corporation USA 69,643.0 60,535.0 5,685.0 1.2x 12.3x
Nov-17National Pharmaceutical
ServicesDiplomat Pharmacy, Inc. USA 47.0 32.0 5.4 1.5x 8.7x
Nov-16Integrated Prescription
Solutions, Inc.Mitchell International, Inc. USA NA NA NA NA NA
Jan-16 Helios Comp OptumRx, Inc. USA 1,600.0 NA NA NA NA
Mar-15 Catamaran Corporation OptumRx, Inc. USA 13,385.5 21,581.9 845.7 0.6x 15.8x
Feb-15 Healthcare Solutions, Inc. Catamaran Corporation USA 405.0 NA 35.0 NA 11.6x
Feb-15 Envision Topco Holdings, LLC Rite Aid Corporation USA 2,640.1 4,071.4 94.3 0.6x 28.0x
Notes: Median $2,500.0 $12,826.6 $470.0 0.9x 11.9x
NA - Not Available Mean 17,655.1 31,047.8 2,299.7 1.1x 14.3x
NM - Not Meaningful Min 4.2 1.9 5.4 0.6x 8.7x
Max 69,643.0 100,064.6 7,132.5 2.2x 28.0x

Compounding/Specialty Pharmacy
18

19
Compounding/Specialty Pharmacy Recap
▪ Despite the late year sell-off, multiples remain elevated in the Compounding/Specialty Pharmacy market in comparison to the S&P 500
▪ The Dec. 31, 2018 TEV/EBITDA multiple for the Compounding/Specialty Pharmacy sector was 17.2x LTM EBITDA
▪ 56% premium to the broader market but below its three year average of 20.1x
▪ As you’ll see in the trading graph, there was a significant dip in multiples in the early Spring of 2016 – a blip that comes from a steep decline in Diplomat Pharmacy’s TEV/EBITDA multiple at the same time
▪ The decrease for Diplomat came on the back of an announcement of change in executive(s) and was compounded by its earnings release/guidance given in Q1 2016
▪ Without this dip, the three year average TEV/EBITDA for Compounding/Specialty Pharmacies would likely sit lower but still above its current multiple
▪ Bourne believes this sector’s multiples will remain favorable due to the margin profiles, the nascent and untapped opportunity within the Compounding market, the continued specialization of newer drugs, and the niche nature of the service provided by specialty pharmacies
▪ Although there is not a large universe of publicly traded companies in the space, there have been a myriad of Private Equity companies interested in the space, including but not limited to Bain Capital, Enhanced Healthcare Partners, and HIG Capital

20
17.2x
5.0x
10.0x
15.0x
20.0x
25.0x
30.0x
35.0x
EV/E
BIT
DA
Compounding/Specialty Pharmacy Valuations
11.0x
Trading History (3 Years) – Compounding/Specialty Pharmacy
*Index constituents listed on subsequent slideSource: CapitalIQ Dec. 31, 2018
Compounding/Specialty Pharmacy IndexS&P 5003 Year Average – Compounding/Specialty Pharmacy
▪ The Compounding/Specialty Pharmacy Index’ Year-End TEV/EBITDA multiple: 17.2x
▪ Three Year Average TEV/EBITDA multiple for the Compounding/Specialty Pharmacy Index: 20.1x
20.1x
21
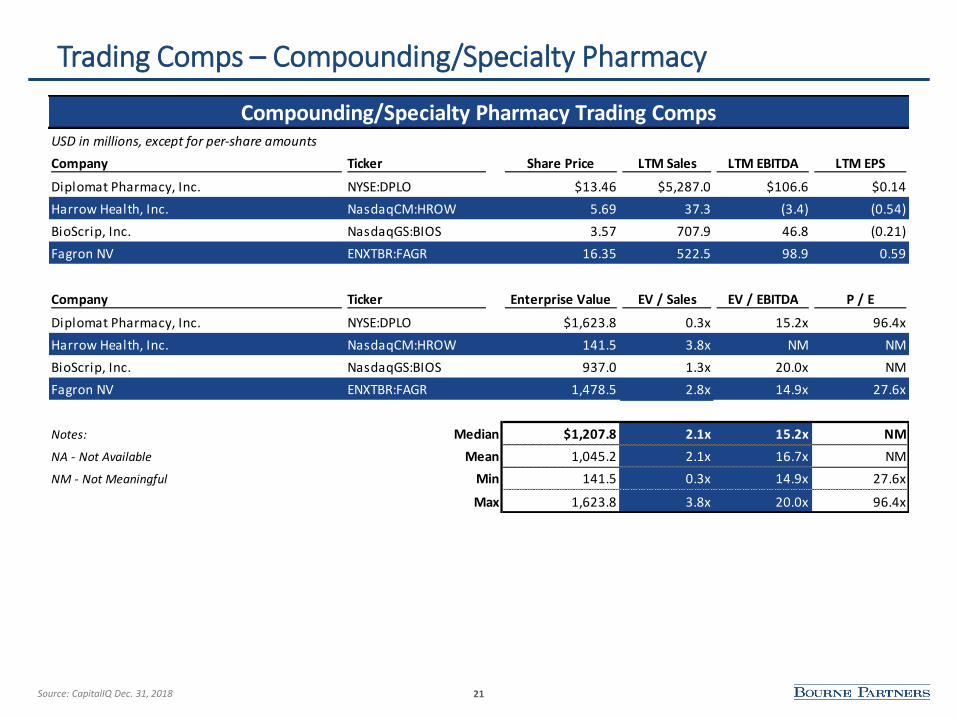
Trading Comps – Compounding/Specialty Pharmacy
Source: CapitalIQ Dec. 31, 2018
Compounding/Specialty Pharmacy Trading CompsUSD in millions, except for per-share amounts
Company Ticker Share Price LTM Sales LTM EBITDA LTM EPS
Diplomat Pharmacy, Inc. NYSE:DPLO $13.46 $5,287.0 $106.6 $0.14
Harrow Health, Inc. NasdaqCM:HROW 5.69 37.3 (3.4) (0.54)
BioScrip, Inc. NasdaqGS:BIOS 3.57 707.9 46.8 (0.21)
Fagron NV ENXTBR:FAGR 16.35 522.5 98.9 0.59
Company Ticker Enterprise Value EV / Sales EV / EBITDA P / E
Diplomat Pharmacy, Inc. NYSE:DPLO $1,623.8 0.3x 15.2x 96.4x
Harrow Health, Inc. NasdaqCM:HROW 141.5 3.8x NM NM
BioScrip, Inc. NasdaqGS:BIOS 937.0 1.3x 20.0x NM
Fagron NV ENXTBR:FAGR 1,478.5 2.8x 14.9x 27.6x
Notes: Median $1,207.8 2.1x 15.2x NM
NA - Not Available Mean 1,045.2 2.1x 16.7x NM
NM - Not Meaningful Min 141.5 0.3x 14.9x 27.6x
Max 1,623.8 3.8x 20.0x 96.4x

22
Transaction Comps – Compounding/Specialty Pharmacy
Source: CapitalIQ Dec. 31, 2018
Compounding/Specialty Pharmacy Transaction CompsUSD in millions
Announced Date Target Buyer
Geographic
Location
Enterprise
Value LTM Revenue LTM EBITDA
EV / LTM
Revenue
EV / LTM
EBITDA
Nov-17 Leehar Distributors, Inc. Diplomat Pharmacy, Inc. USA $595.6 $388.0 $41.0 1.5x 14.5x
Nov-17 Salus Pharmacare Inc. Centric Health Corporation Canada 3.2 NA 0.5 NA 6.8x
Aug-17 Quantum Pharma Plc True Nature Holding, Inc. United Kingdom 199.9 119.5 8.2 1.7x 24.4x
Apr-16Diplomat Specialty Pharmacy of
Los Angeles County, Inc.Diplomat Pharmacy, Inc. USA 75.7 400.0 9.0 NM 8.4x
Apr-16Integrity Compounding
Pharmacy, LLCTrue Nature Holding, Inc. USA 1.0 0.9 NA 1.1x NA
Oct-15PharMEDium Healthcare
Holdings, Inc.
AmerisourceBergen Drug
CorporationUSA 3,060.8 405.7 96.0 7.5x 31.9x
May-15 AnazaoHealth Corporation Fagron NV USA 97.8 NA 16.3 NA 6.0x
Jun-13 CarePoint Partners, LLC BioScrip, Inc. USA 221.1 140.5 NA 1.6x NA
Notes: Median $148.9 $264.3 $12.7 1.6x 11.5x
NA - Not Available Mean 531.9 242.4 28.5 2.7x 15.3x
NM - Not Meaningful Min 1.0 0.9 0.5 1.1x 6.0x
Max 3,060.8 405.7 96.0 7.5x 31.9x

Pharmaceuticals
23

24
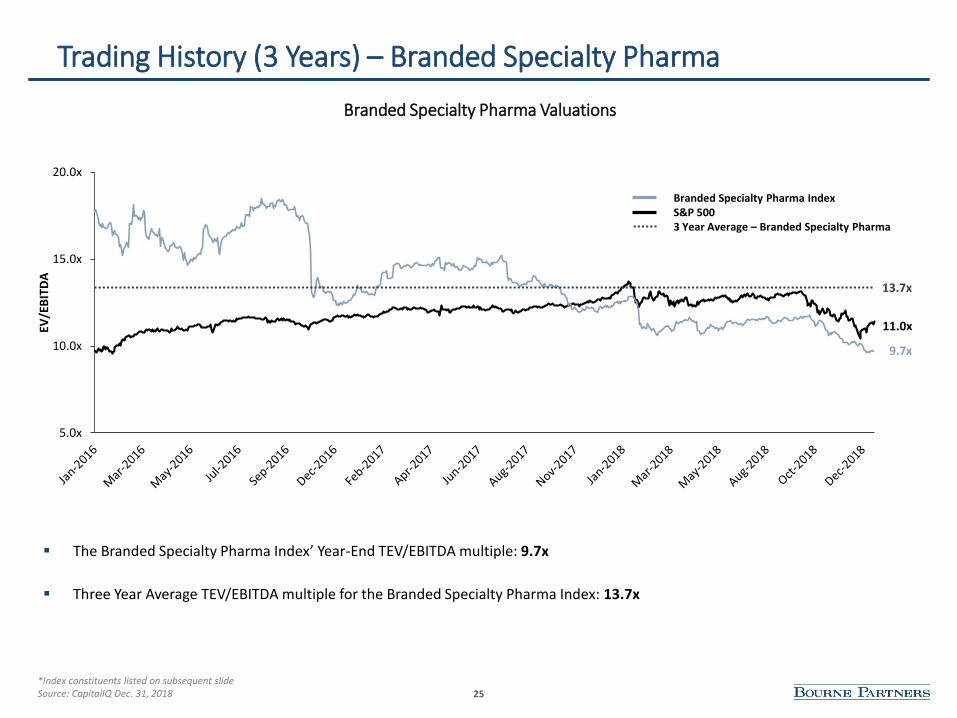
Branded Specialty Pharma Recap
▪ The Branded Specialty Pharma segment has seen sharp declines starting in late 2015 due to the loss of the traditionally strong pricing lever
▪ This issue was amplified in 2018 due to the scrutiny of Pharma by President Trump
▪ The Dec. 31, 2018 TEV/EBITDA multiple for the Branded Specialty Pharma sector was 9.7x LTM EBITDA
▪ 12% discount to the broader market and below its three year average of 13.7x
▪ Bourne Partners believes the Branded Specialty Pharma sector is in a trough and that it could be poised for a boost in the near future, making now a good time to buy in the cycle
25
11.0x
9.7x
5.0x
10.0x
15.0x
20.0x
EV/E
BIT
DA
Branded Specialty Pharma Valuations
Trading History (3 Years) – Branded Specialty Pharma
*Index constituents listed on subsequent slideSource: CapitalIQ Dec. 31, 2018
Branded Specialty Pharma IndexS&P 5003 Year Average – Branded Specialty Pharma
▪ The Branded Specialty Pharma Index’ Year-End TEV/EBITDA multiple: 9.7x
▪ Three Year Average TEV/EBITDA multiple for the Branded Specialty Pharma Index: 13.7x
13.7x
26
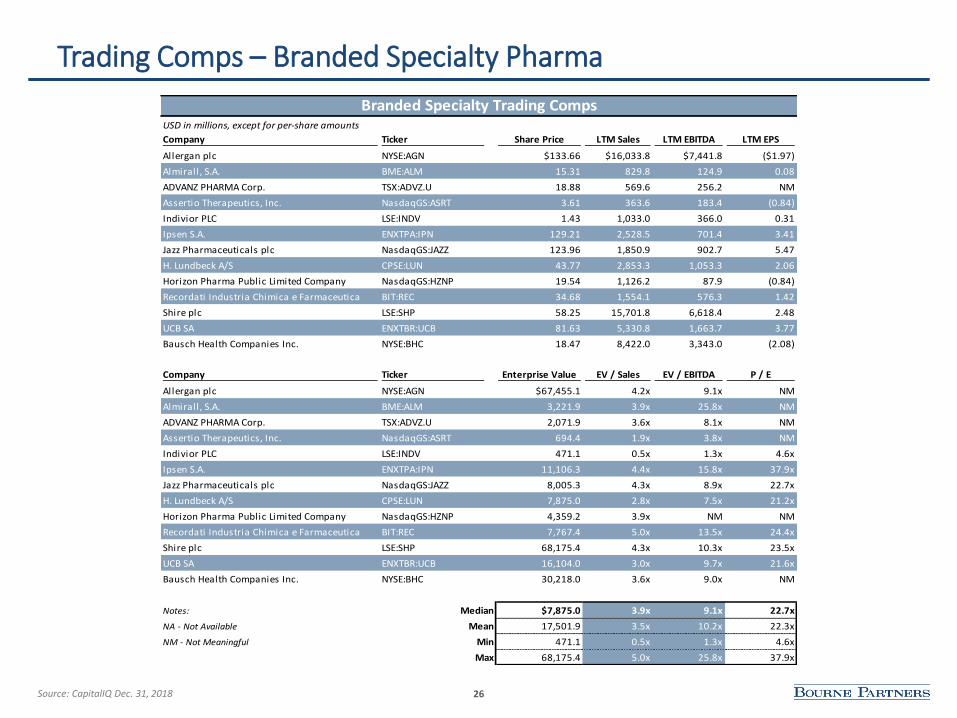
Trading Comps – Branded Specialty Pharma
Source: CapitalIQ Dec. 31, 2018
Branded Specialty Trading CompsUSD in millions, except for per-share amounts
Company Ticker Share Price LTM Sales LTM EBITDA LTM EPS
Allergan plc NYSE:AGN $133.66 $16,033.8 $7,441.8 ($1.97)
Almirall, S.A. BME:ALM 15.31 829.8 124.9 0.08
ADVANZ PHARMA Corp. TSX:ADVZ.U 18.88 569.6 256.2 NM
Assertio Therapeutics, Inc. NasdaqGS:ASRT 3.61 363.6 183.4 (0.84)
Indivior PLC LSE:INDV 1.43 1,033.0 366.0 0.31
Ipsen S.A. ENXTPA:IPN 129.21 2,528.5 701.4 3.41
Jazz Pharmaceuticals plc NasdaqGS:JAZZ 123.96 1,850.9 902.7 5.47
H. Lundbeck A/S CPSE:LUN 43.77 2,853.3 1,053.3 2.06
Horizon Pharma Public Limited Company NasdaqGS:HZNP 19.54 1,126.2 87.9 (0.84)
Recordati Industria Chimica e Farmaceutica BIT:REC 34.68 1,554.1 576.3 1.42
Shire plc LSE:SHP 58.25 15,701.8 6,618.4 2.48
UCB SA ENXTBR:UCB 81.63 5,330.8 1,663.7 3.77
Bausch Health Companies Inc. NYSE:BHC 18.47 8,422.0 3,343.0 (2.08)
Company Ticker Enterprise Value EV / Sales EV / EBITDA P / E
Allergan plc NYSE:AGN $67,455.1 4.2x 9.1x NM
Almirall, S.A. BME:ALM 3,221.9 3.9x 25.8x NM
ADVANZ PHARMA Corp. TSX:ADVZ.U 2,071.9 3.6x 8.1x NM
Assertio Therapeutics, Inc. NasdaqGS:ASRT 694.4 1.9x 3.8x NM
Indivior PLC LSE:INDV 471.1 0.5x 1.3x 4.6x
Ipsen S.A. ENXTPA:IPN 11,106.3 4.4x 15.8x 37.9x
Jazz Pharmaceuticals plc NasdaqGS:JAZZ 8,005.3 4.3x 8.9x 22.7x
H. Lundbeck A/S CPSE:LUN 7,875.0 2.8x 7.5x 21.2x
Horizon Pharma Public Limited Company NasdaqGS:HZNP 4,359.2 3.9x NM NM
Recordati Industria Chimica e Farmaceutica BIT:REC 7,767.4 5.0x 13.5x 24.4x
Shire plc LSE:SHP 68,175.4 4.3x 10.3x 23.5x
UCB SA ENXTBR:UCB 16,104.0 3.0x 9.7x 21.6x
Bausch Health Companies Inc. NYSE:BHC 30,218.0 3.6x 9.0x NM
Notes: Median $7,875.0 3.9x 9.1x 22.7x
NA - Not Available Mean 17,501.9 3.5x 10.2x 22.3x
NM - Not Meaningful Min 471.1 0.5x 1.3x 4.6x
Max 68,175.4 5.0x 25.8x 37.9x

27
Transaction Comps – Branded Specialty Pharma
Source: CapitalIQ Dec. 31, 2018
Branded Specialty Pharma Transaction CompsUSD in millions
Announced Date Target Buyer
Geographic
Location
Enterprise
Value LTM Revenue LTM EBITDA
EV / LTM
Revenue
EV / LTM
EBITDA
Oct-18 Laboratorios Vencofarma Dechra Pharmaceuticals Brazil $49.7 $19.6 NA 2.8x NA
Sep-18 Midatech Pharma Barings United Kingdom 19.0 9.1 NA 2.1x NA
Oct-18 Hovid TAEL Pantaleon Malaysia 92.8 53.2 $6.0 1.8x 15.9x
Jun-18 Prialt from Jazz Pharmaceuticals TerSera Therapeutics USA 80.0 27.0 NA 3.0x NA
Apr-18 Shire Takeda Ireland 81,348.8 15,354.0 6,449.9 5.3x 12.6x
Apr-18 Oncology Business from Shire Servier Pharmaceuticals Ireland 2,400.0 262.0 NA 9.2x NA
Apr-18 Merck Limited Proctor & Gamble India Thailand 324.3 180.7 26.4 1.8x 12.5x
Mar-18 10 brands from Leo Pharma Karo Pharma Denmark 317.0 85.5 NA 3.8x NA
Dec-17 4 brands from AstraZeneca ANI Pharmaceuticals USA 46.5 19.0 NA 2.4x NA
Sep-17 JCR Pharmaceuticals MediPal Japan 839.2 166.2 36.2 5.0x 23.2x
Notes: Median $204.9 $69.4 $31.3 2.9x 14.3x
NA - Not Available Mean 8,551.7 1,617.6 1,629.6 3.7x 16.1x
NM - Not Meaningful Min 19.0 9.1 6.0 1.8x 12.5x
Max 81,348.8 15,354.0 6,449.9 9.2x 23.2x

28
Generic Pharma Recap
▪ Multiples in the Generic Pharma industry remain depressed from their steep decline in 2015 and from continued price deflation
▪ The Dec. 31, 2018 TEV/EBITDA multiple for the Generic Pharma sector was 9.8x LTM EBITDA
▪ 11% discount to the broader market and below its three year average of 11.0x
▪ Bourne Partners sees this as a bottom in the cycle and views the current position as a good time to buy
▪ Many generic CEOs in our network believe some pricing power will return in the near term, which should provide tailwinds to push the industry up going forward

29
11.0x
9.8x
5.0x
10.0x
15.0x
20.0x
EV/E
BIT
DA
Generic Pharma Valuations
Trading History (3 Years) – Generic Pharma
*Index constituents listed on subsequent slideSource: CapitalIQ Dec. 31, 2018
Generic Pharma IndexS&P 5003 Year Average – Generic Pharma
▪ The Generic Pharma Index’ Year-End TEV/EBITDA multiple: 9.8x
▪ Three Year Average TEV/EBITDA multiple for the Generic Pharma Index: 11.0x
11.0x
30
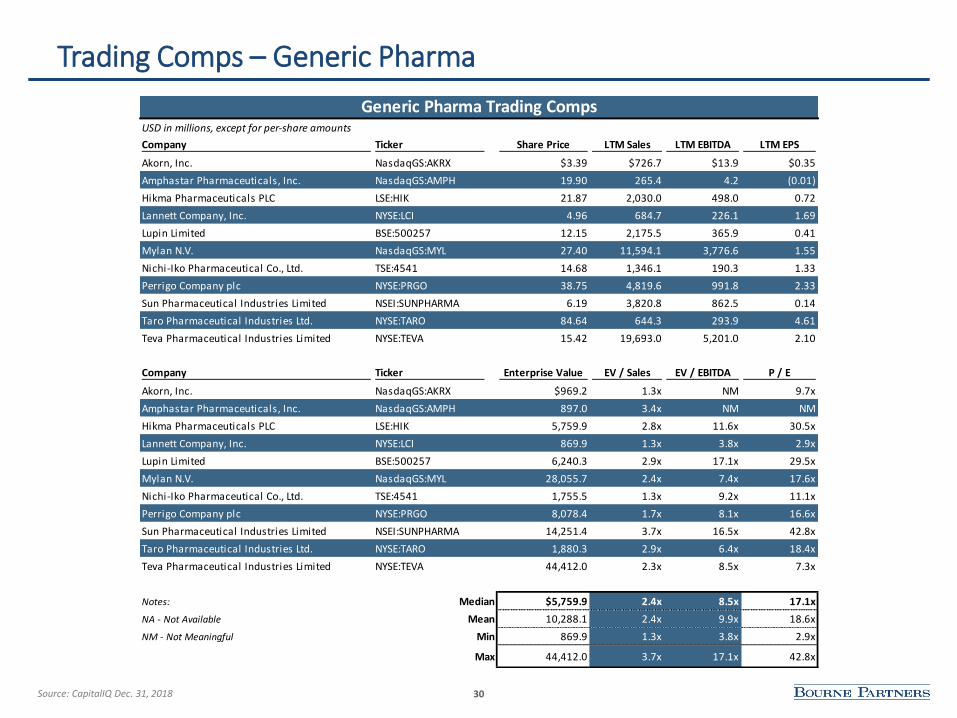
Trading Comps – Generic Pharma
Source: CapitalIQ Dec. 31, 2018
Generic Pharma Trading CompsUSD in millions, except for per-share amounts
Company Ticker Share Price LTM Sales LTM EBITDA LTM EPS
Akorn, Inc. NasdaqGS:AKRX $3.39 $726.7 $13.9 $0.35
Amphastar Pharmaceuticals, Inc. NasdaqGS:AMPH 19.90 265.4 4.2 (0.01)
Hikma Pharmaceuticals PLC LSE:HIK 21.87 2,030.0 498.0 0.72
Lannett Company, Inc. NYSE:LCI 4.96 684.7 226.1 1.69
Lupin Limited BSE:500257 12.15 2,175.5 365.9 0.41
Mylan N.V. NasdaqGS:MYL 27.40 11,594.1 3,776.6 1.55
Nichi-Iko Pharmaceutical Co., Ltd. TSE:4541 14.68 1,346.1 190.3 1.33
Perrigo Company plc NYSE:PRGO 38.75 4,819.6 991.8 2.33
Sun Pharmaceutical Industries Limited NSEI:SUNPHARMA 6.19 3,820.8 862.5 0.14
Taro Pharmaceutical Industries Ltd. NYSE:TARO 84.64 644.3 293.9 4.61
Teva Pharmaceutical Industries Limited NYSE:TEVA 15.42 19,693.0 5,201.0 2.10
Company Ticker Enterprise Value EV / Sales EV / EBITDA P / E
Akorn, Inc. NasdaqGS:AKRX $969.2 1.3x NM 9.7x
Amphastar Pharmaceuticals, Inc. NasdaqGS:AMPH 897.0 3.4x NM NM
Hikma Pharmaceuticals PLC LSE:HIK 5,759.9 2.8x 11.6x 30.5x
Lannett Company, Inc. NYSE:LCI 869.9 1.3x 3.8x 2.9x
Lupin Limited BSE:500257 6,240.3 2.9x 17.1x 29.5x
Mylan N.V. NasdaqGS:MYL 28,055.7 2.4x 7.4x 17.6x
Nichi-Iko Pharmaceutical Co., Ltd. TSE:4541 1,755.5 1.3x 9.2x 11.1x
Perrigo Company plc NYSE:PRGO 8,078.4 1.7x 8.1x 16.6x
Sun Pharmaceutical Industries Limited NSEI:SUNPHARMA 14,251.4 3.7x 16.5x 42.8x
Taro Pharmaceutical Industries Ltd. NYSE:TARO 1,880.3 2.9x 6.4x 18.4x
Teva Pharmaceutical Industries Limited NYSE:TEVA 44,412.0 2.3x 8.5x 7.3x
Notes: Median $5,759.9 2.4x 8.5x 17.1x
NA - Not Available Mean 10,288.1 2.4x 9.9x 18.6x
NM - Not Meaningful Min 869.9 1.3x 3.8x 2.9x
Max 44,412.0 3.7x 17.1x 42.8x

31
Transaction Comps – Generic Pharma
Source: CapitalIQ Dec. 31, 2018
Generic Pharma Transaction CompsUSD in millions
Announced Date Target Buyer
Geographic
Location
Enterprise
Value LTM Revenue LTM EBITDA
EV / LTM
Revenue
EV / LTM
EBITDA
Sep-18Derm and Oral Solids from
SandozAurobindo USA $1,000.0 $1,200.0 NA 0.8x NA
Sep-18 QECS Pharmaceutical Jolly Pharmaceutical NA 58.3 19.6 NA 3.1x NA
Jul-18 Subsidiaries from Apotex Agile Pharma Canada 86.4 163.4 NA 0.6x NA
Jun-18 Chase Sun Pharmaceutical Beijing GTJA China 1,631.6 574.7 $128.4 2.9x 13.0x
Jun-18 Zentiva from Sanofi Advent International France 2,201.9 880.7 179.6 2.5x 12.3x
Apr-18 Bremer Pharma Alivira Animal Health Germany 2.8 8.3 NA 0.3x NA
Mar-18 Elmed Eisai Nichi-Iko Japan 160.1 251.4 NA 0.6x NA
Nov-17 Subsidiaries from Strides Eris Lifesciences India 77.0 28.0 NA 2.8x NA
Jul-17 STADA Bain Capital Germany 6,264.9 2,564.5 472.3 2.3x 12.6x
Apr-17 Upsher-Smith Generic Business Sawai Pharmaceuticals USA 1,050.0 NA NA NA NA
Notes: Median $580.1 $251.4 $179.6 2.3x 12.6x
NA - Not Available Mean 1,253.3 632.3 260.1 1.8x 12.6x
NM - Not Meaningful Min 2.8 8.3 128.4 0.3x 12.3x
Max 6,264.9 2,564.5 472.3 3.1x 13.0x

Consumer Health
32

33
Consumer Health Recap
▪ The Consumer Health market has been on a steady decline from its three year high of 19.0x in January 2018 but remains strong relative to the S&P 500
▪ The Dec. 31, 2018 TEV/EBITDA multiple for the Consumer Health sector was 14.2x LTM EBITDA
▪ 29% premium to the broader market but below its three year average of 16.8x
▪ 2018 saw a handful of ventures within the Consumer Health space, specifically for Big Pharma, that showed a divergence on how large pharma companies are viewing the sector
▪ In March we saw GSK buy out Novartis’ remaining stake in GSK Consumer Health and later ink a JV with Pfizer Consumer Health to build an industry titan, showing GSK’s and Pfizer’s continued focus on this piece of the market
▪ In December Taisho Pharmaceutical Holdings signed a deal to buy Bristol-Myers Squibb’s UPSA Consumer Healthcare unit, showing BMS’ lack of focus on the sector moving forward
▪ Bourne partners expects this sector to remain strong for the foreseeable future

34
14.2x
5.0x
10.0x
15.0x
20.0x
25.0x
EV/E
BIT
DA
Consumer Health Valuations
11.0x
Trading History (3 Years) – Consumer Health
*Index constituents listed on subsequent slideSource: CapitalIQ Dec. 31, 2018
Consumer Health IndexS&P 5003 Year Average – Consumer Health
▪ The Consumer Health Index’ Year-End TEV/EBITDA multiple: 14.2x
▪ Three Year Average TEV/EBITDA multiple for the Consumer Health Index: 16.8x
16.8x
35
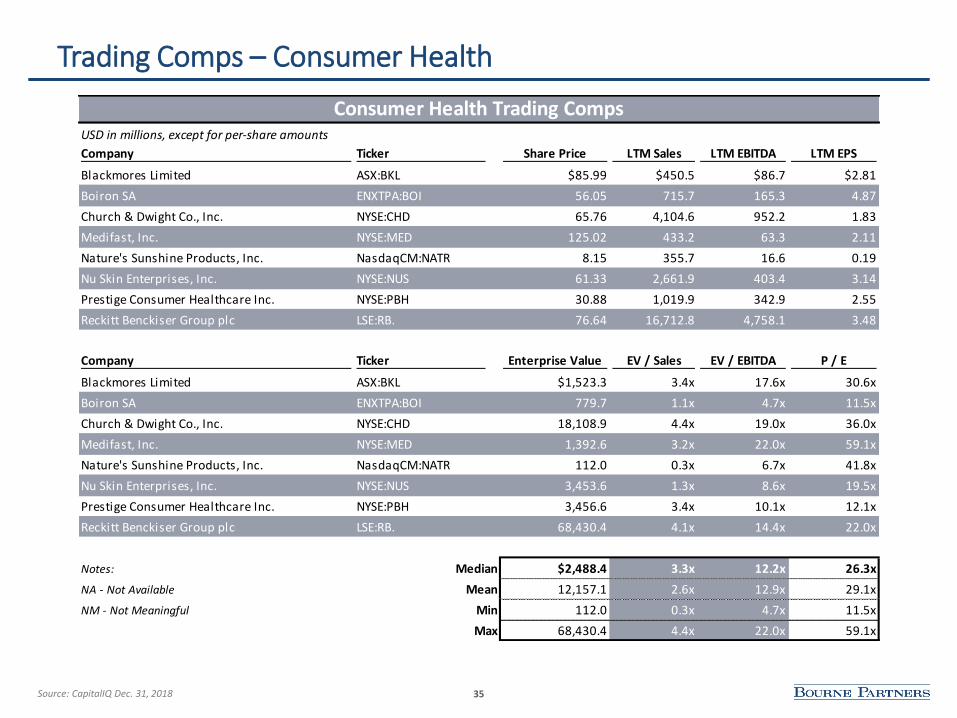
Trading Comps – Consumer Health
Source: CapitalIQ Dec. 31, 2018
Consumer Health Trading CompsUSD in millions, except for per-share amounts
Company Ticker Share Price LTM Sales LTM EBITDA LTM EPS
Blackmores Limited ASX:BKL $85.99 $450.5 $86.7 $2.81
Boiron SA ENXTPA:BOI 56.05 715.7 165.3 4.87
Church & Dwight Co., Inc. NYSE:CHD 65.76 4,104.6 952.2 1.83
Medifast, Inc. NYSE:MED 125.02 433.2 63.3 2.11
Nature's Sunshine Products, Inc. NasdaqCM:NATR 8.15 355.7 16.6 0.19
Nu Skin Enterprises, Inc. NYSE:NUS 61.33 2,661.9 403.4 3.14
Prestige Consumer Healthcare Inc. NYSE:PBH 30.88 1,019.9 342.9 2.55
Reckitt Benckiser Group plc LSE:RB. 76.64 16,712.8 4,758.1 3.48
Company Ticker Enterprise Value EV / Sales EV / EBITDA P / E
Blackmores Limited ASX:BKL $1,523.3 3.4x 17.6x 30.6x
Boiron SA ENXTPA:BOI 779.7 1.1x 4.7x 11.5x
Church & Dwight Co., Inc. NYSE:CHD 18,108.9 4.4x 19.0x 36.0x
Medifast, Inc. NYSE:MED 1,392.6 3.2x 22.0x 59.1x
Nature's Sunshine Products, Inc. NasdaqCM:NATR 112.0 0.3x 6.7x 41.8x
Nu Skin Enterprises, Inc. NYSE:NUS 3,453.6 1.3x 8.6x 19.5x
Prestige Consumer Healthcare Inc. NYSE:PBH 3,456.6 3.4x 10.1x 12.1x
Reckitt Benckiser Group plc LSE:RB. 68,430.4 4.1x 14.4x 22.0x
Notes: Median $2,488.4 3.3x 12.2x 26.3x
NA - Not Available Mean 12,157.1 2.6x 12.9x 29.1x
NM - Not Meaningful Min 112.0 0.3x 4.7x 11.5x
Max 68,430.4 4.4x 22.0x 59.1x

36
Consumer Health Transaction CompsUSD in millions
Announced Date Target Buyer
Geographic
Location
Enterprise
Value LTM Revenue LTM EBITDA
EV / LTM
Revenue
EV / LTM
EBITDA
18-DecBistol-Myers Squibb's UPSA
Consumer Health
Taisho Pharmaceutical
Holdings Co., Ltd.France $1,600.0 NA NA NA NA
18-Apr Humco Holding Group, Inc. Fagron Group BV USA 47.5 $21.6 NA 2.2x NA
18-MarNovartis Remaining Stake in
GSK Consumer HealthcareGlaxoSmithKline plc UK 35,665.9 9,907.2 NA 3.6x NA
18-Mar Matrixx Initiatives, Inc. Gryphon Investors, Inc. USA NA NA NA NA NA
17-NovPlan B and other Women's
Health Brands
Foundation Consumer
HealthcareUSA 675.0 140.0 NA 4.8x NA
17-SepWellspring Pharmaceutical
CorporationAudax Group, Inc. USA NA NA NA NA NA
17-Feb Anusol & Rectinol (J&J Brands) Church & Dwight Co., Inc. Canada 130.0 24.0 NA 5.4x NA
17-Jan Viactiv Holdings, LLC Adare Pharmaceuticals USA NA NA NA NA NA
17-Jan Cold-Eeze®Mylan (Meda Consumer
Healthcare)USA 50.0 19.1 NA 2.6x NA
16-Jan C.B. Fleet CompanyPrestige Consumer
HealthcareUSA 825.0 205.0 NA 4.0x NA
16-May Nutraceutixx Inc. The Clorox Company USA 107.5 35.7 $8.6 3.0x 12.5x
Notes: Median $402.5 $35.7 NM 4.0x NM
NA - Not Available Mean 4,887.6 1,478.9 NM 4.0x NM
NM - Not Meaningful Min 47.5 19.1 NM 2.6x NM
Max 35,665.9 9,907.2 NM 5.4x NM
Transaction Comps – Consumer Health
Source: CapitalIQ Dec. 31, 2018* Deal announced but not closed
*
Related Documents

![[PBM] - Centro Cirúrgico](https://static.cupdf.com/doc/110x72/55261cdb4a79598a498b4e1f/pbm-centro-cirurgico.jpg)