2016 Year-End Summary Volume 44 - Number 164 Clark County Marketing Bulletin

Welcome message from author
This document is posted to help you gain knowledge. Please leave a comment to let me know what you think about it! Share it to your friends and learn new things together.
Transcript

2016Year-End Summary
Volume 44 - Number 164
Clark CountyMarketing Bulletin

Las Vegas Convention and Visitors Authority3150 Paradise Road Las Vegas, NV 89109-9096
(702) 892-0711
VegasMeansBusiness.com VisitLasVegas.com LVCVA.com
VisitLaughlin.com VisitMesquite.com
As of December 31, 2016
Chair - Commissioner Lawrence Weekly Mr. Gregory LeeVice Chair - Mr. Chuck Bowling Mayor John Lee
Secretary - Mr. Bill Noonan Councilman John MarzTreasurer - Mr. Tom Jenkin Ms. Kristin McMillanCouncilman Ricki Y. Barlow Councilman George Rapson
Ms. Susan Brager Mayor Cam WalkerMayor Carolyn G. Goodman Mr. Maurice Wooden
President/CEO - Rossi T. RalenkotterChief Financial Officer - Rana Lacer
Chief Human Resources Officer - Barbara BolenderChief Communications and Public Affairs Officer - Jacqueline Peterson
Senior Vice President of Marketing - Cathy TullSenior Vice President of Operations - Terry Jicinsky
Senior Vice President of Finance - Ed Finger
As of December 31, 2016
Executive Director - Kevin M. Bagger Director - Scott Russell
Senior Research Analyst - Matthew SeltzerResearch Analyst - Jill ReynoldsResearch Analyst - Gina Zozaya
The staff of the Las Vegas Convention and Visitors Authority takes this opportunity to thank all of the people who have assisted us in compiling our marketing information and conducting our research projects. The LVCVA Research Center staff also welcomes any suggestions and/or editorial contributions.
CLARK COUNTY MARKETING BULLETINYear-End 2016: Volume 44, Number 164
BOARD OF DIRECTORS
SENIOR EXECUTIVE STAFF
RESEARCH CENTER

Las Vegas, Nevada Room Tax RevenueLas Vegas Executive Summary 2 LVCVA Room Tax Revenue Earned 20Visitor Statistics Room Tax Revenue Annual Analysis 20
Las Vegas Visitor Volume 3 Room Tax Earned by Entity 20Visitor Volume By Quarter 3 Room Tax Distribution 21Visitor Volume Historical Review 3 Sales Tax RevenueLas Vegas Visitor Segmentation Analysis 4 Historical Las Vegas Hotel/Motel Room Inventory 22Las Vegas Room Nights Occupied 4 Total Clark County Taxable Sales 22Largest Hotels in the U.S. 4 Taxable Sales - Eating, Drinking & Accommodatio 22Las Vegas Hotel/Motel Room Inventory 4 Other Tourism StatsU.S. Cities Inventory Ranking 4 Visitors to Red Rock Canyon & Valley of Fire 23
Convention Analysis Visitors to Hoover Dam & Lake Mead 23Convention Analysis by Number of Delegates 5 Las Vegas Visitor Profile Highlights 24Las Vegas Trade Shows/Meetings & Conventions 5 Digital MarketingConventions Held & Attendance 5 LasVegas.com 25Historical Citywide Convention Data 6 VegasMeansBusiness.com 25Historical Las Vegas Convention Center Data 6 LVCVA.com 25
Gaming Summary VisitLaughlin.com 25Clark County Gross Gaming Revenue 7 VisitMesquite.com 25Historical Clark County Gross Gaming Revenue 7Las Vegas Monthly Employment Index 8 Laughlin, NevadaCasino Revenue Distribution Analysis 8 Laughlin Executive Summary 26Historical Clark County Employment Analysis 8 Laughlin Visitor Profile Highlights 26Casino Location Analysis 8 Laughlin Visitor Volume 27Las Vegas Gaming Revenue Per Visitor Analysis 9 Historical Laughlin Visitor Volume 27Historical Las Vegas Gaming Rev. Per Visitor Analys 9 Laughlin Occupancy, ADR & RevPAR Summary 27Top 10 U.S. Casino Gaming Revenue 9 Laughlin Weekend Occupancy Rankings 28Las Vegas Strip & Downtown Gaming Revenue Laughlin Room Nights Occupied 28Boulder Strip & Las Vegas MSA Gaming Revenue Laughlin Midweek & Weekend Occupancy 28
Airline Statistics Laughlin Daily Auto Traffic 29McCarran Airport Total En/Deplaned Passengers Laughlin/Bullhead City Airport Passengers 29Airline Passengers as % of Total Visitor Market Laughlin Gross Gaming Revenue 29Average Scheduled Daily Flights Historical Laughlin Gross Gaming Revenue 29Scheduled Airline Average Daily Seat Capacity Historical Laughlin Room Inventory & Occupancy 30Scheduled Airline Average Non-Stop Markets Historical Laughlin Daily Auto Traffic 30Historical McCarran Airport Total PassengersHistorical Airline Passengers as % of Visitor Market Mesquite, Nevada
Transportation Data Mesquite Executive Summary 31Principal Highways - Daily Auto Traffic to Las Vega Mesquite Visitor Profile Highlights 31Las Vegas Daily Auto Traffic Mesquite Visitor Volume 32Number of Taxicab Trips in Clark County Mesquite Room Nights Occupied 32Historical Daily Auto Traffic - All 5 Directions Mesquite Daily Auto Traffic 32Historical Daily Auto Traffic - I-15 at NV/CA border Mesquite Gaming Revenue 32
Hotel/Motel Occupancy Mesquite Weekend Occupancy Rankings 33Occupancy, ADR & RevPAR Summary Mesquite Occupancy, ADR & RevPAR Summary 33Weekend vs. Midweek Occupancy Summary Historical Mesquite Visitor Volume 34Las Vegas Occupancy vs. U.S. National Average Historical Mesquite Daily Auto Traffic 34Citywide Weekend Occupancy Rankings Historical Mesquite Room Inventory & Occupancy 34Historical Hotel & Motel Occupancy Historical Mesquite Gross Gaming Revenue 34Historical Weekend & Midweek Occupancy
National Economic & Travel Indicators LVCVA Publications 35Unemployment Rate Other Information Sources 36U.S. Consumer Price IndexTravel Price IndexConsumer Confidence Index
TABLE OF CONTENTS
18
13
1717
1212
1313
19
1010
111111
14
18
14
1516
1111
191919

Tourism Indicator ChangeVisitor Volume
Room Inventory(as of December 31)
ConventionsAttendanceNumber Held
Occupancy LevelsCitywideHotelMotelWeekendMidweekStripDowntown
Average Daily Room Rate rStrip rDowntown
Revenue Per Available Room rStrip rDowntown
Total Room Nights OccupiedTotal
Gross Gaming RevenueClark County rStrip rDowntown rBoulder Strip
Enplaned/Deplaned Airline Passengers Total
Automobile TrafficAverage Daily TrafficAll Major Highways r I-15 at CA/NV Border
Room Tax/LVCVA's Portion:
r = Revised
0.5
$130.08$61.29
$135.87$65.53
4.5%6.9%
2015 2016
93.7%
149,339149,213
5,891,151
1.5%42,936,109
21,306
1.0
6,310,61621,864
89.8% 90.8%
42,312,216
0.1%
1.3
4.4%
4.7
$120.67
89.1% 1.487.7%
$125.96
68.3% 73.0%95.0%
89.4% 90.5% 1.182.3% 82.8%
2.0%45,32944,419
SOURCES: Las Vegas Convention and Visitors Authority, McCarran International Airport, Nevada Department of Transportation (NDOT), and Nevada Gaming Control Board
$254,438,208 7.3%$273,079,478
47,435,640
1.0%0.4%
45,389,074
7.1%
$788,077,000$784,351,000
47,896,317
$9,712,796,000
48,485,632
86.5%1.3
2.6%
LAS VEGAS EXECUTIVE SUMMARY
2
$541,751,000
$9,617,671,000
LAS VEGAS VISITOR STATISTICS
0.5%
109,206 115,229
$6,376,042,000$6,347,845,000$564,637,000
85.2%
5.5%
4.5%
1.2%
4.2%
$50.37 $54.22 7.6%
$105.84 $112.28 6.1%$116.19 $123.01 5.9%
ChangeFirst QuarterSecond QuarterThird QuarterFourth QuarterAnnual Total
PercentMonth ChangeJanFebMar Room Apr Year Inventory Hotel MotelMay 1979Jun 1980Jul 1981Aug 1982Sep 1983Oct 1984Nov 1985Dec 1986Total 1987
19881989
Visitor Volume 1990Millions 1991
1992199319941995199619971998
SOURCE: Las Vegas Convention and Visitors Authority
SOURCE: Las Vegas Convention and Visitors Authority
10,466,97942,936,109
2015 42,312,216 149,213 89.8% 68.3%
2001
20132014
2009201020112012
2002
2004
65.0%
2005200620072008
93.2%64.5%
59.8%41,126,512 150,544 89.1%
39,727,02239,668,221
38,928,708
2015 2016
150,593 87.1%150,481 87.4%150,161
58.0%
83.5%
60.5%
88.9%
94.0%
126,787
148,935
68.7%
126,610
2015 2016
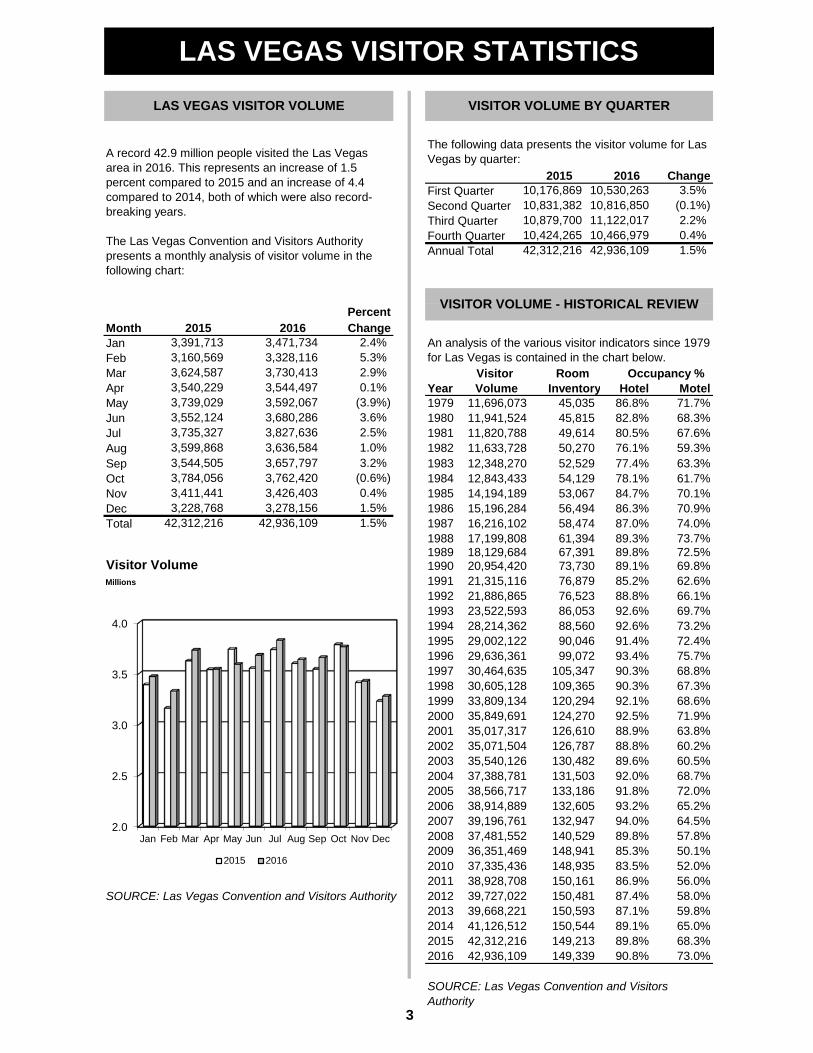
A record 42.9 million people visited the Las Vegas area in 2016. This represents an increase of 1.5 percent compared to 2015 and an increase of 4.4 compared to 2014, both of which were also record-breaking years.
The Las Vegas Convention and Visitors Authority presents a monthly analysis of visitor volume in the following chart:
The following data presents the visitor volume for Las Vegas by quarter:
10,176,86910,831,38210,879,700
42,312,216
10,530,26310,816,850
1.5%
3.5%(0.1%)2.2%0.4%
11,122,017
68.3%
3,657,797
11,941,52411,820,78811,633,728
63.3%61.7%
67.3%
72.4%
68.8%
73.7%74.0%70.9%
90.3%75.7%
89.1%62.6%66.1%
90.3%
61,39458,474
89.3%17,199,80889.8%
LAS VEGAS VISITOR VOLUME VISITOR VOLUME BY QUARTER
70.1%
42,936,10942,312,216
Volume
3.2%
An analysis of the various visitor indicators since 1979 for Las Vegas is contained in the chart below.
49,614
52,52954,129
45,815
77.4%
67.6%59.3%
53,067
50,270
VISITOR VOLUME - HISTORICAL REVIEW
10,424,265
82.8%80.5%76.1%
78.1%
16,216,10256,494
12,348,270
15,196,284
12,843,43314,194,189 84.7%
86.3%87.0%
37,335,436
76,87921,315,11676,523 88.8%
85.2%
89.6%
89.8%
38,566,717
85.3%
29,636,361
133,186
99,072
38,914,889
33,809,134
35,540,12635,071,50435,017,317
131,503
69.7%28,214,36229,002,122
73.2%86,05388,560
92.6%92.6%
90,046
23,522,593
68.6%
92.0%
88.8%
71.9%63.8%60.2%
91.4%93.4%
92.1%92.5%
3,544,505
72.5%69.8%
18,129,68420,954,420
67,391
120,294
86.9%52.0%56.0%
72.0%
57.8%
65.2%
50.1%
124,270
91.8%
36,351,469
39,196,76137,481,552
73,730
148,941
132,605132,947140,529
2003
3,228,768
3,762,4203,426,403
19992000
1.5%
(0.6%)3,784,0560.4%
3,278,156 1.5%3,411,441
2.4%
3,544,497 0.1%
5.3%
3,540,229
3,391,7133,160,5693,624,587
3,471,7343,328,116
3,739,029 (3.9%)
3,599,868
3,552,1243,735,327
3.6%
1.0%2.5%
3,680,2863,827,6363,636,584
2016 42,936,109 149,339 90.8% 73.0%
3
LAS VEGAS VISITOR STATISTICS
3,730,413 Visitor Occupancy %
45,035 86.8% 71.7%3,592,067
2.9%
11,696,073
37,388,781130,482
30,464,63530,605,128
105,347109,365
35,849,691
21,886,865
2.0
2.5
3.0
3.5
4.0
Jan Feb Mar Apr May Jun Jul Aug Sep Oct Nov Dec
2015 2016

As of December 31, 2016Convention Leisure Total Number of
Month Delegates Visitors Visitors Rank Property RoomsJan 1 First World HotelFeb 2 * MGM Grand Hotel and CasinoMar 3 * Luxor Hotel and CasinoApr 4 * The Venetian Resort Hotel CasinoMay 5 Ambassador City JomtienJun 6 * ARIA Resort & CasinoJul 7 Sheraton Hotel Macao Cotai CentralAug 8 * Excalibur Hotel and CasinoSep 9 * BellagioOct 10 * Caesars PalaceNov 11 * Circus Circus Hotel, Casino & Theme ParkDec 12 Shinagawa Prince HotelTotal 13 * Flamingo Las Vegas
14 * Mandalay Bay Resort & Casino15 * The Palazzo Resort - Hotel - Casino16 * The Mirage Hotel & Casino17 * The Cosmopolitan of Las Vegas18 The Venetian Macau
Percent 19 * Monte Carlo Resort and CasinoMonth Change 20 * Westgate Las Vegas Resort & CasinoJanFeb * = Las Vegas propertyMarAprMayJun As of December 31, 2016Jul Number of Total Number PercentAug Properties Of Rooms Of TotalSep HotelsOct MotelsNov TotalDecTotal
Rank City Rooms1 Las Vegas2 Orlando3 Chicago4 New York City5 Los Angeles6 Atlanta7 Houston (2015)
8 Dallas9 Phoenix10 San Diego
48,485,63247,896,317
117,371
149,339(0.7%)
3,811,1842015 2016
3,900,575
4,055,9504,227,074
SOURCE: Las Vegas Convention and Visitors Authority
3,565,960 3,751,591
90.8%
3,861,093
1.2%3,627,336 3,663,136
60,530
94,571
77,50278,228
SOURCE: Las Vegas Convention and Visitors Authority and Individual City CVBs
2016 U.S. CITIES INVENTORY RANKING
163119
135,557
100%9.2%
149,213
282
106,555111,486
13,782
98,135
62,572
4,001
3,7673,792
2,950
2.5%
3.0%0.9%
(0.7%)
5.2%
(4.0%)
3,460
3,933
3,0663,044
3,211
3,981
LAS VEGAS HOTEL/MOTEL ROOM INVENTORY
3,0413,0002,992
2.3%
LAS VEGAS VISITOR STATISTICS
5,0444,4004,027
767,726 2,704,008 3,471,7342,720,329 3,328,116
2016 LAS VEGAS VISITORSEGMENTATION ANALYSIS
575,981 2,968,516 3,544,497
LARGEST HOTELS IN THE WORLD
351,791 3,475,845
668,716 3,061,697 3,730,413
3,680,286466,350 3,213,936
607,787
3,827,636
428,031 3,164,036 3,592,067
554,319
36,625,493 42,936,109
LAS VEGAS ROOM NIGHTS OCCUPIED
2,905,999248,984 3,029,172 3,278,156520,404
3,256,817505,6033,426,4033,762,420
614,924 3,042,873 3,657,7973,082,265 3,636,584
6,310,616
4,0044,013
7,351
3,680
4
4,000,5704,028,5244,125,637
4,228,4464,078,1544,015,911
4,115,1024,137,860
2.4%3.3%
4,230,124
4,290,331
1.0%
4,177,8184,329,869
0.2%4,261,944
3,852,864
4,044,896
Size of Convention Percent Month 2016 Changeby Delegates of Total JanOver 15,000 Feb7,500-14,999 Mar2,500-7,499 Apr500-2,499 MayUnder 500 JunTotal Jul
AugSepOctNovDecTotal
Month 2015 2016 ChangeJan Convention AttendanceFeb Thousands
MarAprMayJunJulAugSepOctNovDecTotal
CONVENTIONS HELD
8.4%2,6521,970
2,5912,029
(2.3%)3.0%
(0.8%)(24.0%)
(1.4%)1,414 1,5981,838
1,8661,722
1,53521,306
1,2692.6%
(17.3%)21,864
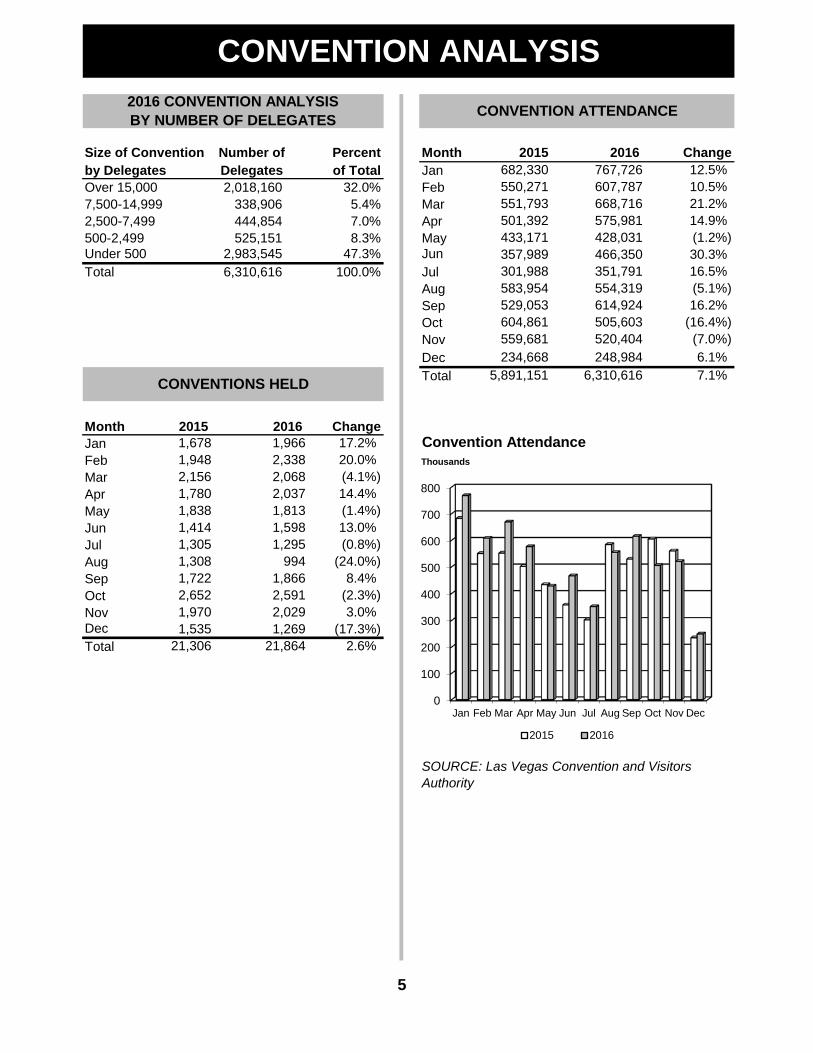
SOURCE: Las Vegas Convention and Visitors Authority
5
17.2%1,948 2,338 20.0%1,678 1,966
(4.1%)1,780 2,037 14.4%
1,308 994
13.0%1,305 1,295
2,156 2,068
1,813
5,891,151
529,053583,954
604,861559,681
16.5%
607,787668,716 21.2%
14.9%
30.3%(1.2%)
466,350351,791
428,031575,981
10.5%
6,310,616 7.1%
554,319614,924
(5.1%)16.2%
(16.4%)(7.0%)6.1%248,984
505,603520,404
CONVENTION ANALYSIS
Number of Delegates
2016 CONVENTION ANALYSIS BY NUMBER OF DELEGATES
32.0%2,018,160
CONVENTION ATTENDANCE
12.5%682,330550,271
767,7262015
5.4%7.0%
338,906444,854
234,668
501,392551,793
525,1512,983,545
100.0%6,310,616
8.3%47.3%
433,171357,989301,988
0
100
200
300
400
500
600
700
800
Jan Feb Mar Apr May Jun Jul Aug Sep Oct Nov Dec
2015 2016

Number Numberof Shows Year of Shows
**
r
rr
r = RevisedSOURCE: Las Vegas Convention and Visitors Authority
1,206,914
4,473,1344,865,272
20155,891,151 49 1,301,381
6652
2013 50 1,176,072
6
5,107,416
1,160,0131,289,383
53 1,363,783
2014 46 1,320,817
5,724,864
19,394
22,154
200720085,899,725
4,492,275
2015 21,306
*2002-2016 convention counts are based on an updated methodology that reflects significant growth in the small meetings market in Las Vegas. 2001 convention counts were REVISED retroactively using this new methodology.
20102011
2013 22,02721,615
2008
2016 21,864 6,310,616 2016
2014 22,111 5,169,054
1,121,022
1,701,0521,553,0341,613,712
18,00419,029
2005
1,267,482
49
85
3941
64
1,295,2621,255,2811,177,072
1,140,736
1,184,9571,307,711
576,288
722,358
744,968687,127
1,477,2661,632,631
1,057,500
34
273,173
473747
117,057
819,259
1,229,424
996,675
680,027649,619
54
305,657388,375
574,279
1,044,580
454,069487,445596,184
6368
6770
2004
556
1,0111,6552,199
681711
1998
2,684,171
3,772,7263,853,363
1,742,194
1,969,4352,439,734
3,8473,722
2,826
3938
19941995
50
385
20,34623,03124,46322,286
1,072,6291,519,4211,677,716
3,301,705
564
305339393
3,7493,999
2,443
290,794357,248
2,924,8793,305,5073,519,424
1,794,444
311,908
5,105,450
198919901991199219931994
198319841985198619871988
198019811982
1970197119721973197419751976197719781979
HISTORICAL CITYWIDECONVENTION DATA
1971
1969 2781968 266Year Attendance
206,709
1970296320
218,918269,129312,347
HISTORICAL LAS VEGAS CONVENTION CENTER DATA
1968 14 98,290Attendance
86,423134,790172,585
20022003
199519961997
2004
2012
1998199920002001
2009
200520062007
5,657,796
25
1723
3738
1975
19791980
19761977
1983
607,318637,862656,024
199119921993
19871988
2003
719,988
943,6111,050,916
109,787
1969
197219731974
2727
4351
183,659217,551
35
157,284131,052
341,6933640
325352
37417,090
2,662
480
421356449515518453499
2002
565644
43
1996
349,787367,322
1982
1978
809,7791981
1985
1989
1984
1986
5,014,240
1990
1997
199920002001
CONVENTION ANALYSIS
504,944,014
201020112012
718076
63
6,307,9616,209,253
2009
20066,166,194
44
1,702,1581,508,842
3,827
23,82523,84722,454
5066
Clark County PercentYear Gross Gaming Revenue Change
--19.2%23.5%16.4%
Month 2016 12.5%Jan r 9.8%Feb r 20.0%Mar r 21.7%Apr r 15.2%May r 13.6%Jun 3.6%Jul r 4.5%Aug 7.8%Sep r 6.4%Oct r 12.4%Nov r 7.7%Dec r 14.7%Total r 12.5%
9.4%r = Revised 19.6%
1.2%5.5%
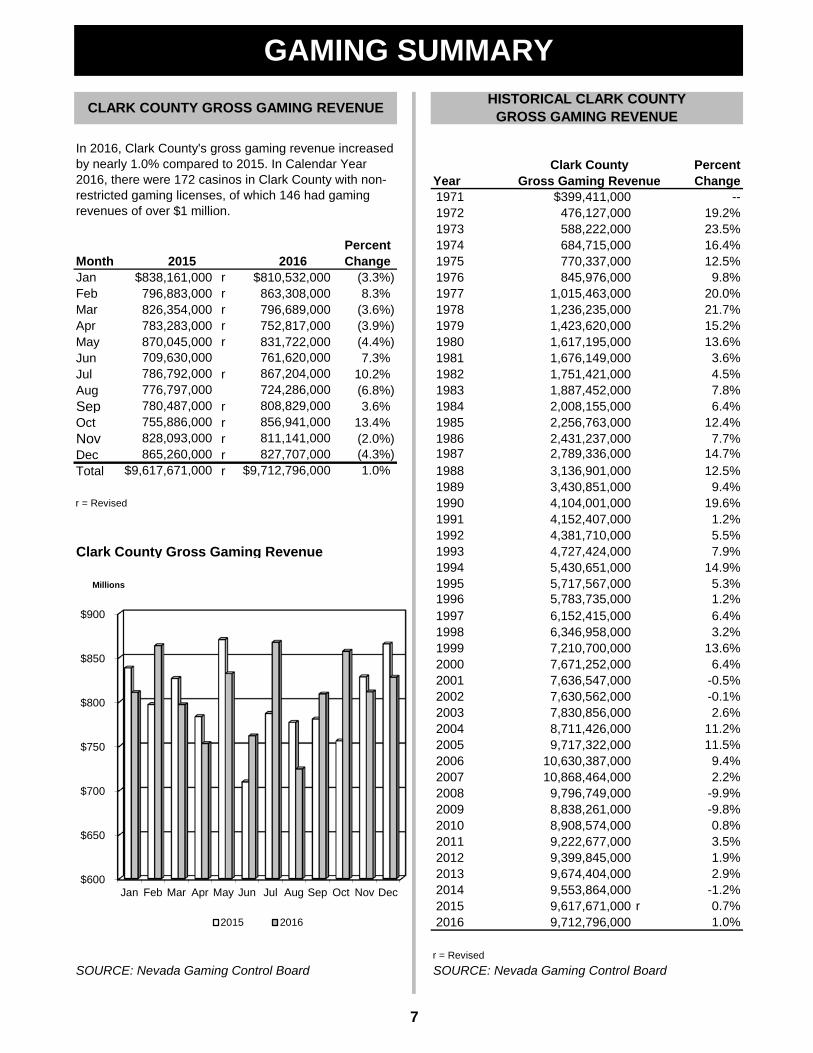
Clark County Gross Gaming Revenue 7.9%14.9%
Millions 5.3%1.2%6.4%3.2%
13.6%6.4%
-0.5%-0.1%2.6%
11.2%11.5%
9.4%2.2%
-9.9%-9.8%
0.8%3.5%1.9%2.9%
-1.2%r 0.7%
1.0%
r = RevisedSOURCE: Nevada Gaming Control Board SOURCE: Nevada Gaming Control Board
10.2%786,792,000776,797,000
709,630,000
808,829,000
$9,617,671,000865,260,000
856,941,000
827,707,000
780,487,000
828,093,000755,886,000
867,204,000761,620,000
724,286,000
811,141,000
3.6%
(4.3%)(2.0%)13.4%
HISTORICAL CLARK COUNTY GROSS GAMING REVENUE
$810,532,000 845,976,000
476,127,000588,222,000684,715,000770,337,000
CLARK COUNTY GROSS GAMING REVENUE
$838,161,000
PercentChange
19721973
1971 $399,411,000
19741975
(3.3%) 1976
In 2016, Clark County's gross gaming revenue increased by nearly 1.0% compared to 2015. In Calendar Year 2016, there were 172 casinos in Clark County with non-restricted gaming licenses, of which 146 had gaming revenues of over $1 million.
1,236,235,000752,817,000831,722,000
783,283,000870,045,000
863,308,000
1,423,620,0001,617,195,0001,676,149,000
19771978
796,883,000826,354,000
1979
7.3%198219811980
1,751,421,000
9,712,796,000
19911990 4,104,001,000
3,430,851,0003,136,901,000
1989
2007
2014 9,553,864,0009,617,671,0002015
4,381,710,0004,727,424,000
2006
1997
1985
19831984
1995
GAMING SUMMARY
10,868,464,0002008 9,796,749,0002009
2015
$9,712,796,000 1.0% 1988
5,717,567,000
8,711,426,000
7,630,562,0007,830,856,000
6,152,415,0006,346,958,000
10,630,387,000
1,015,463,000796,689,000
(3.9%)
8.3%
(4.4%)
(3.6%)
1998
(6.8%)
7
7,210,700,000
2013 9,674,404,000
7,671,252,0007,636,547,000
1999
2004
2000200120022003
2005
2012
2016
8,838,261,000
9,717,322,000
9,399,845,0002011 9,222,677,0002010 8,908,574,000
5,783,735,000
5,430,651,000
2,431,237,000
4,152,407,000
2,008,155,0002,256,763,000
1,887,452,000
19921993
19871986
2,789,336,000
1994
1996
$600
$650
$700
$750
$800
$850
$900
Jan Feb Mar Apr May Jun Jul Aug Sep Oct Nov Dec
2015 2016
Total EmployeesHospitality % of % of Hospitality Clark County To Rooms
Month Employment City State Year Employment Hotel/Motel Rooms RatioJan rFeb rMar rApr rMay rJun rJul rAug rSep rOct rNov Dec
Strip Downtown Boulder LaughlinLocations 46 15 30 10 LocationDepartmental Revenues: Clark County:Gaming Las Vegas StripRooms Downtown LVFood Boulder StripBeverage LaughlinOther TotalTotal Statewide Total
SOURCE: State of Nevada Gaming Control Board
62.7%
Illustrated below is the departmental revenue distribution for the Las Vegas Strip, Downtown Las Vegas, the Boulder Strip and Laughlin Casinos during fiscal year 2016. The chart represents casinos earning $1 million and over in gaming revenue. Please note that figures may not always total 100% due to rounding.
21.7%
SOURCE: State of Nevada - Department of Employment Training & Rehabilitation
201321.7%21.6%29.7%
267,392
Las Vegas
286,500
CASINO REVENUE DISTRIBUTION ANALYSIS
Casinos Earning $1 Million and Over in Gross Gaming Revenues (Calendar Year 2016)
29.7%2015 282,4672016 286,142
11.2%
30.6%
2007
49.3%
22.3%
Number of Casinos with Gross Gaming Revenue of $1 Million and Over (Fiscal Year)
69.9%
29.7%
The above chart indicates that, on average, 1.8 people were directly employed in the leisure and hospitality fields for each available hotel/motel room in Clark County on December 31, 2016. Total hotel/gaming employment figures now represent all leisure and hospitality employees.
43
146,372 1.92008 269,450 153,165 1.8
251,264 161,383 1.62010 253,425 161,052 1.6
2012
LAS VEGAS LEISURE AND HOSPITALITY MONTHLY EMPLOYMENT INDEX
22.1%
HISTORICAL CLARK COUNTY LEISURE AND HOSPITALITY EMPLOYMENT
271,750
22.3%
22.0%
22.4%
30.2%
The table below provides the annual ratios of employment per hotel/motel room for Clark County for the last decade. Clark County includes the Las Vegas, Laughlin and Mesquite areas.
21.8% 262,325
162,662
1.8
289,700
288,600
289,300289,300
30.6%22.2%
30.1%30.3%30.4%
161,164
13.6%19.2%14.5%
7.3%14.3%
28.1%16.0%
273
34.2%
100.0%7.4%
100.0%6.3%
100.0%
9.6% 4.3%
100.0%
7.2%4.2%
6.2%14.5%
311631
GAMING SUMMARY
The following chart contains the monthly employment statistics for the Las Vegas Metropolitan Statistical Area (MSA) in the Leisure and Hospitality industry in 2016. Please note that the Las Vegas MSA encompasses Clark County, Nevada.
SOURCE: State of Nevada Gaming Control Board
2015 2015
4516
146,605 1.8
2013
278,400280,500283,400287,500
29.8%30.0%
30.5%
289,700
21.9%22.0%
285,300285,500
2009
273,100
20052006
2014
CASINO LOCATION ANALYSIS
146,948
1010999100270
100265
3013
46
101271
101263
99
2011 259,600 162,258 1.62012 261,700 162,559 1.6
SOURCE: State of Nevada - Department of Employment Training & Rehabilitation; Las Vegas Convention and Visitors Authority
1.8
8
1.62014 278,325 162,548 1.7
160,946 1.8
44
303116 15
47

MonthJan Feb Those WhoMar Year All Visitors GambledAprMayJunJul AugSep OctNovDecTotal
SOURCE: Las Vegas Convention and Visitors Authority, Las Vegas Visitor Profile Study, and NV Gaming Control Board
2015 Gaming 2016 Gaming % of Total U.S. U.S. Casino Gaming Win by StateState Revenue (win) Revenue (win) Gaming WinNVLAPA rIL NJINMS rNYMO rIAOtherTotalr = RevisedSOURCE: Individual State's Gaming Commissions Note: Does not include Indian Casino Gaming
CAUTION: This analysis does not address local residents who may be contributing to the gaming revenues at these casinos.
220
207233
211
(0.5%)200
189 256
199
215 201
258 250
216 2010221
232
2016 226 349
310 189 189
280 2007
282 188
243186
(0.5%)
323 196
372 227
2013305
2015
2015 2016 Change
(4.0%)
$233
Percent
2.9%(6.3%)228
$247252
221
(5.5%)259214
GAMING SUMMARY
7.5%8.1%
29.2%
228
$11,257,147,000
CAUTION: This analysis does not address local residents who may be contributing to the gaming revenues at these casinos.
2372014
$227252
(2.5%)(5.7%)
2,904,984,000
$226
HISTORICAL LAS VEGAS GAMING REVENUE
The following table analyzes gaming revenues by visitor. "Visitors Who Gambled" is derived from the Las Vegas Visitor Profile Study and excludes visitors under the age of 21, as well as visitors who indicate that they did not gamble while in Las Vegas.
LAS VEGAS GAMING REVENUE PER VISITOR ANALYSIS
Revenue Per Visitor Among:
268
$11,114,081,0003,242,009,000
14.0%
The analysis below divides the monthly gross gaming revenue for the Las Vegas core areas encompassing the Strip, Downtown and Boulder Strip casinos by the monthly visitor volume.
100.0%
4.4%
6,806,377,000$38,591,965,131
1,701,896,000
6,906,939,000
200
2,352,429,0002,234,063,0002,215,595,000 2,216,004,000
1,714,976,0001,424,352,000 1,446,164,000
$38,016,258,000
9
5.7%5.9%
5.7%2,212,246,0002,017,692,131
2,097,066,000
17.9%
6.5%
5.2%
2,522,570,0002,279,819,000
$272$2122006
Gam
ing
Rev
enue
Per
Vis
itor
2012
3.7%
212
7.6%2273.6%
0.4%(7.7%)
20082009
2011
1,950,964,000
2,877,426,0003,113,424,000
TOP 10 U.S. CASINO GAMING REVENUE
100
150
200
250
300
350
400
2006 2007 2008 2009 2010 2011 2012 2013 2014 2015 2016All Visitors Those Who Gambled
NV
LA
PAILNJ
INMS
NY
MOIA
Other

Percent Percent2015 2016 Change 2015 2016 Change
Jan JanFeb FebMar MarApr AprMay May Jun JunJul Jul Aug AugSep Sep Oct OctNov NovDec DecTotal r Total r
Percent Percent2015 2016 Change 2015 2016 Change
Jan JanFeb FebMar MarApr AprMay MayJun JunJul Jul Aug AugSep Sep Oct OctNov NovDec DecTotal Total r
r = Revised
66,313,000 783,283,00081,259,000
29.5%(5.3%)
44,635,00053,647,000
57,818,000
(3.6%)
$564,637,000
$810,532,000
4.2%0.4%
826,354,000
$6,347,845,000
64,278,000 70,962,000 10.4%
$6,376,042,000
752,817,000
8.3%863,308,000796,883,000796,689,000
498,866,000 49,592,000(11.7%)
40,800,000527,383,000
44,574,000
8.8%
(4.2%)
524,970,000445,511,000 42,117,000
51,312,000
7.0%
$532,276,000
486,822,000 53,558,000
$576,811,000
41,833,000
42,905,000 (13.5%)13.1%0.6%2.5%
50,420,000
DOWNTOWN GROSS GAMING REVENUE
570,253,000 7.3% 50,611,000$38,644,00043,245,000
LAS VEGAS STRIP GROSS GAMING REVENUE
531,382,000(4.0%)
(7.7%)
506,868,000
$42,058,00017.0%
531,004,000488,920,000
600,751,000 590,707,000
601,198,000
504,864,000493,626,000 562,747,000
9.7%16.8%
535,615,000 516,992,000
542,541,000 7.5% 47,514,000
(1.7%)
$58,721,000 $68,171,000
BOULDER STRIP GROSS GAMING REVENUE
$541,751,000
16.1%
42,354,000613,019,000449,561,000 (14.8%) 39,979,000 42,785,000
CLARK COUNTY GROSS GAMING REVENUE
(3.3%)
14.0%(3.5%)
49,247,000 3.6%
50,785,000
$838,161,000
43,446,000 42,509,000 (2.2%)
10
(4.3%)
56,477,000 780,487,000(21.8%)60,247,000 73,640,000 22.2%72,235,000
(6.8%)
54,322,000 23.7%3.2%70,503,000
808,829,000 3.6%
SOURCE: Gaming Control Board - Monthly Gaming Revenue Report
1.0%$784,351,000 $788,077,000 $9,617,671,000 $9,712,796,000865,260,000
GAMING SUMMARY
64,939,000
67,178,00072,791,00047,470,000
(8.2%)
(18.9%)25.9%
60,631,000
(26.9%)
75,186,000
(0.1%)
(7.5%)53,767,000
7.3%709,630,000(4.4%)
10.2%
831,722,000761,620,000867,204,000
(3.9%)
491,200,000 (1.5%)
55,666,000724,286,000776,797,000
13.4%(2.0%)
SOURCE: Gaming Control Board - Monthly Gaming Revenue Report
0.5%
870,045,00061,612,000 77,550,000
786,792,000
856,941,000811,141,000827,707,000
755,886,000828,093,000
69,291,000 69,219,000

PercentMonth 2015 ChangeJanFebMar
Percent AprMonth 2015 2016 Change MayJan JunFeb Jul Mar AugApr SepMay OctJun NovJul DecAug AverageSepOctNovDec PercentTotal Month 2015 Change
JanFeb
SOURCE: Las Vegas McCarran International Airport MarAprMayJunJul
% of Net Chg Aug 2016 Visitors Utilizing From Sep
Month Visitors Air Transportation 2015 OctJan NovFeb DecMar AverageAprMayJunJul PercentAug Month ChangeSep JanOct FebNov MarDec AprTotal May
JunJul AugSepOctNovDecAverage
4,104,971 4,277,985 4.2%3,779,105
76,35673,724
75,237
78,805
SCHEDULED AIRLINESAVERAGE NONSTOP MARKETS
73,520
3,730,413
(0.5)2.245.5%1.5
42.3%
4.5%
(1.5)38.7%
3.4%1.0%
38.9%0.0
3,865,1103,707,438
47,435,640
AIRLINE PASSENGERS AS PERCENTAGE OF TOTAL VISITOR MARKET FOR LAS
(0.4)
SOURCES: Las Vegas McCarran International Airport; Las Vegas Convention and Visitors
42,936,109 42.4% 0.5
(0.7)0.83,762,420
43.5% 2.63,278,156 43.7% 1.63,426,403
44.6%42.2%3,657,797
477
463465
5.7%
3,309,9993,162,9453,863,154
4,098,0842.6%
4,007,0064,064,096 4,168,391
3,785,075
7.3%8.9%5.5%
459
473
3,911,813 4,133,764 459
73,926
201666,628 6.8%
468
3,636,584
3,680,2863,592,0673,544,497
2.3%
3,471,734
1.541.5% 0.5
3,328,116
41.4%
3,739,7553,669,005
45,389,074
43.7%
42.7%3,827,636
4,053,362 7.3%
LAS VEGAS McCARRAN AIRPORT TOTAL ENPLANED/DEPLANED PASSENGERS
McCarran International Airport experienced a 4.5% increase in total passenger traffic during 2016. An analysis of the monthly data follows:
474479480
488
2016
4804.6%
4703.4%3.9%
480
472
472
456
2.8%
3,992,1503,912,1164,149,513 4.1%
3,551,6973,443,9234,074,257
1.3%
74,034
67,183
3.8%
0.0%3.3%
2.1%
72,583
468462
474
6.2%
465
492485
469
SCHEDULED AIRLINES AVERAGE DAILY SEAT CAPACITY
74,58672,766
2015 2016132 140 6.1%
4.6%
4.9%5.7%
2.6%71,90370,359
3.8%72,111 74,838
76,356
72,202
132135
(0.6%)
11
135
130
135136135
(4.3%)(2.9%)
141140
134 (0.7%)(1.5%)
SOURCE: Las Vegas McCarran International Airport
137137
136
(3.0%)(5.1%)
131
2.2%
130
138138139133
(5.1%)130
134130
134135
(0.7%)
3.0%
AIRLINE STATISTICS
3.6%
6.0%71,21174,58676,208
4.4%5.0%4.1%5.1%
71,419
76,400
432
3.9%
71,146
5.6%8.8%2.4%3.0%
434
77,04477,694
1.5%
AVERAGE SCHEDULED DAILY FLIGHTS (INBOUND ONLY)

Enplaned/DeplanedYear Year
2016 47,435,640 4.5% 2016 42,936,109 19,578,866 45.6%
Total
VolumeVisitorTotal
TotalPercent of
Air as
15,629,80714,904,102
13,925,333
39,196,76137,481,55236,351,469
35,017,31735,071,50435,540,12637,388,78138,566,71738,914,889
18,129,68420,954,42021,315,11621,886,86523,522,593
16,963,43816,819,326
39,727,02239,668,221
29,636,36130,464,635
17,232,009
VistorsAir
15,586,01117,100,30316,142,98315,606,81916,099,67717,460,56118,049,22417,745,18916,854,607
8,737,9939,037,6099,258,144
10,373,46412,498,96212,818,93814,047,63513,952,803
2,694,963
41,126,512
2,972,0103,248,7573,839,3563,983,8494,560,6695,286,6255,146,7974,740,1364,723,2945,161,5775,073,1565,464,7636,215,2807,329,6787,516,3167,668,856
30,605,12833,809,13435,849,691
16,352,92116,778,273
28,214,36229,002,122
11,941,52411,820,78811,633,72812,348,27012,843,43314,194,18915,196,28416,216,10217,199,808
8,474,7278,664,7519,151,4279,769,354
10,137,02111,178,11111,696,073
41.7%
41.7%42.4%42.3%44.1%44.3%44.2%47.4%45.8%45.5%
40.1%40.6%41.8%39.5%38.5%40.9%
31.8%34.3%35.5%39.3%39.3%40.8%45.2%43.1%
41.0%
46.1%47.7%46.1%44.5%45.3%46.7%46.8%45.6%43.0%
SOURCE: Las Vegas Convention and Visitors Authority
HISTORICAL LAS VEGAS McCARRAN INTERNATIONAL AIRPORT
TOTAL PASSENGERS
HISTORICAL AIRLINE PASSENGERS AS PERCENTAGE OF
TOTAL VISITOR MARKET FOR LAS VEGAS
SOURCE: Las Vegas McCarran International Airport; Las Vegas Convention and Visitors
39,757,3592010
2013 41,857,059 0.5%
2009 (8.2%)40,469,012
2012
2008
41,667,596 0.4%
(1.8%)
(0.5%)3.6%
35,009,01136,265,932
45.2%43.7%42.3%
35,179,960
2007 47,729,52744,074,642
14.3%6.8%4.4%3.3%
(7.7%)
46,193,329
4.2%5.4%
11.6%5.7%
9.4%
(1.7%)7.7%
13.8%25.4%
(2.6%)
15,582,302
5,944,4336,500,806
10,312,842
18.2%3.6%
14.4%16.1%
7,685,8177,964,687
12
26,850,486
20,912,58522,492,156
19,089,684
36,865,866
30,459,96530,315,09430,227,28733,715,129
20,171,557
28,027,2398.7%
(0.5%)(0.3%)11.5%
9.3%
3.7%7.6%
19.4%4.4%
41,441,53144,267,370
(4.6%)
AIRLINE STATISTICS
2011 41,481,204 4.3%
31.6%10.1%
10,141,80910,924,047
5,397,017
PercentChange
16,231,19917,106,948
9,438,648(8.1%)(0.3%)9.3%
9,469,727
Total
Passengers
9,110,84210,574,12710,302,106
12,428,748
1973197419751976197719781979198019811982198319841985198619871988198919901991199219931994199519961997199819992000200120022003200420052006
19731974197519761977197819791980198119821983198419851986198719881989199019911992199319941995199619971998199920002001200220032004200520062007
2015 45,389,074 5.8% 2015 42,312,216 18,236,565 43.1%
20082009201020112012201320142014 42,885,350 2.5%
43.8%43.1%42.7%42.4%41.9%
37,335,43638,928,708

2016JanFebMarAprMayJunJulAugSepOctNovDecAverage SOURCE: State of Nevada Department of Transportation - Traffic Section
Total (All Five Directions)
Average Daily Flow Percent PercentMonth Change Month ChangeJan e JanFeb FebMar MarApr AprMay MayJun JunJul Jul Aug AugSep e SepOct r OctNov r NovDec DecAverage r Total
r = RevisedSOURCE: Nevada Taxicab Authority
41,387
13,467
31,092
7.5%45,172
5.2%4.7%
48,23443,788
42,031
3.5%
(7.1%)
50,55554,577
(1.1%)2.2%
6.5%
6,86815,400 4.0%14,658 3.8%
8.1%
40,21939,21847,339
6.7%(1.5%)9.8%
22,97624,17530,330
Vehicles % Chg Vehicles % Chg Vehicles % Chg VehiclesTotal
Boulder City
Y-o-Y Total Y-o-YTotal Y-o-Y Total Y-o-Y Total Y-o-Y% Chg% Chg Vehicles
LAS VEGAS DAILY AUTO TRAFFIC PRINCIPAL HIGHWAYS - AUTO TRAFFIC LEADING TO LAS VEGAS (TWO-WAY TRAFFIC)
I-15 South I-15 North U.S. 95 North U.S. 95 South U.S. 93 SouthSouthern CA Salt Lake City Tonopah/Reno Searchlight/Laughlin
19,385 2.7%20,348 9.4%20,442 8.0%
19,537 9.1%20,110 9.9%
19,276 6.2%19,597 9.0%
22,011 6.1%
6,567 3.1%7,072 5.9%
6,850 9.2%7,080 8.1%
19,186
10.3%6,596 8.1%
7,384 (2.1%)7,188 9.5%7,114 5.7%
5.8%7,180
10.8%
LAS VEGAS DAILY AUTO TRAFFIC NUMBER OF TAXICAB TRIPSIN NEVADA
6,7187,062
8.6%0.5%
18,38917,547
24.6%2.8%
44,90445,329
46,518
28,83826,301
5.5%0.7%
5.5%
4.2%19,837 8.5%
14,874 10.9%14,1548.7%
6.4%
11.6%10.4%4.4%
11.9%
14,22313,092
12.5%
31,43333,273 5.6%
15,014
13,09113,990
5.7%
29,605 21.4%30,354
8,253 6.1%
2.2%2.8%2.0%
7.8%
28,648
12.6%
111,832
132,0601,900,672 (22.1%)
11.2%
5.0%
28,363 1.1%29,504
2.0%
15,019 4.6%
13,043 7.4%13,981 7.9%
2,115,445 (14.9%)10.0%
107,848
116,193
115,447
105,415104,711 112,118
109,685
102,525
106,8253.7%
(13.5%)
1,602,775 (19.2%)
2,284,198 1,977,0694.1% (13.4%)2,438,409
2,044,127 (13.2%)
1,990,580 (14.9%)2,331,786 1,957,769 (16.0%)2,339,433
2,080,5591.6%
120,870114,244
3.6%
124,558 2,400,7102,769,2882,356,053110,206
121,601
5.3%
(1.4%)5.9%
2,487,254
TRANSPORTATION STATISTICS
201692,18899,517 101,094
2015
(16.0%)
22,212
1,598,38727,487,009
1,400,84323,077,627
(12.4%)
(10.8%)
(12.9%)2,051,364 (25.9%)2,090,979
2015 20162,091,1421,854,862
1,984,081
2,416,851
13
109,206
110,584111,822
118,271126,907116,696
8.1%
5.5%115,229
8.4%7.1%
e = Estimate as partial NDOT data unavailable
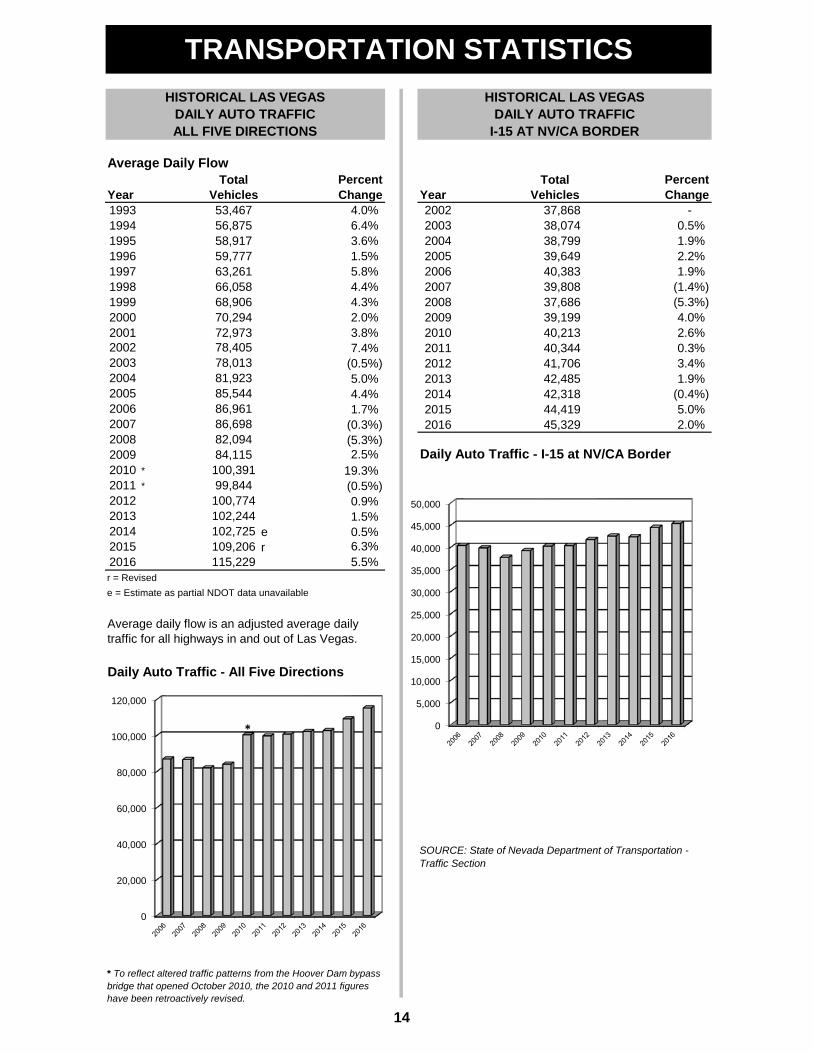
SOURCE: State of Nevada Department of Transportation - Traffic Section
Average Daily FlowPercent Percent
Year Change Year Change
Daily Auto Traffic - I-15 at NV/CA Border**
er
r = Revised
Daily Auto Traffic - All Five Directions
e = Estimate as partial NDOT data unavailable
Average daily flow is an adjusted average daily traffic for all highways in and out of Las Vegas.
* To reflect altered traffic patterns from the Hoover Dam bypass bridge that opened October 2010, the 2010 and 2011 figures have been retroactively revised.
2014 102,725 0.5%
1994
2013 102,244
5.0%
3.6%
4.4%
3.8%7.4%
(0.5%)
4.3%
86,961
70,294
78,4052003
1996
20002001
HISTORICAL LAS VEGAS DAILY AUTO TRAFFIC
I-15 AT NV/CA BORDER
TotalVehicles
2002 - 37,868
5.8%4.4%
2008
HISTORICAL LAS VEGAS DAILY AUTO TRAFFIC ALL FIVE DIRECTIONS
53,46756,875
TotalVehicles
59,777
68,906
58,917
4.0%19932003
(1.4%)1.9%2.2%
0.5%1.9%
38,074
2011
37,686
40,344
2004
2.0%
1.5%2006
0.3%
4.0%2.6%
(5.3%)39,80840,38339,649
1995
2010 40,213
2005
1999
200272,973
78,01381,92385,544
2009
38,799
SOURCE: State of Nevada Department of Transportation - Traffic Section
(0.4%)
14
TRANSPORTATION STATISTICS
19.3%
20082.5%
(0.5%)
41,706 3.4%
2009
0.9%
20122004
6.4%
19971998
2005
200763,26166,058
39,199
(0.3%)(5.3%)
1.9%42,4852013
2016 115,229 5.5%
2016 45,329 2.0%2015 44,419 5.0%
2015 109,206 6.3%
1.5%
1.7%2014 42,318
2012
86,698
100,77420112010
99,844
84,115
20062007
100,391
82,094
0
20,000
40,000
60,000
80,000
100,000
120,000
0
5,000
10,000
15,000
20,000
25,000
30,000
35,000
40,000
45,000
50,000
*

Occupancy ADR RevPARMonth 2015 2016 Change 2015 2016 Change 2015 2016 ChangeJanFebMarAprMayJunJulAugSepOctNovDecYear-to-Date
Occupancy ADR RevPARMonth 2015 2016 Change 2015 2016 Change 2015 2016 ChangeJanFebMarAprMayJunJulAugSepOctNovDecYear-to-Date
Occupancy ADR RevPARMonth 2015 2016 Change 2015 2016 Change 2015 2016 ChangeJanFebMarAprMayJunJulAugSepOctNovDecYear-to-Date
SOURCE: Las Vegas Convention and Visitors Authority
47.18 5.3%49.69 51.38 3.4%
73.5% 75.5% 2.0 60.94 62.49 2.5% 44.7981.9% 81.1% (0.8) 60.67 63.35 4.4%88.4% 87.6% (0.8) 72.48 71.32 -1.6% 64.07 62.48 -2.5%
45.55 -2.3%83.7% 86.1% 2.4 64.10 72.58 13.2% 53.65 62.49 16.5%
78.5% (2.5) 57.57 58.02 0.8% 46.6385.7% 84.9% (0.8) 57.35 65.39 14.0%
79.6% 81.2% 1.6 114.64 123.83 8.0%
86.6% 82.5% (4.1) 63.91 60.57 -5.2%
79.2% 83.2% 4.0 57.74 62.45 8.2%
10.2%87.7% 87.9% 0.2 131.63 134.64 2.3% 115.44 118.35 2.5%
11.6%94.2% 93.7% (0.5) 146.89 150.36 2.4% 138.3791.9% 93.9% 2.0 135.72 148.29 9.3%
140.89 1.8%
11.8%90.8% 91.3% 0.5 117.81 120.95 2.7% 106.97 110.43 3.2%93.1% 95.4% 2.3 117.28 127.98 9.1% 109.19 122.09
9.1%92.4% 94.9% 2.5 122.88 130.55 6.2%
11.7%92.7% 89.6% (3.1) 140.96
113.54 123.89132.60 -5.9% 130.67 118.81 -9.1%
90.3% 91.1% 0.8 127.77 141.48
105.21 107.93 2.6%78.5% 79.6% 1.1 107.13 114.66 7.0% 84.1086.4% 86.5% 0.1 121.77 124.77 2.5%
91.27 8.5%
92.8% 92.7% (0.1) 135.62 139.06 2.5% 125.86 128.91 2.4%89.9% 92.9% 3.0 125.85 137.11 8.9% 113.14 127.38 12.6%
100.39 111.73 11.3%88.4% 89.3% 0.9 109.77 112.50 2.5% 97.0491.5% 93.7% 2.2 109.72 119.24 8.7%
100.46 3.5%
$54.22 7.6%
15
47.26 53.37 12.9%
82.3% 82.8% 0.5 $61.29 $65.53 6.9% $50.37
84.2% 84.4% 0.2 56.13 63.23 12.6%49.15 55.52 13.0%
81.0%
55.35 49.97 -9.7%82.3% 85.0% 2.7 56.30 64.81 15.1% 46.33 55.09 18.9%83.0% 85.2% 2.2 62.20 67.75 8.9% 51.63 57.72 11.8%
13.6%
$123.01 5.9%
DOWNTOWN
77.6% 79.3% 1.7 $64.62 $73.07 13.1% $50.15
89.4% 90.5% 1.1 $130.08 $135.87 4.5% $116.19
$57.94 15.6%
10.7% 115.38 128.89
45.73 51.96
124.73 139.24
91.25 100.55
107.63 115.89 7.7%90.0% 93.2% 3.2 130.35 130.47 0.1% 117.3285.9% 88.2% 2.3 125.30 131.40 4.9%
121.60 3.6%
LAS VEGAS STRIP
83.7% 85.9% 2.2 $147.89 $157.77 6.7% $123.78 $135.52 9.5%
87.7% 89.1% 1.4 $120.67 $125.96 4.4% $105.84 $112.28 6.1%
90.4% 93.5% 3.1 114.34 121.25 6.0% 103.36 113.37 9.7%
105.24 117.18 11.3%91.2% 88.0% (3.2) 130.32 122.73 -5.8% 118.8588.8% 89.7% 0.9 118.51 130.64 10.2%
108.00 -9.1%
88.6% 91.8% 3.2 120.88 122.25 1.1% 107.10 112.23 4.8%84.7% 87.2% 2.5 116.48 121.76 4.5% 98.66 106.17 7.6%
OCCUPANCY - ADR - RevPARCITYWIDE
81.7% 84.7% 3.0 $136.02 $144.88 6.5% $111.13 $122.71 10.4%

Month 2015 2016 Change 2015 2016 Change 2015 2016 ChangeJanFebMarAprMayJunJulAugSepOctNovDecYear-to-Date
Month 2015 2016 Change 2015 2016 Change 2015 2016 ChangeJanFebMarAprMayJunJul AugSepOctNovDecYear-to-Date
Month 2015 2016 Change 2015 2016 Change 2015 2016 ChangeJanFebMarAprMayJunJulAugSepOctNovDecYear-to-Date
SOURCE: Las Vegas Convention and Visitors Authority
16
65.8% 72.1%75.7%
67.2%
LAS VEGAS 2016 OCCUPANCY SUMMARY (MIDWEEK AND WEEKEND)
70.7%
4.1
9.8
1.73.0
11.0
0.11.1
(2.5)
20.07.7
12.95.1
5.7
(0.6)0.1
13.0
14.3
2.33.5
(3.3)
6.3
0.5
94.2%70.7%63.6%80.1%
2.01.9 80.4%
70.4%
95.1%12.95.5
8.67.1
2.0
5.7
1.5 3.9
80.0%
1.0
0.8
2.7(0.1)
(3.6)
4.6
85.7%
89.0% 92.9%(0.1)
94.0%
(0.2)
65.8%
85.4%
84.8%
(3.5)
76.9%
65.3%
1.3
78.4%
93.5%
(3.3)95.0%
86.2%88.7%
3.391.6%
91.8%
65.5%74.9%
72.4%93.2%93.0%
84.4%86.7%90.2% 73.4%
56.1%1.8
3.0 71.5%2.40.9 91.2%90.9% 0.3
63.2%
65.3%2.4
89.0%
1.4
LAS VEGAS 2016 MIDWEEK OCCUPANCY SUMMARY
64.9%
89.8% 73.0%
83.8%81.1%86.1%
2.92.73.8 68.0% 69.7%
64.9%
80.4%1.51.7
65.3%
56.2%
60.1%
76.3%65.8%
72.4%
0.1 59.4%67.3%
88.1%
1.1
Hotel - Weekend
0.52.7
95.9%
88.4%89.9%
89.3%92.9%
82.2%
93.3%84.8%76.8%
(1.0)
88.5%87.4%
87.7% 89.1%
79.3%
79.6%
91.4%
83.4%
91.2%0.4
88.1%
86.5%
93.8%
3.4
81.8%
1.0
Motel - Midweek
90.8%
89.9%86.3% 86.7%
89.9%89.7% 0.9 91.1%
69.1%
93.2%
78.5%
78.6%69.4%
(0.2)
80.3%0.1
94.3%88.1%
94.1%88.2%
(0.1)
84.7%
93.5%
92.8%86.4% 0.1
81.7%84.7%88.6%
91.5%
88.8%91.2%90.4%
93.7%
88.0%
91.8%
(3.2)
3.2
3.12.2
87.2%3.02.5
92.7%86.5%
88.5%88.7%
89.0%91.9%85.2%
83.0%90.5%82.8%
91.5%
86.1%91.1%87.5%87.2%
93.7%86.8%
95.7%94.2%
95.0%88.1%
97.9%
96.8%93.9%95.5%
97.0%95.4%96.5%
95.3%
1.3
93.6%
96.8%97.3%97.7%95.8%
(0.1)(0.9)
96.4%
1.0
1.9
96.5%
95.1%
2.3
1.5
1.3
96.5%
2.00.2
95.7%89.0%
2.21.1
1.1
92.3% 94.6%
(0.2)
85.3%95.8%98.2% 80.3%
96.7%
89.1%
96.8%
95.7% 97.7%
95.6%95.8%95.7%
97.5%95.7%94.8%
85.9%
Citywide - Weekend
75.2%85.2%
74.9%
89.3%
87.5%
91.1% 93.8%91.9%89.4%1.1 88.9%
LAS VEGAS 2016 WEEKEND OCCUPANCY SUMMARY
76.2%
92.4%
58.9%2.892.6%89.8%
2.93.4
68.8%
62.5%(3.7)
(0.9)3.6
73.0%
Motel - Weekend
1.4
56.1%58.9%
67.2%2.02.3
73.9%
96.6% 0.9
90.6%
97.9%86.0%85.2%
95.3%
(1.0)
83.8%85.7%
89.0%92.0%
68.3%
3.90.0 63.4%60.4%
90.4%
98.3%
1.4
92.2%
1.8
0.9
88.3%
65.9%80.0% 82.7%
75.0%85.9%
87.6%97.5%96.5% 0.797.5% 82.3%
93.3%
HOTEL VS. MOTEL OCCUPANCY
4.7
11.1
54.9%
Citywide Hotel Motel
Citywide - Midweek Hotel - Midweek
(2.8)
(1.6)
78.7%70.5%
0.4(4.5)
6.0
(0.3)(0.2)84.6%
74.0%
81.7% 58.8%61.3%
6.9

Rank Date Citywide Hotel Motel1 Mar 18-192 Oct 7-83 Jun 24-254 Sep 16-175 Apr 1-26 Jul 22-237 Oct 21-228 Jun 3-4
National Las Vegas Net 9 Oct 14-15Month Occupancy OccupancyDifference 10 Nov 11-12Jan 11 Jul 29-30Feb 12 Jul 15-16Mar 13 Mar 4-5Apr 14 Jun 17-18May 15 Aug 5-6Jun 16 Sep 23-24Jul 17 Oct 28-29Aug 18 Jul 8-9Sep 19 Mar 25-26Oct 20 Jun 10-11Nov 21 Mar 11-12Dec 22 Feb 12-14Year-to-Date 23 May 27-28
24 Sep 30-Oct 125 May 20-2226 Sep 2-4
Las Vegas vs. U.S. National Occupancy 27 Aug 12-1328 Nov 4-529 Apr 8-930 Apr 15-1631 Jul 1-332 Apr 22-2333 May 13-1434 Sep 9-1035 Dec 30-Jan 136 Feb 26-2737 Dec 2-338 Jan 22-2339 Apr 29-3040 Aug 19-2041 Nov 18-1942 Aug 26-2743 Nov 24-2644 Feb 5-645 Feb 19-2046 May 6-747 Jan 15-1648 Jan 1-249 Jan 8-950 Dec 9-1051 Dec 23-2552 Dec 16-1753 Jan 29-30
97.6%
82.4%
96.1%96.2%
95.9%
87.3%88.1%84.5%
97.6%
98.1%
96.9%
93.7%98.2%98.1%98.0%
93.8%
98.0%93.6%
92.1%
96.2%
89.2%97.6%
98.0%
97.2%
93.8%
94.6%95.2%94.8%
98.3%
LAS VEGAS OCCUPANCY VS.U.S. NATIONAL AVERAGE
67.0%
98.4%98.3%
66.4%61.5%
30.987.2%91.8%
25.753.8% 84.7%
68.1%
98.2%98.2%98.0%98.0%
96.9%
98.6%
95.0%
2016 CITYWIDE WEEKEND OCCUPANCY RANKING
98.4%
94.3%
98.6%98.8% 98.9% 98.2%
94.4%
98.4%
26.7
25.4
98.7%98.7%
73.1%
21.688.0% 21.093.5%
98.3%
97.6%
97.3%93.7%
97.6%19.319.1
20.4
98.1%
The following table compares the Las Vegas monthly occupancy rates to the U.S. hotel average monthly occupancy rates. The "Lodging Review" report published by the national firm of STR was utilized for the comparative study.
98.4%
97.8%97.7%
97.6%
98.0%
95.2%96.2%
74.4%
68.6% 92.7% 24.1
23.6
25.852.9%
86.5%79.6%
60.7%
65.5% 89.1%
95.0%
95.1%
96.6%95.0%95.0%
95.2%
96.7%24.168.8%
96.3%
81.7%
87.9%
95.3% 81.5%
96.4%
83.9%86.4%
96.7%
95.7%96.9%
95.3%
96.6%95.2%
96.1%
83.3%
86.8%80.7%
92.5%
94.6%
93.8%79.1%
94.9%
79.1%
94.1%
94.8%90.5%83.4%
79.7%77.0%
95.8%
96.2%
96.0%
78.9%
95.7%
82.0%79.9%
94.8%
93.1%
HOTEL VS. MOTEL OCCUPANCY
98.8% 99.0% 96.4%
87.4%97.0%
93.2%
92.2%90.7%
93.7%
97.4%
96.6%
90.2%
96.8%93.3%97.7%
97.1%88.3%
70.2%
96.9%96.5%
89.3%92.9%
89.7%
SOURCES: Las Vegas Convention and Visitors Authority; STR
78.2%
92.7%89.0%
90.3%
96.0%95.8%
91.1%89.1% 90.1%
92.6%91.9%
94.6%
90.6%
96.2%96.0%94.4%
94.4%94.2%
78.2%91.3%
95.6%95.2%
81.0% 83.4% 57.3%
17
SOURCE: Las Vegas Convention and Visitors Authority
82.9%
53.1%63.2%48.8%
79.4%
84.6%82.6%82.0% 85.4%
0%
20%
40%
60%
80%
100%
Jan Feb Mar Apr May Jun Jul Aug Sep Oct Nov Dec
National Las Vegas

Year Year
Las Vegas Occupancy Las Vegas Occupancy
81.5%2010 76.8%
The following table presents the citywide, hotel, and motel occupancy rates over the last ten years.
The following table presents the citywide, weekend, and midweek occupancy rates over the last ten years.
90.9%
88.7% 94.3%
2009
94.0%89.8%
84.4%2013
2014
56.0% 83.8%
HISTORICAL LAS VEGAS OCCUPANCY - WEEKEND & MIDWEEK
Midweek Weekend Citywide90.4%86.0%
Citywide
84.3%
HISTORICAL LAS VEGAS OCCUPANCY - HOTEL & MOTEL
Hotel Motel90.4%86.0%
20072008 89.8%
59.8%65.0%
85.3%
2011 80.7%
2014
20072008
64.5%57.8%50.1%
81.6%2012
2010
89.1%87.7%
90.8%2011
84.3%86.8%
SOURCE: Las Vegas Convention and Visitors Authority
SOURCE: Las Vegas Convention and Visitors Authority
81.5%80.4%
81.4%
86.9%
2009 78.2% 88.8%
83.9%87.1%89.1%
52.0%
2015
2013
89.8%
58.0%87.4%83.8%
2012
88.4% 80.4%
84.4%
18
HOTEL VS. MOTEL OCCUPANCY
2016 90.8% 73.0% 89.1%
86.8%
83.5%
85.2% 93.7%2016 86.5%
87.7%68.3%
91.1%93.3%
84.3%
201595.0%
40%
50%
60%
70%
80%
90%
100%
Hotel
Citywide
Motel
70%
80%
90%
100%
Weekend
Citywide
Midweek

Year Jan Feb Mar Apr May Jun Jul Aug Sep Oct Nov DecUnited States
r
Nevadar
Las Vegasr
* Seasonally adjusted rates r = Revised
Percent PercentMonth Change Month ChangeJan JanFeb FebMar MarApr AprMay MayJun Jun Jul Jul Aug Aug Sep Sep Oct OctNov NovDec DecAverage Average
SOURCE: U.S. Department of Labor SOURCE: U.S. Travel Association
Year20032004200520062007200820092010201120122013201420152016
SOURCE: The Conference Board
101 109 11398 94 96 95 92 98 97 102 104
94 91 9379 78 84 82 82 86 90 93 89
U.S. City Average: (1982-1984=100) U.S. City Average: (1982-1984=100)
Composite Series: (1985=100)
SOURCES: U.S. Department of Labor and NV Dept. of Employment, Training and Rehabilitation
54 51 53
TRAVEL PRICE INDEX
51 52 5949 51
105 11095
105
49 50 58 6363
105 107
65 72 64 66 62 58 59 45 41
10687 76 66 63 4561 39
106 105100
58
107 103 110110 111 108
108
55 6561
53 54
106 100 9139
68 73 72 6764 6369
47 554955
88109 105 112
0.9%265.8
236.6
265.6
(0.3%)
(0.1%)
239.3 1.1%
65
(0.4%)
273.4 270.6 (1.0%)274.7 273.8
280.3
57 46 52 58
62 72 7046
2015261.0
1.0%0.8%
277.5
283.8284.8
281.5
263.4
0.9%
237.8 240.2 1.0%
CONSUMER CONFIDENCE INDEX
0.0%
265.4259.4241.4
1.6%
2.1%
1.1%(1.3%)267.9
0.5%(1.8%)
274.5
285.3279.7
(1.1%)271.51.5%
240.6240.9
238.6 241.0238.7238.3
1.7%0.9%2.5%
270.0 274.5267.9265.8
UNEMPLOYMENT RATE *
5.7 5.5 5.44.9 4.9
5.25.54.75.0
234.7 237.1 1.0%1.4%
2015233.7 236.9
236.1 238.1
237.0
Mar AugMay
272.4
237.9 241.4
236.5241.4 1.7%
237.8 241.7237.3
1.3% 272.4
10589
7998
65
104
81JulJunAprJan Feb
20152016
20152016
20152016
9384
10377 82
99106 9397
Dec9582
9389
Sep Oct
240.0
7.5
6.35.5 5.26.2 5.9 5.8 6.1
6.66.56.8
5.8 6.4
7.1
6.3 5.86.9
6.1
6.5
7.2 6.95.6 6.0 6.76.9
106103 106104 8587103104
93Nov
9398
61 77
103
UNITED STATES CONSUMER PRICE INDEX (CPI)
6.5
4.6 4.75.0
20162016
7.1
5.34.9
6.8
4.9
6.4
6.66.4
7.2 7.1 6.9
6.9
6.7
5.66.8 6.76.0 5.5
19
4.95.0
7.0
OTHER ECONOMIC INDICATORS
98
84
4.95.0
4.8
5.0
5.1
6.4 6.2
5.45.0
5.1
5.2
5.0
6.2
37 25 27 41
99 93 96104 99 101 94 95 100 91 101 103
72 72 7858 68 62 69 74 82 81 82 80

Year Room Tax Revenue
Month 2015 2016JanFebMarAprMayJunJulAugSepOctNovDecTotal
LVCVA Room Tax RevenueMillions
% Share ofDollar Chg from Total
Entity Amount 2015 CollectedCountyLas VegasOthers *Total
SOURCE: Las Vegas Convention and Visitors Authority
9.5%2016 273,079,478 7.3%
9.0%12.1%
5.8%7.4%
37.0%76,876,787
34,443,76521,902,888 23,781,589
1990
199319921991
24,668,409 22,643,034
12.7%26,956,881$22,836,893
2.3%17.7%
98,186,440
82,135,745 6.8%26,236,041
22,204,90710.8%6.2%
22.1%(0.2%)
19,527,179 22,767,407
100,468,931
52,259,477
5.8%
11.5%16,522,898$254,438,208
12.9%
17,942,765$273,079,478
3.9%1.7%
56,125,234
1984
30,587,1411985198619871988
18,163,576$25,597,52819,790,308
ROOM TAX & SALES TAX REVENUELVCVA ROOM TAX REVENUE EARNED ROOM TAX REVENUE ANNUAL ANALYSIS
14.0%$21,731,353
Room tax revenue distributed to the LVCVA for the period covering 1983 through 2016 is presented in the following table:
PercentChange
10.1%23,921,3131983
Clark County room tax revenue allocated to the LVCVA totaled $273.1 million in 2016, an increase of 7.3% when compared with last year.
PercentChange
3.1%
7.0%
38,175,5358.6%1989(8.2%)
7.9%13.7%16.6%
7.2%
10.4%
40,528,24549,493,56949,396,226
91,565,876
(1.5%)
(26.1%)
18.6%
(1.1%)
9.3%
194,329,584 18.6%
127,102,165138,941,106
$251,297,55114,608,150
21,409,193
20,260,162 23,040,083
7.3%8.6%
201120122013
1999200020012002
200,384,250
20,604,648
129,053,244130,550,852
2015 254,438,208
118,299,856
22,091,329 24,951,25525,795,038
10.6%
23,492,92313.5%12.6%
19,860,281 21,427,353
20
2014
200420052006
1994199519961997
2009
1998
20072008
ROOM TAX EARNED BY ENTITY
7,173,777
2003
2010
7.1%
* Includes Boulder City, Mesquite, Henderson and North Las Vegas.
$273,079,478 7.3% 100.0%
164,821,755
7.3%6.0%
153,150,310
219,713,911
193,136,789207,289,931
(5.7%)
163,809,985
17.2%
207,117,817
2.6%
210,138,974 4.9%
12.5%6.6%
92.0%5.3%
An analysis of the collection of room tax revenue by the various entities in Clark County is listed in the table below.
232,443,537
$0
$2
$4
$6
$8
$10
$12
$14
$16
$18
$20
$22
$24
$26
$28
Jan Feb Mar Apr May Jun Jul Aug Sep Oct Nov Dec
2015 2016

FY 2016-Room Tax Distribution PercentLVCVA Retains for Operations & Marketing 4 - 5% distributed to LVCVA (Less Collection Allocation Paid to Entities) (Less Debt Service for Transportation)
Portion Distributed to Entity / Jurisdiction 1 - 2% Room Tax Retained by Entity Collection Allocation Grants to Entities
Clark County Transportation (1%)Clark County School District (1 5/8%)Nevada Department of TransportationState of Nevada Schools (3%)State of Nevada Tourism (3/8%)
TOTAL ROOM TAX COLLECTED
20,440,567
$58,845,257
The final distribution of Clark County's room tax is shown here. Of note, the LVCVA receives 32 percent of the room tax, with the remaining 68 percent going back into the community to fund projects such as schools, parks and roads.
Amount
$88,150,843
3.1%
$212,780,014
21
13.4%
14.2%
$259,967,636(25,996,764)(21,190,859)
$62,154,07925,996,764
ROOM TAX REVENUE
$658,262,356 100%
93,387,434 8.9%
163,467,383 21,190,859
24.8%3.2%
32.3%
CLARK COUNTY ROOM TAX DISTRIBUTION
Clark County School District,
14.2%
State of Nevada Schools, 24.8%
NV Dept of Transportation,
3.2%Nevada
Commission on Tourism, 3.1%
, 0.0%
, 100.2%
, 0.0%
LVCVA (Net), 32.0%
LVCVA (Net)32%
Local Jurisdictions 14%
County Transportation
9%
NV Dept of Transportation,
4%
Clark County School District
14%
State of Nevada Schools 25%
Nevada Commission on
Tourism 3%

Total PercentYear Hotel/Motel Rooms Change
Month 2015 2016JanFebMarAprMayJunJulAugSepOctNovDecTotal
SOURCE: State of Nevada - Department of Taxation
Business Type: Food Services and Drinking Places and Accommodations* Only
Month 2015 2016Jan rFeb rMar rApr r
Las Vegas Room Inventory May rThousands Jun r
Jul rAug rSep rOct rNov rDec rTotal r
r = RevisedSOURCE: State of Nevada - Department of Taxation
SOURCE: Las Vegas Convention and Visitors Authority
4.2%$10,387,505,360
5.4%
7.0%
806,314,804
2012 150,481 0.2%
20140.1%
5.5%
7.6%
6.4%5.8%
0.9%
2015 149,213 (0.9%)2016 149,339 0.1%
$9,970,867,012
150,544 (0.0%)
761,638,343 803,453,158
809,075,824 870,714,020838,546,744 897,440,302
846,555,580 900,943,316832,078,270 880,111,748
2011 150,161 0.8%
873,861,234 882,010,261764,712,529
2013 150,593
99,072105,347
850,929,963
3.8%
2.9%
6.0%940,877,685 910,277,459 (3.3%)
6.0%899,478,137 913,127,362 1.5%746,304,497 790,976,278
901,865,016
Percent
3,281,139,7564.7%6.1%
3,307,808,820 3,462,945,9943,193,309,411
Change$806,808,206 $830,271,636 2.9%
3,076,853,417
10.1%3,265,407,912
3,264,266,1341.6%
1.9%3.6%
3,801,514,422 3,873,419,565$38,556,975,693 $39,928,526,913
3,146,484,224 3,278,265,615 4.2%2.8%
3,282,693,0953,270,611,845 3,600,742,478
0.5%
3,212,347,865 3,264,077,922
Percent
TOTAL CLARK COUNTY TAXABLE SALES
Change
12.5%(0.5%)
(2.0%)6.5%3.5%5.0%
3.7%3,005,246,2090.8%
3,411,278,292 3,507,763,111 2.8%
$2,860,450,981 $2,884,688,6982,899,119,280
3.6%3,111,789,224 3,223,278,336
HISTORICAL LAS VEGAS HOTEL/MOTEL ROOM INVENTORY
1993
According to figures compiled by the State Department of Taxation, retail sales transactions in Clark County exceeded $39.9 billion during calendar year 2016, an increase of 3.6 percent from 2015 levels.
2.9%
1.9%
120,294124,270126,610
9.8%
148,941
CLARK COUNTY TAXABLE SALES
6.0%
10.0%3.3%
0.3%
0.8%1.3%
132,605
130,482
9.4%4.3%
1.7%
109,365
133,186
10.0%6.3%
88,56019941995199619971998
5.7%
1991
53,0671985198619871988
1992
56,49458,47461,39467,39173,73076,87976,523
19891990
86,053
90,046
22
*Accommodations category reflects all sales tax derived from hotel-owned revenue centers (i.e. gift shop, catering, room service, retail outlets and hotel-owned restaurants) excluding lodging. Restaurants that are owned independently are categorized in "Food Services and Drinking Places."
ROOM INVENTORY & SALES TAX REVENUE
2004
20092010
2005200620072008 140,529
(0.4%)
19992000200120022003
0.1%126,787
132,947
131,503
148,935 (0.0%)
55
65
75
85
95
105
115
125
135
145
155

PercentMonth 2015 2016 ChangeJanFeb PercentMar Month 2015 2016 ChangeApr JanMay FebJun MarJul AprAug MaySep JunOct JulNov AugDec SepTotal Oct
NovDec
SOURCE: State of Nevada - Parks Division Total
PercentMonth 2015 2016 ChangeJanFebMarAprMayJunJul PercentAug Month 2015 2016 ChangeSep JanOct FebNov MarDec AprTotal May
JunJul
SOURCE: State of Nevada - Parks Division AugSepOctNovDecTotal
23
OTHER TOURISM STATS
38,074 36,261
10.4%647,262
646,713556,164
(14.1%)699,821
Spring Mountain, First Creek & Oak Creek Areas
46,585
27.6%16.0%9.9%
(4.8%)(1.7%)
59,642
16.6%
20.2%
16.3%
54,34842,986 50,597
9.7%17.7%
39,952
755,647 4.9%
During 2016, the Lake Mead area received more than 7.4 million recreational visitors, a decrease of 1.7 percent from the year prior.
6.2%
15.7%415,199342,949
47,215
34,578
79,410
62,463
35,170
74,33968,662
64,059
43,445 52,23638,529 0.7%
66,374 40.6%62,234
38,265
765,377
VISITORS TO RED ROCK CANYON
163.3%(5.5%)
(22.6%)
61,72928,652
23,44630,33428,695 22,216
22,086
31.2%9,435 12,381
30,317 27,765 (8.4%)16,095 18,203 13.1%
54,267 145.7%
256,457 323,879
27.5%
26.3%13.4%
60,003
(10.9%)27,27930,613
11,791 13,37014,276 18,204
56,631
23,06116,308 20,824
18,989 (17.7%)27.7%
39,500
55,213
SOURCE: Boulder Canyon Project - Visitor Services - Report of Visitors
473,581 (12.7%)
1.1%
636,947
41.3%
(18.8%)
817,136(4.3%)
(4.9%)832,120
720,16754,621
VISITORS TO LAKE MEAD
VISITORS TO VALLEY OF FIRE
27,953
635,030
(4.1%)
559,252
VISITORS TO HOOVER DAM
67,578
42,85248,46575,863
In 2016, more than 750,000 people visited the complex at Hoover Dam. The comparative monthly totals for the calendar year of 2015 versus 2016 are contained in the following analysis.
8.5%39,5018.8%
64,526
44,54866,816
54,602
57,173
67,864 13.1%0.8%55,056
13.5%
65,71758,838
(4.5%)
3.9%
2.6%
63,674
0.3%65,535
11.4%3.3%74,072
81,42171,738
83,507
527,598396,823
SOURCE: U.S. Department of Interior - National Park Service
413,520594,070651,004620,922707,061783,912791,166621,800
555,767772,513
7,563,176 7,436,156 (1.7%)
27.1%
738,502
2.5%(2.5%)

Calendar YearFirst vs. Repeat
First time visitorRepeat visitor
Purpose of Current VisitVacation/pleasure/gambleBusiness/conventionOther
TransportationAirAutomobile/Bus/RV
Other Trip CharacteristicsRoom occupants (mean)Number of visits in past yearAdults in partyNights stayedVisitors with children
Expenditures Per VisitorFood & drink (per trip)Transportation (per trip)Shopping (per trip)Shows (per trip)Sightseeing (per trip)Hotel/Motel room (per night)
Gambling BehaviorGambled while in Las VegasDaily hours gambledGambling Budget (per trip)
Visitor OriginEastern StatesSouthern StatesMidwestern StatesWestern States California ArizonaForeign
EthnicityWhiteAfrican American/BlackAsian/Asian AmericanHispanic/LatinoOther
Average AgeAge
SOURCE: Las Vegas Convention and Visitors Authority - 2016 Las Vegas Visitor Profile Study
During the calendar year of 2016, the Las Vegas Convention and Visitors Authority (LVCVA) completed the Las Vegas Visitor Profile Study . The purpose of this marketing research survey is to provide the LVCVA with an objective assessment of the Las Vegas visitor, as well as to identify trends in visitor behavior that occur over time. Copies of this research can be obtained by contacting the LVCVA Research Center at (702) 892-2805 or an electronic version of the report can be viewed and downloaded at www.LVCVA.com.
$57.77$149.29
11%
$9.63$93.13
72%
2%
33%
3%
11%7%
$14.86
33%6%
10%
9%5%
85%
19%
29%9%
4%
LAS VEGAS VISITOR PROFILE HIGHLIGHTS
11% 8%
9%
1.8
54%
29%
43%
10%
17%
$484.70
52%
$529.57
6%12%10%
5%75%
6%
$265.11
2.6
2012 2013
15%
1.6 1.72.42.4
3.32.23.4
2.43.3 3.4
1.7
42%
33%
20%
8%
73%5%
12%
6%
71%2.9
$14.49$9.29
2.6
$86.55
71%
$278.95$59.68
$140.90$38.45
$68.83
$83.62
$149.77$42.89
16%84%
55%16%
57%
2.2
57%
2.0
26%
43%
$292.00$73.45
$122.66$61.95
58%
2.21.62.43.2
85%
56%14%30%
2014
19%81%
59%15%26%
42%
$281.88
16%84%
58%16%
$47.56
58%
2.1
$530.11
7%
53%
12%10%
46%54%
12%
$318.09$96.08
$156.91
$102.64
73%2.9
$578.54
7%13%11%53%
7%
2016
27%73%
52%15%33%
2.1
19%
69%
$67.55$35.93
$116.15
69%1.9
$619.01
2015
45.2
4%
24
45.8
8%1%
47.7
LAS VEGAS VISITOR PROFILE
1%
4%10%
16%
8%
77%
14%3%
44.0
10%49%31%6%
44.8
7%15%

Unique Desktop Visits Unique Mobile VisitsPercent Percent
Month Change Month ChangeJan JanFeb FebMar MarApr AprMay MayJun JunJul JulAug AugSep SepOct OctNov NovDec DecTotal Total
Unique Site Visits Unique Site VisitsPercent Percent
Month Change Month ChangeJan JanFeb FebMar MarApr AprMay MayJun JunJul Jul Aug AugSep SepOct OctNov NovDec DecTotal Total
Unique Site Visits Unique Site VisitsPercent Percent
Month Change Month ChangeJan JanFeb FebMar MarApr AprMay MayJun JunJul JulAug AugSep SepOct OctNov NovDec DecTotal Total
SOURCE: Las Vegas Convention and Visitors Authority
SOURCE: Las Vegas Convention and Visitors Authority
25
590,391 636,492 7.8% 174,411 193,434 10.9%40,916 52,076 27.3% 9,866 11,994 21.6%46,208 62,163 34.5% 8,845 11,536 30.4%50,270 51,261 2.0% 9,893 12,712 28.5%59,702 50,666 (15.1%) 11,013 12,499 13.5%44,955 44,454 (1.1%) 11,918 12,819 7.6%43,648 48,384 10.9% 11,758 12,180 3.6%42,571 45,242 6.3% 15,462 12,429 (19.6%)44,734 37,576 (16.0%) 13,449 15,100 12.3%47,683 59,972 25.8% 16,873 16,915 0.2%47,587 50,867 6.9% 18,380 14,700 (20.0%)51,663 55,501 7.4% 20,967 20,514 (2.2%)70,454 78,330 11.2% 25,987 40,036 54.1%
LVCVA.COM VISITMESQUITE.COM
2015 2016 2015 2016
1,159,724 733,130 (36.8%) 934,821 756,151 (19.1%)58,116 48,395 (16.7%) 67,052 39,625 (40.9%)72,368 53,166 (26.5%) 46,054 39,002 (15.3%)89,892 58,713 (34.7%) 70,169 47,470 (32.3%)98,467 58,489 (40.6%) 84,927 79,384 (6.5%)91,391 58,339 (36.2%) 77,705 70,565 (9.2%)86,060 52,026 (39.5%) 84,372 67,806 (19.6%)90,119 53,379 (40.8%) 84,558 77,505 (8.3%)80,112 58,008 (27.6%) 86,716 72,126 (16.8%)89,420 61,114 (31.7%) 93,493 72,434 (22.5%)
114,834 66,677 (41.9%) 92,647 67,594 -27%111,563 71,105 (36.3%) 74,129 67,602 (8.8%)177,382 93,719 (47.2%) 72,999 55,038 (24.6%)
VEGASMEANSBUSINESS.COM VISITLAUGHLIN.COM
2015 2016 2015 2016
12,168,600 9,273,555 (23.8%) 4,191,027 4,039,964 (3.6%)668,767 517,619 (22.6%) 259,163 271,160 4.6%670,179 561,213 (16.3%) 253,561 264,207 4.2%763,832 588,076 (23.0%) 255,274 279,603 9.5%935,404 649,748 (30.5%) 319,225 319,769 0.2%
1,006,366 769,065 (23.6%) 399,375 352,157 (11.8%)919,612 773,481 (15.9%) 357,877 350,219 (2.1%)
1,223,309 901,769 (26.3%) 489,201 442,820 (9.5%)1,078,592 874,656 (18.9%) 476,653 433,584 (9.0%)1,009,566 850,965 (15.7%) 330,075 343,643 4.1%1,369,935 882,736 (35.6%) 404,055 340,281 (15.8%)
DIGITAL MARKETINGLASVEGAS.COM M.LASVEGAS.COM
2015 2016 2015 2016
1,260,625 890,073 (29.4%) 339,947 298,551 (12.2%)1,262,413 1,014,154 (19.7%) 306,621 343,970 12.2%

Tourism Indicator 2015 2016Visitor VolumeRoom InventoryOccupancy LevelAverage Daily Room RateRevenue Per Available Room (RevPARRoom Nights OccupiedGross Gaming Revenue rLaughlin/Bullhead City Air Passengers Average Daily Traffic-Hwy 163
r = Revised
Calendar Year
First vs. RepeatFirst time visitorRepeat visitor
Purpose of Current VisitVacation/pleasureGambleOther
Other Trip CharacteristicsRoom occupants (mean)Number of visits in past yearAdults in partyNights stayedVisitors with children
Expenditures Per VisitorFood & drink (per trip)Transportation (per trip)Shopping (per trip)Shows (per trip)Sightseeing (per trip)
Gambling BehaviorGambled while in LaughlinDaily hours gambledGambling Budget (per trip)
Average AgeAge
SOURCE: Las Vegas Convention and Visitors Authority - 2016 Laughlin Visitor Profile Study
40%
2.9
46%44%
2.03.33%
Change1.2%
-1.0%1.4
3.8%6.0%2.8%1.0%
-1.2%
19%
5.1
$64.97 $42.76
$8.07 $7.87
30%
3.4
2.92.1
8%
2.0
5%
$5.55 $7.73
100%6.0
LAUGHLIN EXECUTIVE SUMMARY
LAUGHLIN VISITOR PROFILE HIGHLIGHTS
4,298 4,583
2014
SOURCES: Las Vegas Convention and Visitors Authority, Mojave County Airport, Nevada Department of Transportation (NDOT), Nevada Gaming Control Board
2012 2013 2016
213,310
2,292,098$472,430,000
$9.08
87%
210,666$467,790,000
6.6%
$66.15 $8.84
73%
59.1
37%23%
2.0
$657.51
59.4
$41.75 $66.20
3.32.0
24%
$5.95 $10.41
99%5.0
5%
$146.75
3.5
24%
2.52.02.0
98%
$27.95 $29.63
87%85%
61.4% 62.8%$45.48 $47.22
1,910,2419,92010,021
6%
$150.63
$575.30
13%
2.1
26%
15%
30%50%
13% 10%91%9%
26%
90%
$146.52
4%
$688.12
$8.59
2.8
$566.38
$122.22 $57.79 $73.64
2015
26
During the calendar year of 2016, the Las Vegas Convention and Visitors Authority completed the Laughlin Visitor Profile Study. The purpose of this marketing research survey is to provide the Las Vegas Convention and Visitors Authority (LVCVA) with an objective assessment of the Laughlin visitor, as well as to identify trends in visitor behaviors that occur over time. Copies of this research can be obtained by contacting the LVCVA Research Center at (702) 892-2805, or an electronic version of the report can be viewed and downloaded at www.LVCVA.com.
LAUGHLIN, NEVADA
57.9
5.3$619.43
$6.67
100%5.8
99%
63.1 61.2
$65.76
2.3
$69.69
$134.13
2.0 2.2
$71.93
3.4
1,887,853
2,229,500
Percent Occupancy Percentage NetMonth 2015 2016 Change Month ChangeJan JanFeb FebMar MarApr AprMay MayJun JunJul JulAug AugSep SepOct OctNov NovDec DecTotal Average
PercentMonth ChangeJan
Total Percent FebYear Visitor Volume Change Mar1990 Apr1991 May1992 Jun1993 Jul1994 Aug1995 Sep1996 Oct1997 Nov1998 Dec1999 Average20002001200220032004 Percent2005 Month Change2006 Jan2007 Feb2008 Mar2009 Apr2010 May2011 Jun2012 Jul2013 Aug2014 Sep2015 Oct2016 Nov
DecAverage
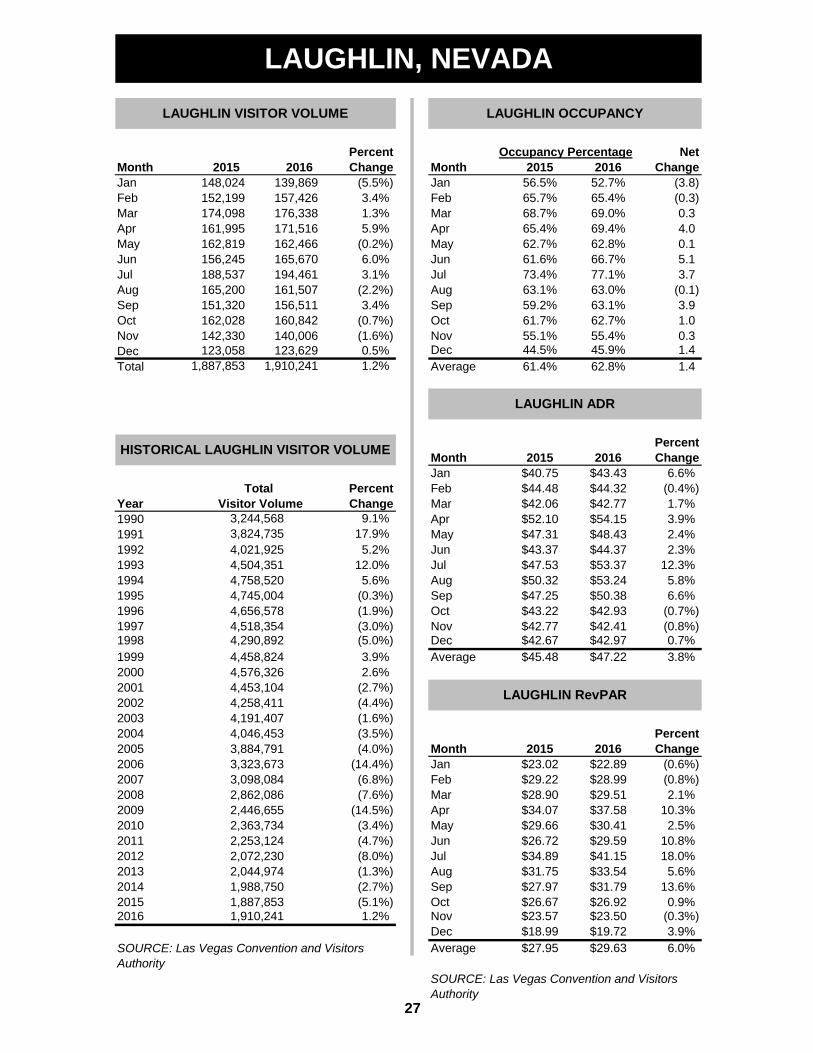
1,910,241 1.2%1,887,853 (5.1%)
SOURCE: Las Vegas Convention and Visitors Authority
SOURCE: Las Vegas Convention and Visitors Authority
2.1%10.3%2.5%
10.8%18.0%5.6%
13.6%0.9%
(0.3%)
$34.07$29.66$26.72$34.89$31.75$27.97$26.67$23.57
6.0%$29.63$27.95$19.72$18.99 3.9%
$37.58$30.41$29.59$41.15$33.54$31.79$26.92$23.50
$48.43$44.37$53.37
$47.31$43.37$47.53
$28.90 $29.51$29.22$23.022015
$22.892016
$28.99
$42.93
$53.24$50.38
$42.41$42.97$47.22
$50.32$47.25$43.22
$42.67
2.4%2.3%
(0.8%)0.7%3.8%
12.3%5.8%
(0.7%)6.6%
$45.48
$42.77
(0.8%)(0.6%)
LAUGHLIN RevPAR
56.5%2015 2016
65.7%68.7%
63.1%59.2%61.7%55.1%44.5%61.4%
63.0%63.1%62.7%55.4%
$40.75 $43.43$44.48 $44.32$42.06$52.10
2015 2016
62.7%61.6%73.4%
LAUGHLIN ADR
45.9%62.8%
(0.1) 3.9 1.0 0.3 1.4
6.6%(0.4%)1.7%3.9%
$42.77$54.15
65.4%
1,988,750 (2.7%)2,044,974 (1.3%)
(8.0%)2,072,230
(1.6%)
4,576,3264,453,1044,258,411
4,046,453
3,323,673
2,862,086 (7.6%)(6.8%)3,098,084
(14.4%)3,884,791 (4.0%)
(4.4%)
4,290,8924,458,824 3.9%
52.7%
1.4
5.1 66.7%3.7 77.1%
69.4% 4.0
4,021,925
165,670
152,199
161,995
157,426176,338
165,200
(5.5%)3.4%
3.1%
162,819
(2.2%)161,507
6.0%
171,516162,466
(3.0%)
9.1%17.9%
4,504,351 12.0%
LAUGHLIN OCCUPANCY
65.4%
0.1
(0.3)
62.8%
(3.8)
69.0% 0.3 174,098 1.3%
188,537
5.9%(0.2%)
3,244,568
LAUGHLIN VISITOR VOLUME
156,245194,461
148,024 139,869
123,058140,006123,629
1,887,853 1,910,241
(1.6%)0.5%1.2%
156,511 3.4%151,320162,028 (0.7%)160,842
27
2,363,734 (3.4%)
LAUGHLIN, NEVADA
4,656,5784,518,354
(1.9%)
5.6%
3,824,7355.2%
4,758,520
2,253,124 (4.7%)
2,446,655 (14.5%)
(5.0%)
(0.3%)
(3.5%)4,191,407
(2.7%)2.6%
4,745,004
HISTORICAL LAUGHLIN VISITOR VOLUME
142,330
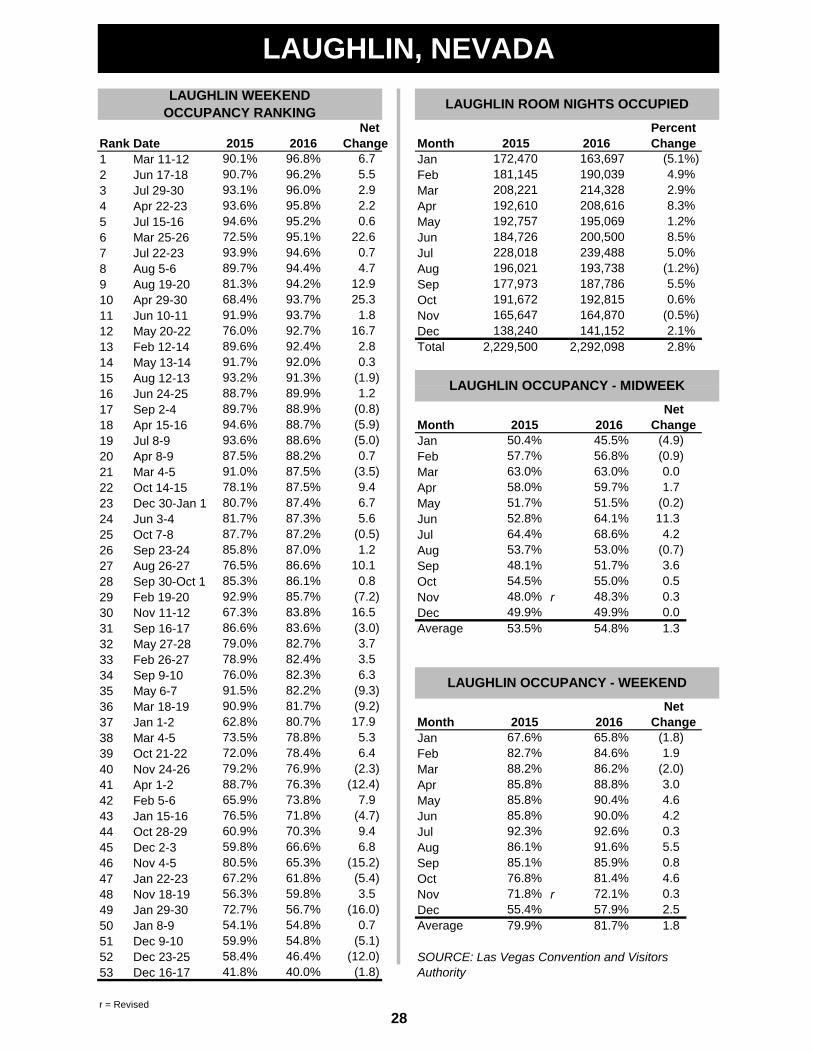
Net PercentRank Date Change Month1 Mar 11-12 Jan2 Jun 17-18 Feb3 Jul 29-30 Mar4 Apr 22-23 Apr5 Jul 15-16 May6 Mar 25-26 Jun7 Jul 22-23 Jul 8 Aug 5-6 Aug9 Aug 19-20 Sep10 Apr 29-30 Oct11 Jun 10-11 Nov12 May 20-22 Dec13 Feb 12-14 Total14 May 13-1415 Aug 12-1316 Jun 24-2517 Sep 2-4 Net18 Apr 15-16 Month19 Jul 8-9 Jan 20 Apr 8-9 Feb21 Mar 4-5 Mar 22 Oct 14-15 Apr23 Dec 30-Jan 1 May 24 Jun 3-4 Jun25 Oct 7-8 Jul 26 Sep 23-24 Aug27 Aug 26-27 Sep 28 Sep 30-Oct 1 Oct29 Feb 19-20 Nov r30 Nov 11-12 Dec31 Sep 16-17 Average32 May 27-2833 Feb 26-2734 Sep 9-1035 May 6-736 Mar 18-19 Net37 Jan 1-2 Month38 Mar 4-5 Jan 39 Oct 21-22 Feb40 Nov 24-26 Mar 41 Apr 1-2 Apr42 Feb 5-6 May 43 Jan 15-16 Jun44 Oct 28-29 Jul 45 Dec 2-3 Aug 46 Nov 4-5 Sep 47 Jan 22-23 Oct48 Nov 18-19 Nov r49 Jan 29-30 Dec50 Jan 8-9 Average51 Dec 9-1052 Dec 23-2553 Dec 16-17
r = Revised
SOURCE: Las Vegas Convention and Visitors Authority
0.6%(0.5%)2.1%2.8%
177,973 191,672 165,647 138,240
2,229,500
164,870 192,815
58.0%51.7%
54.8%
53.0%64.4%
54.5%
5.5%
49.9%
0.50.3
(0.7)
2015 2016172,470 181,145 208,221 192,610 192,757 184,726 228,018 196,021
(5.1%)4.9%2.9%8.3%1.2%
5.0%8.5%
(1.2%)
214,328 208,616 195,069 200,500
190,039
239,488 193,738
3.6
0.01.7
4.2
63.0%59.7%51.5%64.1%68.6%
(0.2)
3.5(16.0)
0.7
(4.7)9.46.8
(15.2)
(5.1)
(1.8)
56.3%72.7%
80.5%67.2%
6.75.52.92.20.6
22.60.74.7
2.80.3
(1.9)1.2
12.925.3
1.816.7
(3.5)9.46.75.6
88.7%
73.5%72.0%
60.9%
62.8%
76.0%91.5%
79.2%
65.9%76.5%
85.3%
91.0%
94.6%93.6%
81.7%
78.9%
67.3%86.6%
90.9%
92.9%
85.8%76.5%
79.0%
89.7%
91.7%93.2%
87.5%
89.6%
68.4%91.9%
88.7%
87.7%
78.1%80.7%
96.8%
2,292,098
2015 201690.1%
93.6%94.6%
90.7%
81.3%
72.5%93.9%
76.0%
Change
LAUGHLIN WEEKEND OCCUPANCY RANKING
93.1%
89.7%
163,697
187,786
141,152
96.2%96.0%95.8%95.2%
2016 Change50.4% 45.5% (4.9)57.7%
11.352.8%
63.0%56.8% (0.9)
95.1%94.6%94.4%94.2%93.7%
91.3%89.9%88.9%
92.4%92.0%
3.56.3
53.7%48.1%
49.9%53.5%
88.7%88.6%88.2%87.5%87.5%87.4%
86.1%85.7%83.8%
86.6%
(5.0)0.7
(7.2)16.5(3.0)3.7
(0.5)
2015(0.8)(5.9)
93.7%92.7%
87.3%87.2%87.0%
59.8%
82.4%82.3%
83.6%82.7%
1.210.1
0.8
6.4(2.3)
(12.4)7.9
(9.3)(9.2)17.9
5.3
(5.4)
70.3%66.6%65.3%61.8%
82.2%81.7%
76.9%76.3%73.8%71.8%
80.7%78.8%78.4%
88.2%85.8%
(2.0)3.0
86.2%
51.7%55.0%48.3%
4.690.4%
84.6% 1.9
1.3
48.0%
82.7%
2015 2016 Change67.6% 65.8% (1.8)
0.0
57.9%
85.9%81.4%
88.8%
1.881.7%
40.0%
54.8%54.8%
41.8%
79.9%59.9%54.1%
86.1%
90.0%92.6% 0.3
4.2
56.7%
28
58.4% 46.4% (12.0)
LAUGHLIN, NEVADALAUGHLIN ROOM NIGHTS OCCUPIED
LAUGHLIN OCCUPANCY - MIDWEEK
LAUGHLIN OCCUPANCY - WEEKEND
2.5
0.84.60.3
85.8%
5.5
76.8%71.8%55.4%
85.1%91.6%59.8%
85.8%92.3%
72.1%

(State Route 163) PercentMonth 2015 ChangeJan rFeb rMar rApr rMayJunJul AugSep rOct r
Percent Nov rMonth 2015 2016 Change Dec rJan Total rFebMar SOURCE: Nevada Gaming Control BoardAprMayJunJul AugSepOct PercentNov Year ChangeDec 1990Average 1991
19921993199419951996199719981999
Enplaned and Deplaned Passengers 2000Percent 2001
Month 2015 2016 Change 2002 Jan 2003Feb 2004 Mar 2005Apr 2006May 2007Jun 2008Jul 2009Aug 2010Sep 2011Oct 2012Nov 2013Dec 2014Total 2015 r
2016SOURCE: Mojave County Airport Authority, Inc.
(13.7%)
213,310 210,666 (1.2%)(39.5%)
(9.5%)
559,948,000
21,226
21,258
19,42925,663
14,705 1.1%
(15.0%)21,814
14.6%15,493 12,656
9,198 5,56220,182
17,565
3.0%20,779
492,514,000
3.8%(3.6%)
40,982,000
17,395
11.0%4,603
13.0%
6.1%3.3%
$467,790,000
9.3%4,828
5.0%
4,464
(8.8%)1.0%
HISTORICAL LAUGHLIN GROSS GAMING REVENUE
539,822,000
594,787,000
490,664,000
16.3%9.5%
1.5%
$39,628,00043,009,000
41,170,000
35,132,00037,225,000
49,361,000
1.9%9.6%35,270,000
39,637,00038,645,000
$42,364,000
(3.9%)48,463,000
38,882,000
(1.6%)2.7%
37,408,000
4,148
0.1%630,533,000
507,534,000
17,345
8.3%
(0.9%)
15.1%
4.4%
0.2%7.7%
534,990,000
551,214,000
531,993,000
552,149,000
(2.6%)1.1%
0.3%
4,1444,340
4,583
631,196,00021,979
4,107
4,418
$398,322,0004,338
463,376,000
3,852
29
3.7%20,602 21,361
SOURCE: Nevada Department of Transportation - Traffic Section
LAUGHLIN/BULLHEAD CITY AIRPORT
464,713,000482,389,000
459,610,000
4,686
6.6%
RevenueGross Gaming
8.9%
3,977
7.7%7.0%
4,087
467,790,000
LAUGHLIN DAILY AUTO TRAFFIC
The following chart contains the traffic volume on State Route 163.
1.7%
42,821,000
LAUGHLIN GROSS GAMING REVENUE
The Nevada Department of Transportation records a continuous tabulation of daily traffic volume on Nevada State Route 163, 1/2 mile east of U.S.-95. This marketing tool can be utilized to study the automobile volume along a major highway that leads to the Laughlin area.
4,589
4,236
11.7%
2016
4,511
5,043
35,896,000
28,203,000
4,704
39,468,00040,249,000
30,922,0005.8%
4,303
6.9%0.8%
(1.8%)43,350,000
4,055
1.0%455,166,000 (1.5%)
(0.6%)462,061,000
13,705 15,703
14,666(2.8%)19.8%
20,635
(18.3%)
14,543 570,978,000
(3.7%)
545,215,0005.3%
621,183,00013.1%
(2.1%)
20,512 (3.5%)
6.4%
472,430,000 1.0%
SOURCE: Las Vegas Convention and Visitors Authority
1.8%
4,907
4,225
LAUGHLIN, NEVADA
1.9%
515,847,000
482,348,000491,385,000
(3.6%)(4.9%)(1.7%)
$472,430,000
38,017,00036,063,000
Daily Traffic
4,884 5,130(2.7%)
38,055,000Average
4,298

(State Route 163)Occupancy Room Percent
Year Percentage Inventory Year Change
r
r
r = Revised
Laughlin Occupancy Laughlin Average Daily Auto Traffic
HISTORICAL LAUGHLIN HOTEL/MOTEL ROOM INVENTORY & OCCUPANCY
NOTE: Hoover Dam bypass bridge opened in October 2010
NOTE: Data not available prior to 1993
HISTORICAL LAUGHLIN AVERAGE DAILY AUTO TRAFFIC
1994
10,49489.2%
5,244
1994
10,7372005
10,817
N/A
19921993
9,05410,290
91.1%90.8%
7,1801990 91.4%
TotalVehicles
4,36789.6%
1993
4,836
87.1%86.4%
82.9%1997
1991 8,098
1995
1998
1996
10,912
4.9%
8.4%
10,743
10,811
10,884
10,817
2001
2006
2003
(3.0%)4,819
6,541
(1.2%)7,053
2002
(2.5%)
8.8%16.1%
4,7334,611
11,034
11,035
20001999
(8.9%)
6,088
7.0%7.8%
0.1%71.8% 10,696
2012 4,097 (4.4%)
85.9%
81.7%79.4% 2007 6,797
6,969
86.3%20052004
(0.0%)
4,286 (30.9%)6,199
1.4%4,053 (1.1%)2013
LAUGHLIN, NEVADA
2009
19961997 4,883
(1.2%)
1.0%
1995 (2.6%)
2.9%
6,193
5,025
74.2%78.0%
19984,96511,035
85.3%
0.4%
2008
1999
59.6% 10,333
88.4%
83.0%
200710,660
10,65210,3502010 63.7%
63.3%69.0% 10,655
2014 4,109
2000
63.0% 10,334
6,192
6,11310,8422001200220032004
2011
2008
2009
20112010
2006
2015 61.4% 10,021
2015 4,298 4.6%
30
2012 59.0% 10,333
SOURCE: Las Vegas Convention and Visitors Authority
2014 60.7% 10,268
SOURCE: State of Nevada Department of Transportation - Traffic Section
2013
2016 62.8% 9,920
2016 4,583 6.6%
0
1,000
2,000
3,000
4,000
5,000
6,000
7,000
0%
10%
20%
30%
40%
50%
60%
70%
80%
90%
100%
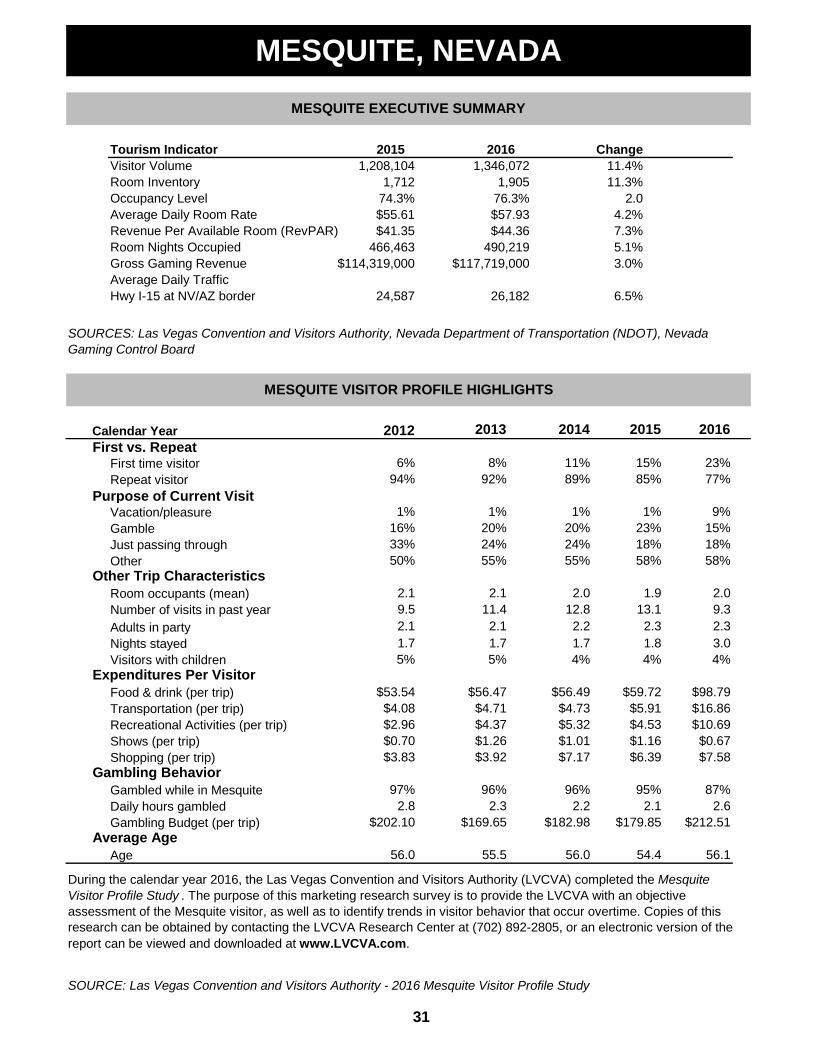
Tourism Indicator 2015 2016Visitor VolumeRoom InventoryOccupancy Level Average Daily Room Rate Revenue Per Available Room (RevPAR) Room Nights OccupiedGross Gaming Revenue Average Daily TrafficHwy I-15 at NV/AZ border
Calendar YearFirst vs. Repeat
First time visitorRepeat visitor
Purpose of Current VisitVacation/pleasureGambleJust passing throughOther
Other Trip CharacteristicsRoom occupants (mean)Number of visits in past yearAdults in partyNights stayedVisitors with children
Expenditures Per VisitorFood & drink (per trip)Transportation (per trip)Recreational Activities (per trip)Shows (per trip)Shopping (per trip)
Gambling BehaviorGambled while in MesquiteDaily hours gambledGambling Budget (per trip)
Average Age Age
SOURCE: Las Vegas Convention and Visitors Authority - 2016 Mesquite Visitor Profile Study
11.4%11.3%
2.04.2%7.3%5.1%3.0%
6.5%
Change
$41.35 $44.36
MESQUITE EXECUTIVE SUMMARY
SOURCES: Las Vegas Convention and Visitors Authority, Nevada Department of Transportation (NDOT), Nevada Gaming Control Board
50%
2.1
6%
18%58%
2.0
94%
1%16%33%
MESQUITE VISITOR PROFILE HIGHLIGHTS
2012
1,208,104 1,346,0721,9051,712
24,587 26,182
2016
23%77%
9%15%
$16.86
55%24%
1.9
18%
74.3%$55.61
466,463 490,219
76.3%$57.93
55%
2014
24%
2.0
58%
$98.79
9.32.32.1 2.2
$117,719,000
$1.01
5%
$59.72
1.84%
$5.91$4.53
1.7
$4.71
15%
13.112.82.3
$6.39 $7.58
11.4
31
MESQUITE, NEVADA
2.2
55.5
96%2.3
$202.10
56.0 56.0
$169.65
1.74%
$56.49$4.73$5.32
85%
5%
$10.69$0.67
3.04%
$114,319,000
$2.96 $4.37$0.70
9.5
$4.08$53.54
92%
20%
$1.26
$56.47
2015
89%
$1.16
8%
2013
1%23%
1%
2.1
11%
1%20%
$3.83 $3.92 $7.17
During the calendar year 2016, the Las Vegas Convention and Visitors Authority (LVCVA) completed the Mesquite Visitor Profile Study . The purpose of this marketing research survey is to provide the LVCVA with an objective assessment of the Mesquite visitor, as well as to identify trends in visitor behavior that occur overtime. Copies of this research can be obtained by contacting the LVCVA Research Center at (702) 892-2805, or an electronic version of the report can be viewed and downloaded at www.LVCVA.com.
$182.98
96%2.8
54.4
95%2.1
$179.85
56.1
$212.51
87%2.6
97%
2.11.7

Percent (I-15 at NV/AZ border)Month ChangeJanFebMarAprMayJunJul PercentAug Month ChangeSep JanOct FebNov MarDec AprTotal May
Jun Jul Visitor Volume Aug
SepOctNovDecAverage
PercentMonth 2015 2016 ChangeJanFeb
Percent MarMonth Change AprJan May Feb JunMar Jul Apr AugMay SepJun OctJul NovAug Dec rSep TotalOctNov SOURCE: Nevada Gaming Control BoardDecTotal
SOURCE: Las Vegas Convention and Visitors Authority
3.3%
466,463
37,464
44,79433,472
38,289
490,219
36,510
42,104
5.1%
5.9%
36,67641,300
39,83432,244
47,716
1.8%
12.4%
37,61729,773 8.3%
9.1%6.5%
20162015
8,451,000
6.5%
5.0%
8,078,000
1.8%
28,743
24,673
10,241,000
24,758
26,531
26,182
8,260,000 4.4%
11,051,000
4.9%30,159
3.3%
6.6%
9,668,000
27,544
$10,653,000
131,023
77,111 88,538
2016
97,028
1,208,104 1,346,072
115,611113,405100,708
109,377
2015
97,426
2015
122,79396,810
2016105,070
109,691 113,231
MESQUITE VISITOR VOLUME
116,01486,689 15.6%
7.1%
9.5%113,976
98,123
8.0%
14.2%8.7%
100,252
3.2%19.2%
99,16693,277
133,487110,561
8.6%11.2%
9,943,000
$10,463,000
8,077,000
10,011,000
3.3%
9,706,000
8,353,0002.5%
7.9%10,636,000
8,821,000
SOURCE: State of Nevada Department of Transportation - Traffic Section
22,02227,77522,746
7.5%
26,805
124,809
12.9%
14.4%
38,26537,380 7.7%40,265
14.8%
26,68924,739
42,35345,454
47,41244,008
48,614
8,141,000(2.6%)41,237
37,886
22,945
1.0%
25,830
MESQUITE ROOM NIGHTS OCCUPIED
11.4%
MESQUITE, NEVADAMESQUITE DAILY AUTO TRAFFIC
MESQUITE GAMING REVENUE
36,015
10,394,00011,463,000
24,587
26,724
23,624
22,432
The State of Nevada Department of Transportation records a continuous tabulation of daily traffic volume on Nevada State Route I-15 at NV/AZ border. This marketing tool is used to measure trends in automobile volume headed into the Mesquite area.
Daily Traffic
10.9%25,491
28,008
20,863
1.5%7.2%
Average
25,04312.3%
7,913,000
25,114
7.9%
32
4.9%
1.2%
(1.5%)
23,707
$117,719,000
7.9%(2.8%)
1.9%6.1%
4.3%
8.4%(0.0%)
3.0%
26,259
$114,319,000
10,024,000
11,296,000
9,886,0009,600,000
10,909,000
0
20,000
40,000
60,000
80,000
100,000
120,000
140,000
Jan Feb Mar Apr May Jun Jul Aug Sep Oct Nov Dec
2015 2016

Rank Date Change Month1 Mar 25-26 Jan2 Mar 11-12 Feb3 Feb 19-20 Mar4 Apr 8-9 Apr5 May 22-24 May6 Apr 1-2 Jun7 Mar 4-5 Jul 8 Feb 12-14 Aug9 Mar 18-19 Sep10 Oct 14-15 Oct11 May 20-22 Nov12 Oct 21-22 Dec13 Apr 15-16 Average14 Oct 7-815 Apr 22-2316 Feb 26-2717 Sep 30-Oct 118 May 6-719 Oct 28-29 Month20 Sep 16-17 Jan21 Nov 11-12 Feb22 Jun 10-11 Mar23 Sep 23-24 Apr24 Jan 29-30 May25 Jan 15-16 Jun26 Jul 22-23 Jul 27 Jun 3-4 Aug28 Jul 15-16 Sep29 Nov 24-26 Oct30 Apr 29-30 Nov31 May 27-28 Dec32 Jun 17-18 Average33 Jun 24-2534 Jan 8-935 Sep 2-436 Aug 5-637 Aug 12-1338 Dec 30-Jan 1 Month39 Jan 22-23 Jan40 Jul 8-9 Feb41 Jul 29-30 Mar42 Jan 1-2 Apr43 Feb 5-6 May44 Nov 4-5 Jun45 May 13-14 Jul 46 Aug 19-20 Aug47 Aug 26-27 Sep48 Sep 9-10 Oct49 Dec 2-3 Nov50 Nov 18-19 Dec51 Dec 9-10 Average52 Dec 16-1753 Dec 23-25
NetNet
Percent
Percent
$41.35 $44.36 7.3%
60.4% 46.9% (13.5)53.0%
(19.1)0.277.4%
70.4% 2.4
97.7%
(4.7)(15.1)
72.8%
61.5%68.1%
(22.5)72.0%
56.8%
72.8% 0.83.8
$54.69$49.84
7.3%2016
76.3%
4.2%6.8%
$56.20
1.6%
MESQUITE ADR
(0.9%)
9.7%5.1%$53.64
1.6%
$58.31
(5.4%)
(0.0%)
$51.02
85.7%86.4%90.3%96.4%
91.4%91.3%
92.1%
$55.31
82.0% 87.0%87.1%
84.4%97.3%83.5%97.2%
87.7%81.8%79.5%
92.9%81.3%91.4%89.9%76.3%
95.2%
96.7%94.6%92.4%89.8%88.4%
98.8%98.3%98.9%97.0%
88.4%
83.0%85.5%91.4%
3.54.088.5%
(1.0)82.8% 9.6
88.1%84.5%
81.1%
73.2%78.7% 77.7%
91.6%
$58.11
98.5%
2015
$60.65
2.0
6.4
84.4%83.5%
(2.2)
80.0%
88.3%87.4%
12.29.23.2
86.2%
92.4%92.5%
93.7%93.5%93.2%
0.6
(3.2)(1.4)
(4.4)
2.7
95.2%
90.7%90.3%
92.4%
93.0%
(1.9)(0.5)12.8
90.2%89.5%89.4%89.1%
87.4%
(5.7)(2.6)
(1.3)(4.8)
4.04.06.45.01.0
MESQUITE OCCUPANCY
69.7%
74.3%
2015
(3.9)84.7%
$57.08$58.21 $61.88
(2.1%)
$53.91 $64.406.3%
(1.5)
$61.60
Change$62.34
94.7%94.6%93.9%
2016 Change
76.9%1.74.2
72.1%70.4%
6.21.768.1% 69.8%
73.5%56.1% 54.6%
(3.8)
71.8%
72.4% 78.6%
80.8%
97.0%96.7%95.5%
65.4%(1.5)
97.2% (1.6)(1.3)
98.0%97.9%97.5%
92.5%96.9%98.9%
MESQUITE WEEKEND OCCUPANCY RANKING
98.7%98.3%98.0%
201595.9%
2016
99.0%97.3%
2.8(0.7)0.75.51.0
(1.4)
71.0%93.5%
77.6%
88.4%89.1%
69.0%72.8%
2.3(11.0)
2.7
5.0
28.1
(11.0)12.5(3.3)
86.3%
5.6(2.1)
86.8%84.4%
71.9%
59.3%81.8%89.2%
$35.49
$45.89
$46.64$40.91
86.7%
$36.94
MESQUITE- RevPAR
2015 2016
(3.4%)$54.76$58.99
$44.35
$49.96
11.3%
7.1%
8.8
Change9.9%$44.95
$35.2478.6%
$36.48
$47.49$49.19
8.9
1.46.6
$51.01$55.61
$54.47$57.93
$62.12
$51.75 $48.97$53.76$62.11
SOURCE: Las Vegas Convention and Visitors Authority
33
MESQUITE, NEVADA
(3.6%)3.9%
$52.62 (4.6%)$50.18$40.65$28.62 $29.74
$39.17
$38.60 8.8%
24.1%$45.28
$34.18 (3.0%)14.1%$42.16
19.5%
$54.26
24.2%86.2%

Total Percent Occupancy RoomYear Visitor Volume Change Year Percentage Inventory
(I-15 at NV/AZ border) Gross Gaming PercentPercent Year Revenue Change
Year Change
e
r
2012 21,437 (1.6%)2012 117,513,000 0.5%
19,925 6.3%101,850,0002001
2011 21,793
3.9%
23,680 (1.1%)
21,961
20062005 23,585
21,511
200521,837
2010 115,774,000
HISTORICAL MESQUITE VISITOR VOLUME
2007
1999 N/A*
(10.5%)
109,149,000
82.5%
1,450,314
(1.4%)2011 981,5412010 995,120
2008
(2.6%)
2002
(9.4%)
86.1%7.4%1,691,779
2009
1,722,193
20022003
1,577,583
1,574,872
20002001 1,616,672
2006
2.7%
(8.4%)
2004
2.5%
1.8%
2004
HISTORICAL MESQUITE HOTEL/MOTEL ROOM INVENTORY & OCCUPANCY
2000 2,9012001 2,712
2003 2,894
79.0%3,11381.5%
80.4%
1999
2,783
2,67186.6%
2002 82.7%
76.3%
1,79083.3%1,076,162
2012
2015
20132014
2012 72.8%
1,736
996,146 1.5%69.6%
2007
22,016
2004
(12.0%)143,961,000
2009
1,208,104 4.1% 2015 74.3%
1,745
1,712
1,011,245 1.5% 2013 1,7361,160,745 14.8%
80.2%
2014 72.3%
1,346,072 11.4% 2016
1,574,380
(7.0%)
1,601,9371,620,804
23,942
Vehicles N/A*
(25.8%)
HISTORICAL MESQUITE GAMING REVENUE
2010
0.1%
1,76778.4%
22,692
2005
1,7632011
2008 78.3%
18,740
(11.0%)11.5%
116,955,000
2008
(3.6%)1.0%
120,103,000(0.2%)
2011
(7.5%)
2003
3.3%6.0%
2005
9.2%
2,729
1.5%
N/A*
122,474,000
159,876,00016.6%
2.4%2006
1,981
96,043,0001999 $92,936,000
2,682
1,905
34
3.9%1.5%
(16.6%)
r = Revised
NOTE: Data not available prior to 1999
SOURCE: State of Nevada Department of Transportation - Traffic Section
NOTE: Data not available prior to 1999
e-estimate as partial NDOT data unavailable 3 months in 2007
SOURCE: Nevada Gaming Control Board
2010 19,538
2013(3.7%)
200920082009
2014 113,025,000 (0.1%)1.3%
MESQUITE, NEVADA
1999
2003
1,737,785
1.2%
2004
8.0%20022001
18,7142000
85.1%83.5%2006
2007
Total
HISTORICAL MESQUITE DAILY AUTO TRAFFIC
7.2%
142,823,000
2.8%112,165,000
2016
* NOTE: Data not available prior to 1999
2,683
2016 26,182 6.5%2016 117,719,000 3.0%
SOURCE: Las Vegas Convention and Visitors Authority
SOURCE: Las Vegas Convention and Visitors Authority
2015 24,587 7.8%2015 114,319,000 1.1%
163,661,00011.9%
113,123,000
2000
2014
2007
22,80622,506 5.0%
2013

Executive Summary of Clark County Visitor Statistics Monthly
Marketing Bulletin Semiannually
Visitor Profile Study Annually
Clark County Residents Study Biennially
Construction Bulletin 2-3 Times/Year (as needed)
35
This publication provides insight into the gaming/entertainment behaviors and attitudes of Clark County residents. Data is collected through telephone interviews and published every two years.
LVCVA PUBLICATIONS
This document tracks new hotel/motel room construction for Clark County. The project name, number of rooms and completion date are listed with subtotals by year. A list of proposed hotel/motel projects is included as well.
LVCVA TOURISM STATISTICS
Many of the statistics and reports listed below can be viewed and downloaded from the Las Vegas Convention and Visitor Authority's website at www.LVCVA.com .
The Marketing Bulletin is the published format of the Clark County Visitor Statistics. It contains all of the data found in the monthly reports as well as additional information such as room tax revenue, hotel/gaming employment and convention center statistics. The publication also contains an in-depth study of hotel and motel occupancy in Las Vegas, Laughlin and Mesquite. A historical review of many of the key tourism statistics is also included which provides an excellent source to summarize the growth rate of Clark County tourism. Marketing Bulletins are published twice per year and contain year-to-date information so that the second issue serves as a year-end summary.
The LVCVA publishes statistics for Las Vegas, Laughlin and Mesquite that include visitor volume, convention attendance, occupancy levels, room inventory, gaming revenues, airline passengers and automobile traffic. Requestors of this data receive the Executive Summary, a report with both current month and year-to-date data for the current and prior year.
A source for demographic and behavioral data on visitors, the study presents the findings of visitor interviews conducted throughout the calendar year (January 1- December 31). Sections include reasons for visiting, travel planning, trip characteristics and expenditures, gaming behavior and budgets, entertainment, attitudinal information and visitor demographics. Separate reports are available for Las Vegas, Laughlin and Mesquite.

702-895-1135unlv.edu/igi
36
Billed as the "global intellectual capital of gaming", The UNLV International Gaming Institute (IGI) provides gaming research and programs to more than 50 jurisdictions across the globe.
Has many valuable online resources, including a guide for media and entertainment professionals, an online thesis/dissertation group for graduate researchers, a reading room with topical articles on gaming issues, a message board and a sizable links page.
UNLV INTERNATIONAL GAMING INSTITUTE4505 S Maryland PkwyBox 456037Las Vegas, NV 89154-6037
Distributes information on traffic volume for all highways and interstates throughout Nevada.
UNLV CENTER FOR BUSINESS & ECONOMIC RESEARCH (CBER)4505 S. Maryland Pkwy
gaming.unlv.edu
Box 456002Las Vegas, NV 89154-6002702-895-3191cber.unlv.eduCBER was established to aid businesses and agencies by providing information that encompasses aspects of the business community, including private, commercial and residential development; public transportation; and communication systems.
UNLV CENTER FOR GAMING RESEARCH4505 S. Maryland PkwyBox 457010Las Vegas, NV 89154-7010702-895-2242
CLARK COUNTY COMPREHENSIVE PLANNING
Maintains information pertaining to Clark County such as population, resident demographics, housing and land-use guides.
The LVGEA is a public-private partnership focused on growing the economy in Southern Nevada through community development and business recruitment, retention and outreach.
MCCARRAN INTERNATIONAL AIRPORT PO Box 11005Las Vegas, NV 89111-1005
The state agency responsible for collecting and distributing gaming revenue information. Monthly, quarterly and annual reports are available. In addition, booklets regarding gaming regulations, the U.S. gaming industry and the Nevada Gaming Control Act are available.
gaming.nv.gov
NEVADA GAMING CONTROL BOARD555 E. Washington AveSte 2600Las Vegas, NV 89101Las Vegas: 702-486-2000Carson City: 775-684-7700
Distributes information on Nevada employment statistics, such as labor force estimates, wage surveys and employment guides.
NEVADA DEPT. OF EMPLOYMENT, TRAINING & REHABILITATION2800 E. St. Louis Ave Las Vegas, NV 89104702-486-7923nevadaworkforce.com
702-261-5100mccarran.comCollects information on airline passengers, average daily flights, air seats and other statistics regarding scheduled, charter and commuter air traffic at Clark County airports.
Las Vegas, NV 89118702-791-0000lvgea.org
accessclarkcounty.com
6795 Edmont StreetSte 260
LAS VEGAS GLOBAL ECONOMIC ALLIANCE (LVGEA)
500 South Grand Central PkwySte 3012Las Vegas, NV 89155702-455-4314
INFORMATION SOURCES
NEVADA DEPARTMENT OF TRANSPORTATION123 E. Washington AveLas Vegas, NV 89101702-385-6500nevadadot.com
Related Documents