www.smec.com Yarralumla Equestrian Park Offset Golden Sun Moth Monitoring 2016 Prepared for: ACT Government Land Development Agency Reference No: 3002461 02/06/2017

Welcome message from author
This document is posted to help you gain knowledge. Please leave a comment to let me know what you think about it! Share it to your friends and learn new things together.
Transcript

www.smec.com
Yarralumla Equestrian Park Offset Golden Sun Moth Monitoring 2016
Prepared for: ACT Government Land Development Agency Reference No: 3002461
02/06/2017

Document/Report Control Form
Report for
Golden Sun Moth Monitoring 2016 | Yarralumla Equestrian Park Offset | ACT Government Land Development
Agency | 3002461
SMEC Australia
Document/Report Control Form
File Location Name: X:\PROJECT\3002461 LDA YEP Monitoring\2016\Report\Yarralumla Equestrian Park Offset Report 2016 Final Draft.docx
Project Name: Yarralumla Equestrian Park Offset Golden Sun Moth Monitoring 2016
Project Number: 3002461
Revision Number: 0
Revision History Revision # Date Prepared by Reviewed by Approved for Issue by
0 29/05/2017 Mark Allen Natasha Crook
Robert Jessop David Moore
1 02/06/2017 Mark Allen
Natasha Crook
Robert Jessop David Moore
Issue Register Distribution List Date Issued Number of Copies
ACT Government Land Development Agency 02/06/2017 Electronic
SMEC Project File
SMEC Company Details Daniel Spackman
Suite 2, Level 1 243 Northbourne Avenue Lyneham ACT 2602
Tel: (02) 6234 1977 Fax:
Email: [email protected] Website: www.smec.com
The information within this document is and shall remain the property of: SMEC Australia.
Report for
Golden Sun Moth Monitoring 2016 | Yarralumla Equestrian Park Offset | ACT Government Land Development
Agency | 3002461
SMEC Australia | Page i
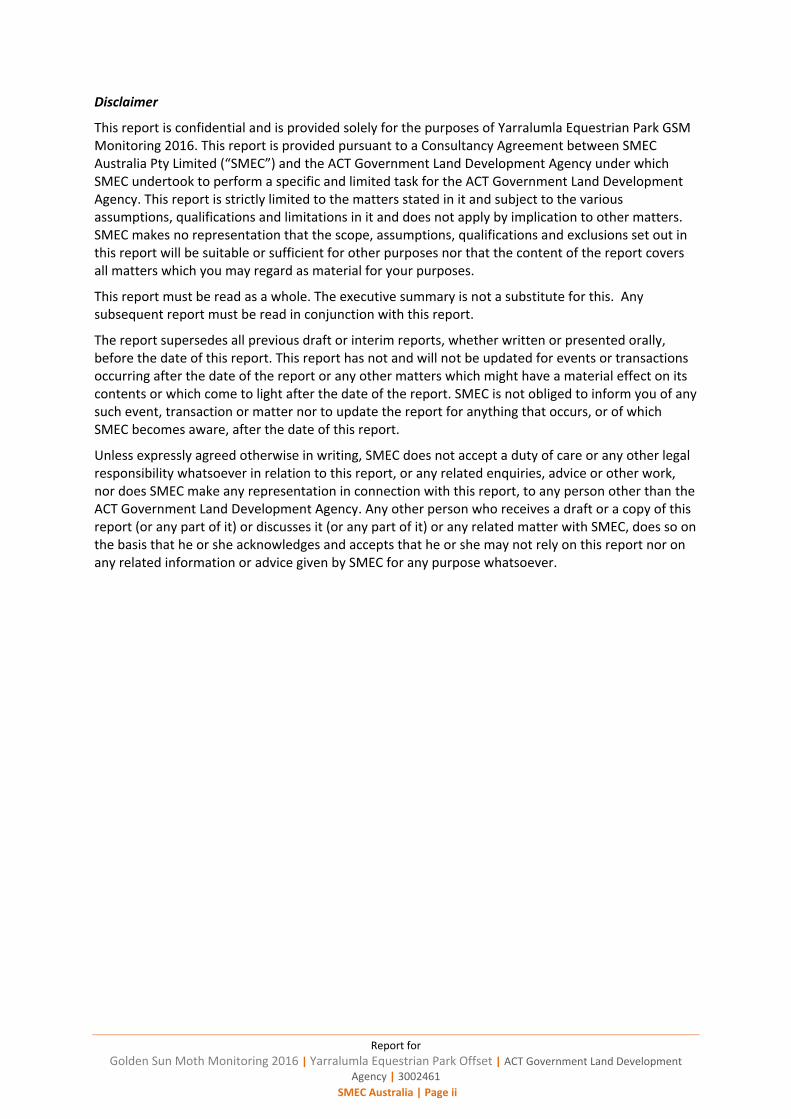
Executive Summary
SMEC Australia Pty Ltd prepared this monitoring report on behalf of the ACT Government Land Development Agency to meet the 2017 annual reporting requirements of the Yarralumla Equestrian Park Offset Management Plan (RJPL 2014a, the OMP). The year 3 GSM, vegetation condition and GSM habitat condition surveys were conducted in 2016 in accordance with the OMP.
Data is provided in summarised form suitable for incorporation into future trend analysis. All survey data is presented in Appendices A and B. Meteorological data obtained for Canberra Airport from the Bureau of Meteorology is summarised in Appendices C and D.
This report presents the findings of the GSM flying moth, vegetation condition and GSM habitat condition surveys conducted in 2016 in accordance with the Yarralumla Equestrian Park Offset Management Plan (RJPL 2014a, the OMP).
Data is provided in summarised form suitable for incorporation into future trend analysis. All survey data is presented in Appendices A and B. Meteorological data obtained for Canberra Airport from the Bureau of Meteorology is summarised in Appendices C and D.
The key results are:
Overall changes to vegetation mapping were minor since the 2015 survey, except for the small increase (i.e. ~0.3 ha), in Chilean needle grass distribution and the substantial expansion of African lovegrass
GSM habitat quality mapping remained consistent since the 2015 survey
Grassland quality and GSM habitat quality assessed at each of the monitoring quadrats was consistent or higher than in previous years; this is likely to be due to the seasonal conditions and timing of the assessments
GSM flying activity at YEP was the highest on record and confirm that GSM widespread. Variation in flying moth activity between years is within that expected due to the highly variable nature of GSM flying activity
In all survey years, male moths were observed flying in areas not considered in the OMP to meet criteria for classification as GSM habitat; future surveys may consider what grass species GSM may be using in these areas
Meteorological data for 2013 to 2016 was reviewed in relation to the survey results; however, trends could not be determined from just four years of data
No GSM pupa cases were observed throughout YEP
Sixteen female GSM were observed at YEP during the 2016 surveys.
This report confirms that the GSM population is widespread throughout the YEP and that moths are co-existing with current site management practices and equestrian activities. The GSM population continues to be relatively stable and is not showing any decline; however, it is not possible to make any statements relating to long-term GSM population trends from just four years of monitoring data.
Based on the observed expansion of Chilean needlegrass and African lovegrass within YEP, it is recommended that current weed management practices be reviewed to ensure that future degradation of natural temperate grassland and GSM habitat due to weed invasion is avoided.
This report fulfils the reporting requirements for GSM monitoring at the YEP for year 3 as specified in the OMP (RJPL 2014a).
Report for
Golden Sun Moth Monitoring 2016 | Yarralumla Equestrian Park Offset | ACT Government Land Development
Agency | 3002461
SMEC Australia | Page ii
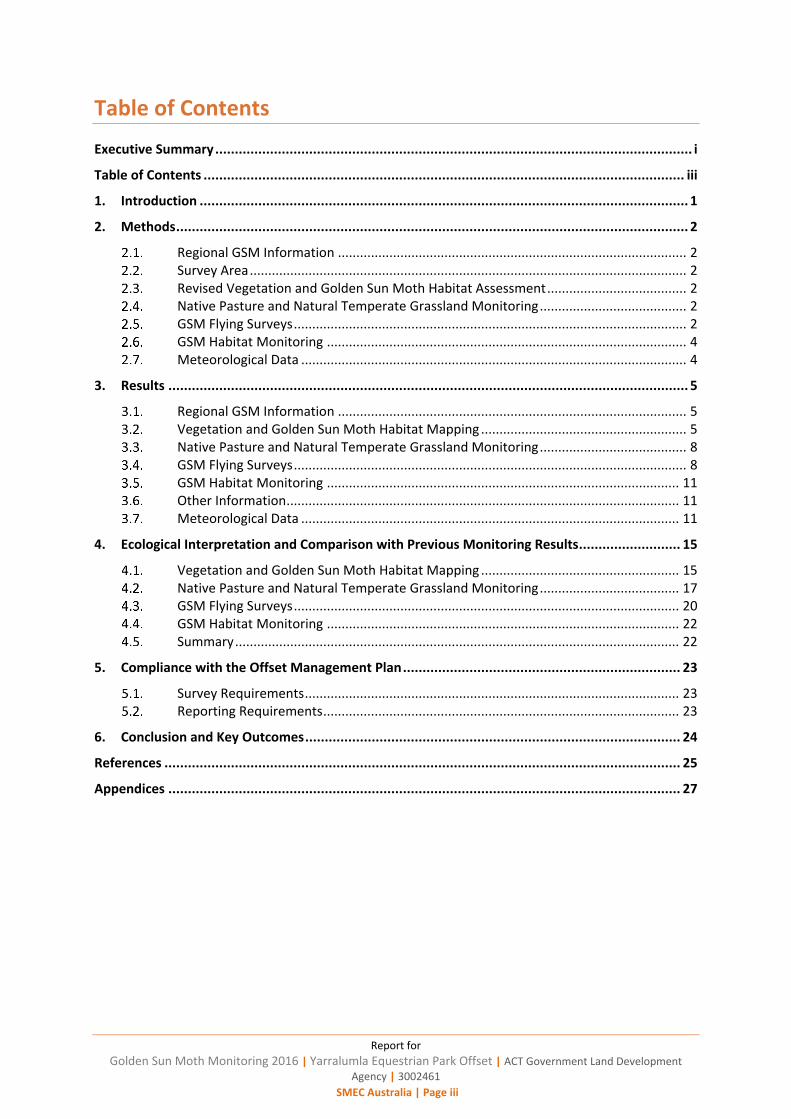
Disclaimer
This report is confidential and is provided solely for the purposes of Yarralumla Equestrian Park GSM Monitoring 2016. This report is provided pursuant to a Consultancy Agreement between SMEC Australia Pty Limited (“SMEC”) and the ACT Government Land Development Agency under which SMEC undertook to perform a specific and limited task for the ACT Government Land Development Agency. This report is strictly limited to the matters stated in it and subject to the various assumptions, qualifications and limitations in it and does not apply by implication to other matters. SMEC makes no representation that the scope, assumptions, qualifications and exclusions set out in this report will be suitable or sufficient for other purposes nor that the content of the report covers all matters which you may regard as material for your purposes.
This report must be read as a whole. The executive summary is not a substitute for this. Any subsequent report must be read in conjunction with this report.
The report supersedes all previous draft or interim reports, whether written or presented orally, before the date of this report. This report has not and will not be updated for events or transactions occurring after the date of the report or any other matters which might have a material effect on its contents or which come to light after the date of the report. SMEC is not obliged to inform you of any such event, transaction or matter nor to update the report for anything that occurs, or of which SMEC becomes aware, after the date of this report.
Unless expressly agreed otherwise in writing, SMEC does not accept a duty of care or any other legal responsibility whatsoever in relation to this report, or any related enquiries, advice or other work, nor does SMEC make any representation in connection with this report, to any person other than the ACT Government Land Development Agency. Any other person who receives a draft or a copy of this report (or any part of it) or discusses it (or any part of it) or any related matter with SMEC, does so on the basis that he or she acknowledges and accepts that he or she may not rely on this report nor on any related information or advice given by SMEC for any purpose whatsoever.
Report for
Golden Sun Moth Monitoring 2016 | Yarralumla Equestrian Park Offset | ACT Government Land Development
Agency | 3002461
SMEC Australia | Page iii
Table of Contents
Executive Summary .......................................................................................................................... i
Table of Contents ........................................................................................................................... iii
1. Introduction ............................................................................................................................. 1
2. Methods ................................................................................................................................... 2
Regional GSM Information ............................................................................................... 2 Survey Area ....................................................................................................................... 2 Revised Vegetation and Golden Sun Moth Habitat Assessment ...................................... 2 Native Pasture and Natural Temperate Grassland Monitoring ........................................ 2 GSM Flying Surveys ........................................................................................................... 2 GSM Habitat Monitoring .................................................................................................. 4 Meteorological Data ......................................................................................................... 4
3. Results ..................................................................................................................................... 5
Regional GSM Information ............................................................................................... 5 Vegetation and Golden Sun Moth Habitat Mapping ........................................................ 5 Native Pasture and Natural Temperate Grassland Monitoring ........................................ 8 GSM Flying Surveys ........................................................................................................... 8 GSM Habitat Monitoring ................................................................................................ 11 Other Information ........................................................................................................... 11 Meteorological Data ....................................................................................................... 11
4. Ecological Interpretation and Comparison with Previous Monitoring Results .......................... 15
Vegetation and Golden Sun Moth Habitat Mapping ...................................................... 15 Native Pasture and Natural Temperate Grassland Monitoring ...................................... 17 GSM Flying Surveys ......................................................................................................... 20 GSM Habitat Monitoring ................................................................................................ 22 Summary ......................................................................................................................... 22
5. Compliance with the Offset Management Plan ....................................................................... 23
Survey Requirements ...................................................................................................... 23 Reporting Requirements ................................................................................................. 23
6. Conclusion and Key Outcomes ................................................................................................ 24
References .................................................................................................................................... 25
Appendices ................................................................................................................................... 27

Report for
Golden Sun Moth Monitoring 2016 | Yarralumla Equestrian Park Offset | ACT Government Land Development
Agency | 3002461
SMEC Australia | Page iv
Table of Figures
Figure 1. Yarralumla Equestrian Park offset survey area and survey details. .................................... 3 Figure 2. Distribution of vegetation communities at Yarralumla Equestrian Park. ............................ 6 Figure 3. Distribution of potential Golden Sun Moth habitat in Yarralumla Equestrian Park (2016). . 7 Figure 4. Distribution of Golden Sun Moth records in Yarralumla Equestrian Park in 2016. ............ 10 Figure 5. Monthly rainfall and average daily maximum and minimum air temperatures. ............... 12 Figure 6. Monthly average daily maximum and minimum soil temperature (10 cm) depth at Canberra airport. ........................................................................................................................... 13 Figure 7. Maximum daily soil temperature and daily rainfall at Canberra Airport during the GSM flying period. ................................................................................................................................. 14 Figure 8. Golden Sun Moth distribution in relation to potential habitat at Yarralumla Equestrian Park. ............................................................................................................................................. 16 Figure 9. Floristic value score for each quadrat (2013 to 2016). ...................................................... 17 Figure 10. Significant weed species numbers in each quadrat (2013 to 2016)................................. 19 Figure 11. GSM traverse survey results (2013-2016). ..................................................................... 20 Figure 12. Average rotational point count observations in each quadrat (2013-2016). ................... 21 Figure 13. GSM habitat scores for each quadrat (2013 to 2016). .................................................... 22
List of Tables
Table 1. Revised vegetation and land use mapping compared with 2013 and 2015. ......................... 5 Table 2. Revised 2016 GSM habitat areas compared with 2013 to 2016. .......................................... 5 Table 3. Vegetation survey results for 2016. .................................................................................... 8 Table 4. Site conditions during flying moth surveys in 2016. ............................................................ 8 Table 5. Summary of flying GSM observations – Transects............................................................... 9 Table 6. Summary of rotational point count survey observations for 2016. ..................................... 9 Table 7. Summary of grassland and GSM habitat condition assessment (2013 to 2016). ................ 18 Table 8. Summary of traverse data averaged by year. ................................................................... 20 Table 9. Summary of rotational point counts averaged by year. .................................................... 21
Appendices
Vegetation and Habitat Survey 2016
Flying GSM Survey 2016 – Point Survey, GSM Per Quadrat
Complete List of GSM Observations 2016
Summarised Meteorological Data 2013-2016
Detailed Meteorological Data During the GSM Flying Period

Report for
Golden Sun Moth Monitoring 2016 | Yarralumla Equestrian Park Offset | ACT Government Land Development Agency
| 3002461
SMEC Australia | Page 1
1. Introduction
SMEC Australia Pty Ltd prepared this monitoring report on behalf of the ACT Government Land Development Agency (LDA) to meet the 2017 annual reporting requirements of the Yarralumla Equestrian Park Offset Management Plan (RJPL 2014a, the OMP). The OMP was prepared to meet specific offset requirements of the Commonwealth Department of Environment and Energy (DoEE) EPBC Act approval decision (EPBC 2012/2692) for mixed-use development proposed for Campbell Section 5, Constitution Avenue, ACT. The OMP details the requirement for ongoing monitoring of natural temperate grassland (NTG) and golden sun moth (Synemon plana, GSM) populations at the Yarralumla Equestrian Park (YEP) offset area (RJPL 2014a).
This report presents the results of year 3 monitoring surveys undertaken in spring and summer 2016 in the YEP offset area. As this report presents the fourth year of data collected according to the monitoring protocol specified in the OMP, detailed assessment and analysis of trends at the site can be undertaken with caution. The results are briefly assessed in relation to existing site information and the baseline year (i.e. year 0), year 1 and year 2 monitoring data collected in spring and summer 2013 to 2015 (RJPL 2014b; RJPL 2015; SMEC 2016).
Report for
Golden Sun Moth Monitoring 2016 | Yarralumla Equestrian Park Offset | ACT Government Land Development Agency
| 3002461
SMEC Australia | Page 2
2. Methods
Regional GSM Information
ACT researchers and consultants shared information regarding the timing and location of GSM sightings, particularly the start of the flying season, via email on a weekly basis during the GSM flying season.
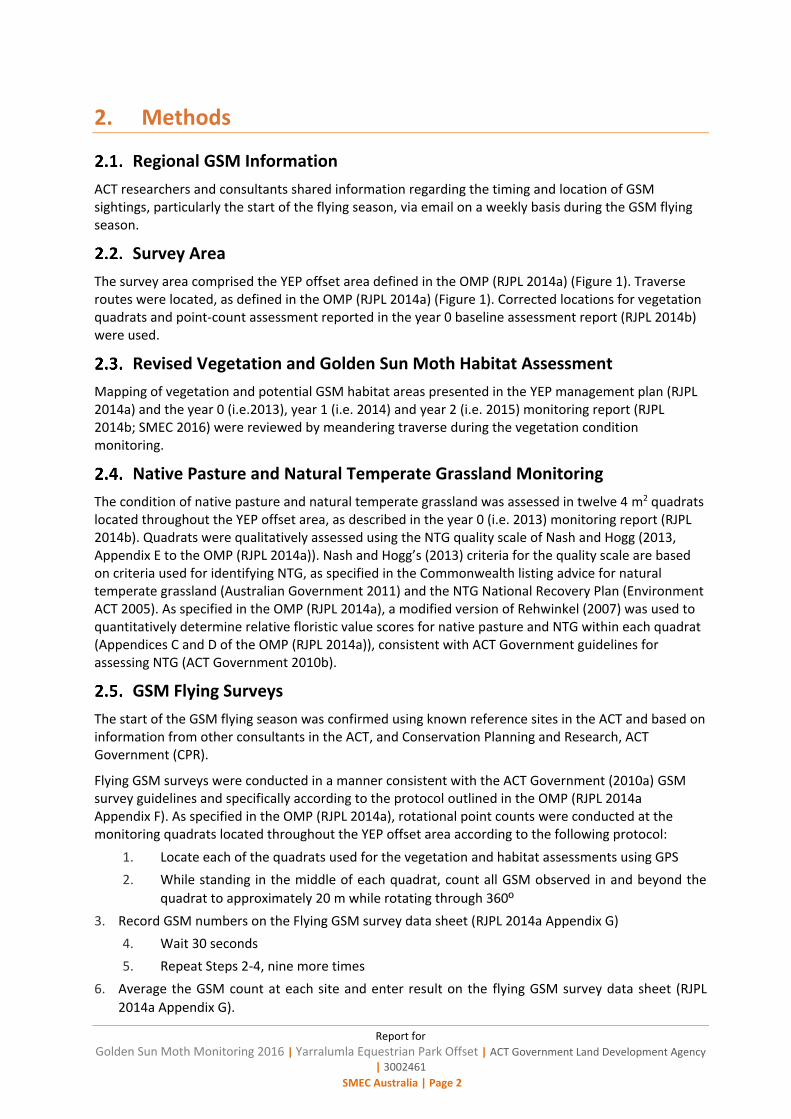
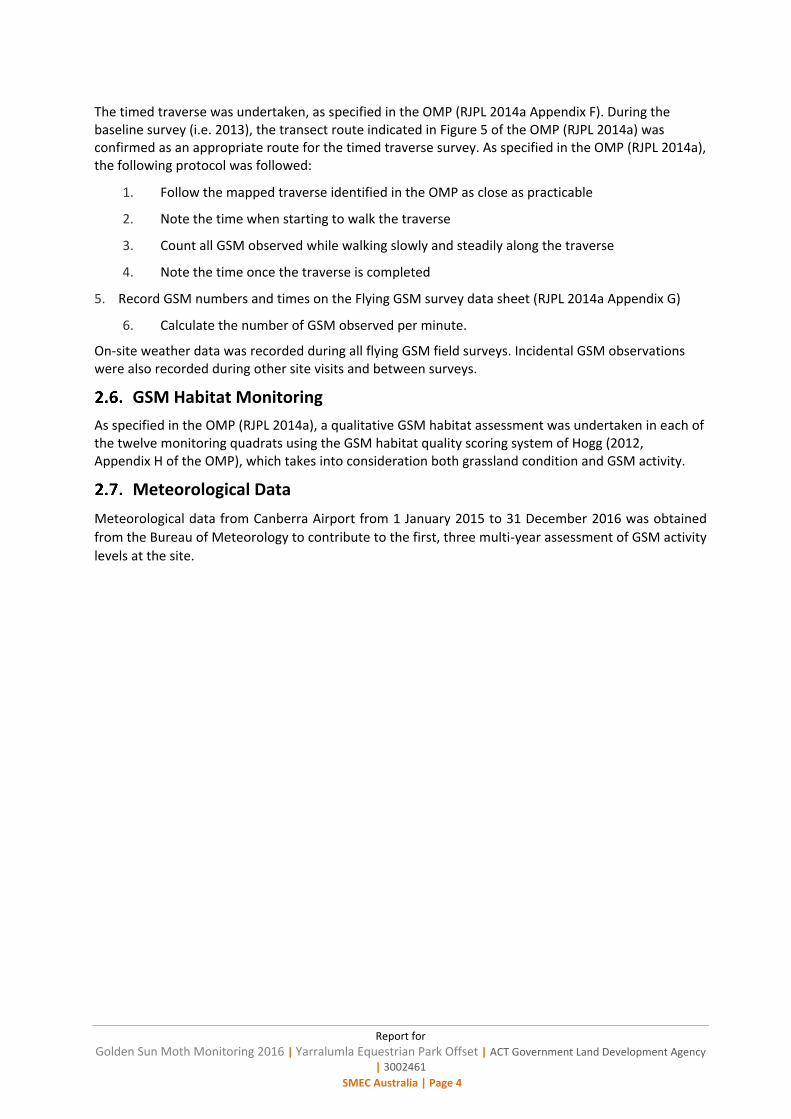
Survey Area
The survey area comprised the YEP offset area defined in the OMP (RJPL 2014a) (Figure 1). Traverse routes were located, as defined in the OMP (RJPL 2014a) (Figure 1). Corrected locations for vegetation quadrats and point-count assessment reported in the year 0 baseline assessment report (RJPL 2014b) were used.
Revised Vegetation and Golden Sun Moth Habitat Assessment
Mapping of vegetation and potential GSM habitat areas presented in the YEP management plan (RJPL 2014a) and the year 0 (i.e.2013), year 1 (i.e. 2014) and year 2 (i.e. 2015) monitoring report (RJPL 2014b; SMEC 2016) were reviewed by meandering traverse during the vegetation condition monitoring.
Native Pasture and Natural Temperate Grassland Monitoring
The condition of native pasture and natural temperate grassland was assessed in twelve 4 m2 quadrats located throughout the YEP offset area, as described in the year 0 (i.e. 2013) monitoring report (RJPL 2014b). Quadrats were qualitatively assessed using the NTG quality scale of Nash and Hogg (2013, Appendix E to the OMP (RJPL 2014a)). Nash and Hogg’s (2013) criteria for the quality scale are based on criteria used for identifying NTG, as specified in the Commonwealth listing advice for natural temperate grassland (Australian Government 2011) and the NTG National Recovery Plan (Environment ACT 2005). As specified in the OMP (RJPL 2014a), a modified version of Rehwinkel (2007) was used to quantitatively determine relative floristic value scores for native pasture and NTG within each quadrat (Appendices C and D of the OMP (RJPL 2014a)), consistent with ACT Government guidelines for assessing NTG (ACT Government 2010b).
GSM Flying Surveys
The start of the GSM flying season was confirmed using known reference sites in the ACT and based on information from other consultants in the ACT, and Conservation Planning and Research, ACT Government (CPR).
Flying GSM surveys were conducted in a manner consistent with the ACT Government (2010a) GSM survey guidelines and specifically according to the protocol outlined in the OMP (RJPL 2014a Appendix F). As specified in the OMP (RJPL 2014a), rotational point counts were conducted at the monitoring quadrats located throughout the YEP offset area according to the following protocol:
1. Locate each of the quadrats used for the vegetation and habitat assessments using GPS
2. While standing in the middle of each quadrat, count all GSM observed in and beyond the
quadrat to approximately 20 m while rotating through 360º
3. Record GSM numbers on the Flying GSM survey data sheet (RJPL 2014a Appendix G)
4. Wait 30 seconds
5. Repeat Steps 2-4, nine more times
6. Average the GSM count at each site and enter result on the flying GSM survey data sheet (RJPL
2014a Appendix G).
"S"S
"S
"S
"S
"S
"S
"S
"S
"S
"S
"S
9
8
7
6
5
4
3
2 1
12
11
10
ACTMapi ©Australian Capital Territory
© SMEC Australia Pty Ltd 2015. All Rights Reserved
PROJECT TITLE Yarralumla Equestrian Park Offset 2016 Mointoring Report
¹
PROJECT NO. 3002461 CREATED BY N.Crook SOURCESImagery © actmapi/imagery2015mga
FIG NO.1 DATE
20/12/2016COORDINATE SYSTEMGDA 94 MGA Zone 55
PAGE SIZE
A40 90 18045
Metres1:4,748
Location: X:\PROJECT\3002461 LDA YEP Monitoring\GIS\YEP_Study_Site.mxd
Disclaimer: While all reasonable care has been taken to
ensure the information contained on this map is up to dateand accurate, this map contains data from a number of
sources - no warranty is given that the information
contained on this map is free from error or omission. Any
reliance placed on such information shall be at the sole riskof the user. Please verify the accuracy of all information prior
to using it. This map is not a design document.
FIGURE TITLE Yarralumla Equestrain Park offset area and survey details.
LegendYarralumla Equestrian Park (Offset Managment Area)
Lake Pony Club (Exclused Area)
Indicative meandering traverse route
"S Quadrat and rotational point count locations
Report for
Golden Sun Moth Monitoring 2016 | Yarralumla Equestrian Park Offset | ACT Government Land Development Agency
| 3002461
SMEC Australia | Page 4
The timed traverse was undertaken, as specified in the OMP (RJPL 2014a Appendix F). During the baseline survey (i.e. 2013), the transect route indicated in Figure 5 of the OMP (RJPL 2014a) was confirmed as an appropriate route for the timed traverse survey. As specified in the OMP (RJPL 2014a), the following protocol was followed:
1. Follow the mapped traverse identified in the OMP as close as practicable
2. Note the time when starting to walk the traverse
3. Count all GSM observed while walking slowly and steadily along the traverse
4. Note the time once the traverse is completed
5. Record GSM numbers and times on the Flying GSM survey data sheet (RJPL 2014a Appendix G)
6. Calculate the number of GSM observed per minute.
On-site weather data was recorded during all flying GSM field surveys. Incidental GSM observations were also recorded during other site visits and between surveys.
GSM Habitat Monitoring
As specified in the OMP (RJPL 2014a), a qualitative GSM habitat assessment was undertaken in each of the twelve monitoring quadrats using the GSM habitat quality scoring system of Hogg (2012, Appendix H of the OMP), which takes into consideration both grassland condition and GSM activity.
Meteorological Data
Meteorological data from Canberra Airport from 1 January 2015 to 31 December 2016 was obtained
from the Bureau of Meteorology to contribute to the first, three multi-year assessment of GSM activity
levels at the site.

Report for
Golden Sun Moth Monitoring 2016 | Yarralumla Equestrian Park Offset | ACT Government Land Development Agency
| 3002461
SMEC Australia | Page 5
3. Results
Regional GSM Information
GSM were first observed during the 2016 flying season on 16 November at Fisher Place, Ainslie and were flying at multiple sites by late November (A. Rowell, pers. comm. 2016). The timing of the onset of the flying season is comparable with the 2015 season but commenced approximately a fortnight later compared to the 2011 - 2014 seasons.
Vegetation and Golden Sun Moth Habitat Mapping
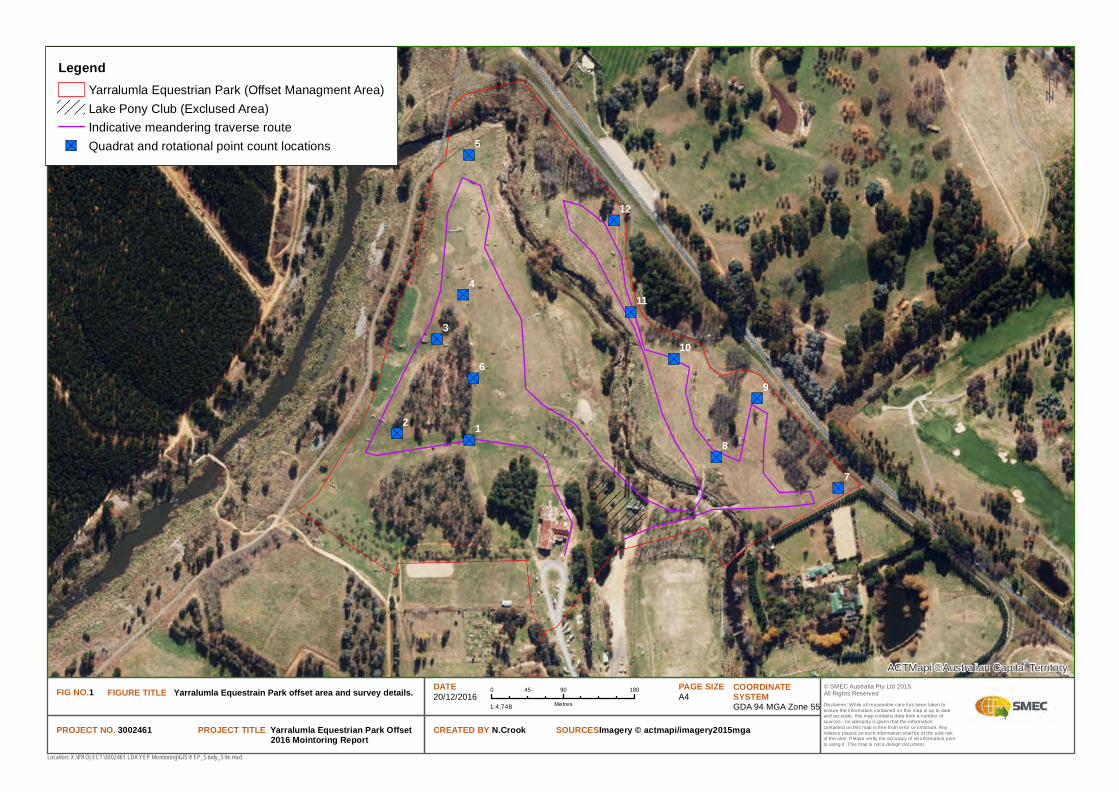
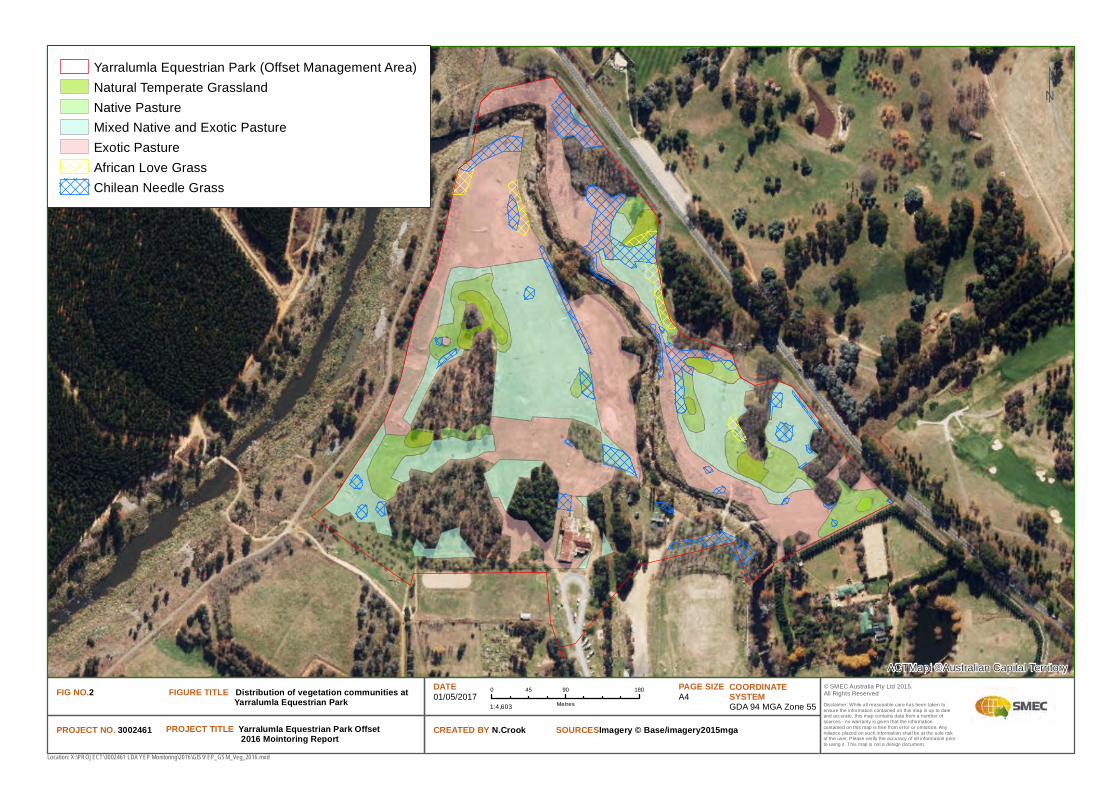
Changes in the distribution and extent of vegetation types and land uses reported in the OMP (RJPL 2014a), and year 0 (RJPL 2014b), year 1 and year 2 monitoring reports (RJPL 2015; SMEC 2016) to 2016 survey were reviewed. Changes to the vegetation map were minimal except for the expansion of the extent of Chilean needle grass on the eastern side of Yarralumla Creek and at the southern end of YEP. Since the 2015 survey, African lovegrass has further spread through the site and is dominating some areas north of YEP. Updated mapping of vegetation types and land use is shown in Figure 4 and revised areas are shown in comparison to the 2013 mapping in Table 1. The increase in total project area is due to an increase in the extent of Chilean needle grass which overlays the exotic grassland layer.
Table 1. Revised vegetation and land use mapping compared with 2013 and 2015.
Vegetation type / land use 2013 (ha) 2015 (ha) 2016 (ha) Change
since
2013 (ha)
Natural temperate grassland 0.5 0.5 0.5 0.0
Native pasture 1.7 1.6 1.6 -0.1
Mixed native and exotic pasture 5.0 4.9 4.9 -0.1
Exotic pasture 5.4 6.5 6.5 +1.1
Chilean needle grass 1.2 1.1 1.4 +0.2
(Construction area) 0.8 0 0 -0.8
(Non-grassland areas (e.g. buildings, riparian
margins, woodland))
8.0 8.0 8.0 0.0
Total Project Area (approximate) 22.6 22.6 22.9 0.0
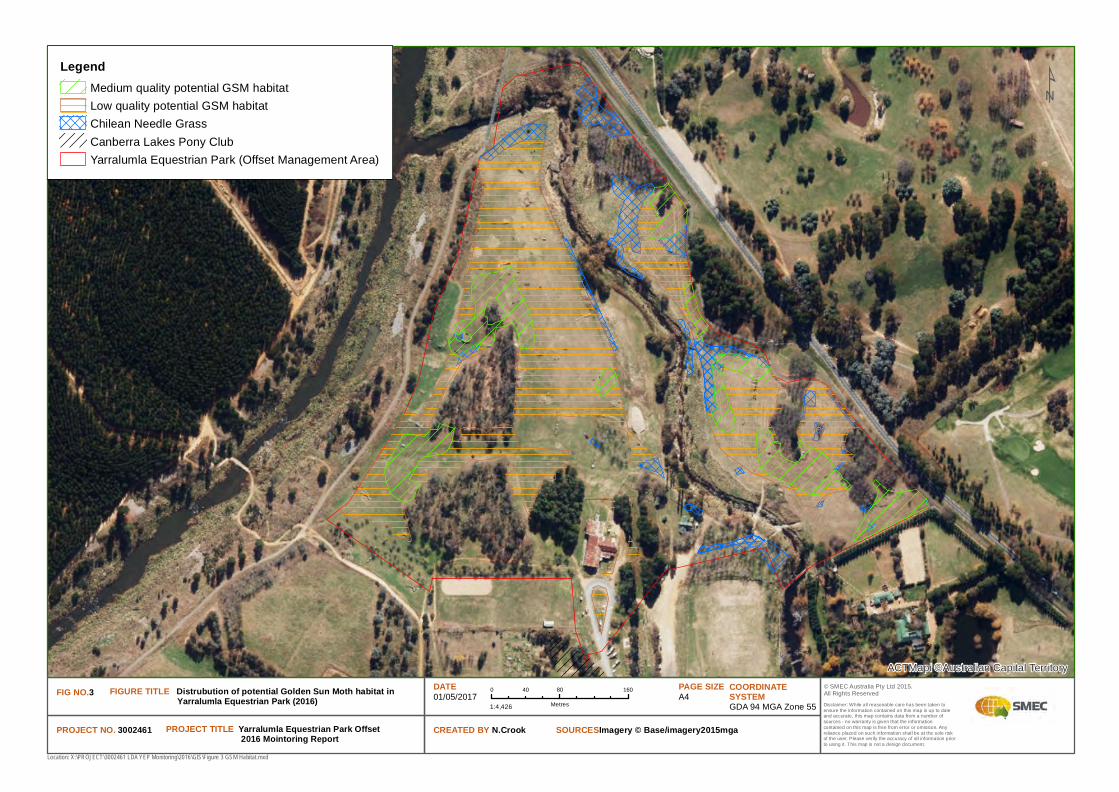
GSM habitat extent reported in the OMP (RJPL 2014a) and the year 0 (i.e. 2013) (RJPL 2014b), year 1
(RJPL 2015) and year 2 (SMEC 2016) monitoring reports were compared (see Table 2); GSM habitat
extent did not change from 2015 to 2016 but GSM habitat has increased since 2013. The current GSM
habitat distribution is presented in Figure 2.
Table 2. Revised 2016 GSM habitat areas compared with 2013 to 2016.
GSM habitat area 2013 (ha) 2015 (ha) 2016 (ha) Change
since
2013 (ha)
Low quality 4.8 5.9 5.9 +1.1
Low quality habitat dominated by Chilean
needle grass
0.6 1.3 1.3 +0.7
Moderate quality 2.2 2.0 2.0 -0.2
High quality 0.0 0.0 0.0 0.0
Total 7.6 9.2 9.2 +1.6
ACTMapi ©Australian Capital Territory
© SMEC Australia Pty Ltd 2015. All Rights Reserved
PROJECT TITLE Yarralumla Equestrian Park Offset 2016 Mointoring Report
¹
PROJECT NO. 3002461 CREATED BY N.Crook SOURCESImagery © Base/imagery2015mga
FIG NO.2 DATE
01/05/2017COORDINATE SYSTEMGDA 94 MGA Zone 55
PAGE SIZE
A40 90 18045
Metres1:4,603
Location: X:\PROJECT\3002461 LDA YEP Monitoring\2016\GIS\YEP_GSM_Veg_2016.mxd
Disclaimer: While all reasonable care has been taken to
ensure the information contained on this map is up to dateand accurate, this map contains data from a number of
sources - no warranty is given that the information
contained on this map is free from error or omission. Any
reliance placed on such information shall be at the sole riskof the user. Please verify the accuracy of all information prior
to using it. This map is not a design document.
FIGURE TITLE Distribution of vegetation communities at Yarralumla Equestrian Park
Yarralumla Equestrian Park (Offset Management Area)
Natural Temperate Grassland
Native Pasture
Mixed Native and Exotic Pasture
Exotic Pasture
African Love Grass
Chilean Needle Grass
ACTMapi ©Australian Capital Territory
© SMEC Australia Pty Ltd 2015. All Rights Reserved
PROJECT TITLE Yarralumla Equestrian Park Offset 2016 Mointoring Report
¹
PROJECT NO. 3002461 CREATED BY N.Crook SOURCESImagery © Base/imagery2015mga
FIG NO.3 DATE
01/05/2017COORDINATE SYSTEMGDA 94 MGA Zone 55
PAGE SIZE
A40 80 16040
Metres1:4,426
Location: X:\PROJECT\3002461 LDA YEP Monitoring\2016\GIS\Figure 3 GSM Habitat.mxd
Disclaimer: While all reasonable care has been taken to
ensure the information contained on this map is up to dateand accurate, this map contains data from a number of
sources - no warranty is given that the information
contained on this map is free from error or omission. Any
reliance placed on such information shall be at the sole riskof the user. Please verify the accuracy of all information prior
to using it. This map is not a design document.
FIGURE TITLE Distrubution of potential Golden Sun Moth habitat in Yarralumla Equestrian Park (2016)
LegendMedium quality potential GSM habitat
Low quality potential GSM habitat
Chilean Needle Grass
Canberra Lakes Pony Club
Yarralumla Equestrian Park (Offset Management Area)
Report for
Golden Sun Moth Monitoring 2016 | Yarralumla Equestrian Park Offset | ACT Government Land Development Agency
| 3002461
SMEC Australia | Page 8
Native Pasture and Natural Temperate Grassland Monitoring
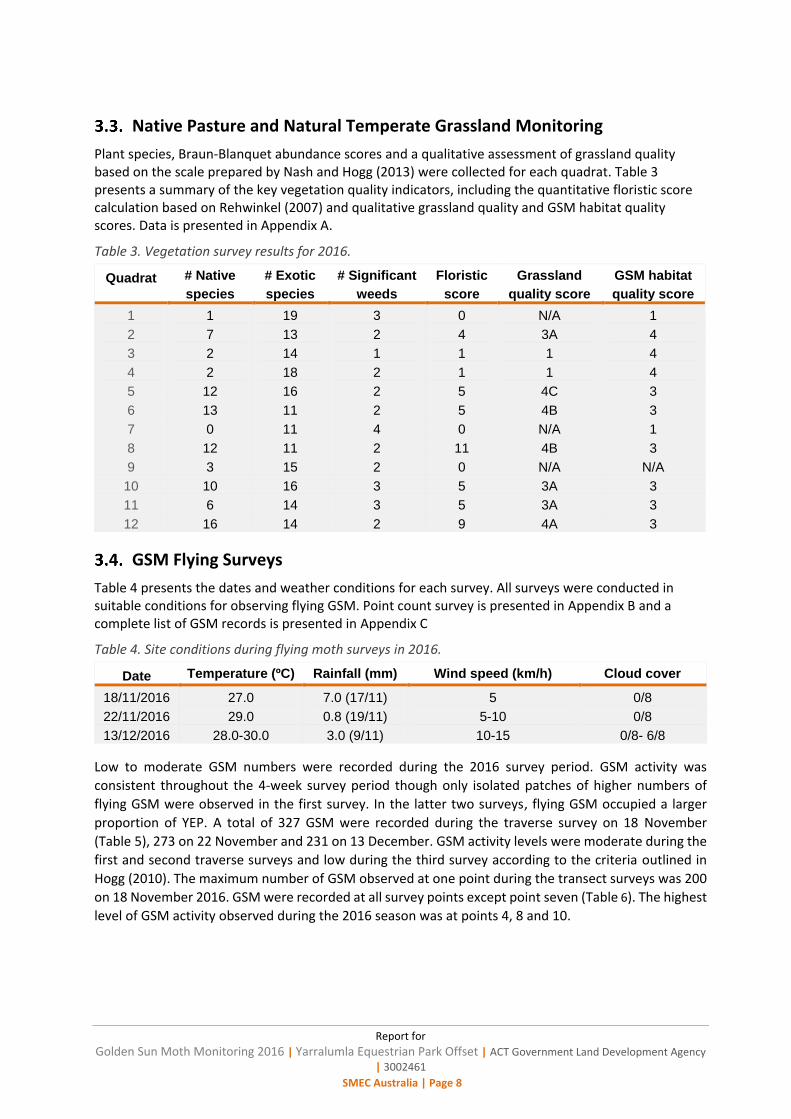
Plant species, Braun-Blanquet abundance scores and a qualitative assessment of grassland quality based on the scale prepared by Nash and Hogg (2013) were collected for each quadrat. Table 3 presents a summary of the key vegetation quality indicators, including the quantitative floristic score calculation based on Rehwinkel (2007) and qualitative grassland quality and GSM habitat quality scores. Data is presented in Appendix A.
Table 3. Vegetation survey results for 2016.
Quadrat # Native
species
# Exotic
species
# Significant
weeds
Floristic
score
Grassland
quality score
GSM habitat
quality score
1 1 19 3 0 N/A 1
2 7 13 2 4 3A 4
3 2 14 1 1 1 4
4 2 18 2 1 1 4
5 12 16 2 5 4C 3
6 13 11 2 5 4B 3
7 0 11 4 0 N/A 1
8 12 11 2 11 4B 3
9 3 15 2 0 N/A N/A
10 10 16 3 5 3A 3
11 6 14 3 5 3A 3
12 16 14 2 9 4A 3
GSM Flying Surveys
Table 4 presents the dates and weather conditions for each survey. All surveys were conducted in suitable conditions for observing flying GSM. Point count survey is presented in Appendix B and a complete list of GSM records is presented in Appendix C
Table 4. Site conditions during flying moth surveys in 2016.
Date Temperature (ºC) Rainfall (mm) Wind speed (km/h) Cloud cover
18/11/2016 27.0 7.0 (17/11) 5 0/8
22/11/2016 29.0 0.8 (19/11) 5-10 0/8
13/12/2016 28.0-30.0 3.0 (9/11) 10-15 0/8- 6/8
Low to moderate GSM numbers were recorded during the 2016 survey period. GSM activity was
consistent throughout the 4-week survey period though only isolated patches of higher numbers of
flying GSM were observed in the first survey. In the latter two surveys, flying GSM occupied a larger
proportion of YEP. A total of 327 GSM were recorded during the traverse survey on 18 November
(Table 5), 273 on 22 November and 231 on 13 December. GSM activity levels were moderate during the
first and second traverse surveys and low during the third survey according to the criteria outlined in
Hogg (2010). The maximum number of GSM observed at one point during the transect surveys was 200
on 18 November 2016. GSM were recorded at all survey points except point seven (Table 6). The highest
level of GSM activity observed during the 2016 season was at points 4, 8 and 10.
Report for
Golden Sun Moth Monitoring 2016 | Yarralumla Equestrian Park Offset | ACT Government Land Development Agency
| 3002461
SMEC Australia | Page 9
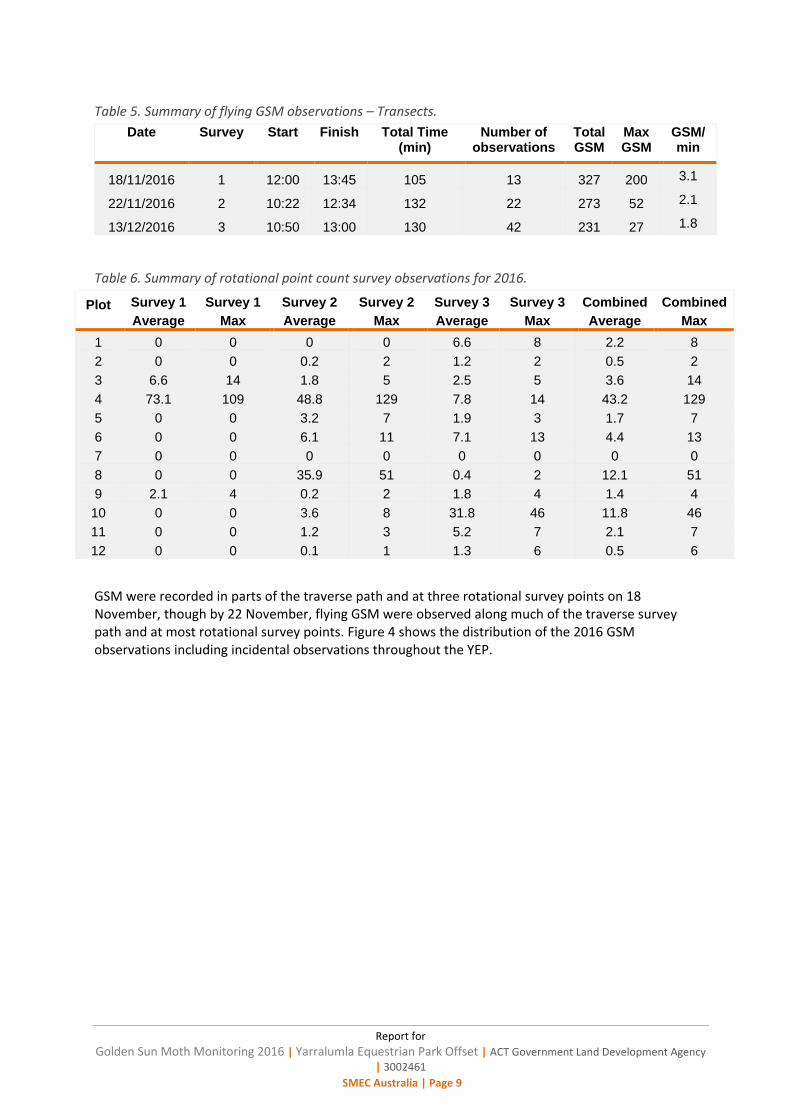
Table 5. Summary of flying GSM observations – Transects.
Date Survey Start Finish Total Time (min)
Number of observations
Total GSM
Max GSM
GSM/min
18/11/2016 1 12:00 13:45 105 13 327 200 3.1
22/11/2016 2 10:22 12:34 132 22 273 52 2.1
13/12/2016 3 10:50 13:00 130 42 231 27 1.8
Table 6. Summary of rotational point count survey observations for 2016.
Plot Survey 1
Average
Survey 1
Max
Survey 2
Average
Survey 2
Max
Survey 3
Average
Survey 3
Max
Combined
Average
Combined
Max
1 0 0 0 0 6.6 8 2.2 8
2 0 0 0.2 2 1.2 2 0.5 2
3 6.6 14 1.8 5 2.5 5 3.6 14
4 73.1 109 48.8 129 7.8 14 43.2 129
5 0 0 3.2 7 1.9 3 1.7 7
6 0 0 6.1 11 7.1 13 4.4 13
7 0 0 0 0 0 0 0 0
8 0 0 35.9 51 0.4 2 12.1 51
9 2.1 4 0.2 2 1.8 4 1.4 4
10 0 0 3.6 8 31.8 46 11.8 46
11 0 0 1.2 3 5.2 7 2.1 7
12 0 0 0.1 1 1.3 6 0.5 6
GSM were recorded in parts of the traverse path and at three rotational survey points on 18 November, though by 22 November, flying GSM were observed along much of the traverse survey path and at most rotational survey points. Figure 4 shows the distribution of the 2016 GSM observations including incidental observations throughout the YEP.

_̂
_̂
_̂
_̂
_̂
_̂
_̂
_̂
_̂
_̂
_̂
_̂
_̂_̂_̂_̂
_̂_̂
_̂_̂_̂̂_
_̂_̂_̂_̂_̂
_̂
_̂̂_
_̂
_̂_̂
_̂
_̂
_̂
_̂
_̂
_̂
_̂_̂
"S"S
"S
"S
"S
"S
"S
"S
"S
"S
"S
"S
j
j
jj
j
j
ACTMapi ©Australian Capital Territory
© SMEC Australia Pty Ltd 2015. All Rights Reserved
PROJECT TITLE Yarralumla Equestrian Park Offset 2016 Mointoring Report
¹
PROJECT NO. 3002461 CREATED BY N.Crook SOURCESImagery © actmapi/imagery2015mga
FIG NO.4 DATE
01/05/2017COORDINATE SYSTEMGDA 94 MGA Zone 55
PAGE SIZE
A40 90 18045
Metres1:4,545
Location: X:\PROJECT\3002461 LDA YEP Monitoring\2016\GIS\YEP_GSM_2016.mxd
Disclaimer: While all reasonable care has been taken to
ensure the information contained on this map is up to dateand accurate, this map contains data from a number of
sources - no warranty is given that the information
contained on this map is free from error or omission. Any
reliance placed on such information shall be at the sole riskof the user. Please verify the accuracy of all information prior
to using it. This map is not a design document.
FIGURE TITLE Distribution of Golden Sun Moth records in Yarraumla Equestrian Park in 2016.
Legendj Female GSM: 1 indiviudal
j Female GSM: 6 indiviudals
"S >1-5 average # moths per survey
"S >10-20 average # moths per survey
"S >40 average # moths per survey
_̂ Incidental: 1-5 individuals
_̂ Incidental: 6-10 indiviudals
_̂ Incidental: 11-15 indiviudals
_̂ Incidental: 18 individuals
_̂ Incidental: 30 individuals
Transect: 1-5 individuals
Transect: 6-10 individuals
Transect: 11-15 individuals
Transect: 16-20 individuals
Transect: 20 - 50 individuals
Transect: 50-100 individuals
Transect: 100 individuals
Transect: 200 individuals
Yarralumla Equestrian Park (Offset Managment Area)
Lake Pony Club (Exclused Area)
Indicative meandering traverse route
Report for
Golden Sun Moth Monitoring 2016 | Yarralumla Equestrian Park Offset | ACT Government Land Development Agency
| 3002461
SMEC Australia | Page 11
GSM Habitat Monitoring
Table 3 presents the GSM habitat quality score at each of the 12 survey points.
Other Information
No GSM pupae cases were observed at YEP.
Four female GSM were observed during the transverse surveys at YEP in 2016 while 12 female GSM were observed during the rotational count surveys (i.e. plot 4 and 6).
Meteorological Data
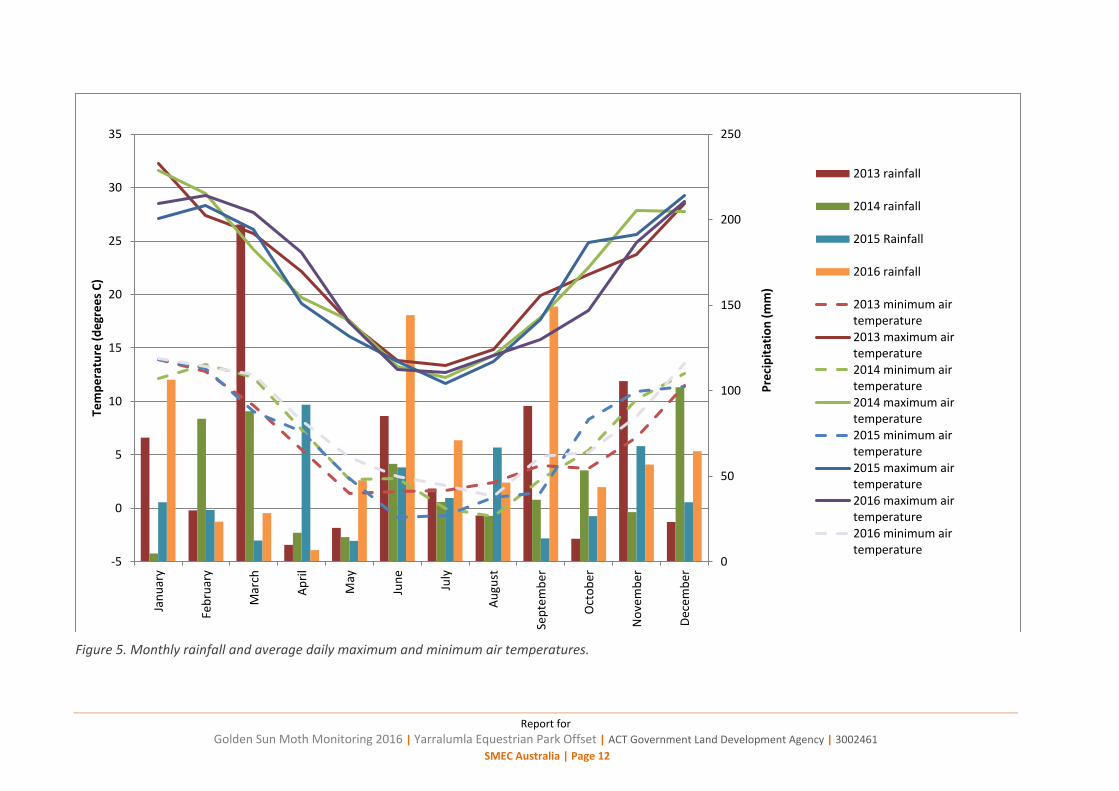
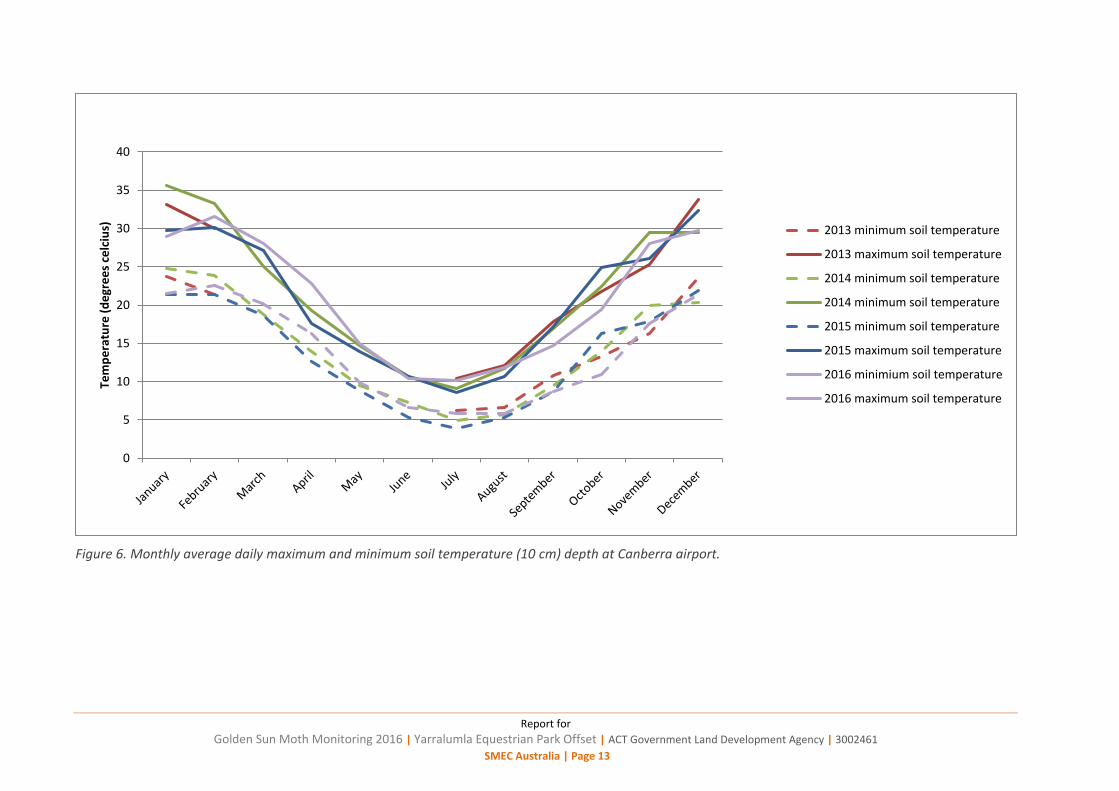
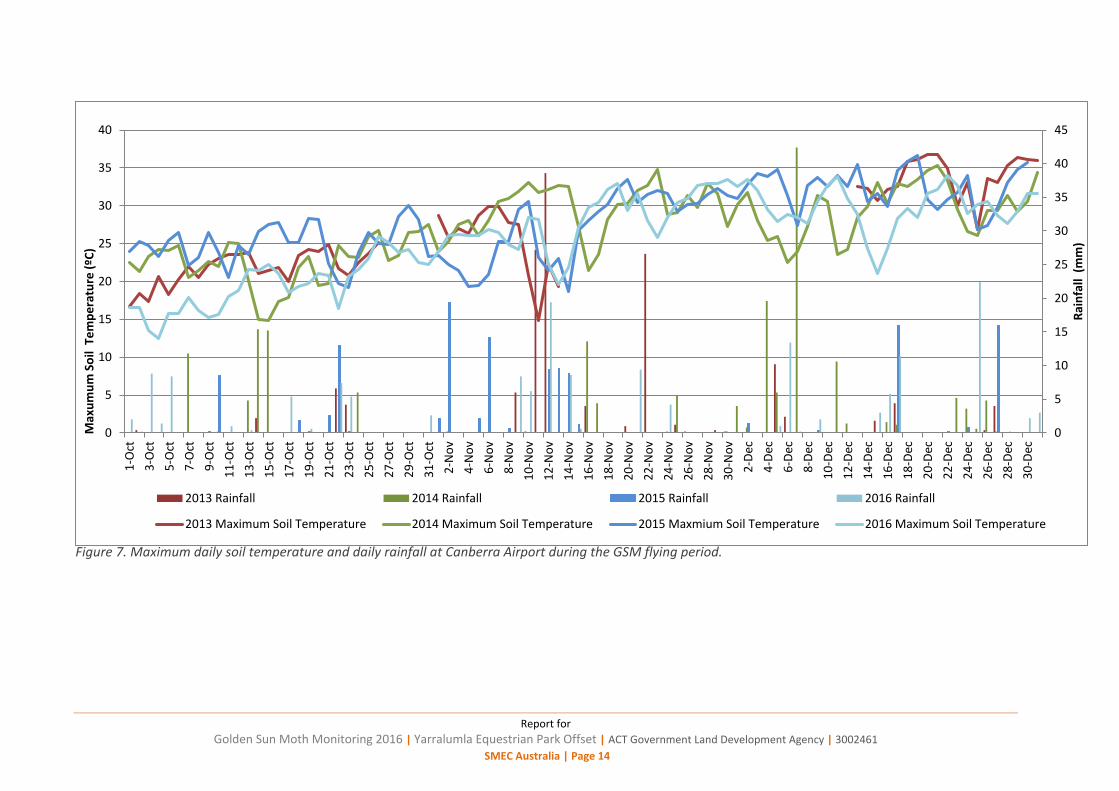
Meteorological data is summarised for the year and presented in detail for the GSM flying season in Appendix D and Appendix E respectively. Figure 5 summarises monthly rainfall and average daily maximum and minimum air temperatures recorded at Canberra Airport from 2013 to 2016. Figure 6 shows the monthly average daily maximum and minimum soil temperatures, recorded at 10 cm depth from 2013 to 2016 at the Canberra Airport, although some data is missing for 2013, limiting comparison between years. As expected, soil temperature trends remain consistent from 2013 to 2016. shows, in more detail, daily maximum soil temperature and daily precipitation during the GSM flying season (i.e. October to December). The Bureau of Meteorology was unable to provide soil temperature data for November and December 2013, restricting comparison between 2013 and 2014.
Report for
Golden Sun Moth Monitoring 2016 | Yarralumla Equestrian Park Offset | ACT Government Land Development Agency | 3002461
SMEC Australia | Page 12
Figure 5. Monthly rainfall and average daily maximum and minimum air temperatures.
0
50
100
150
200
250
-5
0
5
10
15
20
25
30
35
Jan
uar
y
Feb
ruar
y
Mar
ch
Ap
ril
May
Jun
e
July
Au
gust
Sep
tem
ber
Oct
ob
er
No
vem
ber
Dec
emb
er
Pre
cip
itat
ion
(m
m)
Tem
pe
ratu
re (
de
gre
es
C)
2013 rainfall
2014 rainfall
2015 Rainfall
2016 rainfall
2013 minimum airtemperature2013 maximum airtemperature2014 minimum airtemperature2014 maximum airtemperature2015 minimum airtemperature2015 maximum airtemperature2016 maximum airtemperature2016 minimum airtemperature
Report for
Golden Sun Moth Monitoring 2016 | Yarralumla Equestrian Park Offset | ACT Government Land Development Agency | 3002461
SMEC Australia | Page 13
Figure 6. Monthly average daily maximum and minimum soil temperature (10 cm) depth at Canberra airport.
0
5
10
15
20
25
30
35
40
Tem
pe
ratu
re (
de
gre
es
celc
ius) 2013 minimum soil temperature
2013 maximum soil temperature
2014 minimum soil temperature
2014 minimum soil temperature
2015 minimum soil temperature
2015 maximum soil temperature
2016 minimium soil temperature
2016 maximum soil temperature
Report for
Golden Sun Moth Monitoring 2016 | Yarralumla Equestrian Park Offset | ACT Government Land Development Agency | 3002461
SMEC Australia | Page 14
Figure 7. Maximum daily soil temperature and daily rainfall at Canberra Airport during the GSM flying period.
0
5
10
15
20
25
30
35
40
45
0
5
10
15
20
25
30
35
401
-Oct
3-O
ct
5-O
ct
7-O
ct
9-O
ct
11
-Oct
13
-Oct
15
-Oct
17
-Oct
19
-Oct
21
-Oct
23
-Oct
25
-Oct
27
-Oct
29
-Oct
31
-Oct
2-N
ov
4-N
ov
6-N
ov
8-N
ov
10
-No
v
12
-No
v
14
-No
v
16
-No
v
18
-No
v
20
-No
v
22
-No
v
24
-No
v
26
-No
v
28
-No
v
30
-No
v
2-D
ec
4-D
ec
6-D
ec
8-D
ec
10
-Dec
12
-Dec
14
-Dec
16
-Dec
18
-Dec
20
-Dec
22
-Dec
24
-Dec
26
-Dec
28
-Dec
30
-Dec
2013 Rainfall 2014 Rainfall 2015 Rainfall 2016 Rainfall
2013 Maximum Soil Temperature 2014 Maximum Soil Temperature 2015 Maxmium Soil Temperature 2016 Maximum Soil Temperature
0
5
10
15
20
25
30
35
40
45
0
5
10
15
20
25
30
35
401
-Oct
3-O
ct
5-O
ct
7-O
ct
9-O
ct
11
-Oct
13
-Oct
15
-Oct
17
-Oct
19
-Oct
21
-Oct
23
-Oct
25
-Oct
27
-Oct
29
-Oct
31
-Oct
2-N
ov
4-N
ov
6-N
ov
8-N
ov
10
-No
v
12
-No
v
14
-No
v
16
-No
v
18
-No
v
20
-No
v
22
-No
v
24
-No
v
26
-No
v
28
-No
v
30
-No
v
2-D
ec
4-D
ec
6-D
ec
8-D
ec
10
-Dec
12
-Dec
14
-Dec
16
-Dec
18
-Dec
20
-Dec
22
-Dec
24
-Dec
26
-Dec
28
-Dec
30
-Dec
Rai
nfa
ll (
mm
)
Max
um
um
So
il T
em
pe
ratu
re (
ºC)
2013 Rainfall 2014 Rainfall 2015 Rainfall 2016 Rainfall
2013 Maximum Soil Temperature 2014 Maximum Soil Temperature 2015 Maxmium Soil Temperature 2016 Maximum Soil Temperature

Report for
Golden Sun Moth Monitoring 2016 | Yarralumla Equestrian Park Offset | ACT Government Land Development Agency
| 3002461
SMEC Australia | Page 15
4. Ecological Interpretation and Comparison with Previous Monitoring Results
Vegetation and Golden Sun Moth Habitat Mapping
The distribution of vegetation types across YEP during the 2016 survey season varied slightly from the original 2013 mapping of vegetation types reported in the OMP and the 2013 monitoring report (RJPL 2014b; Table 1).
The most significant change is the increase in exotic pasture area due to the addition of new vegetation across the former construction area (Table 1). There has been an increase in Chilean needle grass (i.e. 0.3 ha) on the eastern side and the southern side of YEP. The extent of African lovegrass has expanded, with the species becoming dominant in patches on the eastern side of Yarralumla Creek. The increase in exotic species may be a function of variation in seasonal conditions. Either way, such trends in grassland quality should be considered in future monitoring reports.
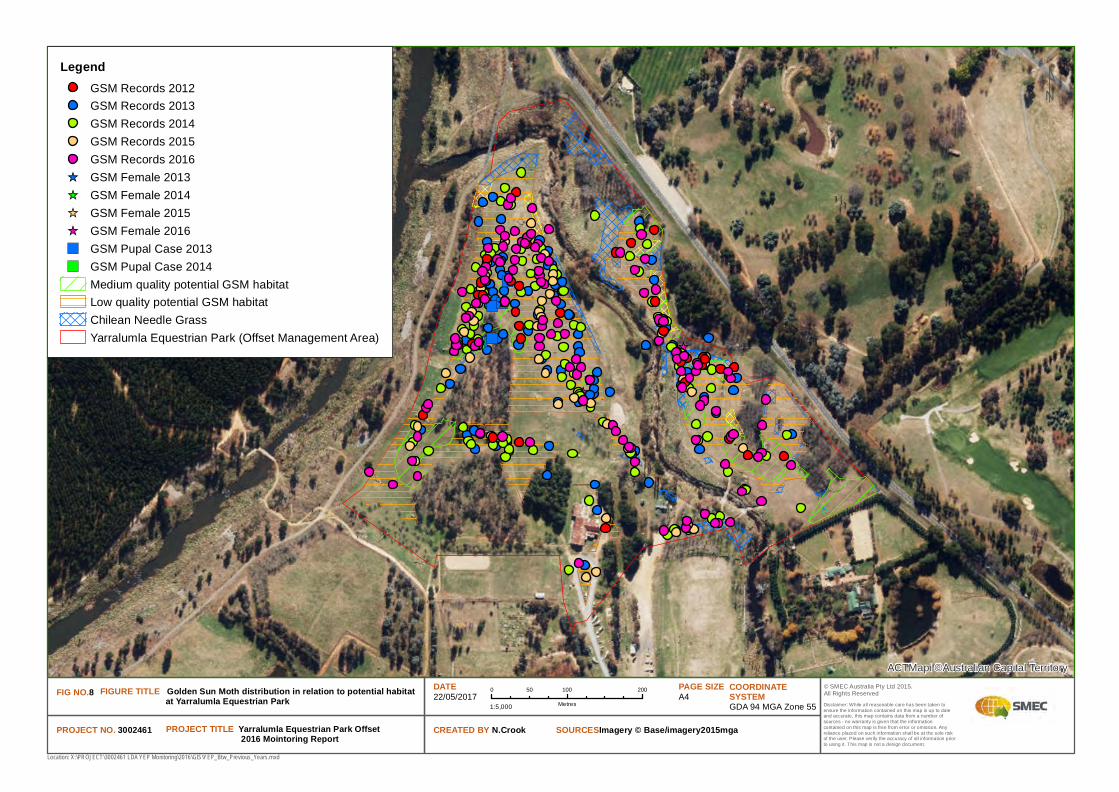
The extent of GSM habitat mapped in 2016 across YEP is greater than that mapped in 2013 (RJPL 2014a, RJPL 2015; Table 2); however, is consistent with 2015 survey. GSM surveys since 2013 have consistently indicated that flying male GSM are not only using the majority of potential habitat mapped at the site, including highly marginal areas (Figure 8), but are also consistently present in areas dominated by exotic grasses. Flying GSM have been consistently detected in approximately 1 ha of exotic pasture dominated by soft brome (Bromus hordeaceus) and goose grass (Eleusine tristachya) with very limited presence of potential food grasses located between quadrats 4 and 5 in the 2015 and 2016 surveys.
Future investigations into GSM larvae food sources in the exotic pasture between quadrats 4 and 5 may be useful. An increase in survey effort through ‘incidental’ traversing to the south west of quadrat 2 identified low GSM numbers (Figure 8). The vegetation cover is mixed native and exotic pasture with patches of Chilean needle grass. Further ‘incidental’ traversing to the north-east of quadrat one could confirm GSM presence or absence.
Chilean needle grass patches supporting GSM are located in the north and east of the YEP, and along the edge of the access track to the west of Yarralumla Creek in the south of the YEP (Figure 8). Since 2013, patches of Chilean needle grass east of Yarralumla Creek have increased and are encroaching the native pasture south-east of the YEP. SMEC recommends that the Chilean needle grass in the patches is controlled to prevent further native pasture degradation. In general, GSM did not appear to have extensively used the major Chilean needle grass patches in the north of the YEP in the past four years of surveys. (Figure 8).
African lovegrass has extended since the 2015 surveys, particularly east of the Yarralumla Creek in the south of YEP and northern section of YEP (Figure 8). African lovegrass expansion would further degrade the mixed native and exotic pasture and NTG. SMEC recommends that the African lovegrass in these areas is controlled.
")
")
")
")
")
_̂
_̂
_̂
_̂
_̂_̂
_̂_̂
_̂
_̂
_̂
_̂
_̂
_̂_̂
_̂
_̂
")
ACTMapi ©Australian Capital Territory
© SMEC Australia Pty Ltd 2015. All Rights Reserved
PROJECT TITLE Yarralumla Equestrian Park Offset 2016 Mointoring Report
¹
PROJECT NO. 3002461 CREATED BY N.Crook SOURCESImagery © Base/imagery2015mga
FIG NO.8 DATE
22/05/2017COORDINATE SYSTEMGDA 94 MGA Zone 55
PAGE SIZE
A40 100 20050
Metres1:5,000
Location: X:\PROJECT\3002461 LDA YEP Monitoring\2016\GIS\YEP_Btw_Previous_Years.mxd
Disclaimer: While all reasonable care has been taken to
ensure the information contained on this map is up to dateand accurate, this map contains data from a number of
sources - no warranty is given that the information
contained on this map is free from error or omission. Any
reliance placed on such information shall be at the sole riskof the user. Please verify the accuracy of all information prior
to using it. This map is not a design document.
FIGURE TITLE Golden Sun Moth distribution in relation to potential habitat at Yarralumla Equestrian Park
LegendGSM Records 2012
GSM Records 2013
GSM Records 2014
GSM Records 2015
GSM Records 2016
_̂ GSM Female 2013
_̂ GSM Female 2014
_̂ GSM Female 2015
_̂ GSM Female 2016
") GSM Pupal Case 2013
") GSM Pupal Case 2014
Medium quality potential GSM habitat
Low quality potential GSM habitat
Chilean Needle Grass
Yarralumla Equestrian Park (Offset Management Area)
Report for
Golden Sun Moth Monitoring 2016 | Yarralumla Equestrian Park Offset | ACT Government Land Development
Agency | 3002461
SMEC Australia | Page 17
Native Pasture and Natural Temperate Grassland Monitoring
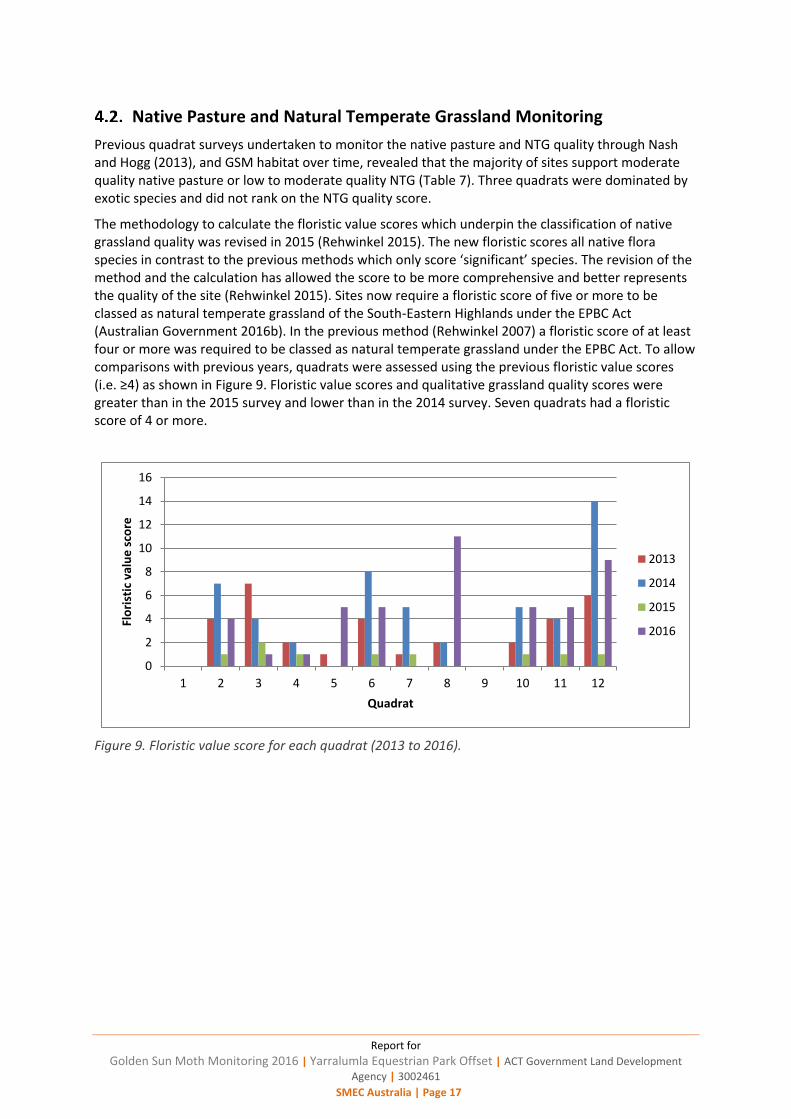
Previous quadrat surveys undertaken to monitor the native pasture and NTG quality through Nash and Hogg (2013), and GSM habitat over time, revealed that the majority of sites support moderate quality native pasture or low to moderate quality NTG (Table 7). Three quadrats were dominated by exotic species and did not rank on the NTG quality score.
The methodology to calculate the floristic value scores which underpin the classification of native grassland quality was revised in 2015 (Rehwinkel 2015). The new floristic scores all native flora species in contrast to the previous methods which only score ‘significant’ species. The revision of the method and the calculation has allowed the score to be more comprehensive and better represents the quality of the site (Rehwinkel 2015). Sites now require a floristic score of five or more to be classed as natural temperate grassland of the South-Eastern Highlands under the EPBC Act (Australian Government 2016b). In the previous method (Rehwinkel 2007) a floristic score of at least four or more was required to be classed as natural temperate grassland under the EPBC Act. To allow comparisons with previous years, quadrats were assessed using the previous floristic value scores (i.e. ≥4) as shown in Figure 9. Floristic value scores and qualitative grassland quality scores were greater than in the 2015 survey and lower than in the 2014 survey. Seven quadrats had a floristic score of 4 or more.
Figure 9. Floristic value score for each quadrat (2013 to 2016).
0
2
4
6
8
10
12
14
16
1 2 3 4 5 6 7 8 9 10 11 12
Flo
rist
ic v
alu
e s
core
Quadrat
2013
2014
2015
2016
Report for
Golden Sun Moth Monitoring 2016 | Yarralumla Equestrian Park Offset | ACT Government Land Development Agency | 3002461
SMEC Australia | Page 18
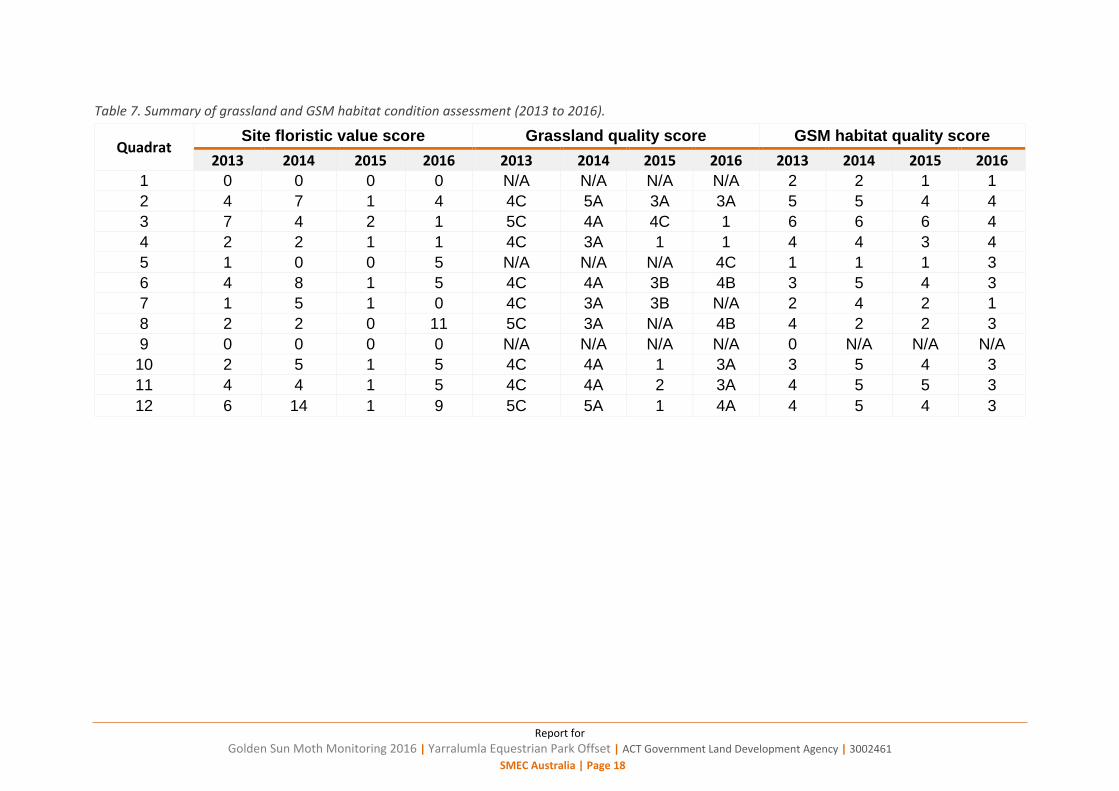
Table 7. Summary of grassland and GSM habitat condition assessment (2013 to 2016).
Quadrat Site floristic value score Grassland quality score GSM habitat quality score
2013 2014 2015 2016 2013 2014 2015 2016 2013 2014 2015 2016
1 0 0 0 0 N/A N/A N/A N/A 2 2 1 1
2 4 7 1 4 4C 5A 3A 3A 5 5 4 4
3 7 4 2 1 5C 4A 4C 1 6 6 6 4
4 2 2 1 1 4C 3A 1 1 4 4 3 4
5 1 0 0 5 N/A N/A N/A 4C 1 1 1 3
6 4 8 1 5 4C 4A 3B 4B 3 5 4 3
7 1 5 1 0 4C 3A 3B N/A 2 4 2 1
8 2 2 0 11 5C 3A N/A 4B 4 2 2 3
9 0 0 0 0 N/A N/A N/A N/A 0 N/A N/A N/A
10 2 5 1 5 4C 4A 1 3A 3 5 4 3
11 4 4 1 5 4C 4A 2 3A 4 5 5 3
12 6 14 1 9 5C 5A 1 4A 4 5 4 3
Report for
Golden Sun Moth Monitoring 2016 | Yarralumla Equestrian Park Offset | ACT Government Land Development
Agency | 3002461
SMEC Australia | Page 19
This variation in grassland diversity and assessed quality is most likely due to seasonal conditions and survey timing rather than reflecting long term changes in vegetation condition. The 2014 survey was conducted in October and is likely to have detected higher native forb diversity. The 2016 survey was undertaken in November, which is still suitable to detect native forbs. The 2015 and 2013 surveys were undertaken in December, when some native forbs could no longer be detected. Climate variability, in particular rainfall, and seasonal variability is an important factor in grassland composition and cover (Williams et al. 2015). In 2013, rainfall was 14% below the average in the ACT (BOM 2014). In 2014, rainfall was still below average in the ACT (BOM 2015). In 2015, rainfall was close to the average rainfall in comparison to previous years (BOM 2016). In 2016, rainfall was about average in comparison to previous years (BOM 2017). The increase in rainfall may have affected the composition of the native species and weeds; however, further data than the four years available would be required to clarify trends.
Some variation in vegetation composition between the years may be due to minor variations each year in monitoring quadrat positions, which are marked by GPS. While there is likely to be some variation, we anticipate that the implications of the position of the quadrats on overall vegetation condition would be minimal.
Seven quadrats located in the mapped patches of natural temperate grassland had a floristic score of 4 or more (Figure 9). This contrasts with the results of the 2013 to 2015 surveys with 2016 having the highest number of quadrats meeting the previous criteria. The NTG is present within YEP; however, seasonal conditions and survey timing plays an important role in assessing native grassland diversity. The number of sensitive grazing species recorded was less than the 2013 and 2014 survey, and the native species recorded are disturbance and drought tolerant. The increase in rainfall in 2016 may have caused the number of sensitive grazing species being recorded. All quadrats except for 1 and 9 had at least one sensitive grazing species in 2016. The different survey times most likely explain the lower diversity and hence floristic score, and the rainfall difference between the years is likely to influence the proportions of native and exotic species. Despite this, ongoing monitoring should help identify whether any long-term decline in grassland condition is potentially occurring.
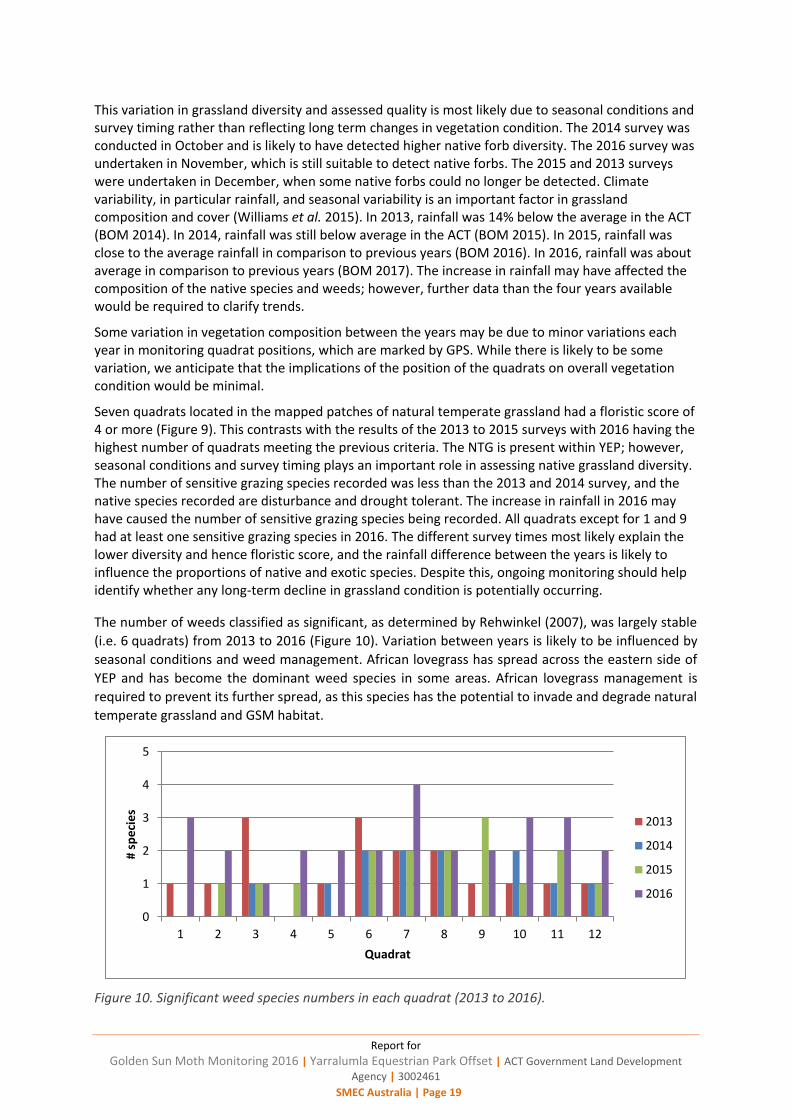
The number of weeds classified as significant, as determined by Rehwinkel (2007), was largely stable
(i.e. 6 quadrats) from 2013 to 2016 (Figure 10). Variation between years is likely to be influenced by
seasonal conditions and weed management. African lovegrass has spread across the eastern side of
YEP and has become the dominant weed species in some areas. African lovegrass management is
required to prevent its further spread, as this species has the potential to invade and degrade natural
temperate grassland and GSM habitat.
Figure 10. Significant weed species numbers in each quadrat (2013 to 2016).
0
1
2
3
4
5
1 2 3 4 5 6 7 8 9 10 11 12
# sp
eci
es
Quadrat
2013
2014
2015
2016
Report for
Golden Sun Moth Monitoring 2016 | Yarralumla Equestrian Park Offset | ACT Government Land Development
Agency | 3002461
SMEC Australia | Page 20
GSM Flying Surveys
All flying moth surveys were undertaken during the peak period of GSM activity in the ACT and are consequently valid representations of GSM activity levels at the YEP offset site. GSM activity observed during the traverse surveys was moderate during the first and second surveys and low during the last survey.
The timed traverse surveys indicate that GSM numbers ranged from low (i.e. 0-2 moths per minute) to moderate (2-10 moths per minute) based on the semi-quantitative GSM site assessment method developed by David Hogg Pty Ltd (2010). Moderate to high numbers were observed on the first survey in parts of YEP west of Yarralumla Creek (Figure 3). The relatively continuous distribution of records along the traverse route indicate that GSM are flying across the majority of open areas in YEP (Figure 8).
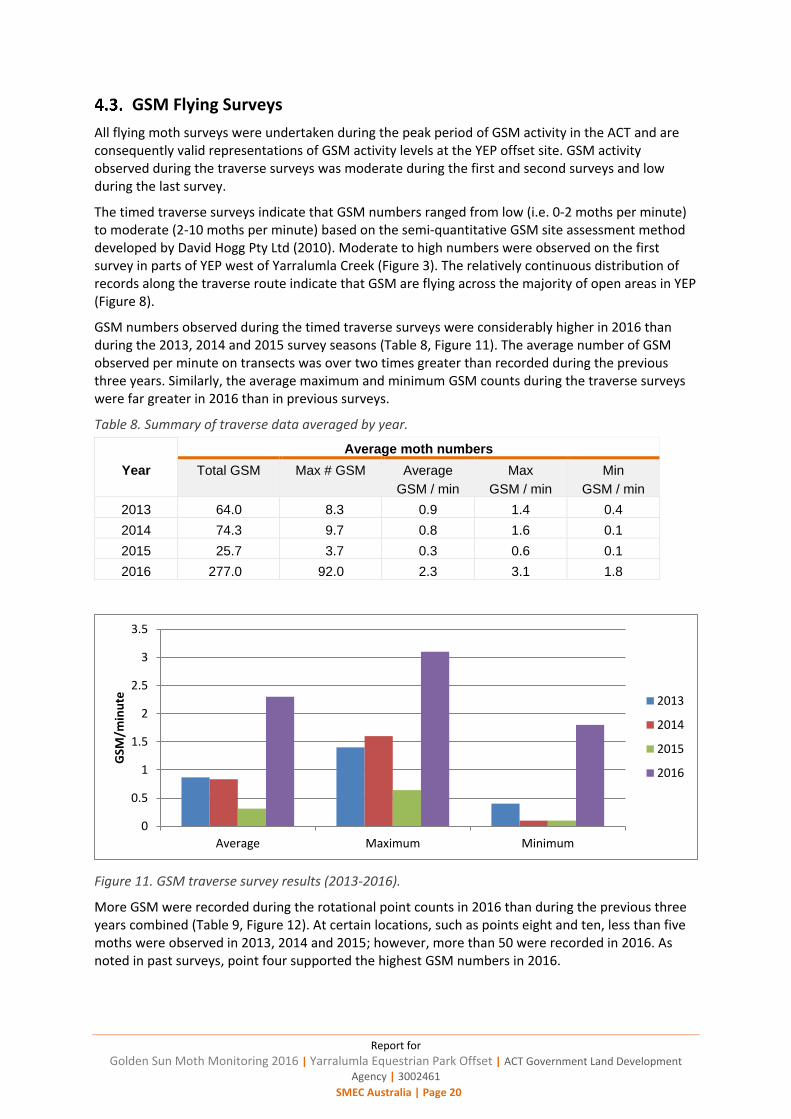
GSM numbers observed during the timed traverse surveys were considerably higher in 2016 than during the 2013, 2014 and 2015 survey seasons (Table 8, Figure 11). The average number of GSM observed per minute on transects was over two times greater than recorded during the previous three years. Similarly, the average maximum and minimum GSM counts during the traverse surveys were far greater in 2016 than in previous surveys.
Table 8. Summary of traverse data averaged by year.
Year
Average moth numbers
Total GSM Max # GSM Average
GSM / min
Max
GSM / min
Min
GSM / min
2013 64.0 8.3 0.9 1.4 0.4
2014 74.3 9.7 0.8 1.6 0.1
2015 25.7 3.7 0.3 0.6 0.1
2016 277.0 92.0 2.3 3.1 1.8
Figure 11. GSM traverse survey results (2013-2016).
More GSM were recorded during the rotational point counts in 2016 than during the previous three years combined (Table 9, Figure 12). At certain locations, such as points eight and ten, less than five moths were observed in 2013, 2014 and 2015; however, more than 50 were recorded in 2016. As noted in past surveys, point four supported the highest GSM numbers in 2016.
0
0.5
1
1.5
2
2.5
3
3.5
Average Maximum Minimum
GSM
/min
ute 2013
2014
2015
2016
Report for
Golden Sun Moth Monitoring 2016 | Yarralumla Equestrian Park Offset | ACT Government Land Development
Agency | 3002461
SMEC Australia | Page 21
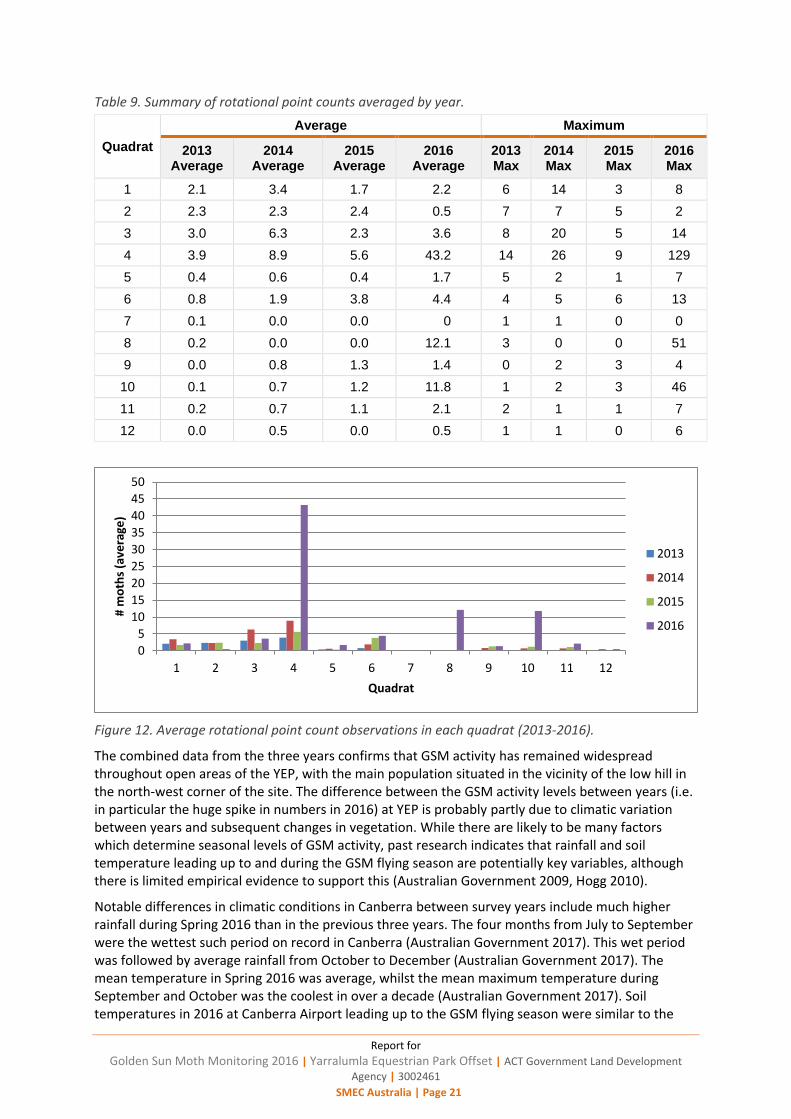
Table 9. Summary of rotational point counts averaged by year.
Quadrat
Average Maximum
2013 Average
2014 Average
2015 Average
2016 Average
2013 Max
2014 Max
2015 Max
2016 Max
1 2.1 3.4 1.7 2.2 6 14 3 8
2 2.3 2.3 2.4 0.5 7 7 5 2
3 3.0 6.3 2.3 3.6 8 20 5 14
4 3.9 8.9 5.6 43.2 14 26 9 129
5 0.4 0.6 0.4 1.7 5 2 1 7
6 0.8 1.9 3.8 4.4 4 5 6 13
7 0.1 0.0 0.0 0 1 1 0 0
8 0.2 0.0 0.0 12.1 3 0 0 51
9 0.0 0.8 1.3 1.4 0 2 3 4
10 0.1 0.7 1.2 11.8 1 2 3 46
11 0.2 0.7 1.1 2.1 2 1 1 7
12 0.0 0.5 0.0 0.5 1 1 0 6
Figure 12. Average rotational point count observations in each quadrat (2013-2016).
The combined data from the three years confirms that GSM activity has remained widespread throughout open areas of the YEP, with the main population situated in the vicinity of the low hill in the north-west corner of the site. The difference between the GSM activity levels between years (i.e. in particular the huge spike in numbers in 2016) at YEP is probably partly due to climatic variation between years and subsequent changes in vegetation. While there are likely to be many factors which determine seasonal levels of GSM activity, past research indicates that rainfall and soil temperature leading up to and during the GSM flying season are potentially key variables, although there is limited empirical evidence to support this (Australian Government 2009, Hogg 2010).
Notable differences in climatic conditions in Canberra between survey years include much higher rainfall during Spring 2016 than in the previous three years. The four months from July to September were the wettest such period on record in Canberra (Australian Government 2017). This wet period was followed by average rainfall from October to December (Australian Government 2017). The mean temperature in Spring 2016 was average, whilst the mean maximum temperature during September and October was the coolest in over a decade (Australian Government 2017). Soil temperatures in 2016 at Canberra Airport leading up to the GSM flying season were similar to the
0
5
10
15
20
25
30
35
40
45
50
1 2 3 4 5 6 7 8 9 10 11 12
# m
oth
s (a
vera
ge)
Quadrat
2013
2014
2015
2016
Report for
Golden Sun Moth Monitoring 2016 | Yarralumla Equestrian Park Offset | ACT Government Land Development
Agency | 3002461
SMEC Australia | Page 22
previous surveys (i.e. 2013 to 2015) (Figure 7). BoM did not record soil temperature data between mid-November and mid-December 2013, which limits comparison of these months from 2013 to 2015.
No obvious temperature or rainfall effect appears to correspond with regular GSM activity; however, there was regular rainfall from September to mid-November in 2016 which caused a delay in the GSM flying season (Section 3.7, Figure 5). Higher soil temperature in late November to early December coincides with the GSM survey; however, the maximum soil temperature and minimum soil temperature (Figure 6) in spring 2016 was lower compared to previous years.
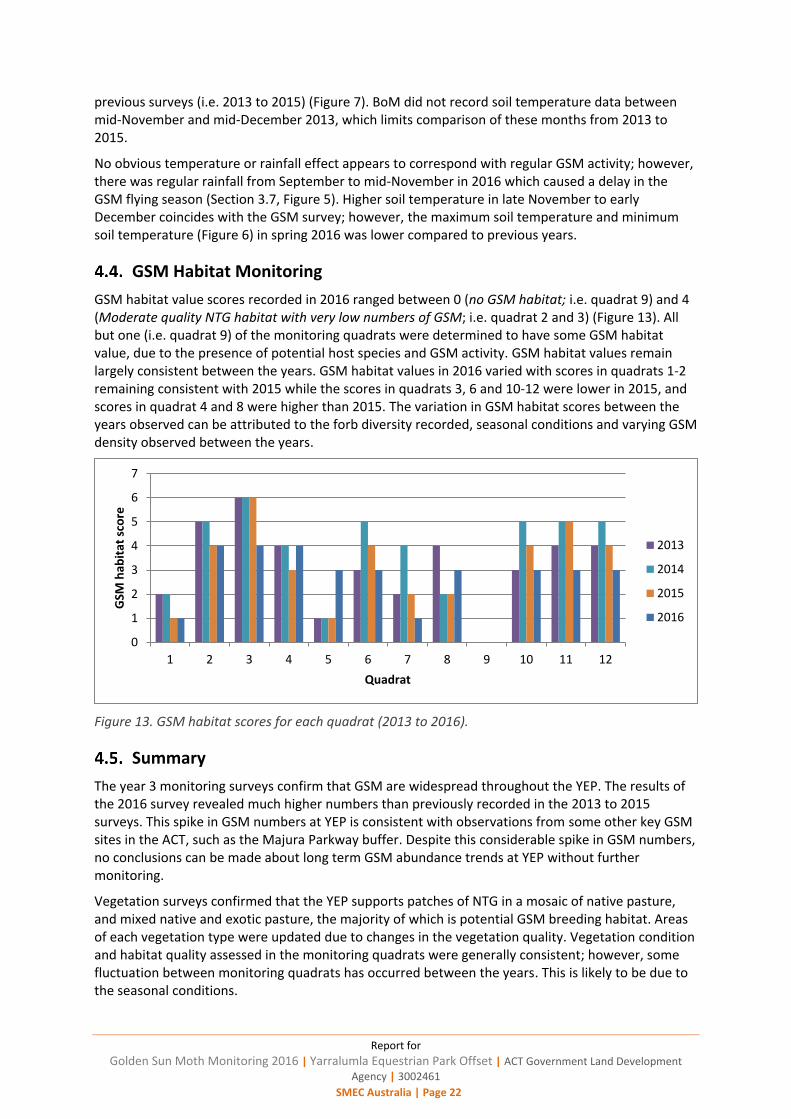
GSM Habitat Monitoring
GSM habitat value scores recorded in 2016 ranged between 0 (no GSM habitat; i.e. quadrat 9) and 4 (Moderate quality NTG habitat with very low numbers of GSM; i.e. quadrat 2 and 3) (Figure 13). All but one (i.e. quadrat 9) of the monitoring quadrats were determined to have some GSM habitat value, due to the presence of potential host species and GSM activity. GSM habitat values remain largely consistent between the years. GSM habitat values in 2016 varied with scores in quadrats 1-2 remaining consistent with 2015 while the scores in quadrats 3, 6 and 10-12 were lower in 2015, and scores in quadrat 4 and 8 were higher than 2015. The variation in GSM habitat scores between the years observed can be attributed to the forb diversity recorded, seasonal conditions and varying GSM density observed between the years.
Figure 13. GSM habitat scores for each quadrat (2013 to 2016).
Summary
The year 3 monitoring surveys confirm that GSM are widespread throughout the YEP. The results of the 2016 survey revealed much higher numbers than previously recorded in the 2013 to 2015 surveys. This spike in GSM numbers at YEP is consistent with observations from some other key GSM sites in the ACT, such as the Majura Parkway buffer. Despite this considerable spike in GSM numbers, no conclusions can be made about long term GSM abundance trends at YEP without further monitoring.
Vegetation surveys confirmed that the YEP supports patches of NTG in a mosaic of native pasture, and mixed native and exotic pasture, the majority of which is potential GSM breeding habitat. Areas of each vegetation type were updated due to changes in the vegetation quality. Vegetation condition and habitat quality assessed in the monitoring quadrats were generally consistent; however, some fluctuation between monitoring quadrats has occurred between the years. This is likely to be due to the seasonal conditions.
0
1
2
3
4
5
6
7
1 2 3 4 5 6 7 8 9 10 11 12
GSM
hab
itat
sco
re
Quadrat
2013
2014
2015
2016

Report for
Golden Sun Moth Monitoring 2016 | Yarralumla Equestrian Park Offset | ACT Government Land Development
Agency | 3002461
SMEC Australia | Page 23
5. Compliance with the Offset Management Plan
Survey Requirements
All surveys were conducted according to the methods specified in the OMP (RJPL 2014a). Quadrats were located at co-ordinates specified in the 2013 monitoring report (RJPL 2014b), which are consistent with Figure 5 of the OMP (RJPL 2014a), rather than at the incorrect co-ordinates reported in Appendix B of the OMP.
Reporting Requirements
The OMP (RJPL 2014a) requires that annual monitoring reports meet the following specifications:
An annual monitoring report would be prepared by February each year meeting the EPBC Act approval requirements by:
providing and assessing the monitoring data for the previous twelve months against the previous monitoring results
concluding whether or not there has been a lack of increase or a decline in GSM population numbers in the YEP due to equestrian activities, taking into account regional population trends and local ecological conditions
concluding whether or not there has been no improvement or a decline in GSM habitat and NTG quality and extent in the YEP due to equestrian activities, taking into account local ecological conditions.
The OMP would be made available on the ACT Government’s website within 12 months of implementation.
Annual monitoring reports would also be made available on the ACT Government’s website following monitoring activities in November-December of the preceding year.
The current report represents the year 3 monitoring report. Results are compared with previous monitoring results in Section 5; suggests that the GSM population has remained consistent since 2013 however; it is inappropriate to infer from four years of data.
The preparation of this report fulfils the reporting requirements for year 3, as specified in the OMP (RJPL 2014a).
Report for
Golden Sun Moth Monitoring 2016 | Yarralumla Equestrian Park Offset | ACT Government Land Development
Agency | 3002461
SMEC Australia | Page 24
6. Conclusion and Key Outcomes
This report presents the findings of the GSM flying moth, vegetation condition and GSM habitat condition surveys conducted in 2016 in accordance with the Yarralumla Equestrian Park Offset Management Plan (RJPL 2014a, the OMP).
Data is provided in summarised form suitable for incorporation into future trend analysis. All survey data is presented in Appendices A and B. Meteorological data obtained for Canberra Airport from the Bureau of Meteorology is summarised in Appendices C and D.
The key results are:
Overall changes to vegetation mapping were minor since the 2015 survey, except for the small increase (i.e. ~0.3 ha), in Chilean needle grass distribution and the substantial expansion of African lovegrass
GSM habitat quality mapping remained consistent since the 2015 survey
Grassland quality and GSM habitat quality assessed at each of the monitoring quadrats was consistent or higher than in previous years; this is likely to be due to the seasonal conditions and timing of the assessments
GSM flying activity at YEP was the highest on record and confirm that GSM widespread. Variation in flying moth activity between years is within that expected due to the highly variable nature of GSM flying activity
In all survey years, male moths were observed flying in areas not considered in the OMP to meet criteria for classification as GSM habitat; future surveys may consider what grass species GSM may be using in these areas
Meteorological data for 2013 to 2016 was reviewed in relation to the survey results; however, trends could not be determined from just four years of data
No GSM pupa cases were observed throughout YEP
Sixteen female GSM were observed at YEP during the 2016 surveys.
This report confirms that the GSM population is widespread throughout the YEP and that moths are co-existing with current site management practices and equestrian activities. The GSM population continues to be relatively stable and is not showing any decline; however, it is not possible to make any statements relating to long-term GSM population trends from just four years of monitoring data.
Based on the observed expansion of Chilean needlegrass and African lovegrass within YEP, it is recommended that current weed management practices be reviewed to ensure that future degradation of natural temperate grassland and GSM habitat due to weed invasion is avoided.
This report fulfils the reporting requirements for GSM monitoring at the YEP for year 3 as specified in the OMP (RJPL 2014a).
Report for
Golden Sun Moth Monitoring 2016 | Yarralumla Equestrian Park Offset | ACT Government Land Development
Agency | 3002461
SMEC Australia | Page 25
References
ACT Government. 2010a. Survey guidelines for golden sun moth, Conservation Planning and Research, Canberra.
ACT Government. 2010b. Survey guidelines for determining lowland vegetation classification and condition in the ACT. Conservation Planning and Research, Canberra.
Australian Government. 2009. Significant impact guidelines for the critically end angered golden sun moth (Synemon plana). National threatened species and ecological communities. EPBC Act policy statement 3.12. Department of Environment, Water, Heritage and the Arts, Australian Government, Canberra, ACT. 13 p.
Australian Government. 2011. Natural Temperate Grassland of the Southern Tablelands of NSW and the Australian Capital Territory. Advice to the Minister for the Environment and Heritage from the Endangered Species Scientific Subcommittee (ESSS) on a proposal to add an ecological community to Schedule 2 of the Endangered Species Protection Act 1992 (ESP Act). Department of the Environment, Australian Government. Site accessed 17 October 2013. http://www.environment.gov.au/biodiversity/threatened/communities/natural-temperate-grasslands.html.
Australian Government. 2014. Annual Climate Report 2013. Bureau of Meteorology. Site accessed 18 January 2015. www.bom.gov.au/climate/annual_sum/2013//
Australian Government. 2015. Annual Climate Report 2014. Bureau of Meteorology. Site accessed 18 January 2015. www.bom.gov.au/climate/annual_sum/2014//
Australian Government. 2016. Annual Climate Report 2015. Bureau of Meteorology. Site accessed 18 January 2015. www.bom.gov.au/climate/annual_sum/2013//
Australian Government. 2017. Canberra in 2016: A warm, wet year. Bureau of Meteorology. Site accessed 18 April 2017. http://www.bom.gov.au/climate/current/annual/act/summary.shtml
Environment ACT. 2005. National recovery plan for natural temperate grassland of the Southern Tablelands (NSW and ACT): An endangered ecological community. Environment ACT, ACT Government, Canberra, ACT. 54 p.
Hogg, D. 2010. Semi-quantitative assessment of golden sun moths. David Hogg Pty Ltd, Canberra, ACT. 6 p.
Hogg, D. 2012. Application of EPBC Act offsets assessment guide to the golden sun moth. David Hogg Pty Ltd, Canberra, ACT. 5 p.
Nash, K and Hogg, D. 2013. Application of EPBC Act offset assessment guide to natural temperate grassland of the Southern Tablelands of NSW and the Australian Capital Territory. David Hogg Pty Ltd, Canberra, ACT. 8 p.
Nash, K.; Hogg, D.McC. and Rowell, A. 2013. Conservation management plan, Yarralumla Equestrian Park, Lady Denman Drive, Yarralumla, ACT. Report prepared for the Land Development Agency. David Hogg Pty Ltd, Canberra, ACT. 17 p. + figures.
Robert Jessop Pty Ltd. 2015. Yarralumla Equestrian Park offset management plan. 2014 Monitoring Report. Report prepared for the Land Development Agency, ACT Government. Robert Jessop Pty Ltd. Canberra, ACT.
Robert Jessop Pty Ltd. 2014a. Yarralumla Equestrian Park offset management plan. Report prepared for the Land Development Agency, ACT Government. Robert Jessop Pty Ltd. Canberra, ACT.
Report for
Golden Sun Moth Monitoring 2016 | Yarralumla Equestrian Park Offset | ACT Government Land Development
Agency | 3002461
SMEC Australia | Page 26
Robert Jessop Pty Ltd. 2014b. Yarralumla Equestrian Park offset. 2013 monitoring report. Report prepared for the ACT Government. Robert Jessop Pty Ltd. Canberra, ACT. 33 p.
Rowell, A. 2013. Golden sun moth (Synemon plana) surveys adjacent to Lady Denman Drive, Weston Creek November – December 2012. Report prepared for the Land Development Agency, ACT Government. Alison Rowell Biologist and Environmental Consultant, Dickson, ACT. 21 p.
Rehwinkel, R. 2007. A method to assess grassy ecosystem sites: Using floristic information to assess a site’s quality. NSW Department of Environment and Climate Change, Sydney.
SMEC 2016
Williams, N.S.G, Marshall, A., and Morgan, J.W. 2015. Land of sweeping plans. Management and restoring the native grassland of south-eastern Australia. CSIRO Publishing, Melbourne.

Report for
Golden Sun Moth Monitoring 2016 | Yarralumla Equestrian Park Offset | ACT Government Land Development Agency | 3002461
SMEC Australia | Page 27
Appendices
Report for
Golden Sun Moth Monitoring 2016 | Yarralumla Equestrian Park Offset | ACT Government Land Development Agency | 3002461
SMEC Australia | Page 28
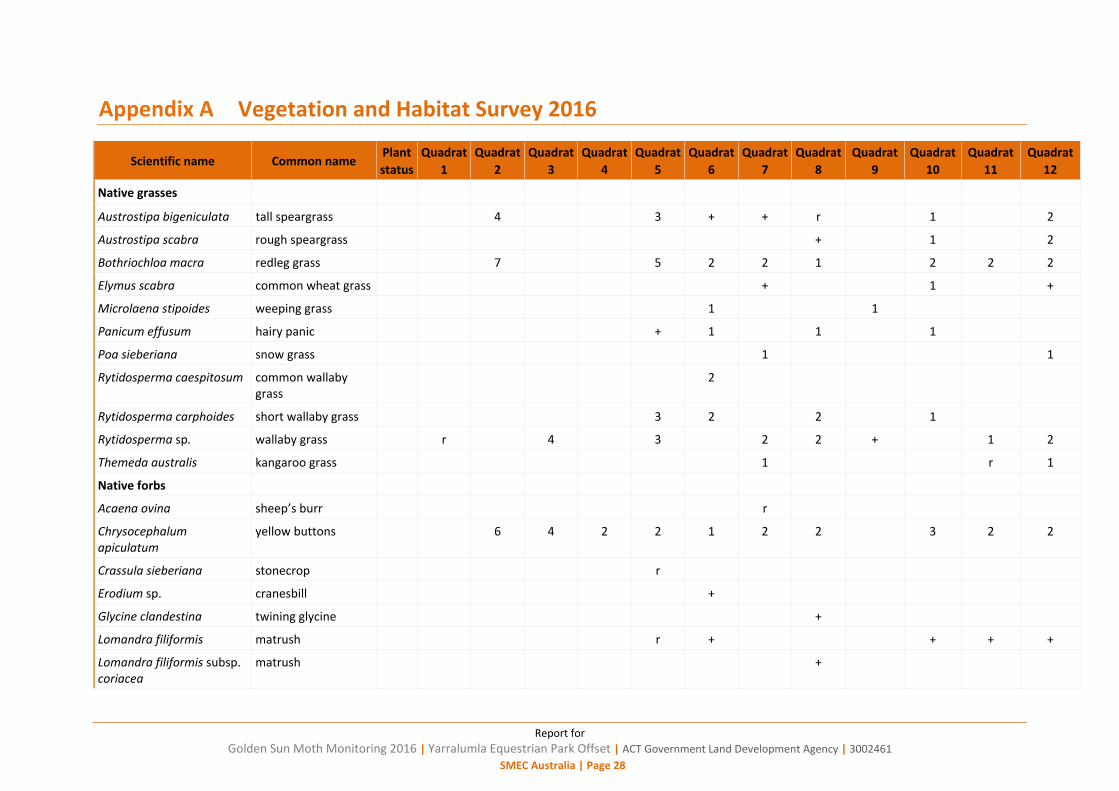
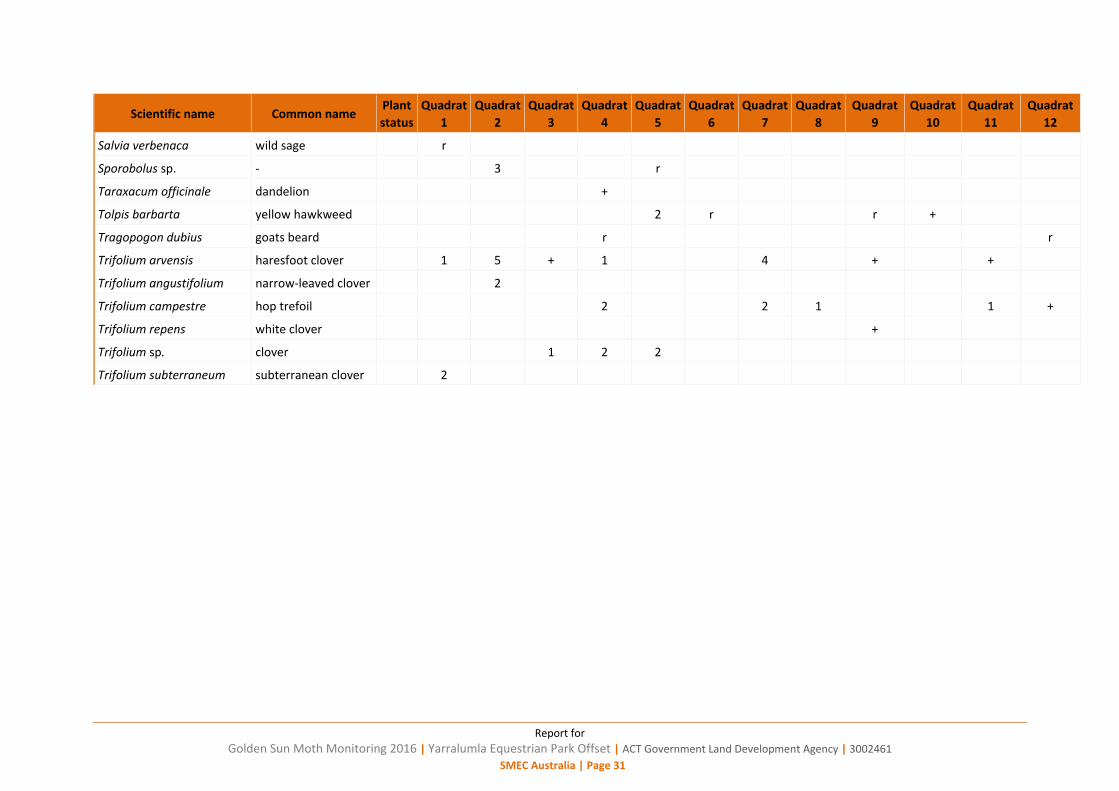
Vegetation and Habitat Survey 2016
Scientific name Common name Plant
status
Quadrat
1
Quadrat
2
Quadrat
3
Quadrat
4
Quadrat
5
Quadrat
6
Quadrat
7
Quadrat
8
Quadrat
9
Quadrat
10
Quadrat
11
Quadrat
12
Native grasses
Austrostipa bigeniculata tall speargrass 4 3 + + r 1 2
Austrostipa scabra rough speargrass + 1 2
Bothriochloa macra redleg grass 7 5 2 2 1 2 2 2
Elymus scabra common wheat grass + 1 +
Microlaena stipoides weeping grass 1 1
Panicum effusum hairy panic + 1 1 1
Poa sieberiana snow grass 1 1
Rytidosperma caespitosum common wallaby grass
2
Rytidosperma carphoides short wallaby grass 3 2 2 1
Rytidosperma sp. wallaby grass r 4 3 2 2 + 1 2
Themeda australis kangaroo grass 1 r 1
Native forbs
Acaena ovina sheep’s burr r
Chrysocephalum apiculatum
yellow buttons 6 4 2 2 1 2 2 3 2 2
Crassula sieberiana stonecrop r
Erodium sp. cranesbill +
Glycine clandestina twining glycine +
Lomandra filiformis matrush r + + + +
Lomandra filiformis subsp. coriacea
matrush +
Report for
Golden Sun Moth Monitoring 2016 | Yarralumla Equestrian Park Offset | ACT Government Land Development Agency | 3002461
SMEC Australia | Page 29
Scientific name Common name Plant
status
Quadrat
1
Quadrat
2
Quadrat
3
Quadrat
4
Quadrat
5
Quadrat
6
Quadrat
7
Quadrat
8
Quadrat
9
Quadrat
10
Quadrat
11
Quadrat
12
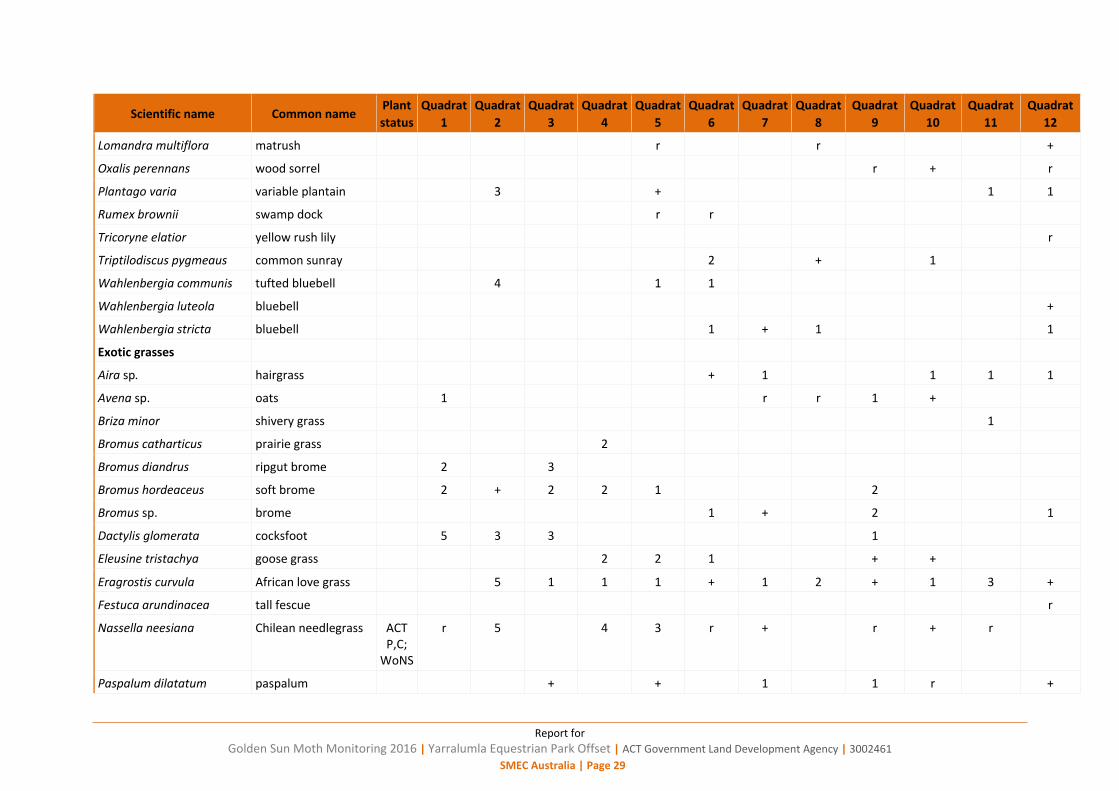
Lomandra multiflora matrush r r +
Oxalis perennans wood sorrel r + r
Plantago varia variable plantain 3 + 1 1
Rumex brownii swamp dock r r
Tricoryne elatior yellow rush lily r
Triptilodiscus pygmeaus common sunray 2 + 1
Wahlenbergia communis tufted bluebell 4 1 1
Wahlenbergia luteola bluebell +
Wahlenbergia stricta bluebell 1 + 1 1
Exotic grasses
Aira sp. hairgrass + 1 1 1 1
Avena sp. oats 1 r r 1 +
Briza minor shivery grass 1
Bromus catharticus prairie grass 2
Bromus diandrus ripgut brome 2 3
Bromus hordeaceus soft brome 2 + 2 2 1 2
Bromus sp. brome 1 + 2 1
Dactylis glomerata cocksfoot 5 3 3 1
Eleusine tristachya goose grass 2 2 1 + +
Eragrostis curvula African love grass 5 1 1 1 + 1 2 + 1 3 +
Festuca arundinacea tall fescue r
Nassella neesiana Chilean needlegrass ACT P,C;
WoNS
r 5 4 3 r + r + r
Paspalum dilatatum paspalum + + 1 1 r +
Report for
Golden Sun Moth Monitoring 2016 | Yarralumla Equestrian Park Offset | ACT Government Land Development Agency | 3002461
SMEC Australia | Page 30
Scientific name Common name Plant
status
Quadrat
1
Quadrat
2
Quadrat
3
Quadrat
4
Quadrat
5
Quadrat
6
Quadrat
7
Quadrat
8
Quadrat
9
Quadrat
10
Quadrat
11
Quadrat
12
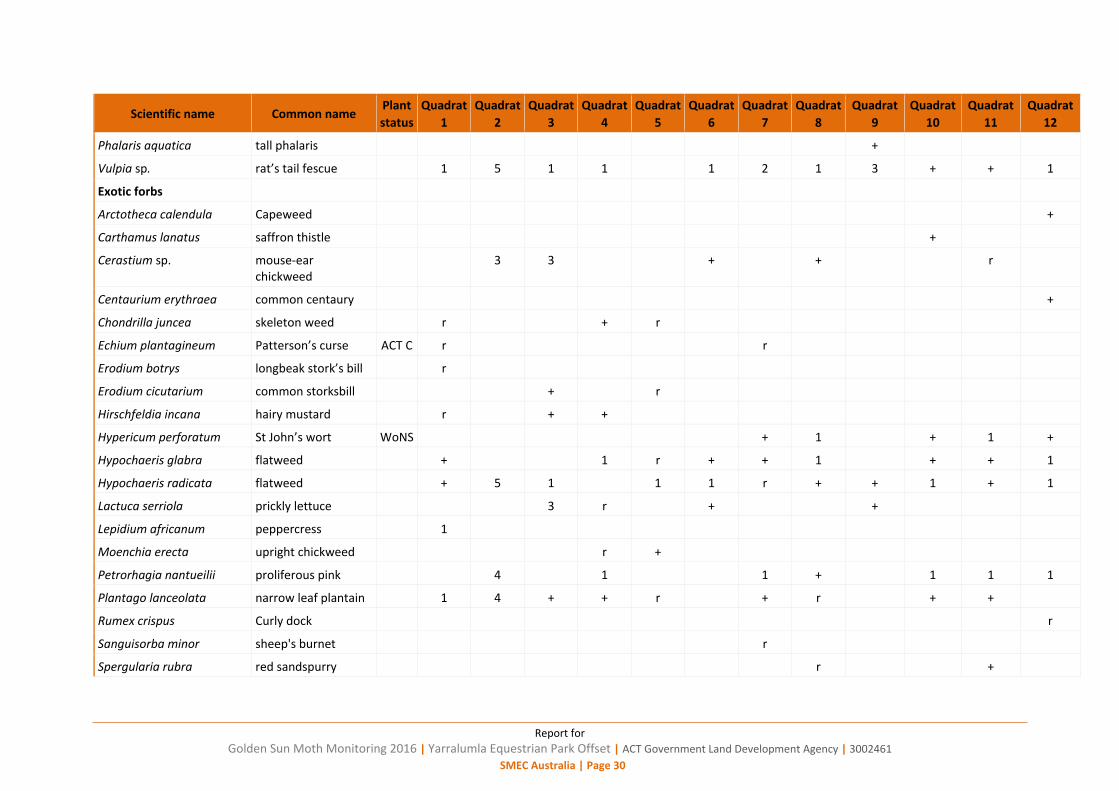
Phalaris aquatica tall phalaris +
Vulpia sp. rat’s tail fescue 1 5 1 1
1 2 1 3 + + 1
Exotic forbs
Arctotheca calendula Capeweed +
Carthamus lanatus saffron thistle +
Cerastium sp. mouse-ear chickweed
3 3 + + r
Centaurium erythraea common centaury +
Chondrilla juncea skeleton weed r + r
Echium plantagineum Patterson’s curse ACT C r r
Erodium botrys longbeak stork’s bill r
Erodium cicutarium common storksbill + r
Hirschfeldia incana hairy mustard r + +
Hypericum perforatum St John’s wort WoNS + 1 + 1 +
Hypochaeris glabra flatweed + 1 r + + 1 + + 1
Hypochaeris radicata flatweed + 5 1 1 1 r + + 1 + 1
Lactuca serriola prickly lettuce 3 r + +
Lepidium africanum peppercress 1
Moenchia erecta upright chickweed r +
Petrorhagia nantueilii proliferous pink 4 1 1 + 1 1 1
Plantago lanceolata narrow leaf plantain 1 4 + + r + r + +
Rumex crispus Curly dock r
Sanguisorba minor sheep's burnet
r
Spergularia rubra red sandspurry r +
Report for
Golden Sun Moth Monitoring 2016 | Yarralumla Equestrian Park Offset | ACT Government Land Development Agency | 3002461
SMEC Australia | Page 31
Scientific name Common name Plant
status
Quadrat
1
Quadrat
2
Quadrat
3
Quadrat
4
Quadrat
5
Quadrat
6
Quadrat
7
Quadrat
8
Quadrat
9
Quadrat
10
Quadrat
11
Quadrat
12
Salvia verbenaca wild sage r
Sporobolus sp. - 3 r
Taraxacum officinale dandelion +
Tolpis barbarta yellow hawkweed 2 r r +
Tragopogon dubius goats beard r r
Trifolium arvensis haresfoot clover 1 5 + 1 4 + +
Trifolium angustifolium narrow-leaved clover 2
Trifolium campestre hop trefoil 2 2 1 1 +
Trifolium repens white clover +
Trifolium sp. clover 1 2 2
Trifolium subterraneum subterranean clover 2
Report for
Golden Sun Moth Monitoring 2016 | Yarralumla Equestrian Park Offset | ACT Government Land Development Agency | 3002461
SMEC Australia | Page 32
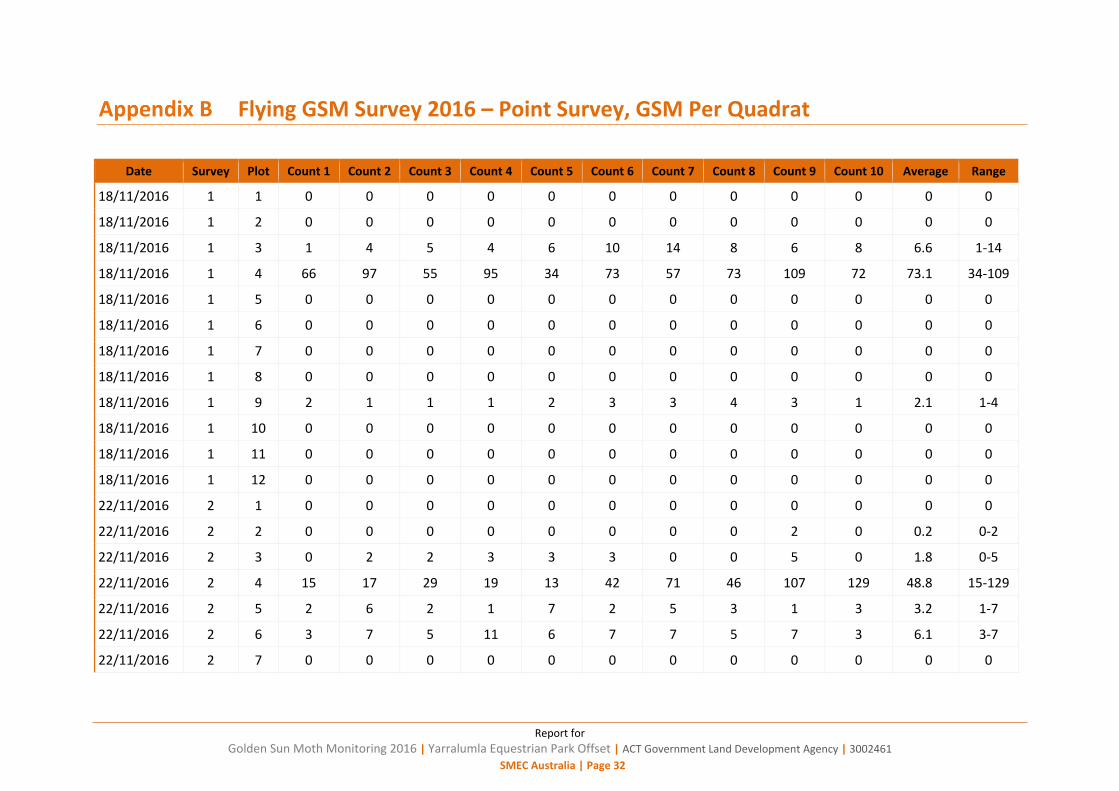
Flying GSM Survey 2016 – Point Survey, GSM Per Quadrat
Date Survey Plot Count 1 Count 2 Count 3 Count 4 Count 5 Count 6 Count 7 Count 8 Count 9 Count 10 Average Range
18/11/2016 1 1 0 0 0 0 0 0 0 0 0 0 0 0
18/11/2016 1 2 0 0 0 0 0 0 0 0 0 0 0 0
18/11/2016 1 3 1 4 5 4 6 10 14 8 6 8 6.6 1-14
18/11/2016 1 4 66 97 55 95 34 73 57 73 109 72 73.1 34-109
18/11/2016 1 5 0 0 0 0 0 0 0 0 0 0 0 0
18/11/2016 1 6 0 0 0 0 0 0 0 0 0 0 0 0
18/11/2016 1 7 0 0 0 0 0 0 0 0 0 0 0 0
18/11/2016 1 8 0 0 0 0 0 0 0 0 0 0 0 0
18/11/2016 1 9 2 1 1 1 2 3 3 4 3 1 2.1 1-4
18/11/2016 1 10 0 0 0 0 0 0 0 0 0 0 0 0
18/11/2016 1 11 0 0 0 0 0 0 0 0 0 0 0 0
18/11/2016 1 12 0 0 0 0 0 0 0 0 0 0 0 0
22/11/2016 2 1 0 0 0 0 0 0 0 0 0 0 0 0
22/11/2016 2 2 0 0 0 0 0 0 0 0 2 0 0.2 0-2
22/11/2016 2 3 0 2 2 3 3 3 0 0 5 0 1.8 0-5
22/11/2016 2 4 15 17 29 19 13 42 71 46 107 129 48.8 15-129
22/11/2016 2 5 2 6 2 1 7 2 5 3 1 3 3.2 1-7
22/11/2016 2 6 3 7 5 11 6 7 7 5 7 3 6.1 3-7
22/11/2016 2 7 0 0 0 0 0 0 0 0 0 0 0 0
Report for
Golden Sun Moth Monitoring 2016 | Yarralumla Equestrian Park Offset | ACT Government Land Development Agency | 3002461
SMEC Australia | Page 33
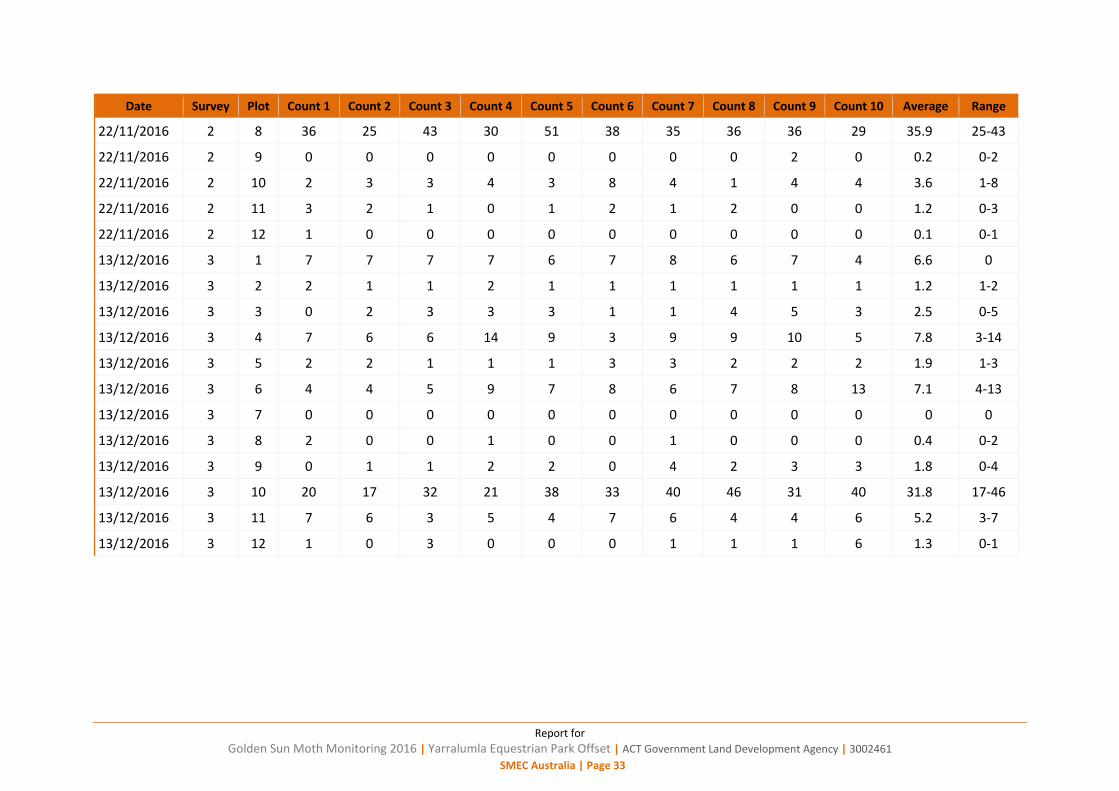
Date Survey Plot Count 1 Count 2 Count 3 Count 4 Count 5 Count 6 Count 7 Count 8 Count 9 Count 10 Average Range
22/11/2016 2 8 36 25 43 30 51 38 35 36 36 29 35.9 25-43
22/11/2016 2 9 0 0 0 0 0 0 0 0 2 0 0.2 0-2
22/11/2016 2 10 2 3 3 4 3 8 4 1 4 4 3.6 1-8
22/11/2016 2 11 3 2 1 0 1 2 1 2 0 0 1.2 0-3
22/11/2016 2 12 1 0 0 0 0 0 0 0 0 0 0.1 0-1
13/12/2016 3 1 7 7 7 7 6 7 8 6 7 4 6.6 0
13/12/2016 3 2 2 1 1 2 1 1 1 1 1 1 1.2 1-2
13/12/2016 3 3 0 2 3 3 3 1 1 4 5 3 2.5 0-5
13/12/2016 3 4 7 6 6 14 9 3 9 9 10 5 7.8 3-14
13/12/2016 3 5 2 2 1 1 1 3 3 2 2 2 1.9 1-3
13/12/2016 3 6 4 4 5 9 7 8 6 7 8 13 7.1 4-13
13/12/2016 3 7 0 0 0 0 0 0 0 0 0 0 0 0
13/12/2016 3 8 2 0 0 1 0 0 1 0 0 0 0.4 0-2
13/12/2016 3 9 0 1 1 2 2 0 4 2 3 3 1.8 0-4
13/12/2016 3 10 20 17 32 21 38 33 40 46 31 40 31.8 17-46
13/12/2016 3 11 7 6 3 5 4 7 6 4 4 6 5.2 3-7
13/12/2016 3 12 1 0 3 0 0 0 1 1 1 6 1.3 0-1
Report for
Golden Sun Moth Monitoring 2016 | Yarralumla Equestrian Park Offset | ACT Government Land Development
Agency | 3002461
SMEC Australia | Page 34
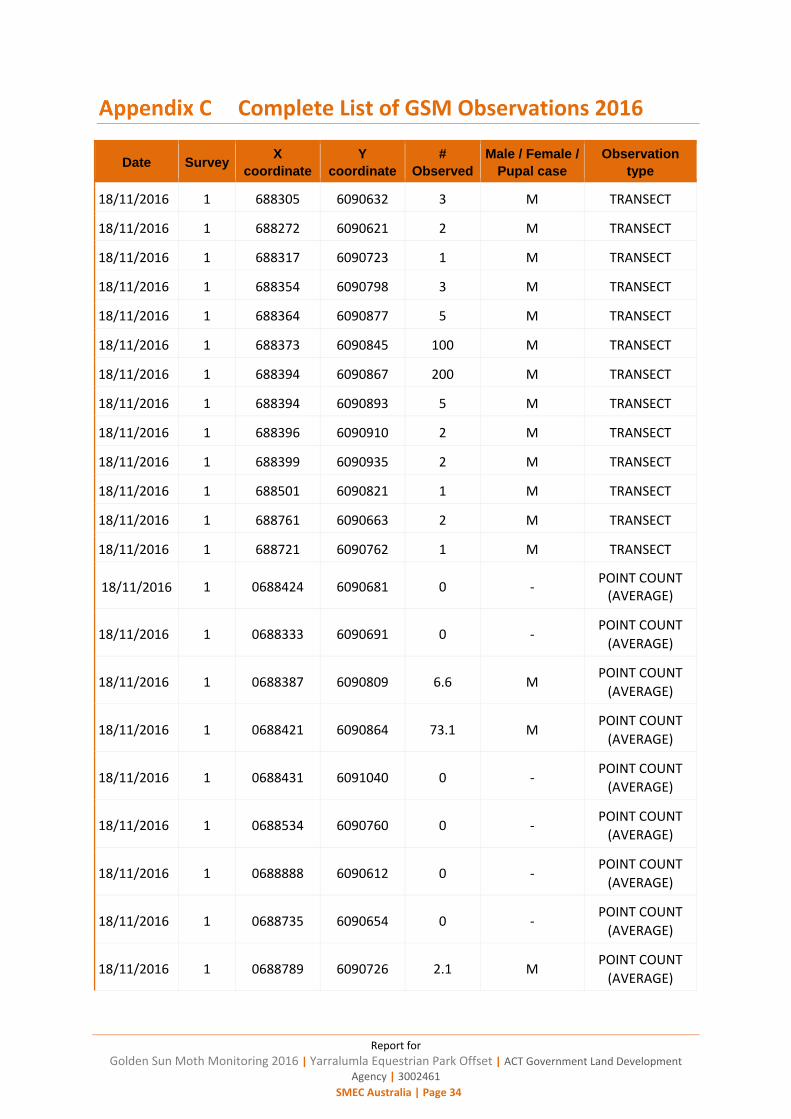
Complete List of GSM Observations 2016
Date Survey X
coordinate
Y
coordinate
#
Observed
Male / Female /
Pupal case
Observation
type
18/11/2016 1 688305 6090632 3 M TRANSECT
18/11/2016 1 688272 6090621 2 M TRANSECT
18/11/2016 1 688317 6090723 1 M TRANSECT
18/11/2016 1 688354 6090798 3 M TRANSECT
18/11/2016 1 688364 6090877 5 M TRANSECT
18/11/2016 1 688373 6090845 100 M TRANSECT
18/11/2016 1 688394 6090867 200 M TRANSECT
18/11/2016 1 688394 6090893 5 M TRANSECT
18/11/2016 1 688396 6090910 2 M TRANSECT
18/11/2016 1 688399 6090935 2 M TRANSECT
18/11/2016 1 688501 6090821 1 M TRANSECT
18/11/2016 1 688761 6090663 2 M TRANSECT
18/11/2016 1 688721 6090762 1 M TRANSECT
18/11/2016 1 0688424 6090681 0 - POINT COUNT
(AVERAGE)
18/11/2016 1 0688333 6090691 0 - POINT COUNT
(AVERAGE)
18/11/2016 1 0688387 6090809 6.6 M POINT COUNT
(AVERAGE)
18/11/2016 1 0688421 6090864 73.1 M POINT COUNT
(AVERAGE)
18/11/2016 1 0688431 6091040 0 - POINT COUNT
(AVERAGE)
18/11/2016 1 0688534 6090760 0 - POINT COUNT
(AVERAGE)
18/11/2016 1 0688888 6090612 0 - POINT COUNT
(AVERAGE)
18/11/2016 1 0688735 6090654 0 - POINT COUNT
(AVERAGE)
18/11/2016 1 0688789 6090726 2.1 M POINT COUNT
(AVERAGE)
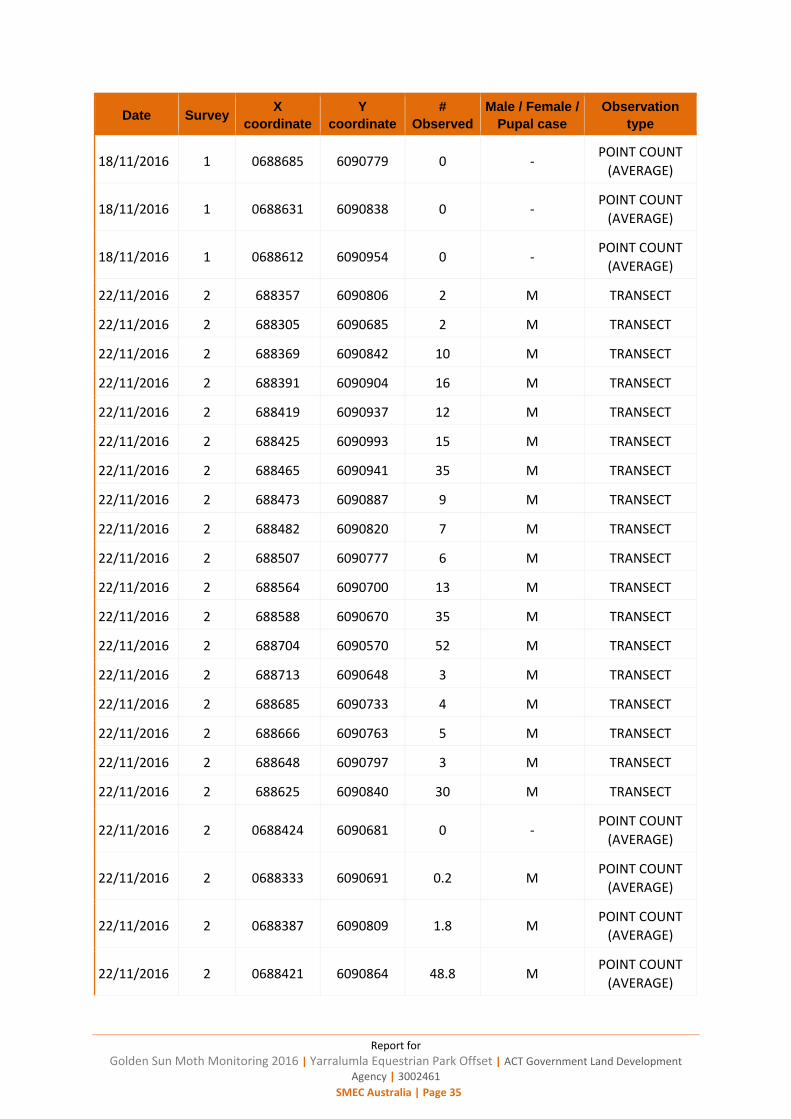
Report for
Golden Sun Moth Monitoring 2016 | Yarralumla Equestrian Park Offset | ACT Government Land Development
Agency | 3002461
SMEC Australia | Page 35
Date Survey X
coordinate
Y
coordinate
#
Observed
Male / Female /
Pupal case
Observation
type
18/11/2016 1 0688685 6090779 0 - POINT COUNT
(AVERAGE)
18/11/2016 1 0688631 6090838 0 - POINT COUNT
(AVERAGE)
18/11/2016 1 0688612 6090954 0 - POINT COUNT
(AVERAGE)
22/11/2016 2 688357 6090806 2 M TRANSECT
22/11/2016 2 688305 6090685 2 M TRANSECT
22/11/2016 2 688369 6090842 10 M TRANSECT
22/11/2016 2 688391 6090904 16 M TRANSECT
22/11/2016 2 688419 6090937 12 M TRANSECT
22/11/2016 2 688425 6090993 15 M TRANSECT
22/11/2016 2 688465 6090941 35 M TRANSECT
22/11/2016 2 688473 6090887 9 M TRANSECT
22/11/2016 2 688482 6090820 7 M TRANSECT
22/11/2016 2 688507 6090777 6 M TRANSECT
22/11/2016 2 688564 6090700 13 M TRANSECT
22/11/2016 2 688588 6090670 35 M TRANSECT
22/11/2016 2 688704 6090570 52 M TRANSECT
22/11/2016 2 688713 6090648 3 M TRANSECT
22/11/2016 2 688685 6090733 4 M TRANSECT
22/11/2016 2 688666 6090763 5 M TRANSECT
22/11/2016 2 688648 6090797 3 M TRANSECT
22/11/2016 2 688625 6090840 30 M TRANSECT
22/11/2016 2 0688424 6090681 0 - POINT COUNT
(AVERAGE)
22/11/2016 2 0688333 6090691 0.2 M POINT COUNT
(AVERAGE)
22/11/2016 2 0688387 6090809 1.8 M POINT COUNT
(AVERAGE)
22/11/2016 2 0688421 6090864 48.8 M POINT COUNT
(AVERAGE)
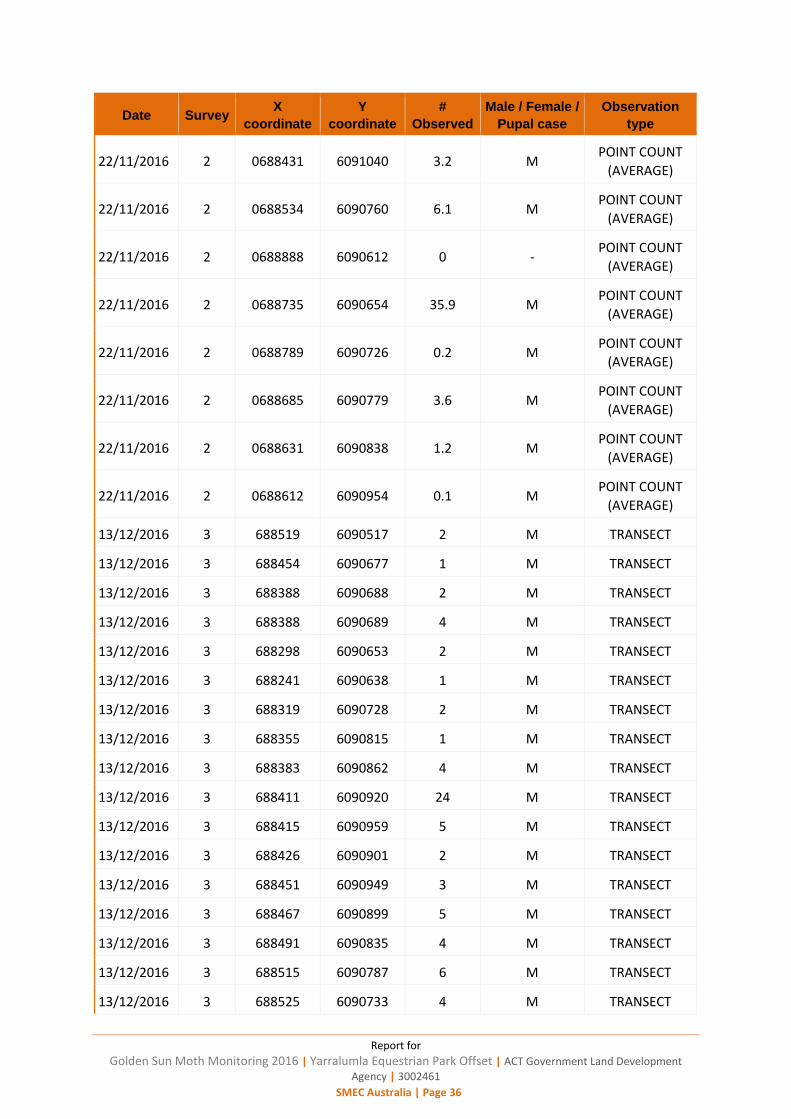
Report for
Golden Sun Moth Monitoring 2016 | Yarralumla Equestrian Park Offset | ACT Government Land Development
Agency | 3002461
SMEC Australia | Page 36
Date Survey X
coordinate
Y
coordinate
#
Observed
Male / Female /
Pupal case
Observation
type
22/11/2016 2 0688431 6091040 3.2 M POINT COUNT
(AVERAGE)
22/11/2016 2 0688534 6090760 6.1 M POINT COUNT
(AVERAGE)
22/11/2016 2 0688888 6090612 0 - POINT COUNT
(AVERAGE)
22/11/2016 2 0688735 6090654 35.9 M POINT COUNT
(AVERAGE)
22/11/2016 2 0688789 6090726 0.2 M POINT COUNT
(AVERAGE)
22/11/2016 2 0688685 6090779 3.6 M POINT COUNT
(AVERAGE)
22/11/2016 2 0688631 6090838 1.2 M POINT COUNT
(AVERAGE)
22/11/2016 2 0688612 6090954 0.1 M POINT COUNT
(AVERAGE)
13/12/2016 3 688519 6090517 2 M TRANSECT
13/12/2016 3 688454 6090677 1 M TRANSECT
13/12/2016 3 688388 6090688 2 M TRANSECT
13/12/2016 3 688388 6090689 4 M TRANSECT
13/12/2016 3 688298 6090653 2 M TRANSECT
13/12/2016 3 688241 6090638 1 M TRANSECT
13/12/2016 3 688319 6090728 2 M TRANSECT
13/12/2016 3 688355 6090815 1 M TRANSECT
13/12/2016 3 688383 6090862 4 M TRANSECT
13/12/2016 3 688411 6090920 24 M TRANSECT
13/12/2016 3 688415 6090959 5 M TRANSECT
13/12/2016 3 688426 6090901 2 M TRANSECT
13/12/2016 3 688451 6090949 3 M TRANSECT
13/12/2016 3 688467 6090899 5 M TRANSECT
13/12/2016 3 688491 6090835 4 M TRANSECT
13/12/2016 3 688515 6090787 6 M TRANSECT
13/12/2016 3 688525 6090733 4 M TRANSECT
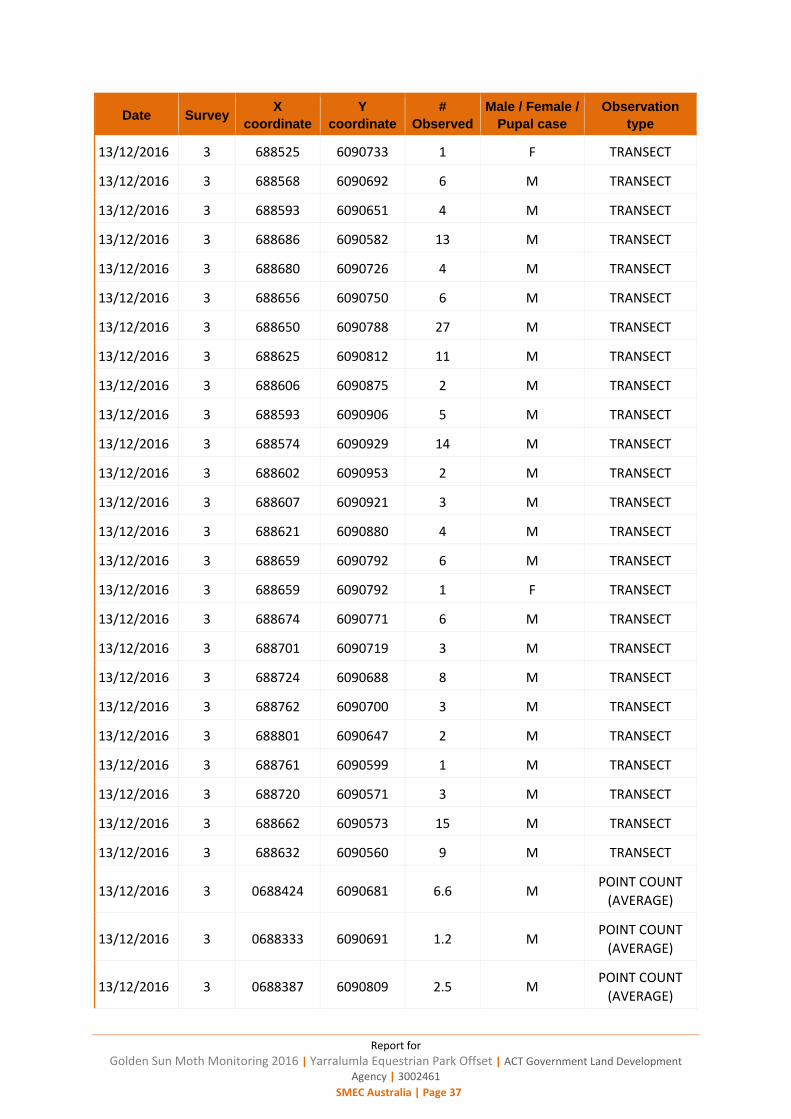
Report for
Golden Sun Moth Monitoring 2016 | Yarralumla Equestrian Park Offset | ACT Government Land Development
Agency | 3002461
SMEC Australia | Page 37
Date Survey X
coordinate
Y
coordinate
#
Observed
Male / Female /
Pupal case
Observation
type
13/12/2016 3 688525 6090733 1 F TRANSECT
13/12/2016 3 688568 6090692 6 M TRANSECT
13/12/2016 3 688593 6090651 4 M TRANSECT
13/12/2016 3 688686 6090582 13 M TRANSECT
13/12/2016 3 688680 6090726 4 M TRANSECT
13/12/2016 3 688656 6090750 6 M TRANSECT
13/12/2016 3 688650 6090788 27 M TRANSECT
13/12/2016 3 688625 6090812 11 M TRANSECT
13/12/2016 3 688606 6090875 2 M TRANSECT
13/12/2016 3 688593 6090906 5 M TRANSECT
13/12/2016 3 688574 6090929 14 M TRANSECT
13/12/2016 3 688602 6090953 2 M TRANSECT
13/12/2016 3 688607 6090921 3 M TRANSECT
13/12/2016 3 688621 6090880 4 M TRANSECT
13/12/2016 3 688659 6090792 6 M TRANSECT
13/12/2016 3 688659 6090792 1 F TRANSECT
13/12/2016 3 688674 6090771 6 M TRANSECT
13/12/2016 3 688701 6090719 3 M TRANSECT
13/12/2016 3 688724 6090688 8 M TRANSECT
13/12/2016 3 688762 6090700 3 M TRANSECT
13/12/2016 3 688801 6090647 2 M TRANSECT
13/12/2016 3 688761 6090599 1 M TRANSECT
13/12/2016 3 688720 6090571 3 M TRANSECT
13/12/2016 3 688662 6090573 15 M TRANSECT
13/12/2016 3 688632 6090560 9 M TRANSECT
13/12/2016 3 0688424 6090681 6.6 M POINT COUNT
(AVERAGE)
13/12/2016 3 0688333 6090691 1.2 M POINT COUNT
(AVERAGE)
13/12/2016 3 0688387 6090809 2.5 M POINT COUNT
(AVERAGE)
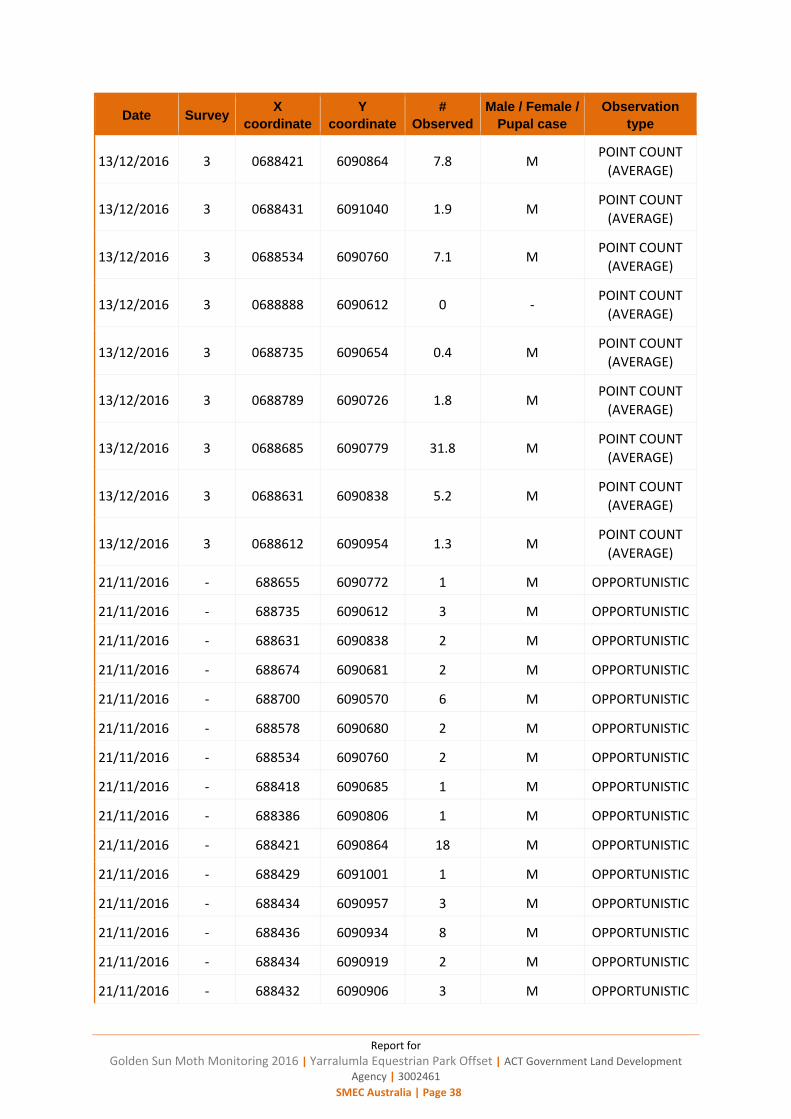
Report for
Golden Sun Moth Monitoring 2016 | Yarralumla Equestrian Park Offset | ACT Government Land Development
Agency | 3002461
SMEC Australia | Page 38
Date Survey X
coordinate
Y
coordinate
#
Observed
Male / Female /
Pupal case
Observation
type
13/12/2016 3 0688421 6090864 7.8 M POINT COUNT
(AVERAGE)
13/12/2016 3 0688431 6091040 1.9 M POINT COUNT
(AVERAGE)
13/12/2016 3 0688534 6090760 7.1 M POINT COUNT
(AVERAGE)
13/12/2016 3 0688888 6090612 0 - POINT COUNT
(AVERAGE)
13/12/2016 3 0688735 6090654 0.4 M POINT COUNT
(AVERAGE)
13/12/2016 3 0688789 6090726 1.8 M POINT COUNT
(AVERAGE)
13/12/2016 3 0688685 6090779 31.8 M POINT COUNT
(AVERAGE)
13/12/2016 3 0688631 6090838 5.2 M POINT COUNT
(AVERAGE)
13/12/2016 3 0688612 6090954 1.3 M POINT COUNT
(AVERAGE)
21/11/2016 - 688655 6090772 1 M OPPORTUNISTIC
21/11/2016 - 688735 6090612 3 M OPPORTUNISTIC
21/11/2016 - 688631 6090838 2 M OPPORTUNISTIC
21/11/2016 - 688674 6090681 2 M OPPORTUNISTIC
21/11/2016 - 688700 6090570 6 M OPPORTUNISTIC
21/11/2016 - 688578 6090680 2 M OPPORTUNISTIC
21/11/2016 - 688534 6090760 2 M OPPORTUNISTIC
21/11/2016 - 688418 6090685 1 M OPPORTUNISTIC
21/11/2016 - 688386 6090806 1 M OPPORTUNISTIC
21/11/2016 - 688421 6090864 18 M OPPORTUNISTIC
21/11/2016 - 688429 6091001 1 M OPPORTUNISTIC
21/11/2016 - 688434 6090957 3 M OPPORTUNISTIC
21/11/2016 - 688436 6090934 8 M OPPORTUNISTIC
21/11/2016 - 688434 6090919 2 M OPPORTUNISTIC
21/11/2016 - 688432 6090906 3 M OPPORTUNISTIC

Report for
Golden Sun Moth Monitoring 2016 | Yarralumla Equestrian Park Offset | ACT Government Land Development
Agency | 3002461
SMEC Australia | Page 39
Date Survey X
coordinate
Y
coordinate
#
Observed
Male / Female /
Pupal case
Observation
type
21/11/2016 - 688426 6090895 5 M OPPORTUNISTIC
21/11/2016 - 688534 6090760 1 M OPPORTUNISTIC
21/11/2016 - 688516 6090767 1 M OPPORTUNISTIC
21/11/2016 - 688467 6090805 1 M OPPORTUNISTIC
21/11/2016 - 688467 6090816 2 M OPPORTUNISTIC
21/11/2016 - 688470 6090831 2 M OPPORTUNISTIC
21/11/2016 - 688471 6090839 3 M OPPORTUNISTIC
21/11/2016 - 688469 6090890 1 M OPPORTUNISTIC
21/11/2016 - 688466 6090905 2 M OPPORTUNISTIC
21/11/2016 - 688469 6090922 3 M OPPORTUNISTIC
21/11/2016 - 688461 6090936 1 M OPPORTUNISTIC
21/11/2016 - 688456 6090954 2 M OPPORTUNISTIC
21/11/2016 - 688457 6090988 5 M OPPORTUNISTIC
22/11/2016 - 688381 6090805 1 M OPPORTUNISTIC
22/11/2016 - 688386 6090810 1 M OPPORTUNISTIC
22/11/2016 - 688414 6090916 15 M OPPORTUNISTIC
22/11/2016 - 688421 6090951 4 M OPPORTUNISTIC
22/11/2016 - 688443 6090101 5 M OPPORTUNISTIC
22/11/2016 - 688479 6090960 14 M OPPORTUNISTIC
22/11/2016 - 688479 6090917 30 M OPPORTUNISTIC
22/11/2016 - 688489 6090865 4 M OPPORTUNISTIC
22/11/2016 - 688522 6090777 7 M OPPORTUNISTIC
22/11/2016 - 688586 6090671 10 M OPPORTUNISTIC
22/11/2016 - 688767 6090734 1 M OPPORTUNISTIC
22/11/2016 - 688717 6090771 3 M OPPORTUNISTIC
22/11/2016 - 688677 6090779 3 M OPPORTUNISTIC
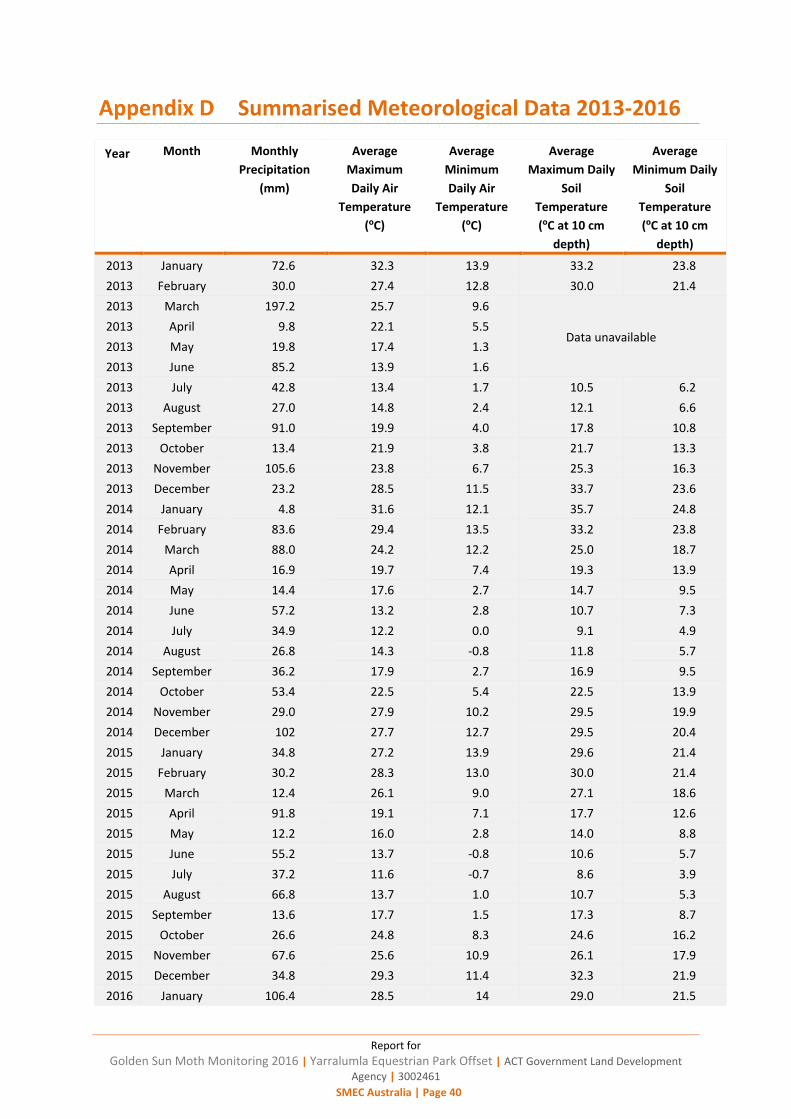
Report for
Golden Sun Moth Monitoring 2016 | Yarralumla Equestrian Park Offset | ACT Government Land Development
Agency | 3002461
SMEC Australia | Page 40
Summarised Meteorological Data 2013-2016
Year Month Monthly
Precipitation
(mm)
Average
Maximum
Daily Air
Temperature
(ºC)
Average
Minimum
Daily Air
Temperature
(ºC)
Average
Maximum Daily
Soil
Temperature
(ºC at 10 cm
depth)
Average
Minimum Daily
Soil
Temperature
(ºC at 10 cm
depth)
2013 January 72.6 32.3 13.9 33.2 23.8
2013 February 30.0 27.4 12.8 30.0 21.4
2013 March 197.2 25.7 9.6
Data unavailable 2013 April 9.8 22.1 5.5
2013 May 19.8 17.4 1.3
2013 June 85.2 13.9 1.6
2013 July 42.8 13.4 1.7 10.5 6.2
2013 August 27.0 14.8 2.4 12.1 6.6
2013 September 91.0 19.9 4.0 17.8 10.8
2013 October 13.4 21.9 3.8 21.7 13.3
2013 November 105.6 23.8 6.7 25.3 16.3
2013 December 23.2 28.5 11.5 33.7 23.6
2014 January 4.8 31.6 12.1 35.7 24.8
2014 February 83.6 29.4 13.5 33.2 23.8
2014 March 88.0 24.2 12.2 25.0 18.7
2014 April 16.9 19.7 7.4 19.3 13.9
2014 May 14.4 17.6 2.7 14.7 9.5
2014 June 57.2 13.2 2.8 10.7 7.3
2014 July 34.9 12.2 0.0 9.1 4.9
2014 August 26.8 14.3 -0.8 11.8 5.7
2014 September 36.2 17.9 2.7 16.9 9.5
2014 October 53.4 22.5 5.4 22.5 13.9
2014 November 29.0 27.9 10.2 29.5 19.9
2014 December 102 27.7 12.7 29.5 20.4
2015 January 34.8 27.2 13.9 29.6 21.4
2015 February 30.2 28.3 13.0 30.0 21.4
2015 March 12.4 26.1 9.0 27.1 18.6
2015 April 91.8 19.1 7.1 17.7 12.6
2015 May 12.2 16.0 2.8 14.0 8.8
2015 June 55.2 13.7 -0.8 10.6 5.7
2015 July 37.2 11.6 -0.7 8.6 3.9
2015 August 66.8 13.7 1.0 10.7 5.3
2015 September 13.6 17.7 1.5 17.3 8.7
2015 October 26.6 24.8 8.3 24.6 16.2
2015 November 67.6 25.6 10.9 26.1 17.9
2015 December 34.8 29.3 11.4 32.3 21.9
2016 January 106.4 28.5 14 29.0 21.5
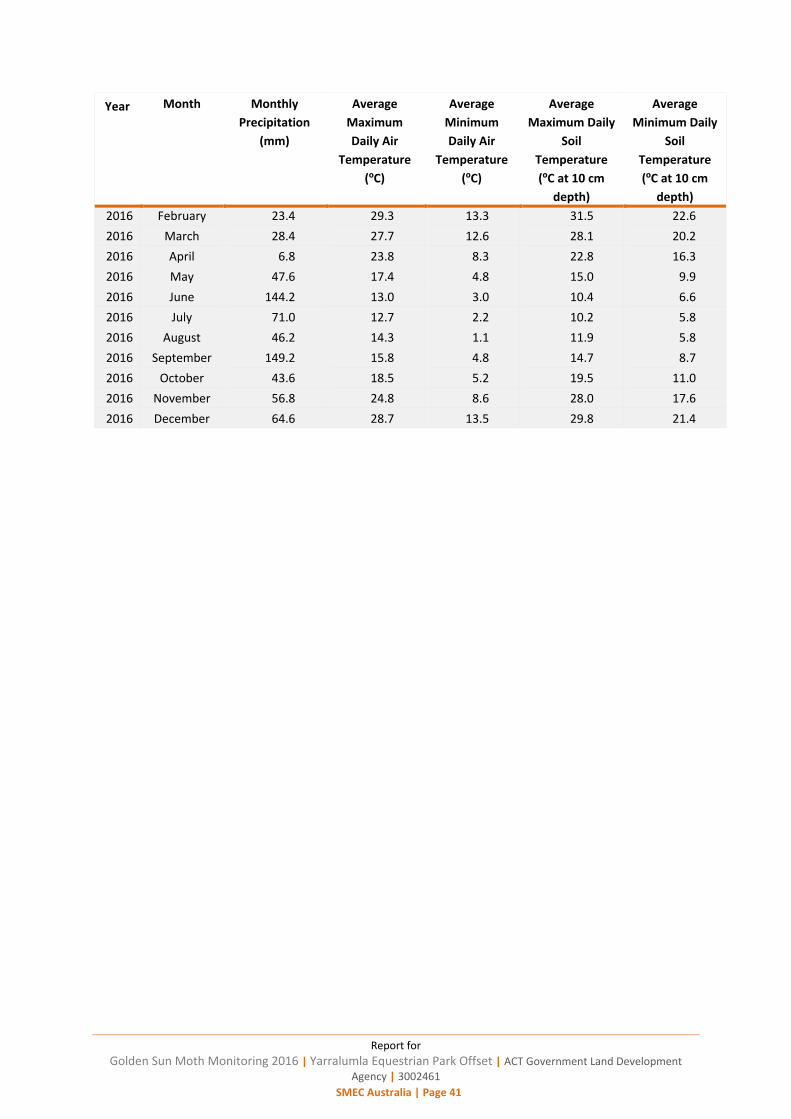
Report for
Golden Sun Moth Monitoring 2016 | Yarralumla Equestrian Park Offset | ACT Government Land Development
Agency | 3002461
SMEC Australia | Page 41
Year Month Monthly
Precipitation
(mm)
Average
Maximum
Daily Air
Temperature
(ºC)
Average
Minimum
Daily Air
Temperature
(ºC)
Average
Maximum Daily
Soil
Temperature
(ºC at 10 cm
depth)
Average
Minimum Daily
Soil
Temperature
(ºC at 10 cm
depth)
2016 February 23.4 29.3 13.3 31.5 22.6
2016 March 28.4 27.7 12.6 28.1 20.2
2016 April 6.8 23.8 8.3 22.8 16.3
2016 May 47.6 17.4 4.8 15.0 9.9
2016 June 144.2 13.0 3.0 10.4 6.6
2016 July 71.0 12.7 2.2 10.2 5.8
2016 August 46.2 14.3 1.1 11.9 5.8
2016 September 149.2 15.8 4.8 14.7 8.7
2016 October 43.6 18.5 5.2 19.5 11.0
2016 November 56.8 24.8 8.6 28.0 17.6
2016 December 64.6 28.7 13.5 29.8 21.4
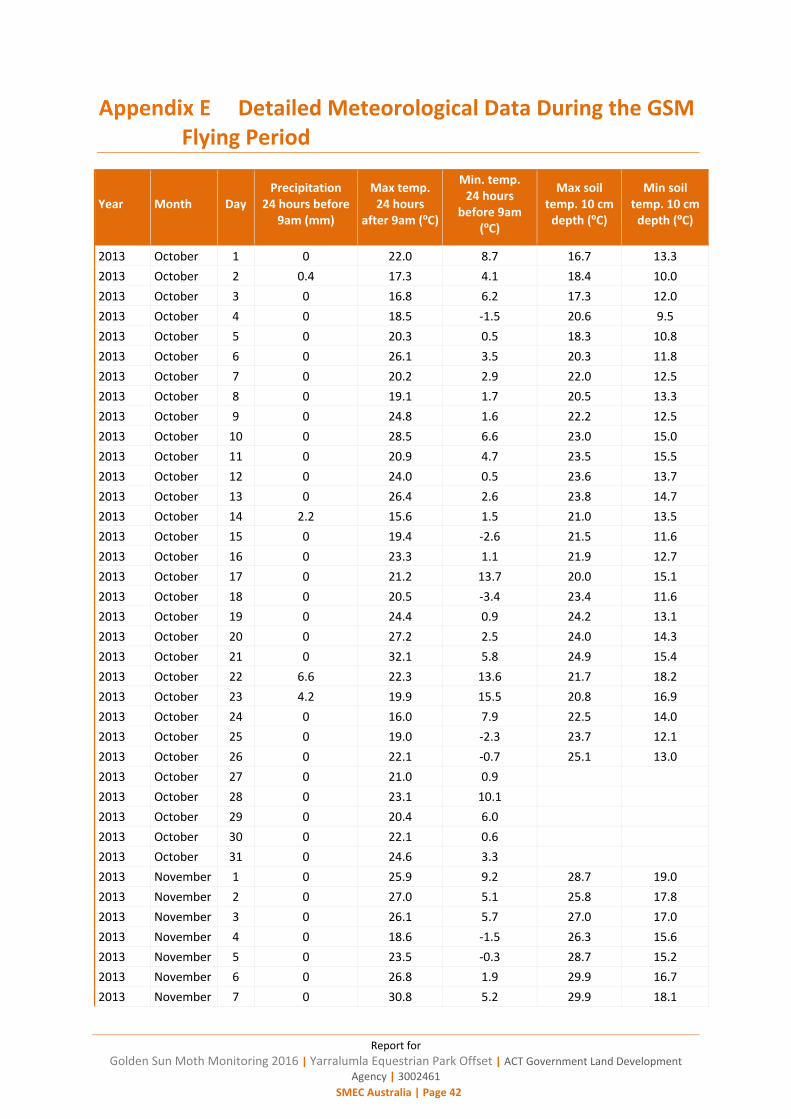
Report for
Golden Sun Moth Monitoring 2016 | Yarralumla Equestrian Park Offset | ACT Government Land Development
Agency | 3002461
SMEC Australia | Page 42
Detailed Meteorological Data During the GSM Flying Period
Year Month Day Precipitation
24 hours before 9am (mm)
Max temp. 24 hours
after 9am (ºC)
Min. temp. 24 hours
before 9am (ºC)
Max soil temp. 10 cm
depth (ºC)
Min soil temp. 10 cm
depth (ºC)
2013 October 1 0 22.0 8.7 16.7 13.3
2013 October 2 0.4 17.3 4.1 18.4 10.0
2013 October 3 0 16.8 6.2 17.3 12.0
2013 October 4 0 18.5 -1.5 20.6 9.5
2013 October 5 0 20.3 0.5 18.3 10.8
2013 October 6 0 26.1 3.5 20.3 11.8
2013 October 7 0 20.2 2.9 22.0 12.5
2013 October 8 0 19.1 1.7 20.5 13.3
2013 October 9 0 24.8 1.6 22.2 12.5
2013 October 10 0 28.5 6.6 23.0 15.0
2013 October 11 0 20.9 4.7 23.5 15.5
2013 October 12 0 24.0 0.5 23.6 13.7
2013 October 13 0 26.4 2.6 23.8 14.7
2013 October 14 2.2 15.6 1.5 21.0 13.5
2013 October 15 0 19.4 -2.6 21.5 11.6
2013 October 16 0 23.3 1.1 21.9 12.7
2013 October 17 0 21.2 13.7 20.0 15.1
2013 October 18 0 20.5 -3.4 23.4 11.6
2013 October 19 0 24.4 0.9 24.2 13.1
2013 October 20 0 27.2 2.5 24.0 14.3
2013 October 21 0 32.1 5.8 24.9 15.4
2013 October 22 6.6 22.3 13.6 21.7 18.2
2013 October 23 4.2 19.9 15.5 20.8 16.9
2013 October 24 0 16.0 7.9 22.5 14.0
2013 October 25 0 19.0 -2.3 23.7 12.1
2013 October 26 0 22.1 -0.7 25.1 13.0
2013 October 27 0 21.0 0.9
2013 October 28 0 23.1 10.1
2013 October 29 0 20.4 6.0
2013 October 30 0 22.1 0.6
2013 October 31 0 24.6 3.3
2013 November 1 0 25.9 9.2 28.7 19.0
2013 November 2 0 27.0 5.1 25.8 17.8
2013 November 3 0 26.1 5.7 27.0 17.0
2013 November 4 0 18.6 -1.5 26.3 15.6
2013 November 5 0 23.5 -0.3 28.7 15.2
2013 November 6 0 26.8 1.9 29.9 16.7
2013 November 7 0 30.8 5.2 29.9 18.1
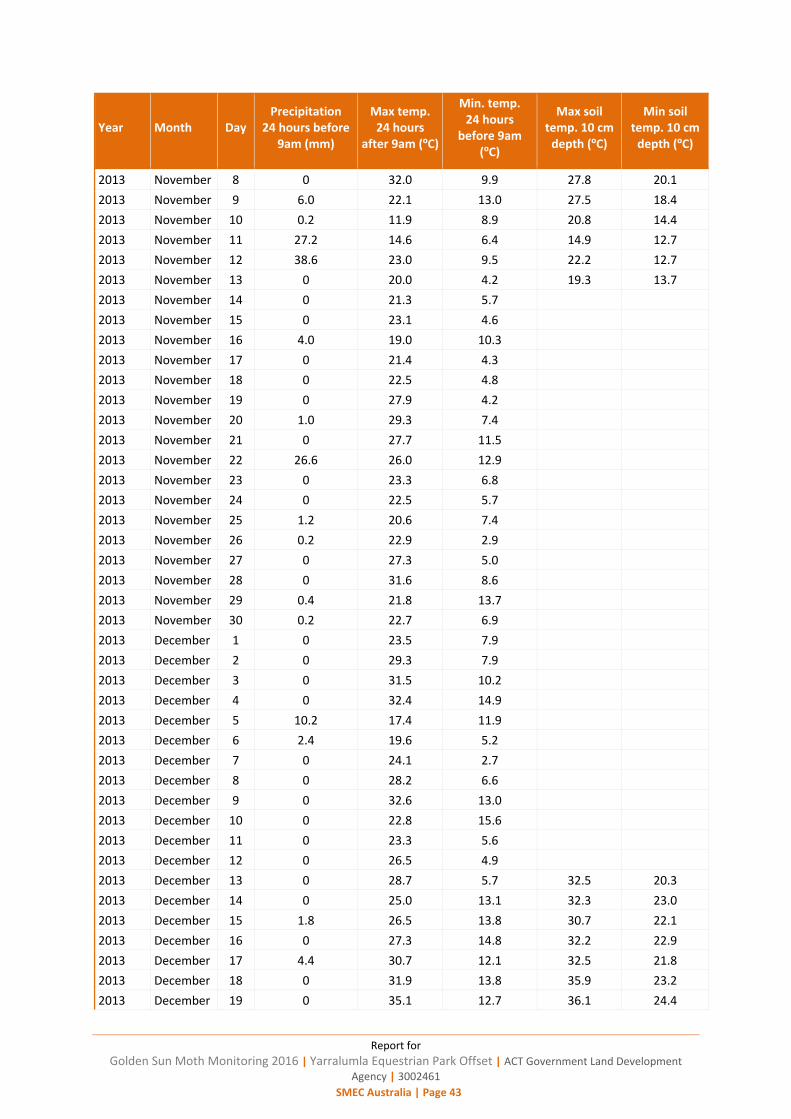
Report for
Golden Sun Moth Monitoring 2016 | Yarralumla Equestrian Park Offset | ACT Government Land Development
Agency | 3002461
SMEC Australia | Page 43
Year Month Day Precipitation
24 hours before 9am (mm)
Max temp. 24 hours
after 9am (ºC)
Min. temp. 24 hours
before 9am (ºC)
Max soil temp. 10 cm
depth (ºC)
Min soil temp. 10 cm
depth (ºC)
2013 November 8 0 32.0 9.9 27.8 20.1
2013 November 9 6.0 22.1 13.0 27.5 18.4
2013 November 10 0.2 11.9 8.9 20.8 14.4
2013 November 11 27.2 14.6 6.4 14.9 12.7
2013 November 12 38.6 23.0 9.5 22.2 12.7
2013 November 13 0 20.0 4.2 19.3 13.7
2013 November 14 0 21.3 5.7
2013 November 15 0 23.1 4.6
2013 November 16 4.0 19.0 10.3
2013 November 17 0 21.4 4.3
2013 November 18 0 22.5 4.8
2013 November 19 0 27.9 4.2
2013 November 20 1.0 29.3 7.4
2013 November 21 0 27.7 11.5
2013 November 22 26.6 26.0 12.9
2013 November 23 0 23.3 6.8
2013 November 24 0 22.5 5.7
2013 November 25 1.2 20.6 7.4
2013 November 26 0.2 22.9 2.9
2013 November 27 0 27.3 5.0
2013 November 28 0 31.6 8.6
2013 November 29 0.4 21.8 13.7
2013 November 30 0.2 22.7 6.9
2013 December 1 0 23.5 7.9
2013 December 2 0 29.3 7.9
2013 December 3 0 31.5 10.2
2013 December 4 0 32.4 14.9
2013 December 5 10.2 17.4 11.9
2013 December 6 2.4 19.6 5.2
2013 December 7 0 24.1 2.7
2013 December 8 0 28.2 6.6
2013 December 9 0 32.6 13.0
2013 December 10 0 22.8 15.6
2013 December 11 0 23.3 5.6
2013 December 12 0 26.5 4.9
2013 December 13 0 28.7 5.7 32.5 20.3
2013 December 14 0 25.0 13.1 32.3 23.0
2013 December 15 1.8 26.5 13.8 30.7 22.1
2013 December 16 0 27.3 14.8 32.2 22.9
2013 December 17 4.4 30.7 12.1 32.5 21.8
2013 December 18 0 31.9 13.8 35.9 23.2
2013 December 19 0 35.1 12.7 36.1 24.4
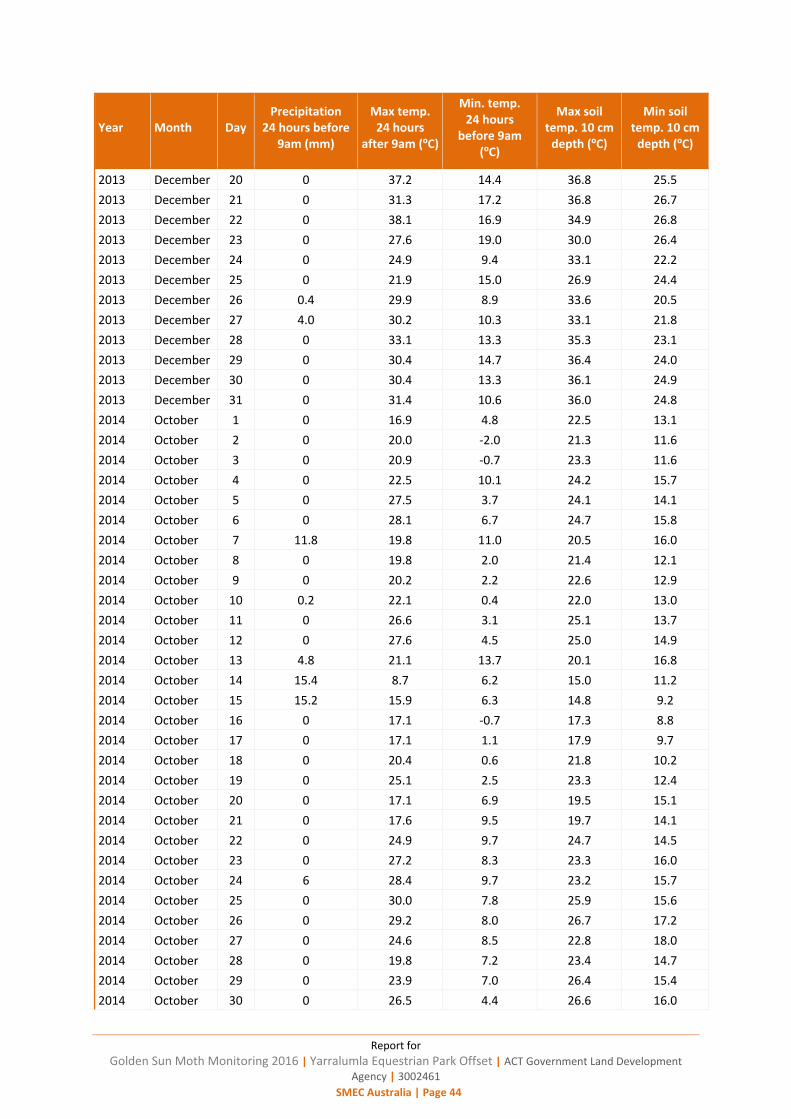
Report for
Golden Sun Moth Monitoring 2016 | Yarralumla Equestrian Park Offset | ACT Government Land Development
Agency | 3002461
SMEC Australia | Page 44
Year Month Day Precipitation
24 hours before 9am (mm)
Max temp. 24 hours
after 9am (ºC)
Min. temp. 24 hours
before 9am (ºC)
Max soil temp. 10 cm
depth (ºC)
Min soil temp. 10 cm
depth (ºC)
2013 December 20 0 37.2 14.4 36.8 25.5
2013 December 21 0 31.3 17.2 36.8 26.7
2013 December 22 0 38.1 16.9 34.9 26.8
2013 December 23 0 27.6 19.0 30.0 26.4
2013 December 24 0 24.9 9.4 33.1 22.2
2013 December 25 0 21.9 15.0 26.9 24.4
2013 December 26 0.4 29.9 8.9 33.6 20.5
2013 December 27 4.0 30.2 10.3 33.1 21.8
2013 December 28 0 33.1 13.3 35.3 23.1
2013 December 29 0 30.4 14.7 36.4 24.0
2013 December 30 0 30.4 13.3 36.1 24.9
2013 December 31 0 31.4 10.6 36.0 24.8
2014 October 1 0 16.9 4.8 22.5 13.1
2014 October 2 0 20.0 -2.0 21.3 11.6
2014 October 3 0 20.9 -0.7 23.3 11.6
2014 October 4 0 22.5 10.1 24.2 15.7
2014 October 5 0 27.5 3.7 24.1 14.1
2014 October 6 0 28.1 6.7 24.7 15.8
2014 October 7 11.8 19.8 11.0 20.5 16.0
2014 October 8 0 19.8 2.0 21.4 12.1
2014 October 9 0 20.2 2.2 22.6 12.9
2014 October 10 0.2 22.1 0.4 22.0 13.0
2014 October 11 0 26.6 3.1 25.1 13.7
2014 October 12 0 27.6 4.5 25.0 14.9
2014 October 13 4.8 21.1 13.7 20.1 16.8
2014 October 14 15.4 8.7 6.2 15.0 11.2
2014 October 15 15.2 15.9 6.3 14.8 9.2
2014 October 16 0 17.1 -0.7 17.3 8.8
2014 October 17 0 17.1 1.1 17.9 9.7
2014 October 18 0 20.4 0.6 21.8 10.2
2014 October 19 0 25.1 2.5 23.3 12.4
2014 October 20 0 17.1 6.9 19.5 15.1
2014 October 21 0 17.6 9.5 19.7 14.1
2014 October 22 0 24.9 9.7 24.7 14.5
2014 October 23 0 27.2 8.3 23.3 16.0
2014 October 24 6 28.4 9.7 23.2 15.7
2014 October 25 0 30.0 7.8 25.9 15.6
2014 October 26 0 29.2 8.0 26.7 17.2
2014 October 27 0 24.6 8.5 22.8 18.0
2014 October 28 0 19.8 7.2 23.4 14.7
2014 October 29 0 23.9 7.0 26.4 15.4
2014 October 30 0 26.5 4.4 26.6 16.0
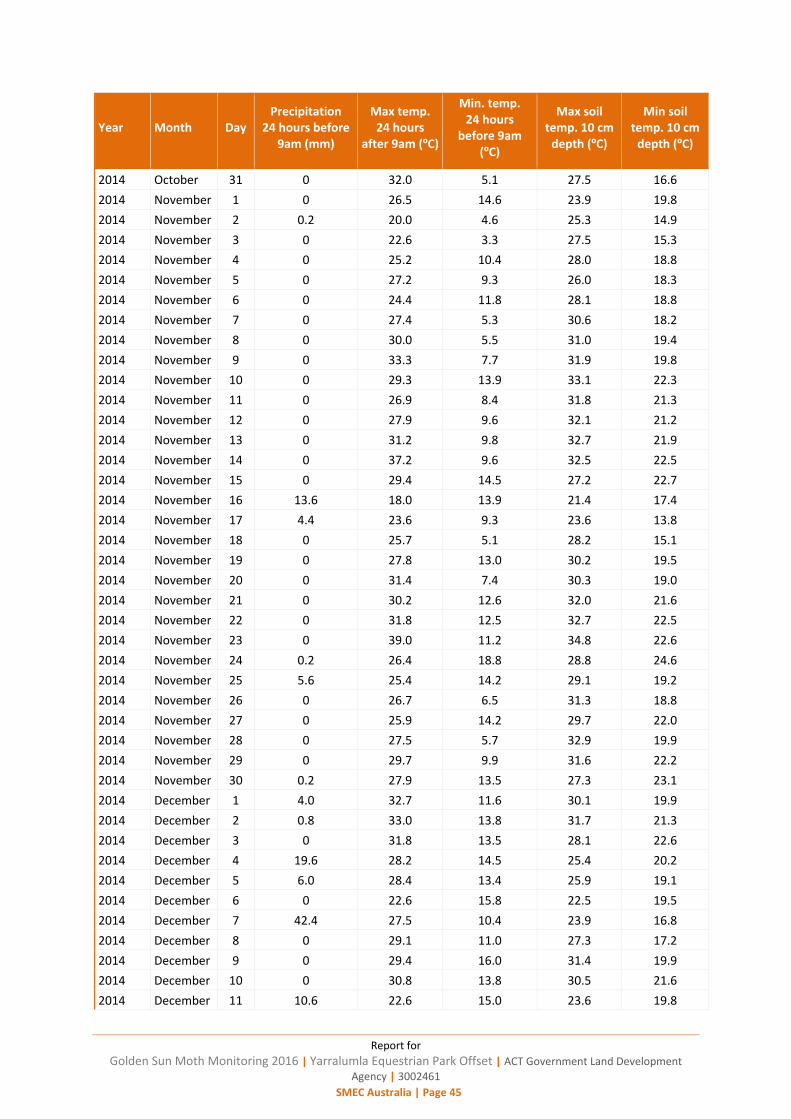
Report for
Golden Sun Moth Monitoring 2016 | Yarralumla Equestrian Park Offset | ACT Government Land Development
Agency | 3002461
SMEC Australia | Page 45
Year Month Day Precipitation
24 hours before 9am (mm)
Max temp. 24 hours
after 9am (ºC)
Min. temp. 24 hours
before 9am (ºC)
Max soil temp. 10 cm
depth (ºC)
Min soil temp. 10 cm
depth (ºC)
2014 October 31 0 32.0 5.1 27.5 16.6
2014 November 1 0 26.5 14.6 23.9 19.8
2014 November 2 0.2 20.0 4.6 25.3 14.9
2014 November 3 0 22.6 3.3 27.5 15.3
2014 November 4 0 25.2 10.4 28.0 18.8
2014 November 5 0 27.2 9.3 26.0 18.3
2014 November 6 0 24.4 11.8 28.1 18.8
2014 November 7 0 27.4 5.3 30.6 18.2
2014 November 8 0 30.0 5.5 31.0 19.4
2014 November 9 0 33.3 7.7 31.9 19.8
2014 November 10 0 29.3 13.9 33.1 22.3
2014 November 11 0 26.9 8.4 31.8 21.3
2014 November 12 0 27.9 9.6 32.1 21.2
2014 November 13 0 31.2 9.8 32.7 21.9
2014 November 14 0 37.2 9.6 32.5 22.5
2014 November 15 0 29.4 14.5 27.2 22.7
2014 November 16 13.6 18.0 13.9 21.4 17.4
2014 November 17 4.4 23.6 9.3 23.6 13.8
2014 November 18 0 25.7 5.1 28.2 15.1
2014 November 19 0 27.8 13.0 30.2 19.5
2014 November 20 0 31.4 7.4 30.3 19.0
2014 November 21 0 30.2 12.6 32.0 21.6
2014 November 22 0 31.8 12.5 32.7 22.5
2014 November 23 0 39.0 11.2 34.8 22.6
2014 November 24 0.2 26.4 18.8 28.8 24.6
2014 November 25 5.6 25.4 14.2 29.1 19.2
2014 November 26 0 26.7 6.5 31.3 18.8
2014 November 27 0 25.9 14.2 29.7 22.0
2014 November 28 0 27.5 5.7 32.9 19.9
2014 November 29 0 29.7 9.9 31.6 22.2
2014 November 30 0.2 27.9 13.5 27.3 23.1
2014 December 1 4.0 32.7 11.6 30.1 19.9
2014 December 2 0.8 33.0 13.8 31.7 21.3
2014 December 3 0 31.8 13.5 28.1 22.6
2014 December 4 19.6 28.2 14.5 25.4 20.2
2014 December 5 6.0 28.4 13.4 25.9 19.1
2014 December 6 0 22.6 15.8 22.5 19.5
2014 December 7 42.4 27.5 10.4 23.9 16.8
2014 December 8 0 29.1 11.0 27.3 17.2
2014 December 9 0 29.4 16.0 31.4 19.9
2014 December 10 0 30.8 13.8 30.5 21.6
2014 December 11 10.6 22.6 15.0 23.6 19.8
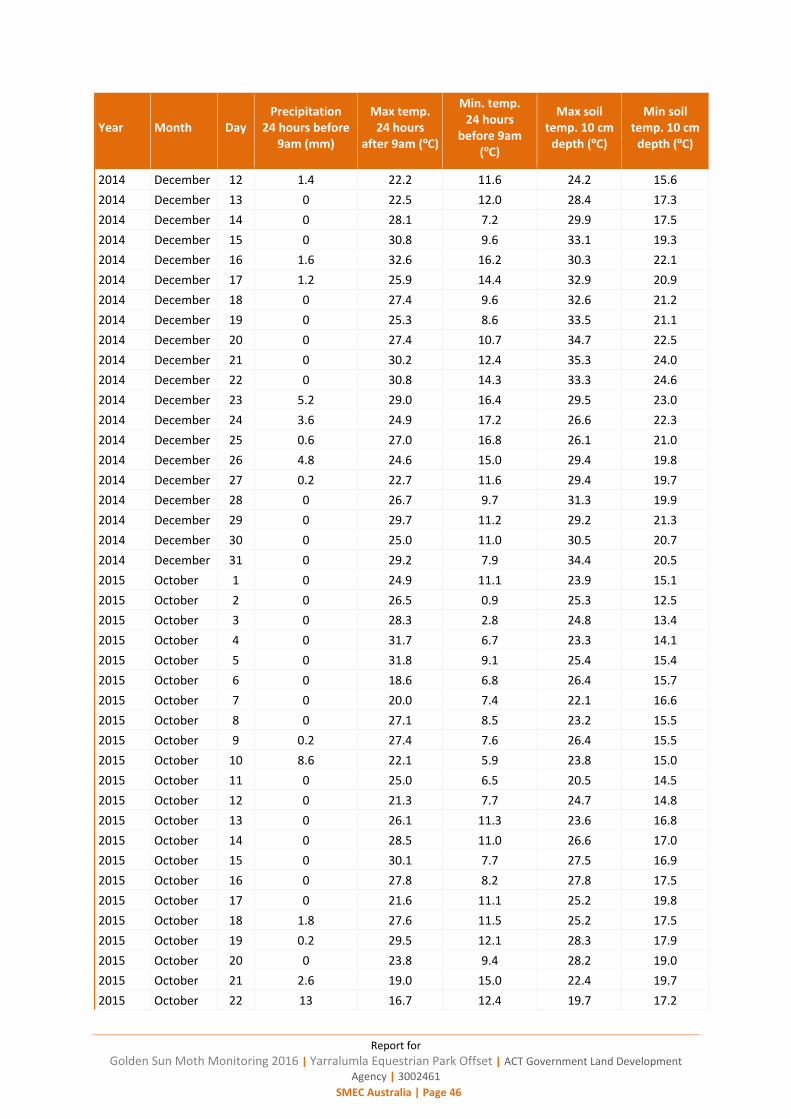
Report for
Golden Sun Moth Monitoring 2016 | Yarralumla Equestrian Park Offset | ACT Government Land Development
Agency | 3002461
SMEC Australia | Page 46
Year Month Day Precipitation
24 hours before 9am (mm)
Max temp. 24 hours
after 9am (ºC)
Min. temp. 24 hours
before 9am (ºC)
Max soil temp. 10 cm
depth (ºC)
Min soil temp. 10 cm
depth (ºC)
2014 December 12 1.4 22.2 11.6 24.2 15.6
2014 December 13 0 22.5 12.0 28.4 17.3
2014 December 14 0 28.1 7.2 29.9 17.5
2014 December 15 0 30.8 9.6 33.1 19.3
2014 December 16 1.6 32.6 16.2 30.3 22.1
2014 December 17 1.2 25.9 14.4 32.9 20.9
2014 December 18 0 27.4 9.6 32.6 21.2
2014 December 19 0 25.3 8.6 33.5 21.1
2014 December 20 0 27.4 10.7 34.7 22.5
2014 December 21 0 30.2 12.4 35.3 24.0
2014 December 22 0 30.8 14.3 33.3 24.6
2014 December 23 5.2 29.0 16.4 29.5 23.0
2014 December 24 3.6 24.9 17.2 26.6 22.3
2014 December 25 0.6 27.0 16.8 26.1 21.0
2014 December 26 4.8 24.6 15.0 29.4 19.8
2014 December 27 0.2 22.7 11.6 29.4 19.7
2014 December 28 0 26.7 9.7 31.3 19.9
2014 December 29 0 29.7 11.2 29.2 21.3
2014 December 30 0 25.0 11.0 30.5 20.7
2014 December 31 0 29.2 7.9 34.4 20.5
2015 October 1 0 24.9 11.1 23.9 15.1
2015 October 2 0 26.5 0.9 25.3 12.5
2015 October 3 0 28.3 2.8 24.8 13.4
2015 October 4 0 31.7 6.7 23.3 14.1
2015 October 5 0 31.8 9.1 25.4 15.4
2015 October 6 0 18.6 6.8 26.4 15.7
2015 October 7 0 20.0 7.4 22.1 16.6
2015 October 8 0 27.1 8.5 23.2 15.5
2015 October 9 0.2 27.4 7.6 26.4 15.5
2015 October 10 8.6 22.1 5.9 23.8 15.0
2015 October 11 0 25.0 6.5 20.5 14.5
2015 October 12 0 21.3 7.7 24.7 14.8
2015 October 13 0 26.1 11.3 23.6 16.8
2015 October 14 0 28.5 11.0 26.6 17.0
2015 October 15 0 30.1 7.7 27.5 16.9
2015 October 16 0 27.8 8.2 27.8 17.5
2015 October 17 0 21.6 11.1 25.2 19.8
2015 October 18 1.8 27.6 11.5 25.2 17.5
2015 October 19 0.2 29.5 12.1 28.3 17.9
2015 October 20 0 23.8 9.4 28.2 19.0
2015 October 21 2.6 19.0 15.0 22.4 19.7
2015 October 22 13 16.7 12.4 19.7 17.2
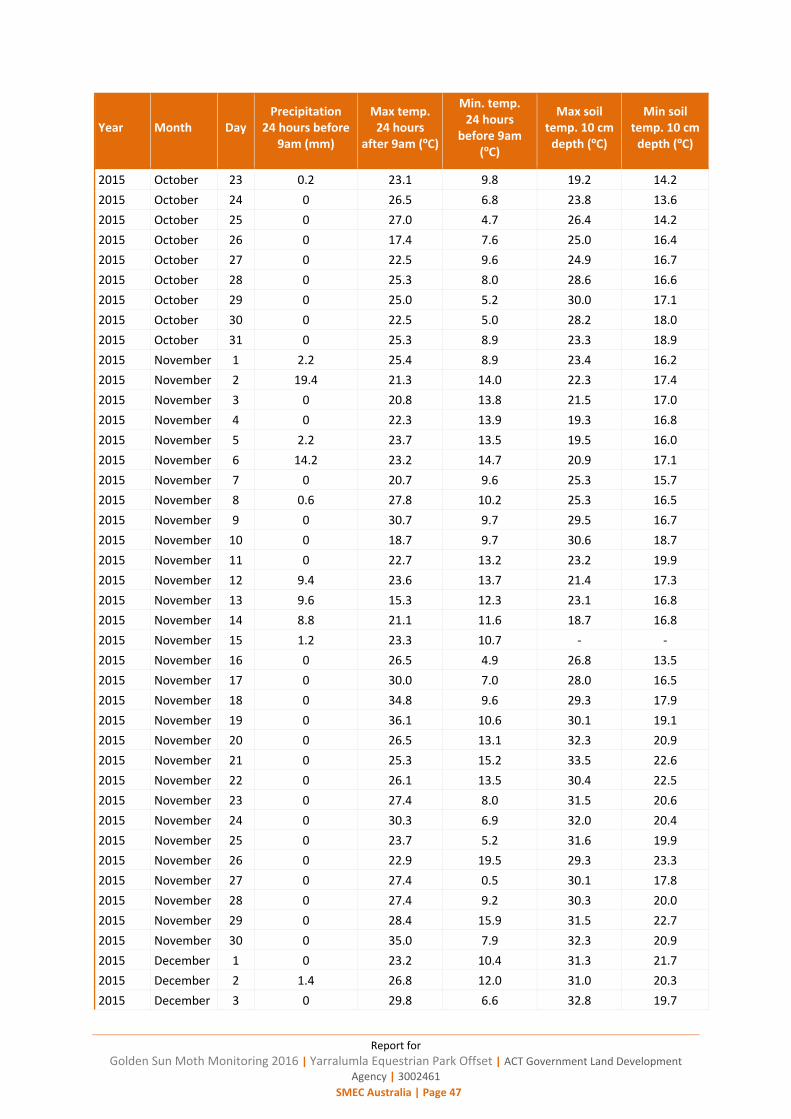
Report for
Golden Sun Moth Monitoring 2016 | Yarralumla Equestrian Park Offset | ACT Government Land Development
Agency | 3002461
SMEC Australia | Page 47
Year Month Day Precipitation
24 hours before 9am (mm)
Max temp. 24 hours
after 9am (ºC)
Min. temp. 24 hours
before 9am (ºC)
Max soil temp. 10 cm
depth (ºC)
Min soil temp. 10 cm
depth (ºC)
2015 October 23 0.2 23.1 9.8 19.2 14.2
2015 October 24 0 26.5 6.8 23.8 13.6
2015 October 25 0 27.0 4.7 26.4 14.2
2015 October 26 0 17.4 7.6 25.0 16.4
2015 October 27 0 22.5 9.6 24.9 16.7
2015 October 28 0 25.3 8.0 28.6 16.6
2015 October 29 0 25.0 5.2 30.0 17.1
2015 October 30 0 22.5 5.0 28.2 18.0
2015 October 31 0 25.3 8.9 23.3 18.9
2015 November 1 2.2 25.4 8.9 23.4 16.2
2015 November 2 19.4 21.3 14.0 22.3 17.4
2015 November 3 0 20.8 13.8 21.5 17.0
2015 November 4 0 22.3 13.9 19.3 16.8
2015 November 5 2.2 23.7 13.5 19.5 16.0
2015 November 6 14.2 23.2 14.7 20.9 17.1
2015 November 7 0 20.7 9.6 25.3 15.7
2015 November 8 0.6 27.8 10.2 25.3 16.5
2015 November 9 0 30.7 9.7 29.5 16.7
2015 November 10 0 18.7 9.7 30.6 18.7
2015 November 11 0 22.7 13.2 23.2 19.9
2015 November 12 9.4 23.6 13.7 21.4 17.3
2015 November 13 9.6 15.3 12.3 23.1 16.8
2015 November 14 8.8 21.1 11.6 18.7 16.8
2015 November 15 1.2 23.3 10.7 - -
2015 November 16 0 26.5 4.9 26.8 13.5
2015 November 17 0 30.0 7.0 28.0 16.5
2015 November 18 0 34.8 9.6 29.3 17.9
2015 November 19 0 36.1 10.6 30.1 19.1
2015 November 20 0 26.5 13.1 32.3 20.9
2015 November 21 0 25.3 15.2 33.5 22.6
2015 November 22 0 26.1 13.5 30.4 22.5
2015 November 23 0 27.4 8.0 31.5 20.6
2015 November 24 0 30.3 6.9 32.0 20.4
2015 November 25 0 23.7 5.2 31.6 19.9
2015 November 26 0 22.9 19.5 29.3 23.3
2015 November 27 0 27.4 0.5 30.1 17.8
2015 November 28 0 27.4 9.2 30.3 20.0
2015 November 29 0 28.4 15.9 31.5 22.7
2015 November 30 0 35.0 7.9 32.3 20.9
2015 December 1 0 23.2 10.4 31.3 21.7
2015 December 2 1.4 26.8 12.0 31.0 20.3
2015 December 3 0 29.8 6.6 32.8 19.7
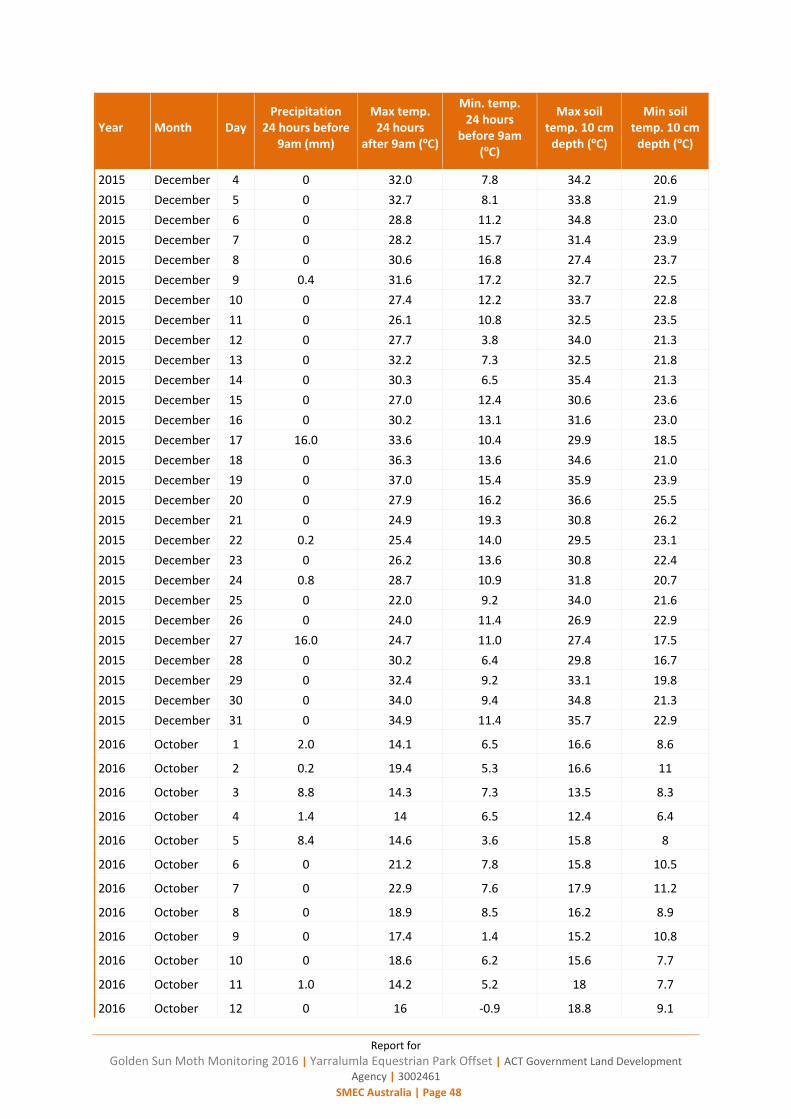
Report for
Golden Sun Moth Monitoring 2016 | Yarralumla Equestrian Park Offset | ACT Government Land Development
Agency | 3002461
SMEC Australia | Page 48
Year Month Day Precipitation
24 hours before 9am (mm)
Max temp. 24 hours
after 9am (ºC)
Min. temp. 24 hours
before 9am (ºC)
Max soil temp. 10 cm
depth (ºC)
Min soil temp. 10 cm
depth (ºC)
2015 December 4 0 32.0 7.8 34.2 20.6
2015 December 5 0 32.7 8.1 33.8 21.9
2015 December 6 0 28.8 11.2 34.8 23.0
2015 December 7 0 28.2 15.7 31.4 23.9
2015 December 8 0 30.6 16.8 27.4 23.7
2015 December 9 0.4 31.6 17.2 32.7 22.5
2015 December 10 0 27.4 12.2 33.7 22.8
2015 December 11 0 26.1 10.8 32.5 23.5
2015 December 12 0 27.7 3.8 34.0 21.3
2015 December 13 0 32.2 7.3 32.5 21.8
2015 December 14 0 30.3 6.5 35.4 21.3
2015 December 15 0 27.0 12.4 30.6 23.6
2015 December 16 0 30.2 13.1 31.6 23.0
2015 December 17 16.0 33.6 10.4 29.9 18.5
2015 December 18 0 36.3 13.6 34.6 21.0
2015 December 19 0 37.0 15.4 35.9 23.9
2015 December 20 0 27.9 16.2 36.6 25.5
2015 December 21 0 24.9 19.3 30.8 26.2
2015 December 22 0.2 25.4 14.0 29.5 23.1
2015 December 23 0 26.2 13.6 30.8 22.4
2015 December 24 0.8 28.7 10.9 31.8 20.7
2015 December 25 0 22.0 9.2 34.0 21.6
2015 December 26 0 24.0 11.4 26.9 22.9
2015 December 27 16.0 24.7 11.0 27.4 17.5
2015 December 28 0 30.2 6.4 29.8 16.7
2015 December 29 0 32.4 9.2 33.1 19.8
2015 December 30 0 34.0 9.4 34.8 21.3
2015 December 31 0 34.9 11.4 35.7 22.9
2016 October 1 2.0 14.1 6.5 16.6 8.6
2016 October 2 0.2 19.4 5.3 16.6 11
2016 October 3 8.8 14.3 7.3 13.5 8.3
2016 October 4 1.4 14 6.5 12.4 6.4
2016 October 5 8.4 14.6 3.6 15.8 8
2016 October 6 0 21.2 7.8 15.8 10.5
2016 October 7 0 22.9 7.6 17.9 11.2
2016 October 8 0 18.9 8.5 16.2 8.9
2016 October 9 0 17.4 1.4 15.2 10.8
2016 October 10 0 18.6 6.2 15.6 7.7
2016 October 11 1.0 14.2 5.2 18 7.7
2016 October 12 0 16 -0.9 18.8 9.1
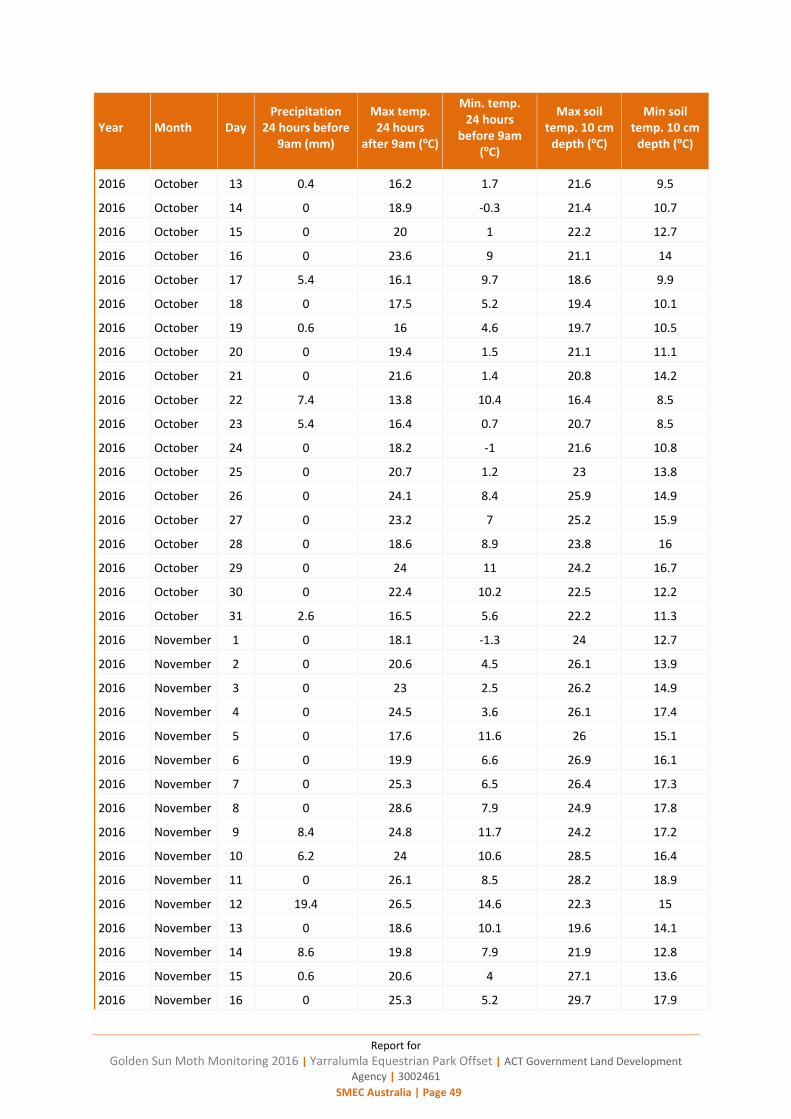
Report for
Golden Sun Moth Monitoring 2016 | Yarralumla Equestrian Park Offset | ACT Government Land Development
Agency | 3002461
SMEC Australia | Page 49
Year Month Day Precipitation
24 hours before 9am (mm)
Max temp. 24 hours
after 9am (ºC)
Min. temp. 24 hours
before 9am (ºC)
Max soil temp. 10 cm
depth (ºC)
Min soil temp. 10 cm
depth (ºC)
2016 October 13 0.4 16.2 1.7 21.6 9.5
2016 October 14 0 18.9 -0.3 21.4 10.7
2016 October 15 0 20 1 22.2 12.7
2016 October 16 0 23.6 9 21.1 14
2016 October 17 5.4 16.1 9.7 18.6 9.9
2016 October 18 0 17.5 5.2 19.4 10.1
2016 October 19 0.6 16 4.6 19.7 10.5
2016 October 20 0 19.4 1.5 21.1 11.1
2016 October 21 0 21.6 1.4 20.8 14.2
2016 October 22 7.4 13.8 10.4 16.4 8.5
2016 October 23 5.4 16.4 0.7 20.7 8.5
2016 October 24 0 18.2 -1 21.6 10.8
2016 October 25 0 20.7 1.2 23 13.8
2016 October 26 0 24.1 8.4 25.9 14.9
2016 October 27 0 23.2 7 25.2 15.9
2016 October 28 0 18.6 8.9 23.8 16
2016 October 29 0 24 11 24.2 16.7
2016 October 30 0 22.4 10.2 22.5 12.2
2016 October 31 2.6 16.5 5.6 22.2 11.3
2016 November 1 0 18.1 -1.3 24 12.7
2016 November 2 0 20.6 4.5 26.1 13.9
2016 November 3 0 23 2.5 26.2 14.9
2016 November 4 0 24.5 3.6 26.1 17.4
2016 November 5 0 17.6 11.6 26 15.1
2016 November 6 0 19.9 6.6 26.9 16.1
2016 November 7 0 25.3 6.5 26.4 17.3
2016 November 8 0 28.6 7.9 24.9 17.8
2016 November 9 8.4 24.8 11.7 24.2 17.2
2016 November 10 6.2 24 10.6 28.5 16.4
2016 November 11 0 26.1 8.5 28.2 18.9
2016 November 12 19.4 26.5 14.6 22.3 15
2016 November 13 0 18.6 10.1 19.6 14.1
2016 November 14 8.6 19.8 7.9 21.9 12.8
2016 November 15 0.6 20.6 4 27.1 13.6
2016 November 16 0 25.3 5.2 29.7 17.9

Report for
Golden Sun Moth Monitoring 2016 | Yarralumla Equestrian Park Offset | ACT Government Land Development
Agency | 3002461
SMEC Australia | Page 50
Year Month Day Precipitation
24 hours before 9am (mm)
Max temp. 24 hours
after 9am (ºC)
Min. temp. 24 hours
before 9am (ºC)
Max soil temp. 10 cm
depth (ºC)
Min soil temp. 10 cm
depth (ºC)
2016 November 17 0 25.5 11 30.4 18.5
2016 November 18 0 30 9.1 32.1 20.5
2016 November 19 0 31.1 11.7 33 21.9
2016 November 20 0 31.1 13.4 29.4 21.4
2016 November 21 9.4 30.2 14.4 31.6 20.2
2016 November 22 0 31.2 11.9 28 21.2
2016 November 23 0 20.4 13.4 25.8 13.8
2016 November 24 4.2 21.2 2.5 28.5 15.6
2016 November 25 0 24.3 4.7 30.4 18.3
2016 November 26 0 24.7 7.9 30.9 19.3
2016 November 27 0 26.5 9.2 32.7 22
2016 November 28 0 27.7 14.7 32.9 20.7
2016 November 29 0 28 7.9 33 22
2016 November 30 0 30.1 10.4 33.5 22.7
2016 December 1 0 28.8 12.1 32.6 21.5
2016 December 2 0 30.3 8.5 33.4 22.7
2016 December 3 0 30.9 11.7 32 22.8
2016 December 4 0 32.8 10.6 29.5 24.4
2016 December 5 1.0 31.4 17.7 27.9 22.4
2016 December 6 13.4 23.1 16.9 28.8 17.5
2016 December 7 0.2 26.9 8.9 28.4 19.2
2016 December 8 0 31.3 10.1 27.6 17.2
2016 December 9 2.0 21.6 11 30.5 18.1
2016 December 10 0 25.2 7.3 32.7 21.3
2016 December 11 0 28 12.8 33.8 23.2
2016 December 12 0 31.2 15.3 31 22.8
2016 December 13 0 33.9 10.6 28.9 25.1
2016 December 14 0 28.6 21.6 24.4 20.1
2016 December 15 3.0 14.8 12.8 21 17.6
2016 December 16 5.8 20.1 12.3 24.4 18.5
2016 December 17 11.4 27.9 13.5 28.3 17.6
2016 December 18 0 24.9 11.4 29.6 19.5
2016 December 19 0 26.5 11.1 28.4 20.2
2016 December 20 0 30.8 9.7 31.6 20.1
2016 December 21 0 28.7 8.9 32.2 22.6
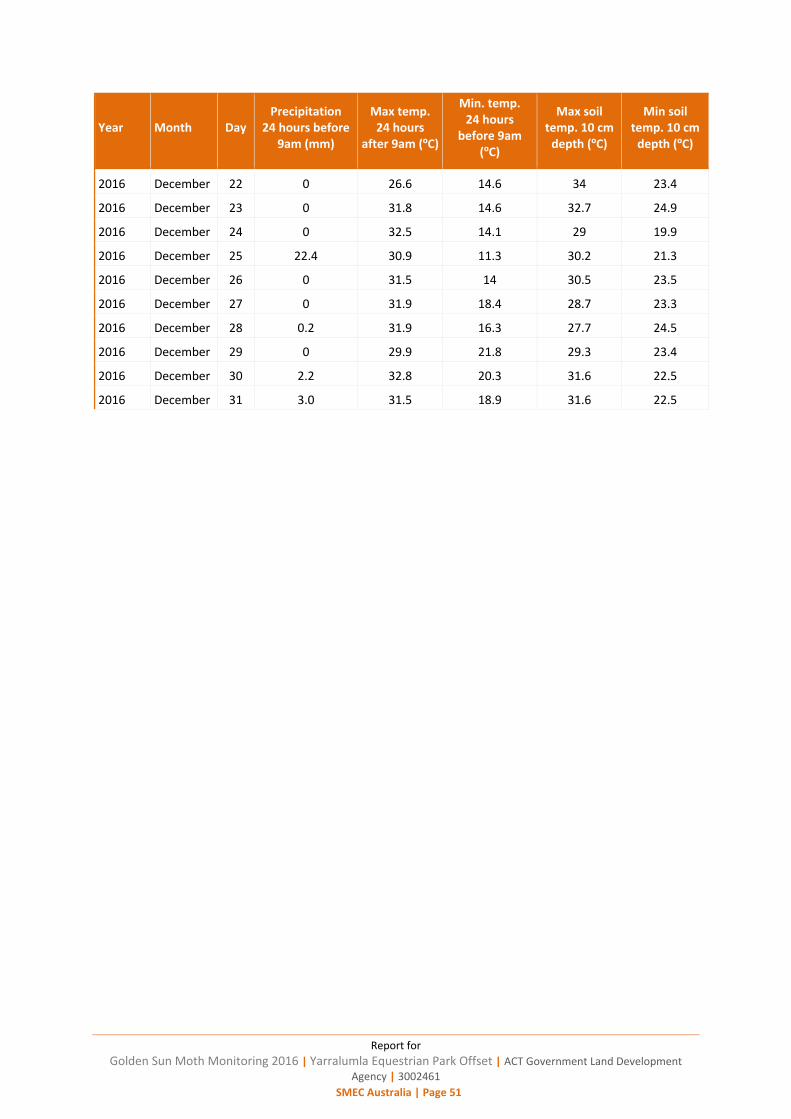
Report for
Golden Sun Moth Monitoring 2016 | Yarralumla Equestrian Park Offset | ACT Government Land Development
Agency | 3002461
SMEC Australia | Page 51
Year Month Day Precipitation
24 hours before 9am (mm)
Max temp. 24 hours
after 9am (ºC)
Min. temp. 24 hours
before 9am (ºC)
Max soil temp. 10 cm
depth (ºC)
Min soil temp. 10 cm
depth (ºC)
2016 December 22 0 26.6 14.6 34 23.4
2016 December 23 0 31.8 14.6 32.7 24.9
2016 December 24 0 32.5 14.1 29 19.9
2016 December 25 22.4 30.9 11.3 30.2 21.3
2016 December 26 0 31.5 14 30.5 23.5
2016 December 27 0 31.9 18.4 28.7 23.3
2016 December 28 0.2 31.9 16.3 27.7 24.5
2016 December 29 0 29.9 21.8 29.3 23.4
2016 December 30 2.2 32.8 20.3 31.6 22.5
2016 December 31 3.0 31.5 18.9 31.6 22.5
Report for
Golden Sun Moth Monitoring 2016 | Yarralumla Equestrian Park Offset | ACT Government Land Development Agency
| 3002461
SMEC Australia | Page 52
SMEC Australia Pt y Ltd
Level 5, 20 Berr y Street Nor th Sydney, NSW, 2060
T +61 2 9925 5555 F +61 2 9925 5566
w w w.smec.com
Related Documents