Yael Amid Jerusalem, December 2016 Report GSI/39/2016 Flowstone of Te’omim Cave, Israel: Characterization and Paleoclimate Trends in the middle Pleistocene transition Geological Survey of Israel Ministry of Naonal infrastructures Energy and Water Resources

Welcome message from author
This document is posted to help you gain knowledge. Please leave a comment to let me know what you think about it! Share it to your friends and learn new things together.
Transcript
Yael Amid
Jerusalem, December 2016Report GSI/39/2016
Flowstone of Te’omim Cave, Israel:Characterization and Paleoclimate Trends
in the middle Pleistocene transition
Flowstone of Te’om
im Cave, Israel:Characterization and Paleoclim
ate Trends in the middle Pleistocene transition- Yael Am
id
Geological Survey of IsraelMinistry of National infrastructures
Energy and Water Resources
Flowstone of Te’omim Cave, Israel:
Characterization and Paleoclimate Trends in the
middle Pleistocene transition
Yael Amid
This thesis was submitted for the degree "Master" to the senate of the Hebrew University of
Jerusalem.
The study was carried out under the supervision of:
Dr. Mira Bar-Matthews, Geological Survey of Israel.
Prof. Amos Frumkin, Cave Research Center, the Hebrew University of Jerusalem, Israel.
Report GSI/39/2016 Jerusalem, December 2016
Geological Survey of Israel Ministry of National infrastructures
Energy and Water Resources

2
Abstract
The Te’omim cave is an isolated karst cave located on the western slopes of the
Jerusalem hills, approximately 20 km west of Jerusalem, at Nahal Hame’ara (Israel Grid
152049/126028). A wide array of vadose speleothems, such as flowstone, stalagmites
and columns had accumulated in various parts of the main chamber, some of which
producing thick accumulations of flowstone and large stalagmites. During a recent
survey in the cave, a quarry was identified in the eastern part of the cave’s main
chamber. The quarry was dated by U-Th method using a flowstone deposited on the
quarried surface after the cessation of quarrying, to the Middle Bronze Age (first half of
the 2nd
millennium BCE). The quarry is entirely within flowstone, composed of
translucent, banded coarse crystalline calcite, suggesting that it was used in antiquity as
a source of calcite ‘Bahat’ (alabaster). The term ‘Bahat’ is used in modern
archaeological Hebrew literature to denote calcite-alabaster. Calcite-alabaster objects
found in the southern Levant are commonly believed to be imported from Egypt.
Ignoring the possibility of local calcite-alabaster sources, most researchers accepted the
Egyptian source assumption formulated many years ago. However, calcite-alabaster
quarries indeed existed in the southern Levant in at least two caves, Te’omim and
‘Abud caves (approximately 11 km east of Shoham), most probably providing local
workshops with an alternative source for this luxury material.
A cross section of flowstone ~3 m long, TM-2, was sawed from the wall of the quarry.
It was selected where maximal thickness of relatively clean flowstone had accumulated,
in order to identify the major sequence of the flowstone at the quarry. The upper 80 cm
of TM-2 were studied in this research.
3
For dating, climatic and environmental change reconstruction purposes, δ18
Oc and δ13
C
analyses are made at intervals of ~0.5-1.0 mm (459 drilled samples of TM-2 section).
The top 10 cm of the section was previously dated using U-Th dating method. Dating of
the older parts of the section was performed by applying the U-Pb and Paleomagnetic
methods. TM-2 section was dated from ~1.3 Ma to ~50 ka. The U/Pb dating gave two
ages of 1310 ±60 ka and 1350 ±120 ka, and the magneto-stratigraphy of this section gave
five ages: 773ka, 1001ka, 1069ka, 1189ka and 1221ka. The isotopic profile was wiggle-
matched with the isotopic record of LR04 benthic δ18
Oc stack. Fourteen isotopic events
recorded in TM-2 isotopic profile, match MIS events ranging between 1316 ka and 773
ka. The average time interval between the major 18
Oc peaks is about 40ka, matching the
41ka obliquity cycles that occurs until the beginning of the middle Pleistocene transition
(MPT). Further bench marks are isotopic events with low 18
Oc and high 13
C which can
be correlated with strong sapropel events in the Eastern Mediterranean Sea. Using the
combined U-Pb ages, the magnetostratigraphy and wiggle-matching the isotopic events
with benthic δ18
Oc stack and sapropel events suggests that the isotopic record of TM-2
reflects a long period of flowstone deposition since almost 1350ka. This record is the
longest terrestrial paleoclimatic record at the Eastern Mediterranean region.
The isotopic profile demonstrates that during the MPT, there is a continuous flowstone
growth during glacials and interglacials. The lower δ18
O values during glacials and
interglacials of TM-2 section at the early Pleistocene compared with Soreq cave through
the last 230ka indicate a temporal transition of climatic system during the MPT with
symmetric glacial/interglacial cycles with 41 ka obliquity cycles changes by the end of
4
the MPT, at ~700 ka, to a highly nonlinear system dominated by ~100 ka periodicity with
asymmetric glacial/interglacial cycles.
The petrography of the flowstone is characterized mainly by large columnar crystals,
producing the typical 'Bahat' structure. In some cases, significant changes in the crystal
habit follow changes in the isotopic trends.
Oxygen and carbon isotopic compositions of ‘Bahat’ archaeological artifacts samples
from Egypt and Israel were also measured for comparing them to the isotopic
composition of the TM-2 in order to gain information on the provenance of these
artifacts. The isotopic composition of 'Bahat' archaeological artifacts samples from
several archeological sites in Israel show that most of the 'Bahat' artifacts do not match
the δ13
C - δ18
O combination of artifacts imported from Egypt. 'Bahat' artifacts from Umm
el Umdan, Herodion, and Kotel match the isotopic composition of Te'omim Cave and
could have been derived from Te'omim quarry.

5
Acknowledgements
I would like to express my special thanks of gratitude first and foremost to my supervisors:
Dr. Miryam Bar-Matthews and Prof. Amos Frumkin for the interest they showed in my work,
their guidance and their willingness to help at any given moment. I have learned a lot from them
and profoundly benefitted from their knowledge and experience.
This work would not have been possible without the help and support of Dr. Avner Ayalon,
who acted essentially as a supervisor of mine, and whose professional help, friendship, and
general concern made things very enjoyable.
Thanks to Boaz Zissu, head of the archaeological expedition to the Teomim Cave, who
provided administrative and financial support.
Special thanks go to the wonderful team from the Geochemistry Department at the
Geological Survey of Israel (GSI): Tami Zilberman, Jonathan Keinan and Sergei Sladkevich for
their help with performing the stable isotope measurements.
Many thanks to Miryam Bar-Matthews for the U-Th dating, to Ron Shaar and Yael Ebert
from Hebrew University of Jerusalem for the magneto-stratigraphy dating and to Gideon
Henderson at Oxford University, GB for the U-Pb dating.
Many thanks to Ayala Amir for providing the 'Bahat' Sample and for her help.
Thanks to my room colleagues from the GSI: Yuval Burstyn and Neta Shalev for sharing
with me their knowledge and experience.
Many thanks to Gal Yas'ur for her great help with the research proposal.
6
Thanks to Lidia Grossovitch and Irit Gefen for their help with the polarizing optical
microscope. Thanks to Iad Suaid for his help with the thin sections. Raanan Bodzin is thanked
for his help with SEM analyses.
I wish to thank Anton Vaks and Ahuva Almogi-Labin for their help with relevant papers.
Funding for this project is provided by a grant no# 103/14 of the Israel Sciences
Foundation (ISF). Israel Antiquities Authority and the Nature and Parks Authority provided
sampling permits.
And last but not least thank you always to my family: Bnaya, Adi, Aner and Ivri, and to
my parents Uzi and Yaffa Goldberg. You are always so understanding and loving and I could not
make it without you.
7
Table of Content pp. 1 Background and previous studies ............................................................................. 11
1.1 Te’omim Cave .................................................................................................... 11
1.1.1 Location and history of research ................................................................. 11
1.1.2 Te’omim quarry .......................................................................................... 14
1.2 Speleothems formation ....................................................................................... 16
1.3 Flowstone and calcite-alabaster ......................................................................... 17
1.4 Paleoclimate ....................................................................................................... 19
1.4.1 Marine isotope stages .................................................................................. 19
1.4.2 Middle Pleistocene Transition (MPT) ........................................................ 21
1.4.3 Sapropels events.......................................................................................... 24
1.5 Paleoclimate reconstruction using stable isotopes in speleothems .................... 26
1.5.1 Oxygen isotopic composition ..................................................................... 26
1.5.2 Carbon isotopic composition ...................................................................... 27
1.6 Petrography ........................................................................................................ 29
1.7 The use of stable isotopes for identifying provenance of ancient vessels .......... 30
2 Aims and research goals ........................................................................................... 31
3 Methodology ............................................................................................................. 32
3.1 Flowstone sampling in the cave ......................................................................... 32
3.2 Dating ................................................................................................................. 34
3.2.1 Uranium-Thorium dating ............................................................................ 34
3.2.2 Magneto-stratigraphy .................................................................................. 35
8
3.2.3 Uranium-Lead dating .................................................................................. 36
3.3 Oxygen and carbon isotopic composition .......................................................... 37
3.4 Oxygen and carbon isotopic composition of 'Bahat' .......................................... 38
3.5 Optical microscopy ............................................................................................ 38
4 Results ....................................................................................................................... 39
4.1 Dating ................................................................................................................. 39
4.1.1 U-Th dating ................................................................................................. 39
4.1.2 Magneto-stratigraphy .................................................................................. 39
4.1.3 U-Pb dating ................................................................................................. 39
4.2 Isotopic record .................................................................................................... 41
4.3 Petrography and isotopic profile ........................................................................ 42
4.4 Isotopic composition of 'Bahat’ archaeological artifacts ................................... 55
5 Discussion ................................................................................................................. 58
5.1 Dating ................................................................................................................. 58
5.2 Isotopic profile characteristic features ............................................................... 63
5.3 The relations between the petrography and the isotopic profile ........................ 64
5.4 Isotopic composition of 'Bahat’ archaeological artifacts ................................... 66
6 Summary and conclusions ........................................................................................ 67
7 References ................................................................................................................. 70
Table of Figures pp.
Figure 1: Location Map .................................................................................................... 13
Figure 2: Plan of Te’omim Cave. ..................................................................................... 14
Figure 3: Te’omim cave quarry. ....................................................................................... 16
9
Figure 4: The LR04 benthic δ18
O stack constructed by the graphic correlation of 57
globally distributed benthic δ18
O records ............................................................. 21
Figure 5: Precession (a), Obliquity (b) and Eccentricity (c) orbital cycles and summer
solar forcing at 65°N (d) global stacked δ18
O benthic foraminifera record (e)
temperature anomaly (f) and CO2 concentration records (g) ................................ 23
Figure 6: Compilation of sapropel occurrences ............................................................... 24
Figure 7: Sawing the sample from the wall of Te’omim Cave quarry. ............................ 33
Figure 8: The entire TM-2 sampled section. ..................................................................... 33
Figure 9: Image section TM2-2. ....................................................................................... 34
Figure 10: Dating results of TM-2 section ........................................................................ 40
Figure 11: δ18
Oc and δ13
C profiles of TM-2 section vs serial number of the isotopic
analyses points, ..................................................................................................... 41
Figure 12: Comparison between petrography and isotopic record of TM-2-1-b .............. 43
Figure 13: Comparison between petrography and isotopic record of TM-2-1-c .............. 44
Figure 14: Comparison between petrography and isotopic record of TM-2-2-1. ............. 45
Figure 15: Comparison between petrography and isotopic record of TM-2-2-2 .............. 46
Figure 16: Comparison between petrography and isotopic record of TM-2-2-3 .............. 47
Figure 17: Comparison between petrography and isotopic record of TM-2-3-ac ............. 48
Figure 18: Comparison between petrography and isotopic record of TM-2-3-de ............ 49
Figure 19: Comparison between petrography and isotopic record of TM-2-4-1 .............. 50
Figure 20: Comparison between petrography and isotopic record of TM-2-4-2 .............. 51
Figure 21: Comparison between petrography and isotopic record of TM-2-4-3 .............. 52
Figure 22: Comparison between petrography and isotopic record of TM-2-5 ................. 53
10
Figure 23: Comparison between petrography and isotopic record of TM-2-6. ................ 54
Figure 24: δ13
C plotted against δ18
Oc values of TM-2 section, and from 'Bahat' artifacts
from various sources ............................................................................................. 56
Figure 25: location map of the archeological sites. .......................................................... 57
Figure 26: Wiggle matching between TM-2 δ18
Oc isotopic profile to the LR04 benthic
δ18
Oc stack ............................................................................................................. 59
Figure 27: Ages from U/Th and U/Pb at blue, magneto stratigraphy (black)................... 60
Figure 28: δ18
Oc and δ13
C isotopic profiles of TM-2 plotted against age, A. 1350-0 ka, B.
1350-750ka. .......................................................................................................... 62
Figure 29: δ18
O and δ13
C isotopic profiles of Soreq Cave plotted against age ................. 63
11
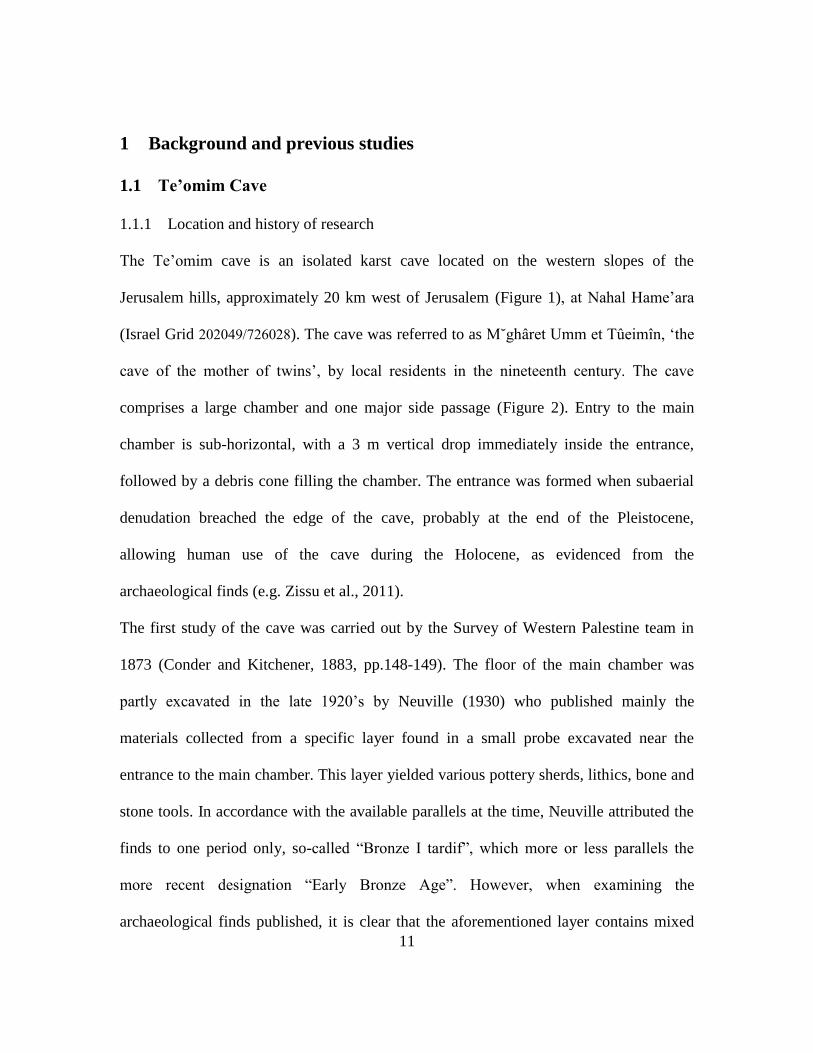
1 Background and previous studies
1.1 Te’omim Cave
1.1.1 Location and history of research
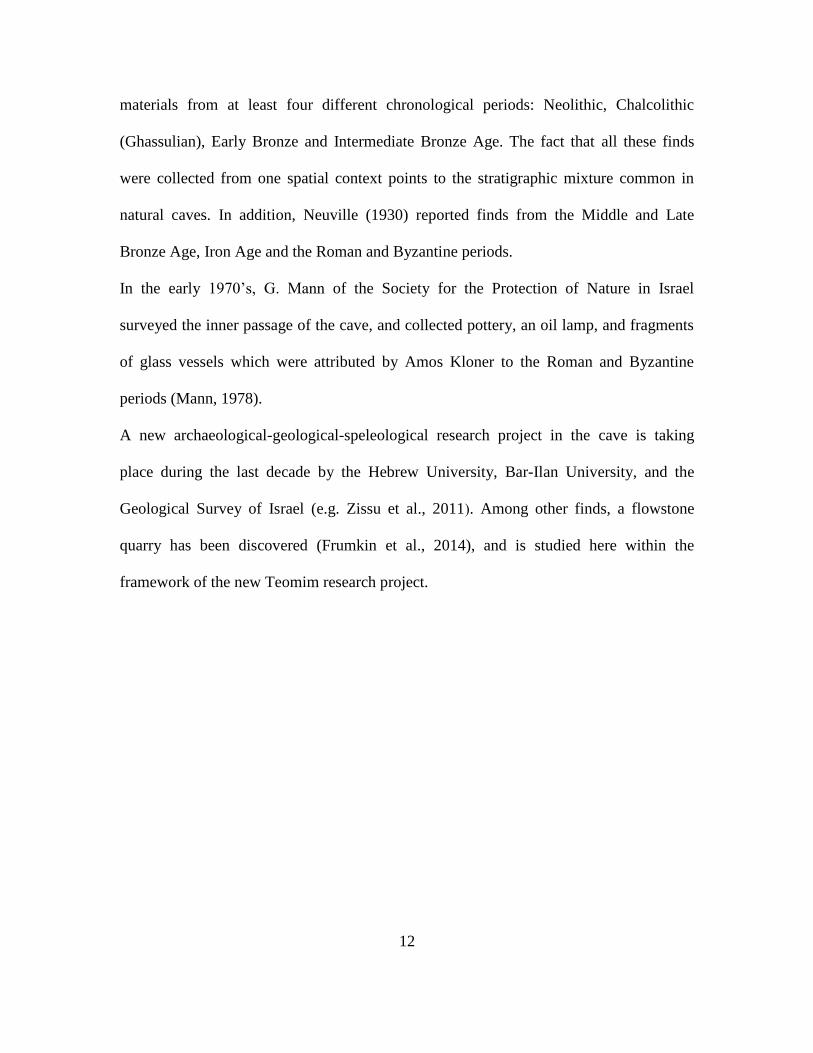
The Te’omim cave is an isolated karst cave located on the western slopes of the
Jerusalem hills, approximately 20 km west of Jerusalem (Figure 1), at Nahal Hame’ara
(Israel Grid 202049/726028). The cave was referred to as M˘ghâret Umm et Tûeimîn, ‘the
cave of the mother of twins’, by local residents in the nineteenth century. The cave
comprises a large chamber and one major side passage (Figure 2). Entry to the main
chamber is sub-horizontal, with a 3 m vertical drop immediately inside the entrance,
followed by a debris cone filling the chamber. The entrance was formed when subaerial
denudation breached the edge of the cave, probably at the end of the Pleistocene,
allowing human use of the cave during the Holocene, as evidenced from the
archaeological finds (e.g. Zissu et al., 2011).
The first study of the cave was carried out by the Survey of Western Palestine team in
1873 (Conder and Kitchener, 1883, pp.148-149). The floor of the main chamber was
partly excavated in the late 1920’s by Neuville (1930) who published mainly the
materials collected from a specific layer found in a small probe excavated near the
entrance to the main chamber. This layer yielded various pottery sherds, lithics, bone and
stone tools. In accordance with the available parallels at the time, Neuville attributed the
finds to one period only, so-called “Bronze I tardif”, which more or less parallels the
more recent designation “Early Bronze Age”. However, when examining the
archaeological finds published, it is clear that the aforementioned layer contains mixed
12
materials from at least four different chronological periods: Neolithic, Chalcolithic
(Ghassulian), Early Bronze and Intermediate Bronze Age. The fact that all these finds
were collected from one spatial context points to the stratigraphic mixture common in
natural caves. In addition, Neuville (1930) reported finds from the Middle and Late
Bronze Age, Iron Age and the Roman and Byzantine periods.
In the early 1970’s, G. Mann of the Society for the Protection of Nature in Israel
surveyed the inner passage of the cave, and collected pottery, an oil lamp, and fragments
of glass vessels which were attributed by Amos Kloner to the Roman and Byzantine
periods (Mann, 1978).
A new archaeological-geological-speleological research project in the cave is taking
place during the last decade by the Hebrew University, Bar-Ilan University, and the
Geological Survey of Israel (e.g. Zissu et al., 2011(. Among other finds, a flowstone
quarry has been discovered (Frumkin et al., 2014), and is studied here within the
framework of the new Teomim research project.
13
Figure 1: Location Map
Te’omim cave
14
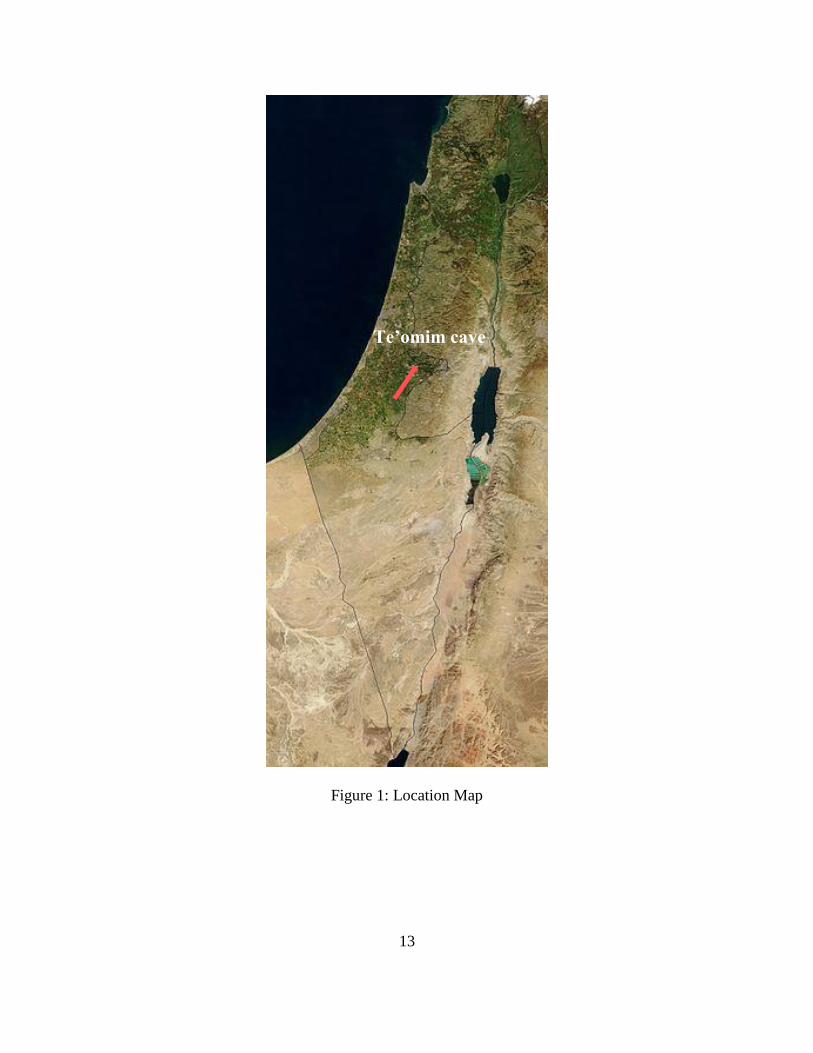
Figure 2: Plan of Te’omim Cave. The inset shows the main quarrying lines (abandoned
quarry walls), as well as estimated iso-thickness lines (dashed) of quarried flowstone,
after Frumkin et al. (2014).
1.1.2 Te’omim quarry
A wide array of vadose speleothems, such as flowstone, stalagmites and columns had
accumulated in various parts of the main chamber, some of which producing thick
accumulations of flowstone and large stalagmites. The flowstone had been deposited
TM-2
15
by a sheet of water over a sloping surface under free-air conditions, prevailing since the
cave emerged above the regional water table, millions of years ago (Frumkin and
Fischhendler, 2005). During the recent survey in the cave, a quarry was identified in the
eastern part of the cave’s main chamber. Field examination and drilling revealed that the
quarry is entirely within flowstone, composed of translucent, banded coarse crystalline
calcite, suggesting that it was used in antiquity as a source of calcite-alabaster. The
flowstone layering is partly seen in the quarried surfaces, while in other surfaces younger
flowstone covers the wall. In many places there are signs of the cessation of quarrying
scars or ‘negatives’ left on the quarry walls and floor after the removal of flowstone
blocks (Figure 3). Few blocks of flowstone were never separated, due to fissures or
defects in the bedrock. The quarry face, where quarrying had stopped, is up to 4 m high
vertical wall of flowstone, underlain by additional flowstone, indicating that the original
flowstone thickness was >4m. The quarry is 25 m long and up to 8 m wide (Figure 2). No
indication for in situ production of vessels was observed during the archaeological survey
of the cave (e.g. working tools, drills), and it seems reasonable to assume that vessel
production took place in a proximate subaerial site. Water flow and dripping is an
ongoing process on the quarried surfaces, where recent flowstone and other types of
dripstone are still deposited today. The quarry was dated by U-Th of the flowstone
deposited on the quarried surface after the cessation of quarrying. Such a date indicates
the latest possible time of abandonment at this part of the quarry. Two drilled cores of
flowstone, TC and TM1 were used. The oldest lamina (just above the quarried surface) of
each core was dated (on 2012) by U-Th to 3426 ± 100 (2 error) and 3585 ± 118 years
for TC and TM1 cores respectively. Younger layers, four and one cm above the oldest
16
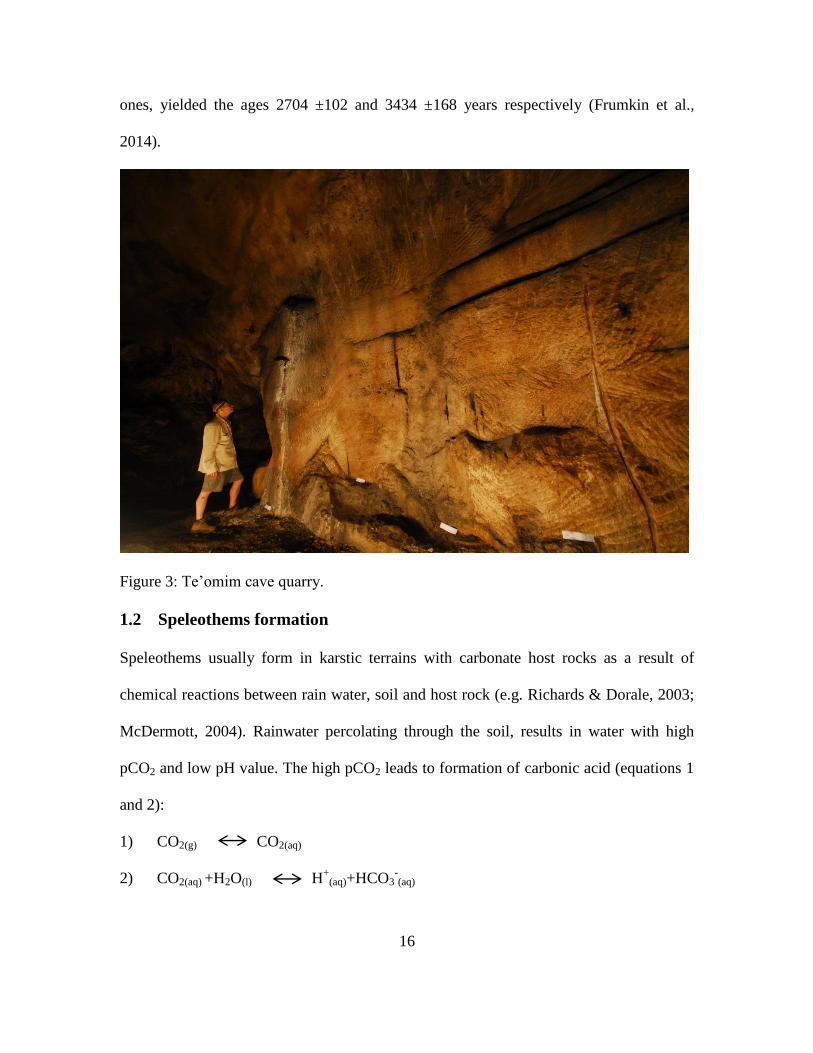
ones, yielded the ages 2704 ±102 and 3434 ±168 years respectively (Frumkin et al.,
2014).
Figure 3: Te’omim cave quarry.
1.2 Speleothems formation
Speleothems usually form in karstic terrains with carbonate host rocks as a result of
chemical reactions between rain water, soil and host rock (e.g. Richards & Dorale, 2003;
McDermott, 2004). Rainwater percolating through the soil, results in water with high
pCO2 and low pH value. The high pCO2 leads to formation of carbonic acid (equations 1
and 2):
1) CO2(g) CO2(aq)
2) CO2(aq) +H2O(l) H+
(aq)+HCO3-(aq)
17
The weakly acidic water migrates through the carbonate host rock, dissolving it and
absorbing trace elements, such as uranium, and becomes saturated in respect to calcium
carbonate (equation 3):
3) H+
(aq)+HCO3-(aq) + CaCO3(s) Ca
2+(aq) + 2HCO3
- (aq)
The water reaches the cave where, due to oversaturation relative to the cave pCO2, it
degasses – a process which results in calcite precipitation (equation 4):
4) Ca2+
(aq) + 2HCO3- (aq) CaCO3(s) + CO2(g) +H2O(l)
Speleothems can continuously grow, but hiatuses are common, due to lack of water or
changes in the fracture system above the cave.
1.3 Flowstone and calcite-alabaster
Calcitic flowstone is a secondary limestone, composed usually of the mineral calcite,
formed by deposition from film flow of water under vadose (unsaturated) conditions
(Ford and Williams, 2007), usually as a coarsely crystalline, translucent speleothem. Its
attractive shelly translucent banding derives from the subsurface deposition environment,
where low energy conditions promote the growth of large, clear crystals. In volume, it is
the most common speleothem, often with m-thick deposits. Flowstone may be deposited
at a rate of micrometers to mm per year, depending strongly on water flow rate and
composition of the water and atmospheric CO2. Flowstone (and closely-associated vein
calcite) was often used in ancient times for the production of high-valued objects. In
Egyptological studies it is commonly referred to as ‘alabaster’, a term derived from
‘alabastrites’, the ancient Roman name of this stone (Harrell, 1995). However,
archaeological terminology related to this material is confusing, as it is alternately
18
referred to in the literature as Egyptian alabaster, onyx, calcite, (Egyptian) travertine,
marble, and more.
Calcite-alabaster was commonly used in Egypt from Early Predynastic times (5th-
millennium BCE; e.g. Lucas, 1930) until the end of the Roman period, ~400 CE, as well
as in recent times (Harrell et al., 2007). In Egypt, calcite-alabaster was used to produce
many kinds of ornamental and high-class objects. It was one of the most popular
materials in Egyptian stone vessel working due to its aesthetic qualities: attractive
coloring, translucency, ability to take a high polish, and softness (3 in Mohs scale), which
made it easy to work with and inscribe upon. Its use was limited to ambient temperatures
because it is not heat-retardant. In the southern Levant, the present-day areas of Israel,
Jordan, Lebanon and Syria, calcite-alabaster objects first appeared sporadically during the
Late Chalcolithic through the Early Bronze Age (late 5th to the 3rd millennium BCE; e.g.
Amiran, 1970; Ussishkin, 1980). During the Middle and Late Bronze Age, calcite
alabaster artifacts peaked in the region (e.g. Clamer, 1976, 2007; Caubet, 1991; Press,
2011). During these periods, calcite-alabaster artifacts in the Levant comprise mainly
small vessels. Calcite-alabaster artifacts declined in number during the Iron Age, and
eventually disappeared after the Roman Byzantine period. The term ‘Bahat’ is used in
modern archaeological Hebrew literature to denote calcite-alabaster. Calcite-alabaster
objects found in the southern Levant are commonly believed to be imported from Egypt
(e.g. Clamer, 1976; Ebeling, 2001; Press, 2011). Ignoring the possibility of local
calcite-alabaster sources, most researchers accepted the Egyptian source assumption
formulated many years ago (Ben-Dor, 1945). However, the Egyptian provenance
assumption is not taken for granted by all researchers. Lilyquist (1996) noted that only
19
“few of the vessels assigned to Egypt being displayed in various cities of the Levant
seemed unquestionably Egyptian in material, shape and detail”. Lilyquist also mentioned
examples of geological deposits in the Levant, suggesting that some of these could
potentially be quarried for calcite-alabaster, but she brings no example of such quarries.
Sparks (2007) has acknowledged the existence of potential calcite-alabaster sources in
the Negev and Sinai deserts, without evidence of quarrying, but does not mention such
deposits in the inhabited parts of the southern Levant. Sparks (2007, p. 160) noted also
that “The main issue therefore becomes whether these sources are suitable for
manufacturing stone vessels and whether it is possible to demonstrate knowledge or
exploitation of them during the period under review”, referring to the southern Levant.
Frumkin et al. (2014) show that calcite-alabaster quarries indeed existed in the southern
Levant in at least two caves, Te’omim and ‘Abud (approximately 11 km east of Shoham),
most probably providing local workshops with an alternative source for this luxury
material. They employed U/Th age dating to constrain the absolute date of these quarries,
succeeding in one of the cave quarries. This age-dating is supported by conventional
archaeological methods.
1.4 Paleoclimate
1.4.1 Marine isotope stages
Marine isotope stages (MIS), are alternating warm and cool periods in the
Earth's paleoclimate, as deduced from oxygen isotope of benthonic foraminifera from
deep sea core samples.
Oxygen isotope records obtained by analysis of benthic foraminifers from deep-sea cores
in the Caribbean were divided by Emiliani (1955) into marine isotopes stages. Shackleton
20
and Opdyke (1973) provided evidence that the δ18
Oc record is dominated by the effect of
changes in the oxygen isotopic composition of the global ocean and therefore that the
isotope stages could be used as a means to create a global stratigraphic framework for
marine sediment. Working backwards from the Holocene, which is MIS 1 in the scale;
stages with even numbers have high δ18
Oc and represent cold glacial periods, while the
odd-numbered stages are troughs in the δ18
Oc, representing warm interglacial (or
interstadial) intervals.
For the description of Quaternary marine sediments this scheme is almost universally
applied, although the means by which it is applied varies; Prell et al. (1986) recommend
the use of ‘‘events’’ (isotopic extremes) rather than boundaries (transitions between
isotope stages) for applying the formal oxygen isotope stratigraphy (and associated
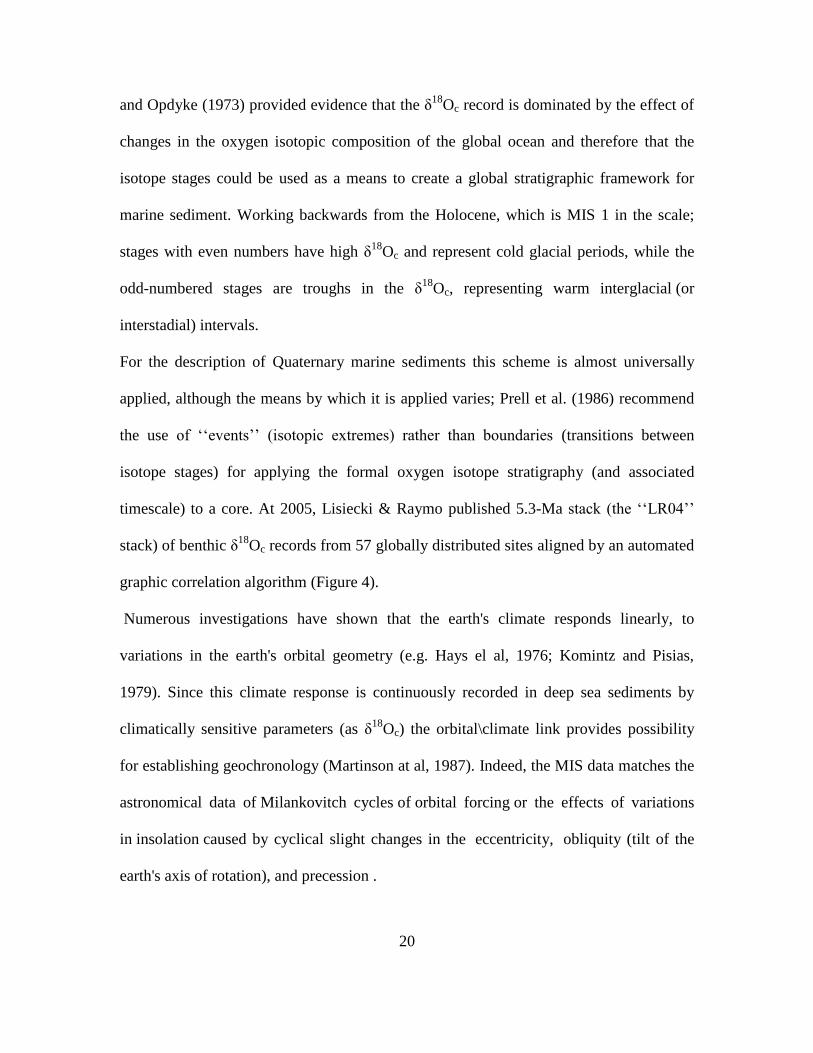
timescale) to a core. At 2005, Lisiecki & Raymo published 5.3-Ma stack (the ‘‘LR04’’
stack) of benthic δ18
Oc records from 57 globally distributed sites aligned by an automated
graphic correlation algorithm (Figure 4).
Numerous investigations have shown that the earth's climate responds linearly, to
variations in the earth's orbital geometry (e.g. Hays el al, 1976; Komintz and Pisias,
1979). Since this climate response is continuously recorded in deep sea sediments by
climatically sensitive parameters (as δ18
Oc) the orbital\climate link provides possibility
for establishing geochronology (Martinson at al, 1987). Indeed, the MIS data matches the
astronomical data of Milankovitch cycles of orbital forcing or the effects of variations
in insolation caused by cyclical slight changes in the eccentricity, obliquity (tilt of the
earth's axis of rotation), and precession .
21
Figure 4: The LR04 benthic δ18
O stack constructed by the graphic correlation of 57
globally distributed benthic δ18
O records. Marine isotopes Stages compared with
paleomagnetic time scale, after Lisiecki and Raymo, 2005. Black bars indicate normal
polarity and white bars is reversed polarity.
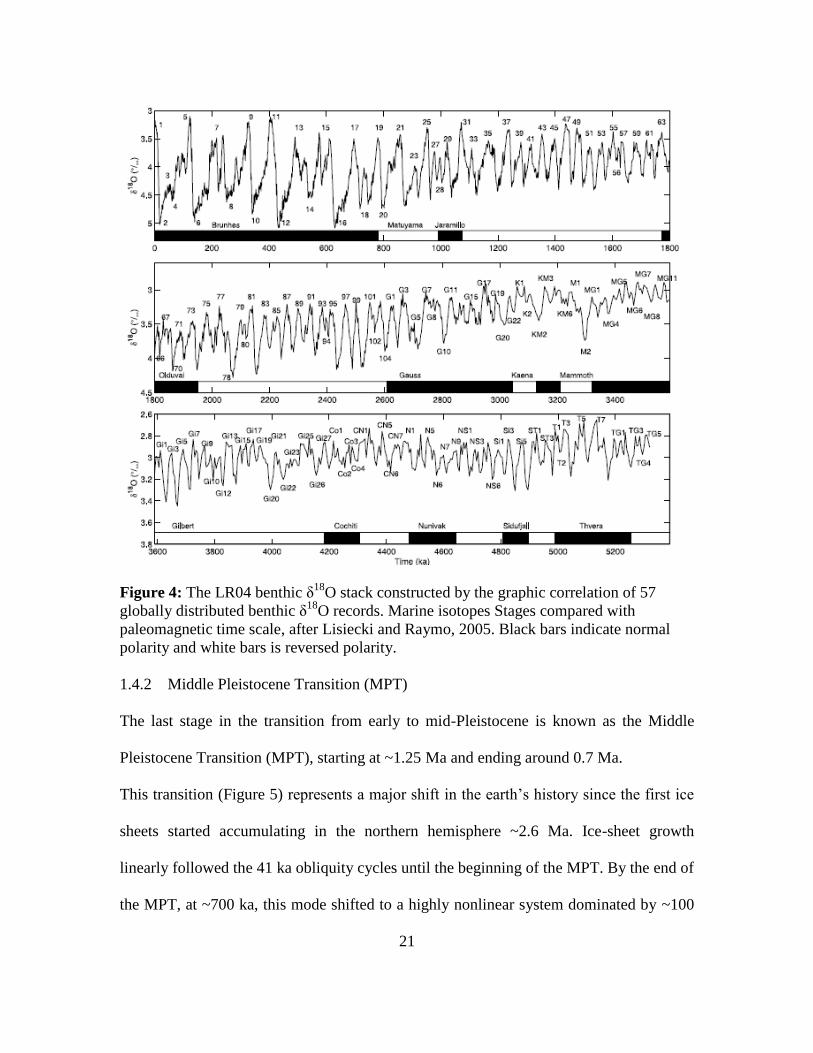
1.4.2 Middle Pleistocene Transition (MPT)
The last stage in the transition from early to mid-Pleistocene is known as the Middle
Pleistocene Transition (MPT), starting at ~1.25 Ma and ending around 0.7 Ma.
This transition (Figure 5) represents a major shift in the earth’s history since the first ice
sheets started accumulating in the northern hemisphere ~2.6 Ma. Ice-sheet growth
linearly followed the 41 ka obliquity cycles until the beginning of the MPT. By the end of
the MPT, at ~700 ka, this mode shifted to a highly nonlinear system dominated by ~100
22
ka. periodicity (Lisiecki and Raymo, 2005; Clark et al., 2006) with asymmetric
glacial/interglacial cycles (Figure 5). Large-scale ice-sheet growth in the northern
hemisphere coincides with the onset of MPT, representing a fundamental change in ice-
sheet dynamics. The change was attributed to an increase in ice-sheet thickness rather
than in areal extent (Clark et al., 2006; Sosdian and Rosenthal, 2010). The first major
glaciation, indicated by a substantial increase in ice volume, predates the end of the MPT,
occurring at ~880 ka during glacial stage 22, with increasing severity and duration of this
cold stage compared with earlier glacial stages (Figure 5). Later on, between ~850 ka and
~750 ka there were notable minima in summer solar forcing at 65°N and markedly
smaller amplitude in the ~23 ka, ~100 ka, and ~400 ka orbital bands (Figure 5).
23
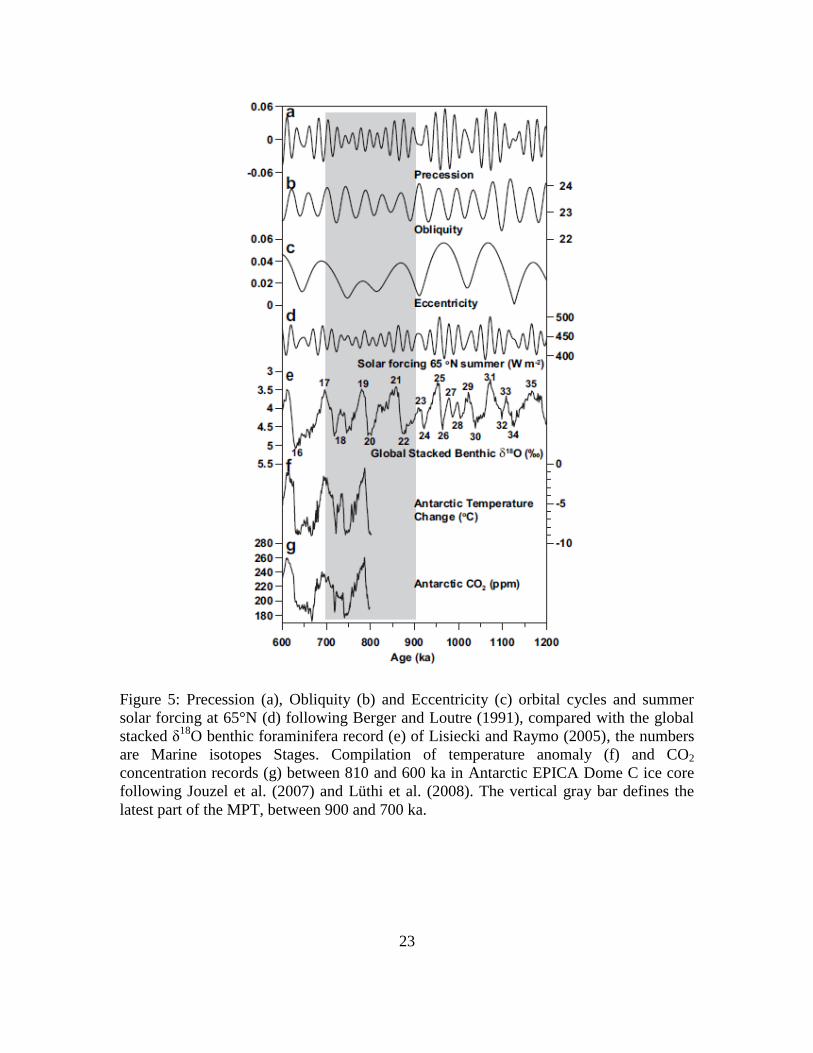
Figure 5: Precession (a), Obliquity (b) and Eccentricity (c) orbital cycles and summer
solar forcing at 65°N (d) following Berger and Loutre (1991), compared with the global
stacked δ18
O benthic foraminifera record (e) of Lisiecki and Raymo (2005), the numbers
are Marine isotopes Stages. Compilation of temperature anomaly (f) and CO2
concentration records (g) between 810 and 600 ka in Antarctic EPICA Dome C ice core
following Jouzel et al. (2007) and Lüthi et al. (2008). The vertical gray bar defines the
latest part of the MPT, between 900 and 700 ka.
24
1.4.3 Sapropels events
Sapropel is a term used to describe dark-coloured marine sediments that are rich
in organic matter. Organic carbon concentrations in sapropels commonly exceed 2% in
weight.
The sapropel occurrences in the marine sequences over the entire Eastern Mediterranean
(EM) are considerable; with the resolution that can be obtained from isotope studies,
groups of sapropels occurred simultaneously over the entire basin (Emeis at al., 1998).
Studies on the geochemistry and facies of sapropels agree that anoxic conditions favored
preservation of organic matter in sapropels, caused the enrichment of trace metals
associated with sapropels, and helped preserve primary sedimentary structures. All
evidence is consistent with elevated flux of organic matter and associated elements
during sapropel events.
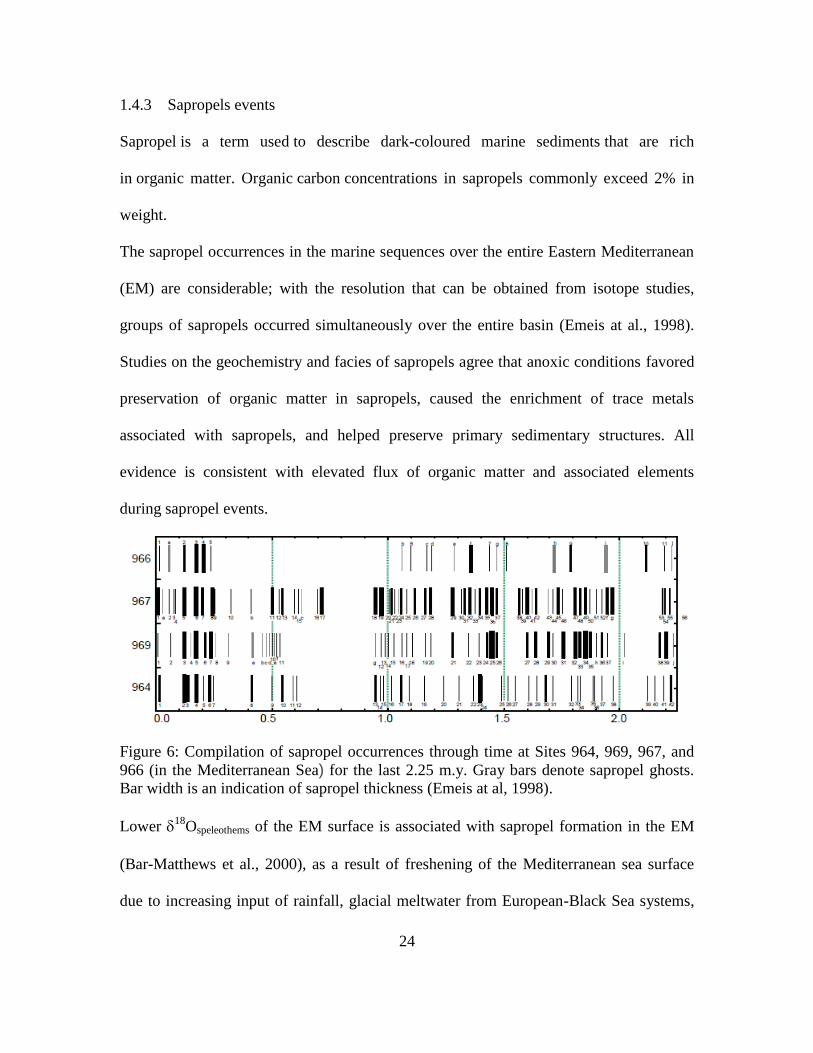
Figure 6: Compilation of sapropel occurrences through time at Sites 964, 969, 967, and
966 (in the Mediterranean Sea) for the last 2.25 m.y. Gray bars denote sapropel ghosts.
Bar width is an indication of sapropel thickness (Emeis at al, 1998).
Lower 18
Ospeleothems of the EM surface is associated with sapropel formation in the EM
(Bar-Matthews et al., 2000), as a result of freshening of the Mediterranean sea surface
due to increasing input of rainfall, glacial meltwater from European-Black Sea systems,
25
and Nile River and rivers from the Sahara discharge, associated with increased African
monsoon rains (for review see Bar-Matthews, 2014). The climatic conditions during the
sapropel events are also reflected in the terrestrial record. 13
C values of Soreq Cave
speleothems present more complicated features. During most of the interglacials, 13
C
values range between -13 and -10‰, typical of C3-dominated vegetation, but during MIS
5e (128-120 ka) and during the early Holocene (9.4 and 7.0 ka), 13
C values are
extremely high, rising to ~0‰ and ~ -5.0‰ at MIS 5e and early Holocene respectively.
The very high 13
C during these intervals are coupled with the very low 18
O. Bar-
Matthews et al. (2000) interpreted this coupling as reflecting deluge events, where 13
C
cannot reflect the soil-CO2 composition due to high water flushing to the cave that result
in isotopic composition approaching the surrounding dolomite host rock. Evidence for
this process is provided by the large amount of detrital material incorporated in the Soreq
Cave speleothems during these time intervals (Ayalon et al., 1999), and the sharp drop in
the concentrations of Sr, Ba, and U, and in the ratios of (234
U/238
U)0 and 87
Sr/86
Sr, which
reflect enhanced weathering of the host-rock (Kaufman et al., 1998; Ayalon et al., 1999;
Bar-Matthews et al., 2000).
Bar-Matthews et al. (2000, 2003) estimated that rainfall during these events could have
been 20%-70% higher than present-day amounts. Alternatively, Frumkin et al. (2000)
suggest that the high 13
C during 128-120 ka can be the outcome of unstable, dry and warm
conditions, loss of vegetation, and erosion of the soil cover. This hydrologic regime is
consistent with irregular high water flushing events: flash-floods are potentially more
common under scarce vegetation cover. Such fluctuating dry-hot intervals could have
26
enhanced forest fires, followed by rapid soil erosion; eventually leading to abrupt changes
and high 13
C. The high Soreq cave pool levels during the 128-120 ka interval indicate that
some flash-floods were frequent enough to keep the pools full, long enough for calcite
deposition. Enhanced rainfall over the Mediterranean basin during sapropel events is evident
from the similar salinity trend in the entire Mediterranean basin (Kallel et al., 1997) and from
combined biotic and abiotic proxies in the Yammouneh basin (Lebanon) (Gasse et al., 2015).
The extreme arid region of northeast Africa experienced episodes of considerable increase in
rainfall at this time associated with EM rainfall front, coinciding in time with increased
African monsoon activity (Vaks et al., 2010). Less wet conditions developed during the
intervals of sapropels S3 and S4 (~109-107 ka to 104-100 ka and 86-83 ka, respectively). In
general, the speleothem evidence reflects highly unstable and erratic conditions during these
deglacial/interglacial transitions.
During interglacial substages, between sapropel events (e.g. MIS 5.2, 5.4, 7.2, 7.4 etc.,)
the 18
OCc are higher by ~2-3‰, reflecting change in the 18
O of the source water and
increased aridity in the region. The increased aridity is also evident from the marine record
indicating aeolian deposits replacing fluvial Nilotic contribution (Almogi-Labin et al., 2004,
2009).
1.5 Paleoclimate reconstruction using stable isotopes in speleothems
1.5.1 Oxygen isotopic composition
Speleothems are used as archives providing information related to environmental
conditions, which are monitored using their isotopic and chemical composition. Once the
chronology and growth rate of the speleothem are determined, a detailed climatic
reconstruction can be made, using δ18
Oc and δ13
C values (e.g., McDermott, 2004). The
27
fractionation of 18
O/16
O between water and calcite during the precipitation of the
speleothems depends on the temperature in the cave and the δ18
Ow of the cave water. The
δ18
O of the cave water is closely related to the isotopic composition of the rainwater
(Ayalon, et al., 1998), and the cave temperature reflects average annual temperature in
the area. δ18
Ow of rainwater is a function of various parameters, including the isotopic
composition of the source, temperature, distance from the rainfall source and the amount
of precipitation also referred as the “amount effect” (Bar-Matthews et al., 2003; Kolodny
et al., 2005), latitude and altitude. The “source effect” is significant on the long-term
behavior of isotopic reservoirs of the east Mediterranean region: Speleothem δ18
Oc is
strongly influenced by the marine reservoir that contributes its vapor to rain formation.
Short-term variations in the isotopic composition of rainfall are dominated by the amount
effect and the temperature. Periods of low δ18
Oc values in Soreq Cave speleothems were
interpreted as related to warming, and increase in the rainfall amount (Bar-Matthews, et
al., 2000). High values of δ18
Oc in Soreq Cave speleothems are related to global cooling
episodes, such as Heinrich events and the LGM.
1.5.2 Carbon isotopic composition
The δ13
C values of cave waters reflect the contribution of the dolomitic host rock and of
soil-CO2, CO2 degassing and carbonate precipitation (e.g. Frumkin, et al., 2000; Genty &
Massault, 1999; Bar-Matthews, et al., 1996). Soil-CO2 is a major source of carbon to the
speleothems, and δ13
C of soil-CO2 gas mostly depends on the type of photosynthesis
pathway and also on the intensity of biogenic activity and deserts tend. Thus, δ13
C
fluctuations shown in speleothems may reflect changes in the vegetation type in the cave
area. There are two major photosynthetic pathways: C3 and C4. The C3 pathway is usually
28
used by trees, shrubs and cool climate herbs. The C4 pathway is used by warmer climate
adapted grasses and herbs. Average δ13
C values of C3 vegetation is ~ -27‰, and of C4 is
~ -12‰ (Smith and Epstein, 1971; Deins, 1980). The expected range of δ13
C in
carbonates in regions dominated by C3 plants is -14 to -6‰ whereas those dominated by
C4 plants range between -6 to +2‰ (Bourdon, et al., 2003).
Other factors controlling the carbon isotopic composition are the presence or absence
of soil cover, intensity of carbonate host-rock dissolution and water–rock interactions in
the unsaturated zone (e.g., Bar-Matthews et al., 1996; Hendy, 1971; Genty et al., 2001;
Frumkin, et al., 2000). Environmental parameter such as water stress, high temperature
and CO2 level may affect the plant δ13
C value by an increase in the range of 2-4‰ (e.g.,
Ehleringer and Cooper, 1988; Tieszen, 1991)
29
1.6 Petrography
Experiments have demonstrated that crystal morphology and growth mechanisms yield
much information on the physicochemical parameters of the parent fluid (Sunagawa,
1987). Crystals form when there is departure from equilibrium, which, for sparingly
soluble salts (such as calcium carbonate), is the degree of supersaturation. As
supersaturation increases, crystal habits are expected to change from prismatic to
spherulitic (Boistelle, 1982). Kim and O’Neil (1997) demonstrated that nonequilibrium
isotope fractionation in calcite occurs when crystals grow at high supersaturation
resulting in kinetic fractionation. Departure from equilibrium growth, therefore, may
influence both the form (habit) and the isotopic properties of calcite crystals.
Gonzalez et al. (1992) illustrated that spelean calcite crystal habit is controlled by
supersaturation, and fabrics are controlled by flow rate. Changes in calcite fabrics and
crystal habits, therefore, have the potential to provide a record of supersaturation and
changes in water availability through time (Szabo et al. 1994).
Crystal habits, however, are not controlled solely by the degree of supersaturation but
also by other factors such as crystal structure (Burton et al.1951), the presence of foreign
ions, and the kinetics of growth processes (Prieto et al. 1981).
The combination of different factors such as drip rate, supersaturation, impurity content,
and, possibly, Mg/Ca ratio of the parent waters seemingly control the development of
columnar, fibrous, microcrystalline, dendritic, and calcareous fabrics in speleothems.
Most of these factors are detectable through petrographic observations. Secondary
changes, such as neomorphism or transformation also impact speleothem preservation of
climate signals and are, potentially, detectable by petrographic observations also.
30
Commonly, speleothems are mineral aggregates formed in voids (caves) – only a few
speleothems consist of single crystals (Frisia, 2000). The fabric is, thus: “a geometric
picture formed by the dividing surfaces of the separate mineral individuals which form
the mineral aggregate” (Stepanov, 1997).
For example, columnar fabric proper has been interpreted as forming at relatively low
supersaturation, regular flow, negligible presence of “foreign ions” (Frisia, 2000) and
"feathered" like, columnar may form because of the presence of magnesium, sulphate, or
microbes (Folk, 1965). Likewise, large detritus free crystals are common during glacial
periods when water dripping was more continuous and slow compared with early
Holocene (Bar-Matthews et al., 1997(.
1.7 The use of stable isotopes for identifying provenance of ancient vessels
To determine the provenance of artifacts, each potential source area must be "finger-
printed" and a database built up of sources. The distinctive fingerprints can base on
petrographic, magnetic, geochemical or any other distinguishing physical characteristics
of the material.
The most widely used procedure today for identification of white marbles involves a
combination of microscope and C-O stable isotope analyses (Gorgoni et al, 2002). As
early as the beginning of the 1970s, Craig and Craig (1972) highlighted the importance of
the carbon and oxygen isotopic signature for provenance study of archeological white
marbles, and proposed the first comparative data bank in the form of correlation clusters.
Over the following years, the first database was developed and detailed by several
researchers (Manfra et al, 1975; Hertz, 1986). This progressive implantation proceeded in
two directions: 1. By creating sets of reference data for new supply areas of known or
31
potential archeological interest never previously considered and 2. By improving and
detailing the database for the most important marbles of classical antiquity.
For example, a study has been made of δ18
Oc and δ13
C variations in Greek marbles from
the ancient quarry localities of Naxos, Paros, Mount Hymettus, and Mount Pentelikon.
Parian, Hymettian, and Pentelic marbles can be clearly distinguished by the isotopic
relationships; Naxian marbles fall into two groups characterized by different oxygen-
18/oxygen-16 ratios. Ten archeological samples were also analyzed; the isotopic data
indicate that the "Theseion" is made of Pentelic marble and a block in the Treasury of
Siphnos at Delphi is probably Parian marble (Craig, 1972).
Here we shall use, in a similar way, stable isotopes of oxygen and carbon for preliminary
identification of the provenance of some ‘bahat’ artifacts.
2 Aims and research goals
This research has three main goals:
(1) To identify the character of local calcite-alabaster raw material, based on petrographic
and isotopic parameters of TM-2 flowstone section from the quarry at the Te'omim cave.
These parameters will be used to determine whether shifts in the isotopic composition are
associated with change in crystal growth.
(2) To date the entire studied section of TM-2 using paleomagnetic tools, U-Pb and U-Th
methods and by comparing isotopic events with the global stacked δ18
Oc benthic
foraminifera record, timing of magnetic reversals and sapropel events. The paleo
environment of the southern Levant during the growth period of TM-2 will be deduced
32
from the analysis of oxygen and carbon stable isotope values. This will shed light on
long-range terrestrial climate change and its extreme values.
(3) To compare the isotopic composition of the TM-2 to the isotopic composition of
archeological artifacts from several locations in order to add information on the
provenance of archaeological artifacts that were produced from this site as opposed to
alternative sources.
As mentioned above, calcite-alabaster objects found in the southern Levant are
commonly believed to be imported from Egypt (e.g. Clamer, 1976; Ebeling, 2001; Press,
2011). Ignoring the possibility of local calcite-alabaster sources, most researchers
accepted the Egyptian source assumption formulated many years ago (Ben-Dor, 1945). In
this research petrographic and isotopic characteristics of the calcite-alabaster will enable
the characterization of the local alabaster, that were quarried from the local flowstone
quarry in the Te’omim Cave.
3 Methodology
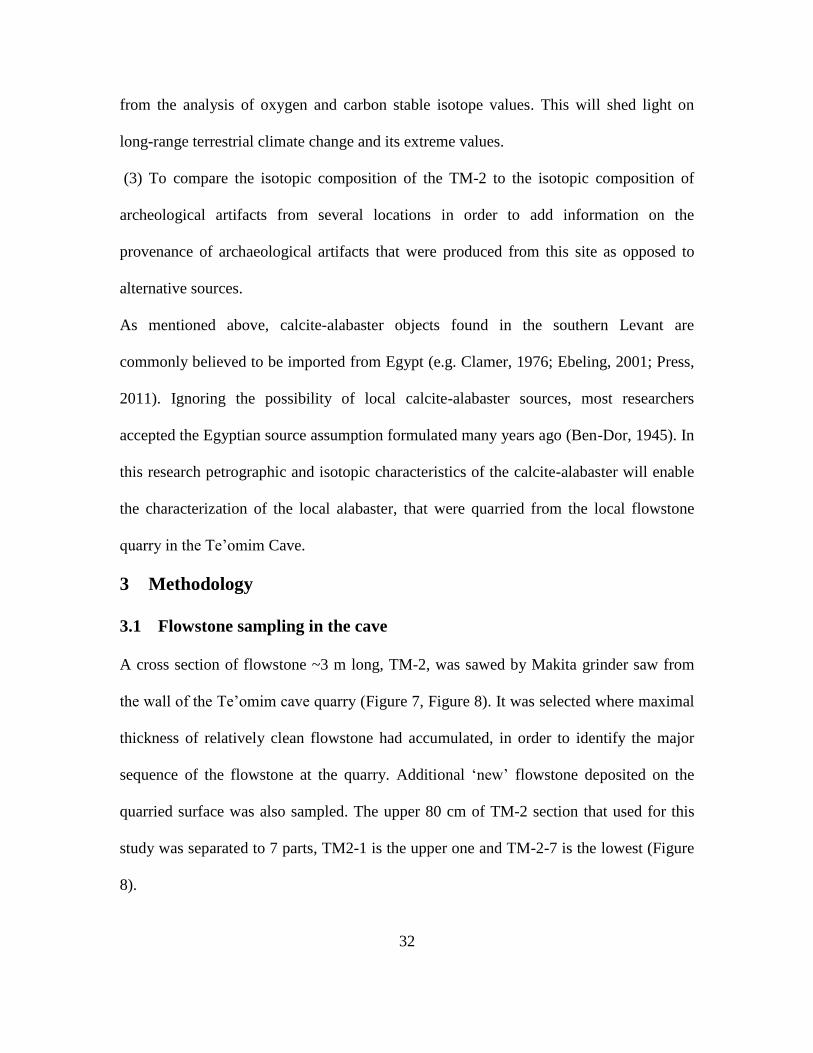
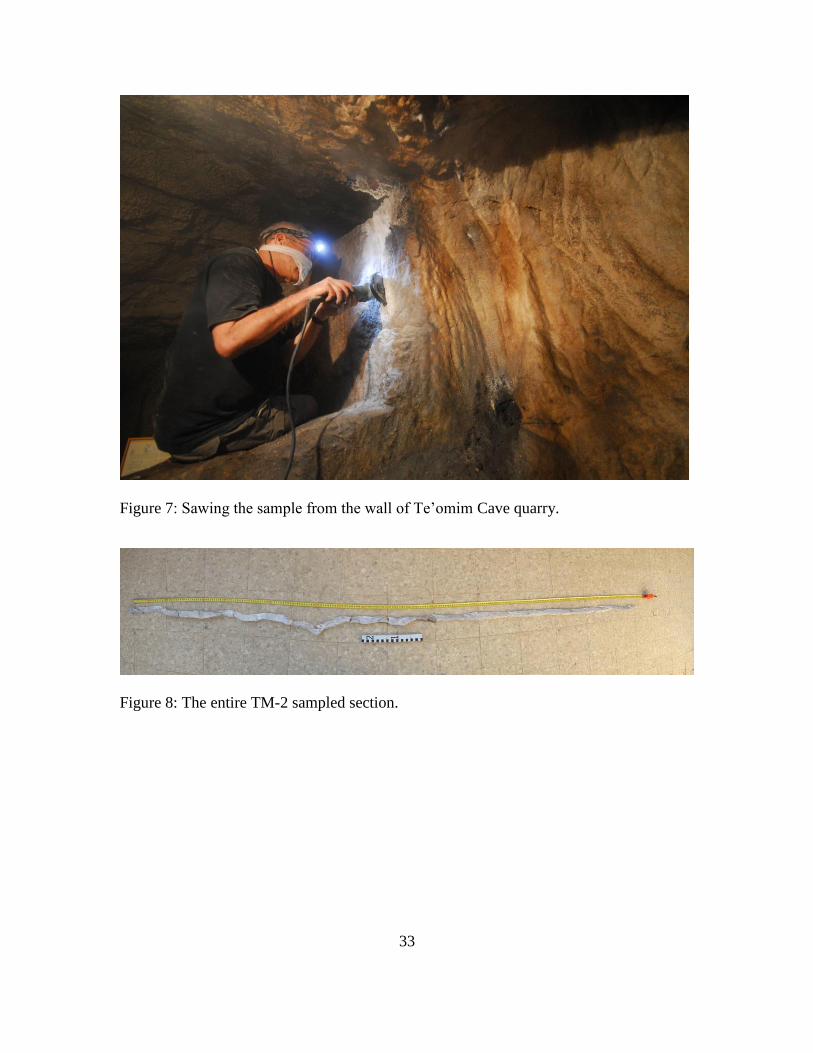
3.1 Flowstone sampling in the cave
A cross section of flowstone ~3 m long, TM-2, was sawed by Makita grinder saw from
the wall of the Te’omim cave quarry (Figure 7, Figure 8). It was selected where maximal
thickness of relatively clean flowstone had accumulated, in order to identify the major
sequence of the flowstone at the quarry. Additional ‘new’ flowstone deposited on the
quarried surface was also sampled. The upper 80 cm of TM-2 section that used for this
study was separated to 7 parts, TM2-1 is the upper one and TM-2-7 is the lowest (Figure
8).
33
Figure 7: Sawing the sample from the wall of Te’omim Cave quarry.
Figure 8: The entire TM-2 sampled section.
34
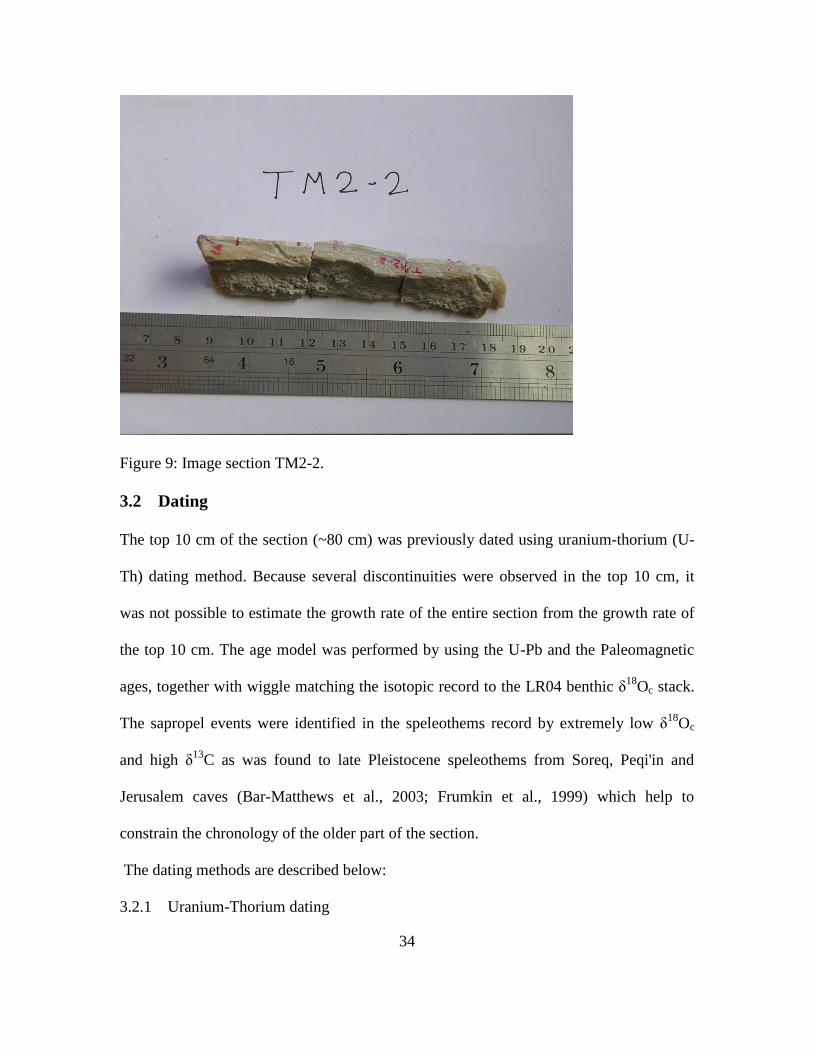
Figure 9: Image section TM2-2.
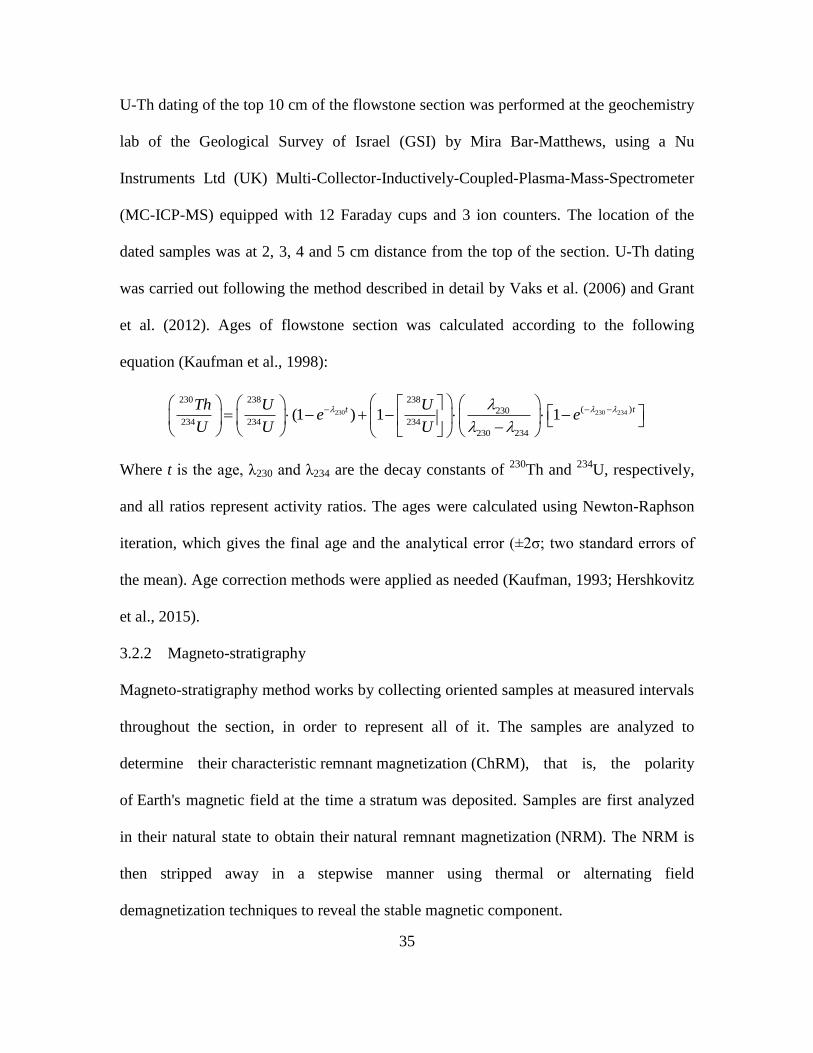
3.2 Dating
The top 10 cm of the section (~80 cm) was previously dated using uranium-thorium (U-
Th) dating method. Because several discontinuities were observed in the top 10 cm, it
was not possible to estimate the growth rate of the entire section from the growth rate of
the top 10 cm. The age model was performed by using the U-Pb and the Paleomagnetic
ages, together with wiggle matching the isotopic record to the LR04 benthic δ18
Oc stack.
The sapropel events were identified in the speleothems record by extremely low δ18
Oc
and high δ13
C as was found to late Pleistocene speleothems from Soreq, Peqi'in and
Jerusalem caves (Bar-Matthews et al., 2003; Frumkin et al., 1999) which help to
constrain the chronology of the older part of the section.
The dating methods are described below:
3.2.1 Uranium-Thorium dating
35
U-Th dating of the top 10 cm of the flowstone section was performed at the geochemistry
lab of the Geological Survey of Israel (GSI) by Mira Bar-Matthews, using a Nu
Instruments Ltd (UK) Multi-Collector-Inductively-Coupled-Plasma-Mass-Spectrometer
(MC-ICP-MS) equipped with 12 Faraday cups and 3 ion counters. The location of the
dated samples was at 2, 3, 4 and 5 cm distance from the top of the section. U-Th dating
was carried out following the method described in detail by Vaks et al. (2006) and Grant
et al. (2012). Ages of flowstone section was calculated according to the following
equation (Kaufman et al., 1998):
230 230 234
230 238 238( )230
234 234 234
230 234
(1 ) 1 1t tTh U U
e eU U U
Where t is the age, λ230 and λ234 are the decay constants of 230
Th and 234
U, respectively,
and all ratios represent activity ratios. The ages were calculated using Newton-Raphson
iteration, which gives the final age and the analytical error (±2σ; two standard errors of
the mean). Age correction methods were applied as needed (Kaufman, 1993; Hershkovitz
et al., 2015).
3.2.2 Magneto-stratigraphy
Magneto-stratigraphy method works by collecting oriented samples at measured intervals
throughout the section, in order to represent all of it. The samples are analyzed to
determine their characteristic remnant magnetization (ChRM), that is, the polarity
of Earth's magnetic field at the time a stratum was deposited. Samples are first analyzed
in their natural state to obtain their natural remnant magnetization (NRM). The NRM is
then stripped away in a stepwise manner using thermal or alternating field
demagnetization techniques to reveal the stable magnetic component.
36
Magnetic orientations of all samples from a site are then compared and their average
magnetic polarity is determined with directional statistics. The latitudes of the Virtual
Geomagnetic Poles from those sites determined to be statistically significant are plotted
against the stratigraphic level at which they were collected. These data are then abstracted
to the standard black and white magnetostratigraphic columns in which black indicates
normal polarity and white is reversed polarity (Figure 10).
To locate the magnetic reversals in the time scale, at least one age obtained from another
dating method is needed. With the aid of the independent age, the local
magnetostratigraphic column is correlated with the Global Magnetic Polarity Time Scale
(GMPTS) (Singer, 2014).
Oriented cores, 1’’ in diameter were drilled in the section using electrical drill. The
cores were sliced in the lab to smaller 1’’ length specimens. Paleomagnetic stepwise
demagnetization experiments were carried out in the paleomagnetic laboratory of the
Institute of Earth Sciences, the Hebrew University of Jerusalem by Ron Shaar and Yael
Ebert. Measurements were carried out using a 3-axis 2G cryogenic magnetometer
with integrated Alternating Field (AF) demagnetization unit. Each specimen
underwent multiple demagnetization steps at progressively increased field up to 90 mT
to determine the paleomagnetic polarity.
3.2.3 Uranium-Lead dating
The method Uranium-Lead (U-Pb) chronology is usually applies to two U-Pb decay
systems:
(1) 206
Pbm = 206
Pbi + 238
U(el238t – 1)
37
(2) 207
Pbm = 207
Pbi + 235
U(el235t – 1)
Where “m” refers to the measured amount of an isotope at present, “i” to its initial
concentration, “l” is the decay constant for the appropriate isotope, and “t” is the time
elapsed from initial conditions to the present. Uranium-lead dating is usually performed
on the mineral zircon (ZrSiO4), but also been applied to other minerals such
as calcite/aragonite and other carbonate minerals. The two U-Pb dates obtained from 238
U
and 235
U have different half-lives, so if the dates obtained from the two decays are in
agreement this adds confidence to the date.
Flowstone samples from Te'omim cave were U-Pb dated by Gideon Henderson at Oxford
University, GB.
3.3 Oxygen and carbon isotopic composition
For climatic and environmental change reconstruction purposes, δ18
Oc and δ13
C analyses
are made on 0.35-0.5 mg samples, obtained by drilling at intervals of ~0.5-1.0 mm and
put in glass vials. Dry phosphoric acid (100%) is added to the top of the vials, which are
placed in a horizontal position to avoid reaction with the carbonate. The samples are
flushed with pure helium gas for 10 minutes in order to remove all atmospheric CO2, and
only then the vials are turned to vertical position to allow the phosphoric acid to react
with the powder of the drilled samples dissolving the carbonate, and forming CO2. The
CO2 is measured using a Delta V mass spectrometer with a Gas Bench automatic sampler
in order to measure δ18
Oc and δ13
C. All δ18
Oc and δ13
C values were calibrated against the
international standard NBS-19, and are reported in permil (‰), relative to the VPDB
standard
38
3.4 Oxygen and carbon isotopic composition of 'Bahat'
Oxygen and carbon isotope composition of ‘Bahat’ (alabaster) archaeological artifacts
samples from Egypt and Israel were measured using the same technique described above.
The 'Bahat' artifacts and their characteristics were supplied by Ayala Amir who studied
the provenance of these objects for her MSc thesis, using other methods (e.g., trace
elements, Sr isotopic composition). The description of each 'Bahat' samples is given in
the supplementary section.
3.5 Optical microscopy
13 thin sections 30µm thick were taken lengthwise the TM-2 section. These thin sections
were examined using polarization optical microscope Olympus BX50 in the GSI in order
to determine their crystal growth habit and fabric.
39
4 Results
4.1 Dating
4.1.1 U-Th dating
U-Th dating of five samples from the top of the section yielded ages of ca. 53.1 ± 1.2 ka,
60.2 ± 0.8 ka, 109.4 ± 1.3 ka, and 488 ± 87 ka (Figure 10).
4.1.2 Magneto-stratigraphy
Figure 10 displays the TM-2 section and the location of the 26 samples taken for the
magneto-stratigraphy dating.
The first reversal commonly dated to 773 ka occurs at about 10 cm from the top of the
section. Comparison with the isotopic profile (see paragraph 4.2) suggests that the
reversal point can be placed where isotopic measurement no. 100 was performed (Fig.
11).
4.1.3 U-Pb dating
Eight samples were dated U-Pb dating method. The sample powders were taken from the
samples collected for paleomagnetic study, and are numbered with the same numbers as
marked in Fig. 10. The results are as follows:
1. Samples 1 and 6: Contain high concentration of Pb and thus could not give
reliable U-Pb age. Based on their 234
U/238
U ratio, their age is estimated at about
1000 ka.
2. Samples 8, 12, 15: located close to each other, gave an age of 1300 ka with error
of ±60-120 ka.
3. Sample 16: Probably not a closed system.
40
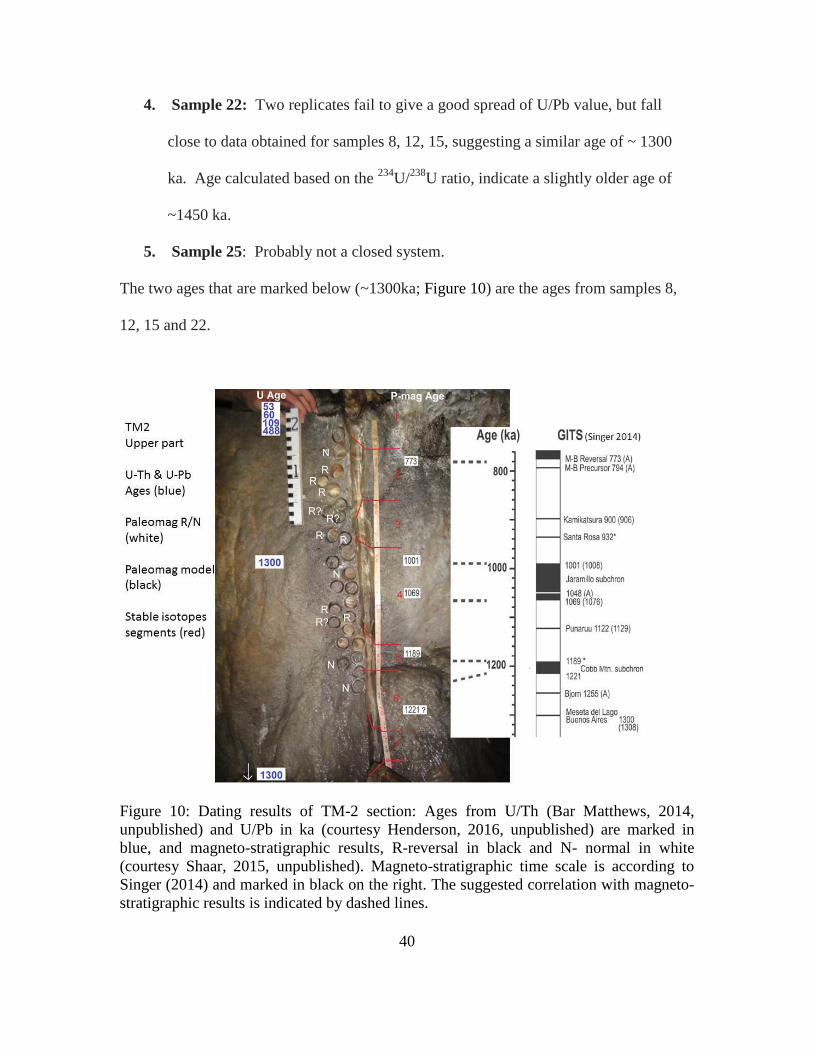
4. Sample 22: Two replicates fail to give a good spread of U/Pb value, but fall
close to data obtained for samples 8, 12, 15, suggesting a similar age of ~ 1300
ka. Age calculated based on the 234
U/238
U ratio, indicate a slightly older age of
~1450 ka.
5. Sample 25: Probably not a closed system.
The two ages that are marked below (~1300ka; Figure 10) are the ages from samples 8,
12, 15 and 22.
Figure 10: Dating results of TM-2 section: Ages from U/Th (Bar Matthews, 2014,
unpublished) and U/Pb in ka (courtesy Henderson, 2016, unpublished) are marked in
blue, and magneto-stratigraphic results, R-reversal in black and N- normal in white
(courtesy Shaar, 2015, unpublished). Magneto-stratigraphic time scale is according to
Singer (2014) and marked in black on the right. The suggested correlation with magneto-
stratigraphic results is indicated by dashed lines.
41
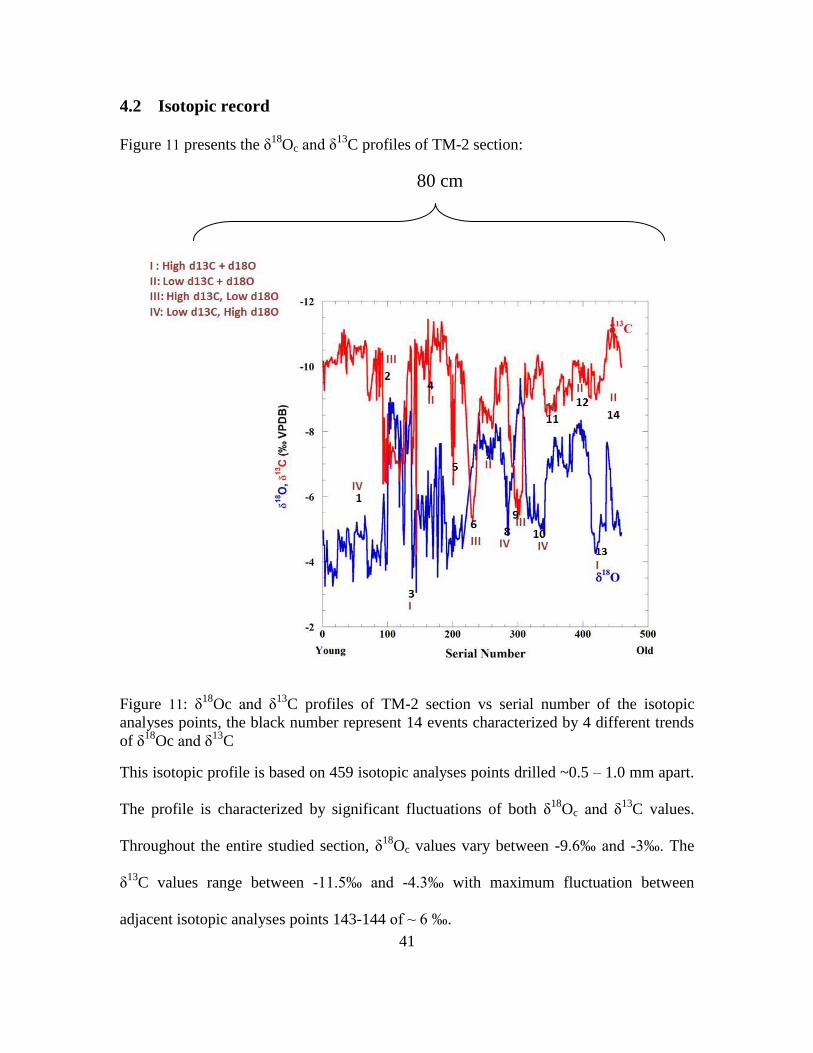
4.2 Isotopic record
Figure 11 presents the δ18
Oc and δ13
C profiles of TM-2 section:
Figure 11: δ18
Oc and δ13
C profiles of TM-2 section vs serial number of the isotopic
analyses points, the black number represent 14 events characterized by 4 different trends
of δ18
Oc and δ13
C
This isotopic profile is based on 459 isotopic analyses points drilled ~0.5 – 1.0 mm apart.
The profile is characterized by significant fluctuations of both δ18
Oc and δ13
C values.
Throughout the entire studied section, δ18
Oc values vary between -9.6‰ and -3‰. The
δ13
C values range between -11.5‰ and -4.3‰ with maximum fluctuation between
adjacent isotopic analyses points 143-144 of ~ 6 ‰.
80 cm

42
The isotopic record was divided to 14 events characterized by 4 different combinations of
δ18
Oc and δ13
C trends:
I. High δ13
C and high δ18
Oc (events 13, 5, 3)
II. Low δ13
C and low δ18
Oc (events 14, 12, 7, 4)
III. High δ13
C and low δ18
Oc (events 11, 9, 6, 2)
IV. Low δ13
C and high δ18
Oc (events 10, 8, 1)
4.3 Petrography and isotopic profile
This chapter presents a description of the calcite crystals of TM-2 (flowstone) cross-
section, in order to define if growth was continuous and if there were major depositional
changes during the formation of the flowstone. Special attention will be given to verify if
changes in the crystal growth habits and size correspond to changes observed in the
isotopic profile and therefore the numbers 1-14 represent the isotopes events described in
section 4.2.
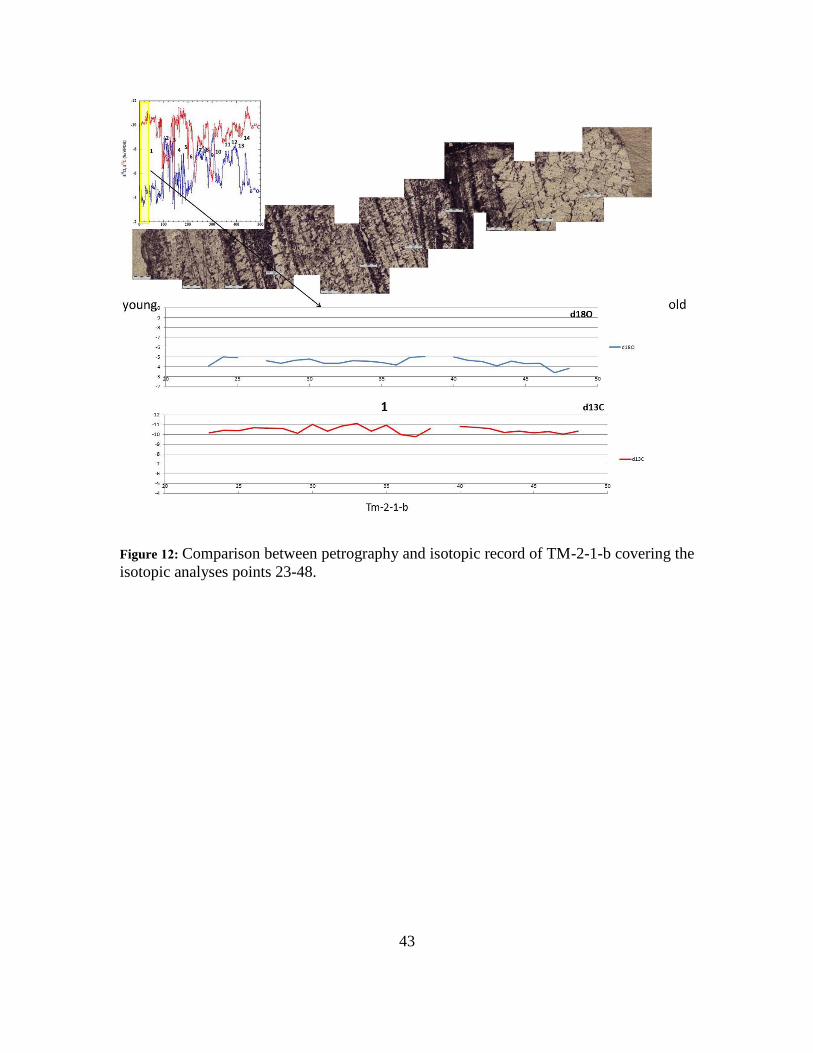
TM2-1B (event No. 1, Figure 12)
Two patterns are observed in the sample: (1) The oldest part, between isotopic analyses
points 48-31 is characterized by very large (~ 10 mm) and transparent crystals with
mosaic structure. Along this section, 18
O values show moderated decreasing trend from -
3.5‰ to -5‰. (2) The younger part of the section, between isotopic analyses points 31-
23, is characterized mostly by small (1-2 mm) columnar crystals with parallel extinction,
with dark laminae in between. Along this part, 18
O values are characterized by
fluctuations between -4‰ and -5‰. In both sections, the 13
C values are relatively low,
ranging between ~ -11‰ and -10‰. Although there are changes in the crystal habit, no
sharp oscillations in the 18
O and 13
C are observed.
43
Figure 12: Comparison between petrography and isotopic record of TM-2-1-b covering the
isotopic analyses points 23-48.
44
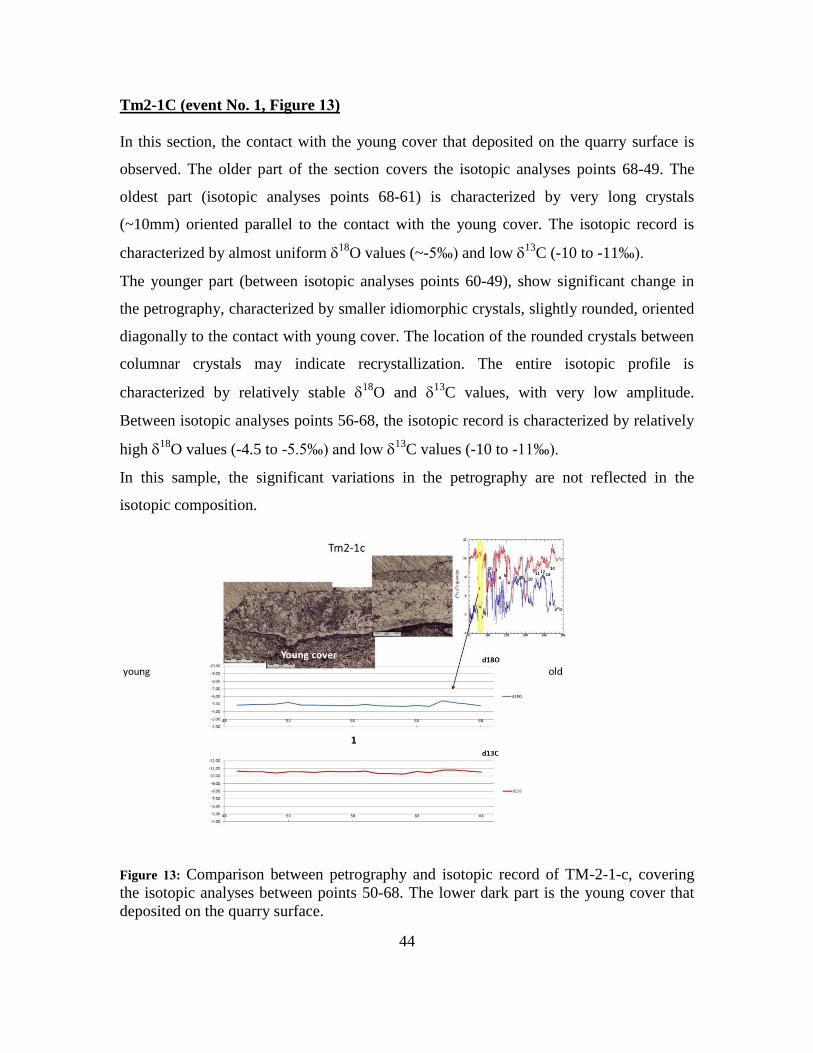
Tm2-1C (event No. 1, Figure 13)
In this section, the contact with the young cover that deposited on the quarry surface is
observed. The older part of the section covers the isotopic analyses points 68-49. The
oldest part (isotopic analyses points 68-61) is characterized by very long crystals
(~10mm) oriented parallel to the contact with the young cover. The isotopic record is
characterized by almost uniform 18
O values (~-5‰) and low 13
C (-10 to -11‰).
The younger part (between isotopic analyses points 60-49), show significant change in
the petrography, characterized by smaller idiomorphic crystals, slightly rounded, oriented
diagonally to the contact with young cover. The location of the rounded crystals between
columnar crystals may indicate recrystallization. The entire isotopic profile is
characterized by relatively stable 18
O and 13
C values, with very low amplitude.
Between isotopic analyses points 56-68, the isotopic record is characterized by relatively
high 18
O values (-4.5 to -5.5‰) and low 13
C values (-10 to -11‰).
In this sample, the significant variations in the petrography are not reflected in the
isotopic composition.
Figure 13: Comparison between petrography and isotopic record of TM-2-1-c, covering
the isotopic analyses between points 50-68. The lower dark part is the young cover that
deposited on the quarry surface.
45
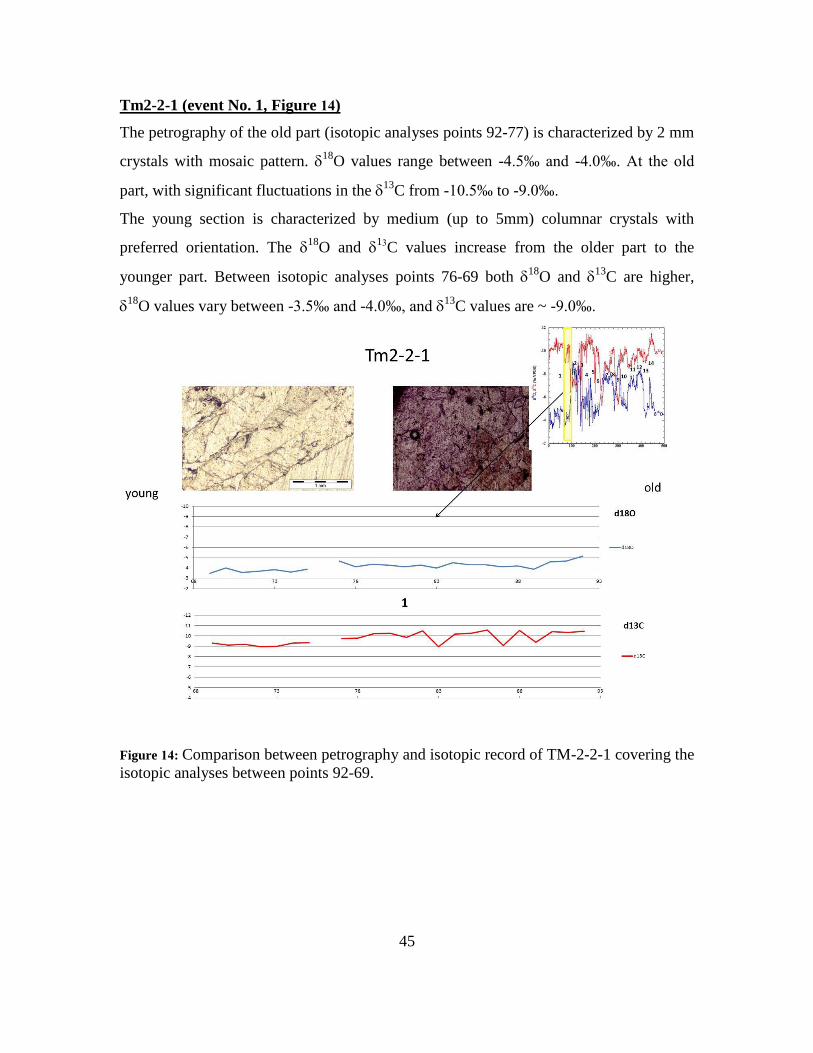
Tm2-2-1 (event No. 1, Figure 14)
The petrography of the old part (isotopic analyses points 92-77) is characterized by 2 mm
crystals with mosaic pattern. 18
O values range between -4.5‰ and -4.0‰. At the old
part, with significant fluctuations in the 13
C from -10.5‰ to -9.0‰.
The young section is characterized by medium (up to 5mm) columnar crystals with
preferred orientation. The 18
O and 13C values increase from the older part to the
younger part. Between isotopic analyses points 76-69 both 18
O and 13
C are higher,
18
O values vary between -3.5‰ and -4.0‰, and 13
C values are ~ -9.0‰.
Figure 14: Comparison between petrography and isotopic record of TM-2-2-1 covering the
isotopic analyses between points 92-69.
46
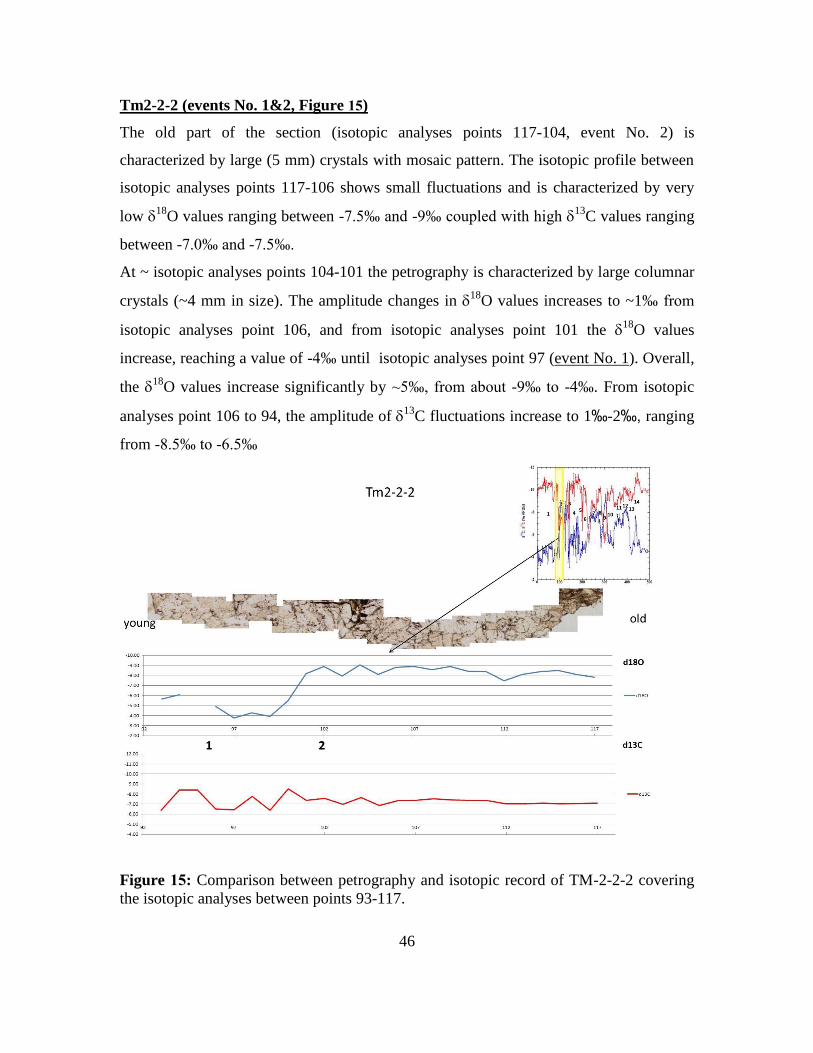
Tm2-2-2 (events No. 1&2, Figure 15)
The old part of the section (isotopic analyses points 117-104, event No. 2) is
characterized by large (5 mm) crystals with mosaic pattern. The isotopic profile between
isotopic analyses points 117-106 shows small fluctuations and is characterized by very
low 18
O values ranging between -7.5‰ and -9‰ coupled with high 13
C values ranging
between -7.0‰ and -7.5‰.
At ~ isotopic analyses points 104-101 the petrography is characterized by large columnar
crystals (~4 mm in size). The amplitude changes in 18
O values increases to ~1‰ from
isotopic analyses point 106, and from isotopic analyses point 101 the 18
O values
increase, reaching a value of -4‰ until isotopic analyses point 97 (event No. 1). Overall,
the 18
O values increase significantly by ~5‰, from about -9‰ to -4‰. From isotopic
analyses point 106 to 94, the amplitude of 13
C fluctuations increase to 1‰-2‰, ranging
from -8.5‰ to -6.5‰
Figure 15: Comparison between petrography and isotopic record of TM-2-2-2 covering
the isotopic analyses between points 93-117.
47
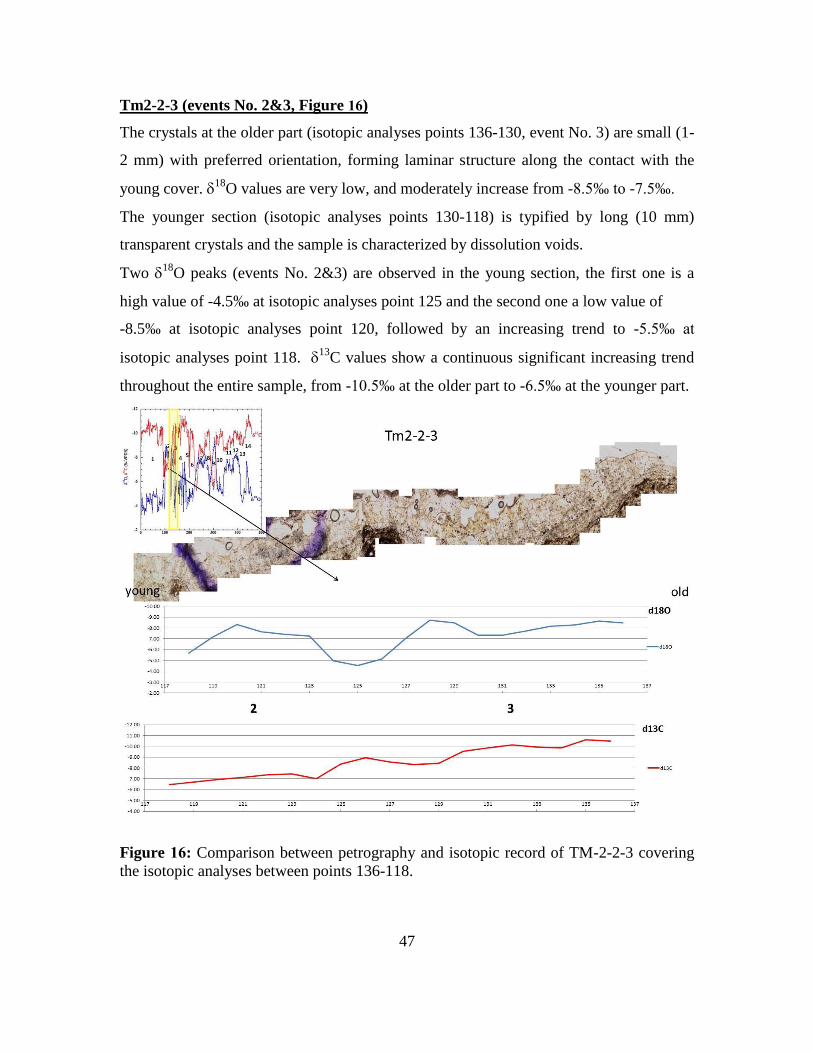
Tm2-2-3 (events No. 2&3, Figure 16)
The crystals at the older part (isotopic analyses points 136-130, event No. 3) are small (1-
2 mm) with preferred orientation, forming laminar structure along the contact with the
young cover. 18
O values are very low, and moderately increase from -8.5‰ to -7.5‰.
The younger section (isotopic analyses points 130-118) is typified by long (10 mm)
transparent crystals and the sample is characterized by dissolution voids.
Two 18
O peaks (events No. 2&3) are observed in the young section, the first one is a
high value of -4.5‰ at isotopic analyses point 125 and the second one a low value of
-8.5‰ at isotopic analyses point 120, followed by an increasing trend to -5.5‰ at
isotopic analyses point 118. 13
C values show a continuous significant increasing trend
throughout the entire sample, from -10.5‰ at the older part to -6.5‰ at the younger part.
Figure 16: Comparison between petrography and isotopic record of TM-2-2-3 covering
the isotopic analyses between points 136-118.
48
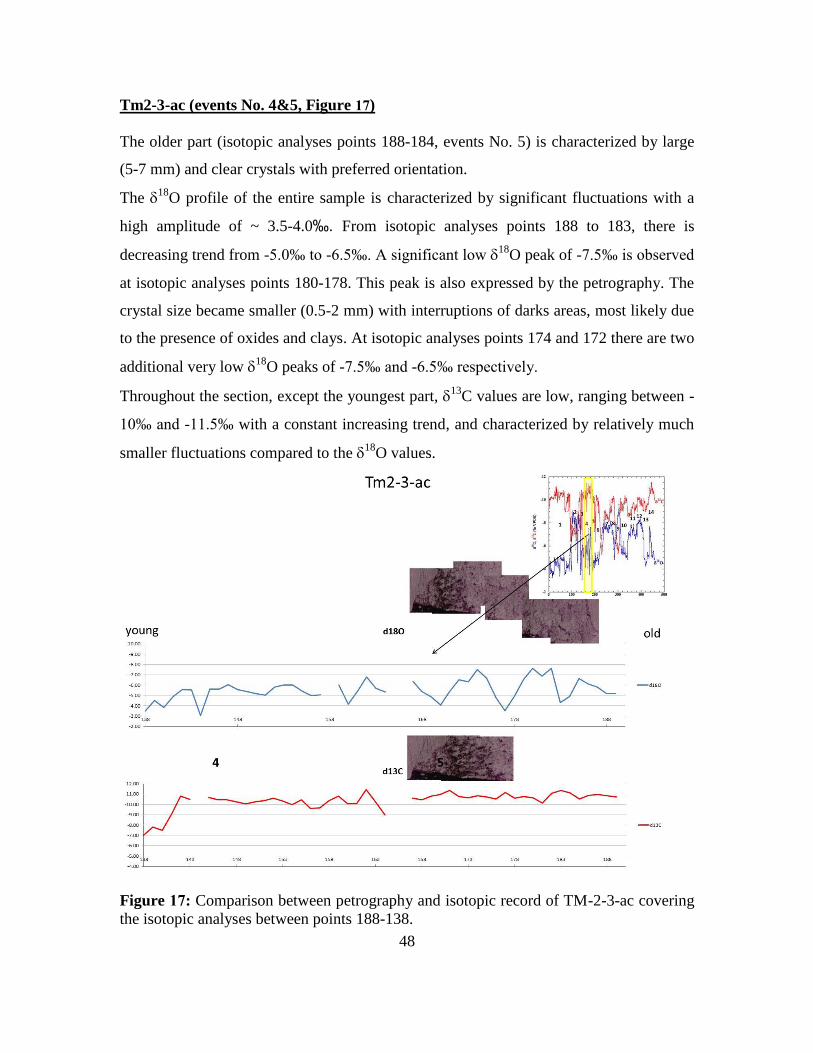
Tm2-3-ac (events No. 4&5, Figure 17)
The older part (isotopic analyses points 188-184, events No. 5) is characterized by large
(5-7 mm) and clear crystals with preferred orientation.
The 18
O profile of the entire sample is characterized by significant fluctuations with a
high amplitude of ~ 3.5-4.0‰. From isotopic analyses points 188 to 183, there is
decreasing trend from -5.0‰ to -6.5‰. A significant low 18
O peak of -7.5‰ is observed
at isotopic analyses points 180-178. This peak is also expressed by the petrography. The
crystal size became smaller (0.5-2 mm) with interruptions of darks areas, most likely due
to the presence of oxides and clays. At isotopic analyses points 174 and 172 there are two
additional very low 18
O peaks of -7.5‰ and -6.5‰ respectively.
Throughout the section, except the youngest part, 13
C values are low, ranging between -
10‰ and -11.5‰ with a constant increasing trend, and characterized by relatively much
smaller fluctuations compared to the 18
O values.
Figure 17: Comparison between petrography and isotopic record of TM-2-3-ac covering
the isotopic analyses between points 188-138.
49
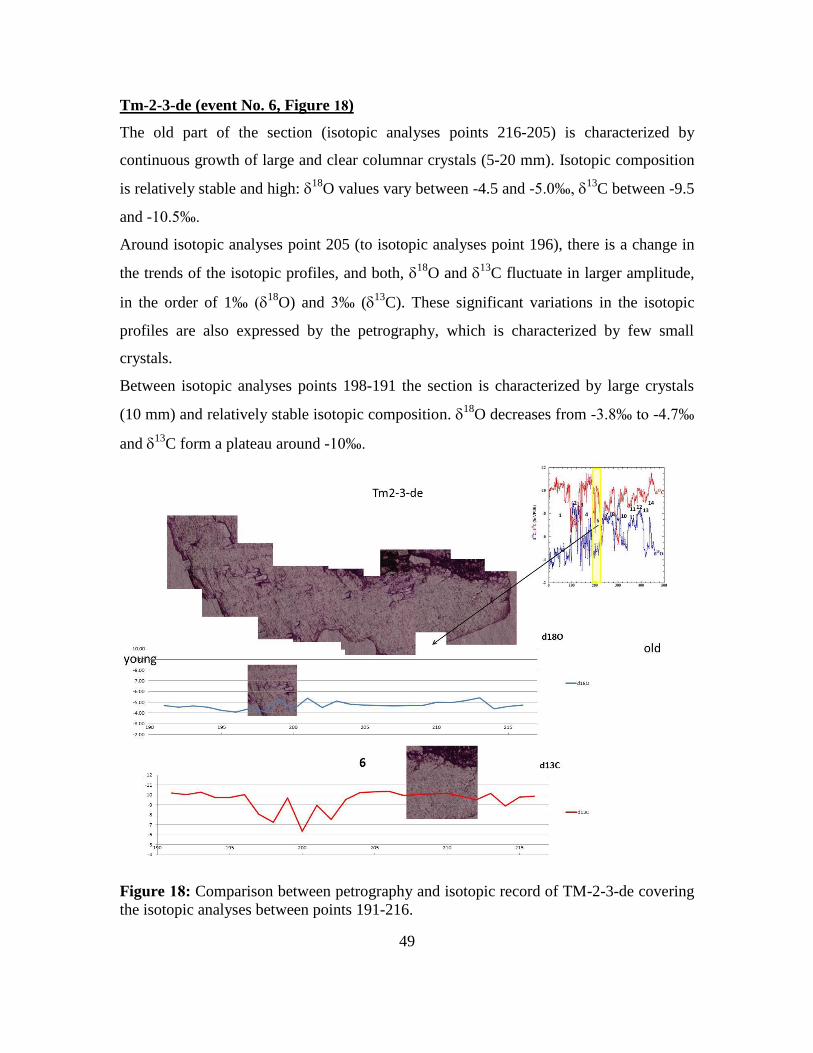
Tm-2-3-de (event No. 6, Figure 18)
The old part of the section (isotopic analyses points 216-205) is characterized by
continuous growth of large and clear columnar crystals (5-20 mm). Isotopic composition
is relatively stable and high: 18
O values vary between -4.5 and -5.0‰, 13
C between -9.5
and -10.5‰.
Around isotopic analyses point 205 (to isotopic analyses point 196), there is a change in
the trends of the isotopic profiles, and both, 18
O and 13
C fluctuate in larger amplitude,
in the order of 1‰ (18
O) and 3‰ (13
C). These significant variations in the isotopic
profiles are also expressed by the petrography, which is characterized by few small
crystals.
Between isotopic analyses points 198-191 the section is characterized by large crystals
(10 mm) and relatively stable isotopic composition. 18
O decreases from -3.8‰ to -4.7‰
and 13
C form a plateau around -10‰.
Figure 18: Comparison between petrography and isotopic record of TM-2-3-de covering
the isotopic analyses between points 191-216.
50
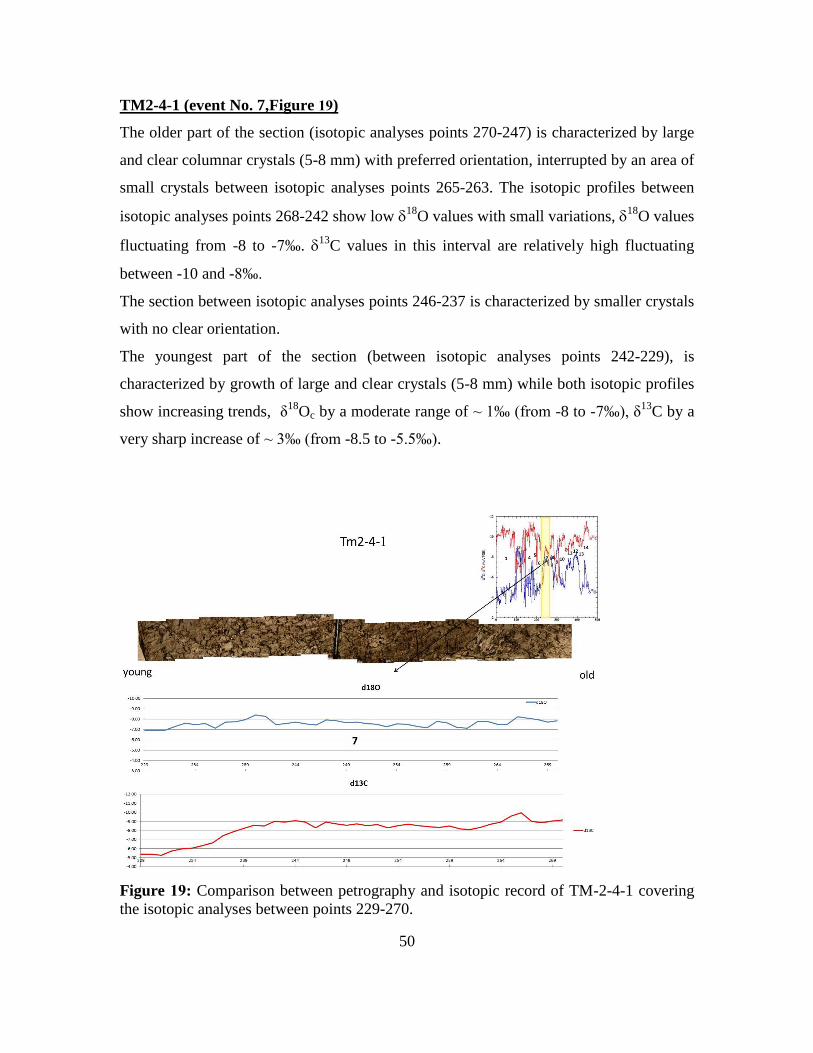
TM2-4-1 (event No. 7,Figure 19)
The older part of the section (isotopic analyses points 270-247) is characterized by large
and clear columnar crystals (5-8 mm) with preferred orientation, interrupted by an area of
small crystals between isotopic analyses points 265-263. The isotopic profiles between
isotopic analyses points 268-242 show low 18
O values with small variations, 18
O values
fluctuating from -8 to -7‰. 13
C values in this interval are relatively high fluctuating
between -10 and -8‰.
The section between isotopic analyses points 246-237 is characterized by smaller crystals
with no clear orientation.
The youngest part of the section (between isotopic analyses points 242-229), is
characterized by growth of large and clear crystals (5-8 mm) while both isotopic profiles
show increasing trends, δ18
Oc by a moderate range of ~ 1‰ (from -8 to -7‰), δ13
C by a
very sharp increase of ~ 3‰ (from -8.5 to -5.5‰).
Figure 19: Comparison between petrography and isotopic record of TM-2-4-1 covering
the isotopic analyses between points 229-270.
51
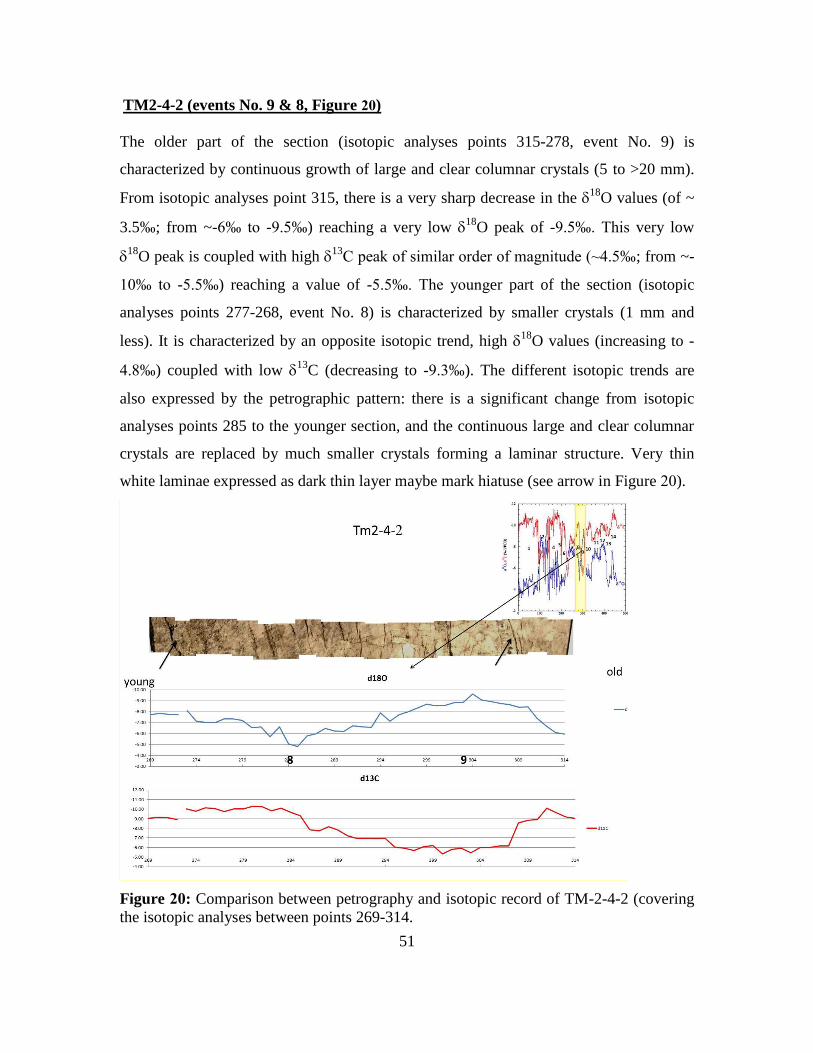
TM2-4-2 (events No. 9 & 8, Figure 20)
The older part of the section (isotopic analyses points 315-278, event No. 9) is
characterized by continuous growth of large and clear columnar crystals (5 to >20 mm).
From isotopic analyses point 315, there is a very sharp decrease in the 18
O values (of ~
3.5‰; from ~-6‰ to -9.5‰) reaching a very low 18
O peak of -9.5‰. This very low
18
O peak is coupled with high 13
C peak of similar order of magnitude (~4.5‰; from ~-
10‰ to -5.5‰) reaching a value of -5.5‰. The younger part of the section (isotopic
analyses points 277-268, event No. 8) is characterized by smaller crystals (1 mm and
less). It is characterized by an opposite isotopic trend, high 18
O values (increasing to -
4.8‰) coupled with low 13
C (decreasing to -9.3‰). The different isotopic trends are
also expressed by the petrographic pattern: there is a significant change from isotopic
analyses points 285 to the younger section, and the continuous large and clear columnar
crystals are replaced by much smaller crystals forming a laminar structure. Very thin
white laminae expressed as dark thin layer maybe mark hiatuse (see arrow in Figure 20).
Figure 20: Comparison between petrography and isotopic record of TM-2-4-2 (covering
the isotopic analyses between points 269-314.
52
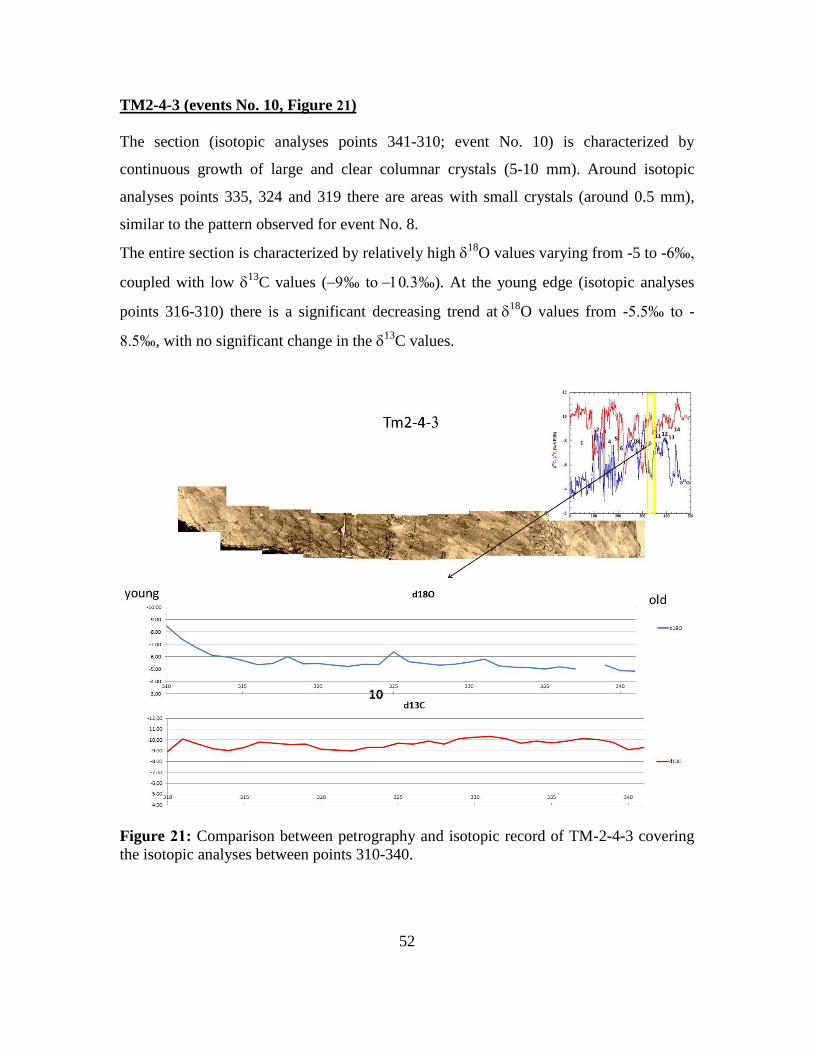
TM2-4-3 (events No. 10, Figure 21)
The section (isotopic analyses points 341-310; event No. 10) is characterized by
continuous growth of large and clear columnar crystals (5-10 mm). Around isotopic
analyses points 335, 324 and 319 there are areas with small crystals (around 0.5 mm),
similar to the pattern observed for event No. 8.
The entire section is characterized by relatively high 18
O values varying from -5 to -6‰,
coupled with low 13
C values (‰ to‰). At the young edge (isotopic analyses
points 316-310) there is a significant decreasing trend at18
O values from -5.5‰ to -
8.5‰, with no significant change in the 13
C values.
Figure 21: Comparison between petrography and isotopic record of TM-2-4-3 covering
the isotopic analyses between points 310-340.
53
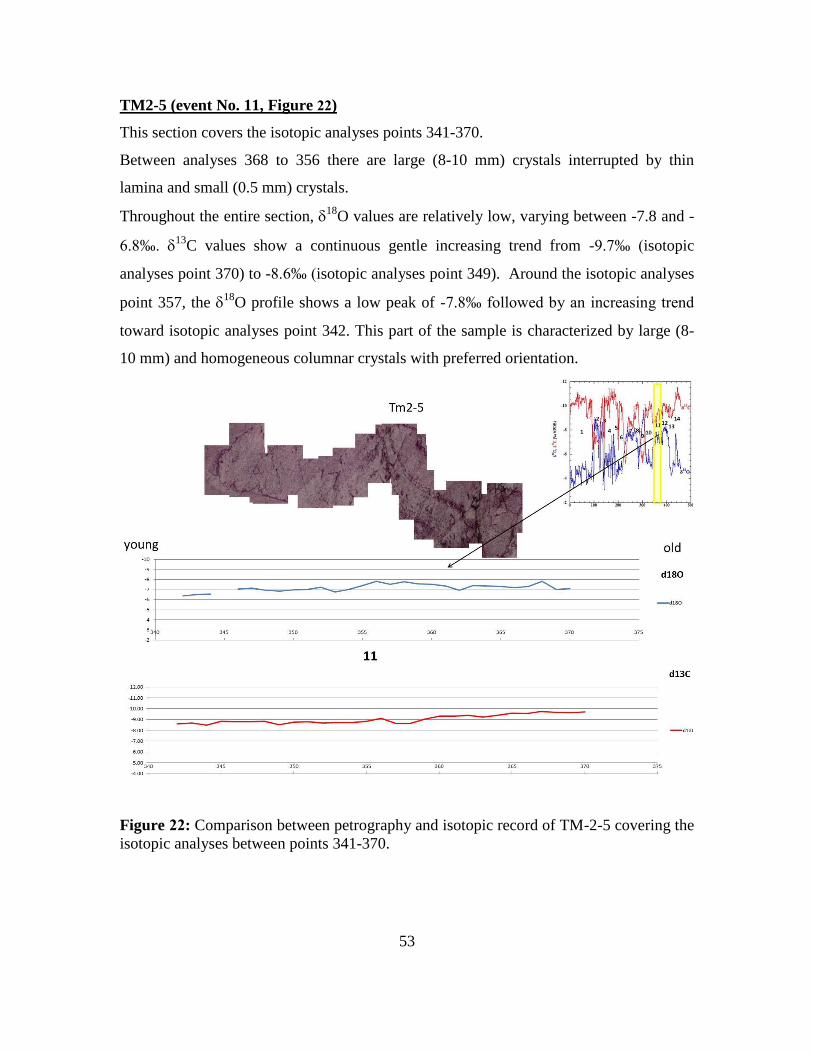
TM2-5 (event No. 11, Figure 22)
This section covers the isotopic analyses points 341-370.
Between analyses 368 to 356 there are large (8-10 mm) crystals interrupted by thin
lamina and small (0.5 mm) crystals.
Throughout the entire section, 18
O values are relatively low, varying between -7.8 and -
6.8‰. 13
C values show a continuous gentle increasing trend from -9.7‰ (isotopic
analyses point 370) to -8.6‰ (isotopic analyses point 349). Around the isotopic analyses
point 357, the 18
O profile shows a low peak of -7.8‰ followed by an increasing trend
toward isotopic analyses point 342. This part of the sample is characterized by large (8-
10 mm) and homogeneous columnar crystals with preferred orientation.
Figure 22: Comparison between petrography and isotopic record of TM-2-5 covering the
isotopic analyses between points 341-370.
54
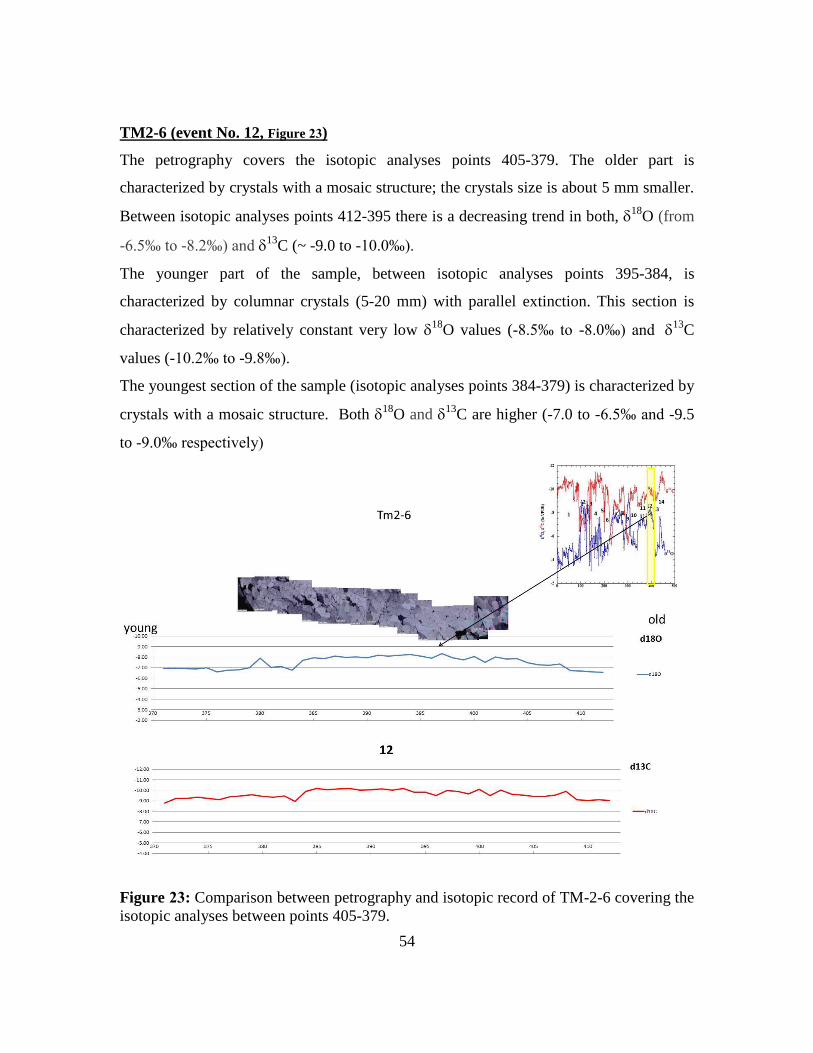
TM2-6 (event No. 12, Figure 23)
The petrography covers the isotopic analyses points 405-379. The older part is
characterized by crystals with a mosaic structure; the crystals size is about 5 mm smaller.
Between isotopic analyses points 412-395 there is a decreasing trend in both, 18
O (from
-6.5‰ to -8.2‰) and 13
C (~ -9.0 to -10.0‰).
The younger part of the sample, between isotopic analyses points 395-384, is
characterized by columnar crystals (5-20 mm) with parallel extinction. This section is
characterized by relatively constant very low 18
O values (-8.5‰ to -8.0‰) and 13
C
values (-10.2‰ to -9.8‰).
The youngest section of the sample (isotopic analyses points 384-379) is characterized by
crystals with a mosaic structure. Both 18
O and 13
C are higher (-7.0 to -6.5‰ and -9.5
to -9.0‰ respectively)
Figure 23: Comparison between petrography and isotopic record of TM-2-6 covering the
isotopic analyses between points 405-379.
55
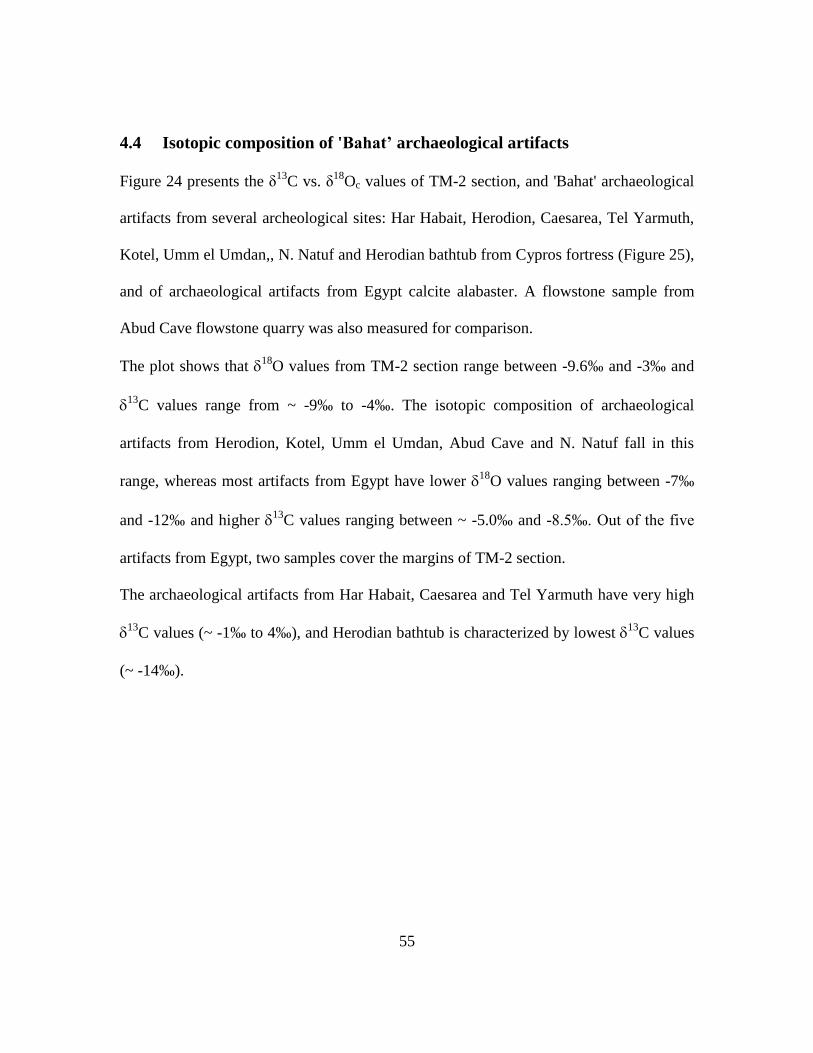
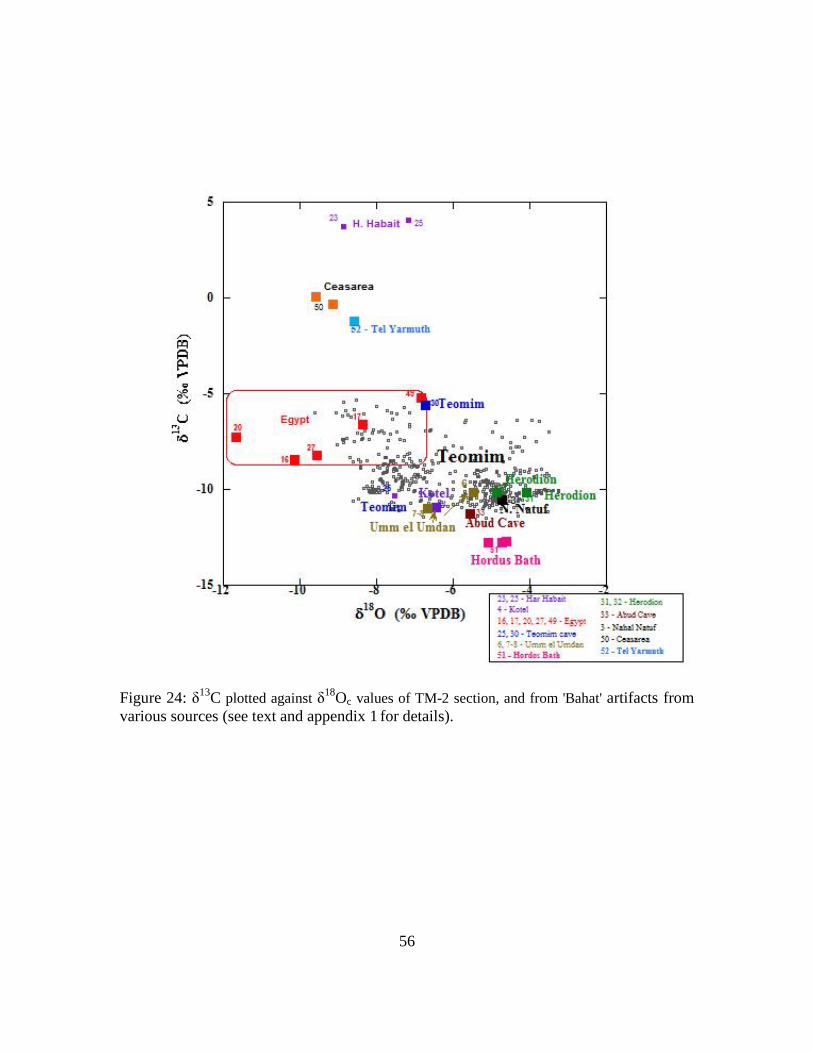
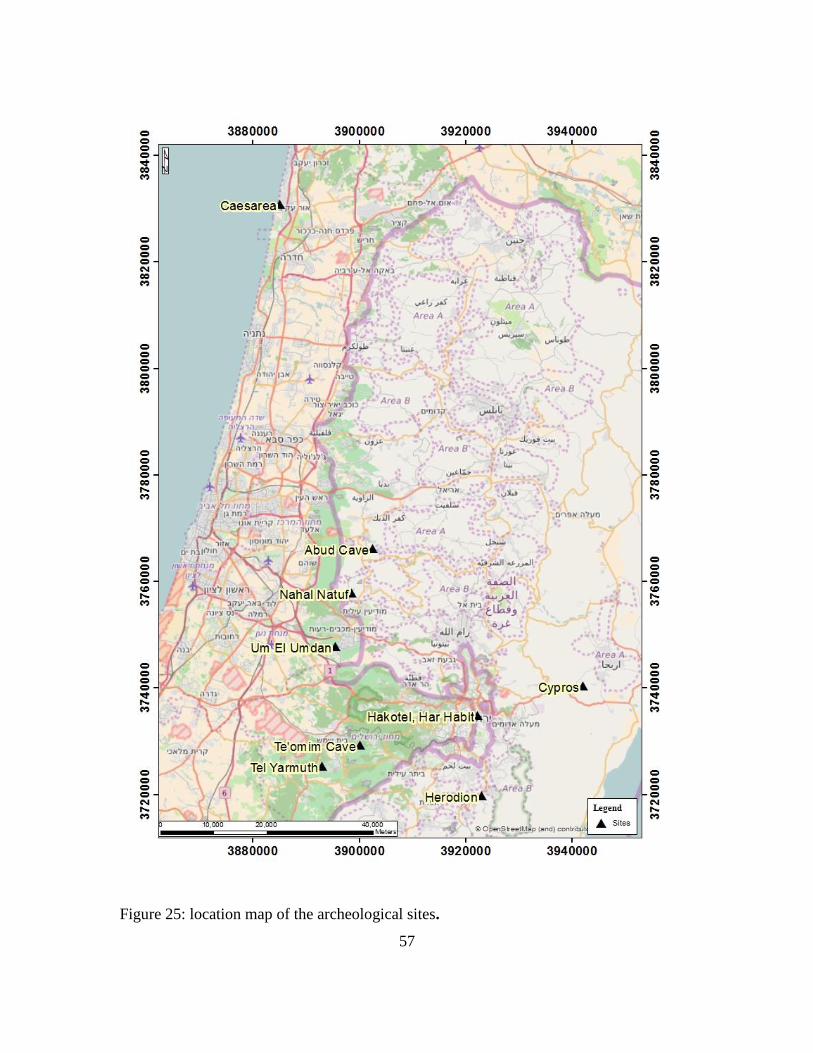
4.4 Isotopic composition of 'Bahat’ archaeological artifacts
Figure 24 presents the δ13
C vs. δ18
Oc values of TM-2 section, and 'Bahat' archaeological
artifacts from several archeological sites: Har Habait, Herodion, Caesarea, Tel Yarmuth,
Kotel, Umm el Umdan,, N. Natuf and Herodian bathtub from Cypros fortress (Figure 25),
and of archaeological artifacts from Egypt calcite alabaster. A flowstone sample from
Abud Cave flowstone quarry was also measured for comparison.
The plot shows that 18
O values from TM-2 section range between -9.6‰ and -3‰ and
13
C values range from ~ -9‰ to -4‰. The isotopic composition of archaeological
artifacts from Herodion, Kotel, Umm el Umdan, Abud Cave and N. Natuf fall in this
range, whereas most artifacts from Egypt have lower 18
O values ranging between -7‰
and -12‰ and higher 13
C values ranging between ~ -5.0‰ and -8.5‰. Out of the five
artifacts from Egypt, two samples cover the margins of TM-2 section.
The archaeological artifacts from Har Habait, Caesarea and Tel Yarmuth have very high
13
C values (~ -1‰ to 4‰), and Herodian bathtub is characterized by lowest 13
C values
(~ -14‰).
56
Figure 24: δ13
C plotted against δ18
Oc values of TM-2 section, and from 'Bahat' artifacts from
various sources (see text and appendix 1 for details).
57
Figure 25: location map of the archeological sites.
58
5 Discussion
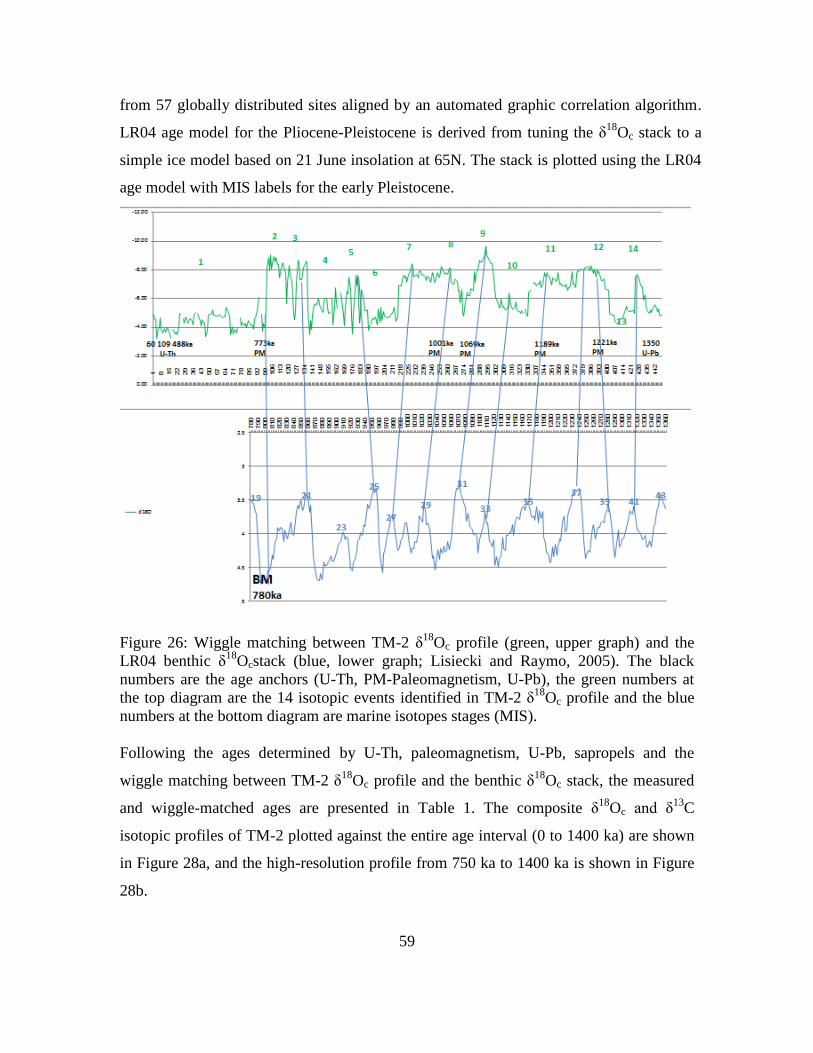
5.1 Dating
The dating of the section TM-2 was carried out using three different methods as
described above in the methods (3.2) and the results (4.1) chapters. The methods include
U/Th dating of the younger (upper) part, magneto-stratigraphy and U/Pb of the older part.
Top 10 cm of the flowstone grew between 773-53 ka and the mean growth rate is ~ 0.015
cm/ka.
The U/Pb dating (the 2 lower ages marked in blue in Figure 27) gave two similar ages of
1310 ±60 ka and 1350 ±120 ka, with ~40 cm of flowstone in between these dating points,
suggesting very fast mean growth rates of 5.5-10 cm/ka.
The magneto-stratigraphic chronology gave five reversal ages from top to bottom: 773ka,
1001ka, 1069ka, 1189ka and 1221ka (marked in black in Figure 27).
The assumptions made for wiggle matching are as follows:
Using all the measured ages, TM-2 grew between 1350-60ka. The youngest part, the top
10 cm, grew very slow between 773-60ka, and provide a low resolution profile. The older
70 cm of the section, grew between ~1350ka and 773ka. The average growth rate is about
8cm/ka. At this time interval, 13 significant climate events were identified as described
above. Out of the 13 events, 4 events (2, 6, 9 and 11) are characterized by low δ18
Oc and
high δ13
C peaks, that usually identify sapropel events (Bar-Matthews et al., 2000; 2003;
Frumkin et al., 1999). Event 2 at ~ 770 ka can match sapropel 17, event 6 at ~ 950 ka can
match sapropel 18, event 9 at ~1100 ka can match sapropel 26, and event 11 at ~ 1170 ka
can match sapropel 28. Using these dated “anchors”, allows us to locate the older 70 cm of
TM-2 section in the time interval of 1350-773 ka. Based on the determined time range, we
can wiggle-match the significant isotopic events of TM-2 δ18
Oc profile with a global
isotopic profile in this time interval.
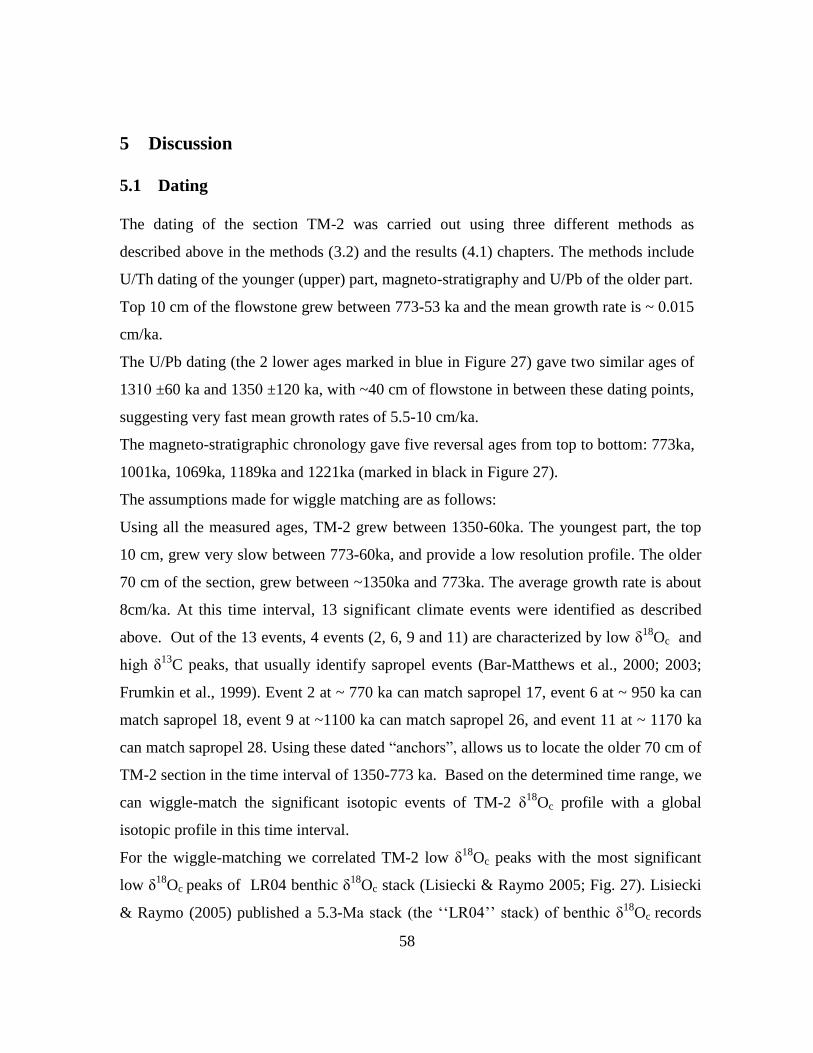
For the wiggle-matching we correlated TM-2 low δ18
Oc peaks with the most significant
low δ18
Oc peaks of LR04 benthic δ18
Oc stack (Lisiecki & Raymo 2005; Fig. 27). Lisiecki
& Raymo (2005) published a 5.3-Ma stack (the ‘‘LR04’’ stack) of benthic δ18
Oc records
59
from 57 globally distributed sites aligned by an automated graphic correlation algorithm.
LR04 age model for the Pliocene-Pleistocene is derived from tuning the δ18
Oc stack to a
simple ice model based on 21 June insolation at 65N. The stack is plotted using the LR04
age model with MIS labels for the early Pleistocene.
Figure 26: Wiggle matching between TM-2 δ18
Oc profile (green, upper graph) and the
LR04 benthic δ18
Ocstack (blue, lower graph; Lisiecki and Raymo, 2005). The black
numbers are the age anchors (U-Th, PM-Paleomagnetism, U-Pb), the green numbers at
the top diagram are the 14 isotopic events identified in TM-2 δ18
Oc profile and the blue
numbers at the bottom diagram are marine isotopes stages (MIS).
Following the ages determined by U-Th, paleomagnetism, U-Pb, sapropels and the
wiggle matching between TM-2 δ18
Oc profile and the benthic δ18
Oc stack, the measured
and wiggle-matched ages are presented in Table 1. The composite δ18
Oc and δ13
C
isotopic profiles of TM-2 plotted against the entire age interval (0 to 1400 ka) are shown
in Figure 28a, and the high-resolution profile from 750 ka to 1400 ka is shown in Figure
28b.
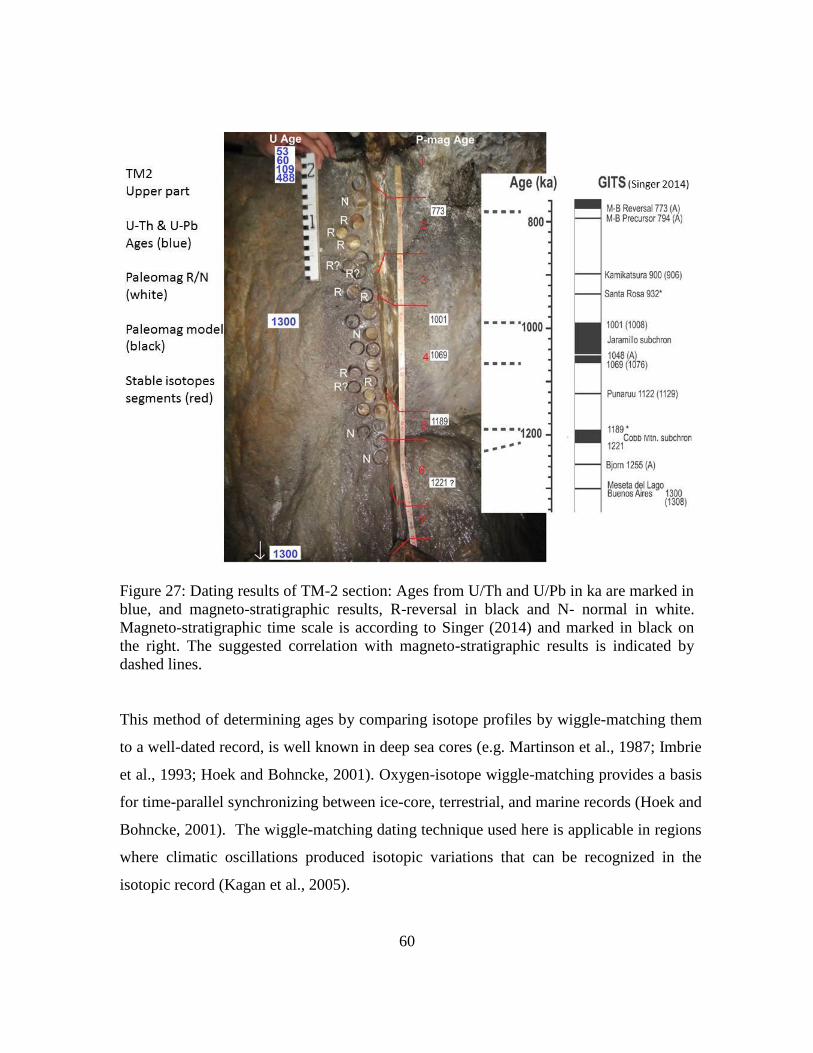
60
Figure 27: Dating results of TM-2 section: Ages from U/Th and U/Pb in ka are marked in
blue, and magneto-stratigraphic results, R-reversal in black and N- normal in white.
Magneto-stratigraphic time scale is according to Singer (2014) and marked in black on
the right. The suggested correlation with magneto-stratigraphic results is indicated by
dashed lines.
This method of determining ages by comparing isotope profiles by wiggle-matching them
to a well-dated record, is well known in deep sea cores (e.g. Martinson et al., 1987; Imbrie
et al., 1993; Hoek and Bohncke, 2001). Oxygen-isotope wiggle-matching provides a basis
for time-parallel synchronizing between ice-core, terrestrial, and marine records (Hoek and
Bohncke, 2001). The wiggle-matching dating technique used here is applicable in regions
where climatic oscillations produced isotopic variations that can be recognized in the
isotopic record (Kagan et al., 2005).
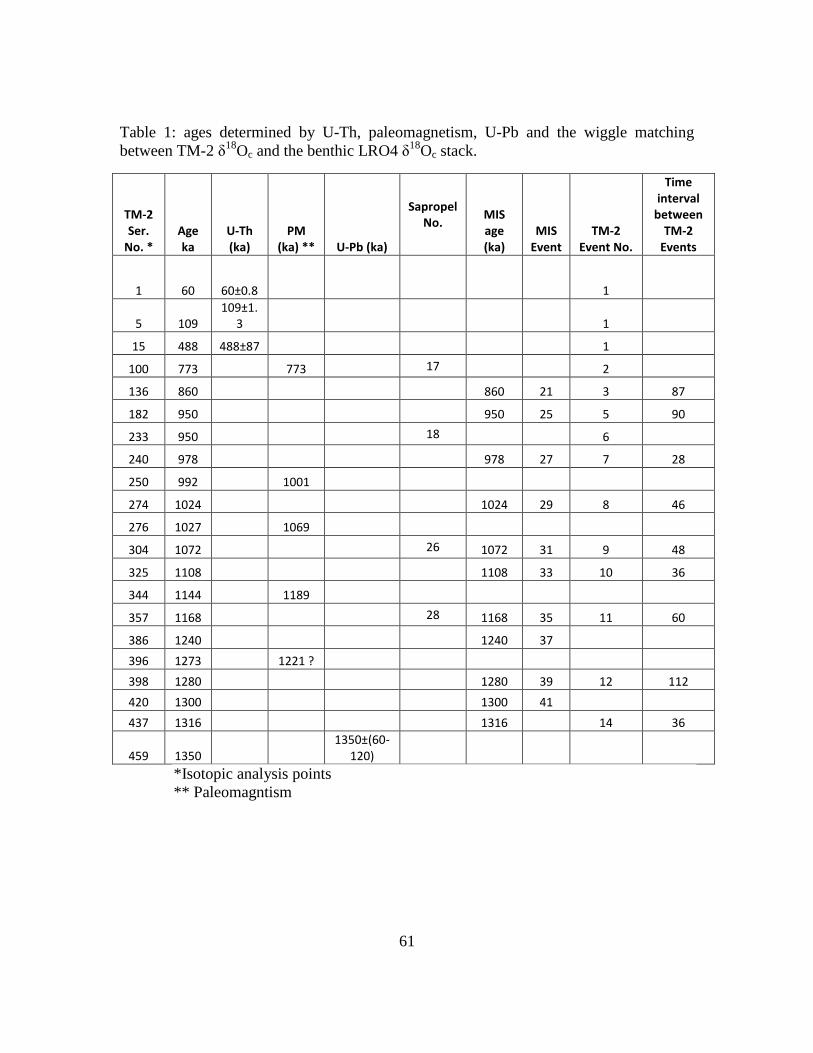
61
Table 1: ages determined by U-Th, paleomagnetism, U-Pb and the wiggle matching
between TM-2 δ18
Oc and the benthic LRO4 δ18
Oc stack.
TM-2 Ser.
No. * Age ka
U-Th (ka)
PM (ka) ** U-Pb (ka)
Sapropel No.
MIS age (ka)
MIS Event
TM-2 Event No.
Time interval
between TM-2
Events
1 60 60±0.8
1
5 109 109±1.
3
1
15 488 488±87 1
100 773 773 17 2
136 860 860 21 3 87
182 950 950 25 5 90
233 950 18 6
240 978 978 27 7 28
250 992 1001
274 1024 1024 29 8 46
276 1027 1069
304 1072 26 1072 31 9 48
325 1108 1108 33 10 36
344 1144 1189
357 1168 28 1168 35 11 60
386 1240 1240 37
396 1273 1221 ?
398 1280 1280 39 12 112
420 1300 1300 41
437 1316 1316 14 36
459 1350 1350±(60-
120)
*Isotopic analysis points
** Paleomagntism
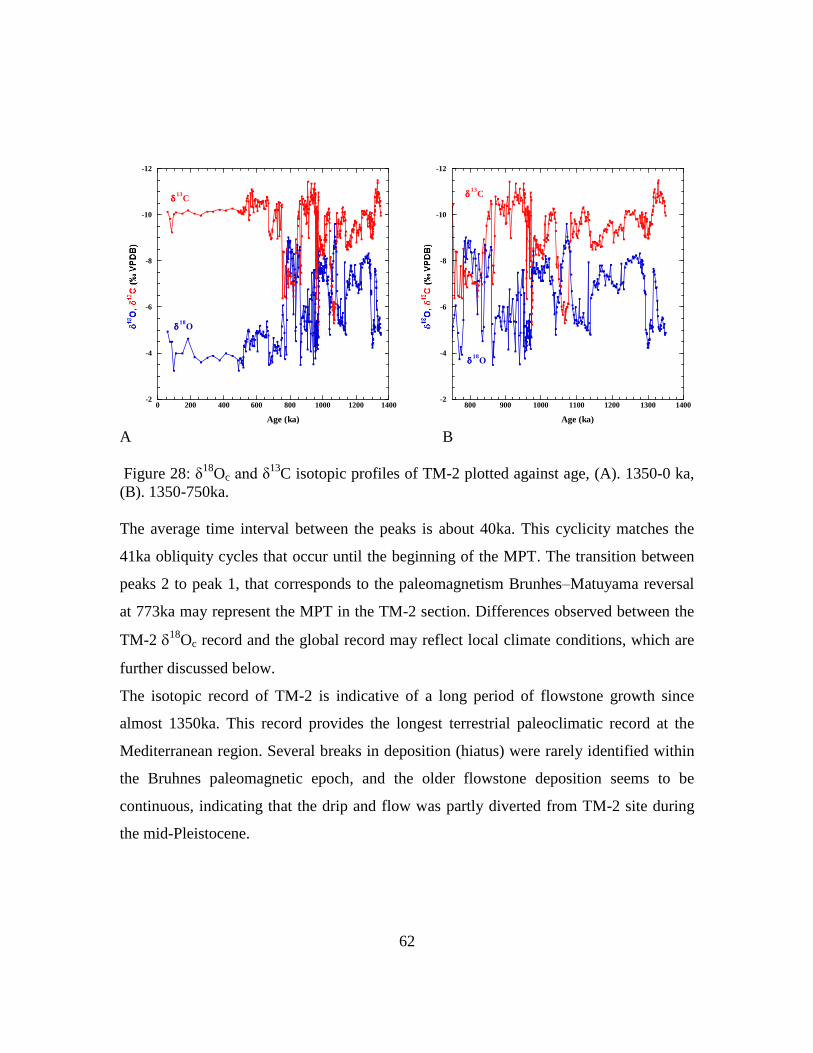
62
-12
-10
-8
-6
-4
-20 200 400 600 800 1000 1200 1400
Age (ka)
13
C
18
O
-12
-10
-8
-6
-4
-2800 900 1000 1100 1200 1300 1400
Age (ka)
13
C
18
O
A B
Figure 28: δ18
Oc and δ13
C isotopic profiles of TM-2 plotted against age, (A). 1350-0 ka,
(B). 1350-750ka.
The average time interval between the peaks is about 40ka. This cyclicity matches the
41ka obliquity cycles that occur until the beginning of the MPT. The transition between
peaks 2 to peak 1, that corresponds to the paleomagnetism Brunhes–Matuyama reversal
at 773ka may represent the MPT in the TM-2 section. Differences observed between the
TM-2 18
Oc record and the global record may reflect local climate conditions, which are
further discussed below.
The isotopic record of TM-2 is indicative of a long period of flowstone growth since
almost 1350ka. This record provides the longest terrestrial paleoclimatic record at the
Mediterranean region. Several breaks in deposition (hiatus) were rarely identified within
the Bruhnes paleomagnetic epoch, and the older flowstone deposition seems to be
continuous, indicating that the drip and flow was partly diverted from TM-2 site during
the mid-Pleistocene.
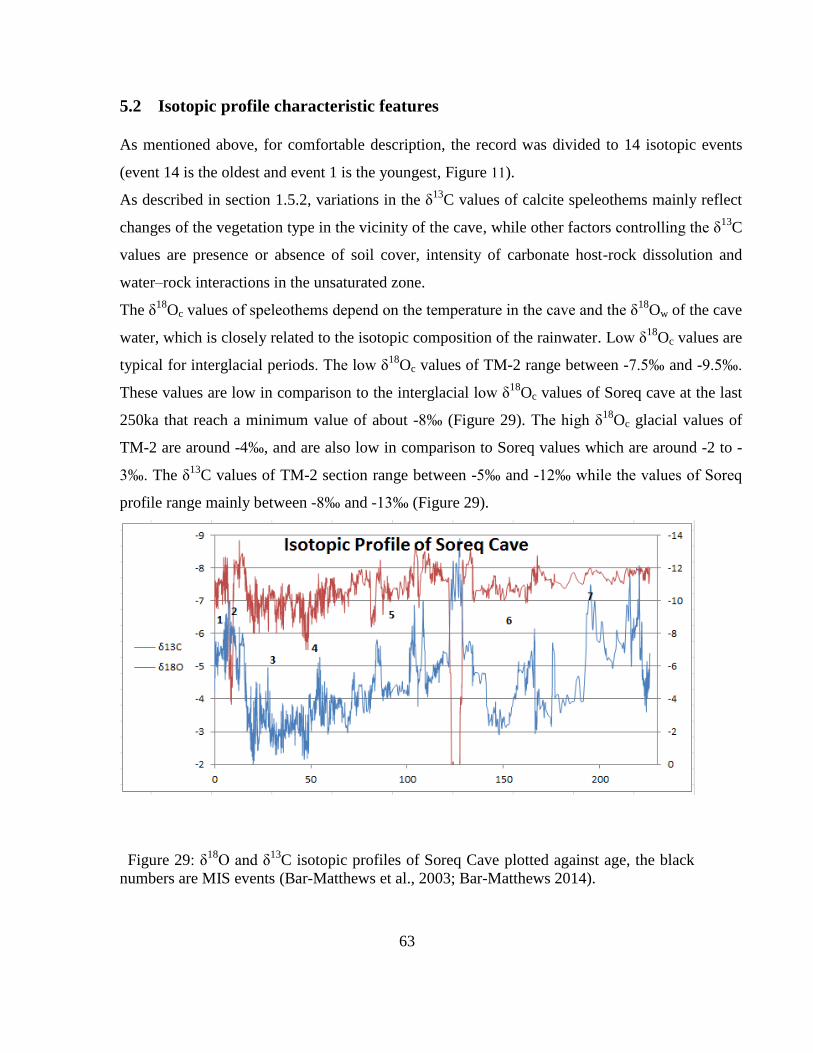
63
5.2 Isotopic profile characteristic features
As mentioned above, for comfortable description, the record was divided to 14 isotopic events
(event 14 is the oldest and event 1 is the youngest, Figure 11).
As described in section 1.5.2, variations in the δ13
C values of calcite speleothems mainly reflect
changes of the vegetation type in the vicinity of the cave, while other factors controlling the δ13
C
values are presence or absence of soil cover, intensity of carbonate host-rock dissolution and
water–rock interactions in the unsaturated zone.
The δ18
Oc values of speleothems depend on the temperature in the cave and the δ18
Ow of the cave
water, which is closely related to the isotopic composition of the rainwater. Low δ18
Oc values are
typical for interglacial periods. The low δ18
Oc values of TM-2 range between -7.5‰ and -9.5‰.
These values are low in comparison to the interglacial low δ18
Oc values of Soreq cave at the last
250ka that reach a minimum value of about -8‰ (Figure 29). The high δ18
Oc glacial values of
TM-2 are around -4‰, and are also low in comparison to Soreq values which are around -2 to -
3‰. The δ13
C values of TM-2 section range between -5‰ and -12‰ while the values of Soreq
profile range mainly between -8‰ and -13‰ (Figure 29).
Figure 29: δ18
O and δ13
C isotopic profiles of Soreq Cave plotted against age, the black
numbers are MIS events (Bar-Matthews et al., 2003; Bar-Matthews 2014).
64
The differences between the δ18
Oc and δ13
C values of TM-2 section at the mid
Pleistocene and the values of Soreq cave at the last 230ka may indicate different climatic
systems. This difference is also reflected at 40ka cyclicity observed in the TM-2 section
that matches the 41ka obliquity cycles that occur until the beginning of the MPT,
compared with the 100ka cyclicity at the late Pleistocene.
There are four events observed at the TM-2 isotopic profile which are characterized by
low δ18
Oc values associated with high δ13
C values (events 11, 9, 6 and 2; Figure 11).
High δ13
C values usually indicate dry conditions and relatively low biogenic activity and
low vegetation root zone respiration rates (e.g., Quade et al., 1989a), and high ratio of C4
to the C3 biomass. Low δ18
Oc values usually do not match the high δ13
C values. The
coupling between low value of the δ18
Oc and high δ13
C values of can be also interpreted
as reflecting deluge events, where δ13
C values do not reflect the soil-CO2 composition,
due to high rate of water flushing to the cave, resulting in isotopic composition
approaching the surrounding dolomite host rock (e.g., Bar-Matthews et al., 2000).
Alternatively, high δ13
C values can be the outcome of unstable, dry and warm conditions,
loss of vegetation, and erosion of the soil cover. This hydrologic regime is consistent with
irregular high water flushing events: flash-floods are potentially more common under
scarce vegetation cover. Such fluctuating dry-hot intervals could have enhanced forest
fires, followed by rapid soil erosion; eventually leading to abrupt changes and high δ13
C
values (Frumkin et al., 2000). These periods occur at 1168 ka, 1072 ka, 960 ka and 830
ka (peaks 11, 9, 6 and 2 respectively). Peaks 11 and 9 are correlated with sapropel events
35 and 31 respectively.
5.3 The relations between the petrography and the isotopic profile
As described above, combining the δ13
C and δ18
O trends, four categories have been
observed. In some cases, these isotopic trends are associated with significant petrographic
structures. In general, most of the flowstone section is characterized by large columnar
crystals, leading for the typical 'Bahat' structure. Though in some cases similar
petrographic features are found for different isotopic peaks from the same category, it is
not always so, and isotopic peaks from the same category may be associated with
different petrographic features.
65
(I) High δ13
C and high δ18
O (peaks 13, 5, 3)
Event 5 and 3 (Figure 18 and Figure 16 respectively) are characterized by small
crystals interrupting large and massive calcite crystals structure. The combination of
the isotopic composition of high δ13
C and high δ18
O, and the petrography, small
crystals indicate slow and inconsistent growth, most likely reflecting relatively dry
conditions
(II) Low δ13
C and low δ18
O (events 14, 12, 7, 4)
Peaks 12 and 7 are characterized by large crystals, reaching up to 10-20 mm, in some
places forming a mosaic structure (Figure 23 and Figure 19 respectively). The
combination of the isotopic composition of low δ13
C and low δ18
O, and the
petrography, large, mostly not oriented crystals indicate continuous growth, most
likely reflecting relatively wet conditions. Such wet conditions are not always
reflected in the petrographic structure.
(III) High δ13
C and low δ18
O (peaks 11, 9, 6, 2)
Peaks 11 and 2 show similar petrography. Peak 11 is characterized by large (8-10
mm) and transparent homogenous columnar crystals with preferred orientation
(Figure 22), and peak 2 is typified by long transparent crystals (~10 mm; Figure 16).
Peaks 9 and 6 are also characterized by large and clear columnar crystals (5-8 mm)
with preferred orientation, but interrupted by an area of small crystals (Figure 20 and
Figure 18 respectively).
The combination of high δ13
C values coupled by low δ18
O values may indicate
periods of relatively dry (high δ13
C) and warm (low δ18
O) conditions. However, as
clearly seen in peaks 9 which is characterized by very sharp decrease in δ18
O values
(from ~ -5 to -9‰) coupled with very sharp increase in δ13
C values (from ~ -10 to -
5.5‰), these climatic conditions may reflect a sapropel event which is characterized
by high hydrologic activity, resulting in very low δ18
O values. As explained by Bar-
Matthews et al (2003), the high δ13
C values during the sapropel event may be due to
deluge conditions, resulting in minimum reaction between the water and the soil CO2.
Alternatively, Frumkin et al. (2000) suggest that the high δ13
C during sapropel events
66
could be the outcome of unstable, dry and warm conditions, loss of vegetation, and
erosion of the soil cover.
(IV) Low δ13
C and high δ18
O (peaks 10, 8, 1)
Peak 10 is characterized by medium-large and clear columnar crystals (5-10 mm)
with preferred orientation, interrupted in places by an area of small crystals (Figure
21). Peak 8 is characterized by smaller crystals without preferred orientation. On the
other hand, peak 1 is characterized by various petrographic features, including large
tabular crystals, laminated medium-size crystals, and large crystals with mosaic
structure.
The combination of low δ13
C and high δ18
O values may reflect wet (low δ13
C values)
and cold (high δ18
O values) climatic conditions. The large and clear calcite crystals
most likely reflect continuous and constant growth.
5.4 Isotopic composition of 'Bahat’ archaeological artifacts
Figure 24 presents the δ13
C plotted against δ18
O values of TM-2 section, and of 'Bahat'
archaeological artifacts from several archeological sites. The plot shows that 18
O values
from TM-2 section range between -9.6‰ and -3‰ and 13
C values range from ~ -11.5‰
to -4‰. Archaeological artifacts from Har Habait are characterized by very high 13
C
values (+4.1‰ and +3.7‰), relatively to the values of the Te'omim cave, coupled with
low 18
O values of -8.9‰ and -7.2‰. These artifacts are not made of 'Bahat' but
probably from marble. Archaeological artifacts from Caesarea and Tel Yarmuth are also
characterized by relatively high 13
C values (~0‰ and -1.2‰ respectively) coupled with
low 18
O values (~-9.3‰ and -8.6‰ respectively). These artifacts are also probably most
likely not made of the 'Bahat' quarried at the Te'omim cave quarry.
Most measured archaeological artifacts from Egypt (samples 20, 16 and 27, see Figure
24) are characterized by significantly lower 18
O values (ranging between -6.8‰ and -
11.7‰) than Te'omim cave values, whereas 13
C (range between -5.2‰ and -8.5‰), is
similar to the higher 13
C values measured for Te'omim Cave. Samples 17 and 49 have
values that match the margins of the Te'omim Cave values, but to find the provenance of
67
these artifacts requires using other methods (e.g., trace elements, Sr isotopic
composition).
18
O value of the sample taken from Herodian buthtub is in the middle of the range of
Te'omim Cave samples (~ -5‰), while the 13
C is ~-13‰, below the range of the values
from the Te'omim cave, lower also than all other 'Bahat' samples measured in this study.
Therefore, probably the Herodian bathtub was not made of the 'Bahat' quarried at the
Te'omim cave quarry.
The isotopic composition of archaeological artifacts from Herodion, Kotel, Umm el
Umdan and N. Natuf fall in the range of the Te'omim cave. It is possible that these
artifacts were created from the 'Bahat' quarried at the Te'omim cave quarry. The isotopic
composition of speleothems from Abud Cave is characterized by similar 18
O values, and
lower 13
C values compared with Te'omim cave quarry.
In order to confirm this hypothesis other methods are required in another study.
6 Summary and conclusions
1. TM-2 section was dated from ~1.3 Ma to ~50 ka . U/Th dating of the younger (upper)
part, yielded ages between 488ka-53ka, whereas the rest of the section was beyond the
limit of U-Th dating method (~500 ka) and was dated by Magneto-stratigraphy and U/Pb.
The U/Pb dating gave two ages of 1310 ±60 ka and 1350 ±120 ka, and the magneto
stratigraphy of this section gives five ages: 773ka, 1001ka, 1069ka, 1189ka and 1221ka.
Based on these range of dates, the TM-2 18
O profile was then dated by “wiggle-
matching“ its oxygen isotopic record to the globally distributed benthic 18
O records
(Figure 26). Fourteen isotopic events recorded in TM-2 isotopic profile, match MIS
events ranging between 1316 ka and 773 ka. The average time period between the 18
O
peaks is about 40ka, matching the 41ka obliquity cycles that occurs until the beginning of
the MPT.
The isotopic record of TM-2 reflects a long period of flowstone deposition since almost
1350ka. This record is the longest terrestrial paleoclimatic record at the Mediterranean
region.
68
2. The lower δ18
O values during glacials and interglacial of TM-2 section at the mid
Pleistocene transition compared with Soreq cave at the last 230ka indicate a temporal
transition of climatic system during the MPT. This difference is also reflected at 40ka
cyclicity observed in the TM-2 section that matches the 41ka obliquity cycles that
occurred until the beginning of the MPT, compared with the 100ka cyclicity at the late
Pleistocene.
Events characterized by low δ18
O associated with high δ13
C values were correlated with
sapropel events as was described for Soreq and Jerusalem caves, and may reflect deluge
or extremely unstable dry events. During the MPT there is a continuous growth during
glacials and interglacials.
3. In general, most of the flowstone section is characterized by large columnar crystals,
producing the typical 'Bahat' structure. In some cases, the isotopic trends are associated
with significant petrographic textures. (I) High δ13
C and high δ18
O are often characterized
by relatively small crystals, though their structure is not uniform. The combination of the
isotopic composition of high δ13
C and high δ18
O, and the small crystals indicating slow
and inconsistent growth, most likely reflecting relatively dry conditions; (II) Low δ13
C
and low δ18
O are mostly associated with large, usually not oriented crystals, indicating
constant and fast growth, most likely reflecting relatively wet conditions. These wet
conditions are not always reflected in the petrographic structure; (III) High δ13
C and low
δ18
O peaks are usually associated with homogenous columnar and transparent crystals
with preferred orientation. The large and clear calcite crystals reflect constant and more
or less homogenous growth due to constant dripping in the cave. (IV) Low δ13
C and high
δ18
O values are often characterized by medium-large and clear columnar crystals with
preferred orientation, interrupted in places by an area of small crystals. The combination
of the isotopic characteristics and the petrography of the calcite crystals may reflect wet
and cold climatic conditions, resulting in continuous and constant growth.
4. The isotopic composition of 'Bahat' archaeological artifacts samples from several
archeological sites in Israel and Egypt show that most of the 'Bahat' artifacts do not match
the δ13
C - δ18
O combination of artifacts imported from Egypt. 'Bahat' artifacts from Umm

69
el Umdan, Herodion, and Kotel match the isotopic composition of Te'omim Cave and
could have been derived from Te'omim quarry. 'Bahat' artifacts from Ceasarea, Tel
Yarmuth and Har Habait deviate significantly from both, Egypt and Te'omim isotopic
trends. Herodian bathub matches the δ18
O range of Te'omim Cave, with somewhat lower
δ13
C values. Additional methods (e.g., trace elements, Sr isotopic composition) are
required to find the provenance of 'Bahat' artifacts.
70
7 References
Almogi-Labin, A., Bar-Matthews, M., & Ayalon, A., 2004. Climate variability in the
Levant and northeast Africa during the Late Quaternary based on marine and land
records. Human paleoecology in the Levantine corridor, 117-134.
Almogi-Labin, A., Bar-Matthews, M., Shriki, D., Kolosovsky, E., Paterne, M., Schilman,
B., & Matthews, A., 2009. Climatic variability during the last∼ 90ka of the southern
and northern Levantine Basin as evident from marine records and speleothems.
Quaternary Science Reviews, 28(25), 2882-2896.
Amir, A., 2016.A Re-Examination of the sources of 'Alabaster' vessels found in
archeological exvacations in the land of Israel, following the discovery of an Ancient
quarry of Speleothems (calcite alabaster) in Jerusalem hills. Master degree in the
Martin (Szusz) department of the land of Israel studies and archeology, Bar Ilan
university, Ramat Gan, Israel (Hebrew).
Amiran, R., 1970. The Egyptian alabaster vessels from Ai. Isr. Explor. J. 20 (2),pp. 170-
179.
Ayalon, A., Bar-Matthews, M. & Sass, E., 1998. Rainfall-recharge relationships within a
karstic terrain in the eastern Mediterranean semi-arid region, Israel: d18O and dD
characteristics. Journal of Hydrology, v 207, pp. 18-31.
Ayalon, A., Bar-Matthews, M., Kaufman, A. 1999. Petrography, strontium, barium and
uranium concentrations, and strontium and uranium isotope ratios in speleothems as
palaeoclimatic proxies: Soreq Cave, Israel. The Holocene 9,pp. 715–722.
Bar-Matthews, M., 2014. History of Water in the Middle East and North Africa. Treatise
on Geochemistry, Second Edition, vol. 14.9, pp. 109-124. Oxford: Elsevier.
Bar-Matthews, M., Ayalon, A., Matthews, A., Sass, E., & Halicz, L.,1996. Carbon and
oxygen isotope study of the active water-carbonate system in a karstic Mediterranean
cave: Implications for paleoclimate research in semiarid regions. Geochimica et
Cosmochimica Acta, 60(2), 337-347. Bar-Matthews, M., Ayalon, A., & Kaufman, A.
(2000). Timing and hydrological conditions of Sapropel events in the Eastern
71
Mediterranean, as evident from speleothems, Soreq cave, Israel. Chemical Geology,
169(1), 145-156.
Bar-Matthews, M., Ayalon, A. and Kaufman, A. 1997. Late Quaternary paleoclimate in
the eastern Mediterranean region from stable isotope analysis of speleothems at Soreq
Cave, Israel. Quaternary Research, 47, 155-168.
Bar-Matthews, M., Ayalon, A. & Kaufman, A., 2000. Timing and hydrological
conditions of Sapropel events in the Eastern Mediterranean, as evident from
speleothems, Soreq cave, Israel. Chemical Geology, v. 169, pp. 145-156.
Bar-Matthews, M. et al., 2003. Sea-land oxygen isotopic relationships from planktonic
foraminifera and speleothems in the Eastern Mediterranean region and their
implication for paleorainfall during interglacial intervals. geochimica et
cosmochimica, v. 67, pp. 3181-3199.
Ben-Dor, I., 1945. Palestinian alabaster vases. In: Quarterly of the Department of
Antiquities of Palestine, 11, pp. 93-112.
Berger, A., & Loutre, M. F., 1991. Insolation values for the climate of the last 10 million
years. Quaternary Science Reviews, 10(4), 297-317.
Boistelle, R., 1982. Mineral crystallization from solutions: Estudios Geolo´gicos, v. 38,
pp. 135–153.
Bourdon, B., Henderson, G. M., Lundstorm, C. C. & Turner, S. P., 2003. Uranium-series
geochemistry. Washington, DC: The Mineralogical Society of America. ]
Burton, W.K., Cabrera, N., and Frank, F.C., 1951. The growth of crystals and the
equilibrium structure of their surfaces: Royal Society [London], Philosophical
Transactions, v. A243, pp.299–358.
Caubet, A., 1991. Répertoire de la vaiselle de pierre: Ougarit 1929-1988. In: Yon,
M.(Ed.), Ras Shamra-Ougarit VI: Arts et Industries de la Pierre. Editions Recherches
sur les Civilisations, Paris, pp. 205-264.
Clamer, C., 1976. Late Bronze Age alabaster vessels found. In: Palestinian Contexts with
an Emphasis on Calcite and Gypsum Tazze. The Hebrew University of Jerusalem,
Israel (M.A. thesis).
72
Clamer, C., 2007. The stone vessels. In: Mazar, A., Mullins, R. (Eds.), Excavations at Tel
Beth-Shean 1989-1996, The Middle and Late Bronze Age Strata in Area R, v. II.
Israel Exploration Society, Jerusalem, pp. 626e638.
Clark, P. U., Archer, D., Pollard, D., Blum, J. D., Rial, J. A., Brovkin, V., & Roy, M.,
2006. The middle Pleistocene transition: characteristics, mechanisms, and
implications for long-term changes in atmospheric pCO 2. Quaternary Science
Reviews, 25(23), 3150-3184.
Conder, C.R., Kitchener, H.H., 1883. The Survey of Western Palestine: Memoirs. In:
Judaea, v. 3. Palestine Exploration Fund, London.
Craig, H, & Craig, V 1972. "Greek marbles: determination of provenance by isotopic
analysis." Science 176.4033 (1972): 401-403.
Deines, P. (1980). The isotopic composition of reduced organic carbon. In: Fritz, P.,
Fontes, J.Ch. (Eds.), Handbook of Environmental Isotope Geochemistry, 1A.
Elsevier, Amsterdam, pp. 329-406.
Ebeling, J.R., 2001. Utilitarian Objects in Sacred Spaces: Ground Stone Tools in
Middle and Late Bronze Age Temples in the Southern Levant (PhD dissertation).
University of Arizona.
Ehleringer, J. R., & Cooper, T. A., 1988. Correlations between carbon isotope ratio and
microhabitat in desert plants. Oecologia, 76(4), 562-566.
Emeis, K. C., Schulz, H. M., Struck, U., Sakamoto, T., Doose, H., Erlenkeuser, H., &
Paterne, M., 1998. 26. Stable Isotope And Alkenone Temperature Rcords Of
Sapropels From Sites 964 And 967: Constraining The Physical Environment Of
Sapropel Formation In the Eastern Mediterranean Sea.
Emiliani, C., 1955. "Pleistocene temperatures." The Journal of Geology (1955): 538-578.
Folk, R.L., 1965. Some aspects of recrystallization in ancient limestones, in Pray, L.C.,
and Murray, R.C., eds., Dolomitization and Limestone Diagenesis: Society of
Economic Paleontologists and Mineralogists, Special Publication 13, pp. 14–48.
Ford, D.C., Williams, P.W., 2007. Karst Hydrogeology and Geomorphology. Wiley,
Chichester.
73
Frisia, S., Borasto, A., Fairchild, I.J and Mcdermott, F., 2000. Calcite Fabrics, Growth
Mechanisms, And Enviroments Of Formation In Speleothems From The Italian Alps
And Southwestern Ireland. Journal Of Sedimantary Research, v. 70, no. 5, , pp.
1183–1196.
Frumkin, A., Fischhendler, I., 2005. Morphometry and distribution of isolated caves as a
guide for phreatic and confined paleohydrological conditions. Geomorphology
67, pp. 457-471.
Frumkin, A., Ford, D. C. & Schwarcz, H. P., 1999. Continental oxygen isotopic record of the
last 170,000 years in Jerusalem. Quaternary Research, Volume 51, pp. 317-327.
Frumkin, A., Ford, D. C. & Schwarcz, H. P., 2000. Paleoclimate and vegetation of the
last glacial cycles in Jerusalem from speleothem record. Global Biogeochem Cycles,
v. 104, pp. 863-870.
Frumkin, A., Bar-Matthews, M., Davidovich, U., Langford, B., Porat , R., Ullman, M.,
Zissu, B., 2014. In-situ dating of ancient quarries and the source of flowstone
(‘calcite-alabaster’) artifacts in the southern Levant. Journal of Archaeological
Science v. 41,pp. 749-758.
Gasse, F., Vidal, L., Van Campo, E., Demory, F., Develle, A. L., Tachikawa, K., &
Thouveny, N., 2015. Hydroclimatic changes in northern Levant over the past 400,000
years. Quaternary Science Reviews, 111, 1-8.
Genty, D. & Massault, M., 1999. Carbon transfer dynamics from bomb-14C and d13C
time series of a laminated stalagmite from SW France - Modeling and comparison
with other stalagmite records. Geochimica et Cosmochimica Acta, 63(10), pp. 1537-
1548.
Gonzalez, L., Carpenter, S.J., and Lohmann, K.C., 1992, Inorganic calcite morphology:
Roles of fluid chemistry and fluid flow: Journal of Sedimentary Petrology, v. 62, pp.
382–399.
Gorgoni, Carlo, et al.2002. "An updated and detailed mineropetrographic and CO stable
isotopic reference database for the main Mediterranean marbles used in
antiquity." Asmosia 5 (2002): 115-131.
74
Grant, K.M., Rohling, E.J., Bar-Matthews, M., Ayalon, A., Medina-Elizalde, M., Bronk
Ramsey, C., Satow, C., Roberts, A.P. ,2012. Rapid coupling between ice volume and
polar temperature over the past 150 kyr. Nature 491,744-747.
Harrell, J.A., 1995. Ancient Egyptian origins of some common rock names. J. Geol. Edu.
43 (1), pp. 4-30.
Harrell, J.A., Broekmans, M.A.T.M., Godefrey-Smith, D.I., 2007. The origin, destruction
and restoration of colour in Egyptian travertine. Archaeometry 49, pp. 421-436.
Hays, J.D., Imbrie, J., Shackleton, N.J., 1976. Variations in the earth’s orbit: Pacemaker
of the ice ages. Science 194, 1121-1132.
Hendy, C.H., 1971. The isotopic geochemistry of speleothems I. The calculation of the
effects of different modes of formation on the isotopic composition of speleothems
and their applicability as paleoclimatic indicators: Geochimica et Cosmochimica
Acta, v. 35, pp. 801–824.
Hershkovitz, I., Marder, O., Ayalon, A., Bar-Matthews, M., Yasur, G., Boaretto, E., &
Gunz, P., 2015. Levantine cranium from Manot Cave (Israel) foreshadows the first
European modern humans. Nature, 520(7546), 216-219.
Hertz, N. and Dean, N.E., 1986. "Stable isotopes and archaeological geology: the Carrara
marble, northern Italy." Applied Geochemistry 1.1 (1986): 139-151.
Hoek, W. Z., & Bohncke, S. J. P., 2001. Oxygen-isotope wiggle matching as a tool for
synchronising ice-core and terrestrial records over Termination 1. Quaternary Science
Reviews, 20(11), 1251-1264.
Imbrie, J., Mix, A. C., & Martinson, D. G., 1993. Milankovitch theory viewed from
Devils Hole. Nature, 363(6429), 531-533.
Jouzel, J., Masson-Delmotte, V., Cattani, O., Dreyfus, G., Falourd, S., Hoffmann, G., &
Fischer, H., 2007. Orbital and millennial Antarctic climate variability over the past
800,000 years. science, 317(5839), 793-796.
Kagan, E.J., Agnon, A., Bar-Matthews, M., Ayalon, A., 2005. Dating large infrequent
earthquakes by damaged cave deposits. Geology 33, 261–264
75
Kallel, N., Paterne, M., Duplessy, J. C., Vergnaudgrazzini, C., Pujol, C., Labeyrie, L., &
Pierre, C., 1997. Enhanced rainfall in the Mediterranean region during the last
sapropel event. Oceanolica Acta, 20(5), 697-712.
Kaufman, A. Wasserburg, G., Porcelli, D., Bar-Matthews, M., Ayalon, A. and Halicz, L.
1998. U-Th isotope systematics from the Soreq cave, Israel and climatic correlations.
Earth and Planetary Science Letters 156, no. 3-4, 141-155. Kaufmann, G., Dreybrodt,
W., 2004. Stalagmite growth and palaeo- climate: an inverse approach. Earth and
Planetary Science Letters 224, pp. 529–545.
Kaufman, A., 1993. An evaluation of several methods for determining 230ThU ages in
impure carbonates. Geochimica et Cosmochimica Acta, 57(10), 2303-2317.
Kim S.-T., and O’Neil, J.R., 1997. Equilibrium and nonequilibrium oxygen isotope
effects in synthetic carbonates: Geochimica et Cosmochimica Acta, v. 61, pp. 3461–
3475.
Kolodny, Y., Stein, M., Machlus, M., 2004. Sea-rain-lake relation in the Last Glacial East
Mediterranean revealed by δ18
O - δ13
C in Lake Lisan aragonites. Geochimica et
Cosmochimica Acta, v. 69, No. 16, pp. 4045–4060.
Komintz, M. A., and Pisias N. G., 1979: Pleistocene climate: Deterministic or stochastic?
Science,204, 171–172.
Li, H.-C., Ku, T.-H., You, C.-F., Cheng, H., Edwards, R.L., Ma, Z.- B., Tsai, W.-S., Li,
M.-D., 2005. 87Sr/86Sr and Sr/Ca in speleothems for paleoclimate reconstruction in
Central China between 70 and 280 kyr ago. Geochimica et Cosmochimica Acta 69,
pp. 3933–3947.
Lilyquist, C.,1996. Stone vessels at Kamid el-Loz, Lebanon: Egyptian, Egyptianizing, or
Non-Egyptian? A Question at Sites fromthe Sudan to Iraq to the Greek Mainland. In:
Hachmann, R. (Ed.), Kamid el-Loz 16. ‘Schatzhaus’-Studien, Saarbruecker
Beitraege zur Altertumskunde, v. 59. R. Habelt., Bonn, pp. 133-173.
Lisiecki, L. and Raymo, M., 2005. "A Pliocene-Pleistocene stack of 57 globally
distributed benthic δ18O records." Paleoceanography 20.1 (2005).
Lucas, A., 1930. Egyptian Predynastic stone vessels. J. Egypt Archaeol. 16 (3-4), pp.
200-212.
76
Lüthi, D., Le Floch, M., Bereiter, B., Blunier, T., Barnola, J. M., Siegenthaler, U., &
Stocker, T. F. ,2008. High-resolution carbon dioxide concentration record 650,000–
800,000 years before present. Nature, 453(7193), 379-382.
Manfra, L., U. Masi, and B. Turi. "Carbon and oxygen isotope ratios of marbles from
some ancient quarries of western Anatolia and their archaeological significance."
Archaeometry 17.2 (1975): 215-219.
Mann, G., 1978. On a rope-to the pit in the Te’omim Cave. Teva va-Aretz 20, pp. 161-
164 (Hebrew).
Martinson, D. G., Pisias, N. G., Hays, J. D., Imbrie, J., Moore, T. C., & Shackleton, N. J.,
1987. Age dating and the orbital theory of the ice ages: development of a high-
resolution 0 to 300,000-year chronostratigraphy. Quaternary research, 27(1), 1-29.
Mcdermott, F., 2004. Palaeo-climate reconstruction from stable isotopic variations in
speleothems: a review. Quaternary Science Reviews, 23(7-8), pp. 901-918.
Neuville, R., 1930. Notes de Préhistoire Palestinienne; La Grotte d’et-Taouamin.
J. Palest. Orient. Soc. 10, pp. 64-75.
Prell, W. L., Imbrie, J., Martinson, D. G., Morley, J. J., Pisias, N. G., Shackleton, N. J., &
Streeter, H. F., 1986. Graphic correlation of oxygen isotope stratigraphy application
to the late Quaternary. Paleoceanography, 1(2), 137-162.
Press, M.D., 2011. Faience and alabaster vessels (Chapter 14). In: Stager, L.E.,
Master, D.M., Schloen, J.D. (Eds.), Ashkelon 3, the Seventh Century B.C.
Eisenbrauns, Indiana, pp. 421-429.
Prieto, M., Garcia-Ruiz, J.M., and Amoro’s, J.L., 1981. Growth of calcite crystals with
nonsingular faces: Journal of Crystal Growth, v. 52, pp. 864–867.
Quade, J., Cerling, T. E., & Bowman, J. R., 1989. Systematic variations in the carbon and
oxygen isotopic composition of pedogenic carbonate along elevation transects in the
southern Great Basin, United States. Geological Society of America Bulletin, 101(4),
464-475.
Richards, D. A. & Dorale, J. A., 2003. Uranium-series chronology and environmental
applications of speleothems. Reviews in mineralogy and geochemistry, v. 52, pp.
407-460.
77
Shackleton, N. J., and Opdyke N.D., 1973. "Oxygen isotope and palaeomagnetic
stratigraphy of equatorial Pacific core V28-238: Oxygen isotope temperatures and ice
volumes on a 10 5 year and 10 6 year scale." Quaternary research 3.1, 39-55.
Singer, B. S. (2014). A quaternary geomagnetic instability time scale. Quat. Geochronol.
21, 29-52.
Smith, B.N. and Epstein, S., 1971. two categories of 13
C/12
C ratios for plant. Plant
Physiol., 47, 380-384.
Sosdian, S., & Rosenthal, Y., 2010. Response to Comment on “Deep-sea temperature and
ice volume changes across the Pliocene-Pleistocene climate transitions”. Science,
328(5985), 1480-1480.
Sparks, R., 2007. Stone Vessels in the Levant, the Palestine Exploration Fund Annual
VIII. Maney, Leeds.
Stepanov, V.I., 1997, Notes on mineral growth from the archive of V.I. Stepanov (1924–
1988) translated by V.N. Koulanin: University of Bristol, Spelaeological Society,
Proceedings, v. 21, pp. 25–42.
Sunagawa, I., 1987, Morphology of minerals, in Sunagawa, I., ed., Morphology of
Crystals:Tokyo, Terra Scientific Publishing Company, pp. 509–587.
Szabo, B.J., Kolesar, P.T., Riggs, A.C., Winograd, I.J., and Ludwig, K.R., 1994.
Paleoclimatic inferences from a 120,000-yr calcite record of water-table fluctuation in
Browns Room of Devils Hole, Nevada: Quaternary Research, v. 41, pp. 59–69.
Tieszen, L. L., 1991. Natural variations in the carbon isotope values of plants:
implications for archaeology, ecology, and paleoecology. Journal of Archaeological
Science, 18(3), 227-248.
Ussishkin, D., 1980. The Ghassulian shrine at Ein Gedi. Tel Aviv 7 (1), pp. 1-44.
Vaks, A., Bar-Matthews, M., Matthews, A., Ayalon, A., & Frumkin, A. (2010). Middle-
Late Quaternary paleoclimate of northern margins of the Saharan-Arabian Desert:
reconstruction from speleothems of Negev Desert, Israel. Quaternary Science
Reviews, 29(19)
Vaks, A., Bar-Matthews, M., Ayalon, A., Matthews, A., Frumkin, A., Dayan, U., &
Schilman, B., 2006. Paleoclimate and location of the border between Mediterranean
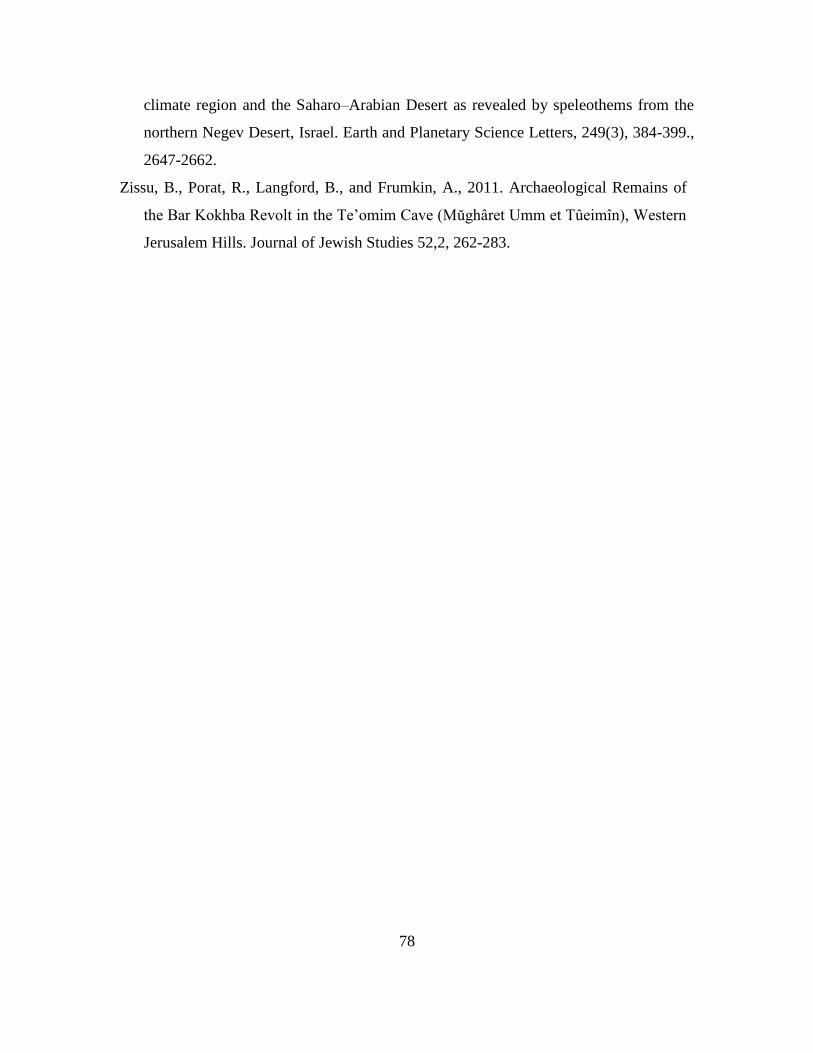
78
climate region and the Saharo–Arabian Desert as revealed by speleothems from the
northern Negev Desert, Israel. Earth and Planetary Science Letters, 249(3), 384-399. ,
2647-2662.
Zissu, B., Porat, R., Langford, B., and Frumkin, A., 2011. Archaeological Remains of
the Bar Kokhba Revolt in the Te’omim Cave (Mŭghâret Umm et Tûeimîn), Western
Jerusalem Hills. Journal of Jewish Studies 52,2, 262-283.
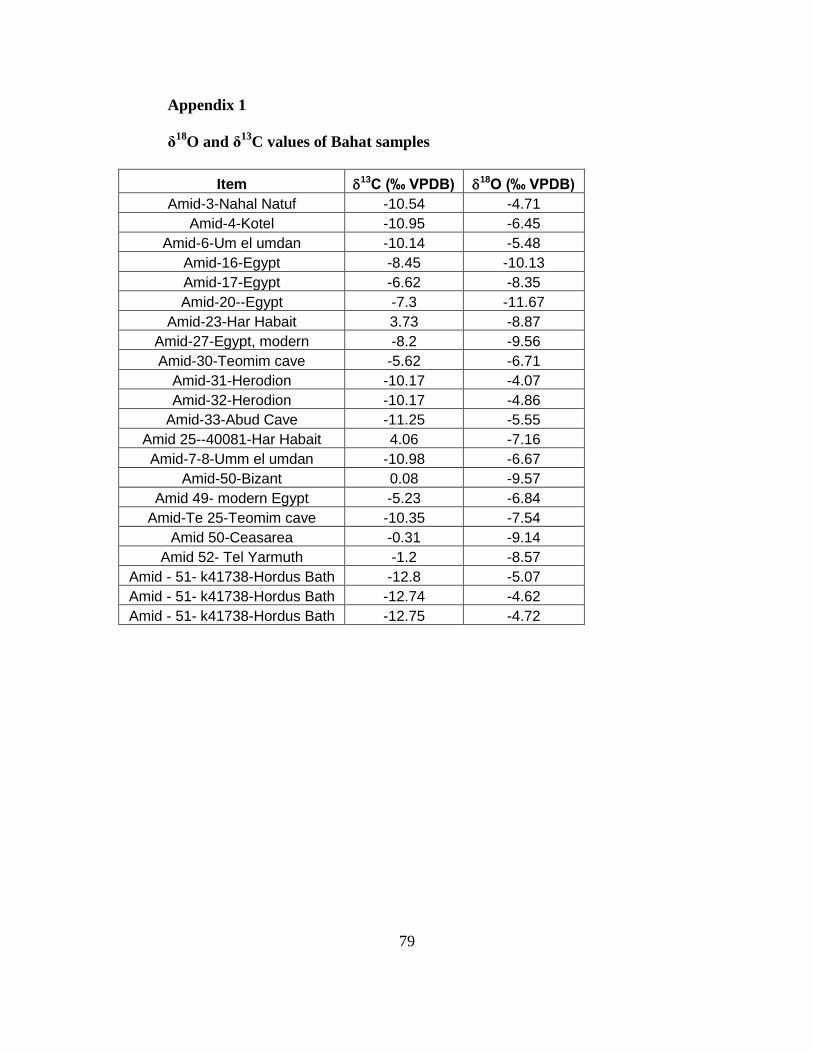
79
Appendix 1
δ18
O and δ13
C values of Bahat samples
Item 13C (‰ VPDB)
18O (‰ VPDB)
Amid-3-Nahal Natuf -10.54 -4.71
Amid-4-Kotel -10.95 -6.45
Amid-6-Um el umdan -10.14 -5.48
Amid-16-Egypt -8.45 -10.13
Amid-17-Egypt -6.62 -8.35
Amid-20--Egypt -7.3 -11.67
Amid-23-Har Habait 3.73 -8.87
Amid-27-Egypt, modern -8.2 -9.56
Amid-30-Teomim cave -5.62 -6.71
Amid-31-Herodion -10.17 -4.07
Amid-32-Herodion -10.17 -4.86
Amid-33-Abud Cave -11.25 -5.55
Amid 25--40081-Har Habait 4.06 -7.16
Amid-7-8-Umm el umdan -10.98 -6.67
Amid-50-Bizant 0.08 -9.57
Amid 49- modern Egypt -5.23 -6.84
Amid-Te 25-Teomim cave -10.35 -7.54
Amid 50-Ceasarea -0.31 -9.14
Amid 52- Tel Yarmuth -1.2 -8.57
Amid - 51- k41738-Hordus Bath -12.8 -5.07
Amid - 51- k41738-Hordus Bath -12.74 -4.62
Amid - 51- k41738-Hordus Bath -12.75 -4.72
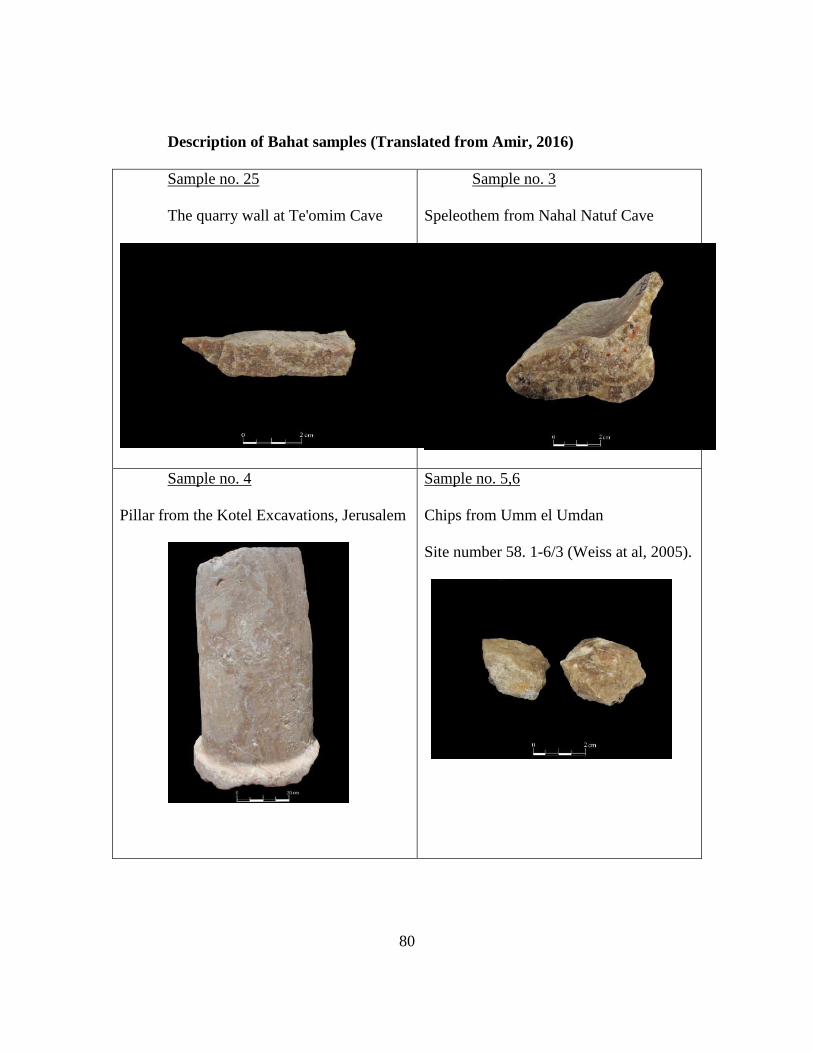
80
Description of Bahat samples (Translated from Amir, 2016)
Sample no. 25
The quarry wall at Te'omim Cave
Sample no. 3
Speleothem from Nahal Natuf Cave
Sample no. 4
Pillar from the Kotel Excavations, Jerusalem
Sample no. 5,6
Chips from Umm el Umdan
Site number 58. 1-6/3 (Weiss at al, 2005).
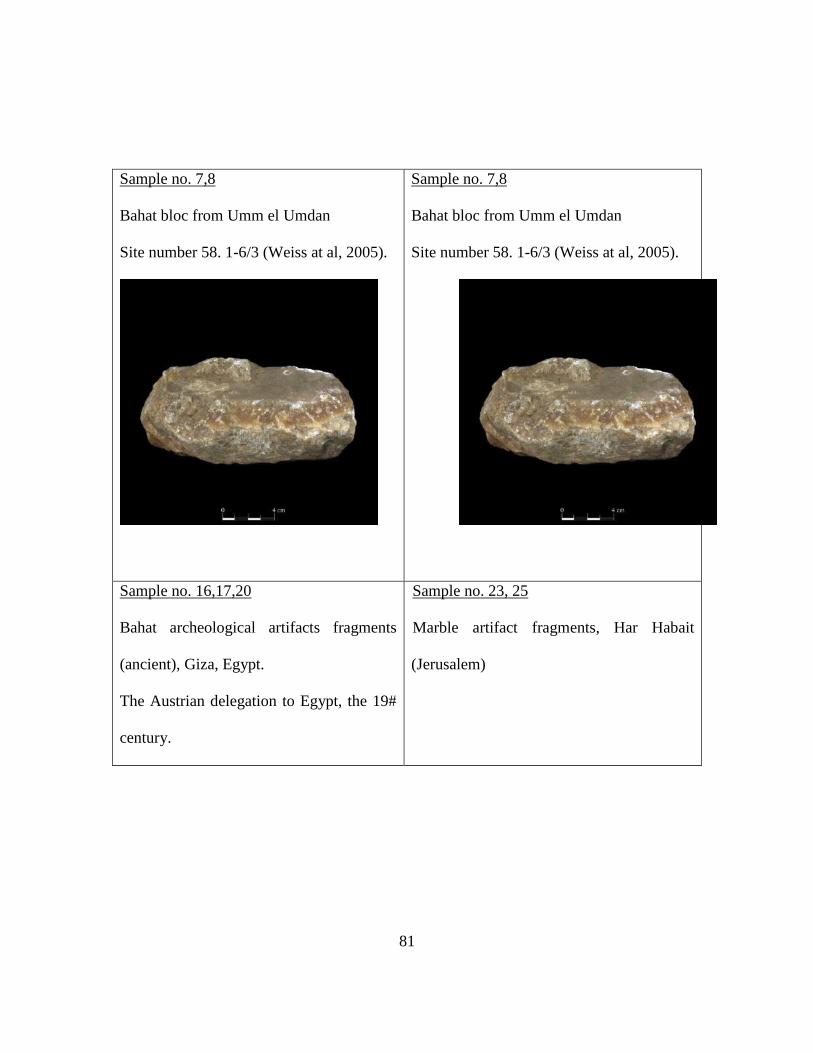
81
Sample no. 7,8
Bahat bloc from Umm el Umdan
Site number 58. 1-6/3 (Weiss at al, 2005).
Sample no. 7,8
Bahat bloc from Umm el Umdan
Site number 58. 1-6/3 (Weiss at al, 2005).
Sample no. 16,17,20
Bahat archeological artifacts fragments
(ancient), Giza, Egypt.
The Austrian delegation to Egypt, the 19#
century.
Sample no. 23, 25
Marble artifact fragments, Har Habait
(Jerusalem)
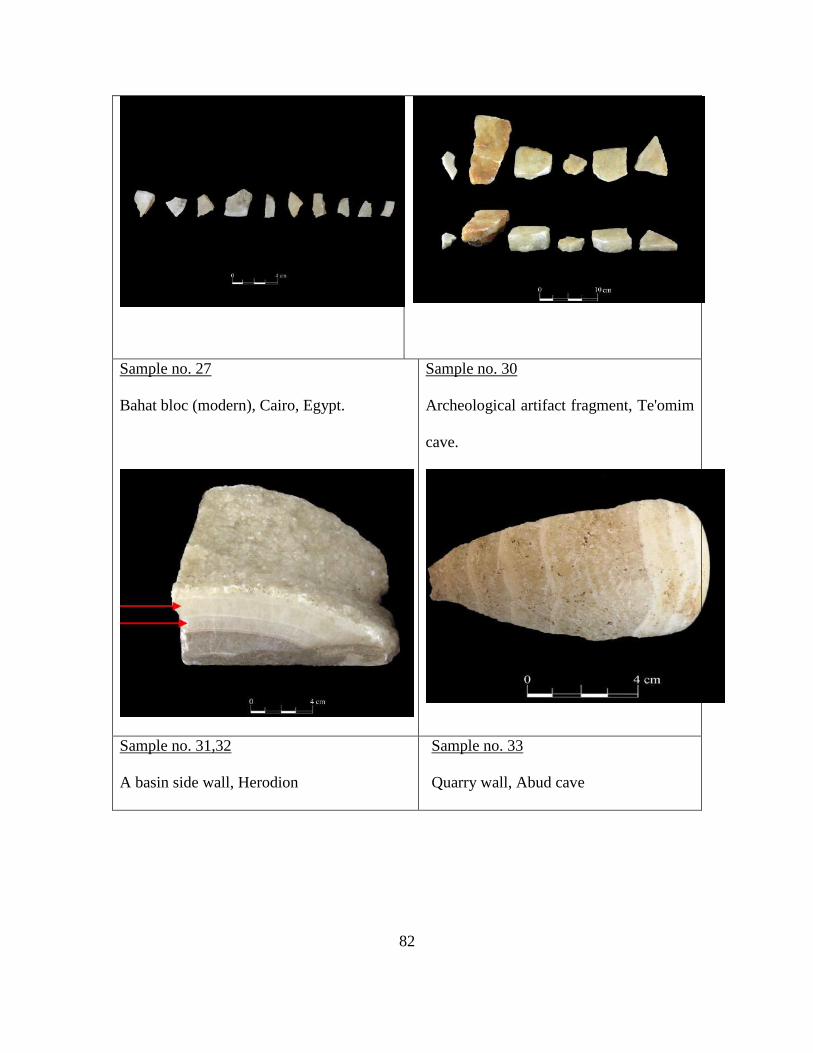
82
Sample no. 27
Bahat bloc (modern), Cairo, Egypt.
Sample no. 30
Archeological artifact fragment, Te'omim
cave.
Sample no. 31,32
A basin side wall, Herodion
Sample no. 33
Quarry wall, Abud cave
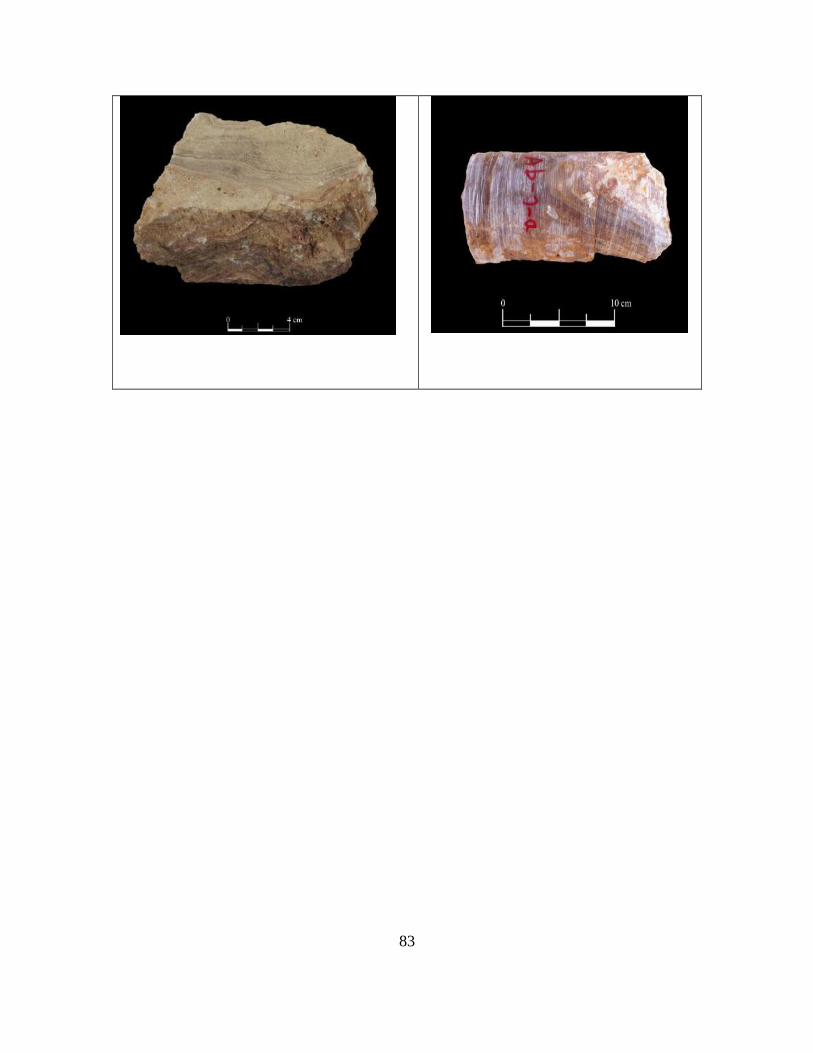
83
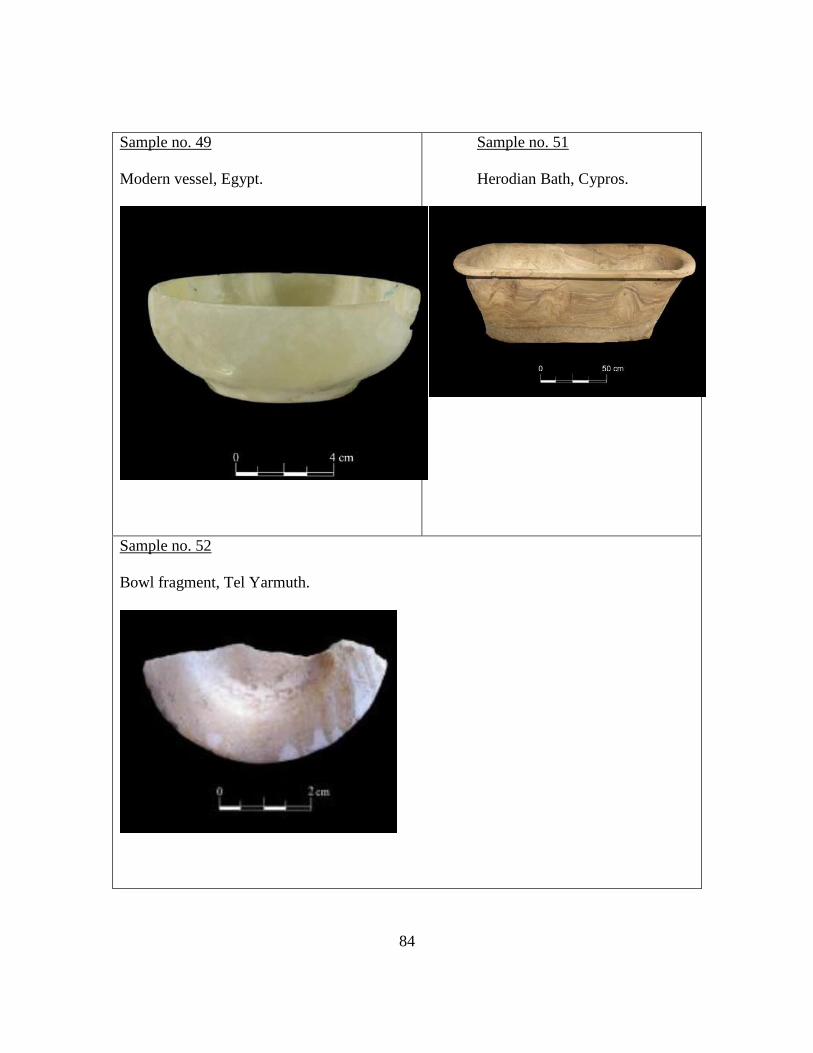
84
Sample no. 49
Modern vessel, Egypt.
Sample no. 51
Herodian Bath, Cypros.
Sample no. 52
Bowl fragment, Tel Yarmuth.
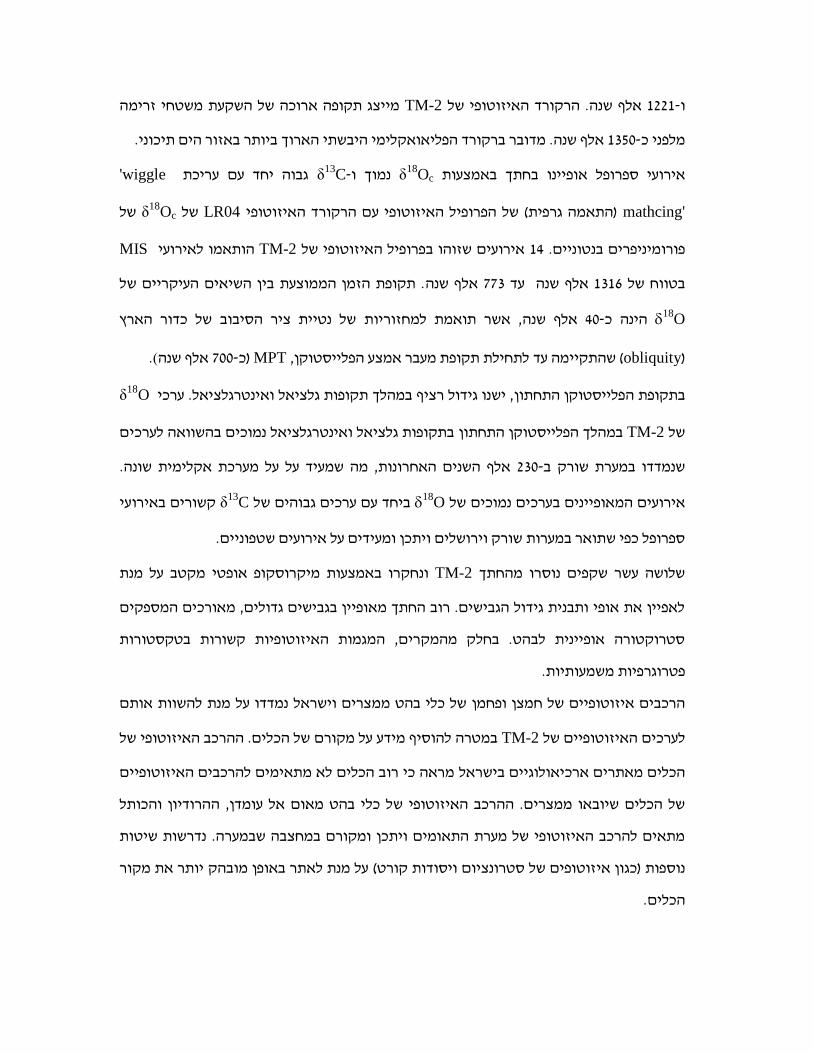
מייצג תקופה ארוכה של השקעת משטחי זרימה TM-2. הרקורד האיזוטופי של אלף שנה 1221-ו
הארוך ביותר באזור הים תיכוני. אואקלימי היבשתייקורד הפל. מדובר בראלף שנה 1350-מלפני כ
δבאמצעות אופיינו בחתךאירועי ספרופל 18
Oc נמוך ו- δ13
Cת גבוה יחד עם עריכ'wiggle
mathcing' התאמה גרפית( של הפרופיל האיזוטופי עם הרקורד האיזוטופי(LR04 שלδ18
Oc של
MISהותאמו לאירועי TM-2אירועים שזוהו בפרופיל האיזוטופי של 14פורומיניפרים בנטוניים.
. תקופת הזמן הממוצעת בין השיאים העיקריים של אלף שנה 773עד אלף שנה 1316בטווח של
18
O של נטיית ציר הסיבוב של כדור הארץ , אשר תואמת למחזוריותאלף שנה 40-הינה כ
(obliquityשהתקיימה עד לתחילת תקופת מעבר אמצע הפלייסטוקן ) ,MPT (אלף שנה 700-כ).
δ, ישנו גידול רציף במהלך תקופות גלציאל ואינטרגלציאל. ערכי התחתון הפלייסטוקן תקופתב18
O
בתקופות גלציאל ואינטרגלציאל נמוכים בהשוואה לערכים התחתון במהלך הפלייסטוקן TM-2של
אלף השנים האחרונות, מה שמעיד על על מערכת אקלימית שונה. 230-ק בשנמדדו במערת שור
ערכים נמוכים של באירועים המאופיינים 18
O ביחד עם ערכים גבוהים שלδ13
C קשורים באירועי
.ספרופל כפי שתואר במערות שורק וירושלים ויתכן ומעידים על אירועים שטפוניים
חקרו באמצעות מיקרוסקופ אופטי מקטב על מנת ונ TM-2שלושה עשר שקפים נוסרו מהחתך
לאפיין את אופי ותבנית גידול הגבישים. רוב החתך מאופיין בגבישים גדולים, מאורכים המספקים
סטרוקטורה אופיינית לבהט. בחלק מהמקרים, המגמות האיזוטופיות קשורות בטקסטורות
משמעותיות.פטרוגרפיות
של כלי בהט ממצרים וישראל נמדדו על מנת להשוות אותם הרכבים איזוטופיים של חמצן ופחמן
במטרה להוסיף מידע על מקורם של הכלים. ההרכב האיזוטופי של TM-2לערכים האיזוטופיים של
מראה כי רוב הכלים לא מתאימים להרכבים האיזוטופיים בישראל הכלים מאתרים ארכיאולוגיים
ל כלי בהט מאום אל עומדן, ההרודיון והכותל של הכלים שיובאו ממצרים. ההרכב האיזוטופי ש
מתאים להרכב האיזוטופי של מערת התאומים ויתכן ומקורם במחצבה שבמערה. נדרשות שיטות
יותר את מקור מובהק ( על מנת לאתר באופן זוטופים של סטרונציום ויסודות קורטכגון אינוספות )
הכלים.
תקציר
מערת התאומים היא מערת המסה קארסטית הממוקמת במדרונות המערביים של הרי ירושלים,
טווח רחב של נמצא (. במערה202049/726028ק"מ מערבית לירושלים בנחל המערה )נ.צ. 20-כ
ספלאותמים ואדוסים כגון משטחי זרימה, נטיפים וזקיפים שהושקעו בחלקים שונים בחלל המרכזי
של המערה, כאשר חלקם יצרו חתך עבה של משטחי זרימה וזקיפים. במחקר עדכני שנערך במערה,
-םאותרה מחצבה בחלק המזרחי של החלל המרכזי במערה. המחצבה תוארכה בשיטת אורניו
תוריום באמצעות תיארוך של משטחי זרימה שהושקעו מעל משטח החציבה לאחר תום החציבה,
החומר שנחצב מורכב ממשטחי שנה(. 3500-והגיל שהתקבל הינו תקופת הברונזה התיכונה )לפני כ
זרימה המורכבים משכבות גבישי קלציט גדולים ובעלי שקיפות שככל הנראה שימשו בעבר כמקור
המודרנית להגדרת משמש בספרות הארכיאולוגית העברית ציט אלבסטר(. המונח 'בהט'ל'בהט' )קל
קלציט אלבסטר. בעבר נהוג היה לחשוב כי חפצים המורכבים מקלציט אלבסטר אשר נמצאו בדרום
התקבלה לפני שנים הלבנט יובאו ממצרים. ההנחה שאין אפשרות למקור מקומי לקלציט אלבסטר
המחקרים הניחו שמקורם של החפצים במצרים. בניגוד לכך הסתבר כי רוב רבות, ובהתאם לכך
לפחות בשתי מערות, מערת התאומים מחצבות של קלציט אלבסטר אכן קיימות בדרום הלבנט
ומערת עבוד, וככל הנראה מחצבות אלו היוו מקור מקומי אלטרנטיבי לחומר היוקרתי.
מקיר המחצבה. המיקום נבחר היכן שנמצא גםנד, TM-2מ', 3-חתך של משטחי זרימה בעובי של כ
חתך בעל עובי מקסימלי של משטחי זרימה נקיים על מנת לאפיין את החתך העיקרי במחצבה.
, נחקרו בעבודה זו.TM-2הס"מ העליונים של שמונים
δלמדידת ערכי דגימות 18
Oc ו- δ13
Cמות נקדחוידג 459מ"מ ) 0.5-1.0 -נלקחו במרווחים של כ
הס"מ העליונים של תעשרלשם תיארוך ושחזור שינויים אקלימיים וסביבתיים. ,(TM-2בחתך
תוריום. החלק העתיק יותר של החתך תוארך -כו תחילה באמצעות שיטת אורניוםרהחתך תוא
1300-לתקופה שבין כזם. החתך תוארך עופרת ובאמצעות פליאומגנטי -באמצעות שיטת אורניום
-ו אלף שנה 1310+ 60עופרת התקבלו שני גילים,-. בשיטת האורניוםאלף שנה 50-עד לכ אלף שנה
1189, 1069, 1001, 773ובשיטת המגנטוסטרטיגפיה התקבלו חמישה גילים: אלף שנה 1350+ 120

המכון הגיאולוגי משרד התשתיות הלאומיות
האנרגיה והמים
:, ישראלמשטחי זרימה במערת התאומים
בתקופת המעבר מאפיינים ומגמות אקלימיות
MPTהפליסטוקנית
יעל אמיד
ה העברית בירושלים.באוניברסיט" "מוסמךעבודה זו הוגשה כחיבור לקבלת תואר
העבודה נעשתה בהדרכתם של:
., המכון הגיאולוגי, ירושליםמטיוס-ד"ר מירה בר
., האוניברסיטה העברית בירושליםחקר מערותל רכזהמ, עמוס פרומקיןפרופ'
2016 דצמבר, זתשע" כסלוירושלים, GSI/39/2016 דוח מס'
Related Documents


