XYZ Health Center

Welcome message from author
This document is posted to help you gain knowledge. Please leave a comment to let me know what you think about it! Share it to your friends and learn new things together.
Transcript
XYZ Health Center
© 2021 Capital Link
Performance Evaluation Profile 2016 - 2019
| 2
Methodology
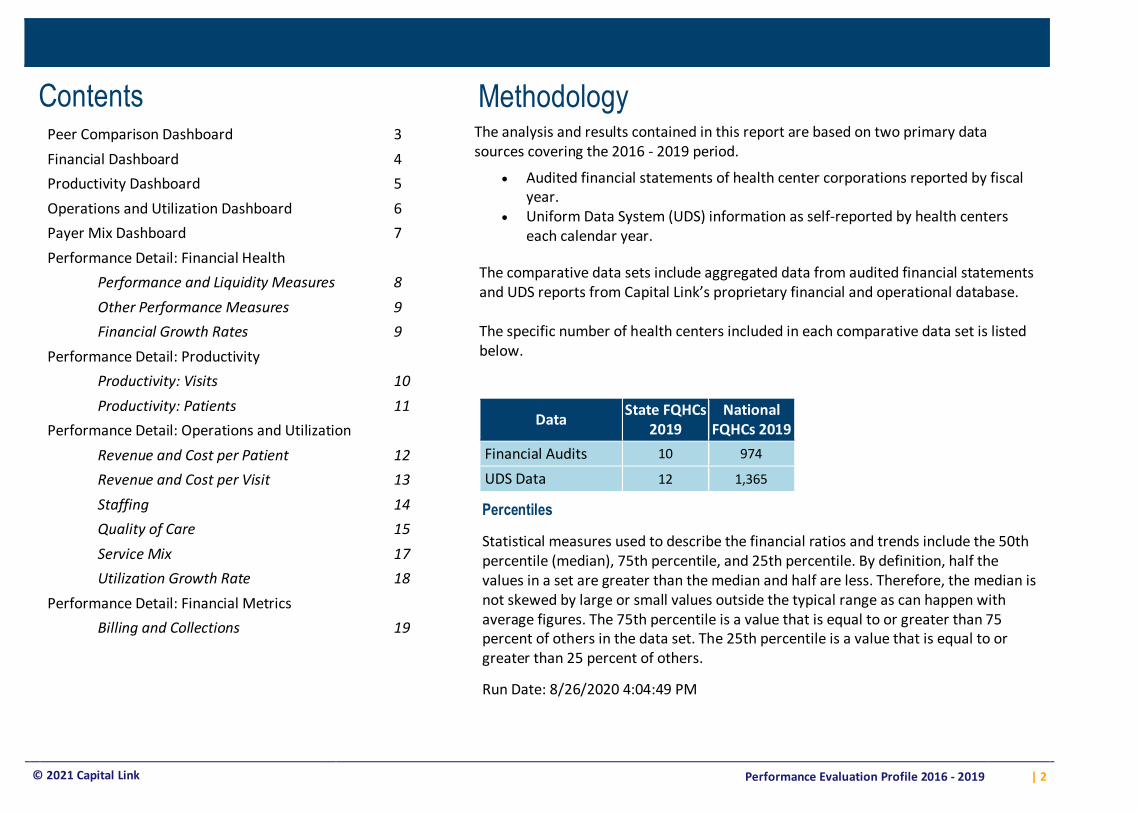
The analysis and results contained in this report are based on two primary data sources covering the 2016 - 2019 period.
• Audited financial statements of health center corporations reported by fiscal year.
• Uniform Data System (UDS) information as self-reported by health centers each calendar year.
The comparative data sets include aggregated data from audited financial statements and UDS reports from Capital Link’s proprietary financial and operational database. The specific number of health centers included in each comparative data set is listed below.
Data State FQHCs
2019 National
FQHCs 2019
Financial Audits 10 974
UDS Data 12 1,365
Percentiles
Statistical measures used to describe the financial ratios and trends include the 50th percentile (median), 75th percentile, and 25th percentile. By definition, half the values in a set are greater than the median and half are less. Therefore, the median is not skewed by large or small values outside the typical range as can happen with average figures. The 75th percentile is a value that is equal to or greater than 75 percent of others in the data set. The 25th percentile is a value that is equal to or greater than 25 percent of others.
Run Date: 8/26/2020 4:04:49 PM
Contents
Peer Comparison Dashboard 3
Financial Dashboard 4 Productivity Dashboard 5
Operations and Utilization Dashboard 6 Payer Mix Dashboard 7
Performance Detail: Financial Health
Performance and Liquidity Measures
8
Other Performance Measures
9 Financial Growth Rates
9
Performance Detail: Productivity
Productivity: Visits 10
Productivity: Patients 11 Performance Detail: Operations and Utilization
Revenue and Cost per Patient 12 Revenue and Cost per Visit 13
Staffing 14 Quality of Care 15
Service Mix 17 Utilization Growth Rate 18
Performance Detail: Financial Metrics
Billing and Collections 19
© 2021 Capital Link
Performance Evaluation Profile 2016 - 2019
| 3
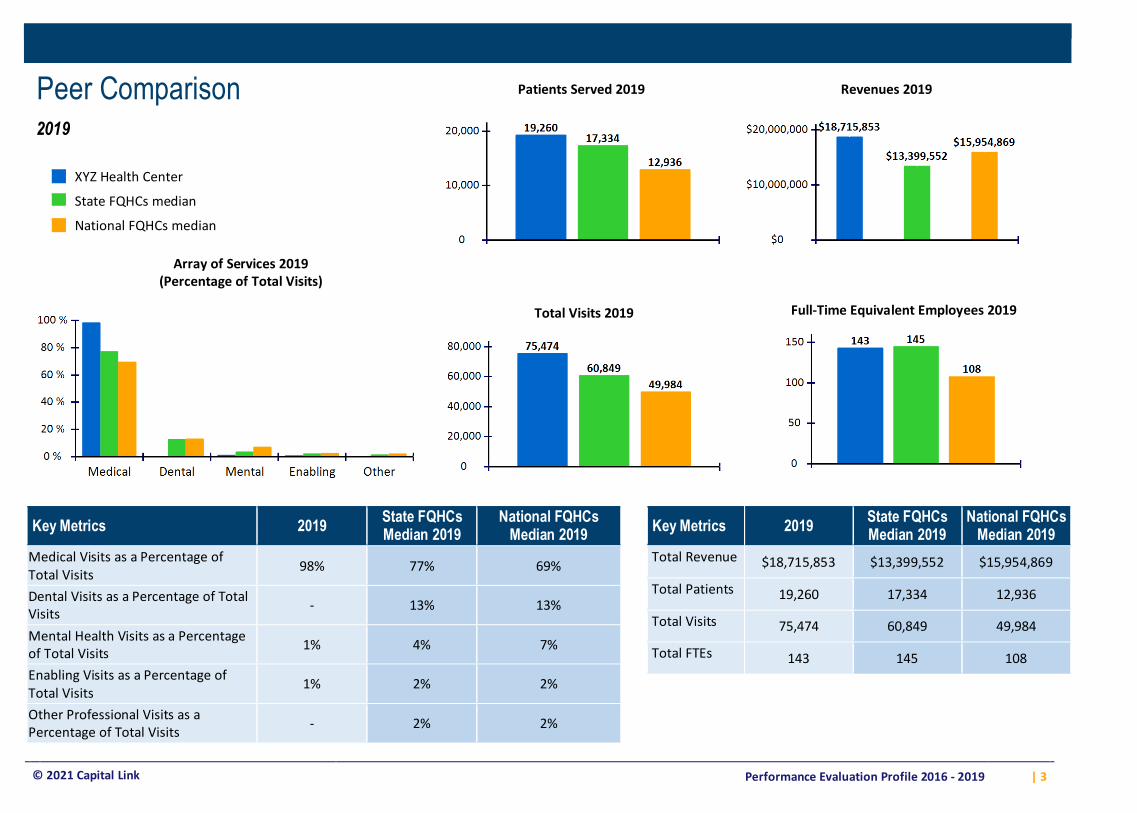
Peer Comparison
Patients Served 2019
Revenues 2019
2019
XYZ Health Center
State FQHCs median
National FQHCs median
Array of Services 2019 (Percentage of Total Visits)
Full-Time Equivalent Employees 2019
Total Visits 2019
Key Metrics 2019 State FQHCs Median 2019
National FQHCs Median 2019
Medical Visits as a Percentage of Total Visits
98% 77% 69%
Dental Visits as a Percentage of Total Visits
- 13% 13%
Mental Health Visits as a Percentage of Total Visits
1% 4% 7%
Enabling Visits as a Percentage of Total Visits
1% 2% 2%
Other Professional Visits as a Percentage of Total Visits
- 2% 2%
Key Metrics 2019 State FQHCs Median 2019
National FQHCs Median 2019
Total Revenue $18,715,853 $13,399,552 $15,954,869
Total Patients 19,260 17,334 12,936
Total Visits 75,474 60,849 49,984
Total FTEs 143 145 108
© 2021 Capital Link
Performance Evaluation Profile 2016 - 2019
| 4
Days Cash on Hand
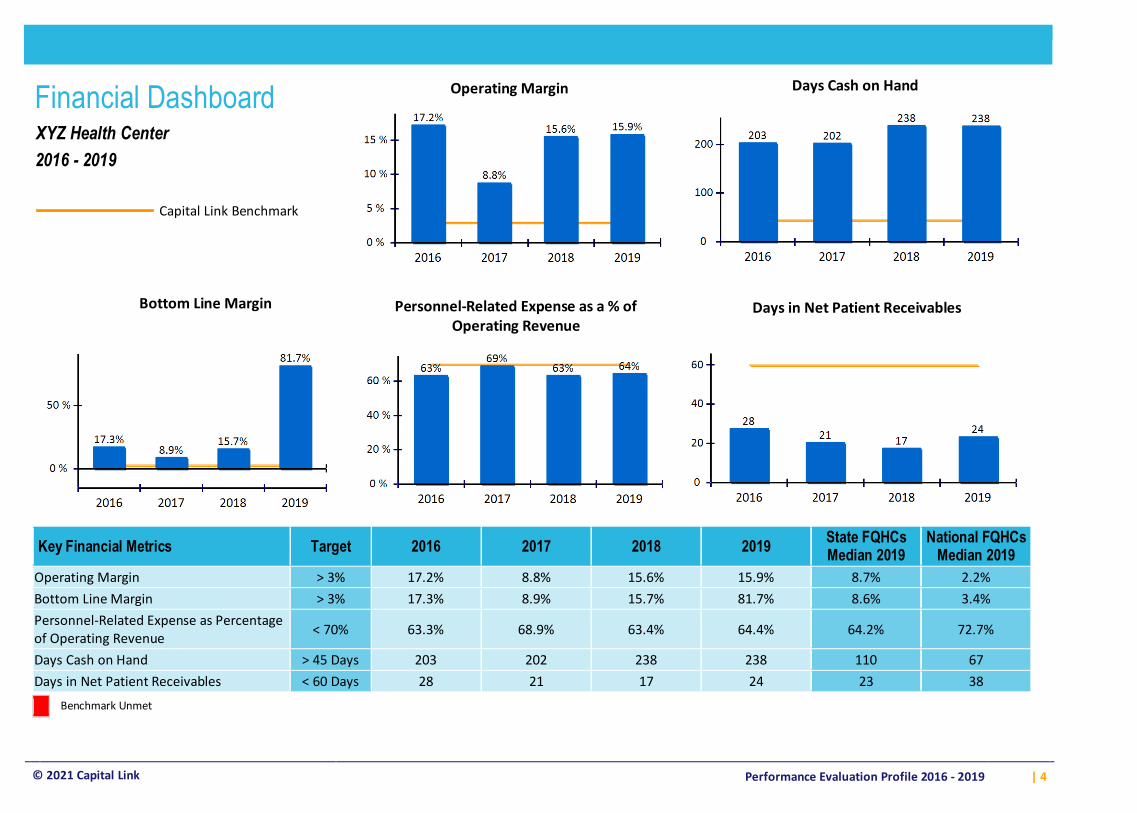
Financial Dashboard
Operating Margin
XYZ Health Center
2016 - 2019
Capital Link Benchmark
Bottom Line Margin
Personnel-Related Expense as a % of Operating Revenue
Days in Net Patient Receivables
Key Financial Metrics Target 2016 2017 2018 2019 State FQHCs Median 2019
National FQHCs Median 2019
Operating Margin > 3% 17.2% 8.8% 15.6% 15.9% 8.7% 2.2% Bottom Line Margin > 3% 17.3% 8.9% 15.7% 81.7% 8.6% 3.4% Personnel-Related Expense as Percentage of Operating Revenue
< 70% 63.3% 68.9% 63.4% 64.4% 64.2% 72.7%
Days Cash on Hand > 45 Days 203 202 238 238 110 67 Days in Net Patient Receivables < 60 Days 28 21 17 24 23 38
Benchmark Unmet
© 2021 Capital Link
Performance Evaluation Profile 2016 - 2019
| 5
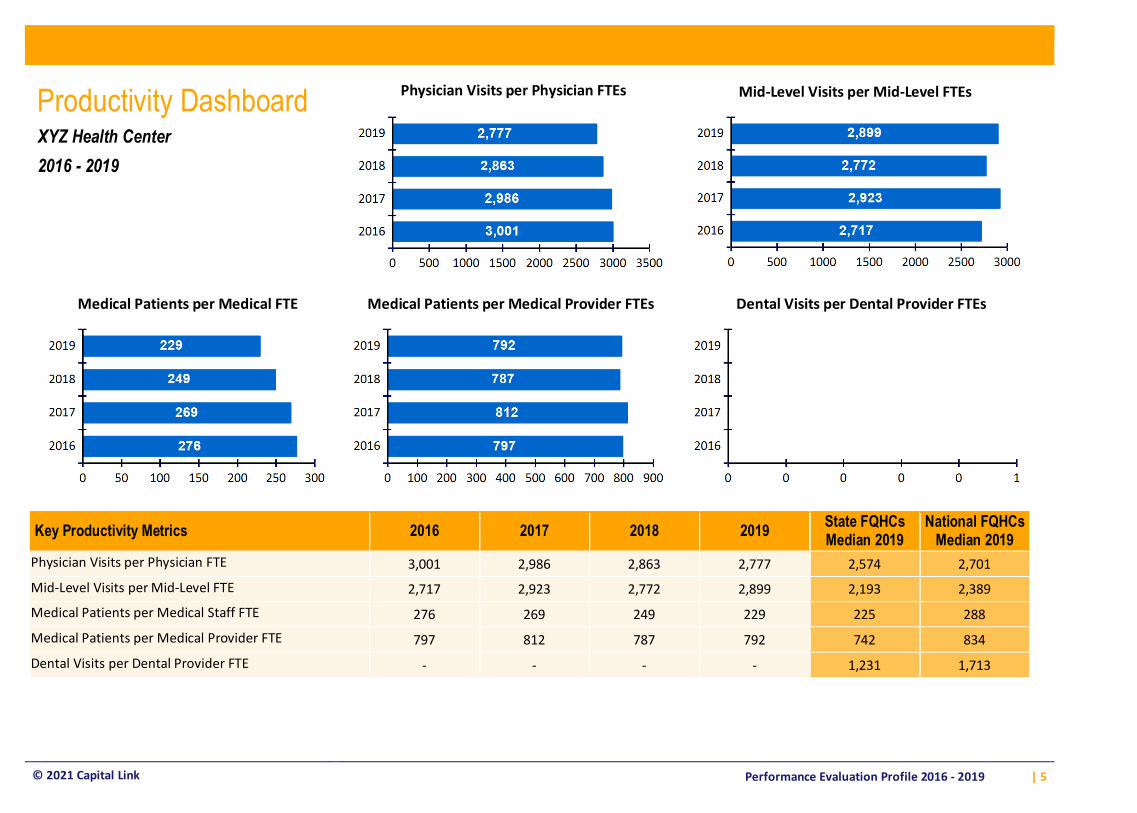
Physician Visits per Physician FTEs
Productivity Dashboard
Mid-Level Visits per Mid-Level FTEs
XYZ Health Center
2016 - 2019
Medical Patients per Medical FTE
Medical Patients per Medical Provider FTEs
Dental Visits per Dental Provider FTEs
Key Productivity Metrics 2016 2017 2018 2019 State FQHCs Median 2019
National FQHCs Median 2019
Physician Visits per Physician FTE 3,001 2,986 2,863 2,777 2,574 2,701
Mid-Level Visits per Mid-Level FTE 2,717 2,923 2,772 2,899 2,193 2,389
Medical Patients per Medical Staff FTE 276 269 249 229 225 288
Medical Patients per Medical Provider FTE 797 812 787 792 742 834
Dental Visits per Dental Provider FTE - - - - 1,231 1,713
© 2021 Capital Link
Performance Evaluation Profile 2016 - 2019
| 6
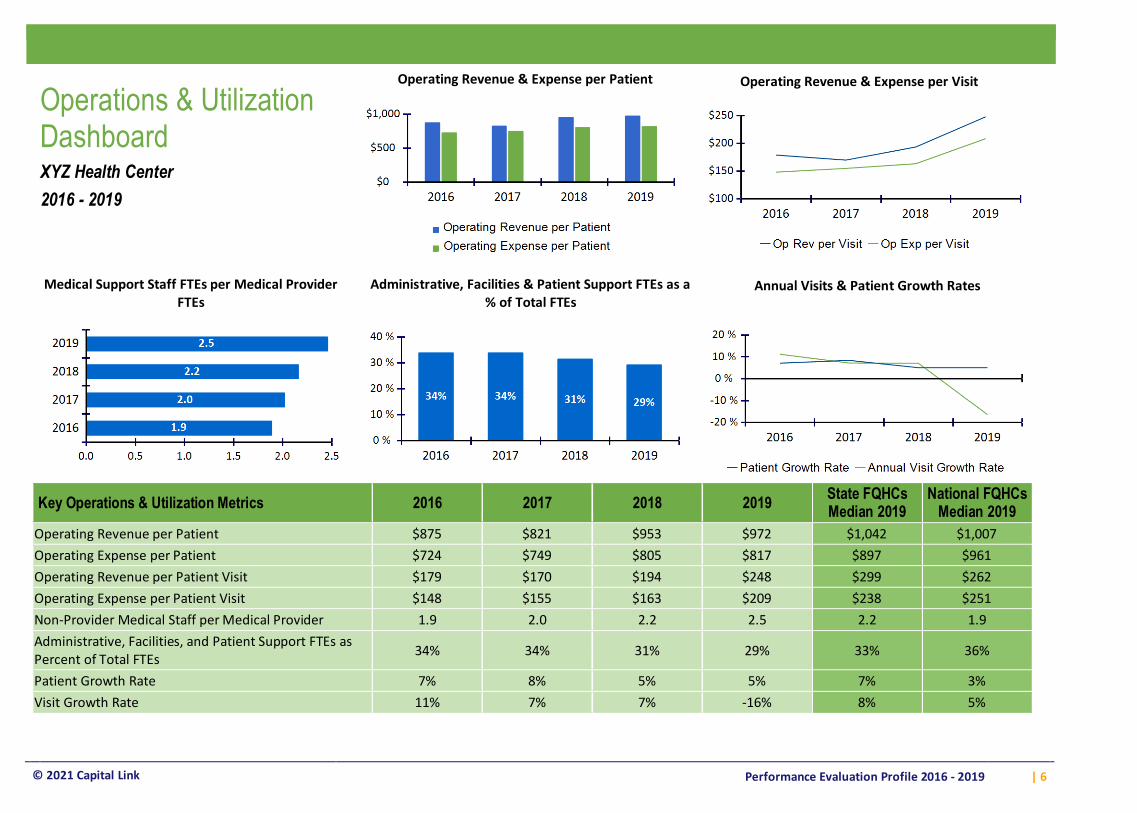
Operating Revenue & Expense per Patient
Operating Revenue & Expense per Visit
Operations & Utilization Dashboard
XYZ Health Center
2016 - 2019
Medical Support Staff FTEs per Medical Provider FTEs
Administrative, Facilities & Patient Support FTEs as a % of Total FTEs
Annual Visits & Patient Growth Rates
Key Operations & Utilization Metrics 2016 2017 2018 2019 State FQHCs Median 2019
National FQHCs Median 2019
Operating Revenue per Patient $875 $821 $953 $972 $1,042 $1,007 Operating Expense per Patient $724 $749 $805 $817 $897 $961 Operating Revenue per Patient Visit $179 $170 $194 $248 $299 $262 Operating Expense per Patient Visit $148 $155 $163 $209 $238 $251 Non-Provider Medical Staff per Medical Provider 1.9 2.0 2.2 2.5 2.2 1.9 Administrative, Facilities, and Patient Support FTEs as Percent of Total FTEs
34% 34% 31% 29% 33% 36%
Patient Growth Rate 7% 8% 5% 5% 7% 3% Visit Growth Rate 11% 7% 7% -16% 8% 5%
© 2021 Capital Link
Performance Evaluation Profile 2016 - 2019
| 7
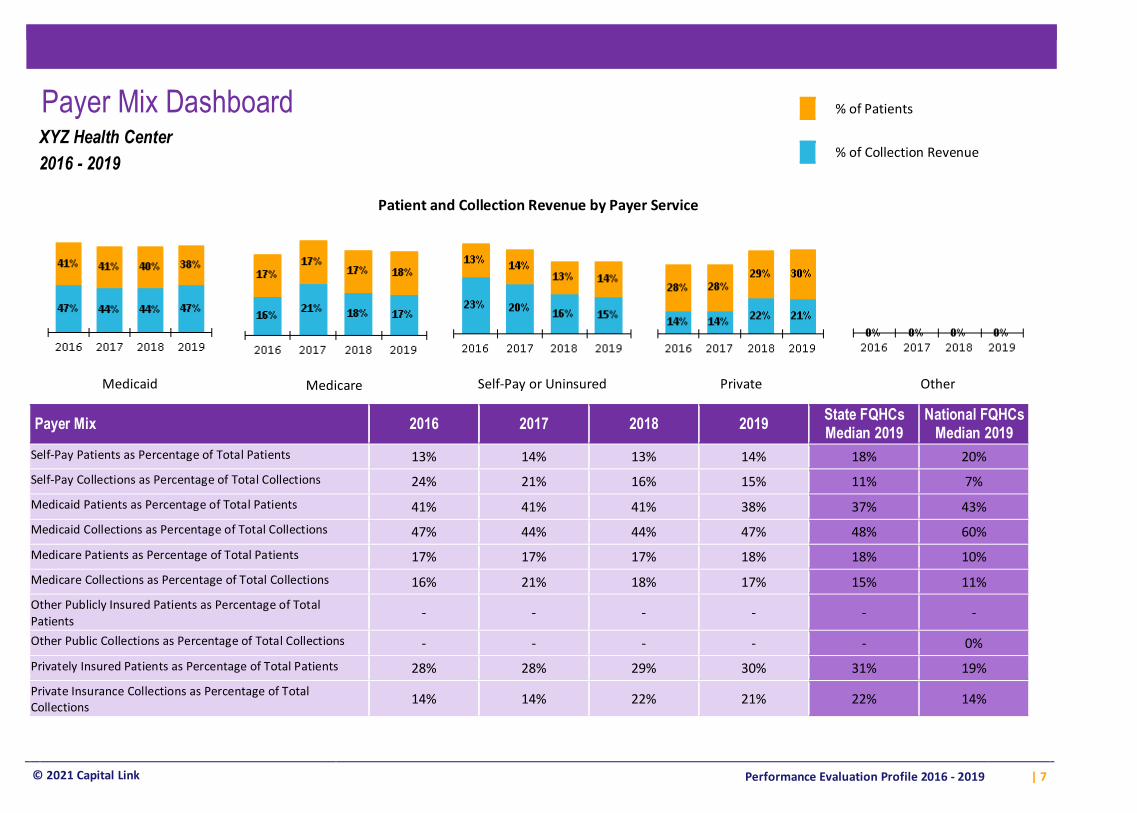
Payer Mix Dashboard
% of Patients % of Collection Revenue
XYZ Health Center
2016 - 2019
Patient and Collection Revenue by Payer Service
Medicaid
Self-Pay or Uninsured
Private
Other
Medicare
Payer Mix 2016 2017 2018 2019 State FQHCs Median 2019
National FQHCs Median 2019
Self-Pay Patients as Percentage of Total Patients 13% 14% 13% 14% 18% 20%
Self-Pay Collections as Percentage of Total Collections 24% 21% 16% 15% 11% 7%
Medicaid Patients as Percentage of Total Patients 41% 41% 41% 38% 37% 43%
Medicaid Collections as Percentage of Total Collections 47% 44% 44% 47% 48% 60%
Medicare Patients as Percentage of Total Patients 17% 17% 17% 18% 18% 10%
Medicare Collections as Percentage of Total Collections 16% 21% 18% 17% 15% 11%
Other Publicly Insured Patients as Percentage of Total Patients - - - - - -
Other Public Collections as Percentage of Total Collections - - - - - 0%
Privately Insured Patients as Percentage of Total Patients 28% 28% 29% 30% 31% 19%
Private Insurance Collections as Percentage of Total Collections 14% 14% 22% 21% 22% 14%
© 2021 Capital Link
Performance Evaluation Profile 2016 - 2019
| 8
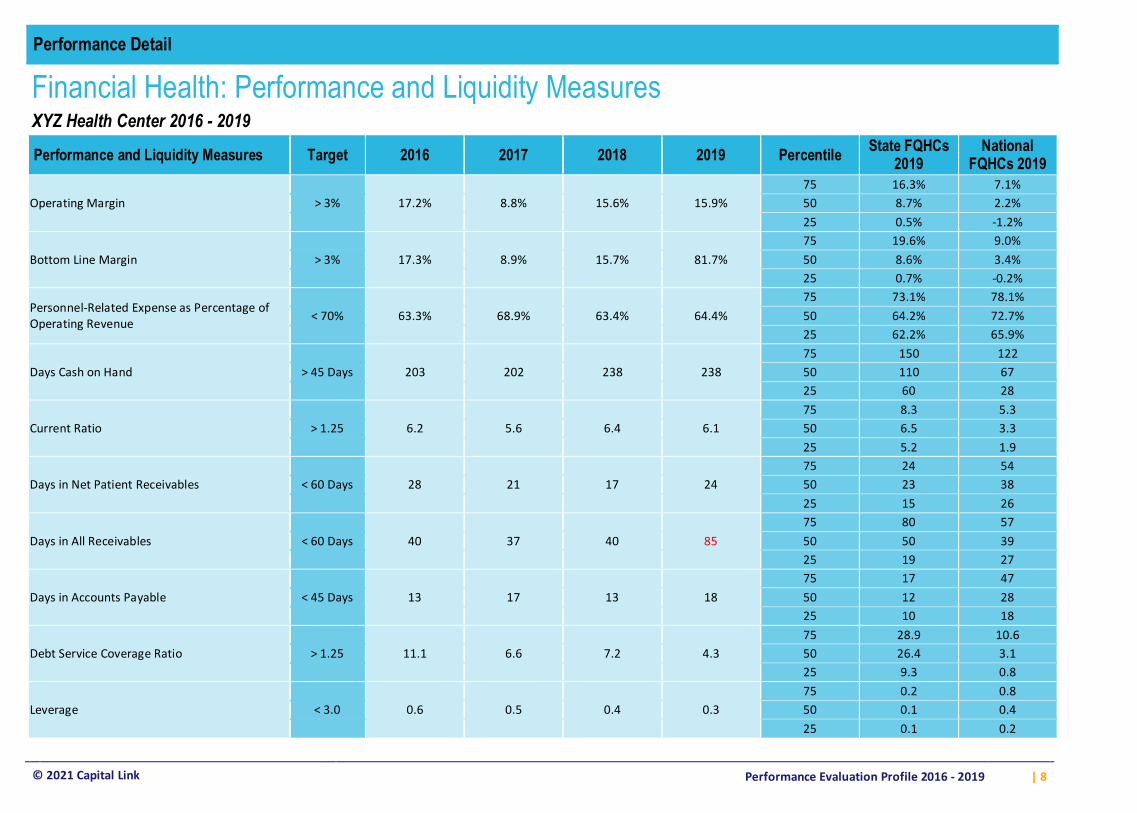
Performance Detail
Financial Health: Performance and Liquidity Measures
XYZ Health Center 2016 - 2019
Performance and Liquidity Measures Target 2016 2017 2018 2019 Percentile State FQHCs
2019 National
FQHCs 2019
Operating Margin 75 16.3% 7.1%
> 3% 17.2% 8.8% 15.6% 15.9% 50 8.7% 2.2% 25 0.5% -1.2%
Bottom Line Margin 75 19.6% 9.0%
> 3% 17.3% 8.9% 15.7% 81.7% 50 8.6% 3.4% 25 0.7% -0.2%
Personnel-Related Expense as Percentage of Operating Revenue
75 73.1% 78.1% < 70% 63.3% 68.9% 63.4% 64.4% 50 64.2% 72.7%
25 62.2% 65.9%
Days Cash on Hand 75 150 122
> 45 Days 203 202 238 238 50 110 67 25 60 28
Current Ratio 75 8.3 5.3
> 1.25 6.2 5.6 6.4 6.1 50 6.5 3.3 25 5.2 1.9
Days in Net Patient Receivables 75 24 54
< 60 Days 28 21 17 24 50 23 38 25 15 26
Days in All Receivables 75 80 57
< 60 Days 40 37 40 85 50 50 39 25 19 27
Days in Accounts Payable 75 17 47
< 45 Days 13 17 13 18 50 12 28 25 10 18
Debt Service Coverage Ratio 75 28.9 10.6
> 1.25 11.1 6.6 7.2 4.3 50 26.4 3.1 25 9.3 0.8
Leverage 75 0.2 0.8
< 3.0 0.6 0.5 0.4 0.3 50 0.1 0.4 25 0.1 0.2
© 2021 Capital Link
Performance Evaluation Profile 2016 - 2019
| 9
Performance Detail
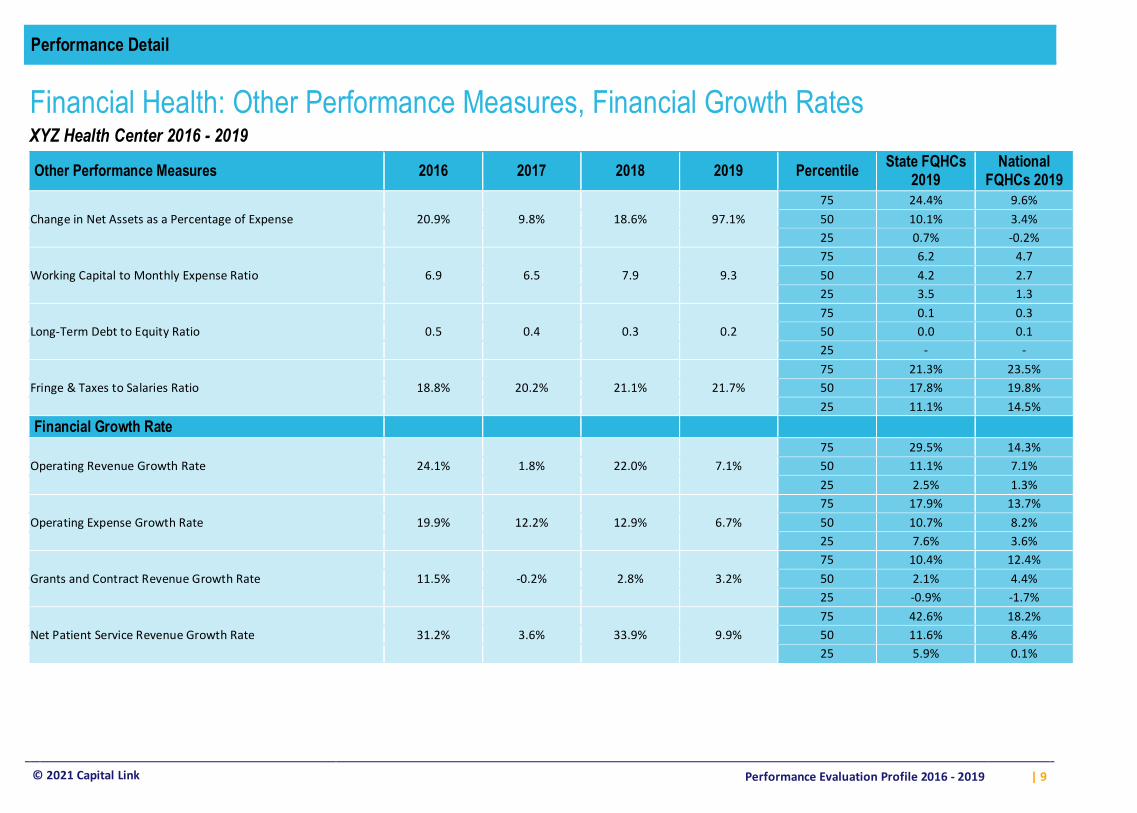
Financial Health: Other Performance Measures, Financial Growth Rates
XYZ Health Center 2016 - 2019
Other Performance Measures 2016 2017 2018 2019 Percentile State FQHCs
2019 National
FQHCs 2019 75 24.4% 9.6% Change in Net Assets as a Percentage of Expense 20.9% 9.8% 18.6% 97.1% 50 10.1% 3.4% 25 0.7% -0.2% 75 6.2 4.7 Working Capital to Monthly Expense Ratio 6.9 6.5 7.9 9.3 50 4.2 2.7 25 3.5 1.3 75 0.1 0.3 Long-Term Debt to Equity Ratio 0.5 0.4 0.3 0.2 50 0.0 0.1 25 - - 75 21.3% 23.5% Fringe & Taxes to Salaries Ratio 18.8% 20.2% 21.1% 21.7% 50 17.8% 19.8% 25 11.1% 14.5% Financial Growth Rate 75 29.5% 14.3% Operating Revenue Growth Rate 24.1% 1.8% 22.0% 7.1% 50 11.1% 7.1% 25 2.5% 1.3% 75 17.9% 13.7% Operating Expense Growth Rate 19.9% 12.2% 12.9% 6.7% 50 10.7% 8.2% 25 7.6% 3.6% 75 10.4% 12.4% Grants and Contract Revenue Growth Rate 11.5% -0.2% 2.8% 3.2% 50 2.1% 4.4% 25 -0.9% -1.7% 75 42.6% 18.2% Net Patient Service Revenue Growth Rate 31.2% 3.6% 33.9% 9.9% 50 11.6% 8.4% 25 5.9% 0.1%
© 2021 Capital Link
Performance Evaluation Profile 2016 - 2019
| 10
Performance Detail
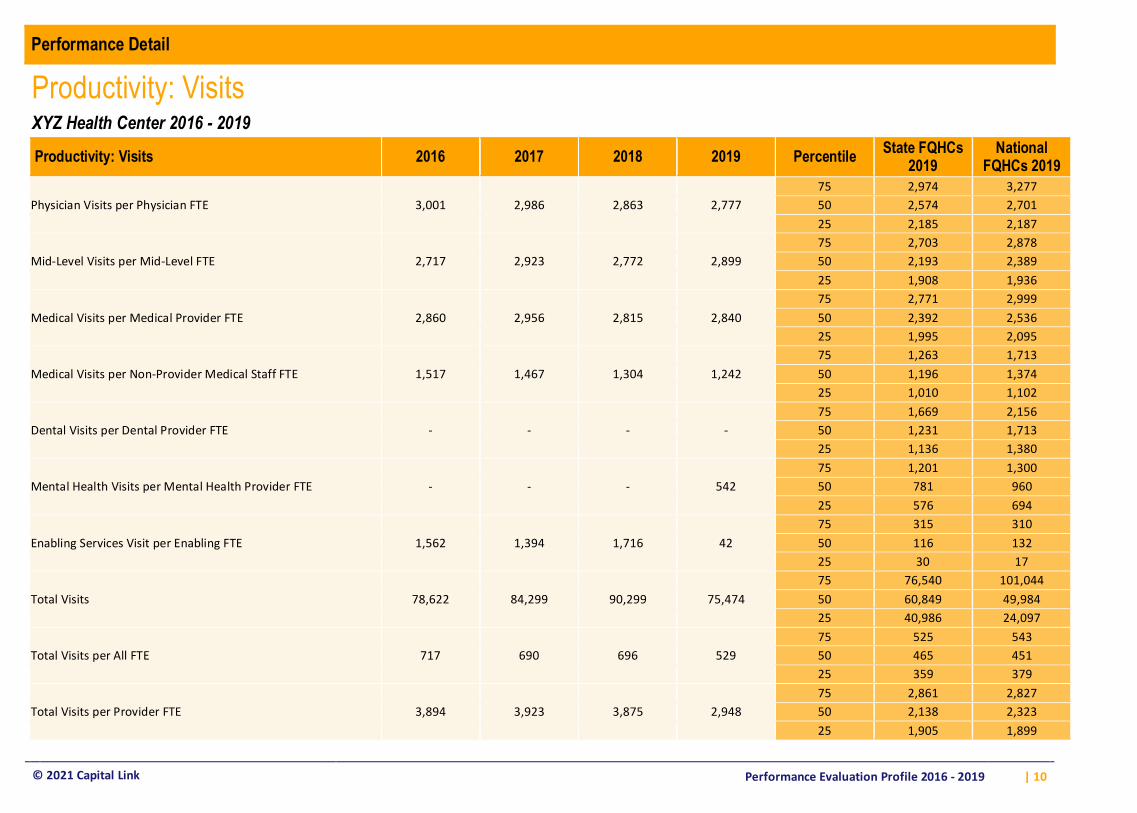
Productivity: Visits
XYZ Health Center 2016 - 2019
Productivity: Visits 2016 2017 2018 2019 Percentile State FQHCs
2019 National
FQHCs 2019 75 2,974 3,277 Physician Visits per Physician FTE 3,001 2,986 2,863 2,777 50 2,574 2,701 25 2,185 2,187 75 2,703 2,878 Mid-Level Visits per Mid-Level FTE 2,717 2,923 2,772 2,899 50 2,193 2,389 25 1,908 1,936 75 2,771 2,999 Medical Visits per Medical Provider FTE 2,860 2,956 2,815 2,840 50 2,392 2,536 25 1,995 2,095 75 1,263 1,713 Medical Visits per Non-Provider Medical Staff FTE 1,517 1,467 1,304 1,242 50 1,196 1,374 25 1,010 1,102 75 1,669 2,156 Dental Visits per Dental Provider FTE - - - - 50 1,231 1,713 25 1,136 1,380 75 1,201 1,300 Mental Health Visits per Mental Health Provider FTE - - - 542 50 781 960 25 576 694 75 315 310 Enabling Services Visit per Enabling FTE 1,562 1,394 1,716 42 50 116 132 25 30 17 75 76,540 101,044 Total Visits 78,622 84,299 90,299 75,474 50 60,849 49,984 25 40,986 24,097 75 525 543 Total Visits per All FTE 717 690 696 529 50 465 451 25 359 379 75 2,861 2,827 Total Visits per Provider FTE 3,894 3,923 3,875 2,948 50 2,138 2,323 25 1,905 1,899
© 2021 Capital Link
Performance Evaluation Profile 2016 - 2019
| 11
Performance Detail
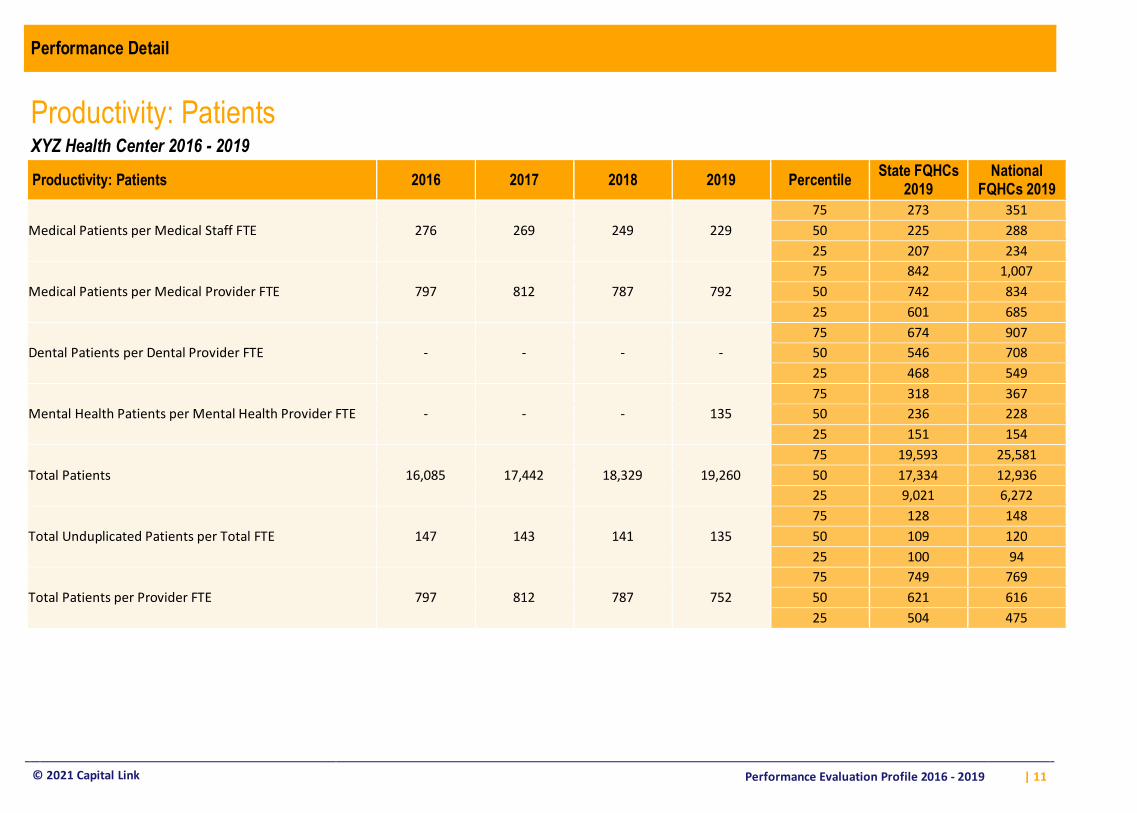
Productivity: Patients
XYZ Health Center 2016 - 2019
Productivity: Patients 2016 2017 2018 2019 Percentile State FQHCs
2019 National
FQHCs 2019 75 273 351 Medical Patients per Medical Staff FTE 276 269 249 229 50 225 288 25 207 234 75 842 1,007 Medical Patients per Medical Provider FTE 797 812 787 792 50 742 834 25 601 685 75 674 907 Dental Patients per Dental Provider FTE - - - - 50 546 708 25 468 549 75 318 367 Mental Health Patients per Mental Health Provider FTE - - - 135 50 236 228 25 151 154 75 19,593 25,581 Total Patients 16,085 17,442 18,329 19,260 50 17,334 12,936 25 9,021 6,272 75 128 148 Total Unduplicated Patients per Total FTE 147 143 141 135 50 109 120 25 100 94 75 749 769 Total Patients per Provider FTE 797 812 787 752 50 621 616 25 504 475
© 2021 Capital Link
Performance Evaluation Profile 2016 - 2019
| 12
Performance Detail
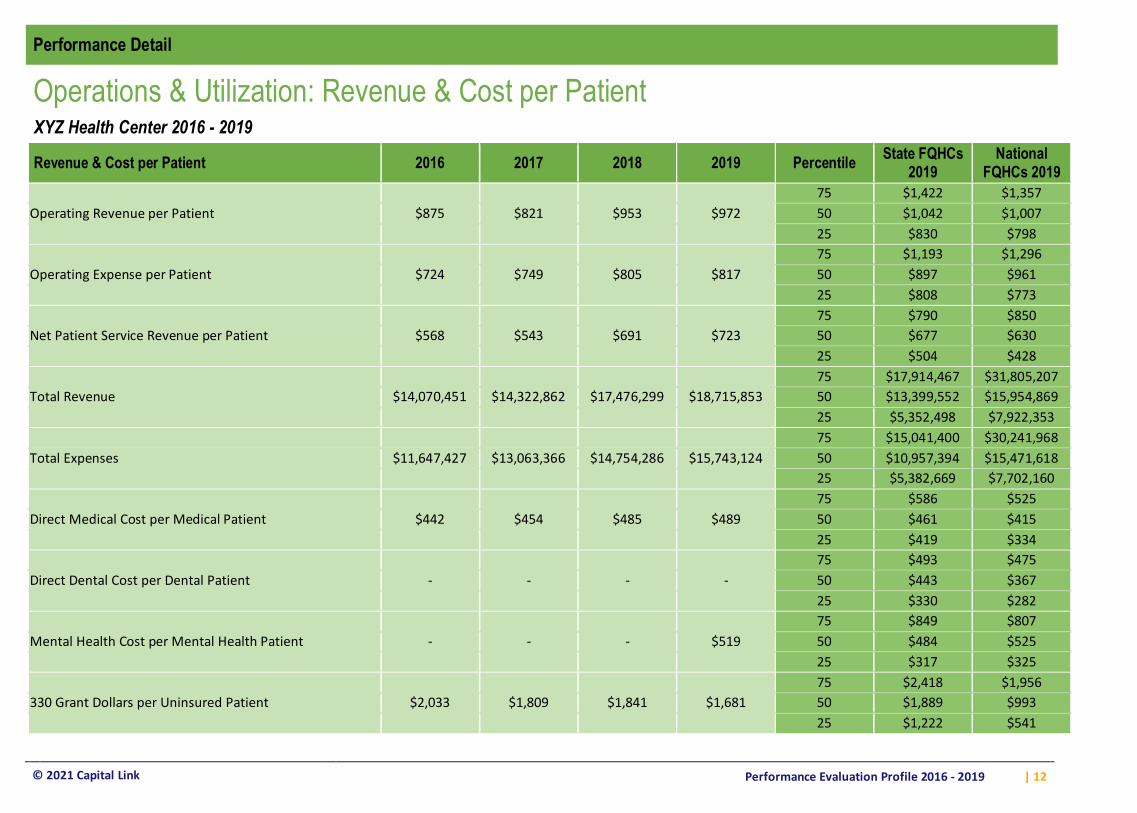
Operations & Utilization: Revenue & Cost per Patient
XYZ Health Center 2016 - 2019
Revenue & Cost per Patient 2016 2017 2018 2019 Percentile State FQHCs
2019 National
FQHCs 2019 75 $1,422 $1,357 Operating Revenue per Patient $875 $821 $953 $972 50 $1,042 $1,007 25 $830 $798 75 $1,193 $1,296 Operating Expense per Patient $724 $749 $805 $817 50 $897 $961 25 $808 $773 75 $790 $850 Net Patient Service Revenue per Patient $568 $543 $691 $723 50 $677 $630 25 $504 $428 75 $17,914,467 $31,805,207 Total Revenue $14,070,451 $14,322,862 $17,476,299 $18,715,853 50 $13,399,552 $15,954,869 25 $5,352,498 $7,922,353 75 $15,041,400 $30,241,968 Total Expenses $11,647,427 $13,063,366 $14,754,286 $15,743,124 50 $10,957,394 $15,471,618 25 $5,382,669 $7,702,160 75 $586 $525 Direct Medical Cost per Medical Patient $442 $454 $485 $489 50 $461 $415 25 $419 $334 75 $493 $475 Direct Dental Cost per Dental Patient - - - - 50 $443 $367 25 $330 $282 75 $849 $807 Mental Health Cost per Mental Health Patient - - - $519 50 $484 $525 25 $317 $325 75 $2,418 $1,956 330 Grant Dollars per Uninsured Patient $2,033 $1,809 $1,841 $1,681 50 $1,889 $993 25 $1,222 $541
© 2021 Capital Link
Performance Evaluation Profile 2016 - 2019
| 13
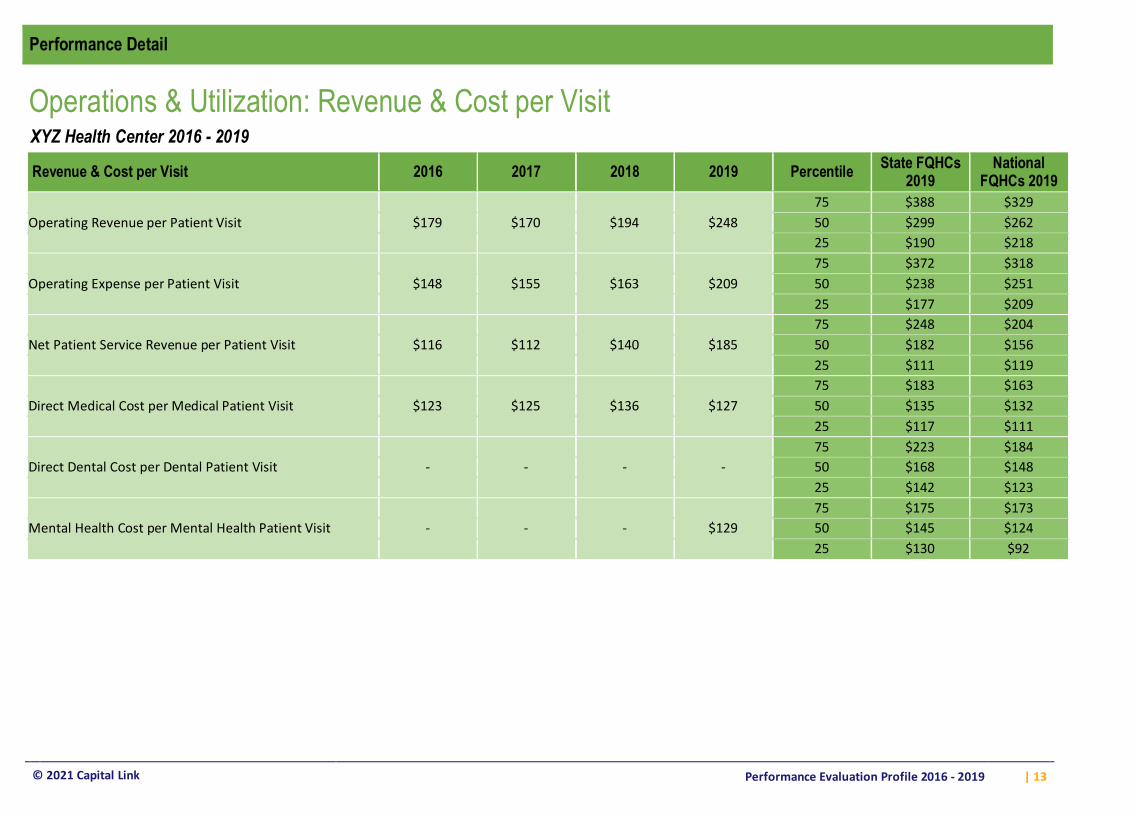
Performance Detail
Operations & Utilization: Revenue & Cost per Visit
XYZ Health Center 2016 - 2019
Revenue & Cost per Visit 2016 2017 2018 2019 Percentile State FQHCs
2019 National
FQHCs 2019 75 $388 $329 Operating Revenue per Patient Visit $179 $170 $194 $248 50 $299 $262 25 $190 $218 75 $372 $318 Operating Expense per Patient Visit $148 $155 $163 $209 50 $238 $251 25 $177 $209 75 $248 $204 Net Patient Service Revenue per Patient Visit $116 $112 $140 $185 50 $182 $156 25 $111 $119 75 $183 $163 Direct Medical Cost per Medical Patient Visit $123 $125 $136 $127 50 $135 $132 25 $117 $111 75 $223 $184 Direct Dental Cost per Dental Patient Visit - - - - 50 $168 $148 25 $142 $123 75 $175 $173 Mental Health Cost per Mental Health Patient Visit - - - $129 50 $145 $124 25 $130 $92
© 2021 Capital Link
Performance Evaluation Profile 2016 - 2019
| 14
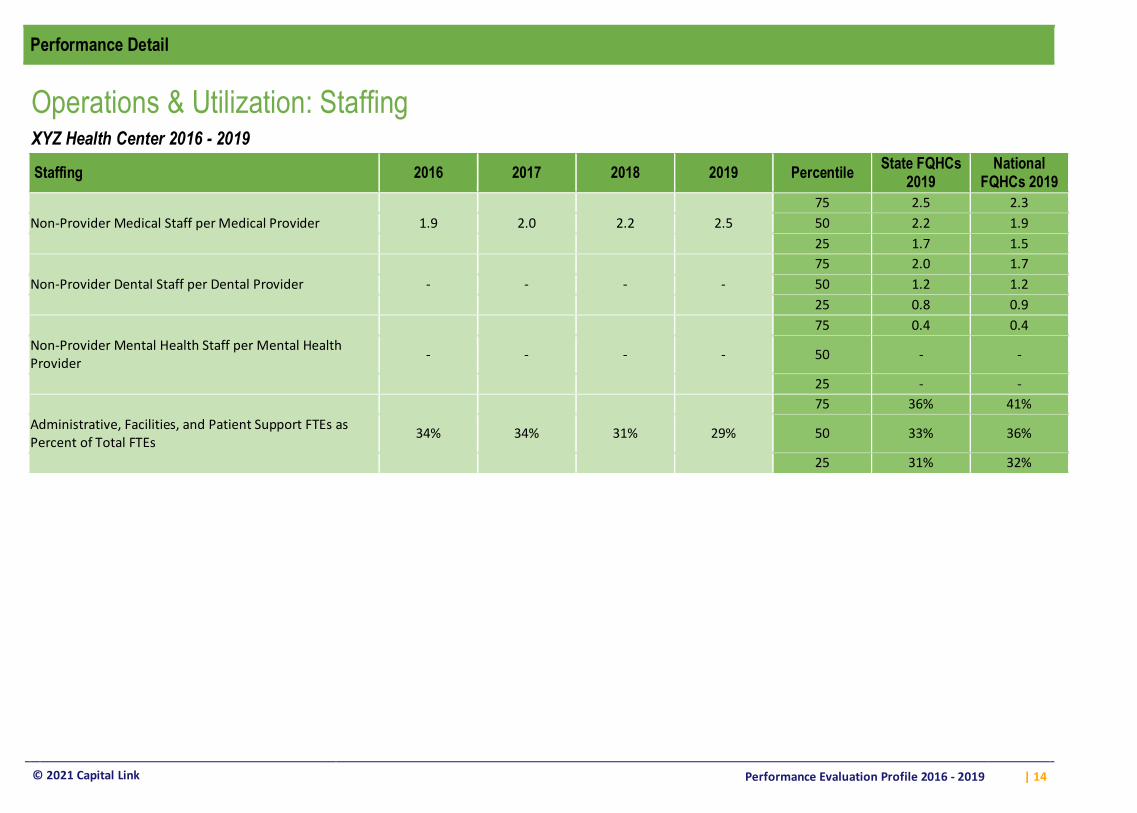
Performance Detail
Operations & Utilization: Staffing
XYZ Health Center 2016 - 2019
Staffing 2016 2017 2018 2019 Percentile State FQHCs
2019 National
FQHCs 2019 75 2.5 2.3 Non-Provider Medical Staff per Medical Provider 1.9 2.0 2.2 2.5 50 2.2 1.9 25 1.7 1.5 75 2.0 1.7 Non-Provider Dental Staff per Dental Provider - - - - 50 1.2 1.2 25 0.8 0.9 75 0.4 0.4 Non-Provider Mental Health Staff per Mental Health Provider - - - - 50 - -
25 - - 75 36% 41% Administrative, Facilities, and Patient Support FTEs as Percent of Total FTEs
34% 34% 31% 29% 50 33% 36%
25 31% 32%
© 2021 Capital Link
Performance Evaluation Profile 2016 - 2019
| 15
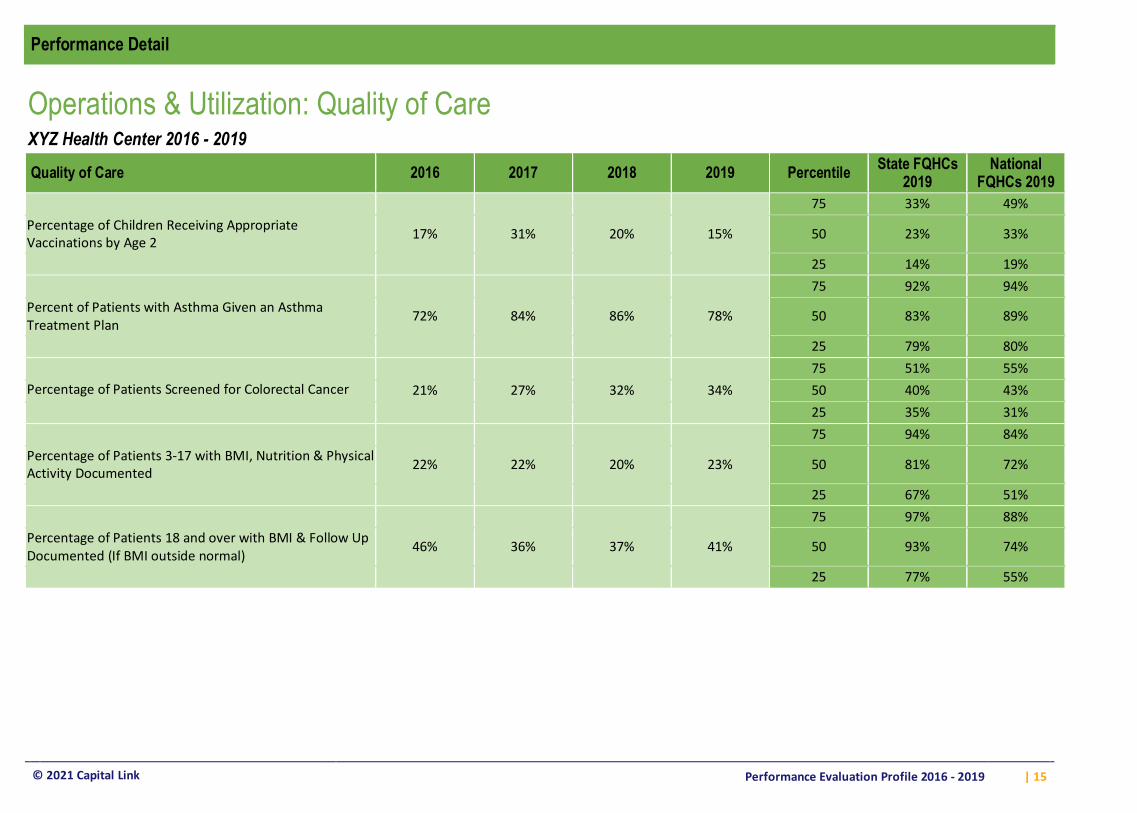
Performance Detail
Operations & Utilization: Quality of Care
XYZ Health Center 2016 - 2019
Quality of Care 2016 2017 2018 2019 Percentile State FQHCs
2019 National
FQHCs 2019 75 33% 49% Percentage of Children Receiving Appropriate Vaccinations by Age 2
17% 31% 20% 15% 50 23% 33%
25 14% 19% 75 92% 94% Percent of Patients with Asthma Given an Asthma Treatment Plan
72% 84% 86% 78% 50 83% 89%
25 79% 80% 75 51% 55% Percentage of Patients Screened for Colorectal Cancer 21% 27% 32% 34% 50 40% 43% 25 35% 31% 75 94% 84% Percentage of Patients 3-17 with BMI, Nutrition & Physical Activity Documented
22% 22% 20% 23% 50 81% 72%
25 67% 51% 75 97% 88% Percentage of Patients 18 and over with BMI & Follow Up Documented (If BMI outside normal)
46% 36% 37% 41% 50 93% 74%
25 77% 55%
© 2021 Capital Link
Performance Evaluation Profile 2016 - 2019
| 16
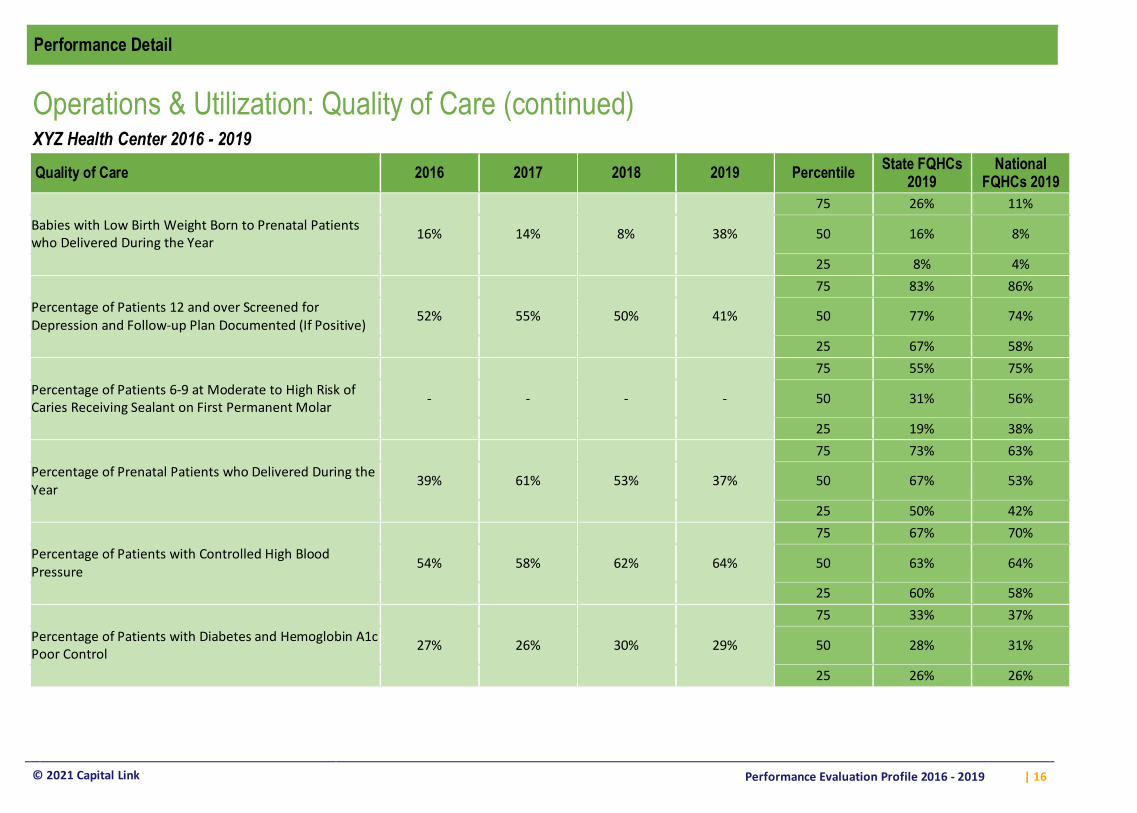
Performance Detail
Operations & Utilization: Quality of Care (continued)
XYZ Health Center 2016 - 2019
Quality of Care 2016 2017 2018 2019 Percentile State FQHCs
2019 National
FQHCs 2019 75 26% 11% Babies with Low Birth Weight Born to Prenatal Patients who Delivered During the Year 16% 14% 8% 38% 50 16% 8%
25 8% 4% 75 83% 86% Percentage of Patients 12 and over Screened for Depression and Follow-up Plan Documented (If Positive)
52% 55% 50% 41% 50 77% 74%
25 67% 58% 75 55% 75% Percentage of Patients 6-9 at Moderate to High Risk of Caries Receiving Sealant on First Permanent Molar - - - - 50 31% 56%
25 19% 38% 75 73% 63% Percentage of Prenatal Patients who Delivered During the Year
39% 61% 53% 37% 50 67% 53%
25 50% 42% 75 67% 70% Percentage of Patients with Controlled High Blood Pressure
54% 58% 62% 64% 50 63% 64%
25 60% 58% 75 33% 37% Percentage of Patients with Diabetes and Hemoglobin A1c Poor Control 27% 26% 30% 29% 50 28% 31%
25 26% 26%
© 2021 Capital Link
Performance Evaluation Profile 2016 - 2019
| 17
Performance Detail
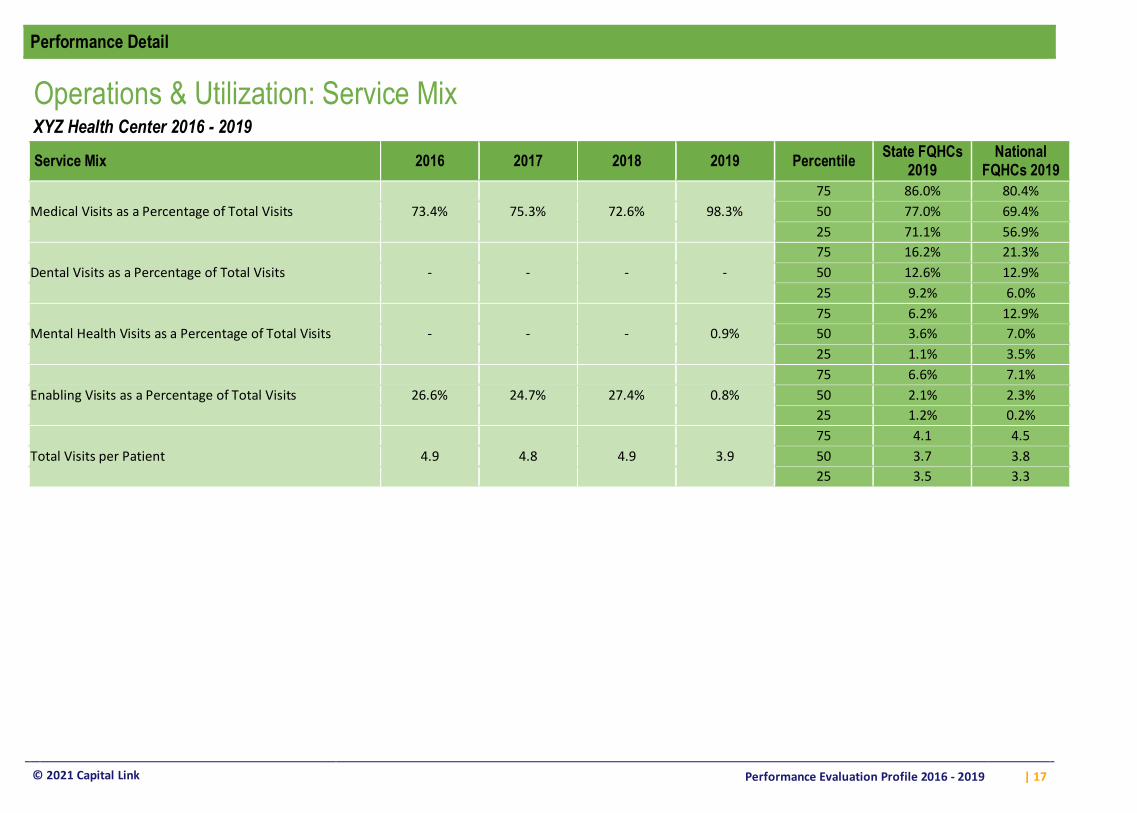
Operations & Utilization: Service Mix
XYZ Health Center 2016 - 2019
Service Mix 2016 2017 2018 2019 Percentile State FQHCs
2019 National
FQHCs 2019 75 86.0% 80.4% Medical Visits as a Percentage of Total Visits 73.4% 75.3% 72.6% 98.3% 50 77.0% 69.4% 25 71.1% 56.9% 75 16.2% 21.3% Dental Visits as a Percentage of Total Visits - - - - 50 12.6% 12.9% 25 9.2% 6.0% 75 6.2% 12.9% Mental Health Visits as a Percentage of Total Visits - - - 0.9% 50 3.6% 7.0% 25 1.1% 3.5% 75 6.6% 7.1% Enabling Visits as a Percentage of Total Visits 26.6% 24.7% 27.4% 0.8% 50 2.1% 2.3% 25 1.2% 0.2% 75 4.1 4.5 Total Visits per Patient 4.9 4.8 4.9 3.9 50 3.7 3.8 25 3.5 3.3
© 2021 Capital Link
Performance Evaluation Profile 2016 - 2019
| 18
Performance Detail
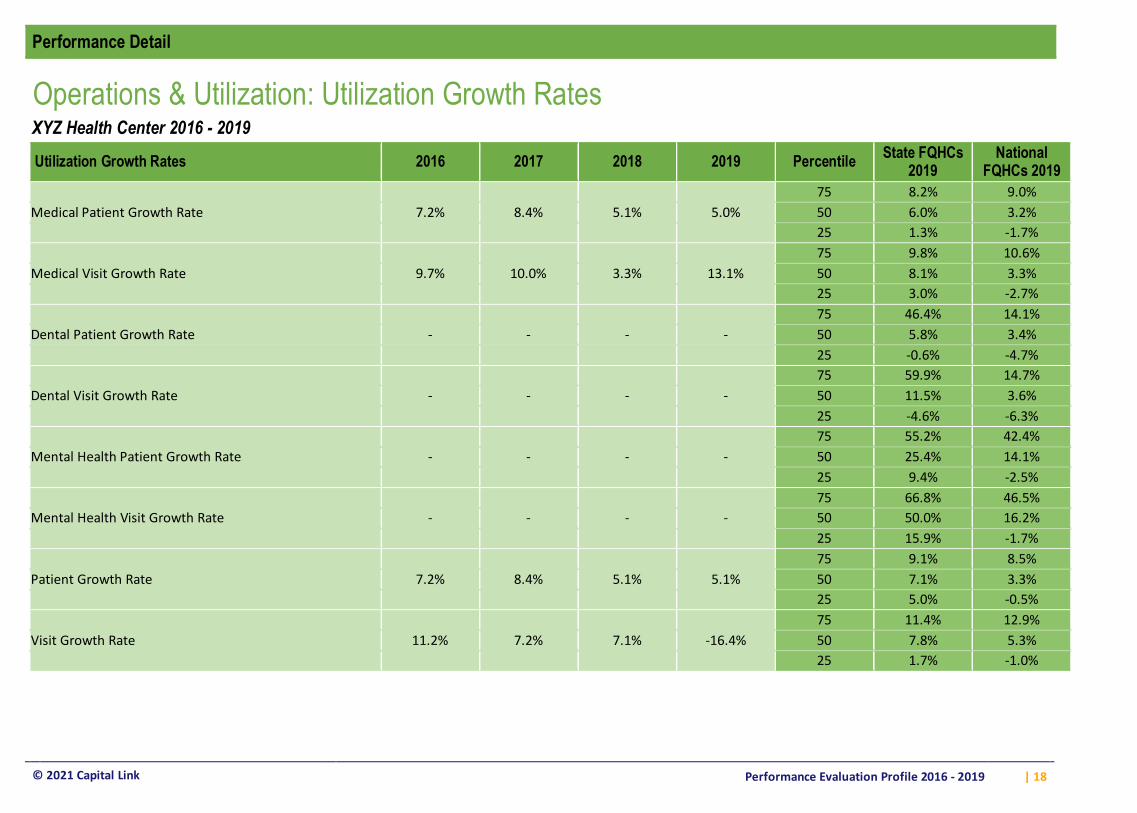
Operations & Utilization: Utilization Growth Rates
XYZ Health Center 2016 - 2019
Utilization Growth Rates 2016 2017 2018 2019 Percentile State FQHCs
2019 National
FQHCs 2019 75 8.2% 9.0% Medical Patient Growth Rate 7.2% 8.4% 5.1% 5.0% 50 6.0% 3.2% 25 1.3% -1.7% 75 9.8% 10.6% Medical Visit Growth Rate 9.7% 10.0% 3.3% 13.1% 50 8.1% 3.3% 25 3.0% -2.7% 75 46.4% 14.1% Dental Patient Growth Rate - - - - 50 5.8% 3.4% 25 -0.6% -4.7% 75 59.9% 14.7% Dental Visit Growth Rate - - - - 50 11.5% 3.6% 25 -4.6% -6.3% 75 55.2% 42.4% Mental Health Patient Growth Rate - - - - 50 25.4% 14.1% 25 9.4% -2.5% 75 66.8% 46.5% Mental Health Visit Growth Rate - - - - 50 50.0% 16.2% 25 15.9% -1.7% 75 9.1% 8.5% Patient Growth Rate 7.2% 8.4% 5.1% 5.1% 50 7.1% 3.3% 25 5.0% -0.5% 75 11.4% 12.9% Visit Growth Rate 11.2% 7.2% 7.1% -16.4% 50 7.8% 5.3% 25 1.7% -1.0%
© 2021 Capital Link
Performance Evaluation Profile 2016 - 2019
| 19
Performance Detail
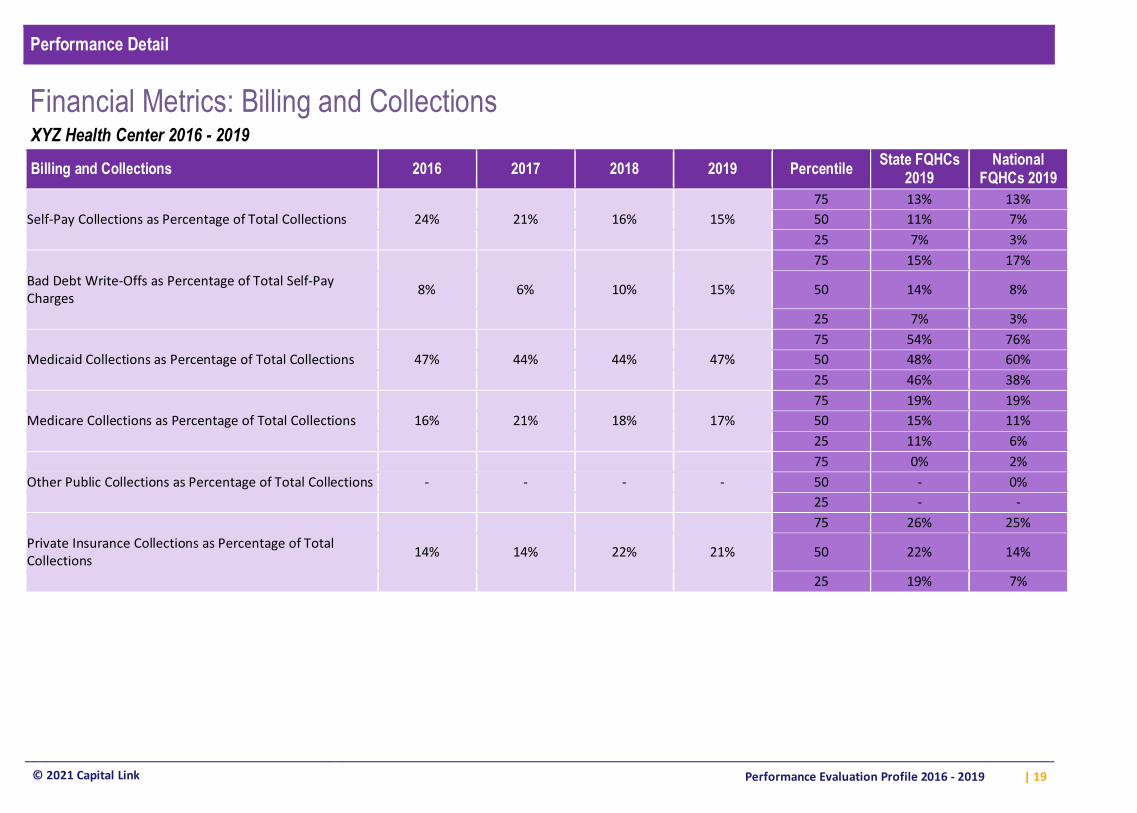
Financial Metrics: Billing and Collections
XYZ Health Center 2016 - 2019
Billing and Collections 2016 2017 2018 2019 Percentile State FQHCs
2019 National
FQHCs 2019 75 13% 13% Self-Pay Collections as Percentage of Total Collections 24% 21% 16% 15% 50 11% 7% 25 7% 3% 75 15% 17% Bad Debt Write-Offs as Percentage of Total Self-Pay Charges
8% 6% 10% 15% 50 14% 8%
25 7% 3% 75 54% 76% Medicaid Collections as Percentage of Total Collections 47% 44% 44% 47% 50 48% 60% 25 46% 38% 75 19% 19% Medicare Collections as Percentage of Total Collections 16% 21% 18% 17% 50 15% 11% 25 11% 6% 75 0% 2% Other Public Collections as Percentage of Total Collections - - - - 50 - 0% 25 - - 75 26% 25% Private Insurance Collections as Percentage of Total Collections
14% 14% 22% 21% 50 22% 14%
25 19% 7%
Related Documents


