(XURVWDW :RUNLQJ3DSHUV % $SULO 0DWHULDO)ORZ$FFRXQWV 0DWHULDOEDODQFHDQG LQGLFDWRUV$XVWULD 3UHSDUHGIRU’*(QYLURQPHQWDQG(XURVWDWE\ 6XVDQQH*HUKROGDQG%ULJLWWH3HWURYLF 6WDWLVWLFV$XVWULD

Welcome message from author
This document is posted to help you gain knowledge. Please leave a comment to let me know what you think about it! Share it to your friends and learn new things together.
Transcript

(XURVWDW:RUNLQJ�3DSHUV
�������%�� ���$SULO�����
0DWHULDO�)ORZ�$FFRXQWV
0DWHULDO�EDODQFH�DQGLQGLFDWRUV��$XVWULD����������
3UHSDUHG�IRU�'*�(QYLURQPHQW�DQG�(XURVWDW�E\�6XVDQQH�*HUKROG�DQG�%ULJLWWH�3HWURYLF
6WDWLVWLFV�$XVWULD

:RUNLQJ�3DSHU�1R���������%�� ���$SULO�����
�0DWHULDO�)ORZ�$FFRXQWV
0DWHULDO�EDODQFH�DQG�UHVRXUFH�XVHLQGLFDWRUV��'0,�DQG�'0&��IRU�$XVWULD
�����������
3UHSDUHG�IRU�'*�(QYLURQPHQW�DQG�(XURVWDW�E\�6XVDQQH�*HUKROG�DQG�%ULJLWWH�3HWURYLF
6WDWLVWLFV�$XVWULD
7KH�YLHZV�H[SUHVVHG�LQ�WKLV�GRFXPHQW�DUH�WKH�DXWKRUV�DQG�GR�QRW�QHFHVVDULO\�UHIOHFW�WKH�RSLQLRQ�RIWKH�(XURSHDQ�&RPPLVVLRQ
&RS\ULJKW��(XURSHDQ�&RPPLVVLRQ�����

3UHIDFH
As part of work to develop environmental accounting linked to national accounts and input-output tables, Eurostat is currently looking at HFRQRP\�ZLGH�PDWHULDO� IORZ� DFFRXQWV� DQGDJJUHJDWH�PDWHULDO�EDODQFHV. These accounts provide aggregate descriptions of the materialflows through economies and allow for the derivation of aggregate indicators of material useand material efficiency when compared to e.g. Gross Domestic Product (GDP). A preliminarybasic layout of economy-wide material balances showing the aggregate indicators that can bederived from such accounts is presented overleaf.
This Working Paper presents the results of work by Statistics Austria on an economy-widematerial balance for 1997 as well as a time series of resource use indicators such as DirectMaterial Inputs (DMI) and Direct Material Consumption (DMC) for 1960-1997. This report isan essential contribution to the development of economy-wide material flow accounts andbalances. Eurostat distributes this report hoping that those wishing to implement economy-wide material flows can benefit from the Austrian experience.
Brian NewsonHead of Unit B1
National accounts methodology,statistics of own resources

(85267$7�'5$)7�6&+(0(�)25�(&2120<�:,'(�0$7(5,$/�%$/$1&(6
(FRQRP\�ZLGH�PDWHULDO�EDODQFH�ZLWK�GHULYHG�LQGLFDWRUV�H[FOXGHV�DLU��ZDWHU�IORZV�
,13876��RULJLQ� 2873876��GHVWLQDWLRQ�'RPHVWLF�H[WUDFWLRQ 'RPHVWLF�SURFHVVHG�RXWSXW�WR�QDWXUHFossil fuels (coal, oil…) (PLVVLRQV�DQG�ZDVWHVMinerals (ores, sand…) Emissions to airBiomass (timber, cereals…) Waste landfilled
Emissions to water,PSRUWV 'LVVLSDWLYH�XVH�RI�SURGXFWV'0,���GLUHFW�PDWHULDO�LQSXWV (Fertiliser, manure, compost, seeds..)
'32���GRPHVWLF�SURFHVVHG�RXWSXW�WR�QDWXUH8QXVHG�GRPHVWLF�H[WUDFWLRQMining/quarrying overburden 'LVSRVDO�RI�XQXVHG�GRPHVWLF�H[WUDFWLRQSoil excavation Mining/quarrying overburdenErosion Soil excavation70,�±�WRWDO�PDWHULDO�LQSXW Erosion
7'2���WRWDO�GRPHVWLF�RXWSXW�WR�QDWXUH+LGGHQ�IORZV1)�LPSRUWHG705���WRWDO�PDWHULDO�UHTXLUHPHQWV ([SRUWV
702�±�WRWDO�PDWHULDO�RXWSXW
1HW�$GGLWLRQV�WR�6WRFN��1$6�1RWH��WHUPLQRORJ\�QRW�\HW�IXOO\�VWDQGDUGLVHG Infrastructures and buildings
Other (machinery, durable goods, etc.)
+LGGHQ�IORZV�H[SRUWHG6RXUFH��(XURVWDW
This account allows derivation of key material use indicators for inputs (DMI, TMI and TMR), outputs(DPO, TDO and TMO) as well as calculation of aggregate material consumption indicators (NAS,DMC and TMC). DMC and TMC are calculated as follows:• '0&��GRPHVWLF�PDWHULDO�FRQVXPSWLRQ��= Domestic extraction + Imports – Exports = DMI -
Exports• 70&��WRWDO�PDWHULDO�FRQVXPSWLRQ��= Domestic extraction (used and unused) + Imports + hidden
flows imported - exports - hidden flows exported
These indicators are linked by accounting identities. For example, TMI (total material input) = TMO +NAS; or NAS = DMC – DPO. It is important to have the indicators in a long time series in order toidentify longer-term trends and isolate changes that are due to economic cycles.
1 Hidden flows (or ecological rucksacks) are a measure of material flows that are ’hidden’ behind the goodsimported or exported. In the exporting country, hidden flows are the total material inputs (i.e. TMI) needed toproduce the goods exported. In the importing country these hidden flows are a measure (as part of TMR) of thematerial flows that its imports induce in the exporting country. Hidden flows do not enter the importing (or leavethe exporting) country. Rather, they are a way of converting the imported inputs of a country into a commonbasis of primary resource extraction, thus indicating the impact on other countries. In some studies the unuseddomestic extraction (e.g. mining overburden) is called ’domestic hidden flows’ to underline that such flows areoften without monetary value and thus not recorded in economic accounts. Standard methodologies forestimating hidden flows (in particular hidden flows exported) are only just developing.


&217(176
Summary.....................................................................................................................................................1
Introduction..................................................................................................................................................1
Methodology................................................................................................................................................2
Data used....................................................................................................................................................2
Results ........................................................................................................................................................3
ANNEX - Material flow account for Austria, 1960 to 1997 ........................................................................12

1
6XPPDU\
7KH�H[WHQW�RI�HQYLURQPHQWDO�GHJUDGDWLRQ�RU�SROOXWLRQ�GHSHQGV�ODUJHO\�RQ�WKH�YROXPHV�RI�PDWHULDOV�WDNHQ�IURPWKH�HQYLURQPHQW�DQG�VXEVHTXHQWO\�UHWXUQHG�WR�LW�LQ�WKH�IRUP�RI�ZDVWH�RU�HPLVVLRQV�� �$Q�HDUOLHU�DUWLFOH� �VHH$QQH[��SUHVHQWLQJ�PDWHULDO�LQSXW�VHULHV�FRQFHQWUDWHG�RQ�WKH�ILUVW�RI�WKHVH�WZR�DVSHFWV��LQ�DQ�DWWHPSW�WR�GHFLGHKRZ�PDWHULDOV�HIILFLHQW�WKH�VRFLRHFRQRPLF�V\VWHP�LV�
7KLV� SDSHU� JRHV� RQH� VWHS� IXUWKHU� DQG� DWWHPSWV� WR� VKRZ� WR� ZKLFK� FDWHJRULHV� RI� XVH� PDWHULDO� IORZV� DUHXOWLPDWHO\� WR�EH�DOORFDWHG�� WR� VKRZ�KRZ�PXFK�JRHV� WR� LQFUHDVH�VWRFNV��KRZ�PXFK� LV� UHWXUQHG� WR�QDWXUH�DVZDVWH�DQG�KRZ�PXFK�LV�UHSURFHVVHG�� �)UHVK�GDWD�KDYH�UHFHQWO\�EHFRPH�DYDLODEOH�IRU�WKLV�NLQG�RI�EDODQFH�DQG�LW�LV�WKHUHIRUH�ZRUWKZKLOH�WR�SXW�SUHYLRXV�ZRUN�RQ�D�ILUPHU�IRRWLQJ�
7KH�VHFRQG�VHFWLRQ�RI�WKH�SDSHU�XVHV�VRPH�RI�WKH�LQGLFDWRUV�GHULYHG�IURP�WKH�PDWHULDO�IORZ�DFFRXQW�WR�WU\�WRVKHG�OLJKW�RQ�WKH�UHODWLRQVKLS�EHWZHHQ�WKH�FRQVXPSWLRQ�RI�PDWHULDOV�DQG�HFRQRPLF�SHUIRUPDQFH��L�H��PDWHULDOSURGXFWLYLW\�� � ,W� HPHUJHV� WKDW� GRPHVWLF� FRQVXPSWLRQ� RI� PDWHULDOV� URVH� E\� ���� EHWZHHQ� ����� DQG� �����ZKHUHDV�*'3�LQFUHDVHG�E\������RYHU�WKH�VDPH�SHULRG��DQG�WKXV�PDWHULDO�SURGXFWLYLW\�URVH�E\�����GXULQJWKRVH�\HDUV���7KLV�DQDO\VLV��GLIIHUHQWLDWHG�WR�VKRZ�LQGLYLGXDO�JURXSV�RI�PDWHULDOV��WKXV�GHPRQVWUDWHV�WKDW�ZLWKPLQHUDO�PDWHULDOV�WKHUH�LV�VWLOO�D�JRRG�GHDO�RI�SRWHQWLDO�IRU�VDYLQJV�WR�EH�PDGH��ZKLOVW�IRVVLO� IXHOV�DUH�QRZXVHG�PXFK�PRUH�HIILFLHQWO\�
,QWURGXFWLRQ
The political objective of sustainable development2) calls for the more sparing use of natural resources, a callprompted by two environmentally-relevant aspects of society’s consumption of materials. On the one hand,there are fears about the future scarcity of resources. If there are no restrictions on their extraction fromnature, supplies for the longer term will inevitably be at risk. It is possible to guard against this danger onlyif mankind is aware of how many renewable and non-renewable resources are being consumed and, on thebasis of this knowledge, uses fewer non-renewable resources in the future, whilst exploiting renewable onesonly to the extent that they can be renewed over the period of use. The second aspect is the fact that the useand extraction of raw materials have in themselves an effect on the environment, through the movement oflarge quantities of materials and the construction of the associated infrastructure, which seals the ground bybuilding on it and destroys the landscape, and through the increased use of transport and the resultingemissions.
Material flow accounts may be considered a good indicator of various types of environmental deteriorationwhich it would otherwise be difficult to measure in qualitative terms. They are sources of information onwhich sustainable development can be based. They are already being produced in various industrialcountries (including Germany, Japan, the USA, the Netherlands and Austria). In Austria, the IFF3) socialecology unit produced the first material flow account for 1988, and a further account produced by the sameinstitute for 1992 was included in the National Environment Plan. The methodology worked out by the IFFwas the basis for all further accounts.
Statistics Austria (“STATISTIK ÖSTERREICH” - formerly Austrian Central Statistical Office), firstproduced material balances in 1998, in cooperation with the IFF, for the reference year 19964). Now,following publication of input series for all three sub-sectors5), material balances for 1997 are appearing, andthese are an improvement on the previous year as regards the use of data.
• The biomass balance has been improved by the use of supply balances for plant and animal products,and thus the output side of plant/animal production has been more fully represented (a broader spectrumcovered and a greater degree of detail).
• New calculation methods for the volume of natural stone and of sand and gravel from the input seriesenable improvements to be made in the mineral balance compared with the previous year, with the
2) Referred to, for example, in Agenda 21, the UN Conference on Environment and Development, Rio de Janeiro 1992.
3) Interdisziplinäres Institut für Forschung und Fortbildung [Institute for Inter-disciplinary Research and Continuing Education]4 ) Statistische Nachrichten, Volume 11/1998, p.939 et seq. Materialflussrechnung Österreich 1996.5 ) Statistische Nachrichten, Volume 2/2000, p.128 et seq. Materialflussrechnung für Österreich 1960-1997.

2
recalculation of the volume extracted producing a lower level which has affected not only the input series butalso the balance items, in particular material accumulation (infrastructure).
• For the first time, only data from ÖSTAT's energy balance were used for the fossil fuels balance.
0HWKRGRORJ\
The whole national economy is shown as a physical input-output system representing societal metabolism.The figure below6) shows in diagrammatic form the relationship between the individual flows of material.
,QSXW (FRQRP\ 2XWSXW
'RPHVWLFH[WUDFWLRQ�• IRVVLO�IXHOV• PLQHUDOV• ELRPDVV
0DWHULDO�DFFXPXODWLRQ�QHW�DGGLWLRQ�WR�VWRFN�
Material throughput�SHU�DQQXP�
7R�QDWXUH�• HPLVVLRQV�WR�DLU• ZDVWH�ODQGILOOHG• HPLVVLRQV�WR�ZDWHU• GLVVLSDWLYH�ORVVHV
,PSRUWV([SRUWV
8QXVHG�GRPHVWLFH[WUDFWLRQ 8QXVHG�GRPHVWLF
H[WUDFWLRQ
Source: EUROSTAT
The input side covers primary extraction and imports. Imports are the mass of raw materials plus semi-manufactures and finished products.7) They are shown in terms of the weight of raw materials and productsas they cross the Austrian national borders, and thus do not include any of the intermediate consumption ofmaterials ("ecological rucksacks"8)) arising when materials are extracted or products are manufactured inother countries. The materials which have entered the socioeconomic system are processed and used eitherto build up stocks (e.g. buildings) or, following consumption, are returned to the environment in some formor other. On the output side are emissions to the atmosphere, waste, dissipative losses (e.g. wear and tear onroads), specific applications (of farm manure, for example), losses during use and exports. All materialflows are measured in millions of tonnes. In line with the conservation of mass principle, input equals outputplus changes in stocks. The reference period is one year. A total balance is aggregated from three partialbalances, or "individual accounts", which show the annual throughput of biomass, minerals and fossil fuels(petroleum, coal and natural gas). These partial balances are in turn all constructed according to the sameplan, namely imports, primary extraction, processing, final consumption and exports. The system boundaryis that of national accounts, and thus flows of materials can be compared with national accounts data.
'DWD�XVHG
The balances were produced for the year 1997. Where only older data were available in a few areas, thefigures were taken over from the previous year, and any missing data were estimated. The following datasources were used to compile the three individual accounts:
6) Taken from a Eurostat B1 paper - National accounts methodology, February 2000.7) Since it was often difficult in practice to differentiate between raw materials and products consisting largely of those raw materials, certain
product groups were included in the representation of material flows for the sake of completion.8) "Ecological Rucksacks" are materials extracted but not used. See Adriaanse et al.: "Stoffströme: Die materielle Basis von
Industriegesellschaften", Wuppertal Institut, Wuppertal 1998, English version "Resource flows: the material basis of industrial economies",World Resources Institute 1997.

3
2IILFLDO�VWDWLVWLFV
� &RDO��SHWUROHXP�DQG�QDWXUDO�JDV���1997 energy balances.
• 0LQHUDO�VXEVWDQFHV��1997 external trade statistics; 1996 and 1997 short-term economic statistics onthe producing industries (production of physical assets); 1990 input-output table; net output values for theproduction of sand and gravel and natural stone by industry, large- and small-scale businesses.
� %LRPDVV��1997 external trade statistics; 1997 agricultural statistics (harvest statistics); 1997 short-term economic statistics (feedingstuffs processed by industry), animal and crop supply balances for 1997;material flow account - input series.
2WKHU�GDWD
� &RDO�� SHWUROHXP� DQG� QDWXUDO� JDV�� Austrian Mining and Steel Handbook [ÖsterreichischesMontanhandbuch] for 1998 (reporting year 1997; blast furnace consumption).
� 0LQHUDO�VXEVWDQFHV��Austrian Mining and Steel Handbook for 1998 (reference year 1997); ÖSTATand the Federal Environment Agency [Umweltbundesamt]: The environment in Austria in 1994, data andtrends; Federal Environment Agency: Federal Waste Management Plan 1998 (reference year 1996).
� %LRPDVV��BMLF: [Federal Ministry of Agriculture and Forestry]: Forest Report, Austria (felling),Federal Environment Agency: Federal Waste Management Plan 1998; Austropapier: Paper from Austria.Monthly magazine of the paper industry 4/1998.
5HVXOWV
,QGLYLGXDO�DFFRXQWV
&RDO��SHWUROHXP�DQG�QDWXUDO�JDV��IRVVLO�IXHOV�
The data for this account are taken mainly from the basic energy balance for 1997 and ÖSTAT's conversionbalances. Starting with inputs (domestic extraction and imports), these three material flows are divided upby processing step (e.g. refineries, coking plants, blast furnaces, production of electricity and heating,petrochemical industry) or final consumption, storage and exports. The output side is also divided intoproducts and emissions (emissions of carbon, hydrogen, nitrogen, oxygen and sulphur into the atmosphere,plus waste and ash).
For 1997, input of fossil fuels totalled just under 29 million tonnes, 88% of which (25 million tonnes) wasimported. Around 33% of input is of crude oil, 21% coal and 25% gases, the remainder being petroleumproducts, plastic and plastic products. Total output amounted to 29 million tonnes, 27 million tonnes of thisbeing emissions. The majority of emissions are of carbon (17 million tonnes) with the remainder dividedbetween nitrogen, hydrogen, oxygen, sulphur and dust. Four million tonnes were exported, the majority ofexports being plastics and plastic goods (2 million tonnes).
4
0LQHUDOV
The minerals for this group are mined (ores, salts, industrial minerals, clay) or quarried (sand, gravel andnatural stone). Since there was a new basic calculation for sand and gravel and for natural stone in the caseof domestic primary extraction, the figures cannot be compared with the previous year’s. The data weretaken from the mineral input series.9) Total input amounted to 109 million tonnes, 82% domestic primaryextraction and the remaining 18% imports. 14 million tonnes, 13% of material throughput, were exported.The vast majority of mineral raw materials remain in the system as additions to stock (82 million tonnes,including the statistical difference). Only some 3 million tonnes are recycled (3% of total mineral output).
%LRPDVV
The use of supply balances of animal and crop products to give biomass is a new departure. Material inputamounted to 54 million tonnes, 72% arising in Austria and 28% imported. Domestic extraction can bedivided into crop production and amounts arising from forestry. For animal production, there is only a verysmall amount from game.10) Imports consist primarily of timber and wood products, food, beverages andtobacco and other products from biotic materials.
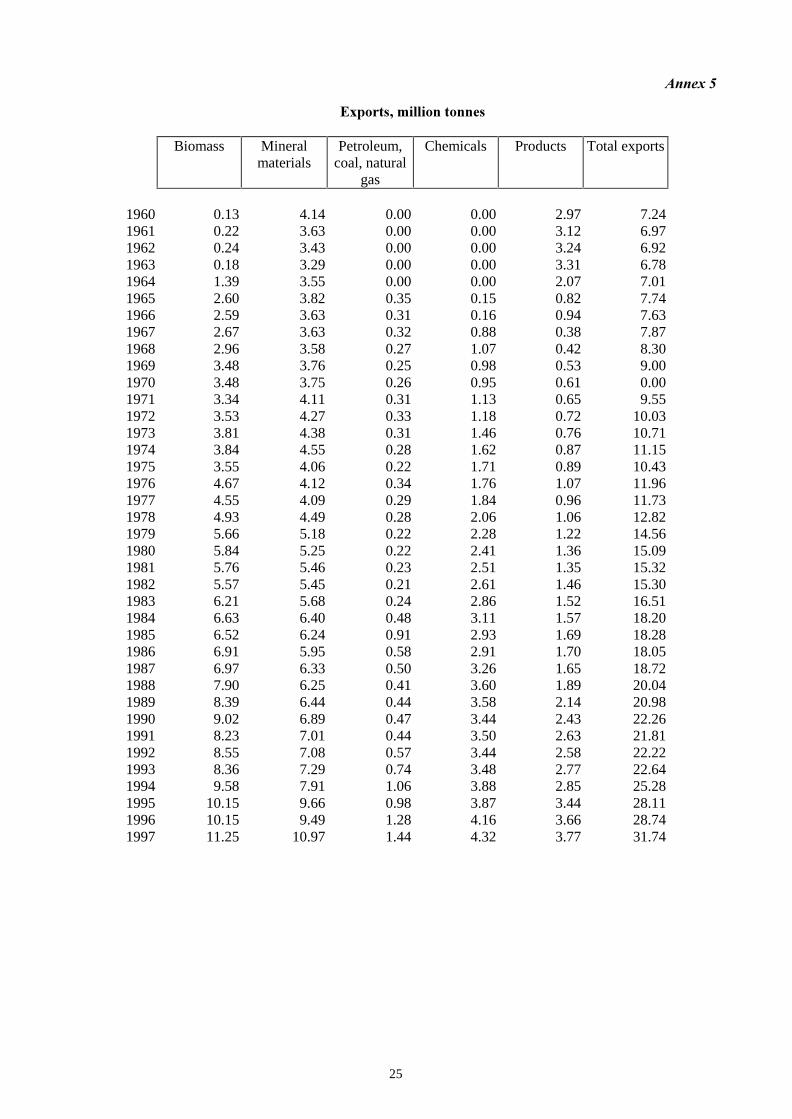
Exports totalled 13 million tonnes, 14% of material throughput. 41% of the exports of biotic materials arewood and wood products, 34% other products, 23% food, beverages and tobacco and the remainderfeedingstuffs.
2YHUDOO�DFFRXQW
For 1997, 29 million tonnes of fossil fuels were extracted, 109 million tonnes of minerals and 54 milliontonnes of biomass. This gives a total input of 191 million tonnes or per capita consumption of 24 tonnes ofmaterial. For the overall account, a comparison is possible with the 1992 results, provided a little caution isexercised: in that year, the total materials input was around 221 million tonnes, or a material throughput ofapproximately 29 tonnes per person per year. This overall comparison shows a clear reduction - around 18%- in total consumption over the past six years. Nevertheless, compared with other countries the consumptionfigures are very high, indicating the extent to which the quality of life in developed economies goes hand-in-hand with a high level of material consumption. Particularly high consumption volumes are associated withthe resource-intensive construction industry, the eating habits of the population and the kind of energy used.
An analysis of up-to-date results also shows that on the inputs side a little over two-thirds of materialthroughput is extracted within Austria. The largest share of imports, namely 42%, is of fossil fuels. 16%, oraround 31 million tonnes, of material input is exported, primarily mineral raw materials, timber and semi-finished and finished products.
Moving on to output flows, we see that around 68 million tonnes of material throughput are returned tonature in the form of emissions and waste. A further 31 million tonnes are "specific applications", i.e. spreadas manure, etc. 87 million tonnes, including 82 million tonnes of minerals, accumulate for the long term inthe form of structures and other fixed assets, thus contributing to an annual net increase in stocks.
Although there is a great deal of publicity nowadays to encourage recycling, at present only a very smallshare of material throughput, 5%, is reprocessed. Considering that roughly half of all waste comes fromconstruction, it is open to question whether the recycling potential of materials is anywhere near exhausted.Only in agriculture are fairly large volumes, namely around 12% of total throughput (farm manure andharvest residues), reutilised.
See graphs 1 – 4 for details.
9) Statistische Nachrichten, Volume 2/2000, p. 128 et seq. Materialflussrechnung für Österreich 1960-1997.10) The output of productive livestock is not primary extraction from nature, since it occurs within the system boundary assumed here.

5
0DWHULDO�IORZ��$XVWULD��������2YHUDOO�DFFRXQW��H[FO��ZDWHU�DQG�DLUData in million tonnes
System boundaryPrimary extraction, Processing, Final demand
Output, Increase in stocks
Domestic extraction 131
Imports 59
Mineral materials 109
Biomass 54
Coal, Petroleum, Natural gas 29
Emissions 32
Waste 25
Spreading 13
Exports 31
Diffuse losses 3
Increase in stocks 87(incl. stat. Difference)
Recycling 11
0DWHULDO�IORZV��$XVWULD��������0LQHUDOData in million tonnes
Excavated earth 20
Processing Final demand
Extracted but notentering theeconomy
Extracted andentering themonetaryeconomy 88,8
Raw materials andproducts 19,8 Imports
Raw materials andproducts 19,8
Ironworks
Stone and ceramicsindustries
Glass industry
Chemical industry
Metalworking industry
Mechanical engineeringand steel constructionConstruction industry
Other industry/business
Other
Recycling 3,2
Emissions ~ 0,04
Spreading of chemical fertilisers, de-icing salts etc. 0,6
Waste (mineral components, including construction wastes) 8,4
Products incl. constructionmaterials 16,2
Households
Stocks
Increase 82,2(incl. stat. difference)
Capital goods,Construction material 76(incl. stat. difference)
Diffuse losses 3,0
Raw materials and products 14,3 Exports
(mining)overburden
Salt 0,5
Ore 2,2
Industrial minerals 2,2
Clay 3,0
Sand and gravel 39,4
Stone for construction 41,4
Domestic architecture, privateinfrastructure 15,7
Tak
ing
out o
f raw
mat
eria
ls o
f min
ing
and
othe
rs

6
0DWHULDO�IORZ��$XVWULD��������%LRPDVVData in million tonnes
Processing Final demand
Forest production 12,9Wood for energy purposes 5,6
Emissions, waste 29,6
Wood and wood products 6,6 12,3
Crop products 8,0
Crop production 26,0 Irrigation ~ 53
Foodstuffs, feedingstuffs and other products 8,3
Raw materials, live animals, products 14,9
Water requirement ~
37
Animal production
Oxygen (respiration) 12
Trade
Sawmills
Wood processing
Product of chemical woodpulp
Paper industry
Foodstuffs industry
Leather industry
Chemical industry
Other industry/business
Foodstuffs and other products 9,4
Final demand1,4
Stocks
(increase 2,6)Milk and products 2,5
Direct marketing 0,2Wood, -products, other products 9,8
Exports 13,0
Foodstuffs, feedingstuffs 3,2
Manure, liquids from silage 29,1
0DWHULDO�IORZ��$XVWULD��������&RDO��SHWUROHXP��QDWXUDO�JDVData in million tonnes
Processing Final demand
Petroleum products
Crude
Plastics, organic chemical products
Coal
Gases
Imports
Crude
Coal
Gases
Mining, extraction of petroleum and natural gas
Refineries
Coking plants
Blast furnaces
Electricity and water supply industries
(+ 7,0 Air)
Petrochemical industry
Industry
Own consumption of electricity and heating supply industries
Services
Agriculture and forestry
Transport
Households
Increase in stocks 0,7(incl. stat.difference)
Exports
Stocks
Carbon in exhaust air 16 7
Other emissions to the atmosphere
Waste and ashes 2,2

7
,QGLFDWRUV�GHULYHG�IURP�WKH�PDWHULDO�IORZ�DFFRXQW
However important the detailed description of the individual input and output flows may be for an accurateanalysis of a country’s material balances, the main requirement is still simple answers to general questionson, for example, the kind and quality of a country’s societal metabolism. For this purpose, indicators in theform of easily understandable and informative parameters are the appropriate data, in the same way as GDPgrowth rates or unemployment rates, for example.
Eurostat has considered how useful indicators11) may be derived from material flow balances. In principle,the starting point could be either the input or the output side of a material balance, since according to theconservation of mass principle the sums of the two sides must be equal. The paper on the input time series11)presented the "Direct Material Input" (DMI) indicator, i.e. domestic extraction plus imports, which shows asimilar growth pattern in Austria to that of gross domestic product - more rapid growth in the 1960s and1970s, with the trend flattening out after that. The indicator thus shows at a glance that up to now only smallefficiency gains have been achieved in the use of natural resources.
The indicator provides more information, however, if exports are deducted from domestic extraction (DMC= domestic material consumption). This indicator shows only the volumes of materials consumed within thecountry, and is therefore not distorted by the often substantial export volumes, as may happen in smallcountries such as Austria, in particular. In general, the indicator is flatter and more suited to internationalcomparisons within the EU, for example.
As the 7DEOH shows, the total material input indicator (DMI) rose 112% over the period 1960 to 1997,whereas the indicator reflecting the domestic consumption of materials (DMC) rose by only 92% �*UDSK���.
Gross domestic product (GDP) in real terms rose much more sharply over the same period (+231%)�� �Thewidening gap between DMI and DMC is driven by the development of imports and exports in physical termswhich increased much faster than GDP over the period (imports by 337% and exports by 339%) �*UDSK��).
Material productivity expressed as DMI in relation to GDP increased by only 56% whereas materialproductivity expressed as DMC per unit of constant GDP shows a 72% increase between 1960 and 1997(Graph 7).
Even more revealing, however, is a breakdown of the total period of almost 40 years into typical economicphases. Thus the period between the late 1960s and around 1980 may be termed a period of particularly higheconomic growth. The oil crisis of 1974/75 interrupted the growth trend briefly and led to a phase in whichgrowth rates were roughly halved. Following the 1981 recession, there was a period of fairly moderateeconomic growth, with recovery beginning only after the 1993 slump. If the pattern of overall materialconsumption is looked at in parallel to these economic phases, the following interesting details emerge:
• During the 1960 to 1975 expansion phase, with an average annual growth rate of 6.2%, materialconsumption increased by 3.6% a year.
• During the following phase, 1975 to 1981, when average annual growth rates (3.2%) were roughlyhalf of their previous levels, material consumption grew at roughly half the rate (1.8% per annum), inother words the change in the material consumption trend matched the change in the economic growthtrend.
• In the following period, 1981 to 1993, when the economy was weaker, average growth rates were2.7% a year in contrast to an increase in material consumption of only 0.4% a year, or an input trendnoticeably below average.
• During the final phase, following the 1993 collapse, GDP growth rates were rather weak at + 2.2% perannum, but the increase in material consumption was roughly the same (+2.0% per annum).
If the material flow is divided up into its three major streams - biomass, minerals and fossil fuels - extremelyinteresting details emerge: there was only slight growth in the consumption of biomass over the period in 11) Eurostat B1 National accounts methodology: Deriving resource use indicators from a material balance, February 2000.11) Statistische Nachrichten,, Volume 2/2000, p.. 128 et seq. Materialflussrechnung für Österreich 1960-1997.

8
question (+8%), which is not surprising, since most of this flow (with the exception of wood) was useddirectly or indirectly as food. Compared with 1960, around 60% more fossil energy is consumed today.This is a much slower increase than the increase in GDP, which indicates that energy has been successfully"delinked" from economic growth . Per head of the population, the consumption of fossil raw materials isaround 63% higher than in the first year taken into account. The largest increase in domestic materialsconsumption was in the minerals group (+182%), where the rise was only 15% slower than the rate at whichthe economy grew in just under 40 years. By the end of the period, per capita consumption (1997: 13.4tonnes a year) was almost three times as high as in 1960 (4.8 tonnes). This is a particularly striking exampleof the overutilisation of natural resources. It is noticeable that the largest volumes of consumption per capitadid not occur when economic growth was at its most dynamic, but in years when the economy was flat. Itwas only in 1975 that the tonnage figures moved into two digits. In the 1990s, the figures rose again, toaverage values of 12 to 13 tonnes per person, although there was no unusually dynamic growth in theeconomy over this period, either. In the case of minerals, therefore, the overall consumption patterndescribed can be seen particularly clearly. If we assume that most mineral material input goes into thebuilding stock, then there is an obvious comparison to be made with the construction industry: whereas theeconomy as a whole - as described above - recovered quickly after the 1975 collapse, real value added in theconstruction industry remained virtually the same for the next ten years (growth rates are the exception andare offset by frequent periods of decline). It was not until the start of the 1990s that a clear upward trendemerged in the construction industry. This explains the pattern of minerals consumption described above.
A further very useful indicator would be one which could be derived from the data on the output side of amaterial balance, namely one showing the material flows returned to nature (DPO = domestic processedoutput to nature). This would be a combination of emissions, waste and dissipative losses. Unfortunately, itis not yet possible to produce information of this kind, since no time series of material balances with outputdata are yet available.

9
7DEOH��,QGLFDWRUV�IURP�PDWHULDO�IORZ�DFFRXQWV����������
2YHUDOO�FKDQJHV���� ���
'0,1960 =100
'0&1960=100
'0,�SHU�FDSLWD��WRQQHV
'0&�SHU�FDSLWD��WRQQHV
Year'0, '0& *'3 Biomass
Mineralmaterials
Fossilfuels
BiomassMineralmaterials
Fossilfuels
BiomassMineralmaterials
Fossilfuels
BiomassMineralmaterials
Fossilfuels
1960 ����� ����� ����� 100.0 100.0 100.0 100.0 100.0 100.0 5.1 5.3 2.1 5.1 4.8 2.1
1961 ���� ���� ����� 93.7 101.6 94.9 93.4 103.3 94.9 4.8 5.4 2.0 4.7 4.9 2.0
1962 ���� ���� ����� 90.9 101.4 97.7 90.6 103.7 97.7 4.6 5.4 2.1 4.6 4.9 2.1
1963 ����� ����� ����� 93.7 107.7 105.8 93.6 111.2 105.8 4.8 5.8 2.2 4.7 5.3 2.2
1964 ����� ����� ����� 99.6 117.9 112.3 96.1 121.9 112.3 5.1 6.3 2.4 4.9 5.8 2.4
1965 ����� ����� ����� 92.9 118.9 118.9 85.9 122.2 116.5 4.7 6.4 2.5 4.4 5.8 2.5
1966 ����� ����� ����� 100.4 120.5 120.8 93.5 124.5 118.7 5.1 6.4 2.6 4.7 5.9 2.5
1967 ����� ����� ����� 101.4 114.2 112.5 94.2 117.5 110.3 5.2 6.1 2.4 4.8 5.6 2.3
1968 ����� ����� ����� 103.1 126.5 119.4 95.2 131.5 117.6 5.2 6.8 2.5 4.8 6.3 2.5
1969 ����� ����� ����� 101.8 136.4 121.7 92.5 142.1 120.0 5.2 7.3 2.6 4.7 6.8 2.5
1970 ����� ����� ����� 105.3 149.4 137.5 95.9 156.7 135.7 5.4 8.0 2.9 4.9 7.5 2.9
1971 ����� ����� ����� 102.0 162.8 136.8 93.0 170.6 134.7 5.2 8.7 2.9 4.7 8.1 2.8
1972 ����� ����� ����� 104.1 178.0 141.9 94.6 187.3 139.6 5.3 9.5 3.0 4.8 8.9 3.0
1973 ����� ����� ����� 108.5 174.6 159.1 98.2 183.2 157.0 5.5 9.3 3.4 5.0 8.7 3.3
1974 ����� ����� ����� 110.2 199.2 155.3 99.8 210.2 153.4 5.6 10.6 3.3 5.1 10.0 3.2
1975 ����� ����� ����� 110.8 192.7 144.1 101.2 204.4 142.7 5.6 10.3 3.0 5.1 9.7 3.0
1976 ����� ����� ����� 111.4 200.7 156.4 98.8 213.2 154.2 5.7 10.7 3.3 5.0 10.1 3.3
1977 ����� ����� ����� 114.3 209.7 148.1 102.0 223.4 146.2 5.8 11.2 3.1 5.2 10.6 3.1
1978 ����� ����� ����� 112.3 205.7 155.9 98.9 217.7 154.0 5.7 11.0 3.3 5.0 10.4 3.3
1979 ����� ����� ����� 116.9 217.6 162.6 101.5 229.1 161.1 5.9 11.6 3.4 5.1 10.9 3.4
1980 ����� ����� ����� 125.1 224.5 161.1 109.2 236.6 159.6 6.4 12.0 3.4 5.5 11.3 3.4
1981 ����� ����� ����� 123.5 220.6 156.0 107.8 231.6 154.4 6.3 11.8 3.3 5.5 11.0 3.3
1982 ����� ����� ����� 132.6 211.7 145.0 117.5 221.6 143.6 6.7 11.3 3.1 6.0 10.5 3.0
1983 ����� ����� ����� 123.1 206.9 136.5 106.1 215.5 134.9 6.3 11.1 2.9 5.4 10.3 2.9
1984 ����� ����� ����� 128.6 214.6 152.4 110.5 222.0 149.2 6.5 11.5 3.2 5.6 10.6 3.2
1985 ����� ����� ����� 133.3 206.6 156.4 115.5 213.5 150.3 6.8 11.0 3.3 5.8 10.2 3.2
1986 ����� ����� ����� 129.5 209.2 154.7 110.6 217.3 150.8 6.6 11.2 3.3 5.6 10.3 3.2
1987 ����� ����� ����� 130.7 210.7 155.1 111.6 217.9 151.8 6.6 11.3 3.3 5.7 10.4 3.2
1988 ����� ����� ����� 135.3 216.7 144.9 113.7 224.9 142.1 6.9 11.6 3.1 5.8 10.7 3.0
1989 ����� ����� ����� 136.1 229.7 146.6 113.0 238.8 143.7 6.9 12.3 3.1 5.7 11.4 3.0
1990 ����� ����� ����� 134.9 234.5 157.1 110.1 242.9 153.9 6.9 12.5 3.3 5.6 11.6 3.3
1991 ����� ����� ����� 128.0 237.4 159.1 105.4 245.8 156.2 6.5 12.7 3.4 5.3 11.7 3.3
1992 ����� ����� ����� 118.3 255.0 155.4 94.7 265.4 151.6 6.0 13.6 3.3 4.8 12.6 3.2
1993 ����� ����� ����� 123.4 252.4 151.7 100.4 261.9 146.7 6.3 13.5 3.2 5.1 12.5 3.1
1994 ����� ����� ����� 133.1 270.5 148.8 106.8 280.3 141.7 6.8 14.5 3.1 5.4 13.3 3.0
1995 ����� ����� ����� 134.6 258.7 157.5 106.7 261.8 150.9 6.8 13.8 3.3 5.4 12.5 3.2
1996 ����� ����� ����� 133.7 257.9 165.7 105.8 261.5 157.1 6.8 13.8 3.5 5.4 12.4 3.3
1997 ����� ����� ����� 139.1 280.1 169.0 108.1 281.9 159.4 7.1 15.0 3.6 5.5 13.4 3.4
DMI: (Direct Material Input) = Domestic extraction + importsDMC: (Domestic Material Consumption) = Domestic extraction + Imports - ExportsGDP: Gross Domestic ProductSource: Statistik Österreich (ÖSTAT)

10
*UDSK����'0,��'0&�DQG�GRPHVWLF�PDWHULDO�H[WUDFWLRQ��LQGH[����� ���
*UDSK����'0,��'0&�DQG�GRPHVWLF�PDWHULDO�H[WUDFWLRQ��LQGH[����� ���
80
100
120
140
160
180
200
220
60 61 62 63 64 65 66 67 68 69 70 71 72 73 74 75 76 77 78 79 80 81 82 83 84 85 86 87 88 89 90 91 92 93 94 95 96 97
DMI
DMC
Domestic material extraction
50
100
150
200
250
300
350
400
450
60 61 62 63 64 65 66 67 68 69 70 71 72 73 74 75 76 77 78 79 80 81 82 83 84 85 86 87 88 89 90 91 92 93 94 95 96 97
Imports
Exports
GDP
DMC

11
*UDSK����0DWHULDO�SURGXFWLYLW\��LQGH[����� ���
100
110
120
130
140
150
160
170
180
60 61 62 63 64 65 66 67 68 69 70 71 72 73 74 75 76 77 78 79 80 81 82 83 84 85 86 87 88 89 90 91 92 93 94 95 96 97
1960=100
DMC material productivity
DMI material productivity

12
$11(;���0DWHULDO�IORZ�DFFRXQW�IRU�$XVWULD�������WR�����
(Translation of an article published in Statistische Nachrichten Nr. 2/2000)
6XPPDU\
7KLV�SDSHU�GLVFXVVHV�RQH�DVSHFW�RI�DQ�H[WHQVLRQ�RI�QDWLRQDO�DFFRXQWV�WR�LQFOXGH�PRUH�HQYLURQPHQW�VWDWLVWLFVLQ�WKH�IRUP�RI�D�VDWHOOLWH�DFFRXQW�RQ��SK\VLFDO�DFFRXQWLQJ���6DWHOOLWH�DFFRXQWV�VHW�RXW�WR�VKRZ�WKH�HIIHFWV�RIVRFLRHFRQRPLF� DFWLYLWLHV� RQ� WKH� HQYLURQPHQW�� XVLQJ� D� IUDPHZRUN� ZKLFK� LV� FRQVLVWHQW� ZLWK� WKH� QDWLRQDODFFRXQWV�EXW�GRHV�QRW�FKDQJH�WKH�DFWXDO�V\VWHP���7KH\�DUH�EHLQJ�SURGXFHG�LQ�UHVSRQVH�WR�WKH�FULWLFLVP�WKDWQDWLRQDO� DFFRXQWV� GR� QRW� DGHTXDWHO\� FRYHU� WKH� QHJDWLYH� H[WHUQDO� HIIHFWV� RI� HFRQRPLF� GHYHORSPHQW�HQYLURQPHQWDO� SROOXWLRQ��� � 7KH� ZKROH� VXEMHFW� RI� WKH� QDWXUDO� UHVRXUFHV� ZKLFK� QDWLRQDO� HFRQRPLHV� H[WUDFWIURP�WKH�HQYLURQPHQW�KDV�DWWUDFWHG�D�JUHDW�GHDO�RI�DWWHQWLRQ�LQ�FRQQHFWLRQ�ZLWK�WKH�GHPDQGV�RI�VXVWDLQDEOHFRQVXPSWLRQ�DQG�VXVWDLQDEOH� HFRQRPLF�EHKDYLRXU�� �7KH�PHWKRGRORJ\� IRU� FRPSXWLQJ�GLUHFW�PDWHULDO� LQSXW�WKH�KHDGOLQH�LQGLFDWRU��ZLOO�EH�SUHVHQWHG�DQG�WKH�LQGLFDWRU�FDOFXODWHG�IRU�WKH�SHULRG������WR��������7KLV�ZLOOEH�WKH�ILUVW�SXEOLFDWLRQ�RI�FRPSUHKHQVLYH�GDWD�RQ�WKH�XVH�RI�PDWHULDOV�LQ�$XVWULD��DV�D�WLPH�VHULHV�LQ�RIILFLDOVWDWLVWLFV�
,QWURGXFWLRQ
Material flow accounts are one of the key areas of ecological accounting. They are produced as a satellitenational account illustrating physical exchange processes involving society and nature or various nationaleconomies. They provide evidence of the quantities of material needed to underpin a national economy.
The present work concentrates on the input side of the material flows "mobilised" by socioeconomicprocesses, flows which are depicted in a time series for the period 1960 to 1997. Annual material input is thefirst parameter for the environmental pollution caused by society.
The groundwork was already in place. As long ago as 1994, the Institut für Interdisziplinäre Forschung undFortbildung (IFF) - Soziale Ökologie calculated a time series12) for the Austrian economy's material inputbetween 1970 and 1990. The methodology and time scale were subsequently13) extended (1960 - 1995), anda further development of the methodology made it possible to carry out a plausibility test on the input sidefor the input-output balance.14)
The Statistics Austria also has a long history of physical accounting, producing a whole series of materialflow accounts15). In 1998, the 1996 material balance for Austria was incorporated into official statistics16).The current project, aiming as it does to link statistical with scientific know-how, ties in with internationalprojects. The German Federal Statistical Office produced a material input time series - for the old Länder -as long ago as 199417). In 1997, the World Resources Institute produced a report on material input over timein four industrial countries (Germany, the Netherlands, Japan and USA) for the period 1995 to 1995.18)
0HWKRGRORJ\
We began with the idea that national accounts are input-output systems which metabolise with nature andwith other national economies. This economic (or societal) metabolism enables national economies toorganise their exchanges of materials and energy with nature. Materials are extracted from nature,
12 ) A. Steurer, 1994. Stoffstrombilanz Österreich 1970 – 1990. "Soziale Ökologie" series, volume 34, Vienna: IFF own publication.13 ) H. Schandl, 1997. Materialfluss Österreich. Die materielle Basis der österreichischen Gesellschaft im Zeitraum 1960 bis 1995.
"Soziale Ökologie" series, volume 50, Vienna: IFF own publication.14 ) H. Weisz, H. Schandl and M. Fischer-Kowalski 1999. OMEN – An Operating Matrix for Material Interrelations Between the
Economy and Nature. How to Make Material Balances Consistent. In: R. Kleijn, S. Bringezu, M. Fischer-Kowalski and V. Palm, ed.Ecologizing Societal Metabolism: Designing Scenarios for Sustainable Materials Management. CML Report 148. Leiden:University Papers, pp. 160-165.
15 ) S. Gerhold. Several contributions to this periodical since 1990.16 ) M.E. Wolf, B. Petrovic and H. Payer, 1998. Materialflußrechnung Österreich 1996. (Volume 11/1998), p. 939 ff.17) Kuhn, Radermacher and Stahmer.18) A. Adriaanse, S. Bringezu, A. Hammond, Y. Moriguchi, E. Rodenburg, D. Rogich and H. Schütz 1997. Resource Flows: The
Material Basis of Industrial Economies. Washington: WRI.

13
processed, stockpiled in society (in the form of buildings, roads, vehicles and consumer durables) and finally,at the end of the chain, returned to nature in the form of waste and emissions. The metabolism of materials isa sweeping illustration of current environmental problems. The main topics of the environmental debate -waste and emissions - are but one minor aspect of what lies behind the annual flow of materials19).
A material flow account is a concrete expression of the idea of societal metabolism, quantifying the materialsused, changes in stocks of materials and materials returned to nature. The accounts cover one-year periods.When a national materials balance is to be compiled, it is important first of all to delimit the boundaries ofthe system to be balanced, to draw the dividing lines between the national economy (society) and nature aswell as between the national economy in question and other national economies. To this end, a distinction ismade between the extraction of materials from nature on the country’s own territory and external relationswith other economies.20)
Work on the material input time series focuses on three key criteria: the account must be theoretically sound,relevant to the policies in question and technically feasible. What do these criteria mean, exactly?• The theoretical soundness criterion means that we must have a clear idea of the system boundaries (in
time and space) of the social unit to be investigated (in this case the Austrian national economy), of thecomponents of the system and of the difference between stocks and flows of materials (see above) andthat, for complete balancing, the conservation of mass principle must be observed.
• The policy-relevance criterion means that the account must be compatible with other reporting systems.In particular, it needs to be based closely on national accounts, so that material indicators may becompared with monetary ones. The times series for material input must also be usable as a generalsource of information for integrated environmental policies. A further criterion is that links must bepossible with other environmental information systems.
• The feasibility criterion refers to the possibilities offered and limitations imposed by the available datawhen it comes to a top-down account. It must be possible to compile a material input times seriesannually and reasonably quickly from statistics which appear regularly.
The present time series covers the input side of the materials balance for Austria, representing it in the formof quantities of materials used each year. The use of water and air was not covered. The account coversmaterials (other than water and air) which are either extracted from nature in Austria or imported from othereconomies. Thus the system boundary for the balance on the input side is described, a functional boundarybetween the Austrian economy and nature or between the Austrian economy and other national economies.
The annual material input is split into biomass, mineral materials, fossil materials and products. Thesehighly aggregated groups of materials are compiled using a top-down approach, on the basis of existing andregularly available statistical data sources. The core data for the input side of the materials balance areagricultural statistics, mining statistics, certain components of industrial and commercial statistics andexternal trade statistics. Annual material input is calculated in line with the logic and criteria of nationalaccounts, care being taken to ensure compatibility. This leads to problems in those areas where materialflows which are not valued - or not fully valued - in economic terms are important from the point of view ofvolumes used, such as mineral raw materials in bulk or biomass which is grazed.
In such cases, we had to fall back on plausible estimates or secondary statistics, although we kept to the basicprinciple that the data sources used for the estimates must be available for several years at least. Thus theinput-output table, for example21), which is available for three years (1976, 1983 and 1990), was suitable fora plausibility check on the partial aggregates in the times series. We did not use special studies for the timesseries if they had a single year reference year. The series presented here shows direct annual material input
19
) See on this subject the ideas of Jänicke 1995. Tragfähige Entwicklung: Anforderungen an die Umweltberichterstattung aus Sichtder Politikanalyse. In: S. Bringezu, ed: Neue Ansätze der Umweltstatistik. Ein Wuppertaler Werkstattgespräch. Berlin, Basel,Boston: Birkhäuser. pp. 9-25.
20) A material flow account could also be produced for a region, an economic sector or an individual business. The starting point in
this case, too, would be a definition of the system to be balanced and its boundaries.21) %HLWUlJH�]XU�6WDWLVWLN „Input-Output-Tabelle 1990. Güter und Produktionskonten“; „ Input-Output-Tabelle 1983. Güter und
Produktionskonten“, two volumes ´Input-Output-Tabelle 1976. Güter und Produktionskonten“, two volumes. The input-output tablecontains the monetary equivalents of physical production in ATS million.

14
and ignores the "ecological rucksacks“22) - meaning, where the extraction of raw materials is concerned,those quantities of materials which are "mobilised" in connection with direct material input but are not, in theend, used, such as the overburden from mining or the excavation of soil.
%DVLF�GDWD�DQG�FDOFXODWLRQ�PHWKRGV
The following section discusses the basic data and methods used to calculate the extraction of materials inAustria, divided into main aggregates: biomass, mineral materials and fossil materials, followed by materialimports/exports.
%LRPDVV
$JULFXOWXUDO�KDUYHVW
Coverage of the harvest is based on ÖSTAT's agricultural report, which collects figures on quantitiesharvested each year. As Austria had to adjust EU statistics after joining the European Union, the coverage ofvegetables and fruit has been much more detailed since 1994. Since 1983, there have been sharp falls inalmost all groups (with the exception of cereals), but the reasons have varied: changes in the weather or inareas under cultivation may have been responsible. In the longer term, the quantities harvested depend on theutilisation of the land and productivity per hectare.23)
Figures were collected for the harvests of the following crops:
• &HUHDOV� This group includes winter wheat (from 1995 common wheat), spring wheat (from 1995durum wheat), winter rye (and spring rye from 1990), spring rye (up to 1989), winter barley, springbarley, winter meslin, summer meslin, buckwheat (up to 1967), triticale (from 1995), oats and grain-maize. The cereals harvest as recorded in the statistics increased by 123.2% during the period underobservation. Up to 1995, the straw harvest was also recorded separately for all kinds of cereal, but since1996 this has not been the case. Prior to 1996, figures for straw covered the following kinds of cereal:winter wheat, spring wheat, winter rye (and spring rye), spring rye, winter barley, spring barley, wintermeslin, summer meslin, triticale and oats. No explanation could be found for the sharp drop in the timesseries in 1995/1996 (-18.4%).
• 5RRW�FURSV��These include potatoes, sugarbeet, fodder beet, swede, fodder carrots and other root crops(up to 1965). Quantities harvested in Austria declined by 55.1%.
• 9HJHWDEOHV��These include kidney beans (up to 1974 and from 1995), cos lettuce (from 1995), Brusselssprouts (from 1995), garlic (from 1995), horse radish (from 1995), radish (from 1995), leek (from1995), iceberg lettuce (from 1994), endive (from 1994), frisee (from 1994), lollo rosso (from 1994),radicchio (from 1994), zucchini (from 1995), lambs lettuce (from 1995), green leaf chicory (from 1995),celery (from 1995), sweet corn (from 1995), lentils (up to 1961), millet (up to 1974), garden peas (up to1974), broccoli (from 1995), cauliflower (from 1995), Chinese cabbage (from 1964), cabbage, spinach(from 1987), carrots, red beet (from 1987), gherkins, asparagus (from 1995), parsley (root and leaves)(from 1967 to 1975 and from 1995), radishes (up to 1975, from 1995), Savoy cabbage (up to 1975, from1995), kohlrabi (up to 1975, from 1995), head lettuce, onions, green peas, French beans, tomatoes andpaprika (including pepperoni). As already mentioned, there has been a considerable improvement in thedegree of detail of the vegetable survey since Austria joined the EU. Many of these kinds were grownin previous years, but were lumped together under combined headings in the old classification. Since1960, there has been a 93.1% rise.
• 2WKHU� FURSV�� �This category comprises horse beans (from 1986, up to 1994), oil squash (fruit withseeds), oil squash (dried seeds), winter rape for oil, sunflowers for oil (seeds), sunflowers, chicons,
22) Schmidt-Bleek, Friedrich (1994): Wie viel Umwelt braucht der Mensch? MIPS – das Maß für ökologisches Wirtschaften. Berlin,
Basel, Boston: Birkhäuser. As well as the "ecological rucksack" for raw materials, there is an "ecological rucksack" of productswhich includes the whole intermediate consumption of materials chain.
23) See Krausmann, F. 2000. Rekonstruktion der Entwicklung von Materialflüssen im Zuge der Industrialisierung: Veränderungen im
sozioökonomischen Biomassemetabolismus in Österreich 1830 bis 1998. Final report of a study commissioned by the BreuningerStiftung. Vienna.

15
hops, tobacco, soya beans (from 1990) and poppy. Here, there was a 122.3% increase during the periodunder consideration.
• )RGGHU�FURSV��These include field beans (up to 1972, from 1987), feed peas (from 1986), green maize,pulse mixes, foxtail millet/common millet and bird rape (up to 1975) (and summer rape from 1990).Grain maize made up the largest share in this category, and the group as a whole showed an increase of166.5%.
• &DWFK� FURSV�� These are buckwheat for seed, turnips (all kinds), summer fodder mix, fodder rape,sunflowers and maize for fodder, foxtail millet and other field crops. This category saw a 35.8%increase.
• &ORYHU� DQG�KD\��These include: red clover and other clover hay varieties, alfalfa hay, other clover,clover/grass hay, hay from ley grass farming, hay from meadows mown only once, hay from meadowsmown two or three times, mountain meadows (up to 1972) and hay from litter meadows. Cultivation ofthese crops remained relatively stable over the period under consideration, with a negligible drop of0.7% overall.
• )UXLW��this covers summer apples, winter apples, cider apples, summer pears, winter pears, cider pears,cherries, sour cherries, damsons, greengages, cultivated plums, mirabelles, apricots, peaches, walnuts,pine strawberries, red and white currants, blackcurrants and gooseberries. During the period as a whole,43.8% less fruit was harvested, but between 1990 and 1997, there was 27.8% growth.
• :LQH� Overall, the wine harvest increased by 100.9% during the period under consideration.
• :RRG�KDUYHVW� In Austria, most of the wood harvested is covered in the annual statistics of the FederalMinistry of Agriculture and Forestry (felling statistics). Detailed studies, which include more accuratecalculations and correct errors, in particular underestimates in the felling statistics, are available fromthe Bundesholzwirtschaftsrat [Federal Council for the Timber Industry] (Holzkurier No 48/1980) for1926 to 1978, and from ÖSTAT for 1983 and 1988 to 1995.24) For years 1960 to 1978, wood input wascalculated from Bundesholzwirtschaftsrat data (Holzkurier No 48/1980). The following headings wereaggregated: total commercial timber and firewood from forest land, merchantable timber (coniferousand broadleaf) from non-forest land, from non-commercial kinds of wood and seedlings/saplings,together with merchantable firewood (coniferous and broadleaf) from non-forest land and from non-commercial kinds of wood, seedlings/saplings and branches. For 1983 and 1988 to 1995, the followingheadings from the ÖSTAT wood balance were aggregated: timber felled, other timber from forest landand other timber, and "reprocessed timber" was subtracted. For the remaining years, for which no woodbalance was available, the additional estimates were calculated analogous to those from the woodbalances for 1978 and 1983.
The unit in which the volumes of wood are shown is the cubic metre. These were converted to tonnes andstandardised at 14% water content. Since different species of wood have different specific weights, aweighted average appropriate for the composition of the Austrian forests was taken as the conversion factor(see Table 1).
24
) Gerhold, S. 1992. Stoffstromrechnung: Holzbilanz 1955-1991. Volume 8/1992, p. 651 ff.

16
7DEOH����:RRG�FRQYHUVLRQ�IDFWRUV
Species Percentageproductivewoodland
Dryweight percubic meter ofsolid timber
[kg/Vfm]
Picea abies/spruce ���� 430Abies alba/fir ��� 410Larix decidua/larch ��� 550Pinus/pine ��� 535Other coniferous wood ��� 435Fagus sylvatica/beech ��� 680Quercus/oak ��� 680Other hard wood ��� 680Softwood ��� 490Other/shrubs ��� 490Weighted average 4876RXUFH��+DEHUO�������6SHFLHV�FRPSRVLWLRQ�RI�$XVWULDQ��IRUHVWV�DFFRUGLQJ�WR�WKH�IRUHVW�LQYHQWRU\����������GU\ZHLJKW�SHU�9IPDFFRUGLQJ�WR�g1250�������FDORULILF�YDOXH�DFFRUGLQJ�WR�/LHWK������
• (VWLPDWH�RI�JUHHQ�IRGGHU�(biomass input through grazing): The volume of biomass which is grazed offwhen animals eat roughage is not regularly documented in the statistics. In soil use statistics, three typesof grazing are shown, by area: rough grazing, grazing on artificial pastures and grazing on alpinepastures. Green fodder was calculated as the net yield per hectare for rough grazing and grazing onartificial pastures.25). For alpine pastures, green fodder intake was calculated on the basis of the numberof livestock units grazed on alpine pastures per year (alpine pasture survey), the average period ofgrazing and the average dry matter per livestock unit per day.26) The period of mountain grazing varieswith the height of the pastures. Various studies27) suggest an average of ten days.
• +RQH\��JDPH�DQG�ILVK�� These three areas were not surveyed until 1992 (supply balances of crop/animalproducts). Since the volumes involved are very small, they have little effect on the overall picture ofmaterial input.
0LQHUDO�PDWHULDOV
These are aggregates of ore, salt, industrial minerals, clay, natural stone, sand and gravel.
• 2UH� The data source is the Austrian 0RQWDQKDQGEXFK� [Mining Manual]. Of the seven ores at the startof the period (iron ore with micaceous iron oxide, tungsten ore, lead and zinc ores, copper ore, antimonyore and bauxite), there were only two left by 1997, namely iron ore with micaceous iron oxide andtungsten ore. Tungsten ore mining ceased in 1971 and restarted in 1974 in a new area. The samehappened in 1993 (closure) and 1994 (reopening in a new area). In 1994, the mining of lead and zincores ceased. Copper ore was mined until 1976. In 1991, the antimony ore works were closed. Themining of bauxite ceased in mid-1964. During the period 1960/97, the extraction of ore in Austria fellby 44%.
• 6DOW� The source used was the primary production of evaporated salt, as recorded in industrialproduction statistics. This series has been in existence since 1977. Years 1960 to 1976 wereextrapolated back using an appropriate factor (industrial salt-rocksalt/brine). Overall, there was a111.5% increase.
• ,QGXVWULDO�PLQHUDOV: The source for these values is the Austrian 0RQWDQKDQGEXFK. The group includesgypsum, anhydrite, barytes, graphite, oil shale, talc, kaolin, magnesite, feldspar, diatomite, trass and
25) Schechtner 1963, quoted in Hohenecker 1980. Ernährungswirtschaftsplanung für Krisenzeiten in Österreich. Vierter Teilbericht:
Futtermittelbilanzen für Österreich. Universität für Bodenkultur. Vienna. Buchgraber, Karl (1998): Nutzung und Konservierung desGründlandfutters im österreichischen Alpenraum. Publications of the Bundesanstalt für Alpenländische Landwirtschaft,Gumpenstein, Volume 31. Irdning. Schlechter's 1963 values were used for 1959. The Buchgrabner 1998 values were used foryears 1986 onwards. Between 1959 and 1986, the yield per hectare was interpolated linearly.
26 ) According to Hohenecker (1980) we can assume a daily intake of dry matter per livestock unit of 10kt (grass and herbage).27 ) Hohenecker 1980, Brugger and Wohlfahrter 1983. Alp Wirtschaft Heute. Graz, Stuttgart: Leopold Stocker Verlag.

17
sulphur (extracted). No barytes has been extracted since 1981, and no diatomite since 1979. Overall, a22.5% drop was recorded for this group during the period under consideration.
• &OD\V� This group consists of clay, illite clay and bentonite. The rise in quantities recorded was not agenuine increase, but was due to the increase in the number of workings to be inspected as a result of the1990 %HUJJHVHW]QRYHOOH [Mining Act Amendment]. To correct for this, the data for 1960 to 1990 weregrossed up using annual rates of change in the output of the tile industry (where clay is the main rawmaterial). Since 1991, the sub-aggregates clay and illite clay have been covered. No bentonite has beenmined since 1969. During the period under consideration, there was a 2.6% drop in clay extracted.
• 1DWXUDO�VWRQH� In this area, too, the %HUJJHVHW]QRYHOOH led to breaks in the data series. As from 1991,dolomite, quartz and quartzite, basaltic rocks, limestone, marble and marl have been lumped together asnatural stone. This aggregate includes both stone used as a raw material in the building industry (in theform of rough blocks or crushed or broken stone) and stone used as the basic product for industry. Acomparison of values from the 0RQWDQKDQGEXFK and the volume of output for the two-digit heading 271(quarrying of natural stone) from the 1990 input/output table confirms that from 1991 the values givenin the 0RQWDQKDQGEXFK can be used. The series for 1960 to 1990 was calculated from the quantities ofnatural stone quarried (crushed and broken stone and preliminary screening material) in industry andlarge-scale businesses. These values, however, include neither the output of small-scale businesses northe output of "competitors"28). In order to remedy this statistical under-reporting, key figures from the1976, 1983 and 1990 input/output tables were used. On the basis of knowledge of the ratios of outputvolumes in industry and large-scale businesses to small-scale businesses and "competitors", total outputvolume was grossed up linearly from the output of industry and large-scale businesses for whichinformation was available. The increase in the quarrying of natural stone, including cement andlimestone raw materials, was 234.9%.
• 6DQG� DQG� JUDYHO� Sand and gravel form the most sensitive area where data are concerned. Outputvolumes in industry and large-scale business are known but small-scale businesses are not known, eventhough they account for a large share of the quantities quarried. The 0RQWDQKDQGEXFK, which isotherwise a reliable source of data, does not provide any useful information in this field. By convertingoutput in monetary terms from the input/output tables, we can calculate total output volumes for threeyears, 1976, 1983 and 1990. In contrast to natural stone, however, the result of this conversion isimplausible, namely a clear drop in output volumes between 1976 and 1990, a trend for which we couldfind no firm evidence, and so for the calculation of the times series, the output of small-scale businessesand "competitors" (from the 1990 input/output table) was grossed up to the volumes for industry andlarge-scale business output, which were known. With this input series, an increase of 277.3% wasobserved.
)RVVLO�PDWHULDOV
Figures for the extraction of coal, petroleum and natural gas are based on the values in the Austrian0RQWDQKDQGEXFK.• &RDO� In years 1960 to 1967 and 1990 to 1995, both hard coal and brown coal were mined, and in other
years only brown coal. Over the period under consideration, coal extraction fell by 81.5%.• 3HWUROHXP���There was a 60.3% decline in the production of petroleum.
• 1DWXUDO�JDV��Between 1960 and 1997, output of natural gas fell by 2.8%.
([WHUQDO�WUDGH
Imports are the second important component in the calculation of material input. In this case, we are able touse the very detailed, reliable basic data from external trade statistics, which are available for every yearfrom 1947. For the whole period under consideration, data are broken down into three groups of materials(biomass, mineral materials and fossil materials) and into chemicals and other products. For exports, this hasbeen possible only since 1964. The processing trade was not taken into account29). For both imports andexports, there were sharp rises in all groups, with the largest increase in exports of biomass.
28) i.e. groupings of financial firms combining for a limited period for construction projects.29 ) i.e. goods are imported/exported for finishing and returned to the country of origin.

18
5HVXOWV
A look back at material input in Austria over the past four decades shows that even highly industrialisedsocieties are confronted with extremely dynamic physical growth processes. In 1960, direct material inputwas 89.7 million tonnes, or 12.7 tonnes per capita. By 1997, this already high figure had risen to 185.4million tonnes or 23 tonnes per capita. Thus the annual volume of materials used in the country doubledbetween 1960 and the present day.
7DEOH�� shows the average material input for ten-year periods, divided by group of materials. 7DEOH�� showsthe dynamics of growth from one decade to another. By far the largest increase was between the 1960s andthe 1970s, when average direct material input rose by 40%. All the partial aggregates (with the exception ofbiomass input) rose more during this period than any other. In contrast, the growth rate in average materialinput between the 1970s and the 1980s was "only" 14% and between the 1980s and the 1990s 12%.
7DEOH����$YHUDJH�PDWHULDO�LQSXW�LQ�$XVWULD�GXULQJ�WKH�SDVW�IRXU�GHFDGHV��PLOOLRQ�WRQQHV
Mean values1960-69 1970-79 1980-89 1990-97
Biomass 35.0 39.2 46.5 46.8Mineral materials 43.1 71.2 81.0 96.4Fossil materials 16.5 22.3 22.5 23.6Products 1.8 3.7 5.7 7.9'LUHFW�PDWHULDO�LQSXW��'0,���WRWDO ���� ����� ����� �����
7DEOH����5HODWLYH�JURZWK�LQ�DYHUDJH�PDWHULDO�LQSXW��$XVWULD���
Change in mean values60s/70s 70s/80s 80s/90s
Biomass ���� ���� ���Mineral materials ���� ���� ����Fossil materials ���� ��� ���Products ���� ���� ����'LUHFW�PDWHULDO�LQSXW��'0,���WRWDO ���� ���� ����
A comparison of average material input and population figures shows that annual per capita materialsconsumption was 13.3 tonnes in the 1960s, rising to almost 22 tonnes in the 1990s. Economic growth(represented as the change in GDP) followed a similar pattern to that of material input, with rapid growth inthe 1960s but slower growth since the 1980s.
As an example of a highly industrialised country, Austria curbed the growth trend - both economic growthand the consumption of materials - following an extremely intensive growth phase in the 1960s and the1970s. It is too early to say whether this is a temporary phenomenon or whether the figures are stable,although still high.
7DEOH����3HU�FDSLWD�GLUHFW�PDWHULDO�LQSXW��'0,���*'3�DQG�SRSXODWLRQ�LQ�$XVWULD�����������
Mean values1960-69 1970-79 1980-89 1990-97
Per capita DMI, tonnes 13.3 18.1 20.5 21.9Real GDP, ATS billion 627.4 993.3 1 271.8 1 592.0Population, ’000 7 248.9 7 552.0 7 587.0 7 956.9
7DEOH����,QFUHDVH�LQ�SHU�FDSLWD�GLUHFW�PDWHULDO�LQSXW��'0,���*'3�DQG�SRSXODWLRQ�LQ�$XVWULD��LQ��
Change in mean values60s/70s 70s/80s 80s/90s
Per capita DMI ���� ���� ���Real GDP ���� ���� ����Population ��� ��� ���

19
The key issue in the debate on environmental policies over the past decade has been whether theindustrialised countries could manage to decouple the consumption of energy and materials from economicgrowth by making technological improvements and structural changes. The hope is that this will come aboutvia improvements in efficiency, as recently expressed under the slogan "Factor four - wealth doubled andresource use halved"30). There would seem to be ample scope for the more efficient use of raw materials.Use of energy has been examined particularly thoroughly and it has been estimated that over 50% savingscould be made through the introduction of technical improvements. However, there are factors whichmilitate against the likely dematerialisation of industrial production and the way of life of industrial societiesin the future. Improvements in resource efficiency are frequently more than offset by quantity effects.Resource efficiency is a function of economic growth and the consumption of resources. Thus the materialefficiency indicator shows how many units of material were consumed to produce one unit of GDP. Theconcept of materials productivity crops up more frequently in economic discussions. This shows how manyunits of value added have been produced from a given unit of material.31) Have resources been used moreefficiently in Austria over the past few decades?
Since the 1960s, material efficiency has risen by approximately 30%. In 1960, a material input of 174 kgwas needed for each ATS 1 000 of value added, whereas today only 121 kg are required. This indicates thatthere has been some success during the past few decades in decoupling material consumption from economicgrowth. The Austrian national economy was even more materials-extensive at the start of the 1990s,however, producing ATS 1 000 worth of value added in 1991 and 1992 for only 112 kg of material input.Thus in the 1990s the physical economy became more dynamic again.32)
6RXUFH��,))�6WDWLVWLN�gVWHUUHLFK��PDWHULDO�LQSXW�LQ�NJ�SHU�$76�������RI�YDOXH�DGGHG�
The example of Austria also shows that more efficient use of materials has not led to a reduction in materialinput in absolute terms. This continues to increase even though, as in the 1980s, the rate of growth hasslowed down. It is still too early to tell what effect the greater dynamism of the late 1990s will have onmaterial consumption in the future.
30) Weizsäcker, F.., A. B. Lovins und L. H. Lovins 1995. Faktor Vier: Doppelter Wohlstand – halbierter Naturverbrauch. The new
report to the Club of Rome, Munich, Droemer Knaur.31) Material productivity is the reciprocal of material efficiency.32) Looked at another way, the figures for productivity growth of material input were ATS 5.75 per kg of material input in 1960 as
opposed to ATS 9 in 1997.
(FRQRPLF�JURZWK��FRQVXPSWLRQ�RI�PDWHULDOV�DQG�PDWHULDO�HIILFLHQF\�LQ�$XVWULD������������
50
75
100
125
150
175
200
225
250
275
300
325
350
1960 65 70 75 80 85 90 95
Real GDP, index 1960 =
Material efficiency, index 1960 =
Direct material input, index 1960 =

20
6XPPDU\�DQG�RXWORRN
This material flow account of an input times series for the Austrian economy between 1960 and 1997 resultsfrom a successful pooling of scientific and statistical know-how. The Institut für Interdisziplinäre Forschungund Fortbildung - Soziale Ökologie, which was one of the first institutes in Europe to develop material flowaccounting, contributed its experience of methodology and its knowledge of ecological conditions andprocesses. As the producer of an enormous fund of data, ÖSTAT was able to contribute the knowledge ithad acquired of the quality, informative value and methodology of data acquisition. But the main thrust ofour work was to demonstrate that material flow accounting on a regular basis is simple and feasible.
Once material input accounting for Austria has been incorporated into ÖSTAT's regular programme, we planthree-yearly updates. International discussions have suggested that three years is an appropriate interval forthis kind of work. This stock-taking could also be an opportunity to review the success of the ever-increasing efforts of environmental policymakers over the past few years to reduce the national economy'smaterial input and/or to decouple the use of materials from economic growth by increasing efficiency.
In ÖSTAT's view, this work has shown that, as well as information on input flows, many data are availableon the destination of material flows, i.e. the key building blocks for balances are in place. By widening thefocus, we could increase the value of the experience gained with the material flow accounting system, sinceas well as depicting changes in the volumes of materials consumed, we could show who are the mainconsumers of materials, i.e. those who cause materials to be extracted from nature. The plan is therefore toproduce a further paper setting out a balance for the three major flows of matter.
However, a clear distinction has to be made between the two aims from the point of view of the datainvolved. Whereas in theory�we need only production data (or estimates of such data) for the calculation ofthe material input of a national economy, for a materials balance a key requirement is statistics on the use ofraw materials. ÖSTAT compiled such statistics up to 1994, although their quality left something to bedesired. But such statistics ceased to be collected when the programme of work was adapted to EUrequirements and the Office suffered from an increasing shortage of resources. Since, however, input dataare required to help solve many issues - including for input output statistics, for example - this data collectionwas resumed as from the 1997 reporting year, albeit in a somewhat changed form. In the future, therefore,we can count on a regular supply of data on the use of the most important material flows, and ongoingbalances will be possible as well. With society's throughput of materials becoming an ever more seriousissue, it is becoming increasingly important to extend in this way the range of information available.
+HLQ]�6FKDQGO���+HOJD�:HLV]��,))����%ULJLWWH�3HWURYLF��g67$7�

21
$QQH[��
'RPHVWLF�UHPRYDO�RI�ELRPDVV��PLOOLRQ�WRQQHV
Grainharves
t
Strawhar-vest
Rootcrops,othercrops
Vegeta-bles
Othercrops
Foddercrops
Catchcrops
Clo-verandhay
Fruithar-vest
Winehar-vest
Greenfodderesti-mate
Honey, game
andfish
Wood
Totalbio-mass
1960 2.24 3.08 8.34 0.24 0.10 1.54 0.53 7.50 1.28 0.09 1.28 - 7.38 33.591961 2.27 3.02 6.95 0.23 0.08 1.31 0.50 7.80 1.03 0.13 1.28 - 7.15 31.751962 2.31 2.96 6.91 0.21 0.08 1.31 0.00 7.63 0.77 0.10 1.28 - 6.85 30.401963 2.23 2.81 7.89 0.26 0.12 1.35 0.00 8.08 0.86 0.18 1.27 - 6.40 31.441964 2.35 2.80 7.87 0.26 0.14 1.47 0.86 8.42 0.86 0.28 1.28 - 6.73 33.321965 2.02 2.60 5.94 0.26 0.10 1.62 0.72 8.97 0.48 0.14 1.28 - 6.53 30.661966 2.64 3.24 7.53 0.29 0.13 1.66 0.00 9.07 0.75 0.15 1.25 - 6.93 33.631967 2.93 3.34 7.28 0.28 0.14 1.73 0.85 8.79 0.65 0.26 1.24 - 6.69 34.191968 3.04 3.30 7.52 0.29 0.14 1.89 0.93 8.85 0.72 0.25 1.25 - 6.53 34.711969 3.40 3.34 6.96 0.27 0.10 2.31 0.00 8.86 0.64 0.23 1.21 - 6.98 34.311970 3.07 3.22 6.76 0.28 0.11 2.55 0.93 8.84 0.67 0.31 1.23 - 6.88 34.841971 3.54 3.19 6.23 0.28 0.11 2.63 0.00 8.47 0.55 0.18 1.24 - 7.21 33.631972 3.31 3.14 6.18 0.30 0.11 2.74 0.63 8.85 0.37 0.26 1.25 - 7.20 34.341973 3.78 3.18 5.61 0.31 0.13 3.76 0.73 8.50 0.65 0.24 1.19 - 6.84 34.911974 4.03 3.34 5.50 0.32 0.15 3.67 0.70 8.71 0.68 0.17 1.22 - 6.68 35.161975 3.71 3.14 5.90 0.36 0.14 4.36 0.76 9.21 0.65 0.27 1.24 - 6.48 36.221976 4.27 3.56 5.28 0.27 0.14 4.62 1.08 7.15 0.63 0.29 1.18 - 7.51 35.981977 4.21 3.32 4.89 0.35 0.16 5.23 0.94 8.32 0.53 0.26 1.20 - 7.50 36.931978 4.63 3.27 4.02 0.34 0.18 5.46 0.79 8.12 0.59 0.34 1.22 - 7.29 36.241979 3.99 3.21 4.31 0.36 0.19 5.45 0.87 7.77 0.64 0.28 1.19 - 8.83 37.101980 4.83 3.81 4.45 0.40 0.25 5.35 0.84 8.04 0.65 0.31 1.22 - 9.17 39.331981 4.35 3.31 4.80 0.39 0.25 5.79 1.10 7.92 0.45 0.21 1.25 - 9.20 39.031982 5.03 3.76 5.13 0.37 0.21 6.58 1.15 8.38 0.81 0.49 1.28 - 8.93 42.111983 5.06 3.90 3.41 0.19 0.16 5.48 0.85 7.71 0.67 0.37 1.09 - 9.61 38.511984 5.35 4.16 4.12 0.25 0.20 6.06 0.85 7.40 0.70 0.25 1.11 - 9.97 40.421985 5.56 3.86 3.82 0.26 0.22 6.82 0.76 8.16 0.59 0.11 1.12 - 9.80 41.091986 5.11 3.63 3.02 0.26 0.32 6.51 0.88 7.57 0.72 0.22 1.18 - 10.19 39.621987 4.97 3.51 3.32 0.27 0.40 6.38 0.99 7.96 0.51 0.22 1.19 - 10.09 39.791988 5.36 3.97 3.19 0.30 0.47 5.76 1.03 7.83 0.78 0.35 1.19 - 10.77 41.001989 5.00 3.68 3.72 0.29 0.51 5.58 1.08 7.84 0.65 0.26 1.20 - 11.49 41.291990 5.29 3.83 3.45 0.30 0.44 4.48 0.95 7.07 0.56 0.32 1.13 - 12.58 40.401991 5.04 2.75 3.48 0.30 0.55 4.43 0.73 7.13 0.49 0.31 1.08 - 10.06 36.341992 4.32 2.16 3.46 0.24 0.59 3.70 0.36 5.54 0.48 0.37 1.07 0.01 10.75 33.061993 4.21 2.00 4.01 0.25 0.60 4.36 0.42 6.43 0.63 0.27 1.07 0.01 10.71 34.961994 4.44 2.32 3.26 0.28 0.70 4.32 0.71 7.05 0.55 0.22 1.14 0.02 12.54 37.541995 4.45 2.41 3.70 0.39 0.77 4.06 0.79 7.24 0.66 0.22 1.22 0.02 12.06 37.991996 4.49 1.97 3.96 0.40 0.21 4.02 0.73 6.77 0.59 0.21 1.23 0.01 13.11 37.701997 5.01 2.15 3.75 0.46 0.22 4.11 0.71 7.45 0.72 0.18 1.22 0.01 12.86 38.86

22
$QQH[��
([WUDFWLRQ�RI�PLQHUDO�UDZ�PDWHULDOV��PLOOLRQ�WRQQHV
Ores (ironore, tungsten
ore, lead,copper, zinc
and antimonyore)
Salt Industrialminerals(gypsum,anhydrite,
graphite, kaolin,talc, magnesite)
Clays Natural stone(incl. cementand limestoneraw materials
Sand andgravel
Total mineralmaterials
1960 3.92 0.25 2.83 3.13 12.37 10.44 32.951961 4.06 0.21 3.04 3.16 12.02 10.82 33.311962 4.14 0.23 2.83 3.19 11.80 10.94 33.131963 4.11 0.28 2.45 3.23 11.80 12.94 34.801964 3.91 0.29 2.80 3.26 12.75 16.70 39.701965 3.88 0.30 2.95 3.29 11.96 18.72 41.111966 3.84 0.32 2.95 3.32 12.77 18.32 41.531967 3.85 0.31 2.80 3.36 13.57 15.52 39.401968 3.90 0.34 2.71 3.39 13.09 19.94 43.371969 4.41 0.34 2.78 3.43 13.02 22.83 46.811970 4.43 0.40 2.76 3.60 15.34 24.34 50.871971 4.78 0.39 2.60 3.83 16.55 27.68 55.831972 4.72 0.41 2.66 3.86 17.26 32.19 61.081973 4.83 0.44 2.73 3.86 16.52 31.72 60.101974 4.85 0.44 2.72 3.88 18.22 38.08 68.181975 4.45 0.38 2.39 3.58 17.78 38.08 66.661976 4.55 0.47 2.12 3.15 17.94 40.90 69.131977 4.17 0.32 2.26 3.07 19.67 42.56 72.061978 3.59 0.32 2.21 2.90 20.27 40.84 70.131979 4.12 0.38 2.43 2.92 22.00 41.47 73.311980 4.39 0.41 2.69 3.56 23.27 42.08 76.401981 4.24 0.46 2.46 3.47 22.30 42.22 75.161982 4.62 0.43 2.30 3.27 23.86 37.44 71.931983 4.84 0.36 2.36 3.02 22.34 38.03 70.951984 5.01 0.42 2.60 3.16 22.53 38.19 71.911985 4.49 0.44 2.66 3.08 22.40 36.17 69.241986 4.04 0.49 2.44 2.98 23.82 36.88 70.651987 3.73 0.48 2.26 2.99 24.51 37.23 71.221988 3.01 0.41 2.48 3.36 26.44 36.46 72.171989 3.10 0.40 2.67 3.27 27.29 39.84 76.571990 2.95 0.39 2.58 3.50 27.00 42.04 78.441991 2.72 0.46 2.17 3.68 27.37 42.66 79.051992 2.24 0.46 2.32 3.72 32.45 43.72 84.911993 1.71 0.52 2.03 3.29 34.04 42.71 84.291994 1.65 0.52 2.36 3.23 34.83 46.71 89.311995 2.31 0.60 2.32 3.40 34.40 40.36 83.381996 2.23 0.60 2.08 2.94 35.46 39.41 82.701997 2.18 0.53 2.19 3.05 41.41 39.41 88.78

23
$QQH[��
([WUDFWLRQ�RI�IRVVLO�PDWHULDOV��PLOOLRQ�WRQQHV
Coal Petroleum Natural gas Total fossilmaterials
1960 6.11 2.45 1.11 9.671961 5.77 2.36 1.18 9.301962 5.81 2.39 1.24 9.441963 6.16 2.62 1.29 10.061964 5.86 2.66 1.34 9.861965 5.51 2.85 1.31 9.671966 5.30 2.76 1.42 9.481967 4.62 2.68 1.36 8.661968 4.18 2.72 1.23 8.141969 3.84 2.76 1.12 7.721970 3.67 2.80 1.44 7.901971 3.77 2.52 1.43 7.721972 3.76 2.48 1.49 7.721973 3.63 2.58 1.72 7.931974 3.63 2.24 1.67 7.541975 3.40 2.04 1.79 7.221976 3.21 1.93 1.62 6.771977 3.13 1.79 1.81 6.731978 3.08 1.79 1.83 6.691979 2.74 1.73 1.75 6.221980 2.86 1.48 1.44 5.781981 3.06 1.34 1.09 5.491982 3.30 1.29 1.00 5.591983 3.04 1.27 0.92 5.231984 2.90 1.21 0.96 5.071985 3.08 1.15 0.88 5.111986 2.97 1.12 0.84 4.931987 2.79 1.06 0.88 4.731988 2.13 1.18 0.96 4.261989 2.07 1.16 1.00 4.231990 2.45 1.15 0.98 4.571991 2.08 1.28 1.01 4.371992 1.75 1.18 1.09 4.021993 1.69 1.16 1.13 3.971994 1.37 1.10 1.03 3.501995 1.25 1.03 1.12 3.411996 1.11 0.99 1.13 3.231997 1.13 0.97 1.08 3.18

24
$QQH[��
,PSRUWV��PLOOLRQ�WRQQHV
Biomass Mineralmaterials
Petroleum,coal, natural
gas
Chemicals Products Total imports
1960 2.22 4.73 5.24 0.00 1.31 13.501961 1.80 4.96 4.84 0.00 1.36 12.961962 2.16 5.08 5.12 0.00 1.36 13.711963 2.12 5.79 5.70 0.00 1.47 15.081964 2.36 4.74 6.88 0.62 1.13 15.721965 2.60 3.68 8.05 1.23 0.79 16.351966 2.32 3.85 8.52 1.25 0.89 16.821967 2.11 3.63 8.10 1.30 0.88 16.011968 2.21 4.30 9.67 1.43 0.95 18.551969 2.17 4.59 10.42 1.48 1.00 19.661970 2.88 5.43 12.58 1.64 1.18 23.711971 2.89 5.49 12.67 1.66 1.37 24.071972 2.93 6.00 13.42 1.96 1.60 25.911973 3.95 5.69 15.78 1.81 1.59 28.831974 4.31 6.87 15.61 2.01 1.60 30.401975 3.45 5.95 14.26 1.61 1.61 26.881976 3.93 6.48 16.54 1.83 1.91 30.701977 4.01 6.96 15.36 2.19 2.13 30.641978 3.98 7.37 16.54 2.24 1.94 32.071979 4.76 8.68 18.02 2.53 2.10 36.091980 5.48 8.18 18.23 2.67 2.25 36.831981 5.20 7.95 17.76 2.79 2.15 35.851982 5.39 7.83 16.02 2.82 2.19 34.251983 5.56 6.99 15.12 2.95 2.27 32.911984 5.65 8.95 17.65 3.07 2.33 37.661985 6.64 8.59 18.20 3.36 2.44 39.241986 6.75 8.16 18.13 3.32 2.54 38.911987 7.00 8.16 18.39 3.44 2.69 39.681988 7.47 9.49 17.34 3.86 2.83 40.971989 7.44 9.96 17.63 3.76 3.03 41.831990 7.91 9.89 18.85 3.77 3.30 43.711991 9.50 10.38 19.35 3.72 3.46 46.411992 9.29 11.17 19.14 3.66 3.47 46.731993 9.24 10.81 18.64 3.63 3.38 45.691994 10.14 12.59 18.68 4.03 3.78 49.221995 10.23 14.09 20.06 4.17 4.04 52.591996 10.19 14.47 21.47 4.77 4.48 55.371997 10.96 16.73 22.01 4.32 4.98 59.00
25
$QQH[��
([SRUWV��PLOOLRQ�WRQQHV
Biomass Mineralmaterials
Petroleum,coal, natural
gas
Chemicals Products Total exports
1960 0.13 4.14 0.00 0.00 2.97 7.241961 0.22 3.63 0.00 0.00 3.12 6.971962 0.24 3.43 0.00 0.00 3.24 6.921963 0.18 3.29 0.00 0.00 3.31 6.781964 1.39 3.55 0.00 0.00 2.07 7.011965 2.60 3.82 0.35 0.15 0.82 7.741966 2.59 3.63 0.31 0.16 0.94 7.631967 2.67 3.63 0.32 0.88 0.38 7.871968 2.96 3.58 0.27 1.07 0.42 8.301969 3.48 3.76 0.25 0.98 0.53 9.001970 3.48 3.75 0.26 0.95 0.61 0.001971 3.34 4.11 0.31 1.13 0.65 9.551972 3.53 4.27 0.33 1.18 0.72 10.031973 3.81 4.38 0.31 1.46 0.76 10.711974 3.84 4.55 0.28 1.62 0.87 11.151975 3.55 4.06 0.22 1.71 0.89 10.431976 4.67 4.12 0.34 1.76 1.07 11.961977 4.55 4.09 0.29 1.84 0.96 11.731978 4.93 4.49 0.28 2.06 1.06 12.821979 5.66 5.18 0.22 2.28 1.22 14.561980 5.84 5.25 0.22 2.41 1.36 15.091981 5.76 5.46 0.23 2.51 1.35 15.321982 5.57 5.45 0.21 2.61 1.46 15.301983 6.21 5.68 0.24 2.86 1.52 16.511984 6.63 6.40 0.48 3.11 1.57 18.201985 6.52 6.24 0.91 2.93 1.69 18.281986 6.91 5.95 0.58 2.91 1.70 18.051987 6.97 6.33 0.50 3.26 1.65 18.721988 7.90 6.25 0.41 3.60 1.89 20.041989 8.39 6.44 0.44 3.58 2.14 20.981990 9.02 6.89 0.47 3.44 2.43 22.261991 8.23 7.01 0.44 3.50 2.63 21.811992 8.55 7.08 0.57 3.44 2.58 22.221993 8.36 7.29 0.74 3.48 2.77 22.641994 9.58 7.91 1.06 3.88 2.85 25.281995 10.15 9.66 0.98 3.87 3.44 28.111996 10.15 9.49 1.28 4.16 3.66 28.741997 11.25 10.97 1.44 4.32 3.77 31.74
Related Documents


![Hospital Visit Presentation - Home - KRHOP...2020/06/05 · Z } µ À ] o o 6DPSOH 3ROLFLHV 6DPSOH &DWHULQJ *XLGHOLQHV:KLWH 3DSHUV RQ 1LQH &HQWHUV RI ([FHOOHQFH $ZDUG 5HFLSLHQWV +HDOWK\](https://static.cupdf.com/doc/110x72/60ac47754793104d9b0a30f2/hospital-visit-presentation-home-krhop-20200605-z-o-o-6dpsoh.jpg)


