X/Q for Releases From Area Sources 2009 RETS-REMP Workshop Jim Key Key Solutions, Inc. www.keysolutionsinc.com

X/Q for Releases From Area Sources 2009 RETS-REMP Workshop Jim Key Key Solutions, Inc. .
Dec 18, 2015
Welcome message from author
This document is posted to help you gain knowledge. Please leave a comment to let me know what you think about it! Share it to your friends and learn new things together.
Transcript

X/Q for Releases From Area Sources
2009 RETS-REMP Workshop
Jim Key
Key Solutions, Inc.
www.keysolutionsinc.com

Concerns
• Industry Tritium Issues Have Revealed Many Unanalyzed Dose Pathways– Storm Drains– Ground Water– Service Water– Discharge Basins or Lakes With Little Water
Turnover

Evaporation From Area Sources
• Has Been Mostly Ignored
• Tritium Concentrations in Bodies of Water Can Continue to Build Up
• Release from Such Sources are Estimated to be 10 Ci/yr and Higher

Application of Gaussian Model to Release from Area Sources
• Simplify Gaussian Model As Follows– Ground Level Release– Ground Level Receptor
• Modify From Point Source Geometry to Square Area Geometry

Examine
• Point Source Plume Centerline
• Point Source Sector Average
• Area Source Plume Centerline
• Area Source Sector Average
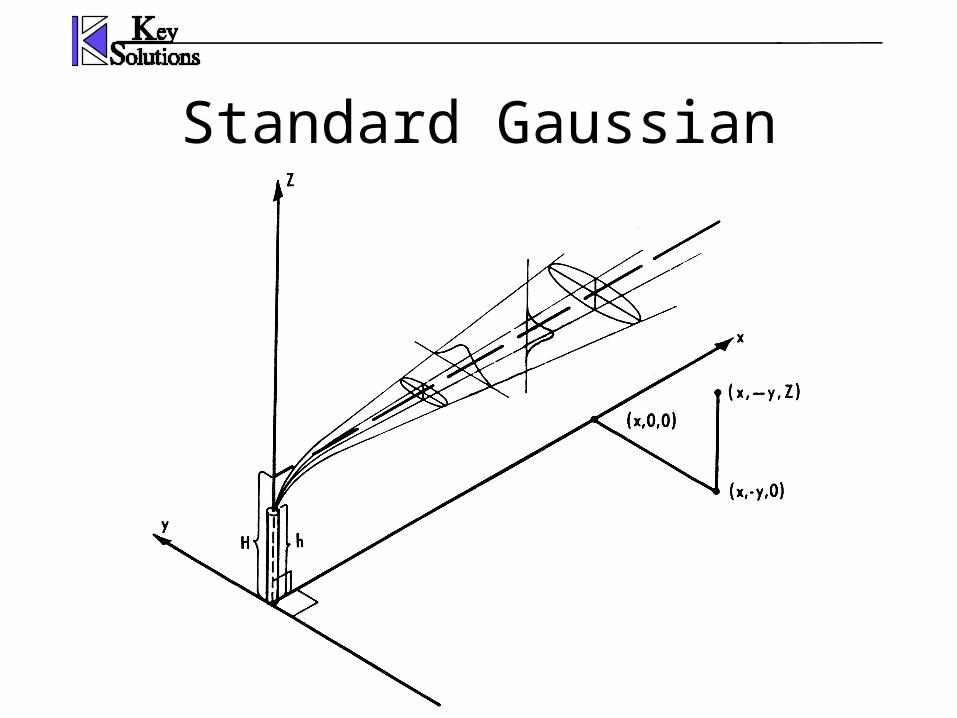
Standard Gaussian Model

General Gaussian X/Q
2y
2
y 2
yExp
2
1
u
1Downwind Factor
Crosswind Factor
Vertical Factor
2z
2
2z
2
z 2
zHExp
2
zHExp
2
1
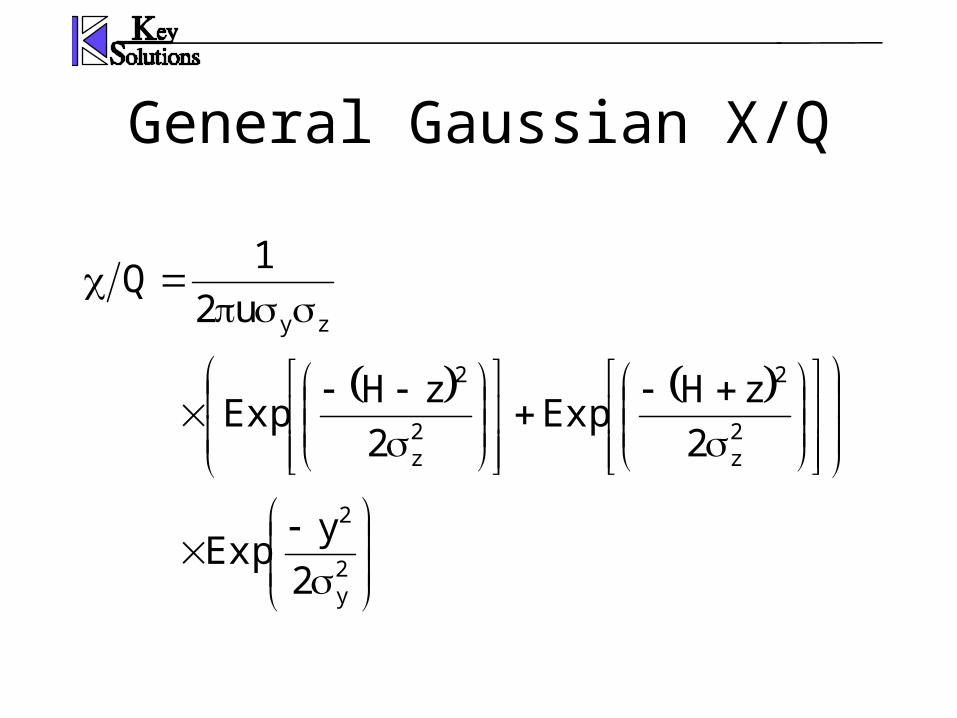
General Gaussian X/Q
2y
2
2z
2
2z
2
zy
2
yExp
2
zHExp
2
zHExp
u2
1Q

Horizontal and VerticalParameters
y(x) and z(x) are functions of
– Downwind Distance – x– Atmospheric Stability – Pasquill Category
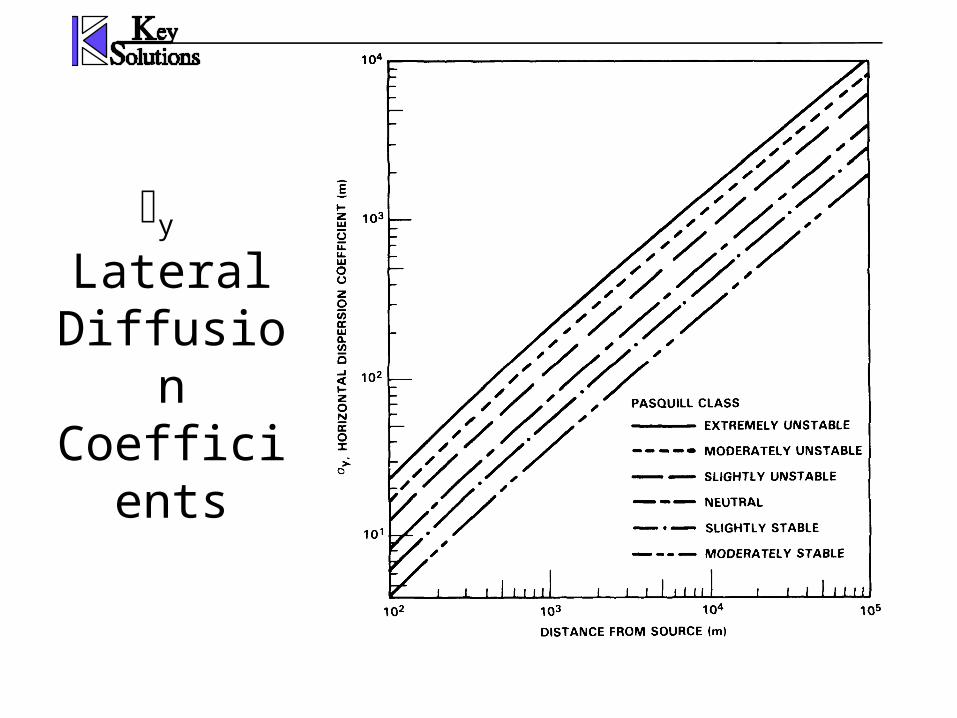
y Lateral
Diffusion Coefficients
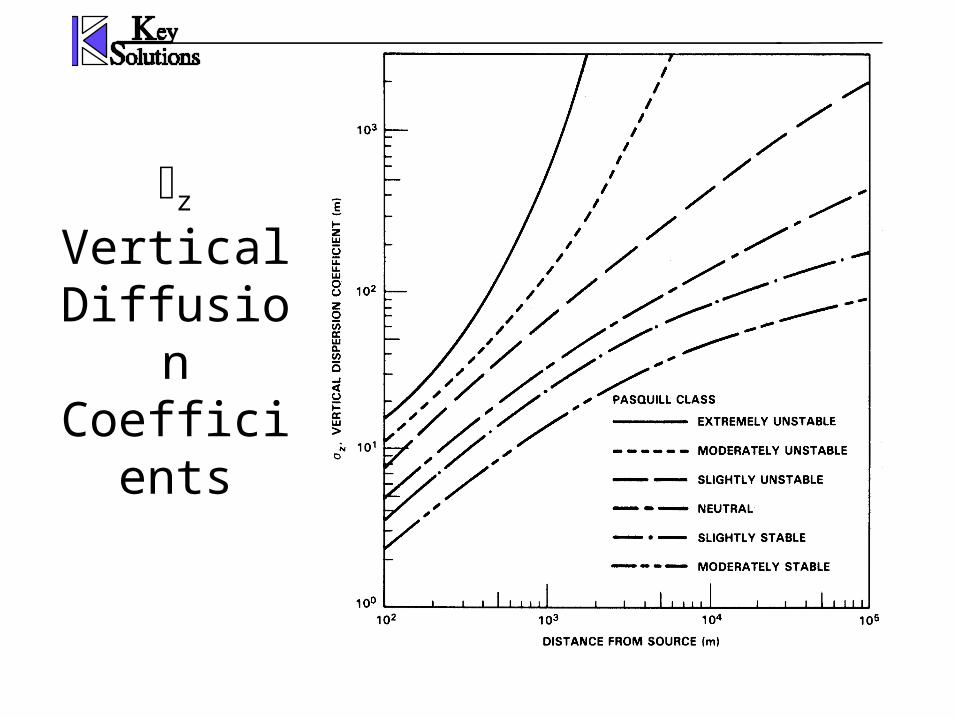
z
Vertical Diffusion
Coefficients
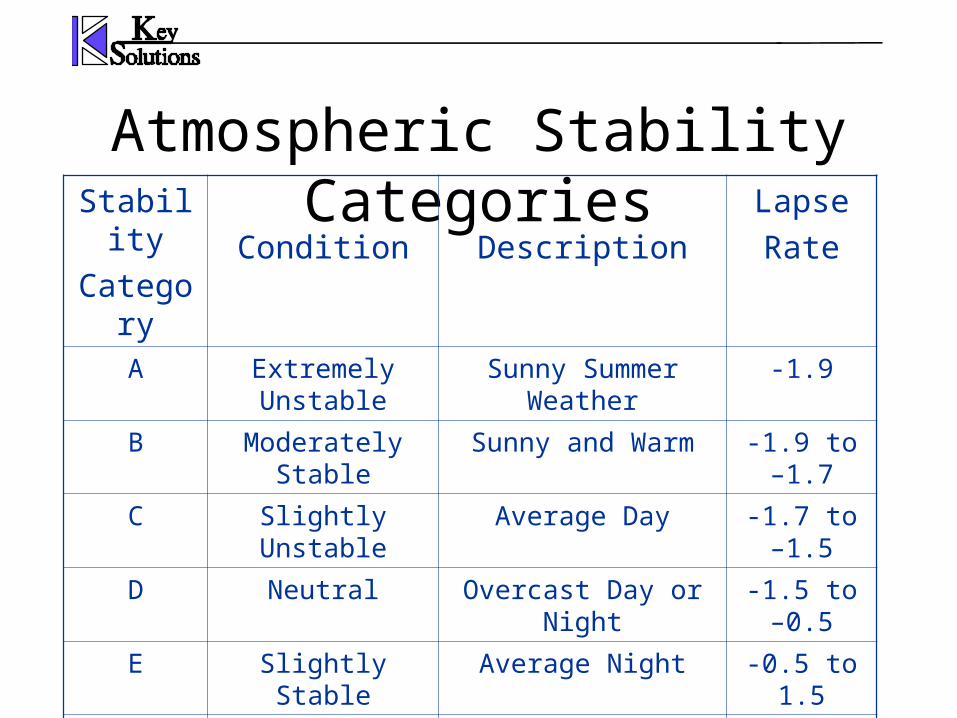
Atmospheric Stability CategoriesStability
Category Condition Description
Lapse
RateA Extremely Unstable Sunny Summer Weather -1.9
B Moderately Stable Sunny and Warm -1.9 to –1.7
C Slightly Unstable Average Day -1.7 to –1.5
D Neutral Overcast Day or Night -1.5 to –0.5
E Slightly Stable Average Night -0.5 to 1.5
F Moderately Stable Clear Night 1.5 to 4.0
G Highly Stable Added by NRC > 4.0

Simplifications
• Ground Level Release– Set H = 0
• Ground Level Receptor– Set z = 0
• Plume Centerline– Set y = 0

Ground Level ConcentrationGround Level Receptor
Plume CenterlinePoint Source
xxu
1Q
zy

Point Source Geometry
Receptor
Wind
Point Source
x

Sector Averaged Concentration
• Wind Directions in Each Sector are Distributed Randomly Over Period of Interest
• Calculate Average Value of /Q for Sector Length

Calculate Average Value of Function Over Sector Length
ab
xF
)x(F
b
ab,aAVE
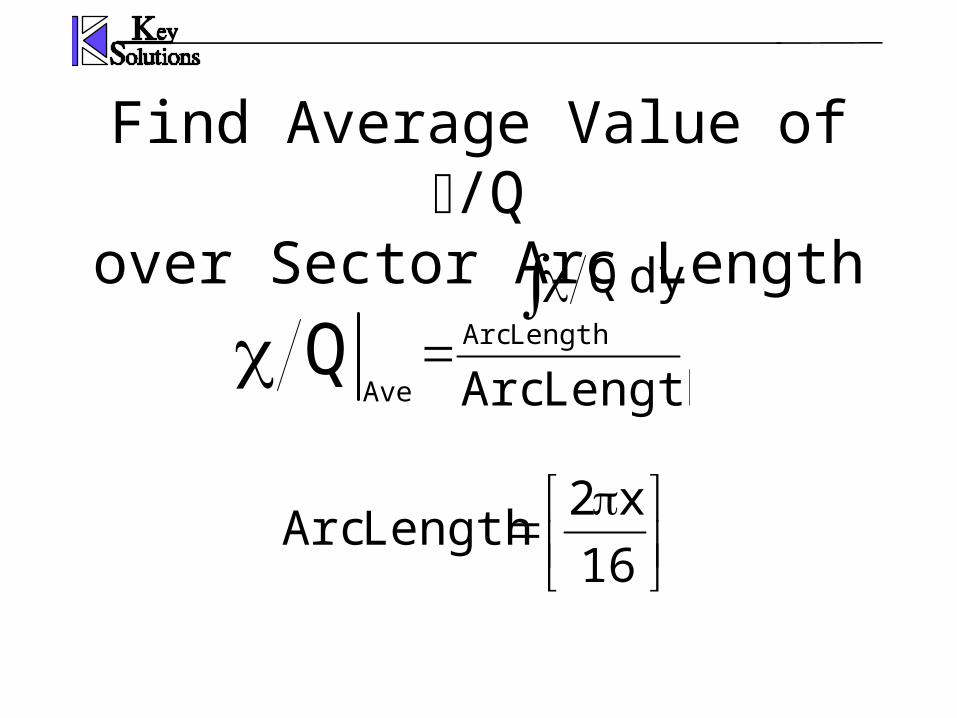
Find Average Value of /Qover Sector Arc Length
LengthArc
dyQLengthArc
AveQ
16
x2Length Arc

Crosswind Integrated Concentration
dy2
yExp
16x2
1
u
1Q
2a
2a2y
2
zyAve
This term is cannot be integrated analytically

Easier to Use…
2y2
y
2
2dy2
yExp
From Standard Math Tables

Crosswind Integrated Concentration
2y
zy
2
16x2
1
u
1Q
• Function Of Only– Downwind Distance – x– Wind Speed - u

xu
03.2Q
z
Ground Level ConcentrationGround Level Receptor
Sector AveragePoint Source
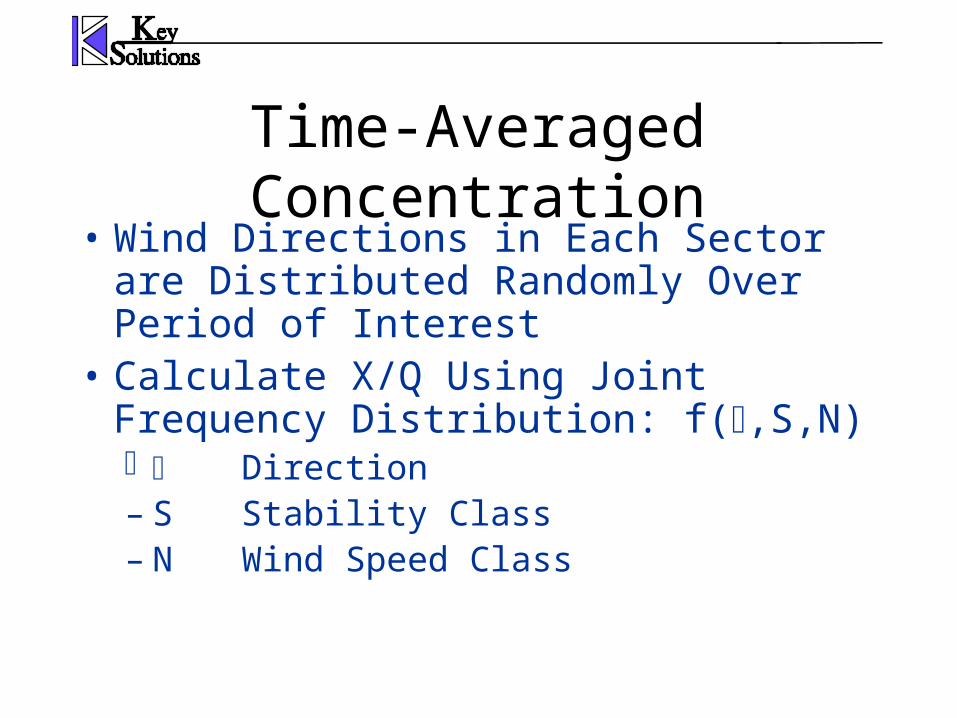
Time-Averaged Concentration
• Wind Directions in Each Sector are Distributed Randomly Over Period of Interest
• Calculate X/Q Using Joint Frequency Distribution: f(,S,N) Direction– S Stability Class– N Wind Speed Class

Time-Averaged Concentration
• Allowed By NRC Guidance– Reg Guides 1.109– NUREGs 0133, 0472, 0473, 1301, 1302
• Less Scatter and Variability Than Real Data
• Dose Models Are Based On 1 Year Annual Exposure

/Q Variability
• Real Time/Short Term /Q– Factors of 3 to 10
• Long Term /Q– Factors of 2 to 4
From NCRP Report No. 76

Applying JFD Data to X/Q
• Use Average Wind Speed (Not Max Wind Speed)
• Determine yo for Each Stability Class
• Determine Virtual Distance (Xv) for Each Stability Class

Calculate X/Q Using:
Frequency theis N,S,f
Index Class Speed Wind theis N
Index ClassStability theis S
IndexSector theis
Where
N,S,fxu
03.2,xQ
N,S vNzS
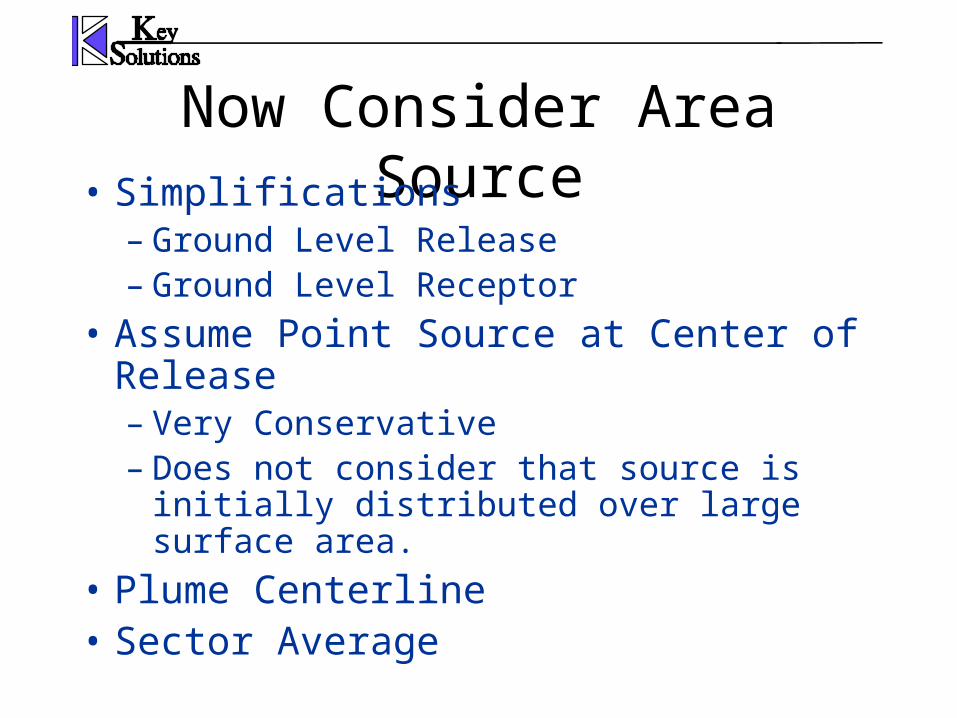
Now Consider Area Source• Simplifications
– Ground Level Release– Ground Level Receptor
• Assume Point Source at Center of Release– Very Conservative– Does not consider that source is initially
distributed over large surface area.
• Plume Centerline• Sector Average

Area Source For Plume Centerline Assumes
• Ground Level Release
• Ground Level Receptor
• Simple Geometry

Simple Geometry for NearField Area Source
WindArea
Source
Receptor
2b
2a

Calculate Average Value of Function Over An Area
1212
x
x
y
yy,yx,xAREA yyxx
y,xQ
)y,x(Q
2
1
2
1
2121
• Integration Over Area of Source
• Calculates Plume Centerline Concentration

Ground Level Concentration
x2
yexp
xxu
1Q
2y
2
zy
Near field conditions or large area sources require that we consider y(x) and z(x) as
functions of x

Problem to Solve
1212
x
x
y
y2y
2
zy
AREA
yyxx
dydxx2
yexp
xxu1
Q
2
1
2
1

Problem to Solve - 2
a
a
b
b2y
2
zy
AREA
dydxx2
yexp
xx
1
ub2a2
1
Q
• Cannot Be Solved Analytically• Use Error Function for Integral Over dy
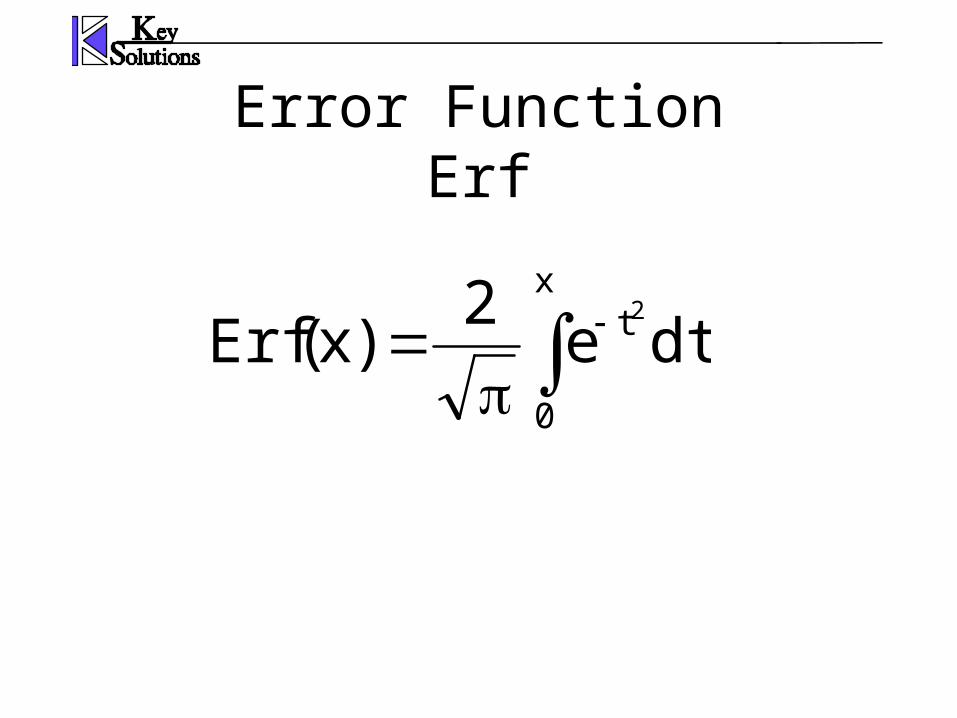
Error FunctionErf
x
0
t dte2
)x(Erf2

Error FunctionIdentities
)x(Erf)x(Erf
)x(Erf2
dtex
0
t2

a
a zy
b
b
2
y
dxxx
1dy
x2
yexp
uba4
1
Problem to Solve - 3
x2
bErf
y
Replace With

a
a zy
y
a
a zyy
dxxx
x2bErf
uba4
1
or
dxxx
1
x2
bErf
uba4
1
Problem to Solve - 4

a
a zy
y
Areadx
xx
x2bErf
uba4
1Q
Problem to Solve - 5
• Reduced to Integral of dx• Integrate Using Simpson’s Rule

Area Source For Sector Average
• Similar Development for Point Source Results In -
a
a zArea
dxux2ba
1Q
• Cannot Be Integrated Analytically• Integrate Using Simpson’s Rule
– Simpler Function to Integrate Numerically

Simple Case
• Calculate X/Q Assuming– Ground Level Release– Emission Source is One Mile Square– Receptor is Due West ½ Mile from Center of
Source (i.e. at Boundary)– Assume Worst Case Met Conditions
• Extremely Stabile (Class G)• Calm Conditions (0.04 m/s)• Least Dispersion

Example 1
• Ground Level Release• Emission Source is One Mile Square• Receptor is Due West ½ Mile from Center
of Source (i.e. at Area Boundary)• Assume Worst Case Met Conditions
– Extremely Stabile (Class G)– Calm Conditions (0.04 m/s)– Least Dispersion

Point Source vsArea Source
Receptor
Wind
Point Source
1600 meters
Area Source

Example 1 Calculations
Geometry /Q (m/sec2)
Point Source Plume Centerline 9.2E-02
Point Source Sector Average 1.5E-02
Area Source Plume Centerline 6.6E-03
Area Source Sector Average 3.2E-03
Source = 1 Square Mile
Receptor at Source Boundary

Simple X/Q for Area Source
• u = 0.022 m/s
• x = 20,800 m zG = 7.5 m
04E76.5800,20022.07.7
03.2QX

Geometry for Example 2
1600 meters
ReceptorPoint Source
Wind
3200 meters

Example 2 Calculations
Geometry /Q (m/sec2)
Point Source Plume Centerline 8.1E-03
Point Source Sector Average 1.2E-03
Area Source Plume Centerline 9.2E-06
Area Source Sector Average 5.7E-04
Source = 1 Square Mile
Receptor 2 Miles From Boundary

Point Source vs Area SourceX/Q
• Larger Sources – Expect Greater Difference
• As Distance to Receptor Increases Difference Slowly Decreases

Plume Centerline Comparison
1.E-09
1.E-08
1.E-07
1.E-06
1.E-05
1.E-04
800 1800 2800 3800 4800 5800 6800 7800 8800 9800
Distance (meters)
X/Q
(m
/sec
3 )
Area Source Plume Centerline
Point Source Plume Centerline

Sector Average Comparison
1.E-07
1.E-06
1.E-05
1.E-04
800 1800 2800 3800 4800 5800 6800 7800 8800 9800
x (meters)
X/Q
(m
/se
c3)
Area Source Sector Average
Point Source Sector Average

Sector Average Comparison
1.E-07
1.E-06
1.E-05
1.E-04
800 1800 2800 3800 4800 5800 6800 7800 8800 9800
x (meters)
X/Q
(m
/se
c3)
Area Source Sector Average
Point Source Sector Average
Point Source Sector Average

ALOHA
Related Documents


