XMET INC. GPS-INTEGRATED GROUND MAGNETIC SURVEY BLACKFLAKE WEST PROJECT FEAGAN LAKE AREA, ONTARIO, CANADA LOGISTICS & INTERPRETATION REPORT 14N040 AUGUST 2014

Welcome message from author
This document is posted to help you gain knowledge. Please leave a comment to let me know what you think about it! Share it to your friends and learn new things together.
Transcript

XXMMEETT IINNCC..
GPS-INTEGRATED GROUND MAGNETIC SURVEY
BBLLAACCKKFFLLAAKKEE WWEESSTT PPRROOJJEECCTT
FEAGAN LAKE AREA, ONTARIO, CANADA
LOGISTICS & INTERPRETATION REPORT
14N040 AUGUST 2014

XMET INC. BLACKFLAKE WEST PROJECT / 14N040 PAGE 1
TABLE OF CONTENTS
Abstract ................................................................................................................................................................ 1
1. The Mandate ............................................................................................................................................... 2 2. The Blackflake West Project ........................................................................................................................ 3 3. GPS-Integrated Ground Magnetic Field Survey .......................................................................................... 5 4. Data Presentation ........................................................................................................................................ 7 5. Geophysical Interpretation ........................................................................................................................... 8 6. Conclusions ............................................................................................................................................... 10
LIST OF FIGURES
Figure 1. General location of the Blackflake West Project ................................................................................... 2 Figure 2. Index of claims and ground magnetic survey coverage over the Blackflake West Project ................... 4 Figure 3. Total magnetic intensity contours map of the Blackflake West Project ............................................... 11 Figure 4. A) Residual magnetic contours map; B) Total Gradient Amplitude (analytic signal) contours map of
the Blackflake West Project ................................................................................................................. 12 Figure 5. First Vertical Derivative contours map of the Blackflake West Project ................................................ 13 Figure 6. Simplified structural interpretation map of the Blackflake West Project .............................................. 14 Figure 7. Regional vertical gradient magnetic field (cell size 200 m) showing the surveyed line paths and low
magnetic signatures ............................................................................................................................ 15 Figure 8. Perspective view showing the subsurface magnetic susceptibility isosurfaces rendered at -0.01 SI
(blue dark) to 0.03 SI (red colour) ........................................................................................................ 16 Figure 9. Top view showing the distribution of the magnetic susceptibility of the Blackflake West Project ........ 17
LIST OF TABLES
Table 1. Quality statistics – Ground Magnetic ....................................................................................................... 6
Table 2. Maps produced ........................................................................................................................................ 7

XMET INC. BLACKFLAKE WEST PROJECT / 14N040 PAGE 1
ABSTRACT On behalf of Xmet Inc., a GPS-integrated ground magnetic field survey was carried out part of the Blackflake West property located within the Feagan Lake area, 80 km NW of Hearst, Ontario. The goal of this geophysical campaign was to highlight low amplitude magnetic features that might relate to an economic hydrothermal graphite deposit. From July 17 to 20, 2014, a total of 41.1 km of magnetic data were gathered over 25 N-S regularly spaced lines. Survey specifications, instrumentation control, data acquisition and processing were all successfully performed within our Quality System framework. The ground magnetic survey successfully and clearly mapped the lithological formations of the Blackflake West grid. The dominant interpreted features are two intersecting magnetic lineaments trending NW and WNW, and an open ended irregular shaped magnetic anomaly located north of the grid. Faulting patterns crossing the property were also successfully identified. A potential shear-zone was also interpreted following a weak magnetic trend that is weaker than the magnetic background. A three-dimensional magnetic susceptibility model was built and proposed for the studied grid. We propose a combination of magnetic and electromagnetic surveys (VTEM survey) in order to verify the nature of the weakly magnetized zones.

XMET INC. BLACKFLAKE WEST PROJECT / 14N040 PAGE 2
1. THE MANDATE
PROJECT ID Blackflake West Project (Our reference: 14N040)
GENERAL LOCATION 80 km northwest of Hearst, Ontario, Canada
CUSTOMER Xmet Inc. 120 Adelaide Street West, Suite 2500 Toronto, Ontario M5H 1T1 Telephone: (416) 644-6588 http://xmet.ca
REPRESENTATIVE Mr. Justin Rocco, P. Eng. Geological Engineer [email protected]
SURVEY TYPE GPS-integrated ground magnetic field
GEOPHYSICAL OBJECTIVE To highlight low magnetic features that might relate to an economic hydrothermal graphite deposit
Figure 1. General location of the Blackflake West Project
Blackflake West Project

XMET INC. BLACKFLAKE WEST PROJECT / 14N040 PAGE 3
2. THE BLACKFLAKE WEST PROJECT
LOCATION Feagan Lake area, Ontario, Canada Latitude: 50°03’ N, Longitude: 84°36’ W UTM : 671 300 mE, 5 548 000 mN (NAD83, zone 16N) NTS sheet: 42K/02
NEAREST SETTLEMENT Hearst: 80 km to the southeast.
ACCESS The Blackflake West grid was accessed daily from Hearst by taking highway 11 west for ~70 km. From here, an access road (forest road) was taken north for about ~30 km. From there the grid was accessed by ATV after driving approximately 15 km and walking about 0.7 km.
GEOMORPHOLOGY The terrain of the Blackflake West property shows moderate to flat topographic relief with elevation varying from 134 to 144 m above mean see level. Vegetation is classified as thick boreal forest consisting of spruce, fir and birch. The middle of the property the ground is swampy.
CULTURAL FEATURES No cultural features have affected the quality of the geophysical data.
MINING LAND TENURE The location of the Blackflake West grid is illustrated on the following page. The claims encompassed in the present project are wholly owned (100%) by Xmet Inc.
SECURITY AND
ENVIRONMENT
As part of the Abitibi Geophysics EHS program, crew members received first aid training and are provided with the safety equipment and specialized training for the geophysical techniques utilized on this project. No incident was reported during this project.
SURVEY GRID The survey grid consists of twenty-five (25) lines regularly spaced at 75 m and oriented N-S direction. The lines are 1.5 km in length. Two tie-lines spaced at 600 m complete the survey grid. Refer to figure 2, on page 5 for a plan view of the region covered by the present survey.
COORDINATE SYSTEM Projection: Universal Transverse Mercator (UTM), zone 16N Datum: NAD 83

XMET INC. BLACKFLAKE WEST PROJECT / 14N040 PAGE 4
Figure 2. Index of claims and ground magnetic survey coverage over the Blackflake West Project

XMET INC. BLACKFLAKE WEST PROJECT / 14N040 PAGE 5
3. GPS-INTEGRATED GROUND MAGNETIC FIELD SURVEY
TYPE OF SURVEY Measurement of the Total Magnetic Field (TMF) with GPS readings recorded every second. The plotted values were corrected for diurnal variations using readings from a synchronized MAG base station.
PERSONNEL Philippe Larouche, Chief crew, geophysical operator Barbara Estor, Geophysical operator Carole Picard, Tech., Plotting Martin Dubois, P. Geo., Logistics Madjid Chemam, P. Geo., QC, Data processing &
interpretation Chris Brown, P. Geo., Final validation of product
conformity
DATA ACQUISITION From July 17 to 20, 2014
SURVEY COVERAGE 41.1 km
FIELD MAGNETOMETERS GEM Systems GSM-19W, s/n 2085540, 2071191 Proton precession magnetometers with Overhauser effect and built-in GPS. Resolution: 0.01 nT / 1 m Absolute accuracy: 0.2 nT / 2-5 m Gradient tolerance: >10 000 nT/m TMI sensor: at a height of 1.8 m above ground Sensors: 83450 & 83191
BASE STATION GEM Systems GSM-19, s/n 70824767 Proton precession magnetometer with Overhauser effect Resolution: 0.01 nT Absolute accuracy: 0.2 nT Cycle time: 10 seconds Sensor: 3020 Location (UTM NAD83): 5 540 470 mN, 662 540 mE Reference field: 56 930 nT
XMET INC. BLACKFLAKE WEST PROJECT / 14N040 PAGE 6
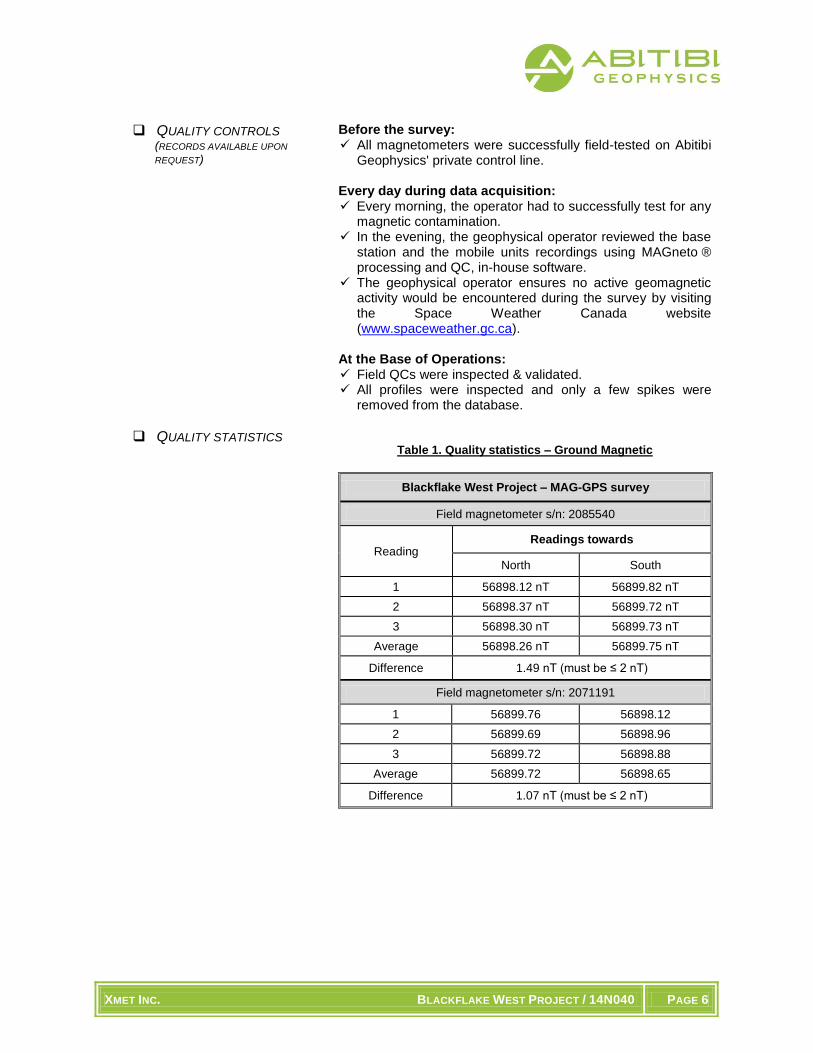
QUALITY CONTROLS (RECORDS AVAILABLE UPON
REQUEST)
Before the survey: All magnetometers were successfully field-tested on Abitibi
Geophysics' private control line. Every day during data acquisition: Every morning, the operator had to successfully test for any
magnetic contamination. In the evening, the geophysical operator reviewed the base
station and the mobile units recordings using MAGneto ® processing and QC, in-house software.
The geophysical operator ensures no active geomagnetic activity would be encountered during the survey by visiting the Space Weather Canada website (www.spaceweather.gc.ca).
At the Base of Operations: Field QCs were inspected & validated. All profiles were inspected and only a few spikes were
removed from the database.
QUALITY STATISTICS Table 1. Quality statistics – Ground Magnetic
Blackflake West Project – MAG-GPS survey
Field magnetometer s/n: 2085540
Reading Readings towards
North South
1 56898.12 nT 56899.82 nT
2 56898.37 nT 56899.72 nT
3 56898.30 nT 56899.73 nT
Average 56898.26 nT 56899.75 nT
Difference 1.49 nT (must be ≤ 2 nT)
Field magnetometer s/n: 2071191
1 56899.76 56898.12
2 56899.69 56898.96
3 56899.72 56898.88
Average 56899.72 56898.65
Difference 1.07 nT (must be ≤ 2 nT)

XMET INC. BLACKFLAKE WEST PROJECT / 14N040 PAGE 7
4. DATA PRESENTATION
TOTAL MAGNETIC FIELD
CONTOURS
The total magnetic field (TMF) was gridded using a minimum curvature algorithm with grid cell size of 20 m. One pass of a 3 x 3 Hanning filter was applied to the resulting grid, which was then re-gridded with a cell size of 10 m to improve the overall appearance of the final map (#1.2). The Geosoft colour table (Clrb64.tbl) was used with linear interval of 10 from 56 940 nT to 57 400 nT.
RESIDUAL ANOMALY
CONTOURS
To isolate the local magnetic anomaly from the regional component for the Blackflake West grid, an upward continuation of the total magnetic field at 700 m was implemented.
The residual anomaly was generated in a straightforward way by removing the calculated regional grid from the Total magnetic field grid (figure 4.A, map #1.3).
FIRST VERTICAL
DERIVATIVE
Using a convolution filter method, the first vertical derivative (vertical gradient) of the TMI anomaly was calculated (#2.7). One pass of a Hanning 3 x 3 filter was applied to the resulting grid to improve the overall appearance of the final contours map (#1.4).
The Oasis Montaj color table (Clra64.tbl) was used with linear interval of 0.25 mGal/m from -1.75 to 6.25 mGal/m.
MAPS PRODUCED The following colour maps are bound or inserted in pockets at the end of this report. All plan maps are registered to the NAD 83, zone 16N, UTM grid coordinate system.
Our Quality System requires every final map to be inspected by at least two qualified persons before being approved and included within a final report.
Table 2. Maps produced
Map # Description Scale
MAG-GPS Survey
1.1 GPS-positioned Magnetic Field Survey – Total Magnetic Intensity Anomaly Profiles (nT) 1:5000
1.2 GPS-positioned Magnetic Field Survey – Total Magnetic Intensity Anomaly Contours (nT) 1:5000
1.3 GPS- positioned Magnetic Field Survey – Upward Residual Anomaly Contours (nT) 1:5000
1.4 GPS-positioned Magnetic Field Survey – First Vertical Derivative Contours (nT/m) 1:5000
10.0 Geophysical Interpretation 1:5000
DIGITAL DATA The above-described maps are delivered in the Oasis Montaj map and JPG file formats on DVD-Rom.
A copy of all survey acquisition data (ASCII text format) and processed data (Geosoft Montaj databases) are also delivered on DVD-Rom.
XMET INC. BLACKFLAKE WEST PROJECT / 14N040 PAGE 8
5. GEOPHYSICAL INTERPRETATION
GROUND MAGNETIC SURVEY The area of investigation is located between longitudes 84
º 37' 15'' and 84
º 35' 45'' W, and latitudes
50º 03' 10'' and 50
º03' 50'' N. The magnetic survey method is a useful mapping tool, outlining both
lithological and structural trends. The principal purpose of this study is to delineate low magnetic features that might relate to a hydrothermal graphite deposit within the Blackflake West property. Analysis of the magnetic data allowed the identification of two distinctive magnetic lineaments (dyke structures) trending NW and WNW in the center south part of the grid. Also interpreted from the data were an irregular shaped magnetic feature in the north between the lines 17+25E to 20+25E which is open to the north, an arc-shaped magnetic lineament to the NE side, and finally a low magnetic zone in the SW of the property. As shown on the residual magnetic map (figure 4-A), amplitudes of the positive magnetic features range from 10 nT to more than 400 nT above a magnetic background of 57 010 nT. The two delineated dominant dyke units intersect one another and the narrow one which is trending NW-SE seems post-intruded. A few negative magnetic anomalies of -100 nT in amplitude were observed on the residual magnetic anomaly (figure 4-A). To clarify the nature of these anomalies, a Total Gradient Amplitude (Analytic Signal) was calculated (figure 4-B). This enhancement technique allowed us to better define boundaries of magnetic sources, especially the bipolar magnetic anomaly type. The detected negative magnetic anomalies in the middle-north of the grid could correspond to a shear zone / magnetic contact zone which may be associated with graphite. It’s difficult for us to associate this type of response with graphite without the support or integration of EM data (VTEM survey, etc.). Several lineations that are indicative of faults have affected the studied grid by causing distortions in the shape of the magnetic signatures. These faults were interpreted and reported on the geophysical interpretation map (figure 6). To improve the geological understanding of the Blackflake West region, regional analysis of the magnetic field has been performed. The regional vertical magnetic gradient (Figure 7) reveals the presence of four (4) large zones of negative magnetic values. These zones could be perspective for hydrothermal graphite exploration. The most interesting negative magnetic is zone 1 which is located just NW of the surveyed grid.
UNCONSTRAINED 3D MAGNETIC INVERSION
The principal purpose of this interpretation is to produce a subsurface magnetic susceptibility model for the Blackflake West Project. The resulting 3D map will provide a model of the architecture that should assist in the identification of favourable zones for graphite deposition (if they exist), therefore helping in the design of a follow up drilling program. In this study, an unconstrained magnetic inversion has been performed on the ground magnetic data. First-Order removed trend residual magnetic data is used as input file for producing a 3D magnetic susceptibility model. The topography is included in the modelling process.
The final inversion result is illustrated in figures 8 and 9, as three-dimensional isosurfaces. As shown in these figures, the unconstrained inversion reveals the 3D geometry of the major structures of the Blackflake West Project.

XMET INC. BLACKFLAKE WEST PROJECT / 14N040 PAGE 9
Susceptibility isosurfaces with negative values ranging from -0.01 to -0.002 SI, were left in the recovered model to show the potential zones for graphite deposition (figures 7 & 8). Physically speaking, negative susceptibility values don’t make any sense, they should be always positive. In this study, the recovered negative susceptibility values indicate zones of negative susceptibility contrasts which could reflect shear zones, etc. However, this type of signature could also indicate the footprint of the remanent magnetization effect. Interpreted positive magnetic signatures could correspond to intermediate or mafic rocks lying within the Blakflake West property (figure 6). The final 3D magnetic susceptibility model is delivered in the Autocad dxf file for the geophysical / geological data integration. Due to the unconstrained character of the 3D magnetic inversion and the non-uniqueness of potential field modeling, any parametric calculation resulting from this study is only one possible solution. Only sampling by drilling through the rock formation may give the final answer to the origin of the detected magnetic features.

XMET INC. BLACKFLAKE WEST PROJECT / 14N040 PAGE 10
6. CONCLUSIONS
The interpretation of the ground magnetic survey has improved the understanding of the geological setting of the Blackflake West Project. Several magnetic structures showing generally low to moderate amplitudes were identified from the present magnetic survey. High quality displays of the TMF, the residual anomaly, the total gradient amplitude (TGA), and the first vertical derivative were generated in order to highlight and define more mainly subtle magnetic features and to improve the magnetic picture of the Blackflake West property. Despite the generic nature of the unconstrained magnetic inversion, this 3D interpretation has shown a possible 3D geological model of the studied grid. Low magnetic zones that may reflect shear zones / large fractures have been delineated. The resulting inversion model may be used as a guide for determining the potential zones for graphite. We recommend integrating additional geophysical information such as VTEM data to verify if the identified negative magnetic anomalies are associated with conductive orebodies. The interpretation of the geophysical data embodied in this report is essentially a geophysical appraisal of the Blackflake West Project. As such, it incorporates only as much geoscientific information as the author had on hand at the time. Geologists thoroughly familiar with the area may be in a better position to evaluate the geological significance of the various geophysical signatures. Moreover, as time passes and data provided by follow-up programs are compiled, the priority and significance of exploration targets reported in this study may be downgraded or upgraded.
Respectfully submitted, Abitibi Geophysics Inc.
Madjid Chemam, P.Geo. Geophysicist OGQ # 1259
MC/mw

XMET INC. BLACKFLAKE WEST PROJECT / 14N040 PAGE 11
Figure 3. Total magnetic intensity contours map of the Blackflake West Project

XMET INC. BLACKFLAKE WEST PROJECT / 14N040 PAGE 12
Figure 4. A) Residual magnetic contours map; B) Total Gradient Amplitude (analytic signal) contours map of the Blackflake West Project
A)
B)

XMET INC. BLACKFLAKE WEST PROJECT / 14N040 PAGE 13
Figure 5. First Vertical Derivative contours map of the Blackflake West Project

XMET INC. BLACKFLAKE WEST PROJECT / 14N040 PAGE 14
Figure 6. Simplified structural interpretation map of the Blackflake West Project

XMET INC. BLACKFLAKE WEST PROJECT / 14N040 PAGE 15
Figure 7. Regional vertical gradient magnetic field (cell size 200 m) showing the surveyed line paths and low magnetic signatures

XMET INC. BLACKFLAKE WEST PROJECT / 14N040 PAGE 16
Figure 8. Perspective view showing the subsurface magnetic susceptibility isosurfaces rendered at -0.01 SI (blue dark) to 0.03 SI (red colour)
0.015 SI
0.002 SI 0.01 SI
0.005 SI -0.006 SI
-0.002 SI
0.015 SI
0.002 SI 0.01 SI

XMET INC. BLACKFLAKE WEST PROJECT / 14N040 PAGE 17
Figure 9. Top view showing the distribution of the magnetic susceptibility of the Blackflake West Project
0.015 SI
0.002 SI
Related Documents